FORM 6-K
SECURITIES AND EXCHANGE COMMISSION
Washington, D.C. 20549
Report of Foreign Issuer
Pursuant to Rule 13a-16 or 15d-16
of the Securities Exchange Act of 1934
For the month of April, 2020
Commission File Number: 001-12518
Banco Santander, S.A.
(Exact name of registrant as specified in its charter)
Ciudad Grupo Santander
28660 Boadilla del Monte (Madrid) Spain
(Address of principal executive office)
Indicate by check mark whether the registrant files or will file annual reports under cover of Form 20-F or Form 40-F:
Form 20-F ☒ Form 40-F ☐
Indicate by check mark if the registrant is submitting the Form 6-K in paper as permitted by Regulation S-T Rule 101(b)(1):
Yes ☐ No ☒
Indicate by check mark if the registrant is submitting the Form 6-K in paper as permitted by Regulation S-T Rule 101(b)(7):
Yes ☐ No ☒
Banco Santander, S.A.
TABLE OF CONTENTS
FINANCIAL
REPORT

| Financial Report | 2020 |
| January - March | |
Index

This report was approved by the Board of Directors on 27 April 2020, following a favourable report from the Audit Committee. Important information regarding this report can be found on pages 89 and 90.
Key consolidated data
| BALANCE SHEET (EUR million) | Mar-20 | Dec-19 | % | Mar-19 | % | Dec-19 | ||||||
| Total assets | 1,540,359 | 1,522,695 | 1.2 | 1,506,151 | 2.3 | 1,522,695 | ||||||
| Loans and advances to customers | 935,407 | 942,218 | (0.7 | ) | 910,195 | 2.8 | 942,218 | |||||
| Customer deposits | 815,459 | 824,365 | (1.1 | ) | 808,361 | 0.9 | 824,365 | |||||
| Total funds | 1,006,948 | 1,050,765 | (4.2 | ) | 1,019,878 | (1.3 | ) | 1,050,765 | ||||
| Total equity | 106,113 | 110,659 | (4.1 | ) | 110,365 | (3.9 | ) | 110,659 | ||||
| Note: Total funds includes customer deposits, mutual funds, pension funds and managed portfolios | ||||||||||||
| INCOME STATEMENT (EUR million) | Q1'20 | Q4'19 | % | Q1'19 | % | 2019 | ||||||
| Net interest income | 8,487 | 8,841 | (4.0 | ) | 8,682 | (2.2 | ) | 35,283 | ||||
| Total income | 11,809 | 12,327 | (4.2 | ) | 12,085 | (2.3 | ) | 49,229 | ||||
| Net operating income | 6,220 | 6,356 | (2.1 | ) | 6,327 | (1.7 | ) | 25,949 | ||||
| Profit before tax | 1,891 | 3,831 | (50.6 | ) | 3,602 | (47.5 | ) | 12,543 | ||||
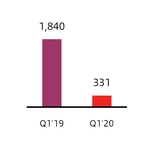
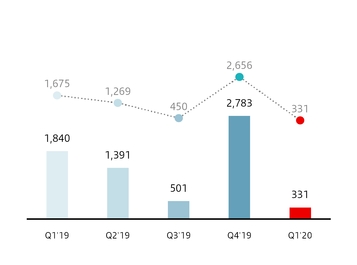
| Attributable profit to the parent | 331 | 2,783 | (88.1 | ) | 1,840 | (82.0 | ) | 6,515 | ||||
| Change in constant euros: | ||||||||||||
| Q1'20 / Q4'19: NII: -1.8%; Total income: -2.0%; Net operating income: +0.8%; Attributable profit: -87.5% | ||||||||||||
| Q1'20 / Q1'19: NII: +2.7%; Total income: +2.7%; Net operating income: +4.2%; Attributable profit: -80.2% | ||||||||||||
UNDERLYING INCOME STATEMENT (1) (EUR million) | Q1'20 | Q4'19 | % | Q1'19 | % | 2019 | ||||||
| Net interest income | 8,487 | 8,841 | (4.0 | ) | 8,682 | (2.2 | ) | 35,283 | ||||
| Total income | 11,814 | 12,592 | (6.2 | ) | 12,085 | (2.2 | ) | 49,494 | ||||
| Net operating income | 6,237 | 6,621 | (5.8 | ) | 6,327 | (1.4 | ) | 26,214 | ||||
| Profit before tax | 3,556 | 3,506 | 1.4 | 3,684 | (3.5 | ) | 14,929 | |||||
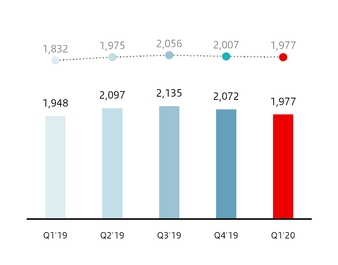
| Attributable profit to the parent | 1,977 | 2,072 | (4.6 | ) | 1,948 | 1.5 | 8,252 | |||||
| Variations in constant euros: | ||||||||||||
| Q1'20 / Q4'19: NII: -1.8%; Total income: -4.1%; Net operating income: -3.1%; Attributable profit: -1.5% | ||||||||||||
| Q1'20 / Q1'19: NII: +2.7%; Total income: +2.7%; Net operating income: +4.5%; Attributable profit: +7.9% | ||||||||||||
| EPS, PROFITABILITY AND EFFICIENCY (%) | Q1'20 | Q4'19 | % | Q1'19 | % | 2019 | ||||||
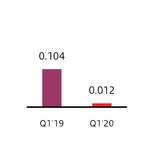
| EPS (euros) | 0.012 | 0.161 | (92.8 | ) | 0.104 | (89.0 | ) | 0.362 | ||||
Underlying EPS (euros) (1) | 0.111 | 0.116 | (5.0 | ) | 0.111 | (0.3 | ) | 0.468 | ||||
| RoE | 6.31 | 9.10 | 7.85 | 6.62 | ||||||||
| RoTE | 8.75 | 12.62 | 11.15 | 9.31 | ||||||||
Underlying RoTE (1) | 11.06 | 11.63 | 11.31 | 11.79 | ||||||||
| RoA | 0.49 | 0.68 | 0.63 | 0.54 | ||||||||
| RoRWA | 1.25 | 1.69 | 1.54 | 1.33 | ||||||||
Underlying RoRWA (1) | 1.52 | 1.57 | 1.56 | 1.61 | ||||||||
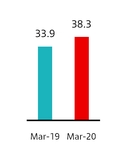
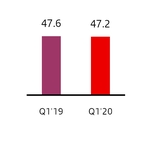
| Efficiency ratio | 47.2 | 47.4 | 47.6 | 47.0 | ||||||||
| SOLVENCY AND NPL RATIOS (%) | Mar-20 | Dec-19 | Mar-19 | Dec-19 | ||||||
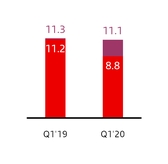
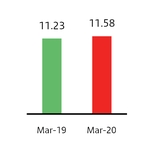
CET1 (2) | 11.58 | 11.65 | 11.23 | 11.65 | ||||||
Fully loaded Total capital ratio (2) | 15.08 | 15.02 | 14.82 | 15.02 | ||||||
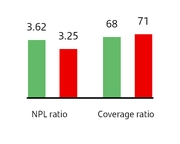
| NPL ratio | 3.25 | 3.32 | 3.62 | 3.32 | ||||||
| Coverage ratio | 71 | 68 | 68 | 68 | ||||||
| MARKET CAPITALISATION AND SHARES | Mar-20 | Dec-19 | % | Mar-19 | % | Dec-19 | ||||||
| Shares (millions) | 16,618 | 16,618 | — | 16,237 | 2.3 | 16,618 | ||||||
| Share price (euros) | 2.218 | 3.730 | (40.5 | ) | 4.145 | (46.5 | ) | 3.730 | ||||
| Market capitalisation (EUR million) | 36,859 | 61,986 | (40.5 | ) | 67,292 | (45.2 | ) | 61,986 | ||||
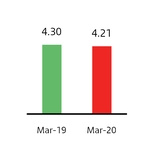
| Tangible book value per share (euros) | 4.21 | 4.36 | 4.30 | 4.36 | ||||||||
| Price / Tangible book value per share (X) | 0.53 | 0.86 | 0.96 | 0.86 | ||||||||
| P/E ratio (X) | 48.29 | 10.30 | 9.94 | 10.30 | ||||||||
| OTHER DATA | Mar-20 | Dec-19 | % | Mar-19 | % | Dec-19 | ||||||
| Number of shareholders | 4,043,974 | 3,986,093 | 1.5 | 4,089,097 | (1.1 | ) | 3,986,093 | |||||
| Number of employees | 194,948 | 196,419 | (0.7 | ) | 202,484 | (3.7 | ) | 196,419 | ||||
| Number of branches | 11,902 | 11,952 | (0.4 | ) | 13,277 | (10.4 | ) | 11,952 | ||||
| (1) In addition to financial information prepared in accordance with International Financial Reporting Standards (IFRS) and derived from our consolidated financial statements, this report contains certain financial measures that constitute alternative performance measures (APMs) as defined in the Guidelines on Alternative Performance Measures issued by the European Securities and Markets Authority (ESMA) on 5 October 2015 and other non-IFRS measures, including the figures related to “underlying” results, as they are recorded in the separate line of “net capital gains and provisions”, above the line of attributable profit to the parent. Further details are provided on page 14 of this report. For further details of the APMs and non-IFRS measures used, including its definition or a reconciliation between any applicable management indicators and the financial data presented in the consolidated financial statements prepared under IFRS, please see 2019 Annual Financial Report, published in the CNMV on 28 February 2020, our 20-F report for the year ending 31 December 2019 registered with the SEC in the United States as well as the “Alternative performance measures” section of the appendix to this report. |
| (2) Data applying the IFRS 9 transitional arrangements. |
January - March 2020 |  | 5 |
Response to the COVID-19 crisis Business model | ||||||||
| Response to COVID-19 crisis | ||||||||
In order to support the global effort being made to combat COVID-19, Grupo Santander is implementing various measures to protect our stakeholders. The most relevant measures are detailed below, focused on six main dimensions:
 | Contingency plan |  | Health of our employees | ||
Preserving our critical business and functions is essential to providing our services to customers under the same standards as usual. Consequently, the Group has the necessary contingency plans to ensure the continuity of all our businesses and react effectively in any eventuality. To this end, periodic crisis simulations have been carried out in recent years. In February, in line with our special situations management framework, the highest level corporate crisis committees were activated to coordinate the situation and to give a global response in all geographic areas. Different action plans were implemented to coordinate the different corporate areas and their counterparties in all countries, including all subsidiaries’ Board Chairs, Country Heads, Global Directors and local crisis committees. For example, only in March the corporate crisis committees held follow-up meetings almost on a daily basis at the Bronze and Silver levels, whilst the Gold Committee was held on five occasions and shared information with the board in four meetings. Previous training carried out by the Group for the swift and agile activation of protocols and procedures was key for the continuity of our business with no significant disruption in this unprecedented situation. From the beginning, all units have identified their critical businesses and implemented contingency plans by splitting teams, establishing shifts between critical persons and their back-ups, segregating technological infrastructure, etc. Likewise, the technology area proceeded to increase the capacity of systems and lines, while providing the appropriate equipment to adapt the organisation to the new telecommuting situation. In addition, we have made sure that our key suppliers have contingency plans that ensure the continuity of our activity in order to ensure the proper functioning of our services. | One of our priorities is to protect the health of our employees. To this end, we have laid out a series of measures: • We have provided all our employees the necessary hygiene guidelines to limit the spread of COVID-19.• At the same time, and to avoid the outbreak of COVID-19, we put in place travel and face-to-face meeting restrictions for our employees straight away.• We also established large scale remote working in all Group countries. Currently, 112,000 employees, which account for more than half of the total workforce are telecommuting, almost 100% of the central services employees in some countries.This was reflected in the sharp increase of video and internet call connections (exceeding 780,000 per day) and more than 3 million chat lines in a single day. • As for our branch network, we have also taken measures to combine customer service with the protection of our employees' health, for example: closure of some of our branches, reduce opening hours, shifts, limiting the number of costumers in a branch at a time, in compliance with the authorities' recommendations on safe distances between people and avoiding physical contact.• The Bank has reinforced its hygiene protocol at its branches and ATMs and is promoting the use of digital channels by customers.• We have also made services available for our employees, aimed at ensuring their well-being and balance between professional and family life (Santander Contigo). | ||||
 |  | ||||
January - March 2020 | | 6 |
Response to the COVID-19 crisis Business model | ||||||||
| Response to COVID-19 crisis | ||||||||
 | Customers |  | Business, liquidity and risks | ||
Santander has implemented measures to ensure the health and safety of its customers and foster their economic resilience during the crisis in all countries. Of note were: • Provide liquidity and credit facilities for businesses facing hardship.• Facilitate payment deferrals and repayment holidays in many of our markets.• Temporary option to increase credit card and overdraft limits.• Proactive support for vulnerable customers (senior citizens, SMEs, etc.) trying to cover their needs.• Temporary reduction and suspension of fees (withdrawals from ATMs, interest free online purchases, bank transfers, ...).• Ensure COVID-19 health insurance coverage.• Specialised teams to advise customers facing financial difficulties.We also adapted the branch network to the current situation, with some closures, but ensuring the continuity of service in the branch network. On the other hand, we strengthened our contact centres' capabilities, which has enabled us to increase the volume of services by 21% on average compared to normal times. Additionally, following the recommendation issued by the European Central Bank, the Bank's board decided to cancel the payment of the final dividend for 2019 and its dividend policy for 2020 until there is greater visibility on the impact of the crisis. The Bank is reevaluating the situation as the pandemic evolves in each market, and takes action according to the specific needs of every country and market. | Business performance continued its growth trajectory. Group loans and advances to customers increased 7% and customer funds 4% year-on-year, excluding the exchange rate impact, following the rise in the quarter. The positive star of the year was affected in March by the first impacts of the crisis, although, in terms of new business and balances, growth in corporates and large corporates offset the declines in individuals and consumer credit. Since the start of the crisis, business performance and liquidity have been closely monitored n the parent bank and our subsidiaries. Our liquidity position has remained solid at all times. The Group's LCR ratio was 146% at the end of the quarter, the parent bank's was 134% and all our subsidiaries stood above 125%. Likewise, the liquidity buffer is ample. In addition, central banks announced anti-crisis packages to pump liquidity in the system and the Group is rolling out preventive management measures to strengthen its position. Regarding risks, the main indicators are also continuously monitored and reported. The impacts of COVID-19 have not yet materialised in the first quarter indicators, which reflect an improvement in the credit quality and coverage ratios. As acknowledged by the IASB and other regulators and supervisors, it is likely to be difficult at this time to know the specific effects the health crisis and government and central bank support measures, such as mortgage repayment holidays, credit lines and guarantees and other mitigating packages, will have. Nevertheless, and in compliance with the accounting standard (IFRS 9), which includes the incorporation of forward-looking macroeconomic information in the calculation of provisions, that include future effects arising from changes in variables to which the models are sensitive (GDP, unemployment, house prices, etc.), the Group recorded a provisions overlay in the quarter of EUR 1.6 billion, based on the expected deterioration arising from the pandemic. | ||||
 |  | ||||
January - March 2020 | | 7 |
Response to the COVID-19 crisis Business model | ||||||||
| Response to COVID-19 crisis | ||||||||
 | Society |  | Information for stakeholders | ||
One of our main priorities is to contribute to the well-being of society as a whole. We have implemented actions and mobilised resources together with governments and institutions to help society combat the health crisis. Santander All. Together. Now. is the motto that brings together the Group's collective efforts around the world to stand beside the people who need it the most at this time. This effort has succeeded in mobilising EUR 100 million worldwide dedicated to solidarity initiatives to fight COVID-19. The main initiatives adopted are: • Creation of a solidarity fund which amounts to EUR 54 million to acquire medical equipment and materials, and to support organisations in the fight against COVID-19. This fund is primarily financed by contributions from senior management, employees and the Group's subsidiaries, as well as contributions from third parties. As a starting point, the Executive Chairman and the CEO, have decided to give up 50% of their compensation in 2020 (fixed and variable) and non-executive directors 20% of their total remuneration. The Group has created employee funds in most of the countries where it operates.Only in Spain, one of the most affected countries, the Bank has donated more than 4 million high-protection masks, 500 non-invasive respirators and thousands of hospital beds and blankets, protective suits and gloves. • Supporting different projects and social initiatives to protect the vulnerable groups most impacted by the effects of the pandemic (especially in the UK and the US). EUR 16 million has been donated so far.• Santander has also mobilised more than EUR 30 million through Santander Universidades, to support collaboration projects with universities that will help to find solutions to the health and educational challenges arising from the COVID-19 crisis, scholarships to foster online education during the confinement period and support the most disadvantaged students.• Launch of Overcome Together, an open and accessible space for individuals and companies, both customers and non-customers, which contains information and resources to help overcome the situation arising from COVID-19. It is already available in Spain, Portugal, Mexico, Brazil, Uruguay and Chile, and will be soon available in other countries.We will continue to monitor the situation of this global health crisis in order to continue to contribute to minimise its impact on society. | Since the crisis started, the Group has been proactive in keeping our people, customers, shareholders and investors informed at all times and providing advice. The communication plan is based on transparency and anticipation, and followed different stages as the COVID-19 pandemic evolved: • First phase of information and prevention: started on 23 January after the COVID-19 outbreak in China, and was focused on informing and raising awareness among Group employees about basic hygiene measures to prevent contagion.• Second phase of recommendations and protections: in early March, the Group focused on communicating its employees in all countries the travelling recommendations, meeting policies and protocols for potential infections.• Third phase regarding the business continuity plan: it began on 10 March, with internal communication focused on contingency plans implementation and telecommuting. We also issued communications to our customers, encouraging the use of digital channels, new branch opening hours and and functionality, and all information regarding public and the Bank's support measures. In addition, the Group announced to its shareholders that the annual general Meeting would be held via remote channels, the changes regarding the 2019 and 2020 dividend policy, on the creation of a fund of an initial value of EUR 25 million to help the health authorities cover its most urgent needs.It is also worth highlighting the commitment of the Bank's senior management, both the Chairman, who held three Ask Ana events to answer the employees' questions, as well as the CEO, Senior Executives and Country Heads, who have been constantly in touch with the teams. The main measures announced by each country can be found on the Group's website (www.santander.com). | ||||
 |  | ||||
January - March 2020 | | 8 |
Response to the COVID-19 crisis Business model | Group financial information | Financial information by segments | Responsible banking Corporate governance Santander share | Appendix | ||||
| Business model | ||||||||
Our business model is based on three pillars
1. Our scale Local scale and global reach | 2. Customer focus Unique personal banking relationships strengthen customer loyalty | 3. Diversification Our geographic and business diversification make us more resilient under adverse circumstances | ||||
• Local scale based on three geographic regions, where we maintain a leadership position in our 10 core markets.• Global reach backed by our global businesses, enabling greater collaboration across the Group to generate higher revenue and efficiencies. | • We serve 146 million customers, in markets with a total population of more than one billion people.• We have over 100,000 people talking to our customers every day in our c.12,000 branches and contact centres. | • Geographic diversification in three regions, with a good balance between mature and developing markets.• Global businesses that strengthen our local franchises.• Santander Global Platform supports the digital transformation across the Group. | ||||
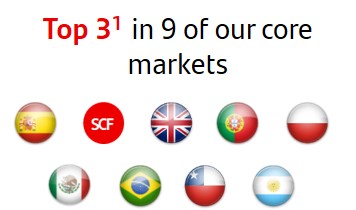 | 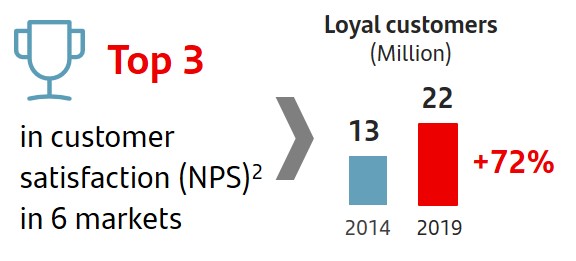 | 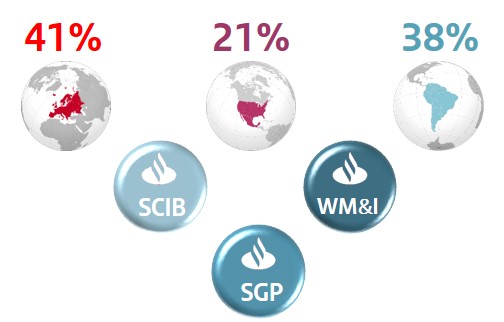 | ||||
| 1. Market share in lending as of Dec-19 including only privately-owned banks. UK benchmark refers to the mortgage market. | 2. NPS – Customer Satisfaction internal benchmark of active customers’ experience and satisfaction audited by Stiga / Deloitte. | Note. Underlying attributable profit contribution by region, excluding Santander Global Platform and Corporate Centre. | ||||
Our corporate culture: Santander Way
The Santander Way reflects our purpose, our aim, and how we do business. It is the bedrock on which we are building a more responsible bank.

January - March 2020 | | 9 |
GROUP PERFORMANCE

"From the start of this crisis we have been determined to do everything in our power to fight the pandemic and support the recovery, and this remains our utmost priority" |

"Our strong pre-provision profit across the cycle, combined with our resilient balance sheet and capital position, are the key levers to manage the economic downturn" |
 GROWTH
The Group continued to boost the relationship with customers and increase digital activity
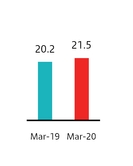
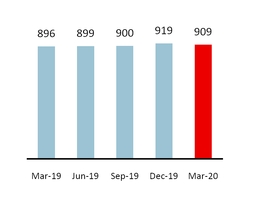
In the current environment, Santander’s strategy continues to focus on providing the best service to our 21.5 million loyal customers, whose number rose 1.2 million year-on-year (+6%), with growth both in individuals and corporates.
The number of digital customers and activity grew at a faster pace (+1.5 million in the quarter, +4.4 million year-on-year), as digital sales represented 43% of total sales in March, rising 7 percentage points compared to 2019.
| Loyal customers | Digital customers | |
| Millions | Millions | |
| +6% |
| +13% |
Volumes were negatively impacted by exchange rates in the quarter (-5 pp) and year-on-year. In constant euros, both loans and advances to customers and customer deposits grew strongly in the quarter (+3%) driven by corporates. Conversely, mortgages and consumer lending recorded sharp activity falls in recent weeks, down by 40%-50% in new lending, highly affected by the isolation measures adopted by governments in various countries.
On a year-on-year basis (at constant exchange rates), gross loans and advances to customers (excluding reverse repos) grew 7% and customer funds rose 4%, both with nine of the 10 core markets growing.
Activity Mar-20 vs. Mar-19 | ||||||||||||
| % change in constant euros | ||||||||||||
| +6% | ||||||||||||
| Individuals | ||||||||||||
| +7% | ||||||||||||
| +2% | Demand | |||||||||||
| SMEs and corporates | ||||||||||||
| +3% | ||||||||||||
| +7% | +4% | Time | ||||||||||
| +22% | ||||||||||||
| CIB and institutions | -2% | |||||||||||
| Mutual funds | ||||||||||||
| Gross loans and advances to customers excl. reverse repos | Customer deposits excl. repos + mutual funds | |||||||||||
| 10 | | January - March 2020 |
GROUP PERFORMANCE
 PROFITABILITY
Solid business model based on customers, scale and diversification, which enables us to obtain profits on a recurring basis
In the quarter, attributable profit of EUR 331 million, affected by the recording of a provisions overlay of EUR 1.6 billion in compliance with the accounting rules and based on the expected deterioration of the macroeconomic conditions arising from the COVID-19 health crisis.
Excluding this charge, underlying attributable profit increased 1% to EUR 1,977 million. In constant euros, growth was 8%, driven by higher customer revenue, costs synergies and a stable cost of credit.
| Att. profit to the parent | Earnings per share | |
| EUR million | Euros | |
By region, underlying attributable profit rose in all countries in the Americas (except Chile) and decreased in Europe, in a more complicated business environment.
The efficiency ratio improved to 47.2%, one of the best among our peers. Underlying RoTE was 11.06% and underlying RoRWA 1.52%.
| Efficiency ratio | RoTE | ||||
| % | % | ||||
n Total n Underlying* | |||||
 (*) Excluding net capital gains and provisions
 STRENGTH
Santander maintained its solid capital rations and high levels of credit quality
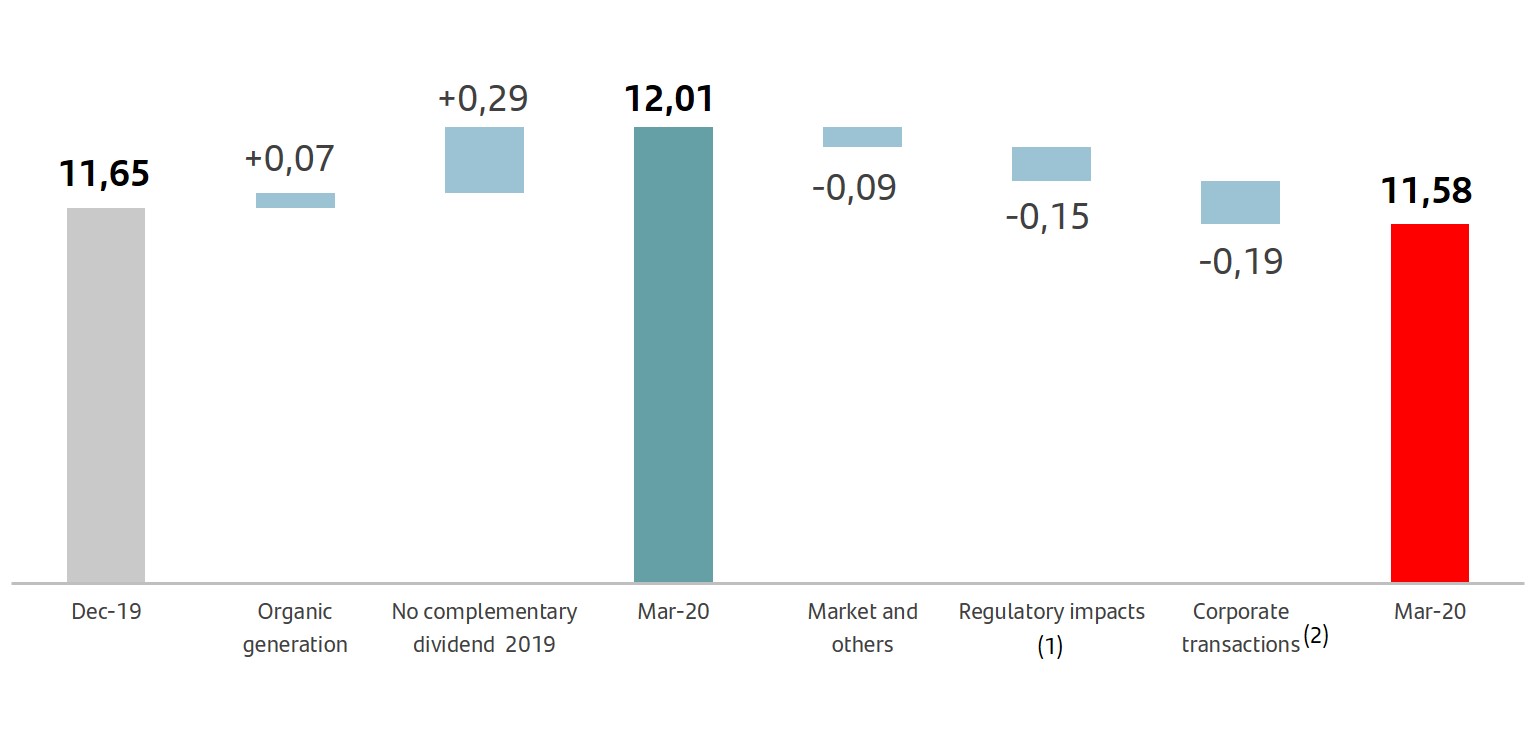
The CET1 ratio stood at 11.58% virtually unchanged compared to December 2019. In a quarter of strong volume growth, organic generation and the measures adopted regarding dividends, led to an increase of 36 bps, which was offset by negative impacts stemming from corporate operations and regulatory and market impacts.
Net tangible equity per share (TNAV) at quarter-end was EUR 4.21. Considering the dividend remuneration in the period, TNAV per share increased 1.8% in the last 12 months.
| CET1* | Tangible equity per share | |
| % | Euros | |
(*) Using the IFRS 9 transitional arrangement
The impacts arising from the COVID-19 crisis are not yet reflected in risk indicators in the first quarter, which maintained the continued improvement in credit quality in the first two months of the year. The NPL ratio improved 7 bps in the quarter.
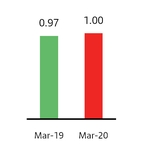
The cost of credit stood at 1.00%, in line with the previous quarter and similar to the first quarter of 2019.
| Cost of credit | NPL ratio and coverage | ||||
| % | % | ||||
n Mar-19 n Mar-20 | |||||
January - March 2020 | | 11 |
GRUPO SANTANDER RESULTS
| • | First quarter attributable profit to the parent of EUR 331 million, including a net negative impact of EUR 1,646 million that is outside the ordinary course performance of our business, of which EUR 1.6 billion corresponds to the creation of a provisions overlay based on the expected deterioration of the macroeconomic conditions arising from the health crisis. |
| • | Excluding these charges, underlying attributable profit of 1,977 million euros, 1% more than in the same period of 2019 (+ 8% without exchange rate impact). |
| • | Results reflect a negative impact on the year-on-year comparison of exchange rate performance: 5 pp in revenue and 4 pp in costs. |
| • | By geographic area, underlying profit grew in all countries in the Americas (except Chile) and fell in Europe in a more complicated business environment. |
| • | In 2019, results continued to reflect a solid underlying trend in constant euros: customer revenue continued to increase, costs show the synergies obtained and the cost of credit remained stable. |
| • | As regards profitability ratios: underlying RoTE of 11.06% and underlying RoRWA of 1.52% (11.31% and 1.56%, respectively, in the first quarter of 2019). |
| Grupo Santander. Summarised income statement | ||||||||||||||
| EUR million | ||||||||||||||
| Change | Change | |||||||||||||
| Q1'20 | Q4'19 | % | % excl. FX | Q1'19 | % | % excl. FX | ||||||||
| Net interest income | 8,487 | 8,841 | (4.0 | ) | (1.8 | ) | 8,682 | (2.2 | ) | 2.7 | ||||
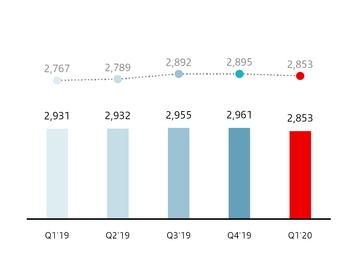
| Net fee income (commission income minus commission expense) | 2,853 | 2,961 | (3.6 | ) | (1.5 | ) | 2,931 | (2.7 | ) | 3.1 | ||||
| Gains or losses on financial assets and liabilities and exchange differences (net) | 287 | 596 | (51.8 | ) | (51.7 | ) | 277 | 3.6 | 15.2 | |||||
| Dividend income | 57 | 100 | (43.0 | ) | (42.9 | ) | 66 | (13.6 | ) | (13.8 | ) | |||
| Share of results of entities accounted for using the equity method | 98 | (119 | ) | — | (31.2 | ) | 153 | (35.9 | ) | (33.1 | ) | |||
| Other operating income / expenses | 27 | (52 | ) | — | — | (24 | ) | — | 647.0 | |||||
| Total income | 11,809 | 12,327 | (4.2 | ) | (2.0 | ) | 12,085 | (2.3 | ) | 2.7 | ||||
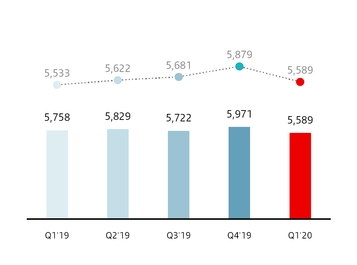
| Operating expenses | (5,589 | ) | (5,971 | ) | (6.4 | ) | (4.9 | ) | (5,758 | ) | (2.9 | ) | 1.0 | |
| Administrative expenses | (4,860 | ) | (5,179 | ) | (6.2 | ) | (4.6 | ) | (5,011 | ) | (3.0 | ) | 0.9 | |
| Staff costs | (2,899 | ) | (3,053 | ) | (5.0 | ) | (3.7 | ) | (3,006 | ) | (3.6 | ) | (0.2 | ) |
| Other general administrative expenses | (1,961 | ) | (2,126 | ) | (7.8 | ) | (6.0 | ) | (2,005 | ) | (2.2 | ) | 2.7 | |
| Depreciation and amortisation | (729 | ) | (792 | ) | (8.0 | ) | (6.9 | ) | (747 | ) | (2.4 | ) | 1.4 | |
| Impairment or reversal of impairment of financial assets not measured at fair value through profit or loss (net)* | (3,934 | ) | (2,542 | ) | 54.8 | 58.5 | (2,246 | ) | 75.2 | 84.6 | ||||
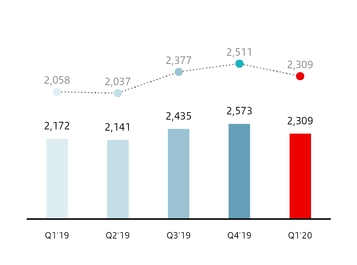
| o/w: net loan-loss provisions* | (3,919 | ) | (2,573 | ) | 52.3 | 56.1 | (2,172 | ) | 80.4 | 90.4 | ||||
| Impairment on other assets (net) | (14 | ) | (76 | ) | (81.6 | ) | (80.8 | ) | (20 | ) | (30.0 | ) | (29.4 | ) |
| Provisions or reversal of provisions | (374 | ) | (979 | ) | (61.8 | ) | (60.3 | ) | (465 | ) | (19.6 | ) | (15.9 | ) |
| Gains or losses on non financial assets and investments, net | 18 | 1,038 | (98.3 | ) | (98.3 | ) | 219 | (91.8 | ) | (91.8 | ) | |||
| Negative goodwill recognised in results | — | — | — | — | — | — | — | |||||||
| Gains or losses on non-current assets held for sale not classified as discontinued operations | (25 | ) | 34 | — | — | (213 | ) | (88.3 | ) | (88.2 | ) | |||
| Profit or loss before tax from continuing operations | 1,891 | 3,831 | (50.6 | ) | (49.1 | ) | 3,602 | (47.5 | ) | (42.9 | ) | |||
| Tax expense or income from continuing operations | (1,244 | ) | (687 | ) | 81.1 | 74.7 | (1,357 | ) | (8.3 | ) | (0.5 | ) | ||
| Profit from the period from continuing operations | 647 | 3,144 | (79.4 | ) | (78.4 | ) | 2,245 | (71.2 | ) | (68.6 | ) | |||
| Profit or loss after tax from discontinued operations | — | — | — | — | — | — | — | |||||||
| Profit for the period | 647 | 3,144 | (79.4 | ) | (78.4 | ) | 2,245 | (71.2 | ) | (68.6 | ) | |||
| Attributable profit to non-controlling interests | (316 | ) | (361 | ) | (12.5 | ) | (7.8 | ) | (405 | ) | (22.0 | ) | (17.6 | ) |
| Attributable profit to the parent | 331 | 2,783 | (88.1 | ) | (87.5 | ) | 1,840 | (82.0 | ) | (80.2 | ) | |||
| EPS (euros) | 0.012 | 0.161 | (92.8 | ) | 0.104 | (89.0 | ) | |||||||
| Diluted EPS (euros) | 0.011 | 0.160 | (92.8 | ) | 0.104 | (89.0 | ) | |||||||
| Memorandum items: | ||||||||||||||
| Average total assets | 1,536,725 | 1,530,761 | 0.4 | 1,488,505 | 3.2 | |||||||||
| Average stockholders' equity | 99,221 | 98,851 | 0.4 | 97,886 | 1.4 | |||||||||
(*) Includes provisions overlay of EUR 1,600 million in Q1'20.
| 12 | | January - March 2020 |
è Evolution of results compared to the first quarter of 2019
Compared to the first quarter of 2019, the underlying trends of the P&L remained solid, as it was only marginally affected by the health crisis derived from the COVID-19 outbreak. Customer revenue continued to grow in constant currency, both net interest income and net fee income, costs reflected the synergies obtained in various units, mainly in Europe, and the cost of credit remained unchanged.
This good performance, however, is not fully reflected in attributable profit to the parent because of the recording of a net negative amount of EUR 1,646 million for charges that are outside the ordinary course performance of our business, primarily due to the aforementioned recording of a provisions overlay due to the COVID-19 outbreak (EUR 1.6 billion), together with several restructuring charges.
This performance is explained in detail below:
u Revenue
Total income was 2% lower than in the first quarter of 2019 at EUR 11,809 million (+3% excluding the exchange rate impact). Net interest income and net fee income accounted for 96% of total income. By lines:
| • | Net interest income amounted to EUR 8,487 million, down 2% compared to the first three months of 2019. Excluding the FX impact, growth was 3% due to greater lending and deposit volumes, and management of spreads in an environment of falling interest rates in the past year in numerous markets, and with still negative interest rates in Europe. |
| Net interest income | |
| EUR million | |
 | constant euros |
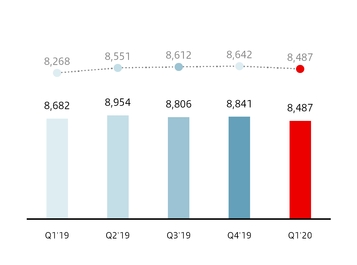
Net interest income recorded rises in seven of the ten core markets in local currency terms. Of note was growth in Argentina driven by the lower cost of funding, Chile, driven by higher inflation, Brazil, backed by increased volumes, and Poland due to the improvement in the cost of deposits and the change of mix in the lending portfolio. Falls were recorded in Portugal and Spain, affected by low interest rates, and the UK, due to the competitive pressure and the fall in SVR balances (Standard Variable Rate).
| • | Net fee income was 3% lower at EUR 2,853 million. Excluding the exchange rate impact, net fee income was 3% higher year-on-year, despite the impact of regulatory changes in various units, such as the UK and SCF. The strategy remained focused on increasing loyalty and growing higher value-added products and services. |
Of note was growth in Wealth Management & Insurance and Santander Corporate & Investment Banking, both with rises of 20%. Net fee income from WM&I, including those ceded to the branch network, represented 30% of the Group's total.
By region, increases in South America and North America, and a slight decrease in Europe. By country, growth in seven of our ten core markets, notably Brazil (+7%) driven by cards. In addition,19% growth in Other Europe, which includes the wholesale banking business in the region. On the other hand, falls in SCF (-12%) due to regulatory changes and the first impacts of lower production stemming from COVID-19, and the UK (-12%), driven by overdrafts.
| Net fee income | |
| EUR million | |
 | constant euros |
January - March 2020 | | 13 |
| • | Gains on financial transactions, which account for only 2% of total income, amounted to EUR 287 million with no material change compared to the first quarter of 2019. |
| • | Dividend income was EUR 57 million in the first three months of 2020, 14% lower than in the same period of 2020. This item started to be affected by the delay or cancellation of dividend payments by several companies. |
| • | The share of results of entities accounted for by the equity method decreased 36% to EUR 98 million (-33% excluding the FX impact) mainly due to lower income from real estate stakes in Spain. |
| • | Other operating income amounted to EUR 27 million (loss of EUR 24 million in the first quarter of 2019). |
u Costs
Costs totalled EUR 5,589 million, 3% lower year-on-year. Excluding the exchange rate impact, they rose only 1%.
In real terms (excluding inflation and perimeter), costs were 3% lower, reflecting the successful management carried out over the past three years.
The efficiency ratio improved 0.4 percentage points year-on-year to 47.2%, which has enabled us to remain as one of the world's most efficient global banks.
| Total income | |
| EUR million | |
 | constant euros |

The Group’s aim is to improve our operational capacity and at the same time manage our costs more efficiently and adapted to each area. For a better comparison, the trends by region and market are detailed below:
| • | In Europe, costs reflect the synergies of integrations, and fell 3.4% in nominal terms and 4.6% in real terms. Regarding the latter, of note were the declines in Spain (-8%) and Portugal (-4%) due to the efficiencies resulting from the integration of Popular and the optimisation efforts, the UK (-6%) reflecting cost savings from our transformation programme and Poland (-4%), in an environment of high single-digit salary pressures. |
In SCF, costs rose 1% mainly due to perimeter. Excluding it, costs fell 3% benefiting from the efficiency projects carried out in the various countries.
The efficiency ratio remained stable at around 54%-55%.
| • | In North America, costs were 2.5% higher in nominal terms affected by inflation. In real terms, they remained broadly unchanged, with Mexico increasing 1.5%, while in the US they fell 0.7%. The higher revenue enabled us to improve the efficiency ratio in this region to 41.7%. |
| • | Lastly, in South America, the increase in costs was significantly distorted by the very high inflation in Argentina. Excluding it, the increase was 3.4% in nominal terms and 0.3% in real terms, with Brazil performing well (-2%). Efficiency improved in all markets (1.1 percentage points in the region). |
We believe this management by region will enable us to continue to optimise costs, while improving customer experience.
| Operating expenses | |
| EUR million | |
 | constant euros |
| 14 | | January - March 2020 |
u Impairment or reversal of impairment of financial assets not measured at fair value through profit or loss (net)
Impairment or reversal of impairment of financial assets not measured at fair value through profit or loss (net) was EUR 3,934 million, a 75% increase year-on-year in euros and 85% higher excluding the exchange rate impact.
Loan-loss provisions included in this item, excluding the provisions overlay of EUR 1,6 billion aforementioned, amounted to EUR 2,309 million, 6% higher than in the same period of 2019. Excluding the FX impact, growth was 12%, led primarily by the increases in Santander Consumer Finance, Poland, Mexico and Brazil, mostly driven by volume growth, as the Group's cost of credit remained at around 1%.
u Impairment on other assets (net)
Impairment on other assets in the first three months of 2020 amounted to EUR 14 million (EUR 20 million in the same period of 2019).
u Provisions or reversal of provisions
Provisions (net of reversal provisions) stood at EUR 374 million (EUR 465 million in the first quarter of 2019). This line item includes charges for restructuring costs, which are set out on page 14 of this report.
u Gains or losses on non-financial assets and investments (net)
Net gains on non-financial assets and investments were EUR 18 million in the first quarter of 2020, compared to EUR 219 million in the same period of 2019, when capital gains from the sale of 51% our stake in Prisma Medios de Pago S.A. and the revaluation of the remaining stake (49%) were recorded.
u Negative goodwill recognised in results
Both in the first quarter of 2019 as in the first quarter of 2020, this line item recorded EUR 0 million.
u Gains or losses on non-current assets held for sale not classified as discontinued operations
This item, which includes mainly impairment of foreclosed assets recorded and the sale of properties acquired upon foreclosure, were EUR -25 million in March 2020, compared to EUR -213 million in the first three months of 2019.
u Profit before tax
Profit before tax was 48% lower than in 2019, at EUR 1,891 million. (-43% excluding the exchange rate impact).
u Income tax
Corporate income tax was EUR 1,244 million in 2019, an 8% decrease year-on-year (-0.5% excluding the exchange rate impact).
u Attributable profit to non-controlling interests
The attributable profit to non-controlling interests was EUR 316 million, 22% lower year-on-year (-18% excluding the FX impact), mainly due to the share repurchase programme carried out in Mexico in 2019, and the increased stake in SC USA.
u Attributable profit to the parent
Attributable profit to the parent amounted to EUR 331 million in the first quarter of 2020, 82% less compared to the same period of 2019. Excluding the exchange rate impact, -80%.
RoE was 6.31%, RoTE 8.75% and RoRWA 1.25% (7.85%, 11.15% and 1.54%, respectively in the first quarter of 2019).
Earnings per share was EUR 0.012 (EUR 0.104 in March 2019).
| Net loan-loss provisions | |
| EUR million | |
 | constant euros |
| Attributable profit to the parent | |
| EUR million | |
 | constant euros |
Note: Excluding provisions overlay in Q1'20.
January - March 2020 | | 15 |
u Underlying attributable profit to the parent
The attributable profit to the parent previously commented was affected, in 2020 and 2019, by results (net of tax) that are outside the ordinary course performance of our business and distort the year-on-year comparison, and are detailed below:
| • | In the first quarter of 2020, a provisions overlay of EUR 1.6 billion was recorded and restructuring costs of EUR 46 million as follows: EUR 23 million in the UK, EUR 12 million in Santander Consumer Finance, EUR 2 million in Poland and EUR 9 million in Other Europe. |
| • | In the first quarter of 2019, capital gains from the sale of 51% of our stake in the Argentinian entity Prisma Medios de Pago S.A. and the revaluation of the remaining 49% (EUR 150 million), capital losses related to real estate assets in Spain (EUR -180 million) and restructuring costs in the UK and Poland (EUR -78 million). |
Excluding these results from the various P&L lines where they are recorded, and incorporating them separately in the net capital gains and provisions line, underlying attributable profit to the parent was EUR 1,977 million in the first quarter of 2020 and EUR 1,948 million in the first quarter of 2019, 1% higher year-on-year (+8% without the FX impact).
By market, rises in all countries in the Americas, except Chile, notably the US and Mexico, and falls in all markets in Europe, in a more complicated market environment and where the first impacts of the health crisis were most noticeable.
This was reflected in the performance by region, with notable growth in North America (+34%) and South America (+15%), while Europe dropped 16%.
In the first quarter of 2020, the Group’s underlying RoTE was 11.06%, underlying RoRWA was 1.52% (11.31% and 1.56%, respectively in the same period of 2019) and underlying earnings per share EUR 0.111, the same than in March 2019.
| Summarised underlying income statement | ||||||||||||||
| EUR million | Change | Change | ||||||||||||
| Q1'20 | Q4'19 | % | % excl. FX | Q1'19 | % | % excl. FX | ||||||||
| Net interest income | 8,487 | 8,841 | (4.0) | (1.8) | 8,682 | (2.2) | 2.7 | |||||||
| Net fee income | 2,853 | 2,961 | (3.6) | (1.5) | 2,931 | (2.7) | 3.1 | |||||||
Gains (losses) on financial transactions (1) | 292 | 596 | (51.0) | (50.7) | 277 | 5.4 | 16.9 | |||||||
| Other operating income | 182 | 194 | (6.2) | (1.2) | 195 | (6.7) | (15.9) | |||||||
| Total income | 11,814 | 12,592 | (6.2) | (4.1) | 12,085 | (2.2) | 2.7 | |||||||
| Administrative expenses and amortisations | (5,577 | ) | (5,971 | ) | (6.6) | (5.1) | (5,758 | ) | (3.1) | 0.8 | ||||
| Net operating income | 6,237 | 6,621 | (5.8) | (3.1) | 6,327 | (1.4) | 4.5 | |||||||
| Net loan-loss provisions | (2,309 | ) | (2,573 | ) | (10.3) | (8.1) | (2,172 | ) | 6.3 | 12.2 | ||||
| Other gains (losses) and provisions | (372 | ) | (542 | ) | (31.4) | (29.6) | (471 | ) | (21.0) | (17.3) | ||||
| Profit before tax | 3,556 | 3,506 | 1.4 | 4.8 | 3,684 | (3.5) | 2.8 | |||||||
| Tax on profit | (1,260 | ) | (1,109 | ) | 13.6 | 17.3 | (1,326 | ) | (5.0) | 1.9 | ||||
| Profit from continuing operations | 2,296 | 2,397 | (4.2) | (1.0) | 2,358 | (2.6) | 3.3 | |||||||
| Net profit from discontinued operations | — | — | — | — | — | — | — | |||||||
| Consolidated profit | 2,296 | 2,397 | (4.2) | (1.0) | 2,358 | (2.6) | 3.3 | |||||||
| Non-controlling interests | (319 | ) | (325 | ) | (1.8) | 2.0 | (410 | ) | (22.2) | (18.1) | ||||
| Underlying attributable profit to the parent | 1,977 | 2,072 | (4.6) | (1.5) | 1,948 | 1.5 | 7.9 | |||||||
| Net capital gains and provisions | (1,646 | ) | 711 | — | — | (108 | ) | 0.0 | 943.0 | |||||
| Attributable profit to the parent | 331 | 2,783 | (88.1) | (87.5) | 1,840 | (82.0) | (80.2) | |||||||
(1) Includes exchange differences.
| 16 | | January - March 2020 |
è First quarter results compared to the fourth quarter of 2019
Compared to the fourth quarter of 2019, profit was 88% lower, strongly conditioned by the high charges recorded in the net capital gains and provisions line:
| • | In the first quarter of 2020: EUR -1,646 million, detailed on previous pages. |
| • | On the other hand, in the fourth quarter of 2019, positive results of EUR 711 million, as follows: EUR 693 million stemming from the agreement with Crédit Agricole S.A. for the integration of the custody businesses and EUR 551 million due to changes in tax regulation in Brazil, and negative results of EUR 225 million related to real estate stakes in Spain, EUR 140 million of restructuring costs and EUR 168 million for intangible assets and other. |
Excluding the capital gains and provisions line in the first quarter of 2020 and in the fourth quarter of 2019, underlying attributable profit was 5% lower in euros. Excluding the exchange rate impact, -2%, with the following evolution by lines:
| • | Total income was down 4%: net interest income declined 2%, strongly conditioned by Brazil and the UK (on the other hand, increases in Santander Consumer Finance and Chile). Net fee income was 1% lower, due to the UK, Argentina, where the fourth quarter was above average, and Brazil, where the fourth quarter was seasonally higher due to the collection of insurance premiums. Of particular note were the quarterly increases in Spain and the US, which reached the highest figure in the last five quarters. |
| • | Operating expenses decreased 5% driven by the falls in all business units, except Santander Consumer Finance, Poland and the UK. Of note were Brazil , the US and Argentina. |
| • | Loan-loss provisions dropped 8% primarily due to the seasonality of SC USA, a single name case in the UK and the strong volume growth in Brazil, all of them recorded in the previous quarter. |
| Underlying attributable profit to the parent* | |
| EUR million | |
 | constant euros |
(*) Excluding net capital gains and provisions.
January - March 2020 | | 17 |
| Response to the COVID-19 crisis Business model | ||||||||
| Balance sheet | ||||||||
| Grupo Santander. Condensed balance sheet | ||||||||||
| EUR million | ||||||||||
| Change | ||||||||||
| Assets | Mar-20 | Mar-19 | Absolute | % | Dec-19 | |||||
| Cash, cash balances at central banks and other demand deposits | 122,456 | 103,500 | 18,956 | 18.3 | 101,067 | |||||
| Financial assets held for trading | 125,846 | 98,592 | 27,254 | 27.6 | 108,230 | |||||
| Debt securities | 28,969 | 30,162 | (1,193 | ) | (4.0 | ) | 32,041 | |||
| Equity instruments | 8,605 | 11,982 | (3,377 | ) | (28.2 | ) | 12,437 | |||
| Loans and advances to customers | 298 | 241 | 57 | 23.7 | 355 | |||||
| Loans and advances to central banks and credit institutions | — | — | — | — | — | |||||
| Derivatives | 87,974 | 56,207 | 31,767 | 56.5 | 63,397 | |||||
| Financial assets designated at fair value through profit or loss | 67,142 | 82,149 | (15,007 | ) | (18.3 | ) | 66,980 | |||
| Loans and advances to customers | 31,270 | 24,535 | 6,735 | 27.5 | 31,147 | |||||
| Loans and advances to central banks and credit institutions | 28,775 | 48,250 | (19,475 | ) | (40.4 | ) | 28,122 | |||
| Other (debt securities an equity instruments) | 7,097 | 9,364 | (2,267 | ) | (24.2 | ) | 7,711 | |||
| Financial assets at fair value through other comprehensive income | 110,238 | 116,359 | (6,121 | ) | (5.3 | ) | 125,708 | |||
| Debt securities | 99,557 | 111,519 | (11,962 | ) | (10.7 | ) | 118,405 | |||
| Equity instruments | 2,291 | 2,590 | (299 | ) | (11.5 | ) | 2,863 | |||
| Loans and advances to customers | 8,390 | 2,250 | 6,140 | 272.9 | 4,440 | |||||
| Loans and advances to central banks and credit institutions | — | — | — | — | — | |||||
| Financial assets measured at amortised cost | 981,331 | 980,733 | 598 | 0.1 | 995,482 | |||||
| Debt securities | 26,033 | 39,895 | (13,862 | ) | (34.7 | ) | 29,789 | |||
| Loans and advances to customers | 895,449 | 883,169 | 12,280 | 1.4 | 906,276 | |||||
| Loans and advances to central banks and credit institutions | 59,849 | 57,669 | 2,180 | 3.8 | 59,417 | |||||
| Investments in subsidiaries, joint ventures and associates | 8,610 | 7,726 | 884 | 11.4 | 8,772 | |||||
| Tangible assets | 34,912 | 33,246 | 1,666 | 5.0 | 35,235 | |||||
| Intangible assets | 26,583 | 29,114 | (2,531 | ) | (8.7 | ) | 27,687 | |||
| Goodwill | 23,141 | 25,989 | (2,848 | ) | (11.0 | ) | 24,246 | |||
| Other intangible assets | 3,442 | 3,125 | 317 | 10.1 | 3,441 | |||||
| Other assets | 63,241 | 54,732 | 8,509 | 15.5 | 53,534 | |||||
| Total assets | 1,540,359 | 1,506,151 | 34,208 | 2.3 | 1,522,695 | |||||
| Liabilities and shareholders' equity | ||||||||||
| Financial liabilities held for trading | 100,082 | 67,994 | 32,088 | 47.2 | 77,139 | |||||
| Customer deposits | — | — | — | — | — | |||||
| Debt securities issued | — | — | — | — | — | |||||
| Deposits by central banks and credit institutions | — | — | — | — | — | |||||
| Derivatives | 88,121 | 56,509 | 31,612 | 55.9 | 63,016 | |||||
| Other | 11,961 | 11,485 | 476 | 4.1 | 14,123 | |||||
| Financial liabilities designated at fair value through profit or loss | 67,337 | 74,426 | (7,089 | ) | (9.5 | ) | 60,995 | |||
| Customer deposits | 44,638 | 41,063 | 3,575 | 8.7 | 34,917 | |||||
| Debt securities issued | 4,287 | 2,709 | 1,578 | 58.3 | 3,758 | |||||
| Deposits by central banks and credit institutions | 18,412 | 30,525 | (12,113 | ) | (39.7 | ) | 22,194 | |||
| Other | — | 129 | (129 | ) | (100.0 | ) | 126 | |||
| Financial liabilities measured at amortised cost | 1,224,749 | 1,211,981 | 12,768 | 1.1 | 1,230,745 | |||||
| Customer deposits | 770,821 | 767,298 | 3,523 | 0.5 | 789,448 | |||||
| Debt securities issued | 257,606 | 247,552 | 10,054 | 4.1 | 258,219 | |||||
| Deposits by central banks and credit institutions | 170,275 | 165,811 | 4,464 | 2.7 | 152,969 | |||||
| Other | 26,047 | 31,320 | (5,273 | ) | (16.8 | ) | 30,109 | |||
| Liabilities under insurance contracts | 2,280 | 751 | 1,529 | 203.6 | 739 | |||||
| Provisions | 12,335 | 13,449 | (1,114 | ) | (8.3 | ) | 13,987 | |||
| Other liabilities | 27,463 | 27,185 | 278 | 1.0 | 28,431 | |||||
| Total liabilities | 1,434,246 | 1,395,786 | 38,460 | 2.8 | 1,412,036 | |||||
| Shareholders' equity | 124,139 | 121,866 | 2,273 | 1.9 | 124,239 | |||||
| Capital stock | 8,309 | 8,118 | 191 | 2.4 | 8,309 | |||||
| Reserves | 117,161 | 114,145 | 3,016 | 2.6 | 111,077 | |||||
| Attributable profit to the Group | 331 | 1,840 | (1,509 | ) | (82.0 | ) | 6,515 | |||
| Less: dividends | (1,662 | ) | (2,237 | ) | 575 | (25.7 | ) | (1,662 | ) | |
| Other comprehensive income | (27,761 | ) | (23,021 | ) | (4,740 | ) | 20.6 | (24,168 | ) | |
| Minority interests | 9,735 | 11,520 | (1,785 | ) | (15.5 | ) | 10,588 | |||
| Total equity | 106,113 | 110,365 | (4,252 | ) | (3.9 | ) | 110,659 | |||
| Total liabilities and equity | 1,540,359 | 1,506,151 | 34,208 | 2.3 | 1,522,695 | |||||
| 18 | | January - March 2020 |
| Response to the COVID-19 crisis Business model | ||||||||
| Balance sheet | ||||||||
GRUPO SANTANDER BALANCE SHEET
| • | Strong negative exchange rate impact, both in the quarter (-5 pp) and year-on-year (-6 pp). |
| • | Excluding this impact, the following movements were recorded in the quarter, partially affected by the impacts derived from the COVID-19 crisis at the end of March: |
| – | Gross loans and advances to customers excluding reverse repos rose 3% driven by the increase in new lending and credit lines granted in the corporate segment, which offset the reduced activity of individuals. |
| – | Customer funds increased 1% reflecting two different factors. On one hand, deposits excluding repos rose 3% while, on the other hand, mutual funds were 10% lower, predominantly driven by the impact of markets. |
| • | Compared to March 2019: |
| – | Gross loans and advances to customers excluding reverse repos rose 7% year-on-year in constant euros with nine of the 10 core markets growing particularly in South America (+16%) and North America (+13%). |
| – | Customer funds increased 4% in constant euros, driven by deposits excluding repos, which rose 6%. Growth in nine of our 10 core markets. |
è Loans and advances to customers
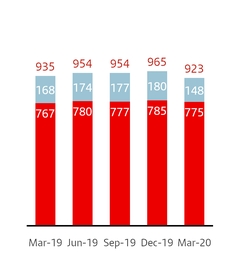
Gross loans and advances to customers rose to EUR 935,407 million in March 2019, 3% growth in euros year-on-year.
The Group uses gross loans and advances to customers excluding reverse repos for the purpose of analysing traditional commercial banking loans.
| • | In the quarter, gross loans and advances to customers excluding reverse repos and the exchange rate impact increased 3%, particularly in March, derived from the impact of the health crisis in activity and the need for funding of the different segments, which varies across countries depending on the expansion of the pandemic. This was reflected in a strong growth in loans to legal entities and institutions in all countries and in the stagnation or reduction of the lending activity of individuals, particularly in Europe. |
Volume growth across all markets, except Argentina and Santander Consumer Finance, the latter affected by the halt in consumer activity driven by the confinement measures in Spain and Italy, followed by France and other countries.
| Gross loans and advances to customers (Excl. reverse repos) | |
| EUR billion | |
| +1% * |
| Mar-20 / Mar-19 |
(*) In constant EUR: +7%
The performance of the quarter also affects the year-on-year comparison: gross loans and advances to customers excluding reverse repos and the exchange rate impact rose 7%, with the following performance by region:
In Europe, 4% growth with all markets increasing, except Spain (-4%). Santander Consumer Finance rose 7%, with almost all countries growing, Poland +9%, and the UK +5%, driven by strong residential mortgage activity from late 2019. Portugal grew 2%, shifting the downward trend of previous quarters. Other Europe, which includes most of the wholesale banking business in the region, increased 37%.
In North America, Mexico grew 13% and the US 12%, leading to a 13% increase in the region.
Growth in South America was 16%, with Brazil growing 18%, Chile +13% and Argentina +16%.
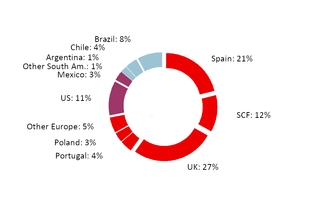
Gross loans and advances to customers excluding reverse repos maintained a balanced structure: individuals (46%), consumer credit (17%), SMEs and corporates (23%) and SCIB (14%).
| Gross loans and advances to customers (Excl. reverse repos) | |
| % operating areas. March 2020 | |
January - March 2020 | | 19 |
| Response to the COVID-19 crisis Business model | ||||||||
| Balance sheet | ||||||||
è Customer funds
Customer deposits amounted to EUR 815,459 million, 1% growth in the last 12 months (in euros).
The Group uses customer funds (customer deposits excluding repos, and including mutual funds) for the purpose of analysing traditional retail banking funds.
| • | In the first quarter, customer funds were 1% higher excluding exchange rate impacts and, as in loans, growth was mainly produced in March: |
Mixed performance by products: customer deposits excluding repos rose 3% (+2% demand deposits and +5% time deposits), while mutual funds dropped 10% due to high market volatility derived from COVID-19, mainly in Europe.
By market, North America rose 12%, with growth of 10% and 14% in the US and Mexico, respectively, South America increased 5% with broad-based growth in the region, notably Argentina, and Europe dropped 2% with decreases in most countries, adversely impacted by the fall in mutual funds.
| • | Compared to March 2019, customer funds, excluding the exchange rate impact, increased 4%, as follows: |
By product, deposits excluding repos rose 6%. Demand deposits (+7%) increased in nine of the ten core markets and time deposits grew 3% driven by the US and South America, which offset the falls in the other countries. Mutual funds dropped 2%, due to the aforementioned market volatility, with decreases in most European countries and increases in the Americas.
By market, customer funds rose in all of them except Spain (-4%), due to the falls in time deposits and mutual funds. Of note were Argentina (+34%), Chile (+21%), the US (+18%) and Brazil (+12%). There was more moderate growth in Mexico and Santander Consumer Finance (+10% and +7% respectively), while the others increased less than 5%.
| Customer funds | |
| EUR billion | |
| -1% * |
| -12% |
| +1% |
l Total |
l Mutual funds |
l Deposits excl. repos |
| Mar-20 / Mar-19 |
(*) In constant EUR: +4%
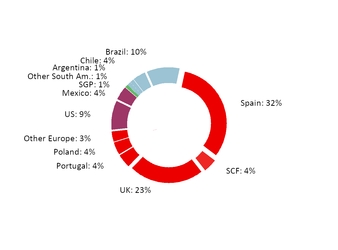
Customer funds continued to be well diversified by products: 63% demand deposits, 21% time deposits and 16% mutual funds.
As well as capturing customer deposits, Grupo Santander, for strategic reasons, maintains a selective policy of issuing securities in the international fixed income markets and strives to adapt the frequency and volume of its market operations to the structural liquidity needs of each unit, as well as to the receptiveness of each market.
• In the first quarter of 2020, the Group issued:
Medium- and long-term covered bonds placed in the market of EUR 6,553 million and senior debt amounting to EUR 6,679 million.
There were EUR 3,663 million of securitisations placed in the market.
Issuances to meet the TLAC (Total Loss-Absorbing Capacity) requirement amounting to EUR 4,125 million, in order to strengthen the Group’s situation (senior non-preferred: EUR 2,625 million, preferred: EUR 1,500 million).
Maturities of medium- and long-term debt of EUR 14,460 million.
| • | The net loan-to-deposit ratio was 115% (113% in March 2019). The ratio of deposits plus medium- and long-term funding to the Group’s loans was 112%, underscoring the comfortable funding structure. |
In the first quarter, Fitch Ratings confirmed the rating of long-term debt and deposits at A-/F2, changing the outlook from stable to negative due to the economic consequences that the COVID-19 crisis might have on the rating in the medium term. Additionally, following a change of criteria, Fitch Ratings revised the Bank’s subordinated debt (T2) ratings to BBB (from BBB+) and upgraded the preferred debt (AT1) to BB+ (from BB).
| Customer funds | |
| % operating areas. March 2020 | |
| 20 | | January - March 2020 |
SOLVENCY RATIOS
| • | At the end of the quarter, the CET1 ratio reached 11.58%. The organic generation and the measures adopted in dividends led to an increase of 36 bps, offset by corporate transactions, regulatory impacts and markets. |
| • | Tangible equity per share was EUR 4.21. Including the dividend recorded in the last 12 months, it was EUR 4.37, 1.8% higher year-on-year. |
| • | The fully loaded leverage ratio remained broadly stable at 5.04% in the quarter. |
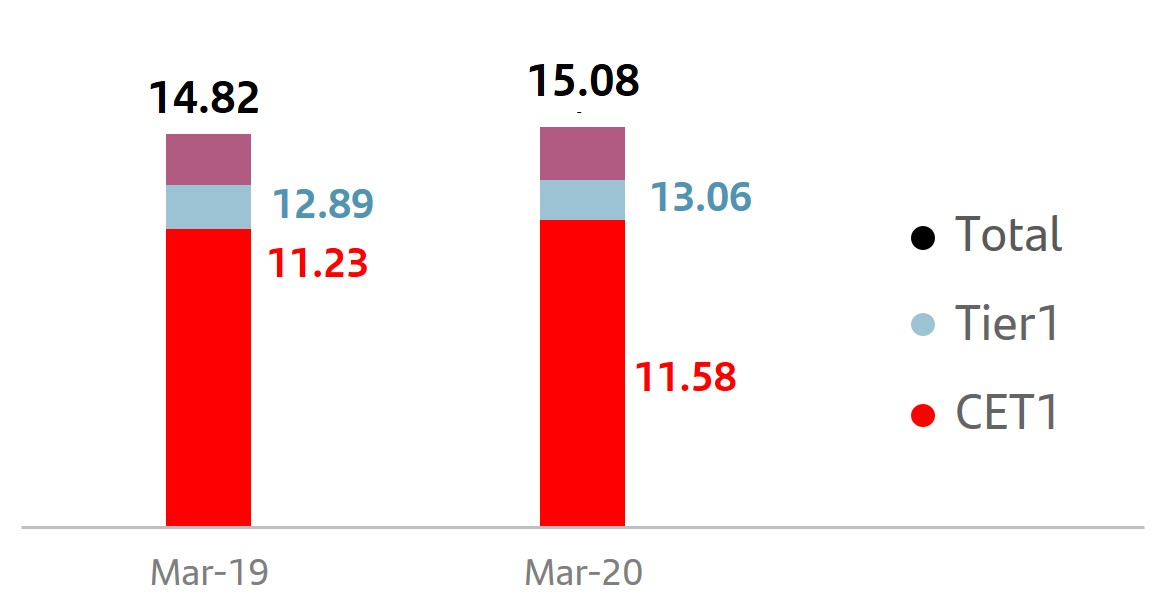
At the end of the quarter, the total phased-in capital ratio stood at 15.09% and the CET1 ratio (phased-in and fully loaded) at 11.58%. We have a strong capital base, comfortably meeting the minimum levels required by the European Central Bank on a consolidated basis (13.02% for the total capital ratio and 8.86% for the CET1 ratio), after the recent measures adopted by regulators of reducing the Pillar 2 R and countercyclical buffer. This results in a CET1 management buffer of 272 bps.
In the quarter, we continued to generate capital organically, +7 bps, after absorbing the sharp growth of risk weighted assets, as a result of increased lending. In addition, the cancellation of the payment of the final dividend against 2019 results, in compliance with the
European Central Bank's recommendation, had a positive impact of 29 bps. The aggregate effect amounted to a generation of 36 bps.
On the other hand, there were several non-recurring impacts in the quarter. Corporate transactions had a negative impact of 19 bps (mainly related to Allianz, Olé put and Elavon) and regulatory impacts of -15 bps (securitisations, Brazil models and IFRS 9), together with the negative performance of markets and exchange rates.
Had the IFRS 9 transitional arrangement not been applied, the total impact on the CET1 would have been -25 bps after the application of the dynamic phased-in.
| Eligible capital. Eligible capital. December 2019* | ||||
| EUR million | ||||
| Phased-in | Fully loaded | |||
| CET1 | 68,414 | 68,414 | ||
| Basic capital | 77,741 | 77,173 | ||
| Eligible capital | 89,196 | 89,097 | ||
| Risk-weighted assets | 590,952 | 590,952 | ||
| CET1 capital ratio | 11.58 | 11.58 | ||
| T1 capital ratio | 13.16 | 13.06 | ||
| Total capital ratio | 15.09 | 15.08 | ||
| Fully-loaded capital ratio* |
| % |
 |
| CET1 evolution* |
| % |
 |
(1) New securitisation framework (-0.06), Brazil models (-0.05) and phased-out IFRS 9 (-0.04)
(2) Corporate operations: Allianz (-0.09), Put Olé (-0.03) and Elavon and Other (-0.07)
(*) All 2019 and 2020 data was calculated using the IFRS 9 transitional arrangements, unless otherwise indicated.
January - March 2020 | | 21 |
RISK MANAGEMENT
| • | The effects related to the COVID-19 situation had not yet materialised in the risk indicators of the first quarter, which reflect the credit quality improvements observed in the first three months of the year. |
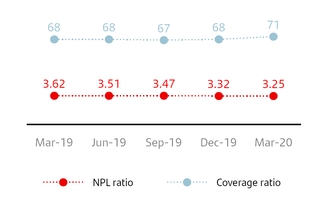
| • | The NPL ratio stood at 3.25% as of the end of March which is lower on both a quarterly and an annual basis, while cost of credit remained at 1%. Coverage increased 3 pp to 71%. |
| • | Our market risk exposure in this first quarter, remained at low levels, in spite of the recent uncertainty and volatility that is now prevailing in the current context. These exceptional circumstances that the markets have been going through since the final weeks of March did not have a material impact on Santander’s portfolio. |
| • | The operational risk profile remained stable, with a similar distribution of losses by category, despite the aforementioned observed volatility and uncertainty. |
u COVID-19 risk management
Santander is executing across all its units the existing business contingency plans, with the goal of ensuring the correct functioning of all our activities as well as providing the necessary support to our customers.
In order to address and closely monitor the potential effects derived from the current situation, the Group has additional governance including crisis management committees in which, among others, the following topics are discussed:
| • | Assessment of all risk factors and identification of areas of focus. |
| • | Potential impact analysis in all units where the Group operates, through continuous monitoring and scenario analysis. |
| • | Analysis and implementation of the different economic mitigating measures adopted by governments and central banks as well as those designed internally by the Bank. |
Continuous monitoring and reporting of the main key risk indicators to the board and senior management is key to facilitate the decision making process.
Even though the COVID-19 situation has deeply altered the normal functioning of the financial markets and the overall economic activity especially since the last few weeks of March, the Group maintained, in the first quarter, the positive trend in terms of credit quality, supported by the positive evolution of the NPL ratio, an appropriate coverage ratio and a stable cost of credit.
| Credit risk | ||||||||
| EUR million | ||||||||
| Mar-20 | Mar-19 | Chg (%) | Dec-19 | |||||
| Non-performing loans | 32,743 | 35,590 | (8.0 | ) | 33,799 | |||
| NPL ratio (%) | 3.25 | 3.62 | 3.32 | |||||
| Loan-loss allowances | 23,361 | 24,129 | (3.2 | ) | 22,965 | |||
| For impaired assets | 13,364 | 15,100 | (11.5 | ) | 14,093 | |||
| For other assets | 9,997 | 9,029 | 10.7 | 8,872 | ||||
| Coverage ratio (%) | 71 | 68 | 68 | |||||
| Cost of credit (%) | 1.00 | 0.97 | 1.00 | |||||
u Credit risk management
As acknowledged by the IASB and other regulators and supervisors, it is difficult at this time to know the specific effects of the health crisis and government and central bank support measures, such as mortgage repayment holidays, credit lines and guarantees and other mitigating packages.
Nevertheless, and in compliance with the accounting standard (IFRS 9), which enables the incorporation of forward-looking macroeconomic information in the calculation of provisions, that include future effects arising from changes in variables to which the models are sensitive to (GDP, unemployment, house prices, etc.), the Group recorded a provisions overlay in the quarter of EUR 1.6 billion, based on the expected deterioration in the economic conditions arising from the pandemic.
In terms of the first quarter credit risk performance, non-performing loans amounted to EUR 32,743 million in March, 3% less than in the previous quarter, due to the reductions observed in most of our countries.
The Group’s NPL ratio decreased to 3.25% (-7 bps quarter-on-quarter and -37 bps year-on-year). Reductions were observed on a year-on-year basis in most of the Group’s units.
Loan-loss provisions in the first quarter and excluding the previously mentioned overlay amounted to EUR 2,309 million, 8% less in constant euros than in the fourth quarter, mainly driven by seasonality in SC USA. On a year-on-year basis, 12% increase in constant euros, mainly led by the portfolio growth registered in Brazil and the lower portfolio sales in SCF.
| NPL and coverage ratios. Total Group |
| % |
| 22 | | January - March 2020 |
| Key metrics geographic performance. Key metrics geographic performance. March 2020 | ||||||||
| % | Change (bps) | |||||||
| NPL ratio | QoQ | YoY | Coverage ratio | |||||
| EUROPE | 3.19 | (6 | ) | (42 | ) | 51 | ||
| Spain | 6.88 | (6 | ) | (41 | ) | 42 | ||
| Consumer Finance | 2.43 | 13 | 10 | 104 | ||||
| United Kingdom | 0.96 | (5 | ) | (21 | ) | 38 | ||
| Portugal | 4.56 | (27 | ) | (121 | ) | 55 | ||
| Poland | 4.29 | (2 | ) | (10 | ) | 66 | ||
| NORTH AMERICA | 2.02 | (18 | ) | (31 | ) | 158 | ||
| USA | 2.00 | (20 | ) | (41 | ) | 167 | ||
| Mexico | 2.07 | (12 | ) | (5 | ) | 128 | ||
| SOUTH AMERICA | 4.63 | (23 | ) | (20 | ) | 86 | ||
| Brazil | 4.93 | (39 | ) | (33 | ) | 100 | ||
| Chile | 4.63 | (1 | ) | (4 | ) | 54 | ||
| Argentina | 3.97 | 58 | 47 | 113 | ||||
| GROUP | 3.25 | (7 | ) | (37 | ) | 71 | ||
| Non-performing loans by quarter | ||||||||||
| EUR million | ||||||||||
| Q1'19 | Q2'19 | Q3'19 | Q4'19 | Q1'20 | ||||||
| Balance at beginning of period | 35,692 | 35,590 | 34,421 | 34,326 | 33,799 | |||||
| Net additions | 2,147 | 2,511 | 3,190 | 2,696 | 2,543 | |||||
| Increase in scope of consolidation | — | — | — | — | — | |||||
| Exchange rate differences and other | 479 | (162 | ) | (110 | ) | (51 | ) | (964 | ) | |
| Write-offs | (2,728 | ) | (3,518 | ) | (3,175 | ) | (3,172 | ) | (2,635 | ) |
| Balance at period-end | 35,590 | 34,421 | 34,326 | 33,799 | 32,743 | |||||
Cost of credit remained at 1%, similar levels compared to the previous quarter and to the first quarter of 2019, reflecting the stability of our loan portfolio’s credit quality.
Total loan-loss reserves amounted to EUR 23,361 million. Coverage at the end of March 2020 increased to 71% due to the extraordinary provisions raised as previously explained. It should also be taken into account that in Spain and the UK, a large part of their portfolios has real estate collateral, which justifies lower coverage levels.
The Group’s coverage by IFRS 9 stages remained stable on a year-on-year and quarter-on-quarter basis, with no significant movements.
u Market risk
The global corporate banking trading activity risk is mainly interest rate driven, focused on servicing our customer's needs and measured in daily VaR terms at 99%. In the first quarter, after VaR fluctuating around an average value of EUR 10.6 million until the beginning of March, it reached EUR 54.8 million as a result of the market volatility spike caused by the health crisis, decreasing after that point and stabilising at around EUR 30 million, closing Q1'20 at EUR 20.7 million. These figures remain low compared to the size of the Group’s balance sheet and activity.
It should be also mentioned that there are other positions classified for accounting purposes as trading (total VaR of EUR 22.8 million at the end of March 2020).
| Coverage ratio by stage | |||||||
| EUR billion | |||||||
Exposure1 | Coverage | ||||||
| Mar-20 | Mar-20 | Mar-19 | |||||
| Stage 1 | 891 | 0.6 | % | 0.5 | % | ||
| Stage 2 | 53 | 8.2 | % | 9.1 | % | ||
| Stage 3 | 33 | 40.8 | % | 42.4 | % | ||
(1) Exposure subject to impairment. Additionally, there are EUR 31 billion in loans and advances to customers not subject to impairment recorded at mark to market with changes through P&L.
Stage 1: financial instruments for which no significant increase in credit risk is identified since its initial recognition.
Stage 2: if there has been a significant increase in credit risk since the date of initial recognition but the impairment event has not materialised, the financial instrument is classified in Stage 2.
Stage 3: a financial instrument is catalogued in this stage when it shows effective signs of impairment as a result of one or more events that have already occurred resulting in a loss.
January - March 2020 | | 23 |
| Trading portfolios*. VaR performance |
| EUR million |
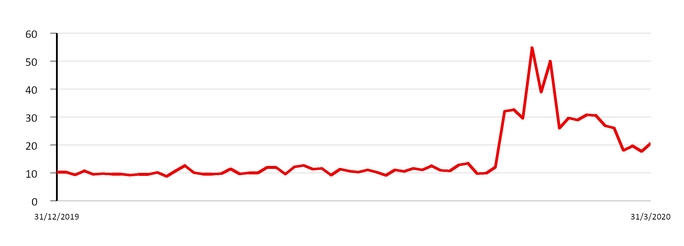
(*) Corporate & Investment Banking performance in financial markets.
Trading portfolios (1). VaR by geographic region | |||||||
| EUR million | |||||||
| 2020 | 2019 | ||||||
| First quarter | Average | Latest | Average | ||||
| Total | 15.8 | 20.7 | 13.5 | ||||
| Europe | 10.7 | 19.9 | 6.0 | ||||
| North America | 5.6 | 11.7 | 2.7 | ||||
| South America | 8.0 | 5.8 | 11.3 | ||||
(1) Activity performance in Santander Corporate & Investment Banking markets.
u Structural and liquidity risk
| • | With regards to structural exchange rate risk, Santander’s CET1 ratio coverage remained around 100% in order to protect it from foreign currency movements. |
| • | In structural interest rate risk, negative performance in the ALCO activity, mainly in Latin America due to the potential negative impact on its economy, which is highly dependent on trade with China. |
| • | In liquidity risk during the first quarter, the Group maintained a comfortable position, supported by a robust liquidity buffer, with ratios well above regulatory limits. |
Trading portfolios (1). VaR by market factor | ||||||||
| EUR million | ||||||||
| First quarter 2020 | Min. | Avg. | Max. | Last | ||||
| VaR total | 8.8 | 15.8 | 54.8 | 20.7 | ||||
| Diversification effect | (2.0 | ) | (11.2 | ) | (32.7 | ) | (28.3 | ) |
| Interest rate VaR | 6.2 | 11.0 | 29.2 | 20.6 | ||||
| Equity VaR | 3.0 | 5.4 | 14.7 | 12.9 | ||||
| FX VaR | 2.6 | 5.4 | 12.9 | 8.9 | ||||
| Credit spreads VaR | 3.1 | 5.1 | 10.3 | 6.4 | ||||
| Commodities VaR | — | — | 0.2 | — | ||||
(1) Activity performance in Corporate & Investment Banking markets.
NOTE: In the North America, South America and Asia portfolios, VaR corresponding to the credit spreads factor other than sovereign risk is not relevant and is included in the interest rate factor.
u Operational risk
| • | The COVID-19 situation has driven the Group to put additional focus on several operational risk aspects, such as: |
| – | Business continuity plans to support our employees, customers and overall businesses. |
| – | Potential increase of cyber risk due to new conditions in business management and remote working. Our cyber security programme continued to be improved by strengthening detection, response and protection mechanisms. |
| – | Increase in technological support in order to ensure adequate customer service and correct performance of our services, especially in online banking and call centres. |
| – | Continuous follow up on other risk that could increase such as third party, fraud, data risk or conduct and AML. |
| • | In terms of the first quarter performance, levels of losses in relative terms by Basel categories were aligned with the first quarter of 2019, and lower than previous quarter. In addition to the COVID-19 situation, the main risk this quarter was the evolution of ongoing legal and regulatory cases (including legacy cases) and legal claims in Brazil. |
| 24 | | January - March 2020 |
GENERAL BACKGROUND
Grupo Santander carried out its business in the first quarter of 2020 which began on a positive note until the outbreak of the COVID-19 crisis. The development of the pandemic, the confinement measures and suspension of most activity and the economic policy measures created an environment of great economic and financial uncertainty, which led to a strong global recession at the end of the quarter, which will extend to the second quarter of the year, together with significant market volatility.
| Country | GDP Change1 | Economic performance | |
 | Eurozone | +1.2% | Confidence indicators plummeted in March, evidencing a sharp contraction in GDP growth. Business surveys expect a decline in employment and increase in unemployment. Inflation fell to 0.8%in March due to lower oil prices. |
 | Spain | +2.0% | The quarter began with a similar growth rate to that of Q4'19. However, conditions changed dramatically in March, as the economic halt resulting from confinement measures due to COVID-19 will lead to a fall in GDP growth. Inflation dropped to 0% in March driven by lower oil prices. |
 | United Kingdom | +1.4% | The rebound in activity at the beginning of the quarter was truncated by the COVID-19 crisis. Inflation in February (1.7%) reflected the fall in oil prices but not the weakening of activity. The unemployment rate ended the year at 3.8% . The Bank of England cut interest rates to 0.1% to address the crisis. |
 | Portugal | +2.2% | The economic standstill in the past weeks will lead to a notable decrease in GDP growth, which had already moderated due to the lower contribution of domestic demand. The jobless rate rose slightly at the end of the year (6.71%) and inflation remained unchanged in March (0.05%). |
 | Poland | +4.1% | The economy grew at a good pace in 2019, but Q1'20 will be affected by the COVID-19 crisis. Inflation remained high in March (4.6%), although the central bank cut its key interest rate to 0.5% from1.0%, to handle the impact from the pandemic. The unemployment rate will rise from 2.9% in Q4'19. |
 | United States | +2.3% | After economic growth slowed down by 0.6 pp in 2019, conditions for the stabilisation of the economy were met at the start of 2020. But the pandemic, with high potential economic impact, and tighter financial conditions led the Fed to cut rates to 0-0.25% in March. |
 | Mexico | -0.1% | The outbreak of COVID-19 raised market volatility and will negatively affect the GDP growth, which was stagnant in 2019. The central bank cut its key interest rate to 6.50% (7.25% in Q4'19) and announced measures to provide liquidity, which will help to ease tensions. Inflation stood at 3.2% in March, in line with the official target. S&P downgraded the sovereign rating (from BBB+ to BBB). |
 | Brazil | +1.1% | The gradual recovery of GDP in 2019 is expected to be dampened by the effects of the pandemic and market volatility generated. Inflation remained low (3.3% in March). The central bank cut its benchmark rate to 3.75% (4.50% in Q4'19) and announced liquidity measures to calm market volatility. |
 | Chile | +1.1% | GDP was impacted in Q4'19 by the social protests that began in mid-October. Activity recovered in the following months, although future uncertainty remained and increased due to the pandemic. Inflation temporarily rebounded to 3.7% in March. The central bank cut the official rate by 125 bps to 0.5% in March and approved measures to inject liquidity and reduce volatility. |
 | Argentina | -2.2% | GDP growth fell 1% in Q4'19 and 2.2% in the year, dampened by consumption and investment. Inflation moderated slightly to 2.5% per month in Q1'20 ( 3.8% in average in Q4'19), due to exchange rate control and price agreements. The main focus was the renegotiation of foreign debt. |
(1) Year-on-year change 2019.
January - March 2020 | | 25 |
| Response to the COVID-19 crisis Business model | ||||||||
DESCRIPTION OF SEGMENTS
The segment reporting is based on financial information presented to the chief operating decision maker, which excludes certain items included in the statutory results that distort year-on-year comparisons and are not considered for management reporting purposes. This financial information (underlying basis) is computed by adjusting reported results for the effects of certain gains and losses (e.g.: capital gains, write-downs, impairment of goodwill, etc.). These gains and losses are items that management and investors ordinarily identify and consider separately to better understand the underlying trends in the business.
The Group has aligned the information in this operating segment section in a manner consistent with the underlying information used internally for management reporting purposes and with that presented throughout the Group’s other public documents.
The Group executive committee has been determined to be the chief operating decision maker for the Group. The Group’s operating segments reflect the organisational and management structures. The Group executive committee reviews the internal reporting based on these segments in order to assess performance and allocate resources.
The segments are differentiated by the geographic area where profits are earned and by type of business. The financial information of each reportable segment is prepared by aggregating the figures for the Group’s various geographic areas and business units. The information relates to both the accounting data of the units integrated in each segment and that provided by management information systems. In all cases, the same general principles as those used in the Group are applied.
The businesses included in each of the business areas in this report and the accounting principles under which their results are presented here may differ from the businesses included and accounting principles applied in the financial information separately prepared and disclosed by our subsidiaries (some of which are publicly listed) which in name or geographical description may seem to correspond to the business areas covered in this report. Accordingly, the results of operations and trends shown for our business areas in this document may differ materially from those of such subsidiaries.
In 2020, the Group maintains the general criteria applied in 2019, as well as the business segments with the following exceptions, which only affect the secondary segments:
1. Following the creation of the reporting segment Santander Global Platform in 2019, which comprises our global digital services under a single unit, and its incorporation in both main and secondary segments, in 2020 for better monitoring of its evolution and contribution to the Group's results, at the secondary segment level in addition to the results generated by the platforms, 50% of the results generated by countries in products linked to these platforms are considered. These results were previously included in Retail Banking.
2. Annual adjustment of the perimeter of the Global Customer Relationship Model between Retail Banking and Santander Corporate & Investment Banking and between Retail Banking and Wealth Management & Insurance.
These changes in the secondary segments have no impact on the primary segments and do not affect the Group’s figures.
To allow better comparability of the secondary segments, the data of 2019 has been provided on a new basis.
After these changes, the operating business areas are structured in two levels:
Primary segments
This primary level of segmentation, which is based on the Group’s management structure, comprises five reportable segments: four operating areas plus the Corporate Centre. The operating areas are:
Europe: which comprises all the business activities carried out in the region. Detailed financial information is provided on Spain, Portugal, Poland, Santander Consumer Finance (which incorporates all the region’s business, including the three countries mentioned herewith) and the UK.
North America: which comprises all the business activities carried out in Mexico and the US, which includes the holding company (SHUSA) and the businesses of Santander Bank, Santander Consumer USA, Banco Santander Puerto Rico (whose sale was agreed in the second half of 2019 and is expected to close in the middle of 2020), the specialised unit Banco Santander International and the New York branch.
South America: includes all the financial activities carried out by the Group through its banks and subsidiary banks in the region. Detailed information is provided on Brazil, Chile, Argentina, Uruguay, Peru and Colombia.
Santander Global Platform: which comprises our global digital services under a single unit, includes Global Payments Services (Global Trade Services, Global Merchant Services, Superdigital, Pago FX), our fully digital bank Openbank and Open Digital Services, and Digital Assets (Centres of Digital Expertise, InnoVentures and Digital Assets).
| 26 | | January - March 2020 |
| Response to the COVID-19 crisis Business model | ||||||||
Secondary segments
At this secondary level of segment reporting, the Group is structured into Retail Banking, Santander Corporate & Investment Banking, Wealth Management & Insurance and Santander Global Platform.
Retail banking: this covers all customer banking businesses, including consumer finance, except those of corporate banking, which are managed through Santander Corporate & Investment Banking, asset management, private banking and insurance, which are managed by Wealth Management & Insurance and 50% of the countries’ results generated by digital services, which are included in Santander Global Platform. The results of the hedging positions in each country are also included, conducted within the sphere of each one’s assets and liabilities committee.
Santander Corporate & Investment Banking (SCIB): this business reflects revenue from global corporate banking, investment banking and markets worldwide including treasuries managed globally (always after the appropriate distribution with Retail Banking customers), as well as equity business.
Wealth Management & Insurance: includes the asset management business (Santander Asset Management), the corporate unit of Private Banking and International Private Banking in Miami and Switzerland and the insurance business (Santander Insurance).
Santander Global Platform: which comprises our global digital services under a single unit (breakdown in the primary segment definition), as well as 50% of the results generated by these services in the commercial network.
In addition to these operating units, which report by geographic area and businesses, the Group continues to maintain the area of Corporate Centre, that includes the centralised activities relating to equity stakes in financial companies, financial management of the structural exchange rate position, assumed within the sphere of the Group’s assets and liabilities committee, as well as management of liquidity and of shareholders’ equity via issuances.
As the Group’s holding entity, this area manages all capital and reserves and allocations of capital and liquidity with the rest of businesses. It also incorporates amortisation of goodwill but not the costs related to the Group’s central services (charged to the areas), except for corporate and institutional expenses related to the Group’s functioning.
As described on the previous page, the results of our business areas presented below are provided on the basis of underlying results only and including the impact of foreign exchange rate fluctuations. However, for a better understanding of the actual changes in the performance of our business areas, we provide and discuss the year-on-year changes to our results excluding such impact. On the other hand, certain figures contained in this report, including financial information, have been subject to rounding to enhance their presentation. Accordingly, in certain instances, the sum of the numbers in a column or a row in tables contained in this report may not conform exactly to the total figure given for that column or row. |
January - March 2020 | | 27 |
| Response to the COVID-19 crisis Business model | ||||||||
| January-March 2020 | ||||||||||||
| Main items of the underlying income statement | ||||||||||||
| EUR million | ||||||||||||
| Primary segments | Net interest income | Net fee income | Total income | Net operating income | Profit before tax | Underlying attributable profit to the parent | ||||||
| EUROPE | 3,435 | 1,315 | 4,974 | 2,263 | 1,511 | 974 | ||||||
| Spain | 925 | 643 | 1,789 | 844 | 487 | 352 | ||||||
| Santander Consumer Finance | 979 | 187 | 1,171 | 656 | 528 | 304 | ||||||
| United Kingdom | 898 | 193 | 1,098 | 384 | 260 | 188 | ||||||
| Portugal | 202 | 101 | 350 | 199 | 173 | 120 | ||||||
| Poland | 296 | 116 | 365 | 193 | 90 | 38 | ||||||
| Other | 134 | 74 | 202 | (14 | ) | (27 | ) | (28 | ) | |||
| NORTH AMERICA | 2,261 | 461 | 2,936 | 1,712 | 824 | 522 | ||||||
| US | 1,462 | 250 | 1,929 | 1,120 | 468 | 273 | ||||||
| Mexico | 798 | 211 | 1,007 | 592 | 357 | 249 | ||||||
| SOUTH AMERICA | 3,065 | 1,074 | 4,163 | 2,677 | 1,661 | 928 | ||||||
| Brazil | 2,270 | 869 | 3,137 | 2,133 | 1,298 | 694 | ||||||
| Chile | 448 | 92 | 553 | 322 | 216 | 125 | ||||||
| Argentina | 241 | 76 | 318 | 132 | 79 | 59 | ||||||
| Other | 106 | 37 | 157 | 91 | 68 | 51 | ||||||
| SANTANDER GLOBAL PLATFORM | 31 | 13 | 45 | (26 | ) | (27 | ) | (13 | ) | |||
| CORPORATE CENTRE | (304 | ) | (9 | ) | (304 | ) | (389 | ) | (413 | ) | (434 | ) |
| TOTAL GROUP | 8,487 | 2,853 | 11,814 | 6,237 | 3,556 | 1,977 | ||||||
| Secondary segments | ||||||||||||
| RETAIL BANKING | 7,885 | 2,024 | 9,972 | 5,445 | 2,818 | 1,637 | ||||||
| CORPORATE & INVESTMENT BANKING | 671 | 404 | 1,300 | 764 | 745 | 491 | ||||||
| WEALTH MANAGEMENT & INSURANCE | 132 | 320 | 586 | 342 | 334 | 240 | ||||||
| SANTANDER GLOBAL PLATFORM | 103 | 115 | 260 | 74 | 71 | 43 | ||||||
| CORPORATE CENTRE | (304 | ) | (9 | ) | (304 | ) | (389 | ) | (413 | ) | (434 | ) |
| TOTAL GROUP | 8,487 | 2,853 | 11,814 | 6,237 | 3,556 | 1,977 | ||||||
| Underlying attributable profit geographic distribution* | Underlying attributable profit Q1'20. Core markets | |
| January - March 2020 | EUR million. % change YoY in constant euros | |
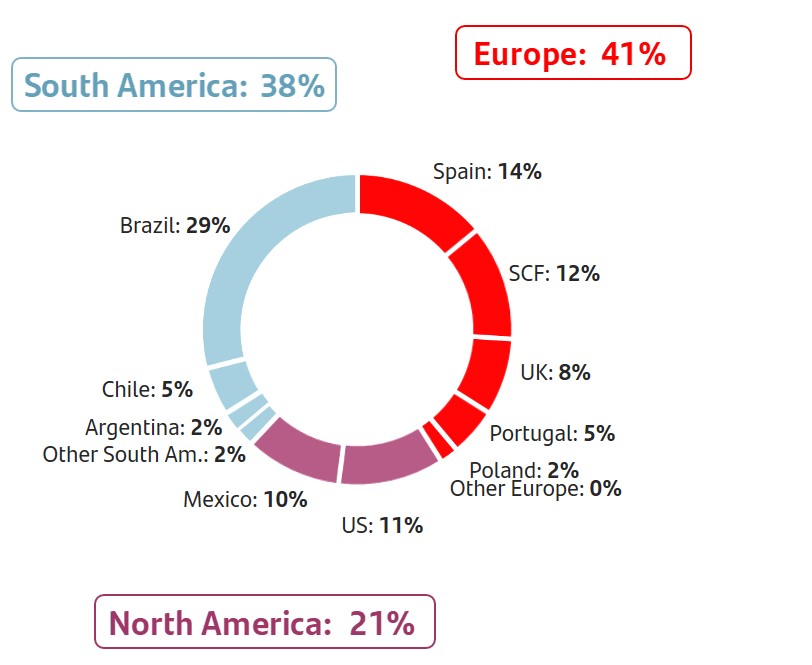 | 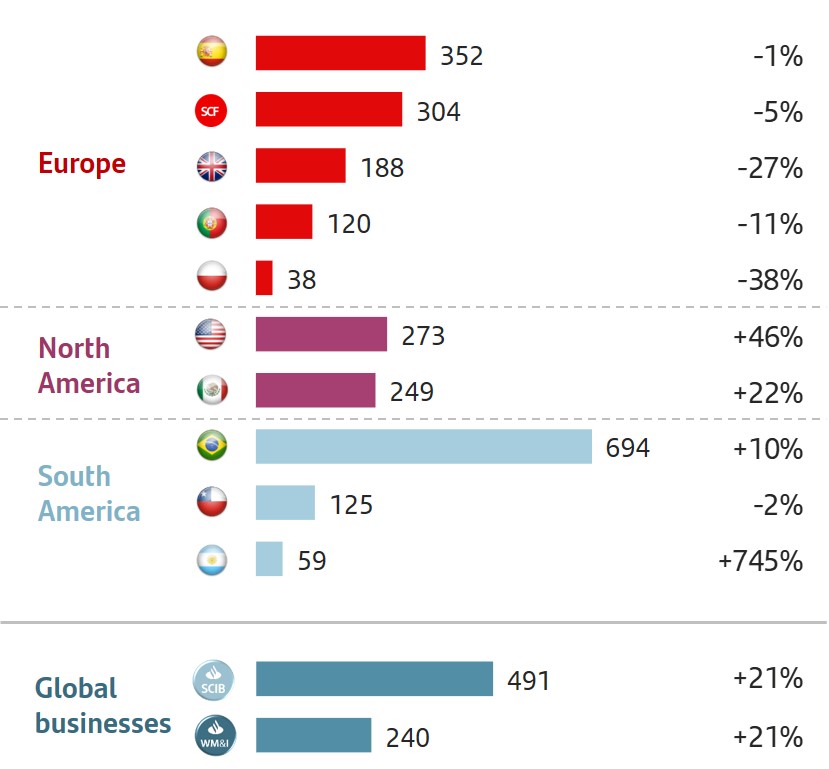 | |
| (*) As a % of operating areas. Excluding Corporate Centre and Santander Global Platform. | ||
| 28 | | January - March 2020 |
| Response to the COVID-19 crisis Business model | ||||||||
| January-March 2019 | ||||||||||||
| Main items of the underlying income statement | ||||||||||||
| EUR million | ||||||||||||
| Primary segments | Net interest income | Net fee income | Total income | Net operating income | Profit before tax | Underlying attributable profit to the parent | ||||||
| EUROPE | 3,561 | 1,327 | 5,225 | 2,423 | 1,768 | 1,163 | ||||||
| Spain | 1,009 | 623 | 1,857 | 832 | 478 | 356 | ||||||
| Santander Consumer Finance | 941 | 214 | 1,167 | 659 | 561 | 324 | ||||||
| United Kingdom | 975 | 216 | 1,206 | 467 | 357 | 254 | ||||||
| Portugal | 216 | 98 | 357 | 200 | 193 | 135 | ||||||
| Poland | 281 | 113 | 377 | 204 | 127 | 61 | ||||||
| Other | 139 | 62 | 261 | 61 | 52 | 32 | ||||||
| NORTH AMERICA | 2,173 | 439 | 2,753 | 1,581 | 713 | 386 | ||||||
| US | 1,407 | 234 | 1,815 | 1,039 | 370 | 181 | ||||||
| Mexico | 766 | 204 | 939 | 542 | 343 | 205 | ||||||
| SOUTH AMERICA | 3,222 | 1,178 | 4,487 | 2,842 | 1,785 | 926 | ||||||
| Brazil | 2,459 | 931 | 3,411 | 2,286 | 1,409 | 721 | ||||||
| Chile | 440 | 103 | 600 | 344 | 279 | 148 | ||||||
| Argentina | 213 | 116 | 331 | 129 | 34 | 10 | ||||||
| Other | 109 | 29 | 146 | 83 | 63 | 47 | ||||||
| SANTANDER GLOBAL PLATFORM | 22 | 2 | 19 | (22 | ) | (23 | ) | (11 | ) | |||
| CORPORATE CENTRE | (296 | ) | (14 | ) | (399 | ) | (497 | ) | (559 | ) | (517 | ) |
| TOTAL GROUP | 8,682 | 2,931 | 12,085 | 6,327 | 3,684 | 1,948 | ||||||
| Secondary segments | ||||||||||||
| RETAIL BANKING | 8,083 | 2,178 | 10,412 | 5,718 | 3,184 | 1,763 | ||||||
| CORPORATE & INVESTMENT BANKING | 654 | 352 | 1,278 | 717 | 686 | 441 | ||||||
| WEALTH MANAGEMENT & INSURANCE | 141 | 273 | 523 | 282 | 285 | 208 | ||||||
| SANTANDER GLOBAL PLATFORM | 100 | 142 | 271 | 107 | 88 | 52 | ||||||
| CORPORATE CENTRE | (296 | ) | (14 | ) | (399 | ) | (497 | ) | (559 | ) | (517 | ) |
| TOTAL GROUP | 8,682 | 2,931 | 12,085 | 6,327 | 3,684 | 1,948 | ||||||
January - March 2020 | | 29 |
| EUROPE | |
 | Highlights (changes in constant euros) • Given the current macroeconomic environment, characterised by lower for longer interest rates, we are working on our franchises to simplify our business model and structures and adapt our technology platforms.• In an environment of high uncertainty generated by the COVID-19 health crisis, loans grew 4%, mainly in SMEs and large corporates, which partially offset the falls in new lending in the consumer and individual segments.• Underlying attributable profit amounted to EUR 974 million, down 16% compared to 2019, due to lower customer revenue and higher provisions (partly due to portfolio sales in SCF in Q1'19). Costs improved 3%, with good performance in all markets, reflecting the optimisation measures. |
| EUR 974 Mn | |
| Underlying attributable profit | |
Strategy
In Europe, we are further exploring initiatives to enable greater business integration, and aimed at obtaining additional synergies in the medium-term, leveraging our global capabilities to strengthen operational efficiency in the region. For example:
| • | Integration of the different technological platforms and acceleration of the digital transformation process, improving customer experience and expanding distribution channels for our products and services. |
| • | Simplification of our business, reducing the number of products to gain efficiency and agility but maintaining a full value proposition that is capable of meeting the daily needs of our individual customers and offering tailored solutions for SMEs and large corporates. |
In addition, we are managing regulatory impacts on income and costs.
Business performance
Gross loans and advances to customers (excluding reverse repos) increased by 4%, boosted by SCF (driven by the organic growth in 2019 and the JV in Germany), CIB business, the UK (mortgages) and Poland. Spain was affected by lower balances in institutions, portfolio sales and the fall in mortgages.
Customer deposits (excluding repos) increased 1% year-on-year with rises in all countries except Spain. Mutual funds fell 7%, very impacted by markets, with no material change in customer funds.
Results
Underlying attributable profit amounted to EUR 974 million in the first quarter, 16% less than the previous year. By lines:
| • | In an environment of high uncertainty derived from the health crisis, total income dropped 5%. Net interest income was 4% lower, impacted by Spain (smaller ALCO portfolio, average volumes and rates) and the UK (competitive pressure and SVR attrition). Net fee income fell slightly (-1%) whilst gains on financial transactions declined 24%, adversely impacted by CIB. Lastly, decreases in other operating income (-46%) due to lower income from real estate stakes in Spain and higher BFG contribution in Poland. |
| • | Costs decreased 3% (-5% in real terms) because of the efficiencies generated and the optimisation processes, mainly in Spain and the UK. |
| • | Provisions rose 22%, primarily from higher portfolio sales in SCF in the first quarter of 2019. |
In the quarter, profit dropped 21% mainly due to lower income (NII and gains on financial transactions) affected by lower income from ALCO portfolio sales.
| Customers | ||||||
| March 2020. Thousands | ||||||
| Loyal customers | Digital customers | |||||
 | 9,851 |  | 14,227 | |||
| 36 | % | /active customers | +6 | % | YoY | |
| Activity | ||||||||||
| March 2020. EUR billion and % change in constant euros | ||||||||||
| +3% | -2% | |||||||||
| QoQ | QoQ | |||||||||
| 653 | 644 | |||||||||
| +4% | 0% | |||||||||
| YoY | YoY | |||||||||
| Gross loans and advances to customers excl. reverse repos | Customer deposits excl. repos + mutual funds | |||||||||
| Underlying income statement | |||||||
| EUR million and % change in constant euros | |||||||
| Q1'20 | / Q4'19 | / Q1'19 | |||||
| Revenue | 4,974 | -6 | % | -5 | % | ||
| Expenses | -2,712 | -1 | % | -3 | % | ||
| LLPs | -556 | +12 | % | +22 | % | ||
| PBT | 1,511 | -18 | % | -15 | % | ||
| Underlying attrib. profit | 974 | -21 | % | -16 | % | ||
| 30 | | January - March 2020 |
| SPAIN | ||
 | Highlights | |
| Given the COVID-19 health crisis, Santander España was the first entity to offer a EUR 20 billion fund to cover SMEs' short-term liquidity needs and launched an ICO-COVID-19 credit line for the tourism and hospitality industry. In addition, other measures were implemented to promote financing for individuals. | ||
• In corporates, focus on loans with ICO guarantee, in which we have already granted EUR 9.6 billion in around 60,000 operations.• Underlying attributable profit in the first quarter was EUR 352 million, 1% lower, as net interest income was impacted by lower average balances and lower ALCO portfolios, which were offset by cost reduction and improved cost of funding (-8 bps compared to Q1'19). | ||
| EUR 352 Mn | ||
| Underlying attributable profit | ||
Commercial activity
| • | Positive commercial dynamism with double-digit production growth up to mid-March in all segments and products, ending the quarter with a 14% year-on-year increase despite the COVID-19 impact. |
| • | Residential mortgage activity increased 15% year-on-year, boosted by the launch of the new flexible contracting modules. Subsequently, the priority shifted to the Plan Ayuda a las personas, as a part of the holiday repayment actions for vulnerable customers. |
| • | Our digital capabilities enabled us to provide all our services in an environment of fewer open branches and with a record growth in the number of digital customers in the quarter (+139,000) and in the number of accesses to digital channels (99 million in March). |
| • | We continue to drive digitalisation, enabling customers to take out support plans and legal repayment holidays digitally and the launch of Financia&Go, the first fully digital invoice financing service for SMEs and self-employed workers on external platforms, fully digital confirming procurement process and car renting though online banking for individuals. |
Business performance
Gross loans and advances to customers (excluding reverse repos) dropped 4% year-on-year. Loans grew in the quarter due to an increase of close to EUR 3 billion in March, notably SMEs and corporates. Significant decreases in loans to individuals, new mortgage lending and consumer lending.
In customer funds, deposits declined mainly dampened by institutions. Mutual funds decreased highly impacted by the markets performance and capturing was flat.
Results
Underlying attributable profit in the first quarter amounted to EUR 352 million, 1% lower year-on-year. By lines:
| • | Total income fell 4%, mainly driven by net interest income due to smaller ALCO portfolio and lower stock in wholesale banking. Lower income from real estate stakes were partially offset by higher gains on financial transactions. |
| • | Cost reduction efforts were reflected in an 8% decrease year-on-year, delivering on our efficiency plan. |
| • | Controlled loan-loss provisions. The NPL ratio fell 41 bps year-on-year to 6.88%. |
Compared to the fourth quarter of 2019, profit declined mainly due to higher provisions, which were far below average in the previous quarter.
| Customers | ||||||
| March 2020. Thousands | ||||||
| Loyal customers | Digital customers | |||||
| 2,535 | | 4,860 | |||
| 32 | % | /active customers | +6 | % | YoY | |
| Activity | ||||||||||
| March 2020. EUR billion and % change | ||||||||||
| -5% | ||||||||||
| +1% | QoQ | |||||||||
| QoQ | ||||||||||
| 192 | 294 | |||||||||
| -4% | -4% | |||||||||
| YoY | YoY | |||||||||
| Gross loans and advances to customers excl. reverse repos | Customer deposits excl. repos + mutual funds | |||||||||
| Underlying income statement | |||||||
| EUR million and % change | |||||||
| Q1'20 | / Q4'19 | / Q1'19 | |||||
| Revenue | 1,789 | -1 | % | -4 | % | ||
| Expenses | -944 | -3 | % | -8 | % | ||
| LLPs | -253 | +44 | % | +5 | % | ||
| PBT | 487 | -13 | % | +2 | % | ||
| Underlying attrib. profit | 352 | -12 | % | -1 | % | ||
January - March 2020 | | 31 |
| SANTANDER CONSUMER FINANCE | ||
 | Highlights (changes in constant euros) | |
| All our units have taken measures to protect employees during the COVID-19 crisis. We are adapting to this new situation with a proactive management, to ensure the continuity of our service in branches and call centres and to continue to assist and support customers, dealers and providers affected by the health crisis. | ||
• The crisis has significantly impacted the consumer business in the quarter, particularly in Italy and Spain, which was reflected in the 5% fall in new lending year-on-year.• Underlying attributable profit of EUR 304 million, 5% lower year-on-year. The positive performance of total income (net interest income) was offset by higher costs (perimeter) and provisions (lower portfolio sales). | ||
| EUR 304 Mn | ||
| Underlying attributable profit | ||
Commercial activity
SCF business model is based on geographic diversification, scale, leadership in efficiency and and a better risk control and recovery system than its competitors, which enables business growth maintaining good credit quality.
We continued to focus on remaining the leader in auto finance and increasing consumer finance by boosting digital channels. To this end, we made an offer in the quarter to acquire up to 50% of Sixt Leasing, which will enable us to grow our leasing activity across Europe, and launched a joint consumer finance operation with Telecom Italia Mobile for its 25 million customers in Italy.
Business performance
Up to February, before the impact of COVID-19, new lending rose 2% compared to the 7% drop in new car sales in Europe.
However, the falls in activity registered in March as a consequence of COVID-19, caused new lending in the quarter to fall 5% year-on-year (new car sales -26% year-on-year). The largest falls were recorded in Italy (-17%) and Spain (-16%), more affected by the isolation measures and decreased activity in recent weeks (10%-20% of usual volumes). In Germany it fell to 50%-70% and only the Nordic countries maintained its regular levels. The stock of credit rose 7% year-on-year.
It should be noted than in China, the first country affected, our financial entity reduced new lending by 83% when the confinement started, although in recent weeks it has almost recovered its usual levels.
Customer deposits excluding repos increased 7% year-on-year and continued to be a product that sets Santander apart from its competitors.
Results
Underlying attributable profit of EUR 304 million in the first quarter, 5% lower than in the same period of 2019:
| • | Growth in net interest income (+5% driven by increased volumes) was partially mitigated by fees (European Court of Justice judgement regarding refunding fees to customers who repay loans early). |
| • | Costs increased 2% mainly due to perimeter. Excluding this impact, they fell EUR 17 million (-3%) benefiting from the efficiency projects carried out in several units. |
| • | Cost of credit remained low for this type of business (0.52%). The 14 bps increase year-on-year was due to portfolio sales and some positive one-offs in the previous year (excluding these impacts the cost of credit would be similar). The NPL ratio stood at 2.43%, 10 bps higher compared to March 2019. |
| • | The largest contribution to the underlying attributable profit came from Germany (EUR 84 million), the Nordic countries (EUR 55 million) and Spain (EUR 43 million). |
Compared to the previous quarter, underlying attributable profit fell 4% affected by lower portfolio sales and higher perimeter costs, which were not fully reflected in net interest income, which rose 2%.
| Customer loan distribution | |
| March 2020 | |
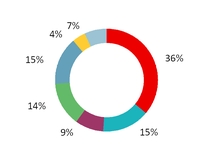
| n | Germany |
| n | Spain |
| n | Italy |
| n | France |
| n | Nordic countries |
| n | Poland |
| n | Other |
| Activity | ||||||||||
| March 2020. EUR billion and % change in constant euros | ||||||||||
| 0% | ||||||||||
| QoQ | -10% | |||||||||
| 103 | QoQ | |||||||||
| +7% | -5% | |||||||||
| YoY | 10 | YoY | ||||||||
| Gross loans and advances to customers excl. reverse repos | New lending | |||||||||
| Underlying income statement | |||||||
| EUR million and % change in constant euros | |||||||
| Q1'20 | / Q4'19 | / Q1'19 | |||||
| Revenue | 1,171 | -1 | % | +1 | % | ||
| Expenses | -514 | +3 | % | +2 | % | ||
| LLPs | -172 | +18 | % | +44 | % | ||
| PBT | 528 | +5 | % | -5 | % | ||
| Underlying attrib. profit | 304 | -4 | % | -5 | % | ||
| 32 | | January - March 2020 |
| UNITED KINGDOM | ||
 | Highlights (changes in constant euros) | |
| In response to the COVID-19 crisis, we are focused on supporting individuals and businesses. We introduced payment holidays for mortgages and on credit cards and loans, while delivering tailored solutions to business and corporate customers. With our strong foundations, including capital and liquidity, we believe we will continue to be able to support our people, customers and communities. | ||
• Business activity remained solid in the quarter, with growth in mortgages, increased digital customers and a loyalty ratio of nearly 32% as we continue to focus on improving customer experience and strengthen our franchise.• Underlying attributable profit was 27% lower than the first three months of 2019, reflecting the ongoing mortgage margin pressure and SVR attrition. | ||
| EUR 188 Mn | ||
| Underlying attributable profit | ||
Commercial activity
We continue to focus on building stronger customer relationships and a seamless customer experience. Our purpose to help people and businesses prosper remains unchanged. As a result, the number of loyal customers continued to grow year-on-year as well as digital customer which reached almost 6 million.
We are focused on helping first time buyers while continuing to increase simplicity and ease of online mortgage services.
This quarter we achieved strong net mortgage growth driven by end 2019 new business flows, helping reinforce our Top 3 position. However, at the end of the quarter there was a marked slowdown in mortgage activity related to the COVID-19 lockdown of the UK economy, which is expected to continue.
In Corporate & Commercial Banking new business was up GBP 1.1 bn in Q1’20, with lower business as usual flows offset by COVID-19 demand for extended credit facilities.
Our strategic transformation programme which commenced in 2019, to simplify and digitise the business continues.
Business performance
Gross loans and advances to customers (excluding reverse repos) increased 5% compared to March 2019 driven by the aforementioned strong residential retail mortgage activity from late 2019.
Customer funds were up 4% year-on-year, strongly backed by the 4% increase in deposits.
Results
Underlying attributable profit in the first three months of 2020 of EUR 188 million, down 27% year-on-year (in constant euros):
| • | Total revenue 10% lower due to competitive pressures and SVR attrition and net fee income reduction in part driven by overdrafts. |
| • | Costs reduced 5%, reflecting lower staff costs and efficiency savings from our 2019 transformation actions. |
| • | Loan-loss provisions fell 20%, the cost of credit remained at very low levels (9 basis points) and the NPL ratio decreased to 0.96%, supported by prudent approach to risk management. |
Compared to the fourth quarter of 2019, underlying attributable profit fell by 24%, as the improvement in LLPs and flat costs were not enough to offset the reductions in total income.
| Customers | ||||||
| March 2020. Thousands | ||||||
| Loyal customers | Digital customers | |||||
| 4,543 | | 5,962 | |||
| 32 | % | /active customers | +6 | % | YoY | |
| Activity | ||||||||||
| March 2020. EUR billion and % change in constant euros | ||||||||||
| +2% | 0% | |||||||||
| QoQ | QoQ | |||||||||
| 244 | 210 | |||||||||
| +5% | +4% | |||||||||
| YoY | YoY | |||||||||
| Gross loans and advances to customers excl. reverse repos | Customer deposits excl. repos + mutual funds | |||||||||
| Underlying income statement | |||||||
| EUR million and % change in constant euros | |||||||
| Q1'20 | / Q4'19 | / Q1'19 | |||||
| Revenue | 1,098 | -10 | % | -10 | % | ||
| Expenses | -714 | 0 | % | -5 | % | ||
| LLPs | -49 | -49 | % | -20 | % | ||
| PBT | 260 | -24 | % | -28 | % | ||
| Underlying attrib. profit | 188 | -24 | % | -27 | % | ||
January - March 2020 | | 33 |
| PORTUGAL | ||
 | Highlights | |
| In the environment deriving from the COVID-19 pandemic, the Bank is focusing on supporting society and the economy, with measures to mitigate the effects on households and businesses, especially in terms of liquidity. | ||
• Loans rose 2% year-on-year, benefiting from the increase recorded in the quarter.• Underlying attributable profit decreased 11% year-on-year due to net interest income and the recovery of provisions in the first quarter of 2019. Net operating income remained flat. | ||
| EUR 120 Mn | ||
| Underlying attributable profit | ||
Commercial activity
The Bank continued with its strategy of offering products and services tailored to customer needs, but adapting it to the health emergency environment:
| • | Some of the specific measures adopted to support our customers are: temporary suspension of fees for payment methods, a six-month repayment holiday on loans to individuals, households and businesses, and a rapid participation in credit lines set up by the government to support businesses. |
| • | The digital transformation carried out in recent years has enabled the teams to work remotely and to maintain business continuity and the smooth running of the Bank. |
The weight of loyal and digital customers as a percentage of active customers continued to increase, accounting for 46% and 47%, respectively, and digital sales were also strengthened.
Santander was named as Best Bank in Portugal 2020 by Global Finance.
Santander Totta maintained the best risk ratings by the rating agencies, aligned with or above the sovereign’s.
Business performance
Loans and advances to customers rose 2% year-on-year, underpinned by increased new lending to corporates and mortgages in March.
Customer funds were 3% higher year-on-year driven by growth in deposits and mutual funds.
Results
The first quarter underlying attributable profit decreased 11% year-on-year to EUR 120 million:
| • | Net interest income fell 6% dampened by lower average interest rates. This fall was offset by the increase in net fee income (+3%), higher ALCO portfolio sales and cost reduction (-4%), which enabled the efficiency ratio to improve to 43.1% and total income to remain stable. |
| • | Profit fell adversely impacted by loan-loss provisions, as recoveries from a specific customer were recorded in the first quarter of 2019. The NPL ratio improved to 4.56% and the cost of credit stood at around 0%. |
Compared to the previous quarter, underlying attributable profit decreased 14%. The strong revenue growth driven by ALCO portfolio sales did not offset the contribution to the Single Resolution Fund and the National Contribution Fund in this quarter, and the capital gains from real estate sales in the fourth quarter.
| Customers | ||||||
| March 2020. Thousands | ||||||
| Loyal customers | Digital customers | |||||
| 782 | | 797 | |||
| 46 | % | /active customers | +5 | % | YoY | |
| Activity | ||||||||||
| March 2020. EUR billion and % change | ||||||||||
| -2% | ||||||||||
| +3% | QoQ | |||||||||
| QoQ | ||||||||||
| 37 | 42 | |||||||||
| +2% | +3% | |||||||||
| YoY | YoY | |||||||||
| Gross loans and advances to customers excl. reverse repos | Customer deposits excl. repos + mutual funds | |||||||||
| Underlying income statement | |||||||
| EUR million and % change | |||||||
| Q1'20 | / Q4'19 | / Q1'19 | |||||
| Revenue | 350 | +6 | % | -2 | % | ||
| Expenses | -151 | -3 | % | -4 | % | ||
| LLPs | -5 | +31 | — | ||||
| PBT | 173 | -10 | % | -11 | % | ||
| Underlying attrib. profit | 120 | -14 | % | -11 | % | ||
| 34 | | January - March 2020 |
| POLAND | ||
 | Highlights (changes in constant euros) | |
| In the last three weeks of March, and regarding the emergency situation derived from the COVID-19 outbreak, the Bank took several actions to protect customers and employees, both regarding health and business. The suspension of capital repayments for cash loans, mortgages and SME loans was announced and implemented on 19 March. Other examples include temporary free of charge withdrawals from other ATM networks. | ||
• The Bank’s strategy to be the bank of first choice continues, predicting and responding to customer expectations. In addition, Santander Bank Polska was awarded 5 stars for Santander Private Banking in the prestigious Forbes ranking.• In the first three months, underlying attributable profit was EUR 38 million, 38% less than in the same period of 2019, impacted by the greater BFG and Banking Tax contributions and provisions related to regulatory changes. | ||
| EUR 38 Mn | ||
| Underlying attributable profit | ||
Commercial activity
In January and February 2020, the Bank recorded strong sales growth, including digital sales. Business in March showed signs of a slowdown due to the COVID-19 crisis. In mid-March, Santander Bank Polska started implementing processes and product solutions in response to the pandemic in Poland. The Bank is able to provide solutions to support our customers in the new reality. The Group provides services to all channels while promoting the use of the digital ones.
In March, due to the COVID-19 outbreak, the Bank intensified the promotion of the use of digital channels among customers. Close to 50% of total sales were digital (+ 3.3 pp versus 2019), with over 65% of credit card sales made through remote channels. The opening of personal accounts through digital channels recorded a fourfold rise, and those from SMEs were 12 times higher than in 2019.
Business performance
Loans rose 9% year-on-year, driven by all the Bank’s target segments. Strong volume growth in CIB (+23%) and consumer loans (+20%). SMEs grew at a slower pace (+10%).
Deposits grew 8% year-on-year. Deposits were 7% higher and SME deposits increased by 27%. CIB’s deposit base showed an annual decrease of 41%. The Group continued to actively manage its deposit base to optimise the cost of funding.
Results
Underlying attributable profit in the first quarter was EUR 38 million, 38% lower than in the same period of 2019:
| • | Total income fell 3%. Net interest income up 6% year-on-year, mainly due to the adjustment of the cost of deposits and by the changes in the loan mix towards more profitable products, partially offset by a change in regulations regarding earlier repayments of consumer loans. Net fee income was 3% higher driven by SCIB. These increases were offset by lower gains on financial transactions due to the fall in markets and the higher BFG contribution. |
| • | Costs remained virtually unchanged, and the efficiency ratio stood at 47.1%. |
| • | Loan-loss provisions increased 57% year-on-year, mainly due higher charges in the retail and a single name in CIB. |
| • | Other income was affected by the higher Banking Tax contribution and regulatory changes regarding consumer loans. |
Compared to the previous quarter, underlying attributable profit was down 63%, impacted by lower gains on financial transactions, higher provisions and the aforementioned regulatory factors.
| Customers | ||||||
| March 2020. Thousands | ||||||
| Loyal customers | Digital customers | |||||
| 1,992 | | 2,607 | |||
| 52 | % | /active customers | +9 | % | YoY | |
| Activity | ||||||||||
| March 2020. EUR billion and % change in constant euros | ||||||||||
| +4% | -2% | |||||||||
| QoQ | QoQ | |||||||||
| 30 | 35 | |||||||||
| +9% | +4% | |||||||||
| YoY | YoY | |||||||||
| Gross loans and advances to customers excl. reverse repos | Customer deposits excl. repos + mutual funds | |||||||||
| Underlying income statement | |||||||
| EUR million and % change in constant euros | |||||||
| Q1'20 | / Q4'19 | / Q1'19 | |||||
| Revenue | 365 | -20 | % | -3 | % | ||
| Expenses | -172 | +2 | % | 0 | % | ||
| LLPs | -68 | +35 | % | +57 | % | ||
| PBT | 90 | -56 | % | -29 | % | ||
| Underlying attrib. profit | 38 | -63 | % | -38 | % | ||
January - March 2020 | | 35 |
| NORTH AMERICA | |
 | Highlights (changes in constant euros) • In North America, the US and Mexico are managed according to their local strategic priorities, while increasing coordination and cooperation between the two units.• In volumes, there was strong year-on-year volume growth, both in gross loans and advances to customers and in customer funds (double-digit growth).• In results, underlying attributable profit increased 34% year-on-year, driven mainly by customer revenue, improved efficiency and reduced non-controlling interests. |
| EUR 522 Mn | |
| Underlying attributable profit | |
Strategy
In the United States, SBNA's strategy focuses on improving customer satisfaction through digital channels and branches, while continuing to develop the Lead Bank initiative in corporate banking. In SC USA, focus is on managing the relation between profitability, through pricing, and risk, while improving the dealer experience. In Mexico, we remained focused on strengthening the distribution network and developing digital channels with the aim to attract new customers and increase loyalty.
Coordination between the countries has increased as we continue to pursue join initiatives, such as:
| • | Continued development of the USMX trade corridor. SCIB and Commercial Banking are working to deepen relationships with existing clients and increase client acquisition in both countries, which is reflected in corridor revenue growth (SCIB: +38%; Commercial: +23%). |
| • | Commission-free same-day remittance service from Santander US branches to any bank in Mexico. At the same time, ongoing development of other payment alternatives for the USMX trade corridor, such as PagoFX. |
| • | Joint technology programmes between the two countries. |
Business performance
Gross loans and advances to customers (excluding reverse repos) increased 13% with similar growth in both countries, after the strong increases recorded in March.
Customer funds also presented a solid year-on-year performance (+15%) driven by growth in demand deposits in SBNA, corporate loans in the New York branch and deposits in Mexico. Mutual funds remained stable.
Results
In the first quarter, underlying attributable profit amounted to EUR 522 million, 34% higher year-on-year:
| • | Positive total income performance in both markets, with rises in net interest income (+2%) and net fee income (+4%). |
| • | Costs grew at a slower pace than income, enabling the efficiency ratio to improve to 41.7% (89 bp better than in the same period of 2019). Cost control in the US (-1% in real terms) and year-on-year increase in Mexico, although stable compared to previous quarters. |
| • | Loan-loss provisions rose 6% driven mainly by higher volumes. The NPL ratio improved to 2.02%, coverage rose to 158% and the cost of credit improved to 2.75%. |
Compared to the previous quarter, underlying attributable profit surged 37% through customer revenue growth, lower costs and decreased provisions, seasonally higher in the US in the fourth quarter.
| Customers | ||||||
| March 2020. Thousands | ||||||
| Loyal customers | Digital customers | |||||
| 3,628 | | 5,467 | |||
| 32 | % | /active customers | +30 | % | YoY | |
| Activity | ||||||||||
| March 2020. EUR billion and % change in constant euros | ||||||||||
| +4% | ||||||||||
| QoQ | +12% | |||||||||
| QoQ | ||||||||||
| 132 | 120 | |||||||||
| +13% | +15% | |||||||||
| YoY | YoY | |||||||||
| Gross loans and advances to customers excl. reverse repos | Customer deposits excl. repos + mutual funds | |||||||||
| Underlying income statement | |||||||
| EUR million and % change in constant euros | |||||||
| Q1'20 | / Q4'19 | / Q1'19 | |||||
| Revenue | 2,936 | 0 | % | +5 | % | ||
| Expenses | -1,224 | -6 | % | +2 | % | ||
| LLPs | -874 | -17 | % | +6 | % | ||
| PBT | 824 | +52 | % | +14 | % | ||
| Underlying attrib. profit | 522 | +37 | % | +34 | % | ||
| 36 | | January - March 2020 |
| UNITED STATES | ||
 | Highlights (changes in constant euros) | |
| We have implemented specific measures to continue to support our stakeholders throughout the COVID-19 pandemic, such as: temporary payment and mortgage and home equity line of credit foreclosures suspension at the retail network, USD 25 million in loans to Community Development Financial Institutions for small business loans, additional paid leave and pay premiums for certain employees. SC USA expanded payment deferrals, waived late charges and easing extensions for lessees unable to return their vehicles. | ||
• In volumes, the improved year-on-year trend in gross loans and advances to customers excluding reverse repos continues to drive higher revenue to help offset the impact of rate decreases.• Underlying attributable profit increased 46% compared to the same period of 2019, driven by higher revenues and lower provisions. | ||
| EUR 273 Mn | ||
| Underlying attributable profit | ||
Commercial activity
Santander US remains focused on the following strategic priorities:
Santander Bank: Support customers, employees and communities during COVID-19 crisis; while continuing the digital and branch transformation initiatives that remain key to enhancing customer experience and growing consumer customers and deposits. SBNA continues to enhance its auto finance partnership with SC USA focused on Prime loans.
Santander Consumer USA: The key focus is to continue to support employees, customers, communities impacted by COVID-19, as well as dealers, while remaining disciplined on price in an environment with reduced demand.
Business performance
Gross loans and advances to customers (excluding reverse repos) improved 12% year-on-year due to lending growth in retail banking (auto) and commercial banking. Despite the current unfavorable environment, originations remained stable year-on-year, however due to COVID-19 and shelter-in-place orders, auto manufacturers and many dealerships have closed nationwide, reducing auto financing demand, driving lower applications and volume.
Customer funds presented a strong growth year-on-year (+18%) boosted by demand deposits at SBNA and corporate deposits at the New York branch.
Results
Underlying attributable profit in the first quarter was 273 million, up 46% against the same period of 2019.
| • | Total revenue up 3% due to higher loan and leasing volumes, increased net fee income and positive gains on financial transactions performance, which offset lower interest rates. |
| • | Controlled costs, with efficiency ratio improvement to 41.9%. |
| • | Loan-loss provisions increased 3%, well below balance growth, improving the cost of credit to 2.81% and the NPL ratio to 2.00%. |
Compared to the previous quarter, underlying attributable profit 181% higher, boosted mainly by seasonally lower loan-loss provisions and lower costs in the first quarter.
| Customers | ||||||
| March 2020. Thousands | ||||||
| Loyal customers | Digital customers | |||||
| 328 | | 1,019 | |||
| 19 | % | /active customers | +6 | % | YoY | |
| Activity | ||||||||||
| March 2020. EUR billion and % change in constant euros | ||||||||||
| +3% | ||||||||||
| QoQ | +10% | |||||||||
| QoQ | ||||||||||
| 101 | 82 | |||||||||
| +12% | +18% | |||||||||
| YoY | YoY | |||||||||
| Gross loans and advances to customers excl. reverse repos | Customer deposits excl. repos + mutual funds | |||||||||
| Underlying income statement | |||||||
| EUR million and % change in constant euros | |||||||
| Q1'20 | / Q4'19 | / Q1'19 | |||||
| Revenue | 1,929 | +1 | % | +3 | % | ||
| Expenses | -809 | -7 | % | 1 | % | ||
| LLPs | -646 | -22 | % | +3 | % | ||
| PBT | 468 | +199 | % | +23 | % | ||
| Underlying attrib. profit | 273 | +181 | % | +46 | % | ||
January - March 2020 | | 37 |
| MEXICO | ||
 | Highlights (changes in constant euros) | |
| In response to the spread of COVID-19, we have laid out support measures for our customers, such as repayment holiday on loans, credit cards and mortgages, interest-free financing for online supermarket purchases and in pharmacies, laboratories and hospitals. In addition, branch services maintained, although with minimum staffing. Our digital channels and contact centres continue to operate normally. | ||
• Gross loans and advances to customers (excluding reverse repos) increased 13% year-on-year, particularly corporates, CIB and mortgages and customer funds rose 10%, both driven by the strong growth in March due to greater liquidity demand from our customers given the current situation.• Underlying attributable profit rose 22% year-on-year, backed by the sound performance of total income and reduced non-controlling interests, following the increased stake in the second half of 2019. | ||
| EUR 249 Mn | ||
| Underlying attributable profit | ||
Commercial activity
The commercial strategy continued to focus on improving the distribution model and boosting digital channels to increase customer attraction and loyalty with new products and services:
| • | We continued to develop our distribution model with the transformation of 560 branches and 1,138 full function ATMs. |
| • | Santander Plus reached 6.8 million customers (52% new). |
| • | Launch of the first numberless credit card, becoming the first bank in Mexico to offer this card model, without revealing sensitive data and providing greater security to our customers. |
| • | We also began to register customers’ biometric data to make their transactions more secure, by facial and fingerprint scanning. |
| • | Alliance with Mazda to become its main partner in auto financing, progressing towards the consolidation in this segment. |
| • | We continued to boost customer deposits with the launch of the new version of the Arma tu Kit campaign, which continues to reward customers who increase their balances and use digital banking. |
| • | These measures resulted in a strong year-on-year increase in the number of loyal and digital customers (24% and 38% respectively). |
Business performance
Gross loans and advances to customers (excluding reverse repos) increased 13% year-on-year. Of note were corporate loans (+16%) and CIB (+27%). Individuals rose 5%, driven by mortgages (+13%), credit cards (+6%) and payrolls (+8%).
Customer funds increased 10%. Demand deposits were 12% higher, with growth in individuals and corporates and time deposits rose 15% (notably corporates at 22%). Growth in deposits continued to reflect the positive performance of our customer attraction and loyalty strategy. Mutual funds remained broadly unchanged.
Results
Underlying attributable profit in the first quarter was of EUR 249 million, 22% higher than in the same period of 2019:
| • | Net interest income rose 5%, underpinned by higher volumes . Net fee income grew 4% mainly from financial advisory services and restructuring, transactional banking and cards. Gains on financial transactions increased benefiting from the weak markets activity in the first quarter of 2019. |
| • | Operating expenses were up due to increased amortisations and higher technology investments. |
| • | Loan-loss provisions surged 18% compared to the first quarter of 2019, which was affected by a mortgage portfolio sale. Good credit quality in all metrics. |
Compared to the fourth quarter of 2019, underlying attributable profit fell 12% due to the high gains on financial transactions recorded in the previous quarter and higher loan-loss provisions.
| Customers | ||||||
| March 2020. Thousands | ||||||
| Loyal customers | Digital customers | |||||
| 3,300 | | 4,448 | |||
| 34 | % | /active customers | +38 | % | YoY | |
| Activity | ||||||||||
| March 2020. EUR billion and % change in constant euros | ||||||||||
| +14% | ||||||||||
| +9% | QoQ | |||||||||
| QoQ | ||||||||||
| 31 | 38 | |||||||||
| +13% | +10% | |||||||||
| YoY | YoY | |||||||||
| Gross loans and advances to customers excl. reverse repos | Customer deposits excl. repos + mutual funds | |||||||||
| Underlying income statement | |||||||
| EUR million and % change in constant euros | |||||||
| Q1'20 | / Q4'19 | / Q1'19 | |||||
| Revenue | 1,007 | -2 | % | +8 | % | ||
| Expenses | -415 | -4 | % | +5 | % | ||
| LLPs | -228 | +6 | % | +18 | % | ||
| PBT | 357 | -7 | % | +4 | % | ||
| Underlying attrib. profit | 249 | -12 | % | +22 | % | ||
| 38 | | January - March 2020 |
| SOUTH AMERICA | |
 | Highlights (changes in constant euros) • The banks in the different countries have implemented contingency plans for the COVID-19 crisis. They continue to operate and meet the demands and needs of our customers, with different products and services to help them financially.• The focus remained on the integration of the region, through a wide range of products and services, with a strategy oriented to deliver profitable growth, improve customer satisfaction and loyalty as well as risk control.• We continued to capture business opportunities, exchanging positive experiences across countries, for example in payment methods, consumer finance and microfinance.• Underlying attributable profit increased by 15% year-on-year backed by net interest income, net fee income and improved efficiency. RoTE of 21.1%. |
| EUR 928 Mn | |
| Underlying attributable profit | |
Strategy
We continued to capture synergies across businesses in the region:
| • | In auto financing, we are exporting our experience in Brazil, which maintained its leadership in the country, expanding its business model to other countries. In Peru, for example, we increased our presence in this type of business, while increasing business profitability in Colombia through our digital proposition and strategic alliances. |
| • | In terms of financing goods and services, Uruguay continued to lead the local market, increasing its market share and business activity. Colombia, in turn, continued to diversify its business alliances. We also exported the model, successfully in Uruguay and Brazil, to other countries. |
| • | Prospera, our micro-credit programme to satisfy the demand for small businesses in Brazil, continued expand in Uruguay as well. |
| • | In payment methods, we focused on e-commerce strategies and instant transfers. We are rolling out Getnet, our acquiring business in Brazil, and plan to further expand it to the rest of Latin America. As regards Superdigital, it is already showing positive results in Chile, attracting customers for its transactionality and digital platform. |
| • | We remained focused on enhancing our products and services digitally. Sales through digital channels already account for a high percentage of the total in Brazil and Argentina, and continued to grow in Chile. |
Business performance
Gross loans and advances to customers (excluding reverse repos) increased 16% year-on-year, with double-digit growth in all countries.
Customer deposits rose 24%, with all countries growing at double-digit rates in both demand and time deposits. Mutual funds rose 5%.
Results
Underlying attributable profit in the first quarter amounted to EUR 928 million, up 15% year-on-year:
| • | Total income increased 8%, underpinned by the sound performance of net interest income (+11%) and net fee income (+7%). |
| • | Costs rose 7%, at a slower pace than income, enabling efficiency to improve 97 bps to 35.7%. |
| • | Provisions increased 13% driven by the rises in Brazil and Chile, partially offset by the decrease in Argentina. In credit quality, the NPL ratio improved 20 bps to 4.63%, coverage was 86% and cost of credit of 2.94%. |
In the quarter, underlying attributable profit was 4% higher driven by lower costs, seasonally higher in the fourth quarter, and lower provisions.
| Customers | ||||||
| March 2020. Thousands | ||||||
| Loyal customers | Digital customers | |||||
| 7,756 | | 17,762 | |||
| 25 | % | /active customers | +12 | % | YoY | |
| Activity | ||||||||||
| March 2020. EUR billion and % change in constant euros | ||||||||||
| +5% | ||||||||||
| +7% | QoQ | |||||||||
| QoQ | ||||||||||
| 118 | 148 | |||||||||
| +16% | +16% | |||||||||
| YoY | YoY | |||||||||
| Gross loans and advances to customers excl. reverse repos | Customer deposits excl. repos + mutual funds | |||||||||
| Underlying income statement | |||||||
| EUR million and % change in constant euros | |||||||
| Q1'20 | / Q4'19 | / Q1'19 | |||||
| Revenue | 4,163 | -7 | % | +8 | % | ||
| Expenses | -1,486 | -12 | % | +7 | % | ||
| LLPs | -875 | -8 | % | +13 | % | ||
| PBT | 1,661 | +4 | % | +7 | % | ||
| Underlying attrib. profit | 928 | +4 | % | +15 | % | ||
January - March 2020 | | 39 |
| BRAZIL | ||
 | Highlights (changes in constant euros) | |
| In response to the expansion of COVID-19, we have launched a series of initiatives to guarantee the health of our employees (between 50-80% of the workforce are telecommuting, bringing forward the additional salary payment from November to April, closure of some branches...) and the service to our customers (adapted opening hours, anticipation of liquidity, greater digital support...) and to society (volunteer programme, donations from the bank and employees...). | ||
• We continued with our sustainable growth strategy focused on customer service, capturing business opportunities in the market in an innovative way and the relentless search for operational excellence, committed to our people, customers, communities and shareholders.• Underlying attributable profit was 10% higher year-on-year, with improved efficiency and reflecting recurrence in profit generation, even in the current worsened environment. RoTE of 22.0%. | ||
| EUR 694 Mn | ||
| Underlying attributable profit | ||
Commercial activity
We continued to progress in our strategic actions in the quarter. Of note were:
| • | We continued to expand to strategic regions in the country through products such as Agribusiness and Prospera Microfinance. We ended the quarter with 36 specialised Agro shops. |
| • | In mortgages, we offered financing at a term of more than 30 years. In addition, we continued to drive Usecasa, a product that offers a personal loan using property as collateral. |
| • | In acquiring, our strategy is to grow while maintaining profitability. This quarter we delivered a solid increase in the active customer base. We also installed new POS terminals and reached 1.4 million. In cards, we increased credit limit by 10% and we launched a new card together with a leading Latin American travel company. |
| • | We also launched Consignado Folha, a credit line to finance SMEs payrolls with a grace period of 60 days. |
| • | Santander Brasil was awarded the ECO Prize by Amcham Brasil and the Estadão newspaper, which recognised the Bank's responsible work with Prospera Santander Microfinanzas. |
Business performance
Gross loans and advances to customers excluding reverse repos grew 18% year-on-year. Of note was growth in the corporate and CIB segments following the strong increases recorded in the quarter. As in other countries, new lending started to fall.
Customer deposits excluding repos increased 21%, with rises in both demand deposits (+31%) and time deposits (+17%). Strong growth in the quarter as well. Mutual funds rose 3% year-on-year.
Results
First quarter underlying attributable profit of EUR 694 million (+10% year-on-year). Of note:
| • | Total income rose 5% boosted by net interest income (+6% driven by larger volumes which offset margin pressures due to mix effect) and net fee income (+7%), led largely by cards. |
| • | Operating expenses increased 2%, well below revenue growth, which enabled the efficiency ratio to improve by 98 bps to 32.0%. |
| • | Net loan-loss provisions increased 14%, below loan growth, maintaining high levels of credit quality: the cost of credit was 3.93%, the NPL ratio improved to 4.93% and the coverage ratio stood at 100%. |
In the quarter, underlying attributable profit rose 8% driven by lower costs and provisions, after a seasonally higher fourth quarter.
| Customers | ||||||
| March 2020. Thousands | ||||||
| Loyal customers | Digital customers | |||||
| 5,673 | | 13,828 | |||
| 22 | % | /active customers | +13 | % | YoY | |
| Activity | ||||||||||
| March 2020. EUR billion and % change in constant euros | ||||||||||
| +2% | ||||||||||
| +9% | QoQ | |||||||||
| QoQ | ||||||||||
| 69 | 98 | |||||||||
| +18% | +12% | |||||||||
| YoY | YoY | |||||||||
| Gross loans and advances to customers excl. reverse repos | Customer deposits excl. repos + mutual funds | |||||||||
| Underlying income statement | |||||||
| EUR million and % change in constant euros | |||||||
| Q1'20 | / Q4'19 | / Q1'19 | |||||
| Revenue | 3,137 | -5 | % | +5 | % | ||
| Expenses | -1,004 | -13 | % | +2 | % | ||
| LLPs | -709 | -6 | % | +14 | % | ||
| PBT | 1,298 | +6 | % | +5 | % | ||
| Underlying attrib. profit | 694 | +8 | % | +10 | % | ||
| 40 | | January - March 2020 |
| CHILE | ||
 | Highlights (changes in constant euros) | |
| In response to the spread of COVID-19, Santander Chile carried out various measures to ensure the welfare of customers and employees. In the first case, the Bank designed a plan to benefit more than 500,000 customers, providing support to the consumer, mortgage, SME and business portfolios of around USD 6 billion. In the second case, around 7,100 employees are telecommuting (65% of total workforce). | ||
• Gross loans and advances to customers (excluding reverse repos) increased, with a positive performance in the past month mainly due to corporates. Demand deposits rose 30% year-on-year and growth in account openings hit a record high in March.• Underlying attributable profit decreased 2% year-on-year, due to lower gains on financial transactions and increased provisions (greater ALCO portfolio sales and releases in Q1'19). | ||
| EUR 125 Mn | ||
| Underlying attributable profit | ||
Commercial activity
Continued focus on transformation in order to increase new customer attraction and loyalty, maintaining a strategy aimed at offering attractive returns based on our digital transformation:
| • | We continued to boost the Santander Life programme, which is centred on promoting good credit behaviour and financial education, reaching more than 165,000 customers. |
| • | Since its recent launch, Superdigital has exceeded 26,000 customers because of its high transactionality and digital platform. |
All these measures led to a strong year-on-year increase in digital customers (+21%).
Business performance
Gross loans and advances to customers (excluding reverse repos) increased 13% year-on-year, spurred by the increase in new lending to corporates and large corporates in March.
Customer funds reflected a better funding mix. Current accounts continued to rise strongly across all segments due to increased current account openings and the positive performance in transactional banking. These factors led to a 21% increase in customer funds .
Results
First quarter attributable profit amounted to EUR 125 million, 2% lower year-on-year, as follows:
| • | Gross income increased 8% year-on-year backed by net interest income, benefiting from higher inflation, and the positive performance of net fee income, driven by digital account openings and increased transactionality. |
| • | Costs rose 6% impacted by supplier contract adjustments stemming from higher inflation. Efficiency improved 88 bp to 41.7%. |
| • | Loan-loss provisions increased 22% due to releases in Q1'19 and, to a lesser extent, driven by the first impacts of the health crisis. The NPL ratio stood below 5% and the cost of credit stood at 1.10% |
Compared to the fourth quarter of 2019, underlying attributable profit decreased 15%. Customer revenue rose slightly, with positive performance in costs and provisions which was offset by the sharp fall in gains on financial transactions.
| Customers | ||||||
| March 2020. Thousands | ||||||
| Loyal customers | Digital customers | |||||
| 680 | | 1,316 | |||
| 44 | % | /active customers | +21 | % | YoY | |
| Activity | ||||||||||
| March 2020. EUR billion and % change in constant euros | ||||||||||
| +5% | +7% | |||||||||
| QoQ | QoQ | |||||||||
| 38 | 34 | |||||||||
| +8% | +21% | |||||||||
| YoY | YoY | |||||||||
| Gross loans and advances to customers excl. reverse repos | Customer deposits excl. repos + mutual funds | |||||||||
| Underlying income statement | |||||||
| EUR million and % change in constant euros | |||||||
| Q1'20 | / Q4'19 | / Q1'19 | |||||
| Revenue | 553 | -8 | % | +8 | % | ||
| Expenses | -230 | -1 | % | +6 | % | ||
| LLPs | -107 | -11 | % | +22 | % | ||
| PBT | 216 | -16 | % | -9 | % | ||
| Underlying attrib. profit | 125 | -15 | % | -2 | % | ||
January - March 2020 | | 41 |
| ARGENTINA | ||
 | Highlights (changes in constant euros) | |
| In response to the potential risks arising from the spread of COVID-19, we have put contingency plans in place to contribute to the well-being of all: most employees are working remotely, customer operations are being enhanced through digital means and implemented several measures, such as credit lines for SMEs, aimed at working capital in different segments, purchase medical equipment, technology investments to facilitate telecommuting and to pay salaries. | ||
• We continued to focus on four strategic pillars: profitable growth, customer experience, operational excellence and transformation.• Underlying attributable profit reached EUR 59 million boosted by higher net interest income, improved efficiency and lower provisions. | ||
| EUR 59 Mn | ||
| Underlying attributable profit | ||
Commercial activity
The commercial strategy is focused on transactional business and customer service improvements, while we continue working on the digital transformation of the main processes and products. The aim is to have increasingly digital platforms integrating the latest technology, which enables us to better know our customers and anticipate their needs.
In addition, we redefined our value proposition, with special focus on priority segments and business communities. During the quarter, we continued to boost the digital transformation of the main processes and products, aiming at simplification, digitalisation and remote onboarding, with the launch of the Onboarding Web service for SMEs.
Our customer centred strategy enabled loyal and digital customers to account for 46% and 80%, respectively, of active customers.
Business performance
Gross loans and advances to customers (excluding reverse repos) rose 16% year-on-year, driven by cards and mortgages. In the quarter, 1% fall due to lower activity.
Customer deposits (excluding repos) rose 37% year-on-year (+24% in the quarter). Local currency deposits grew 75% (demand and time deposits) and foreign currency ones declined.
The Bank maintains high levels of liquidity in both pesos and dollars.
Results
Underlying attributable profit in the first quarter of EUR 59 million (EUR 7 million in the first quarter of 2019).
As regards the year-on-year comparison, of note was:
| • | Revenue grew 43%. Net interest income rose 68%, underpinned by the lower cost of funding. Net fee income and gains on financial transactions fell slightly. |
| • | Costs increased 37%, hit by high inflation and the peso’s depreciation. The efficiency ratio improved to 58.5%, 263 bps lower than in the first quarter of 2019. |
| • | Loan-loss provisions decreased 20%, as there were no relevant impacts from one-offs. The NPL ratio stood at 3.97% and the coverage ratio at 113%. |
In the quarter, underlying attributable profit rose 15% benefiting from cost reduction and lower loan-loss provisions.
| Customers | ||||||
| March 2020. Thousands | ||||||
| Loyal customers | Digital customers | |||||
| 1,299 | | 2,249 | |||
| 46 | % | /active customers | +7 | % | YoY | |
| Activity | ||||||||||
| March 2020. EUR billion and % change in constant euros | ||||||||||
| +24% | ||||||||||
| -1% | QoQ | |||||||||
| QoQ | ||||||||||
| 5 | 10 | |||||||||
| +16% | +34% | |||||||||
| YoY | YoY | |||||||||
| Gross loans and advances to customers excl. reverse repos | Customer deposits excl. repos + mutual funds | |||||||||
| Underlying income statement | |||||||
| EUR million and % change in constant euros | |||||||
| Q1'20 | / Q4'19 | / Q1'19 | |||||
| Revenue | 318 | -21 | % | +43 | % | ||
| Expenses | -186 | -21 | % | +37 | % | ||
| LLPs | -39 | -37 | % | -20 | % | ||
| PBT | 79 | +52 | % | +250 | % | ||
| Underlying attrib. profit | 59 | +15 | % | +745 | % | ||
| 42 | | January - March 2020 |
Uruguay
Highlights (changes in constant euros)
| • | Santander Uruguay remained as the country’s leading privately-owned bank, with a strategy focused on retail banking and improving efficiency and the quality of service. |
| • | Underlying attributable profit rose 14% year-on-year, spurred by increased revenue. Activity grew at a steady pace in the quarter, which enabled us to continue gaining market share. |
Commercial activity and business performance
Santander continued to focus on enhancing customer satisfaction and loyalty and making progress in the digital transformation and channel optimisation. These efforts were reflected in the 15% year-on-year increase in loyal customers, while transactions through digital channels rose 33%. On the other hand, the Group’s financial entities in Uruguay continued leading the local market in consumer credit, with a market share of more than 22%.
In line with our strategy of contributing to people’s progress, we continued to expand Prosperá and Santander Locker, a proposal that simplifies the delivery of our products to our customers. We continued to pursue commercial alliances through an agreement with the country's leading retail group, which places us in a unique position to offer discounts to our customers.
Regarding volumes, gross loans and advances to customer (excluding reverse repos) grew 25%, driven by retail loans in local currency. Customer deposits (excluding repos) grew 41% underpinned by both peso and foreign currency balances.
Results
Underlying attributable profit in the first quarter of 2020 of EUR 35 million, 14% higher year-on-year:
| • | Gross income rose 14%, backed by customer revenue and the positive performance of gains on financial transactions, due to exchange rate volatility. |
| • | Operating expenses rose at a slower pace than total income, improving the efficiency ratio by 131 bps year-on-year to 41.8%. |
| • | Loan-loss provisions increased 42% due to extraordinary recoveries recorded in the first quarter of 2019. High coverage (101%) and cost of credit improved to 2.40% (-32 bps year-on-year). |
Compared to the fourth quarter of 2019, underlying attributable profit dropped 6% due to a higher tax burden, from low levels in the previous quarter.
Peru
Highlights (changes in constant euros)
The strategy remained focused on the corporate segment, the country’s large companies and the Group’s global customers, with an increase in product and team capabilities.
The auto loan financial entity continued to expand its business within the Group’s strategy of increasing its presence in this business.
First quarter attributable profit amounted to EUR 12 million (+33% year-on-year). Total income rose 19% mainly due to higher gains on financial transactions. Costs increased 23% and loan-loss provisions were 43% lower.
The NPL ratio was 0.76%, coverage remained high and cost of credit was 0.07%.
Colombia
Highlights (changes in constant euros)
Activity in Colombia remained focused on SCIB clients, large companies and corporates, contributing solutions in treasury, risk hedging, foreign trade, confirming, custody and development of investment banking products supporting the country’s infrastructure plan. In line with this strategy, Santander Investment Banking in Colombia was named leader in the Project Finance ranking by Inframation Deals, one of the main dedicated platforms in the infrastructure sector.
In auto finance, we continued to increase profitability through our digital proposition, consolidating strategic alliances, seeking to also increase our value offering and customer loyalty through the insurance business. On the other hand, we continued to diversify our commercial alliances for financing goods and services in the health, furniture and transport sectors in the first quarter of 2020.
Gross loans and advances to customers (excluding reverse repos) rose 20% with broad-based growth across all business segments, particularly vehicles (+75%). Customer deposits excluding repos increased 38%.
Underlying attributable profit in the first quarter was EUR 6 million (EUR 2 million in the same period of 2019). Total income grew 97%, primarily backed by both net interest income and net fee income.
January - March 2020 | | 43 |
| CORPORATE CENTRE | |||
 | Highlights | ||
| In the health crisis environment caused by the spread of COVID-19, the Corporate Centre is playing a critical role in supporting the Group through the corporate crisis committees (Gold, Silver and Bronze). Also, in this context and to protect the health of employees, nearly 100% of the staff is teleworking. | |||
• The Corporate Centre’s objective is to aid the operating units by contributing value and carrying out the corporate function of oversight and control. It also carries out functions related to financial and capital management.• The underlying attributable loss decreased compared to 2019, mainly due to foreign currency hedging. | |||
| EUR | -434 Mn | ||
| Underlying attributable profit | |||
Strategy and functions
The Corporate Centre contributes value to the Group in various ways:
| • | It makes the Group’s governance more solid, through global control frameworks and supervision. |
| • | Fostering the exchange of best practices in management of costs and generating economies of scale. This enables us to be one of the most efficient banks. |
| • | It contributes to the launch of projects that will be developed by global business areas. |
It also coordinates the relationship with European regulators and supervisors and develops functions related to financial and capital management, as follows:
| • | Financial Management functions: |
| – | Structural management of liquidity risk associated with funding the Group’s recurring activity, stakes of a financial nature and management of net liquidity related to the needs of some business units. |
| – | This activity is carried out by the different funding sources (issuances and other), always maintaining an adequate profile in volumes, maturities and costs. The price at which these operations are made with other Group units is the market rate plus the premium, which in liquidity terms, the Group supports by immobilising funds during the term of the operation. |
| – | Interest rate risk is also actively managed in order to soften the impact of interest rate changes on net interest income, conducted via high credit quality, very liquid and low capital consumption derivatives. |
| – | Strategic management of the exposure to exchange rates in equity and dynamic in the countervalue of the units’ annual results in euros. Net investments in equity are currently covered by EUR 23,692 million (mainly Brazil, the UK, Mexico, Chile, the US, Poland and Norway) with different instruments (spot, fx, forwards). |
| • | Management of total capital and reserves: efficient capital allocation to each of the units in order to maximise shareholder return. |
Results
First quarter underlying attributable loss of EUR 434 million, 16% lower than in the same period of 2019 (EUR -517 million).
| • | Positive impact of EUR 93 million in gains on financial transactions mainly due to foreign currency hedging. |
| • | On the other hand, the positive trend on operating expenses continued, improving 13% compared to the first quarter of 2019, driven by ongoing streamlining and simplification measures. |
| CORPORATE CENTRE | |||||||||||
| EUR million | |||||||||||
| Q1'20 | Q4'19 | Chg. | Q1'19 | Chg. | |||||||
| Gross income | -304 | -381 | -20 | % | -399 | -24 | % | ||||
| Net operating income | -389 | -471 | -17 | % | -497 | -22 | % | ||||
| PBT | -413 | -529 | -22 | % | -559 | -26 | % | ||||
| Underlying attrib. profit | -434 | -459 | -6 | % | -517 | -16 | % | ||||
| 44 | | January - March 2020 |
| Response to the COVID-19 crisis Business model | ||||||||
| Secondary segments | ||||||||
| RETAIL BANKING | |
 | Highlights (changes in constant euros) • In the quarter, Santander continued to support its customers, corporates and governments in all countries with the usual product and services and the launch of extraordinary measures arising from the global health crisis.• The Group continued to focus on improving customer satisfaction, increasing loyalty and boosting the use of remote channels. In March, we had almost 146 million customers, of which more than 21 million are loyal and increased by more than 4 million in twelve months the number of digital customers.• Underlying attributable profit of EUR 1,637 million in the first quarter, 4% lower year-on-year, driven by higher provisions. |
| EUR 1,637 Mn | |
| Underlying attributable profit | |
Commercial activity
Santander wants to be the reference bank for individual customers, SMEs and other companies. To this end, we continued to launch different commercial initiatives, including:
| • | In individuals, we are offering mortgages of up to 90% of the property’s value and at a term of more than 30 years in Brazil. We continued to expand Santander Life in Chile and launched a numberless credit card in Mexico, providing greater security to our customers. |
| • | In auto finance, we signed strategic agreements in Europe, the joint initiative between SBNA and SC USA regarding prime auto loans continued to thrive and Peru and Colombia continued to increase their activity in this business. |
| • | In the SME segment, we continued to move forward with products such as Prospera in Brazil and Uruguay and Financia&Go in Spain, the first fully digital invoice financing service for SMEs and self-employed workers on external platforms. In Argentina, we launched the digital onboarding service for SMEs. |
| • | Of note in corporates were strategies such as the Trade Club Alliance in the UK, a digital platform to foster international trade. |
We also continued with the conversion of the branch network, though greater digitalisation of our businesses, which was reflected on the increase in the number of digital customers and transactions, particularly in those countries where the government adopted confinement measures.
In addition to this initiatives, framed within the Bank’s regular activity, in the last weeks of the quarter and in the areas where our customers are being most affected by the crisis, the Bank has defined a number of support measures, such as pre-approved credit lines, repayment holidays and special policies, further detailed on the COVID-19 section in this report and on each entity's website.
Results
Underlying attributable profit in the first quarter was EUR 1,637 million, 4% lower year-on-year as follows:
| • | Total income remained flat, as the increase in net interest income was offset by lower gains on financial transactions and other income. |
| • | Costs had no material change. |
| • | Loan-loss provisions up 13% primarily due to higher volumes. Cost of credit stood al 1.17% and the NPL ratio improved both year-on-year (-32 bps) and to quarter-on-quarter (-8 bps). |
| Customers | ||||||
| March 2020. Thousands | ||||||
| Loyal customers | Digital customers | |||||
| 21,453 | | 38,279 | |||
| 31 | % | /active customers | +13 | % | YoY | |
| Activity | ||||||||||
| March 2020. EUR billion and % change in constant euros | ||||||||||
| +2% | -1% | |||||||||
| QoQ | QoQ | |||||||||
| 760 | 669 | |||||||||
| +4% | +3% | |||||||||
| YoY | YoY | |||||||||
| Gross loans and advances to customers excl. reverse repos | Customer deposits excl. repos + mutual funds | |||||||||
| Underlying income statement | |||||||
| EUR million and % change in constant euros | |||||||
| Q1'20 | / Q4'19 | / Q1'19 | |||||
| Revenue | 9,972 | -5 | % | 0 | % | ||
| Expenses | -4,526 | -5 | % | +1 | % | ||
| LLPs | -2,289 | -4 | % | +13 | % | ||
| PBT | 2,818 | -3 | % | -7 | % | ||
| Underlying attrib. profit | 1,637 | -9 | % | -4 | % | ||
January - March 2020 | | 45 |
| Response to the COVID-19 crisis Business model | ||||||||
| Secondary segments | ||||||||
| CORPORATE & INVESTMENT BANKING | ||
 | Highlights (changes in constant euros) | |
| In the context of the COVID-19 health crisis, the initial efforts focused on implementing contingency plans to protect employees and provide business continuity. The strong relationship with our global clients (corporates, governments, societies and institutions) has been essential to support them in their capital issuances and provide financing solutions and transactional services. | ||
• These measures were reflected in the 16% increase in lending volumes to EUR 125,306 million in the quarter. Deposits rose 24% compared to December 2019.• Underlying attributable profit in the quarter was 21% higher year-on-year at EUR 491 million, driven by double-digit growth across almost all core businesses, which more than offset the negative impact from the increase counterparty credit risk (CVA), due to volatility in the financial markets. | ||
| EUR 491 Mn | ||
| Underlying attributable profit | ||
Commercial activity
| • | Cash management: sustained growth in all geographic areas. Of note was the positive performance of Spain, the UK and Europe with double-digit growth year-on-year. |
| • | Export & Agency Finance: we maintained leadership positions in export financing backed by export credit agencies (ECA) in the quarter, supporting our clients in their export activities and with strong increases in Europe and Asia. |
| • | Trade & Working Capital Solutions: Of note was activity in Continental Europe, the Americas and Asia, with strong growth in all products and strengthening support for our clients, especially in Receivables and Supply Chain Finance programmes. |
| • | Debt Capital Markets: significant growth in the quarter, backed by the positive performance in Spain, the UK and the US. We continued to focus on activities related to sustainable financing, being a reference for the issuance of green bonds, while maintaining our leadership in Latin America by number of transactions and significant positions in Europe. |
| • | Corporate Finance: in merger and acquisitions (M&A) we strengthened our position as the leader in our main markets, with noteworthy operations such as advising Cellnex on the purchase of Omtel in Portugal as well as Mexico Infrastructure Partners on the largest transaction in the infrastructure sector in Mexico. |
| • | Syndicated Corporate Loans: we continued to play a significant role, although with a reduced volume of acquisitions during the year due to low M&A activity. In line with our responsible banking strategy, we increased our range of sustainable finance products via green loans or loans linked to sustainable indices. |
| • | Structured Financing: Santander maintained its global leadership position in Project Finance, remaining among the top 10 global competitors with a position of over USD 1 billion in three deals. |
| • | Global markets: The activity was heavily impacted by the crisis, particularly in the management of positions subject to CVA. Positive performance in other Markets businesses, with good evolution in institutional sales in the UK, Mexico, Chile and Asia, and in the corporate segment in Spain, Europe and the Americas. |
Business performance
The exceptional circumstances generated by the COVID-19 health crisis defined the end of the first quarter of the year. In this regard, we have supported our customers through contingency lines and other financing solutions. In March, we assisted our customers by extending more than EUR 15 billion in credit facilities.
In the quarter, the volume of loans and advances to customers excluding reverse repos rose to EUR 125,306 million, 16% higher than in December 2019. This led to an increase in risk weighted assets, both due to the increase in the volume of granted loans and higher market volatility. We are developing mitigation measures to minimise this increase.
Customer deposits excluding repurchase agreements rose 24% in the quarter to more than EUR 92 billion, driven by higher liquidity from our clients.
| Activity | ||||||||||
| March 2020. EUR billion and % change in constant euros | ||||||||||
| +16% | +20% | |||||||||
| QoQ | QoQ | |||||||||
| 125 | 101 | |||||||||
| +29% | +19% | |||||||||
| YoY | YoY | |||||||||
| Gross loans and advances to customers excl. reverse repos | Customer deposits excl. repos + mutual funds | |||||||||
| 46 | | January - March 2020 |
| Response to the COVID-19 crisis Business model | ||||||||
| Secondary segments | ||||||||
Results (in constant euros)
First quarter underlying attributable profit was 21% higher to EUR 491 million, boosted by total income, which grew driven by net interest income (+9%) and especially net fee income (+20%), which broadly offset the negative impact from gains on financial transactions from the increase in the market value of counterparty credit risk (CVA) due to volatility in the financial markets derived from the expansion of COVID-19.
Strong growth year-on-year in most core businesses: Global Transation Banking, Global Debt Financing, Corporate Finance, and Global Markets, the latter excluding the aforementioned negative results from CVA performance.
Costs fell 1% and loan-loss provisions were very low, as in the first quarter of 2019.
Compared to the fourth quarter of 2019, underlying attributable profit rose also 21%, as lower income was offset by cost reduction and lower provisions.
| Total income breakdown | |
| Constant EUR million | |
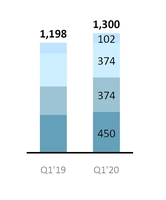
| TOTAL | +9 | % |
| Capital & Other | -6 | % |
| Global Markets | +3 | % |
| Global Debt Financing | +21 | % |
| Global Transaction Banking | +8 | % |
| (*) In euros: +2% | ||
| Underlying income statement | |||||||
| EUR million and % change in constant euros | |||||||
| Q1'20 | / Q4'19 | / Q1'19 | |||||
| Revenue | 1,300 | -8 | % | +9 | % | ||
| Expenses | -536 | -11 | % | -1 | % | ||
| LLPs | -4 | -97 | % | -49 | % | ||
| PBT | 745 | +15 | % | +19 | % | ||
| Underlying attrib. profit | 491 | +21 | % | +21 | % | ||
January - March 2020 | | 47 |
| Response to the COVID-19 crisis Business model | ||||||||
| Secondary segments | ||||||||
| WEALTH MANAGEMENT & INSURANCE | ||
 | Highlights (changes in constant euros) | |
| In response to the challenges posed by COVID-19, almost all employees are working remotely, critical people and processes were identified and business continuity plans were activated. In addition, follow-up and interaction with clients, with market updates and daily reports on the situation, reinforcing relationships and trust. | ||
• Underlying attributable profit rose 21% compared to the first quarter of 2019.• Total contribution (net profit + net fee income) of EUR 596 million, 7% higher than in the first quarter of 2019.• Assets under management reached EUR 345 billion, 2% lower year-on-year, affected by the crisis at the end of the quarter. | ||
| EUR 240 Mn | ||
| Underlying attributable profit | ||
Commercial activity
We continued to progress in our plan to make us the best responsible wealth manager in Europe and Latin America:
| • | In Private Banking, we performed well early this year, increasing contribution to profit year-on-year. This was achieved by strengthening the value proposition in all our countries, connecting and coordinating investment teams to leverage our global scale and developing a more innovative new product offering (for example with alternative funds), mainly in Spain, Miami, Switzerland and Brazil. |
We continued to connect our global platform, which allows our clients to be considered Private Banking clients in all our countries and to operate between them in a simple and efficient way. In this regard, total volume of shared business across our markets reached EUR 5,850 million, 25% higher than March 2019. Additionally, we continued to boost digitalisation of our transactions through the new private banking app for clients, Virginia, and service tools for our managers (SPiRIT).
| Collaboration volumes | ||||
| EUR million | ||||
| 5,850 | 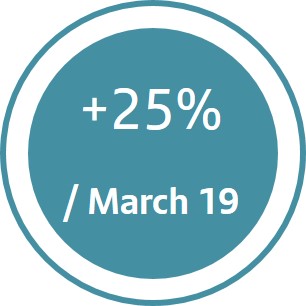 | |||
| • | In Santander Asset Management we remained focused on enhancing our product offering, such as the Santander GO range (with a volume of more than EUR 900 million since its launch), while we continue working on developing our Global Multi Asset Solutions platform and others. |
We continued to progress in our operational and technological transformation by implementing the Aladdin platform, along with the centralisation of some investment and control functions. This quarter we included in our perimeter the Allianz-Popular operation in Spain and continued to progress in our sustainability strategy (ESG), widening our product offering and reaching EUR 3.8 billion ESG assets under management in March 2020.
| • | In Insurance, focus remained on the strategy of strengthening the product offering for our clients, completing it in all the countries where we operate, and reached 20 million total protected customers worldwide. |
Of note were the progress of the alliance with Mapfre, having distributed the first products for SMEs and corporates in Spain.
In digital terms, Brazil launched a new end-to-end product for the travel sector, and in the UK we signed a new alliance with Aviva, where 50% of sales are made through digital channels, with tailored offers and a simple, fully digital process. In Latin America we continued to develop a sound operation of non-related insurance, where of note was the performance of Autocompara as market leader in the distribution of auto insurance with more than one million insurance policies in its portfolio.
Business performance
Total assets under management amounted to EUR 345 billion, 2% lower than in the first quarter of 2019:
This growth reflects the strong commercial activity early this year, with a slight slowdown and markets impact, particularly at the end of the quarter, due to the COVID-19 crisis.
| • | In Private Banking, the volume of customer assets and liabilities amounted to EUR 213 million in March 2020, 3% lower year-on-year, conditioned by the impact of markets, especially in the custody business. |
However, activity levels, particularly at the beginning of the quarter, led to 17% growth in fee income which, backed by a sound cost management (the efficiency ratio improved 7 pp year-on-year to 49%), increased contribution to attributable profit to117 million, 21% more than in the first quarter of 2019.
| Business performance: SAM and Private Banking | ||||||
| March 2020. EUR billion and % change in constant euros | ||||||
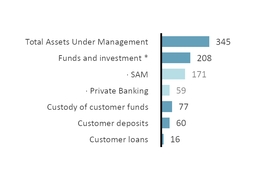
| / Mar-19 | |
| -2 | % |
| -2 | % |
| -1 | % |
| -3 | % |
| -10 | % |
| +8 | % |
| +6 | % |
Note: Total assets marketed and/or managed in 2020 and 2019.
(*) Total adjusted customer funds of private banking managed by SAM. 2019 data Pro forma including Popular asset management Joint Ventures, fully integrated in 2020.
January - March 2020 | | 48 |
| Response to the COVID-19 crisis Business model | ||||||||
| Secondary segments | ||||||||
| • | In SAM, total assets under management rose to EUR 171 billion, 1% lower compared to the same period of 2019, due to the impact of the crisis on the market. In February, we reached EUR 183 billion, up 6% compared to March 2019. |
Net sales in the first two months amounted to EUR 1.1 billion. However, they were negative in the quarter (EUR -2.3 billion). The contribution to profit of SAM was EUR 141 million, 6% higher year-on-year.
| • | In Insurance, the volume of gross written premiums in the quarter decreased 23% year-on-year to EUR 1.7 billion, with a decline of 3% in protection and 35% in savings insurance, driven by the current interest rate environment. Production was impacted by lower activity, and will be further affected during the crisis. |
The total contribution to net profit and total fees generated amounted to EUR 333 million, 3% more than in the first quarter of 2019.
Results
Underlying attributable profit was EUR 240 million in the first quarter of 2020, 21% growth year-on-year:
| • | Total income rose 15% mainly driven by net fee income (+20%) due to the higher average balance managed and the greater contribution of the insurance business. |
| • | Total fee income generated, including those ceded to the branch network, amounted to EUR 852 million and represented 30% of the Group's total. |
| Total fee income generated | ||||
| EUR million | ||||
| 852 | 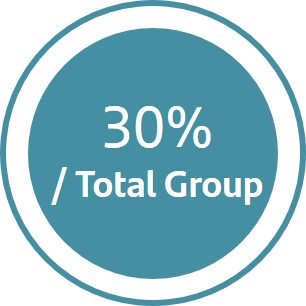 | |||
| • | Operating expenses were 2% higher, well bellow income growth, due to the Allianz-Popular perimeter integration. |
| • | Higher loan-loss provisions due to the recoveries recorded a year earlier. |
The total contribution to the Group (including net profit and total fees generated net of taxes) was EUR 596 million in March 2020, 7% growth year-on-year.
| Total profit contribution | ||||||
| EUR million and % change in constant euros | ||||||
| Q1'20 | Q1'20 | |||||
 | 596 | | 596 | |||
| -5 | % | / Q4'19 | +7 | % | / Q1'19 | |
Compared to the fourth quarter of 2019, underlying attributable profit dropped 5% due to the recovery in loan-loss provisions recorded in the previous quarter.
| Underlying income statement | |||||||
| EUR million and % change in constant euros | |||||||
| Q1'20 | / Q4'19 | / Q1'19 | |||||
| Revenue | 586 | +1 | % | +15 | % | ||
| Expenses | -244 | +1 | % | +2 | % | ||
| LLPs | -7 | — | — | ||||
| PBT | 334 | -6 | % | +22 | % | ||
| Underlying attrib. profit | 240 | -5 | % | +21 | % | ||
January - March 2020 | | 49 |
| Response to the COVID-19 crisis Business model | ||||||||
| Secondary segments | ||||||||
| SANTANDER GLOBAL PLATFORM (SGP) | ||
 | Highlights (changes in constant euros) • Santander Global Platform (SGP) aims to accelerate our growth by deploying global payments and financial solutions for SMEs and individuals in high-growth and large addressable markets.• SGP leverages our scale and footprint, our expertise in payments and our track-record scaling up fintech solutions to build best-in-class services.• In the first quarter of 2020 we continued to make relevant progress on developing our platforms. We deployed our Global Merchant Solution (GMS) in Mexico for our Mexican merchants. Likewise, and to strengthen our expansion plan, we acquired the acquiring business of our partner Elavon in Mexico and, in addition to Ebury in 2019, we acquired Mercury TFS in GTS this year. | |
GMS/Getnet GTS/OneTrade & Ebury Superdigital Openbank | ||
Strategy
Santander Global Platform is focused on offering global payment solutions to customers. These solutions are all being built based on customer experience and as a driver of loyalty. SGP offers these solutions to both our banks (B2C) and to third parties (B2B2C), helping to expand our market to non-customers and new geographic areas, generating new significant revenue opportunities. The area continued to advance according to the envisaged schedule.
Bringing best-in-class banking solutions to SMEs:
| • | Global Merchant Services is a single open platform for the global development of the acquiring business through the unique brand Getnet. This business has a high strategic value in the relationship with our customers given the relevance of collections and value-added services for merchants. |
In the quarter, we finished building this platform on the back of the available functionalities in Brazil's Getnet and incorporating new features such as its flexible cloud-based architecture. At the same time, it was rolled out in Mexico and we expect to expand it gradually, according to the market conditions. In addition, and to strengthen the expansion plan, we acquired 50% of the acquiring business in Mexico from our partner Elavon inc., with whom we had a joint venture which dated back to 2010, and will now be fully owned by the Group.
At the end of the quarter, the acquiring business had more than one million active businesses and reached a total income of EUR 144 million, excluding Corporate & Investment Banking and WM&I,. In Brazil, Getnet recorded strong turnover growth (+30% year-on-year) with 12% market share gains in a highly competitive environment. Progress was also recorded in countries such as Mexico, Spain and Portugal, consolidating significant market shares.
We remained focused on expanding to other countries where the Group operates, first in Latin America, followed by Europe and the rest of geographic areas. This plan will enable us to continue strengthening our global presence, capture synergies across different countries and enhancing our global value proposition through a single open platform.

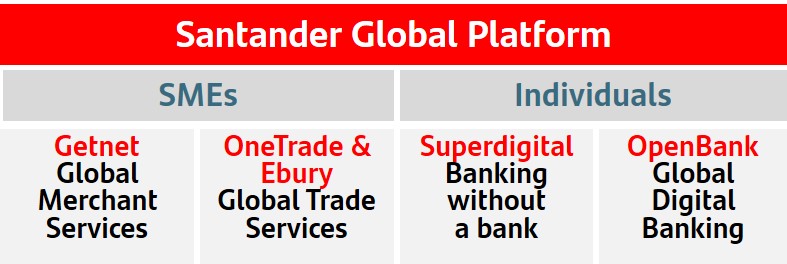
| • | Global Trade Services, our global platform to serve companies that trade internationally using international payments, FX, trade finance and multi-country accounts. The revenue pool for global transaction banking services in the Group's Retail Banking, excluding Corporate & Investment Banking and WM&I, was EUR 307 million in the first quarter. |
Regarding the development of the Global International Trade Platform, OneTrade, continued progressing as scheduled. The first services are expected to be launched in April in the main countries where the Bank operates, and will be further rolled out to the rest in the following months. In addition, new services will be included during 2020 regarding international payments (instant payments), FX Digital and international financing of business, all included in one single platform, OneTrade, for all the Group's customers in different countries.
To accelerate the development of this opportunity, together with the already announced acquisition of 50.1% Ebury's stake in November 2019, Global Trade Services acquired in March 50.1% of the Mercury TFS though a EUR 30 million investment. Mercury TFS is a company specialised in software solutions that enables to digitalise and automatise the management of trade financial activity, both for customers as for internal management. This operation will strengthen the Group's international trade offer and consolidate its position as the bank of choice for SMEs and corporates with international operations.
Mercury's offer will be included in OneTrade, as well as the Santander Trade Club Platform and Trade Club Alliance, providing customers in a single platform, and in a fully integrated way, the access to all services associated with their international business operations.

| 50 | | January - March 2020 |
| Response to the COVID-19 crisis Business model | ||||||||
| Secondary segments | ||||||||
Bringing best-in-class digital banking solutions to individuals:
| • | Superdigital, our financial inclusion platform for individuals that require a simple, flexible pre-banking service. It enables us to meet the financial needs of the underserved in a cost-effective way, providing them with basic financial products and a path to access credit, thus serving them responsibly and profitably. |
Superdigital also integrates with GMS for small merchants. With a special focus on Latin America, where there are c.300 million unbanked and underbanked consumers.
As of today, Superdigital operates in Brazil, Mexico and Chile, active customers grew c.60% year-on-year, whereas transactions are growing by c.70% year-on-year. We aim to expand Superdigital to 7 countries in Latin America later this year.

| • | Openbank, our global, full-service digital bank caters the current account and cards also offered by neobanks, including loans and mortgages, and a state-of-the-art robo-advisory and open platform brokerage services. |
Active now in Spain, the Netherlands, Germany and Portugal, Openbank grew in Q1 its loan book by 84% year-on-year and new customers in the period by 78% compared with Q1’19. Deposits grew 9% YoY. Loyal customers keep showing an industry record benchmark engagement ratio of 4.4 products per customer.
This quarter, Openbank launched the first travel card that works by subscription, that can be turned-on and off from the app, and our customers pay only when they use it, as compared to competing neobank products that charge full year fees.
This new travel card, branded R42, is available in plastic and metal and offers privileged exchange rates when used abroad, free ATM withdrawals, travel insurance and a concierge service.

Other activities
| • | Santander InnoVentures, our venture capital investments in the fintech ecosystem, continued to grow. As at end-March, it had invested more than USD 150 million in 31 companies in 9 countries. We are implementing 13 projects across our banks for the benefit of our customer base. |
Results
Looking at SGP's activity in Q1'20 in a broad sense, i.e. if, in addition to considering the results generated by the digital platforms, 50% of the results generated by the countries on the products related with the platform (e.g. merchant acquiring, trade finance products, etc.) are also included, revenue of SGP as secondary segment is close to EUR 260 million in and pro forma underlying attributable profit is positive at EUR 43 million in the first quarter of 2020.
This is the net result of two components: on the one hand, the investment in building the platforms and, on the other hand, 50% of the profit obtained from commercial relationships with our customers:
| • | The construction of platforms is where most of the spend is concentrated. We are making progress in the development of new solutions and rolling it out in countries. This has a negative impact of EUR 31 million on the income statement for the first quarter. |
| • | Profit obtained from commercial relationships with our customers linked to the global SGP platforms, and according to the criteria for allocating the aforementioned results, resulted in EUR 74 million in the quarter. |
We regularly assess the market valuations of the businesses included in SGP, based on multiples of comparable companies, to ensure our investments in digital are creating value.
| Underlying income statement | |||||||
| EUR million and % change in constant euros | |||||||
| Q1'20 | / Q4'19 | / Q1'19 | |||||
| Revenue | 260 | +6 | % | +5 | % | ||
| Expenses | -186 | -7 | % | +20 | % | ||
| LLPs | -5 | -69 | % | -70 | % | ||
| PBT | 71 | +180 | % | -5 | % | ||
| Underlying attrib. profit | 43 | +740 | % | -5 | % | ||
January - March 2020 | | 51 |
Responsible banking | ||||||||
| Responsible banking | ||||||||
RESPONSIBLE BANKING
Santander strives every day to contribute to the progress of people and companies in a Simple, Personal and Fair way in all that we do, to earn the confidence of our employees, customers, shareholders and society.
In order to meet our commitment to be a more responsible bank and help society address the main global issues, we have identified two challenges: adapt to the new business environment and contribute to more inclusive and sustainable growth, with the following goals set on 2019 for the coming years:
 | Santander Responsible banking targets |
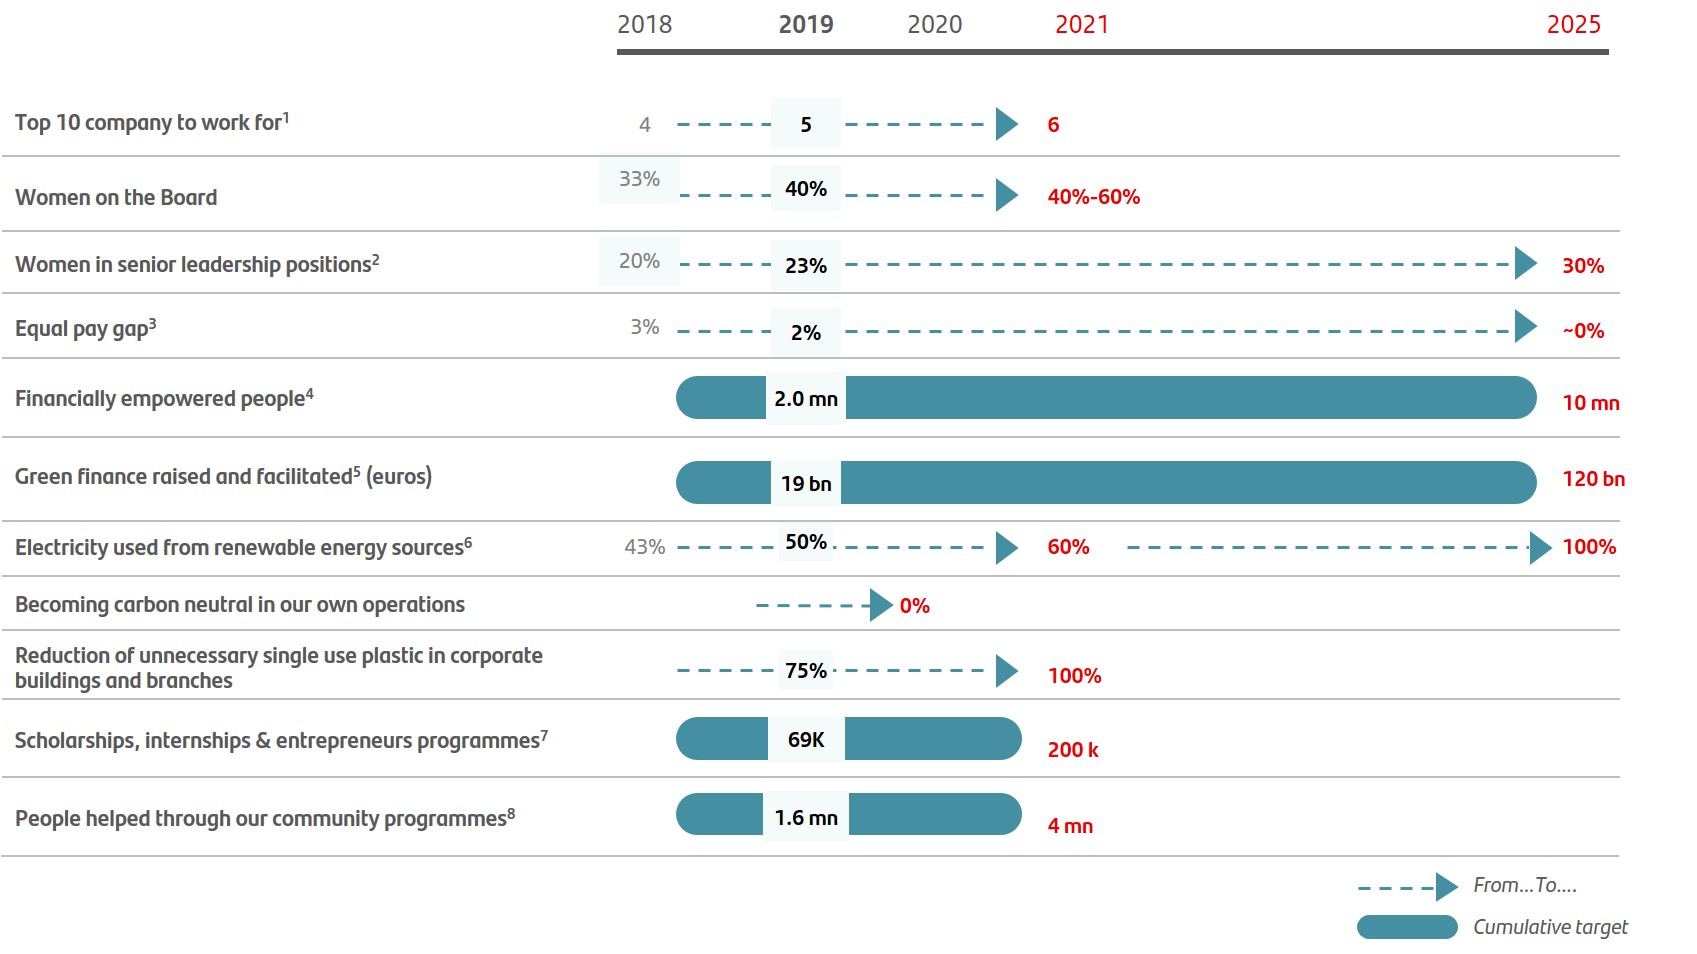
More information on our public commitments in responsible banking can be found on our website.
| 1. | According to relevant external indexes in each country (Great Place to Work, Top Employer, Merco, etc.). |
2. Senior positions represent 1% of total workforce.
3. Calculation of equal pay gap compares employees of the same job, level and function.
4. People (unbanked, underbanked or financially vulnerable), who are given access to the financial system, receive tailored finance and increase their knowledge and resilience through financial education.
5. Includes Santander overall contribution to green finance: project finance, syndicated loans, green bonds, capital finance, export finance, advisory, structuring and other products to help our clients in the transition to a low carbon economy. Commitment from 2019 to 2030 is 220Bn.
6. In those countries where it is possible to certify renewable sourced electricity for the properties occupied by the Group.
7. People supported through Santander Universities initiative (students who will receive a Santander scholarship, will achieve an internship in an SME or participate in entrepreneurship programmes supported by the bank).
8. People helped through our community investment programmes (excluded Santander Universities and financial education initiatives).
| 52 | | January - March 2020 |
Responsible banking | ||||||||
| Responsible banking | ||||||||
| First quarter highlights |
 | The Group is supporting its stakeholders in the difficulties they may have as a result of the current pandemic. To this end, we have put in place various contingency plans in the countries in which we operate, which have been discussed in previous sections of this report. |
| In addition, the Group continued to develop responsible banking initiatives in the quarter, in the areas of environmental sustainability, diversity and support to the communities. The most relevant are detailed below. | |
We were recognised for our excellent results in this area with the Gold Class distinction in The Sustainability Yearbook 2020 released by S&P Global, as Santander ranked 1st in the Dow Jones Sustainability Index. We achieved a total score of 86 points out of 100, reaching the maximum score of 100 in a number of assessed areas, including tax strategy, privacy protection, environmental reporting and financial inclusion. | |
 | As part of our corporate commitment with the environment, Santander continued financing green alternatives and renewable energies in its different countries: Santander Argentina was involved in the placement of the first green bond issued on the primary local debt market. The placement, which also involved other banks and financial institutions, amounted to USD 48.4 million. This operation is another step towards the goal of bringing sustainability principles into the Argentinian capital market in line with world markets. In retail baking, Santander Polska launched a leasing offer to finance a wide range of solar installations. |
 | Regarding our diversity and inclusion commitments, we have also announced our membership to The Valuable 500, committing to include disability inclusion in the board's agenda, and signed the UN Women Empowerment principles. |
We were awarded Top Employers 2020 for the excellent working conditions in Spain, Poland, the UK and Chile, and Santander Consumer Finance in Germany, the Netherlands, Austria, Italy, Poland and Belgium. To continue working in line with our corporate culture, we implemented a minimum standard for parental leave to be implemented in 2020, offering at least 14 paid weeks for mothers and four weeks for the secondary parent. | |
 | In addition to the measures implemented to minimise the impacts of the COVID-19 pandemic, we continued to invest in the communities where we operate. |
In collaboration with MIT Professional Education, we launched the Santander Scholarships MIT Leading Digital Transformation, in which 2,500 university students and eligible professionals from 14 countries will benefit from specialised training in digital transformation. Additionally, Santander and the British Council launched the Santander British Council Summer Experience, 90 full scholarships to foster the learning of English and knowledge of British culture among young people from 12 countries in the international networks in which both institutions operate. | |
As a result of these efforts, Banco Santander was ranked the world’s most sustainable bank in the Dow Jones Sustainability Index for the first time and was also first in Europe for the second year running. The index evaluates the Group’s performance across economic, environmental and social dimensions. | |
Also, we continue to form part of the various sustainability indices, providing non-financial information to the ESG markets, investors and analysts. | |
 | |
January - March 2020 | | 53 |
| Response to the COVID-19 crisis Business model | Corporate governance | |||||||
| Corporate governance | ||||||||
CORPORATE GOVERNANCE
| A responsible bank has a solid governance model with well-defined functions; it manages risks and opportunities prudently and defines its long-term strategy watching out for the interests of all its stakeholders and society in general |  |
à Changes in the board
| • | As of 27 February 2020, the Board submitted a resolution to the General Shareholders’ Meeting recommending the appointment of Mr Sergio Rial as a new executive director of the Group which was approved on 3 April 2020. Mr Sergio Rial will fill the vacancy left by Mr Ignacio Benjumea with effect from the approval of his election. |
| • | The aforementioned General Shareholders’ Meeting also agreed to appoint Mr Luis Isasi as an external director. As announced on 26 November 2019, Mr Luis Isasi will replace Mr Guillermo de la Dehesa on 3 April 2020. |
| • | Both appointments are subject to regulatory approval. |
à Changes in the composition of the board committees
| • | After leaving the Board on 3 April 2020, Mr Guillermo de la Dehesa also ceased to be a member of the executive, appointments, remuneration and innovation and technology committees. |
| • | As of April 2020, Mrs Pamela Walkden was appointed, with effects from 26 April, as Group audit committee Chairman replacing Ms Belén Romana, who will remain a member of the committee, having completed the four year period since her appointment as chairman, as provided by the regulation of the board. |
à Annual General Meeting
The Annual General Shareholder’s Meeting was held on 3 April 2020.
| • | In accordance of Royal Decree 463/2020 of 14 March declaring the state of emergency to address the health situation caused by COVID-19, in accordance with articles 40 and 41 of Royal Decree-Law 8/2020 of 17 March on urgent extraordinary measures to address the economic and social impact of COVID-19 and in order to safeguard the general interests, health and safety of shareholders, employees and other people who participate in organising and holding the general meeting, by resolution of the board of directors announced on 10 and 23 March, the venue of the ordinary general shareholders’ meeting was changed to the Ciudad Grupo Santander in Boadilla del Monte (Madrid), and was held without the shareholders attending in person but using the software applications to remotely attend the meeting established in the Bank’s bylaws and regulations for the general shareholders’ meeting to guarantee the rights of all shareholders to receive information, to remotely attend the meetings, to participate and to vote at the general meeting. |
| • | Furthermore, and in compliance with the ECB recommendation issued on 27 March, on 2 April a material fact was published, announcing the decision of the Board to withdraw from the agenda of the ordinary general shareholders meeting the proposals under points Two and Seven A, regarding, respectively, the application of the Banks 2019 results and the capital increase to instrument, through the application of the Santander Dividendo Elección programme, the part of the remuneration corresponding to the final dividend against 2019 results initially contemplated. A further general shareholders meeting will be held no later than 31 October in which shareholders’ will have the opportunity to decide on the new proposed application of 2019 results, which might differ from the one initially proposed for the aforementioned General Shareholders’ Meeting and, if needed, on any supplementary resolutions. |
| 54 | | January - March 2020 |
| Response to the COVID-19 crisis Business model | Corporate governance | |||||||
| Corporate governance | ||||||||
| • | The decision to withdraw from the agenda the aforementioned proposals was as provided for by the joint communication issued by the Spanish National Securities Commission and the Spanish Registrars Society on 26 March 2020, articles 40.6.bis and 41.3 Royal Decree-Law 8/2020 on 17 March, according to the First Final Provision of Royal Decree Law 11/2020 on 31 March. |
| • | At the AGM, a total of 589.268 shareholders were present or represented, holders of 10,802,580,226 shares. The quorum was 65.0% of the Bank’s share capital. |
| • | The agreements submitted to a vote received an average 94.37% of favourable votes. The Bank’s management during 2019 was approved by 99.68% of votes. |
| • | The remuneration policy for directors for 2020, 2021 and 2022 was submitted to the Meeting’s binding approval, and received 94.40% of votes in favour. |
| • | All the proposed agreements, the reports of administrators and other legal documentation regarding the AGM were published on the Group’s website on February 28 when the meeting was called. The documentation includes the 2019 Annual Report which has a section on corporate governance setting out the main activities of the board and of its committees in 2019, including detailed information on the regulations and procedures on which the Bank’s corporate governance system is based, as well as the annual report on directors’ remuneration. |
| • | In addition as the appointments of Mr Luis Isasi and Mr Sergio Rial as new directors, the board approved the ratification and re-election of Mrs Pamela Walkden as independent director and the re-election of Mrs Ana Botín-Sanz de Sautuola as an executive director, Mr Rodrigo Echenique as an external director and Mrs Esther Giménez-Salinas and Mrs Sol Daurella as independent directors. |
Full information on the agreements approved by the annual general meeting can be found at www.santander.com.
January - March 2020 | | 55 |
| Response to the COVID-19 crisis Business model | Santander share | |||||||
| Santander share | ||||||||
SANTANDER SHARE
Banco Santander, following the ECB recommendation urging financial institutions, given the uncertainty resulting from the COVID-19 emergency, to preserve capital by cancelling the payment of dividends against 2019 and 2020 earnings, has decided to cancel the final dividend charged against 2019 earnings and hold a further general shareholders meeting expected in October 2020, to consider a dividend payment if the uncertainties relating to the COVID-19 crisis are resolved.
The Group, even before the ECB’s announcement, had agreed to cancel the interim dividend charged against 2020 and suspend its decision on 2020 dividends until there is more clarity regarding the impact of the crisis. This decision was taken to ensure the Bank has as much flexibility as possible to allow it to maximise lending and support businesses and individuals affected by the COVID-19 pandemic.
àShareholder remuneration
The Santander share is listed in five markets, in Spain, Mexico and Poland as an ordinary share, in the UK as a CDI and in the US as an ADR.
The rapid spread of COVID-19 worldwide increased uncertainty and risk aversion, conditioning market performance in the quarter. As a response to the healthcare measures that governments have implemented and which are impacting the economy, in the US and Europe, central banks and governments are using the tools to counteract the economic slowdown. Central banks have redoubled their monetary policy efforts, and governments have put in place support packages for businesses and households, laying the groundwork for the restoration of market confidence.
The European Central Bank announced a new asset purchase programme of EUR 750 billion to counter the risk to the monetary policy transmission mechanism, and the Fed cut interest rates twice to 0%.
In the midst of the global health crisis, the disagreement between Russia and Saudi Arabia regarding the need of production cuts triggered the price war that plunged the oil price.
In this context, the main markets reported significant falls in the quarter. In Spain, the Ibex 35 dropped 28.9% and, in Europe, the DJ Stoxx 50 fell 19.8%.
As such, the leading European banking index, DJ Stoxx Bank decreased 38.7% while the MSCI World Banks index declined 36.6%. The Santander Share price ended the quarter at EUR 2.218, 40.5% lower.
| Share price | ||||
 |  | |||
START 31/12/2019 | END 31/03/2020 | |||
| €3.730 | €2.218 | |||
 |  | |||
Maximum 17/02/2020 | Minimum 16/03/2020 | |||
| €3.964 | €1.928 | |||
| Comparative share performance |
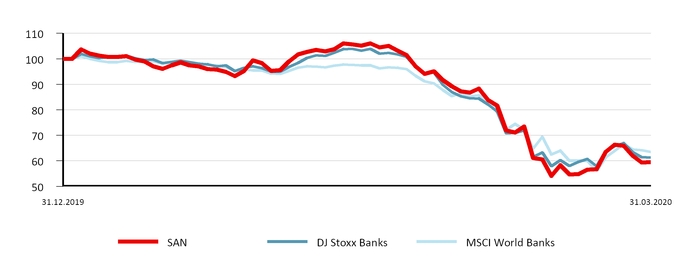
| 56 | | January - March 2020 |
| Response to the COVID-19 crisis Business model | Santander share | |||||||
| Santander share | ||||||||
SANTANDER SHARE
àMarket capitalisation and trading
As at 31 March 2020, Santander was the largest bank in the Eurozone by market capitalisation and the 29th in the world among financial entities (EUR 36,859 million).
The share’s weighting in the DJ Stoxx 50 was 1.1% and 6.9% in the DJ Stoxx Banks. In the domestic market, its weight in the Ibex 35 as at end-March was 10.5%.
A total of 5,119 million shares were traded in the year for an effective value of EUR 15,595 million and a liquidity ratio of 31%.
The daily trading volume was 80 million shares with an effective value of EUR 244 million.
àShareholder base
The total number of Santander shareholders at 31 March 2020 was 4,043,974 of which 3,768,316 were European (77.64% of the capital stock) and 259,139 from the Americas (21.09%).
Excluding the board, which holds 1.10% of the Bank’s capital stock, retail shareholders account for 40.71% and institutional shareholders 58.19%.
| Share capital distribution by geographic area | ||
| March 2020 | ||
| The Americas | Europe | Other |
| 21.09% | 77.64% | 1.27% |
 | ||
 | 1st | Bank in the Eurozone by market capitalisation |
EUR 36,859 million | ||
| The Santander share | ||
| March 2020 | ||
| Shares and trading data | ||
| Shares (number) | 16,618,114,582 | |
| Average daily turnover (number of shares) | 79,988,463 | |
| Share liquidity (%) | 31 | |
| (Number of shares traded during the year / number of shares) | ||
| Stock market indicators | ||
| Price / Tangible book value (X) | 0.53 | |
| P/E ratio (X) | 48.29 | |
| Free float (%) | 99.83 | |
| Share capital distribution by type of shareholder | |
| March 2020 | |
| Institutional |
| 58.19% |
| Board (*) |
| 1.10% |
| Retail |
| 40.71% |
(*) Shares owned or represented by directors.
January - March 2020 | | 57 |
Financial report January - March 2020 
| 58 | | January - March 2020 |
| Response to the COVID-19 crisis Business model | ||||||||
| Group financial information | ||||||||
| Net fee income. Consolidated | ||||||||
| EUR million | ||||||||
| Q1'20 | Q4'19 | Change (%) | Q1'19 | Change (%) | ||||
| Fees from services | 1,705 | 1,791 | (4.8) | 1,779 | (4.2) | |||
| Wealth management and marketing of customer funds | 928 | 948 | (2.1) | 936 | (0.9) | |||
| Securities and custody | 220 | 222 | (0.9) | 216 | 1.9 | |||
| Net fee income | 2,853 | 2,961 | (3.6) | 2,931 | (2.7) | |||
| Operating expenses. Consolidated | ||||||||
| EUR million | ||||||||
| Q1'20 | Q4'19 | Change (%) | Q1'19 | Change (%) | ||||
| Staff costs | 2,899 | 3,053 | (5.0) | 3,006 | (3.6) | |||
| Other general administrative expenses | 1,949 | 2,126 | (8.3) | 2,005 | (2.8) | |||
| Information technology | 498 | 588 | (15.3) | 551 | (9.6) | |||
| Communications | 133 | 128 | 3.9 | 132 | 0.8 | |||
| Advertising | 136 | 196 | (30.6) | 157 | (13.4) | |||
| Buildings and premises | 210 | 218 | (3.7) | 211 | (0.5) | |||
| Printed and office material | 26 | 27 | (3.7) | 32 | (18.8) | |||
| Taxes (other than tax on profits) | 138 | 132 | 4.5 | 126 | 9.5 | |||
| Other expenses | 808 | 837 | (3.5) | 796 | 1.5 | |||
| Administrative expenses | 4,848 | 5,179 | (6.4) | 5,011 | (3.3) | |||
| Depreciation and amortisation | 729 | 792 | (8.0) | 747 | (2.4) | |||
| Operating expenses | 5,577 | 5,971 | (6.6) | 5,758 | (3.1) | |||
| Operating means. Consolidated | |||||||||||||
| Employees | Branches | ||||||||||||
| Mar-20 | Mar-19 | Change | Mar-20 | Mar-19 | Change | ||||||||
| Europe | 85,805 | 93,060 | (7,255 | ) | 5,329 | 6,696 | (1,367 | ) | |||||
| Spain | 27,354 | 31,325 | (3,971 | ) | 3,222 | 4,365 | (1,143 | ) | |||||
| Santander Consumer Finance | 13,859 | 14,796 | (937 | ) | 417 | 433 | (16 | ) | |||||
| United Kingdom | 24,500 | 25,485 | (985 | ) | 615 | 754 | (139 | ) | |||||
| Portugal | 6,512 | 6,735 | (223 | ) | 529 | 561 | (32 | ) | |||||
| Poland | 11,034 | 12,551 | (1,517 | ) | 535 | 571 | (36 | ) | |||||
| Other | 2,546 | 2,168 | 378 | 11 | 12 | (1 | ) | ||||||
| North America | 37,398 | 37,149 | 249 | 2,048 | 2,071 | (23 | ) | ||||||
| US | 17,277 | 17,279 | (2 | ) | 619 | 659 | (40 | ) | |||||
| Mexico | 20,121 | 19,870 | 251 | 1,429 | 1,412 | 17 | |||||||
| South America | 68,624 | 69,973 | (1,349 | ) | 4,524 | 4,509 | 15 | ||||||
| Brazil | 45,807 | 46,793 | (986 | ) | 3,617 | 3,562 | 55 | ||||||
| Chile | 11,437 | 11,888 | (451 | ) | 366 | 380 | (14 | ) | |||||
| Argentina | 9,290 | 9,271 | 19 | 438 | 468 | (30 | ) | ||||||
| Other | 2,090 | 2,021 | 69 | 103 | 99 | 4 | |||||||
| Santander Global Platform | 1,424 | 545 | 879 | 1 | 1 | — | |||||||
| Corporate Centre | 1,697 | 1,757 | (60 | ) | |||||||||
| Total Group | 194,948 | 202,484 | (7,536 | ) | 11,902 | 13,277 | (1,375 | ) | |||||
| Net loan-loss provisions. Consolidated | ||||||||||
| EUR million | ||||||||||
| Q1'20 | Q4'19 | Change (%) | Q1'19 | Change (%) | ||||||
| Non-performing loans | 2,616 | 2,974 | (12.0) | 2,515 | 4.0 | |||||
| Country-risk | (6 | ) | 1 | — | 1 | — | ||||
| Recovery of written-off assets | (301 | ) | (402 | ) | (25.1) | (344 | ) | (12.5) | ||
| Net loan-loss provisions | 2,309 | 2,573 | (10.3) | 2,172 | 6.3 | |||||
Note: Excluding provisions overlay in Q1'20.
January - March 2020 | | 59 |
| Response to the COVID-19 crisis Business model | ||||||||
| Group financial information | ||||||||
| Loans and advances to customers. Consolidated | |||||||||
| EUR million | |||||||||
| Change | |||||||||
| Mar-20 | Mar-19 | Absolute | % | Dec-19 | |||||
| Commercial bills | 34,619 | 31,980 | 2,639 | 8.3 | 37,753 | ||||
| Secured loans | 499,667 | 495,005 | 4,662 | 0.9 | 513,929 | ||||
| Other term loans | 279,295 | 269,908 | 9,387 | 3.5 | 267,138 | ||||
| Finance leases | 35,360 | 34,030 | 1,330 | 3.9 | 35,788 | ||||
| Receivable on demand | 9,418 | 8,247 | 1,171 | 14.2 | 7,714 | ||||
| Credit cards receivable | 19,052 | 22,687 | (3,635 | ) | (16.0) | 23,876 | |||
| Impaired assets | 31,697 | 34,086 | (2,389 | ) | (7.0) | 32,559 | |||
| Gross loans and advances to customers (excl. reverse repos) | 909,108 | 895,943 | 13,165 | 1.5 | 918,757 | ||||
| Reverse repos | 49,005 | 37,696 | 11,309 | 30.0 | 45,703 | ||||
| Gross loans and advances to customers | 958,113 | 933,639 | 24,474 | 2.6 | 964,460 | ||||
| Loan-loss allowances | 22,706 | 23,444 | (738 | ) | (3.1) | 22,242 | |||
| Loans and advances to customers | 935,407 | 910,195 | 25,212 | 2.8 | 942,218 | ||||
| Total funds. Consolidated | |||||||||
| EUR million | |||||||||
| Change | |||||||||
| Mar-20 | Mar-19 | Absolute | % | Dec-19 | |||||
| Demand deposits | 584,015 | 565,477 | 18,538 | 3.3 | 588,534 | ||||
| Time deposits | 191,054 | 202,018 | (10,964 | ) | (5.4) | 196,920 | |||
| Mutual funds | 148,003 | 167,870 | (19,867 | ) | (11.8) | 180,405 | |||
| Customer funds | 923,072 | 935,365 | (12,293 | ) | (1.3) | 965,859 | |||
| Pension funds | 14,549 | 15,623 | (1,074 | ) | (6.9) | 15,878 | |||
| Managed portfolios | 28,937 | 28,024 | 913 | 3.3 | 30,117 | ||||
| Repos | 40,390 | 40,866 | (476 | ) | (1.2) | 38,911 | |||
| Total funds | 1,006,948 | 1,019,878 | (12,930 | ) | (1.3) | 1,050,765 | |||
| Eligible capital (fully loaded) | |||||||||
| EUR million | |||||||||
| Change | |||||||||
| Mar-20 | Mar-19 | Absolute | % | Dec-19 | |||||
| Capital stock and reserves | 124,727 | 119,866 | 4,861 | 4.1 | 120,260 | ||||
| Attributable profit | 331 | 1,840 | (1,509 | ) | (82.0) | 6,515 | |||
| Dividends | — | (920 | ) | 920 | (100.0) | (3,423 | ) | ||
| Other retained earnings | (30,166 | ) | (24,315 | ) | (5,851 | ) | 24.1 | (25,385 | ) |
| Minority interests | 6,911 | 7,138 | (227 | ) | (3.2) | 6,441 | |||
| Goodwill and intangible assets | (27,103 | ) | (29,218 | ) | 2,115 | (7.2) | (28,478 | ) | |
| Other deductions | (6,285 | ) | (6,301 | ) | 15 | (0.2) | (5,432 | ) | |
| Core CET1 | 68,414 | 68,090 | 324 | 0.5 | 70,497 | ||||
| Preferred shares and other eligible T1 | 8,760 | 10,059 | (1,299 | ) | (12.9) | 8,467 | |||
| Tier 1 | 77,173 | 78,149 | (975 | ) | (1.2) | 78,964 | |||
| Generic funds and eligible T2 instruments | 11,924 | 11,694 | 229 | 2.0 | 11,973 | ||||
| Eligible capital | 89,097 | 89,843 | (746 | ) | (0.8) | 90,937 | |||
| Risk-weighted assets | 590,952 | 606,300 | (15,347 | ) | (2.5) | 605,244 | |||
| CET1 capital ratio | 11.58 | 11.23 | 0.35 | 11.65 | |||||
| T1 capital ratio | 13.06 | 12.89 | 0.17 | 13.05 | |||||
| Total capital ratio | 15.08 | 14.82 | 0.26 | 15.02 | |||||
| 60 | | January - March 2020 |
| EUROPE | |||||||||||
| EUR million | |||||||||||
| / | Q4'19 | / | Q1'19 | ||||||||
| Underlying income statement | Q1'20 | % | % excl. FX | % | % excl. FX | ||||||
| Net interest income | 3,435 | (2.7 | ) | (2.5 | ) | (3.5 | ) | (3.6 | ) | ||
| Net fee income | 1,315 | (0.3 | ) | (0.2 | ) | (0.9 | ) | (1.1 | ) | ||
Gains (losses) on financial transactions (1) | 142 | (66.9 | ) | (66.9 | ) | (23.4 | ) | (23.6 | ) | ||
| Other operating income | 83 | 546.9 | 534.8 | (45.6 | ) | (45.7 | ) | ||||
| Total income | 4,974 | (6.0 | ) | (5.8 | ) | (4.8 | ) | (4.9 | ) | ||
| Administrative expenses and amortisations | (2,712 | ) | (0.8 | ) | (0.7 | ) | (3.2 | ) | (3.4 | ) | |
| Net operating income | 2,263 | (11.6 | ) | (11.4 | ) | (6.6 | ) | (6.6 | ) | ||
| Net loan-loss provisions | (556 | ) | 11.7 | 12.1 | 21.8 | 22.3 | |||||
| Other gains (losses) and provisions | (195 | ) | (6.5 | ) | (6.8 | ) | (1.4 | ) | (1.5 | ) | |
| Profit before tax | 1,511 | (18.4 | ) | (18.2 | ) | (14.6 | ) | (14.6 | ) | ||
| Tax on profit | (438 | ) | (9.0 | ) | (8.9 | ) | (10.9 | ) | (10.9 | ) | |
| Profit from continuing operations | 1,072 | (21.7 | ) | (21.5 | ) | (16.0 | ) | (16.0 | ) | ||
| Net profit from discontinued operations | — | — | — | — | — | ||||||
| Consolidated profit | 1,072 | (21.7 | ) | (21.5 | ) | (16.0 | ) | (16.0 | ) | ||
| Non-controlling interests | (99 | ) | (25.1 | ) | (24.9 | ) | (12.8 | ) | (12.8 | ) | |
| Underlying attributable profit to the parent | 974 | (21.3 | ) | (21.1 | ) | (16.3 | ) | (16.3 | ) | ||
| Balance sheet | |||||||||||
| Loans and advances to customers | 681,075 | 0.6 | 2.9 | 3.8 | 5.8 | ||||||
| Cash, central banks and credit institutions | 189,610 | 5.1 | 6.3 | 4.4 | 5.3 | ||||||
| Debt instruments | 82,119 | (21.3 | ) | (20.1 | ) | (29.2 | ) | (28.3 | ) | ||
| Other financial assets | 60,788 | 12.8 | 12.9 | 11.6 | 11.7 | ||||||
| Other asset accounts | 47,697 | 15.0 | 16.3 | 6.5 | 7.5 | ||||||
| Total assets | 1,061,290 | 0.4 | 2.2 | 0.8 | 2.3 | ||||||
| Customer deposits | 580,842 | (3.3 | ) | (1.2 | ) | (1.1 | ) | 0.5 | |||
| Central banks and credit institutions | 198,127 | 4.4 | 5.2 | (1.9 | ) | (1.3 | ) | ||||
| Marketable debt securities | 136,012 | 1.8 | 4.5 | 5.3 | 7.8 | ||||||
| Other financial liabilities | 72,115 | 18.6 | 18.9 | 19.7 | 20.0 | ||||||
| Other liabilities accounts | 17,881 | 9.1 | 11.1 | (3.0 | ) | (1.7 | ) | ||||
| Total liabilities | 1,004,978 | 0.4 | 2.2 | 0.8 | 2.3 | ||||||
| Total equity | 56,312 | 0.3 | 2.7 | 1.2 | 3.4 | ||||||
| Memorandum items: | |||||||||||
Gross loans and advances to customers (2) | 652,651 | 0.3 | 2.5 | 2.1 | 3.9 | ||||||
| Customer funds | 644,106 | (4.0 | ) | (2.2 | ) | (1.3 | ) | 0.2 | |||
Customer deposits (3) | 567,332 | (2.4 | ) | (0.4 | ) | (0.4 | ) | 1.2 | |||
| Mutual funds | 76,774 | (14.4 | ) | (13.8 | ) | (7.2 | ) | (6.6 | ) | ||
| Ratios (%) and operating means | |||||||||||
| Underlying RoTE | 7.94 | (2.08 | ) | (1.67 | ) | ||||||
| Efficiency ratio | 54.5 | 2.9 | 0.9 | ||||||||
| NPL ratio | 3.19 | (0.06 | ) | (0.42 | ) | ||||||
| NPL coverage | 50.7 | 0.9 | 1.2 | ||||||||
| Number of employees | 85,805 | (0.9 | ) | (7.8 | ) | ||||||
| Number of branches | 5,329 | (0.1 | ) | (20.4 | ) | ||||||
(1) Includes exchange differences.
(2) Excluding reverse repos.
(3) Excluding repos.
January - March 2020 | | 61 |
| Spain | |||||||
| EUR million | |||||||
| / Q4'19 | / Q1'19 | ||||||
| Underlying income statement | Q1'20 | % | % | ||||
| Net interest income | 925 | (0.9 | ) | (8.3 | ) | ||
| Net fee income | 643 | 3.8 | 3.2 | ||||
Gains (losses) on financial transactions (1) | 156 | (59.7 | ) | 30.9 | |||
| Other operating income | 64 | — | (39.1 | ) | |||
| Total income | 1,789 | (1.3 | ) | (3.7 | ) | ||
| Administrative expenses and amortisations | (944 | ) | (3.4 | ) | (7.8 | ) | |
| Net operating income | 844 | 1.2 | 1.5 | ||||
| Net loan-loss provisions | (253 | ) | 43.7 | 4.5 | |||
| Other gains (losses) and provisions | (104 | ) | 3.5 | (7.3 | ) | ||
| Profit before tax | 487 | (12.6 | ) | 2.0 | |||
| Tax on profit | (135 | ) | (14.1 | ) | 10.9 | ||
| Profit from continuing operations | 352 | (12.0 | ) | (1.1 | ) | ||
| Net profit from discontinued operations | — | — | — | ||||
| Consolidated profit | 352 | (12.0 | ) | (1.1 | ) | ||
| Non-controlling interests | — | (93.7 | ) | — | |||
| Underlying attributable profit to the parent | 352 | (12.0 | ) | (1.1 | ) | ||
| Balance sheet | |||||||
| Loans and advances to customers | 186,296 | 0.6 | (4.1 | ) | |||
| Cash, central banks and credit institutions | 78,407 | 0.1 | (2.6 | ) | |||
| Debt instruments | 24,458 | (28.7 | ) | (41.7 | ) | ||
| Other financial assets | 1,407 | 1.1 | (26.9 | ) | |||
| Other asset accounts | 25,209 | 5.4 | 2.0 | ||||
| Total assets | 315,778 | (2.3 | ) | (8.0 | ) | ||
| Customer deposits | 234,716 | (2.4 | ) | (3.2 | ) | ||
| Central banks and credit institutions | 20,341 | (19.4 | ) | (56.4 | ) | ||
| Marketable debt securities | 29,503 | 9.9 | 26.2 | ||||
| Other financial liabilities | 8,968 | — | 11.7 | ||||
| Other liabilities accounts | 6,231 | 19.3 | (16.8 | ) | |||
| Total liabilities | 299,759 | (2.3 | ) | (8.7 | ) | ||
| Total equity | 16,019 | (2.3 | ) | 5.2 | |||
| Memorandum items: | |||||||
Gross loans and advances to customers (2) | 192,490 | 0.6 | (4.4 | ) | |||
| Customer funds | 293,889 | (4.8 | ) | (4.2 | ) | ||
Customer deposits (3) | 234,716 | (2.3 | ) | (3.0 | ) | ||
| Mutual funds | 59,173 | (13.8 | ) | (8.8 | ) | ||
| Ratios (%) and operating means | |||||||
| Underlying RoTE | 9.00 | (1.26 | ) | (0.61 | ) | ||
| Efficiency ratio | 52.8 | (1.2 | ) | (2.4 | ) | ||
| NPL ratio | 6.88 | (0.06 | ) | (0.41 | ) | ||
| NPL coverage | 42.0 | 0.9 | (1.3 | ) | |||
| Number of employees | 27,354 | (1.0 | ) | (12.7 | ) | ||
| Number of branches | 3,222 | (0.4 | ) | (26.2 | ) | ||
(1) Includes exchange differences.
(2) Excluding reverse repos.
(3) Excluding repos.
| 62 | | January - March 2020 |
| Santander Consumer Finance | |||||||||||
| EUR million | |||||||||||
| / | Q4'19 | / | Q1'19 | ||||||||
| Underlying income statement | Q1'20 | % | % excl. FX | % | % excl. FX | ||||||
| Net interest income | 979 | 1.9 | 2.5 | 4.0 | 5.2 | ||||||
| Net fee income | 187 | (4.4 | ) | (4.2 | ) | (12.8 | ) | (12.5 | ) | ||
Gains (losses) on financial transactions (1) | (9 | ) | 171.8 | 177.3 | — | — | |||||
| Other operating income | 15 | (54.9 | ) | (54.9 | ) | 34.2 | 35.5 | ||||
| Total income | 1,171 | (1.2 | ) | (0.7 | ) | 0.3 | 1.2 | ||||
| Administrative expenses and amortisations | (514 | ) | 3.0 | 3.4 | 1.2 | 2.1 | |||||
| Net operating income | 656 | (4.3 | ) | (3.8 | ) | (0.4 | ) | 0.6 | |||
| Net loan-loss provisions | (172 | ) | 15.9 | 17.7 | 41.4 | 44.3 | |||||
| Other gains (losses) and provisions | 44 | — | — | 85.4 | 84.0 | ||||||
| Profit before tax | 528 | 4.8 | 5.3 | (5.9 | ) | (5.2 | ) | ||||
| Tax on profit | (149 | ) | 35.0 | 35.4 | (6.5 | ) | (5.9 | ) | |||
| Profit from continuing operations | 380 | (3.7 | ) | (3.2 | ) | (5.6 | ) | (4.9 | ) | ||
| Net profit from discontinued operations | — | — | — | — | — | ||||||
| Consolidated profit | 380 | (3.7 | ) | (3.2 | ) | (5.6 | ) | (4.9 | ) | ||
| Non-controlling interests | (76 | ) | 0.1 | 0.1 | (3.1 | ) | (3.1 | ) | |||
| Underlying attributable profit to the parent | 304 | (4.6 | ) | (4.0 | ) | (6.2 | ) | (5.3 | ) | ||
| Balance sheet | |||||||||||
| Loans and advances to customers | 99,989 | (2.2 | ) | (0.2 | ) | 4.4 | 7.0 | ||||
| Cash, central banks and credit institutions | 12,186 | 47.6 | 51.7 | 93.5 | 100.4 | ||||||
| Debt instruments | 2,710 | (15.2 | ) | (10.6 | ) | (21.3 | ) | (17.7 | ) | ||
| Other financial assets | 39 | 18.2 | 20.6 | 18.0 | 20.9 | ||||||
| Other asset accounts | 3,986 | (0.4 | ) | 1.0 | 6.9 | 8.6 | |||||
| Total assets | 118,911 | 1.0 | 3.2 | 8.8 | 11.6 | ||||||
| Customer deposits | 38,119 | (3.7 | ) | (1.0 | ) | 3.3 | 6.4 | ||||
| Central banks and credit institutions | 28,302 | 12.5 | 14.3 | 14.3 | 16.6 | ||||||
| Marketable debt securities | 36,931 | 0.4 | 2.2 | 15.2 | 17.9 | ||||||
| Other financial liabilities | 1,080 | (23.6 | ) | (22.3 | ) | (9.6 | ) | (8.4 | ) | ||
| Other liabilities accounts | 3,476 | (10.1 | ) | (8.8 | ) | (7.4 | ) | (6.2 | ) | ||
| Total liabilities | 107,909 | 1.0 | 3.2 | 9.4 | 12.1 | ||||||
| Total equity | 11,001 | 0.6 | 3.8 | 3.8 | 7.2 | ||||||
| Memorandum items: | |||||||||||
Gross loans and advances to customers (2) | 102,542 | (2.1 | ) | — | 4.5 | 7.1 | |||||
| Customer funds | 38,119 | (3.7 | ) | (1.0 | ) | 3.4 | 6.6 | ||||
Customer deposits (3) | 38,119 | (3.7 | ) | (1.0 | ) | 3.4 | 6.6 | ||||
| Mutual funds | — | — | — | — | — | ||||||
| Ratios (%) and operating means | |||||||||||
| Underlying RoTE | 13.86 | (0.76 | ) | (0.99 | ) | ||||||
| Efficiency ratio | 43.9 | 1.8 | 0.4 | ||||||||
| NPL ratio | 2.43 | 0.13 | 0.10 | ||||||||
| NPL coverage | 103.8 | (2.3 | ) | (1.5 | ) | ||||||
| Number of employees | 13,859 | (4.1 | ) | (6.3 | ) | ||||||
| Number of branches | 417 | 0.2 | (3.7 | ) | |||||||
(1) Includes exchange differences.
(2) Excluding reverse repos.
(3) Excluding repos.
January - March 2020 | | 63 |
| United Kingdom | |||||||||||
| EUR million | |||||||||||
| / | Q4'19 | / | Q1'19 | ||||||||
| Underlying income statement | Q1'20 | % | % excl. FX | % | % excl. FX | ||||||
| Net interest income | 898 | (6.5 | ) | (6.4 | ) | (7.8 | ) | (9.0 | ) | ||
| Net fee income | 193 | (14.4 | ) | (14.4 | ) | (10.7 | ) | (11.8 | ) | ||
Gains (losses) on financial transactions (1) | (7 | ) | — | — | — | — | |||||
| Other operating income | 13 | (49.3 | ) | (49.8 | ) | (6.9 | ) | (8.1 | ) | ||
| Total income | 1,098 | (10.0 | ) | (9.9 | ) | (9.0 | ) | (10.1 | ) | ||
| Administrative expenses and amortisations | (714 | ) | 0.3 | 0.4 | (3.4 | ) | (4.6 | ) | |||
| Net operating income | 384 | (24.4 | ) | (24.4 | ) | (17.8 | ) | (18.8 | ) | ||
| Net loan-loss provisions | (49 | ) | (48.6 | ) | (49.0 | ) | (18.6 | ) | (19.6 | ) | |
| Other gains (losses) and provisions | (74 | ) | 12.1 | 11.4 | 49.4 | 47.5 | |||||
| Profit before tax | 260 | (24.6 | ) | (24.4 | ) | (27.0 | ) | (27.9 | ) | ||
| Tax on profit | (66 | ) | (26.1 | ) | (26.0 | ) | (31.6 | ) | (32.4 | ) | |
| Profit from continuing operations | 194 | (24.1 | ) | (23.8 | ) | (25.3 | ) | (26.3 | ) | ||
| Net profit from discontinued operations | — | — | — | — | — | ||||||
| Consolidated profit | 194 | (24.1 | ) | (23.8 | ) | (25.3 | ) | (26.3 | ) | ||
| Non-controlling interests | (6 | ) | (0.3 | ) | (0.3 | ) | 15.2 | 13.7 | |||
| Underlying attributable profit to the parent | 188 | (24.7 | ) | (24.4 | ) | (26.2 | ) | (27.1 | ) | ||
| Balance sheet | |||||||||||
| Loans and advances to customers | 267,963 | (2.0 | ) | 2.1 | 1.7 | 5.0 | |||||
| Cash, central banks and credit institutions | 37,568 | (4.4 | ) | (0.4 | ) | (0.6 | ) | 2.7 | |||
| Debt instruments | 16,943 | (16.1 | ) | (12.6 | ) | (28.6 | ) | (26.2 | ) | ||
| Other financial assets | 1,103 | 17.0 | 21.9 | 46.3 | 51.1 | ||||||
| Other asset accounts | 12,276 | 44.5 | 50.5 | 19.6 | 23.6 | ||||||
| Total assets | 335,852 | (1.9 | ) | 2.2 | (0.1 | ) | 3.2 | ||||
| Customer deposits | 216,059 | (5.8 | ) | (1.9 | ) | (0.4 | ) | 2.9 | |||
| Central banks and credit institutions | 30,219 | 20.5 | 25.6 | 19.7 | 23.7 | ||||||
| Marketable debt securities | 64,066 | (0.4 | ) | 3.7 | (5.2 | ) | (2.1 | ) | |||
| Other financial liabilities | 3,112 | 16.5 | 21.4 | (29.6 | ) | (27.3 | ) | ||||
| Other liabilities accounts | 5,071 | 15.0 | 19.8 | 10.9 | 14.6 | ||||||
| Total liabilities | 318,528 | (2.2 | ) | 1.8 | — | 3.2 | |||||
| Total equity | 17,324 | 4.3 | 8.6 | (0.6 | ) | 2.7 | |||||
| Memorandum items: | |||||||||||
Gross loans and advances to customers (2) | 243,599 | (2.3 | ) | 1.8 | 1.3 | 4.7 | |||||
| Customer funds | 210,269 | (4.0 | ) | 0.1 | 0.2 | 3.5 | |||||
Customer deposits (3) | 203,423 | (3.5 | ) | 0.6 | 0.9 | 4.3 | |||||
| Mutual funds | 6,846 | (16.7 | ) | (13.2 | ) | (17.3 | ) | (14.6 | ) | ||
| Ratios (%) and operating means | |||||||||||
| Underlying RoTE | 5.16 | (1.57 | ) | (1.75 | ) | ||||||
| Efficiency ratio | 65.0 | 6.7 | 3.8 | ||||||||
| NPL ratio | 0.96 | (0.05 | ) | (0.21 | ) | ||||||
| NPL coverage | 37.7 | 1.2 | 6.8 | ||||||||
| Number of employees | 24,500 | — | (3.9 | ) | |||||||
| Number of branches | 615 | (0.2 | ) | (18.4 | ) | ||||||
(1) Includes exchange differences.
(2) Excluding reverse repos.
(3) Excluding repos.
| 64 | | January - March 2020 |
| Portugal | |||||||
| EUR million | |||||||
| / Q4'19 | / Q1'19 | ||||||
| Underlying income statement | Q1'20 | % | % | ||||
| Net interest income | 202 | (5.2 | ) | (6.4 | ) | ||
| Net fee income | 101 | 3.4 | 3.1 | ||||
Gains (losses) on financial transactions (1) | 56 | 442.4 | 12.8 | ||||
| Other operating income | (9 | ) | — | 47.5 | |||
| Total income | 350 | 5.6 | (2.0 | ) | |||
| Administrative expenses and amortisations | (151 | ) | (3.3 | ) | (4.0 | ) | |
| Net operating income | 199 | 13.6 | (0.4 | ) | |||
| Net loan-loss provisions | (5 | ) | 31.1 | — | |||
| Other gains (losses) and provisions | (21 | ) | — | 6.0 | |||
| Profit before tax | 173 | (10.1 | ) | (10.6 | ) | ||
| Tax on profit | (53 | ) | 1.6 | (9.0 | ) | ||
| Profit from continuing operations | 120 | (14.4 | ) | (11.4 | ) | ||
| Net profit from discontinued operations | — | — | — | ||||
| Consolidated profit | 120 | (14.4 | ) | (11.4 | ) | ||
| Non-controlling interests | — | (44.1 | ) | (18.5 | ) | ||
| Underlying attributable profit to the parent | 120 | (14.3 | ) | (11.3 | ) | ||
| Balance sheet | |||||||
| Loans and advances to customers | 36,366 | 2.7 | 2.7 | ||||
| Cash, central banks and credit institutions | 5,138 | 9.9 | 22.5 | ||||
| Debt instruments | 11,346 | (9.8 | ) | (14.0 | ) | ||
| Other financial assets | 1,552 | (8.5 | ) | (15.7 | ) | ||
| Other asset accounts | 1,684 | (4.8 | ) | (14.6 | ) | ||
| Total assets | 56,086 | (0.1 | ) | (0.9 | ) | ||
| Customer deposits | 38,882 | (1.0 | ) | 1.7 | |||
| Central banks and credit institutions | 7,997 | (0.1 | ) | (1.9 | ) | ||
| Marketable debt securities | 3,337 | (1.4 | ) | (21.1 | ) | ||
| Other financial liabilities | 301 | 8.8 | 5.3 | ||||
| Other liabilities accounts | 1,666 | 9.9 | 17.5 | ||||
| Total liabilities | 52,183 | (0.5 | ) | (0.3 | ) | ||
| Total equity | 3,903 | 5.8 | (9.0 | ) | |||
| Memorandum items: | |||||||
Gross loans and advances to customers (2) | 37,286 | 2.7 | 2.2 | ||||
| Customer funds | 41,583 | (1.8 | ) | 3.3 | |||
Customer deposits (3) | 38,882 | (1.0 | ) | 1.7 | |||
| Mutual funds | 2,700 | (11.9 | ) | 35.0 | |||
| Ratios (%) and operating means | |||||||
| Underlying RoTE | 12.91 | (1.39 | ) | (0.14 | ) | ||
| Efficiency ratio | 43.1 | (4.0 | ) | (0.9 | ) | ||
| NPL ratio | 4.56 | (0.27 | ) | (1.21 | ) | ||
| NPL coverage | 54.8 | 2.0 | 4.1 | ||||
| Number of employees | 6,512 | (1.1 | ) | (3.3 | ) | ||
| Number of branches | 529 | (2.4 | ) | (5.7 | ) | ||
(1) Includes exchange differences.
(2) Excluding reverse repos.
(3) Excluding repos.
January - March 2020 | | 65 |
| Poland | |||||||||||
| EUR million | |||||||||||
| / | Q4'19 | / | Q1'19 | ||||||||
| Underlying income statement | Q1'20 | % | % excl. FX | % | % excl. FX | ||||||
| Net interest income | 296 | (3.7 | ) | (2.9 | ) | 5.3 | 5.8 | ||||
| Net fee income | 116 | (0.9 | ) | — | 2.6 | 3.1 | |||||
Gains (losses) on financial transactions (1) | 8 | (72.0 | ) | (71.8 | ) | (54.9 | ) | (54.7 | ) | ||
| Other operating income | (56 | ) | — | — | 55.5 | 56.2 | |||||
| Total income | 365 | (20.5 | ) | (19.9 | ) | (3.3 | ) | (2.8 | ) | ||
| Administrative expenses and amortisations | (172 | ) | 1.3 | 2.2 | (0.9 | ) | (0.5 | ) | |||
| Net operating income | 193 | (33.3 | ) | (32.8 | ) | (5.3 | ) | (4.8 | ) | ||
| Net loan-loss provisions | (68 | ) | 33.5 | 34.6 | 56.5 | 57.2 | |||||
| Other gains (losses) and provisions | (36 | ) | 4.8 | 5.7 | 6.8 | 7.2 | |||||
| Profit before tax | 90 | (56.3 | ) | (55.9 | ) | (29.4 | ) | (29.1 | ) | ||
| Tax on profit | (35 | ) | (33.0 | ) | (32.4 | ) | (6.7 | ) | (6.2 | ) | |
| Profit from continuing operations | 55 | (64.2 | ) | (63.9 | ) | (39.0 | ) | (38.7 | ) | ||
| Net profit from discontinued operations | — | — | — | — | — | ||||||
| Consolidated profit | 55 | (64.2 | ) | (63.9 | ) | (39.0 | ) | (38.7 | ) | ||
| Non-controlling interests | (17 | ) | (65.3 | ) | (65.0 | ) | (40.1 | ) | (39.8 | ) | |
| Underlying attributable profit to the parent | 38 | (63.7 | ) | (63.4 | ) | (38.4 | ) | (38.2 | ) | ||
| Balance sheet | |||||||||||
| Loans and advances to customers | 29,220 | (2.7 | ) | 4.0 | 2.8 | 8.8 | |||||
| Cash, central banks and credit institutions | 3,547 | 4.4 | 11.6 | 32.8 | 40.5 | ||||||
| Debt instruments | 8,574 | (7.7 | ) | (1.3 | ) | (23.9 | ) | (19.4 | ) | ||
| Other financial assets | 741 | 17.7 | 25.8 | 36.2 | 44.1 | ||||||
| Other asset accounts | 1,334 | (0.5 | ) | 6.4 | 1.9 | 7.8 | |||||
| Total assets | 43,417 | (2.8 | ) | 3.9 | (1.8 | ) | 3.9 | ||||
| Customer deposits | 31,687 | (5.4 | ) | 1.2 | (2.3 | ) | 3.4 | ||||
| Central banks and credit institutions | 2,475 | 6.8 | 14.1 | (26.1 | ) | (21.8 | ) | ||||
| Marketable debt securities | 2,360 | 8.7 | 16.2 | 31.6 | 39.2 | ||||||
| Other financial liabilities | 826 | 8.4 | 15.9 | 10.2 | 16.7 | ||||||
| Other liabilities accounts | 1,217 | 31.9 | 41.0 | 48.5 | 57.2 | ||||||
| Total liabilities | 38,565 | (2.8 | ) | 4.0 | (1.5 | ) | 4.2 | ||||
| Total equity | 4,852 | (3.5 | ) | 3.1 | (4.1 | ) | 1.5 | ||||
| Memorandum items: | |||||||||||
Gross loans and advances to customers (2) | 30,076 | (2.7 | ) | 4.0 | 2.6 | 8.5 | |||||
| Customer funds | 34,661 | (8.6 | ) | (2.3 | ) | (1.5 | ) | 4.2 | |||
Customer deposits (3) | 31,673 | (5.4 | ) | 1.1 | 1.8 | 7.7 | |||||
| Mutual funds | 2,988 | (32.8 | ) | (28.1 | ) | (26.6 | ) | (22.3 | ) | ||
| Ratios (%) and operating means | |||||||||||
| Underlying RoTE | 4.73 | (8.60 | ) | (3.03 | ) | ||||||
| Efficiency ratio | 47.1 | 10.2 | 1.1 | ||||||||
| NPL ratio | 4.29 | (0.02 | ) | (0.10 | ) | ||||||
| NPL coverage | 66.2 | (0.6 | ) | (1.4 | ) | ||||||
| Number of employees | 11,034 | (0.1 | ) | (12.1 | ) | ||||||
| Number of branches | 535 | 3.9 | (6.3 | ) | |||||||
(1) Includes exchange differences.
(2) Excluding reverse repos.
(3) Excluding repos.
| 66 | | January - March 2020 |
| Other Europe | |||||||||||
| EUR million | |||||||||||
| / | Q4'19 | / | Q1'19 | ||||||||
| Underlying income statement | Q1'20 | % | % excl. FX | % | % excl. FX | ||||||
| Net interest income | 134 | (13.2 | ) | (13.3 | ) | (3.4 | ) | (3.6 | ) | ||
| Net fee income | 74 | 17.3 | 17.3 | 20.1 | 19.0 | ||||||
Gains (losses) on financial transactions (1) | (62 | ) | — | — | — | — | |||||
| Other operating income | 55 | (18.5 | ) | (18.6 | ) | (13.1 | ) | (13.1 | ) | ||
| Total income | 202 | (29.3 | ) | (29.4 | ) | (22.5 | ) | (23.0 | ) | ||
| Administrative expenses and amortisations | (216 | ) | (1.4 | ) | (1.6 | ) | 8.3 | 7.6 | |||
| Net operating income | (14 | ) | — | — | — | — | |||||
| Net loan-loss provisions | (9 | ) | (61.9 | ) | (61.9 | ) | 294.6 | 294.8 | |||
| Other gains (losses) and provisions | (4 | ) | — | — | (33.7 | ) | (33.7 | ) | |||
| Profit before tax | (27 | ) | — | — | — | — | |||||
| Tax on profit | (1 | ) | (95.6 | ) | (95.6 | ) | (95.2 | ) | (95.2 | ) | |
| Profit from continuing operations | (28 | ) | — | — | — | — | |||||
| Net profit from discontinued operations | — | — | — | — | — | ||||||
| Consolidated profit | (28 | ) | — | — | — | — | |||||
| Non-controlling interests | — | — | — | — | — | ||||||
| Underlying attributable profit to the parent | (28 | ) | — | — | — | — | |||||
| Balance sheet | |||||||||||
| Loans and advances to customers | 61,240 | 21.3 | 20.7 | 59.2 | 58.4 | ||||||
| Cash, central banks and credit institutions | 52,765 | 13.7 | 13.8 | 5.1 | 5.0 | ||||||
| Debt instruments | 18,088 | (27.2 | ) | (27.3 | ) | (19.3 | ) | (19.5 | ) | ||
| Other financial assets | 55,945 | 13.7 | 13.7 | 13.4 | 13.3 | ||||||
| Other asset accounts | 3,207 | 64.1 | 61.1 | 14.2 | 12.7 | ||||||
| Total assets | 191,246 | 10.6 | 10.4 | 17.2 | 16.9 | ||||||
| Customer deposits | 21,378 | 17.2 | 16.8 | 5.0 | 4.7 | ||||||
| Central banks and credit institutions | 108,792 | 4.6 | 4.4 | 16.0 | 15.7 | ||||||
| Marketable debt securities | (185 | ) | — | — | — | — | |||||
| Other financial liabilities | 57,827 | 23.8 | 23.8 | 26.8 | 26.8 | ||||||
| Other liabilities accounts | 219 | (51.1 | ) | (51.3 | ) | (41.4 | ) | (41.8 | ) | ||
| Total liabilities | 188,033 | 11.0 | 10.8 | 17.4 | 17.2 | ||||||
| Total equity | 3,213 | (7.4 | ) | (8.4 | ) | 6.0 | 4.8 | ||||
| Memorandum items: | |||||||||||
Gross loans and advances to customers (2) | 46,658 | 22.7 | 22.0 | 37.8 | 37.1 | ||||||
| Customer funds | 25,585 | 8.9 | 8.7 | 8.8 | 8.5 | ||||||
Customer deposits (3) | 20,518 | 12.7 | 12.5 | 2.4 | 2.1 | ||||||
| Mutual funds | 5,067 | (4.2 | ) | (4.2 | ) | 46.0 | 46.0 | ||||
| Resources | |||||||||||
| Number of employees | 2,546 | 7.2 | 17.4 | ||||||||
(1) Includes exchange differences.
(2) Excluding reverse repos.
(3) Excluding repos.
January - March 2020 | | 67 |
| NORTH AMERICA | |||||||||||
| EUR million | |||||||||||
| / | Q4'19 | / | Q1'19 | ||||||||
| Underlying income statement | Q1'20 | % | % excl. FX | % | % excl. FX | ||||||
| Net interest income | 2,261 | (0.2 | ) | 0.5 | 4.0 | 2.2 | |||||
| Net fee income | 461 | 7.9 | 9.1 | 5.0 | 3.5 | ||||||
Gains (losses) on financial transactions (1) | 68 | (17.6 | ) | (16.8 | ) | 464.1 | 441.9 | ||||
| Other operating income | 146 | (16.1 | ) | (16.5 | ) | 12.7 | 8.6 | ||||
| Total income | 2,936 | (0.4 | ) | 0.2 | 6.6 | 4.7 | |||||
| Administrative expenses and amortisations | (1,224 | ) | (6.9 | ) | (6.4 | ) | 4.4 | 2.5 | |||
| Net operating income | 1,712 | 4.7 | 5.6 | 8.3 | 6.3 | ||||||
| Net loan-loss provisions | (874 | ) | (16.8 | ) | (16.7 | ) | 8.6 | 6.3 | |||
| Other gains (losses) and provisions | (14 | ) | (55.4 | ) | (55.5 | ) | (78.3 | ) | (78.8 | ) | |
| Profit before tax | 824 | 48.9 | 52.2 | 15.6 | 14.0 | ||||||
| Tax on profit | (211 | ) | 60.2 | 63.5 | 12.7 | 10.9 | |||||
| Profit from continuing operations | 613 | 45.4 | 48.7 | 16.6 | 15.2 | ||||||
| Net profit from discontinued operations | — | — | — | — | — | ||||||
| Consolidated profit | 613 | 45.4 | 48.7 | 16.6 | 15.2 | ||||||
| Non-controlling interests | (91 | ) | 177.9 | 192.6 | (34.8 | ) | (35.7 | ) | |||
| Underlying attributable profit to the parent | 522 | 34.2 | 37.0 | 35.1 | 33.5 | ||||||
| Balance sheet | |||||||||||
| Loans and advances to customers | 135,826 | 1.6 | 4.8 | 9.2 | 12.2 | ||||||
| Cash, central banks and credit institutions | 33,173 | 45.0 | 55.7 | 1.4 | 8.2 | ||||||
| Debt instruments | 30,262 | (10.3 | ) | (2.2 | ) | 23.1 | 31.5 | ||||
| Other financial assets | 18,150 | 68.7 | 88.1 | 114.4 | 135.4 | ||||||
| Other asset accounts | 23,183 | 1.9 | 3.1 | 14.7 | 15.4 | ||||||
| Total assets | 240,593 | 7.5 | 12.4 | 14.4 | 18.8 | ||||||
| Customer deposits | 117,771 | 19.1 | 25.6 | 17.1 | 22.6 | ||||||
| Central banks and credit institutions | 31,082 | (20.2 | ) | (15.9 | ) | 33.0 | 41.7 | ||||
| Marketable debt securities | 42,024 | (4.7 | ) | (3.9 | ) | (10.0 | ) | (10.0 | ) | ||
| Other financial liabilities | 19,555 | 66.2 | 87.6 | 79.3 | 100.5 | ||||||
| Other liabilities accounts | 6,652 | 6.7 | 12.1 | 18.1 | 23.4 | ||||||
| Total liabilities | 217,084 | 8.6 | 13.8 | 16.0 | 20.7 | ||||||
| Total equity | 23,509 | (1.6 | ) | 1.6 | 1.1 | 3.8 | |||||
| Memorandum items: | |||||||||||
Gross loans and advances to customers (2) | 131,913 | 1.0 | 4.3 | 9.4 | 12.5 | ||||||
| Customer funds | 119,985 | 5.8 | 11.6 | 9.5 | 15.2 | ||||||
Customer deposits (3) | 101,389 | 9.9 | 14.9 | 13.6 | 18.5 | ||||||
| Mutual funds | 18,596 | (12.2 | ) | (3.7 | ) | (8.4 | ) | (0.1 | ) | ||
| Ratios (%) and operating means | |||||||||||
| Underlying RoTE | 9.92 | 2.52 | 1.47 | ||||||||
| Efficiency ratio | 41.7 | (2.9 | ) | (0.9 | ) | ||||||
| NPL ratio | 2.02 | (0.18 | ) | (0.31 | ) | ||||||
| NPL coverage | 157.6 | 4.6 | 4.2 | ||||||||
| Number of employees | 37,398 | (1.2 | ) | 0.7 | |||||||
| Number of branches | 2,048 | 0.2 | (1.1 | ) | |||||||
(1) Includes exchange differences.
(2) Excluding reverse repos.
(3) Excluding repos.
| 68 | | January - March 2020 |
| United States | |||||||||||
| EUR million | |||||||||||
| / | Q4'19 | / | Q1'19 | ||||||||
| Underlying income statement | Q1'20 | % | % excl. FX | % | % excl. FX | ||||||
| Net interest income | 1,462 | 0.9 | 0.5 | 3.9 | 0.9 | ||||||
| Net fee income | 250 | 8.5 | 8.1 | 6.6 | 3.5 | ||||||
Gains (losses) on financial transactions (1) | 46 | 39.0 | 38.4 | 193.1 | 184.5 | ||||||
| Other operating income | 170 | (6.2 | ) | (6.5 | ) | 8.1 | 4.9 | ||||
| Total income | 1,929 | 1.8 | 1.4 | 6.3 | 3.2 | ||||||
| Administrative expenses and amortisations | (809 | ) | (6.9 | ) | (7.4 | ) | 4.3 | 1.3 | |||
| Net operating income | 1,120 | 9.2 | 8.9 | 7.8 | 4.6 | ||||||
| Net loan-loss provisions | (646 | ) | (22.0 | ) | (22.5 | ) | 5.7 | 2.6 | |||
| Other gains (losses) and provisions | (6 | ) | (84.0 | ) | (84.0 | ) | (89.3 | ) | (89.6 | ) | |
| Profit before tax | 468 | 195.6 | 199.4 | 26.4 | 22.7 | ||||||
| Tax on profit | (124 | ) | 149.4 | 151.7 | 12.0 | 8.7 | |||||
| Profit from continuing operations | 344 | 216.7 | 221.2 | 32.6 | 28.7 | ||||||
| Net profit from discontinued operations | — | — | — | — | — | ||||||
| Consolidated profit | 344 | 216.7 | 221.2 | 32.6 | 28.7 | ||||||
| Non-controlling interests | (71 | ) | 571.4 | 617.0 | (9.2 | ) | (11.8 | ) | |||
| Underlying attributable profit to the parent | 273 | 178.5 | 180.9 | 50.6 | 46.1 | ||||||
| Balance sheet | |||||||||||
| Loans and advances to customers | 104,889 | 6.3 | 3.6 | 14.9 | 12.0 | ||||||
| Cash, central banks and credit institutions | 19,765 | 54.1 | 50.3 | 9.4 | 6.7 | ||||||
| Debt instruments | 15,959 | (4.3 | ) | (6.7 | ) | 18.8 | 15.9 | ||||
| Other financial assets | 7,249 | 67.8 | 63.7 | 104.4 | 99.3 | ||||||
| Other asset accounts | 19,897 | 5.4 | 2.8 | 17.4 | 14.5 | ||||||
| Total assets | 167,759 | 10.8 | 8.1 | 17.1 | 14.1 | ||||||
| Customer deposits | 83,705 | 32.1 | 28.8 | 29.1 | 25.9 | ||||||
| Central banks and credit institutions | 18,220 | (27.5 | ) | (29.3 | ) | 39.7 | 36.2 | ||||
| Marketable debt securities | 36,086 | (2.8 | ) | (5.2 | ) | (11.6 | ) | (13.8 | ) | ||
| Other financial liabilities | 7,402 | 78.5 | 74.1 | 103.2 | 98.1 | ||||||
| Other liabilities accounts | 4,254 | 3.9 | 1.4 | 15.3 | 12.5 | ||||||
| Total liabilities | 149,668 | 11.8 | 9.0 | 18.7 | 15.8 | ||||||
| Total equity | 18,091 | 3.1 | 0.5 | 4.8 | 2.2 | ||||||
| Memorandum items: | |||||||||||
Gross loans and advances to customers (2) | 101,146 | 5.6 | 3.0 | 15.3 | 12.4 | ||||||
| Customer funds | 82,155 | 13.2 | 10.4 | 20.9 | 17.9 | ||||||
Customer deposits (3) | 72,884 | 16.4 | 13.5 | 23.8 | 20.7 | ||||||
| Mutual funds | 9,271 | (7.3) | (9.5) | 1.9 | (0.6) | ||||||
| Ratios (%) and operating means | |||||||||||
| Underlying RoTE | 6.98 | 4.49 | 1.91 | ||||||||
| Efficiency ratio | 41.9 | (3.9 | ) | (0.8 | ) | ||||||
| NPL ratio | 2.00 | (0.20 | ) | (0.41 | ) | ||||||
| NPL coverage | 166.8 | 5.0 | 5.8 | ||||||||
| Number of employees | 17,277 | (0.5 | ) | — | |||||||
| Number of branches | 619 | (0.3 | ) | (6.1 | ) | ||||||
(1) Includes exchange differences.
(2) Excluding reverse repos.
(3) Excluding repos.
January - March 2020 | | 69 |
| Mexico | |||||||||||
| EUR million | |||||||||||
| / | Q4'19 | / | Q1'19 | ||||||||
| Underlying income statement | Q1'20 | % | % excl. FX | % | % excl. FX | ||||||
| Net interest income | 798 | (2.1 | ) | 0.5 | 4.2 | 4.7 | |||||
| Net fee income | 211 | 7.2 | 10.2 | 3.2 | 3.6 | ||||||
Gains (losses) on financial transactions (1) | 22 | (56.0 | ) | (55.2 | ) | — | — | ||||
| Other operating income | (24 | ) | 229.8 | 249.0 | (13.6 | ) | (13.2 | ) | |||
| Total income | 1,007 | (4.5 | ) | (1.9 | ) | 7.2 | 7.7 | ||||
| Administrative expenses and amortisations | (415 | ) | (6.8 | ) | (4.3 | ) | 4.6 | 5.0 | |||
| Net operating income | 592 | (2.8 | ) | (0.2 | ) | 9.2 | 9.7 | ||||
| Net loan-loss provisions | (228 | ) | 2.7 | 5.5 | 17.9 | 18.4 | |||||
| Other gains (losses) and provisions | (8 | ) | — | — | 38.0 | 38.6 | |||||
| Profit before tax | 357 | (9.8 | ) | (7.4 | ) | 3.9 | 4.3 | ||||
| Tax on profit | (88 | ) | 6.5 | 9.4 | 13.7 | 14.2 | |||||
| Profit from continuing operations | 269 | (14.1 | ) | (11.8 | ) | 1.1 | 1.5 | ||||
| Net profit from discontinued operations | — | — | — | — | — | ||||||
| Consolidated profit | 269 | (14.1 | ) | (11.8 | ) | 1.1 | 1.5 | ||||
| Non-controlling interests | (20 | ) | (10.2 | ) | (6.1 | ) | (67.5 | ) | (67.3 | ) | |
| Underlying attributable profit to the parent | 249 | (14.4 | ) | (12.3 | ) | 21.5 | 22.0 | ||||
| Balance sheet | |||||||||||
| Loans and advances to customers | 30,937 | (11.7 | ) | 9.0 | (6.4 | ) | 12.9 | ||||
| Cash, central banks and credit institutions | 13,408 | 33.3 | 64.5 | (8.5 | ) | 10.4 | |||||
| Debt instruments | 14,303 | (16.2 | ) | 3.4 | 28.3 | 54.9 | |||||
| Other financial assets | 10,901 | 69.3 | 108.8 | 121.7 | 167.5 | ||||||
| Other asset accounts | 3,286 | (14.8 | ) | 5.1 | 0.6 | 21.4 | |||||
| Total assets | 72,834 | 0.5 | 24.0 | 8.6 | 31.1 | ||||||
| Customer deposits | 34,066 | (4.2 | ) | 18.2 | (4.5 | ) | 15.2 | ||||
| Central banks and credit institutions | 12,862 | (6.9 | ) | 14.8 | 24.5 | 50.3 | |||||
| Marketable debt securities | 5,938 | (14.7 | ) | 5.2 | 1.8 | 22.8 | |||||
| Other financial liabilities | 12,152 | 59.5 | 96.8 | 67.3 | 101.9 | ||||||
| Other liabilities accounts | 2,398 | 11.8 | 38.0 | 23.5 | 49.0 | ||||||
| Total liabilities | 67,416 | 2.0 | 25.8 | 10.4 | 33.3 | ||||||
| Total equity | 5,418 | (14.7 | ) | 5.2 | (9.4 | ) | 9.3 | ||||
| Memorandum items: | |||||||||||
Gross loans and advances to customers (2) | 30,768 | (11.7 | ) | 8.9 | (6.4 | ) | 13.0 | ||||
| Customer funds | 37,830 | (7.3 | ) | 14.4 | (9.1 | ) | 9.7 | ||||
Customer deposits (3) | 28,505 | (3.8 | ) | 18.7 | (6.3 | ) | 13.1 | ||||
| Mutual funds | 9,325 | (16.6 | ) | 2.9 | (16.8 | ) | 0.4 | ||||
| Ratios (%) and operating means | |||||||||||
| Underlying RoTE | 17.96 | (3.13 | ) | (2.15 | ) | ||||||
| Efficiency ratio | 41.2 | (1.0 | ) | (1.1 | ) | ||||||
| NPL ratio | 2.07 | (0.12 | ) | (0.05 | ) | ||||||
| NPL coverage | 128.4 | 0.1 | (1.7 | ) | |||||||
| Number of employees | 20,121 | (1.8 | ) | 1.3 | |||||||
| Number of branches | 1,429 | 0.5 | 1.2 | ||||||||
(1) Includes exchange differences.
(2) Excluding reverse repos.
(3) Excluding repos.
| 70 | | January - March 2020 |
| SOUTH AMERICA | |||||||||||
| EUR million | |||||||||||
| / | Q4'19 | / | Q1'19 | ||||||||
| Underlying income statement | Q1'20 | % | % excl. FX | % | % excl. FX | ||||||
| Net interest income | 3,065 | (8.7 | ) | (3.7 | ) | (4.9 | ) | 10.8 | |||
| Net fee income | 1,074 | (12.6 | ) | (8.1 | ) | (8.8 | ) | 6.8 | |||
Gains (losses) on financial transactions (1) | 68 | (46.1 | ) | (44.8 | ) | (57.5 | ) | (48.4 | ) | ||
| Other operating income | (43 | ) | — | 559.4 | (40.1 | ) | (22.9 | ) | |||
| Total income | 4,163 | (11.7 | ) | (6.8 | ) | (7.2 | ) | 8.2 | |||
| Administrative expenses and amortisations | (1,486 | ) | (15.6 | ) | (11.6 | ) | (9.7 | ) | 6.6 | ||
| Net operating income | 2,677 | (9.3 | ) | (3.8 | ) | (5.8 | ) | 9.1 | |||
| Net loan-loss provisions | (875 | ) | (13.8 | ) | (8.4 | ) | (3.1 | ) | 13.1 | ||
| Other gains (losses) and provisions | (142 | ) | (43.2 | ) | (39.7 | ) | (8.1 | ) | 8.2 | ||
| Profit before tax | 1,661 | (1.6 | ) | 4.2 | (7.0 | ) | 7.1 | ||||
| Tax on profit | (603 | ) | 3.7 | 9.7 | (12.8 | ) | 0.6 | ||||
| Profit from continuing operations | 1,057 | (4.4 | ) | 1.3 | (3.2 | ) | 11.3 | ||||
| Net profit from discontinued operations | — | — | — | — | — | ||||||
| Consolidated profit | 1,057 | (4.4 | ) | 1.3 | (3.2 | ) | 11.3 | ||||
| Non-controlling interests | (130 | ) | (18.6 | ) | (13.1 | ) | (22.4 | ) | (10.4 | ) | |
| Underlying attributable profit to the parent | 928 | (2.1 | ) | 3.8 | 0.2 | 15.2 | |||||
| Balance sheet | |||||||||||
| Loans and advances to customers | 113,261 | (9.5 | ) | 7.9 | (8.2 | ) | 16.9 | ||||
| Cash, central banks and credit institutions | 45,888 | (10.7 | ) | 8.2 | 3.3 | 34.4 | |||||
| Debt instruments | 44,696 | (2.0 | ) | 21.4 | (2.8 | ) | 25.7 | ||||
| Other financial assets | 19,260 | 30.1 | 52.4 | 114.9 | 173.6 | ||||||
| Other asset accounts | 17,137 | 1.4 | 23.0 | 8.8 | 40.3 | ||||||
| Total assets | 240,240 | (5.3 | ) | 14.0 | 0.8 | 29.3 | |||||
| Customer deposits | 106,432 | (7.3 | ) | 11.2 | (4.5 | ) | 22.7 | ||||
| Central banks and credit institutions | 45,699 | 8.8 | 31.7 | 17.8 | 50.5 | ||||||
| Marketable debt securities | 26,951 | (9.7 | ) | 8.3 | (13.1 | ) | 10.6 | ||||
| Other financial liabilities | 33,522 | (1.6 | ) | 18.9 | 29.4 | 67.2 | |||||
| Other liabilities accounts | 8,529 | (19.6 | ) | (1.4 | ) | (4.2 | ) | 23.8 | |||
| Total liabilities | 221,134 | (4.4 | ) | 15.1 | 2.3 | 31.3 | |||||
| Total equity | 19,106 | (15.0 | ) | 2.7 | (14.4 | ) | 9.7 | ||||
| Memorandum items: | |||||||||||
Gross loans and advances to customers (2) | 117,614 | (10.3 | ) | 7.1 | (8.9 | ) | 16.1 | ||||
| Customer funds | 148,102 | (13.2 | ) | 5.0 | (9.7 | ) | 16.3 | ||||
Customer deposits (3) | 95,933 | (5.6 | ) | 12.6 | (3.6 | ) | 23.8 | ||||
| Mutual funds | 52,169 | (24.5 | ) | (6.6 | ) | (19.1 | ) | 4.6 | |||
| Ratios (%) and operating means | |||||||||||
| Underlying RoTE | 21.12 | 1.36 | 1.54 | ||||||||
| Efficiency ratio | 35.7 | (1.7 | ) | (1.0 | ) | ||||||
| NPL ratio | 4.63 | (0.23 | ) | (0.20 | ) | ||||||
| NPL coverage | 86.3 | (2.1 | ) | (7.8 | ) | ||||||
| Number of employees | 68,624 | (1.3 | ) | (1.9 | ) | ||||||
| Number of branches | 4,524 | (1.0 | ) | 0.3 | |||||||
(1) Includes exchange differences.
(2) Excluding reverse repos.
(3) Excluding repos.
January - March 2020 | | 71 |
| Brazil | |||||||||||
| EUR million | |||||||||||
| / | Q4'19 | / | Q1'19 | ||||||||
| Underlying income statement | Q1'20 | % | % excl. FX | % | % excl. FX | ||||||
| Net interest income | 2,270 | (10.4 | ) | (3.8 | ) | (7.7 | ) | 5.6 | |||
| Net fee income | 869 | (10.7 | ) | (4.0 | ) | (6.6 | ) | 6.8 | |||
Gains (losses) on financial transactions (1) | 14 | (45.7 | ) | (43.2 | ) | (76.0 | ) | (72.6 | ) | ||
| Other operating income | (17 | ) | — | — | (54.3 | ) | (47.7 | ) | |||
| Total income | 3,137 | (12.0 | ) | (5.4 | ) | (8.0 | ) | 5.1 | |||
| Administrative expenses and amortisations | (1,004 | ) | (19.2 | ) | (12.9 | ) | (10.8 | ) | 2.0 | ||
| Net operating income | 2,133 | (8.2 | ) | (1.4 | ) | (6.7 | ) | 6.7 | |||
| Net loan-loss provisions | (709 | ) | (12.8 | ) | (6.1 | ) | (0.2 | ) | 14.1 | ||
| Other gains (losses) and provisions | (127 | ) | (38.1 | ) | (33.2 | ) | (24.2 | ) | (13.3 | ) | |
| Profit before tax | 1,298 | (0.6 | ) | 6.4 | (7.9 | ) | 5.3 | ||||
| Tax on profit | (529 | ) | 0.1 | 7.1 | (10.6 | ) | 2.2 | ||||
| Profit from continuing operations | 768 | (1.1 | ) | 5.9 | (5.9 | ) | 7.6 | ||||
| Net profit from discontinued operations | — | — | — | — | — | ||||||
| Consolidated profit | 768 | (1.1 | ) | 5.9 | (5.9 | ) | 7.6 | ||||
| Non-controlling interests | (74 | ) | (14.8 | ) | (8.8 | ) | (22.3 | ) | (11.2 | ) | |
| Underlying attributable profit to the parent | 694 | 0.7 | 7.8 | (3.7 | ) | 10.1 | |||||
| Balance sheet | |||||||||||
| Loans and advances to customers | 65,970 | (12.8 | ) | 10.1 | (8.0 | ) | 19.5 | ||||
| Cash, central banks and credit institutions | 30,070 | (19.7 | ) | 1.3 | (9.8 | ) | 17.2 | ||||
| Debt instruments | 37,932 | (4.2 | ) | 20.9 | (7.6 | ) | 20.1 | ||||
| Other financial assets | 5,885 | (13.3 | ) | 9.4 | 3.8 | 34.8 | |||||
| Other asset accounts | 12,410 | (1.1 | ) | 24.9 | 4.7 | 36.0 | |||||
| Total assets | 152,267 | (11.5 | ) | 11.7 | (6.9 | ) | 20.9 | ||||
| Customer deposits | 64,578 | (13.6 | ) | 9.1 | (8.1 | ) | 19.4 | ||||
| Central banks and credit institutions | 32,941 | 8.6 | 37.1 | 11.0 | 44.3 | ||||||
| Marketable debt securities | 16,278 | (14.1 | ) | 8.4 | (18.6 | ) | 5.8 | ||||
| Other financial liabilities | 19,126 | (18.9 | ) | 2.3 | (10.1 | ) | 16.8 | ||||
| Other liabilities accounts | 6,654 | (22.9 | ) | (2.7 | ) | (8.0 | ) | 19.6 | |||
| Total liabilities | 139,577 | (10.7 | ) | 12.8 | (6.0 | ) | 22.2 | ||||
| Total equity | 12,689 | (19.6 | ) | 1.5 | (16.5 | ) | 8.5 | ||||
| Memorandum items: | |||||||||||
Gross loans and advances to customers (2) | 69,041 | (13.9 | ) | 8.7 | (9.6 | ) | 17.5 | ||||
| Customer funds | 98,212 | (19.3 | ) | 1.8 | (13.7 | ) | 12.2 | ||||
Customer deposits (3) | 54,244 | (12.2 | ) | 10.8 | (7.1 | ) | 20.8 | ||||
| Mutual funds | 43,969 | (26.7 | ) | (7.4 | ) | (20.6 | ) | 3.1 | |||
| Ratios (%) and operating means | |||||||||||
| Underlying RoTE | 22.04 | 2.29 | 1.06 | ||||||||
| Efficiency ratio | 32.0 | (2.8 | ) | (1.0 | ) | ||||||
| NPL ratio | 4.93 | (0.39 | ) | (0.33 | ) | ||||||
| NPL coverage | 99.9 | 0.1 | (7.8 | ) | |||||||
| Number of employees | 45,807 | (1.9 | ) | (2.1 | ) | ||||||
| Number of branches | 3,617 | (1.1 | ) | 1.5 | |||||||
(1) Includes exchange differences.
(2) Excluding reverse repos.
(3) Excluding repos.
| 72 | | January - March 2020 |
| Chile | |||||||||||
| EUR million | |||||||||||
| / | Q4'19 | / | Q1'19 | ||||||||
| Underlying income statement | Q1'20 | % | % excl. FX | % | % excl. FX | ||||||
| Net interest income | 448 | (3.5 | ) | 2.8 | 1.8 | 19.1 | |||||
| Net fee income | 92 | (9.9 | ) | (3.9 | ) | (10.4 | ) | 4.8 | |||
Gains (losses) on financial transactions (1) | 13 | (81.5 | ) | (80.2 | ) | (75.5 | ) | (71.3 | ) | ||
| Other operating income | (1 | ) | 2.8 | 23.6 | — | — | |||||
| Total income | 553 | (13.4 | ) | (7.7 | ) | (7.8 | ) | 7.8 | |||
| Administrative expenses and amortisations | (230 | ) | (6.5 | ) | (0.7 | ) | (9.8 | ) | 5.6 | ||
| Net operating income | 322 | (17.8 | ) | (12.1 | ) | (6.4 | ) | 9.5 | |||
| Net loan-loss provisions | (107 | ) | (17.6 | ) | (11.2 | ) | 4.2 | 21.9 | |||
| Other gains (losses) and provisions | 1 | (93.0 | ) | (92.7 | ) | (97.8 | ) | (97.4 | ) | ||
| Profit before tax | 216 | (21.1 | ) | (16.1 | ) | (22.6 | ) | (9.4 | ) | ||
| Tax on profit | (37 | ) | (19.2 | ) | (14.8 | ) | (39.2 | ) | (28.8 | ) | |
| Profit from continuing operations | 180 | (21.5 | ) | (16.4 | ) | (18.0 | ) | (4.1 | ) | ||
| Net profit from discontinued operations | — | — | — | — | — | ||||||
| Consolidated profit | 180 | (21.5 | ) | (16.4 | ) | (18.0 | ) | (4.1 | ) | ||
| Non-controlling interests | (55 | ) | (23.6 | ) | (18.6 | ) | (22.5 | ) | (9.3 | ) | |
| Underlying attributable profit to the parent | 125 | (20.6 | ) | (15.4 | ) | (15.9 | ) | (1.6 | ) | ||
| Balance sheet | |||||||||||
| Loans and advances to customers | 36,595 | (5.2 | ) | 4.8 | (7.7 | ) | 12.8 | ||||
| Cash, central banks and credit institutions | 9,322 | 23.4 | 36.3 | 132.7 | 184.6 | ||||||
| Debt instruments | 3,850 | (24.0 | ) | (16.0 | ) | 1.8 | 24.5 | ||||
| Other financial assets | 13,176 | 67.7 | 85.4 | 316.2 | 408.8 | ||||||
| Other asset accounts | 3,429 | 10.9 | 22.6 | 17.9 | 44.2 | ||||||
| Total assets | 66,372 | 6.8 | 18.0 | 24.0 | 51.6 | ||||||
| Customer deposits | 27,205 | (0.5 | ) | 10.0 | 1.7 | 24.4 | |||||
| Central banks and credit institutions | 9,243 | 12.4 | 24.2 | 54.5 | 88.9 | ||||||
| Marketable debt securities | 10,475 | (2.3 | ) | 8.0 | (2.1 | ) | 19.7 | ||||
| Other financial liabilities | 13,661 | 41.4 | 56.3 | 266.2 | 347.8 | ||||||
| Other liabilities accounts | 1,202 | (7.1 | ) | 2.7 | 13.4 | 38.7 | |||||
| Total liabilities | 61,786 | 7.9 | 19.3 | 28.1 | 56.7 | ||||||
| Total equity | 4,587 | (6.5 | ) | 3.3 | (13.4 | ) | 5.9 | ||||
| Memorandum items: | |||||||||||
Gross loans and advances to customers (2) | 37,550 | (5.3 | ) | 4.7 | (8.0 | ) | 12.5 | ||||
| Customer funds | 33,939 | (3.3 | ) | 6.9 | (0.7 | ) | 21.5 | ||||
Customer deposits (3) | 27,041 | (0.1 | ) | 10.4 | 1.3 | 23.9 | |||||
| Mutual funds | 6,898 | (14.1 | ) | (5.1 | ) | (7.8 | ) | 12.7 | |||
| Ratios (%) and operating means | |||||||||||
| Underlying RoTE | 15.15 | (3.41 | ) | (1.20 | ) | ||||||
| Efficiency ratio | 41.7 | 3.1 | (0.9 | ) | |||||||
| NPL ratio | 4.63 | (0.01 | ) | (0.04 | ) | ||||||
| NPL coverage | 54.3 | (1.7 | ) | (5.4 | ) | ||||||
| Number of employees | 11,437 | (1.2 | ) | (3.8 | ) | ||||||
| Number of branches | 366 | (2.4 | ) | (3.7 | ) | ||||||
(1) Includes exchange differences.
(2) Excluding reverse repos.
(3) Excluding repos.
January - March 2020 | | 73 |
| Argentina | |||||||||||
| EUR million | |||||||||||
| / | Q4'19 | / | Q1'19 | ||||||||
| Underlying income statement | Q1'20 | % | % excl. FX | % | % excl. FX | ||||||
| Net interest income | 241 | (3.5 | ) | (14.7 | ) | 13.0 | 68.0 | ||||
| Net fee income | 76 | (35.8 | ) | (43.3 | ) | (34.7 | ) | (2.9 | ) | ||
Gains (losses) on financial transactions (1) | 23 | 45.7 | 19.8 | (38.4 | ) | (8.5 | ) | ||||
| Other operating income | (22 | ) | (10.1 | ) | (30.2 | ) | (38.3 | ) | (8.2 | ) | |
| Total income | 318 | (11.5 | ) | (21.3 | ) | (4.0 | ) | 42.7 | |||
| Administrative expenses and amortisations | (186 | ) | (11.2 | ) | (20.9 | ) | (8.1 | ) | 36.5 | ||
| Net operating income | 132 | (11.9 | ) | (21.9 | ) | 2.5 | 52.3 | ||||
| Net loan-loss provisions | (39 | ) | (26.0 | ) | (37.0 | ) | (45.9 | ) | (19.6 | ) | |
| Other gains (losses) and provisions | (14 | ) | (74.9 | ) | (75.1 | ) | (39.9 | ) | (10.7 | ) | |
| Profit before tax | 79 | 84.5 | 51.7 | 135.4 | 249.8 | ||||||
| Tax on profit | (20 | ) | — | — | (13.9 | ) | 28.0 | ||||
| Profit from continuing operations | 59 | 24.6 | 14.7 | 464.8 | 739.5 | ||||||
| Net profit from discontinued operations | — | — | — | — | — | ||||||
| Consolidated profit | 59 | 24.6 | 14.7 | 464.8 | 739.5 | ||||||
| Non-controlling interests | — | (12.5 | ) | (21.9 | ) | 185.0 | 323.7 | ||||
| Underlying attributable profit to the parent | 59 | 24.9 | 15.1 | 468.6 | 745.1 | ||||||
| Balance sheet | |||||||||||
| Loans and advances to customers | 4,521 | (5.7 | ) | (1.0 | ) | (25.6 | ) | 7.9 | |||
| Cash, central banks and credit institutions | 3,395 | (13.2 | ) | (9.0 | ) | (29.5 | ) | 2.1 | |||
| Debt instruments | 2,226 | 419.3 | 444.7 | 420.4 | 654.5 | ||||||
| Other financial assets | 77 | (11.9 | ) | (7.6 | ) | (32.6 | ) | (2.3 | ) | ||
| Other asset accounts | 824 | (1.5 | ) | 3.4 | 1.7 | 47.4 | |||||
| Total assets | 11,042 | 9.8 | 15.2 | (9.8 | ) | 30.8 | |||||
| Customer deposits | 8,305 | 18.6 | 24.4 | (5.8 | ) | 36.6 | |||||
| Central banks and credit institutions | 686 | (33.5 | ) | (30.3 | ) | (28.8 | ) | 3.2 | |||
| Marketable debt securities | 87 | 22.7 | 28.7 | (64.8 | ) | (48.9 | ) | ||||
| Other financial liabilities | 631 | (15.4 | ) | (11.3 | ) | (25.9 | ) | 7.4 | |||
| Other liabilities accounts | 388 | (1.2 | ) | 3.7 | (1.9 | ) | 42.2 | ||||
| Total liabilities | 10,097 | 9.2 | 14.6 | (10.4 | ) | 29.8 | |||||
| Total equity | 945 | 16.6 | 22.3 | (2.5 | ) | 41.3 | |||||
| Memorandum items: | |||||||||||
Gross loans and advances to customers (2) | 4,724 | (5.4 | ) | (0.8 | ) | (20.0 | ) | 15.9 | |||
| Customer funds | 9,569 | 18.2 | 23.9 | (7.9 | ) | 33.6 | |||||
Customer deposits (3) | 8,305 | 18.6 | 24.4 | (5.8 | ) | 36.6 | |||||
| Mutual funds | 1,264 | 15.3 | 20.9 | (19.4 | ) | 16.9 | |||||
| Ratios (%) and operating means | |||||||||||
| Underlying RoTE | 30.06 | (1.61 | ) | 24.98 | |||||||
| Efficiency ratio | 58.5 | 0.2 | (2.6 | ) | |||||||
| NPL ratio | 3.97 | 0.58 | 0.47 | ||||||||
| NPL coverage | 112.5 | (11.5 | ) | (6.1 | ) | ||||||
| Number of employees | 9,290 | 1.2 | 0.2 | ||||||||
| Number of branches | 438 | — | (6.4 | ) | |||||||
(1) Includes exchange differences.
(2) Excluding reverse repos.
(3) Excluding repos.
| 74 | | January - March 2020 |
| Other South America | |||||||||||
| EUR million | |||||||||||
| / | Q4'19 | / | Q1'19 | ||||||||
| Underlying income statement | Q1'20 | % | % excl. FX | % | % excl. FX | ||||||
| Net interest income | 106 | (2.2 | ) | 1.4 | (3.1 | ) | 9.4 | ||||
| Net fee income | 37 | 6.8 | 10.9 | 28.1 | 44.7 | ||||||
Gains (losses) on financial transactions (1) | 18 | 44.1 | 47.3 | 72.2 | 89.5 | ||||||
| Other operating income | (4 | ) | 63.7 | 69.7 | 60.0 | 84.2 | |||||
| Total income | 157 | 2.6 | 6.3 | 7.3 | 20.9 | ||||||
| Administrative expenses and amortisations | (66 | ) | 2.6 | 6.2 | 5.0 | 18.7 | |||||
| Net operating income | 91 | 2.6 | 6.3 | 9.1 | 22.6 | ||||||
| Net loan-loss provisions | (21 | ) | 3.9 | 10.3 | 14.2 | 28.9 | |||||
| Other gains (losses) and provisions | (2 | ) | (15.7 | ) | (10.0 | ) | 27.6 | 48.4 | |||
| Profit before tax | 68 | 2.9 | 5.7 | 7.2 | 20.2 | ||||||
| Tax on profit | (17 | ) | 41.1 | 40.9 | 6.5 | 18.5 | |||||
| Profit from continuing operations | 51 | (5.9 | ) | (2.6 | ) | 7.5 | 20.8 | ||||
| Net profit from discontinued operations | — | — | — | — | — | ||||||
| Consolidated profit | 51 | (5.9 | ) | (2.6 | ) | 7.5 | 20.8 | ||||
| Non-controlling interests | — | (100.0 | ) | (100.0 | ) | — | — | ||||
| Underlying attributable profit to the parent | 51 | (6.3 | ) | (3.1 | ) | 8.4 | 22.0 | ||||
| Balance sheet | |||||||||||
| Loans and advances to customers | 6,175 | 0.8 | 11.0 | 5.4 | 22.6 | ||||||
| Cash, central banks and credit institutions | 3,101 | 28.0 | 43.5 | 36.6 | 64.6 | ||||||
| Debt instruments | 688 | 33.1 | 51.9 | (6.5 | ) | 15.6 | |||||
| Other financial assets | 122 | 74.9 | 78.0 | — | — | ||||||
| Other asset accounts | 474 | 10.5 | 16.9 | 162.9 | 216.3 | ||||||
| Total assets | 10,560 | 10.4 | 22.1 | 16.6 | 37.6 | ||||||
| Customer deposits | 6,344 | 10.8 | 24.5 | 11.8 | 35.2 | ||||||
| Central banks and credit institutions | 2,829 | 17.9 | 25.9 | 29.1 | 43.0 | ||||||
| Marketable debt securities | 112 | 17.5 | 18.9 | 87.9 | 89.7 | ||||||
| Other financial liabilities | 104 | 60.9 | 77.6 | 117.5 | 169.9 | ||||||
| Other liabilities accounts | 286 | (3.6 | ) | 7.3 | 28.7 | 54.2 | |||||
| Total liabilities | 9,674 | 12.8 | 24.6 | 18.0 | 39.1 | ||||||
| Total equity | 886 | (10.1 | ) | (0.5 | ) | 3.0 | 23.0 | ||||
| Memorandum items: | |||||||||||
Gross loans and advances to customers (2) | 6,299 | 0.6 | 10.8 | 5.0 | 22.2 | ||||||
| Customer funds | 6,382 | 10.8 | 24.5 | 11.8 | 35.2 | ||||||
Customer deposits (3) | 6,344 | 10.8 | 24.5 | 11.8 | 35.2 | ||||||
| Mutual funds | 38 | 5.5 | 20.6 | 14.3 | 45.5 | ||||||
| Resources | �� | ||||||||||
| Number of employees | 2,090 | 1.1 | 3.4 | ||||||||
(1) Includes exchange differences.
(2) Excluding reverse repos.
(3) Excluding repos.
January - March 2020 | | 75 |
| SANTANDER GLOBAL PLATFORM (primary segment) | |||||||||||
| EUR million | |||||||||||
| Underlying income statement | Q1'20 | Q4'19 | % | Q1'19 | % | ||||||
| Net interest income | 31 | 23 | 36.2 | 22 | 38.3 | ||||||
| Net fee income | 13 | 2 | 548.5 | 2 | 747.6 | ||||||
Gains (losses) on financial transactions (1) | — | (3 | ) | — | (1 | ) | — | ||||
| Other operating income | 1 | (3 | ) | — | (4 | ) | — | ||||
| Total income | 45 | 18 | 149.8 | 19 | 142.0 | ||||||
| Administrative expenses and amortisations | (71 | ) | (72 | ) | (1.6 | ) | (41 | ) | 72.4 | ||
| Net operating income | (26 | ) | (54 | ) | (52.6 | ) | (22 | ) | 14.2 | ||
| Net loan-loss provisions | — | — | 13.0 | — | 213.0 | ||||||
| Other gains (losses) and provisions | (1 | ) | (4 | ) | (75.4 | ) | (1 | ) | 57.4 | ||
| Profit before tax | (27 | ) | (58 | ) | (53.7 | ) | (23 | ) | 16.7 | ||
| Tax on profit | 14 | 16 | (9.9 | ) | 12 | 14.2 | |||||
| Profit from continuing operations | (13 | ) | (43 | ) | (69.5 | ) | (11 | ) | 19.5 | ||
| Net profit from discontinued operations | — | — | — | — | — | ||||||
| Consolidated profit | (13 | ) | (43 | ) | (69.5 | ) | (11 | ) | 19.5 | ||
| Non-controlling interests | — | — | — | — | — | ||||||
| Underlying attributable profit to the parent | (13 | ) | (43 | ) | (70.0 | ) | (11 | ) | 17.6 | ||
| Balance sheet | |||||||||||
| Loans and advances to customers | 791 | 702 | 12.6 | 417 | 89.8 | ||||||
| Cash, central banks and credit institutions | 9,423 | 9,063 | 4.0 | 8,673 | 8.6 | ||||||
| Debt instruments | 10 | 10 | 2.2 | — | — | ||||||
| Other financial assets | 205 | 187 | 9.7 | 152 | 34.9 | ||||||
| Other asset accounts | 318 | 272 | 16.8 | 129 | 147.2 | ||||||
| Total assets | 10,747 | 10,234 | 5.0 | 9,370 | 14.7 | ||||||
| Customer deposits | 9,674 | 9,460 | 2.3 | 8,804 | 9.9 | ||||||
| Central banks and credit institutions | 144 | 82 | 75.8 | 75 | 92.0 | ||||||
| Marketable debt securities | — | — | — | — | — | ||||||
| Other financial liabilities | 134 | 105 | 27.5 | 41 | 230.9 | ||||||
| Other liabilities accounts | 98 | 112 | (12.4 | ) | 60 | 62.9 | |||||
| Total liabilities | 10,051 | 9,760 | 3.0 | 8,980 | 11.9 | ||||||
| Total equity | 696 | 474 | 46.9 | 390 | 78.2 | ||||||
| Memorandum items: | |||||||||||
Gross loans and advances to customers (2) | 794 | 706 | 12.5 | 420 | 89.1 | ||||||
| Customer funds | 10,127 | 9,910 | 2.2 | 9,183 | 10.3 | ||||||
Customer deposits (3) | 9,674 | 9,460 | 2.3 | 8,804 | 9.9 | ||||||
| Mutual funds | 453 | 450 | 0.7 | 379 | 19.7 | ||||||
| Resources | |||||||||||
| Number of employees | 1,424 | 820 | 73.7 | 545 | 161.3 | ||||||
(1) Includes exchange differences..
(2) Excluding reverse repos.
(3) Excluding repos.
| 76 | | January - March 2020 |
| CORPORATE CENTRE | |||||||||||
| EUR million | |||||||||||
| Underlying income statement | Q1'20 | Q4'19 | % | Q1'19 | % | ||||||
| Net interest income | (304 | ) | (333 | ) | (8.6 | ) | (296 | ) | 2.8 | ||
| Net fee income | (9 | ) | (15 | ) | (37.5 | ) | (14 | ) | (32.9 | ) | |
Gains (losses) on financial transactions (1) | 14 | (39 | ) | — | (79 | ) | — | ||||
| Other operating income | (5 | ) | 5 | — | (11 | ) | (56.6 | ) | |||
| Total income | (304 | ) | (381 | ) | (20.2 | ) | (399 | ) | (23.8 | ) | |
| Administrative expenses and amortisations | (85 | ) | (89 | ) | (5.2 | ) | (97 | ) | (12.9 | ) | |
| Net operating income | (389 | ) | (471 | ) | (17.4 | ) | (497 | ) | (21.6 | ) | |
| Net loan-loss provisions | (3 | ) | (10 | ) | (64.5 | ) | (8 | ) | (55.6 | ) | |
| Other gains (losses) and provisions | (20 | ) | (49 | ) | (58.2 | ) | (55 | ) | (62.9 | ) | |
| Profit before tax | (413 | ) | (529 | ) | (22.0 | ) | (559 | ) | (26.2 | ) | |
| Tax on profit | (21 | ) | 71 | — | 33 | — | |||||
| Profit from continuing operations | (434 | ) | (458 | ) | (5.3 | ) | (526 | ) | (17.5 | ) | |
| Net profit from discontinued operations | — | — | — | — | — | ||||||
| Consolidated profit | (434 | ) | (458 | ) | (5.3 | ) | (526 | ) | (17.5 | ) | |
| Non-controlling interests | — | (1 | ) | — | 10 | (99.8 | ) | ||||
| Underlying attributable profit to the parent | (434 | ) | (459 | ) | (5.5 | ) | (517 | ) | (16.0 | ) | |
| Balance sheet | |||||||||||
| Loans and advances to customers | 4,454 | 5,764 | (22.7 | ) | 6,139 | (27.4 | ) | ||||
| Cash, central banks and credit institutions | 46,836 | 32,803 | 42.8 | 26,755 | 75.1 | ||||||
| Debt instruments | 1,292 | 840 | 53.9 | 954 | 35.4 | ||||||
| Other financial assets | 3,745 | 2,406 | 55.7 | 2,207 | 69.7 | ||||||
| Other asset accounts | 131,526 | 126,539 | 3.9 | 132,551 | (0.8 | ) | |||||
| Total assets | 187,853 | 168,352 | 11.6 | 168,605 | 11.4 | ||||||
| Customer deposits | 740 | 793 | (6.7 | ) | 163 | 355.0 | |||||
| Central banks and credit institutions | 27,484 | 12,254 | 124.3 | 16,921 | 62.4 | ||||||
| Marketable debt securities | 56,906 | 54,495 | 4.4 | 43,441 | 31.0 | ||||||
| Other financial liabilities | 803 | 636 | 26.2 | 2,321 | (65.4 | ) | |||||
| Other liabilities accounts | 8,917 | 9,810 | (9.1 | ) | 8,356 | 6.7 | |||||
| Total liabilities | 94,849 | 77,989 | 21.6 | 71,201 | 33.2 | ||||||
| Total equity | 93,004 | 90,362 | 2.9 | 97,404 | (4.5 | ) | |||||
| Memorandum items: | |||||||||||
Gross loans and advances to customers (2) | 6,135 | 5,859 | 4.7 | 6,414 | (4.4 | ) | |||||
| Customer funds | 751 | 804 | (6.6 | ) | 176 | 327.9 | |||||
Customer deposits (3) | 740 | 793 | (6.7 | ) | 163 | 355.0 | |||||
| Mutual funds | 11 | 11 | 0.3 | 13 | (16.9 | ) | |||||
| Resources | |||||||||||
| Number of employees | 1,697 | 1,651 | 2.8 | 1,757 | (3.4 | ) | |||||
(1) Includes exchange differences.
(2) Excluding reverse repos.
(3) Excluding repos.
January - March 2020 | | 77 |
| RETAIL BANKING | |||||||||||
| EUR million | |||||||||||
| / | Q4'19 | / | Q1'19 | ||||||||
| Underlying income statement | Q1'20 | % | % excl. FX | % | % excl. FX | ||||||
| Net interest income | 7,885 | (4.2 | ) | (1.9 | ) | (2.5 | ) | 2.2 | |||
| Net fee income | 2,024 | (5.5 | ) | (3.1 | ) | (7.1 | ) | (1.3 | ) | ||
Gains (losses) on financial transactions (1) | 50 | (84.1 | ) | (84.1 | ) | (31.3 | ) | (34.9 | ) | ||
| Other operating income | 13 | (51.6 | ) | (35.6 | ) | (83.0 | ) | (87.1 | ) | ||
| Total income | 9,972 | (6.9 | ) | (4.7 | ) | (4.2 | ) | 0.3 | |||
| Administrative expenses and amortisations | (4,526 | ) | (6.2 | ) | (4.6 | ) | (3.6 | ) | 0.6 | ||
| Net operating income | 5,445 | (7.4 | ) | (4.8 | ) | (4.8 | ) | — | |||
| Net loan-loss provisions | (2,289 | ) | (6.1 | ) | (3.8 | ) | 6.8 | 12.7 | |||
| Other gains (losses) and provisions | (338 | ) | (25.7 | ) | (23.5 | ) | (13.6 | ) | (8.8 | ) | |
| Profit before tax | 2,818 | (5.7 | ) | (2.7 | ) | (11.5 | ) | (7.4 | ) | ||
| Tax on profit | (919 | ) | 6.0 | 9.7 | (13.7 | ) | (8.2 | ) | |||
| Profit from continuing operations | 1,899 | (10.5 | ) | (7.8 | ) | (10.4 | ) | (7.0 | ) | ||
| Net profit from discontinued operations | — | — | — | — | — | ||||||
| Consolidated profit | 1,899 | (10.5 | ) | (7.8 | ) | (10.4 | ) | (7.0 | ) | ||
| Non-controlling interests | (262 | ) | (0.4 | ) | 3.1 | (26.4 | ) | (23.3 | ) | ||
| Underlying attributable profit to the parent | 1,637 | (11.9 | ) | (9.3 | ) | (7.2 | ) | (3.7 | ) | ||
(1) Includes exchange differences.
| CORPORATE & INVESTMENT BANKING | |||||||||||
| EUR million | |||||||||||
| / | Q4'19 | / | Q1'19 | ||||||||
| Underlying income statement | Q1'20 | % | % excl. FX | % | % excl. FX | ||||||
| Net interest income | 671 | (6.3 | ) | (5.1 | ) | 2.6 | 8.6 | ||||
| Net fee income | 404 | 8.4 | 10.2 | 14.8 | 20.2 | ||||||
Gains (losses) on financial transactions (1) | 165 | (39.6 | ) | (38.7 | ) | (23.7 | ) | (12.0 | ) | ||
| Other operating income | 60 | (5.1 | ) | (5.6 | ) | 8.3 | 7.3 | ||||
| Total income | 1,300 | (8.8 | ) | (7.6 | ) | 1.8 | 8.6 | ||||
| Administrative expenses and amortisations | (536 | ) | (11.9 | ) | (11.0 | ) | (4.4 | ) | (1.0 | ) | |
| Net operating income | 764 | (6.5 | ) | (5.0 | ) | 6.6 | 16.5 | ||||
| Net loan-loss provisions | (4 | ) | (96.6 | ) | (96.5 | ) | (53.5 | ) | (48.6 | ) | |
| Other gains (losses) and provisions | (15 | ) | (52.8 | ) | (52.1 | ) | (31.0 | ) | (29.5 | ) | |
| Profit before tax | 745 | 13.3 | 15.2 | 8.6 | 19.0 | ||||||
| Tax on profit | (218 | ) | 4.4 | 6.3 | 7.9 | 18.8 | |||||
| Profit from continuing operations | 527 | 17.4 | 19.4 | 8.9 | 19.1 | ||||||
| Net profit from discontinued operations | — | — | — | — | — | ||||||
| Consolidated profit | 527 | 17.4 | 19.4 | 8.9 | 19.1 | ||||||
| Non-controlling interests | (36 | ) | (7.4 | ) | (2.6 | ) | (14.7 | ) | (6.0 | ) | |
| Underlying attributable profit to the parent | 491 | 19.8 | 21.3 | 11.2 | 21.4 | ||||||
(1) Includes exchange differences.
| 78 | | January - March 2020 |
| WEALTH MANAGEMENT & INSURANCE | |||||||||||
| EUR million | |||||||||||
| / | Q4'19 | / | Q1'19 | ||||||||
| Underlying income statement | Q1'20 | % | % excl. FX | % | % excl. FX | ||||||
| Net interest income | 132 | (9.0 | ) | (8.9 | ) | (5.7 | ) | (3.5 | ) | ||
| Net fee income | 320 | (2.9 | ) | (1.3 | ) | 17.2 | 20.2 | ||||
Gains (losses) on financial transactions (1) | 21 | 73.7 | 77.3 | (37.0 | ) | (35.1 | ) | ||||
| Other operating income | 113 | 11.3 | 15.2 | 48.1 | 56.5 | ||||||
| Total income | 586 | (0.4 | ) | 1.2 | 12.1 | 15.4 | |||||
| Administrative expenses and amortisations | (244 | ) | 0.1 | 0.9 | 1.0 | 2.2 | |||||
| Net operating income | 342 | (0.8 | ) | 1.4 | 21.5 | 27.1 | |||||
| Net loan-loss provisions | (7 | ) | — | — | — | — | |||||
| Other gains (losses) and provisions | (1 | ) | (70.9 | ) | (70.1 | ) | (50.7 | ) | (48.1 | ) | |
| Profit before tax | 334 | (7.4 | ) | (5.6 | ) | 17.1 | 22.4 | ||||
| Tax on profit | (82 | ) | (7.6 | ) | (6.5 | ) | 22.8 | 28.0 | |||
| Profit from continuing operations | 252 | (7.4 | ) | (5.2 | ) | 15.4 | 20.7 | ||||
| Net profit from discontinued operations | — | — | — | — | — | ||||||
| Consolidated profit | 252 | (7.4 | ) | (5.2 | ) | 15.4 | 20.7 | ||||
| Non-controlling interests | (11 | ) | (21.0 | ) | (15.9 | ) | 9.4 | 23.8 | |||
| Underlying attributable profit to the parent | 240 | (6.6 | ) | (4.7 | ) | 15.7 | 20.5 | ||||
(1) Includes exchange differences.
| SANTANDER GLOBAL PLATFORM (secondary segment) | |||||||||||
| EUR million | |||||||||||
| / | Q4'19 | / | Q1'19 | ||||||||
| Underlying income statement | Q1'20 | % | % excl. FX | % | % excl. FX | ||||||
| Net interest income | 103 | 23.4 | 26.2 | 2.7 | 10.9 | ||||||
| Net fee income | 115 | (13.0) | (11.5) | (19.0) | (10.0) | ||||||
Gains (losses) on financial transactions (1) | 42 | 12.0 | 14.3 | 25.5 | 31.7 | ||||||
| Other operating income | — | — | — | — | — | ||||||
| Total income | 260 | 4.4 | 6.4 | (4.1) | 4.8 | ||||||
| Administrative expenses and amortisations | (186 | ) | (8.1) | (6.9) | 13.0 | 20.4 | |||||
| Net operating income | 74 | 57.9 | 65.6 | (30.5) | (21.0) | ||||||
| Net loan-loss provisions | (5 | ) | (69.2 | ) | (68.9 | ) | (70.7 | ) | (70.3 | ) | |
| Other gains (losses) and provisions | 2 | — | — | — | — | ||||||
| Profit before tax | 71 | 156.8 | 179.5 | (18.9) | (5.3) | ||||||
| Tax on profit | (19 | ) | 29.9 | 40.0 | (23.4) | (6.2) | |||||
| Profit from continuing operations | 52 | 301.3 | 342.3 | (17.1) | (4.9) | ||||||
| Net profit from discontinued operations | — | — | — | — | — | ||||||
| Consolidated profit | 52 | 301.3 | 342.3 | (17.1) | (4.9) | ||||||
| Non-controlling interests | (9 | ) | 32.5 | 39.5 | (13.4) | (4.2) | |||||
| Underlying attributable profit to the parent | 43 | 619.7 | 739.9 | (17.8) | (5.0) | ||||||
(1) Includes exchange differences.
January - March 2020 | | 79 |
ALTERNATIVE PERFORMANCE MEASURES (APMs)
In addition to the financial information prepared under IFRS, this consolidated directors’ report contains financial measures that constitute alternative performance measures (‘APMs’) to comply with the guidelines on alternative performance measures issued by the European Securities and Markets Authority on 5 October 2015 and non-IFRS measures.
The financial measures contained in this consolidated directors’ report that qualify as APMs and non-IFRS measures have been calculated using the financial information from Santander but are not defined or detailed in the applicable financial information framework or under IFRS and have neither been audited nor reviewed by our auditors.
We use these APMs and non-IFRS measures when planning, monitoring and evaluating our performance. We consider these APMs and non-IFRS financial measures to be useful metrics for management and investors to facilitate operating performance comparisons from period to period. While we believe that these APMs and non-IFRS financial measures are useful in evaluating our business, this information should be considered as supplemental in nature and is not meant as a substitute of IFRS measures. In addition, the way in which Santander defines and calculates these APMs and non-IFRS measures may differ from the calculations and by other
companies with similar measures and, therefore, may not be comparable.
The APMs and non-IFRS measures we use in this document can be categorised as follows:
Underlying results
In addition to IFRS results measures, we present some results measures which are non-IFRS measures and which we refer to as underlying measures. These underlying measures allow in our view a better year-on-year comparability as they exclude items outside the ordinary course performance of our business which are grouped in the non-IFRS line net capital gains and provisions and are further detailed on page 14 of this report.
In addition, the results by business areas in the 'Geographic businesses' section are presented only on an underlying basis in accordance with IFRS 8, and reconciled on an aggregate basis to our IFRS consolidated results to the consolidated financial statements, which are set out below.
| Reconciliation of underlying results to statutory results | ||||||
| EUR million | ||||||
| January-March 2020 | ||||||
| Underlying results | Adjustments | Statutory results | ||||
| Net interest income | 8,487 | — | 8,487 | |||
| Net fee income | 2,853 | — | 2,853 | |||
Gains (losses) on financial transactions (1) | 292 | (5 | ) | 287 | ||
| Other operating income | 182 | — | 182 | |||
| Total income | 11,814 | (5 | ) | 11,809 | ||
| Administrative expenses and amortisations | (5,577 | ) | (12 | ) | (5,589 | ) |
| Net operating income | 6,237 | (17 | ) | 6,220 | ||
| Net loan-loss provisions | (2,309 | ) | (1,610 | ) | (3,919 | ) |
| Other gains (losses) and provisions | (372 | ) | (38 | ) | (410 | ) |
| Profit before tax | 3,556 | (1,665 | ) | 1,891 | ||
| Tax on profit | (1,260 | ) | 16 | (1,244 | ) | |
| Profit from continuing operations | 2,296 | (1,649 | ) | 647 | ||
| Net profit from discontinued operations | — | — | — | |||
| Consolidated profit | 2,296 | (1,649 | ) | 647 | ||
| Non-controlling interests | (319 | ) | 3 | (316 | ) | |
| Attributable profit to the parent | 1,977 | (1,646 | ) | 331 | ||
(1) Includes exchange differences.
Explanation of adjustments:
Recording of a provisions overlay based on the expected deterioration of the macroeconomic conditions arising from the health crisis of EUR -1,600 million and restructuring costs for a net impact of EUR -46 million.
| 80 | | January - March 2020 |
| Reconciliation of underlying results to statutory results | ||||||
| EUR million | ||||||
| January-March 2019 | ||||||
| Underlying results | Adjustments | Statutory results | ||||
| Net interest income | 8,682 | — | 8,682 | |||
| Net fee income | 2,931 | — | 2,931 | |||
Gains (losses) on financial transactions (1) | 277 | — | 277 | |||
| Other operating income | 195 | — | 195 | |||
| Total income | 12,085 | — | 12,085 | |||
| Administrative expenses and amortisations | (5,758 | ) | — | (5,758 | ) | |
| Net operating income | 6,327 | — | 6,327 | |||
| Net loan-loss provisions | (2,172 | ) | — | (2,172 | ) | |
| Other gains (losses) and provisions | (471 | ) | (82 | ) | (553 | ) |
| Profit before tax | 3,684 | (82 | ) | 3,602 | ||
| Tax on profit | (1,326 | ) | (31 | ) | (1,357 | ) |
| Profit from continuing operations | 2,358 | (113 | ) | 2,245 | ||
| Net profit from discontinued operations | — | — | — | |||
| Consolidated profit | 2,358 | (113 | ) | 2,245 | ||
| Non-controlling interests | (410 | ) | 5 | (405 | ) | |
| Attributable profit to the parent | 1,948 | (108 | ) | 1,840 | ||
(1) Includes exchange differences.
Explanation of adjustments:
Net capital gains from the sale of our stake in Prisma of EUR 150 million, net capital losses of EUR -180 million related to real estate assets (Spain) and restructuring costs for a net impact of EUR -78 million.
Profitability and efficiency ratios
The purpose of the profitability and efficiency ratios is to measure the ratio of profit to capital, to tangible capital, to assets and to risk weighted assets, while the efficiency ratio measures how much general administrative expenses (personnel and other) and amortisation costs are needed to generate revenue.
| Ratio | Formula | Relevance of the metric | ||
| RoE | Attributable profit to the parent | This ratio measures the return that shareholders obtain on the funds invested in the Bank and as such measures the company's ability to pay shareholders. | ||
| (Return on equity) | Average stockholders’ equity (1) (excl. minority interests) | |||
| RoTE | Attributable profit to the parent | This is a very common indicator, used to evaluate the profitability of the company as a percentage of its tangible equity. It's measured as the return that shareholders receive as a percentage of the funds invested in the entity less intangible assets. | ||
| (Return on tangible equity) | Average stockholders' equity (1) (excl. minority interests) - intangible assets | |||
| Underlying RoTE | Attributable profit to the parent | This indicator measures the profitability of the tangible equity of a company arising from ordinary activities, i.e. excluding results from non-recurring operations. | ||
Average stockholders' equity(1) (excl. minority interests) - intangible assets | ||||
| RoA | Consolidated profit | This metric, commonly used by analysts, measures the profitability of a company as a percentage of its total assets. It is an indicator that reflects the efficiency of the company's total funds in generating profit over a given period. | ||
| (Return on assets) | Average total assets | |||
| RoRWA | Consolidated profit | The return adjusted for risk is an derivative of the RoA metric. The difference is that RoRWA measures profit in relation to the bank's risk weighted assets | ||
| (Return on risk weighted assets) | Average risk weighted assets | |||
| Underlying RoRWA | Underlying consolidated profit | This relates the consolidated profit (excluding non-recurring results) to the bank's risk weighted assets. | ||
| Average risk weighted assets | ||||
| Efficiency ratio | Operating expenses (2) | One of the most commonly used indicators when comparing productivity of different financial entities. It measures the amount of funds used to generate the bank's total income. | ||
| Total income | ||||
1. Stockholders’ equity = Capital and Reserves + Accumulated other comprehensive income + Attributable profit to the parent + Dividends.
2. Operating expenses = Administrative expenses + amortisations.
January - March 2020 | | 81 |
Profitability and efficiency (1) (2) (3) (4) | Q1'20 | Q4'19 | Q1'19 | |||
| RoE | 6.31 | % | 9.10 | % | 7.85 | % |
| Attributable profit to the parent | 6,259 | 8,999 | 7,684 | |||
| Average stockholders' equity (excluding minority interests) | 99,221 | 98,851 | 97,886 | |||
| RoTE | 8.75 | % | 12.62 | % | 11.15 | % |
| Attributable profit to the parent | 6,259 | 8,999 | 7,684 | |||
| Average stockholders' equity (excluding minority interests) | 99,221 | 98,851 | 97,886 | |||
| (-) Average intangible assets | 27,721 | 27,562 | 28,978 | |||
| Average stockholders' equity (excl. minority interests) - intangible assets | 71,500 | 71,289 | 68,908 | |||
| Underlying RoTE | 11.06 | % | 11.63 | % | 11.31 | % |
| Attributable profit to the parent | 6,259 | 8,999 | 7,684 | |||
| (-) Net capital gains and provisions | (1,646) | 711 | (108) | |||
| Underlying attributable profit to the parent | 7,904 | 8,288 | 7,792 | |||
| Average stockholders' equity (excl. minority interests) - intangible assets | 71,500 | 71,289 | 68,908 | |||
| RoA | 0.49 | % | 0.68 | % | 0.63 | % |
| Consolidated profit | 7,536 | 10,335 | 9,318 | |||
| Average total assets | 1,536,725 | 1,530,761 | 1,488,505 | |||
| RoRWA | 1.25 | % | 1.69 | % | 1.54 | % |
| Consolidated profit | 7,536 | 10,335 | 9,318 | |||
| Average risk weighted assets | 603,069 | 612,149 | 603,340 | |||
| Underlying RoRWA | 1.52 | % | 1.57 | % | 1.56 | % |
| Consolidated profit | 7,536 | 10,335 | 9,318 | |||
| (-) Net capital gains and provisions | (1,649) | 746 | (113) | |||
| Underlying consolidated profit | 9,186 | 9,589 | 9,431 | |||
| Average risk weighted assets | 603,069 | 612,149 | 603,340 | |||
| Efficiency ratio | 47.2 | % | 47.4 | % | 47.6 | % |
| Underlying operating expenses | 5,577 | 5,971 | 5,758 | |||
| Operating expenses | 5,589 | 5,971 | 5,758 | |||
| Net capital gains and provisions impact in operating expenses | (12) | — | — | |||
| Underlying total income | 11,814 | 12,592 | 12,085 | |||
| Total income | 11,809 | 12,327 | 12,085 | |||
| Net capital gains and provisions impact in total income | 5 | 265 | — | |||
(1) Averages included in the RoE, RoTE, RoA and RoRWA denominators are calculated using 4 months' worth of data in the case of quarterly figures (from December to March in Q1 and September to December in Q4).
(2) For periods less than one year, and if there are results in the net capital gains and provisions line, the profit used to calculate RoE and RoTE is the annualised underlying attributable profit to which said results are added without annualising.
(3) For periods less than one year, and if there are results in the net capital gains and provisions line, the profit used to calculate RoA and RoRWA is the annualised underlying consolidated profit, to which said results are added without annualising.
(4) The risk weighted assets included in the denominator of the RoRWA metric are calculated in line with the criteria laid out in the CRR (Capital Requirements Regulation).
| Efficiency ratio | ||||||||||||
| Q1'20 | Q1'19 | |||||||||||
| % | Total income | Operating expenses | % | Total income | Operating expenses | |||||||
| Europe | 54.5 | 4,974 | 2,712 | 53.6 | 5,225 | 2,802 | ||||||
| Spain | 52.8 | 1,789 | 944 | 55.2 | 1,857 | 1,025 | ||||||
| Santander Consumer Finance | 43.9 | 1,171 | 514 | 43.5 | 1,167 | 508 | ||||||
| United Kingdom | 65.0 | 1,098 | 714 | 61.3 | 1,206 | 739 | ||||||
| Portugal | 43.1 | 350 | 151 | 44.0 | 357 | 157 | ||||||
| Poland | 47.1 | 365 | 172 | 45.9 | 377 | 173 | ||||||
| North America | 41.7 | 2,936 | 1,224 | 42.6 | 2,753 | 1,172 | ||||||
| US | 41.9 | 1,929 | 809 | 42.7 | 1,815 | 775 | ||||||
| Mexico | 41.2 | 1,007 | 415 | 42.3 | 939 | 397 | ||||||
| South America | 35.7 | 4,163 | 1,486 | 36.7 | 4,487 | 1,645 | ||||||
| Brazil | 32.0 | 3,137 | 1,004 | 33.0 | 3,411 | 1,125 | ||||||
| Chile | 41.7 | 553 | 230 | 42.6 | 600 | 255 | ||||||
| Argentina | 58.5 | 318 | 186 | 61.1 | 331 | 202 | ||||||
| 82 | | January - March 2020 |
| Underlying RoTE | ||||||||||||
| Q1'20 | Q1'19 | |||||||||||
| % | Underlying attributable profit to the parent | Average stockholders' equity (excl. minority interests) - intangible assets | % | Underlying attributable profit to the parent | Average stockholders' equity (excl. minority interests) - intangible assets | |||||||
| Europe | 7.94 | 3,895 | 49,049 | 9.61 | 4,653 | 48,433 | ||||||
| Spain | 9.00 | 1,409 | 15,650 | 9.61 | 1,424 | 14,820 | ||||||
| Santander Consumer Finance | 13.86 | 1,216 | 8,778 | 14.85 | 1,297 | 8,733 | ||||||
| United Kingdom | 5.16 | 751 | 14,556 | 6.91 | 1,018 | 14,724 | ||||||
| Portugal | 12.91 | 479 | 3,705 | 13.05 | 540 | 4,135 | ||||||
| Poland | 4.73 | 151 | 3,192 | 7.76 | 245 | 3,161 | ||||||
| North America | 9.92 | 2,089 | 21,068 | 8.45 | 1,546 | 18,297 | ||||||
| US | 6.98 | 1,092 | 15,648 | 5.07 | 725 | 14,305 | ||||||
| Mexico | 17.96 | 997 | 5,550 | 20.11 | 820 | 4,080 | ||||||
| South America | 21.12 | 3,711 | 17,571 | 19.58 | 3,704 | 18,910 | ||||||
| Brazil | 22.04 | 2,775 | 12,590 | 20.98 | 2,882 | 13,738 | ||||||
| Chile | 15.15 | 499 | 3,294 | 16.34 | 593 | 3,630 | ||||||
| Argentina | 30.06 | 235 | 782 | 5.08 | 41 | 814 | ||||||
Credit risk indicators
The credit risk indicators measure the quality of the credit portfolio and the percentage of non-performing loans covered by provisions.
| Ratio | Formula | Relevance of the metric | ||
NPL ratio (Non-performing loans) | Non-performing loans and advances to customers, customer guarantees and customer commitments granted | The NPL ratio is an important variable regarding financial institutions' activity since it gives an indication of the level of risk the entities are exposed to. It calculates risks that are, in accounting terms, declared to be non-performing as a percentage of the total outstanding amount of customer credit and contingent liabilities. | ||
Total Risk (1) | ||||
| Coverage ratio | Provisions to cover impairment losses on loans and advances to customers, customer guarantees and customer commitments granted | The coverage ratio is a fundamental metric in the financial sector. It reflects the level of provisions as a percentage of the non-performing assets (credit risk). Therefore it is a good indicator of the entity's solvency against client defaults both present and future. | ||
| Non-performing loans and advances to customers, customer guarantees and customer commitments granted | ||||
| Cost of Credit | Allowances for loan-loss provisions over the last 12 months | This ratio quantifies loan-loss provisions arising from credit risk over a defined period of time for a given loan portfolio. As such, it acts as an indicator of credit quality. | ||
| Average loans and advances to customers over the last 12 months | ||||
(1) Total risk = Total loans and advances and guarantees to customers (performing and non-performing) + non-performing contingent liabilities.
| Credit risk | Mar-20 | Dec-19 | Mar-19 | |||
| NPL ratio | 3.25 | % | 3.32 | % | 3.62 | % |
| Non-performing loans and advances to customers customer guarantees and customer commitments granted | 32,743 | 33,799 | 35,590 | |||
| Total risk | 1,008,275 | 1,016,507 | 983,790 | |||
| Coverage ratio | 71 | % | 68 | % | 68 | % |
| Provisions to cover impairment losses on loans and advances to customers, customer guarantees and customer commitments granted | 23,361 | 22,965 | 24,129 | |||
| Non-performing loans and advances to customers customer guarantees and customer commitments granted | 32,743 | 33,799 | 35,590 | |||
| Cost of credit | 1.00 | % | 1.00 | % | 0.97 | % |
| Underlying allowances for loan-loss provisions over the last 12 months | 9,458 | 9,321 | 8,762 | |||
| Allowances for loan-loss provisions over the last 12 months | 11,068 | 9,321 | 8,762 | |||
| Net capital gains and provisions impact in allowances for loan-loss provisions | (1,610) | — | — | |||
| Average loans and advances to customers over the last 12 months | 944,853 | 935,488 | 899,201 | |||
January - March 2020 | | 83 |
| NPL ratio | ||||||||||
| Q1'20 | Q1'19 | |||||||||
| % | Non-performing loans and advances to customers customer guarantees and customer commitments granted | Total risk | % | Non-performing loans and advances to customers customer guarantees and customer commitments granted | Total risk | |||||
| Europe | 3.19 | 23,199 | 726,929 | 3.61 | 25,314 | 701,283 | ||||
| Spain | 6.88 | 14,724 | 214,072 | 7.29 | 16,264 | 223,123 | ||||
| Santander Consumer Finance | 2.43 | 2,494 | 102,833 | 2.33 | 2,295 | 98,373 | ||||
| United Kingdom | 0.96 | 2,603 | 270,280 | 1.17 | 3,110 | 266,134 | ||||
| Portugal | 4.56 | 1,776 | 38,956 | 5.77 | 2,201 | 38,129 | ||||
| Poland | 4.29 | 1,387 | 32,368 | 4.39 | 1,364 | 31,066 | ||||
| North America | 2.02 | 2,936 | 145,566 | 2.33 | 3,118 | 133,887 | ||||
| US | 2.00 | 2,238 | 111,853 | 2.41 | 2,353 | 97,820 | ||||
| Mexico | 2.07 | 698 | 33,713 | 2.12 | 765 | 36,067 | ||||
| South America | 4.63 | 5,969 | 128,953 | 4.83 | 6,841 | 141,757 | ||||
| Brazil | 4.93 | 3,809 | 77,202 | 5.26 | 4,477 | 85,096 | ||||
| Chile | 4.63 | 1,839 | 39,707 | 4.67 | 2,013 | 43,127 | ||||
| Argentina | 3.97 | 190 | 4,776 | 3.50 | 224 | 6,398 | ||||
| Coverage ratio | ||||||||||||
| Q1'20 | Q1'19 | |||||||||||
| % | Provisions to cover impairment losses on loans and advances to customers, customer guarantees and customer commitments granted | Non-performing loans and advances to customers customer guarantees and customer commitments granted | % | Provisions to cover impairment losses on loans and advances to customers, customer guarantees and customer commitments granted | Non-performing loans and advances to customers customer guarantees and customer commitments granted | |||||||
| Europe | 50.7 | 11,766 | 23,199 | 49.5 | 12,523 | 25,314 | ||||||
| Spain | 42.0 | 6,189 | 14,724 | 43.3 | 7,044 | 16,264 | ||||||
| Santander Consumer Finance | 103.8 | 2,588 | 2,494 | 105.3 | 2,416 | 2,295 | ||||||
| United Kingdom | 37.7 | 981 | 2,603 | 30.9 | 960 | 3,110 | ||||||
| Portugal | 54.8 | 973 | 1,776 | 50.7 | 1,116 | 2,201 | ||||||
| Poland | 66.2 | 919 | 1,387 | 67.6 | 922 | 1,364 | ||||||
| North America | 157.6 | 4,629 | 2,936 | 153.4 | 4,782 | 3,118 | ||||||
| US | 166.8 | 3,733 | 2,238 | 161.0 | 3,788 | 2,353 | ||||||
| Mexico | 128.4 | 897 | 698 | 130.1 | 994 | 765 | ||||||
| South America | 86.3 | 5,149 | 5,969 | 94.1 | 6,439 | 6,841 | ||||||
| Brazil | 99.9 | 3,806 | 3,809 | 107.7 | 4,822 | 4,477 | ||||||
| Chile | 54.3 | 998 | 1,839 | 59.7 | 1,202 | 2,013 | ||||||
| Argentina | 112.5 | 213 | 190 | 118.6 | 266 | 224 | ||||||
| 84 | | January - March 2020 |
Other indicators
The market capitalisation indicator provides information on the volume of tangible equity per share. The loan-to-deposit ratio (LTD) identifies the relationship between net customer loans and advances and customer deposits, assessing the proportion of loans and advances granted by the Group that are funded by customer deposits.
The Group also uses gross customer loan magnitudes excluding reverse repurchase agreements (repos) and customer deposits excluding repos. In order to analyse the evolution of the traditional commercial banking business of granting loans and capturing deposits, repos and reverse repos are excluded, as they are mainly treasury business products and highly volatile.
| Ratio | Formula | Relevance of the metric | ||
| TNAV per share | Tangible book value (1) | This is a very commonly used ratio used to measure the company's accounting value per share having deducted the intangible assets. It is useful in evaluating the amount each shareholder would receive if the company were to enter into liquidation and had to sell all the company's tangible assets. | ||
| (Tangible equity net asset value per share) | Number of shares excluding treasury stock | |||
| Price / tangible book value per share (X) | Share price | This is one of the most commonly used ratios by market participants for the valuation of listed companies both in absolute terms and relative to other entities. This ratio measures the relationship between the price paid for a company and its accounting equity value. | ||
| TNAV per share | ||||
| LTD ratio | Net loans and advances to customers | This is an indicator of the bank's liquidity. It measures the total (net) loans and advances to customers as a percentage of customer deposits. | ||
| (Loan-to-deposit) | Customer deposits | |||
| Loans and advances (excl. reverse repos) | Gross loans and advances to customers excluding reverse repos | In order to aid analysis of the commercial banking activity, reverse repos are excluded as they are highly volatile treasury products. | ||
| Deposits (excl. repos) | Customer deposits excluding repos | In order to aid analysis of the commercial banking activity, repos are excluded as they are highly volatile treasury products. | ||
| PAT + After tax fees paid to SAN (in Wealth Management & Insurance) | Net profit + fees paid from Santander Asset Management and Santander Insurance to Santander, net of taxes, excluding Private Banking customers | Metric to assess Wealth Management & Insurance's total contribution to Grupo Santander profit. | ||
(1) Tangible book value = Stockholders' equity - intangible assets
| Others | Mar-20 | Dec-19 | Mar-19 | |||
| TNAV (tangible book value) per share | 4.21 | 4.36 | 4.30 | |||
| Tangible book value (EUR million) | 69,795 | 72,384 | 69,731 | |||
| Number of shares excl. treasury stock (million) | 16,590 | 16,610 | 16,235 | |||
| Price / Tangible book value per share (X) | 0.53 | 0.86 | 0.96 | |||
| Share price (euros) | 2.218 | 3.730 | 4.145 | |||
| TNAV (tangible book value) per share | 4.21 | 4.36 | 4.30 | |||
| Loan-to-deposit ratio | 115 | % | 114 | % | 113 | % |
| Net loans and advances to customers | 935,407 | 942,218 | 910,195 | |||
| Customer deposits | 815,459 | 824,365 | 808,361 | |||
| Q1'20 | Q4'19 | Q1'19 | ||||
| PAT + After tax fees paid to SAN (in WM&I) (Constant EUR million) | 596 | 629 | 556 | |||
| Profit after tax | 252 | 266 | 209 | |||
| Net fee income net of tax | 344 | 364 | 347 | |||
January - March 2020 | | 85 |
Local currency measures
We make use of certain financial measures in local currency to help in the assessment of our ongoing operating performance. These non-IFRS financial measures include the results of operations of our subsidiary banks located outside the Eurozone, excluding the impact of foreign exchange. Because changes in foreign currency exchange rates do not have an operating impact on the results, we believe that evaluating their performance on a local currency basis provides an additional and meaningful assessment of performance to both management and the company’s investors.
The Group presents, at both the Group level as well as the business unit level, the real changes in the income statement as well as the changes excluding the exchange rate effect, as it considers the latter facilitates analysis, since it enables businesses movements to be identified without taking into account the impact of converting each local currency into euros.
Said variations, excluding the impact of exchange rate movements, are calculated by converting P&L lines for the different business units comprising the Group into our presentation currency, the euro, applying the average exchange rate for the first quarter of 2020 to all periods contemplated in the analysis.
The Group presents, at both the Group level as well as the business unit level, the changes in euros in the balance sheet as well as the changes excluding the exchange rate effect for loans and advances to customers excluding reverse repos and customer funds (which comprise deposits and mutual funds) excluding repos. As with the income statement, the reason is to facilitate analysis by isolating the changes in the balance sheet that are not caused by converting each local currency into euros.
These changes excluding the impact of exchange rate movements are calculated by converting loans and advances to customers excluding reverse repos and customer funds excluding repos, into our presentation currency, the euro, applying the closing exchange rate on the last working day of March 2020 to all periods contemplated in the analysis.
The average and period-end exchange rates for the main currencies in which the Group operates are set out in the table below.
| Exchange rates: 1 euro / currency parity | |||||||||||
| Average (income statement) | Period-end (balance sheet) | ||||||||||
| Q1'20 | Q1'19 | Mar-20 | Dec-19 | Mar-19 | |||||||
| US dollar | 1.102 | 1.136 | 1.096 | 1.123 | 1.124 | ||||||
| Pound sterling | 0.861 | 0.872 | 0.886 | 0.851 | 0.858 | ||||||
| Brazilian real | 4.889 | 4.277 | 5.700 | 4.516 | 4.387 | ||||||
| Mexican peso | 21.898 | 21.804 | 26.177 | 21.220 | 21.691 | ||||||
| Chilean peso | 886.223 | 757.486 | 934.656 | 845.673 | 764.435 | ||||||
| Argentine peso | 67.819 | 44.208 | 70.546 | 67.258 | 48.659 | ||||||
| Polish zloty | 4.321 | 4.302 | 4.551 | 4.257 | 4.301 | ||||||
| 86 | | January - March 2020 |
| Response to the COVID-19 crisis Business model | ||||||||
| Interim condensed consolidated financial statements | ||||||||
INTERIM CONDENSED CONSOLIDATED FINANCIAL STATEMENTS
| • | CONSOLIDATED BALANCE SHEET |
| • | CONSOLIDATED INCOME STATEMENT |
| NOTE: | The following financial information for the first three months of 2020 and 2019 (attached herewith) corresponds to the condensed consolidated financial statements prepared in accordance with the International Financial Reporting Standards. |
| Interim condensed consolidated balance sheet | ||||||
| EUR million | ||||||
| ASSETS | Mar-20 | Dec-19 | Mar-19 | |||
| Cash, cash balances at central banks and other deposits on demand | 122,456 | 101,067 | 103,500 | |||
| Financial assets held for trading | 125,846 | 108,230 | 98,592 | |||
| Non-trading financial assets mandatorily at fair value through profit or loss | 4,483 | 4,911 | 6,661 | |||
| Financial assets designated at fair value through profit or loss | 62,659 | 62,069 | 75,488 | |||
| Financial assets at fair value through other comprehensive income | 110,238 | 125,708 | 116,359 | |||
| Financial assets at amortised cost | 981,331 | 995,482 | 980,733 | |||
| Hedging derivatives | 12,755 | 7,216 | 7,270 | |||
| Changes in the fair value of hedged items in portfolio hedges of interest risk | 2,089 | 1,702 | 1,435 | |||
| Investments | 8,610 | 8,772 | 7,726 | |||
| Joint ventures companies | 1,266 | 1,325 | 956 | |||
| Associated entities | 7,344 | 7,447 | 6,770 | |||
| Assets under insurance or reinsurance contracts | 312 | 292 | 332 | |||
| Tangible assets | 34,912 | 35,235 | 33,246 | |||
| Property, plant and equipment | 33,972 | 34,262 | 32,149 | |||
| For own-use | 14,089 | 15,041 | 14,771 | |||
| Leased out under an operating lease | 19,883 | 19,221 | 17,378 | |||
| Investment property | 940 | 973 | 1,097 | |||
| Of which Leased out under an operating lease | 806 | 823 | 786 | |||
| Intangible assets | 26,583 | 27,687 | 29,114 | |||
| Goodwill | 23,141 | 24,246 | 25,989 | |||
| Other intangible assets | 3,442 | 3,441 | 3,125 | |||
| Tax assets | 29,607 | 29,585 | 29,634 | |||
| Current tax assets | 7,516 | 6,827 | 6,415 | |||
| Deferred tax assets | 22,091 | 22,758 | 23,219 | |||
| Other assets | 13,564 | 10,138 | 11,501 | |||
| Insurance contracts linked to pensions | 186 | 192 | 204 | |||
| Inventories | 5 | 5 | 4 | |||
| Other | 13,373 | 9,941 | 11,293 | |||
| Non-current assets held for sale | 4,914 | 4,601 | 4,560 | |||
| TOTAL ASSETS | 1,540,359 | 1,522,695 | 1,506,151 | |||
January - March 2020 | | 87 |
| Response to the COVID-19 crisis Business model | ||||||||
| Interim condensed consolidated financial statements | ||||||||
| Interim condensed consolidated balance sheet | ||||||
| EUR million | ||||||
| LIABILITIES | Mar-20 | Dec-19 | Mar-19 | |||
| Financial liabilities held for trading | 100,082 | 77,139 | 67,994 | |||
| Financial liabilities designated at fair value through profit or loss | 67,337 | 60,995 | 74,426 | |||
| Financial liabilities at amortised cost | 1,224,749 | 1,230,745 | 1,211,981 | |||
| Hedging derivatives | 6,673 | 6,048 | 7,273 | |||
| Changes in the fair value of hedged items in portfolio hedges of interest rate risk | 264 | 269 | 313 | |||
| Liabilities under insurance or reinsurance contracts | 2,280 | 739 | 751 | |||
| Provisions | 12,335 | 13,987 | 13,449 | |||
| Pensions and other post-retirement obligations | 5,507 | 6,358 | 5,737 | |||
| Other long term employee benefits | 1,273 | 1,382 | 1,160 | |||
| Taxes and other legal contingencies | 2,519 | 3,057 | 3,205 | |||
| Contingent liabilities and commitments | 668 | 739 | 710 | |||
| Other provisions | 2,368 | 2,451 | 2,637 | |||
| Tax liabilities | 9,405 | 9,322 | 8,783 | |||
| Current tax liabilities | 2,588 | 2,800 | 2,699 | |||
| Deferred tax liabilities | 6,817 | 6,522 | 6,084 | |||
| Other liabilities | 11,121 | 12,792 | 10,816 | |||
| Liabilities associated with non-current assets held for sale | — | — | — | |||
| TOTAL LIABILITIES | 1,434,246 | 1,412,036 | 1,395,786 | |||
| EQUITY | ||||||
| Shareholders´ equity | 124,139 | 124,239 | 121,866 | |||
| Capital | 8,309 | 8,309 | 8,118 | |||
| Called up paid capital | 8,309 | 8,309 | 8,118 | |||
| Unpaid capital which has been called up | — | — | — | |||
| Share premium | 52,446 | 52,446 | 50,993 | |||
| Equity instruments issued other than capital | 604 | 598 | 573 | |||
| Equity component of the compound financial instrument | — | — | — | |||
| Other equity instruments issued | 604 | 598 | 573 | |||
| Other equity | 171 | 146 | 172 | |||
| Accumulated retained earnings | 67,594 | 61,028 | 64,346 | |||
| Revaluation reserves | — | — | — | |||
| Other reserves | (3,580 | ) | (3,110 | ) | (1,933 | ) |
| (-) Own shares | (74 | ) | (31 | ) | (6 | ) |
| Profit attributable to shareholders of the parent | 331 | 6,515 | 1,840 | |||
| (-) Interim dividends | (1,662 | ) | (1,662 | ) | (2,237 | ) |
| Other comprehensive income | (27,761 | ) | (24,168 | ) | (23,021 | ) |
| Items not reclassified to profit or loss | (3,484 | ) | (4,288 | ) | (3,469 | ) |
| Items that may be reclassified to profit or loss | (24,277 | ) | (19,880 | ) | (19,552 | ) |
| Non-controlling interest | 9,735 | 10,588 | 11,520 | |||
| Other comprehensive income | (1,696 | ) | (982 | ) | (1,137 | ) |
| Other elements | 11,431 | 11,570 | 12,657 | |||
| TOTAL EQUITY | 106,113 | 110,659 | 110,365 | |||
| TOTAL LIABILITIES AND EQUITY | 1,540,359 | 1,522,695 | 1,506,151 | |||
| MEMORANDUM ITEMS | ||||||
| Loans commitment granted | 217,767 | 241,179 | 221,305 | |||
| Financial guarantees granted | 12,810 | 13,650 | 12,265 | |||
| Other commitments granted | 73,128 | 68,895 | 79,472 | |||
January - March 2020 | | 88 |
| Response to the COVID-19 crisis Business model | ||||||||
| Interim condensed consolidated financial statements | ||||||||
| Interim condensed consolidated income statement | ||||
| EUR million | ||||
| Q1'20 | Q1'19 | |||
| Interest income | 13,208 | 14,280 | ||
| Financial assets at fair value through other comprehensive income | 1,145 | 1,022 | ||
| Financial assets at amortised cost | 11,402 | 11,987 | ||
| Other interest income | 661 | 1,271 | ||
| Interest expense | (4,721 | ) | (5,598 | ) |
| Net interest income | 8,487 | 8,682 | ||
| Dividend income | 57 | 66 | ||
| Share of results of entities accounted for using the equity method | 98 | 153 | ||
| Commission income | 3,765 | 3,746 | ||
| Commission expense | (912 | ) | (815 | ) |
| Gain or losses on financial assets and liabilities not measured at fair value through profit or loss, net | 312 | 116 | ||
| Financial assets at amortised cost | (23 | ) | 5 | |
| Other financial assets and liabilities | 335 | 111 | ||
| Gain or losses on financial assets and liabilities held for trading, net | 3,975 | 28 | ||
| Reclassification of financial assets at fair value through other comprehensive income | — | — | ||
| Reclassification of financial assets at amortised cost | — | — | ||
| Other gains (losses) | 3,975 | 28 | ||
| Gains or losses on non-trading financial assets and liabilities mandatorily at fair value through profit or loss | (41 | ) | 131 | |
| Reclassification of financial assets at fair value through other comprehensive income | — | — | ||
| Reclassification of financial assets at amortised cost | — | — | ||
| Other gains (losses) | (41 | ) | 131 | |
| Gain or losses on financial assets and liabilities measured at fair value through profit or loss, net | (55 | ) | (76 | ) |
| Gain or losses from hedge accounting, net | 138 | (29 | ) | |
| Exchange differences (profit or loss) net | (4,042 | ) | 107 | |
| Other operating income | 435 | 419 | ||
| Other operating expenses | (451 | ) | (469 | ) |
| Income from assets under insurance and reinsurance contracts | 452 | 882 | ||
| Expenses from liabilities under insurance and reinsurance contracts | (409 | ) | (856 | ) |
| Total income | 11,809 | 12,085 | ||
| Administrative expenses | (4,860 | ) | (5,011 | ) |
| Staff costs | (2,899 | ) | (3,006 | ) |
| Other general administrative expenses | (1,961 | ) | (2,005 | ) |
| Depreciation and amortisation cost | (729 | ) | (747 | ) |
| Provisions or reversal of provisions, net | (374 | ) | (465 | ) |
| Impairment or reversal of impairment at financial assets not measured at fair value through profit or loss and net gains and losses from changes | (3,934 | ) | (2,246 | ) |
| Financial assets at fair value with changes in other comprehensive income | (1 | ) | (3 | ) |
| Financial assets at amortised cost | (3,933 | ) | (2,243 | ) |
| Impairment of investments in subsidiaries, joint ventures and associates, net | — | — | ||
| Impairment on non-financial assets, net | (14 | ) | (20 | ) |
| Tangible assets | (3 | ) | (20 | ) |
| Intangible assets | (8 | ) | (1 | ) |
| Others | (3 | ) | 1 | |
| Gain or losses on non financial assets and investments, net | 18 | 219 | ||
| Negative goodwill recognised in results | — | — | ||
| Gains or losses on non-current assets held for sale not classified as discontinued operations | (25 | ) | (213 | ) |
| Profit or loss before tax from continuing operations | 1,891 | 3,602 | ||
| Tax expense or income from continuing operations | (1,244 | ) | (1,357 | ) |
| Profit for the period from continuing operations | 647 | 2,245 | ||
| Profit or loss after tax from discontinued operations | — | — | ||
| Profit for the period | 647 | 2,245 | ||
| Profit attributable to non-controlling interests | 316 | 405 | ||
| Profit attributable to the parent | 331 | 1,840 | ||
| Earnings per share | ||||
| Basic | 0.012 | 0.104 | ||
| Diluted | 0.011 | 0.104 | ||
January - March 2020 | | 89 |
GLOSSARY
| • | Active customer: Those customers who comply with the minimum balance, income and/or transactionality requirements as defined according to the business area |
| • | ALCO: Assets and Liabilities Committee |
| • | APM: Alternative Performance Measures |
| • | bps: basis points |
| • | CET1: Core equity tier 1 |
| • | CNMV: Spanish National Securities Market Commission (Comisión Nacional del Mercado de Valores) |
| • | COVID-19: Corona Virus Disease 19 |
| • | Digital customers: Every consumer of a commercial bank’s services who has logged on to their personal online banking and/or mobile banking in the last 30 days |
| • | EBA: European Banking Authority |
| • | ECB: European Central Bank |
| • | EPS: Earnings per share |
| • | ESG: Environmental, Social and Governance |
| • | ESMA: European Securities and Markets Authority |
| • | Fed: Federal Reserve |
| • | FX: Foreign Exchange |
| • | GDP: Gross Domestic Product |
| • | IFRS 9: International Financial Reporting Standard 9, regarding financial instruments |
| • | IFRS 16: International Financial Reporting Standard 16, regarding leases |
| • | Loyal customers: Active customers who receive most of their financial services from the Group according to the commercial segment that they belong to. Various engaged customer levels have been defined taking profitability into account. |
| • | NPLs: Non-performing loans |
| • | P/E ratio: Price / earnings per share ratio |
| • | PBT: Profit before tax |
| • | pp: percentage points |
| • | PPI: Payment protection insurance |
| • | Repos: Repurchase agreements |
| • | RoA: Return on assets |
| • | RoE: Return on equity |
| • | RoRWA: Return on risk weighted assets |
| • | RoTE: Return on tangible equity |
| • | RWAs: Risk weighted assets |
| • | SAM: Santander Asset Management |
| • | SBNA: Santander Bank N.A. |
| • | SCF: Santander Consumer Finance |
| • | SCIB: Santander Corporate & Investment Banking |
| • | SC USA: Santander Consumer USA |
| • | SEC: Securities and Exchanges Commission |
| • | SGP: Santander Global Platform |
| • | SH USA: Santander Holdings USA, Inc. |
| • | SMEs: Small and medium enterprises |
| • | SPF: Simple, Personal and Fair |
| • | SREP: Supervisory Review and Evaluation Process |
| • | SSM: Single Supervisory Mechanism, the system of banking supervision in Europe. It comprises the ECB and the national supervisory authorities of the participating countries |
| • | T1: Tier 1 |
| • | TLAC: The total loss-absorption capacity requirement which is required to be met under the CRD V package |
| • | TNAV: Tangible net asset value |
| • | TRIM: Targeted review of internal models |
| • | VaR: Value at Risk |
| • | WM&I: Wealth Management & Insurance |
| 90 | | January - March 2020 |
| Response to the COVID-19 crisis Business model | ||||||||
| Important information | ||||||||
Important information
Non-IFRS and alternative performance measures
In addition to the financial information prepared in accordance with International Financial Reporting Standards (“IFRS”), this report contains certain financial measures that constitute alternative performance measures (“APMs”) as defined in the Guidelines on Alternative Performance Measures issued by the European Securities and Markets Authority (ESMA) on 5 October 2015 (ESMA/2015/1415en) and other non-IFRS measures (“Non-IFRS Measures”). The financial measures contained in this report that qualify as APMs and non-IFRS measures have been calculated using the financial information from Santander Group but are not defined or detailed in the applicable financial reporting framework and have neither been audited nor reviewed by our auditors. We use these APMs and non-IFRS measures when planning, monitoring and evaluating our performance. We consider these APMs and non-IFRS measures to be useful metrics for management and investors to facilitate operating performance comparisons from period to period. While we believe that these APMs and non-IFRS measures are useful in evaluating our business, this information should be considered as supplemental in nature and is not meant as a substitute of IFRS measures. In addition, other companies, including companies in our industry, may calculate or use such measures differently, which reduces their usefulness as comparative measures. For further details of the APMs and non-IFRS Measures used, including its definition or a reconciliation between any applicable management indicators and the financial data presented in the consolidated financial statements prepared under IFRS, please see 2019 Annual Financial Report, published in the CNMV on 28 February 2020, our 20-F report for the year ending 31 December 2019 registered with the SEC in the United States as well as the section “Alternative performance measures” of the annex to this report.
The businesses included in each of our geographic segments and the accounting principles under which their results are presented here may differ from the included businesses and local applicable accounting principles of our public subsidiaries in such geographies. Accordingly, the results of operations and trends shown for our geographic segments may differ materially from those of such subsidiaries.
Forward-looking statements
Santander cautions that this report contains statements that constitute “forward-looking statements” within the meaning of the U.S. Private Securities Litigation Reform Act of 1995. Forward-looking statements may be identified by words such as “expect”, “project”, “anticipate”, “should”, “intend”, “probability”, “risk”, “VaR”, “RoRAC”, “RoRWA”, “TNAV”, “target”, “goal”, “objective”, “estimate”, “future” and similar expressions. These forward-looking statements are found in various places throughout this report and include, without limitation, statements concerning our future business development and economic performance and our shareholder remuneration policy. While these forward-looking statements represent our judgment and future expectations concerning the development of our business, a number of risks, uncertainties and other important factors could cause actual developments and results to differ materially from our expectations. The following important factors, in addition to those discussed elsewhere in this report, and in our annual report on Form 20-F for the year ended December 31, 2018, filed with the U.S. Securities and Exchange Commission, could affect our future results and could cause outcomes to differ materially from those anticipated in any forward-looking statement: (1) general economic or industry conditions in areas in which we have significant business activities or investments, including a worsening of the economic environment, increasing in the volatility of the capital markets, inflation or deflation, and changes in demographics, consumer spending, investment or saving habits; (2) exposure to various types of market risks, principally including interest rate risk, foreign exchange rate risk, equity price risk and risks associated with the replacement of benchmark indices; (3) potential losses associated with prepayment of our loan and investment portfolio, declines in the value of collateral securing our loan portfolio, and counterparty risk; (4) political stability in Spain, the UK, other European countries, Latin America and the US (5) changes in laws, regulations or taxes, including changes in regulatory capital and liquidity requirements, including as a result of the UK exiting the European Union and increased regulation in light of the global financial crisis; (6) our ability to integrate successfully our acquisitions and the challenges inherent in diverting management’s focus and resources from other strategic opportunities and from operational matters while we integrate these acquisitions; and (7) changes in our ability to access liquidity and funding on acceptable terms, including as a result of changes in our credit spreads or a downgrade in our credit ratings or those of our more significant subsidiaries. Numerous factors could affect the future results of Santander and could result in those results deviating materially from those anticipated in the forward-looking statements. Other unknown or unpredictable factors could cause actual results to differ materially from those in the forward-looking statements.
Forward-looking statements speak only as of the date of this report and are based on the knowledge, information available and views taken on such date; such knowledge, information and views may change at any time. Santander does not undertake any obligation to update or revise any forward-looking statement, whether as a result of new information, future events or otherwise.
January - March 2020 | | 91 |
| Response to the COVID-19 crisis Business model | ||||||||
| Important information | ||||||||
No offer
The information contained in this report is subject to, and must be read in conjunction with, all other publicly available information, including, where relevant any fuller disclosure document published by Santander. Any person at any time acquiring securities must do so only on the basis of such person’s own judgment as to the merits or the suitability of the securities for its purpose and only on such information as is contained in such public information having taken all such professional or other advice as it considers necessary or appropriate in the circumstances and not in reliance on the information contained in this report. No investment activity should be undertaken on the basis of the information contained in this report. In making this report available Santander gives no advice and makes no recommendation to buy, sell or otherwise deal in shares in Santander or in any other securities or investments whatsoever.
Neither this report nor any of the information contained therein constitutes an offer to sell or the solicitation of an offer to buy any securities. No offering of securities shall be made in the United States except pursuant to registration under the U.S. Securities Act of 1933, as amended, or an exemption therefrom. Nothing contained in this report is intended to constitute an invitation or inducement to engage in investment activity for the purposes of the prohibition on financial promotion in the U.K. Financial Services and Markets Act 2000.
Historical performance is not indicative of future results
Statements as to historical performance or financial accretion are not intended to mean that future performance, share price or future earnings (including earnings per share) for any period will necessarily match or exceed those of any prior period. Nothing in this report should be construed as a profit forecast.
| This document is a translation of a document originally issued in Spanish. Should there be any discrepancies between the English and the Spanish versions, only the original Spanish version should be binding. |
| 92 | | January - March 2020 |
SIGNATURE
Pursuant to the requirements of the Securities Exchange Act of 1934, the registrant has duly caused this report to be signed on its behalf by the undersigned, thereunto duly authorized.
| Banco Santander, S.A. | ||
| Date: April 28, 2020 | By: | /s/ José García Cantera |
| Name: | José García Cantera | |
| Title: | Chief Financial Officer | |