FORM 6-K
SECURITIES AND EXCHANGE COMMISSION
Washington, D.C. 20549
Report of Foreign Issuer
Pursuant to Rule 13a-16 or 15d-16 of
the Securities Exchange Act of 1934
For the month of April, 2020
Commission File Number: 001-12518
Banco Santander, S.A.
(Exact name of registrant as specified in its charter)
Ciudad Grupo Santander
28660 Boadilla del Monte (Madrid) Spain
(Address of principal executive office)
Indicate by check mark whether the registrant files or will file annual reports under cover of Form 20-F or Form 40-F:
| Form 20-F | X | Form 40-F |
Indicate by check mark if the registrant is submitting the Form 6-K in paper as permitted by Regulation S-T Rule 101(b)(1):
| Yes | No | X |
Indicate by check mark if the registrant is submitting the Form 6-K in paper as permitted by Regulation S-T Rule 101(b)(7):
| Yes | No | X |
Banco Santander, S.A.
TABLE OF CONTENTS
Item | |
| 1 | January – March 2020 Earnings Presentation |
Item 1

Q1’20 Earnings Presentation 28 April 2020 Here to help you prosper
Important information 2 Non - IFRS and alternative performance measures In addition to the financial information prepared in accordance with International Financial Reporting Standards (“IFRS”) and derived from our financial statements, this presentation contains certain financial measures that constitute alternative performance measures (“APMs”) as defined in the Guidelines on Alternative Performance Measures issued by the European Securities and Markets Authority (ESMA) on 5 October 2015 (ESMA/ 2015 / 1415 en) and other non - IFRS measures (“Non - IFRS Measures”) . The financial measures contained in this presentation that qualify as APMs and non - IFRS measures have been calculated using the financial information from Santander Group but are not defined or detailed in the applicable financial reporting framework and have neither been audited nor reviewed by our auditors . We use these APMs and non - IFRS measures when planning, monitoring and evaluating our performance . We consider these APMs and non - IFRS measures to be useful metrics for management and investors to facilitate operating performance comparisons from period to period . While we believe that these APMs and non - IFRS measures are useful in evaluating our business, this information should be considered as supplemental in nature and is not meant as a substitute of IFRS measures . In addition, other companies, including companies in our industry, may calculate or use such measures differently, which reduces their usefulness as comparative measures . For further details of the APMs and Non - IFRS Measures used, including its definition or a reconciliation between any applicable management indicators and the financial data presented in the consolidated financial statements prepared under IFRS, please see the 2019 Annual Financial Report, filed with the Comisión Nacional del Mercado de Valores of Spain (CNMV) on 28 February 2020 , as well as the section “Alternative performance measures” of the annex to the Banco Santander, S . A . (“Santander”) 2020 1 Q Financial Report, published as Relevant Fact on 28 April 2020 . These documents are available on Santander’s website ( www . santander . com ) . The businesses included in each of our geographic segments and the accounting principles under which their results are presented here may differ from the included businesses and local applicable accounting principles of our public subsidiaries in such geographies . Accordingly, the results of operations and trends shown for our geographic segments may differ materially from those of such subsidiaries Forward - looking statements Santander cautions that this presentation contains statements that constitute “forward - looking statements” within the meaning of the U . S . Private Securities Litigation Reform Act of 1995 . Forward - looking statements may be identified by words such as “expect”, “project”, “anticipate”, “should”, “intend”, “probability”, “risk”, “ VaR ”, “ RoRAC ”, “ RoRWA ”, “TNAV”, “target”, “goal”, “objective”, “estimate”, “future” and similar expressions . These forward - looking statements are found in various places throughout this presentation and include, without limitation, statements concerning our future business development and economic performance and our shareholder remuneration policy . While these forward - looking statements represent our judgment and future expectations concerning the development of our business, a number of risks, uncertainties and other important factors could cause actual developments and results to differ materially from our expectations . The following important factors, in addition to those discussed elsewhere in this presentation, could affect our future results and could cause outcomes to differ materially from those anticipated in any forward - looking statement : ( 1 ) general economic or industry conditions in areas in which we have significant business activities or investments, including a worsening of the economic environment, increasing in the volatility of the capital markets, inflation or deflation, and changes in demographics, consumer spending, investment or saving habits ; ( 2 ) exposure to various types of market risks, principally including interest rate risk, foreign exchange rate risk, equity price risk and risks associated with the replacement of benchmark indices ; ( 3 ) potential losses associated with prepayment of our loan and investment portfolio, declines in the value of collateral securing our loan portfolio, and counterparty risk ; ( 4 ) political stability in Spain, the UK, other European countries, Latin America and the US ( 5 ) changes in laws, regulations or taxes, including changes in regulatory capital and liquidity requirements, including as a result of the UK exiting the European Union and increased regulation in light of the global financial crisis ; ( 6 ) our ability to integrate successfully our acquisitions and the challenges inherent in diverting management’s focus and resources from other strategic opportunities and from operational matters while we integrate these acquisitions ; and ( 7 ) changes in our ability to access liquidity and funding on acceptable terms, including as a result of changes in our credit spreads or a downgrade in our credit ratings or those of our more significant subsidiaries . Numerous factors could affect the future results of Santander and could result in those results deviating materially from those anticipated in the forward - looking statements . Other unknown or unpredictable factors could cause actual results to differ materially from those in the forward - looking statements .
Important information 3 Forward - looking statements speak only as of the date of this presentation and are based on the knowledge, information available and views taken on such date; such knowledge, information and views may change at any time. Santander does not undertake any obligation to update or revise any forward - looking statement, whether as a result of new information, future events or otherwise. No offer The information contained in this presentation is subject to, and must be read in conjunction with, all other publicly available information, including, where relevant any fuller disclosure document published by Santander . Any person at any time acquiring securities must do so only on the basis of such person’s own judgment as to the merits or the suitability of the securities for its purpose and only on such information as is contained in such public information having taken all such professional or other advice as it considers necessary or appropriate in the circumstances and not in reliance on the information contained in this presentation . No investment activity should be undertaken on the basis of the information contained in this presentation . In making this presentation available Santander gives no advice and makes no recommendation to buy, sell or otherwise deal in shares in Santander or in any other securities or investments whatsoever . Neither this presentation nor any of the information contained therein constitutes an offer to sell or the solicitation of an offer to buy any securities . No offering of securities shall be made in the United States except pursuant to registration under the U . S . Securities Act of 1933 , as amended, or an exemption therefrom . Nothing contained in this presentation is intended to constitute an invitation or inducement to engage in investment activity for the purposes of the prohibition on financial promotion in the U . K . Financial Services and Markets Act 2000 . Historical performance is not indicative of future results Statements as to historical performance or financial accretion are not intended to mean that future performance, share price or future earnings (including earnings per share) for any period will necessarily match or exceed those of any prior period. Nothing in this presentation should be construed as a profit forecast. Third Party Information In particular, regarding the data provided by third parties, neither Santander, nor any of its administrators, directors or employees, either explicitly or implicitly, guarantees that these contents are exact, accurate, comprehensive or complete, nor are they obliged to keep them updated, nor to correct them in the case that any deficiency, error or omission were to be detected. Moreover, in reproducing these contents in by any means, Santander may introduce any changes it deems suitable, may omit partially or completely any of the elements of this presentation, and in case of any deviation between such a version and this one, Santander assumes no liability for any discrepancy.

4 1 Q1’20 Highlights 4 Appe n dix Ind e x 2 Group & Business areas review 3 COVID - 19 and Key takeaways
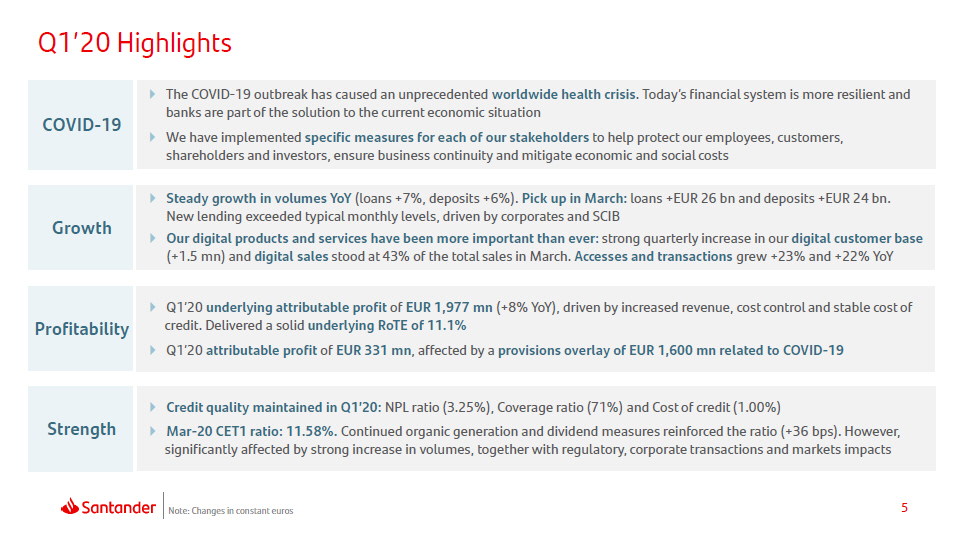
5 Steady growth in volumes YoY (loans +7%, deposits +6%). Pick up in March: loans +EUR 26 bn and deposits +EUR 24 bn. New lending exceeded typical monthly levels, driven by corporates and SCIB Our digital products and services have been more important than ever : strong quarterly increase in our digital customer base (+1.5 mn) and digital sales stood at 43% of the total sales in March. Accesses and transactions grew +23% and +22% YoY Q1’20 Highlights The COVID - 19 outbreak has caused an unprecedented worldwide health crisis . Today’s financial system is more resilient and banks are part of the solution to the current economic situation We have implemented specific measures for each of our stakeholders to help protect our employees, customers, shareholders and investors, ensure business continuity and mitigate economic and social costs Note: Changes in constant euros Q1’20 underlying attributable profit of EUR 1,977 mn (+8% YoY), driven by increased revenue, cost control and stable cost of credit. Delivered a solid underlying RoTE of 11.1% Q1’20 attributable profit of EUR 331 mn , affected by a provisions overlay of EUR 1,600 mn related to COVID - 19 Credit quality maintained in Q1’20: NPL ratio (3.25%), Coverage ratio (71%) and Cost of credit (1.00%) Mar - 20 CET1 ratio: 11.58%. Continued organic generation and dividend measures reinforced the ratio (+36 bps). However, significantly affected by strong increase in volumes, together with regulatory, corporate transactions and markets impacts COVID - 19 G r owth Pr of i tabili ty Strength
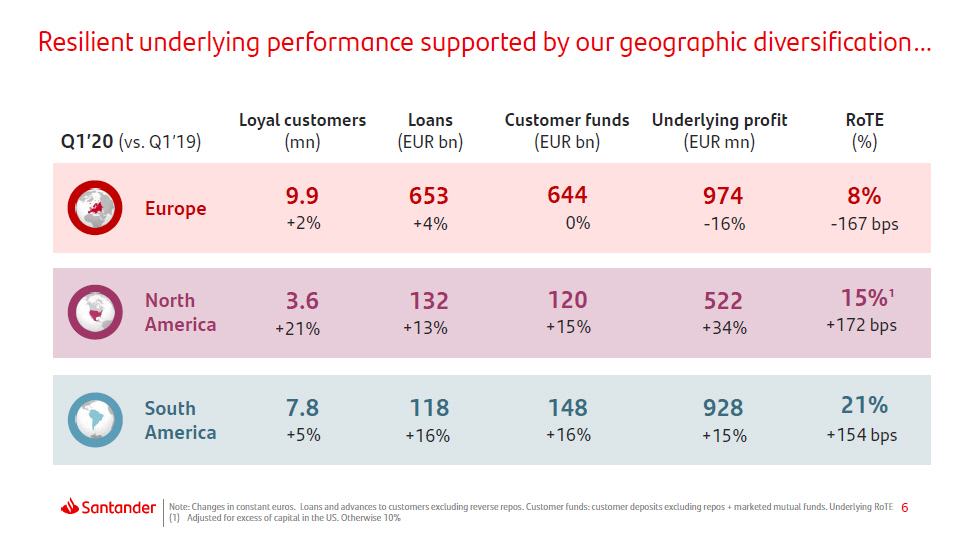
6 Resilient underlying performance supported by our geographic diversification… Note: Changes in constant euros. Loans and advances to customers excluding reverse repos. Customer funds: customer deposits excluding repos + marketed mutual funds. Underlying RoTE (1) Adjusted for excess of capital in the US. Otherwise 10% Eu r ope South Ameri c a North Amer i c a Loyal customers (mn) Loans (EUR bn) Underlying profit (EUR mn) R o TE (%) 132 +13% 522 +34% 15 % 1 +172 bps 118 +16% 928 + 15% 21% +154 bps Q1’20 (vs. Q1’19) Customer funds (EUR bn) 120 +15% 148 +16% 9.9 653 644 974 8% +2% +4% 0% - 16% - 167 bps 3.6 +21% 7.8 +5%
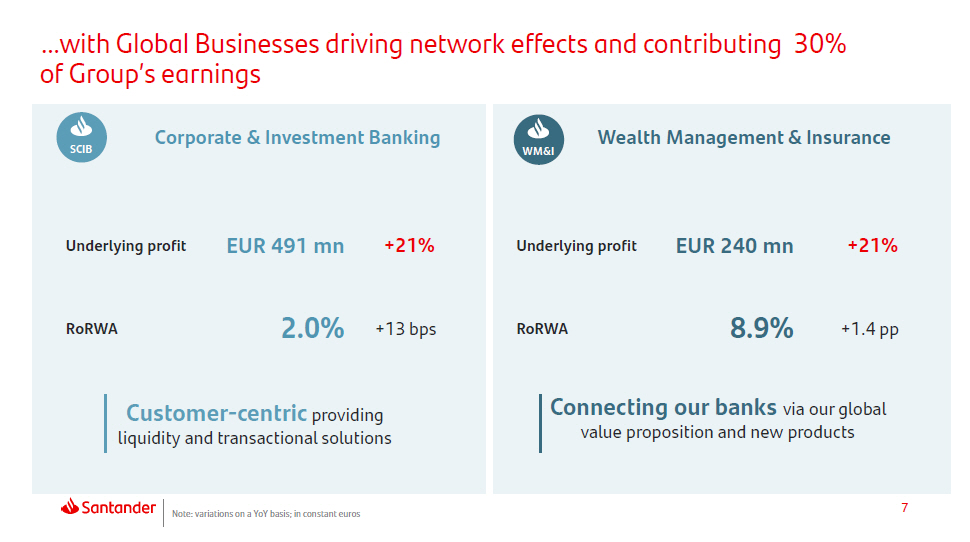
7 … with Global B u sin e s s e s driving net w ork e f fe c ts and c o n tributing 30% of Group’s earnings Customer - centric providing liquidity and transactional solutions Note: variations on a YoY basis; in constant euros Ro R W A Underlying profit S CIB 2.0% +13 bps Corporate & Investment Banking Wealth Management & Insurance Ro R W A Underlying profit W M& I 8.9% +1.4 pp Connecting our banks via our global value proposition and new products EUR 240 mn +21% EUR 491 mn +21%

8 1 Q1’20 Highlights 4 Appe n dix Ind e x 2 Group & Business areas review 3 COVID - 19 and Key takeaways
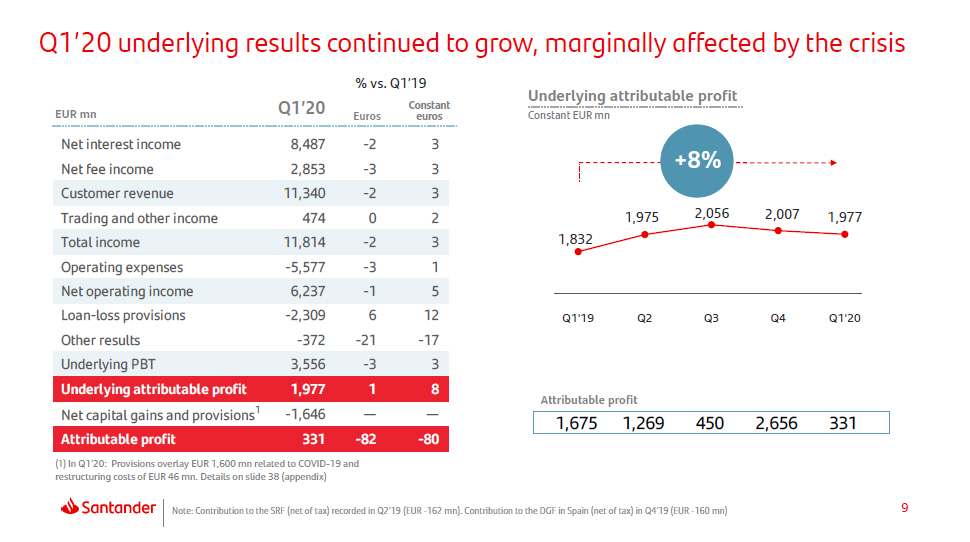
9 (1 ) In Q1’20: Provisions overlay EUR 1,600 mn related to COVID - 19 and restructuring costs of EUR 46 mn. Details on slide 38 (appendix) Note: Contribution to the SRF (net of tax) recorded in Q2’19 (EUR - 162 mn). Contribution to the DGF in Spain (net of tax) in Q4’19 (EUR - 160 mn) Constant % vs. Q1’19 Q1’20 underlying results continued to grow, marginally affected by the crisis Underlying attributable profit EUR mn Q1’ 2 0 Euros eu r os Constant EUR mn Net interest income 8 , 48 7 - 2 3 Net fee income 2 , 85 3 - 3 3 +8% Customer revenue 11 , 34 0 - 2 3 Trading and other income 474 0 2 1,975 2,056 2,007 1,9 7 7 Total income 11 , 81 4 - 2 3 1,8 3 2 Operating expenses - 5 , 57 7 - 3 1 Net operating income 6 , 23 7 - 1 5 Loan - loss provisions - 2 , 30 9 6 12 Q1'19 Q2 Q3 Q4 Q1'20 Other results - 37 2 - 21 - 1 7 Underlying PBT 3 , 55 6 - 3 3 Underlying attributable profit 1 , 97 7 1 8 N e t c a p i t al g a i n s a n d p r o v isi o n s 1 - 1 , 64 6 — — Attributable profit 331 - 82 - 80 Attributable profit 1 , 67 5 1 , 26 9 45 0 2 , 65 6 331
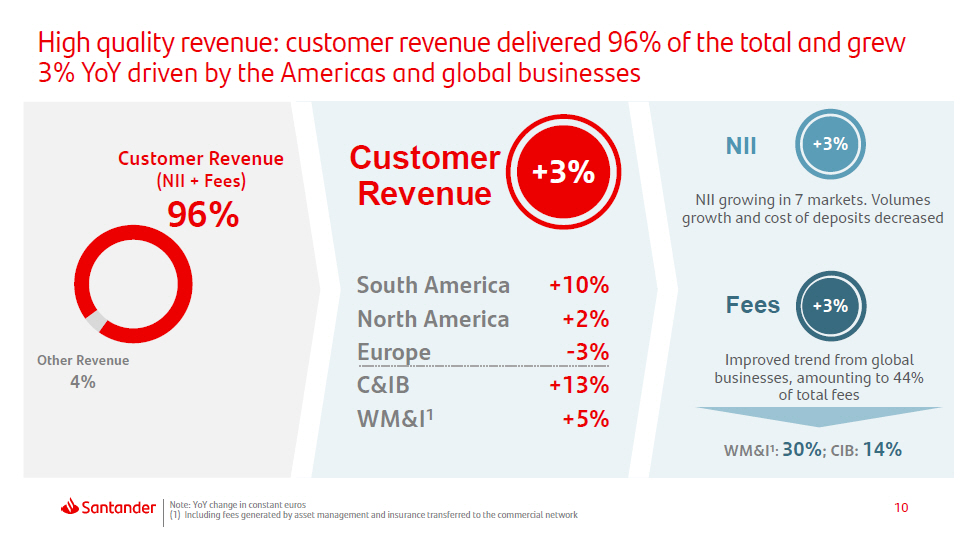
10 High quality revenue: customer revenue delivered 96% of the total and grew 3% YoY driven by the Americas and global businesses Note: YoY change in constant euros (1) Including fees generated by asset management and insurance transferred to the commercial network Other Revenue 4% Customer Revenue (NII + Fees) 96% South America +10% North Ameri c a +2% E u r o p e - 3% C&IB WM&I 1 +13% +5% +3% Custom e r Revenue WM&I 1 : 30% ; CIB: 14% NII +3% Fees NII growing in 7 markets. Volumes growth and cost of deposits decreased Improved trend from global businesses, amounting to 44% of total fees +3%
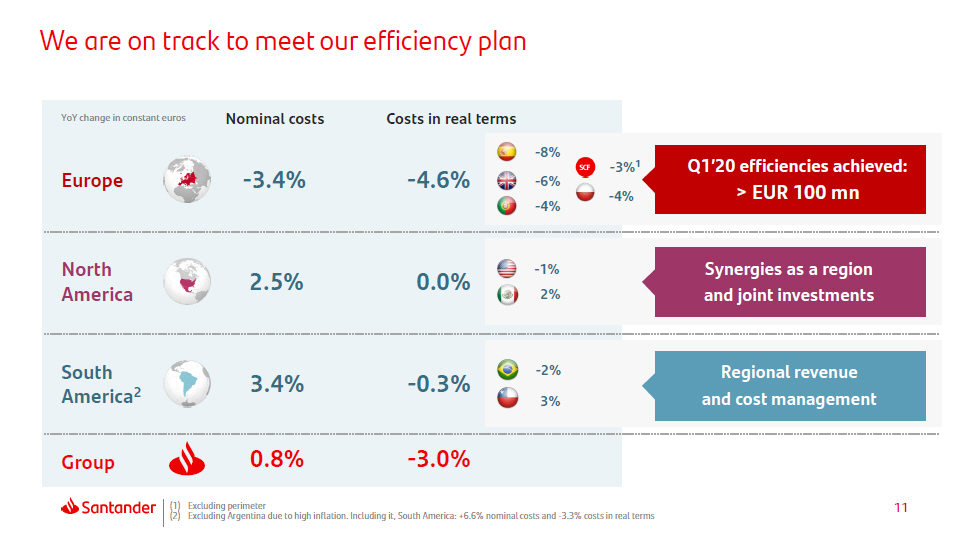
11 We are on track to meet our efficiency plan Eu r ope South Ameri c a 2 North Ameri c a - 3.4% 3.4% 2.5% Nominal costs - 8% - 6% - 4% - 1% 2% - 2% 3% - 4.6% - 0.3% 0.0% Costs in real terms YoY change in constant euros G r oup 0.8% - 3.0% (1) Excluding perimeter (2) Excluding Argentina due to high inflation. Including it, South America: +6.6% nominal costs and - 3.3% costs in real terms Regional revenue and cost management Synergies as a region and joint investments Q1’20 efficiencies achieved: > EUR 100 mn - 3% 1 - 4%
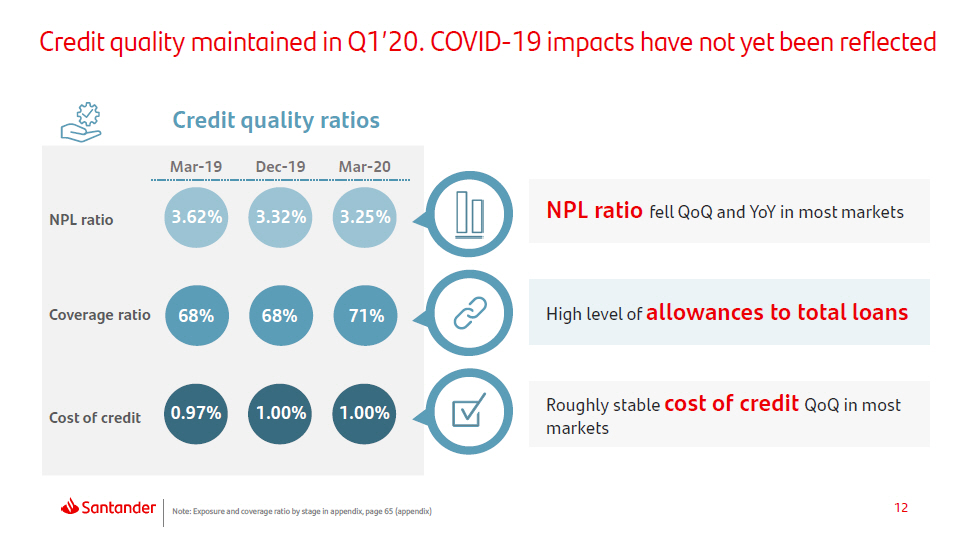
12 Cost of credit NPL ratio Credit quality maintained in Q1’20. COVID - 19 impacts have not yet been reflected 0 . 97 % 1 . 00 % Coverage ratio 68% 68% 1 . 00 % 71% Credit quality ratios Mar - 19 Dec - 19 Mar - 20 3 . 6 2 % 3 . 3 2 % 3 . 2 5 % Roughly stable cost of credit QoQ in most markets NPL ratio fell QoQ and YoY in most markets High level of allowances to total loans Note: Exposure and coverage ratio by stage in appendix, page 65 (appendix)
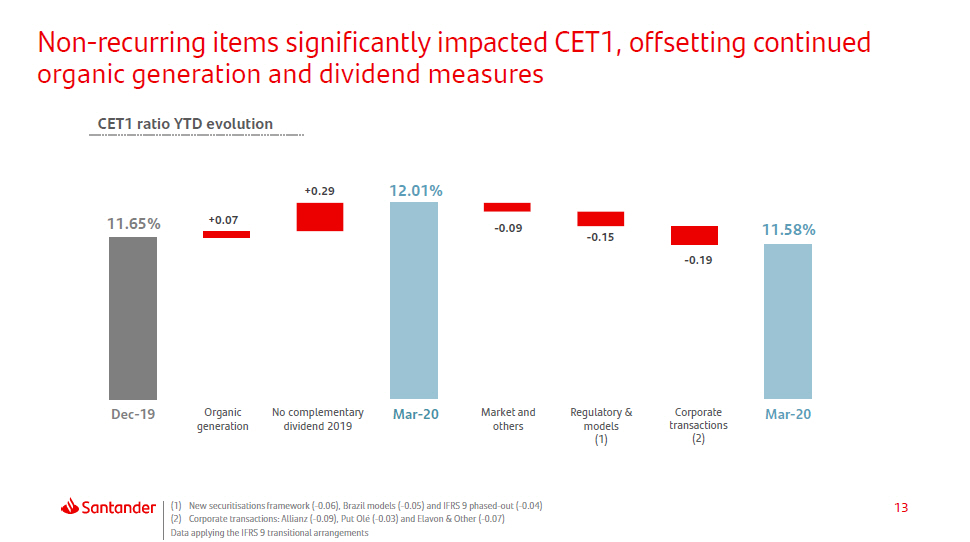
13 Ma r - 20 Organic gen era t io n Market and others Regulatory & models (1) De c - 19 CET1 ratio YTD evolution Ma r - 20 No complementary dividend 2019 Corporate t ransaction s (2) Non - recurring items significantly impacted CET1, offsetting continued organic generation and dividend measures 12. 0 1 % 11. 5 8 % - 0.09 - 0.15 - 0.19 11. 6 5 % +0.07 +0.29 (1) New securitisations framework ( - 0.06), Brazil models ( - 0.05) and IFRS 9 phased - out ( - 0.04) (2) Corporate transactions: Allianz ( - 0.09), Put Olé ( - 0.03) and Elavon & Other ( - 0.07) Data applying the IFRS 9 transitional arrangements

14 Resilient underlying profitability in Q1’20 (1) Statutory RoTE Q1’19 11.2% and Q1’20 8.8%. Statutory RoRWA Q1’19 1.54% and Q1’20 1.25%. Notes: The averages for the Q1 RoTE and RoRWA denominators are calculated on the basis of 4 months from December to March. For periods of less than a year, and in the event of non - recurring results existing, the profit used to calculate the statutory RoTE is the annualised underlying attributable profit (excluding non - recurring results), to which are added non - recurring results without annualising them. For periods of less than a year, and in the event of non - recurring results existing, the profit used to calculate the statutory RoRWA is the annualised underlying consolidated result (excluding non - recurring results), to which is added non - recurring results without annualising them. Underlying RoTE 1 11.3% 11.1% Q1' 1 9 Q1' 2 0 1.56% 1.52% Q 1 ' 1 9 Q 1 ' 2 0 Underlying RoRWA 1 TNAV per share EUR 4 . 3 0 4 . 2 1 M a r - 19 M a r - 20 Profitability ratios TNAV per share + Dividend per share: +1.8% YoY

15 Business areas review
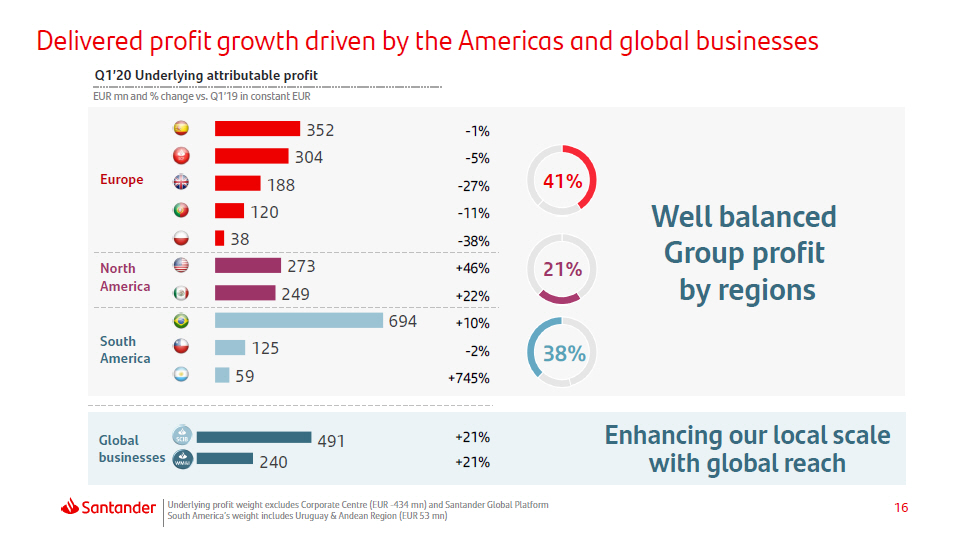
16 694 125 59 Delivered profit growth driven by the Americas and global businesses Q1’20 Underlying attributable profit EUR mn and % change vs. Q1’19 in constant EUR 491 240 South A merica Global b us in e ss e s Well balanced Group profit by regions Enhancing our local scale with global reach Underlying profit weight excludes Corporate Centre (EUR - 434 mn) and Santander Global Platform South America’s weight includes Uruguay & Andean Region (EUR 53 mn) +21% +21% 352 - 1 % 304 - 5 % Europe 188 - 27 % 120 - 11 % 38 North 273 - 38% +46% America 249 +22% +10% - 2 % +745% 38% 41% 21%
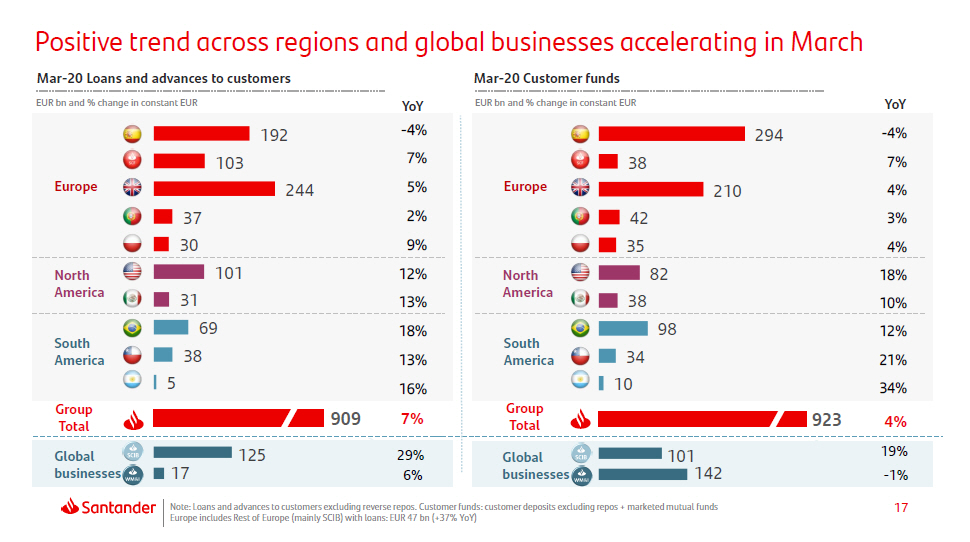
17 Positive trend across regions and global businesses accelerating in March Note: Loans and advances to customers excluding reverse repos. Customer funds: customer deposits excluding repos + marketed mutual funds Europe includes Rest of Europe (mainly SCIB) with loans: EUR 47 bn (+37% YoY) 294 38 210 42 82 38 98 34 10 EUR bn and % change in constant EUR Eu r o p e South A merica North A m erica Y o Y - 4 % 7% 4% 3% 35 4% 18% 10% 12% 21% 34% Global b us in e ss e s G r oup Total 923 4% 101 142 19% - 1 % Mar - 20 Loans and advances to customers Mar - 20 Customer funds 192 103 244 37 31 69 38 5 EUR bn and % change in constant EUR G r oup Total Eu r o p e South A merica North 101 America Y o Y - 4 % 7% 5% 2% 30 9% 12% 13% 18% 13% 16% Global b us in e ss e s 125 17 2 9 % 6% 909 7%
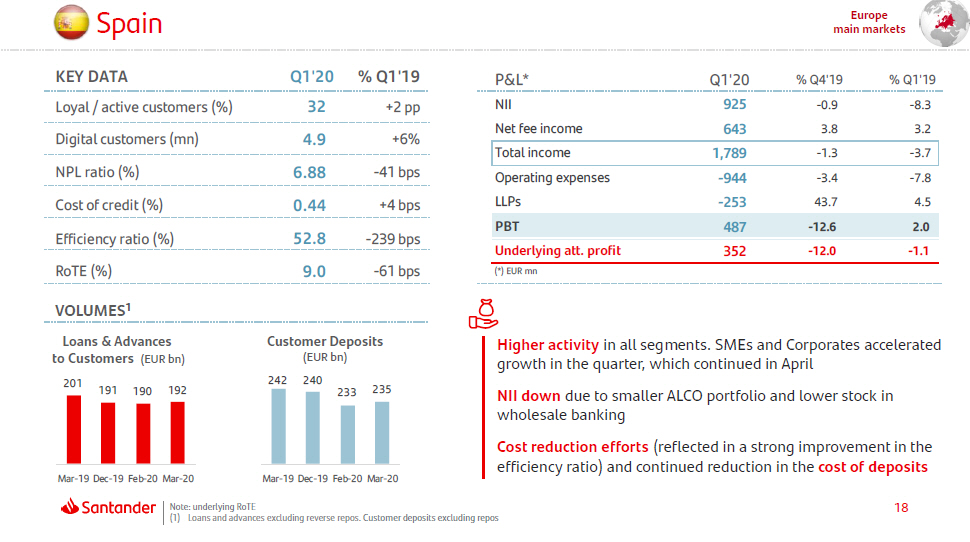
18 Spa in Europe main markets Note: underlying RoTE (1) Loans and advances excluding reverse repos. Customer deposits excluding repos KEY DATA Q 1 ' 2 0 % Q1'19 Loyal / active customers (%) 3 2 +2 pp Digital customers (mn) 4 . 9 +6% NPL ratio (%) 6 . 8 8 - 41 bps P & L * Q 1 ' 20 % Q4'19 % Q1'19 NII 925 - 0 . 9 - 8 . 3 Net fee income 643 3 . 8 3 . 2 Total income 1 , 78 9 - 1 . 3 - 3 . 7 Operating expenses - 94 4 - 3 . 4 - 7 . 8 LLPs - 25 3 43 . 7 4 . 5 PBT 487 - 12 . 6 2 . 0 Underlying att. profit 352 - 12 . 0 - 1 . 1 (*) EUR mn Cost of credit (%) 0.44 +4 bps Efficiency ratio (%) 52.8 - 239 bps RoTE (%) 9.0 - 61 bps VOLUMES 1 Loans & Advances to Customers (EUR bn) Customer Deposits (EUR bn) 201 190 19 1 192 24 2 240 233 235 Mar - 19 Dec - 19 Feb - 20 Mar - 20 Mar - 19 Dec - 19 Feb - 20 Mar - 20 Higher activity in all segments. SMEs and Corporates accelerated growth in the quarter, which continued in April NII down due to smaller ALCO portfolio and lower stock in wholesale banking Cost reduction efforts (reflected in a strong improvement in the efficiency ratio) and continued reduction in the cost of deposits
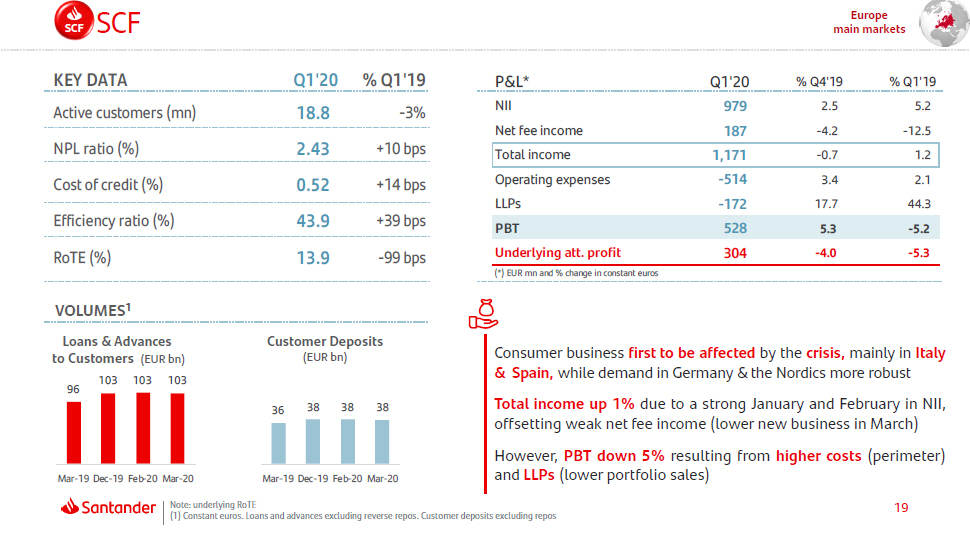
SCF SC F Europe main markets Consumer business first to be affected by the crisis, mainly in Italy & Spain, while demand in Germany & the Nordics more robust Total income up 1% due to a strong January and February in NII, offsetting weak net fee income (lower new business in March) However, PBT down 5% resulting from higher costs (perimeter) and LLPs (lower portfolio sales) KEY DATA Q1'20 % Q1'19 Active customers (mn) 18 . 8 - 3 % NPL ratio (%) 2.43 +10 bps P&L* Q1'20 % Q4'19 % Q1'19 NII 979 2.5 5 . 2 Net fee income 187 - 4.2 - 12 . 5 Total income 1 , 17 1 - 0.7 1 . 2 Operating expenses - 51 4 3.4 2 . 1 LLPs - 17 2 17.7 44 . 3 PBT 528 5.3 - 5 . 2 Underlying att. profit 304 - 4.0 - 5 . 3 (*) EUR mn and % change in constant euros Cost of credit (%) 0 . 5 2 +14 bps Efficiency ratio (%) 43 . 9 +39 bps RoTE (%) 13 . 9 - 99 bps VOLUMES 1 Loans & Advances to Customers (EUR bn) Customer Deposits (EUR bn) 96 10 3 10 3 103 Mar - 19 Dec - 19 Feb - 20 Mar - 20 36 19 Note: underlying RoTE (1) Constant euros. Loans and advances excluding reverse repos. Customer deposits excluding repos 3 8 3 8 38 Mar - 19 Dec - 19 Feb - 20 Mar - 20
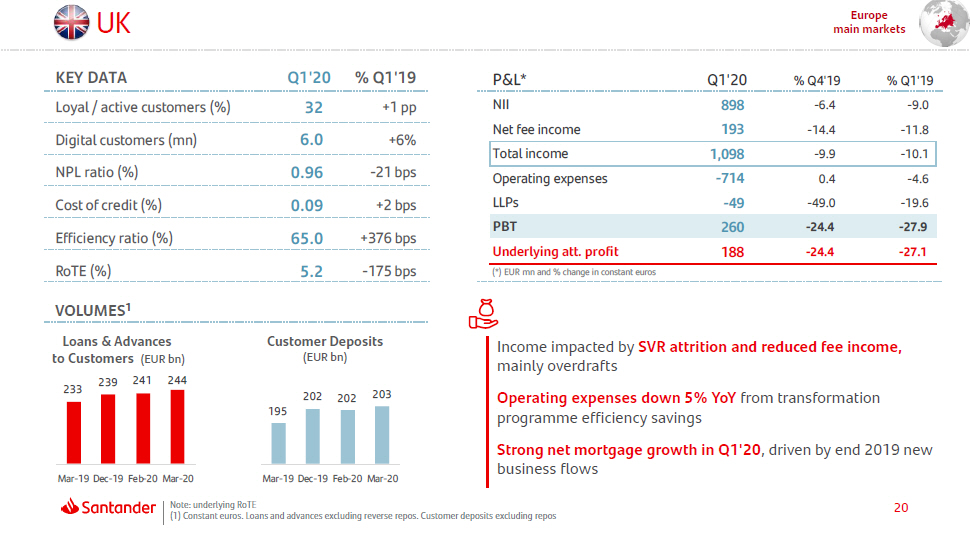
UK Europe main markets KEY DATA Q 1 ' 2 0 % Q1'19 Loyal / active customers (%) 3 2 +1 pp Digital customers (mn) 6 . 0 +6% NPL ratio (%) 0 . 9 6 - 21 bps P & L * Q 1 ' 20 % Q4'19 % Q1'19 NII 898 - 6 . 4 - 9 . 0 Net fee income 193 - 14 . 4 - 11 . 8 Total income 1 , 09 8 - 9 . 9 - 10 . 1 Operating expenses - 71 4 0 . 4 - 4 . 6 LLPs - 4 9 - 49 . 0 - 19 . 6 PBT 260 - 24 . 4 - 27 . 9 Underlying att. profit 188 - 24 . 4 - 27 . 1 (*) EUR mn and % change in constant euros Cost of credit (%) 0.09 +2 bps Efficiency ratio (%) 65.0 +376 bps RoTE (%) 5.2 - 175 bps VOLUMES 1 Loans & Advances to Customers (EUR bn) Customer Deposits (EUR bn) 233 239 24 1 244 Mar - 19 Dec - 19 Feb - 20 Mar - 20 195 20 Note: underlying RoTE (1) Constant euros. Loans and advances excluding reverse repos. Customer deposits excluding repos 202 202 203 Mar - 19 Dec - 19 Feb - 20 Mar - 20 Income impacted by SVR attrition and reduced fee income, mainly overdrafts Operating expenses down 5% YoY from transformation programme efficiency savings Strong net mortgage growth in Q1'20 , driven by end 2019 new business flows
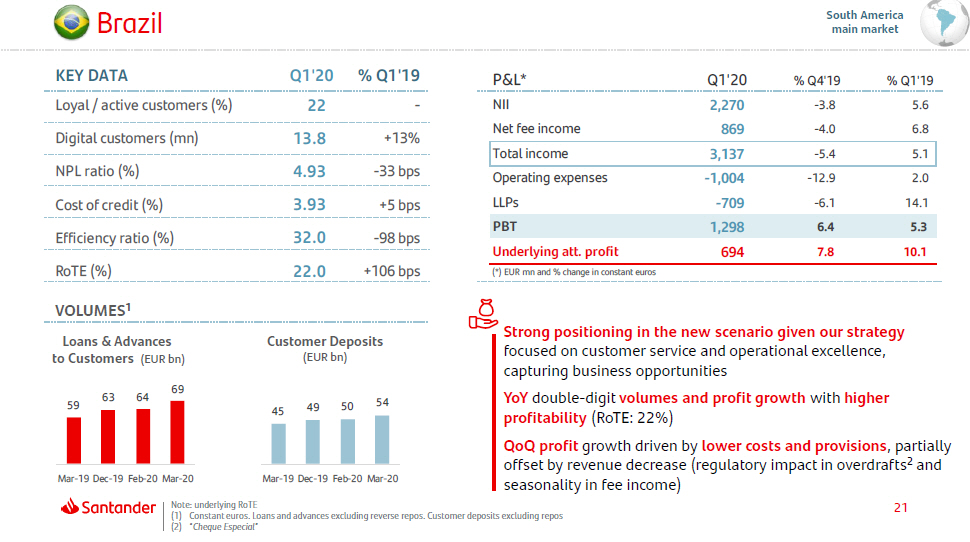
B r a z il South America main market KEY DATA Q 1 ' 2 0 % Q1'19 Loyal / active customers (%) 2 2 - Digital customers (mn) 13 . 8 +13% NPL ratio (%) 4 . 9 3 - 33 bps Cost of credit (%) 3 . 9 3 +5 bps P & L * Q 1 ' 20 % Q4'19 % Q1'19 NII 2 , 27 0 - 3 . 8 5 . 6 Net fee income 869 - 4 . 0 6 . 8 Total income 3 , 13 7 - 5 . 4 5 . 1 Operating expenses - 1 , 00 4 - 12 . 9 2 . 0 LLPs - 70 9 - 6 . 1 14 . 1 PBT 1 , 29 8 6 . 4 5 . 3 Underlying att. profit 694 7 . 8 10 . 1 (*) EUR mn and % change in constant euros Efficiency ratio (%) 32.0 - 98 bps RoTE (%) 22.0 +106 bps VOLUMES 1 Loans & Advances to Customers (EUR bn) Customer Deposits (EUR bn) 59 6 3 64 69 Mar - 19 Dec - 19 Feb - 20 Mar - 20 45 21 Note: underlying RoTE (1) Constant euros. Loans and advances excluding reverse repos. Customer deposits excluding repos (2) “ Cheque Especial ” 49 50 54 Mar - 19 Dec - 19 Feb - 20 Mar - 20 Strong positioning in the new scenario given our strategy focused on customer service and operational excellence, capturing business opportunities YoY double - digit volumes and profit growth with higher profitability (RoTE: 22%) QoQ profit growth driven by lower costs and provisions , partially offset by revenue decrease (regulatory impact in overdrafts 2 and seasonality in fee income)
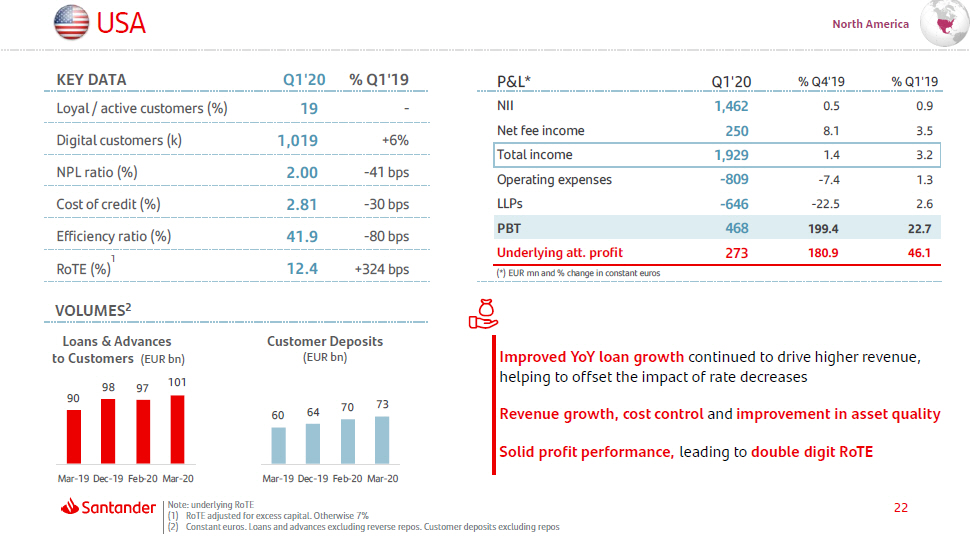
22 USA 1 North America Improved YoY loan growth continued to drive higher revenue, helping to offset the impact of rate decreases Revenue growth, cost control and improvement in asset quality Solid profit performance, leading to double digit RoTE KEY DATA Q1'20 % Q1'19 Loyal / active customers (%) 1 9 - Digital customers (k) 1 , 01 9 +6% NPL ratio (%) 2 . 0 0 - 41 bps Cost of credit (%) 2 . 8 1 - 30 bps Efficiency ratio (%) 41.9 - 80 bps RoTE (%) 12 . 4 +324 bps P&L* Q1'20 % Q4'19 % Q1'19 NII 1 , 46 2 0 . 5 0 . 9 Net fee income 250 8 . 1 3 . 5 Total income 1 , 92 9 1 . 4 3 . 2 Operating expenses - 80 9 - 7 . 4 1 . 3 LLPs - 64 6 - 22 . 5 2 . 6 PBT 468 199 . 4 22 . 7 Underlying att. profit 273 180 . 9 46 . 1 (*) EUR mn and % change in constant euros V O L U ME S 2 Customer Deposits (EUR bn) 90 9 8 97 Loans & Advances to Customers (EUR bn) 101 60 (2) Constant euros. Loans and advances excluding reverse repos. Customer deposits excluding repos 64 70 73 Mar - 19 Dec - 19 Feb - 20 Mar - 20 Mar - 19 Dec - 19 Feb - 20 Mar - 20 Note: underlying RoTE (1) RoTE adjusted for excess capital. Otherwise 7%
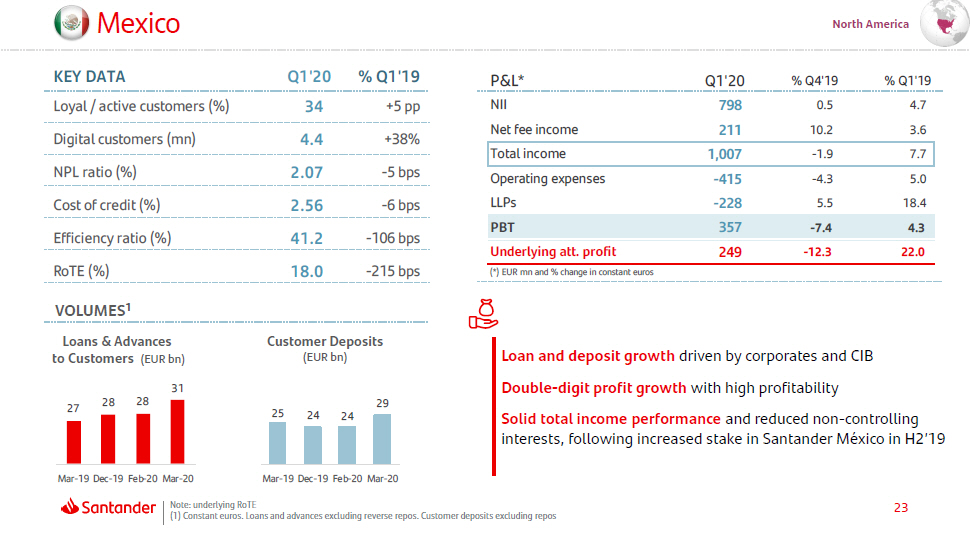
23 M e xi c o North America Loan and deposit growth driven by corporates and CIB Double - digit profit growth with high profitability Solid total income performance and reduced non - controlling interests, following increased stake in Santander México in H2’19 KEY DATA Q 1 ' 2 0 % Q1'19 Loyal / active customers (%) 3 4 +5 pp Digital customers (mn) 4 . 4 +38% NPL ratio (%) 2 . 0 7 - 5 bps P & L * Q 1 ' 20 % Q4'19 % Q1'19 NII Net fee income 798 211 0 . 5 10 . 2 4 . 7 3 . 6 Total income 1,007 - 1.9 7.7 Operating expenses LLPs - 41 5 - 22 8 - 4 . 3 5 . 5 5 . 0 18 . 4 PBT 357 - 7.4 4.3 - 1 2 . 3 22 . 0 U nd e r l y i n g a tt . p r o f i t 249 (*) EUR mn and % change in constant euros Note: underlying RoTE Cost of credit (%) 2.56 - 6 bps Efficiency ratio (%) 41.2 - 106 bps RoTE (%) 18.0 - 215 bps VOLUMES 1 Customer Deposits (EUR bn) 27 2 8 28 Loans & Advances to Customers (EUR bn) 31 Mar - 19 Dec - 19 Feb - 20 Mar - 20 25 (1) Constant euros. Loans and advances excluding reverse repos. Customer deposits excluding repos 24 24 29 Mar - 19 Dec - 19 Feb - 20 Mar - 20
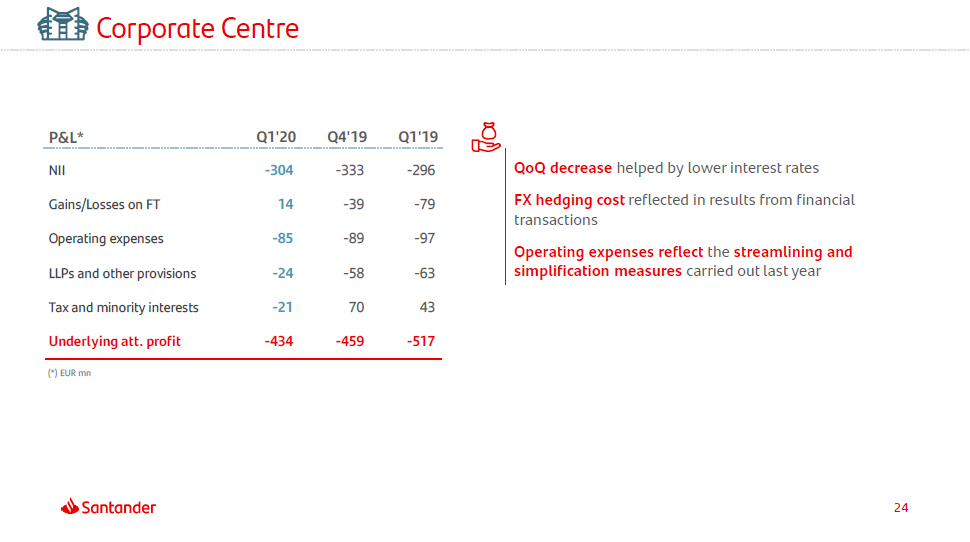
24 Corporate Centre P&L* Q1'20 Q4'19 Q1'19 QoQ decrease helped by lower interest rates FX hedging cost reflected in results from financial transactions Operating expenses reflect the streamlining and simplification measures carried out last year NII - 30 4 - 33 3 - 29 6 Gains/Losses on FT 14 - 3 9 - 7 9 Operating expenses - 8 5 - 8 9 - 9 7 LLPs and other provisions - 2 4 - 5 8 - 6 3 Tax and minority interests - 2 1 70 43 Underlying att. profit - 43 4 - 45 9 - 51 7 (*) EUR mn

2 5 1 Q1’20 Highlights 4 Appe n dix Ind e x 2 Group & Business areas review 3 COVID - 19 and Key takeaways
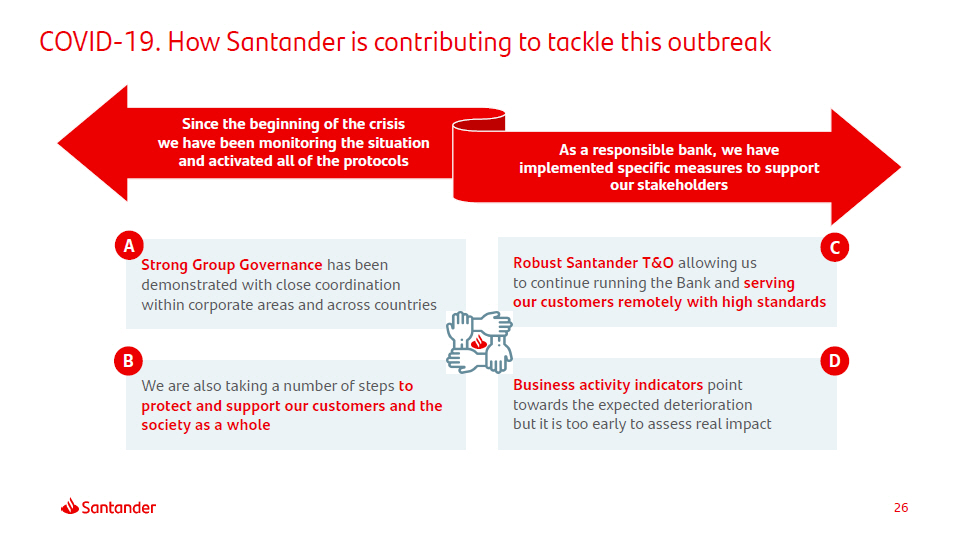
Since the beginning of the crisis we have been monitoring the situation and activated all of the protocols COVID - 19. How Santander is contributing to tackle this outbreak A Strong Group Governance has been demonstrated with close coordination within corporate areas and across countries B We are also taking a number of steps to protect and support our customers and the society as a whole As a responsible bank, we have implemented specific measures to support our stakeholders Robust Santander T&O allowing us C to continue running the Bank and serving our customers remotely with high standards D Business activity indicators point towards the expected deterioration but it is too early to assess real impact 26
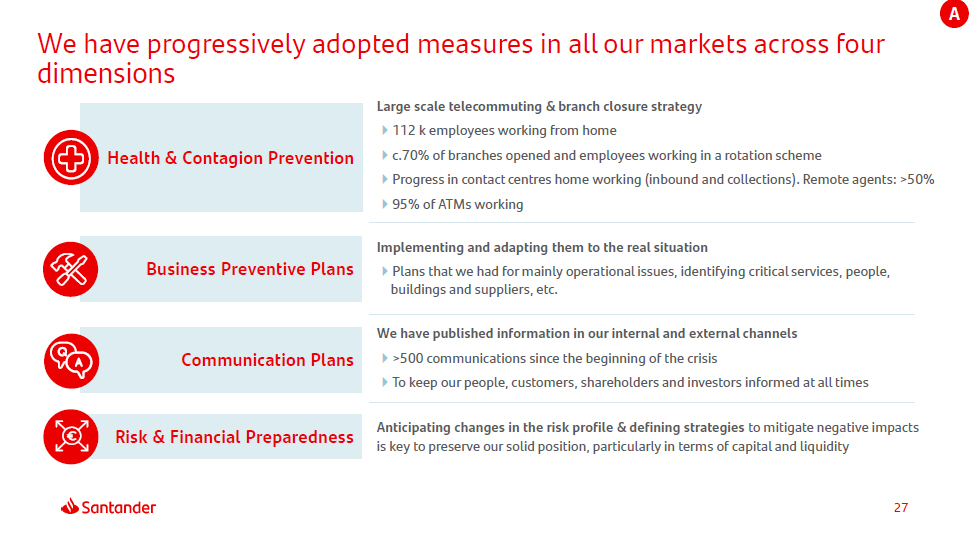
We have progressively adopted measures in all our markets across four dimensions Large scale telecommuting & branch closure strategy 112 k employees working from home c.70% of branches opened and employees working in a rotation scheme Progress in contact centres home working (inbound and collections). Remote agents: >50% 95% of ATMs working Implementing and adapting them to the real situation Plans that we had for mainly operational issues, identifying critical services, people, buildings and suppliers, etc. Anticipating changes in the risk profile & defining strategies to mitigate negative impacts is key to preserve our solid position, particularly in terms of capital and liquidity We have published information in our internal and external channels >500 communications since the beginning of the crisis To keep our people, customers, shareholders and investors informed at all times A Health & Contagion Prevention Business Preventive Plans Communication Plans Risk & Financial Preparedness 27
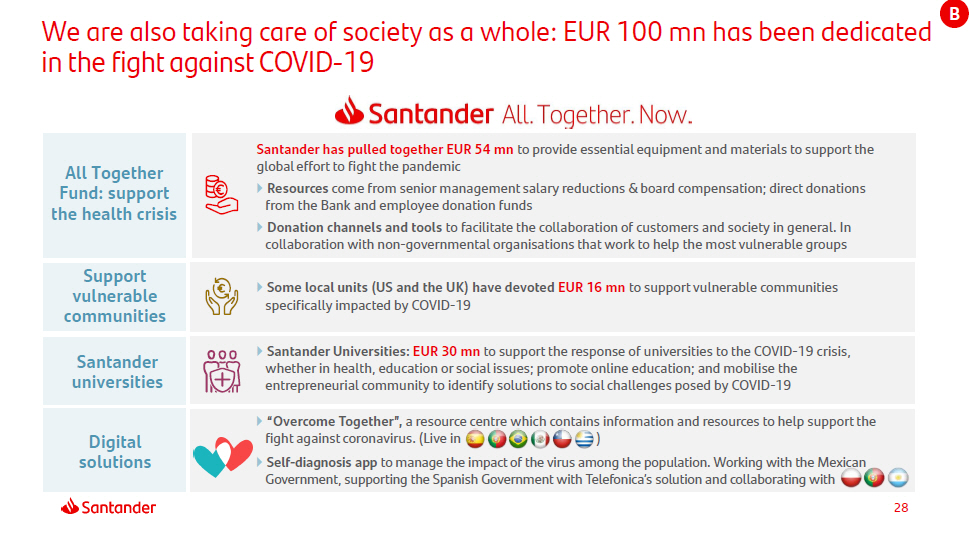
We are also taking care of society as a whole: EUR 100 mn has been dedicated in the fight against COVID - 19 B Santander has pulled together EUR 54 mn to provide essential equipment and materials to support the global effort to fight the pandemic Resources come from senior management salary reductions & board compensation; direct donations from the Bank and employee donation funds Donation channels and tools to facilitate the collaboration of customers and society in general. In collaboration with non - governmental organisations that work to help the most vulnerable groups Some local units (US and the UK) have devoted EUR 16 mn to support vulnerable communities specifically impacted by COVID - 19 Santander Universities: EUR 30 mn to support the response of universities to the COVID - 19 crisis, whether in health, education or social issues; promote online education; and mobilise the entrepreneurial community to identify solutions to social challenges posed by COVID - 19 “Overcome Together”, a resource centre which contains information and resources to help support the fight against coronavirus. (Live in ) Self - diagnosis app to manage the impact of the virus among the population. Working with the Mexican Government, supporting the Spanish Government with Telefonica’s solution and collaborating with All Together Fund: support the health crisis Support vulnerable comm u n i ti e s Santander u n iversi t ies Digital so l u t io n s 28
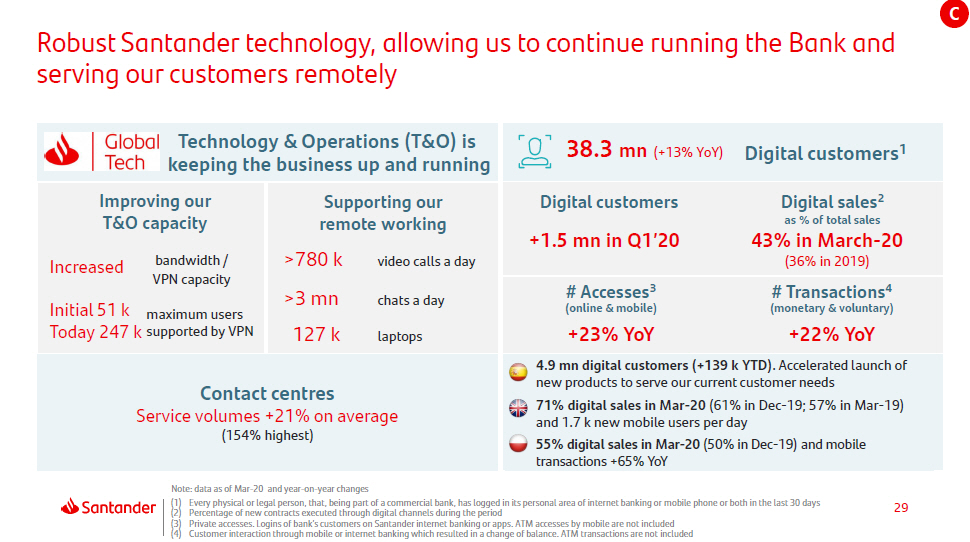
29 Robust Santander technology, allowing us to continue running the Bank and serving our customers remotely Note: data as of Mar - 20 and year - on - year changes (1) Every physical or legal person, that, being part of a commercial bank, has logged in its personal area of internet banking or mobile phone or both in the last 30 days (2) Percentage of new contracts executed through digital channels during the period (3) Private accesses. Logins of bank’s customers on Santander internet banking or apps. ATM accesses by mobile are not included (4) Customer interaction through mobile or internet banking which resulted in a change of balance. ATM transactions are not included C Technology & Operations (T&O) is keeping the business up and running Improving our T&O capacity Increased bandwidth / VPN capacity Initial 51 k maximum users Today 247 k supported by VPN Supporting our remote working >780 k video calls a day >3 mn chats a day 127 k laptops Contact centres Service volumes +21% on average (154% highest) 38.3 mn (+13% YoY) Digital customers 1 Digital customers Digital sales 2 as % of total sales +1.5 mn in Q1’20 43% in March - 20 (36% in 2019) # Accesses 3 # Transactions 4 (online & mobile) (monetary & voluntary) +23% YoY +22% YoY 4.9 mn digital customers (+139 k YTD) . Accelerated launch of new products to serve our current customer needs 71% digital sales in Mar - 20 (61% in Dec - 19; 57% in Mar - 19) and 1.7 k new mobile users per day 55% digital sales in Mar - 20 (50% in Dec - 19) and mobile transactions +65% YoY
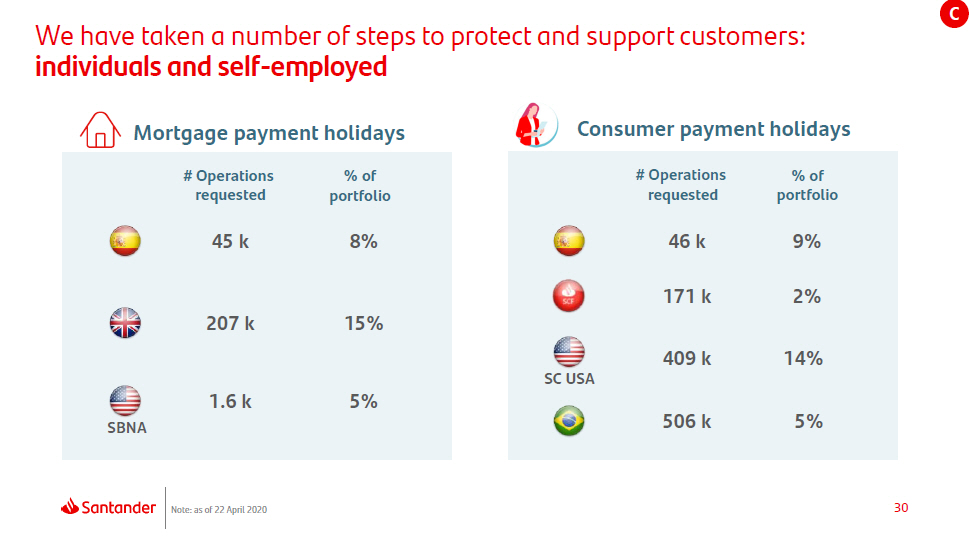
30 We have taken a number of steps to protect and support customers: individuals and self - employed C Mortgage payment holidays Consumer payment holidays 207 k 15% # Operations requested 45 k % of por t f olio 8% 1.6 k 5% SC USA # Operations requested % of por t f olio 171 k 2% 46 k 9% 409 k 14% S B NA 506 k 5% Note: as of 22 April 2020
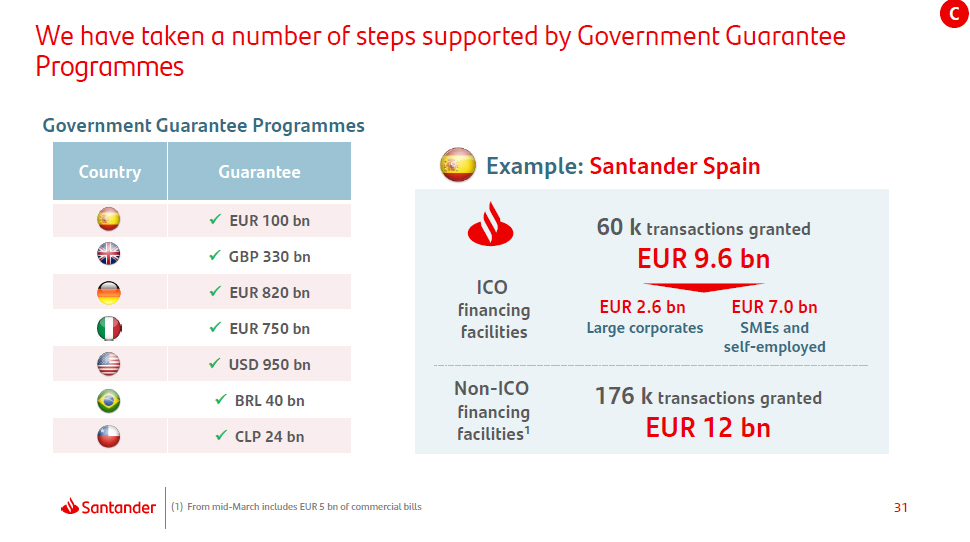
31 We have taken a number of steps supported by Government Guarantee Programmes C Country Guarantee x EUR 100 bn x GBP 330 bn x EUR 820 bn x EUR 750 bn x USD 950 bn x BRL 40 bn x CLP 24 bn ICO f i na nci n g facilities Government Guarantee Programmes Example: Santander Spain 60 k transactions granted EUR 9.6 bn EUR 2.6 bn EUR 7.0 bn Large corporates SMEs and s e l f - emp l o y ed Non - ICO f i na nci n g f a cili t ie s 1 176 k transactions granted EUR 12 bn (1) From mid - March includes EUR 5 bn of commercial bills
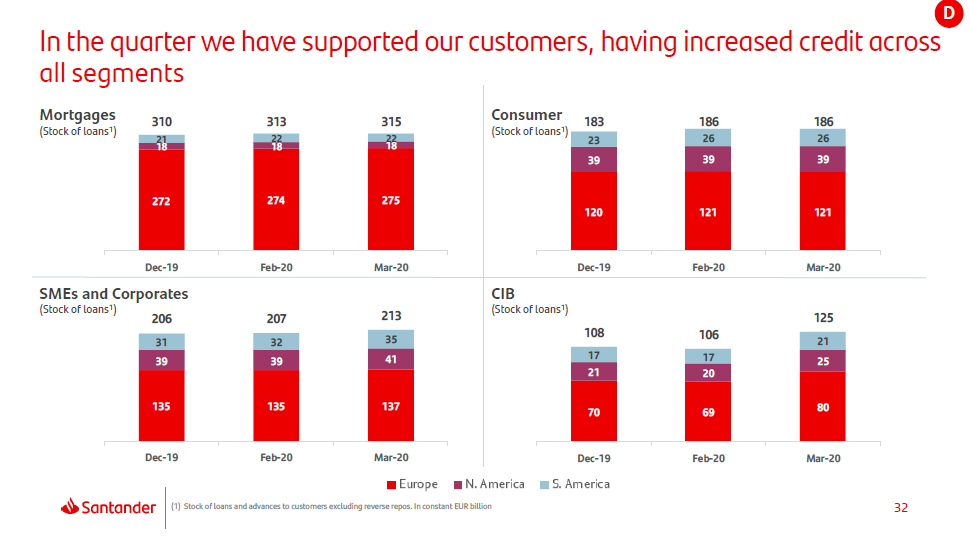
32 In the quarter we have supported our customers, having increased credit across all segments (1) Stock of loans and advances to customers excluding reverse repos. In constant EUR billion Mortgages (Stock of loans 1 ) Consumer (Stock of loans 1 ) SMEs and Corporates (Stock of loans 1 ) CIB (Stock of loans 1 ) 272 274 275 18 18 18 21 22 22 310 313 315 D e c - 1 9 F e b - 2 0 M a r - 2 0 120 121 121 39 39 39 23 26 26 183 186 186 Dec - 19 F e b - 2 0 M a r - 2 0 135 135 137 39 39 41 31 32 35 206 207 213 D e c - 1 9 F e b - 2 0 M a r - 2 0 70 69 80 21 20 25 17 17 21 108 106 125 Dec - 19 F e b - 2 0 M a r - 2 0 D
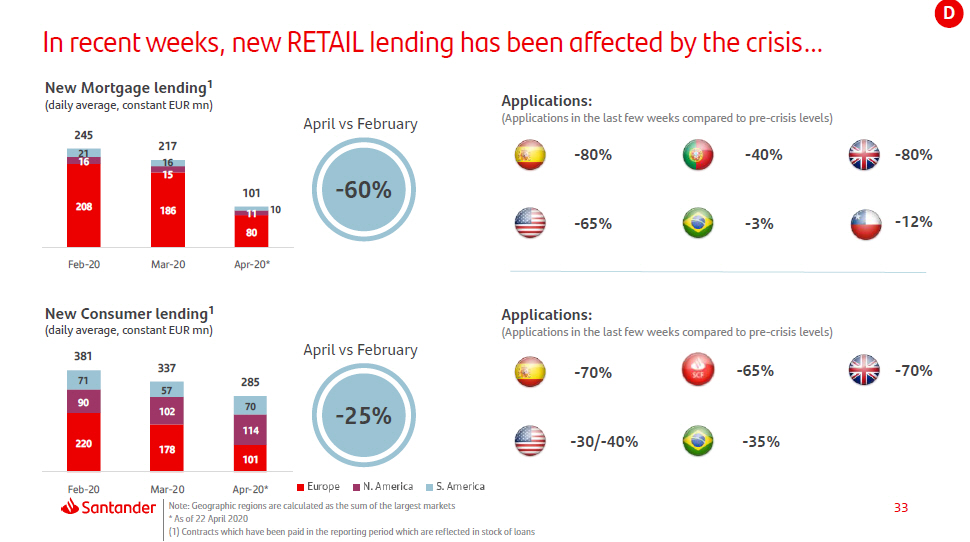
In recent weeks, new RETAIL lending has been affected by the crisis… New Mortgage lending 1 (daily average, constant EUR mn) Applications: (Applications in the last few weeks compared to pre - crisis levels) D April vs February - 60% 208 186 80 16 15 11 21 16 10 245 217 101 F e b - 2 0 Mar - 20 A p r - 2 0 * April vs February - 25% 220 178 101 90 102 114 71 57 70 337 285 F e b - 2 0 M a r - 2 0 A p r - 2 0 * New Consumer lending 1 (daily average, constant EUR mn) 381 - 80% - 40% - 80% - 65% - 3% - 70% - 65% - 30/ - 40% - 35% - 70% Applications: (Applications in the last few weeks compared to pre - crisis levels) - 12% 33 Note: Geographic regions are calculated as the sum of the largest markets * As of 22 April 2020 (1) Contracts which have been paid in the reporting period which are reflected in stock of loans
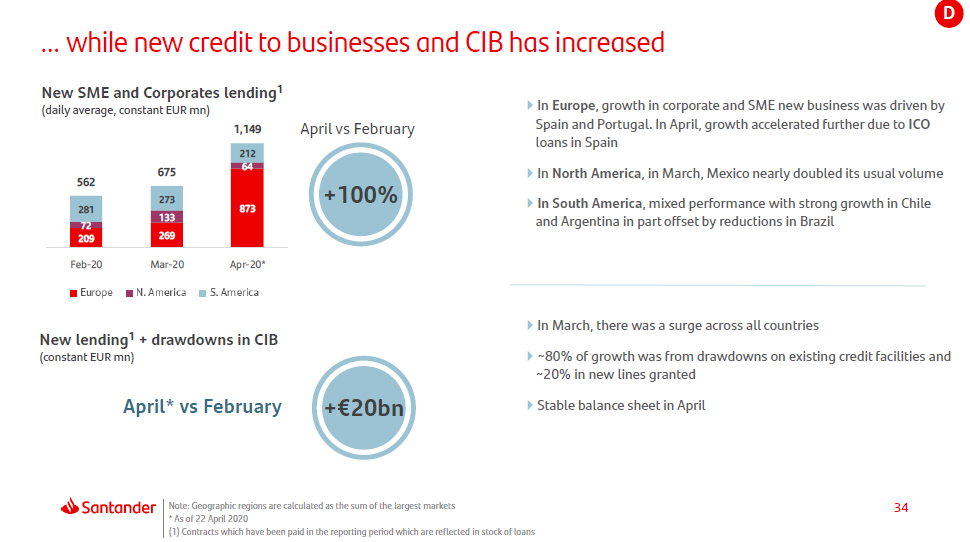
… while new credit to businesses and CIB has increased D In Europe , growth in corporate and SME new business was driven by Spain and Portugal. In April, growth accelerated further due to ICO loans in Spain In North America , in March, Mexico nearly doubled its usual volume In South America , mixed performance with strong growth in Chile and Argentina in part offset by reductions in Brazil In March, there was a surge across all countries ~80% of growth was from drawdowns on existing credit facilities and ~20% in new lines granted Stable balance sheet in April April vs February +100% New lending 1 + drawdowns in CIB (constant EUR mn) April* vs February + € 20bn 269 34 Note: Geographic regions are calculated as the sum of the largest markets * As of 22 April 2020 (1) Contracts which have been paid in the reporting period which are reflected in stock of loans 873 72 209 133 64 281 273 212 562 675 New SME and Corporates lending 1 (daily average, constant EUR mn) 1,14 9 F e b - 2 0 M ar - 2 0 A p r - 2 0 *
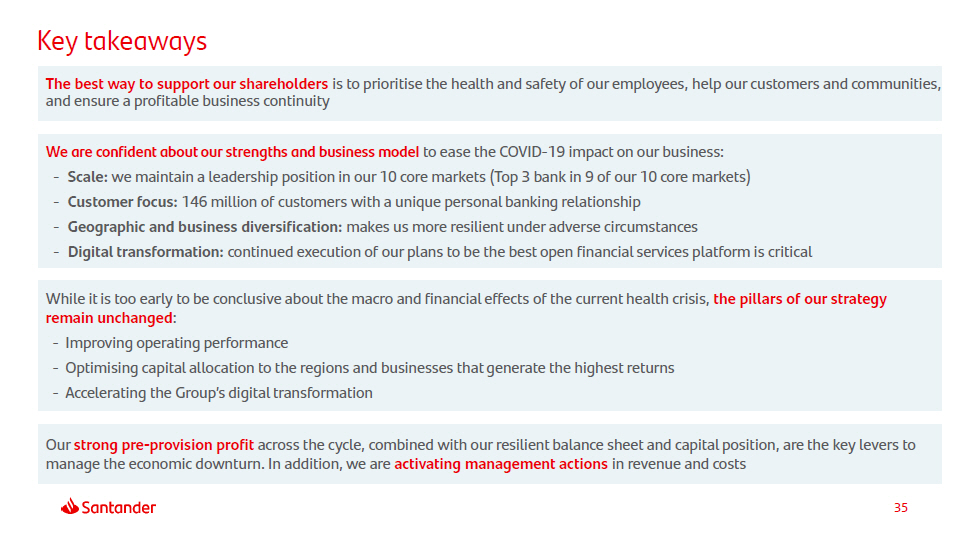
35 The best way to support our shareholders is to prioritise the health and safety of our employees, help our customers and communities, and ensure a profitable business continuity Key takeaways We are confident about our strengths and business model to ease the COVID - 19 impact on our business: - Scale: we maintain a leadership position in our 10 core markets (Top 3 bank in 9 of our 10 core markets) - Customer focus: 146 million of customers with a unique personal banking relationship - Geographic and business diversification: makes us more resilient under adverse circumstances - Digital transformation: continued execution of our plans to be the best open financial services platform is critical While it is too early to be conclusive about the macro and financial effects of the current health crisis, the pillars of our strategy remain unchanged : - Improving operating performance - Optimising capital allocation to the regions and businesses that generate the highest returns - Accelerating the Group’s digital transformation Our strong pre - provision profit across the cycle, combined with our resilient balance sheet and capital position, are the key levers to manage the economic downturn. In addition, we are activating management actions in revenue and costs

3 6 1 Q1’20 Highlights 4 Appe n dix Ind e x 2 Group & Business areas review 3 COVID - 19 and Key takeaways

37 Net capital gains and provisions Primary segments Secondary segments Other countries. Detail Balance sheet and capital management Yield on loans and cost of deposits NPL and coverage ratios and cost of credit Responsible Banking Quarterly income statements Glossary Appendix
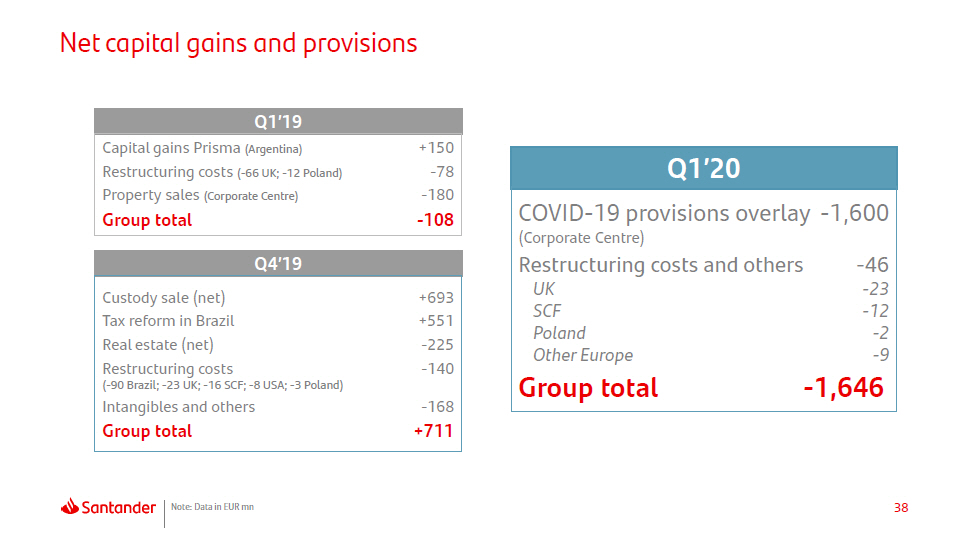
38 Note: Data in EUR mn Q1’20 COVID - 19 provisions overlay - 1,600 (Corporate Centre) Restructuring costs and others UK SCF Poland - 46 - 23 - 12 - 2 - 9 Other Europe Group total - 1,646 Net capital gains and provisions Q1’19 Capital gains Prisma (Argentina) +150 Restructuring costs ( - 66 UK; - 12 Poland) - 78 Property sales (Corporate Centre) - 180 Group total - 108 Q4’19 Custody sale (net) +693 Tax reform in Brazil +551 Real estate (net) - 225 Restructuring costs - 140 ( - 90 Brazil; - 23 UK; - 16 SCF; - 8 USA; - 3 Poland) Intangibles and others - 168 Group total +711

39 App e ndix Net capital gains and provisions Primary segments Secondary segments Other countries. Detail Balance sheet and capital management Yield on loans and cost of deposits NPL and coverage ratios and cost of credit Responsible Banking Quarterly income statements Glossary
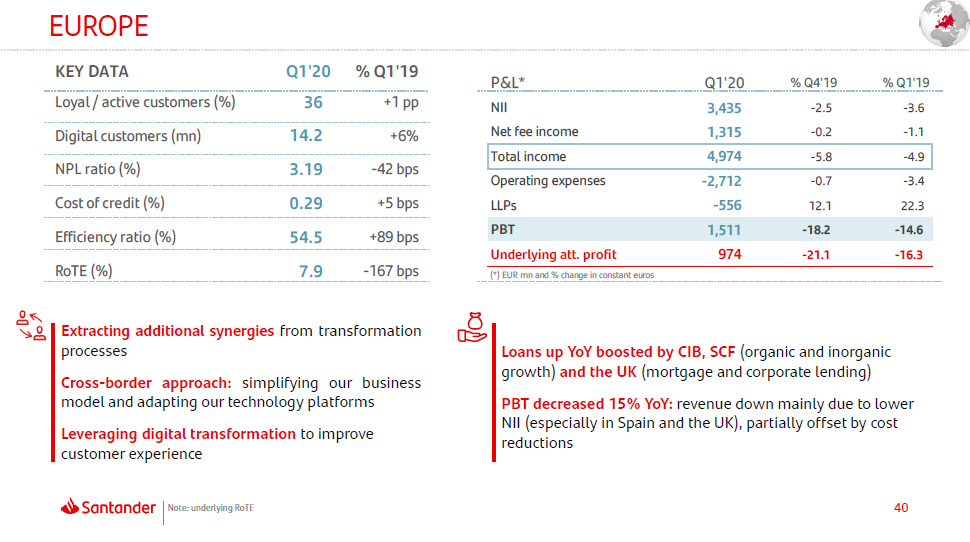
40 EUROPE Note: underlying RoTE Extracting additional synergies from transformation processes Cross - border approach: simplifying our business model and adapting our technology platforms Leveraging digital transformation to improve customer experience Loans up YoY boosted by CIB, SCF (organic and inorganic growth) and the UK (mortgage and corporate lending) PBT decreased 15% YoY: revenue down mainly due to lower NII (especially in Spain and the UK), partially offset by cost reductions KEY DATA Q 1 ' 2 0 % Q1'19 Loyal / active customers (%) 3 6 +1 pp Digital customers (mn) 14 . 2 +6% NPL ratio (%) 3 . 1 9 - 42 bps Cost of credit (%) 0 . 2 9 +5 bps Efficiency ratio (%) 54.5 +89 bps RoTE (%) 7.9 - 167 bps P & L * Q 1 ' 20 % Q4'19 % Q1'19 (*) EUR mn and % change in constant euros NII 3 , 43 5 - 2 . 5 - 3 . 6 Net fee income 1 , 31 5 - 0 . 2 - 1 . 1 Total income 4 , 97 4 - 5 . 8 - 4 . 9 Operating expenses - 2 , 71 2 - 0 . 7 - 3 . 4 LLPs - 55 6 12 . 1 22 . 3 PBT 1 , 51 1 - 18 . 2 - 14 . 6 Underlying att. profit 974 - 21 . 1 - 16 . 3
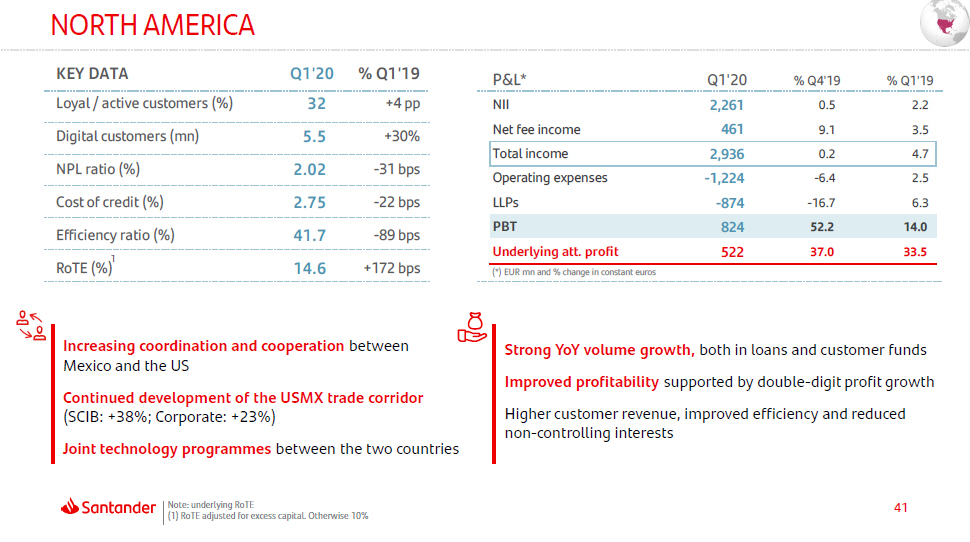
41 NORTH AMERICA 1 Note: underlying RoTE (1) RoTE adjusted for excess capital. Otherwise 10% Increasing coordination and cooperation between Mexico and the US Continued development of the USMX trade corridor (SCIB: +38%; Corporate: +23%) Joint technology programmes between the two countries Strong YoY volume growth, both in loans and customer funds Improved profitability supported by double - digit profit growth Higher customer revenue, improved efficiency and reduced non - controlling interests KEY DATA Q 1 ' 2 0 % Q1'19 Loyal / active customers (%) 3 2 +4 pp Digital customers (mn) 5 . 5 +30% NPL ratio (%) 2 . 0 2 - 31 bps Cost of credit (%) 2 . 7 5 - 22 bps Efficiency ratio (%) 41 . 7 - 89 bps RoTE (%) 14.6 +172 bps P & L * Q 1 ' 20 % Q4'19 % Q1'19 NII 2 , 26 1 0 . 5 2 . 2 Net fee income 461 9 . 1 3 . 5 Total income 2 , 93 6 0 . 2 4 . 7 Operating expenses - 1 , 22 4 - 6 . 4 2 . 5 LLPs - 87 4 - 16 . 7 6 . 3 PBT 824 52 . 2 14 . 0 Underlying att. profit 522 37 . 0 33 . 5 (*) EUR mn and % change in constant euros
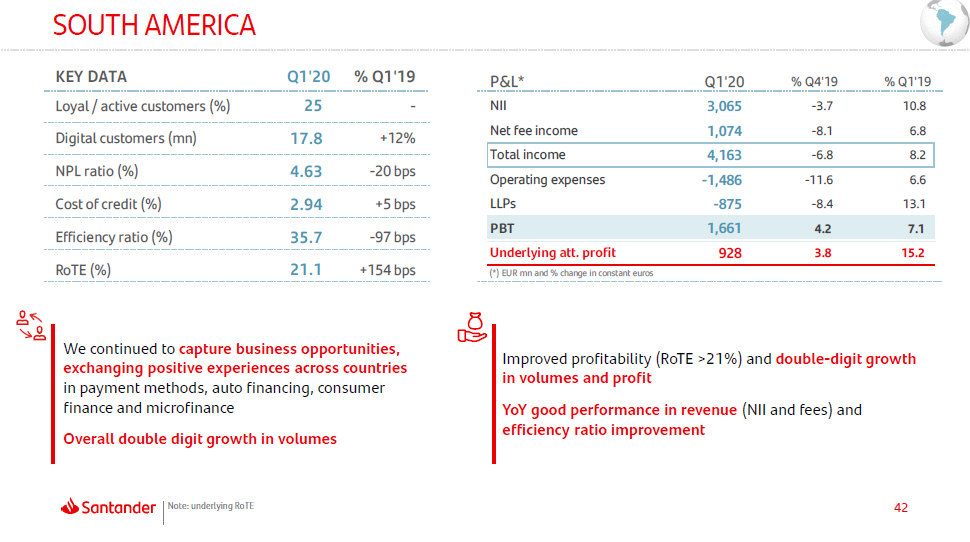
42 SOUTH AMERICA Note: underlying RoTE We continued to capture business opportunities, exchanging positive experiences across countries in payment methods, auto financing, consumer finance and microfinance Overall double digit growth in volumes Improved profitability (RoTE >21%) and double - digit growth in volumes and profit YoY good performance in revenue (NII and fees) and efficiency ratio improvement KEY DATA Q 1 ' 2 0 % Q1'19 Loyal / active customers (%) 2 5 - Digital customers (mn) 17 . 8 +12% NPL ratio (%) 4 . 6 3 - 20 bps Cost of credit (%) 2 . 9 4 +5 bps Efficiency ratio (%) 35.7 - 97 bps RoTE (%) 21.1 +154 bps P & L * Q 1 ' 20 % Q4'19 % Q1'19 NII 3 , 06 5 - 3 . 7 10 . 8 Net fee income 1 , 07 4 - 8 . 1 6 . 8 Total income 4 , 16 3 - 6 . 8 8 . 2 Operating expenses - 1 , 48 6 - 11 . 6 6 . 6 LLPs - 87 5 - 8 . 4 13 . 1 PBT 1 , 66 1 4 . 2 7 . 1 Underlying att. profit 928 3 . 8 15 . 2 (*) EUR mn and % change in constant euros

Appendix 43 Net capital gains and provisions Primary segments Secondary segments Other countries. Detail Balance sheet and capital management Yield on loans and cost of deposits NPL and coverage ratios and cost of credit Responsible Banking Quarterly income statements Glossary
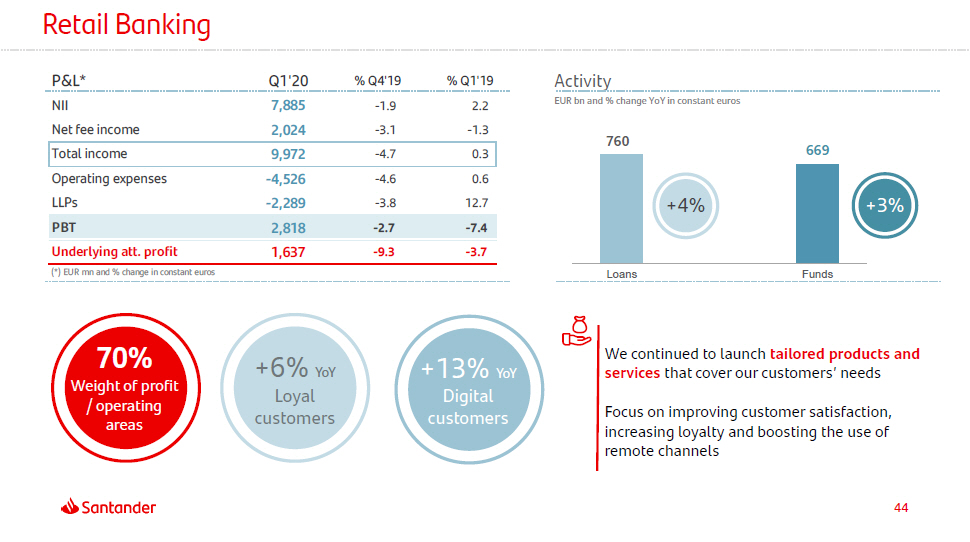
760 669 Loans Funds Retail Banking Activity EUR bn and % change YoY in constant euros 70% Weight of profit / operating areas +6% YoY Loyal customers +13% YoY Digital customers We continued to launch tailored products and services that cover our customers’ needs Focus on improving customer satisfaction, increasing loyalty and boosting the use of remote channels +4% +3% P&L* Q1'20 % Q4'19 % Q1'19 44 NII 7 , 88 5 - 1.9 2 . 2 Net fee income 2 , 02 4 - 3.1 - 1 . 3 Total income 9 , 97 2 - 4.7 0 . 3 Operating expenses - 4 , 52 6 - 4.6 0 . 6 LLPs - 2 , 28 9 - 3.8 12 . 7 PBT 2 , 81 8 - 2.7 - 7 . 4 Underlying att. profit 1 , 63 7 - 9.3 - 3 . 7 (*) EUR mn and % change in constant euros

45 (1) Constant euros. Loans = c ustomer loans excluding reverse repos. Customer deposits excluding repos Corporate & Investment Banking 417 450 310 374 361 374 1,198 110 1,300 102 Q 1 ' 1 9 Q 1 ' 2 0 Global Transaction Banking Global Debt Financing Capital & Other Global Markets +9% - 6% +3% +21% + 8 % Total income (Constant EUR mn) In a tough trading environment CIB stood by its clients, swiftly providing liquidity lines (EUR 15 bn in March) and other financing and transactional solutions YoY profit growth mainly driven by double digit increase of core traditional corporate banking activities (GTB, GDF) Global Markets marginally down in an extremely challenging environment. Excluding valuation adjustments, up 40% YoY V O L U ME S 1 S CIB P&L* Q1'20 % Q4'19 % Q1'19 NII Net fee income 671 404 - 5 . 1 10 . 2 8 . 6 20 . 2 Total income 1 , 30 0 - 7 . 6 8 . 6 Operating expenses LLPs - 53 6 - 4 - 1 1 . 0 - 9 6 . 5 - 1 . 0 - 4 8 . 6 P BT 745 15 . 2 19 . 0 Underlying att. profit 491 21 . 3 21 . 4 (*) EUR mn and % change in constant euros 2.0% RoRWA 41.2% Effi cien c y ratio 97 Stock (EUR bn) 108 106 125 Loans C us t ome r deposits 77 75 77 92 Mar - 19 Dec - 19 Feb - 20 Mar - 20
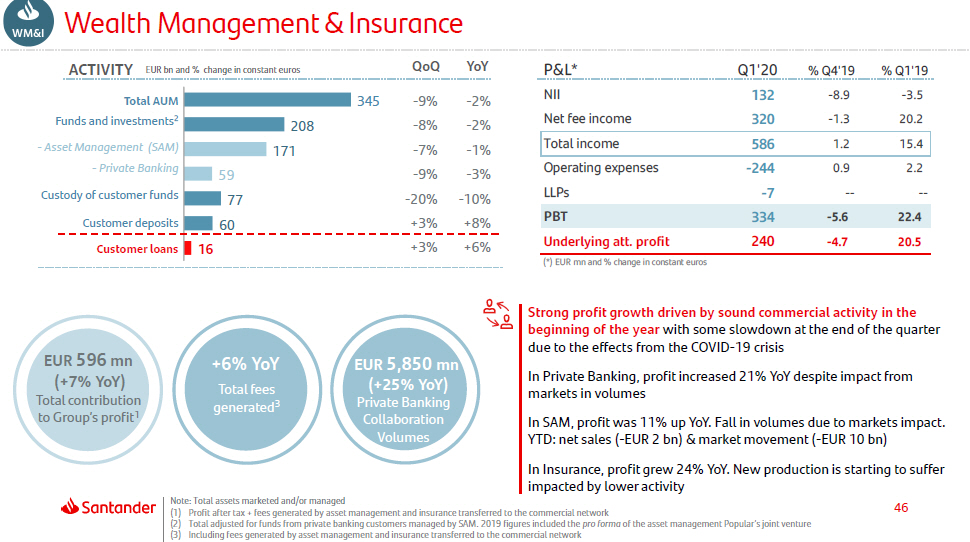
46 Wealth Management & Insurance P&L* Q1'20 % Q4'19 % Q1'19 N I I 132 - 8 . 9 - 3 . 5 LL Ps - 7 -- -- Net fee income 320 - 1 . 3 20 . 2 Total income 586 1 . 2 15 . 4 Operating expenses - 24 4 0 . 9 2 . 2 PBT 334 - 5.6 22 . 4 Underlying att. profit 240 - 4.7 20 . 5 (*) EUR mn and % change in constant euros Note: Total assets marketed and/or managed (1) Profit after tax + fees generated by asset management and insurance transferred to the commercial network (2) Total adjusted for funds from private banking customers managed by SAM. 2019 figures included the pro forma of the asset management Popular’s joint venture (3) Including fees generated by asset management and insurance transferred to the commercial network 171 59 77 60 16 Customer loans EUR bn and % change in constant euros Fu - Asset Management (SAM) - Private Banking Custody of customer funds Customer deposits ACTIVITY Qo Q Y o Y Strong profit growth driven by sound commercial activity in the beginning of the year with some slowdown at the end of the quarter due to the effects from the COVID - 19 crisis In Private Banking, profit increased 21% YoY despite impact from markets in volumes In SAM, profit was 11% up YoY. Fall in volumes due to markets impact. YTD: net sales ( - EUR 2 bn) & market movement ( - EUR 10 bn) In Insurance, profit grew 24% YoY. New production is starting to suffer impacted by lower activity EUR 596 mn (+7% YoY) Total contribution to Group’s profit 1 Total AUM 345 - 9% - 2% nds and i n v e stment s 2 20 8 - 8 % - 2% - 7 % - 1% - 9 % - 3% - 20 % - 10% +3 % +8% +3 % +6% +6% YoY Total fees g e ne r a t ed 3 EUR 5,850 mn (+25% YoY) Private Banking Collaboration Volumes
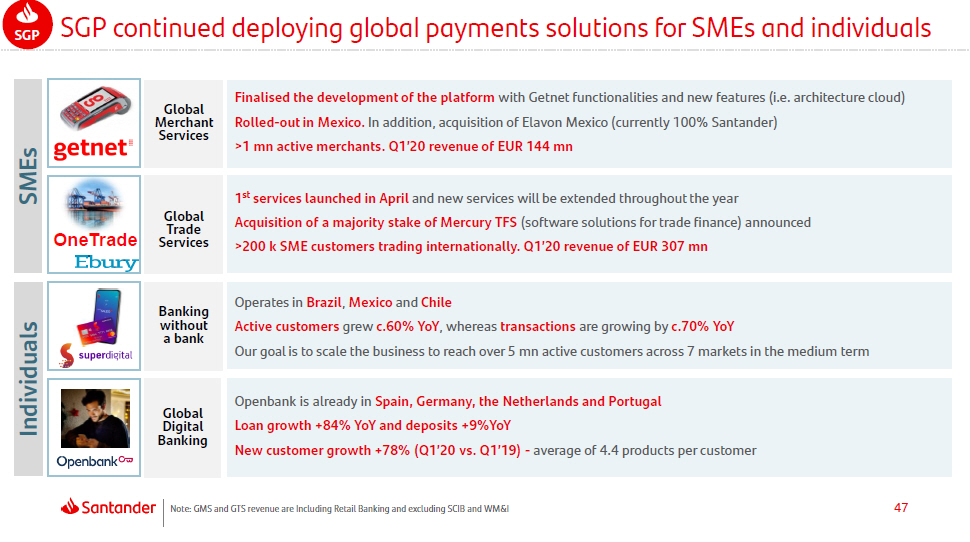
47 Indi v idua ls OneTrade SME s G l o b al Me r c ha nt Se r vi c e s G l o b al T r a d e Se r vi c e s B a n king w it h out a bank G l o b al Di gi t al B a n king Finalised the development of the platform with Getnet functionalities and new features (i.e. architecture cloud) Rolled - out in Mexico. In addition, acquisition of Elavon Mexico (currently 100% Santander) >1 mn active merchants. Q1’20 revenue of EUR 144 mn 1 st services launched in April and new services will be extended throughout the year Acquisition of a majority stake of Mercury TFS (software solutions for trade finance) announced >200 k SME customers trading internationally. Q1’20 revenue of EUR 307 mn Operates in Brazil , Mexico and Chile Active customers grew c.60% YoY , whereas transactions are growing by c.70% YoY Our goal is to scale the business to reach over 5 mn active customers across 7 markets in the medium term Openbank is already in Spain, Germany, the Netherlands and Portugal Loan growth +84% YoY and deposits +9%YoY New customer growth +78% (Q1’20 vs. Q1’19) - average of 4.4 products per customer SGP continued deploying global payments solutions for SMEs and individuals SGP Note: GMS and GTS revenue are Including Retail Banking and excluding SCIB and WM&I

48 Appendix Net capital gains and provisions Primary segments Secondary segments Other countries. Detail Balance sheet and capital management Yield on loans and cost of deposits NPL and coverage ratios and cost of credit Responsible Banking Quarterly income statements Glossary
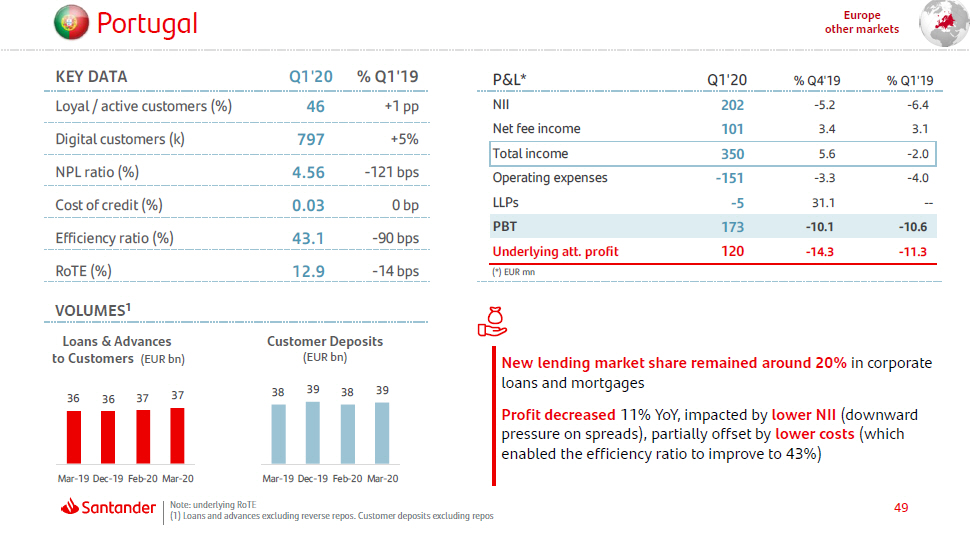
49 P or t ug a l Europe other markets KEY DATA Q 1 ' 2 0 % Q1'19 Loyal / active customers (%) 4 6 +1 pp Digital customers (k) 79 7 +5% NPL ratio (%) 4 . 5 6 - 121 bps P & L * Q 1 ' 20 % Q4'19 % Q1'19 NII 202 - 5 . 2 - 6.4 Net fee income 101 3 . 4 3.1 Total income 350 5 . 6 - 2.0 Operating expenses - 15 1 - 3 . 3 - 4.0 LLPs - 5 31 . 1 -- PBT 173 - 10.1 - 10.6 Underlying att. profit 120 - 14 . 3 - 11.3 (*) EUR mn Cost of credit (%) 0.03 0 bp Efficiency ratio (%) 43.1 - 90 bps RoTE (%) 12.9 - 14 bps VOLUMES 1 Loans & Advances to Customers (EUR bn) Customer Deposits (EUR bn) 36 36 37 37 38 38 3 9 39 Mar - 19 Dec - 19 Feb - 20 Mar - 20 Mar - 19 Dec - 19 Feb - 20 Mar - 20 Note: underlying RoTE (1) Loans and advances excluding reverse repos. Customer deposits excluding repos New lending market share remained around 20% in corporate loans and mortgages Profit decreased 11% YoY, impacted by lower NII (downward pressure on spreads), partially offset by lower costs (which enabled the efficiency ratio to improve to 43%)
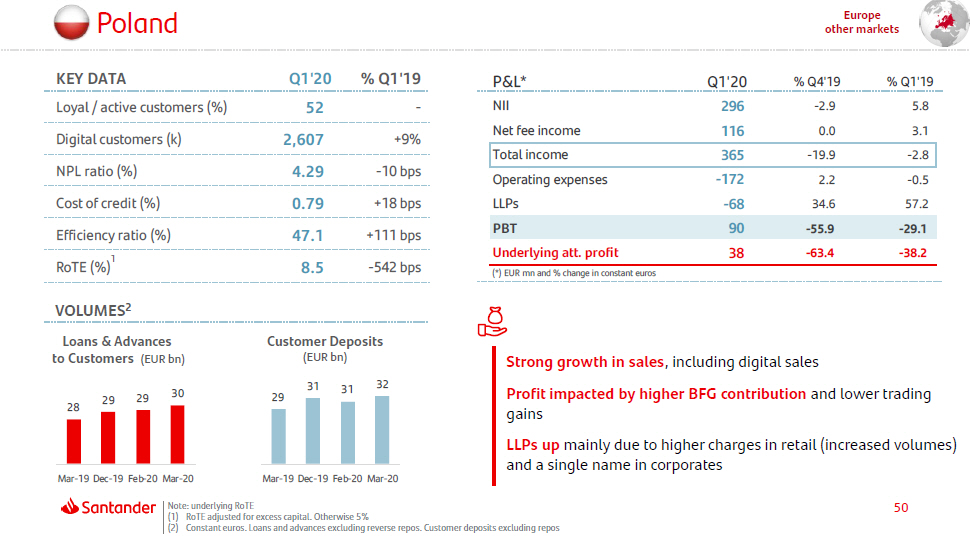
50 P oland Europe other markets Strong growth in sales , including digital sales Profit impacted by higher BFG contribution and lower trading gains LLPs up mainly due to higher charges in retail (increased volumes) and a single name in corporates KEY DATA Q 1 ' 2 0 % Q1'19 Underlying att. profit 38 - 63.4 - 38.2 (*) EUR mn and % change in constant euros Loyal / active customers (%) 5 2 - Digital customers (k) 2 , 60 7 +9% NPL ratio (%) 4 . 2 9 - 10 bps Cost of credit (%) 0 . 7 9 +18 bps Efficiency ratio (%) 47 . 1 +111 bps RoTE (%) 1 8 . 5 - 542 bps VOLUMES 2 P&L* Q 1 ' 20 % Q4'19 % Q1'19 NII 296 - 2.9 5 . 8 Net fee income 116 0.0 3 . 1 Total income 365 - 19.9 - 2 . 8 Operating expenses - 17 2 2.2 - 0 . 5 LLPs - 6 8 34.6 57 . 2 PBT 90 - 55.9 - 29 . 1 Loans & Advances to Customers (EUR bn) Customer Deposits (EUR bn) 28 29 29 30 29 (2) Constant euros. Loans and advances excluding reverse repos. Customer deposits excluding repos 31 31 32 Mar - 19 Dec - 19 Feb - 20 Mar - 20 Mar - 19 Dec - 19 Feb - 20 Mar - 20 Note: underlying RoTE (1) RoTE adjusted for excess capital. Otherwise 5%
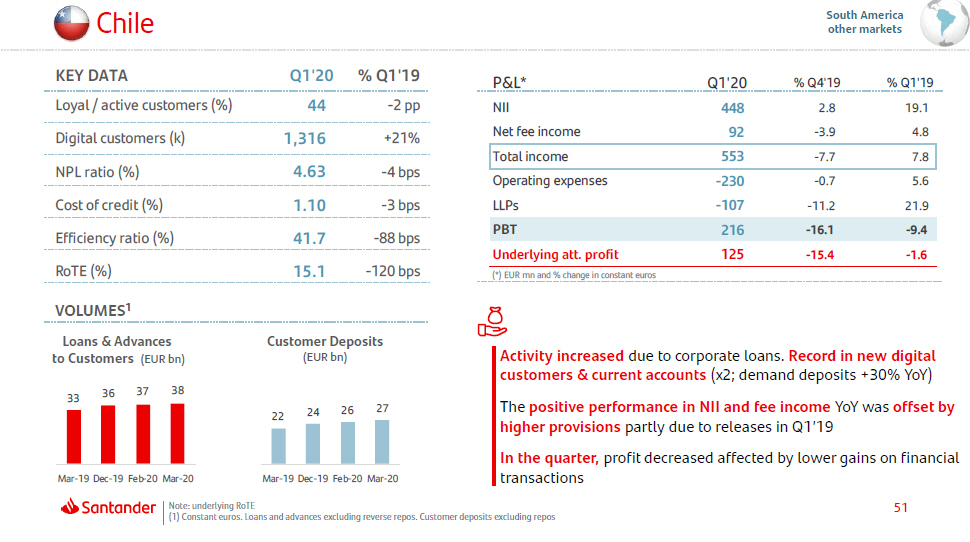
Chile South America other markets KEY DATA Q 1 ' 2 0 % Q1'19 Loyal / active customers (%) 4 4 - 2 pp Digital customers (k) 1 , 31 6 +21% NPL ratio (%) 4 . 6 3 - 4 bps Cost of credit (%) 1 . 1 0 - 3 bps P & L * Q 1 ' 20 % Q4'19 % Q1'19 (*) EUR mn and % change in constant euros NII 448 2 . 8 19 . 1 Net fee income 92 - 3 . 9 4 . 8 Total income 553 - 7 . 7 7 . 8 Operating expenses - 23 0 - 0 . 7 5 . 6 LLPs - 10 7 - 11 . 2 21 . 9 PBT 216 - 16 . 1 - 9 . 4 Underlying att. profit 125 - 15 . 4 - 1 . 6 Note: underlying RoTE Efficiency ratio (%) 41.7 - 88 bps RoTE (%) 15.1 - 120 bps VOLUMES 1 Loans & Advances to Customers (EUR bn) Customer Deposits (EUR bn) 33 36 3 7 38 Mar - 19 Dec - 19 Feb - 20 Mar - 20 22 (1) Constant euros. Loans and advances excluding reverse repos. Customer deposits excluding repos 24 26 27 Mar - 19 Dec - 19 Feb - 20 Mar - 20 Activity increased due to corporate loans. Record in new digital customers & current accounts (x2; demand deposits +30% YoY) The positive performance in NII and fee income YoY was offset by higher provisions partly due to releases in Q1’19 In the quarter, profit decreased affected by lower gains on financial transactions 51
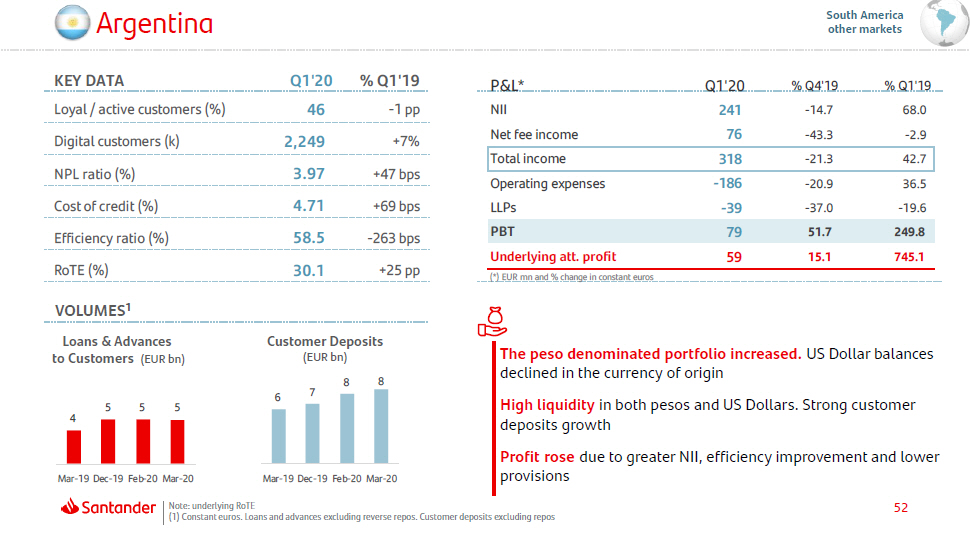
Argentina South America other markets The peso denominated portfolio increased. US Dollar balances declined in the currency of origin High liquidity in both pesos and US Dollars. Strong customer deposits growth Profit rose due to greater NII, efficiency improvement and lower KEY DATA Q1'20 % Q1'19 Loyal / active customers (%) 4 6 - 1 pp P&L* Q1'20 % Q4'19 % Q1'19 N I I 241 - 1 4 . 7 68 . 0 PBT 79 51.7 249.8 Underlying att. profit 59 15.1 745.1 (*) EUR mn and % change in constant euros Digital customers (k) 2,249 +7% Net fee income 76 - 43.3 - 2 . 9 Total income 318 - 21.3 42 . 7 NPL ratio (%) 3.97 +47 bps Operating expenses - 18 6 - 20.9 36 . 5 Cost of credit (%) 4.71 +69 bps LLPs - 3 9 - 37.0 - 19 . 6 Efficiency ratio (%) 58.5 - 263 bps RoTE (%) 30.1 +25 pp VOLUMES 1 Loans & Advances to Customers (EUR bn) Customer Deposits (EUR bn) 4 5 5 5 6 p r o visi on s Mar - 19 Dec - 19 Feb - 20 Mar - 20 Mar - 19 Dec - 19 Feb - 20 Mar - 20 52 Note: underlying RoTE (1) Constant euros. Loans and advances excluding reverse repos. Customer deposits excluding repos 7 8 8
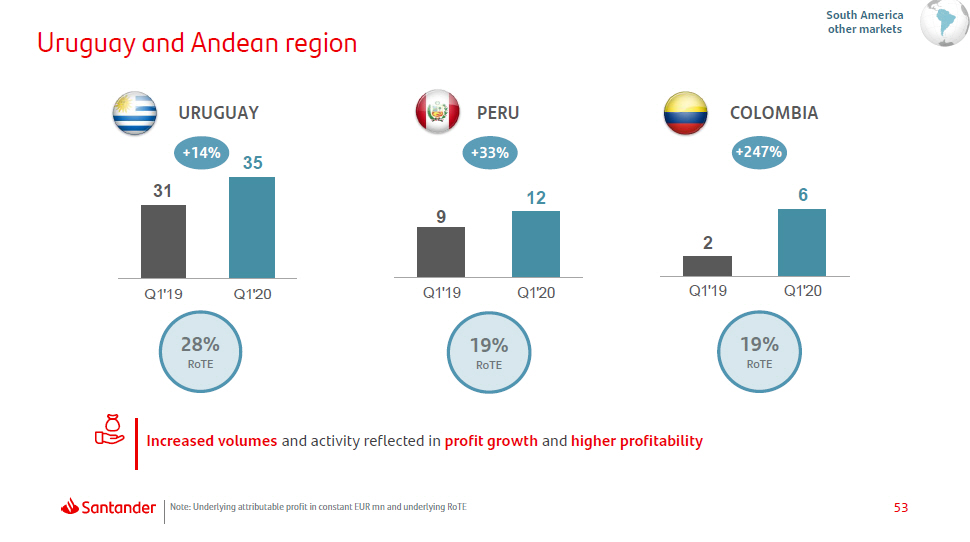
53 28% RoTE 31 35 Q 1 ' 1 9 Q 1 ' 2 0 Uruguay and Andean region Note: Underlying attributable profit in constant EUR mn and underlying RoTE 19% RoTE +14% URUG U AY 19% RoTE South America other markets Increased volumes and activity reflected in profit growth and higher profitability PERU +33% C O LOM BIA +247% 9 12 Q 1 ' 1 9 Q 1 ' 2 0 2 6 Q 1 ' 1 9 Q 1 ' 2 0

54 App e ndix Net capital gains and provisions Primary segments Secondary segments Other countries. Detail Balance sheet and capital management Yield on loans and cost of deposits NPL and coverage ratios and cost of credit Responsible Banking Quarterly income statements Glossary
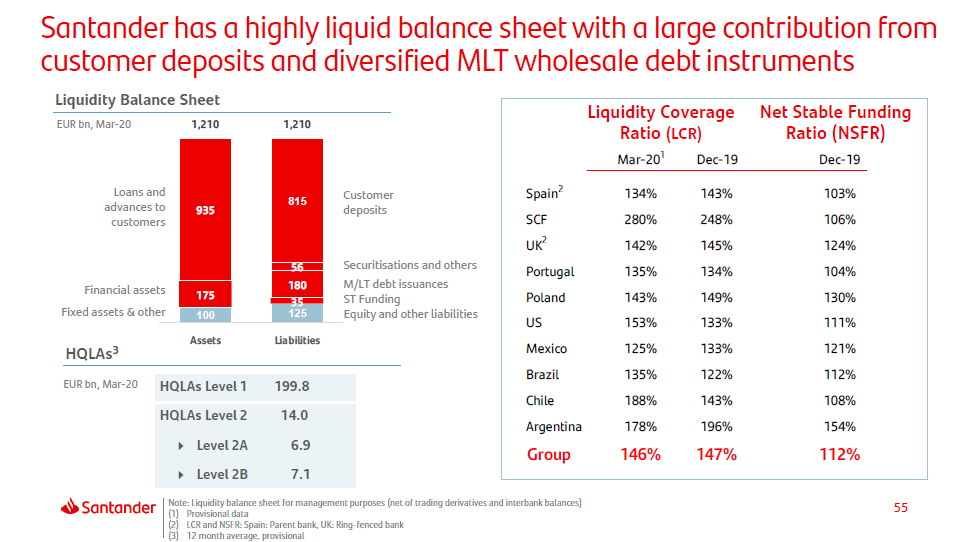
55 Santander has a highly liquid balance sheet with a large contribution from customer deposits and diversified MLT wholesale debt instruments Loans and advances to customers Financial assets Fixed assets & other C ustome r deposits Securitisations and others M/LT debt issuances ST Funding Equity and other liabilities Note: Liquidity balance sheet for management purposes (net of trading derivatives and interbank balances) (1) Provisional data (2) LCR and NSFR: Spain: Parent bank, UK: Ring - fenced bank (3) 12 month average, provisional HQLAs 3 EUR bn, Mar - 20 HQLAs Level 1 1 9 9.8 HQLAs Level 2 1 4.0 Level 2A 6 .9 Level 2B 7.1 100 125 175 935 56 180 35 815 Liquidity Balance Sheet EUR bn, Mar - 20 1,210 1,210 A ss e t s Liabilities Liquidity Coverage Ratio (LCR) Net Stable Funding Ratio (NSFR) Mar - 20 1 Dec - 19 D e c - 1 9 Spain 2 134% 143% 103% SCF 280% 248% 106% UK 2 142% 145% 124% Portugal 135% 134% 104% Poland 143% 149% 130% US 153% 133% 111% Mexico 125% 133% 121% Brazil 135% 122% 112% Chile 188% 143% 108% Argentina 178% 196% 154% Group 146% 147% 112%
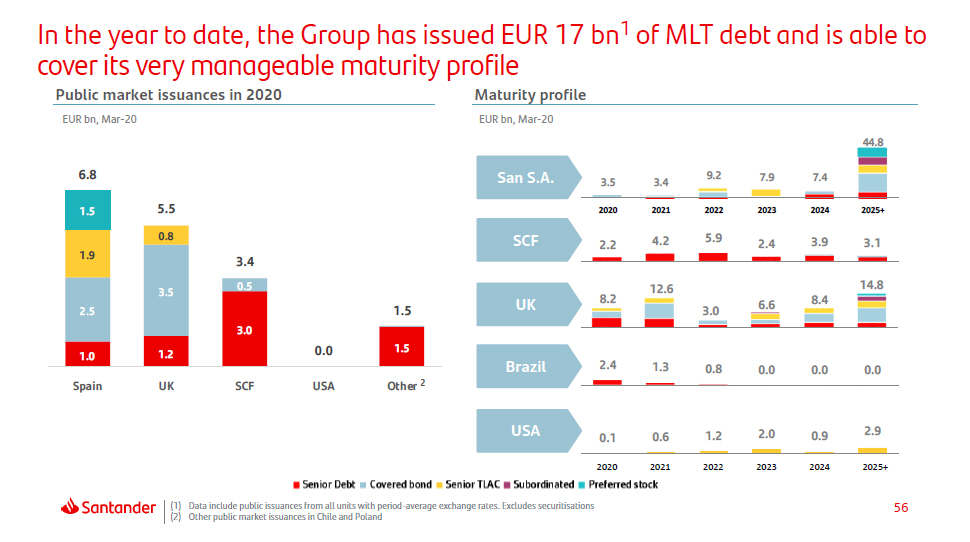
56 In the year to date, the Group has issued EUR 17 bn 1 of MLT debt and is able to cover its very manageable maturity profile (1) Data include public issuances from all units with period - average exchange rates. Excludes securitisations (2) Other public market issuances in Chile and Poland Public market issuances in 2020 EUR bn, Mar - 20 UK SCF Brazil U SA 2020 2021 2022 2023 2024 2025+ Maturity profile EUR bn, Mar - 20 44. 8 2 . 2 4 . 2 5 . 9 2 . 4 3 . 9 3 . 1 8 . 2 12 . 6 3 . 0 6 . 6 8 . 4 14 . 8 2.4 1.3 0.8 0.0 0.0 0.0 0.1 0.6 1.2 2.0 0.9 2.9 1 . 0 1 . 2 3 . 0 1 . 5 2 . 5 3 . 5 0 . 5 1 . 9 0 . 8 6 . 8 San S.A. 3.5 3.4 9.2 7.9 7.4 1.5 5.5 2020 2021 2022 2023 2024 2025+ 3 . 4 0 . 0 1 . 5 S p a i n UK S C F U S A Other 2
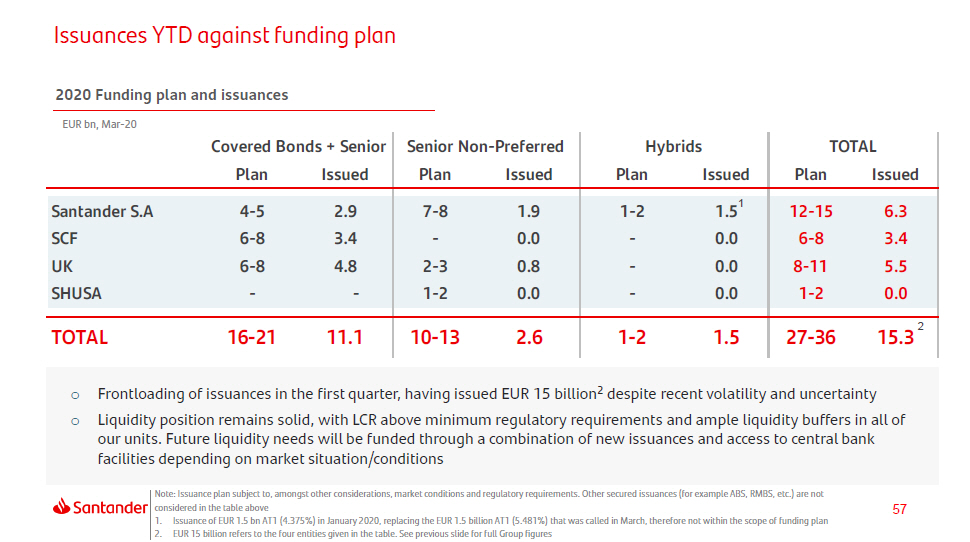
57 Issuances YTD against funding plan Note: Issuance plan subject to, amongst other considerations, market conditions and regulatory requirements. Other secured issuances (for example ABS, RMBS, etc.) are not considered in the table above 1. Issuance of EUR 1.5 bn AT1 (4.375%) in January 2020, replacing the EUR 1.5 billion AT1 (5.481%) that was called in March, therefore not within the scope of funding plan 2. EUR 15 billion refers to the four entities given in the table. See previous slide for full Group figures o Frontloading of issuances in the first quarter, having issued EUR 15 billion 2 despite recent volatility and uncertainty o Liquidity position remains solid, with LCR above minimum regulatory requirements and ample liquidity buffers in all of our units. Future liquidity needs will be funded through a combination of new issuances and access to central bank facilities depending on market situation/conditions 2020 Funding plan and issuances EUR bn, Mar - 20 Covered Bonds + Senior Plan Issued Senior Non - Preferred Plan Issued Hybrids Plan Issued TOTAL Plan Issued Santander S.A 4 - 5 2.9 7 - 8 1.9 1 - 2 1.5 1 12 - 15 6.3 SCF 6 - 8 3.4 - 0.0 - 0.0 6 - 8 3.4 UK 6 - 8 4.8 2 - 3 0.8 - 0.0 8 - 11 5.5 SHUSA - - 1 - 2 0.0 - 0.0 1 - 2 0.0 TOTAL 16 - 21 11.1 10 - 13 2.6 1 - 2 1.5 27 - 36 15.3 2
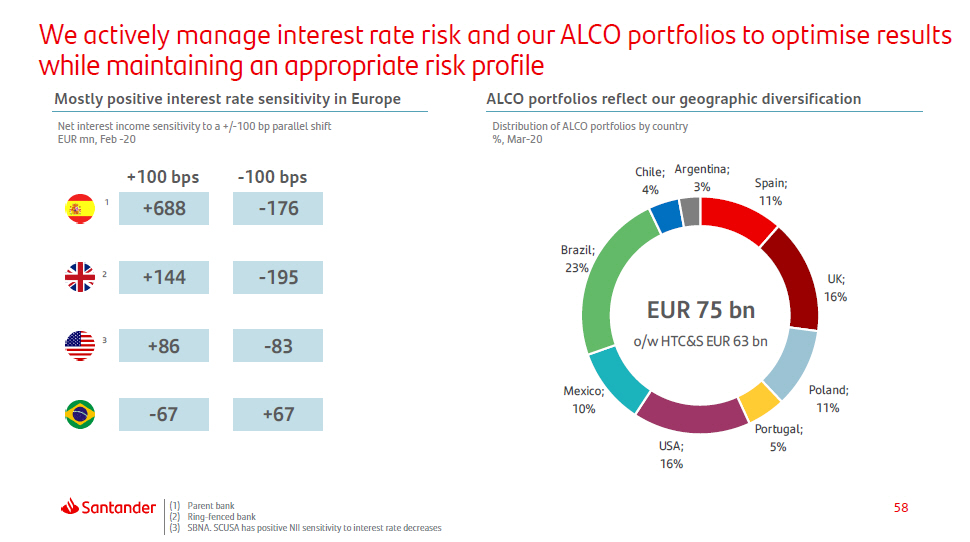
58 We actively manage interest rate risk and our ALCO portfolios to optimise results while maintaining an appropriate risk profile (1) Parent bank (2) Ring - fenced bank (3) SBNA. SCUSA has positive NII sensitivity to interest rate decreases Mostly positive interest rate sensitivity in Europe ALCO portfolios reflect our geographic diversification Distribution of ALCO portfolios by country %, Mar - 20 1 2 3 +688 +144 +86 - 67 - 176 - 195 - 83 +67 Net interest income sensitivity to a +/ - 100 bp parallel shift EUR mn, Feb - 20 +100 bps - 100 bps S p a i n ; 11% UK; 16% P o l a n d ; 11% P o r t u g a l ; 5% U S A ; 16% M e x i c o ; 10% B r a z i l ; 23% 4% Chile; Argentina; 3% EUR 75 bn o/w HTC&S EUR 63 bn
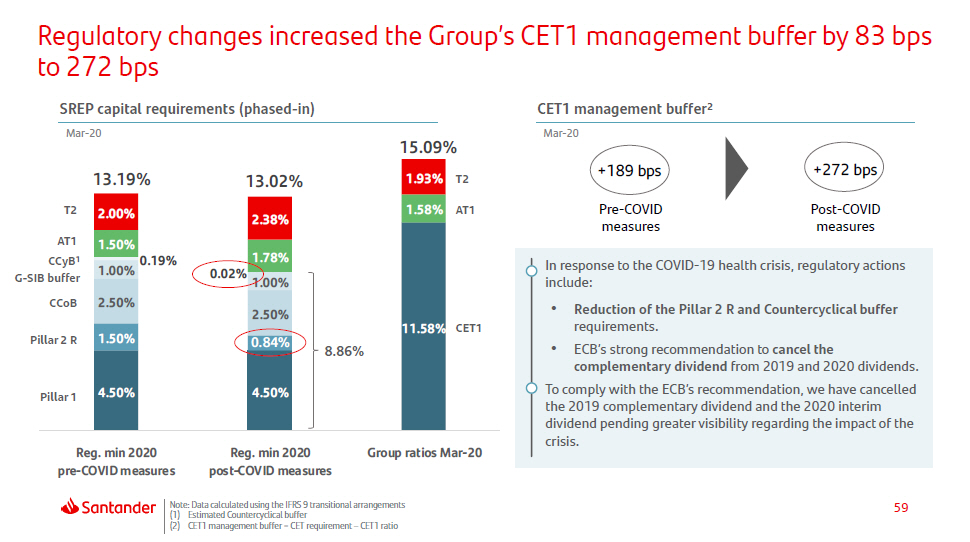
59 Regulatory changes increased the Group’s CET1 management buffer by 83 bps to 272 bps Note: Data calculated using the IFRS 9 transitional arrangements (1) Estimated Countercyclical buffer (2) CET1 management buffer = CET requirement – CET1 ratio 4.50% 4.50% 11 . 58 % 1.50% 0.84% 2.50% 2.50% 1.00% 1.00% 0 . 19 % 0 . 02 % 1.50% 1.78% 2.00% 2.38% 13 . 19 % 13 . 02 % 15 . 09 % Reg. min 2020 pre - COVID measures Reg. min 2020 post - COVID measures Group ratios Mar - 20 C ET 1 Pillar 2 R Pillar 1 G - SIB buffer CCoB SREP capital requirements (phased - in) CET1 management buffer 2 Ma r - 2 0 Ma r - 20 measures measures In response to the COVID - 19 health crisis, regulatory actions include: • Reduction of the Pillar 2 R and Countercyclical buffer requirements. • ECB’s strong recommendation to cancel the complementary dividend from 2019 and 2020 dividends. To comply with the E CB’s recommendation, we have cancelled the 2019 complementary dividend and the 2020 interim dividend pending greater visibility regarding the impact of the crisis. T2 AT1 C C yB 1 8 .8 6% 1.93% T2 +189 bps +272 bps 1.58% AT1 Pre - COVID P os t - CO VID
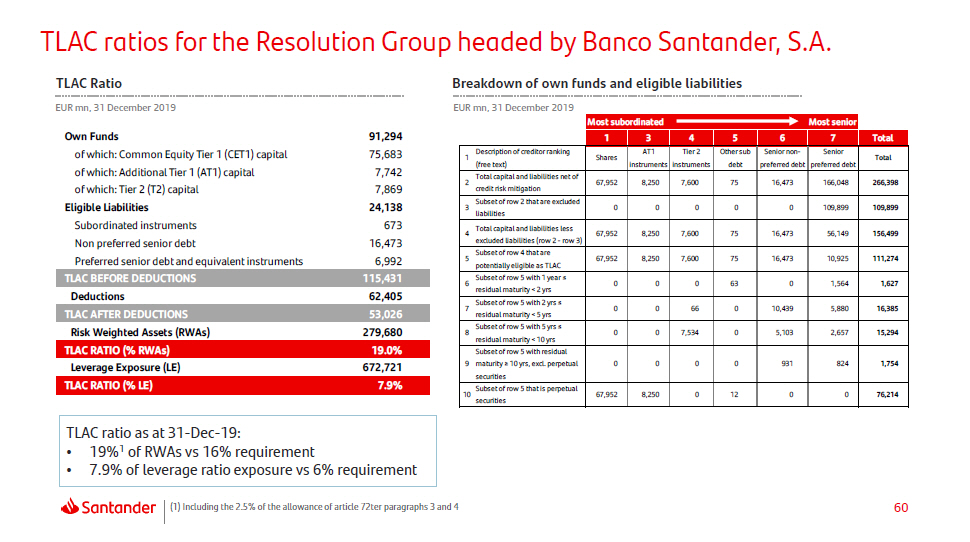
60 TLAC ratios for the Resolution Group headed by Banco Santander, S.A. TLAC Ratio Breakdown of own funds and eligible liabilities EUR mn, 31 December 2019 EUR mn, 31 December 2019 TLAC ratio as at 31 - Dec - 19: • 19% 1 of RWAs vs 16% requirement • 7.9% of leverage ratio exposure vs 6% requirement (1) Including the 2.5% of the allowance of article 72ter paragraphs 3 and 4 Own Funds of which: Common Equity Tier 1 (CET1) capital of which: Additional Tier 1 (AT1) capital of which: Tier 2 (T2) capital Eligible Liabilities Subordinated instruments Non preferred senior debt Preferred senior debt and equivalent instruments 91 , 29 4 75 , 68 3 7,742 7,869 24 , 13 8 673 16 , 47 3 6,992 TLAC BEFORE DEDUCTIONS 115,431 D e du c t i on s 62 , 40 5 TLAC AFTER DEDUCTIONS 53,026 Risk Weighted Assets (RWAs) 279,680 TLAC RATIO (% RWAs) 19.0% Leverage Exposure (LE) 672,721 TLAC RATIO (% LE) 7.9% Most subordinated Most senior 1 3 4 5 6 7 Total 1 Description of creditor ranking (free text) S h a r e s AT1 instruments Tier 2 instruments Other sub debt Senior non - preferred debt Senior preferred debt Total 2 Total capital and liabilities net of credit risk mitigation 67 , 95 2 8 , 25 0 7 , 60 0 75 16 , 47 3 166,048 266 , 39 8 3 Subset of row 2 that are excluded liabilities 0 0 0 0 0 109,899 109 , 89 9 4 Total capital and liabilities less excluded liabilities (row 2 - row 3) 67 , 95 2 8 , 25 0 7 , 60 0 75 16 , 47 3 56,149 156 , 49 9 5 Subset of row 4 that are potentially eligible as TLAC 67 , 95 2 8 , 25 0 7 , 60 0 75 16 , 47 3 10,925 111 , 27 4 6 Subset of row 5 with 1 year ≤ residual maturity < 2 yrs 0 0 0 63 0 1,564 1 , 62 7 7 Subset of row 5 with 2 yrs ≤ residual maturity < 5 yrs 0 0 66 0 10 , 43 9 5,880 16 , 38 5 8 Subset of row 5 with 5 yrs ≤ residual maturity < 10 yrs 0 0 7 , 53 4 0 5 , 10 3 2,657 15 , 29 4 Subset of row 5 with residual 9 maturity ≥ 10 yrs, excl. perpetual securities 0 0 0 0 931 824 1 , 75 4 10 Subset of row 5 that is perpetual securities 67 , 95 2 8 , 25 0 0 12 0 0 76 , 21 4

Net capital gains and provisions Primary segments Secondary segments Other countries. Detail Balance sheet and capital management Yield on loans and cost of deposits NPL and coverage ratios and cost of credit Responsible Banking Quarterly income statements Glossary 61 App e ndix
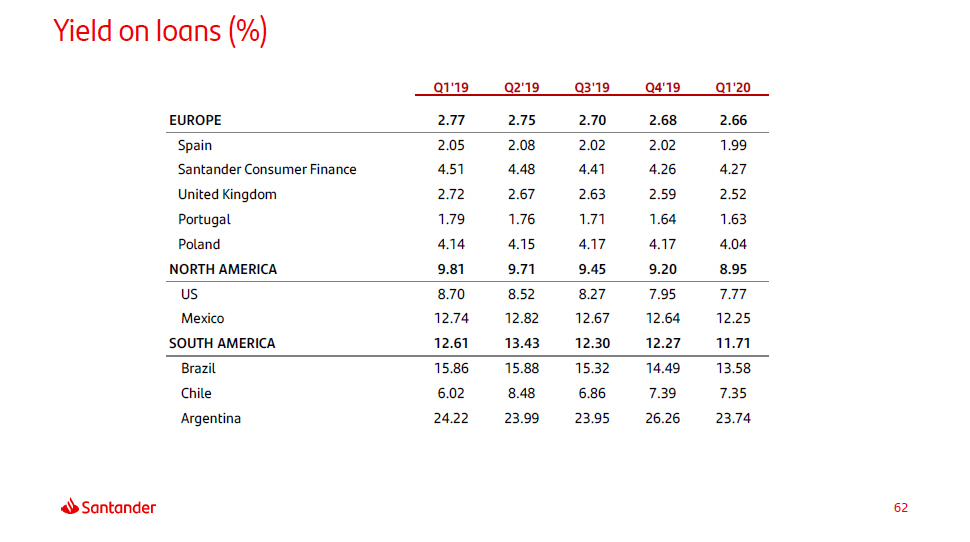
Yield on loans (%) 62 Q1'19 Q2'19 Q3'19 Q4'19 Q1'20 EUROPE 2 . 77 2.75 2.70 2.68 2.66 Spain 2 . 05 2.08 2.02 2.02 1.99 Santander Consumer Finance 4 . 51 4.48 4.41 4.26 4.27 United Kingdom 2 . 72 2.67 2.63 2.59 2.52 Portugal 1 . 79 1.76 1.71 1.64 1.63 Poland 4 . 14 4.15 4.17 4.17 4.04 NORTH AMERICA 9 . 81 9.71 9.45 9.20 8.95 US 8 . 70 8.52 8.27 7.95 7.77 Mexico 12 . 74 12.82 12.67 12.64 12.25 SOUTH AMERICA 12 . 61 13.43 12.30 12.27 11.71 Brazil 15 . 86 15.88 15.32 14.49 13.58 Chile 6 . 02 8.48 6.86 7.39 7.35 Argentina 24 . 22 23.99 23.95 26.26 23.74

Cost of deposits (%) 63 Q1'19 Q2'19 Q3'19 Q4'19 Q1'20 EUROPE 0 . 42 0.42 0 . 41 0.41 0.39 Spain 0 . 14 0.14 0 . 13 0.13 0.06 Santander Consumer Finance 0 . 60 0.61 0 . 60 0.58 0.57 United Kingdom 0 . 67 0.70 0 . 70 0.69 0.69 Portugal 0 . 14 0.12 0 . 10 0.10 0.08 Poland 0 . 89 0.89 0 . 78 0.74 0.65 NORTH AMERICA 1 . 94 1.91 1 . 99 1.76 1.56 US 0 . 95 0.87 0 . 96 0.86 0.73 Mexico 3 . 95 4.08 4 . 14 3.68 3.54 SOUTH AMERICA 4 . 20 4.43 3 . 82 3.42 3.16 Brazil 4 . 70 4.70 4 . 55 3.71 3.16 Chile 1 . 62 2.01 1 . 63 1.47 1.35 Argentina 9 . 93 11.09 10 . 90 12.29 10.64

Net capital gains and provisions Primary segments Secondary segments Other countries. Detail Balance sheet and capital management Yield on loans and cost of deposits NPL and coverage ratios and cost of credit Responsible Banking Quarterly income statements Glossary 64 App e ndix
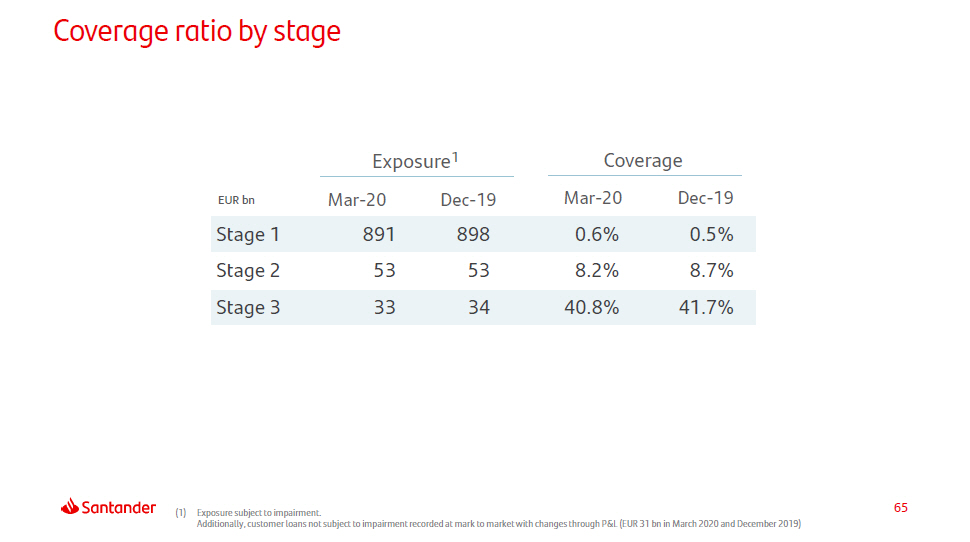
65 (1) Exposure subject to impairment. Additionally, customer loans not subject to impairment recorded at mark to market with changes through P&L (EUR 31 bn in March 2020 and December 2019) Coverage ratio by stage Coverage Exposure 1 EUR bn Mar - 20 D e c - 19 Ma r - 20 D ec - 19 Stage 1 891 898 0.6% 0.5% Stage 2 53 53 8.2% 8.7% Stage 3 33 34 40.8% 41.7%
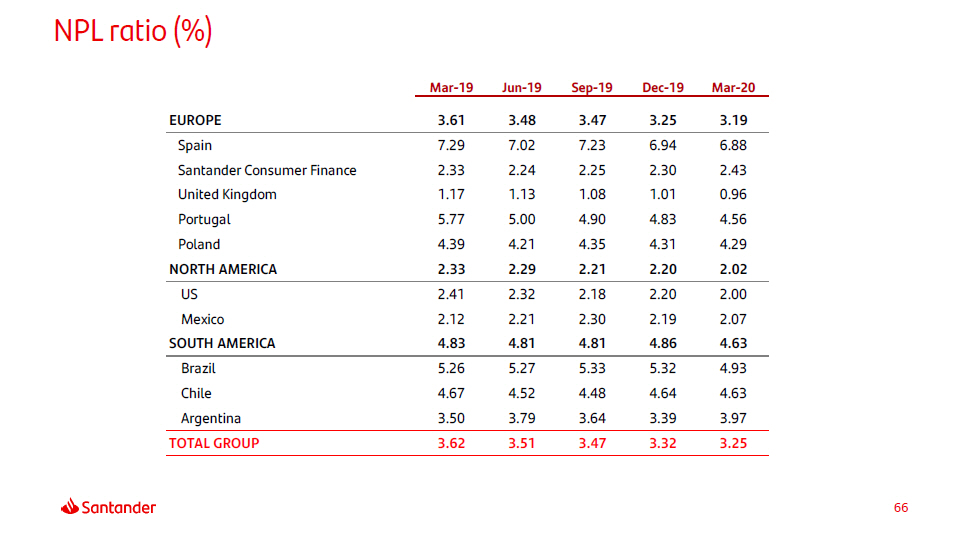
NPL ratio (%) 66 Mar - 19 Jun - 19 Sep - 19 Dec - 19 Mar - 20 EUROPE 3 . 61 3.48 3.47 3.25 3.19 Spain 7 . 29 7.02 7.23 6.94 6.88 Santander Consumer Finance 2 . 33 2.24 2.25 2.30 2.43 United Kingdom 1 . 17 1.13 1.08 1.01 0.96 Portugal 5 . 77 5.00 4.90 4.83 4.56 Poland 4 . 39 4.21 4.35 4.31 4.29 NORTH AMERICA 2 . 33 2.29 2.21 2.20 2.02 US 2 . 41 2.32 2.18 2.20 2.00 Mexico 2 . 12 2.21 2.30 2.19 2.07 SOUTH AMERICA 4 . 83 4.81 4.81 4.86 4.63 Brazil 5 . 26 5.27 5.33 5.32 4.93 Chile 4 . 67 4.52 4.48 4.64 4.63 Argentina 3 . 50 3.79 3.64 3.39 3.97 TOTAL GROUP 3 . 62 3.51 3.47 3.32 3.25
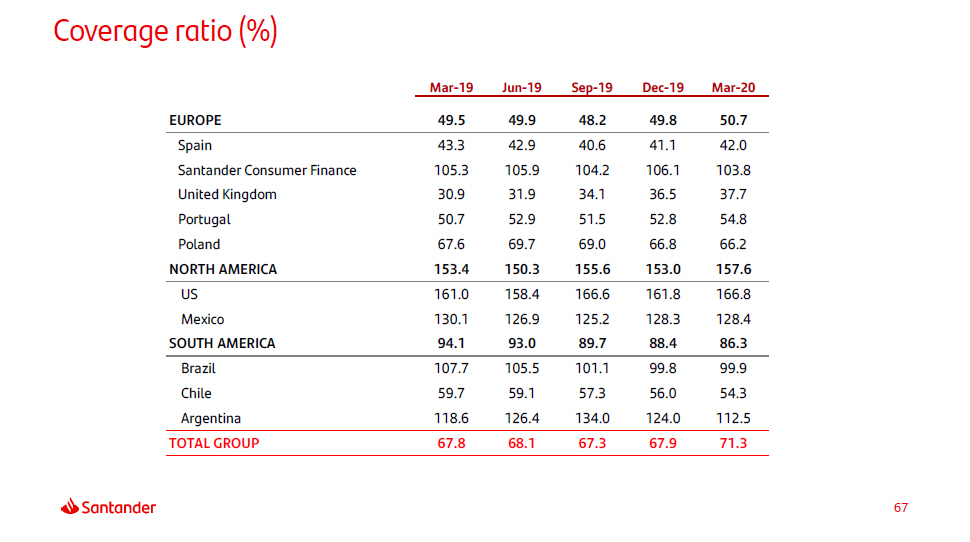
Coverage ratio (%) 67 Mar - 19 Jun - 19 Sep - 19 Dec - 19 Mar - 20 EUROPE 49 . 5 49.9 48.2 49.8 50.7 Spain 43 . 3 42.9 40.6 41.1 42.0 Santander Consumer Finance 105 . 3 105.9 104.2 106.1 103.8 United Kingdom 30 . 9 31.9 34.1 36.5 37.7 Portugal 50 . 7 52.9 51.5 52.8 54.8 Poland 67 . 6 69.7 69.0 66.8 66.2 NORTH AMERICA 153 . 4 150.3 155.6 153.0 157.6 US 161 . 0 158.4 166.6 161.8 166.8 Mexico 130 . 1 126.9 125.2 128.3 128.4 SOUTH AMERICA 94 . 1 93.0 89.7 88.4 86.3 Brazil 107 . 7 105.5 101.1 99.8 99.9 Chile 59 . 7 59.1 57.3 56.0 54.3 Argentina 118 . 6 126.4 134.0 124.0 112.5 TOTAL GROUP 67 . 8 68.1 67.3 67.9 71.3
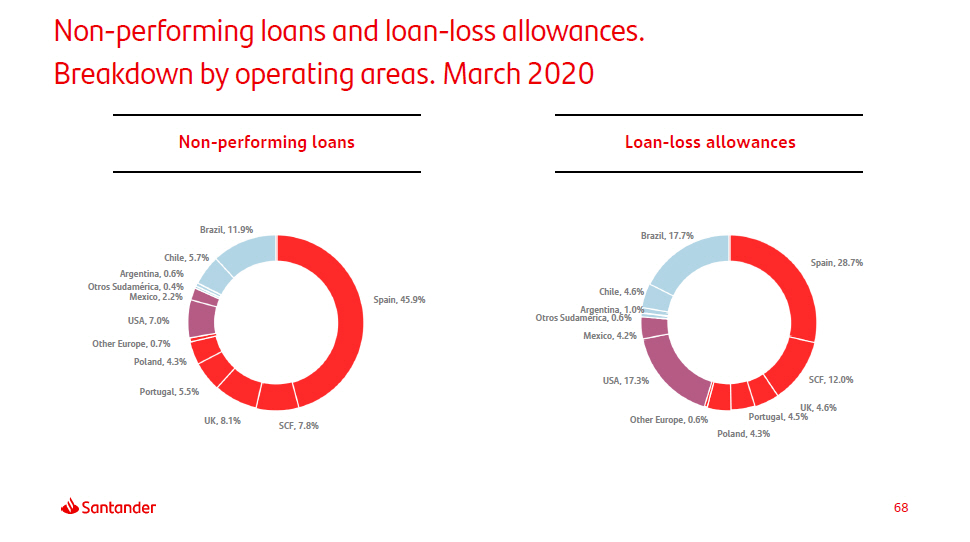
Non - performing loans and loan - loss allowances. Breakdown by operating areas. March 2020 Spain, 45.9% SCF, 7.8% UK, 8.1% Portugal, 5.5% Chile, 5.7% Argentina, 0.6% Otros Sudamérica, 0.4% Mexico, 2.2% USA, 7.0% Other Europe, 0.7% Poland, 4.3% Brazil, 11.9% Spain, 28.7% SCF, 12.0% UK, 4.6% Portugal, 4.5% Poland, 4.3% Other Europe, 0.6% USA, 17.3% Mexico, 4.2% Otros Sudamérica, 0.6% Argentina, 1.0% Chile, 4.6% Brazil, 17.7% Non - performing loans Loan - loss allowances 68
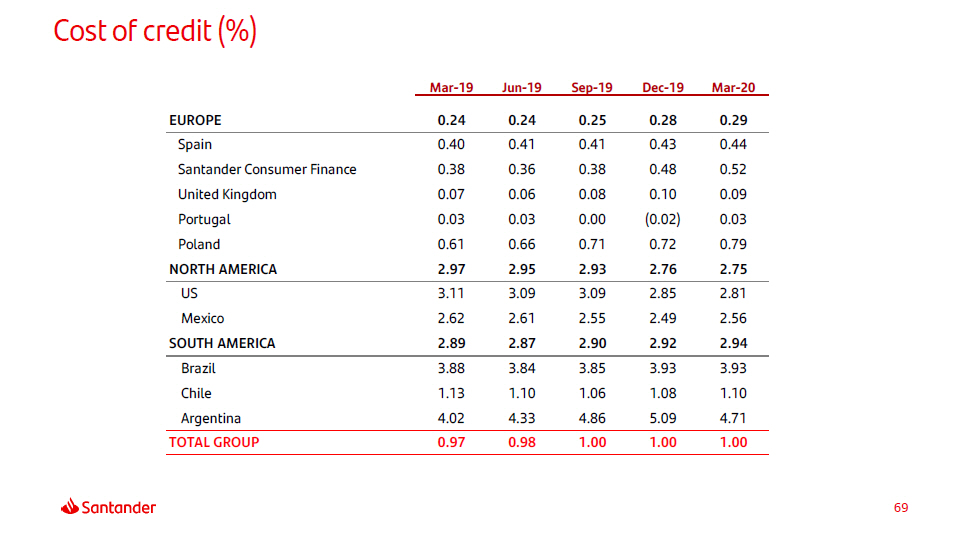
Cost of credit (%) 69 Mar - 19 Jun - 19 Sep - 19 Dec - 19 Mar - 20 EUROPE 0 . 24 0.24 0.25 0.28 0.29 Spain 0 . 40 0.41 0.41 0.43 0.44 Santander Consumer Finance 0 . 38 0.36 0.38 0.48 0.52 United Kingdom 0 . 07 0.06 0.08 0.10 0.09 Portugal 0 . 03 0.03 0.00 (0.02) 0.03 Poland 0 . 61 0.66 0.71 0.72 0.79 NORTH AMERICA 2 . 97 2.95 2.93 2.76 2.75 US 3 . 11 3.09 3.09 2.85 2.81 Mexico 2 . 62 2.61 2.55 2.49 2.56 SOUTH AMERICA 2 . 89 2.87 2.90 2.92 2.94 Brazil 3 . 88 3.84 3.85 3.93 3.93 Chile 1 . 13 1.10 1.06 1.08 1.10 Argentina 4 . 02 4.33 4.86 5.09 4.71 TOTAL GROUP 0 . 97 0.98 1.00 1.00 1.00

Net capital gains and provisions Primary segments Secondary segments Other countries. Detail Balance sheet and capital management Yield on loans and cost of deposits NPL and coverage ratios and cost of credit Responsible Banking Quarterly income statements Glossary 70 Appendix
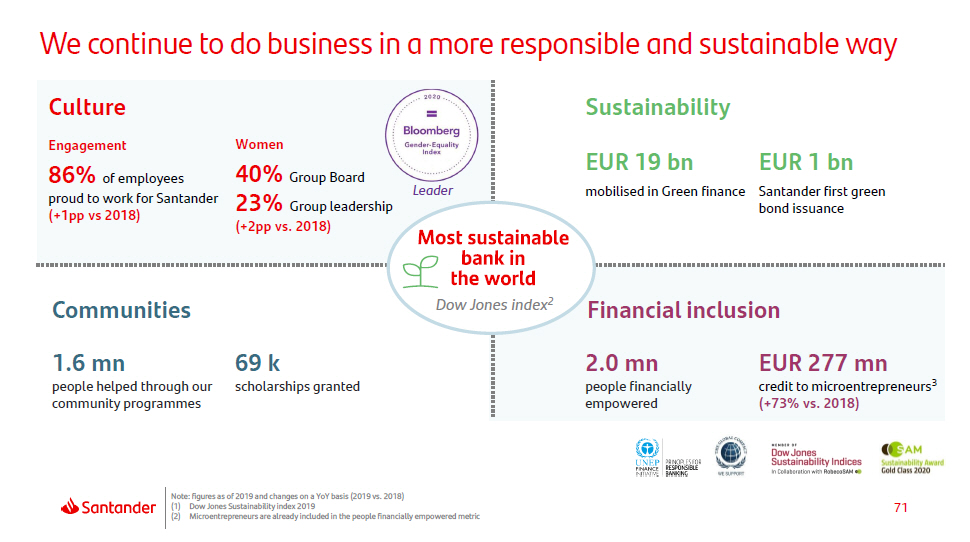
71 We continue to do business in a more responsible and sustainable way Financial inclusion 2.0 mn people financially empowered 69 k scholarships granted Communities 1.6 mn people helped through our community programmes Wo m en 40% Group Board 23% Group leadership (+2pp vs. 2018) EUR 277 mn credit to microentrepreneurs 3 (+73% vs. 2018) EUR 1 bn Santander first green bond issuance Culture Engagement 86% of employees proud to work for Santander (+1pp vs 2018) Sustainability EUR 19 bn mobilised in Green finance Dow Jones index 2 Lea der Note: figures as of 2019 and changes on a YoY basis (2019 vs. 2018) (1) Dow Jones Sustainability index 2019 (2) Microentrepreneurs are already included in the people financially empowered metric
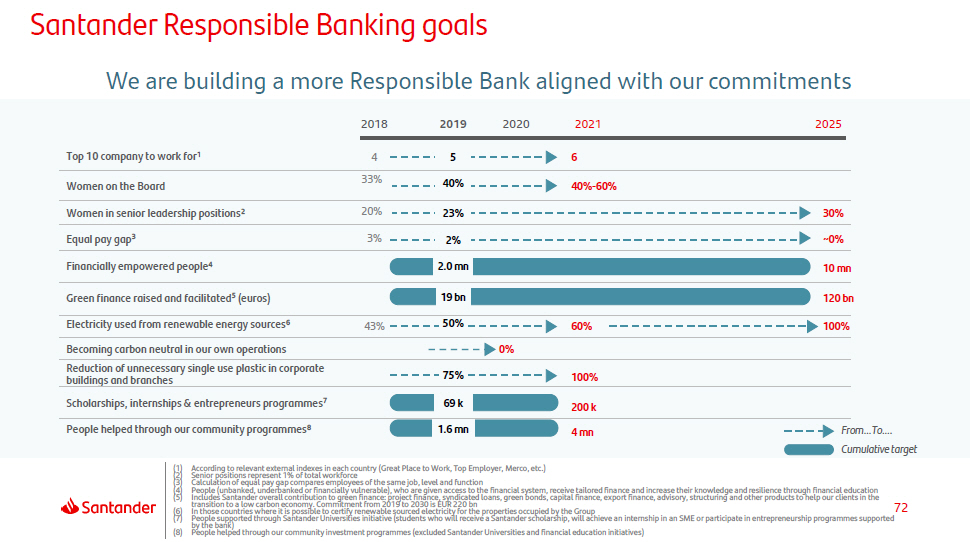
72 100% 200 k 4 mn 3 3 2 0 20% Scholarships, internships & entrepreneurs programmes 7 69 k People helped through our community programmes 8 1.6 mn Reduction of unnecessary single use plastic in corporate 75% buildings and branches (1) According to relevant external indexes in each country (Great Place to Work, Top Employer, Merco, etc.) (2) Senior positions represent 1% of total workforce (3) Calculation of equal pay gap compares employees of the same job, level and function (4) People (unbanked, underbanked or financially vulnerable), who are given access to the financial system, receive tailored finance and increase their knowledge and resilience through financial education (5) Includes Santander overall contribution to green finance: project finance, syndicated loans, green bonds, capital finance, export finance, advisory, structuring and other products to help our clients in the transition to a low carbon economy. Commitment from 2019 to 2030 is EUR 220 bn ( 6) In those countries where it is possible to certify renewable sourced electricity for the properties occupied by the Group by the bank) (7) People supported through Santander Universities initiative (students who will receive a Santander scholarship, will achieve an internship in an SME or participate in entrepreneurship programmes supported (8) People helped through our community investment programmes (excluded Santander Universities and financial education initiatives) Santander Responsible Banking goals We are building a more Responsible Bank aligned with our commitments 2018 2019 2020 2021 2025 Top 10 company to work for 1 4 5 6 Women on the Board 33% 40% 40% - 60% Women in senior leadership positions 2 20% 23% 30% Equal pay gap 3 3% 2% ~0% Financially empowered people 4 2.0 mn 10 mn Green finance raised and facilitated 5 (euros) 19 bn 120 bn Electricity used from renewable energy sources 6 43% 50% 60% 100% Becoming carbon neutral in our own operations 0% From…To…. Cumulative target

73 Appendix Net capital gains and provisions Primary segments Secondary segments Other countries. Detail Balance sheet and capital management Yield on loans and cost of deposits NPL and coverage ratios and cost of credit Responsible Banking Quarterly income statements Glossary
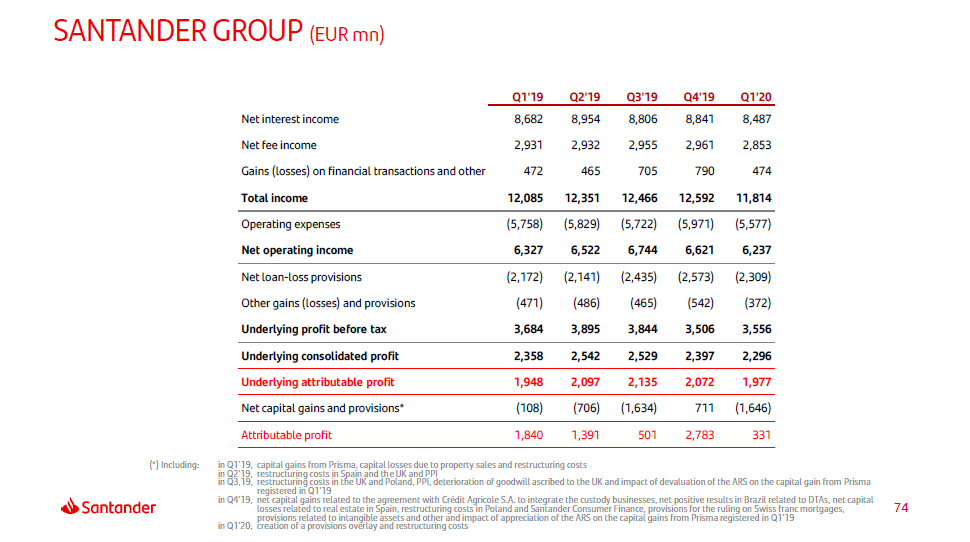
74 SANTANDER GROUP (EUR mn) Q 1 ' 1 9 Q 2 ' 1 9 Q 3 ' 1 9 Q 4 ' 1 9 Q 1 ' 2 0 Net interest income 8 , 68 2 8 , 95 4 8 , 80 6 8 , 84 1 8 , 48 7 Net fee income 2 , 93 1 2 , 93 2 2 , 95 5 2 , 96 1 2 , 85 3 Gains (losses) on financial transactions and other 472 465 705 790 474 Total income 12 , 08 5 12 , 35 1 12 , 46 6 12 , 59 2 11 , 81 4 Operating expenses ( 5 , 758 ) ( 5 , 829 ) ( 5 , 722 ) ( 5 , 971 ) ( 5 , 577 ) Net operating income 6 , 32 7 6 , 52 2 6 , 74 4 6 , 62 1 6 , 23 7 Net loan - loss provisions ( 2 , 172 ) ( 2 , 141 ) ( 2 , 435 ) ( 2 , 573 ) ( 2 , 309 ) Other gains (losses) and provisions ( 471 ) ( 486 ) ( 465 ) ( 542 ) ( 372 ) Underlying profit before tax 3 , 68 4 3 , 89 5 3 , 84 4 3 , 50 6 3 , 55 6 Underlying consolidated profit 2 , 35 8 2 , 54 2 2 , 52 9 2 , 39 7 2 , 29 6 Underlying attributable profit 1 , 94 8 2 , 09 7 2 , 13 5 2 , 07 2 1 , 97 7 Net capital gains and provisions* ( 108 ) ( 706 ) ( 1 , 634 ) 711 ( 1 , 646 ) Attributable profit 1 , 84 0 1 , 39 1 501 2 , 78 3 331 (*) Including: in Q1'19, capital gains from Prisma, capital losses due to property sales and restructuring costs in Q2’19, restructuring costs in Spain and the UK and PPI in Q3,19, restructuring costs in the UK and Poland, PPI, deterioration of goodwill ascribed to the UK and impact of devaluation of the ARS on the capital gain from Prisma registered in Q1’19 in Q4’19, net capital gains related to the agreement with Crédit Agricole S.A. to integrate the custody businesses, net positive results in Brazil related to DTAs, net capital losses related to real estate in Spain, restructuring costs in Poland and Santander Consumer Finance, provisions for the ruling on Swiss franc mortgages, provisions related to intangible assets and other and impact of appreciation of the ARS on the capital gains from Prisma registered in Q1’19 in Q1’20, creation of a provisions overlay and restructuring costs
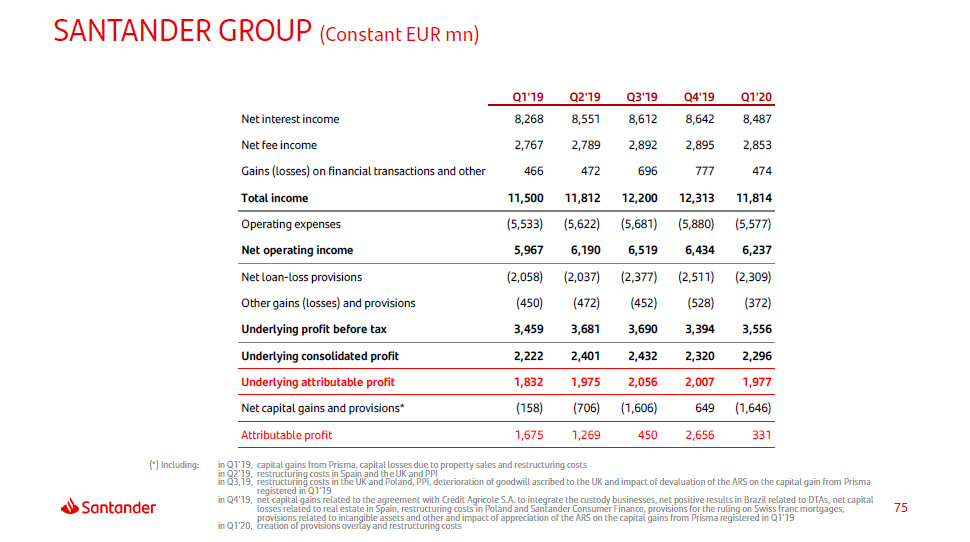
75 SANTANDER GROUP (Constant EUR mn) Q 1 ' 1 9 Q 2 ' 1 9 Q 3 ' 1 9 Q 4 ' 1 9 Q 1 ' 2 0 Net interest income 8 , 26 8 8 , 55 1 8 , 61 2 8 , 64 2 8 , 48 7 Net fee income 2 , 76 7 2 , 78 9 2 , 89 2 2 , 89 5 2 , 85 3 Gains (losses) on financial transactions and other 466 472 696 777 474 Total income 11 , 50 0 11 , 81 2 12 , 20 0 12 , 31 3 11 , 81 4 Operating expenses ( 5 , 533 ) ( 5 , 622 ) ( 5 , 681 ) ( 5 , 880 ) ( 5 , 577 ) Net operating income 5 , 96 7 6 , 19 0 6 , 51 9 6 , 43 4 6 , 23 7 Net loan - loss provisions ( 2 , 058 ) ( 2 , 037 ) ( 2 , 377 ) ( 2 , 511 ) ( 2 , 309 ) Other gains (losses) and provisions ( 450 ) ( 472 ) ( 452 ) ( 528 ) ( 372 ) Underlying profit before tax 3 , 45 9 3 , 68 1 3 , 69 0 3 , 39 4 3 , 55 6 Underlying consolidated profit 2 , 22 2 2 , 40 1 2 , 43 2 2 , 32 0 2 , 29 6 Underlying attributable profit 1 , 83 2 1 , 97 5 2 , 05 6 2 , 00 7 1 , 97 7 Net capital gains and provisions* ( 158 ) ( 706 ) ( 1 , 606 ) 649 ( 1 , 646 ) Attributable profit 1 , 67 5 1 , 26 9 450 2 , 65 6 331 (*) Including: in Q1'19, capital gains from Prisma, capital losses due to property sales and restructuring costs in Q2’19, restructuring costs in Spain and the UK and PPI in Q3,19, restructuring costs in the UK and Poland, PPI, deterioration of goodwill ascribed to the UK and impact of devaluation of the ARS on the capital gain from Prisma registered in Q1’19 in Q4’19, net capital gains related to the agreement with Crédit Agricole S.A. to integrate the custody businesses, net positive results in Brazil related to DTAs, net capital losses related to real estate in Spain, restructuring costs in Poland and Santander Consumer Finance, provisions for the ruling on Swiss franc mortgages, provisions related to intangible assets and other and impact of appreciation of the ARS on the capital gains from Prisma registered in Q1’19 in Q1’20, creation of provisions overlay and restructuring costs
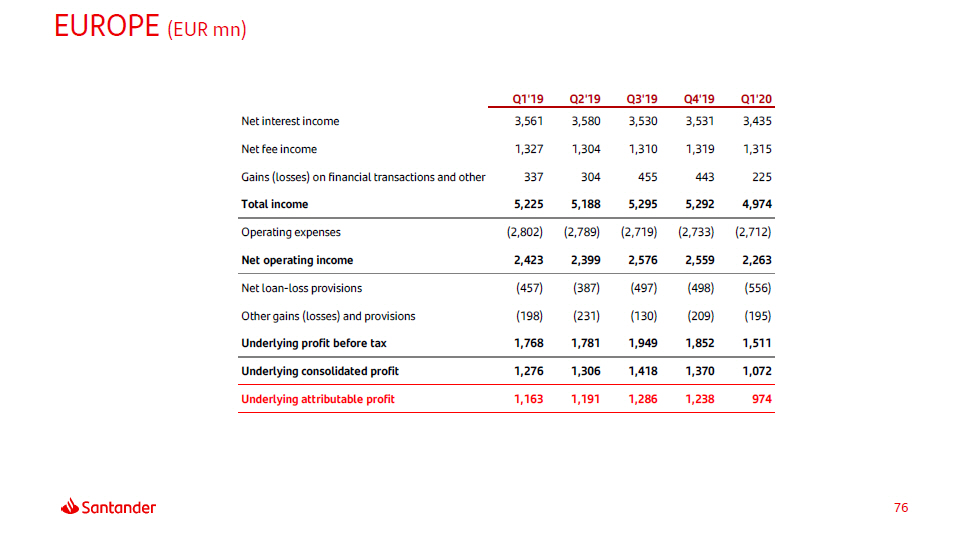
EUROPE (EUR mn) 76 Q 1 ' 1 9 Q 2 ' 1 9 Q 3 ' 1 9 Q 4 ' 1 9 Q 1 ' 2 0 Net interest income 3 , 56 1 3 , 58 0 3 , 53 0 3 , 53 1 3 , 43 5 Net fee income 1 , 32 7 1 , 30 4 1 , 31 0 1 , 31 9 1 , 31 5 Gains (losses) on financial transactions and other 337 304 455 443 225 Total income 5 , 22 5 5 , 18 8 5 , 29 5 5 , 29 2 4 , 97 4 Operating expenses ( 2 , 802 ) ( 2 , 789 ) ( 2 , 719 ) ( 2 , 733 ) ( 2 , 712 ) Net operating income 2 , 42 3 2 , 39 9 2 , 57 6 2 , 55 9 2 , 26 3 Net loan - loss provisions ( 457 ) ( 387 ) ( 497 ) ( 498 ) ( 556 ) Other gains (losses) and provisions ( 198 ) ( 231 ) ( 130 ) ( 209 ) ( 195 ) Underlying profit before tax 1 , 76 8 1 , 78 1 1 , 94 9 1 , 85 2 1 , 51 1 Underlying consolidated profit 1 , 27 6 1 , 30 6 1 , 41 8 1 , 37 0 1 , 07 2 Underlying attributable profit 1 , 16 3 1 , 19 1 1 , 28 6 1 , 23 8 974
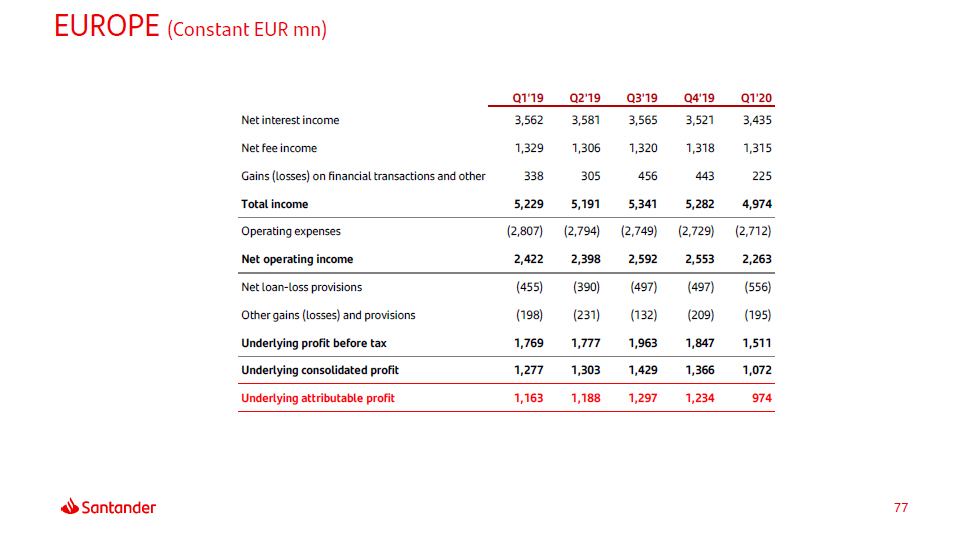
EUROPE (Constant EUR mn) 77 Q 1 ' 1 9 Q 2 ' 1 9 Q 3 ' 1 9 Q 4 ' 1 9 Q 1 ' 2 0 Net interest income 3 , 56 2 3 , 58 1 3 , 56 5 3 , 52 1 3 , 43 5 Net fee income 1 , 32 9 1 , 30 6 1 , 32 0 1 , 31 8 1 , 31 5 Gains (losses) on financial transactions and other 338 305 456 443 225 Total income 5 , 22 9 5 , 19 1 5 , 34 1 5 , 28 2 4 , 97 4 Operating expenses ( 2 , 807 ) ( 2 , 794 ) ( 2 , 749 ) ( 2 , 729 ) ( 2 , 712 ) Net operating income 2 , 42 2 2 , 39 8 2 , 59 2 2 , 55 3 2 , 26 3 Net loan - loss provisions ( 455 ) ( 390 ) ( 497 ) ( 497 ) ( 556 ) Other gains (losses) and provisions ( 198 ) ( 231 ) ( 132 ) ( 209 ) ( 195 ) Underlying profit before tax 1 , 76 9 1 , 77 7 1 , 96 3 1 , 84 7 1 , 51 1 Underlying consolidated profit 1 , 27 7 1 , 30 3 1 , 42 9 1 , 36 6 1 , 07 2 Underlying attributable profit 1 , 16 3 1 , 18 8 1 , 29 7 1 , 23 4 974
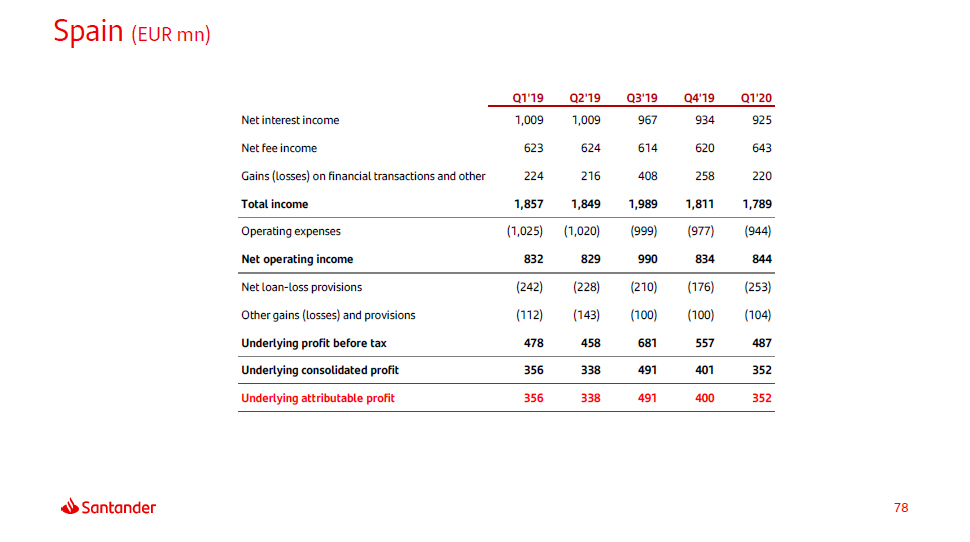
Spain (EUR mn) 78 Q 1 ' 1 9 Q 2 ' 1 9 Q 3 ' 1 9 Q 4 ' 1 9 Q 1 ' 2 0 Net interest income 1 , 00 9 1 , 00 9 967 934 925 Net fee income 623 624 614 620 643 Gains (losses) on financial transactions and other 224 216 408 258 220 Total income 1 , 85 7 1 , 84 9 1 , 98 9 1 , 81 1 1 , 78 9 Operating expenses ( 1 , 025 ) ( 1 , 020 ) ( 999 ) ( 977 ) ( 944 ) Net operating income 832 829 990 834 844 Net loan - loss provisions ( 242 ) ( 228 ) ( 210 ) ( 176 ) ( 253 ) Other gains (losses) and provisions ( 112 ) ( 143 ) ( 100 ) ( 100 ) ( 104 ) Underlying profit before tax 478 458 681 557 487 Underlying consolidated profit 356 338 491 401 352 Underlying attributable profit 356 338 491 400 352
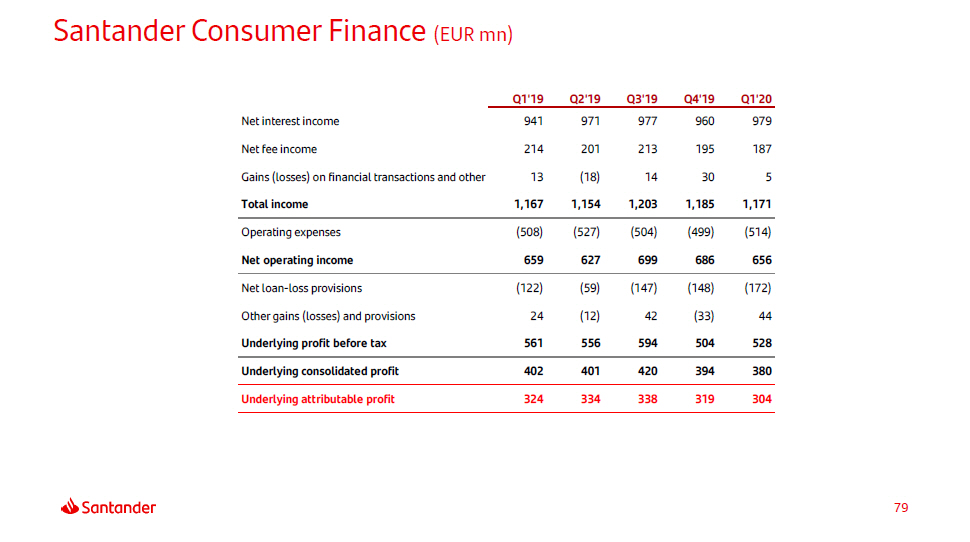
Santander Consumer Finance (EUR mn) 79 Q 1 ' 1 9 Q 2 ' 1 9 Q 3 ' 1 9 Q 4 ' 1 9 Q 1 ' 2 0 Net interest income 941 971 977 960 979 Net fee income 214 201 213 195 187 Gains (losses) on financial transactions and other 13 ( 18 ) 14 30 5 Total income 1 , 16 7 1 , 15 4 1 , 20 3 1 , 18 5 1 , 17 1 Operating expenses ( 508 ) ( 527 ) ( 504 ) ( 499 ) ( 514 ) Net operating income 659 627 699 686 656 Net loan - loss provisions ( 122 ) ( 59 ) ( 147 ) ( 148 ) ( 172 ) Other gains (losses) and provisions 24 ( 12 ) 42 ( 33 ) 44 Underlying profit before tax 561 556 594 504 528 Underlying consolidated profit 402 401 420 394 380 Underlying attributable profit 324 334 338 319 304
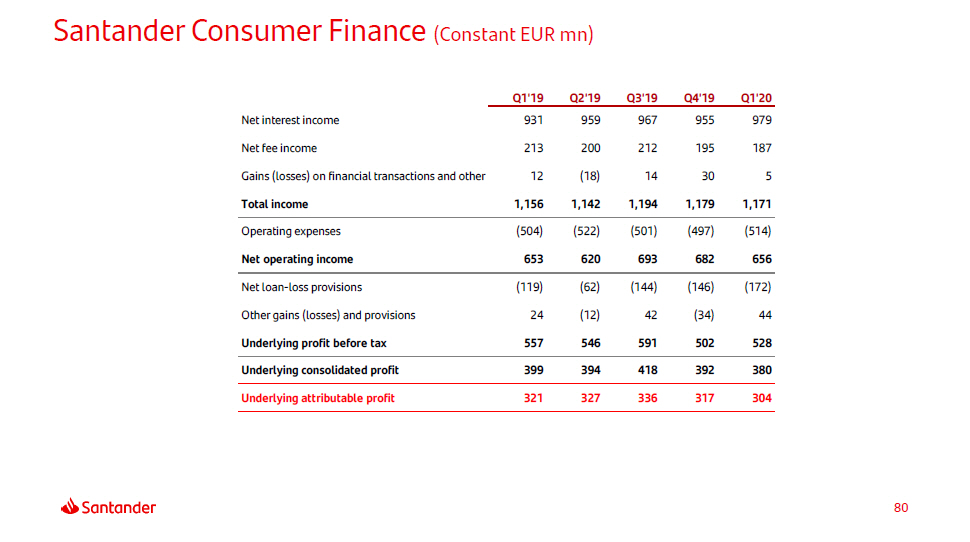
Santander Consumer Finance (Constant EUR mn) 80 Q 1 ' 1 9 Q 2 ' 1 9 Q 3 ' 1 9 Q 4 ' 1 9 Q 1 ' 2 0 Net interest income 931 959 967 955 979 Net fee income 213 200 212 195 187 Gains (losses) on financial transactions and other 12 ( 18 ) 14 30 5 Total income 1 , 15 6 1 , 14 2 1 , 19 4 1 , 17 9 1 , 17 1 Operating expenses ( 504 ) ( 522 ) ( 501 ) ( 497 ) ( 514 ) Net operating income 653 620 693 682 656 Net loan - loss provisions ( 119 ) ( 62 ) ( 144 ) ( 146 ) ( 172 ) Other gains (losses) and provisions 24 ( 12 ) 42 ( 34 ) 44 Underlying profit before tax 557 546 591 502 528 Underlying consolidated profit 399 394 418 392 380 Underlying attributable profit 321 327 336 317 304
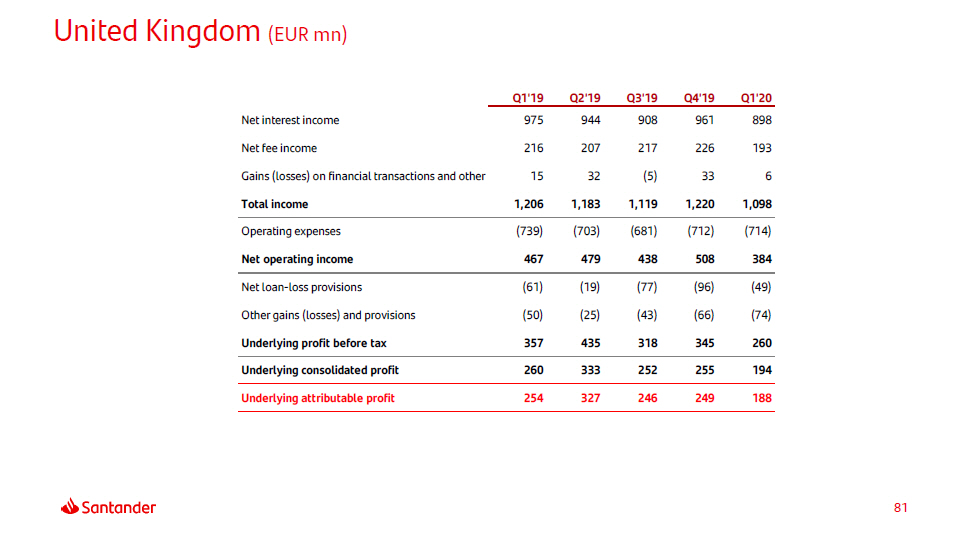
United Kingdom (EUR mn) 81 Q 1 ' 1 9 Q 2 ' 1 9 Q 3 ' 1 9 Q 4 ' 1 9 Q 1 ' 2 0 Net interest income 975 944 908 961 898 Net fee income 216 207 217 226 193 Gains (losses) on financial transactions and other 15 32 ( 5 ) 33 6 Total income 1 , 20 6 1 , 18 3 1 , 11 9 1 , 22 0 1 , 09 8 Operating expenses ( 739 ) ( 703 ) ( 681 ) ( 712 ) ( 714 ) Net operating income 467 479 438 508 384 Net loan - loss provisions ( 61 ) ( 19 ) ( 77 ) ( 96 ) ( 49 ) Other gains (losses) and provisions ( 50 ) ( 25 ) ( 43 ) ( 66 ) ( 74 ) Underlying profit before tax 357 435 318 345 260 Underlying consolidated profit 260 333 252 255 194 Underlying attributable profit 254 327 246 249 188
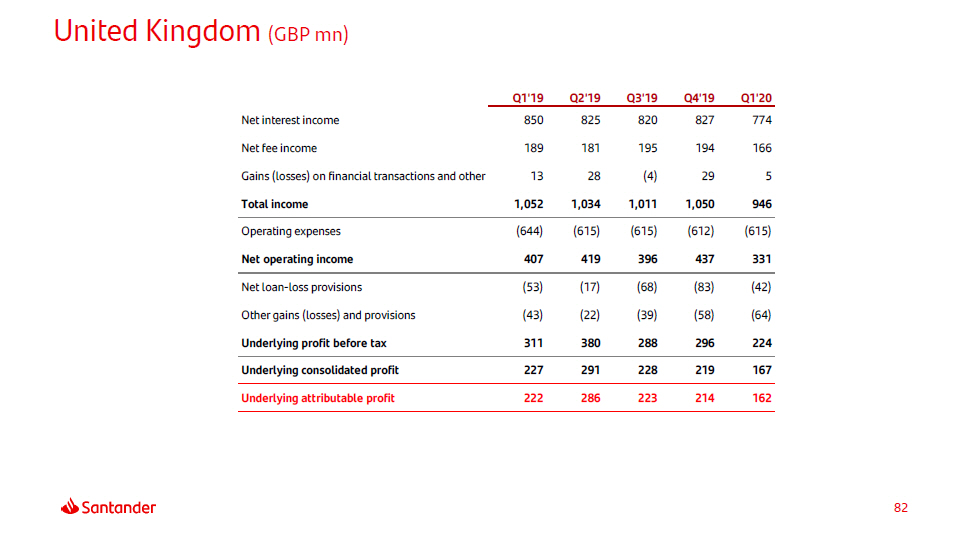
United Kingdom (GBP mn) 82 Q 1 ' 1 9 Q 2 ' 1 9 Q 3 ' 1 9 Q 4 ' 1 9 Q 1 ' 2 0 Net interest income 850 825 820 827 774 Net fee income 189 181 195 194 166 Gains (losses) on financial transactions and other 13 28 ( 4 ) 29 5 Total income 1 , 05 2 1 , 03 4 1 , 01 1 1 , 05 0 946 Operating expenses ( 644 ) ( 615 ) ( 615 ) ( 612 ) ( 615 ) Net operating income 407 419 396 437 331 Net loan - loss provisions ( 53 ) ( 17 ) ( 68 ) ( 83 ) ( 42 ) Other gains (losses) and provisions ( 43 ) ( 22 ) ( 39 ) ( 58 ) ( 64 ) Underlying profit before tax 311 380 288 296 224 Underlying consolidated profit 227 291 228 219 167 Underlying attributable profit 222 286 223 214 162
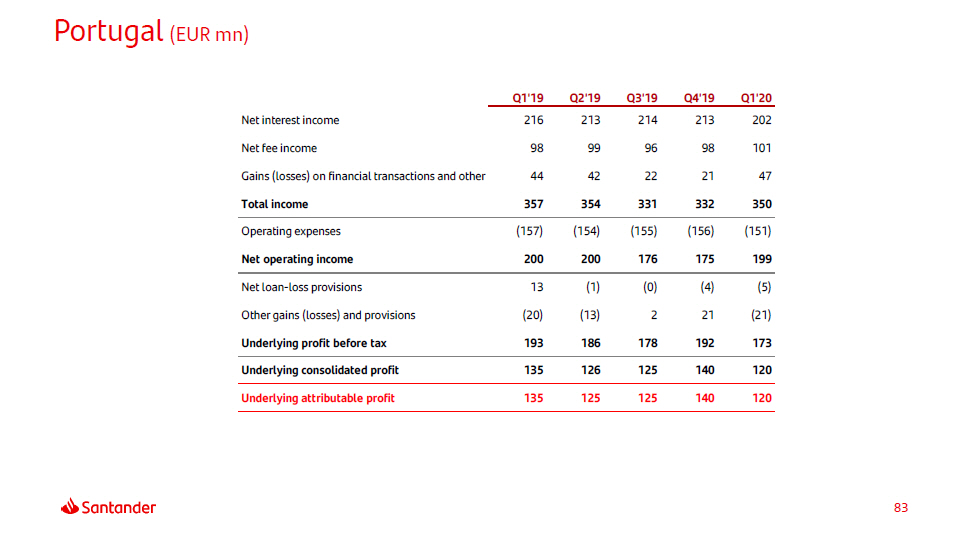
Portugal (EUR mn) 83 Q 1 ' 1 9 Q 2 ' 1 9 Q 3 ' 1 9 Q 4 ' 1 9 Q 1 ' 2 0 Net interest income 216 213 214 213 202 Net fee income 98 99 96 98 101 Gains (losses) on financial transactions and other 44 42 22 21 47 Total income 357 354 331 332 350 Operating expenses ( 157 ) ( 154 ) ( 155 ) ( 156 ) ( 151 ) Net operating income 200 200 176 175 199 Net loan - loss provisions 13 ( 1 ) ( 0 ) ( 4 ) ( 5 ) Other gains (losses) and provisions ( 20 ) ( 13 ) 2 21 ( 21 ) Underlying profit before tax 193 186 178 192 173 Underlying consolidated profit 135 126 125 140 120 Underlying attributable profit 135 125 125 140 120
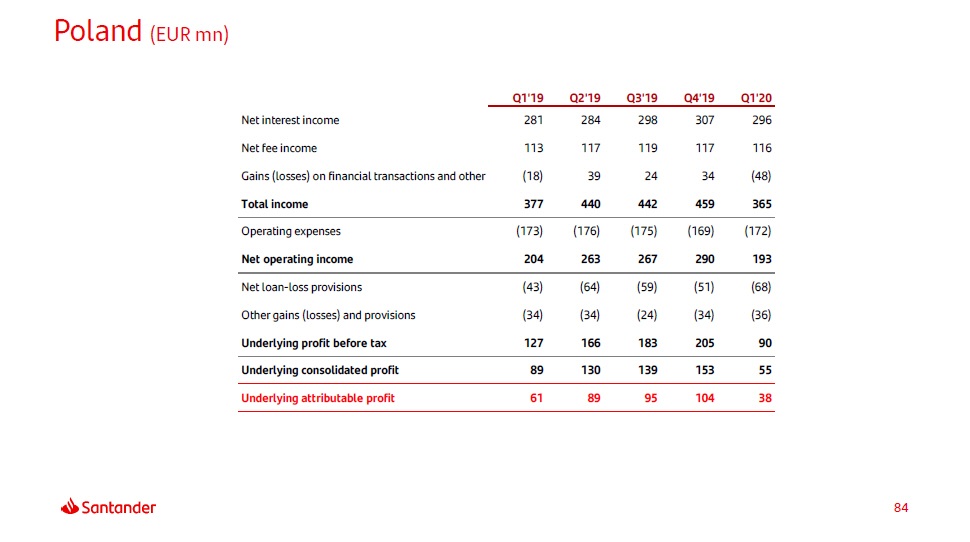
Poland (EUR mn) 84 Q 1 ' 1 9 Q 2 ' 1 9 Q 3 ' 1 9 Q 4 ' 1 9 Q 1 ' 2 0 Net interest income 281 284 298 307 296 Net fee income 113 117 119 117 116 Gains (losses) on financial transactions and other ( 18 ) 39 24 34 ( 48 ) Total income 377 440 442 459 365 Operating expenses ( 173 ) ( 176 ) ( 175 ) ( 169 ) ( 172 ) Net operating income 204 263 267 290 193 Net loan - loss provisions ( 43 ) ( 64 ) ( 59 ) ( 51 ) ( 68 ) Other gains (losses) and provisions ( 34 ) ( 34 ) ( 24 ) ( 34 ) ( 36 ) Underlying profit before tax 127 166 183 205 90 Underlying consolidated profit 89 130 139 153 55 Underlying attributable profit 61 89 95 104 38
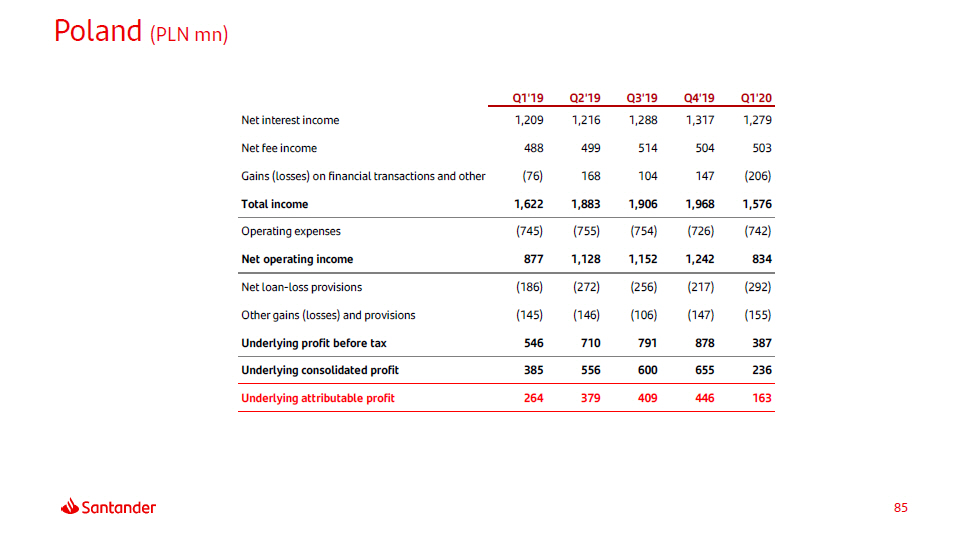
Poland (PLN mn) 85 Q 1 ' 1 9 Q 2 ' 1 9 Q 3 ' 1 9 Q 4 ' 1 9 Q 1 ' 2 0 Net interest income 1 , 20 9 1 , 21 6 1 , 28 8 1 , 31 7 1 , 27 9 Net fee income 488 499 514 504 503 Gains (losses) on financial transactions and other ( 76 ) 168 104 147 ( 206 ) Total income 1 , 62 2 1 , 88 3 1 , 90 6 1 , 96 8 1 , 57 6 Operating expenses ( 745 ) ( 755 ) ( 754 ) ( 726 ) ( 742 ) Net operating income 877 1 , 12 8 1 , 15 2 1 , 24 2 834 Net loan - loss provisions ( 186 ) ( 272 ) ( 256 ) ( 217 ) ( 292 ) Other gains (losses) and provisions ( 145 ) ( 146 ) ( 106 ) ( 147 ) ( 155 ) Underlying profit before tax 546 710 791 878 387 Underlying consolidated profit 385 556 600 655 236 Underlying attributable profit 264 379 409 446 163
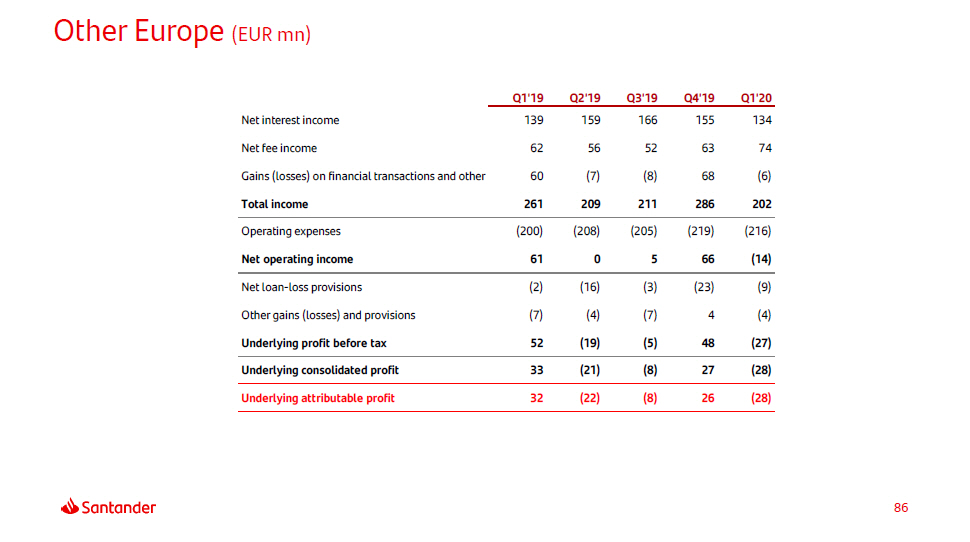
Other Europe (EUR mn) 86 Q 1 ' 1 9 Q 2 ' 1 9 Q 3 ' 1 9 Q 4 ' 1 9 Q 1 ' 2 0 Net interest income 139 159 166 155 134 Net fee income 62 56 52 63 74 Gains (losses) on financial transactions and other 60 ( 7 ) ( 8 ) 68 ( 6 ) Total income 261 209 211 286 202 Operating expenses ( 200 ) ( 208 ) ( 205 ) ( 219 ) ( 216 ) Net operating income 61 0 5 66 ( 14 ) Net loan - loss provisions ( 2 ) ( 16 ) ( 3 ) ( 23 ) ( 9 ) Other gains (losses) and provisions ( 7 ) ( 4 ) ( 7 ) 4 ( 4 ) Underlying profit before tax 52 ( 19 ) ( 5 ) 48 ( 27 ) Underlying consolidated profit 33 ( 21 ) ( 8 ) 27 ( 28 ) Underlying attributable profit 32 ( 22 ) ( 8 ) 26 ( 28 )
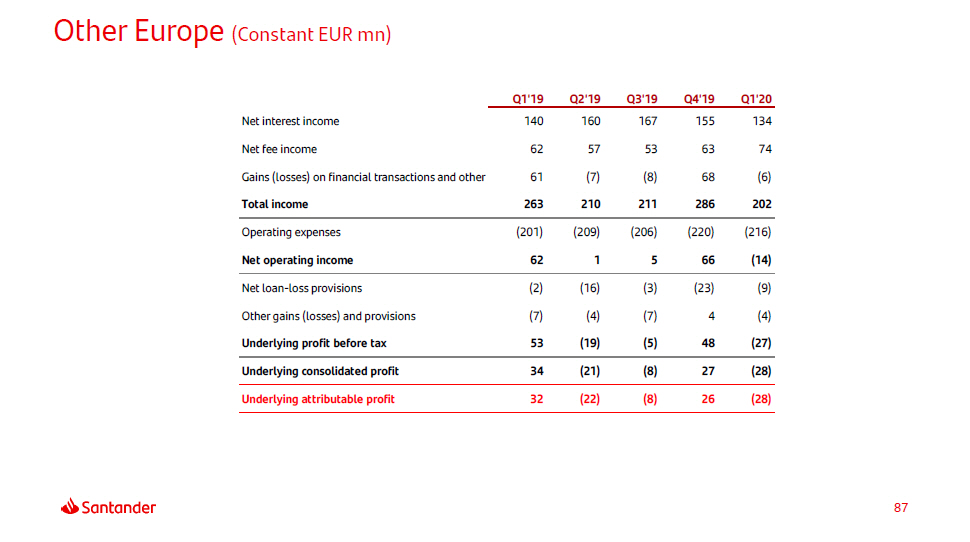
Other Europe (Constant EUR mn) 87 Q 1 ' 1 9 Q 2 ' 1 9 Q 3 ' 1 9 Q 4 ' 1 9 Q 1 ' 2 0 Net interest income 140 160 167 155 134 Net fee income 62 57 53 63 74 Gains (losses) on financial transactions and other 61 ( 7 ) ( 8 ) 68 ( 6 ) Total income 263 210 211 286 202 Operating expenses ( 201 ) ( 209 ) ( 206 ) ( 220 ) ( 216 ) Net operating income 62 1 5 66 ( 14 ) Net loan - loss provisions ( 2 ) ( 16 ) ( 3 ) ( 23 ) ( 9 ) Other gains (losses) and provisions ( 7 ) ( 4 ) ( 7 ) 4 ( 4 ) Underlying profit before tax 53 ( 19 ) ( 5 ) 48 ( 27 ) Underlying consolidated profit 34 ( 21 ) ( 8 ) 27 ( 28 ) Underlying attributable profit 32 ( 22 ) ( 8 ) 26 ( 28 )
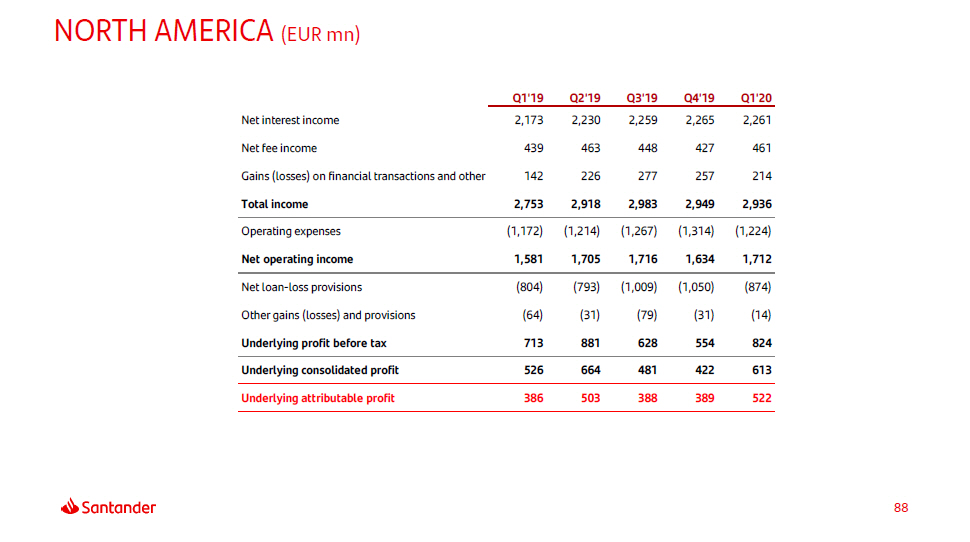
NORTH AMERICA (EUR mn) 88 Q 1 ' 1 9 Q 2 ' 1 9 Q 3 ' 1 9 Q 4 ' 1 9 Q 1 ' 2 0 Net interest income 2 , 17 3 2 , 23 0 2 , 25 9 2 , 26 5 2 , 26 1 Net fee income 439 463 448 427 461 Gains (losses) on financial transactions and other 142 226 277 257 214 Total income 2 , 75 3 2 , 91 8 2 , 98 3 2 , 94 9 2 , 93 6 Operating expenses ( 1 , 172 ) ( 1 , 214 ) ( 1 , 267 ) ( 1 , 314 ) ( 1 , 224 ) Net operating income 1 , 58 1 1 , 70 5 1 , 71 6 1 , 63 4 1 , 71 2 Net loan - loss provisions ( 804 ) ( 793 ) ( 1 , 009 ) ( 1 , 050 ) ( 874 ) Other gains (losses) and provisions ( 64 ) ( 31 ) ( 79 ) ( 31 ) ( 14 ) Underlying profit before tax 713 881 628 554 824 Underlying consolidated profit 526 664 481 422 613 Underlying attributable profit 386 503 388 389 522

NORTH AMERICA (Constant EUR mn) 89 Q 1 ' 1 9 Q 2 ' 1 9 Q 3 ' 1 9 Q 4 ' 1 9 Q 1 ' 2 0 Net interest income 2 , 21 2 2 , 24 4 2 , 25 9 2 , 24 9 2 , 26 1 Net fee income 445 464 447 422 461 Gains (losses) on financial transactions and other 147 231 280 257 214 Total income 2 , 80 4 2 , 93 8 2 , 98 6 2 , 92 9 2 , 93 6 Operating expenses ( 1 , 194 ) ( 1 , 222 ) ( 1 , 269 ) ( 1 , 307 ) ( 1 , 224 ) Net operating income 1 , 61 0 1 , 71 6 1 , 71 7 1 , 62 1 1 , 71 2 Net loan - loss provisions ( 822 ) ( 800 ) ( 1 , 014 ) ( 1 , 049 ) ( 874 ) Other gains (losses) and provisions ( 65 ) ( 31 ) ( 80 ) ( 31 ) ( 14 ) Underlying profit before tax 723 885 623 542 824 Underlying consolidated profit 532 666 478 412 613 Underlying attributable profit 391 505 386 381 522

United States (EUR mn) 90 Q 1 ' 1 9 Q 2 ' 1 9 Q 3 ' 1 9 Q 4 ' 1 9 Q 1 ' 2 0 Net interest income 1 , 40 7 1 , 45 3 1 , 46 0 1 , 44 9 1 , 46 2 Net fee income 234 244 238 230 250 Gains (losses) on financial transactions and other 174 222 278 215 217 Total income 1 , 81 5 1 , 92 0 1 , 97 7 1 , 89 4 1 , 92 9 Operating expenses ( 775 ) ( 805 ) ( 847 ) ( 869 ) ( 809 ) Net operating income 1 , 03 9 1 , 11 5 1 , 13 0 1 , 02 5 1 , 12 0 Net loan - loss provisions ( 611 ) ( 568 ) ( 786 ) ( 828 ) ( 646 ) Other gains (losses) and provisions ( 58 ) ( 26 ) ( 76 ) ( 39 ) ( 6 ) Underlying profit before tax 370 521 267 158 468 Underlying consolidated profit 260 383 196 109 344 Underlying attributable profit 181 284 154 98 273
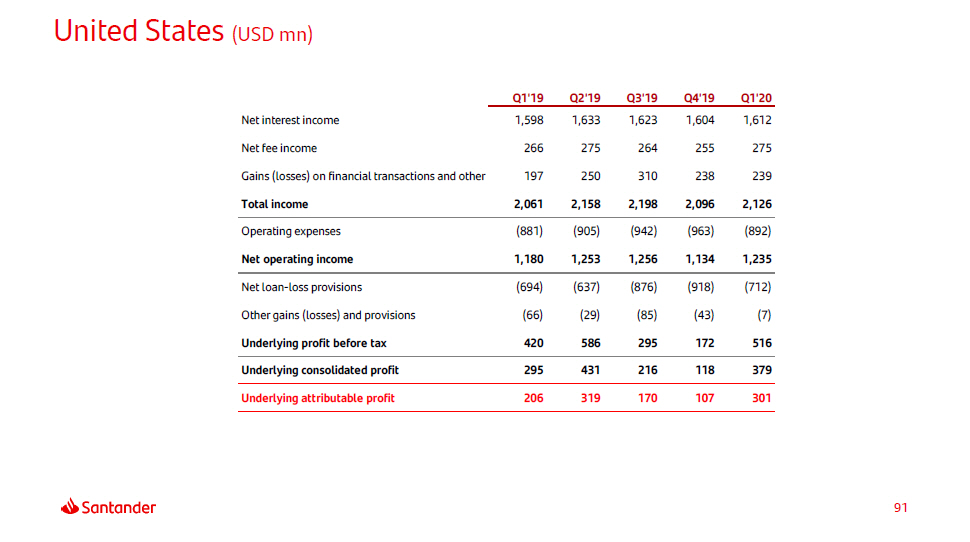
United States (USD mn) 91 Q 1 ' 1 9 Q 2 ' 1 9 Q 3 ' 1 9 Q 4 ' 1 9 Q 1 ' 2 0 Net interest income 1 , 59 8 1 , 63 3 1 , 62 3 1 , 60 4 1 , 61 2 Net fee income 266 275 264 255 275 Gains (losses) on financial transactions and other 197 250 310 238 239 Total income 2 , 06 1 2 , 15 8 2 , 19 8 2 , 09 6 2 , 12 6 Operating expenses ( 881 ) ( 905 ) ( 942 ) ( 963 ) ( 892 ) Net operating income 1 , 18 0 1 , 25 3 1 , 25 6 1 , 13 4 1 , 23 5 Net loan - loss provisions ( 694 ) ( 637 ) ( 876 ) ( 918 ) ( 712 ) Other gains (losses) and provisions ( 66 ) ( 29 ) ( 85 ) ( 43 ) ( 7 ) Underlying profit before tax 420 586 295 172 516 Underlying consolidated profit 295 431 216 118 379 Underlying attributable profit 206 319 170 107 301

Mexico (EUR mn) 92 Q 1 ' 1 9 Q 2 ' 1 9 Q 3 ' 1 9 Q 4 ' 1 9 Q 1 ' 2 0 Net interest income 766 777 798 816 798 Net fee income 204 218 210 197 211 Gains (losses) on financial transactions and other ( 32 ) 4 ( 1 ) 42 ( 2 ) Total income 939 999 1 , 00 7 1 , 05 4 1 , 00 7 Operating expenses ( 397 ) ( 409 ) ( 420 ) ( 445 ) ( 415 ) Net operating income 542 590 586 609 592 Net loan - loss provisions ( 193 ) ( 225 ) ( 223 ) ( 222 ) ( 228 ) Other gains (losses) and provisions ( 6 ) ( 5 ) ( 3 ) 8 ( 8 ) Underlying profit before tax 343 360 361 395 357 Underlying consolidated profit 266 280 286 313 269 Underlying attributable profit 205 219 234 291 249
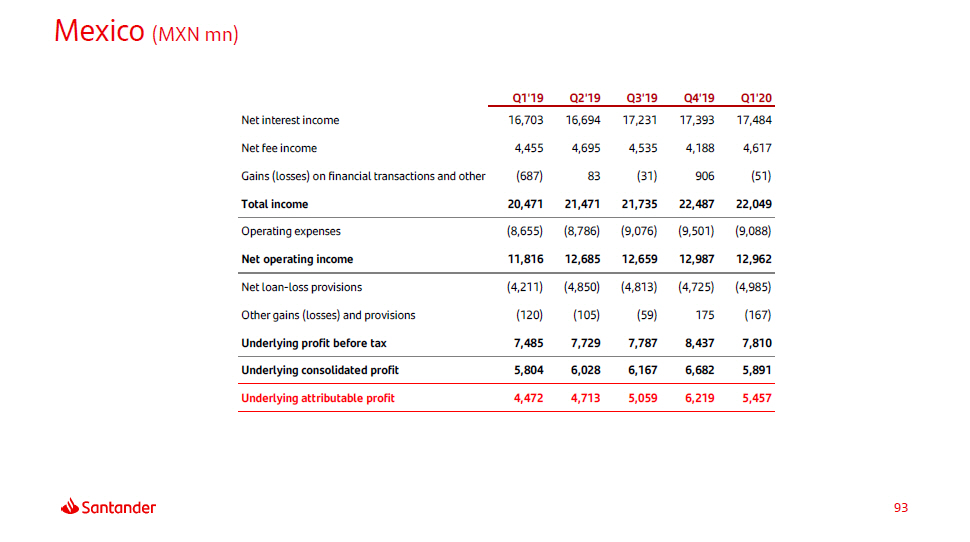
Mexico (MXN mn) 93 Q 1 ' 1 9 Q 2 ' 1 9 Q 3 ' 1 9 Q 4 ' 1 9 Q 1 ' 2 0 Net interest income 16 , 70 3 16 , 69 4 17 , 23 1 17 , 39 3 17 , 48 4 Net fee income 4 , 45 5 4 , 69 5 4 , 53 5 4 , 18 8 4 , 61 7 Gains (losses) on financial transactions and other ( 687 ) 83 ( 31 ) 906 ( 51 ) Total income 20 , 47 1 21 , 47 1 21 , 73 5 22 , 48 7 22 , 04 9 Operating expenses ( 8 , 655 ) ( 8 , 786 ) ( 9 , 076 ) ( 9 , 501 ) ( 9 , 088 ) Net operating income 11 , 81 6 12 , 68 5 12 , 65 9 12 , 98 7 12 , 96 2 Net loan - loss provisions ( 4 , 211 ) ( 4 , 850 ) ( 4 , 813 ) ( 4 , 725 ) ( 4 , 985 ) Other gains (losses) and provisions ( 120 ) ( 105 ) ( 59 ) 175 ( 167 ) Underlying profit before tax 7 , 48 5 7 , 72 9 7 , 78 7 8 , 43 7 7 , 81 0 Underlying consolidated profit 5 , 80 4 6 , 02 8 6 , 16 7 6 , 68 2 5 , 89 1 Underlying attributable profit 4 , 47 2 4 , 71 3 5 , 05 9 6 , 21 9 5 , 45 7
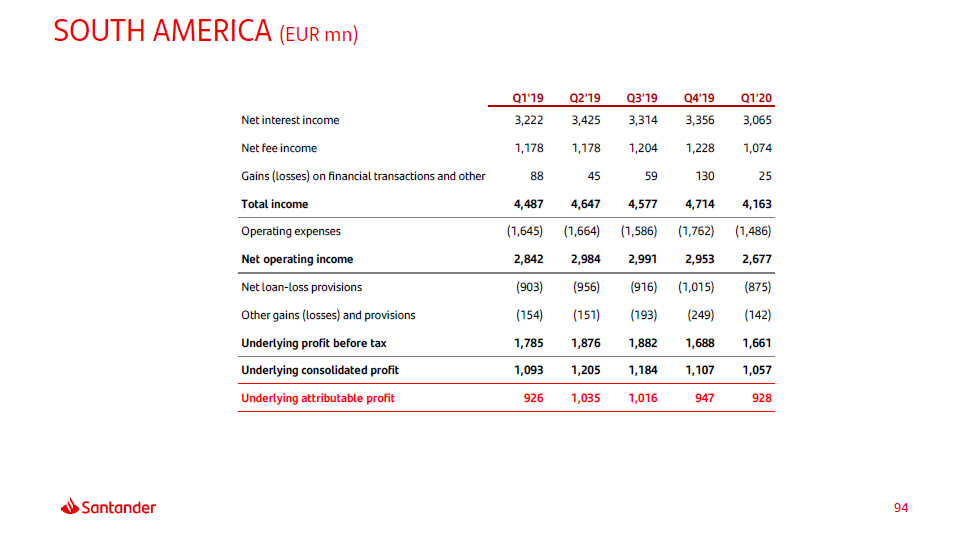
SOUTH AMERICA (EUR mn) 94 Q 1 ' 1 9 Q 2 ' 1 9 Q 3 ' 1 9 Q 4 ' 1 9 Q 1 ' 2 0 Net interest income 3 , 22 2 3 , 42 5 3 , 31 4 3 , 35 6 3 , 06 5 Net fee income 1 , 17 8 1 , 17 8 1 , 20 4 1 , 22 8 1 , 07 4 Gains (losses) on financial transactions and other 88 45 59 130 25 Total income 4 , 48 7 4 , 64 7 4 , 57 7 4 , 71 4 4 , 16 3 Operating expenses ( 1 , 645 ) ( 1 , 664 ) ( 1 , 586 ) ( 1 , 762 ) ( 1 , 486 ) Net operating income 2 , 84 2 2 , 98 4 2 , 99 1 2 , 95 3 2 , 67 7 Net loan - loss provisions ( 903 ) ( 956 ) ( 916 ) ( 1 , 015 ) ( 875 ) Other gains (losses) and provisions ( 154 ) ( 151 ) ( 193 ) ( 249 ) ( 142 ) Underlying profit before tax 1 , 78 5 1 , 87 6 1 , 88 2 1 , 68 8 1 , 66 1 Underlying consolidated profit 1 , 09 3 1 , 20 5 1 , 18 4 1 , 10 7 1 , 05 7 Underlying attributable profit 926 1 , 03 5 1 , 01 6 947 928
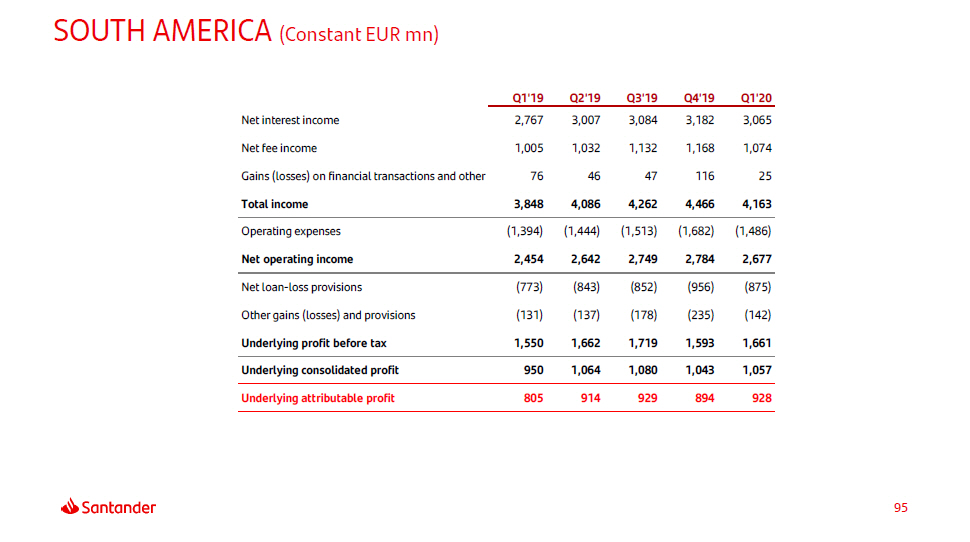
SOUTH AMERICA (Constant EUR mn) 95 Q 1 ' 1 9 Q 2 ' 1 9 Q 3 ' 1 9 Q 4 ' 1 9 Q 1 ' 2 0 Net interest income 2 , 76 7 3 , 00 7 3 , 08 4 3 , 18 2 3 , 06 5 Net fee income 1 , 00 5 1 , 03 2 1 , 13 2 1 , 16 8 1 , 07 4 Gains (losses) on financial transactions and other 76 46 47 116 25 Total income 3 , 84 8 4 , 08 6 4 , 26 2 4 , 46 6 4 , 16 3 Operating expenses ( 1 , 394 ) ( 1 , 444 ) ( 1 , 513 ) ( 1 , 682 ) ( 1 , 486 ) Net operating income 2 , 45 4 2 , 64 2 2 , 74 9 2 , 78 4 2 , 67 7 Net loan - loss provisions ( 773 ) ( 843 ) ( 852 ) ( 956 ) ( 875 ) Other gains (losses) and provisions ( 131 ) ( 137 ) ( 178 ) ( 235 ) ( 142 ) Underlying profit before tax 1 , 55 0 1 , 66 2 1 , 71 9 1 , 59 3 1 , 66 1 Underlying consolidated profit 950 1 , 06 4 1 , 08 0 1 , 04 3 1 , 05 7 Underlying attributable profit 805 914 929 894 928

Brazil (EUR mn) 96 Q 1 ' 1 9 Q 2 ' 1 9 Q 3 ' 1 9 Q 4 ' 1 9 Q 1 ' 2 0 Net interest income 2 , 45 9 2 , 52 0 2 , 56 0 2 , 53 4 2 , 27 0 Net fee income 931 924 970 974 869 Gains (losses) on financial transactions and other 21 9 ( 7 ) 57 ( 3 ) Total income 3 , 41 1 3 , 45 3 3 , 52 2 3 , 56 5 3 , 13 7 Operating expenses ( 1 , 125 ) ( 1 , 102 ) ( 1 , 137 ) ( 1 , 242 ) ( 1 , 004 ) Net operating income 2 , 28 6 2 , 35 1 2 , 38 5 2 , 32 3 2 , 13 3 Net loan - loss provisions ( 710 ) ( 761 ) ( 753 ) ( 813 ) ( 709 ) Other gains (losses) and provisions ( 167 ) ( 153 ) ( 178 ) ( 205 ) ( 127 ) Underlying profit before tax 1 , 40 9 1 , 43 8 1 , 45 4 1 , 30 5 1 , 29 8 Underlying consolidated profit 816 856 862 777 768 Underlying attributable profit 721 762 767 689 694

Brazil (BRL mn) 97 Q 1 ' 1 9 Q 2 ' 1 9 Q 3 ' 1 9 Q 4 ' 1 9 Q 1 ' 2 0 Net interest income 10 , 51 6 11 , 09 5 11 , 27 2 11 , 53 4 11 , 10 0 Net fee income 3 , 98 0 4 , 07 0 4 , 27 1 4 , 42 9 4 , 25 0 Gains (losses) on financial transactions and other 91 41 ( 31 ) 254 ( 14 ) Total income 14 , 58 7 15 , 20 6 15 , 51 1 16 , 21 6 15 , 33 6 Operating expenses ( 4 , 810 ) ( 4 , 857 ) ( 5 , 007 ) ( 5 , 636 ) ( 4 , 907 ) Net operating income 9 , 77 7 10 , 35 0 10 , 50 4 10 , 58 0 10 , 42 9 Net loan - loss provisions ( 3 , 037 ) ( 3 , 347 ) ( 3 , 314 ) ( 3 , 690 ) ( 3 , 464 ) Other gains (losses) and provisions ( 716 ) ( 673 ) ( 785 ) ( 928 ) ( 621 ) Underlying profit before tax 6 , 02 4 6 , 33 0 6 , 40 5 5 , 96 2 6 , 34 4 Underlying consolidated profit 3 , 49 1 3 , 76 9 3 , 79 5 3 , 54 6 3 , 75 6 Underlying attributable profit 3 , 08 2 3 , 35 3 3 , 37 6 3 , 14 7 3 , 39 2
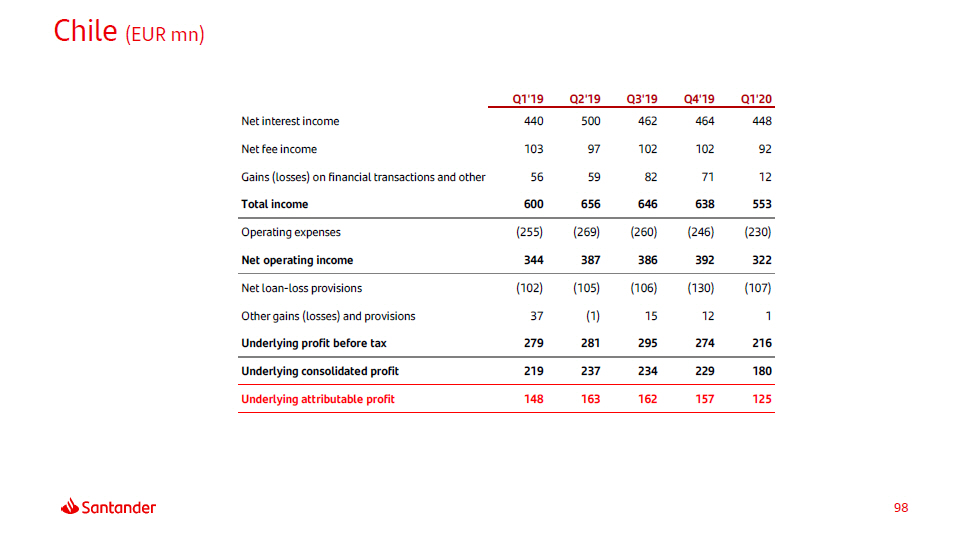
Chile (EUR mn) 98 Q 1 ' 1 9 Q 2 ' 1 9 Q 3 ' 1 9 Q 4 ' 1 9 Q 1 ' 2 0 Net interest income 440 500 462 464 448 Net fee income 103 97 102 102 92 Gains (losses) on financial transactions and other 56 59 82 71 12 Total income 600 656 646 638 553 Operating expenses ( 255 ) ( 269 ) ( 260 ) ( 246 ) ( 230 ) Net operating income 344 387 386 392 322 Net loan - loss provisions ( 102 ) ( 105 ) ( 106 ) ( 130 ) ( 107 ) Other gains (losses) and provisions 37 ( 1 ) 15 12 1 Underlying profit before tax 279 281 295 274 216 Underlying consolidated profit 219 237 234 229 180 Underlying attributable profit 148 163 162 157 125
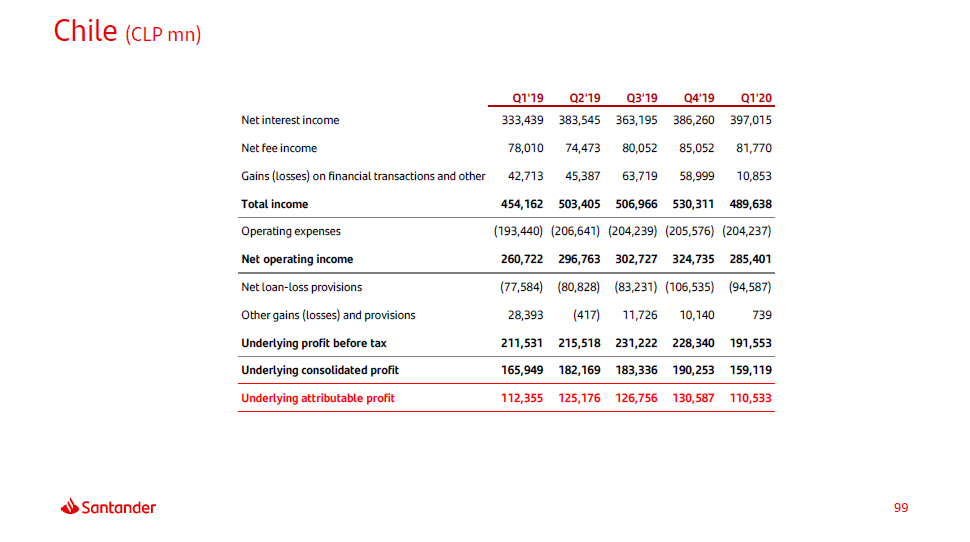
Chile (CLP mn) 99 Q 1 ' 1 9 Q 2 ' 1 9 Q 3 ' 1 9 Q 4 ' 1 9 Q 1 ' 2 0 Net interest income 333 , 43 9 383 , 54 5 363 , 19 5 386 , 26 0 397 , 01 5 Net fee income 78 , 01 0 74 , 47 3 80 , 05 2 85 , 05 2 81 , 77 0 Gains (losses) on financial transactions and other 42 , 71 3 45 , 38 7 63 , 71 9 58 , 99 9 10 , 85 3 Total income 454 , 16 2 503 , 40 5 506 , 96 6 530 , 31 1 489 , 63 8 Operating expenses ( 193 , 440 ) ( 206 , 641 ) ( 204 , 239 ) ( 205 , 576 ) ( 204 , 237 ) Net operating income 260 , 72 2 296 , 76 3 302 , 72 7 324 , 73 5 285 , 40 1 Net loan - loss provisions ( 77 , 584 ) ( 80 , 828 ) ( 83 , 231 ) ( 106 , 535 ) ( 94 , 587 ) Other gains (losses) and provisions 28 , 39 3 ( 417 ) 11 , 72 6 10 , 14 0 739 Underlying profit before tax 211 , 53 1 215 , 51 8 231 , 22 2 228 , 34 0 191 , 55 3 Underlying consolidated profit 165 , 94 9 182 , 16 9 183 , 33 6 190 , 25 3 159 , 11 9 Underlying attributable profit 112 , 35 5 125 , 17 6 126 , 75 6 130 , 58 7 110 , 53 3
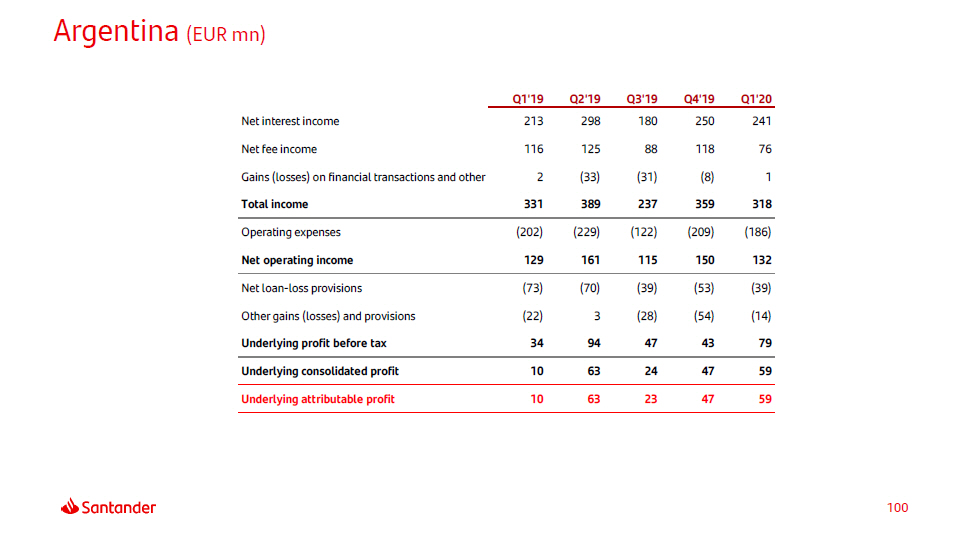
Argentina (EUR mn) 100 Q 1 ' 1 9 Q 2 ' 1 9 Q 3 ' 1 9 Q 4 ' 1 9 Q 1 ' 2 0 Net interest income 213 298 180 250 241 Net fee income 116 125 88 118 76 Gains (losses) on financial transactions and other 2 ( 33 ) ( 31 ) ( 8 ) 1 Total income 331 389 237 359 318 Operating expenses ( 202 ) ( 229 ) ( 122 ) ( 209 ) ( 186 ) Net operating income 129 161 115 150 132 Net loan - loss provisions ( 73 ) ( 70 ) ( 39 ) ( 53 ) ( 39 ) Other gains (losses) and provisions ( 22 ) 3 ( 28 ) ( 54 ) ( 14 ) Underlying profit before tax 34 94 47 43 79 Underlying consolidated profit 10 63 24 47 59 Underlying attributable profit 10 63 23 47 59
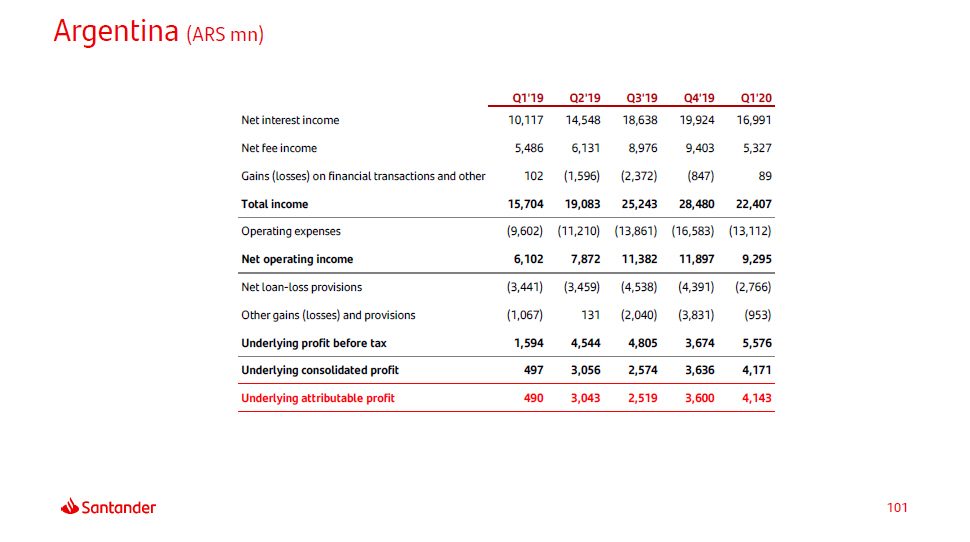
Argentina (ARS mn) 101 Q 1 ' 1 9 Q 2 ' 1 9 Q 3 ' 1 9 Q 4 ' 1 9 Q 1 ' 2 0 Net interest income 10 , 11 7 14 , 54 8 18 , 63 8 19 , 92 4 16 , 99 1 Net fee income 5 , 48 6 6 , 13 1 8 , 97 6 9 , 40 3 5 , 32 7 Gains (losses) on financial transactions and other 102 ( 1 , 596 ) ( 2 , 372 ) ( 847 ) 89 Total income 15 , 70 4 19 , 08 3 25 , 24 3 28 , 48 0 22 , 40 7 Operating expenses ( 9 , 602 ) ( 11 , 210 ) ( 13 , 861 ) ( 16 , 583 ) ( 13 , 112 ) Net operating income 6 , 10 2 7 , 87 2 11 , 38 2 11 , 89 7 9 , 29 5 Net loan - loss provisions ( 3 , 441 ) ( 3 , 459 ) ( 4 , 538 ) ( 4 , 391 ) ( 2 , 766 ) Other gains (losses) and provisions ( 1 , 067 ) 131 ( 2 , 040 ) ( 3 , 831 ) ( 953 ) Underlying profit before tax 1 , 59 4 4 , 54 4 4 , 80 5 3 , 67 4 5 , 57 6 Underlying consolidated profit 497 3 , 05 6 2 , 57 4 3 , 63 6 4 , 17 1 Underlying attributable profit 490 3 , 04 3 2 , 51 9 3 , 60 0 4 , 14 3
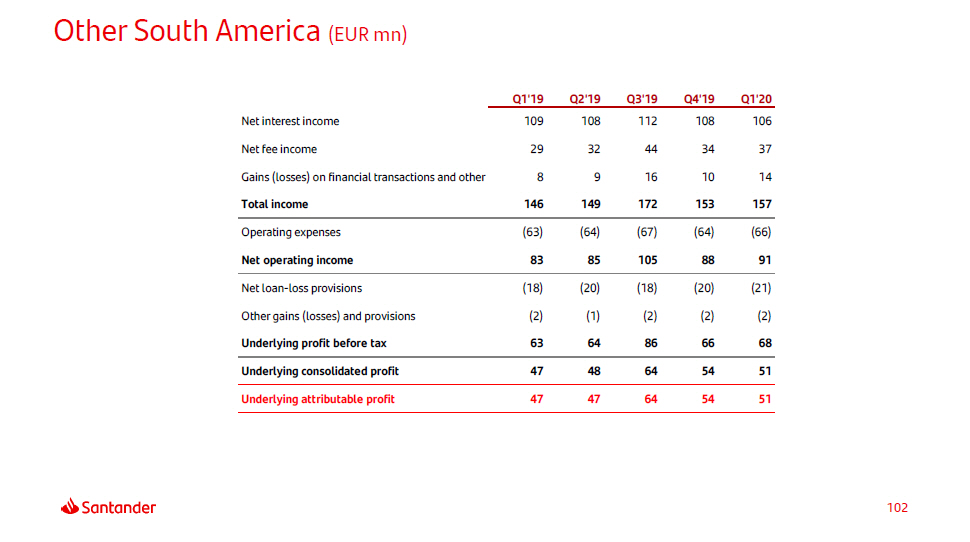
Other South America (EUR mn) 102 Q 1 ' 1 9 Q 2 ' 1 9 Q 3 ' 1 9 Q 4 ' 1 9 Q 1 ' 2 0 Net interest income 109 108 112 108 106 Net fee income 29 32 44 34 37 Gains (losses) on financial transactions and other 8 9 16 10 14 Total income 146 149 172 153 157 Operating expenses ( 63 ) ( 64 ) ( 67 ) ( 64 ) ( 66 ) Net operating income 83 85 105 88 91 Net loan - loss provisions ( 18 ) ( 20 ) ( 18 ) ( 20 ) ( 21 ) Other gains (losses) and provisions ( 2 ) ( 1 ) ( 2 ) ( 2 ) ( 2 ) Underlying profit before tax 63 64 86 66 68 Underlying consolidated profit 47 48 64 54 51 Underlying attributable profit 47 47 64 54 51
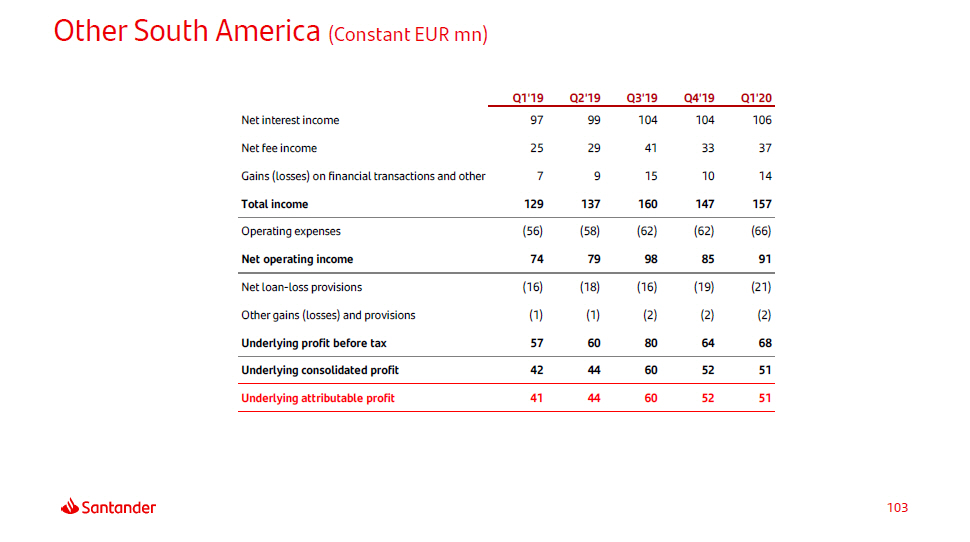
Other South America (Constant EUR mn) 103 Q 1 ' 1 9 Q 2 ' 1 9 Q 3 ' 1 9 Q 4 ' 1 9 Q 1 ' 2 0 Net interest income 97 99 104 104 106 Net fee income 25 29 41 33 37 Gains (losses) on financial transactions and other 7 9 15 10 14 Total income 129 137 160 147 157 Operating expenses ( 56 ) ( 58 ) ( 62 ) ( 62 ) ( 66 ) Net operating income 74 79 98 85 91 Net loan - loss provisions ( 16 ) ( 18 ) ( 16 ) ( 19 ) ( 21 ) Other gains (losses) and provisions ( 1 ) ( 1 ) ( 2 ) ( 2 ) ( 2 ) Underlying profit before tax 57 60 80 64 68 Underlying consolidated profit 42 44 60 52 51 Underlying attributable profit 41 44 60 52 51
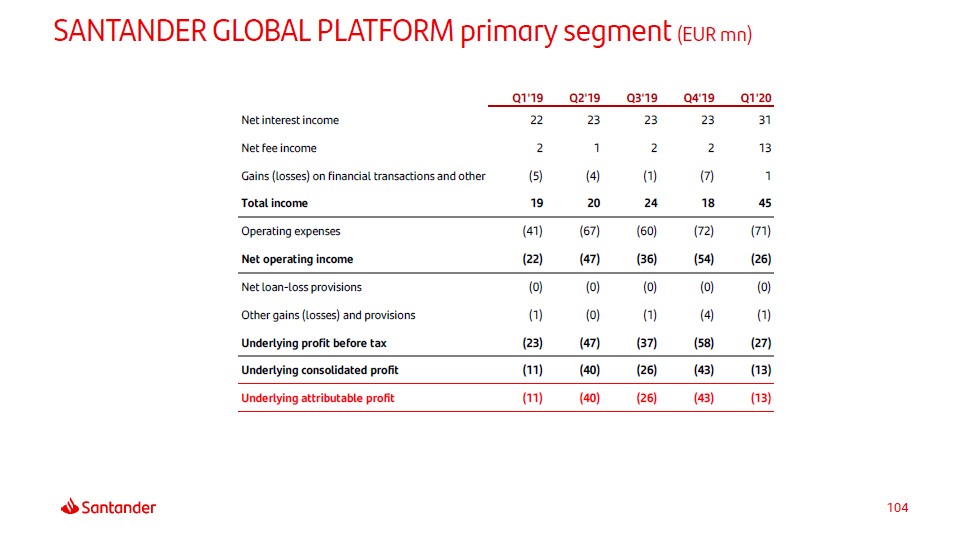
SANTANDER GLOBAL PLATFORM primary segment (EUR mn) 104 Q 1 ' 1 9 Q 2 ' 1 9 Q 3 ' 1 9 Q 4 ' 1 9 Q 1 ' 2 0 Net interest income 22 23 23 23 31 Net fee income 2 1 2 2 13 Gains (losses) on financial transactions and other ( 5 ) ( 4 ) ( 1 ) ( 7 ) 1 Total income 19 20 24 18 45 Operating expenses ( 41 ) ( 67 ) ( 60 ) ( 72 ) ( 71 ) Net operating income ( 22 ) ( 47 ) ( 36 ) ( 54 ) ( 26 ) Net loan - loss provisions ( 0 ) ( 0 ) ( 0 ) ( 0 ) ( 0 ) Other gains (losses) and provisions ( 1 ) ( 0 ) ( 1 ) ( 4 ) ( 1 ) Underlying profit before tax ( 23 ) ( 47 ) ( 37 ) ( 58 ) ( 27 ) Underlying consolidated profit ( 11 ) ( 40 ) ( 26 ) ( 43 ) ( 13 ) Underlying attributable profit ( 11 ) ( 40 ) ( 26 ) ( 43 ) ( 13 )
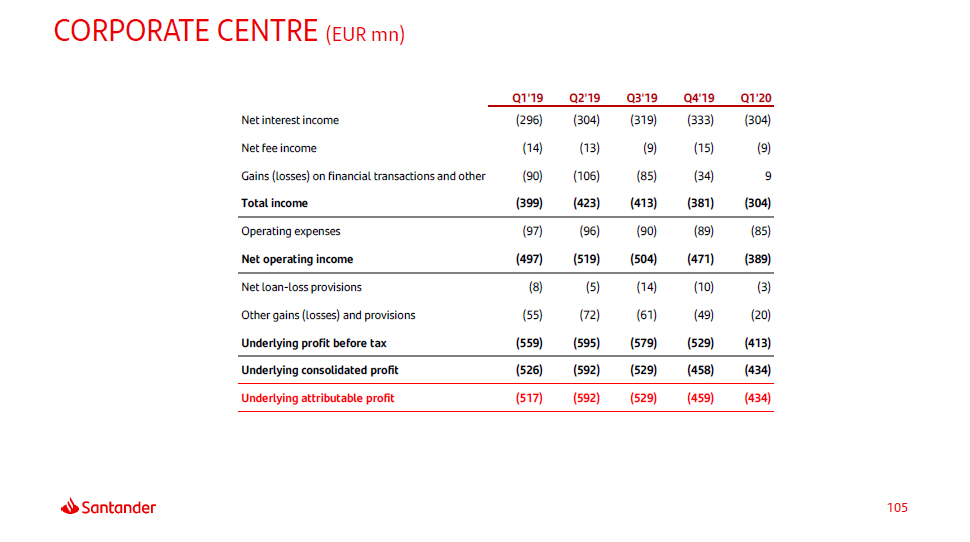
CORPORATE CENTRE (EUR mn) 105 Q 1 ' 1 9 Q 2 ' 1 9 Q 3 ' 1 9 Q 4 ' 1 9 Q 1 ' 2 0 Net interest income ( 296 ) ( 304 ) ( 319 ) ( 333 ) ( 304 ) Net fee income ( 14 ) ( 13 ) ( 9 ) ( 15 ) ( 9 ) Gains (losses) on financial transactions and other ( 90 ) ( 106 ) ( 85 ) ( 34 ) 9 Total income ( 399 ) ( 423 ) ( 413 ) ( 381 ) ( 304 ) Operating expenses ( 97 ) ( 96 ) ( 90 ) ( 89 ) ( 85 ) Net operating income ( 497 ) ( 519 ) ( 504 ) ( 471 ) ( 389 ) Net loan - loss provisions ( 8 ) ( 5 ) ( 14 ) ( 10 ) ( 3 ) Other gains (losses) and provisions ( 55 ) ( 72 ) ( 61 ) ( 49 ) ( 20 ) Underlying profit before tax ( 559 ) ( 595 ) ( 579 ) ( 529 ) ( 413 ) Underlying consolidated profit ( 526 ) ( 592 ) ( 529 ) ( 458 ) ( 434 ) Underlying attributable profit ( 517 ) ( 592 ) ( 529 ) ( 459 ) ( 434 )
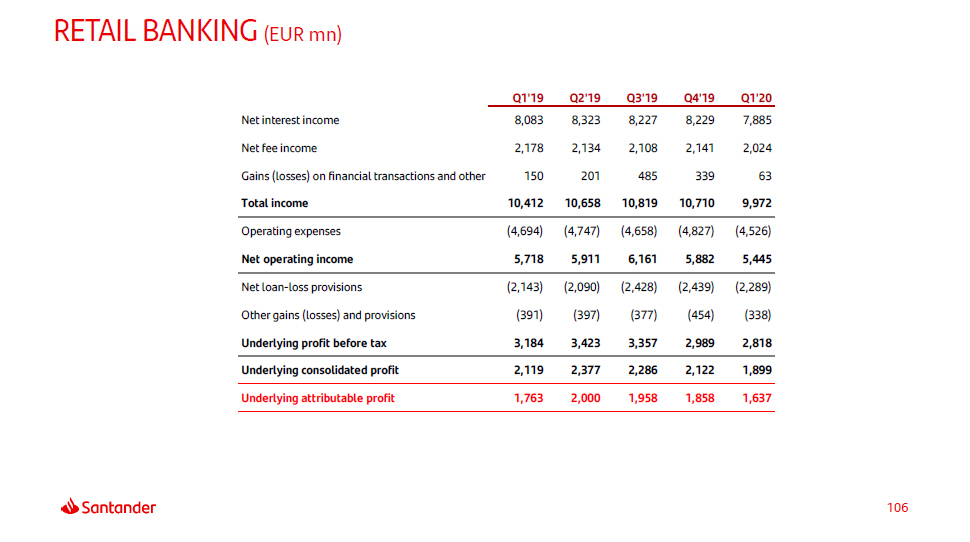
RETAIL BANKING (EUR mn) 106 Q 1 ' 1 9 Q 2 ' 1 9 Q 3 ' 1 9 Q 4 ' 1 9 Q 1 ' 2 0 Net interest income 8 , 08 3 8 , 32 3 8 , 22 7 8 , 22 9 7 , 88 5 Net fee income 2 , 17 8 2 , 13 4 2 , 10 8 2 , 14 1 2 , 02 4 Gains (losses) on financial transactions and other 150 201 485 339 63 Total income 10 , 41 2 10 , 65 8 10 , 81 9 10 , 71 0 9 , 97 2 Operating expenses ( 4 , 694 ) ( 4 , 747 ) ( 4 , 658 ) ( 4 , 827 ) ( 4 , 526 ) Net operating income 5 , 71 8 5 , 91 1 6 , 16 1 5 , 88 2 5 , 44 5 Net loan - loss provisions ( 2 , 143 ) ( 2 , 090 ) ( 2 , 428 ) ( 2 , 439 ) ( 2 , 289 ) Other gains (losses) and provisions ( 391 ) ( 397 ) ( 377 ) ( 454 ) ( 338 ) Underlying profit before tax 3 , 18 4 3 , 42 3 3 , 35 7 2 , 98 9 2 , 81 8 Underlying consolidated profit 2 , 11 9 2 , 37 7 2 , 28 6 2 , 12 2 1 , 89 9 Underlying attributable profit 1 , 76 3 2 , 00 0 1 , 95 8 1 , 85 8 1 , 63 7
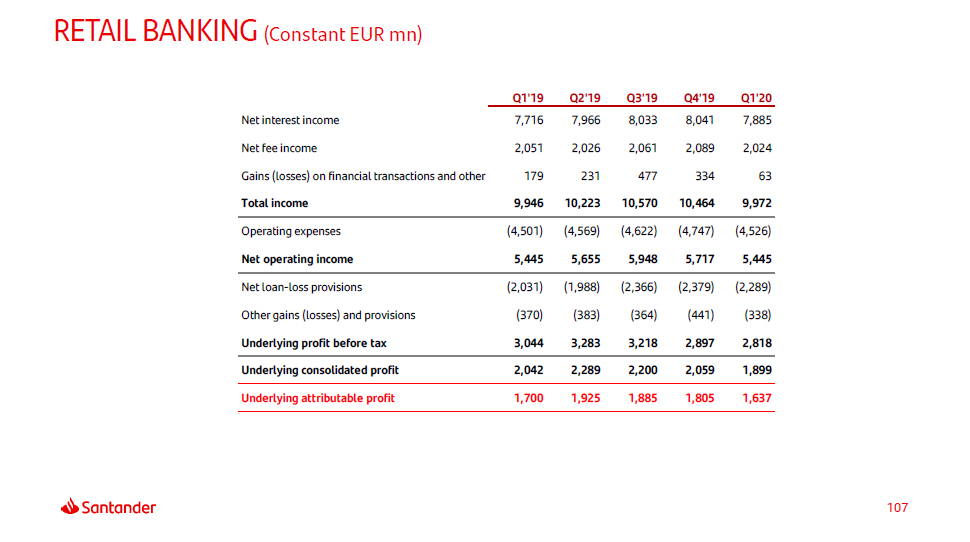
RETAIL BANKING (Constant EUR mn) 107 Q 1 ' 1 9 Q 2 ' 1 9 Q 3 ' 1 9 Q 4 ' 1 9 Q 1 ' 2 0 Net interest income 7 , 71 6 7 , 96 6 8 , 03 3 8 , 04 1 7 , 88 5 Net fee income 2 , 05 1 2 , 02 6 2 , 06 1 2 , 08 9 2 , 02 4 Gains (losses) on financial transactions and other 179 231 477 334 63 Total income 9 , 94 6 10 , 22 3 10 , 57 0 10 , 46 4 9 , 97 2 Operating expenses ( 4 , 501 ) ( 4 , 569 ) ( 4 , 622 ) ( 4 , 747 ) ( 4 , 526 ) Net operating income 5 , 44 5 5 , 65 5 5 , 94 8 5 , 71 7 5 , 44 5 Net loan - loss provisions ( 2 , 031 ) ( 1 , 988 ) ( 2 , 366 ) ( 2 , 379 ) ( 2 , 289 ) Other gains (losses) and provisions ( 370 ) ( 383 ) ( 364 ) ( 441 ) ( 338 ) Underlying profit before tax 3 , 04 4 3 , 28 3 3 , 21 8 2 , 89 7 2 , 81 8 Underlying consolidated profit 2 , 04 2 2 , 28 9 2 , 20 0 2 , 05 9 1 , 89 9 Underlying attributable profit 1 , 70 0 1 , 92 5 1 , 88 5 1 , 80 5 1 , 63 7

CORPORATE & INVESTMENT BANKING (EUR mn) 108 Q 1 ' 1 9 Q 2 ' 1 9 Q 3 ' 1 9 Q 4 ' 1 9 Q 1 ' 2 0 Net interest income 654 700 657 716 671 Net fee income 352 374 421 373 404 Gains (losses) on financial transactions and other 272 217 153 337 225 Total income 1 , 27 8 1 , 29 2 1 , 23 2 1 , 42 6 1 , 30 0 Operating expenses ( 561 ) ( 560 ) ( 552 ) ( 608 ) ( 536 ) Net operating income 717 731 679 818 764 Net loan - loss provisions ( 10 ) ( 45 ) 27 ( 128 ) ( 4 ) Other gains (losses) and provisions ( 22 ) ( 16 ) ( 21 ) ( 32 ) ( 15 ) Underlying profit before tax 686 670 685 658 745 Underlying consolidated profit 484 466 486 449 527 Underlying attributable profit 441 419 443 410 491

CORPORATE & INVESTMENT BANKING (Constant EUR mn) 109 Q 1 ' 1 9 Q 2 ' 1 9 Q 3 ' 1 9 Q 4 ' 1 9 Q 1 ' 2 0 Net interest income 618 662 659 707 671 Net fee income 336 359 412 367 404 Gains (losses) on financial transactions and other 244 200 156 333 225 Total income 1 , 19 8 1 , 22 1 1 , 22 7 1 , 40 7 1 , 30 0 Operating expenses ( 542 ) ( 543 ) ( 550 ) ( 602 ) ( 536 ) Net operating income 656 678 677 805 764 Net loan - loss provisions ( 9 ) ( 44 ) 24 ( 127 ) ( 4 ) Other gains (losses) and provisions ( 21 ) ( 16 ) ( 21 ) ( 31 ) ( 15 ) Underlying profit before tax 626 618 679 647 745 Underlying consolidated profit 442 430 481 441 527 Underlying attributable profit 404 386 442 404 491
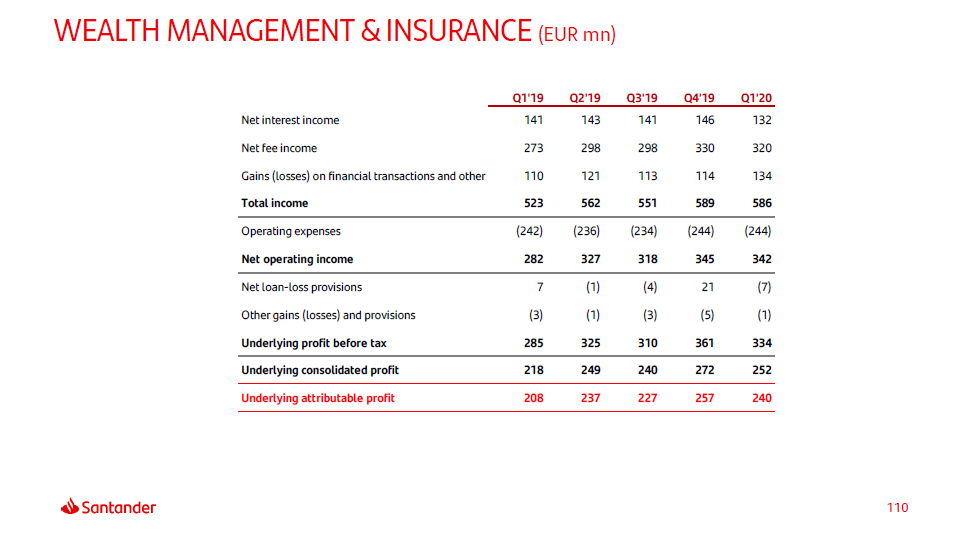
WEALTH MANAGEMENT & INSURANCE (EUR mn) 110 Q 1 ' 1 9 Q 2 ' 1 9 Q 3 ' 1 9 Q 4 ' 1 9 Q 1 ' 2 0 Net interest income 141 143 141 146 132 Net fee income 273 298 298 330 320 Gains (losses) on financial transactions and other 110 121 113 114 134 Total income 523 562 551 589 586 Operating expenses ( 242 ) ( 236 ) ( 234 ) ( 244 ) ( 244 ) Net operating income 282 327 318 345 342 Net loan - loss provisions 7 ( 1 ) ( 4 ) 21 ( 7 ) Other gains (losses) and provisions ( 3 ) ( 1 ) ( 3 ) ( 5 ) ( 1 ) Underlying profit before tax 285 325 310 361 334 Underlying consolidated profit 218 249 240 272 252 Underlying attributable profit 208 237 227 257 240

WEALTH MANAGEMENT & INSURANCE (Constant EUR mn) 111 Q 1 ' 1 9 Q 2 ' 1 9 Q 3 ' 1 9 Q 4 ' 1 9 Q 1 ' 2 0 Net interest income 137 140 144 145 132 Net fee income 266 291 294 324 320 Gains (losses) on financial transactions and other 105 116 109 110 134 Total income 508 546 547 579 586 Operating expenses ( 239 ) ( 232 ) ( 232 ) ( 242 ) ( 244 ) Net operating income 269 314 314 338 342 Net loan - loss provisions 7 ( 1 ) ( 4 ) 21 ( 7 ) Other gains (losses) and provisions ( 3 ) ( 1 ) ( 3 ) ( 5 ) ( 1 ) Underlying profit before tax 273 312 307 354 334 Underlying consolidated profit 209 239 237 266 252 Underlying attributable profit 199 228 225 252 240
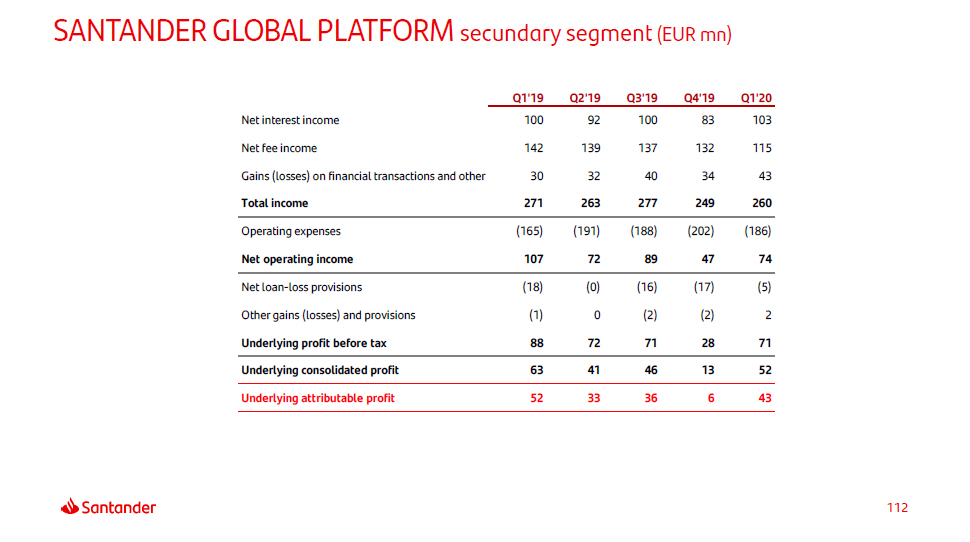
SANTANDER GLOBAL PLATFORM secundary segment (EUR mn) 112 Q 1 ' 1 9 Q 2 ' 1 9 Q 3 ' 1 9 Q 4 ' 1 9 Q 1 ' 2 0 Net interest income 100 92 100 83 103 Net fee income 142 139 137 132 115 Gains (losses) on financial transactions and other 30 32 40 34 43 Total income 271 263 277 249 260 Operating expenses ( 165 ) ( 191 ) ( 188 ) ( 202 ) ( 186 ) Net operating income 107 72 89 47 74 Net loan - loss provisions ( 18 ) ( 0 ) ( 16 ) ( 17 ) ( 5 ) Other gains (losses) and provisions ( 1 ) 0 ( 2 ) ( 2 ) 2 Underlying profit before tax 88 72 71 28 71 Underlying consolidated profit 63 41 46 13 52 Underlying attributable profit 52 33 36 6 43

SANTANDER GLOBAL PLATFORM secondary segment (Constant EUR mn) 113 Q 1 ' 1 9 Q 2 ' 1 9 Q 3 ' 1 9 Q 4 ' 1 9 Q 1 ' 2 0 Net interest income 92 87 96 81 103 Net fee income 127 127 134 130 115 Gains (losses) on financial transactions and other 28 30 39 34 43 Total income 248 244 269 244 260 Operating expenses ( 154 ) ( 182 ) ( 186 ) ( 200 ) ( 186 ) Net operating income 94 62 83 45 74 Net loan - loss provisions ( 18 ) 0 ( 16 ) ( 17 ) ( 5 ) Other gains (losses) and provisions ( 1 ) 0 ( 2 ) ( 2 ) 2 Underlying profit before tax 75 63 65 25 71 Underlying consolidated profit 55 35 42 12 52 Underlying attributable profit 45 27 33 5 43

Appendix 114 Net capital gains and provisions Primary segments Secondary segments Other countries. Detail Balance sheet and capital management Yield on loans and cost of deposits NPL and coverage ratios and cost of credit Responsible Banking Quarterly income statements Glossary
Glossary - Acronyms AFS: Available for sale AuM: Assets under Management BFG: Deposit Guarantee Fund in Poland bn: Billion CET1: Common equity tier 1 C&I: Commercial and Industrial CIB: Corporate & Investment Bank COVID - 19: Coronavirus Disease 19 DGF: Deposit guarantee fund GDP: Gross domestic product FL: Fully - loaded FX: Foreign exchange EPS: Earning per share ESG: Environmental, social and governance LTV: Loan to Value LLPs: Loan - loss provisions RoRWA: Return on risk - weighted assets RoTE: Return on tangible equity RWA: Risk - weighted assets SBNA: Santander Bank NA SCF: Santander Consumer Finance SC USA: Santander Consumer USA SME: Small and Medium Enterprises SRF: Single Resolution Fund ST: Short term SVR: Standard variable rate TDR: Troubled debt restructuring TLAC: Total loss absorbing capacity TNAV: Tangible net asset value UF: Unidad de fomento (Chile) YoY: Year - on - Year UX: User experience M/LT: Medium - and long - term mn: million MXN: Mexican Pesos n.a.: Not available NII : Net interest income NIM: Net interest margin n.m.: Not meaningful NPL: Non - performing loans PBT: Profit before tax P&L: Profit and loss PPP: Pre - provision profit QoQ: Quarter - on - Quarter RE : Real Estate Repos: Repurchase agreements ROF: Gains on financial transactions 115

Glossary – definitions PROFITABILITY AND EFFICIENCY RoTE: Return on tangible capital: Group attributable profit / average of: net equity (excluding minority interests) – intangible assets (including goodwill) RoRWA: Return on risk - weighted assets: consolidated profit / average risk - weighted assets Efficiency: Operating expenses / gross income. Operating expenses defined as general administrative expenses + amortisations CREDIT RISK NPL ratio: Non - performing loans and customer advances, customer guarantees and contingent liabilities / total risk. Total risk is defined as: normal and non - performing balances of customer loans and advances, customer guarantees and contingent liabilities NPL coverage ratio: Provisions to cover losses due to impairment of customer loans and advances, customer guarantees and contingent liabilities / non - performing balances of customer loans and advances, customer guarantees and contingent liabilities Cost of credit: Provisions to cover losses due to impairment of loans in the last 12 months / average customer loans and advances of the last 12 months CAPITALISATION Tangible net asset value per share – TNAVps: Tangible stockholders' equity / number of shares (excluding treasury shares). Tangible stockholders' equity calculated as shareholders equity + accumulated other comprehensive income - intangible assets 116 Notes: 1) The averages for the RoTE and RoRWA denominators are calculated on the basis of 4 months from December to March. 2) For periods of less than a year, and in the event of non - recurring results existing, the profit used to calculate the RoTE is the annualised underlying attributable profit (excluding non - recurring results), to which are added non - recurring results without annualising them. 3) For periods of less than a year, and in the event of non - recurring results existing, the profit used to calculate the RoRWA is the annualised underlying consolidated result (excluding non - recurring results), to which is added non - recurring results without annualising them. 4) The risk - weighted assets included in the RoRWA denominator are calculated in accordance with the criteria defined by the Capital Requirements Regulation (CRR).

Thank You. Our purpose is to help people and businesses prosper. Our culture is based on believing that everything we do should be:
SIGNATURE
Pursuant to the requirements of the Securities Exchange Act of 1934, the registrant has duly caused this report to be signed on its behalf by the undersigned, thereunto duly authorized.
| Banco Santander, S.A. | |||||
| Date: | April 28, 2020 | By: | /s/ José García Cantera | ||
| Name: | José García Cantera | ||||
| Title: | Chief Financial Officer | ||||