FORM 6-K
SECURITIES AND EXCHANGE COMMISSION
Washington, D.C. 20549
Report of Foreign Issuer
Pursuant to Rule 13a-16 or 15d-16
of the Securities Exchange Act of 1934
For the month of July, 2020
Commission File Number: 001-12518
Banco Santander, S.A.
(Exact name of registrant as specified in its charter)
Ciudad Grupo Santander
28660 Boadilla del Monte (Madrid) Spain
(Address of principal executive office)
Indicate by check mark whether the registrant files or will file annual reports under cover of Form 20-F or Form 40-F:
Form 20-F ☒ Form 40-F ☐
Indicate by check mark if the registrant is submitting the Form 6-K in paper as permitted by Regulation S-T Rule 101(b)(1):
Yes ☐ No ☒
Indicate by check mark if the registrant is submitting the Form 6-K in paper as permitted by Regulation S-T Rule 101(b)(7):
Yes ☐ No ☒
BANCO SANTANDER, S.A.
________________________
TABLE OF CONTENTS
| Part 1. January - June 2020 Financial Report | |||||
FINANCIAL
REPORT

| Financial Report | 2020 | ||||
| First half | |||||
Index

This report was approved by the Board of Directors on 28 July 2020, following a favourable report from the Audit Committee. Important information regarding this report can be found on pages 92 and 93.
Key consolidated data
| BALANCE SHEET (EUR million) | Jun-20 | Mar-20 | % | Jun-20 | Jun-19 | % | Dec-19 | |||||||||||||||||||||||||||||||||||||
| Total assets | 1,572,881 | 1,540,359 | 2.1 | 1,572,881 | 1,512,096 | 4.0 | 1,522,695 | |||||||||||||||||||||||||||||||||||||
| Loans and advances to customers | 934,796 | 935,407 | (0.1) | 934,796 | 908,235 | 2.9 | 942,218 | |||||||||||||||||||||||||||||||||||||
| Customer deposits | 846,832 | 815,459 | 3.8 | 846,832 | 814,751 | 3.9 | 824,365 | |||||||||||||||||||||||||||||||||||||
| Total funds | 1,039,996 | 1,006,948 | 3.3 | 1,039,996 | 1,032,769 | 0.7 | 1,050,765 | |||||||||||||||||||||||||||||||||||||
| Total equity | 91,859 | 106,113 | (13.4) | 91,859 | 109,985 | (16.5) | 110,659 | |||||||||||||||||||||||||||||||||||||
| Note: Total funds includes customer deposits, mutual funds, pension funds and managed portfolios | ||||||||||||||||||||||||||||||||||||||||||||
| INCOME STATEMENT (EUR million) | Q2'20 | Q1'20 | % | H1'20 | H1'19 | % | 2019 | |||||||||||||||||||||||||
| Net interest income | 7,715 | 8,487 | (9.1) | 16,202 | 17,636 | (8.1) | 35,283 | |||||||||||||||||||||||||
| Total income | 10,459 | 11,809 | (11.4) | 22,268 | 24,436 | (8.9) | 49,229 | |||||||||||||||||||||||||
| Net operating income | 5,341 | 6,220 | (14.1) | 11,561 | 12,849 | (10.0) | 25,949 | |||||||||||||||||||||||||
| Profit before tax | (8,301) | 1,891 | — | (6,410) | 6,531 | — | 12,543 | |||||||||||||||||||||||||
| Attributable profit to the parent | (11,129) | 331 | — | (10,798) | 3,231 | — | 6,515 | |||||||||||||||||||||||||
| Changes in constant euros: | ||||||||||||||||||||||||||||||||
| Q2'20 / Q1'20: NII: -1.9%; Total income: -4.6%; Net operating income: -6.1%; Attributable profit: +/- | ||||||||||||||||||||||||||||||||
| H1'20 / H1'19: NII: -0.2%; Total income: -1.1%; Net operating income: -0.9%; Attributable profit: +/- | ||||||||||||||||||||||||||||||||
| EPS, PROFITABILITY AND EFFICIENCY (%) | Q2'20 | Q1'20 | % | H1'20 | H1'19 | % | 2019 | ||||||||||||||||
| EPS (euros) | (0.679) | 0.012 | — | (0.667) | 0.181 | — | 0.362 | ||||||||||||||||
| RoE | (7.06) | 1.47 | (9.28) | 7.41 | 6.62 | ||||||||||||||||||
| RoTE | 5.19 | 2.04 | 1.73 | 10.51 | 11.44 | ||||||||||||||||||
| RoA | (0.38) | 0.18 | (0.51) | 0.60 | 0.54 | ||||||||||||||||||
| RoRWA | (1.02) | 0.45 | (1.34) | 1.48 | 1.33 | ||||||||||||||||||
| Efficiency ratio | 47.4 | 47.2 | 47.3 | 47.4 | 47.0 | ||||||||||||||||||
UNDERLYING INCOME STATEMENT (1) (EUR million) | Q2'20 | Q1'20 | % | H1'20 | H1'19 | % | 2019 | |||||||||||||||||||||||||
| Net interest income | 7,715 | 8,487 | (9.1) | 16,202 | 17,636 | (8.1) | 35,283 | |||||||||||||||||||||||||
| Total income | 10,704 | 11,814 | (9.4) | 22,518 | 24,436 | (7.8) | 49,494 | |||||||||||||||||||||||||
| Net operating income | 5,628 | 6,237 | (9.8) | 11,865 | 12,849 | (7.7) | 26,214 | |||||||||||||||||||||||||
| Profit before tax | 1,885 | 1,956 | (3.6) | 3,841 | 7,579 | (49.3) | 14,929 | |||||||||||||||||||||||||
| Attributable profit to the parent | 1,531 | 377 | 306.1 | 1,908 | 4,045 | (52.8) | 8,252 | |||||||||||||||||||||||||
| Changes in constant euros: | ||||||||||||||||||||||||||||||||
| Q2'20 / Q1'20: NII: -1.9%; Total income: -2.5%; Net operating income: -1.6%; Attributable profit: +420.9% | ||||||||||||||||||||||||||||||||
| H1'20 / H1'19: NII: -0.2%; Total income: 0.0%; Net operating income: +1.7%; Attributable profit: -47.5% | ||||||||||||||||||||||||||||||||
UNDERLYING EPS AND PROFITABILITY (1) (%) | Q2'20 | Q1'20 | % | H1'20 | H1'19 | % | 2019 | ||||||||||||||||
| Underlying EPS (euros) | 0.084 | 0.014 | 487.4 | 0.098 | 0.231 | (57.5) | 0.468 | ||||||||||||||||
| Underlying RoE | 6.62 | 1.52 | 3.98 | 8.24 | 8.38 | ||||||||||||||||||
| Underlying RoTE | 8.93 | 2.11 | 5.44 | 11.68 | 11.79 | ||||||||||||||||||
| Underlying RoA | 0.43 | 0.18 | 0.31 | 0.66 | 0.65 | ||||||||||||||||||
| Underlying RoRWA | 1.14 | 0.46 | 0.80 | 1.62 | 1.61 | ||||||||||||||||||
SOLVENCY (2) AND NPL RATIOS (%) | Jun-20 | Mar-20 | Jun-20 | Jun-19 | Dec-19 | ||||||||||||||||||
| CET1 | 11.84 | 11.58 | 11.84 | 11.30 | 11.65 | ||||||||||||||||||
| Fully loaded Total capital ratio | 15.46 | 15.08 | 15.46 | 14.80 | 15.02 | ||||||||||||||||||
| NPL ratio | 3.26 | 3.25 | 3.26 | 3.51 | 3.32 | ||||||||||||||||||
| Coverage ratio | 72 | 71 | 72 | 68 | 68 | ||||||||||||||||||
| MARKET CAPITALISATION AND SHARES | Jun-20 | Mar-20 | % | Jun-20 | Jun-19 | % | Dec-19 | ||||||||||||||||
| Shares (millions) | 16,618 | 16,618 | 0.0 | 16,618 | 16,237 | 2.3 | 16,618 | ||||||||||||||||
| Share price (euros) | 2.175 | 2.218 | (2.0) | 2.175 | 4.081 | (46.7) | 3.730 | ||||||||||||||||
| Market capitalisation (EUR million) | 36,136 | 36,859 | (2.0) | 36,136 | 66,253 | (45.5) | 61,986 | ||||||||||||||||
| Tangible book value per share (euros) | 4.00 | 4.21 | 4.00 | 4.30 | 4.36 | ||||||||||||||||||
| Price / Tangible book value per share (X) | 0.54 | 0.53 | 0.54 | 0.95 | 0.86 | ||||||||||||||||||
| OTHER DATA | Jun-20 | Mar-20 | % | Jun-20 | Jun-19 | % | Dec-19 | ||||||||||||||||
| Number of shareholders | 4,080,201 | 4,043,974 | 0.9 | 4,080,201 | 4,054,208 | 0.6 | 3,986,093 | ||||||||||||||||
| Number of employees | 194,284 | 194,948 | (0.3) | 194,284 | 201,804 | (3.7) | 196,419 | ||||||||||||||||
| Number of branches | 11,847 | 11,902 | (0.5) | 11,847 | 13,081 | (9.4) | 11,952 | ||||||||||||||||
| (1) In addition to financial information prepared in accordance with International Financial Reporting Standards (IFRS) and derived from our consolidated financial statements, this report contains certain financial measures that constitute alternative performance measures (APMs) as defined in the Guidelines on Alternative Performance Measures issued by the European Securities and Markets Authority (ESMA) on 5 October 2015 and other non-IFRS measures, including the figures related to “underlying” results, as they are recorded in the separate line of “net capital gains and provisions”, above the line of attributable profit to the parent. Further details are provided on page 14 of this report. For further details of the APMs and non-IFRS measures used, including its definition or a reconciliation between any applicable management indicators and the financial data presented in the consolidated financial statements prepared under IFRS, please see 2019 Annual Financial Report, published in the CNMV on 28 February 2020, our 20-F report for the year ending 31 December 2019 registered with the SEC in the United States as well as the “Alternative performance measures” section of the annex to this report. | ||
| (2) Data applying the IFRS 9 transitional arrangements. | ||
January - June 2020 |  | 3 | ||||||
Response to the COVID-19 crisis | ||||||||||||||||||||||||||
| Response to COVID-19 crisis | ||||||||||||||||||||||||||
In order to support the global effort being made to combat COVID-19, Grupo Santander is implementing various measures to protect our stakeholders. The most relevant measures are detailed below, focused on six main dimensions:
 | Contingency plan |  | Health of our employees | ||||||||||||||||||||
Preserving our business and critical functions in stress conditions is essential to providing our services to customers to our usual high standards. Consequently, the Group has the necessary contingency plans, which incorporate simulations of stress scenarios, that have enabled us to face the current situation with suitable preparation and knowledge. In February, in line with our Special Situations Management Framework, the highest level Corporate Special Situation Committees were activated to ensure an early and coordinated response in all geographic areas, where Local Committees were also activated according to the spread of the pandemic and local government responses. The contingency plans were implemented through these committees including the participation of local senior management (Country Heads, Local Special Situations Management Directors, Local Directors, etc.). Our Contingency Plans ensured the operational continuity of business in all geographic areas, identifying their critical businesses and, among other measures, segregating teams and technological infrastructures, establishing shifts between critical employees and their back-ups, as well as increasing the capacity of systems and lines, carried out by the Technology and Operations area. Consequently, none of our units' operational continuity was compromised, nor did they record any relevant incidents. At the same time, we continued to serve our customers with the utmost attention. | Our priority was to safeguard the health and safety of our employees. During the different phases of the confinement, both tightening and relaxing of measures, in which some countries still find themselves: •We have provided all our employees special safety and protection measures: –We redefined our way of working to adapt to remote working, reaching more than 110,000 employees working from home. –We ensured the physical and mental well-being of the employees who continued to work in our offices, or face to face with customers. These measures included providing masks, gloves and protective screens, as well as the reorganisation of physical space to ensure the recommended social distance, combined with strict personal hygiene measures. –Financial well-being was also covered, offering various financial support measures to help employees who are experiencing financial difficulties, such as flexible loans or salary advances. •On the other hand, our training and development programmes were adapted to a new online format. In particular, those related to project management, leadership and remote working efficiency attracted great interest. •Lastly, we started to gradually return to the usual workplaces in some countries at the end of May, always following the recommendations of local governments, respecting the individual needs of each employee and based on three pillars: development and implementation of health and safety protocols, prioritisation and monitoring the health status of our employees, and tracking and tracing (through health apps). | ||||||||||||||||||||||
 |  | ||||||||||||||||||||||
| 4 | | January - June 2020 | ||||||
Response to the COVID-19 crisis | ||||||||||||||||||||||||||
| Response to COVID-19 crisis | ||||||||||||||||||||||||||
 | Customers |  | Business, liquidity and risks | ||||||||||||||||||||
Santander has implemented measures to ensure the health and safety of its customers and foster their economic resilience during the crisis in all countries. Of note were: •Provide liquidity and credit facilities for businesses facing hardship. •Facilitate payment deferrals and payment holidays in many of our markets. •Temporary option to increase credit card and overdraft limits. •Proactive support for vulnerable customers trying to cover their needs. •Temporary reduction and suspension of fees (withdrawals from ATMs, interest free online purchases, bank transfers, etc.). •Ensure COVID-19 health insurance coverage. •Specialised teams to advise customers facing financial difficulties. We are continuously adapting the branch network, ensuring the continuity of service in the branch network. Currently, around 90% of our branches are open. On the other hand, we strengthened our contact centres' capabilities, which has enabled us to increase the volume of services by 16% on average compared to normal times. The Group is actively supporting our customers through various relief programmes, especially those that are more vulnerable, monitoring their performance and payment capacity as well as ensuring that business continuity plans remain effective so that we can keep serving our clients under the highest quality standards. The Bank is reassessing the situation as the pandemic evolves in each market, and taking action according to the specific needs of every country. | In the second quarter, business performance continued its growth trajectory recorded in the previous quarter. Group loans and advances to customers excluding the exchange rate impact increased 6% and customer funds 7% year-on-year. During the second quarter, the recovery of pre-COVID-19 new business levels in the individuasl segment (mortgages and consumer finance) began, mainly in Europe and the US. On the other hand, activity in large corporates stood at more normal levels, following the sharp increase recorded in March, and SMEs and corporates reflected the state-guaranteed programmes. Since the beginning of the crisis, liquidity has been closely monitored in the parent bank and our subsidiaries, and preventive management measures were carried out to strengthen its position. Our liquidity position has remained solid at all times. The Group's LCR ratio was 175%, the parent bank's was 193% and all our subsidiaries stood above 130%, at the end of the first half. In addition, central banks have adopted measures to provide significant liquidity to the system. Regarding risks, the main indicators are also continuously monitored, and maintain a robust credit quality supported by mitigation measures and volume increases. In the first half of the year, we recorded provisions amounting to EUR 7,027 million, 63% more than in the same period of 2019 (+78% excluding the exchange rate impact). In addition, due to the deterioration of the economic outlook, the Bank has adjusted the valuation of its goodwill ascribed to several subsidiaries and deferred tax assets for EUR 12.6 billion. This adjustment has no impact on the Bank's liquidity or market and credit risk position, and is neutral in CET1 capital. | ||||||||||||||||||||||
 |  | ||||||||||||||||||||||
January - June 2020 | | 5 | ||||||
Response to the COVID-19 crisis | ||||||||||||||||||||||||||
| Response to COVID-19 crisis | ||||||||||||||||||||||||||
 | Society |  | Information for stakeholders | ||||||||||||||||||||
One of our main priorities is to contribute to the well-being of society as a whole. We have implemented actions and mobilised resources together with governments and institutions to help society combat the health crisis. Santander All. Together. Now. is the motto that brings together the Group's collective efforts around the world to stand beside the people who need it the most at this time. This effort has succeeded in mobilising more than EUR 100 million dedicated to solidarity initiatives to fight COVID-19. The main initiatives adopted are: •Creation of a solidarity fund to acquire medical equipment and materials, and to support organisations in the fight against COVID-19. This fund is primarily financed by contributions from senior management, employees and the Group's subsidiaries, as well as contributions from third parties. As a starting point, the Executive Chairman and the CEO, have renounced 50% of their total compensation in 2020 and non-executive directors 20% of their total remuneration. The Group has created employee funds in most of the countries where it operates. •Supporting different projects and social initiatives to protect the vulnerable groups most impacted by the effects of the pandemic. •Santander Universidades reallocated funds to support collaboration projects with universities to face the health and educational challenges arising from the COVID-19 crisis, scholarships to foster online education during the confinement period and support the most disadvantaged students. The Bank also launched Santander X Tomorrow Challenge, with the aim of supporting creativity and and entrepreneurs' capacity to contribute the best solutions to the major post-COVID-19 challenges. •Launch of Overcome Together, an open and accessible space for individuals and companies, both customers and non-customers, which contains information and resources to help overcome the situation arising from COVID-19. It is available in Spain, Portugal, Mexico, Brazil, Uruguay, Chile, Poland, Argentina, the UK and Openbank. •Santander, together with another financial entity, developed and provided the Mexican Government the free use of a digital platform that will help the population to generate a COVID-19 self-diagnosis (personal and for a family), where relevant information about the pandemic is available. We will continue to monitor the situation in order to continue to contribute to minimise the impact of COVID-19 on society. | Based on transparency and anticipation, the Group continued to be proactive in keeping our people, customers, shareholders and investors informed at all times. We followed various initiatives during the different phases of the pandemic: •To stay close to all our employees, we sent out newsletters in most of our markets including updates on the health crisis. We reported on measures, policies and recommendations related to prevention and protection. Advice was also given on how to reconcile work and family life, as well as different proposals for leisure and health-related activities. •We continued to issue communications to customers encouraging the use of digital channels, cybersecurity tips, new branch opening hours and functionality and all information regarding the public and the Bank's own support measures. •In order to protect the health of our shareholders, Santander held its first ever general shareholder's meeting via remote channels from Ciudad Grupo Santander. Clear, regular communication is very important for us as a Group. The Bank's senior management (Group executive chairman, Group CEO, Heads of Division and Country Heads) have been in regular contact with all teams. Of note were the five Ask Ana events held to report on the Group's situation and answer questions from employees. The main measures announced by each country can be found on the Group's website (www.santander.com). Santander’s outstanding COVID-19 response and support to SMEs was recognised by Euromoney: •Euromoney has praised Santander's response to the COVID-19 crisis in Europe (Western and Central and Eastern Europe) with an “Excellence in Leadership” award. The magazine commended Santander for the way it managed the health and economic crisis for its employees, clients, business and the society in general. •Euromoney also recognised the valuable support that Santander is providing to SMEs during the crisis and more generally with the Best Bank for SMEs in Western Europe and Latin America awards. Furthermore, the magazine’s editors acknowledged Santander as Best Bank in Spain and Portugal, and Best Investment Bank in Portugal. | ||||||||||||||||||||||
 |  | ||||||||||||||||||||||
| 6 | | January - June 2020 | ||||||
Business model | Group financial information | Financial information by segments | Responsible banking Corporate governance Santander share | Appendix | ||||||||||||||||||||||
| Business model | ||||||||||||||||||||||||||
Our business model is based on three pillars
1. Our scale Local scale and global reach | 2. Customer focus Unique personal banking relationships strengthen customer loyalty | 3. Diversification Our geographic and business diversification makes us more resilient under adverse circumstances | ||||||||||||||||||
•Local scale based on three geographic regions, where we maintain a leadership position in our 10 core markets. •Global reach backed by our global businesses, enabling greater collaboration across the Group to generate higher revenue and efficiencies. | •We serve 146 million customers, in markets with a total population of more than one billion people. •We have over 100,000 people talking to our customers every day in our c.12,000 branches and contact centres. | •Geographic diversification in three regions, with a good balance between mature and developing markets. •Global businesses that strengthen our local franchises. •Santander Global Platform supports the digital transformation across the Group. | ||||||||||||||||||
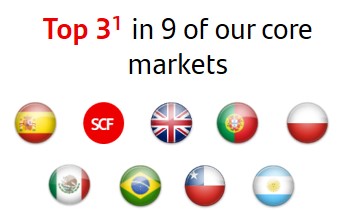 | 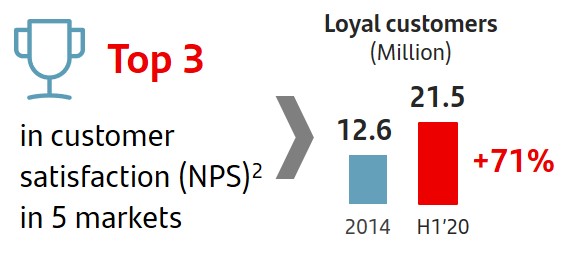 | 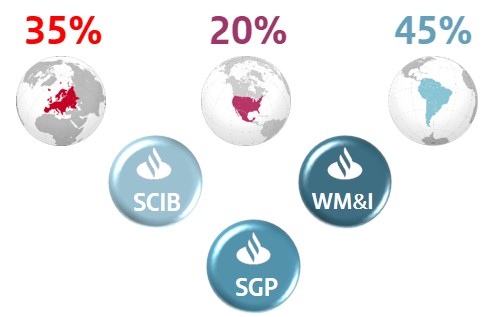 | ||||||||||||||||||
| 1. Market share in lending as of March 2020 including only privately-owned banks. UK benchmark refers to the mortgage market. | 2. NPS – Customer Satisfaction internal benchmark of active customers’ experience and satisfaction audited by Stiga / Deloitte. | Note. Underlying attributable profit contribution by region, excluding Santander Global Platform and Corporate Centre. | ||||||||||||||||||
Our corporate culture: Santander Way
The Santander Way reflects our purpose, our aim, and how we do business. It is the bedrock on which we are building a more responsible bank.

January - June 2020 | | 7 | ||||||
 GROWTH
In the quarter, the Group continued to provide significant financial support to customers to help them overcome the consequences of the pandemic
We are starting to see signs of normalisation in lending trends with mortgage and consumer lending recovering in June. The SME and corporate segments, backed by government-guaranteed programmes, and CIB decreased from the peak in April.
On a year-on-year basis, strong negative exchange rate impact (-5/-6 pp). In constant euros, gross loans and advances to customers (excluding reverse repos) grew 6% and customer funds (excluding repos) rose 7%, both with the 10 core markets growing, except customer funds in Spain.
| Activity Jun-20 / Jun-19 | |||||||||||||||||||||||||||||||||||||||||||||||||||||||||||||||||||||||
| % change in constant euros | |||||||||||||||||||||||||||||||||||||||||||||||||||||||||||||||||||||||
| +4% | |||||||||||||||||||||||||||||||||||||||||||||||||||||||||||||||||||||||
| Individuals | |||||||||||||||||||||||||||||||||||||||||||||||||||||||||||||||||||||||
| +11% | |||||||||||||||||||||||||||||||||||||||||||||||||||||||||||||||||||||||
| +11% | Demand | ||||||||||||||||||||||||||||||||||||||||||||||||||||||||||||||||||||||
| SMEs and corporates | |||||||||||||||||||||||||||||||||||||||||||||||||||||||||||||||||||||||
| +6% | +1% | ||||||||||||||||||||||||||||||||||||||||||||||||||||||||||||||||||||||
| +7% | Time | ||||||||||||||||||||||||||||||||||||||||||||||||||||||||||||||||||||||
| +14% | |||||||||||||||||||||||||||||||||||||||||||||||||||||||||||||||||||||||
| CIB and institutions | -1% | ||||||||||||||||||||||||||||||||||||||||||||||||||||||||||||||||||||||
| Mutual funds | |||||||||||||||||||||||||||||||||||||||||||||||||||||||||||||||||||||||
| Gross loans and advances to customers excl. reverse repos | Customer deposits excl. repos + mutual funds | ||||||||||||||||||||||||||||||||||||||||||||||||||||||||||||||||||||||
In the current environment, digital penetration is accelerating. We reached almost 40 million digital customers (+15% year-on-year), mobile customers exceeded 32 million (+5.8 million in 12 months) and digital sales represented 47% of total sales in the quarter (36% in 2019).
Loyal customers rose nearly 1 million year-on-year, with growth both in individuals and corporates.
| Digital customers | Digital sales | |||||||||||||||||||||||||||||||||||||||||||||||||||||||||||||||||||||||||||||||
| Million | % of total sales | |||||||||||||||||||||||||||||||||||||||||||||||||||||||||||||||||||||||||||||||
| 39.9 | ||||||||||||||||||||||||||||||||||||||||||||||||||||||||||||||||||||||||||||||||
| 47 | % | |||||||||||||||||||||||||||||||||||||||||||||||||||||||||||||||||||||||||||||||
| 34.8 | +15% | |||||||||||||||||||||||||||||||||||||||||||||||||||||||||||||||||||||||||||||||
| 36 | % | |||||||||||||||||||||||||||||||||||||||||||||||||||||||||||||||||||||||||||||||
| Jun-19 | Jun-20 | 2019 | Q2'20 | |||||||||||||||||||||||||||||||||||||||||||||||||||||||||||||||||||||||||||||
 PROFITABILITY
Despite these difficult circumstances, our operating performance has been strong...
In the first half of the year, results were affected by the deterioration of the economic environment derived from the health crisis and the sharp exchange rate depreciation that distort the year-on-year comparison.
Excluding the exchange rate impact, the underlying performance of the business was strong, supported by resilient customer revenue, cost reductions and robust credit quality.
Net interest income and customer revenue remained stable year-on-year, as the fall in activity and lower interest rates were offset by higher volumes, good market volatility management and the reduction in the cost of deposits.
On the other hand, cost reductions were ahead of plan, as costs fell 5% in real terms and excluding the FX impact, due to the optimisation plans carried out in recent years, together with the additional savings measures adopted from the beginning of the crisis.
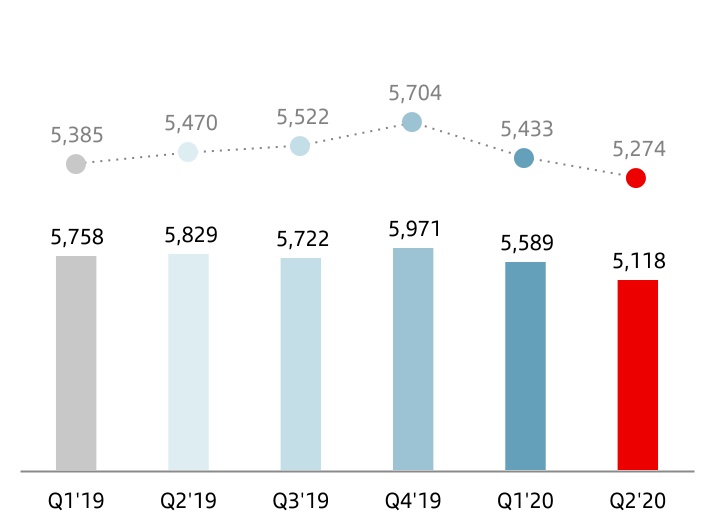
As a result, net operating income increased 2% to EUR 11,865 million, primarily driven by the positive performance in Latin America, Santander Corporate & Investment Banking and Wealth Management & Insurance.
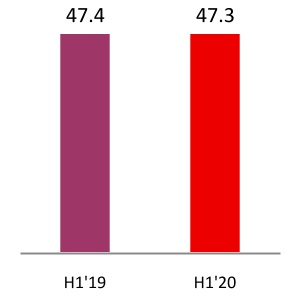
The efficiency ratio stood at around 47%, one of the best among our peers.
| Efficiency ratio | ||
| % | ||
| 8 | | January - June 2020 | ||||||
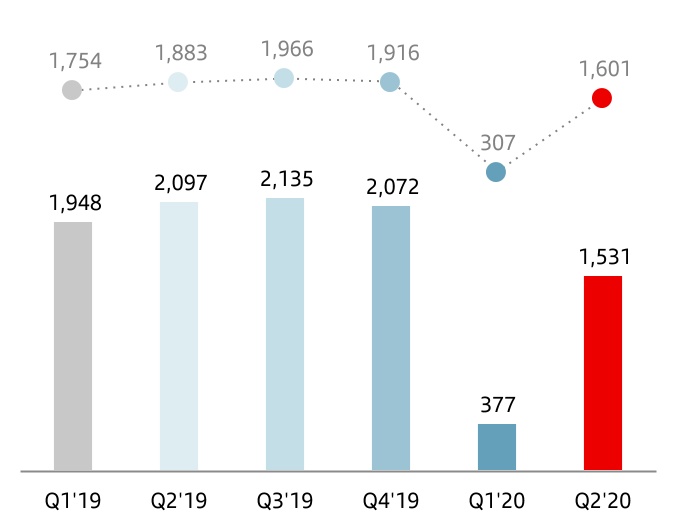
PROFITABILITY… and profit affected by higher loan-loss provisions and valuation adjustments
Loan-loss provisions rose significantly to EUR 7,027 million, driven by lending growth and the expected macro-economic deterioration.
In addition, as a result of the economic outlook, lower for longer interest rates and the increase of discount rates, the Bank has adjusted the valuation of its goodwill ascribed to several units and deferred tax assets for a total of EUR 12.6 billion.
This adjustment has no impact on the Bank's liquidity or market and credit risk position, is neutral in CET1 capital and do not change the strategic importance of any of the Group's markets. The Group remains confident in the potential for the long-term value creation in each of its regions and markets.
This results in an attributable loss of EUR 10,798 million.
| Attr. profit to the parent | Earnings per share | |||||||||||||
| EUR million | EUR | |||||||||||||
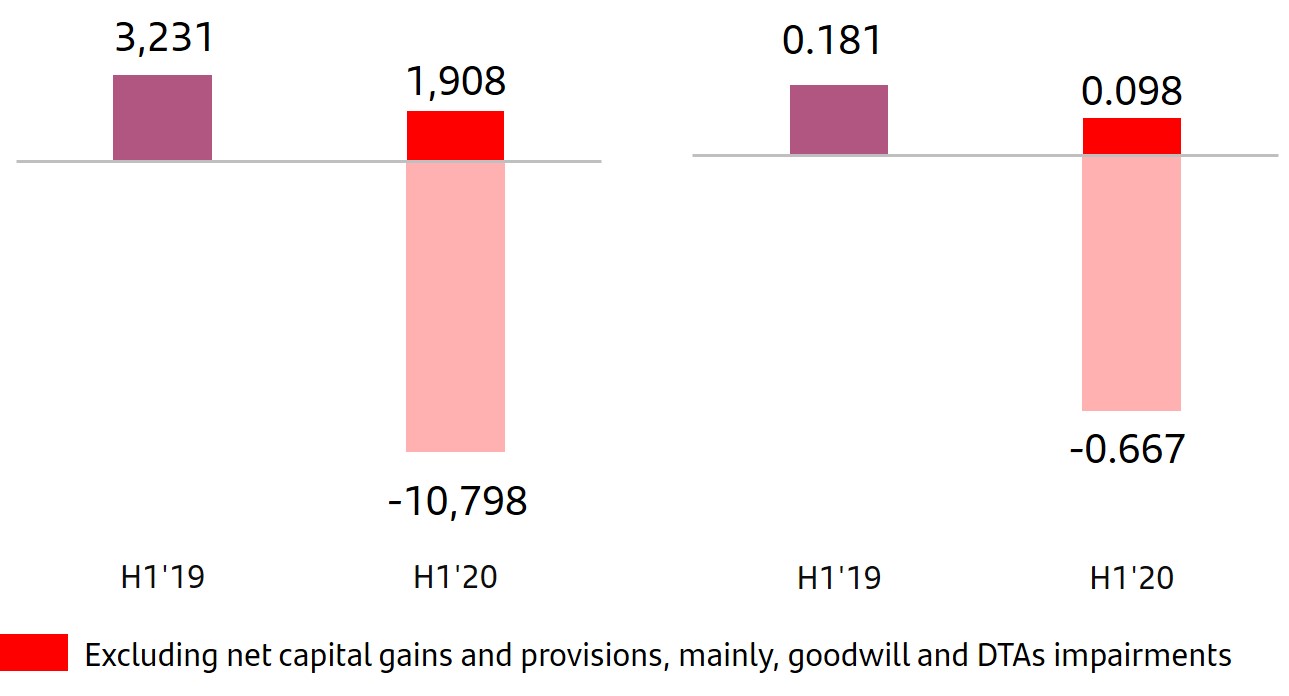 | ||||||||||||||
Before these adjustments and restructuring costs, underlying attributable profit was EUR 1,908 million, 53% lower year-on-year (-48% excluding the exchange rate impact).
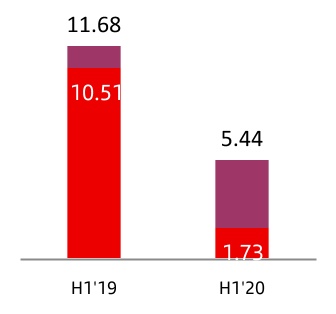
Underlying RoTE was 5.4% and underlying RoRWA 0.80%.
| RoTE | |||||||||||||||||
| % | |||||||||||||||||
n Total n Underlying* | |||||||||||||||||
(*) Excluding net capital gains and provisions
 STRENGTH
CET1 ratio at the top end of our target range and cost of credit in line with our 140-150 bps year-end expectation
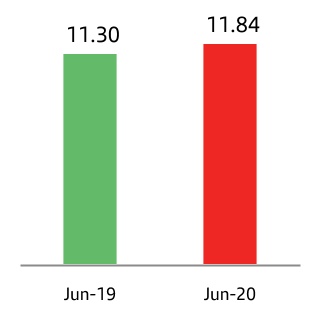
The CET1 ratio increased 26 bps in the quarter to 11.84%, driven by the net impact from the strong organic generation, a positive regulatory impact (mainly CRR2 quick fix) and a negative impact primarily from corporate operations pensions and markets. This results in a Group CET1 management buffer of 298 bps post- COVID-19 compared to 189 bps pre-COVID-19.
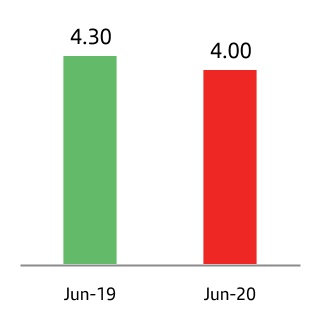
Net tangible equity per share (TNAV) in June 2020 was EUR 4.00 and declined 5% since March, due to the net effect from the adjustment of deferred tax assets, exchange rates and markets, partially offset by the organic generation in the quarter.
| CET1* | TNAV per share | |||||||
| % | Euros | |||||||
(*) Using the IFRS 9 transitional arrangement
Risk management remained focused on minimising the impacts arising from the health crisis.
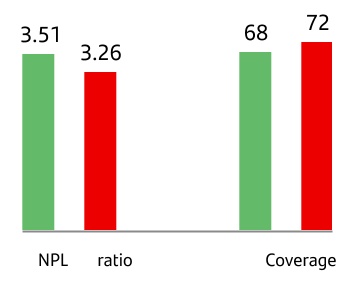
The cost of credit in the first half was in line with out year-en expectation of 140-150 bps and credit quality benefited from mitigation measures and volume increases, reflected in the 25 bp fall year-on-year (+1 bp in the quarter) of the NPL ratio and higher coverage (72%, +4 pp year-on-year).
| Cost of credit | NPL ratio and coverage | ||||||||||||||||||||||
| % | % | ||||||||||||||||||||||
n Jun-19 n Jun-20 | |||||||||||||||||||||||
January - June 2020 | | 9 | ||||||
GRUPO SANTANDER RESULTS
•The Group's results were affected by the health crisis caused by the spread of COVID-19, which is reflected in a weaker economic environment, lower for longer interest rates and a sharp depreciation of some currencies.
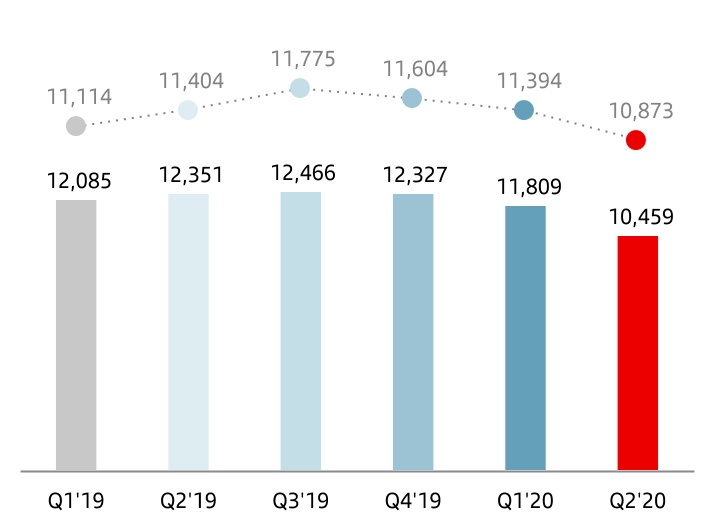
•Total income fell, affected by exchange rates. Excluding their impact, it remained stable as the decrease in activity and lower interest rates were offset by higher volumes, sound management of market volatility and the lower cost of deposits.
•Acceleration in cost reductions, ahead of schedule in the optimisation plans implemented in recent years, along with additional measures adopted since the start of the crisis.
•Greater loan-loss provisions, amounting to EUR 7,027 million due to credit growth, the expected deterioration in economic conditions due to the pandemic and its impact on the deterioration of the portfolio’s credit quality.
•In addition, as a result of the worsening economic outlook, adjustments to the goodwill ascribed to some units and to deferred tax assets have been made totalling EUR 12,600 million, which results in an attributable profit to the Group of negative EUR 10,798 million.
•Excluding the above adjustments and restructuring costs, attributable profit to the parent would have been EUR 1,908 million, with net operating income of EUR 11,865 million, 2% more in constant euros than at the end of the first half of 2019.
| Grupo Santander. Summarised income statement | ||||||||||||||||||||||||||||||||||||||||||||||||||
| EUR million | ||||||||||||||||||||||||||||||||||||||||||||||||||
| Change | Change | |||||||||||||||||||||||||||||||||||||||||||||||||
| Q2'20 | Q1'20 | % | % excl. FX | H1'20 | H1'19 | % | % excl. FX | |||||||||||||||||||||||||||||||||||||||||||
| Net interest income | 7,715 | 8,487 | (9.1) | (1.9) | 16,202 | 17,636 | (8.1) | (0.2) | ||||||||||||||||||||||||||||||||||||||||||
| Net fee income (commission income minus commission expense) | 2,283 | 2,853 | (20.0) | (13.1) | 5,136 | 5,863 | (12.4) | (4.0) | ||||||||||||||||||||||||||||||||||||||||||
| Gains or losses on financial assets and liabilities and exchange differences (net) | 786 | 287 | 173.9 | 174.8 | 1,073 | 511 | 110.0 | 137.6 | ||||||||||||||||||||||||||||||||||||||||||
| Dividend income | 208 | 57 | 264.9 | 265.4 | 265 | 361 | (26.6) | (26.1) | ||||||||||||||||||||||||||||||||||||||||||
| Share of results of entities accounted for using the equity method | (233) | 98 | — | — | (135) | 306 | — | — | ||||||||||||||||||||||||||||||||||||||||||
| Other operating income / expenses | (300) | 27 | — | — | (273) | (241) | 13.3 | 72.7 | ||||||||||||||||||||||||||||||||||||||||||
| Total income | 10,459 | 11,809 | (11.4) | (4.6) | 22,268 | 24,436 | (8.9) | (1.1) | ||||||||||||||||||||||||||||||||||||||||||
| Operating expenses | (5,118) | (5,589) | (8.4) | (2.9) | (10,707) | (11,587) | (7.6) | (1.4) | ||||||||||||||||||||||||||||||||||||||||||
| Administrative expenses | (4,428) | (4,860) | (8.9) | (3.4) | (9,288) | (10,110) | (8.1) | (1.9) | ||||||||||||||||||||||||||||||||||||||||||
| Staff costs | (2,571) | (2,899) | (11.3) | (6.5) | (5,470) | (6,080) | (10.0) | (4.7) | ||||||||||||||||||||||||||||||||||||||||||
| Other general administrative expenses | (1,857) | (1,961) | (5.3) | 1.2 | (3,818) | (4,030) | (5.3) | 2.3 | ||||||||||||||||||||||||||||||||||||||||||
| Depreciation and amortisation | (690) | (729) | (5.3) | 0.4 | (1,419) | (1,477) | (3.9) | 2.6 | ||||||||||||||||||||||||||||||||||||||||||
| Provisions or reversal of provisions | (240) | (374) | (35.8) | (31.0) | (614) | (1,916) | (68.0) | (67.5) | ||||||||||||||||||||||||||||||||||||||||||
| Impairment or reversal of impairment of financial assets not measured at fair value through profit or loss (net) | (3,096) | (3,934) | (21.3) | (15.4) | (7,030) | (4,368) | 60.9 | 76.3 | ||||||||||||||||||||||||||||||||||||||||||
| o/w: net loan-loss provisions | (3,108) | (3,919) | (20.7) | (14.4) | (7,027) | (4,313) | 62.9 | 78.5 | ||||||||||||||||||||||||||||||||||||||||||
| Impairment on other assets (net) | (10,227) | (14) | — | — | (10,241) | (27) | — | — | ||||||||||||||||||||||||||||||||||||||||||
| Gains or losses on non financial assets and investments, net | 9 | 18 | (50.0) | (50.0) | 27 | 250 | (89.2) | (89.2) | ||||||||||||||||||||||||||||||||||||||||||
| Negative goodwill recognised in results | 6 | — | — | — | 6 | — | — | — | ||||||||||||||||||||||||||||||||||||||||||
| Gains or losses on non-current assets held for sale not classified as discontinued operations | (94) | (25) | 276.0 | 276.0 | (119) | (257) | (53.7) | (53.1) | ||||||||||||||||||||||||||||||||||||||||||
| Profit or loss before tax from continuing operations | (8,301) | 1,891 | — | — | (6,410) | 6,531 | — | — | ||||||||||||||||||||||||||||||||||||||||||
| Tax expense or income from continuing operations | (2,684) | (1,244) | 115.8 | 126.4 | (3,928) | (2,449) | 60.4 | 82.7 | ||||||||||||||||||||||||||||||||||||||||||
| Profit from the period from continuing operations | (10,985) | 647 | — | — | (10,338) | 4,082 | — | — | ||||||||||||||||||||||||||||||||||||||||||
| Profit or loss after tax from discontinued operations | — | — | — | — | — | — | — | — | ||||||||||||||||||||||||||||||||||||||||||
| Profit for the period | (10,985) | 647 | — | — | (10,338) | 4,082 | — | — | ||||||||||||||||||||||||||||||||||||||||||
| Attributable profit to non-controlling interests | (144) | (316) | (54.4) | (51.4) | (460) | (851) | (45.9) | (41.4) | ||||||||||||||||||||||||||||||||||||||||||
| Attributable profit to the parent | (11,129) | 331 | — | — | (10,798) | 3,231 | — | — | ||||||||||||||||||||||||||||||||||||||||||
| EPS (euros) | (0.679) | 0.012 | — | (0.667) | 0.181 | — | ||||||||||||||||||||||||||||||||||||||||||||
| Diluted EPS (euros) | (0.677) | 0.011 | — | (0.666) | 0.180 | — | ||||||||||||||||||||||||||||||||||||||||||||
| Memorandum items: | ||||||||||||||||||||||||||||||||||||||||||||||||||
| Average total assets | 1,558,854 | 1,536,725 | 1.4 | 1,548,851 | 1,492,954 | 3.7 | ||||||||||||||||||||||||||||||||||||||||||||
| Average stockholders' equity | 92,528 | 99,221 | (6.7) | 95,803 | 98,191 | (2.4) | ||||||||||||||||||||||||||||||||||||||||||||
| 10 | | January - June 2020 | ||||||
è Evolution of results compared to the first half of 2019
The main lines of the profit and loss account are detailed below.
The Group presents, both at the total level and for each of the business units, the real changes in euros produced in the income statement, as well as variations excluding the exchange rate effect (FX), on the understanding that the latter provide a better analysis of the Group’s management. For the Group as a whole, the exchange rate impact was -8 percentage points in revenue and -6 percentage points in costs.
u Revenue
Revenue totalled EUR 22,268 million in the first half, down 9%. If the FX impact is taken out, total income remained resilient, in line with last year, due to customer relationships and the strength that our geographical and business diversification provides. Net interest income and net fee income accounted for over 95% of total revenue. By line:
•Net interest income amounted to EUR 16,202 million, 8% less than in the same period of 2019. Stripping out the exchange rate impact, it remained stable (-0.2%), the net effect of the increase in revenue from higher lending and deposit volumes and the reduction in revenue from lower interest rates in many markets, regulatory impacts (mainly in Brazil and Poland) and increased liquidity buffer costs.
| Net interest income | ||||||||
| EUR million | ||||||||
 | constant euros | |||||||
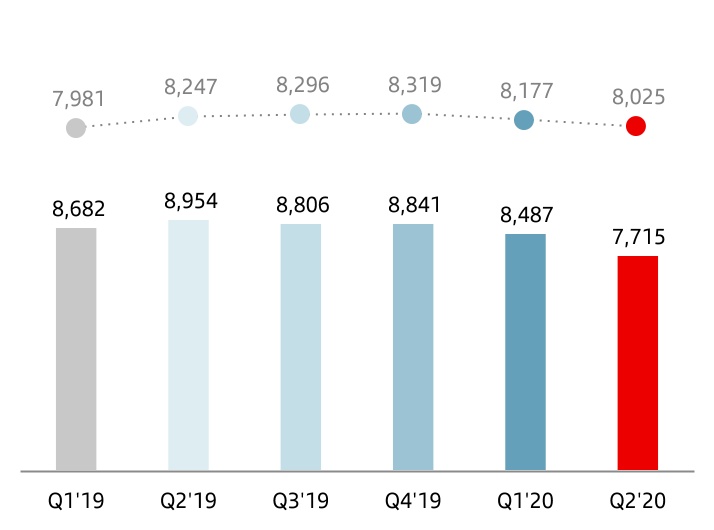
Net interest income was very heterogeneous among units. On the one hand, there were increases in SCF, Mexico and Brazil, due to higher volumes, Chile, due to higher inflation, and Argentina, due to the placement of excess liquidity. There were decreases in Portugal and Spain due to lower interest rates, on top of the lower average volumes and smaller ALCO portfolio in Spain, the UK, impacted by the base rate cut and SVR attrition, Poland, due to a one-off provision for the CJEU judgement on consumer loans, and the United States, driven by lower interest rates which cancelled out growth in average volumes.
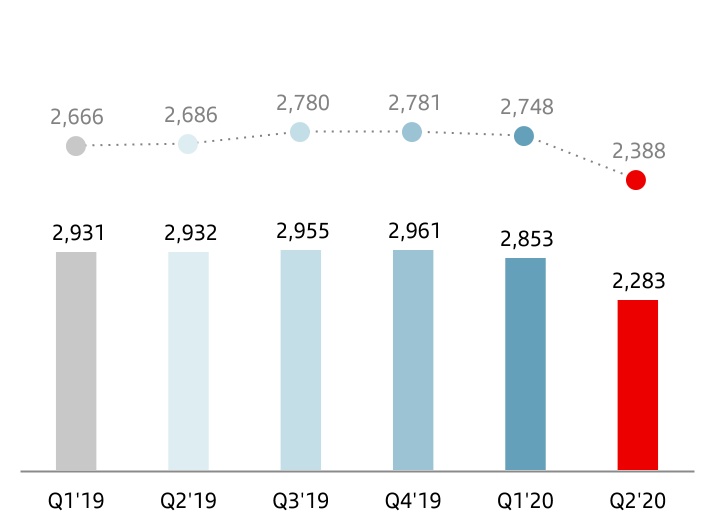
•Net fee income fell 12% to EUR 5,136 million. Excluding the exchange rate impact, it was down 4% compared to the first six months of 2019. This item has been the most affected by the health crisis, reflecting lower client transactionality. Our strategy remains focused on increasing our customer loyalty and growth in higher value-added services and products.
By business, of note was the 20% growth in Santander Corporate & Investment Banking and the 1% increase in Wealth Management & Insurance ( the latter including fees ceded to the branch network). Overall, together the businesses now account for 47% of the Group’s total (SCIB: 16%; WM&I 31%).
By region, there were declines in North and South America (-2% in both cases) and, especially in Europe (-8%), with generalised declines due to lower activity volumes, along with regulatory changes affecting net fee income in Santander Consumer Finance and the UK. On the other hand, "Other Europe", which includes the wholesale banking business in the region, increased net fee income by 58%.
| Net fee income | ||||||||
| EUR million | ||||||||
| constant euros | |||||||
January - June 2020 | | 11 | ||||||
•Gains on financial transactions, accounted for 5% of total income and stood at EUR 1,073 million, double the figure for the first half of 2019 (+138% excluding the exchange rate effect) due to the favourable impact from foreign currency hedging, portfolio sales and market volatility.
•Dividend income was EUR 265 million in the first six months of 2020, 27% lower than in the same period of 2019 (-26% excluding exchange rate effect). This item was affected by the delay or cancellation of dividend payments by several companies.
•The results of entities accounted for using the equity method reflect the lower contribution from the entities associated to the Group.
•Other operating income recorded a loss of EUR 273 million (loss of EUR 241 million in the first half of 2019) due to the greater contribution to the Single Resolution Fund (SRF).
u Costs
Operating costs amounted to EUR 10,707 million, 8% lower year-on-year. Excluding the exchange rate impact, costs fell 2%.
In real terms (excluding inflation) costs were down 5%, reflecting the successful management over the last three years, as well as the first impacts of additional savings measures adopted since the beginning of the crisis.
The efficiency ratio was 47.3%, in line with last year, which has enabled Santander to remain one of the most efficient global banks in the world.
| Total income | ||||||||
| EUR million | ||||||||
| constant euros | |||||||
The Group's objective is still to improve our operational capacity while also managing our costs more efficiently and adapted to each region. Therefore, for a better comparison, the trends by region and market are detailed below:
•In Europe, costs strongly reflect the synergies from the recent integrations and additional savings, decreasing 5.9% in nominal terms and 6.8% in real terms, with falls across all markets. There were reductions in Poland (-10.9%), Spain (-10.1%) and Portugal (-5.2%) due to the optimisation efforts, in the UK (-6.3%) due to the savings from our transformation programme, and in Santander Consumer Finance (-4.5%) driven by efficiency projects carried out in several countries and absorbing the perimeter effect.
The cost reduction plan in Europe is ahead of schedule, having already reached 75% of the total expected for the year as a whole.
•In North America, costs fell 0.8% in nominal terms, affected by inflation, as in real terms they were down 2.9% (US -3.8%, Mexico -0.8%). The efficiency ratio in the region declined to 41.5%.
•Finally, in South America, the increase in costs was greatly distorted by the very high inflation in Argentina. Excluding it, costs rose 2.4% in nominal terms but decreased 0.9% in real terms (Brazil: -1.4% and Chile: -0.4%). Efficiency improved in all markets (35.2% for the region as a whole, improving by 1.1 percentage points).
We believe that this management by region and the lessons learnt from the management of the pandemic will enable us to accelerate our transformation in the future and, consequently, further optimise costs while improving customer experience.
| Operating expenses | ||||||||
| EUR million | ||||||||
| constant euros | |||||||
| 12 | | January - June 2020 | ||||||
u Provisions or reversal of provisions
Provisions (net of provisions reversals) amounted to EUR 614 million (EUR 1,916 million in the first half of 2019). This line item includes charges for restructuring costs.
u Impairment or reversal of impairment of financial assets not measured at fair value through profit or loss (net)
Impairment or reversal of impairment on financial assets not measured at fair value through profit or loss (net) was EUR 7,030 million, up 61% year-on-year in euros and 76% in constant euros.
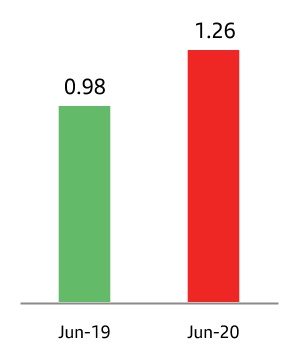
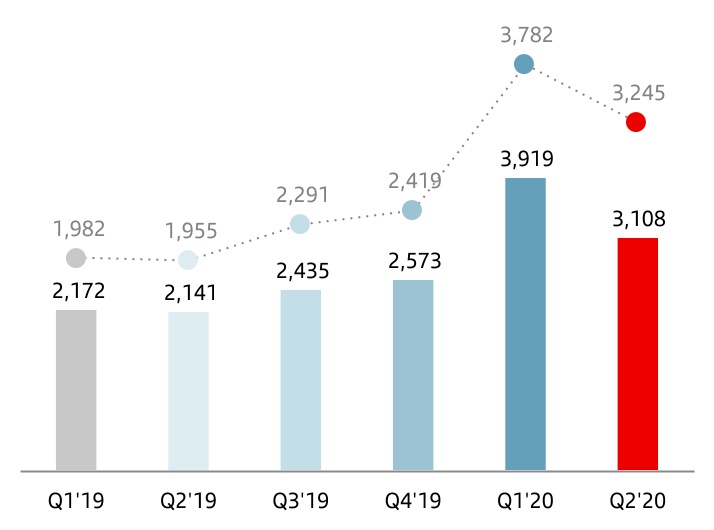
Loan-loss provisions included in this item amounted to EUR 7,027 million, 63% more than in the same period last year. Stripping out the effect of exchange rates, the increase was 78%, heavily impacted by the effects of the COVID-19 and growth in credit volumes. This includes the provisions overlay of EUR 1,600 million which was recorded in the first quarter and which was been allocated by business unit.
Accordingly, the Group’s cost of credit, calculated as the ratio of loan-loss provisions over the last twelve months to the average investment in the period, increased to 1.26% (1.46% considering the annualised year-to-date provisions).
u Impairment on other assets (net)
Every year, usually during the last quarter, the Group evaluates whether an adjustment to the goodwill generated in the acquisition of the subsidiaries is necessary. The accounting rules require this analysis to be carried out earlier should any trigger events occur, which happened in the second quarter of this year, given that the global economic environment has been significantly affected by the COVID-19 crisis.
| Net loan-loss provisions | ||||||||
| EUR million | ||||||||
| constant euros | |||||||
Specifically, the trigger events for this exercise were as follows:
•Changes in the economic environment where a decrease of the GDP is expected in all countries this year and where recovery will take 2 or 3 years.
•A generalised reduction in interest rates, which is expected to last longer than expected before the crisis began.
•The increase of discount rates to reflect greater volatility and risk premiums.
This analysis has resulted in an adjustment in the valuation of goodwill of EUR 10,100 million (Santander UK: EUR 6,101 million; Santander US: EUR 2,330 million; Santander Bank Polska: EUR 1,192 million and Santander Consumer Finance, mainly Nordics and other: 477 million). This adjustment does not affect cash generation and has no impact on the Group’s CET1 ratios or tangible net value per share (TNAV).
Consequently, the impairment of other assets (net) in the first half of 2020 amounted to EUR 10,241 million. In the first half of 2019, this line was EUR 27 million.
u Gains or losses on non-financial assets and investments (net)
Net gains on non-financial assets and investments were EUR 27 million in the first half of 2020, compared to EUR 250 million in the same period of 2019, when capital gains from the sale of 51% of our stake in Prisma Medios de Pago S.A. and the revaluation of the remaining stake (49%) were recorded.
u Gains or losses on non-current assets held for sale not classified as discontinued operations
This item, which mainly includes impairment of foreclosed assets recorded and the sale of properties acquired upon foreclosure, totalled EUR -119 million in the six months to June 2020, compared to EUR -257 million in the first half of 2019.
u Profit before tax
Profit before tax was EUR -6,410 million, affected by the adjustment in the valuation of goodwill, compared to EUR 6,531 million posted in the first half of 2019.
u Income tax
As with goodwill, and due to the impact that the crisis arising from COVID-19 may have on the current and future performance of our businesses, an adjustment of EUR 2,500 million has been made to deferred tax assets of the Spanish consolidated fiscal group in the first half of the year. As a result, the total corporate income tax was EUR 3,928 million (EUR 2,449 million in the first half of 2019).
January - June 2020 | | 13 | ||||||
u Attributable profit to non-controlling interests
Attributable profit to non-controlling interests amounted to EUR 460 million, down 46% year-on-year (-41% excluding the exchange rate impact), due to lower profit obtained by Group companies, on top of the share buyback in Mexico last year and the increased stake in SC USA.
u Attributable profit to the parent
Profit attributable to the parent amounted to EUR -10,798 million in the first half of 2020, compared with EUR 3,231 million in the first six months of 2019. RoTE stood at 1.73% and earnings per share stood at EUR -0.667.
u Underlying attributable profit to the parent
The attributable profit to the parent recorded in the first six months was affected, in 2020 and 2019, by results (net of tax) that are outside the ordinary course performance of our business and distort the year-on-year comparison, and are detailed below:
•In the first half of 2020, the valuation adjustment of goodwill ascribed to various Group units of EUR -10,100 million, with the previously detailed breakdown in Impairment on other assets (net), the valuation adjustment to deferred tax assets of the Spanish consolidated fiscal group with an impact of EUR -2,500 million and restructuring costs and other provisions with a net impact of EUR -106 million, of which EUR -46 million were recognised in the first quarter. The total amount of these results was EUR -12,706 million.
•In the first half of 2019, capital gains from the sale of 51% of our stake in the Argentinian entity Prisma Medios de Pago S.A. and the revaluation of the remaining 49% (EUR 150 million), capital losses related to real estate assets in Spain (EUR -180 million), PPI provisions to cover potential claims in the UK (EUR -80 million) and restructuring costs (EUR -704 million). The combined amount of all these totalled EUR -814 million.
Excluding these results from the various P&L lines where they are recorded, and incorporating them separately in the net capital gains and provisions line, the adjusted or underlying attributable profit to the parent was EUR 1,908 million in the first half of 2020 and EUR 4,045 million in the first half of 2019, 53% lower year-on-year (-48% excluding the FX impact), strongly conditioned by the rise in provisions, mostly related to COVID-19.
Before the recording of loan-loss provisions, net operating income (total income less operating expenses) of Grupo Santander was EUR 11,865 million, an 8% decrease year-on-year, though this becomes a 2% increase excluding the FX impact, with the following performance by line and region:
By line:
•Total income remained unchanged driven by net interest income stability and higher gains on financial transactions, offsetting the fall in net fee income and other operating income (lower dividends, lower results of entities accounted for by the equity method and greater contribution to the SRF).
•Costs were 2% lower, with broad-based declines across countries, mainly in Europe, where cost reductions are ahead of schedule as previously mentioned.
By region:
•Europe decreased 10% with falls in most markets (except SCF).
•In North America, net operating income was 2% higher versus 2019. By country, the US fell 3% and Mexico increased 11%.
•In South America, 8% growth with rises of 5% in Brazil, 9% in Chile and 64% in Argentina.
In the first half of 2020, the Group’s underlying RoTE was 5.44%, underlying RoRWA was 0.80% and underlying earnings per share EUR 0.098 (11.68%, 1.62% and EUR 0.231, respectively in the same period of 2019).
| 14 | | January - June 2020 | ||||||
| Summarised underlying income statement | ||||||||||||||||||||||||||||||||||||||||||||||||||
| EUR million | Change | Change | ||||||||||||||||||||||||||||||||||||||||||||||||
| Q2'20 | Q1'20 | % | % excl. FX | H1'20 | H1'19 | % | % excl. FX | |||||||||||||||||||||||||||||||||||||||||||
| Net interest income | 7,715 | 8,487 | (9.1) | (1.9) | 16,202 | 17,636 | (8.1) | (0.2) | ||||||||||||||||||||||||||||||||||||||||||
| Net fee income | 2,283 | 2,853 | (20.0) | (13.1) | 5,136 | 5,863 | (12.4) | (4.0) | ||||||||||||||||||||||||||||||||||||||||||
Gains (losses) on financial transactions (1) | 781 | 292 | 167.5 | 174.8 | 1,073 | 511 | 110.0 | 137.6 | ||||||||||||||||||||||||||||||||||||||||||
| Other operating income | (75) | 182 | — | — | 107 | 426 | (74.9) | (78.0) | ||||||||||||||||||||||||||||||||||||||||||
| Total income | 10,704 | 11,814 | (9.4) | (2.5) | 22,518 | 24,436 | (7.8) | 0.0 | ||||||||||||||||||||||||||||||||||||||||||
| Administrative expenses and amortisations | (5,076) | (5,577) | (9.0) | (3.5) | (10,653) | (11,587) | (8.1) | (1.9) | ||||||||||||||||||||||||||||||||||||||||||
| Net operating income | 5,628 | 6,237 | (9.8) | (1.6) | 11,865 | 12,849 | (7.7) | 1.7 | ||||||||||||||||||||||||||||||||||||||||||
| Net loan-loss provisions | (3,118) | (3,909) | (20.2) | (14.2) | (7,027) | (4,313) | 62.9 | 78.5 | ||||||||||||||||||||||||||||||||||||||||||
| Other gains (losses) and provisions | (625) | (372) | 68.0 | 79.3 | (997) | (957) | 4.2 | 11.6 | ||||||||||||||||||||||||||||||||||||||||||
| Profit before tax | 1,885 | 1,956 | (3.6) | 8.8 | 3,841 | 7,579 | (49.3) | (43.8) | ||||||||||||||||||||||||||||||||||||||||||
| Tax on profit | (208) | (1,260) | (83.5) | (79.7) | (1,468) | (2,679) | (45.2) | (39.0) | ||||||||||||||||||||||||||||||||||||||||||
| Profit from continuing operations | 1,677 | 696 | 140.9 | 183.0 | 2,373 | 4,900 | (51.6) | (46.4) | ||||||||||||||||||||||||||||||||||||||||||
| Net profit from discontinued operations | — | — | — | — | — | — | — | — | ||||||||||||||||||||||||||||||||||||||||||
| Consolidated profit | 1,677 | 696 | 140.9 | 183.0 | 2,373 | 4,900 | (51.6) | (46.4) | ||||||||||||||||||||||||||||||||||||||||||
| Non-controlling interests | (146) | (319) | (54.2) | (51.1) | (465) | (855) | (45.6) | (41.1) | ||||||||||||||||||||||||||||||||||||||||||
| Net capital gains and provisions | (12,660) | (46) | — | — | (12,706) | (814) | — | — | ||||||||||||||||||||||||||||||||||||||||||
| Attributable profit to the parent | (11,129) | 331 | — | — | (10,798) | 3,231 | — | — | ||||||||||||||||||||||||||||||||||||||||||
Underlying attributable profit to the parent (2) | 1,531 | 377 | 306.1 | 420.9 | 1,908 | 4,045 | (52.8) | (47.5) | ||||||||||||||||||||||||||||||||||||||||||
(1) Includes exchange differences. (2) Excludes net capital gains and provisions, mainly goodwill and DTA impairments.
è Second quarter results compared to the first quarter of 2020
Attributable profit to the parent in the second quarter of 2020 amounted to EUR -11,129 million (EUR 331 million in the first quarter).
Excluding net capital gains and provisions in both periods (EUR -12,660 million in the second quarter and EUR -46 million in the first quarter, as previously detailed), underlying attributable profit to the parent in the second quarter stood at EUR 1,531 million (EUR 377 million in the first quarter), with the following performance by line without the impact of exchange rates, which had a negative impact on the quarterly comparison of -7 percentage points in income and -6 percentage points in costs:
• Total income was down 2%, mostly net fee income, which fell 13% due to the lower activity caused by the impact of COVID-19 and the contribution to the Single Resolution Fund. On the positive side, there were increases in dividend income (seasonally higher in the second quarter) and better gains on financial transactions particularly from SCIB. Net interest income remained relatively strong, falling just 2%.
• Costs were down 3%, falling 6% in Europe and 4% in North America. In South America, a slight increase of 1%.
• Loan-loss provisions fell by 14% due to the high level of provisions relating to the health crisis in the first quarter.
| Net operating income | ||||||||
| EUR million | ||||||||
| constant euros | |||||||
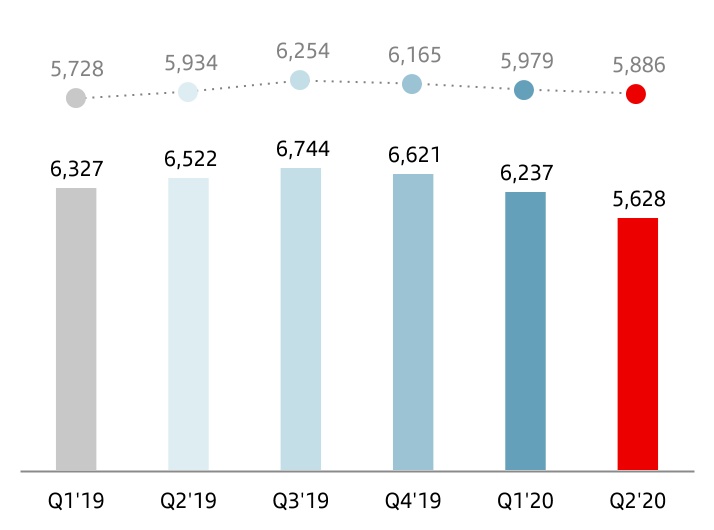
| Underlying attributable profit to the parent* | ||||||||
| EUR million | ||||||||
| constant euros | |||||||
(*) Excluding net capital gains and provisions.
January - June 2020 | | 15 | ||||||
| Response to the COVID-19 crisis Business model | ||||||||||||||||||||||||||
| Balance sheet | ||||||||||||||||||||||||||
| Grupo Santander. Condensed balance sheet | ||||||||||||||||||||||||||||||||
| EUR million | ||||||||||||||||||||||||||||||||
| Change | ||||||||||||||||||||||||||||||||
| Assets | Jun-20 | Jun-19 | Absolute | % | Dec-19 | |||||||||||||||||||||||||||
| Cash, cash balances at central banks and other demand deposits | 138,266 | 104,104 | 34,162 | 32.8 | 101,067 | |||||||||||||||||||||||||||
| Financial assets held for trading | 124,145 | 102,574 | 21,571 | 21.0 | 108,230 | |||||||||||||||||||||||||||
| Debt securities | 32,062 | 33,343 | (1,281) | (3.8) | 32,041 | |||||||||||||||||||||||||||
| Equity instruments | 7,782 | 11,133 | (3,351) | (30.1) | 12,437 | |||||||||||||||||||||||||||
| Loans and advances to customers | 289 | 300 | (11) | (3.7) | 355 | |||||||||||||||||||||||||||
| Loans and advances to central banks and credit institutions | 6 | — | 6 | — | — | |||||||||||||||||||||||||||
| Derivatives | 84,006 | 57,798 | 26,208 | 45.3 | 63,397 | |||||||||||||||||||||||||||
| Financial assets designated at fair value through profit or loss | 97,270 | 78,813 | 18,457 | 23.4 | 66,980 | |||||||||||||||||||||||||||
| Loans and advances to customers | 35,421 | 23,407 | 12,014 | 51.3 | 31,147 | |||||||||||||||||||||||||||
| Loans and advances to central banks and credit institutions | 54,815 | 46,915 | 7,900 | 16.8 | 28,122 | |||||||||||||||||||||||||||
| Other (debt securities an equity instruments) | 7,034 | 8,491 | (1,457) | (17.2) | 7,711 | |||||||||||||||||||||||||||
| Financial assets at fair value through other comprehensive income | 122,560 | 118,062 | 4,498 | 3.8 | 125,708 | |||||||||||||||||||||||||||
| Debt securities | 112,041 | 111,891 | 150 | 0.1 | 118,405 | |||||||||||||||||||||||||||
| Equity instruments | 2,228 | 2,789 | (561) | (20.1) | 2,863 | |||||||||||||||||||||||||||
| Loans and advances to customers | 8,291 | 3,382 | 4,909 | 145.2 | 4,440 | |||||||||||||||||||||||||||
| Loans and advances to central banks and credit institutions | — | — | — | — | — | |||||||||||||||||||||||||||
| Financial assets measured at amortised cost | 976,298 | 981,046 | (4,748) | (0.5) | 995,482 | |||||||||||||||||||||||||||
| Debt securities | 27,167 | 39,382 | (12,215) | (31.0) | 29,789 | |||||||||||||||||||||||||||
| Loans and advances to customers | 890,795 | 881,146 | 9,649 | 1.1 | 906,276 | |||||||||||||||||||||||||||
| Loans and advances to central banks and credit institutions | 58,336 | 60,518 | (2,182) | (3.6) | 59,417 | |||||||||||||||||||||||||||
| Investments in subsidiaries, joint ventures and associates | 8,668 | 7,788 | 880 | 11.3 | 8,772 | |||||||||||||||||||||||||||
| Tangible assets | 33,271 | 33,755 | (484) | (1.4) | 35,235 | |||||||||||||||||||||||||||
| Intangible assets | 15,946 | 28,794 | (12,848) | (44.6) | 27,687 | |||||||||||||||||||||||||||
| Goodwill | 12,595 | 25,613 | (13,018) | (50.8) | 24,246 | |||||||||||||||||||||||||||
| Other intangible assets | 3,351 | 3,181 | 170 | 5.3 | 3,441 | |||||||||||||||||||||||||||
| Other assets | 56,457 | 57,160 | (703) | (1.2) | 53,534 | |||||||||||||||||||||||||||
| Total assets | 1,572,881 | 1,512,096 | 60,785 | 4.0 | 1,522,695 | |||||||||||||||||||||||||||
| Liabilities and shareholders' equity | ||||||||||||||||||||||||||||||||
| Financial liabilities held for trading | 97,700 | 74,187 | 23,513 | 31.7 | 77,139 | |||||||||||||||||||||||||||
| Customer deposits | — | — | — | — | — | |||||||||||||||||||||||||||
| Debt securities issued | — | — | — | — | — | |||||||||||||||||||||||||||
| Deposits by central banks and credit institutions | — | — | — | — | — | |||||||||||||||||||||||||||
| Derivatives | 84,202 | 58,341 | 25,861 | 44.3 | 63,016 | |||||||||||||||||||||||||||
| Other | 13,498 | 15,846 | (2,348) | (14.8) | 14,123 | |||||||||||||||||||||||||||
| Financial liabilities designated at fair value through profit or loss | 59,619 | 60,237 | (618) | (1.0) | 60,995 | |||||||||||||||||||||||||||
| Customer deposits | 36,346 | 37,849 | (1,503) | (4.0) | 34,917 | |||||||||||||||||||||||||||
| Debt securities issued | 4,386 | 3,117 | 1,269 | 40.7 | 3,758 | |||||||||||||||||||||||||||
| Deposits by central banks and credit institutions | 18,887 | 19,141 | (254) | (1.3) | 22,194 | |||||||||||||||||||||||||||
| Other | — | 130 | (130) | (100.0) | 126 | |||||||||||||||||||||||||||
| Financial liabilities measured at amortised cost | 1,283,581 | 1,224,194 | 59,387 | 4.9 | 1,230,745 | |||||||||||||||||||||||||||
| Customer deposits | 810,486 | 776,902 | 33,584 | 4.3 | 789,448 | |||||||||||||||||||||||||||
| Debt securities issued | 254,398 | 251,672 | 2,726 | 1.1 | 258,219 | |||||||||||||||||||||||||||
| Deposits by central banks and credit institutions | 189,214 | 160,808 | 28,406 | 17.7 | 152,969 | |||||||||||||||||||||||||||
| Other | 29,483 | 34,812 | (5,329) | (15.3) | 30,109 | |||||||||||||||||||||||||||
| Liabilities under insurance contracts | 2,246 | 731 | 1,515 | 207.3 | 739 | |||||||||||||||||||||||||||
| Provisions | 11,948 | 14,571 | (2,623) | (18.0) | 13,987 | |||||||||||||||||||||||||||
| Other liabilities | 25,928 | 28,191 | (2,263) | (8.0) | 28,431 | |||||||||||||||||||||||||||
| Total liabilities | 1,481,022 | 1,402,111 | 78,911 | 5.6 | 1,412,036 | |||||||||||||||||||||||||||
| Shareholders' equity | 112,899 | 122,006 | (9,107) | (7.5) | 124,239 | |||||||||||||||||||||||||||
| Capital stock | 8,309 | 8,118 | 191 | 2.4 | 8,309 | |||||||||||||||||||||||||||
| Reserves | 117,050 | 110,657 | 6,393 | 5.8 | 111,077 | |||||||||||||||||||||||||||
| Attributable profit to the Group | (10,798) | 3,231 | (14,029) | — | 6,515 | |||||||||||||||||||||||||||
| Less: dividends | (1,662) | — | (1,662) | — | (1,662) | |||||||||||||||||||||||||||
| Other comprehensive income | (30,637) | (23,377) | (7,260) | 31.1 | (24,168) | |||||||||||||||||||||||||||
| Minority interests | 9,597 | 11,356 | (1,759) | (15.5) | 10,588 | |||||||||||||||||||||||||||
| Total equity | 91,859 | 109,985 | (18,126) | (16.5) | 110,659 | |||||||||||||||||||||||||||
| Total liabilities and equity | 1,572,881 | 1,512,096 | 60,785 | 4.0 | 1,522,695 | |||||||||||||||||||||||||||
| 16 | | January - June 2020 | ||||||
| Response to the COVID-19 crisis Business model | ||||||||||||||||||||||||||
| Balance sheet | ||||||||||||||||||||||||||
GRUPO SANTANDER BALANCE SHEET
•Strong negative exchange rate impact on a year-on-year basis (-5 pp in loans and -6 pp in customer funds).
•Excluding this impact, the following movements were recorded in the quarter:
–Gross loans and advances to customers excluding reverse repos rose 1% driven by the overall increase in corporates, as activity of individuals remained stable in the quarter.
–Customer funds increased 5%, with 5% growth both in deposits excluding repos and mutual funds, following the sharp reduction of the latter in the first quarter.
•Compared to June 2019:
–Gross loans and advances to customers excluding reverse repos rose 6% year-on-year in constant euros with the 10 core markets growing, particularly in South America (+18%) and North America (+11%).
–Customer funds (excluding repos) increased 7% in constant euros, driven by deposits excluding repos, which rose 9%. Growth in nine of our 10 core markets.
è Loans and advances to customers
Gross loans and advances to customers rose to EUR 934,796 million in June 2020. The Group uses gross loans and advances to customers excluding reverse repos for the purpose of analysing traditional commercial banking loans.
•In the quarter, gross loans and advances to customers excluding reverse repos remained unchanged. Without the exchange rate impact, growth was 1%, mostly derived from the impact of the health crisis in activity and the need for funding of the different segments, which varies across countries depending on the spread of the pandemic. This was reflected in a strong growth in loans to SMEs and in the stability of the lending activity of individuals.
Volumes grew across all markets except Mexico, Poland and Santander Consumer Finance, although it began to recover the levels of new lending prior to the halt in consumer activity due to COVID-19 in June. This recovery in new lending in the consumer business could also be observed in the US, driven by Fiat Chrysler prime production incentive programmes. On the other hand, the mortgage business also started to recover in Europe, while the large corporate business returned to more normal levels of activity, following the strong increases recorded in March. Lastly, the South American countries have reflected the different evolution of COVID-19 over time.
Compared to June 2019, gross loans and advances to customers excluding reverse repos increased 1%. Excluding the exchange rate impact, 6% growth, with the following detail by region:
In Europe, 4% growth with all markets increasing. Poland rose 4%, as well as Portugal, consolidating the shift in trend in March, and the UK, driven by strong residential mortgage activity early this year and the government programmes for corporate customers. Santander Consumer Finance rose 3%. Lastly, Spain grew 1% following the 6% increase in the quarter, which shifted the trend of previous quarters. Other Europe, which includes most of the wholesale banking business in the region, increased 19%.
In North America, the US grew 11% driven by auto loans and commercial banking and Mexico 9% due to corporates and SCIB, leading to an 11% increase in the region.
Growth in South America was 18%, with Argentina growing 39%, Brazil +18% with positive performance in all segments and Chile +13% driven by increased new lending to corporates and large corporates in the quarter.
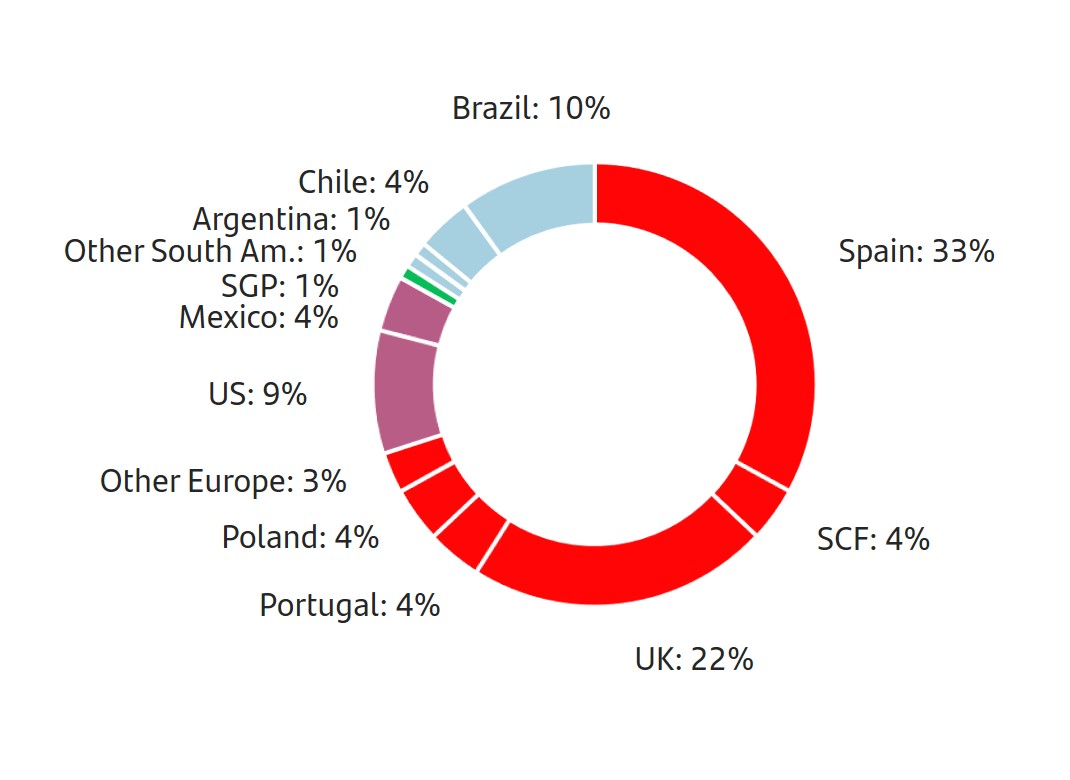
Gross loans and advances to customers excluding reverse repos maintained a balanced structure: individuals (45%), consumer credit (17%), SMEs and corporates (25%) and SCIB (13%).
| Gross loans and advances to customers (excl. reverse repos) | Gross loans and advances to customers (excl. reverse repos) | |||||||||||||||||||
| EUR billion | % operating areas. June 2020 | |||||||||||||||||||
 | 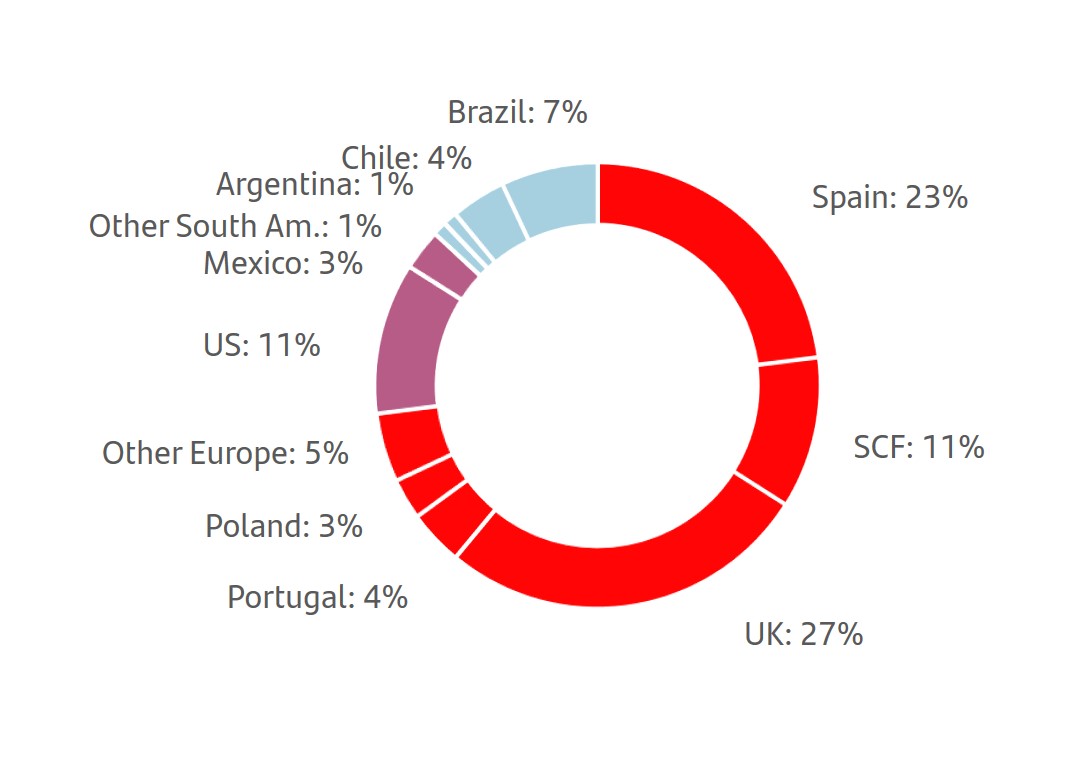 | |||||||||||||||||||
(*) In constant EUR: +6%
January - June 2020 | | 17 | ||||||
| Response to the COVID-19 crisis Business model | ||||||||||||||||||||||||||
| Balance sheet | ||||||||||||||||||||||||||
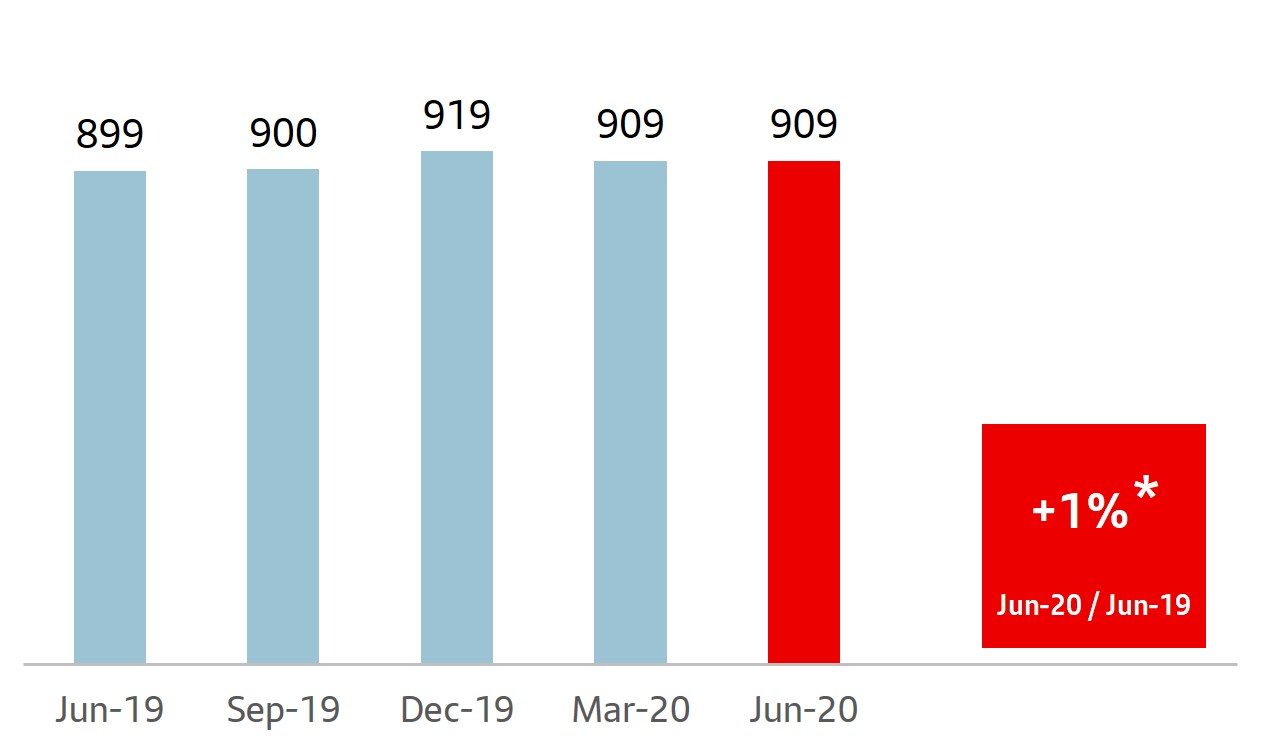
è Customer funds
Customer deposits amounted to EUR 846,832 million. The Group uses customer funds (customer deposits excluding repos, plus including mutual funds) for the purpose of analysing traditional retail banking funds.
•In the second quarter, customer funds were 4% higher. Excluding exchange rate impacts, growth was 5%:
–By product: customer deposits excluding repos rose 5%, boosted by demand deposits (+7%) whilst time deposits remained stable. Mutual funds increased 5% following the sharp fall in the previous quarter.
–Broad-based growth by market, ranging from 14% in Argentina to 3% in Portugal (falls only recorded in SCF: -1%, and Mexico remained flat). By region, increases in Europe (+5%), North America (+6%) and South America (+7%).
•Compared to June 2019, customer funds had no material change. Excluding the exchange rate impact, increases of 7%, as follows:
–By product, deposits excluding repos rose 9%. Demand deposits (+11%) increased in the ten core markets and time deposits grew 1% as the strong growth recorded in the Americas was offset by the falls in all European countries. Mutual funds dropped 1%, due to market volatility in the first quarter of 2020, with decreases in most European countries and increases in the Americas (except Brazil and Mexico).
–By market, customer funds rose in all of them except Spain (-2%), due to the falls in time deposits and mutual funds. Of note were Argentina (+44%), the US (+23%), Chile (+22%), Brazil (+14%), Mexico (+9%) and Poland (+9%). The UK recorded more moderate growth (+5%) as well as Santander Consumer Finance and Portugal, both of which increased 3%.
With this performance, the weight of demand deposits as a percentage of total customer funds rose 5 pp in the last 12 months to 65%, to the detriment of time deposits (-3 pp to 19%) and mutual funds (-2 pp to 16%).
In addition to capturing customer deposits, Grupo Santander, for strategic reasons, maintains a selective policy of issuing securities in the international fixed income markets and strives to adapt the frequency and volume of its market operations to the structural liquidity needs of each unit, as well as to the receptiveness of each market.
• In the first half of 2020, the Group issued:
Medium- and long-term covered bonds placed in the market of EUR 6,517 million and senior debt amounting to EUR 8,796 million.
There were EUR 6,604 million of securitisations placed in the market and maturities were extended by EUR 1 bn.
Issuances to meet the TLAC (Total Loss-Absorbing Capacity) requirement amounting to EUR 10,914 million, in order to strengthen the Group’s situation (senior non-preferred: EUR 9,063 million, preferred: EUR 1,500 million, subordinated debt: EUR 351 million), including a EUR 1 billion senior non-preferred green bond issuance.
Maturities of medium- and long-term debt of EUR 19,496 million.
The net loan-to-deposit ratio was 110% (115% in March 2020 and 111% in June 2019). The ratio of deposits plus medium- and long-term funding to the Group’s loans was 115%, underscoring the comfortable funding structure.
During the first half of the year, the three main rating agencies reviewed their ratings and outlook for Spain's sovereign debt, the banking system and, in Fitch's case, Banco Santander S.A.'s. Regarding the latter, Fitch confirmed its ratings (long-term debt at A- and short-term at F2), as did Moody's and S&P until the next revision in the second half of the quarter. Fitch and S&P changed the outlook from stable to negative due to the economic consequences that the COVID-19 crisis could have on the ratings in the long term. Moody's, on the other hand, maintained its ratings at A2 and P-1, with a stable outlook.
| Customer funds | Customer funds | |||||||||||||||||||
| EUR billion | % operating areas. June 2020 | |||||||||||||||||||
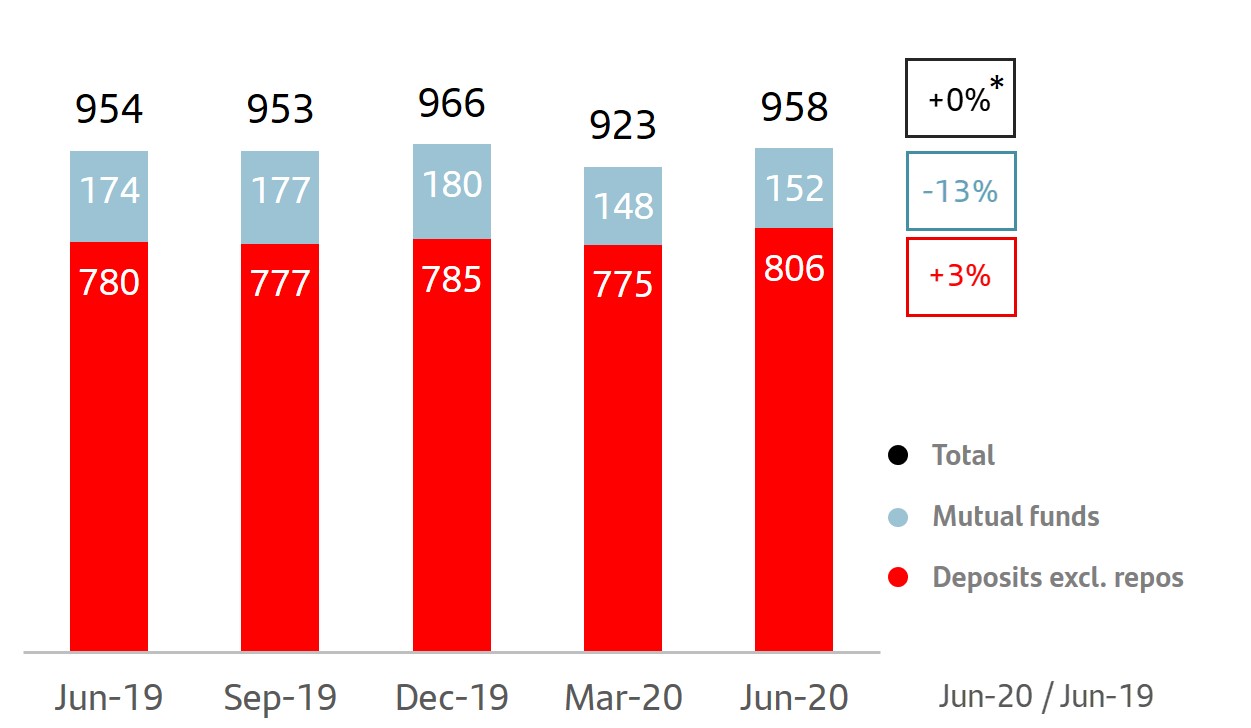 |  | |||||||||||||||||||
(*) In constant EUR: +7%
| 18 | | January - June 2020 | ||||||
SOLVENCY RATIOS
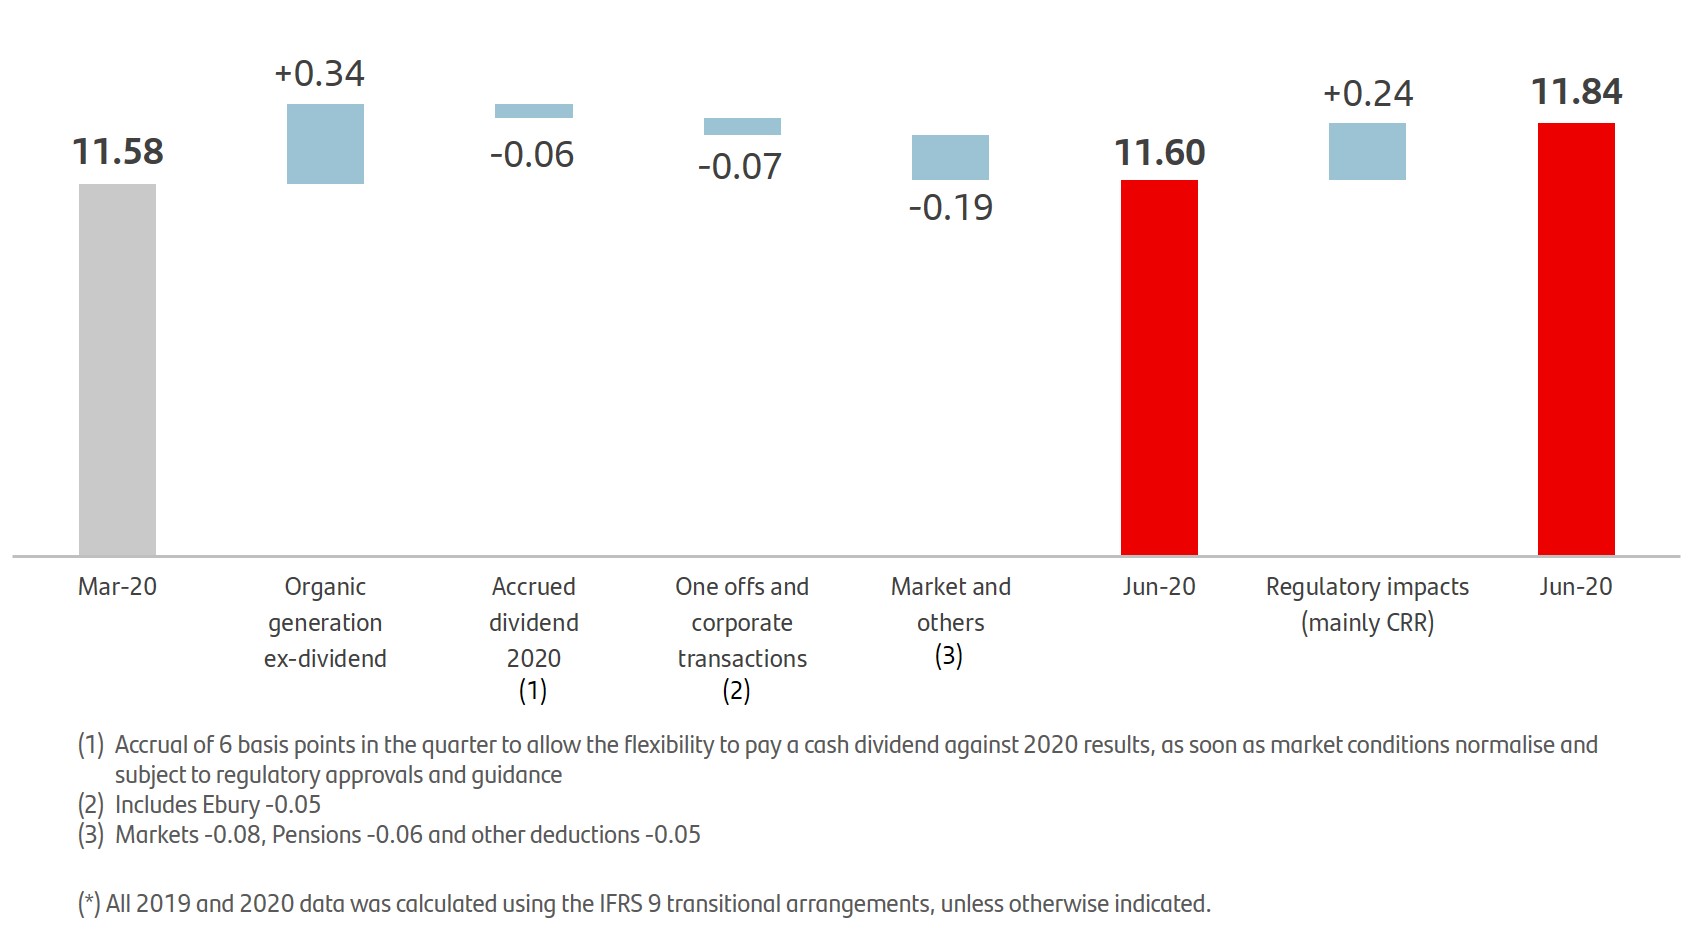
•At the end of June, the CET1 ratio rose 26 bps in the quarter to 11.84%. The organic generation and the anticipation of the measures expected in the European regulation of capital requirements, led to an increase of 52 bps, partially offset by corporate operations, pensions and markets performance.
•Tangible equity per share was EUR 4.00, 5% lower quarter-on-quarter.
•The fully loaded leverage ratio was 4.8%.
At the end of the quarter, the total phased-in capital ratio stood at 15.48% and the CET1 ratio (phased-in and fully loaded) at 11.84%, after increasing 26 bps in the quarter. We have a strong capital base, comfortably meeting the minimum levels required by the European Central Bank on a consolidated basis (13.02% for the total capital ratio and 8.86% for the CET1 ratio), after the recent measures adopted by regulators of reducing the Pillar 2 R and countercyclical buffer. This results in a CET1 management buffer of 298 bps, compared to the pre-COVID-19 buffer of 189 bps.
In the quarter, we continued to generate capital organically, increasing 34 bps due to underlying profit, management of risk weighted assets and increased securitisations. Additionally, 6 bp dividend accrual to allow the flexibility to pay a cash dividend against 2020 results, as soon as market conditions normalise and subject to regulatory approvals and guidance.
These, together with the positive regulatory impact mainly from bringing forward the expected European regulation of capital requirements (CRR2 quick fix) measures, led to a total increase of 52 bps.
On the other hand, there were several non-recurring impacts in the quarter, such as corporate transactions, which had a negative impact of 7 bps (mainly related to Ebury), together with other negative impacts from pensions and markets.
Had the IFRS 9 transitional arrangement not been applied, the total impact on the CET1 would have been -38 bps, of which 13 bps correspond to the second quarter due to the application of the dynamic phased-in.
| Eligible capital. June 2020* | Fully-loaded capital ratio* | |||||||||||||||||||
| EUR million | % | |||||||||||||||||||
| Phased-in | Fully-loaded | 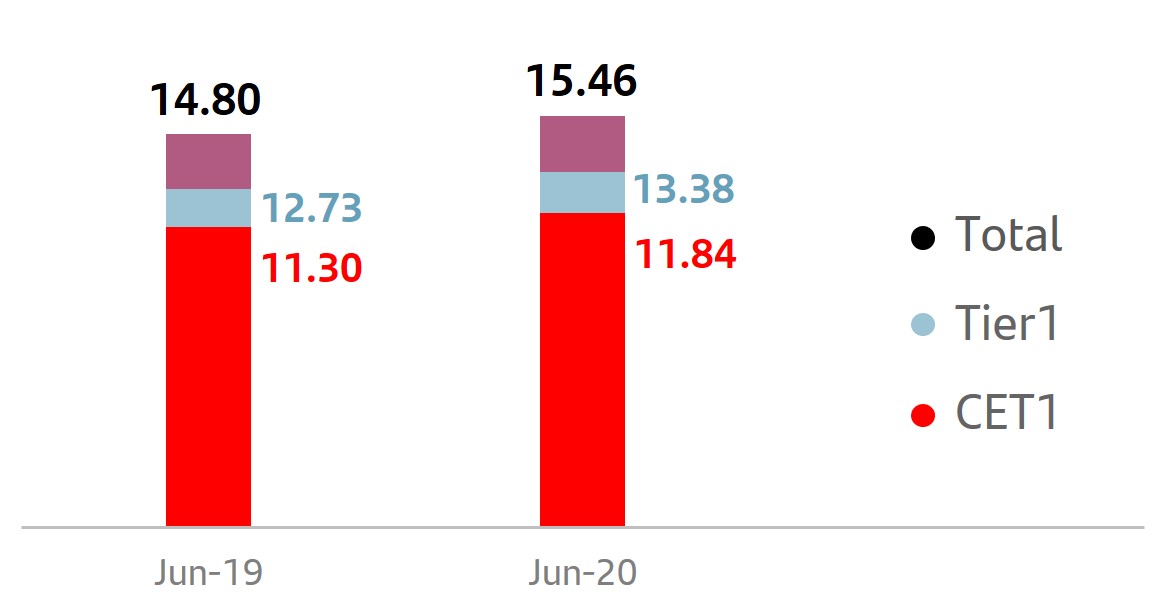 | ||||||||||||||||||
| CET1 | 67,192 | 67,192 | ||||||||||||||||||
| Basic capital | 76,476 | 75,920 | ||||||||||||||||||
| Eligible capital | 87,837 | 87,750 | ||||||||||||||||||
| Risk-weighted assets | 567,446 | 567,446 | ||||||||||||||||||
| CET1 capital ratio | 11.84 | 11.84 | ||||||||||||||||||
| T1 capital ratio | 13.48 | 13.38 | ||||||||||||||||||
| Total capital ratio | 15.48 | 15.46 | ||||||||||||||||||
| CET1 evolution* | ||
| % | ||
 | ||
January - June 2020 | | 19 | ||||||
RISK MANAGEMENT
•Santander’s Risk management in Q2 focused on protecting our stakeholders in an environment that has been, and still is, characterised by the disruption arising from COVID-19. The Group is actively supporting our customers through various relief programmes, especially those that are more vulnerable, monitoring their performance and payment capacity as well as ensuring that business continuity plans remain effective so that we keep serving our clients under the highest quality standards.
•The NPL ratio was 3.26% as of the end of June in line with the first quarter and lower on an annual basis, explained by loan growth and containment of our customers’ credit quality deterioration through the aforementioned relief programmes. Cost of credit increased to 1.26% due to the additional provisions that have been recorded to face the potential consequences of the pandemic. As a result, coverage increased to 72%, rising 1 pp compared to the previous quarter.
•Our market risk exposure in the second quarter maintained its low profile, with low VaR levels after the market volatility spike caused by the COVID-19 situation in previous months.
•The operational risk profile remained stable, with a similar distribution of losses by category as in the previous quarter, despite the exceptional circumstances. In addition to reinforcing existing controls, new ones were launched to avoid the increase of operational risk levels.
u COVID-19 risk management
Santander’s priority is to protect the health of our employees, customers and shareholders but also to help mitigate the economic and financial impact that the health crisis could have.
In this respect, several work streams were activated to find the best possible outcome for our customers as well as to preserve the Bank’s strength and solvency:
•Identification of vulnerable customers, collectives and sectors that are affected or could be affected by the effects of the pandemic.
•Close monitoring of their situation and needs in light of the most recent pandemic and market developments.
•Scenario analysis to assess potential impacts and define action plans in case they are needed.
•Assessment of the risk control framework, risk appetite statement, management limits and policies to ensure their appropriateness under the current circumstances.
•Strengthening of the recoveries teams in all our geographies.
Continuous interaction and coordination among our local units and Group is a key asset. The experience gained in fighting the health crisis across all our geographies enable us to share best practices and quickly implement actions and strategies adapted to each local market.
The Group's business contingency plans remain active across all our markets to ensure that all our processes and functions are preserved so that we keep serving our customers under the highest quality standards in these difficult times.
The additional governance activated, which includes the Special Situation Committees, has been critical to address and closely monitor the current situation and its potential negative effects.
The board and senior management, in order to facilitate the decision-making process, are regularly updated with the continuous monitoring of the key risk indicators.
In order to minimise the medium- and long-term economic impacts of the efforts taken to contain the COVID-19 pandemic, Santander implemented a set of support measures following regulatory and supervisory recommendations, that, in many cases, were materialised through moratoria on payments of credit obligations or government guaranteed loans, with the aim of supporting the economic and financial challenges faced by borrowers.
To support our customers and foster their economic resilience during the crisis and help them overcome its consequences, different measures have been implemented. Of note:
•Provide liquidity and credit facilities for individuals and businesses through government programmes. Around 630,000 operations were formalised which amounted to more than EUR 25 billion, 3% of the portfolio. Of note were the ICO (Instituto de Crédito Oficial) loans granted in Spain.
•As for payment holidays and moratoria, 5.4 million operations have been formalised for a total of EUR 116 billion (12% of the portfolio), of which 1.9 million operations correspond to government programmes, which account for EUR 72 billion (7% of the portfolio), and 3.5 million operations correspond to non-government programmes, which account for EUR 44 billion (5% of the portfolio).
The main features of the moratoria are:
–Circa 60% correspond to residential mortgages, mainly in the United Kingdom, and mostly under short-term government programmes (3 months, extendable for another 3). Santander UK's mortgage portfolio has an average LTV of around 41%.
| 20 | | January - June 2020 | ||||||
–Around 65% of consumer loans are secured (auto loans). They are mainly booked in our subsidiaries specialised in that business; Santander Consumer Finance and SC USA.
–The corporate and SME portfolio is, in percentage terms, the one that has least resorted to moratorium measures. This is partly due to the accessibility of this kind of company to other types of support measures, such the aforementioned liquidity lines and credit facilities.
–Most moratoria are short term. About 90% will expire in 2020 (less than 6 months of residual maturity). Some governments and institutions are re-extending the term of the initial moratoria, especially those that were launched in the initial phases of the pandemic, with less visibility of the potential duration of the crisis. However, these re-extensions are also short term. Circa 25% of moratoria have already expired, and although it is early to have full visibility of their performance once the support measure is over, as of the end of June the performance of expiring moratoria is similar to that of the portfolio which has not required this kind of measures. 98% of expired moratoria remain performing status.
u Credit risk management
The Group’s NPL ratio in June increased by 1 bp to 3.26% (-25 bps year-on-year) favoured by the COVID-19 public and private customer support programmes (liquidity lines, ICO in Spain, CBILS and CLBILC in the UK, etc), which were reflected in the loan growth of the SME and Corporate segments.
Regarding credit risk performance, non-performing loans amounted to EUR 32,782 million in June, a 1% increase compared to the previous quarter, in constant euros.
| Credit risk | ||||||||||||||||||||||||||
| EUR million | ||||||||||||||||||||||||||
| Jun-20 | Jun-19 | Chg (%) | Dec-19 | |||||||||||||||||||||||
| Non-performing loans | 32,782 | 34,421 | (4.8) | 33,799 | ||||||||||||||||||||||
| NPL ratio (%) | 3.26 | 3.51 | 3.32 | |||||||||||||||||||||||
| Loan-loss allowances | 23,635 | 23,432 | 0.9 | 22,965 | ||||||||||||||||||||||
| For impaired assets | 13,458 | 14,723 | (8.6) | 14,093 | ||||||||||||||||||||||
| For other assets | 10,177 | 8,709 | 16.9 | 8,872 | ||||||||||||||||||||||
| Coverage ratio (%) | 72 | 68 | 68 | |||||||||||||||||||||||
| Cost of credit (%) | 1.26 | 0.98 | 1.00 | |||||||||||||||||||||||
| NPL and coverage ratios. Total Group | ||
| % | ||
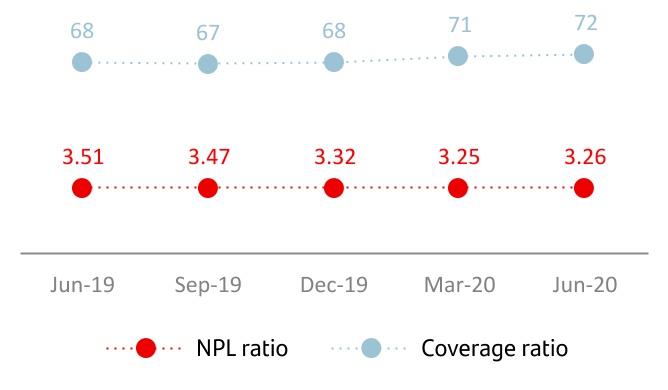
| Key metrics geographic performance. June 2020 | ||||||||||||||||||||||||||
| % | Change (bps) | |||||||||||||||||||||||||
| NPL ratio | QoQ | YoY | Coverage ratio | |||||||||||||||||||||||
| EUROPE | 3.24 | 5 | (24) | 53.4 | ||||||||||||||||||||||
| Spain | 6.55 | (33) | (47) | 43.3 | ||||||||||||||||||||||
| Santander Consumer Finance | 2.52 | 9 | 28 | 106.1 | ||||||||||||||||||||||
| United Kingdom | 1.08 | 12 | (5) | 46.0 | ||||||||||||||||||||||
| Portugal | 4.43 | (13) | (57) | 60.9 | ||||||||||||||||||||||
| Poland | 4.57 | 28 | 36 | 69.0 | ||||||||||||||||||||||
| NORTH AMERICA | 1.73 | (29) | (56) | 206.5 | ||||||||||||||||||||||
| USA | 1.49 | (51) | (83) | 253.1 | ||||||||||||||||||||||
| Mexico | 2.50 | 43 | 29 | 114.9 | ||||||||||||||||||||||
| SOUTH AMERICA | 4.74 | 11 | (7) | 93.0 | ||||||||||||||||||||||
| Brazil | 5.07 | 14 | (20) | 110.2 | ||||||||||||||||||||||
| Chile | 4.99 | 36 | 47 | 54.7 | ||||||||||||||||||||||
| Argentina | 3.15 | (82) | (64) | 165.7 | ||||||||||||||||||||||
| GROUP | 3.26 | 1 | (25) | 72.1 | ||||||||||||||||||||||
January - June 2020 | | 21 | ||||||
Loan-loss provisions in the second quarter amounted to EUR 3,118 million, 66% higher than in the same period of the previous year in constant euros. In the first half of 2020, provisions amounted to EUR 7,027 million, with an increase of 78% year-on-year in constant euros, mainly explained by:
•Initial signs of deterioration in the different loan portfolios observed during the quarter. This has not significantly materialised due to the previously mentioned customer support and relief measures that have been implemented.
•Additional provisions raised reflecting the IFRS 9 forward-looking view, based on a long term approach, taken into account by regulators and supervisors, to the potential macroeconomic scenarios in the COVID-19 context.
•Collective and individual assessment to reflect expected credit losses for assets where credit risk is deemed to have increased. In particular, the Group is continuously monitoring the sectors that have been most affected by the financial impacts of the pandemic, including those related to leisure and tourism, the automotive industry and the oil & gas sector. As in all sectors,
the Group has a well-diversified portfolio in terms of footprint and concentration, which is a mitigating factor even under these circumstances, with the pandemic and its consequences at different phases in the different geographical areas. In addition, governments and central banks have extended specific support measures to companies in these sectors in the most affected geographical areas.
•Year-to-date loan growth stimulated by economic support programmes.
Consequently the Group's cost of credit stood at 1.26% if we consider provisions over the last 12 months (1.46% considering annualised year-to-date provisions).
It should also be noted that the EUR 1.6 billion provisions overlay recorded in first quarter has been allocated across our different markets. This allocation is distributed according to the size of each of our local banks, their loan portfolio characteristics and the potential economic and financial impact of the health crisis in each geography.
| Net loan-loss provisions. Geographic distribution | ||||||||||||||||||||||||||
| EUR million | Q1'20 | Q2'20 | H1'20 | |||||||||||||||||||||||
| LLPs published | Overlay fund | Total LLPs | Total LLPs | Total LLPs | ||||||||||||||||||||||
| EUROPE | 556 | 778 | 1,335 | 877 | 2,211 | |||||||||||||||||||||
| Spain | 253 | 375 | 628 | 313 | 941 | |||||||||||||||||||||
| Santander Consumer Finance | 172 | 145 | 317 | 184 | 501 | |||||||||||||||||||||
| United Kingdom | 49 | 142 | 191 | 239 | 430 | |||||||||||||||||||||
| Portugal | 5 | 75 | 80 | 24 | 105 | |||||||||||||||||||||
| Poland | 68 | 28 | 95 | 89 | 184 | |||||||||||||||||||||
| Other | 9 | 14 | 23 | 29 | 51 | |||||||||||||||||||||
| NORTH AMERICA | 874 | 372 | 1,246 | 1,123 | 2,368 | |||||||||||||||||||||
| USA | 646 | 327 | 972 | 832 | 1,804 | |||||||||||||||||||||
| Mexico | 228 | 46 | 273 | 291 | 564 | |||||||||||||||||||||
| SOUTH AMERICA | 875 | 450 | 1,325 | 1,110 | 2,435 | |||||||||||||||||||||
| Brazil | 709 | 358 | 1,066 | 843 | 1,909 | |||||||||||||||||||||
| Chile | 107 | 56 | 163 | 183 | 346 | |||||||||||||||||||||
| Argentina | 39 | 35 | 75 | 57 | 132 | |||||||||||||||||||||
| Other | 20 | — | 20 | 26 | 47 | |||||||||||||||||||||
| SANTANDER GLOBAL PLATFORM | 0 | — | 0 | 1 | 1 | |||||||||||||||||||||
| CORPORATE CENTRE | 3 | 0 | 3 | 8 | 11 | |||||||||||||||||||||
| GROUP | 2,309 | 1,600 | 3,909 | 3,118 | 7,027 | |||||||||||||||||||||
Total loan-loss reserves stood at EUR 23,635 million, with a non-performing loan coverage ratio of 72% due to higher provisions.
It should also be taken into consideration that a significant part of our portfolios in Spain and the UK have real estate collateral, which requires lower coverage levels.
| 22 | | January - June 2020 | ||||||
| Non-performing loans by quarter | |||||||||||||||||||||||||||||||||||||||||
| EUR million | |||||||||||||||||||||||||||||||||||||||||
| Q1'19 | Q2'19 | Q3'19 | Q4'19 | Q1'20 | Q2'20 | ||||||||||||||||||||||||||||||||||||
| Balance at beginning of period | 35,692 | 35,590 | 34,421 | 34,326 | 33,799 | 32,743 | |||||||||||||||||||||||||||||||||||
| Net additions | 2,147 | 2,511 | 3,190 | 2,696 | 2,543 | 2,805 | |||||||||||||||||||||||||||||||||||
| Increase in scope of consolidation | — | — | — | — | — | — | |||||||||||||||||||||||||||||||||||
| Exchange rate differences and other | 479 | (162) | (110) | (51) | (964) | (353) | |||||||||||||||||||||||||||||||||||
| Write-offs | (2,728) | (3,518) | (3,175) | (3,172) | (2,635) | (2,413) | |||||||||||||||||||||||||||||||||||
| Balance at period-end | 35,590 | 34,421 | 34,326 | 33,799 | 32,743 | 32,782 | |||||||||||||||||||||||||||||||||||
For the purposes of the classification of exposures in the stages of IFRS 9, it should be noted that the Group has taken into account the indications provided by the European Banking Authority (EBA) as regards the classification of exposures subject to moratoria. Accordingly, these moratoria are not considered to be automatic indicators for identifying these contractual modifications as forbearance measures, nor for classifying them as stage 2.
However, this does not exempt the rigorous application of IFRS 9 in the monitoring of customer credit quality and, using individual or collective assessment techniques, the timely detection of significant increases in credit risk in certain transactions or groups of transactions. As such, the macroeconomic deterioration caused by the pandemic has led to a stage 2 classification of EUR 8 billion of assets.
u Market risk
•The global corporate banking trading activity risk is mainly interest rate driven, focused on servicing our customers' needs and measured in daily VaR terms at 99%. In the second quarter, VaR fluctuated around an average value of EUR 15.4 million, stabilising after the market volatility spike caused by the COVID-19 situation in the previous quarter, closing the period at EUR 9.8 million. These figures remain low compared to the size of the Group’s balance sheet and activity.
•It should be also mentioned that there are other positions classified for accounting purposes as trading (total VaR of EUR 9.9 million at the end of June 2020).
| Coverage ratio by stage | ||||||||||||||||||||||||||||||||
| EUR billion | ||||||||||||||||||||||||||||||||
Exposure1 | Coverage | |||||||||||||||||||||||||||||||
| Jun-20 | Mar-20 | Jun-20 | Mar-20 | |||||||||||||||||||||||||||||
| Stage 1 | 878 | 891 | 0.6 | % | 0.6 | % | ||||||||||||||||||||||||||
| Stage 2 | 61 | 53 | 7.7 | % | 8.2 | % | ||||||||||||||||||||||||||
| Stage 3 | 33 | 33 | 41.1 | % | 40.8 | % | ||||||||||||||||||||||||||
(1) Exposure subject to impairment. Additionally, in June 2020 there is EUR 35 billion in loans and advances to customers not subject to impairment recorded at mark to market with changes through P&L (EUR 31 billion in March 2020).
Stage 1: financial instruments for which no significant increase in credit risk is identified since its initial recognition.
Stage 2: if there has been a significant increase in credit risk since the date of initial recognition but the impairment event has not materialised, the financial instrument is classified in Stage 2.
Stage 3: a financial instrument is catalogued in this stage when it shows effective signs of impairment as a result of one or more events that have already occurred resulting in a loss.
| Trading portfolios*. VaR performance | ||
| EUR million | ||
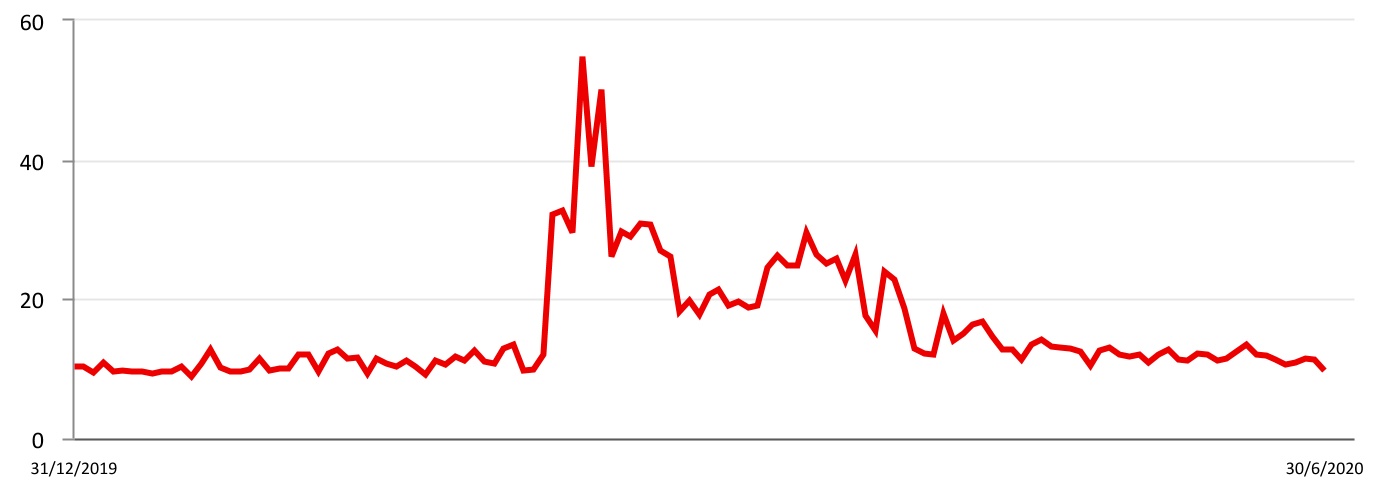
(*) Corporate & Investment Banking performance in financial markets.
January - June 2020 | | 23 | ||||||
Trading portfolios (1). VaR by geographic region | ||||||||||||||||||||||||||
| EUR million | ||||||||||||||||||||||||||
| 2020 | 2019 | |||||||||||||||||||||||||
| Second quarter | Average | Latest | Average | |||||||||||||||||||||||
| Total | 15.4 | 9.8 | 11.4 | |||||||||||||||||||||||
| Europe | 14.9 | 8.7 | 5.8 | |||||||||||||||||||||||
| North America | 8.8 | 6.2 | 3.6 | |||||||||||||||||||||||
| South America | 5.8 | 4.3 | 8.6 | |||||||||||||||||||||||
(1) Activity performance in Corporate & Investment Banking markets.
Trading portfolios (1). VaR by market factor | ||||||||||||||||||||||||||
| EUR million | ||||||||||||||||||||||||||
| Second quarter 2020 | Min. | Avg. | Max. | Last | ||||||||||||||||||||||
| VaR total | 9.8 | 15.4 | 29.5 | 9.8 | ||||||||||||||||||||||
| Diversification effect | (9.5) | (16.9) | (30.9) | (10.8) | ||||||||||||||||||||||
| Interest rate VaR | 5.7 | 11.7 | 25.8 | 5.7 | ||||||||||||||||||||||
| Equity VaR | 2.1 | 5.7 | 10.7 | 3.7 | ||||||||||||||||||||||
| FX VaR | 5.0 | 7.9 | 10.7 | 5.1 | ||||||||||||||||||||||
| Credit spreads VaR | 3.6 | 6.9 | 11.4 | 6.0 | ||||||||||||||||||||||
| Commodities VaR | 0.0 | 0.0 | 0.0 | 0.0 | ||||||||||||||||||||||
(1) Activity performance in Corporate & Investment Banking markets.
NOTE: In the North America, South America and Asia portfolios, VaR corresponding to the credit spreads factor other than sovereign risk is not relevant and is included in the interest rate factor.
u Structural and liquidity risk
•With regards to structural exchange rate risk, Santander’s CET1 ratio coverage remained around 100% in order to protect it from foreign currency movements.
•In structural interest rate risk, very positive performance in the ALCO activity amid continuous support from Central Banks and governments, which helped to reduce the pressure over market interest rates although volatility remains due to the current uncertainty.
•In liquidity risk during the second quarter, the Group maintained a comfortable position, supported by a robust and diversified liquidity buffer, with ratios well above regulatory limits.
u Operational risk
•Overall, the pandemic situation led to an increase in the inherent operational risk exposure, although the Group has put in place additional controls in order to maintain operational risk levels prior to COVID-19 and reinforce the existing ones. The following aspects were closely monitored:
–Business continuity plans were effectively deployed to support our employees, customers and overall businesses.
–The pandemic and remote working scenario has a direct impact on the cyber threats landscape and its associated risks. Controls are being reinforced to support the control environment (i.e. patching, browsing control, data protection controls, etc.).
–Increase in technological support in order to ensure availability and adequate performance of our services, especially in online banking and call centres.
–Transaction processing risk increases due to the volume of new loans and multiple changes in existing portfolios derived from government aid programmes and internal policies. Additional controls have been implemented to minimise incidents.
•In terms of the second quarter performance, levels of losses in relative terms by Basel categories were aligned with the second quarter of 2019, and similar to the previous quarter. There have been no major events related to the COVID-19 situation.
| 24 | | January - June 2020 | ||||||
GENERAL BACKGROUND
Activity in the second quarter was shaped by the confinement measures aimed at curbing the pandemic and economic policy measures to soften the consequences of the downturn. In general, the sharpest drop in activity in most economies was recorded this quarter. However, the intense response of monetary and fiscal policies has contained market deterioration and raised expectations of a recovery in activity, now that the lockdown measures are gradually being eased. Uncertainty regarding the possibility of a new outbreak of the pandemic, where the first wave was overcome, is still high, although the first data on activity after the loosening of measures is relatively encouraging, albeit uneven by country and sector.
| Country | GDP Change1 | Economic performance | |||||||||
 | Eurozone | -3.1% | Economic activity plummeted in March-April as a consequence of COVID-19. Confidence indicators and retail sales started to recover in May, but the labour market is lagging behind. Inflation fell to 0.3% year-on-year in June due to lower oil prices. | ||||||||
 | Spain | -4.1% | GDP contracted in the first quarter due to the lockdown derived from COVID-19 and a further decline is expected in Q2'20. There has been a gradual normalisation since May, although it will take time to recover lost activity. Inflation turned negative in June (-0.3% year-on-year). | ||||||||
 | United Kingdom | -1.7% | Following the GDP fall in Q1'20, the low point of the crisis is expected to be recorded in Q2 due to the almost complete halt of activity in April (GDP fell by 20.4%). Inflation reflected scant demand (0.6% in June). The official interest rate has remained at 0.1% since March. | ||||||||
 | Portugal | -2.3% | The sharp fall recorded since March resulting from COVID-19 will lead to a more pronounced GDP decline in Q2'20 than in the previous quarter, although most indicators in May point to a moderate recovery. The jobless rate remained stable in Q1'20 (6.7%) and inflation turned positive in June (0.1% vs -0.7% in May). | ||||||||
 | Poland | +2.0% | The economy in Q1'20 dropped 0.4% quarter-on-quarter, reflecting the first impacts of mitigation measures. Economic data for May shows the first signs of recovery, leaving the worst of the crisis in April. Inflation rebounded in June to 3.3% driven by services, and the central bank cut its key interest rate twice to 0.1%. | ||||||||
 | United States | +0.3% | COVID-19 pushed the first quarter's GDP down 5% on an annualised quarterly basis. After a sharp rise in April (14.7% vs 3.5% in December), unemployment fell in June to to 11.1%. Inflation remained low (0.6%) and the Fed, after cutting interest rates to 0-0.25% in March, launched a number of facilities to support the markets and the flow of financing. | ||||||||
 | Mexico | -1.4% | The economy contracted strongly in April (-17.3%), after falling 1.2% QoQ in Q1'20, reflecting the strong impact of the pandemic. The gradual reopening of activities in May-June will allow for some recovery in Q3'20. Inflation moderated (2.8% in May) and the central bank continued to cut rates (to 5.0% vs. 6.5% in Q1'20) and announced further measures to support markets and lending. | ||||||||
 | Brazil | -0.3% | Economic growth fell a total of 16.4% between March-May, impacted by the pandemic. Indicators point toward some stabilisation since May, although remaining at depressed levels. Very low inflation (2.1% in June) and the central bank cut the official rate to 2.25% (3.75% in Q1'20), and announced further measures such as plans to purchase private sector debt. | ||||||||
 | Chile | +0.4% | Between March and May, the economy contracted by 16.4%, and additional declines are expected due to the tighter restrictions on mobility implemented in May-end due to the COVID-19 outbreak. The central bank kept the official rate at 0.5% and extended the measures to support liquidity and lending. | ||||||||
 | Argentina | -5.4% | GDP growth fell 26% between March and April, heavily impacted by the social distancing measures adopted arising from COVID-19. Inflation dipped to a monthly average of 1.8% in Q2'20 (2.5% in average in Q1'20). The renegotiation of foreign debt continued. | ||||||||
(1) Year-on-year change Q1'20
January - June 2020 | | 25 | ||||||
| Response to the COVID-19 crisis Business model | ||||||||||||||||||||||||||
DESCRIPTION OF SEGMENTS
The segment reporting is based on financial information presented to the chief operating decision maker, which excludes certain items included in the statutory results that distort year-on-year comparisons and are not considered for management reporting purposes. This financial information (underlying basis) is computed by adjusting reported results for the effects of certain gains and losses (e.g. capital gains, write-downs, impairment of goodwill, etc.). These gains and losses are items that management and investors ordinarily identify and consider separately to better understand the underlying trends in the business.
The Group has aligned the information in this chapter in a manner consistent with the underlying information used internally for management reporting purposes and with that presented in the Group’s other public documents.
The Group's executive committee has been determined to be the chief operating decision maker for the Group. The Group’s operating segments reflect the organisational and management structures. The Group's executive committee reviews the internal reporting based on these segments in order to assess performance and allocate resources.
The segments are differentiated by the geographic area in which profits are earned and by type of business. The financial information of each reportable segment is prepared by aggregating the figures for the Group’s various geographic areas and business units. The information relates to both the accounting data of the units integrated in each segment and that provided by management information systems. In all cases, the same general principles as those used in the Group are applied.
The businesses included in each of the business areas in this report and the accounting principles under which their results are presented here may differ from the businesses included and accounting principles applied in the financial information separately prepared and disclosed by our subsidiaries (some of which are publicly listed) which in name or geographical description may seem to correspond to the business areas covered in this report. Accordingly, the results of operations and trends shown for our business areas in this document may differ materially from those of such subsidiaries.
In 2020, the Group maintains the general criteria applied in 2019, as well as the business segments with the following exceptions, which only affect the secondary segments:
1. Following the creation of the reporting segment Santander Global Platform in 2019, which comprises our global digital services under a single unit, and its incorporation in both primary and secondary segments, in 2020 for better monitoring of its evolution and contribution to the Group's results, at the secondary segment level in addition to the results generated by the platforms, 50% of the results generated by countries in products linked to these platforms are considered. These results were previously included in Retail Banking.
2. Annual adjustment of the perimeter of the Global Customer Relationship Model between Retail Banking and Santander Corporate & Investment Banking and between Retail Banking and Wealth Management & Insurance.
These changes in the secondary segments have no impact on the primary segments and do not affect the Group’s figures.
To allow better comparability of the secondary segments, 2019 data has been provided on a new basis.
After these changes, the operating business areas are structured in two levels:
Primary segments
This primary level of segmentation, which is based on the Group’s management structure, comprises five reportable segments: four operating areas plus the Corporate Centre. The operating areas are:
Europe: which comprises all the business activities carried out in the region. Detailed financial information is provided on Spain, Portugal, Poland, Santander Consumer Finance (which incorporates all the region’s business, including the three countries mentioned herewith) and the UK.
North America: which comprises all the business activities carried out in Mexico and the US, which includes the holding company (SHUSA) and the businesses of Santander Bank, Santander Consumer USA, Banco Santander Puerto Rico (whose sale was agreed in the second half of 2019 and its closing is expected in the third quarter of 2020), the specialised unit Banco Santander International and the New York branch.
South America: includes all the financial activities carried out by the Group through its banks and subsidiary banks in the region. Detailed information is provided on Brazil, Chile, Argentina, Uruguay, Peru and Colombia.
Santander Global Platform: which comprises our global digital services under a single unit, includes Global Payments Services (Global Trade Services, Global Merchant Services, Superdigital, Pago FX), our fully digital bank Openbank and Open Digital Services, and Digital Assets (Centres of Digital Expertise, InnoVentures and Digital Assets).
| 26 | | January - June 2020 | ||||||
| Response to the COVID-19 crisis Business model | ||||||||||||||||||||||||||
Secondary segments
At this secondary level, the Group is structured into Retail Banking, Santander Corporate & Investment Banking, Wealth Management & Insurance and Santander Global Platform.
Retail Banking: this covers all customer banking businesses, including consumer finance, except those of corporate banking, which are managed through Santander Corporate & Investment Banking, asset management, private banking and insurance, which are managed by Wealth Management & Insurance and 50% of the countries’ results generated by digital services, which are included in Santander Global Platform. The results of the hedging positions in each country are also included, conducted within the sphere of each one’s assets and liabilities committee.
Santander Corporate & Investment Banking (SCIB): this business reflects revenue from global corporate banking, investment banking and markets worldwide including treasuries managed globally (always after the appropriate distribution with Retail Banking customers), as well as equity business.
Wealth Management & Insurance: includes the asset management business (Santander Asset Management), the corporate unit of Private Banking and International Private Banking in Miami and Switzerland and the insurance business (Santander Insurance).
Santander Global Platform: which comprises our global digital services under a single unit (breakdown in the primary segment definition), as well as 50% of the results generated by these services in the commercial network.
In addition to these operating units, which report by geographic area and businesses, the Group continues to maintain the area of Corporate Centre, that includes the centralised activities relating to equity stakes in financial companies, financial management of the structural exchange rate position, assumed within the sphere of the Group’s assets and liabilities committee, as well as management of liquidity and of shareholders’ equity via issuances.
As the Group’s holding entity, this area manages all capital and reserves and allocations of capital and liquidity with the rest of businesses. It also incorporates amortisation of goodwill but not the costs related to the Group’s central services (charged to the areas), except for corporate and institutional expenses related to the Group’s functioning.
As described on the previous page, the results of our business areas presented below are provided on the basis of underlying results only and including the impact of foreign exchange rate fluctuations. However, for a better understanding of the actual changes in the performance of our business areas, we provide and discuss the year-on-year changes to our results excluding such impact. On the other hand, certain figures contained in this report, including financial information, have been subject to rounding to enhance their presentation. Accordingly, in certain instances, the sum of the numbers in a column or a row in tables contained in this report may not conform exactly to the total figure given for that column or row. | ||
January - June 2020 | | 27 | ||||||
| Response to the COVID-19 crisis Business model | ||||||||||||||||||||||||||
| January-June 2020 | ||||||||||||||||||||||||||||||||||||||
| Main items of the underlying income statement | ||||||||||||||||||||||||||||||||||||||
| EUR million | ||||||||||||||||||||||||||||||||||||||
| Primary segments | Net interest income | Net fee income | Total income | Net operating income | Profit before tax | Underlying attributable profit to the parent | ||||||||||||||||||||||||||||||||
| EUROPE | 6,787 | 2,413 | 9,551 | 4,314 | 1,747 | 1,075 | ||||||||||||||||||||||||||||||||
| Spain | 1,856 | 1,178 | 3,350 | 1,509 | 350 | 251 | ||||||||||||||||||||||||||||||||
| Santander Consumer Finance | 1,926 | 345 | 2,266 | 1,283 | 849 | 477 | ||||||||||||||||||||||||||||||||
| United Kingdom | 1,769 | 290 | 2,077 | 707 | 198 | 139 | ||||||||||||||||||||||||||||||||
| Portugal | 399 | 191 | 668 | 372 | 230 | 160 | ||||||||||||||||||||||||||||||||
| Poland | 547 | 220 | 742 | 428 | 167 | 73 | ||||||||||||||||||||||||||||||||
| Other | 289 | 189 | 448 | 15 | (48) | (25) | ||||||||||||||||||||||||||||||||
| NORTH AMERICA | 4,339 | 860 | 5,642 | 3,301 | 883 | 617 | ||||||||||||||||||||||||||||||||
| US | 2,891 | 465 | 3,730 | 2,144 | 305 | 211 | ||||||||||||||||||||||||||||||||
| Mexico | 1,448 | 396 | 1,912 | 1,156 | 578 | 406 | ||||||||||||||||||||||||||||||||
| SOUTH AMERICA | 5,671 | 1,847 | 7,854 | 5,093 | 2,465 | 1,383 | ||||||||||||||||||||||||||||||||
| Brazil | 4,083 | 1,483 | 5,788 | 3,949 | 1,881 | 995 | ||||||||||||||||||||||||||||||||
| Chile | 873 | 166 | 1,137 | 678 | 331 | 183 | ||||||||||||||||||||||||||||||||
| Argentina | 502 | 132 | 628 | 289 | 125 | 109 | ||||||||||||||||||||||||||||||||
| Other | 213 | 65 | 301 | 177 | 127 | 96 | ||||||||||||||||||||||||||||||||
| SANTANDER GLOBAL PLATFORM | 63 | 31 | 89 | (59) | (67) | (41) | ||||||||||||||||||||||||||||||||
| CORPORATE CENTRE | (658) | (15) | (617) | (784) | (1,186) | (1,125) | ||||||||||||||||||||||||||||||||
| TOTAL GROUP | 16,202 | 5,136 | 22,518 | 11,865 | 3,841 | 1,908 | ||||||||||||||||||||||||||||||||
| Secondary segments | ||||||||||||||||||||||||||||||||||||||
| RETAIL BANKING | 15,026 | 3,518 | 18,831 | 10,220 | 2,930 | 1,616 | ||||||||||||||||||||||||||||||||
| CORPORATE & INVESTMENT BANKING | 1,384 | 810 | 2,726 | 1,683 | 1,391 | 928 | ||||||||||||||||||||||||||||||||
| WEALTH MANAGEMENT & INSURANCE | 236 | 599 | 1,069 | 605 | 589 | 427 | ||||||||||||||||||||||||||||||||
| SANTANDER GLOBAL PLATFORM | 214 | 224 | 510 | 141 | 117 | 63 | ||||||||||||||||||||||||||||||||
| CORPORATE CENTRE | (658) | (15) | (617) | (784) | (1,186) | (1,125) | ||||||||||||||||||||||||||||||||
| TOTAL GROUP | 16,202 | 5,136 | 22,518 | 11,865 | 3,841 | 1,908 | ||||||||||||||||||||||||||||||||
| Underlying attributable profit geographic distribution* | Underlying attributable profit H1'20. Core markets | |||||||
| First half 2020 | EUR million. % change YoY in constant euros | |||||||
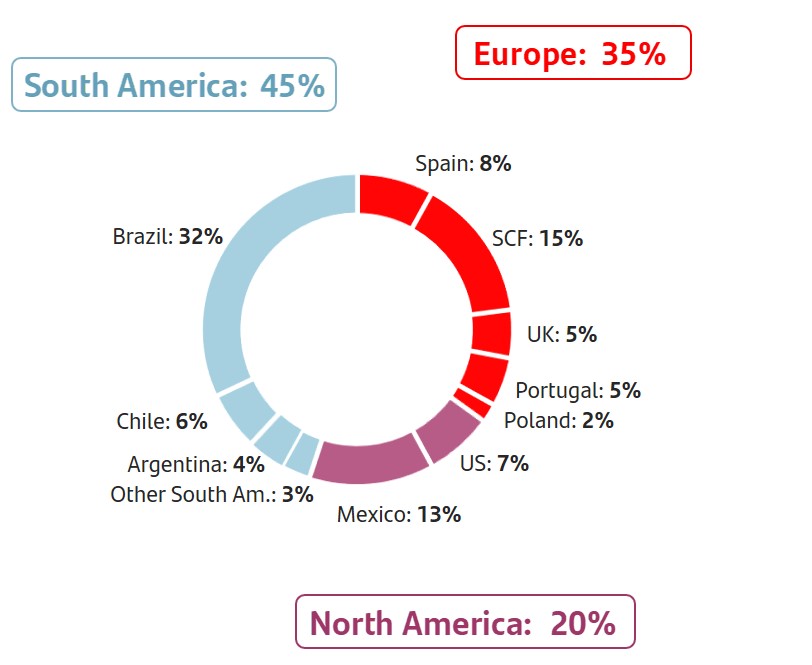 | 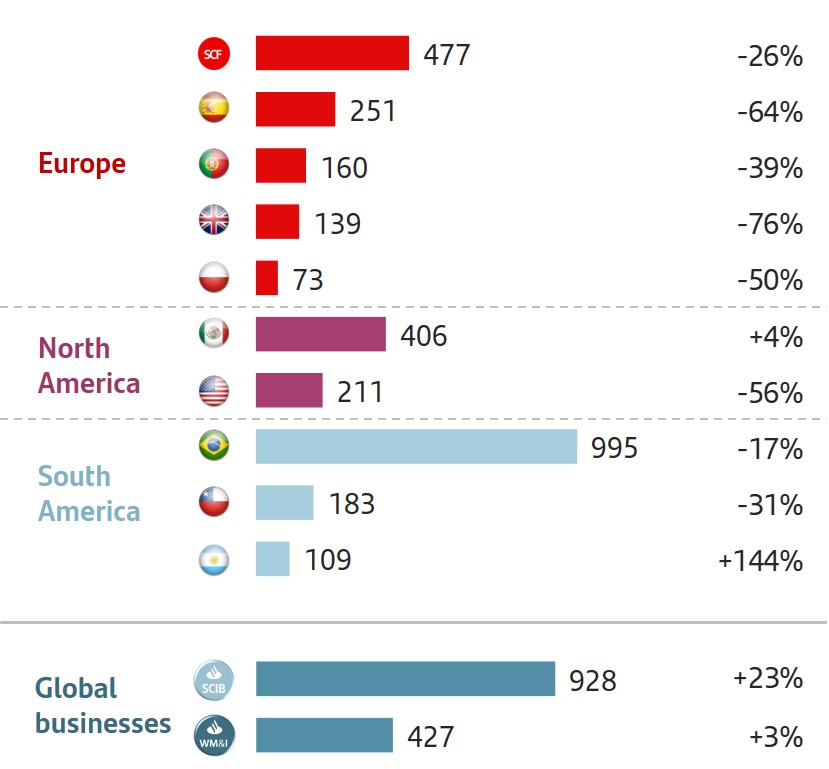 | |||||||
| (*) As a % of operating areas. Excluding Corporate Centre and Santander Global Platform. | ||||||||
| 28 | | January - June 2020 | ||||||
| Response to the COVID-19 crisis Business model | ||||||||||||||||||||||||||
| January-June 2019 | ||||||||||||||||||||||||||||||||||||||
| Main items of the underlying income statement | ||||||||||||||||||||||||||||||||||||||
| EUR million | ||||||||||||||||||||||||||||||||||||||
| Primary segments | Net interest income | Net fee income | Total income | Net operating income | Profit before tax | Underlying attributable profit to the parent | ||||||||||||||||||||||||||||||||
| EUROPE | 7,141 | 2,630 | 10,413 | 4,822 | 3,549 | 2,354 | ||||||||||||||||||||||||||||||||
| Spain | 2,018 | 1,247 | 3,706 | 1,661 | 936 | 694 | ||||||||||||||||||||||||||||||||
| Santander Consumer Finance | 1,911 | 415 | 2,321 | 1,286 | 1,117 | 658 | ||||||||||||||||||||||||||||||||
| United Kingdom | 1,919 | 423 | 2,388 | 946 | 792 | 582 | ||||||||||||||||||||||||||||||||
| Portugal | 429 | 197 | 712 | 400 | 379 | 260 | ||||||||||||||||||||||||||||||||
| Poland | 565 | 230 | 817 | 467 | 293 | 150 | ||||||||||||||||||||||||||||||||
| Other | 299 | 118 | 469 | 62 | 33 | 10 | ||||||||||||||||||||||||||||||||
| NORTH AMERICA | 4,403 | 901 | 5,672 | 3,286 | 1,594 | 889 | ||||||||||||||||||||||||||||||||
| US | 2,860 | 479 | 3,734 | 2,154 | 891 | 465 | ||||||||||||||||||||||||||||||||
| Mexico | 1,543 | 423 | 1,938 | 1,132 | 703 | 424 | ||||||||||||||||||||||||||||||||
| SOUTH AMERICA | 6,647 | 2,355 | 9,134 | 5,825 | 3,661 | 1,961 | ||||||||||||||||||||||||||||||||
| Brazil | 4,979 | 1,855 | 6,864 | 4,637 | 2,846 | 1,482 | ||||||||||||||||||||||||||||||||
| Chile | 940 | 200 | 1,255 | 731 | 560 | 311 | ||||||||||||||||||||||||||||||||
| Argentina | 511 | 241 | 720 | 289 | 127 | 73 | ||||||||||||||||||||||||||||||||
| Other | 217 | 60 | 295 | 168 | 128 | 94 | ||||||||||||||||||||||||||||||||
| SANTANDER GLOBAL PLATFORM | 46 | 2 | 39 | (69) | (70) | (51) | ||||||||||||||||||||||||||||||||
| CORPORATE CENTRE | (600) | (27) | (822) | (1,015) | (1,155) | (1,108) | ||||||||||||||||||||||||||||||||
| TOTAL GROUP | 17,636 | 5,863 | 24,436 | 12,849 | 7,579 | 4,045 | ||||||||||||||||||||||||||||||||
| Secondary segments | ||||||||||||||||||||||||||||||||||||||
| RETAIL BANKING | 16,406 | 4,312 | 21,070 | 11,629 | 6,607 | 3,763 | ||||||||||||||||||||||||||||||||
| CORPORATE & INVESTMENT BANKING | 1,354 | 726 | 2,569 | 1,448 | 1,356 | 860 | ||||||||||||||||||||||||||||||||
| WEALTH MANAGEMENT & INSURANCE | 284 | 571 | 1,085 | 608 | 610 | 444 | ||||||||||||||||||||||||||||||||
| SANTANDER GLOBAL PLATFORM | 192 | 280 | 534 | 179 | 160 | 85 | ||||||||||||||||||||||||||||||||
| CORPORATE CENTRE | (600) | (27) | (822) | (1,015) | (1,155) | (1,108) | ||||||||||||||||||||||||||||||||
| TOTAL GROUP | 17,636 | 5,863 | 24,436 | 12,849 | 7,579 | 4,045 | ||||||||||||||||||||||||||||||||
January - June 2020 | | 29 | ||||||
Business model | ||||||||||||||||||||||||||
| Primary segments | ||||||||||||||||||||||||||
| EUROPE | ||||||||
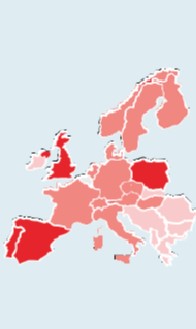 | Highlights (changes in constant euros) •At a critical time, with a number of social and commercial factors that entail major challenges, we are working in a coordinated and integrated way to generate new business opportunities, including those related to technology and innovation. •In this environment of high uncertainty generated by the health crisis, loans grew 4%, mainly in SMEs and large corporates, which offset the falls in new lending in the consumer and individual segments, which has begun to recover in recent weeks. •Underlying attributable profit amounted to EUR 1,075 million, down 54% compared to 2019, due to lower customer revenue and higher provisions. Costs improved 6%, with good performance in all markets, reflecting the management and optimisation measures. | |||||||
| EUR 1,075 Mn | ||||||||
| Underlying attributable profit | ||||||||
Strategy
In Europe, we continued making progress to simplify our business model and enhance our digital capabilities in order to offer better products and services. We are working on:
•The implementation of the different technological platforms and services in our markets, accelerating the digital transformation process, improving customer experience and expanding distribution channels for our products and services.
•Simplifying the number of products to gain efficiency and agility but maintaining a full value proposition that is capable of meeting the daily needs of our individual customers and offering tailored solutions for SMEs and large corporates.
These improvements enable us to appreciate the benefits of business units joining forces, creating One Santander Europe, accelerating and promoting agility and collaboration across countries and global businesses, making the most of our capabilities.
Business performance
Gross loans and advances to customers (excluding reverse repos) increased by 4%, boosted by the UK (mortgages) and CIB, as well as SCF (driven by organic growth in 2019 and early 2020 and the joint venture in Germany) and Poland. Growth in Spain was more than EUR 11 billion in the quarter, spurred by ICO guaranteed loans.
Customer deposits (excluding repos) increased 4% year-on-year with rises in almost all countries. Mutual funds fell 1%, very impacted by markets, with customer funds growing 3%.
Results
Underlying attributable profit amounted to EUR 1,075 million in the first half, 54% less than the previous year. By line:
•In an environment of low interest rates and high uncertainty derived from the health crisis, total income dropped 8%. Net interest income was 4% lower driven by Spain (smaller ALCO portfolio, average volumes and lower rates) and the UK (competitive pressure, lower SVR attrition and rates). Net fee income fell 8% driven by lower business activity and transactionality in the last months whilst gains on financial transactions rose 8%. Lastly, decreases in other operating income due to lower income from real estate stakes in Spain and the higher contribution to the SRF.
•Overall cost decreases across markets, mainly in Spain, which was reflected in the 6% fall in the region (-7% in real terms) because of the efficiencies generated and the optimisation processes.
•Provisions rose 163% due to the expected deterioration of the macro variables arising from the health crisis.
In the quarter, profit rose 45% mainly due to lower provisions and other results.
| Customers | ||||||||||||||||||||
| June 2020. Thousands | ||||||||||||||||||||
| Loyal customers | Digital customers | |||||||||||||||||||
 | 9,834 |  | 14,666 | |||||||||||||||||
| +36 | % | /active customers | +9 | % | YoY | |||||||||||||||
| Activity | ||||||||||||||||||||||||||||||||||||||||||||||||||||||||||||||
| June 2020. EUR billion and % change in constant euros | ||||||||||||||||||||||||||||||||||||||||||||||||||||||||||||||
| +1% | +5% | |||||||||||||||||||||||||||||||||||||||||||||||||||||||||||||
| QoQ | QoQ | |||||||||||||||||||||||||||||||||||||||||||||||||||||||||||||
| 656 | 672 | |||||||||||||||||||||||||||||||||||||||||||||||||||||||||||||
| +4% | +3% | |||||||||||||||||||||||||||||||||||||||||||||||||||||||||||||
| YoY | YoY | |||||||||||||||||||||||||||||||||||||||||||||||||||||||||||||
| Gross loans and advances to customers excl. reverse repos | Customer deposits excl. repos + mutual funds | |||||||||||||||||||||||||||||||||||||||||||||||||||||||||||||
| Underlying income statement | ||||||||||||||||||||||||||||||||
| EUR million and % change in constant euros | ||||||||||||||||||||||||||||||||
| Q2'20 | / Q1'20 | H1'20 | / H1'19 | |||||||||||||||||||||||||||||
| Revenue | 4,577 | -7 | % | 9,551 | -8 | % | ||||||||||||||||||||||||||
| Expenses | -2,526 | -6 | % | -5,237 | -6 | % | ||||||||||||||||||||||||||
| Net operating income | 2,051 | -8 | % | 4,314 | -10 | % | ||||||||||||||||||||||||||
| LLPs | -877 | -34 | % | -2,211 | +163 | % | ||||||||||||||||||||||||||
| PBT | 1,014 | +40 | % | 1,747 | -50 | % | ||||||||||||||||||||||||||
| Underlying attrib. profit | 632 | +45 | % | 1,075 | -54 | % | ||||||||||||||||||||||||||
| 30 | | January - June 2020 | ||||||
Business model | ||||||||||||||||||||||||||
| Primary segments | ||||||||||||||||||||||||||
| SPAIN | ||||||||||||||
 | Highlights | |||||||||||||
| Period eminently impacted by the state of alarm declared in response to the COVID-19 health crisis, where our main goal was to protect our employees and customers, boosting our digital capabilities to preserve services and interaction remotely, exceeding 100 million accesses to digital channels per month. | ||||||||||||||
•Our aim is to be part of the solution to the economic crisis by leading numerous initiatives to support families, self-employed workers and businesses, having granted 27% of the total ICO funding. •Underlying attributable profit was EUR 251 million, 64% lower than in 2019, predominantly affected by higher provisions, in an environment of post-COVID-19 uncertainty. This impact was partially offset by lower costs (-10%). Net operating income fell 9%. | ||||||||||||||
| EUR 251 Mn | ||||||||||||||
| Underlying attributable profit | ||||||||||||||
Commercial activity
•We have granted more than EUR 50 billion to self-employed workers, SMEs and corporates since the state of alert started, of which more than EUR 23.9 billion in ICO-guaranteed loans in more than 150,000 operations and EUR 12 billion in commercial papers.
•In individuals, the focus was on the Plan Ayuda a las Personas, particularly on measures to help vulnerable customers, with a total of 75,000 customers receiving legal mortgage payment holidays. In addition, 96,000 of customers signed up to other measures such as payment holidays for consumer loans, cards or shareholder loans.
•Double-digit growth in businesses, SMEs and corporates, spurred by the ICO-guaranteed loans, which offsets the lower production of transactional related products.
•At quarter-end, we focused on stimulating commercial activity with individuals, of note was the launch of auto insurance, which has a unique process in the market, is fully digital and has an omni-channel strategy for both point of sale and and servicing.
Business performance
In the quarter, loans grew more than EUR 11 billion (+6%), strongly driven by SMEs and corporates. On a year-on-year basis, growth was 1%. In individuals, mortgage completions and consumer lending were significantly lower year-on-year (-16% and -55%, respectively), in line with the economic slowdown recorded in the country.
Customer funds (excluding repos) were 2% lower, impacted by the fall in time deposits and mutual funds (-3%), mainly due to markets. On the other hand, demand deposits rose 3%. In the quarter, deposits grew 6%, maintaining solid liquidity levels.
Results
Underlying attributable profit in the first half of the year amounted to EUR 251 million, 64% lower year-on-year. By line:
•Total income fell 10%, impacted by net interest income (smaller ALCO portfolio and lower stock in wholesale banking), lower fee income from reduced transaction volumes and market performance, and reduced income from stakes (mainly real estate).
•Costs fell at double-digit rates (-10% year-on-year) as a result of the optimisation processes carried out.
•as a result, net operating income fell 9%.
•Higher loan-loss provisions derived from the COVID-19 crisis. Despite the economic recession, the NPL ratio fell 47 bps year-on-year to 6.55%, mainly explained by the high level of corporate loans granted.
Compared to the first quarter of 2020, profit increased driven by NII recovery and positive cost performance. In addition, the first quarter was impacted by higher provisions.
| Customers | ||||||||||||||||||||
| June 2020. Thousands | ||||||||||||||||||||
| Loyal customers | Digital customers | |||||||||||||||||||
| 2,542 | | 5,091 | |||||||||||||||||
| +33 | % | /active customers | +10 | % | YoY | |||||||||||||||
| Activity | ||||||||||||||||||||||||||||||||||||||||||||||||||||||||||||||
| June 2020. EUR billion and % change | ||||||||||||||||||||||||||||||||||||||||||||||||||||||||||||||
| +6% | ||||||||||||||||||||||||||||||||||||||||||||||||||||||||||||||
| +6% | QoQ | |||||||||||||||||||||||||||||||||||||||||||||||||||||||||||||
| QoQ | ||||||||||||||||||||||||||||||||||||||||||||||||||||||||||||||
| 204 | 312 | |||||||||||||||||||||||||||||||||||||||||||||||||||||||||||||
| +1% | -2% | |||||||||||||||||||||||||||||||||||||||||||||||||||||||||||||
| YoY | YoY | |||||||||||||||||||||||||||||||||||||||||||||||||||||||||||||
| Gross loans and advances to customers excl. reverse repos | Customer deposits excl. repos + mutual funds | |||||||||||||||||||||||||||||||||||||||||||||||||||||||||||||
| Underlying income statement | ||||||||||||||||||||||||||||||||
| EUR million and % change | ||||||||||||||||||||||||||||||||
| Q2'20 | / Q1'20 | H1'20 | / H1'19 | |||||||||||||||||||||||||||||
| Revenue | 1,562 | -13 | % | 3,350 | -10 | % | ||||||||||||||||||||||||||
| Expenses | -896 | -5 | % | -1,841 | -10 | % | ||||||||||||||||||||||||||
| Net operating income | 665 | -21 | % | 1,509 | -9 | % | ||||||||||||||||||||||||||
| LLPs | -313 | -50 | % | -941 | +100 | % | ||||||||||||||||||||||||||
| PBT | 237 | +112 | % | 350 | -63 | % | ||||||||||||||||||||||||||
| Underlying attrib. profit | 161 | +79 | % | 251 | -64 | % | ||||||||||||||||||||||||||
January - June 2020 | | 31 | ||||||
Business model | ||||||||||||||||||||||||||
| Primary segments | ||||||||||||||||||||||||||
| SANTANDER CONSUMER FINANCE | ||||||||||||||
 | Highlights (changes in constant euros) | |||||||||||||
| During the quarter, SCF continued to proactively manage the COVID-19 impact. Priorities are to protect employees’ health, ensure business continuity and service in branches and call centres, and to support customers and business partners (car manufacturers, dealers and retailers). | ||||||||||||||
•As a result of the health crisis, new business fell 18% compared to the same period in 2019. However, most markets are showing strong signs of recovery in recent weeks from minimum levels reached in April. •Net operating income of EUR 1,283 million was 1% higher year-on-year driven by a strong start to the year and lower costs, which offset impact of lower volumes. Underlying attributable profit was down 26%, greatly affected by increased provisions. | ||||||||||||||
| EUR 477 Mn | ||||||||||||||
| Underlying attributable profit | ||||||||||||||
Commercial activity
We continue to focus on remaining the leader in auto finance and increasing consumer finance by boosting digital channels, which is the strategy behind our acquisition of 50% of Sixt Leasing and the joint consumer finance operation launched with Telecom Italia Mobile.
Business performance
Most of SCF’s markets have been significantly affected by COVID-19, with a drop in new business starting in mid-March due to gradual lockdowns in most European countries. New lending fell 18% year-on-year (better than European new car sales, -39% as of June). The largest falls were in Southern Europe (c. -30%), which was most affected by isolation measures, whereas Northern European markets were stronger (c. -10%) as measures were softer.
Since reaching its minimum in April (c. 50% of normal levels), new business has recovered to nearly 90% of pre-crisis levels. Both the stock of credit and customer deposits excluding repos increased 3% year-on-year.
On the other hand, in order to compensate lost revenue, several measures are being carried out to reduce risk while supporting customers, particularly strong reductions in operating expenses and income initiatives in pricing, cost of funding and insurance sales.
Results
Underlying attributable profit of EUR 477 million in the first half of 2020, 26% lower in constant euros than in the same period of 2019:
•Net interest income grew 3% driven by greater volumes and revenue actions mitigated somewhat by the European Court of Justice ruling regarding early repayment of loans and interest rate limitations in Poland. Additionally, net fee income decreased due to lower new business in the second quarter.
•Costs decreased 4% mainly due to COVID-19 mitigation actions and continued efficiency projects in several units.
•As a result, efficiency improved 120 bps and net operating income rose 1%.
•LLPs rose significantly driven by COVID-related provisions, portfolio sales and other positive one-offs in 2019. As a result, the cost of credit stood at 0.78% and the NPL ratio at 2.52%, 28 bps higher than June 2019.
•The largest contribution to the underlying attributable profit came from Germany (EUR 134 million), the Nordics (EUR 120 million) and Spain (EUR 59 million).
Compared to the previous quarter, underlying attributable profit grew 19% driven by efficiency improvement and the large loan-loss provisions in the first quarter.
| Customer loan distribution | ||||||||
| June 2020 | ||||||||
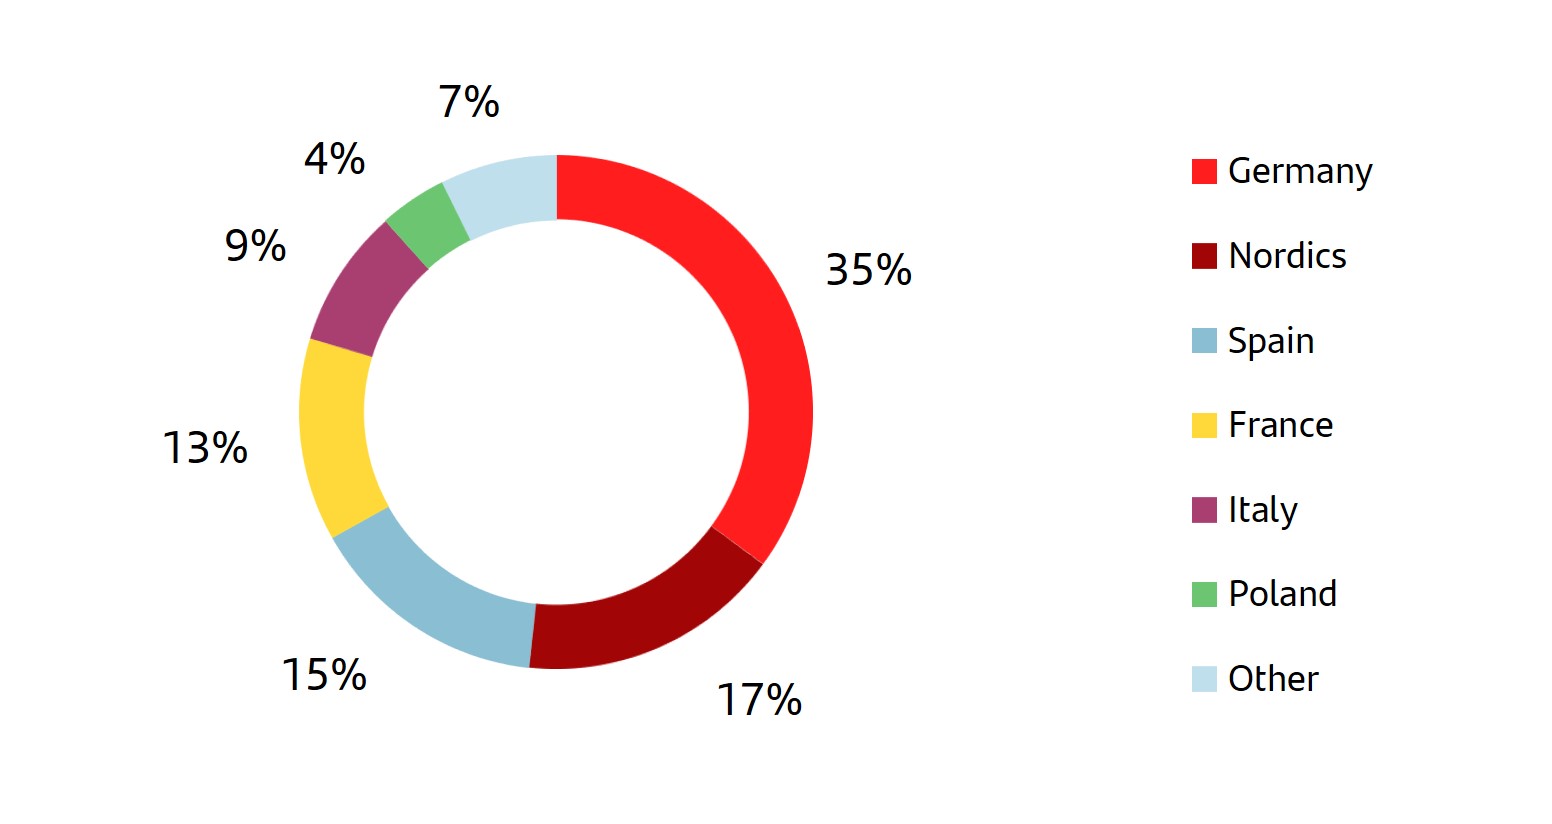 | ||||||||
| Activity | ||||||||||||||||||||||||||||||||||||||||||||||||||||||||||||||
| June 2020. EUR billion and % change in constant euros | ||||||||||||||||||||||||||||||||||||||||||||||||||||||||||||||
| -1% | ||||||||||||||||||||||||||||||||||||||||||||||||||||||||||||||
| QoQ | -20% | |||||||||||||||||||||||||||||||||||||||||||||||||||||||||||||
| 102 | QoQ | |||||||||||||||||||||||||||||||||||||||||||||||||||||||||||||
| +3% | -18% | |||||||||||||||||||||||||||||||||||||||||||||||||||||||||||||
| YoY | 18 | YoY | ||||||||||||||||||||||||||||||||||||||||||||||||||||||||||||
| Gross loans and advances to customers excl. reverse repos | New lending | |||||||||||||||||||||||||||||||||||||||||||||||||||||||||||||
| Underlying income statement | ||||||||||||||||||||||||||||||||
| EUR million and % change in constant euros | ||||||||||||||||||||||||||||||||
| Q2'20 | / Q1'20 | H1'20 | / H1'19 | |||||||||||||||||||||||||||||
| Revenue | 1,095 | -5 | % | 2,266 | -1 | % | ||||||||||||||||||||||||||
| Expenses | -469 | -8 | % | -983 | -4 | % | ||||||||||||||||||||||||||
| Net operating income | 626 | -3 | % | 1,283 | +1 | % | ||||||||||||||||||||||||||
| LLPs | -184 | -41 | % | -501 | +177 | % | ||||||||||||||||||||||||||
| PBT | 466 | +23 | % | 849 | -23 | % | ||||||||||||||||||||||||||
| Underlying attrib. profit | 258 | +19 | % | 477 | -26 | % | ||||||||||||||||||||||||||
| 32 | | January - June 2020 | ||||||
Business model | ||||||||||||||||||||||||||
| Primary segments | ||||||||||||||||||||||||||
| UNITED KINGDOM | ||||||||||||||
 | Highlights (changes in constant euros) | |||||||||||||
| We continue to support our customers while actively managing our business and are confident in the resilience of our balance sheet with prudent approach to risk, liquidity and cautious business growth, positioning us well for recovery post COVID-19 crisis. | ||||||||||||||
•Our results and business performance for the first half of 2020 were materially impacted by the crisis. Net operating income fell 25% to EUR 707 million affected by pressures on income driven by lower interest rates and overdraft fee income, as costs decreased 5%. •Underlying attributable profit was down 76% mainly due to COVID-19 related impairment charges. | ||||||||||||||
| EUR 139 Mn | ||||||||||||||
| Underlying attributable profit | ||||||||||||||
Commercial activity
We continue to focus on building stronger customer relationships and a seamless customer experience. As a result, the proportion of loyal customers to active customers continued to grow year-on-year and digital customers now exceed 6 million. We are supporting our retail and corporate customers to help them bridge COVID-19 uncertainty. We helped over 238,000 mortgage customers with a payment holiday (around GBP 37 bn) and over 115,000 small and large business customers with various COVID-19 loan facilities (around GBP 3.5 bn).
Net mortgage lending of GBP 2 bn year-to-date, with strong first quarter growth partially offset by limited new mortgage inflows during the second quarter due to UK market lockdown. Corporate lending was up GBP 4.6 bn, almost exclusively driven by our lending through COVID-19 related government schemes.
Our strategic transformation programme, which commenced in 2019, with the aim to simplify and digitalise the business is regaining momentum.
Business performance
Gross loans and advances to customers (excluding reverse repos) increased 4% compared to June 2019, driven mainly by mortgages and the aforementioned flows in corporates.
Customer funds (excluding repos) were 5% greater year-on-year, with both Retail Banking and corporate deposits up.
Results
Underlying attributable profit in the first six months of 2020 of EUR 139 million, down 76% year-on-year (in constant euros):
•Total income was down 13%, impacted by base rate reductions and reduced fee income driven from lower activity and regulatory changes. This was partially offset by the 50 bps reduction in the 1I2I3 current account remuneration in May, and will benefit from a further 40 bps cut in August.
•Costs reduced 5%, reflecting efficiency savings from our transformation programme.
•Loan-loss provisions increased five-fold, driven by COVID-19 related impairment charges, from a very low base. The cost of credit remained at low levels (23 bps) and the NPL ratio decreased year-on-year to 1.08% despite a pick-up in the quarter, supported by our prudent approach to risk management.
In the second quarter of 2020, underlying attributable profit was EUR 54 million, impacted particularly by increased provisions and reduced fee income.
| Customers | ||||||||||||||||||||
| June 2020. Thousands | ||||||||||||||||||||
| Loyal customers | Digital customers | |||||||||||||||||||
| 4,483 | | 6,074 | |||||||||||||||||
| +31 | % | /active customers | +7 | % | YoY | |||||||||||||||
| Activity | ||||||||||||||||||||||||||||||||||||||||||||||||||||||||||||||
| June 2020. EUR billion and % change in constant euros | ||||||||||||||||||||||||||||||||||||||||||||||||||||||||||||||
| 0% | +4% | |||||||||||||||||||||||||||||||||||||||||||||||||||||||||||||
| QoQ | QoQ | |||||||||||||||||||||||||||||||||||||||||||||||||||||||||||||
| 238 | 213 | |||||||||||||||||||||||||||||||||||||||||||||||||||||||||||||
| +4% | +5% | |||||||||||||||||||||||||||||||||||||||||||||||||||||||||||||
| YoY | YoY | |||||||||||||||||||||||||||||||||||||||||||||||||||||||||||||
| Gross loans and advances to customers excl. reverse repos | Customer deposits excl. repos + mutual funds | |||||||||||||||||||||||||||||||||||||||||||||||||||||||||||||
| Underlying income statement | ||||||||||||||||||||||||||||||||
| EUR million and % change in constant euros | ||||||||||||||||||||||||||||||||
| Q2'20 | / Q1'20 | H1'20 | / H1'19 | |||||||||||||||||||||||||||||
| Revenue | 979 | -8 | % | 2,077 | -13 | % | ||||||||||||||||||||||||||
| Expenses | -656 | -5 | % | -1,370 | -5 | % | ||||||||||||||||||||||||||
| Net operating income | 323 | -13 | % | 707 | -25 | % | ||||||||||||||||||||||||||
| LLPs | -239 | +28 | % | -430 | +437 | % | ||||||||||||||||||||||||||
| PBT | 80 | -31 | % | 198 | -75 | % | ||||||||||||||||||||||||||
| Underlying attrib. profit | 54 | -33 | % | 139 | -76 | % | ||||||||||||||||||||||||||
January - June 2020 | | 33 | ||||||
Business model | ||||||||||||||||||||||||||
| Primary segments | ||||||||||||||||||||||||||
| PORTUGAL | ||||||||||||||
 | Highlights | |||||||||||||
| The Bank adopted a set of measures to support its customers and the economy to tackle the pandemic, including the suspension of fees on digital payments; payment holidays on mortgages, consumer and business loans; and the participation in state-guaranteed credit lines for businesses. | ||||||||||||||
•The Bank's support to the economy was reflected in new lending market shares, of more than 20% in corporate loans and mortgages. •Santander was named Best Bank in Portugal 2020 by Global Finance and maintained the best risk ratings by the rating agencies, aligned with or above the sovereign’s. •Underlying attributable profit decreased 39% year-on-year, as lower costs could not offset the impact of COVID-19 on income and provisions. Net operating income fell 7%. | ||||||||||||||
| EUR 160 Mn | ||||||||||||||
| Underlying attributable profit | ||||||||||||||
Commercial activity
In the health crisis environment, the Bank adapted its product and service offering to customer needs:
•The commercial network's activity was maintained, with the majority of our branches remaining open during the state of emergency (19 March to 2 May), and a strategy oriented towards the use of digital channels by customers, which resulted in an increase in digital sales (now account for 37% of the total) and year-on-year growth in digital customers.
•Adoption of measures to support our customers, such as temporary suspension of fees for payment methods, a six-month payment holiday on loans to individuals, households and businesses, and a rapid participation in credit lines set up by the government to support businesses.
•In addition, our transformation strategy remained unchanged, with Mundo 1|2|3 being the main customer loyalty driver.
Business performance
Gross loans and advances to customers (excluding reverse repos) rose 4% year-on-year, backed by growth in SMEs loans.
Customer funds (excluding repos) were 3% higher year-on-year driven by growth in demand deposits.
Results
The first half underlying attributable profit decreased 39% year-on-year to EUR 160 million:
•Total income fell 6%. Net interest income was 7% lower (dampened by low interest rates) and net fee income dropped 3%, impacted by the temporary suspension of fees for digital payments and lower activity in payment methods, insurance and credit. Gains on financial transactions remained unchanged and other operating income fell by EUR 8 million impacted by lower activity in insurance and the higher contribution to the SRF.
•Costs continued to fall (-5%), with an efficiency ratio of 44%.
•As a result, net operating income declined 7%.
•Higher provisions for possible future impacts of the pandemic, raising the cost of credit to 0.30%. The NPL ratio fell to 4.43% mitigated by holiday payments.
Compared to the previous quarter, underlying attributable profit increased 35% mainly due to the COVID-19 related provisions recorded in the first quarter.
| Customers | ||||||||||||||||||||
| June 2020. Thousands | ||||||||||||||||||||
| Loyal customers | Digital customers | |||||||||||||||||||
| 783 | | 866 | |||||||||||||||||
| 46 | % | /active customers | +14 | % | YoY | |||||||||||||||
| Activity | ||||||||||||||||||||||||||||||||||||||||||||||||||||||||||||||
| June 2020. EUR billion and % change | ||||||||||||||||||||||||||||||||||||||||||||||||||||||||||||||
| +3% | ||||||||||||||||||||||||||||||||||||||||||||||||||||||||||||||
| +2% | QoQ | |||||||||||||||||||||||||||||||||||||||||||||||||||||||||||||
| QoQ | ||||||||||||||||||||||||||||||||||||||||||||||||||||||||||||||
| 38 | 43 | |||||||||||||||||||||||||||||||||||||||||||||||||||||||||||||
| +4% | +3% | |||||||||||||||||||||||||||||||||||||||||||||||||||||||||||||
| YoY | YoY | |||||||||||||||||||||||||||||||||||||||||||||||||||||||||||||
| Gross loans and advances to customers excl. reverse repos | Customer deposits excl. repos + mutual funds | |||||||||||||||||||||||||||||||||||||||||||||||||||||||||||||
| Underlying income statement | ||||||||||||||||||||||||||||||||
| EUR million and % change | ||||||||||||||||||||||||||||||||
| Q2'20 | / Q1'20 | H1'20 | / H1'19 | |||||||||||||||||||||||||||||
| Revenue | 317 | -9 | % | 668 | -6 | % | ||||||||||||||||||||||||||
| Expenses | -145 | -4 | % | -296 | -5 | % | ||||||||||||||||||||||||||
| Net operating income | 172 | -13 | % | 372 | -7 | % | ||||||||||||||||||||||||||
| LLPs | -24 | -70 | % | -105 | — | |||||||||||||||||||||||||||
| PBT | 132 | +35 | % | 230 | -39 | % | ||||||||||||||||||||||||||
| Underlying attrib. profit | 92 | +35 | % | 160 | -39 | % | ||||||||||||||||||||||||||
| 34 | | January - June 2020 | ||||||
Business model | ||||||||||||||||||||||||||
| Primary segments | ||||||||||||||||||||||||||
| POLAND | ||||||||||||||
 | Highlights (changes in constant euros) | |||||||||||||
| In addition to the actions to protect customers and employees, the main management focus is on customer relationships, maximising business income and cost management in the difficult environment arising from lockdown restrictions related to the COVID-19 outbreak. | ||||||||||||||
•Santander Bank Polska is the third largest bank in Poland in terms of assets as of March 2020. •Underlying attributable profit was EUR 73 million, down 50% year-on-year, impacted by the COVID-19 outbreak, significant official interest rate cuts, and the greater BFG contributions, partially offset by cost improvements. Net operating income was 6% lower. | ||||||||||||||
| EUR 73 Mn | ||||||||||||||
| Underlying attributable profit | ||||||||||||||
Commercial activity
During the pandemic, the Bank took several actions to protect customers from the economic consequences derived from COVID-19, such as the suspension of capital instalments for cash loans, mortgages and SME loans.
In January and February 2020, the Bank recorded strong sales growth, including digital sales. Business in March showed signs of a slowdown due to the COVID-19 crisis but began to recover in mid-April.
In the second quarter, we launched new products and processes in order to boost remote sales in a wide range of products, including personal loans and credit protection insurance, among others. We also simplified the application process for overdrafts through online channels and mobile platforms, and reinforced our product offering in health and life insurances as a opportunity to further bancassurance growth.
Santander Bank Polska was the only bank in Poland to receive an award from Euromoney for the actions taken for the benefit of its customers and society during the COVID-19 pandemic.
Business performance
•Gross loans and advances to customers (excluding reverse repos) rose 4% year-on-year, driven by all the Bank’s target segments. Strong volume growth in individuals (+6%) and cash loans (+13%), while SMEs and corporates fell 3%. On a quarterly basis, loans fell 2% impacted by the decreases in SMEs, corporates and CIB.
•Deposits grew 13% year-on-year, boosted by SME deposits (+56%) and business and commercial banking deposits (+22%). CIB’s deposit base showed an annual decrease of 22%. The Group continued to actively manage deposits to optimise the cost of funding.
Results
Underlying attributable profit in the first half was EUR 73 million, 50% lower than in the same period of 2019. By line:
•Revenue down 7%, with a slight drop in net interest income (growth in volumes offset interest rate cuts and a one-off provision recorded due to the CJEU ruling regarding consumer loans), but mainly due to the decline in net fee income (lower customer transactionality), higher BFG contribution and lower gains on financial transactions.
•Net operating income was 6% lower, as the revenue decrease was partially mitigated by a better performance in costs (-8%), mainly due to personnel expenses.
•Loan-loss provisions increased 77% year-on-year, mainly due to the impact of the COVID-19 crisis, together with the revision of risk parameters and a one-off charge.
Compared to the previous quarter, underlying attributable profit increased strongly, favoured by lower LLPs, cost reduction and lower contributions to regulatory funds.
| Customers | ||||||||||||||||||||
| June 2020. Thousands | ||||||||||||||||||||
| Loyal customers | Digital customers | |||||||||||||||||||
| 2,026 | | 2,635 | |||||||||||||||||
| 53 | % | /active customers | +9 | % | YoY | |||||||||||||||
| Activity | ||||||||||||||||||||||||||||||||||||||||||||||||||||||||||||||
| June 2020. EUR billion and % change in constant euros | ||||||||||||||||||||||||||||||||||||||||||||||||||||||||||||||
| -2% | +6% | |||||||||||||||||||||||||||||||||||||||||||||||||||||||||||||
| QoQ | QoQ | |||||||||||||||||||||||||||||||||||||||||||||||||||||||||||||
| 30 | 38 | |||||||||||||||||||||||||||||||||||||||||||||||||||||||||||||
| +4% | +9% | |||||||||||||||||||||||||||||||||||||||||||||||||||||||||||||
| YoY | YoY | |||||||||||||||||||||||||||||||||||||||||||||||||||||||||||||
| Gross loans and advances to customers excl. reverse repos | Customer deposits excl. repos + mutual funds | |||||||||||||||||||||||||||||||||||||||||||||||||||||||||||||
| Underlying income statement | ||||||||||||||||||||||||||||||||
| EUR million and % change in constant euros | ||||||||||||||||||||||||||||||||
| Q2'20 | / Q1'20 | H1'20 | / H1'19 | |||||||||||||||||||||||||||||
| Revenue | 377 | +8 | % | 742 | -7 | % | ||||||||||||||||||||||||||
| Expenses | -143 | -13 | % | -315 | -8 | % | ||||||||||||||||||||||||||
| Net operating income | 235 | +26 | % | 428 | -6 | % | ||||||||||||||||||||||||||
| LLPs | -89 | -3 | % | -184 | +77 | % | ||||||||||||||||||||||||||
| PBT | 105 | +76 | % | 167 | -41 | % | ||||||||||||||||||||||||||
| Underlying attrib. profit | 51 | +130 | % | 73 | -50 | % | ||||||||||||||||||||||||||
January - June 2020 | | 35 | ||||||
Business model | ||||||||||||||||||||||||||
| Primary segments | ||||||||||||||||||||||||||
| NORTH AMERICA | ||||||||
 | Highlights (changes in constant euros) •In North America, the US and Mexico are managed according to their local strategic priorities, while increasing coordination and cooperation between the two units. In the quarter, mitigation programmes were launched as a measure to support customers in response to the COVID-19 pandemic. •In volumes, double-digit year-on-year volume growth, both in gross loans and advances to customers and in customer funds. •In results, underlying attributable profit decreased 29% year-on-year, driven by higher provisions in Santander Bank (SBNA) and in the auto business in Santander Consumer USA (SC USA). Before provisions, total income remained stable and net operating income increased by 2%. | |||||||
| EUR 617 Mn | ||||||||
| Underlying attributable profit | ||||||||
Strategy
In the US, SBNA's strategy focuses on improving customer satisfaction through digital channels and branches, while continuing to develop the Lead Bank initiative in corporate banking. In SC USA, focus is on managing the relation between profitability, through pricing, and risk, while improving the dealer experience. In Mexico, we remained focused on strengthening the distribution network and developing digital channels with the aim to attract customers and increase loyalty.
Coordination between the countries further increased as we continue to pursue join initiatives, such as:
•Continued development of the USMX trade corridor. SCIB and Commercial Banking are working to deepen relationships with existing clients and increase client acquisition in both countries, which is reflected in corridor revenue growth (SCIB: +19%; Commercial: +16%).
•Commission-free same-day remittance service from Santander US branches to any bank in Mexico. At the same time, ongoing development of other payment alternatives for the USMX trade corridor, such as PagoFX.
•Joint technology programmes between the two countries: operations know-how, digitalisation, hubs, front-office and back-office, and addressing common challenges in both countries.
Business performance
Gross loans and advances to customers (excluding reverse repos) increased 11% with similar growth in both countries.
Customer funds (excluding repos) also presented a solid year-on-year performance (+18%) driven by growth in demand deposits in SBNA, corporate deposits in the New York branch and deposits in Mexico. This growth in deposits reflects the high level of liquidity in the system and the positive performance of our customer attraction and loyalty strategy. Mutual funds rose 4%.
Results
In the first half of the year, underlying attributable profit amounted to EUR 617 million, 29% lower year-on-year:
•Net interest income remained stable driven by volume growth, and net fee income declined (-2%) affected by the lower activity in consumer banking.
•Costs decreased slightly, enabling the efficiency ratio to improve to 41% despite the increase in amortisations and technology investment. Net operating income rose 2%.
•LLPs grew mainly due to COVID-19 related provisions. The NPL ratio improved to 1.73% and coverage was higher at 207%. The cost of credit increased to 3.21%.
Compared to the first quarter, underlying attributable profit surged 33% through higher gains on financial transactions in Mexico, reduced minority interests in SC USA and lower provisions in both SBNA and SC USA.
| Customers | ||||||||||||||||||||
| June 2020. Thousands | ||||||||||||||||||||
| Loyal customers | Digital customers | |||||||||||||||||||
| 3,681 | | 5,658 | |||||||||||||||||
| 33 | % | /active customers | +26 | % | YoY | |||||||||||||||
| Activity | ||||||||||||||||||||||||||||||||||||||||||||||||||||||||||||||
| June 2020. EUR billion and % change in constant euros | ||||||||||||||||||||||||||||||||||||||||||||||||||||||||||||||
| +1% | ||||||||||||||||||||||||||||||||||||||||||||||||||||||||||||||
| QoQ | +6% | |||||||||||||||||||||||||||||||||||||||||||||||||||||||||||||
| QoQ | ||||||||||||||||||||||||||||||||||||||||||||||||||||||||||||||
| 131 | 125 | |||||||||||||||||||||||||||||||||||||||||||||||||||||||||||||
| +11% | +18% | |||||||||||||||||||||||||||||||||||||||||||||||||||||||||||||
| YoY | YoY | |||||||||||||||||||||||||||||||||||||||||||||||||||||||||||||
| Gross loans and advances to customers excl. reverse repos | Customer deposits excl. repos + mutual funds | |||||||||||||||||||||||||||||||||||||||||||||||||||||||||||||
| Underlying income statement | ||||||||||||||||||||||||||||||||
| EUR million and % change in constant euros | ||||||||||||||||||||||||||||||||
| Q2'20 | / Q1'20 | H1'20 | / H1'19 | |||||||||||||||||||||||||||||
| Revenue | 2,706 | -3 | % | 5,642 | +1 | % | ||||||||||||||||||||||||||
| Expenses | -1,117 | -4 | % | -2,341 | -1 | % | ||||||||||||||||||||||||||
| Net operating income | 1,589 | -2 | % | 3,301 | +2 | % | ||||||||||||||||||||||||||
| LLPs | -1,123 | -7 | % | -2,368 | +49 | % | ||||||||||||||||||||||||||
| PBT | 430 | +5 | % | 883 | -43 | % | ||||||||||||||||||||||||||
| Underlying attrib. profit | 336 | +33 | % | 617 | -29 | % | ||||||||||||||||||||||||||
| 36 | | January - June 2020 | ||||||
Business model | ||||||||||||||||||||||||||
| Primary segments | ||||||||||||||||||||||||||
| UNITED STATES | ||||||||||||||
 | Highlights (changes in constant euros) | |||||||||||||
| We remain focused on helping our customers prosper while transforming the business. During the COVID-19 pandemic, Santander US has remained committed to supporting customers and safeguarding its employees while maintaining strong capital and liquidity. | ||||||||||||||
•In volumes, the improved year-on-year trend in gross loans and advances to customers excluding reverse repos continued to increase revenue but these benefits were offset by the impact of lower rates. •Underlying attributable profit decreased 56% compared to the first half of 2019 primarily due to the COVID-19 impact on provisions. Net operating income down only 3%. | ||||||||||||||
| EUR 211 Mn | ||||||||||||||
| Underlying attributable profit | ||||||||||||||
Commercial activity
During the COVID-19 crisis, Santander US remains focused on supporting its customers, employees and communities while pursuing its strategic priorities:
•Santander Bank: continuing the digital and branch transformation initiatives remains key to enhancing customer experience and growing core customers and deposits. SBNA continues to enhance its auto finance partnership with SC USA focused on Prime loans.
•Santander Consumer USA: disciplined originations through its dealer network, enhancing its partnership with Fiat Chrysler and Santander Bank.
Business performance
Gross loans and advances to customers (excluding reverse repos) improved around 11% year-on-year due to lending growth in retail banking (auto), commercial banking, CIB and originations through the Paycheck Protection Program supported by the Small Business Administration.
In Santander Consumer USA, originations declined in March and April, but have recovered later in the quarter driven by FCA incentive programmes. On the prime side, originations are being supported by these programmes, which are generally exclusive to Chrysler Capital. As incentivised programmes drove consumer demand, prime loan originations and our FCA penetration rates continued to increase in the second quarter.
Customer funds (excluding repos) presented a strong growth year-on-year (+23%) boosted by demand deposits at SBNA and corporate deposits at both the New York branch and SBNA.
Results
Underlying attributable profit in the first half of 2020 was EUR 211 million euro, down 56% against the same period of 2019.
•Total income down 3% due to lower rate environment, lower lease income, and lower fees impacted by COVID-19, partially offset by higher loan volumes, gains at SBNA, and strong performance in Capital Markets and Wealth Management.
•Net operating income is down 3%, as the reduction in costs was not enough to offset total income decrease.
•Loan-loss provisions increased 49% due to COVID-19 impact and lower recoveries.
Compared to the previous quarter, underlying attributable profit was 150% higher due to lower costs, loan-loss provisions and reduced minority interests.
| Customers | ||||||||||||||||||||
| June 2020. Thousands | ||||||||||||||||||||
| Loyal customers | Digital customers | |||||||||||||||||||
| 368 | | 1,052 | |||||||||||||||||
| 21 | % | /active customers | +7 | % | YoY | |||||||||||||||
| Activity | ||||||||||||||||||||||||||||||||||||||||||||||||||||||||||||||
| June 2020. EUR billion and % change in constant euros | ||||||||||||||||||||||||||||||||||||||||||||||||||||||||||||||
| +2% | ||||||||||||||||||||||||||||||||||||||||||||||||||||||||||||||
| QoQ | +8% | |||||||||||||||||||||||||||||||||||||||||||||||||||||||||||||
| QoQ | ||||||||||||||||||||||||||||||||||||||||||||||||||||||||||||||
| 101 | 87 | |||||||||||||||||||||||||||||||||||||||||||||||||||||||||||||
| +11% | +23% | |||||||||||||||||||||||||||||||||||||||||||||||||||||||||||||
| YoY | YoY | |||||||||||||||||||||||||||||||||||||||||||||||||||||||||||||
| Gross loans and advances to customers excl. reverse repos | Customer deposits excl. repos + mutual funds | |||||||||||||||||||||||||||||||||||||||||||||||||||||||||||||
| Underlying income statement | ||||||||||||||||||||||||||||||||
| EUR million and % change in constant euros | ||||||||||||||||||||||||||||||||
| Q2'20 | / Q1'20 | H1'20 | / H1'19 | |||||||||||||||||||||||||||||
| Revenue | 1,801 | -7 | % | 3,730 | -3 | % | ||||||||||||||||||||||||||
| Expenses | -776 | -4 | % | -1,585 | -2 | % | ||||||||||||||||||||||||||
| Net operating income | 1,024 | -9 | % | 2,144 | -3 | % | ||||||||||||||||||||||||||
| LLPs | -832 | -15 | % | -1,804 | +49 | % | ||||||||||||||||||||||||||
| PBT | 163 | +16 | % | 305 | -67 | % | ||||||||||||||||||||||||||
| Underlying attrib. profit | 151 | +150 | % | 211 | -56 | % | ||||||||||||||||||||||||||
January - June 2020 | | 37 | ||||||
Business model | ||||||||||||||||||||||||||
| Primary segments | ||||||||||||||||||||||||||
| MEXICO | ||||||||||||||
 | Highlights (changes in constant euros) | |||||||||||||
| The Bank continued with its debtor support programme in the quarter, aimed at individuals and SMEs. In addition, most branches continued to operate with reduced staff. Digital channels and contact centres continued operating normally. | ||||||||||||||
•Gross loans and advances to customers (excluding reverse repos) increased 9% year-on-year, particularly corporates, CIB and mortgages. Customer funds rose also 9%. •Underlying attributable profit rose 4% year-on-year, backed by the sound performance of net interest income, gains on financial transactions and reduced non-controlling interests, which offset higher provisions. Net operating income rose 11%. | ||||||||||||||
| EUR 406 Mn | ||||||||||||||
| Underlying attributable profit | ||||||||||||||
Commercial activity
The commercial strategy continued to focus on improving the distribution model and boosting digital channels to increase customer attraction and loyalty with new products and services:
•We further developed our distribution model with the transformation of 566 branches and 1,161 full function ATMs.
•Santander Plus reached 7.1 million customers (53% new).
•We continued with the payment deferral programme to customers with mortgage, auto, payroll, personal or credit card loans and SMEs.
•We channelled Federal Government loans to small enterprises through Tuiio, without charging any fees. As of June, 136,219 loans were distributed.
•Launch of two new insurance policies, Hospitalización which provides coverage for COVID-19 and Blindaje total which covers fraud on any credit card.
•We rolled out e-SPUG, an innovative system to help stores and private sellers process distance selling in a simple, agile and safe way.
•Focused on our customer security, we marketed credit cards with a QR code which can only be scanned in Super Wallet.
Business performance
Gross loans and advances to customers (excluding reverse repos) increased 9% year-on-year. Of note were corporate loans (+14%) and CIB (+17%). Individuals rose 3%, driven by mortgages (+12%). Conversely, falls were recorded in credit cards (-1%), impacted by lower activity arising from the lockdown measures due to the pandemic.
Customer funds (excluding repos) also increased 9%. Demand deposits were 11% higher, with growth in individuals (+23%) and time deposits rose 16%. Mutual funds declined 1%.
Results
Underlying attributable profit in the first half was of EUR 406 million, 4% higher than in the same period of 2019:
•Net interest income rose 2%, underpinned by higher volumes. Net fee income increased 2% mainly from transactional fees and gains on financial transactions increased driven by market volatility management combined with lower activity in the first half of 2019.
•Operating expenses improved their trend (+2%), with net operating income increasing 11%.
•Loan-loss provisions surged 47% due to COVID-19 related provisions recorded in the first half of the year.
Compared to the first quarter of 2020, underlying attributable profit fell 1% dampened by higher loan-loss provisions, as total income rose 5% and net operating income 11%.
| Customers | ||||||||||||||||||||
| June 2020. Thousands | ||||||||||||||||||||
| Loyal customers | Digital customers | |||||||||||||||||||
| 3,313 | | 4,606 | |||||||||||||||||
| 35 | % | /active customers | +31 | % | YoY | |||||||||||||||
| Activity | ||||||||||||||||||||||||||||||||||||||||||||||||||||||||||||||
| June 2020. EUR billion and % change in constant euros | ||||||||||||||||||||||||||||||||||||||||||||||||||||||||||||||
| 0% | ||||||||||||||||||||||||||||||||||||||||||||||||||||||||||||||
| -2% | QoQ | |||||||||||||||||||||||||||||||||||||||||||||||||||||||||||||
| QoQ | ||||||||||||||||||||||||||||||||||||||||||||||||||||||||||||||
| 30 | 38 | |||||||||||||||||||||||||||||||||||||||||||||||||||||||||||||
| +9% | +9% | |||||||||||||||||||||||||||||||||||||||||||||||||||||||||||||
| YoY | YoY | |||||||||||||||||||||||||||||||||||||||||||||||||||||||||||||
| Gross loans and advances to customers excl. reverse repos | Customer deposits excl. repos + mutual funds | |||||||||||||||||||||||||||||||||||||||||||||||||||||||||||||
| Underlying income statement | ||||||||||||||||||||||||||||||||
| EUR million and % change in constant euros | ||||||||||||||||||||||||||||||||
| Q2'20 | / Q1'20 | H1'20 | / H1'19 | |||||||||||||||||||||||||||||
| Revenue | 905 | +5 | % | 1,912 | +8 | % | ||||||||||||||||||||||||||
| Expenses | -341 | -4 | % | -756 | +2 | % | ||||||||||||||||||||||||||
| Net operating income | 565 | +11 | % | 1,156 | +11 | % | ||||||||||||||||||||||||||
| LLPs | -291 | +23 | % | -564 | +47 | % | ||||||||||||||||||||||||||
| PBT | 267 | 0 | % | 578 | -10 | % | ||||||||||||||||||||||||||
| Underlying attrib. profit | 186 | -1 | % | 406 | +4 | % | ||||||||||||||||||||||||||
| 38 | | January - June 2020 | ||||||
Business model | ||||||||||||||||||||||||||
| Primary segments | ||||||||||||||||||||||||||
| SOUTH AMERICA | ||||||||
 | Highlights (changes in constant euros) •Work protocols were established in all countries to protect our employees' safety, making products available to customers in order to guarantee the necessary financial support, maintaining quality of service and reinforcing our commitment to society. •We continued to progress on our strategy of becoming a more connected region capable of capturing business opportunities, focused on improving customer experience and loyalty as well as delivering profitable growth backed by operational excellence and cost and risk control. •Underlying attributable profit in the first half was affected by COVID-19 related provisions. Net operating income increased by 8% year-on-year backed by net interest income, gains on financial transactions and efficiency improvement. | |||||||
| EUR 1,383 Mn | ||||||||
| Underlying attributable profit | ||||||||
Strategy
We continued to identify growth opportunities across business units to capture synergies:
•During the second quarter we launched products and services for our customers to mitigate the effects of the pandemic. Brazil, Argentina and Chile focused on loans to businesses that could guarantee the continuity of their activity. Uruguay and Brazil also focused on relief policies and the renegotiation of loans to customers, as well as strengthening the risk and recovery teams. In Colombia, relief plans were offered for payment instalments, guaranteed by the Government.
•In payment methods, we focused on e-commerce strategies and instant transfers. In Brazil, we launched initiatives to strengthen e-commerce sales, recording strong annual growth in turnover through this channel. As a result, we are expanding the acquiring business in Brazil to other Latin American countries. On the other hand, continued positive performance of Superdigital and Santander Life in Chile.
•We continued with our strategy of expanding the financial entity specialised in consumer credit and auto financing across the region, exporting the experience in Brazil. However, in the quarter they were affected by the fall in vehicle sales derived from the lockdown measures in some countries.
•Prospera, our micro-credit programme to cover the demand of small businesses in Brazil, continued expand in Uruguay as well.
•We remained focused on the digital transformation of our processes and products and channel optimisation.
Business performance
Gross loans and advances to customers (excluding reverse repos) increased 18% year-on-year, with double-digit growth in all countries.
Customer funds (excluding repos) rose 18%, growing at double-digit rates in both demand and time deposits in all countries.
Results
Underlying attributable profit in the first half amounted to EUR 1,383 million, down 13% year-on-year:
•Total income increased 7%, underpinned by the sound performance of net interest income (+6%) and gains on financial transactions (+87%).
•Costs rose at a slower pace than income, enabling efficiency to improve 107 bps to 35.2% and net operating income to increase 8%.
•Provisions increased 63% driven by COVID-19 related provisions. In credit quality, the NPL ratio stood at 4.74%, coverage was 93% and cost of credit of 3.49%.
In the quarter, underlying attributable profit was 14% higher driven by total income, cost control and lower provisions.
| Customers | ||||||||||||||||||||
| June 2020. Thousands | ||||||||||||||||||||
| Loyal customers | Digital customers | |||||||||||||||||||
| 7,766 | | 18,767 | |||||||||||||||||
| 25 | % | /active customers | +15 | % | YoY | |||||||||||||||
| Activity | ||||||||||||||||||||||||||||||||||||||||||||||||||||||||||||||
| June 2020. EUR billion and % change in constant euros | ||||||||||||||||||||||||||||||||||||||||||||||||||||||||||||||
| +7% | ||||||||||||||||||||||||||||||||||||||||||||||||||||||||||||||
| +3% | QoQ | |||||||||||||||||||||||||||||||||||||||||||||||||||||||||||||
| QoQ | ||||||||||||||||||||||||||||||||||||||||||||||||||||||||||||||
| 116 | 150 | |||||||||||||||||||||||||||||||||||||||||||||||||||||||||||||
| +18% | +18% | |||||||||||||||||||||||||||||||||||||||||||||||||||||||||||||
| YoY | YoY | |||||||||||||||||||||||||||||||||||||||||||||||||||||||||||||
| Gross loans and advances to customers excl. reverse repos | Customer deposits excl. repos + mutual funds | |||||||||||||||||||||||||||||||||||||||||||||||||||||||||||||
| Underlying income statement | ||||||||||||||||||||||||||||||||
| EUR million and % change in constant euros | ||||||||||||||||||||||||||||||||
| Q2'20 | / Q1'20 | H1'20 | / H1'19 | |||||||||||||||||||||||||||||
| Revenue | 3,690 | +4 | % | 7,854 | +7 | % | ||||||||||||||||||||||||||
| Expenses | -1,275 | +1 | % | -2,761 | +5 | % | ||||||||||||||||||||||||||
| Net operating income | 2,416 | +6 | % | 5,093 | +8 | % | ||||||||||||||||||||||||||
| LLPs | -1,110 | -1 | % | -2,435 | +63 | % | ||||||||||||||||||||||||||
| PBT | 1,254 | +20 | % | 2,465 | -17 | % | ||||||||||||||||||||||||||
| Underlying attrib. profit | 685 | +14 | % | 1,383 | -13 | % | ||||||||||||||||||||||||||
January - June 2020 | | 39 | ||||||
Business model | ||||||||||||||||||||||||||
| Primary segments | ||||||||||||||||||||||||||
| BRAZIL | ||||||||||||||
 | Highlights (changes in constant euros) | |||||||||||||
| Our business model and the strength of our balance sheet enabled us to adapt quickly to the new reality, supporting our employees, customers and society, while maintaining a high return for our shareholders. | ||||||||||||||
•Efforts to improve service to our customers were reflected in the increase of the NPS to record levels. •Double-digit year-on-year growth in lending, maintaining credit quality at controlled levels thanks to the continuous improvement of our risk model. •Underlying attributable profit was affected by COVID-19 related provisions, while net operating income rose 5% with a slight increase in net interest income, higher gains on financial transactions and efficiency improvement. | ||||||||||||||
| EUR 995 Mn | ||||||||||||||
| Underlying attributable profit | ||||||||||||||
Commercial activity
We continued to progress in our strategic actions in the quarter. Of note were:
•In acquiring, we carried out several actions related to POS, with attractive rental offers and additional supply to strengthen sales. In addition, we made a free online store available to customers for the first 60 days. All these initiatives contributed to the year-on-year income growth (+18%), reaching1.6 million POS and increasing the customer base 13%.
•In auto, we launched joint offers with Webmotors and created Car Delivery, where customers make a purchase in a partner store and the vehicle is delivered at their home. This initiative was possible thanks to our fully digital financing model.
•In mortgages, we led the market, reducing the rate to 6.99% and extended the mortgage payment holidays for another 60 days.
•In corporates, we focused on providing liquidity to our customers, granting loans with attractive terms and conditions, supported by different programmes approved by the authorities.
Additionally, we were one of the Best Companies to Work For in the women and ethnic-racial category according to GPTW to the Exame Diversidade 2020 Guide conducted by Exame and the Ethos Institute.
Business performance
Gross loans and advances to customers excluding reverse repos grew 18% year-on-year with increases in all segments. Of note were SMEs, corporates and CIB.
Customer deposits excluding repos increased 31% year-on-year, with rises in both demand deposits (+41%) and time deposits (+28%).
Results
First half underlying attributable profit of EUR 995 million (-17% year-on-year). Of note:
•Total income rose 4% boosted by net interest income (+1% driven by larger volumes which offset margin pressures due to the change in mix) and higher gains on financial transactions. Net fee income fell 2% affected by the current environment.
•Operating expenses increased less than 2%, which enabled net operating income to rise 5% and the efficiency ratio to improve by 67 bps to 31.8%.
•Net loan-loss provisions increased 60%, due to provisions related to the health crisis, although maintaining credit quality at controlled levels: the NPL ratio improved 20 bps to 5.07%, the cost of credit was 4.67%, and the coverage ratio stood at 110%.
In the quarter, underlying attributable profit rose 11% driven by cost control and lower provisions, and higher gains on financial transactions.
| Customers | ||||||||||||||||||||
| June 2020. Thousands | ||||||||||||||||||||
| Loyal customers | Digital customers | |||||||||||||||||||
| 5,671 | | 14,492 | |||||||||||||||||
| 22 | % | /active customers | +14 | % | YoY | |||||||||||||||
| Activity | ||||||||||||||||||||||||||||||||||||||||||||||||||||||||||||||
| June 2020. EUR billion and % change in constant euros | ||||||||||||||||||||||||||||||||||||||||||||||||||||||||||||||
| +7% | ||||||||||||||||||||||||||||||||||||||||||||||||||||||||||||||
| +2% | QoQ | |||||||||||||||||||||||||||||||||||||||||||||||||||||||||||||
| QoQ | ||||||||||||||||||||||||||||||||||||||||||||||||||||||||||||||
| 65 | 98 | |||||||||||||||||||||||||||||||||||||||||||||||||||||||||||||
| +18% | +14% | |||||||||||||||||||||||||||||||||||||||||||||||||||||||||||||
| YoY | YoY | |||||||||||||||||||||||||||||||||||||||||||||||||||||||||||||
| Gross loans and advances to customers excl. reverse repos | Customer deposits excl. repos + mutual funds | |||||||||||||||||||||||||||||||||||||||||||||||||||||||||||||
| Underlying income statement | ||||||||||||||||||||||||||||||||
| EUR million and % change in constant euros | ||||||||||||||||||||||||||||||||
| Q2'20 | / Q1'20 | H1'20 | / H1'19 | |||||||||||||||||||||||||||||
| Revenue | 2,651 | +2 | % | 5,788 | +4 | % | ||||||||||||||||||||||||||
| Expenses | -835 | 0 | % | -1,839 | +2 | % | ||||||||||||||||||||||||||
| Net operating income | 1,816 | +2 | % | 3,949 | +5 | % | ||||||||||||||||||||||||||
| LLPs | -843 | -4 | % | -1,909 | +60 | % | ||||||||||||||||||||||||||
| PBT | 942 | +19 | % | 1,881 | -19 | % | ||||||||||||||||||||||||||
| Underlying attrib. profit | 478 | +11 | % | 995 | -17 | % | ||||||||||||||||||||||||||
| 40 | | January - June 2020 | ||||||
Business model | ||||||||||||||||||||||||||
| Primary segments | ||||||||||||||||||||||||||
| CHILE | ||||||||||||||
 | Highlights (changes in constant euros) | |||||||||||||
| In response to the spread of COVID-19, Santander Chile carried out various measures to ensure the welfare of customers and employees. In the first case, we increased the plan to support to the consumer, mortgage, SME and business portfolios. In the latter case, we continued to encourage telecommuting. | ||||||||||||||
•Gross loans and advances to customers (excluding reverse repos) increased, with a positive performance of SMEs and corporates in the quarter. Demand deposits rose 39% year-on-year and growth in account openings continued, backed by Superdigital and Santander Life. •Underlying attributable profit decreased primarily due to COVID-19 related provisions. However, total income and net operating income rose 6% and 9%, respectively. | ||||||||||||||
| EUR 183 Mn | ||||||||||||||
| Underlying attributable profit | ||||||||||||||
Commercial activity
Continued focus on transformation in order to increase new customer attraction and loyalty, maintaining a strategy aimed at offering attractive returns based on our digital transformation:
•We continued to boost the Santander Life programme, which is centred on promoting good credit behaviour and financial education, reaching more than 190,000 customers.
•Since its recent launch, Superdigital has exceeded 70,000 customers because of its high transactionality and digital platform.
All these measures led to a strong year-on-year increase in digital customers (+15%).
Business performance
Gross loans and advances to customers (excluding reverse repos) increased 13% year-on-year, spurred by the increase in new lending with government guarantees to SMEs and working capital lines to corporates and large corporates in the quarter.
Customer funds (excluding repos) reflected a better funding mix. Demand deposits continued to rise strongly across all segments due to increased current account openings. As a result, customer funds grew 22% year-on-year.
Results
First six months attributable profit amounted to EUR 183 million, 31% lower year-on-year, as follows:
•Total income increased 6% year-on-year backed by net interest income and gains on financial transactions, which absorbed the fall in net fee income (reduced activity).
•Costs rose 3% driven by digital banking investments.
•The positive income and cost performance was reflected in an efficiency improvement of 146 bps to 40.3% and in an increase of 9% in net operating income.
•Loan-loss provisions increased 96% due to COVID-19 related charges, leading to an increase in the cost of credit (1.46%). The NPL ratio stood at 4.99%.
Compared to the first quarter of 2020, underlying attributable profit decreased 9%, as the increase in gains on financial transactions and cost control did not offset the increase in provisions and the higher tax burden.
| Customers | ||||||||||||||||||||
| June 2020. Thousands | ||||||||||||||||||||
| Loyal customers | Digital customers | |||||||||||||||||||
| 690 | | 1,339 | |||||||||||||||||
| 45 | % | /active customers | +15 | % | YoY | |||||||||||||||
| Activity | ||||||||||||||||||||||||||||||||||||||||||||||||||||||||||||||
| June 2020. EUR billion and % change in constant euros | ||||||||||||||||||||||||||||||||||||||||||||||||||||||||||||||
| +3% | +4% | |||||||||||||||||||||||||||||||||||||||||||||||||||||||||||||
| QoQ | QoQ | |||||||||||||||||||||||||||||||||||||||||||||||||||||||||||||
| 39 | 36 | |||||||||||||||||||||||||||||||||||||||||||||||||||||||||||||
| +13% | +22% | |||||||||||||||||||||||||||||||||||||||||||||||||||||||||||||
| YoY | YoY | |||||||||||||||||||||||||||||||||||||||||||||||||||||||||||||
| Gross loans and advances to customers excl. reverse repos | Customer deposits excl. repos + mutual funds | |||||||||||||||||||||||||||||||||||||||||||||||||||||||||||||
| Underlying income statement | ||||||||||||||||||||||||||||||||
| EUR million and % change in constant euros | ||||||||||||||||||||||||||||||||
| Q2'20 | / Q1'20 | H1'20 | / H1'19 | |||||||||||||||||||||||||||||
| Revenue | 584 | +8 | % | 1,137 | +6 | % | ||||||||||||||||||||||||||
| Expenses | -228 | +1 | % | -458 | +3 | % | ||||||||||||||||||||||||||
| Net operating income | 356 | +13 | % | 678 | +9 | % | ||||||||||||||||||||||||||
| LLPs | -183 | +14 | % | -346 | +96 | % | ||||||||||||||||||||||||||
| PBT | 171 | +9 | % | 331 | -31 | % | ||||||||||||||||||||||||||
| Underlying attrib. profit | 86 | -9 | % | 183 | -31 | % | ||||||||||||||||||||||||||
January - June 2020 | | 41 | ||||||
Business model | ||||||||||||||||||||||||||
| Primary segments | ||||||||||||||||||||||||||
| ARGENTINA | ||||||||||||||
 | Highlights (changes in constant euros) | |||||||||||||
| In the global pandemic environment, the Bank adopted protocols to look after the health of customers and employees, while maintaining service quality by prioritising investments in digital projects. | ||||||||||||||
•We continued to focus on the four strategic pillars: operational excellence, profitable growth, customer-centric strategy and culture and talent. •Underlying attributable profit reached EUR 109 million boosted by net interest income growth and efficiency improvement. | ||||||||||||||
| EUR 109 Mn | ||||||||||||||
| Underlying attributable profit | ||||||||||||||
Commercial activity
Santander focused on addressing the needs arising from the health crisis. To this end, we launched:
•Corporate credit lines for the acquisition of medical equipment, investment in telecommuting facilities and salary payments.
•White Account, a value proposition with additional benefits for healthcare professionals, who will also be treated as high-priority, and Seniors Account, which offers retired customers preferential service and specialist assistance.
•Overcome Together, a space that provides information and resources to help customers and non-customers deal with the crisis.
•Academia Salud, together with Swiss Medical Group, a fully digital training platform for health workers.
As regards the commercial strategy, we remained focused on transactional business and customer service, through the innovation and improvement of the customer care model, while working on the digital transformation of the main processes and products. This enabled us to increase digital sales and the issuance of electronic cheques.
Business performance
Gross loans and advances to customers (excluding reverse repos) rose 39% year-on-year, driven by SMEs, CIB and cards. Dollar balances declined in the currency of origin.
Customer deposits (excluding repos) rose 42% year-on-year spurred by local currency deposits (demand and time deposits), while foreign currency balances declined. The excess liquidity is placed in central bank notes.
Results
Underlying attributable profit in the first half of EUR 109 million (EUR 45 million in the first half of 2019). As regards the year-on-year comparison, of note was:
•Revenue grew 43%, underpinned by net interest income (+62%). Net fee income was affected by the current environment.
•Costs increased 29%, at a slower pace than total income, as cost management mitigated the high inflation environment and the peso’s depreciation. Net operating income rose 64% and the efficiency ratio improved to 54.0%, 587 bps better than in June 2019.
•Loan-loss provisions increased 52% due to the expected loss stemming from worsening activity due to the pandemic. The NPL ratio stood at 3.15% and coverage was 166%.
In the quarter, underlying attributable profit surged 159% mainly driven by net interest income and cost management.
| Customers | ||||||||||||||||||||
| June 2020. Thousands | ||||||||||||||||||||
| Loyal customers | Digital customers | |||||||||||||||||||
| 1,302 | | 2,557 | |||||||||||||||||
| 44 | % | /active customers | +20 | % | YoY | |||||||||||||||
| Activity | ||||||||||||||||||||||||||||||||||||||||||||||||||||||||||||||
| June 2020. EUR billion and % change in constant euros | ||||||||||||||||||||||||||||||||||||||||||||||||||||||||||||||
| +14% | ||||||||||||||||||||||||||||||||||||||||||||||||||||||||||||||
| +18% | QoQ | |||||||||||||||||||||||||||||||||||||||||||||||||||||||||||||
| QoQ | ||||||||||||||||||||||||||||||||||||||||||||||||||||||||||||||
| 5 | 10 | |||||||||||||||||||||||||||||||||||||||||||||||||||||||||||||
| +39% | +44% | |||||||||||||||||||||||||||||||||||||||||||||||||||||||||||||
| YoY | YoY | |||||||||||||||||||||||||||||||||||||||||||||||||||||||||||||
| Gross loans and advances to customers excl. reverse repos | Customer deposits excl. repos + mutual funds | |||||||||||||||||||||||||||||||||||||||||||||||||||||||||||||
| Underlying income statement | ||||||||||||||||||||||||||||||||
| EUR million and % change in constant euros | ||||||||||||||||||||||||||||||||
| Q2'20 | / Q1'20 | H1'20 | / H1'19 | |||||||||||||||||||||||||||||
| Revenue | 310 | +22 | % | 628 | +43 | % | ||||||||||||||||||||||||||
| Expenses | -153 | +5 | % | -339 | +29 | % | ||||||||||||||||||||||||||
| Net operating income | 157 | +47 | % | 289 | +64 | % | ||||||||||||||||||||||||||
| LLPs | -57 | -1 | % | -132 | +52 | % | ||||||||||||||||||||||||||
| PBT | 82 | +124 | % | 125 | +62 | % | ||||||||||||||||||||||||||
| Underlying attrib. profit | 75 | +159 | % | 109 | +144 | % | ||||||||||||||||||||||||||
| 42 | | January - June 2020 | ||||||
Business model | ||||||||||||||||||||||||||
| Primary segments | ||||||||||||||||||||||||||
Uruguay
Highlights (changes in constant euros)
•In the current environment and following the relaxation of risk policies by the Central Bank of Uruguay, we redefined our strategy focusing on generating relief and renegotiation policies for customers and on strengthening the risk and recovery teams.
•Underlying attributable profit rose 14% year-on-year, spurred by increased revenue and improved efficiency.
Commercial activity and business performance
Santander continued to focus on enhancing customer satisfaction and loyalty and making progress in the digital transformation and channel optimisation. These efforts were reflected in the 9% year-on-year increase in loyal customers, while transactions via digital channels rose 31%.
In line with our strategy of contributing to people’s progress, we continued to expand Prosperá and Santander Locker, a proposal that simplifies the delivery of our products to our customers. We continued to pursue commercial alliances through an agreement with the country's leading retail group, which places us in a unique position to offer discounts to our customers.
Regarding volumes, gross loans and advances to customer (excluding reverse repos) grew 18%. Customer deposits (excluding repos) grew 36% underpinned by both peso and foreign currency balances.
Results
Underlying attributable profit in the first half of 2020 of EUR 69 million, 14% higher year-on-year:
•Gross income rose 11%, backed by customer revenue and the positive performance of gains on financial transactions, due to exchange rate volatility.
•Costs grew at a slower pace than income, improving the efficiency ratio by 214 bps year-on-year. Net operating income increased 15%.
•Loan-loss provisions increased 43% due to two single names recorded in the second quarter and extraordinary recoveries recorded in the first quarter of 2019. Coverage remained high (117%) and cost of credit stood at 2.52%.
Compared to the first quarter of 2020, underlying attributable profit was up 3% underpinned by growth in net interest income and lower costs.
Peru
Highlights (changes in constant euros)
The strategy remained focused on the corporate segment, the country’s large companies and the Group’s global customers, with an increase in product and team capabilities.
The auto loan financial entity continued to expand its business within the Group’s strategy of increasing its presence in this business, underpinned by local teams and South America's best practices.
First half attributable profit amounted to EUR 24 million (+28% year-on-year). Total income rose 23% mainly due to the positive performance of net interest income, net fee income and higher gains on financial transactions, driven by increased customer and markets activity. On the other hand, costs increased 15% and loan-loss provisions were higher. In the quarter, underlying attributable profit reached EUR 12 million.
The NPL ratio was 0.71%, coverage remained high and cost of credit was 0.21%.
Colombia
Highlights (changes in constant euros)
Activity in Colombia remained focused on SCIB clients, large companies and corporates, contributing solutions in treasury, risk hedging, foreign trade, confirming, custody and development of investment banking products. In line with this strategy, SCIB acted as a joint bookrunner in the Republic of Colombia's USD 2.5 billion debt issue, with the lowest coupon in the country's history for a 30-year bond.
In the second quarter of 2020, we recorded a reduction in vehicle sales of more than 60% year-on-year derived from COVID-19. During this period, Santander Consumer improved its value offer, launching a new app for online loans and products such as Seguro de Marca and Plan de Financiación Inteligente o Residual.
In the quarter, we made the payment relief plans enabled by the government available to customers with active credit.
Underlying attributable profit in the first half of the year was EUR 10 million (EUR 4 million in the same period of 2019). Total income grew 67%, primarily backed by the strong growth of net fee income (mainly those collected in the first quarter from project finance) and net interest income (due to increased demand for liquidity from our corporate customers). Costs were 40% higher, the efficiency ratio stood at 49.8% and the cost of credit remained at low levels (0.78%).
January - June 2020 | | 43 | ||||||
Business model | ||||||||||||||||||||||||||
| Primary segments | ||||||||||||||||||||||||||
| CORPORATE CENTRE | ||||||||||||||||||||
 | Highlights | |||||||||||||||||||
| In the health crisis environment, the Corporate Centre continues to play a critical role in supporting the Group through the special situation committees. Also, starting in May, the progressive reincorporation of employees to the workplace began, with a mixture of on-site and remote working, always following government and health authorities recommendations, maintaining a high level of flexibility to meet individual needs. | ||||||||||||||||||||
•The Corporate Centre’s objective is to aid the operating units by contributing value and carrying out the corporate function of oversight and control. It also carries out functions related to financial and capital management. •The underlying attributable loss increased 2% compared to 2019, mainly due to higher provisions. | ||||||||||||||||||||
| EUR | -1,125 Mn | |||||||||||||||||||
| Underlying attributable profit | ||||||||||||||||||||
Strategy and functions
The Corporate Centre contributes value to the Group in various ways:
•Making the Group’s governance more solid, through global control frameworks and supervision.
•Fostering the exchange of best practices in management of costs and generating economies of scale. This enables us to be one of the most efficient banks.
•Contributing to the launch of projects that will be developed by our global businesses that leverage our worldwide presence to develop solutions once that can be used by all business units, generating economies of scale.
It also coordinates the relationship with European regulators and supervisors and develops functions related to financial and capital management, as follows:
•Financial Management functions:
–Structural management of liquidity risk associated with funding the Group’s recurring activity, stakes of a financial nature and management of net liquidity related to the needs of some business units.
–This activity is carried out by the different funding sources (issuances and other), always maintaining an adequate profile in volumes, maturities and costs. The price of these operations with other Group units is the market rate plus the premium which, in liquidity terms, the Group supports by immobilising funds during the term of the operation.
–Interest rate risk is also actively managed in order to soften the impact of interest rate changes on net interest income, conducted via high credit quality, very liquid and low capital consumption derivatives.
–Strategic management of the exposure to exchange rates in equity and dynamic in the countervalue of the units’ annual results in euros. Net investments in equity are currently covered by EUR 21,721 million (mainly Brazil, the UK, Mexico, Chile, the US, Poland and Norway) with different instruments (spot, fx, forwards).
•Management of total capital and reserves: efficient capital allocation to each of the units in order to maximise shareholder return.
Results
First half underlying attributable loss of EUR 1,125 million, 2% higher than in the same period of 2019 (EUR -1,108 million).
•Positive impact of EUR 249 million in gains on financial transactions mainly due to foreign currency hedging.
•On the other hand, the positive trend in operating expenses continued, improving 14% compared to the first half of 2019, driven by ongoing streamlining and simplification measures.
•Other results and provisions increased strongly due to one-off provisions for certain stakes whose value was affected by the crisis.
| Underlying income statement | |||||||||||||||||||||||||||||||||||||||||
| EUR million | |||||||||||||||||||||||||||||||||||||||||
| Q2'20 | Q1'20 | Chg. | H1'20 | H1'19 | Chg. | ||||||||||||||||||||||||||||||||||||
| Total income | -313 | -304 | +3 | % | -617 | -822 | -25 | % | |||||||||||||||||||||||||||||||||
| Net operating income | -395 | -389 | +1 | % | -784 | -1,015 | -23 | % | |||||||||||||||||||||||||||||||||
| PBT | -773 | -413 | +87 | % | -1,186 | -1,155 | +3 | % | |||||||||||||||||||||||||||||||||
| Underlying attrib. profit | -94 | -1,031 | -91 | % | -1,125 | -1,108 | +2 | % | |||||||||||||||||||||||||||||||||
| 44 | | January - June 2020 | ||||||
| Response to the COVID-19 crisis Business model | ||||||||||||||||||||||||||
| Secondary segments | ||||||||||||||||||||||||||
| RETAIL BANKING | ||||||||||||||
 | Highlights (changes in constant euros) | |||||||||||||
| Santander continued to support its customers, corporates and governments in all countries through a series of extraordinary measures to ensure the necessary financial support in the context of the health crisis, while we ensure our usual product and service offering. | ||||||||||||||
•We remained committed to the digital transformation and multi-channel strategy. In June, we reached more than 146 million customers, of which more than 21 million are loyal, 40 million are digital and more than 32 million are mobile customers. •Underlying attributable profit of EUR 1,616 million in the first half, strongly affected by COVID-19 related provisions. | ||||||||||||||
| EUR 1,616 Mn | ||||||||||||||
| Underlying attributable profit | ||||||||||||||
Commercial activity
Santander wants to be the reference bank for individuals, SMEs and other companies in the countries where we operate, strengthening our commitment to society. In recent months, this role has become even more important due to the economic and social impacts arising from the global health crisis. Therefore, our priority has been to aid our customers, partners and local authorities by defining a series of measures which ensure the necessary financial support through pre-approved credit lines, payment holidays and special policies.
In addition, this situation has strengthened and accelerated our digital transformation, focusing on our multi-channel strategy and the digitalisation of processes and businesses, which resulted in an increase in digital customers of more than 3 million.
On the other hand, we continued to launch different commercial initiatives:
•In individuals, in Spain, focus was on the Plan Ayuda a las personas, centred on vulnerable customers. We continued to expand Santander Life in Chile and launched White Account in Argentina, a value proposition with additional benefits for healthcare professionals, who will also be treated as high-priority and Senior Account, which offers retired customers preferential service. In Poland, we strengthened our health and life insurance product offering.
•In auto finance, we are consolidating the strategic agreements in SCF. The joint initiative between SBNA and SC USA continued to thrive in prime auto loans. In Brazil, we launched joint offers with Webmotors.
•In the SME segment, we continued to move forward with products such as Prospera in Brazil and Uruguay. In Mexico, we launched e-SPUG, an innovative system to help stores and private sellers process distance selling in a simple, agile and safe way.
All these measures enabled loyal customers to grow to 21.5 million.
Results
Underlying attributable profit in the first half was EUR 1,616 million, strongly affected by COVID-19 related provisions:
•Total income fell 3% impacted by the fall in net fee income, partly offset by higher gains on financial transactions.
•Costs decreased 2%.
•Loan-loss provisions were up 74% strongly affected by COVID-19 related provisions. Cost of credit stood at 1.46% and the NPL ratio improved 24 bps to 3.75%.
| Customers | ||||||||||||||||||||
| June 2020. Thousands | ||||||||||||||||||||
| Loyal customers | Digital customers | |||||||||||||||||||
| 21,507 | | 39,915 | |||||||||||||||||
| 31 | % | /active customers | +15 | % | YoY | |||||||||||||||
| Activity | ||||||||||||||||||||||||||||||||||||||||||||||||||||||||||||||
| June 2020. EUR billion and % change in constant euros | ||||||||||||||||||||||||||||||||||||||||||||||||||||||||||||||
| +2% | +5% | |||||||||||||||||||||||||||||||||||||||||||||||||||||||||||||
| QoQ | QoQ | |||||||||||||||||||||||||||||||||||||||||||||||||||||||||||||
| 766 | 692 | |||||||||||||||||||||||||||||||||||||||||||||||||||||||||||||
| +4% | +4% | |||||||||||||||||||||||||||||||||||||||||||||||||||||||||||||
| YoY | YoY | |||||||||||||||||||||||||||||||||||||||||||||||||||||||||||||
| Gross loans and advances to customers excl. reverse repos | Customer deposits excl. repos + mutual funds | |||||||||||||||||||||||||||||||||||||||||||||||||||||||||||||
| Underlying income statement | ||||||||||||||||||||||||||||||||
| EUR million and % change in constant euros | ||||||||||||||||||||||||||||||||
| Q2'20 | / Q1'20 | H1'20 | / H1'19 | |||||||||||||||||||||||||||||
| Revenue | 8,859 | -4 | % | 18,831 | -3 | % | ||||||||||||||||||||||||||
| Expenses | -4,084 | -4 | % | -8,611 | -2 | % | ||||||||||||||||||||||||||
| Net operating income | 4,775 | -5 | % | 10,220 | -4 | % | ||||||||||||||||||||||||||
| LLPs | -2,846 | -21 | % | -6,735 | +74 | % | ||||||||||||||||||||||||||
| PBT | 1,711 | +54 | % | 2,930 | -52 | % | ||||||||||||||||||||||||||
| Underlying attrib. profit | 982 | +71% | 1,616 | -54 | % | |||||||||||||||||||||||||||
January - June 2020 | | 45 | ||||||
| Response to the COVID-19 crisis Business model | ||||||||||||||||||||||||||
| Secondary segments | ||||||||||||||||||||||||||
| CORPORATE & INVESTMENT BANKING | ||||||||||||||
 | Highlights (changes in constant euros) | |||||||||||||
| During the COVID-19 health crisis, SCIB maintained its growth strategy focusing its priorities on protecting employees and providing Santander's global clients (corporates, governments, institutions, etc.) the advisory and financial support they needed to overcome this difficult situation. | ||||||||||||||
•Commercial activity remained highly active, as a result of the close and strong relationships with our customers, together with the geographical diversification of our model, with significant year-on-year growth in virtually all our main businesses. •Underlying attributable profit in the quarter was 23% higher year-on-year at EUR 928 million, driven by double-digit revenue growth and cost reduction, which enabled us to absorb the increase in provisions. | ||||||||||||||
| EUR 928 Mn | ||||||||||||||
| Underlying attributable profit | ||||||||||||||
Commercial activity
•Global markets: greater activity as a result of market volatility and the increased coverage needs of our clients. Positive performance in the Americas and Europe, notably sales in the UK and Asia, and management of books in Brazil, Mexico, the US, Colombia and Peru.
•Debt Capital Markets: Santander continued to focus on activities related to sustainable financing, being a reference for the issuance of green and social bonds, with a strong focus on those aimed at softening the effects of the pandemic. Significant growth in the quarter, backed by the positive performance in Europe and the US.
•Syndicated Corporate Loans: we supported our clients by meeting their funding and liquidity needs by increasing loan volumes and participating in operations backed by government support programmes across Europe. However, we maintained our responsible banking strategy, increasing our range of sustainable finance products via ESG loans or loans linked to sustainable indices.
•Structured Financing: Santander remained leader in financial advising in Latin America and in the European renewable energy sector, one of the main priorities of its ESG strategy. It consolidated its leadership position in Project Finance, ranking among the global top 10 both regarding the number and value of transactions as of June 2020.
•Cash management: strong deposit capturing performance, driven by the flight to quality impact on markets of COVID-19. Despite the sharp drop in transaction volumes in the market, Santander continued to grow, backed by solid commercial activity and its commitment to support customers.
•Export & Agency Finance: we continued to support our clients in their export activities through liquidity lines, maintaining our leadership position in this segment, spurred by our participation in government support initiatives through export credit agencies (ECA) and Multilateral Agencies in order to counteract the effects of the pandemic on SMEs.
•Trade & Working Capital Solutions: Santander maintained leadership positions in international confirming, receivables and trade funding (especially in South America).
•Corporate Finance: Despite the worsening of global conditions in recent months, we closed various significant operations, such as financially advising SIX Group AG in the takeover bid for BME (including M&A, ECM and rating advisory), one of the main transactions of 2020 in Spain.
In M&A, SCIB acted as sole advisor to Energias de Portugal (EDP) on the sale of assets and part of its commercial portfolio to Total.
Lastly, of note was Santander's participation as bookrunner in the EUR 2.6 billion IPO of JDE Peet's, the largest equity operation in Europe so far.
Business performance
The health crisis was virtually the sole conditioning factor in the first half of the year. In this regard, we continued to support our customers through contingency lines and other financing solutions.
In the quarter, the volume of loans and advances to customers excluding reverse repos rose to EUR 120,693 million, 14% higher than in December 2019. This led to an increase in risk weighted assets, both due to the increase in the volume of granted loans and higher market volatility. We are developing mitigation measures to minimise this increase.
Customer deposits excluding repos rose 26% in the first half to almost EUR 100 billion, driven by higher liquidity from our clients.
| Activity | ||||||||||||||||||||||||||||||||||||||||||||||||||||||||||||||
| June 2020. EUR billion and % change in constant euros | ||||||||||||||||||||||||||||||||||||||||||||||||||||||||||||||
| -2% | +9% | |||||||||||||||||||||||||||||||||||||||||||||||||||||||||||||
| QoQ | QoQ | |||||||||||||||||||||||||||||||||||||||||||||||||||||||||||||
| 121 | 108 | |||||||||||||||||||||||||||||||||||||||||||||||||||||||||||||
| +20% | +26% | |||||||||||||||||||||||||||||||||||||||||||||||||||||||||||||
| YoY | YoY | |||||||||||||||||||||||||||||||||||||||||||||||||||||||||||||
| Gross loans and advances to customers excl. reverse repos | Customer deposits excl. repos + mutual funds | |||||||||||||||||||||||||||||||||||||||||||||||||||||||||||||
| 46 | | January - June 2020 | ||||||
| Response to the COVID-19 crisis Business model | ||||||||||||||||||||||||||
| Secondary segments | ||||||||||||||||||||||||||
Results (in constant euros)
First half underlying attributable profit was 23% higher, backed by double-digit growth in the majority of businesses, particularly Global Markets and Global Debt Financing. More moderate, but significant growth in Global Transaction Banking.
•Total income growth spurred by the strong increase in net interest income (+12%) and net fee income (+20%).
•Costs fell 1%, which enabled efficiency to improve 5 pp and net operating income to grow 32%.
•Higher provisions derived from the general macroeconomic deterioration were largely offset by sound revenue performance and prudent cost management.
Compared to the previous quarter, underlying attributable profit was down 2% as the positive performance of all revenue lines together with cost control were absorbed higher provisions.
| Total income breakdown | ||||||||
| Constant EUR million | ||||||||
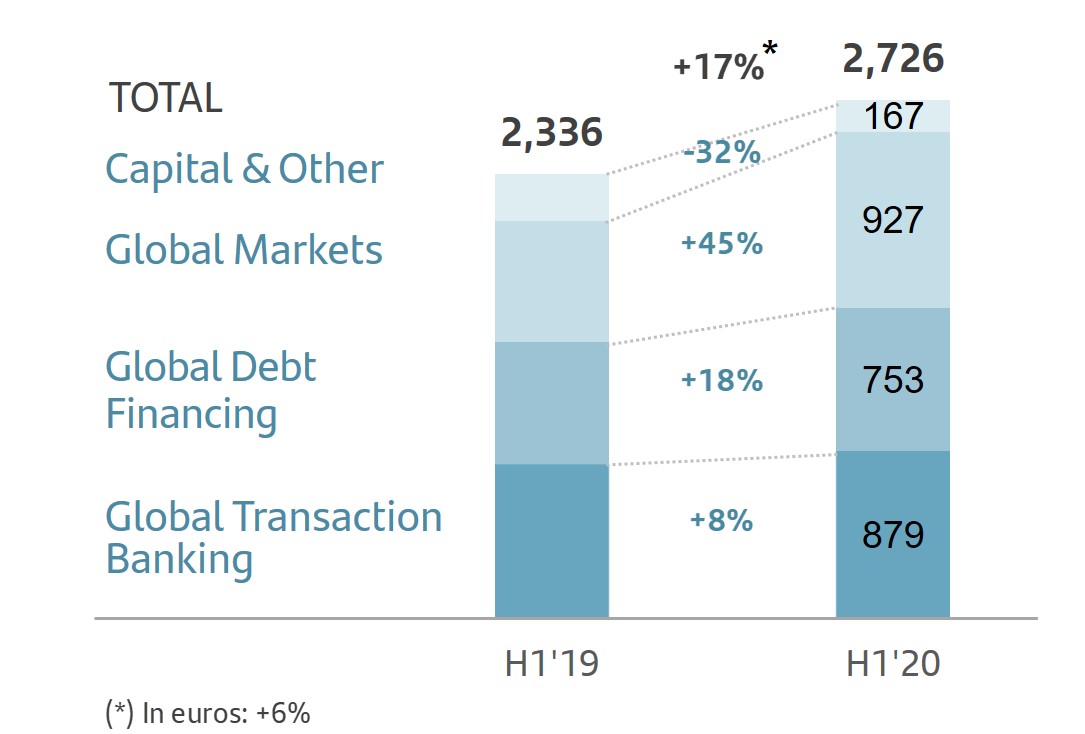 | ||||||||
| Underlying income statement | ||||||||||||||||||||||||||||||||
| EUR million and % change in constant euros | ||||||||||||||||||||||||||||||||
| Q2'20 | / Q1'20 | H1'20 | / H1'19 | |||||||||||||||||||||||||||||
| Revenue | 1,426 | +18 | % | 2,726 | +17 | % | ||||||||||||||||||||||||||
| Expenses | -507 | 0 | % | -1,043 | -1 | % | ||||||||||||||||||||||||||
| Net operating income | 919 | +31 | % | 1,683 | +32 | % | ||||||||||||||||||||||||||
| LLPs | -245 | — | -249 | +372 | % | |||||||||||||||||||||||||||
| PBT | 646 | -4 | % | 1,391 | +17 | % | ||||||||||||||||||||||||||
| Underlying attrib. profit | 437 | -2 | % | 928 | +23 | % | ||||||||||||||||||||||||||
January - June 2020 | | 47 | ||||||
| Response to the COVID-19 crisis Business model | ||||||||||||||||||||||||||
| Secondary segments | ||||||||||||||||||||||||||
| WEALTH MANAGEMENT & INSURANCE | ||||||||||||||
 | Highlights (changes in constant euros) | |||||||||||||
| As part of the Group's 'new normal' plan, some of our employees began to return to their workplaces in several countries, always prioritising the safety of our customers and employees. The follow-up and interaction with customers continued during the crisis, fostering communication through digital channels. | ||||||||||||||
•Underlying attributable profit rose 3% compared to the first half of 2019. •Total fee income generated, including those ceded to the branch network represented 31% of the Group's total and grew 1% despite COVID-19 impact. •Assets under management reached EUR 355 billion, 1% lower year-on-year, affected by the impact of the crisis. However, the previous quarter rebounded, increasing 5%. | ||||||||||||||
| EUR 427 Mn | ||||||||||||||
| Underlying attributable profit | ||||||||||||||
Commercial activity
Within the developed strategy to become the best responsible wealth manager in Europe and Latin America, of note were:
•In Private Banking, the positive trend observed early this year continued, with good sales and business growth rates despite the market situation, as well as the strong reduction of interest rates in the US and the UK.
In the first half of the year, we continued to complete the value proposition in all our countries, focusing on advising services as the key to offer a more innovative product range adapted to the needs of our clients through our global platform.
This offer includes the alternative funds platform in Ireland (Icav) with the launch of a private debt fund managed by Bain Capital, the leading manager in this market, and a private equity fund of secondary securities managed by Harbour Vest. In Spain, we marketed an Everwood Capital fund that invests in photovoltaic plants and a listed fund that invests in student residences managed by GSA.
We continue to invest in our digital tools for both managers (SPiRIT) and clients (Virginia), whose use increased in recent months as the majority of our staff was working remotely.
In June, we received an award for the best technology in Latin America by the Professional Wealth Manager magazine of the Financial Times group.

All Access, our global value proposition, continued to expand and the total volume of shared business across our markets reached EUR 6,950 million, 37% more than June 2019, mainly driven by the operations in Mexico, Brazil, Chile, Miami and Switzerland.
| Collaboration volumes | |||||||||||||||||||||||
| EUR million | |||||||||||||||||||||||
| 6,950 | 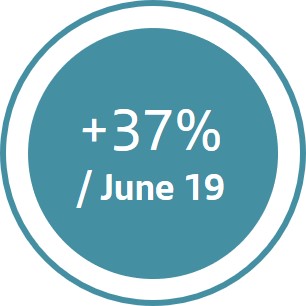 | ||||||||||||||||||||||
•In Santander Asset Management we continued to improve and complete our product offering, such as the Santander GO range, reaching a volume of more than EUR 1 billion. We also launched products such as Gama Horizonte or MultiAsset Low Volatility in Spain following our alternative product offering strategy which began with the creation of the Global Multi Asset Solutions.
We continued with the implementation of the Aladdin platform, a strategic focus for our operational and technological transformation, which was already successfully rolled-out in Europe as scheduled, despite COVID-19.
We also continued to progress in our sustainability strategy (ESG), becoming a member of the International Investors Group on Climate Change (IIGCC), the European membership body for investor collaboration on climate change. Assets under management under the ESG criteria amounted to EUR 3.9 billion.
•In Insurance, our main growth driver continued to be non-credit business, which has a longer portfolio duration, maintaining policy renewals. We continued to increase the number of insurance policies distributed through our digital channels, which now account for 9% of the total sales volume.
At the end of March, a new multi-risk insurance proposal for SMEs was launched in Spain through our joint venture with Mapfre and, in May, an innovative proposal for car insurance through all channels including digital ones.
In the UK, we launched our tailored Home & Life insurance offering and in Latin America we continued to enhance customer experience with new versions of Autocompara, our car insurance distribution platform.
In Chile, Klare, our fully digital insurance broker was launched in May to offer insurance from different insurance companies to the entire Chilean market. In addition, we launched a new insurance proposal for SMEs with a unique digital experience in the market and with a new app that streamlines and tailors the training of our business executives and specialists.
| 48 | | January - June 2020 | ||||||
| Response to the COVID-19 crisis Business model | ||||||||||||||||||||||||||
| Secondary segments | ||||||||||||||||||||||||||
Business performance
Total assets under management amounted to EUR 355 billion, in line with the first half of 2019, strongly impacted by the market value of custody positions. In the quarter, growth was 5%.
| Business performance: SAM and Private Banking | ||||||||||||||||||||||||||||||||||||||
| June 2020. EUR billion and % change in constant euros | ||||||||||||||||||||||||||||||||||||||
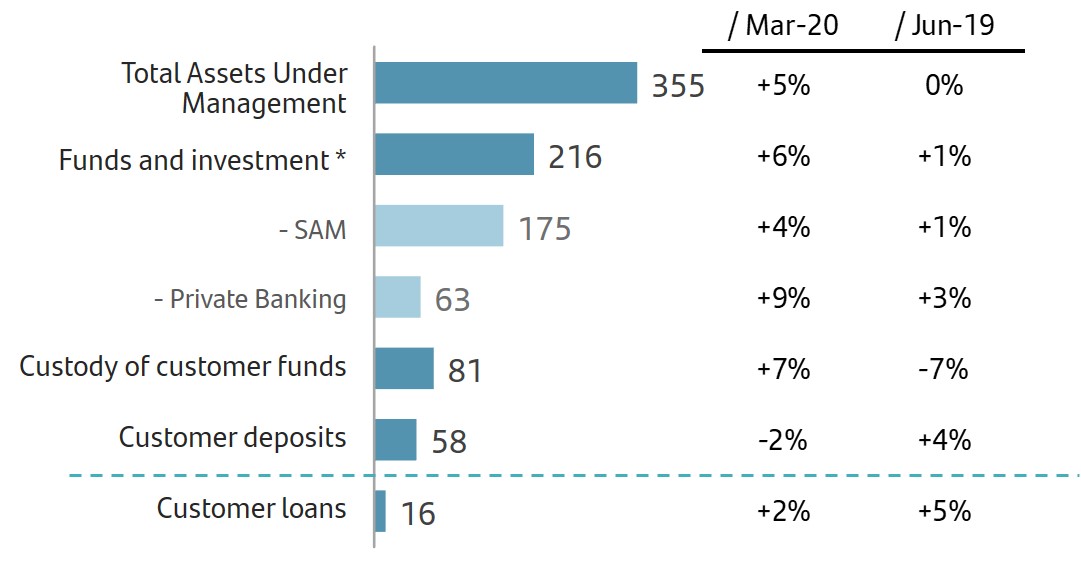 | ||||||||||||||||||||||||||||||||||||||
Note: Total assets marketed and/or managed in 2020 and 2019.
(*) Total adjusted customer funds of private banking managed by SAM. 2019 data Pro forma including Popular asset management Joint Ventures, fully integrated in 2020.
•In Private Banking, the volume of customer assets and liabilities amounted to EUR 219 billion in June 2020, 1% lower year-on-year. This was mainly due to the impact of markets on the custody business. However, mutual funds grew 3% and by 9% in the quarter.
Attributable profit reached EUR 212 million, up 6% compared to the first half of 2019, despite the sharp fall in interest rates. Of note were Miami, Mexico, Brazil, Portugal and Poland.
•In SAM, total assets under management increased 1% compared to the same period of 2019, despite the negative impact of markets driven by the COVID-19 crisis. In the second quarter, growth was 4% due to both the market improvement and the recovery of net sales in the second half of the quarter.
Underlying attributable profit was EUR 64 million, 9% lower year-on-year, due to lower average volumes and spreads. Total contribution to profit (including ceded fee income) was EUR 254 million.
•In Insurance, the volume of gross written premiums as of June amounted to EUR 4 billion (-12% year-on-year), affected by lower activity derived from the crisis, and particularly, due to lower savings insurance premiums impacted by from lower interest rates. At the end of the quarter, some signs of recovery in production could be observed, with more stable levels mainly in Latin America.
Of note was new protection insurance production, up 10% year-on-year.
Underlying attributable profit generated as of June by the insurance business amounted to EUR 152 million, 4% higher than in the same period of 2019. Total contribution to profit (including ceded fee income) was EUR 612 million.
Results
Underlying attributable profit was EUR 427 million in the first half of 2020, 3% higher year-on-year:
•Total income increased mainly driven by net fee income (+10%) due to the greater contribution from private banking, despite the strong exchange rate impact, which resulted in a 13% decrease of net interest income.
•Total fee income generated, including fees ceded to the branch network, rose 1% to EUR 1,586 million despite the crisis and represented 31% of the Group's total.
| Total fee income generated | |||||||||||||||||||||||
| EUR million | |||||||||||||||||||||||
| 1,586 | 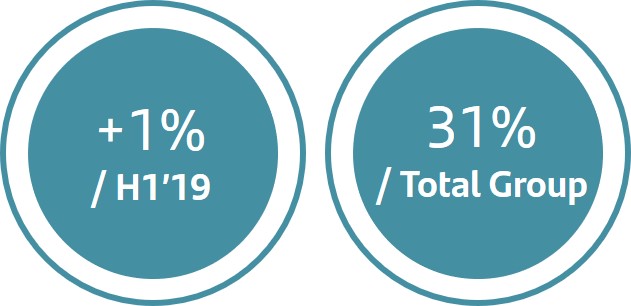 | ||||||||||||||||||||||
•Operating expenses remained flat, due to the optimisation measures that absorbed the impact of the investments carried out.
•As a result, the efficiency ratio improved 0.5 pp compared to the same period last year and net operating income increased 7%.
•The NPL ratio recorded no material change despite the crisis.
The total contribution to the Group (including net profit and total fees generated net of taxes) was EUR 1,085 million in June 2020, 1% lower than in the same period of 2019.
| Total profit contribution | ||||||||||||||||||||||||||
| EUR million and % change in constant euros | ||||||||||||||||||||||||||
| Q2'20 | H1'20 | |||||||||||||||||||||||||
 | 512 | | 1,085 | |||||||||||||||||||||||
| -10 | % | / Q1'20 | -1 | % | / H1'19 | |||||||||||||||||||||
| Underlying income statement | ||||||||||||||||||||||||||||||||
| EUR million and % change in constant euros | ||||||||||||||||||||||||||||||||
| Q2'20 | / Q1'20 | H1'20 | / H1'19 | |||||||||||||||||||||||||||||
| Revenue | 482 | -13 | % | 1,069 | +4 | % | ||||||||||||||||||||||||||
| Expenses | -220 | -7 | % | -464 | 0 | % | ||||||||||||||||||||||||||
| Net operating income | 263 | -18 | % | 605 | +7 | % | ||||||||||||||||||||||||||
| LLPs | -5 | -19 | % | -12 | — | |||||||||||||||||||||||||||
| PBT | 255 | -19 | % | 589 | +4 | % | ||||||||||||||||||||||||||
| Underlying attrib. profit | 186 | -17 | % | 427 | +3 | % | ||||||||||||||||||||||||||
January - June 2020 | | 49 | ||||||
| Response to the COVID-19 crisis Business model | ||||||||||||||||||||||||||
| Secondary segments | ||||||||||||||||||||||||||
| SANTANDER GLOBAL PLATFORM (SGP) | ||||||||
 | Highlights (changes in constant euros) •Our digital transformation leverages the Group's scale and global footprint. Santander Global Platform (SGP) aims to accelerate our growth by deploying global payments and financial solutions for SMEs and individuals in high-growth and large addressable markets. •Within the COVID-19 environment, progress in the development of our payment platforms continued to meet its quarterly plans, incorporating new services and functionalities on schedule. The total number of active businesses stood at around one million and the revenue pool for GTS was 11% higher than in the first half of 2019. •Following the completion of the operation, the GTS and Ebury teams have been working on a joint services and commercial plan, defining synergies and identifying complementary aspects. | |||||||
| GMS/Getnet GTS/OneTrade & Ebury Superdigital Openbank | ||||||||
Strategy
Santander Global Platform is focused on offering global payment solutions to customers. These solutions are all being built based on customer experience and as a driver of loyalty. SGP offers these solutions to both our banks (B2C) and to third parties (B2B2C), helping to expand our market to non-customers and new geographic areas, generating new significant revenue opportunities. The area continued to advance according to the envisaged schedule.
Bringing best-in-class banking solutions to SMEs:
•Global Merchant Services is an initiative led by Grupo Santander with the aim of creating a single open platform for the global development of the acquiring business through the unique brand Getnet. This business has a high strategic value in the relationship with our customers given the importance of collections management and value-added services for merchants.
In the second quarter of the year, transactional activity of our main markets was strongly impacted by mitigation measures arising from the COVID-19 pandemic. The most affected segments were airlines, hotels, restaurants and non-essential businesses.
However, the Group's total number of active businesses stood at around one million and achieved a total income of EUR 242 million in the first half of the year, 19% lower than the first half of 2019 in constant euros. In May and June, some recovery in activity could be observed, although it has not yet reached pre-COVID-19 levels.
Conversely, e-commerce grew at a strong pace, which enabled us to enhance our competitive position (Getnet reached a market share of around 22% in Brazil).
As regards the platform, we continued to include additional functionalities that will enable us to complete the roll-out in Mexico and the rest of Latin American countries as market conditions normalise.

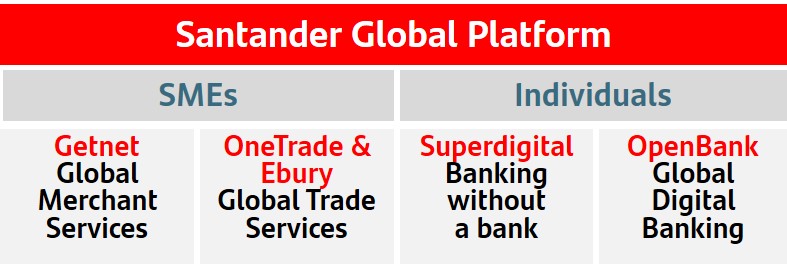
•Global Trade Services, the Group's global platform to serve companies that trade internationally using international payments, FX, international treasury management and foreign trade services.
The Group's revenue pool for these services in the first half of the year amounted to EUR 640 million, excluding SCIB and WM&I, 11% greater than the first half of 2019 in constant euros, a very positive performance considering the COVID-19 environment and the fall in import/export flows related to the downturn in economic activity.
Regarding the development and deployment of the Group's global International Trade platform, Santander OneTrade, where all the Group's customers, as well as new external ones, will have access to an improved offer regarding these services, continued progressing as scheduled. As of July, three countries had been connected to the platform with access given to their customers (Brazil, Spain and the UK), and the development and quarterly incorporation of new features is progressing according to plan. In the quarter, we launched an international payments tracking service and OneTrade Accounts, which enables customers to check their multicountry account balance in real time.
On the other hand, the Ebury acquisition was completed in Q2, having successfully obtaining all required regulatory approvals. Ebury represents a significant strengthening of GTS's strategy through its complementary international services solutions, geographic scope, which expands the Group's presence, and agility developing and executing new solutions for customers. The GTS and Ebury team is already working on the joint services and commercial plan, defining synergies and common aspects between them.

| 50 | | January - June 2020 | ||||||
| Response to the COVID-19 crisis Business model | ||||||||||||||||||||||||||
| Secondary segments | ||||||||||||||||||||||||||
Bringing best-in-class digital banking solutions to individuals:
•Superdigital, our financial inclusion platform for individuals that offers basic financial services simply and flexibly. It enables us to meet the financial needs of the underserved in a cost-effective way, providing them with basic financial products and a path to access credit, thus serving them responsibly and profitably.
Superdigital also integrates into GMS for small merchants. It has a special focus on Latin America, where there are c.300 million unbanked and underbanked consumers.
As of today, Superdigital operates in Brazil, Mexico and Chile, with growth in active customers of 91% year-on-year and 55% in transactions (H1'20 vs. H1'19). We aim to expand Superdigital to 7 countries in Latin America later this year.

•Openbank, our global, full-service digital bank offers the current accounts and cards also offered by neobanks, but also loans and mortgages, in addition to a state-of-the-art robo-advisory and open platform brokerage services.
Currently, Openbank is operating in Spain, the Netherlands, Germany and Portugal. In July, Openbank Argentina obtained its banking licence and is expected to start operations in the first half of 2021. In the first six months of 2020, Openbank increased its loan book by 57% year-on-year, deposits by 10% and new customers in the period by 95% compared with the first six months of 2019. The number of brokerage accounts tripled in the first half of the year and the number of securities transactions rose by 108%. Loyal customers keep showing an industry record benchmark engagement ratio of 4.6 products per customer.
In the first six months, Openbank launched the first travel card, branded R42, that works by subscription, that can be turned-on and off from the app, and our customers pay only when they use it, as compared to competing neobank products that charge full year fees. This new travel card offers privileged exchange rates when used abroad, free ATM withdrawals, travel insurance and a concierge service.

Other activities
•Santander InnoVentures, our venture capital investments in the fintech ecosystem, continued to grow. In the second quarter, it invested in three new corporates, including Upgrade (a US retail lender) and a55 (an alternative SME lender in Brazil and Mexico), and continued to support existing companies such as Autofi (US auto dealer software and financing company), among others. As at end-June, Santander InnoVentures had invested more than USD 170 million in 34 companies in 9 countries. The strategic interaction between the Bank and Santander InnoVentures for the benefit of our customer base remained strong.
Results
Looking at SGP's activity in the first half of the year in a broad sense, i.e. if, in addition to considering the results generated by the digital platforms, 50% of the results generated by the countries on the products related with the platform (e.g. merchant acquiring, trade finance products, etc.) are also included, revenue of SGP as secondary segment was EUR 510 million in and pro forma underlying attributable profit was positive at EUR 63 million in the first half of 2020.
This is the net result of two components: on the one hand, the investment in building the platforms and, on the other hand, 50% of the profit obtained from commercial relationships with our customers:
•The construction of platforms is where most of the spend is concentrated. We are making progress in the development of new solutions and rolling them out in countries. This has a negative impact of EUR 78 million on the income statement for the first half.
•Profit obtained from commercial relationships with our customers linked to the global SGP platforms, and according to the criteria for allocating the aforementioned results, resulted in EUR 141 million in the first six months of the year.
We regularly assess the market valuations of the businesses included in SGP, based on multiples of comparable companies, to ensure our investments in digital are creating value.
| Underlying income statement | ||||||||||||||||||||||||||||||||
| EUR million and % change in constant euros | ||||||||||||||||||||||||||||||||
| Q2'20 | / Q1'20 | H1'20 | / H1'19 | |||||||||||||||||||||||||||||
| Revenue | 250 | +4 | % | 510 | +9 | % | ||||||||||||||||||||||||||
| Expenses | -183 | +4 | % | -369 | +13 | % | ||||||||||||||||||||||||||
| Net operating income | 67 | +5 | % | 141 | -2 | % | ||||||||||||||||||||||||||
| LLPs | -14 | +193 | % | -20 | +19 | % | ||||||||||||||||||||||||||
| PBT | 46 | -22 | % | 117 | -7 | % | ||||||||||||||||||||||||||
| Underlying attrib. profit | 20 | -43 | % | 63 | -3 | % | ||||||||||||||||||||||||||
January - June 2020 | | 51 | ||||||
Responsible banking | ||||||||||||||||||||||||||
| Responsible banking | ||||||||||||||||||||||||||
RESPONSIBLE BANKING
Santander strives every day to contribute to the progress of people and companies in a Simple, Personal and Fair way in all that we do, to earn the confidence of our employees, customers, shareholders and society.
In order to meet our commitment to be a more responsible bank and help society address the main global issues, we have identified two challenges: adapt to the new business environment and contribute to more inclusive and sustainable growth, with the following goals set in 2019 for the coming years:
 | Santander Responsible banking targets | ||||
More information on our public commitments in responsible banking can be found on our website.

1. According to relevant external indices in each country (Great Place to Work, Top Employer, Merco, etc.).
2. Senior positions represent 1% of total workforce.
3. Calculation of equal pay gap compares employees of the same job, level and function.
4. People (unbanked, underbanked or financially vulnerable), who are given access to the financial system, receive tailored finance and increase their knowledge and resilience through financial education.
5. Includes Santander overall contribution to green finance: project finance, syndicated loans, green bonds, capital finance, export finance, advisory, structuring and other products to help our clients in the transition to a low carbon economy. Commitment from 2019 to 2030 is EUR 220 bn.
6. In those countries where it is possible to certify renewable sourced electricity for the properties occupied by the Group.
7. People supported through Santander Universities initiative (students who will receive a Santander scholarship, will achieve an internship in an SME or participate in entrepreneurship programmes supported by the bank).
8. People helped through our community investment programmes (excluded Santander Universities and financial education initiatives).
| 52 | | January - June 2020 | ||||||
Responsible banking | ||||||||||||||||||||||||||
| Responsible banking | ||||||||||||||||||||||||||
| First half highlights | ||||
 | The Group is supporting its stakeholders in the difficulties they may have as a result of the current pandemic. We have put in place various contingency plans in the countries in which we operate. | |||||||
| We signed the Green Recovery alliance launched by the European Parliament: an appeal for a green recovery from the COVID-19 pandemic. | ||||||||
We published the thematic reports on responsible banking in 2019, which review in detail all the activity in this area in our main markets, and complement the chapter on Responsible Banking in the Annual Report published in February. There are a total of seven themes, including the Climate Finance report in which we published this year the progress according to the four pillars of TCFD, as well as our portfolio in relevant sectors to the climate in order to make progress towards the objectives of the Paris Agreement. We were recognised for our excellent results with the Gold Class distinction in The Sustainability Yearbook 2020 released by S&P Global, as Santander ranked 1st in the Dow Jones Sustainability Index. We achieved a total score of 86 points out of 100, reaching the maximum score of 100 in a number of assessed areas, including tax strategy, privacy protection, environmental reporting and financial inclusion. In addition, the Group continued to develop responsible banking initiatives in the quarter, in the areas of environmental sustainability, diversity and community support, among others. The most relevant are detailed below. | ||||||||
 | As part of our corporate commitment to the environment, Santander continued financing green alternatives and renewable energies in its different countries: We issued a EUR 1 bn green bond to finance or refinance renewable wind and solar energy projects. This is the second issuance of this type of instrument made under the Global Sustainable Bond Framework. Santander Bank Polska, together with other entities, signed the largest contract for financing photovoltaic projects in Poland to build 128 solar power plants. Santander Argentina was involved in the placement of the first green bond issued on the local primary debt market, which amounted to USD 84 million. Santander Portugal was involved in the launch of 2020's first corporate hybrid bond - the new Green Hybrid Bond - presented by EDP (Energías de Portugal). The Bank also signed a commitment to promote the objectives of Lisbon Green Capital 2020. | |||||||
 | Regarding our diversity and inclusion commitments, we joined The Valuable 500, committing to include disability inclusion in the board's agenda, and signed the UN Women Empowerment principles. In addition, the board approved a minimum standard for parental leave which is already being implemented and is expected to be applied in all countries by 2022, offering at least 14 paid weeks for mothers and four weeks for fathers or secondary parents. | |||||||
 | Following our commitment of acting responsibly towards our employees, we received the Top Employers 2020 certification for the excellent working conditions in Spain, Poland, the UK and Chile, and in different Santander Consumer Finance units. In addition, we are the ninth best company to work for in Latin America according to Great Place to Work 2020 and ranked third in the category of enterprises with more than 1,000 employees. We were also named best bank in Portugal. | |||||||
 | In addition to the measures implemented to minimise the impacts of the COVID-19 pandemic, we continued to invest in the communities in which we operate. In collaboration with MIT Professional Education, we launched the Santander Scholarships MIT Leading Digital Transformation and, together with the British Council, we launched the Santander British Council Summer Experience. | |||||||
As a result of these efforts, Banco Santander was ranked the world’s most sustainable bank in the Dow Jones Sustainability Index for the first time and was also first in Europe for the second year running. The index evaluates the Group’s performance across economic, environmental and social dimensions. | ||||||||
 | ||||||||
January - June 2020 | | 53 | ||||||
| Response to the COVID-19 crisis Business model | Corporate governance | |||||||||||||||||||||||||
| Corporate governance | ||||||||||||||||||||||||||
CORPORATE GOVERNANCE
| A responsible bank has a solid governance model with well-defined functions, it manages risks and opportunities prudently and defines its long-term strategy looking out for the interests of all its stakeholders and society in general |  | ||||
à Changes in the board
•Once the corresponding regulatory authorisations were obtained, on 19 and 30 May 2020, respectively, Mr Luis Isasi joined the board as an external director and Mr Sergio Rial as an executive director, the latter replacing Mr Ignacio Benjumea, who ceased duties as director on 30 May 2020.
•The appointments committee has proposed Mr R. Martin Chávez as a new independent director of the Bank. Mr Chávez will replace Esther Giménez-Salinas who will be stepping down having served on the board for eight years. His appointment is subject to the usual regulatory approvals and it is expected that his appointment will be submitted for approval at the general shareholders meeting that will likely take place in October 2020.
à Changes in the composition of the board committees
•As of 20 May 2020, Mr Luis Isasi was appointed a member of the executive committee, the remuneration committee and the risk supervision, regulation and compliance committee.
•Once Mr Chavez joins the board of directors, he will also join the remuneration committee, risk supervision, regulation and compliance committee, and innovation and technology committee
à Changes in the organisational structure of the Group's Senior Management
•As of 12 May 2020, the Bank announced the appointment of Mr António Simões as the new regional head of Europe, succeeding Mr Gerry Byrne, who, after a career spanning nearly 50 years in banking, has decided to retire at the beginning of 2021. He will have managerial responsibility and oversight of the Group's business in Europe, will lead the retail and commercial banking businesses, with reporting lines from the country heads of Spain, the UK, Portugal and Poland.
Mr António Simões is expected to join the Bank on 1 September 2020, subject to regulatory approval.
•On the other hand, as of 30 June 2020, Mr. José María Nus has ceased to be part of the Bank's senior management.
SIGNIFICANT EVENTS SINCE QUARTER END
From 1 July 2020 until the approval date of the interim financial statements for the six-month period ended 30 June 2020, no material facts other than those indicated in this report have occurred.
| 54 | | January - June 2020 | ||||||
| Response to the COVID-19 crisis Business model | Santander share | |||||||||||||||||||||||||
| Santander share | ||||||||||||||||||||||||||
SANTANDER SHARE
Banco Santander, following the European Central Bank (ECB) recommendation urging financial institutions, given the uncertainty resulting from the COVID-19 emergency, to preserve capital by cancelling the payment of dividends against 2019 and 2020 earnings, decided to cancel the final dividend charged against 2019 earnings and hold a further general shareholders meeting, expected in October 2020, to consider a dividend payment if the uncertainties relating to the COVID-19 crisis are resolved.
The Group, even before the ECB’s announcement, had agreed to cancel the interim dividend charged against 2020 and suspend its decision on 2020 dividends until there was more clarity regarding the impact of the crisis. This decision was taken to ensure the Bank has as much flexibility as possible to allow it to maximise lending and support businesses and individuals affected by the COVID-19 pandemic.
With the greater visibility we have today and given the Bank's capital strength and the performance of underlying results, the Board intends to propose to the Shareholders' Meeting the payment of a scrip dividend (payable in new shares) equivalent to EUR 0.10 per share, for a total dividend equivalent to EUR 0.20 charged to 2019 results.
In addition, and as commented on in other sections of this report, the Bank has accrued 6 basis points of CET1 capital in the quarter to allow the flexibility to pay a cash dividend against 2020 results, as soon as market conditions normalise and subject to regulatory approvals and guidance.
In a complicated environment derived from the health crisis, the Group has carried out various measures to protect its stakeholders. In this regard, our priorities were to protect the health of our employees, ensure the continuity of service to customers through the offices or by remote channels, and foster their economic resilience, having supported more than 600,000 customers by providing liquidity through government programmes and more than 5 million with payment holidays programmes, while we kept all channels open with our shareholders and investors to boost their confidence, which is reflected in an increase of almost 100,000 new shareholders since December.
àShareholder remuneration
The Santander share is listed in five markets, in Spain, Mexico and Poland as an ordinary share, in the US as an ADR and in the UK as a CDI.
The measures adopted by governments to contain the health crisis resulting from the fast spread of COVID-19 had a very severe effect on economic activity. The rapid adoption of monetary policy measures by central banks, together with the ongoing support packages that governments put in place for businesses and households to counter the economic slowdown, succeeded in increasing investor confidence, although uncertainty and the risk of further outbreaks persist.
Central banks are launching measures to support economies: for example, the ECB announced a new EUR 750 billion asset purchase programme in March, which was increased in June to a total of EUR 1,350 billion. Also, the Fed cut interest rates twice to 0% and announced unlimited asset purchases until markets stabilise.
Since the beginning of the year, the main markets performed better than the banking sector, the latter being influenced by the ECB's recommendation not to distribute dividends, as well as by the limitations of both the Bank of England and the Fed on dividend distribution and share buyback programmes. In Spain, the Ibex 35 was down 24.3% and, in Europe, the DJ Stoxx 50 was down 12.2%. DJ Banks was down 34.3% and MSCI World Banks was down 31.3%. Santander share price fell 41.7%, to end the quarter at EUR 2.175.
| Share price | ||||||||||||||||||||||||||
 |  | |||||||||||||||||||||||||
START 31/12/2019 | END 30/06/2020 | |||||||||||||||||||||||||
| €3.730 | €2.175 | |||||||||||||||||||||||||
 |  | |||||||||||||||||||||||||
Maximum 17/02/2020 | Minimum 20/05/2020 | |||||||||||||||||||||||||
| €3.964 | €1.776 | |||||||||||||||||||||||||
| Comparative share performance | ||
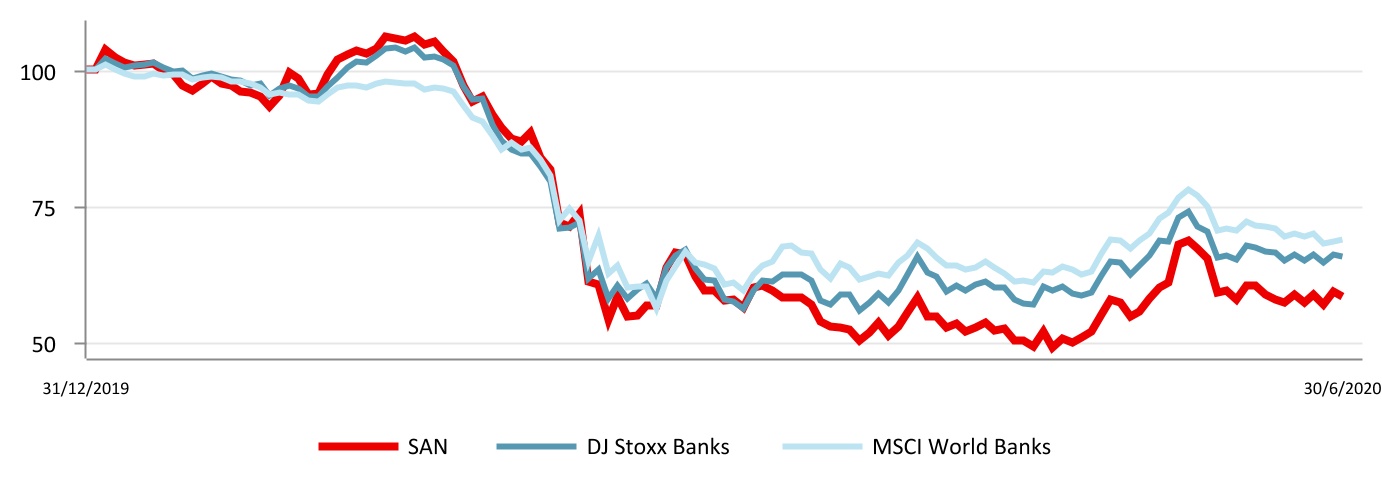
January - June 2020 | | 55 | ||||||
| Response to the COVID-19 crisis Business model | Santander share | |||||||||||||||||||||||||
| Santander share | ||||||||||||||||||||||||||
SANTANDER SHARE
àMarket capitalisation and trading
As at 30 June 2020, Santander was the second largest bank in the Eurozone by market capitalisation and the 33rd in the world among financial entities (EUR 36,136 million).
The share’s weighting in the DJ Stoxx 50 was 1.0% and 7.0% in the DJ Stoxx Banks. In the domestic market, its weight in the Ibex 35 as at end-June was 9.6%.
A total of 10,307 million shares were traded in the year for an effective value of EUR 26,691 million and a liquidity ratio of 62%.
The daily trading volume was 82 million shares with an effective value of EUR 212 million.
àShareholder base
The total number of Santander shareholders at 30 June 2020 was 4,080,201, of which 3,774,868 were European (77.10% of the capital stock) and 288,093 from the Americas (21.99% of the capital stock).
Excluding the board, which holds 1.10% of the Bank’s capital stock, retail shareholders account for 41.59% and institutional shareholders account for 57.31%.
| Share capital distribution by geographic area | ||||||||||||||
| June 2020 | ||||||||||||||
| The Americas | Europe | Other | ||||||||||||
| 21.99% | 77.10% | 0.91% | ||||||||||||
 | ||||||||||||||
 | 2nd | Bank in the Eurozone by market capitalisation | |||||||||
EUR 36,136 million | |||||||||||
| The Santander share | ||||||||
| June 2020 | ||||||||
| Shares and trading data | ||||||||
| Shares (number) | 16,618,114,582 | |||||||
| Average daily turnover (number of shares) | 81,804,975 | |||||||
| Share liquidity (%) | 62 | |||||||
| (Number of shares traded during the year / number of shares) | ||||||||
| Stock market indicators | ||||||||
| Price / Tangible book value (X) | 0.54 | |||||||
| Free float (%) | 99.85 | |||||||
| Share capital distribution by type of shareholder | ||||||||
| June 2020 | ||||||||
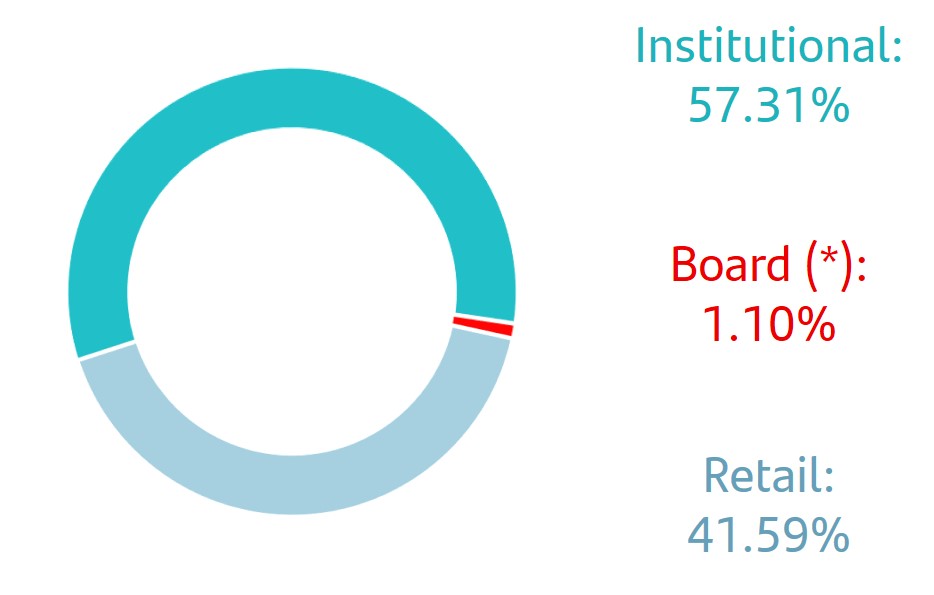 | ||||||||
(*) Shares owned or represented by directors.
| 56 | | January - June 2020 | ||||||
Financial report First half 2020 
January - June 2020 | | 57 | ||||||
| Response to the COVID-19 crisis Business model | ||||||||||||||||||||||||||
| Group financial information | ||||||||||||||||||||||||||
| Net fee income. Consolidated | ||||||||||||||||||||||||||||||||||||||
| EUR million | ||||||||||||||||||||||||||||||||||||||
| Q2'20 | Q1'20 | Change (%) | H1'20 | H1'19 | Change (%) | |||||||||||||||||||||||||||||||||
| Fees from services | 1,216 | 1,705 | (28.7) | 2,921 | 3,513 | (16.9) | ||||||||||||||||||||||||||||||||
| Wealth management and marketing of customer funds | 780 | 928 | (15.9) | 1,708 | 1,898 | (10.0) | ||||||||||||||||||||||||||||||||
| Securities and custody | 287 | 220 | 30.5 | 507 | 452 | 12.2 | ||||||||||||||||||||||||||||||||
| Net fee income | 2,283 | 2,853 | (20.0) | 5,136 | 5,863 | (12.4) | ||||||||||||||||||||||||||||||||
| Operating expenses. Consolidated | ||||||||||||||||||||||||||||||||||||||
| EUR million | ||||||||||||||||||||||||||||||||||||||
| Q2'20 | Q1'20 | Change (%) | H1'20 | H1'19 | Change (%) | |||||||||||||||||||||||||||||||||
| Staff costs | 2,568 | 2,899 | (11.4) | 5,467 | 6,080 | (10.1) | ||||||||||||||||||||||||||||||||
| Other general administrative expenses | 1,818 | 1,949 | (6.7) | 3,767 | 4,030 | (6.5) | ||||||||||||||||||||||||||||||||
| Information technology | 523 | 498 | 5.0 | 1,021 | 1,113 | (8.3) | ||||||||||||||||||||||||||||||||
| Communications | 113 | 133 | (15.0) | 246 | 264 | (6.8) | ||||||||||||||||||||||||||||||||
| Advertising | 123 | 136 | (9.6) | 259 | 325 | (20.3) | ||||||||||||||||||||||||||||||||
| Buildings and premises | 174 | 210 | (17.1) | 384 | 429 | (10.5) | ||||||||||||||||||||||||||||||||
| Printed and office material | 28 | 26 | 7.7 | 54 | 63 | (14.3) | ||||||||||||||||||||||||||||||||
| Taxes (other than tax on profits) | 114 | 138 | (17.4) | 252 | 264 | (4.5) | ||||||||||||||||||||||||||||||||
| Other expenses | 743 | 808 | (8.0) | 1,551 | 1,572 | (1.3) | ||||||||||||||||||||||||||||||||
| Administrative expenses | 4,386 | 4,848 | (9.5) | 9,234 | 10,110 | (8.7) | ||||||||||||||||||||||||||||||||
| Depreciation and amortisation | 690 | 729 | (5.3) | 1,419 | 1,477 | (3.9) | ||||||||||||||||||||||||||||||||
| Operating expenses | 5,076 | 5,577 | (9.0) | 10,653 | 11,587 | (8.1) | ||||||||||||||||||||||||||||||||
| Operating means. Consolidated | |||||||||||||||||||||||||||||||||||||||||
| Employees | Branches | ||||||||||||||||||||||||||||||||||||||||
| Jun-20 | Jun-19 | Change | Jun-20 | Jun-19 | Change | ||||||||||||||||||||||||||||||||||||
| Europe | 85,215 | 91,488 | (6,273) | 5,309 | 6,427 | (1,118) | |||||||||||||||||||||||||||||||||||
| Spain | 27,261 | 30,682 | (3,421) | 3,222 | 4,247 | (1,025) | |||||||||||||||||||||||||||||||||||
| Santander Consumer Finance | 13,716 | 14,494 | (778) | 407 | 424 | (17) | |||||||||||||||||||||||||||||||||||
| United Kingdom | 24,161 | 25,761 | (1,600) | 615 | 659 | (44) | |||||||||||||||||||||||||||||||||||
| Portugal | 6,506 | 6,736 | (230) | 525 | 553 | (28) | |||||||||||||||||||||||||||||||||||
| Poland | 10,968 | 11,488 | (520) | 529 | 532 | (3) | |||||||||||||||||||||||||||||||||||
| Other | 2,603 | 2,327 | 276 | 11 | 12 | (1) | |||||||||||||||||||||||||||||||||||
| North America | 38,116 | 36,917 | 1,199 | 2,043 | 2,062 | (19) | |||||||||||||||||||||||||||||||||||
| US | 17,299 | 17,381 | (82) | 614 | 646 | (32) | |||||||||||||||||||||||||||||||||||
| Mexico | 20,817 | 19,536 | 1,281 | 1,429 | 1,416 | 13 | |||||||||||||||||||||||||||||||||||
| South America | 67,652 | 71,158 | (3,506) | 4,494 | 4,591 | (97) | |||||||||||||||||||||||||||||||||||
| Brazil | 44,951 | 48,118 | (3,167) | 3,585 | 3,643 | (58) | |||||||||||||||||||||||||||||||||||
| Chile | 11,405 | 11,797 | (392) | 367 | 380 | (13) | |||||||||||||||||||||||||||||||||||
| Argentina | 9,244 | 9,183 | 61 | 438 | 469 | (31) | |||||||||||||||||||||||||||||||||||
| Other | 2,052 | 2,060 | (8) | 104 | 99 | 5 | |||||||||||||||||||||||||||||||||||
| Santander Global Platform | 1,528 | 597 | 931 | 1 | 1 | — | |||||||||||||||||||||||||||||||||||
| Corporate Centre | 1,773 | 1,644 | 129 | ||||||||||||||||||||||||||||||||||||||
| Total Group | 194,284 | 201,804 | (7,520) | 11,847 | 13,081 | (1,234) | |||||||||||||||||||||||||||||||||||
| Net loan-loss provisions. Consolidated | ||||||||||||||||||||||||||||||||||||||
| EUR million | ||||||||||||||||||||||||||||||||||||||
| Q2'20 | Q1'20 | Change (%) | H1'20 | H1'19 | Change (%) | |||||||||||||||||||||||||||||||||
| Non-performing loans | 3,361 | 4,216 | (20.3) | 7,577 | 5,152 | 47.1 | ||||||||||||||||||||||||||||||||
| Country-risk | (1) | (6) | (83.3) | (7) | (1) | 600.0 | ||||||||||||||||||||||||||||||||
| Recovery of written-off assets | (242) | (301) | (19.6) | (543) | (838) | (35.2) | ||||||||||||||||||||||||||||||||
| Net loan-loss provisions | 3,118 | 3,909 | (20.2) | 7,027 | 4,313 | 62.9 | ||||||||||||||||||||||||||||||||
| 58 | | January - June 2020 | ||||||
| Response to the COVID-19 crisis Business model | ||||||||||||||||||||||||||
| Group financial information | ||||||||||||||||||||||||||
| Loans and advances to customers. Consolidated | ||||||||||||||||||||||||||||||||
| EUR million | ||||||||||||||||||||||||||||||||
| Change | ||||||||||||||||||||||||||||||||
| Jun-20 | Jun-19 | Absolute | % | Dec-19 | ||||||||||||||||||||||||||||
| Commercial bills | 30,354 | 34,275 | (3,921) | (11.4) | 37,753 | |||||||||||||||||||||||||||
| Secured loans | 508,292 | 495,091 | 13,201 | 2.7 | 513,929 | |||||||||||||||||||||||||||
| Other term loans | 275,762 | 270,244 | 5,518 | 2.0 | 267,138 | |||||||||||||||||||||||||||
| Finance leases | 35,401 | 34,534 | 867 | 2.5 | 35,788 | |||||||||||||||||||||||||||
| Receivable on demand | 10,194 | 8,689 | 1,505 | 17.3 | 7,714 | |||||||||||||||||||||||||||
| Credit cards receivable | 17,341 | 23,031 | (5,690) | (24.7) | 23,876 | |||||||||||||||||||||||||||
| Impaired assets | 31,754 | 33,045 | (1,291) | (3.9) | 32,559 | |||||||||||||||||||||||||||
| Gross loans and advances to customers (excl. reverse repos) | 909,098 | 898,909 | 10,189 | 1.1 | 918,757 | |||||||||||||||||||||||||||
| Reverse repos | 48,681 | 32,049 | 16,632 | 51.9 | 45,703 | |||||||||||||||||||||||||||
| Gross loans and advances to customers | 957,779 | 930,958 | 26,821 | 2.9 | 964,460 | |||||||||||||||||||||||||||
| Loan-loss allowances | 22,983 | 22,723 | 260 | 1.1 | 22,242 | |||||||||||||||||||||||||||
| Loans and advances to customers | 934,796 | 908,235 | 26,561 | 2.9 | 942,218 | |||||||||||||||||||||||||||
| Total funds. Consolidated | ||||||||||||||||||||||||||||||||
| EUR million | ||||||||||||||||||||||||||||||||
| Change | ||||||||||||||||||||||||||||||||
| Jun-20 | Jun-19 | Absolute | % | Dec-19 | ||||||||||||||||||||||||||||
| Demand deposits | 618,832 | 573,079 | 45,753 | 8.0 | 588,534 | |||||||||||||||||||||||||||
| Time deposits | 187,518 | 206,431 | (18,913) | (9.2) | 196,920 | |||||||||||||||||||||||||||
| Mutual funds | 152,040 | 174,294 | (22,254) | (12.8) | 180,405 | |||||||||||||||||||||||||||
| Customer funds | 958,390 | 953,804 | 4,586 | 0.5 | 965,859 | |||||||||||||||||||||||||||
| Pension funds | 15,086 | 15,602 | (516) | (3.3) | 15,878 | |||||||||||||||||||||||||||
| Managed portfolios | 26,038 | 28,122 | (2,084) | (7.4) | 30,117 | |||||||||||||||||||||||||||
| Repos | 40,482 | 35,241 | 5,241 | 14.9 | 38,911 | |||||||||||||||||||||||||||
| Total funds | 1,039,996 | 1,032,769 | 7,227 | 0.7 | 1,050,765 | |||||||||||||||||||||||||||
| Eligible capital (fully loaded). Consolidated | ||||||||||||||||||||||||||||||||
| EUR million | ||||||||||||||||||||||||||||||||
| Change | ||||||||||||||||||||||||||||||||
| Jun-20 | Jun-19 | Absolute | % | Dec-19 | ||||||||||||||||||||||||||||
| Capital stock and reserves | 125,322 | 119,650 | 5,672 | 4.7 | 120,260 | |||||||||||||||||||||||||||
| Attributable profit | (10,798) | 3,231 | (14,029) | — | 6,515 | |||||||||||||||||||||||||||
| Dividends | — | (1,615) | 1,615 | (100.0) | (3,423) | |||||||||||||||||||||||||||
| Other retained earnings | (33,171) | (24,888) | (8,283) | 33.3 | (25,385) | |||||||||||||||||||||||||||
| Minority interests | 6,639 | 6,893 | (254) | (3.7) | 6,441 | |||||||||||||||||||||||||||
| Goodwill and intangible assets | (16,952) | (28,810) | 11,859 | (41.2) | (28,478) | |||||||||||||||||||||||||||
| Other deductions | (3,847) | (6,054) | 2,207 | (36.5) | (5,432) | |||||||||||||||||||||||||||
| Core CET1 | 67,192 | 68,406 | (1,213) | (1.8) | 70,497 | |||||||||||||||||||||||||||
| Preferred shares and other eligible T1 | 8,727 | 8,690 | 37 | 0.4 | 8,467 | |||||||||||||||||||||||||||
| Tier 1 | 75,920 | 77,096 | (1,176) | (1.5) | 78,964 | |||||||||||||||||||||||||||
| Generic funds and eligible T2 instruments | 11,830 | 12,544 | (713) | (5.7) | 11,973 | |||||||||||||||||||||||||||
| Eligible capital | 87,750 | 89,640 | (1,890) | (2.1) | 90,937 | |||||||||||||||||||||||||||
| Risk-weighted assets | 567,446 | 605,470 | (38,024) | (6.3) | 605,244 | |||||||||||||||||||||||||||
| CET1 capital ratio | 11.84 | 11.30 | 0.54 | 11.65 | ||||||||||||||||||||||||||||
| T1 capital ratio | 13.38 | 12.73 | 0.65 | 13.05 | ||||||||||||||||||||||||||||
| Total capital ratio | 15.46 | 14.80 | 0.66 | 15.02 | ||||||||||||||||||||||||||||
January - June 2020 | | 59 | ||||||
| EUROPE | |||||||||||||||||||||||||||||||||||||||||
| EUR million | |||||||||||||||||||||||||||||||||||||||||
| / | Q1'20 | / | H1'19 | ||||||||||||||||||||||||||||||||||||||
| Underlying income statement | Q2'20 | % | % excl. FX | H1'20 | % | % excl. FX | |||||||||||||||||||||||||||||||||||
| Net interest income | 3,352 | (2.4) | (1.0) | 6,787 | (5.0) | (4.3) | |||||||||||||||||||||||||||||||||||
| Net fee income | 1,098 | (16.5) | (15.7) | 2,413 | (8.3) | (8.0) | |||||||||||||||||||||||||||||||||||
Gains (losses) on financial transactions (1) | 216 | 51.6 | 51.3 | 358 | 7.8 | 7.8 | |||||||||||||||||||||||||||||||||||
| Other operating income | (89) | — | — | (7) | — | — | |||||||||||||||||||||||||||||||||||
| Total income | 4,577 | (8.0) | (6.9) | 9,551 | (8.3) | (7.8) | |||||||||||||||||||||||||||||||||||
| Administrative expenses and amortisations | (2,526) | (6.9) | (5.7) | (5,237) | (6.3) | (5.9) | |||||||||||||||||||||||||||||||||||
| Net operating income | 2,051 | (9.4) | (8.3) | 4,314 | (10.6) | (9.9) | |||||||||||||||||||||||||||||||||||
| Net loan-loss provisions | (877) | (34.3) | (33.5) | (2,211) | 162.1 | 163.0 | |||||||||||||||||||||||||||||||||||
| Other gains (losses) and provisions | (160) | (18.0) | (16.0) | (355) | (17.2) | (16.8) | |||||||||||||||||||||||||||||||||||
| Profit before tax | 1,014 | 38.3 | 39.9 | 1,747 | (50.8) | (50.4) | |||||||||||||||||||||||||||||||||||
| Tax on profit | (275) | 26.4 | 27.6 | (492) | (49.1) | (48.7) | |||||||||||||||||||||||||||||||||||
| Profit from continuing operations | 739 | 43.4 | 45.1 | 1,255 | (51.4) | (51.0) | |||||||||||||||||||||||||||||||||||
| Net profit from discontinued operations | — | — | — | — | — | — | |||||||||||||||||||||||||||||||||||
| Consolidated profit | 739 | 43.4 | 45.1 | 1,255 | (51.4) | (51.0) | |||||||||||||||||||||||||||||||||||
| Non-controlling interests | (107) | 46.6 | 47.9 | (180) | (21.5) | (20.8) | |||||||||||||||||||||||||||||||||||
| Underlying attributable profit to the parent | 632 | 42.9 | 44.7 | 1,075 | (54.3) | (54.0) | |||||||||||||||||||||||||||||||||||
| Balance sheet | |||||||||||||||||||||||||||||||||||||||||
| Loans and advances to customers | 684,446 | 0.6 | 1.4 | 684,446 | 5.3 | 6.3 | |||||||||||||||||||||||||||||||||||
| Cash, central banks and credit institutions | 258,158 | 36.2 | 36.8 | 258,158 | 28.5 | 29.1 | |||||||||||||||||||||||||||||||||||
| Debt instruments | 91,038 | 10.9 | 11.1 | 91,038 | (20.0) | (19.4) | |||||||||||||||||||||||||||||||||||
| Other financial assets | 54,171 | (10.9) | (10.8) | 54,171 | 5.2 | 5.3 | |||||||||||||||||||||||||||||||||||
| Other asset accounts | 45,211 | (5.2) | (4.6) | 45,211 | 5.2 | 5.8 | |||||||||||||||||||||||||||||||||||
| Total assets | 1,133,025 | 6.8 | 7.5 | 1,133,025 | 7.0 | 7.8 | |||||||||||||||||||||||||||||||||||
| Customer deposits | 610,021 | 5.0 | 5.8 | 610,021 | 3.5 | 4.4 | |||||||||||||||||||||||||||||||||||
| Central banks and credit institutions | 251,351 | 27.0 | 27.6 | 251,351 | 22.8 | 23.2 | |||||||||||||||||||||||||||||||||||
| Marketable debt securities | 128,570 | (5.5) | (4.5) | 128,570 | (0.8) | 0.3 | |||||||||||||||||||||||||||||||||||
| Other financial liabilities | 71,538 | (0.8) | (0.7) | 71,538 | 13.3 | 13.5 | |||||||||||||||||||||||||||||||||||
| Other liabilities accounts | 17,002 | (4.9) | (4.5) | 17,002 | (2.7) | (1.9) | |||||||||||||||||||||||||||||||||||
| Total liabilities | 1,078,482 | 7.3 | 8.1 | 1,078,482 | 7.4 | 8.2 | |||||||||||||||||||||||||||||||||||
| Total equity | 54,543 | (2.2) | (1.8) | 54,543 | (0.2) | 1.1 | |||||||||||||||||||||||||||||||||||
| Memorandum items: | |||||||||||||||||||||||||||||||||||||||||
Gross loans and advances to customers (2) | 656,001 | 0.5 | 1.3 | 656,001 | 2.8 | 3.8 | |||||||||||||||||||||||||||||||||||
| Customer funds | 672,341 | 4.4 | 5.1 | 672,341 | 2.1 | 2.9 | |||||||||||||||||||||||||||||||||||
Customer deposits (3) | 588,886 | 3.8 | 4.5 | 588,886 | 2.7 | 3.6 | |||||||||||||||||||||||||||||||||||
| Mutual funds | 83,455 | 8.7 | 8.8 | 83,455 | (1.7) | (1.3) | |||||||||||||||||||||||||||||||||||
| Ratios (%) and operating means | |||||||||||||||||||||||||||||||||||||||||
| Underlying RoTE | 5.27 | 1.65 | 4.44 | (5.28) | |||||||||||||||||||||||||||||||||||||
| Efficiency ratio | 55.2 | 0.7 | 54.8 | 1.1 | |||||||||||||||||||||||||||||||||||||
| NPL ratio | 3.24 | 0.05 | 3.24 | (0.24) | |||||||||||||||||||||||||||||||||||||
| NPL coverage | 53.4 | (0.7) | 53.4 | 3.5 | |||||||||||||||||||||||||||||||||||||
| Number of employees | 85,215 | (0.7) | 85,215 | (6.9) | |||||||||||||||||||||||||||||||||||||
| Number of branches | 5,309 | (0.4) | 5,309 | (17.4) | |||||||||||||||||||||||||||||||||||||
(1) Includes exchange differences.
(2) Excluding reverse repos.
(3) Excluding repos.
| 60 | | January - June 2020 | ||||||
| Spain | |||||||||||||||||
| EUR million | |||||||||||||||||
| / Q1'20 | / H1'19 | ||||||||||||||||
| Underlying income statement | Q2'20 | % | H1'20 | % | |||||||||||||
| Net interest income | 931 | 0.6 | 1,856 | (8.0) | |||||||||||||
| Net fee income | 535 | (16.8) | 1,178 | (5.5) | |||||||||||||
Gains (losses) on financial transactions (1) | 250 | 60.2 | 407 | 22.0 | |||||||||||||
| Other operating income | (154) | — | (90) | — | |||||||||||||
| Total income | 1,562 | (12.7) | 3,350 | (9.6) | |||||||||||||
| Administrative expenses and amortisations | (896) | (5.1) | (1,841) | (10.0) | |||||||||||||
| Net operating income | 665 | (21.2) | 1,509 | (9.1) | |||||||||||||
| Net loan-loss provisions | (313) | (50.3) | (941) | 100.1 | |||||||||||||
| Other gains (losses) and provisions | (115) | 11.0 | (219) | (14.3) | |||||||||||||
| Profit before tax | 237 | 112.0 | 350 | (62.6) | |||||||||||||
| Tax on profit | (77) | 245.9 | (99) | (59.0) | |||||||||||||
| Profit from continuing operations | 160 | 78.8 | 250 | (63.9) | |||||||||||||
| Net profit from discontinued operations | — | — | — | — | |||||||||||||
| Consolidated profit | 160 | 78.8 | 250 | (63.9) | |||||||||||||
| Non-controlling interests | — | — | — | (12.1) | |||||||||||||
| Underlying attributable profit to the parent | 161 | 79.1 | 251 | (63.9) | |||||||||||||
| Balance sheet | |||||||||||||||||
| Loans and advances to customers | 197,424 | 6.2 | 197,424 | 1.5 | |||||||||||||
| Cash, central banks and credit institutions | 108,381 | 38.2 | 108,381 | 24.3 | |||||||||||||
| Debt instruments | 25,100 | 2.6 | 25,100 | (36.1) | |||||||||||||
| Other financial assets | 1,661 | 18.0 | 1,661 | 13.0 | |||||||||||||
| Other asset accounts | 23,203 | (8.0) | 23,203 | 3.3 | |||||||||||||
| Total assets | 355,769 | 12.8 | 355,769 | 3.2 | |||||||||||||
| Customer deposits | 248,053 | 5.7 | 248,053 | (1.6) | |||||||||||||
| Central banks and credit institutions | 46,942 | 132.1 | 46,942 | 23.5 | |||||||||||||
| Marketable debt securities | 27,377 | (7.2) | 27,377 | 10.2 | |||||||||||||
| Other financial liabilities | 12,370 | 37.9 | 12,370 | 39.9 | |||||||||||||
| Other liabilities accounts | 5,159 | (17.2) | 5,159 | (15.3) | |||||||||||||
| Total liabilities | 339,901 | 13.4 | 339,901 | 3.1 | |||||||||||||
| Total equity | 15,868 | 0.7 | 15,868 | 5.8 | |||||||||||||
| Memorandum items: | |||||||||||||||||
Gross loans and advances to customers (2) | 203,811 | 5.9 | 203,811 | 1.4 | |||||||||||||
| Customer funds | 311,824 | 6.1 | 311,824 | (1.7) | |||||||||||||
Customer deposits (3) | 248,053 | 5.7 | 248,053 | (1.2) | |||||||||||||
| Mutual funds | 63,770 | 7.8 | 63,770 | (3.4) | |||||||||||||
| Ratios (%) and operating means | |||||||||||||||||
| Underlying RoTE | 4.19 | 1.89 | 3.24 | (6.07) | |||||||||||||
| Efficiency ratio | 57.4 | 4.6 | 54.9 | (0.2) | |||||||||||||
| NPL ratio | 6.55 | (0.33) | 6.55 | (0.47) | |||||||||||||
| NPL coverage | 43.3 | (1.3) | 43.3 | 0.4 | |||||||||||||
| Number of employees | 27,261 | (0.3) | 27,261 | (11.1) | |||||||||||||
| Number of branches | 3,222 | 0.0 | 3,222 | (24.1) | |||||||||||||
(1) Includes exchange differences.
(2) Excluding reverse repos.
(3) Excluding repos.
January - June 2020 | | 61 | ||||||
| Santander Consumer Finance | |||||||||||||||||||||||||||||||||||||||||
| EUR million | |||||||||||||||||||||||||||||||||||||||||
| / | Q1'20 | / | H1'19 | ||||||||||||||||||||||||||||||||||||||
| Underlying income statement | Q2'20 | % | % excl. FX | H1'20 | % | % excl. FX | |||||||||||||||||||||||||||||||||||
| Net interest income | 947 | (3.2) | (2.0) | 1,926 | 0.8 | 2.5 | |||||||||||||||||||||||||||||||||||
| Net fee income | 159 | (14.9) | (14.6) | 345 | (16.7) | (16.3) | |||||||||||||||||||||||||||||||||||
Gains (losses) on financial transactions (1) | 5 | — | — | (5) | — | — | |||||||||||||||||||||||||||||||||||
| Other operating income | (16) | — | — | (1) | (88.3) | (88.8) | |||||||||||||||||||||||||||||||||||
| Total income | 1,095 | (6.4) | (5.4) | 2,266 | (2.4) | (0.9) | |||||||||||||||||||||||||||||||||||
| Administrative expenses and amortisations | (469) | (8.8) | (7.9) | (983) | (5.0) | (3.6) | |||||||||||||||||||||||||||||||||||
| Net operating income | 626 | (4.6) | (3.5) | 1,283 | (0.3) | 1.4 | |||||||||||||||||||||||||||||||||||
| Net loan-loss provisions | (184) | (42.1) | (41.4) | (501) | 176.9 | 177.1 | |||||||||||||||||||||||||||||||||||
| Other gains (losses) and provisions | 23 | (48.1) | (49.0) | 67 | 480.6 | 450.1 | |||||||||||||||||||||||||||||||||||
| Profit before tax | 466 | 21.5 | 22.6 | 849 | (24.0) | (22.6) | |||||||||||||||||||||||||||||||||||
| Tax on profit | (132) | 23.7 | 24.2 | (239) | (23.8) | (22.6) | |||||||||||||||||||||||||||||||||||
| Profit from continuing operations | 333 | 20.6 | 21.9 | 610 | (24.1) | (22.6) | |||||||||||||||||||||||||||||||||||
| Net profit from discontinued operations | — | — | — | — | — | — | |||||||||||||||||||||||||||||||||||
| Consolidated profit | 333 | 20.6 | 21.9 | 610 | (24.1) | (22.6) | |||||||||||||||||||||||||||||||||||
| Non-controlling interests | (76) | 32.4 | 32.9 | (133) | (8.7) | (8.5) | |||||||||||||||||||||||||||||||||||
| Underlying attributable profit to the parent | 258 | 17.5 | 19.1 | 477 | (27.5) | (25.8) | |||||||||||||||||||||||||||||||||||
| Balance sheet | |||||||||||||||||||||||||||||||||||||||||
| Loans and advances to customers | 99,255 | (0.6) | (1.4) | 99,255 | 0.9 | 2.5 | |||||||||||||||||||||||||||||||||||
| Cash, central banks and credit institutions | 9,831 | (19.3) | (20.2) | 9,831 | 44.6 | 47.7 | |||||||||||||||||||||||||||||||||||
| Debt instruments | 4,565 | 68.4 | 64.7 | 4,565 | 38.8 | 43.3 | |||||||||||||||||||||||||||||||||||
| Other financial assets | 31 | (21.5) | (21.9) | 31 | (18.9) | (17.8) | |||||||||||||||||||||||||||||||||||
| Other asset accounts | 4,117 | 3.3 | 2.6 | 4,117 | 0.4 | 1.4 | |||||||||||||||||||||||||||||||||||
| Total assets | 117,799 | (0.8) | (1.7) | 117,799 | 4.6 | 6.3 | |||||||||||||||||||||||||||||||||||
| Customer deposits | 38,307 | 0.5 | (0.7) | 38,307 | 1.1 | 3.2 | |||||||||||||||||||||||||||||||||||
| Central banks and credit institutions | 29,094 | 3.0 | 2.3 | 29,094 | 15.9 | 17.2 | |||||||||||||||||||||||||||||||||||
| Marketable debt securities | 34,691 | (6.1) | (6.7) | 34,691 | 2.2 | 3.7 | |||||||||||||||||||||||||||||||||||
| Other financial liabilities | 1,411 | 30.6 | 29.5 | 1,411 | 1.1 | 1.7 | |||||||||||||||||||||||||||||||||||
| Other liabilities accounts | 3,610 | 3.9 | 3.3 | 3,610 | (7.5) | (6.6) | |||||||||||||||||||||||||||||||||||
| Total liabilities | 107,113 | (0.7) | (1.5) | 107,113 | 4.8 | 6.4 | |||||||||||||||||||||||||||||||||||
| Total equity | 10,686 | (2.1) | (3.3) | 10,686 | 3.0 | 5.5 | |||||||||||||||||||||||||||||||||||
| Memorandum items: | |||||||||||||||||||||||||||||||||||||||||
Gross loans and advances to customers (2) | 101,955 | (0.6) | (1.4) | 101,955 | 1.2 | 2.8 | |||||||||||||||||||||||||||||||||||
| Customer funds | 38,307 | 0.5 | (0.7) | 38,307 | 1.1 | 3.2 | |||||||||||||||||||||||||||||||||||
Customer deposits (3) | 38,307 | 0.5 | (0.7) | 38,307 | 1.1 | 3.2 | |||||||||||||||||||||||||||||||||||
| Mutual funds | — | — | — | — | — | — | |||||||||||||||||||||||||||||||||||
| Ratios (%) and operating means | |||||||||||||||||||||||||||||||||||||||||
| Underlying RoTE | 12.04 | 2.02 | 11.02 | (4.34) | |||||||||||||||||||||||||||||||||||||
| Efficiency ratio | 42.8 | (1.1) | 43.4 | (1.2) | |||||||||||||||||||||||||||||||||||||
| NPL ratio | 2.52 | 0.09 | 2.52 | 0.28 | |||||||||||||||||||||||||||||||||||||
| NPL coverage | 106.1 | (3.5) | 106.1 | 0.2 | |||||||||||||||||||||||||||||||||||||
| Number of employees | 13,716 | (1.0) | 13,716 | (5.4) | |||||||||||||||||||||||||||||||||||||
| Number of branches | 407 | (2.4) | 407 | (4.0) | |||||||||||||||||||||||||||||||||||||
(1) Includes exchange differences.
(2) Excluding reverse repos.
(3) Excluding repos.
| 62 | | January - June 2020 | ||||||
| United Kingdom | |||||||||||||||||||||||||||||||||||||||||
| EUR million | |||||||||||||||||||||||||||||||||||||||||
| / | Q1'20 | / | H1'19 | ||||||||||||||||||||||||||||||||||||||
| Underlying income statement | Q2'20 | % | % excl. FX | H1'20 | % | % excl. FX | |||||||||||||||||||||||||||||||||||
| Net interest income | 871 | (3.1) | (0.2) | 1,769 | (7.8) | (7.7) | |||||||||||||||||||||||||||||||||||
| Net fee income | 96 | (50.1) | (47.9) | 290 | (31.6) | (31.6) | |||||||||||||||||||||||||||||||||||
Gains (losses) on financial transactions (1) | — | (96.8) | (95.3) | (7) | — | — | |||||||||||||||||||||||||||||||||||
| Other operating income | 12 | (9.5) | (6.7) | 25 | (3.4) | (3.4) | |||||||||||||||||||||||||||||||||||
| Total income | 979 | (10.8) | (8.0) | 2,077 | (13.0) | (13.0) | |||||||||||||||||||||||||||||||||||
| Administrative expenses and amortisations | (656) | (8.1) | (5.3) | (1,370) | (5.0) | (4.9) | |||||||||||||||||||||||||||||||||||
| Net operating income | 323 | (15.9) | (13.2) | 707 | (25.3) | (25.2) | |||||||||||||||||||||||||||||||||||
| Net loan-loss provisions | (239) | 25.2 | 28.5 | (430) | 437.0 | 437.5 | |||||||||||||||||||||||||||||||||||
| Other gains (losses) and provisions | (4) | (94.1) | (92.6) | (79) | 5.5 | 5.6 | |||||||||||||||||||||||||||||||||||
| Profit before tax | 80 | (33.0) | (30.5) | 198 | (75.0) | (75.0) | |||||||||||||||||||||||||||||||||||
| Tax on profit | (18) | (35.1) | (32.7) | (46) | (76.7) | (76.7) | |||||||||||||||||||||||||||||||||||
| Profit from continuing operations | 61 | (32.3) | (29.8) | 152 | (74.4) | (74.4) | |||||||||||||||||||||||||||||||||||
| Net profit from discontinued operations | — | — | — | — | — | — | |||||||||||||||||||||||||||||||||||
| Consolidated profit | 61 | (32.3) | (29.8) | 152 | (74.4) | (74.4) | |||||||||||||||||||||||||||||||||||
| Non-controlling interests | (7) | 13.9 | 17.0 | (13) | 21.6 | 21.7 | |||||||||||||||||||||||||||||||||||
| Underlying attributable profit to the parent | 54 | (35.6) | (33.2) | 139 | (76.1) | (76.1) | |||||||||||||||||||||||||||||||||||
| Balance sheet | |||||||||||||||||||||||||||||||||||||||||
| Loans and advances to customers | 260,157 | (2.9) | (0.3) | 260,157 | 3.4 | 4.9 | |||||||||||||||||||||||||||||||||||
| Cash, central banks and credit institutions | 48,060 | 27.9 | 31.3 | 48,060 | 18.6 | 20.3 | |||||||||||||||||||||||||||||||||||
| Debt instruments | 17,001 | 0.3 | 3.0 | 17,001 | (28.0) | (26.9) | |||||||||||||||||||||||||||||||||||
| Other financial assets | 1,475 | 33.7 | 37.2 | 1,475 | 35.0 | 37.0 | |||||||||||||||||||||||||||||||||||
| Other asset accounts | 10,543 | (14.1) | (11.9) | 10,543 | 2.1 | 3.6 | |||||||||||||||||||||||||||||||||||
| Total assets | 337,235 | 0.5 | 3.1 | 337,235 | 3.1 | 4.6 | |||||||||||||||||||||||||||||||||||
| Customer deposits | 225,223 | 4.2 | 7.0 | 225,223 | 6.7 | 8.3 | |||||||||||||||||||||||||||||||||||
| Central banks and credit institutions | 29,157 | (3.4) | (0.9) | 29,157 | 18.9 | 20.6 | |||||||||||||||||||||||||||||||||||
| Marketable debt securities | 59,928 | (6.5) | (4.0) | 59,928 | (8.1) | (6.8) | |||||||||||||||||||||||||||||||||||
| Other financial liabilities | 3,032 | (2.6) | 0.0 | 3,032 | (37.8) | (36.9) | |||||||||||||||||||||||||||||||||||
| Other liabilities accounts | 4,616 | (9.0) | (6.6) | 4,616 | 3.3 | 4.8 | |||||||||||||||||||||||||||||||||||
| Total liabilities | 321,956 | 1.1 | 3.7 | 321,956 | 3.8 | 5.3 | |||||||||||||||||||||||||||||||||||
| Total equity | 15,279 | (11.3) | (9.0) | 15,279 | (10.0) | (8.7) | |||||||||||||||||||||||||||||||||||
| Memorandum items: | |||||||||||||||||||||||||||||||||||||||||
Gross loans and advances to customers (2) | 237,561 | (2.5) | 0.1 | 237,561 | 2.3 | 3.8 | |||||||||||||||||||||||||||||||||||
| Customer funds | 213,146 | 1.4 | 4.0 | 213,146 | 3.9 | 5.5 | |||||||||||||||||||||||||||||||||||
Customer deposits (3) | 205,750 | 1.1 | 3.8 | 205,750 | 4.5 | 6.0 | |||||||||||||||||||||||||||||||||||
| Mutual funds | 7,396 | 8.0 | 10.9 | 7,396 | (9.1) | (7.8) | |||||||||||||||||||||||||||||||||||
| Ratios (%) and operating means | |||||||||||||||||||||||||||||||||||||||||
| Underlying RoTE | 1.54 | (0.78) | 1.95 | (5.86) | |||||||||||||||||||||||||||||||||||||
| Efficiency ratio | 67.0 | 2.0 | 66.0 | 5.6 | |||||||||||||||||||||||||||||||||||||
| NPL ratio | 1.08 | 0.12 | 1.08 | (0.05) | |||||||||||||||||||||||||||||||||||||
| NPL coverage | 46.0 | 3.0 | 46.0 | 14.1 | |||||||||||||||||||||||||||||||||||||
| Number of employees | 24,161 | (1.4) | 24,161 | (6.2) | |||||||||||||||||||||||||||||||||||||
| Number of branches | 615 | 0.0 | 615 | (6.7) | |||||||||||||||||||||||||||||||||||||
(1) Includes exchange differences.
(2) Excluding reverse repos.
(3) Excluding repos.
January - June 2020 | | 63 | ||||||
| Portugal | |||||||||||||||||
| EUR million | |||||||||||||||||
| / Q1'20 | / H1'19 | ||||||||||||||||
| Underlying income statement | Q2'20 | % | H1'20 | % | |||||||||||||
| Net interest income | 197 | (2.3) | 399 | (6.9) | |||||||||||||
| Net fee income | 90 | (11.0) | 191 | (2.9) | |||||||||||||
Gains (losses) on financial transactions (1) | 35 | (37.6) | 91 | (0.8) | |||||||||||||
| Other operating income | (5) | (42.6) | (14) | 145.1 | |||||||||||||
| Total income | 317 | (9.4) | 668 | (6.2) | |||||||||||||
| Administrative expenses and amortisations | (145) | (4.2) | (296) | (5.1) | |||||||||||||
| Net operating income | 172 | (13.4) | 372 | (7.0) | |||||||||||||
| Net loan-loss provisions | (24) | (70.0) | (105) | — | |||||||||||||
| Other gains (losses) and provisions | (16) | (23.4) | (37) | 13.3 | |||||||||||||
| Profit before tax | 132 | 35.2 | 230 | (39.3) | |||||||||||||
| Tax on profit | (41) | 36.9 | (70) | (40.6) | |||||||||||||
| Profit from continuing operations | 92 | 34.5 | 160 | (38.7) | |||||||||||||
| Net profit from discontinued operations | — | — | — | — | |||||||||||||
| Consolidated profit | 92 | 34.5 | 160 | (38.7) | |||||||||||||
| Non-controlling interests | — | (99.1) | — | (64.4) | |||||||||||||
| Underlying attributable profit to the parent | 92 | 35.2 | 160 | (38.6) | |||||||||||||
| Balance sheet | |||||||||||||||||
| Loans and advances to customers | 37,082 | 2.2 | 37,082 | 3.8 | |||||||||||||
| Cash, central banks and credit institutions | 8,769 | 70.7 | 8,769 | 117.9 | |||||||||||||
| Debt instruments | 11,782 | 3.8 | 11,782 | (11.0) | |||||||||||||
| Other financial assets | 1,530 | (1.4) | 1,530 | (15.4) | |||||||||||||
| Other asset accounts | 1,659 | (1.5) | 1,659 | (14.5) | |||||||||||||
| Total assets | 60,822 | 8.6 | 60,822 | 7.2 | |||||||||||||
| Customer deposits | 40,038 | 3.0 | 40,038 | 2.7 | |||||||||||||
| Central banks and credit institutions | 11,584 | 45.3 | 11,584 | 43.6 | |||||||||||||
| Marketable debt securities | 3,268 | (2.1) | 3,268 | (4.6) | |||||||||||||
| Other financial liabilities | 256 | (14.9) | 256 | (21.4) | |||||||||||||
| Other liabilities accounts | 1,784 | 7.1 | 1,784 | 4.9 | |||||||||||||
| Total liabilities | 56,930 | 9.1 | 56,930 | 8.5 | |||||||||||||
| Total equity | 3,892 | 1.1 | 3,892 | (8.5) | |||||||||||||
| Memorandum items: | |||||||||||||||||
Gross loans and advances to customers (2) | 38,097 | 2.2 | 38,097 | 3.8 | |||||||||||||
| Customer funds | 42,922 | 3.2 | 42,922 | 2.7 | |||||||||||||
Customer deposits (3) | 40,038 | 3.0 | 40,038 | 2.7 | |||||||||||||
| Mutual funds | 2,884 | 6.8 | 2,884 | 2.7 | |||||||||||||
| Ratios (%) and operating means | |||||||||||||||||
| Underlying RoTE | 9.60 | 2.24 | 8.52 | (4.03) | |||||||||||||
| Efficiency ratio | 45.6 | 2.5 | 44.3 | 0.5 | |||||||||||||
| NPL ratio | 4.43 | (0.13) | 4.43 | (0.57) | |||||||||||||
| NPL coverage | 60.9 | 1.9 | 60.9 | 8.0 | |||||||||||||
| Number of employees | 6,506 | (0.1) | 6,506 | (3.4) | |||||||||||||
| Number of branches | 525 | (0.8) | 525 | (5.1) | |||||||||||||
(1) Includes exchange differences.
(2) Excluding reverse repos.
(3) Excluding repos.
| 64 | | January - June 2020 | ||||||
| Poland | |||||||||||||||||||||||||||||||||||||||||
| EUR million | |||||||||||||||||||||||||||||||||||||||||
| / | Q1'20 | / | H1'19 | ||||||||||||||||||||||||||||||||||||||
| Underlying income statement | Q2'20 | % | % excl. FX | H1'20 | % | % excl. FX | |||||||||||||||||||||||||||||||||||
| Net interest income | 251 | (15.1) | (11.3) | 547 | (3.1) | (0.5) | |||||||||||||||||||||||||||||||||||
| Net fee income | 104 | (11.1) | (7.2) | 220 | (4.4) | (1.7) | |||||||||||||||||||||||||||||||||||
Gains (losses) on financial transactions (1) | 21 | 154.5 | 161.8 | 30 | (24.7) | (22.6) | |||||||||||||||||||||||||||||||||||
| Other operating income | 1 | — | — | (55) | 210.0 | 218.4 | |||||||||||||||||||||||||||||||||||
| Total income | 377 | 3.5 | 7.6 | 742 | (9.1) | (6.6) | |||||||||||||||||||||||||||||||||||
| Administrative expenses and amortisations | (143) | (16.7) | (13.0) | (315) | (10.0) | (7.5) | |||||||||||||||||||||||||||||||||||
| Net operating income | 235 | 21.5 | 26.0 | 428 | (8.5) | (6.0) | |||||||||||||||||||||||||||||||||||
| Net loan-loss provisions | (89) | (6.8) | (2.8) | (184) | 72.3 | 77.0 | |||||||||||||||||||||||||||||||||||
| Other gains (losses) and provisions | (40) | 12.3 | 16.6 | (76) | 12.5 | 15.6 | |||||||||||||||||||||||||||||||||||
| Profit before tax | 105 | 70.0 | 75.5 | 167 | (42.8) | (41.2) | |||||||||||||||||||||||||||||||||||
| Tax on profit | (31) | 5.9 | 10.1 | (61) | (16.7) | (14.4) | |||||||||||||||||||||||||||||||||||
| Profit from continuing operations | 74 | 129.0 | 135.7 | 106 | (51.5) | (50.2) | |||||||||||||||||||||||||||||||||||
| Net profit from discontinued operations | — | — | — | — | — | — | |||||||||||||||||||||||||||||||||||
| Consolidated profit | 74 | 129.0 | 135.7 | 106 | (51.5) | (50.2) | |||||||||||||||||||||||||||||||||||
| Non-controlling interests | (23) | 142.8 | 149.8 | (33) | (52.5) | (51.2) | |||||||||||||||||||||||||||||||||||
| Underlying attributable profit to the parent | 51 | 123.1 | 129.7 | 73 | (51.1) | (49.7) | |||||||||||||||||||||||||||||||||||
| Balance sheet | |||||||||||||||||||||||||||||||||||||||||
| Loans and advances to customers | 29,186 | 0.0 | (2.4) | 29,186 | (0.5) | 4.0 | |||||||||||||||||||||||||||||||||||
| Cash, central banks and credit institutions | 3,004 | (15.3) | (17.3) | 3,004 | 0.6 | 5.2 | |||||||||||||||||||||||||||||||||||
| Debt instruments | 12,128 | 41.4 | 38.1 | 12,128 | 17.0 | 22.3 | |||||||||||||||||||||||||||||||||||
| Other financial assets | 511 | (31.0) | (32.6) | 511 | (9.5) | (5.4) | |||||||||||||||||||||||||||||||||||
| Other asset accounts | 1,367 | 2.4 | 0.0 | 1,367 | 3.0 | 7.7 | |||||||||||||||||||||||||||||||||||
| Total assets | 46,197 | 6.5 | 4.0 | 46,197 | 3.6 | 8.3 | |||||||||||||||||||||||||||||||||||
| Customer deposits | 34,317 | 8.3 | 5.8 | 34,317 | 4.8 | 9.5 | |||||||||||||||||||||||||||||||||||
| Central banks and credit institutions | 2,896 | 17.5 | 14.8 | 2,896 | (10.7) | (6.6) | |||||||||||||||||||||||||||||||||||
| Marketable debt securities | 2,056 | (12.9) | (14.9) | 2,056 | (1.7) | 2.8 | |||||||||||||||||||||||||||||||||||
| Other financial liabilities | 680 | (17.7) | (19.7) | 680 | (16.5) | (12.7) | |||||||||||||||||||||||||||||||||||
| Other liabilities accounts | 1,182 | (2.9) | (5.1) | 1,182 | 32.2 | 38.2 | |||||||||||||||||||||||||||||||||||
| Total liabilities | 41,131 | 6.7 | 4.2 | 41,131 | 3.3 | 8.1 | |||||||||||||||||||||||||||||||||||
| Total equity | 5,065 | 4.7 | 2.3 | 5,065 | 5.7 | 10.6 | |||||||||||||||||||||||||||||||||||
| Memorandum items: | |||||||||||||||||||||||||||||||||||||||||
Gross loans and advances to customers (2) | 30,151 | 0.3 | (2.1) | 30,151 | (0.4) | 4.1 | |||||||||||||||||||||||||||||||||||
| Customer funds | 37,623 | 8.5 | 6.0 | 37,623 | 4.3 | 9.1 | |||||||||||||||||||||||||||||||||||
Customer deposits (3) | 34,303 | 8.3 | 5.8 | 34,303 | 7.6 | 12.6 | |||||||||||||||||||||||||||||||||||
| Mutual funds | 3,320 | 11.1 | 8.5 | 3,320 | (20.8) | (17.2) | |||||||||||||||||||||||||||||||||||
| Ratios (%) and operating means | |||||||||||||||||||||||||||||||||||||||||
| Underlying RoTE | 6.38 | 3.53 | 4.63 | (4.98) | |||||||||||||||||||||||||||||||||||||
| Efficiency ratio | 37.9 | (9.2) | 42.4 | (0.4) | |||||||||||||||||||||||||||||||||||||
| NPL ratio | 4.57 | 0.28 | 4.57 | 0.36 | |||||||||||||||||||||||||||||||||||||
| NPL coverage | 69.0 | 0.9 | 69.0 | (0.7) | |||||||||||||||||||||||||||||||||||||
| Number of employees | 10,968 | (0.6) | 10,968 | (4.5) | |||||||||||||||||||||||||||||||||||||
| Number of branches | 529 | (1.1) | 529 | (0.6) | |||||||||||||||||||||||||||||||||||||
(1) Includes exchange differences.
(2) Excluding reverse repos.
(3) Excluding repos.
January - June 2020 | | 65 | ||||||
| Other Europe | |||||||||||||||||||||||||||||||||||||||||
| EUR million | |||||||||||||||||||||||||||||||||||||||||
| / | Q1'20 | / | H1'19 | ||||||||||||||||||||||||||||||||||||||
| Underlying income statement | Q2'20 | % | % excl. FX | H1'20 | % | % excl. FX | |||||||||||||||||||||||||||||||||||
| Net interest income | 155 | 14.9 | 14.9 | 289 | (3.2) | (3.4) | |||||||||||||||||||||||||||||||||||
| Net fee income | 115 | 54.5 | 54.4 | 189 | 59.7 | 58.4�� | |||||||||||||||||||||||||||||||||||
Gains (losses) on financial transactions (1) | (95) | 54.0 | 54.1 | (157) | 2.8 | 3.6 | |||||||||||||||||||||||||||||||||||
| Other operating income | 72 | 30.5 | 30.5 | 128 | (37.9) | (37.9) | |||||||||||||||||||||||||||||||||||
| Total income | 246 | 21.8 | 21.7 | 448 | (4.5) | (5.1) | |||||||||||||||||||||||||||||||||||
| Administrative expenses and amortisations | (217) | 0.2 | 0.2 | (433) | 6.2 | 5.6 | |||||||||||||||||||||||||||||||||||
| Net operating income | 29 | — | — | 15 | (75.2) | (75.4) | |||||||||||||||||||||||||||||||||||
| Net loan-loss provisions | (29) | 27.8 | 27.8 | (51) | 186.8 | 186.9 | |||||||||||||||||||||||||||||||||||
| Other gains (losses) and provisions | (7) | 66.0 | 66.0 | (12) | 8.5 | 8.5 | |||||||||||||||||||||||||||||||||||
| Profit before tax | (7) | (83.9) | (83.9) | (48) | — | — | |||||||||||||||||||||||||||||||||||
| Tax on profit | 25 | — | — | 24 | — | — | |||||||||||||||||||||||||||||||||||
| Profit from continuing operations | 18 | — | — | (24) | — | — | |||||||||||||||||||||||||||||||||||
| Net profit from discontinued operations | — | — | — | — | — | — | |||||||||||||||||||||||||||||||||||
| Consolidated profit | 18 | — | — | (24) | — | — | |||||||||||||||||||||||||||||||||||
| Non-controlling interests | (1) | — | — | (1) | (69.2) | (70.0) | |||||||||||||||||||||||||||||||||||
| Underlying attributable profit to the parent | 17 | — | — | (25) | — | — | |||||||||||||||||||||||||||||||||||
| Balance sheet | |||||||||||||||||||||||||||||||||||||||||
| Loans and advances to customers | 61,341 | 0.2 | 0.7 | 61,341 | 51.0 | 50.7 | |||||||||||||||||||||||||||||||||||
| Cash, central banks and credit institutions | 80,113 | 51.8 | 52.2 | 80,113 | 35.0 | 35.0 | |||||||||||||||||||||||||||||||||||
| Debt instruments | 20,463 | 13.1 | 13.1 | 20,463 | (14.9) | (15.0) | |||||||||||||||||||||||||||||||||||
| Other financial assets | 48,964 | (12.5) | (12.5) | 48,964 | 5.2 | 5.2 | |||||||||||||||||||||||||||||||||||
| Other asset accounts | 4,322 | 34.7 | 36.4 | 4,322 | 54.3 | 53.4 | |||||||||||||||||||||||||||||||||||
| Total assets | 215,204 | 12.5 | 12.8 | 215,204 | 24.1 | 24.0 | |||||||||||||||||||||||||||||||||||
| Customer deposits | 24,084 | 12.7 | 13.0 | 24,084 | 42.7 | 42.5 | |||||||||||||||||||||||||||||||||||
| Central banks and credit institutions | 131,676 | 21.0 | 21.4 | 131,676 | 24.4 | 24.3 | |||||||||||||||||||||||||||||||||||
| Marketable debt securities | 1,250 | — | — | 1,250 | 996.8 | 987.4 | |||||||||||||||||||||||||||||||||||
| Other financial liabilities | 53,790 | (7.0) | (7.0) | 53,790 | 14.7 | 14.7 | |||||||||||||||||||||||||||||||||||
| Other liabilities accounts | 650 | 196.6 | 197.1 | 650 | 60.6 | 60.2 | |||||||||||||||||||||||||||||||||||
| Total liabilities | 211,451 | 12.5 | 12.7 | 211,451 | 24.3 | 24.2 | |||||||||||||||||||||||||||||||||||
| Total equity | 3,753 | 17.3 | 18.5 | 3,753 | 16.3 | 15.7 | |||||||||||||||||||||||||||||||||||
| Memorandum items: | |||||||||||||||||||||||||||||||||||||||||
Gross loans and advances to customers (2) | 44,427 | (4.8) | (4.2) | 44,427 | 19.1 | 18.8 | |||||||||||||||||||||||||||||||||||
| Customer funds | 28,518 | 11.5 | 11.7 | 28,518 | 38.9 | 38.8 | |||||||||||||||||||||||||||||||||||
Customer deposits (3) | 22,434 | 9.3 | 9.7 | 22,434 | 33.7 | 33.5 | |||||||||||||||||||||||||||||||||||
| Mutual funds | 6,084 | 20.1 | 20.1 | 6,084 | 62.7 | 62.7 | |||||||||||||||||||||||||||||||||||
| Resources | |||||||||||||||||||||||||||||||||||||||||
| Number of employees | 2,603 | 2.2 | 2,603 | 11.9 | |||||||||||||||||||||||||||||||||||||
(1) Includes exchange differences.
(2) Excluding reverse repos.
(3) Excluding repos.
| 66 | | January - June 2020 | ||||||
| NORTH AMERICA | |||||||||||||||||||||||||||||||||||||||||
| EUR million | |||||||||||||||||||||||||||||||||||||||||
| / | Q1'20 | / | H1'19 | ||||||||||||||||||||||||||||||||||||||
| Underlying income statement | Q2'20 | % | % excl. FX | H1'20 | % | % excl. FX | |||||||||||||||||||||||||||||||||||
| Net interest income | 2,079 | (8.1) | (3.1) | 4,339 | (1.4) | (0.2) | |||||||||||||||||||||||||||||||||||
| Net fee income | 400 | (13.2) | (6.9) | 860 | (4.6) | (2.1) | |||||||||||||||||||||||||||||||||||
Gains (losses) on financial transactions (1) | 138 | 103.1 | 110.1 | 206 | 233.4 | 238.3 | |||||||||||||||||||||||||||||||||||
| Other operating income | 89 | (38.9) | (40.9) | 236 | (22.9) | (26.1) | |||||||||||||||||||||||||||||||||||
| Total income | 2,706 | (7.8) | (3.0) | 5,642 | (0.5) | 0.6 | |||||||||||||||||||||||||||||||||||
| Administrative expenses and amortisations | (1,117) | (8.7) | (4.0) | (2,341) | (1.9) | (0.8) | |||||||||||||||||||||||||||||||||||
| Net operating income | 1,589 | (7.2) | (2.3) | 3,301 | 0.5 | 1.7 | |||||||||||||||||||||||||||||||||||
| Net loan-loss provisions | (1,123) | (9.9) | (6.9) | (2,368) | 48.3 | 48.7 | |||||||||||||||||||||||||||||||||||
| Other gains (losses) and provisions | (36) | 160.0 | 174.8 | (50) | (47.3) | (48.0) | |||||||||||||||||||||||||||||||||||
| Profit before tax | 430 | (4.8) | 5.4 | 883 | (44.6) | (43.4) | |||||||||||||||||||||||||||||||||||
| Tax on profit | (59) | (49.2) | (42.0) | (175) | (56.7) | (55.9) | |||||||||||||||||||||||||||||||||||
| Profit from continuing operations | 371 | 10.5 | 21.8 | 707 | (40.5) | (39.0) | |||||||||||||||||||||||||||||||||||
| Net profit from discontinued operations | — | — | — | — | — | — | |||||||||||||||||||||||||||||||||||
| Consolidated profit | 371 | 10.5 | 21.8 | 707 | (40.5) | (39.0) | |||||||||||||||||||||||||||||||||||
| Non-controlling interests | (35) | (37.4) | (33.8) | (91) | (69.8) | (69.2) | |||||||||||||||||||||||||||||||||||
| Underlying attributable profit to the parent | 336 | 20.1 | 33.3 | 617 | (30.7) | (28.8) | |||||||||||||||||||||||||||||||||||
| Balance sheet | |||||||||||||||||||||||||||||||||||||||||
| Loans and advances to customers | 133,316 | (1.6) | 0.3 | 133,316 | 5.4 | 9.1 | |||||||||||||||||||||||||||||||||||
| Cash, central banks and credit institutions | 30,936 | (6.7) | (5.6) | 30,936 | 22.0 | 30.7 | |||||||||||||||||||||||||||||||||||
| Debt instruments | 37,365 | 23.5 | 24.7 | 37,365 | 39.7 | 50.4 | |||||||||||||||||||||||||||||||||||
| Other financial assets | 20,209 | 11.3 | 12.0 | 20,209 | 113.1 | 134.0 | |||||||||||||||||||||||||||||||||||
| Other asset accounts | 21,843 | (5.8) | (3.7) | 21,843 | 1.8 | 3.6 | |||||||||||||||||||||||||||||||||||
| Total assets | 243,668 | 1.4 | 3.1 | 243,668 | 16.3 | 21.6 | |||||||||||||||||||||||||||||||||||
| Customer deposits | 113,456 | (3.7) | (2.0) | 113,456 | 15.3 | 21.1 | |||||||||||||||||||||||||||||||||||
| Central banks and credit institutions | 35,493 | 14.6 | 16.1 | 35,493 | 26.4 | 33.5 | |||||||||||||||||||||||||||||||||||
| Marketable debt securities | 43,231 | 2.9 | 5.2 | 43,231 | 3.4 | 5.0 | |||||||||||||||||||||||||||||||||||
| Other financial liabilities | 21,397 | 9.4 | 10.0 | 21,397 | 79.6 | 99.2 | |||||||||||||||||||||||||||||||||||
| Other liabilities accounts | 6,578 | (1.1) | 0.3 | 6,578 | 11.8 | 17.9 | |||||||||||||||||||||||||||||||||||
| Total liabilities | 220,155 | 1.5 | 3.1 | 220,155 | 18.3 | 23.9 | |||||||||||||||||||||||||||||||||||
| Total equity | 23,514 | 1.1 | 3.0 | 23,514 | 0.3 | 3.7 | |||||||||||||||||||||||||||||||||||
| Memorandum items: | |||||||||||||||||||||||||||||||||||||||||
Gross loans and advances to customers (2) | 131,154 | (0.6) | 1.3 | 131,154 | 6.7 | 10.6 | |||||||||||||||||||||||||||||||||||
| Customer funds | 124,807 | 4.0 | 5.7 | 124,807 | 11.9 | 18.1 | |||||||||||||||||||||||||||||||||||
Customer deposits (3) | 104,732 | 3.3 | 5.1 | 104,732 | 15.7 | 21.2 | |||||||||||||||||||||||||||||||||||
| Mutual funds | 20,075 | 8.0 | 8.9 | 20,075 | (4.5) | 4.1 | |||||||||||||||||||||||||||||||||||
| Ratios (%) and operating means | |||||||||||||||||||||||||||||||||||||||||
| Underlying RoTE | 6.47 | 1.13 | 5.88 | (3.66) | |||||||||||||||||||||||||||||||||||||
| Efficiency ratio | 41.3 | (0.4) | 41.5 | (0.6) | |||||||||||||||||||||||||||||||||||||
| NPL ratio | 1.73 | (0.29) | 1.73 | (0.56) | |||||||||||||||||||||||||||||||||||||
| NPL coverage | 206.5 | 36.4 | 206.5 | 56.2 | |||||||||||||||||||||||||||||||||||||
| Number of employees | 38,116 | 1.9 | 38,116 | 3.2 | |||||||||||||||||||||||||||||||||||||
| Number of branches | 2,043 | (0.2) | 2,043 | (0.9) | |||||||||||||||||||||||||||||||||||||
(1) Includes exchange differences.
(2) Excluding reverse repos.
(3) Excluding repos.
January - June 2020 | | 67 | ||||||
| United States | |||||||||||||||||||||||||||||||||||||||||
| EUR million | |||||||||||||||||||||||||||||||||||||||||
| / | Q1'20 | / | H1'19 | ||||||||||||||||||||||||||||||||||||||
| Underlying income statement | Q2'20 | % | % excl. FX | H1'20 | % | % excl. FX | |||||||||||||||||||||||||||||||||||
| Net interest income | 1,429 | (2.3) | (2.4) | 2,891 | 1.1 | (1.4) | |||||||||||||||||||||||||||||||||||
| Net fee income | 215 | (13.9) | (14.0) | 465 | (2.9) | (5.3) | |||||||||||||||||||||||||||||||||||
Gains (losses) on financial transactions (1) | 50 | 7.0 | 6.9 | 96 | 145.9 | 139.8 | |||||||||||||||||||||||||||||||||||
| Other operating income | 108 | (36.9) | (36.9) | 278 | (22.1) | (24.0) | |||||||||||||||||||||||||||||||||||
| Total income | 1,801 | (6.6) | (6.7) | 3,730 | (0.1) | (2.6) | |||||||||||||||||||||||||||||||||||
| Administrative expenses and amortisations | (776) | (4.0) | (4.1) | (1,585) | 0.3 | (2.2) | |||||||||||||||||||||||||||||||||||
| Net operating income | 1,024 | (8.5) | (8.6) | 2,144 | (0.4) | (2.9) | |||||||||||||||||||||||||||||||||||
| Net loan-loss provisions | (832) | (14.5) | (14.6) | (1,804) | 53.1 | 49.3 | |||||||||||||||||||||||||||||||||||
| Other gains (losses) and provisions | (30) | 372.6 | 372.3 | (36) | (57.5) | (58.6) | |||||||||||||||||||||||||||||||||||
| Profit before tax | 163 | 15.8 | 15.7 | 305 | (65.8) | (66.7) | |||||||||||||||||||||||||||||||||||
| Tax on profit | 7 | — | — | (36) | (85.7) | (86.1) | |||||||||||||||||||||||||||||||||||
| Profit from continuing operations | 170 | 72.4 | 72.2 | 269 | (58.1) | (59.2) | |||||||||||||||||||||||||||||||||||
| Net profit from discontinued operations | — | — | — | — | — | — | |||||||||||||||||||||||||||||||||||
| Consolidated profit | 170 | 72.4 | 72.2 | 269 | (58.1) | (59.2) | |||||||||||||||||||||||||||||||||||
| Non-controlling interests | (20) | (48.9) | (48.9) | (58) | (67.2) | (68.0) | |||||||||||||||||||||||||||||||||||
| Underlying attributable profit to the parent | 151 | 149.8 | 149.5 | 211 | (54.7) | (55.8) | |||||||||||||||||||||||||||||||||||
| Balance sheet | |||||||||||||||||||||||||||||||||||||||||
| Loans and advances to customers | 102,743 | (1.7) | 1.0 | 102,743 | 10.3 | 9.1 | |||||||||||||||||||||||||||||||||||
| Cash, central banks and credit institutions | 19,221 | (2.8) | (0.1) | 19,221 | 39.4 | 37.9 | |||||||||||||||||||||||||||||||||||
| Debt instruments | 16,002 | 0.3 | 3.0 | 16,002 | 15.6 | 14.3 | |||||||||||||||||||||||||||||||||||
| Other financial assets | 6,476 | (10.7) | (8.2) | 6,476 | 65.5 | 63.7 | |||||||||||||||||||||||||||||||||||
| Other asset accounts | 18,749 | (5.8) | (3.2) | 18,749 | 4.8 | 3.7 | |||||||||||||||||||||||||||||||||||
| Total assets | 163,192 | (2.5) | 0.1 | 163,192 | 14.5 | 13.2 | |||||||||||||||||||||||||||||||||||
| Customer deposits | 77,938 | (6.9) | (4.3) | 77,938 | 21.1 | 19.8 | |||||||||||||||||||||||||||||||||||
| Central banks and credit institutions | 20,991 | 15.9 | 19.1 | 20,991 | 20.0 | 18.7 | |||||||||||||||||||||||||||||||||||
| Marketable debt securities | 35,927 | (0.4) | 2.3 | 35,927 | 1.9 | 0.8 | |||||||||||||||||||||||||||||||||||
| Other financial liabilities | 6,586 | (11.0) | (8.6) | 6,586 | 54.0 | 52.3 | |||||||||||||||||||||||||||||||||||
| Other liabilities accounts | 3,930 | (7.6) | (5.1) | 3,930 | 5.6 | 4.4 | |||||||||||||||||||||||||||||||||||
| Total liabilities | 145,371 | (2.8) | (0.1) | 145,371 | 16.2 | 14.9 | |||||||||||||||||||||||||||||||||||
| Total equity | 17,821 | (0.3) | 2.4 | 17,821 | 2.2 | 1.1 | |||||||||||||||||||||||||||||||||||
| Memorandum items: | |||||||||||||||||||||||||||||||||||||||||
Gross loans and advances to customers (2) | 100,826 | (0.3) | 2.4 | 100,826 | 12.5 | 11.3 | |||||||||||||||||||||||||||||||||||
| Customer funds | 86,719 | 5.6 | 8.4 | 86,719 | 23.9 | 22.6 | |||||||||||||||||||||||||||||||||||
Customer deposits (3) | 76,213 | 4.6 | 7.4 | 76,213 | 26.0 | 24.7 | |||||||||||||||||||||||||||||||||||
| Mutual funds | 10,506 | 13.3 | 16.4 | 10,506 | 10.6 | 9.4 | |||||||||||||||||||||||||||||||||||
| Ratios (%) and operating means | |||||||||||||||||||||||||||||||||||||||||
| Underlying RoTE | 3.79 | 2.24 | 2.68 | (3.70) | |||||||||||||||||||||||||||||||||||||
| Efficiency ratio | 43.1 | 1.2 | 42.5 | 0.2 | |||||||||||||||||||||||||||||||||||||
| NPL ratio | 1.49 | (0.51) | 1.49 | (0.83) | |||||||||||||||||||||||||||||||||||||
| NPL coverage | 253.1 | 71.7 | 253.1 | 94.7 | |||||||||||||||||||||||||||||||||||||
| Number of employees | 17,299 | 0.1 | 17,299 | (0.5) | |||||||||||||||||||||||||||||||||||||
| Number of branches | 614 | (0.8) | 614 | (5.0) | |||||||||||||||||||||||||||||||||||||
(1) Includes exchange differences.
(2) Excluding reverse repos.
(3) Excluding repos.
| 68 | | January - June 2020 | ||||||
| Mexico | |||||||||||||||||||||||||||||||||||||||||
| EUR million | |||||||||||||||||||||||||||||||||||||||||
| / | Q1'20 | / | H1'19 | ||||||||||||||||||||||||||||||||||||||
| Underlying income statement | Q2'20 | % | % excl. FX | H1'20 | % | % excl. FX | |||||||||||||||||||||||||||||||||||
| Net interest income | 650 | (18.6) | (4.5) | 1,448 | (6.1) | 2.4 | |||||||||||||||||||||||||||||||||||
| Net fee income | 185 | (12.4) | 2.2 | 396 | (6.4) | 2.0 | |||||||||||||||||||||||||||||||||||
Gains (losses) on financial transactions (1) | 89 | 309.6 | 349.3 | 110 | 383.6 | 427.3 | |||||||||||||||||||||||||||||||||||
| Other operating income | (18) | (24.2) | (10.5) | (42) | (16.9) | (9.4) | |||||||||||||||||||||||||||||||||||
| Total income | 905 | (10.1) | 4.7 | 1,912 | (1.3) | 7.6 | |||||||||||||||||||||||||||||||||||
| Administrative expenses and amortisations | (341) | (17.9) | (3.7) | (756) | (6.2) | 2.3 | |||||||||||||||||||||||||||||||||||
| Net operating income | 565 | (4.6) | 10.6 | 1,156 | 2.2 | 11.4 | |||||||||||||||||||||||||||||||||||
| Net loan-loss provisions | (291) | 6.5 | 22.6 | (564) | 34.8 | 47.0 | |||||||||||||||||||||||||||||||||||
| Other gains (losses) and provisions | (6) | (14.6) | (0.2) | (14) | 35.5 | 47.7 | |||||||||||||||||||||||||||||||||||
| Profit before tax | 267 | (14.2) | 0.3 | 578 | (17.8) | (10.3) | |||||||||||||||||||||||||||||||||||
| Tax on profit | (66) | (10.8) | 4.0 | (140) | (10.5) | (2.4) | |||||||||||||||||||||||||||||||||||
| Profit from continuing operations | 201 | (15.2) | (0.8) | 438 | (19.9) | (12.6) | |||||||||||||||||||||||||||||||||||
| Net profit from discontinued operations | — | — | — | — | — | — | |||||||||||||||||||||||||||||||||||
| Consolidated profit | 201 | (15.2) | (0.8) | 438 | (19.9) | (12.6) | |||||||||||||||||||||||||||||||||||
| Non-controlling interests | (15) | (11.9) | 2.7 | (32) | (73.5) | (71.1) | |||||||||||||||||||||||||||||||||||
| Underlying attributable profit to the parent | 186 | (15.5) | (1.1) | 406 | (4.4) | 4.2 | |||||||||||||||||||||||||||||||||||
| Balance sheet | |||||||||||||||||||||||||||||||||||||||||
| Loans and advances to customers | 30,573 | (1.1) | (1.9) | 30,573 | (8.3) | 9.1 | |||||||||||||||||||||||||||||||||||
| Cash, central banks and credit institutions | 11,714 | (12.6) | (13.4) | 11,714 | 1.3 | 20.5 | |||||||||||||||||||||||||||||||||||
| Debt instruments | 21,363 | 49.4 | 48.1 | 21,363 | 65.7 | 97.2 | |||||||||||||||||||||||||||||||||||
| Other financial assets | 13,733 | 26.0 | 24.9 | 13,733 | 146.5 | 193.3 | |||||||||||||||||||||||||||||||||||
| Other asset accounts | 3,094 | (5.9) | (6.6) | 3,094 | (13.2) | 3.3 | |||||||||||||||||||||||||||||||||||
| Total assets | 80,476 | 10.6 | 9.6 | 80,476 | 20.2 | 43.0 | |||||||||||||||||||||||||||||||||||
| Customer deposits | 35,518 | 4.3 | 3.4 | 35,518 | 4.5 | 24.3 | |||||||||||||||||||||||||||||||||||
| Central banks and credit institutions | 14,502 | 12.8 | 11.9 | 14,502 | 37.1 | 63.1 | |||||||||||||||||||||||||||||||||||
| Marketable debt securities | 7,305 | 23.0 | 22.0 | 7,305 | 11.3 | 32.4 | |||||||||||||||||||||||||||||||||||
| Other financial liabilities | 14,811 | 21.9 | 20.9 | 14,811 | 94.0 | 130.8 | |||||||||||||||||||||||||||||||||||
| Other liabilities accounts | 2,648 | 10.4 | 9.5 | 2,648 | 22.5 | 45.7 | |||||||||||||||||||||||||||||||||||
| Total liabilities | 74,784 | 10.9 | 10.0 | 74,784 | 22.7 | 46.0 | |||||||||||||||||||||||||||||||||||
| Total equity | 5,693 | 5.6 | 4.8 | 5,693 | (5.2) | 12.8 | |||||||||||||||||||||||||||||||||||
| Memorandum items: | |||||||||||||||||||||||||||||||||||||||||
Gross loans and advances to customers (2) | 30,329 | (1.4) | (2.2) | 30,329 | (8.7) | 8.6 | |||||||||||||||||||||||||||||||||||
| Customer funds | 38,088 | 0.7 | (0.2) | 38,088 | (8.4) | 9.0 | |||||||||||||||||||||||||||||||||||
Customer deposits (3) | 28,519 | 0.0 | (0.8) | 28,519 | (5.1) | 12.9 | |||||||||||||||||||||||||||||||||||
| Mutual funds | 9,570 | 2.6 | 1.8 | 9,570 | (16.9) | (1.1) | |||||||||||||||||||||||||||||||||||
| Ratios (%) and operating means | |||||||||||||||||||||||||||||||||||||||||
| Underlying RoTE | 15.11 | (0.76) | 15.46 | (5.01) | |||||||||||||||||||||||||||||||||||||
| Efficiency ratio | 37.6 | (3.6) | 39.5 | (2.1) | |||||||||||||||||||||||||||||||||||||
| NPL ratio | 2.50 | 0.43 | 2.50 | 0.29 | |||||||||||||||||||||||||||||||||||||
| NPL coverage | 114.9 | (19.0) | 114.9 | (12.0) | |||||||||||||||||||||||||||||||||||||
| Number of employees | 20,817 | 3.5 | 20,817 | 6.6 | |||||||||||||||||||||||||||||||||||||
| Number of branches | 1,429 | 0.0 | 1,429 | 0.9 | |||||||||||||||||||||||||||||||||||||
(1) Includes exchange differences.
(2) Excluding reverse repos.
(3) Excluding repos.
January - June 2020 | | 69 | ||||||
| SOUTH AMERICA | |||||||||||||||||||||||||||||||||||||||||
| EUR million | |||||||||||||||||||||||||||||||||||||||||
| / | Q1'20 | / | H1'19 | ||||||||||||||||||||||||||||||||||||||
| Underlying income statement | Q2'20 | % | % excl. FX | H1'20 | % | % excl. FX | |||||||||||||||||||||||||||||||||||
| Net interest income | 2,606 | (15.0) | (0.1) | 5,671 | (14.7) | 6.1 | |||||||||||||||||||||||||||||||||||
| Net fee income | 774 | (27.9) | (13.2) | 1,847 | (21.6) | (1.5) | |||||||||||||||||||||||||||||||||||
Gains (losses) on financial transactions (1) | 363 | 434.8 | 478.8 | 431 | 48.8 | 86.6 | |||||||||||||||||||||||||||||||||||
| Other operating income | (52) | 19.8 | 41.9 | (95) | (39.7) | (14.5) | |||||||||||||||||||||||||||||||||||
| Total income | 3,690 | (11.4) | 4.0 | 7,854 | (14.0) | 7.0 | |||||||||||||||||||||||||||||||||||
| Administrative expenses and amortisations | (1,275) | (14.2) | 0.7 | (2,761) | (16.6) | 5.1 | |||||||||||||||||||||||||||||||||||
| Net operating income | 2,416 | (9.8) | 5.8 | 5,093 | (12.6) | 8.1 | |||||||||||||||||||||||||||||||||||
| Net loan-loss provisions | (1,110) | (16.2) | (1.0) | (2,435) | 31.0 | 63.3 | |||||||||||||||||||||||||||||||||||
| Other gains (losses) and provisions | (52) | (63.2) | (50.1) | (194) | (36.6) | (20.2) | |||||||||||||||||||||||||||||||||||
| Profit before tax | 1,254 | 3.5 | 19.6 | 2,465 | (32.7) | (17.2) | |||||||||||||||||||||||||||||||||||
| Tax on profit | (470) | 13.0 | 31.4 | (887) | (35.0) | (19.6) | |||||||||||||||||||||||||||||||||||
| Profit from continuing operations | 783 | (1.4) | 13.5 | 1,578 | (31.3) | (15.9) | |||||||||||||||||||||||||||||||||||
| Net profit from discontinued operations | — | — | — | — | — | — | |||||||||||||||||||||||||||||||||||
| Consolidated profit | 783 | (1.4) | 13.5 | 1,578 | (31.3) | (15.9) | |||||||||||||||||||||||||||||||||||
| Non-controlling interests | (98) | 2.1 | 13.4 | (195) | (42.1) | (30.2) | |||||||||||||||||||||||||||||||||||
| Underlying attributable profit to the parent | 685 | (1.9) | 13.6 | 1,383 | (29.5) | (13.3) | |||||||||||||||||||||||||||||||||||
| Balance sheet | |||||||||||||||||||||||||||||||||||||||||
| Loans and advances to customers | 110,995 | (1.7) | 2.9 | 110,995 | (11.2) | 18.0 | |||||||||||||||||||||||||||||||||||
| Cash, central banks and credit institutions | 44,492 | (3.0) | 2.6 | 44,492 | (11.0) | 24.2 | |||||||||||||||||||||||||||||||||||
| Debt instruments | 45,233 | 1.2 | 8.6 | 45,233 | (6.2) | 30.8 | |||||||||||||||||||||||||||||||||||
| Other financial assets | 20,676 | 7.4 | 9.0 | 20,676 | 79.7 | 137.1 | |||||||||||||||||||||||||||||||||||
| Other asset accounts | 16,596 | (3.2) | 2.7 | 16,596 | 0.9 | 38.9 | |||||||||||||||||||||||||||||||||||
| Total assets | 237,993 | (0.8) | 4.4 | 237,993 | (5.2) | 28.6 | |||||||||||||||||||||||||||||||||||
| Customer deposits | 112,587 | 5.8 | 11.4 | 112,587 | (3.6) | 30.9 | |||||||||||||||||||||||||||||||||||
| Central banks and credit institutions | 42,399 | (6.9) | (1.6) | 42,399 | 12.0 | 52.2 | |||||||||||||||||||||||||||||||||||
| Marketable debt securities | 23,973 | (11.1) | (7.3) | 23,973 | (25.0) | (0.3) | |||||||||||||||||||||||||||||||||||
| Other financial liabilities | 32,198 | (3.9) | 0.0 | 32,198 | 2.6 | 40.4 | |||||||||||||||||||||||||||||||||||
| Other liabilities accounts | 8,215 | (3.7) | 2.6 | 8,215 | (20.4) | 10.6 | |||||||||||||||||||||||||||||||||||
| Total liabilities | 219,372 | (0.7) | 4.4 | 219,372 | (3.9) | 30.4 | |||||||||||||||||||||||||||||||||||
| Total equity | 18,621 | (1.4) | 4.0 | 18,621 | (18.4) | 10.7 | |||||||||||||||||||||||||||||||||||
| Memorandum items: | |||||||||||||||||||||||||||||||||||||||||
Gross loans and advances to customers (2) | 115,738 | (1.6) | 3.0 | 115,738 | (11.6) | 17.6 | |||||||||||||||||||||||||||||||||||
| Customer funds | 149,922 | 1.2 | 7.0 | 149,922 | (13.5) | 18.2 | |||||||||||||||||||||||||||||||||||
Customer deposits (3) | 101,965 | 6.3 | 11.7 | 101,965 | (3.2) | 30.9 | |||||||||||||||||||||||||||||||||||
| Mutual funds | 47,957 | (8.1) | (1.8) | 47,957 | (29.5) | (2.0) | |||||||||||||||||||||||||||||||||||
| Ratios (%) and operating means | |||||||||||||||||||||||||||||||||||||||||
| Underlying RoTE | 17.50 | 1.55 | 16.56 | (4.19) | |||||||||||||||||||||||||||||||||||||
| Efficiency ratio | 34.5 | (1.2) | 35.2 | (1.1) | |||||||||||||||||||||||||||||||||||||
| NPL ratio | 4.74 | 0.11 | 4.74 | (0.07) | |||||||||||||||||||||||||||||||||||||
| NPL coverage | 93.0 | 0.1 | 93.0 | 0.0 | |||||||||||||||||||||||||||||||||||||
| Number of employees | 67,652 | (1.4) | 67,652 | (4.9) | |||||||||||||||||||||||||||||||||||||
| Number of branches | 4,494 | (0.7) | 4,494 | (2.1) | |||||||||||||||||||||||||||||||||||||
(1) Includes exchange differences.
(2) Excluding reverse repos.
(3) Excluding repos.
| 70 | | January - June 2020 | ||||||
| Brazil | |||||||||||||||||||||||||||||||||||||||||
| EUR million | |||||||||||||||||||||||||||||||||||||||||
| / | Q1'20 | / | H1'19 | ||||||||||||||||||||||||||||||||||||||
| Underlying income statement | Q2'20 | % | % excl. FX | H1'20 | % | % excl. FX | |||||||||||||||||||||||||||||||||||
| Net interest income | 1,813 | (20.1) | (3.4) | 4,083 | (18.0) | 1.0 | |||||||||||||||||||||||||||||||||||
| Net fee income | 614 | (29.3) | (13.4) | 1,483 | (20.0) | (1.5) | |||||||||||||||||||||||||||||||||||
Gains (losses) on financial transactions (1) | 247 | — | — | 261 | 154.2 | 213.0 | |||||||||||||||||||||||||||||||||||
| Other operating income | (23) | 37.5 | 59.7 | (40) | (45.2) | (32.5) | |||||||||||||||||||||||||||||||||||
| Total income | 2,651 | (15.5) | 1.7 | 5,788 | (15.7) | 3.8 | |||||||||||||||||||||||||||||||||||
| Administrative expenses and amortisations | (835) | (16.8) | 0.3 | (1,839) | (17.4) | 1.7 | |||||||||||||||||||||||||||||||||||
| Net operating income | 1,816 | (14.9) | 2.4 | 3,949 | (14.8) | 4.9 | |||||||||||||||||||||||||||||||||||
| Net loan-loss provisions | (843) | (21.0) | (4.3) | (1,909) | 29.8 | 59.9 | |||||||||||||||||||||||||||||||||||
| Other gains (losses) and provisions | (31) | (75.2) | (63.6) | (158) | (50.5) | (39.1) | |||||||||||||||||||||||||||||||||||
| Profit before tax | 942 | 0.2 | 18.9 | 1,881 | (33.9) | (18.6) | |||||||||||||||||||||||||||||||||||
| Tax on profit | (408) | 10.9 | 30.6 | (777) | (33.8) | (18.5) | |||||||||||||||||||||||||||||||||||
| Profit from continuing operations | 533 | (6.7) | 11.4 | 1,105 | (34.0) | (18.7) | |||||||||||||||||||||||||||||||||||
| Net profit from discontinued operations | — | — | — | — | — | — | |||||||||||||||||||||||||||||||||||
| Consolidated profit | 533 | (6.7) | 11.4 | 1,105 | (34.0) | (18.7) | |||||||||||||||||||||||||||||||||||
| Non-controlling interests | (55) | 0.1 | 18.7 | (110) | (42.4) | (29.0) | |||||||||||||||||||||||||||||||||||
| Underlying attributable profit to the parent | 478 | (7.4) | 10.6 | 995 | (32.9) | (17.4) | |||||||||||||||||||||||||||||||||||
| Balance sheet | |||||||||||||||||||||||||||||||||||||||||
| Loans and advances to customers | 61,572 | (6.2) | 1.4 | 61,572 | (15.9) | 19.1 | |||||||||||||||||||||||||||||||||||
| Cash, central banks and credit institutions | 29,805 | (0.9) | 7.1 | 29,805 | (20.9) | 12.1 | |||||||||||||||||||||||||||||||||||
| Debt instruments | 35,652 | (6.0) | 1.6 | 35,652 | (16.6) | 18.1 | |||||||||||||||||||||||||||||||||||
| Other financial assets | 7,190 | 22.2 | 32.1 | 7,190 | 5.4 | 49.2 | |||||||||||||||||||||||||||||||||||
| Other asset accounts | 11,947 | (3.7) | 4.1 | 11,947 | (4.2) | 35.6 | |||||||||||||||||||||||||||||||||||
| Total assets | 146,166 | (3.8) | 4.0 | 146,166 | (15.4) | 19.7 | |||||||||||||||||||||||||||||||||||
| Customer deposits | 69,202 | 7.2 | 15.8 | 69,202 | (7.4) | 31.2 | |||||||||||||||||||||||||||||||||||
| Central banks and credit institutions | 26,379 | (19.6) | (13.1) | 26,379 | (8.8) | 29.2 | |||||||||||||||||||||||||||||||||||
| Marketable debt securities | 14,207 | (12.7) | (5.7) | 14,207 | (31.0) | (2.3) | |||||||||||||||||||||||||||||||||||
| Other financial liabilities | 17,968 | (6.1) | 1.5 | 17,968 | (25.6) | 5.4 | |||||||||||||||||||||||||||||||||||
| Other liabilities accounts | 6,282 | (5.6) | 2.0 | 6,282 | (27.1) | 3.2 | |||||||||||||||||||||||||||||||||||
| Total liabilities | 134,037 | (3.9) | 3.9 | 134,037 | (14.6) | 20.9 | |||||||||||||||||||||||||||||||||||
| Total equity | 12,129 | (3.1) | 4.8 | 12,129 | (23.8) | 7.9 | |||||||||||||||||||||||||||||||||||
| Memorandum items: | |||||||||||||||||||||||||||||||||||||||||
Gross loans and advances to customers (2) | 64,859 | (6.1) | 1.5 | 64,859 | (16.7) | 18.0 | |||||||||||||||||||||||||||||||||||
| Customer funds | 97,585 | (0.6) | 7.4 | 97,585 | (19.7) | 13.7 | |||||||||||||||||||||||||||||||||||
Customer deposits (3) | 58,730 | 8.3 | 17.0 | 58,730 | (7.4) | 31.1 | |||||||||||||||||||||||||||||||||||
| Mutual funds | 38,856 | (11.6) | (4.5) | 38,856 | (33.1) | (5.3) | |||||||||||||||||||||||||||||||||||
| Ratios (%) and operating means | |||||||||||||||||||||||||||||||||||||||||
| Underlying RoTE | 17.79 | 1.32 | 17.12 | (4.53) | |||||||||||||||||||||||||||||||||||||
| Efficiency ratio | 31.5 | (0.5) | 31.8 | (0.7) | |||||||||||||||||||||||||||||||||||||
| NPL ratio | 5.07 | 0.14 | 5.07 | (0.20) | |||||||||||||||||||||||||||||||||||||
| NPL coverage | 110.2 | 2.2 | 110.2 | 4.7 | |||||||||||||||||||||||||||||||||||||
| Number of employees | 44,951 | (1.9) | 44,951 | (6.6) | |||||||||||||||||||||||||||||||||||||
| Number of branches | 3,585 | (0.9) | 3,585 | (1.6) | |||||||||||||||||||||||||||||||||||||
(1) Includes exchange differences.
(2) Excluding reverse repos.
(3) Excluding repos.
January - June 2020 | | 71 | ||||||
| Chile | |||||||||||||||||||||||||||||||||||||||||
| EUR million | |||||||||||||||||||||||||||||||||||||||||
| / | Q1'20 | / | H1'19 | ||||||||||||||||||||||||||||||||||||||
| Underlying income statement | Q2'20 | % | % excl. FX | H1'20 | % | % excl. FX | |||||||||||||||||||||||||||||||||||
| Net interest income | 425 | (5.2) | (3.3) | 873 | (7.2) | 8.9 | |||||||||||||||||||||||||||||||||||
| Net fee income | 74 | (19.7) | (17.9) | 166 | (16.8) | (2.3) | |||||||||||||||||||||||||||||||||||
Gains (losses) on financial transactions (1) | 92 | 586.3 | 594.1 | 105 | (7.2) | 8.9 | |||||||||||||||||||||||||||||||||||
| Other operating income | (6) | 456.6 | 463.1 | (7) | — | — | |||||||||||||||||||||||||||||||||||
| Total income | 584 | 5.8 | 7.8 | 1,137 | (9.4) | 6.3 | |||||||||||||||||||||||||||||||||||
| Administrative expenses and amortisations | (228) | (1.1) | 0.9 | (458) | (12.6) | 2.5 | |||||||||||||||||||||||||||||||||||
| Net operating income | 356 | 10.7 | 12.8 | 678 | (7.2) | 8.9 | |||||||||||||||||||||||||||||||||||
| Net loan-loss provisions | (183) | 12.2 | 14.3 | (346) | 66.7 | 95.6 | |||||||||||||||||||||||||||||||||||
| Other gains (losses) and provisions | (2) | — | — | (1) | — | — | |||||||||||||||||||||||||||||||||||
| Profit before tax | 171 | 7.2 | 9.3 | 331 | (40.9) | (30.6) | |||||||||||||||||||||||||||||||||||
| Tax on profit | (42) | 97.2 | 100.2 | (63) | (38.6) | (28.0) | |||||||||||||||||||||||||||||||||||
| Profit from continuing operations | 129 | (6.7) | (4.8) | 267 | (41.4) | (31.2) | |||||||||||||||||||||||||||||||||||
| Net profit from discontinued operations | — | — | — | — | — | — | |||||||||||||||||||||||||||||||||||
| Consolidated profit | 129 | (6.7) | (4.8) | 267 | (41.4) | (31.2) | |||||||||||||||||||||||||||||||||||
| Non-controlling interests | (43) | 4.0 | 6.1 | (84) | (41.9) | (31.8) | |||||||||||||||||||||||||||||||||||
| Underlying attributable profit to the parent | 86 | (11.3) | (9.4) | 183 | (41.2) | (31.0) | |||||||||||||||||||||||||||||||||||
| Balance sheet | |||||||||||||||||||||||||||||||||||||||||
| Loans and advances to customers | 38,037 | 4.1 | 2.8 | 38,037 | (5.1) | 13.2 | |||||||||||||||||||||||||||||||||||
| Cash, central banks and credit institutions | 8,709 | (6.6) | (7.7) | 8,709 | 83.7 | 119.1 | |||||||||||||||||||||||||||||||||||
| Debt instruments | 5,958 | 54.8 | 52.8 | 5,958 | 50.9 | 79.9 | |||||||||||||||||||||||||||||||||||
| Other financial assets | 13,306 | 1.0 | (0.3) | 13,306 | 192.4 | 248.7 | |||||||||||||||||||||||||||||||||||
| Other asset accounts | 3,311 | (3.4) | (4.6) | 3,311 | 15.0 | 37.1 | |||||||||||||||||||||||||||||||||||
| Total assets | 69,321 | 4.5 | 3.2 | 69,321 | 23.3 | 47.1 | |||||||||||||||||||||||||||||||||||
| Customer deposits | 28,534 | 4.9 | 3.6 | 28,534 | 5.2 | 25.5 | |||||||||||||||||||||||||||||||||||
| Central banks and credit institutions | 11,822 | 28.3 | 26.7 | 11,822 | 111.6 | 152.4 | |||||||||||||||||||||||||||||||||||
| Marketable debt securities | 9,593 | (8.4) | (9.6) | 9,593 | (13.4) | 3.3 | |||||||||||||||||||||||||||||||||||
| Other financial liabilities | 13,501 | (1.2) | (2.4) | 13,501 | 110.4 | 150.9 | |||||||||||||||||||||||||||||||||||
| Other liabilities accounts | 1,276 | 6.2 | 4.9 | 1,276 | 24.5 | 48.5 | |||||||||||||||||||||||||||||||||||
| Total liabilities | 64,727 | 4.8 | 3.5 | 64,727 | 26.4 | 50.7 | |||||||||||||||||||||||||||||||||||
| Total equity | 4,594 | 0.8 | (0.5) | 4,594 | (7.7) | 10.1 | |||||||||||||||||||||||||||||||||||
| Memorandum items: | |||||||||||||||||||||||||||||||||||||||||
Gross loans and advances to customers (2) | 39,115 | 4.2 | 2.9 | 39,115 | (5.0) | 13.3 | |||||||||||||||||||||||||||||||||||
| Customer funds | 35,913 | 5.8 | 4.5 | 35,913 | 2.0 | 21.6 | |||||||||||||||||||||||||||||||||||
Customer deposits (3) | 28,385 | 5.0 | 3.7 | 28,385 | 5.3 | 25.6 | |||||||||||||||||||||||||||||||||||
| Mutual funds | 7,528 | 9.1 | 7.8 | 7,528 | (8.8) | 8.8 | |||||||||||||||||||||||||||||||||||
| Ratios (%) and operating means | |||||||||||||||||||||||||||||||||||||||||
| Underlying RoTE | 10.62 | (1.20) | 11.23 | (6.40) | |||||||||||||||||||||||||||||||||||||
| Efficiency ratio | 39.0 | (2.7) | 40.3 | (1.5) | |||||||||||||||||||||||||||||||||||||
| NPL ratio | 4.99 | 0.36 | 4.99 | 0.47 | |||||||||||||||||||||||||||||||||||||
| NPL coverage | 54.7 | (2.5) | 54.7 | (4.4) | |||||||||||||||||||||||||||||||||||||
| Number of employees | 11,405 | (0.3) | 11,405 | (3.3) | |||||||||||||||||||||||||||||||||||||
| Number of branches | 367 | 0.3 | 367 | (3.4) | |||||||||||||||||||||||||||||||||||||
(1) Includes exchange differences.
(2) Excluding reverse repos.
(3) Excluding repos.
| 72 | | January - June 2020 | ||||||
| Argentina | |||||||||||||||||||||||||||||||||||||||||
| EUR million | |||||||||||||||||||||||||||||||||||||||||
| / | Q1'20 | / | H1'19 | ||||||||||||||||||||||||||||||||||||||
| Underlying income statement | Q2'20 | % | % excl. FX | H1'20 | % | % excl. FX | |||||||||||||||||||||||||||||||||||
| Net interest income | 261 | 8.6 | 34.5 | 502 | (1.6) | 61.5 | |||||||||||||||||||||||||||||||||||
| Net fee income | 56 | (25.3) | (3.6) | 132 | (45.2) | (10.0) | |||||||||||||||||||||||||||||||||||
Gains (losses) on financial transactions (1) | 10 | (57.8) | (40.2) | 33 | (36.6) | 4.1 | |||||||||||||||||||||||||||||||||||
| Other operating income | (17) | (20.4) | 1.9 | (39) | (52.6) | (22.2) | |||||||||||||||||||||||||||||||||||
| Total income | 310 | (2.3) | 22.2 | 628 | (12.8) | 43.1 | |||||||||||||||||||||||||||||||||||
| Administrative expenses and amortisations | (153) | (17.7) | 4.9 | (339) | (21.4) | 29.1 | |||||||||||||||||||||||||||||||||||
| Net operating income | 157 | 19.4 | 46.6 | 289 | (0.1) | 64.0 | |||||||||||||||||||||||||||||||||||
| Net loan-loss provisions | (57) | (23.1) | (1.1) | (132) | (7.6) | 51.8 | |||||||||||||||||||||||||||||||||||
| Other gains (losses) and provisions | (18) | 33.2 | 62.2 | (32) | 62.5 | 166.9 | |||||||||||||||||||||||||||||||||||
| Profit before tax | 82 | 87.8 | 123.5 | 125 | (1.3) | 62.1 | |||||||||||||||||||||||||||||||||||
| Tax on profit | (7) | (29.5) | (8.4) | (16) | (70.5) | (51.5) | |||||||||||||||||||||||||||||||||||
| Profit from continuing operations | 75 | 119.5 | 159.2 | 110 | 49.1 | 144.8 | |||||||||||||||||||||||||||||||||||
| Net profit from discontinued operations | — | — | — | — | — | — | |||||||||||||||||||||||||||||||||||
| Consolidated profit | 75 | 119.5 | 159.2 | 110 | 49.1 | 144.8 | |||||||||||||||||||||||||||||||||||
| Non-controlling interests | — | 120.0 | 159.8 | (1) | 82.7 | 200.0 | |||||||||||||||||||||||||||||||||||
| Underlying attributable profit to the parent | 75 | 119.5 | 159.2 | 109 | 48.9 | 144.5 | |||||||||||||||||||||||||||||||||||
| Balance sheet | |||||||||||||||||||||||||||||||||||||||||
| Loans and advances to customers | 4,721 | 5.2 | 18.3 | 4,721 | (18.0) | 34.7 | |||||||||||||||||||||||||||||||||||
| Cash, central banks and credit institutions | 2,986 | (12.0) | (1.1) | 2,986 | (42.5) | (5.6) | |||||||||||||||||||||||||||||||||||
| Debt instruments | 2,659 | 19.5 | 34.3 | 2,659 | 190.1 | 376.5 | |||||||||||||||||||||||||||||||||||
| Other financial assets | 68 | (10.8) | 0.3 | 68 | (45.4) | (10.4) | |||||||||||||||||||||||||||||||||||
| Other asset accounts | 840 | 2.0 | 14.6 | 840 | (7.6) | 51.8 | |||||||||||||||||||||||||||||||||||
| Total assets | 11,275 | 2.4 | 15.2 | 11,275 | (12.6) | 43.5 | |||||||||||||||||||||||||||||||||||
| Customer deposits | 8,134 | (2.1) | 10.1 | 8,134 | (13.3) | 42.4 | |||||||||||||||||||||||||||||||||||
| Central banks and credit institutions | 1,043 | 54.4 | 73.6 | 1,043 | 5.1 | 72.6 | |||||||||||||||||||||||||||||||||||
| Marketable debt securities | 76 | (12.5) | (1.6) | 76 | (70.4) | (51.4) | |||||||||||||||||||||||||||||||||||
| Other financial liabilities | 651 | 3.2 | 16.0 | 651 | (14.5) | 40.5 | |||||||||||||||||||||||||||||||||||
| Other liabilities accounts | 365 | (5.9) | 5.7 | 365 | (12.0) | 44.4 | |||||||||||||||||||||||||||||||||||
| Total liabilities | 10,269 | 1.8 | 14.5 | 10,269 | (13.0) | 42.8 | |||||||||||||||||||||||||||||||||||
| Total equity | 1,006 | 9.3 | 22.9 | 1,006 | (8.1) | 51.0 | |||||||||||||||||||||||||||||||||||
| Memorandum items: | |||||||||||||||||||||||||||||||||||||||||
Gross loans and advances to customers (2) | 4,970 | 5.2 | 18.3 | 4,970 | (15.2) | 39.3 | |||||||||||||||||||||||||||||||||||
| Customer funds | 9,669 | 1.0 | 13.6 | 9,669 | (12.3) | 44.0 | |||||||||||||||||||||||||||||||||||
Customer deposits (3) | 8,134 | (2.1) | 10.1 | 8,134 | (13.3) | 42.4 | |||||||||||||||||||||||||||||||||||
| Mutual funds | 1,535 | 21.4 | 36.5 | 1,535 | (6.8) | 53.1 | |||||||||||||||||||||||||||||||||||
| Ratios (%) and operating means | |||||||||||||||||||||||||||||||||||||||||
| Underlying RoTE | 38.40 | 20.81 | 28.76 | 11.81 | |||||||||||||||||||||||||||||||||||||
| Efficiency ratio | 49.3 | (9.2) | 54.0 | (5.9) | |||||||||||||||||||||||||||||||||||||
| NPL ratio | 3.15 | (0.82) | 3.15 | (0.64) | |||||||||||||||||||||||||||||||||||||
| NPL coverage | 165.7 | 34.5 | 165.7 | 39.3 | |||||||||||||||||||||||||||||||||||||
| Number of employees | 9,244 | (0.5) | 9,244 | 0.7 | |||||||||||||||||||||||||||||||||||||
| Number of branches | 438 | 0.0 | 438 | (6.6) | |||||||||||||||||||||||||||||||||||||
(1) Includes exchange differences.
(2) Excluding reverse repos.
(3) Excluding repos.
January - June 2020 | | 73 | ||||||
| Other South America | |||||||||||||||||||||||||||||||||||||||||
| EUR million | |||||||||||||||||||||||||||||||||||||||||
| / | Q1'20 | / | H1'19 | ||||||||||||||||||||||||||||||||||||||
| Underlying income statement | Q2'20 | % | % excl. FX | H1'20 | % | % excl. FX | |||||||||||||||||||||||||||||||||||
| Net interest income | 107 | 0.6 | 8.0 | 213 | (2.1) | 12.5 | |||||||||||||||||||||||||||||||||||
| Net fee income | 29 | (21.2) | (14.2) | 65 | 8.6 | 25.0 | |||||||||||||||||||||||||||||||||||
Gains (losses) on financial transactions (1) | 15 | (16.9) | (11.1) | 32 | 47.1 | 64.4 | |||||||||||||||||||||||||||||||||||
| Other operating income | (5) | 46.2 | 53.3 | (9) | 92.9 | 126.6 | |||||||||||||||||||||||||||||||||||
| Total income | 145 | (7.5) | (0.3) | 301 | 2.3 | 17.3 | |||||||||||||||||||||||||||||||||||
| Administrative expenses and amortisations | (59) | (11.3) | (4.2) | (125) | (1.5) | 13.5 | |||||||||||||||||||||||||||||||||||
| Net operating income | 86 | (4.8) | 2.5 | 177 | 5.1 | 20.1 | |||||||||||||||||||||||||||||||||||
| Net loan-loss provisions | (27) | 30.1 | 39.7 | (47) | 25.4 | 44.4 | |||||||||||||||||||||||||||||||||||
| Other gains (losses) and provisions | (1) | (69.5) | (64.4) | (3) | (1.3) | 16.7 | |||||||||||||||||||||||||||||||||||
| Profit before tax | 59 | (13.4) | (6.7) | 127 | (0.8) | 13.1 | |||||||||||||||||||||||||||||||||||
| Tax on profit | (13) | (23.4) | (17.9) | (31) | (6.9) | 5.4 | |||||||||||||||||||||||||||||||||||
| Profit from continuing operations | 46 | (9.9) | (2.8) | 96 | 1.4 | 15.8 | |||||||||||||||||||||||||||||||||||
| Net profit from discontinued operations | — | — | — | — | — | — | |||||||||||||||||||||||||||||||||||
| Consolidated profit | 46 | (9.9) | (2.8) | 96 | 1.4 | 15.8 | |||||||||||||||||||||||||||||||||||
| Non-controlling interests | — | — | — | — | — | — | |||||||||||||||||||||||||||||||||||
| Underlying attributable profit to the parent | 46 | (9.9) | (2.8) | 96 | 2.2 | 16.9 | |||||||||||||||||||||||||||||||||||
| Balance sheet | |||||||||||||||||||||||||||||||||||||||||
| Loans and advances to customers | 6,666 | 8.0 | 8.6 | 6,666 | 12.2 | 27.1 | |||||||||||||||||||||||||||||||||||
| Cash, central banks and credit institutions | 2,991 | (3.6) | (3.4) | 2,991 | 24.9 | 43.7 | |||||||||||||||||||||||||||||||||||
| Debt instruments | 964 | 40.1 | 38.5 | 964 | 60.4 | 86.0 | |||||||||||||||||||||||||||||||||||
| Other financial assets | 112 | (7.9) | (6.2) | 112 | — | — | |||||||||||||||||||||||||||||||||||
| Other asset accounts | 499 | 5.2 | 5.2 | 499 | 158.6 | 194.4 | |||||||||||||||||||||||||||||||||||
| Total assets | 11,231 | 6.4 | 6.7 | 11,231 | 22.9 | 40.0 | |||||||||||||||||||||||||||||||||||
| Customer deposits | 6,716 | 5.9 | 5.7 | 6,716 | 21.3 | 40.1 | |||||||||||||||||||||||||||||||||||
| Central banks and credit institutions | 3,156 | 11.6 | 13.2 | 3,156 | 32.3 | 46.0 | |||||||||||||||||||||||||||||||||||
| Marketable debt securities | 97 | (13.1) | (8.0) | 97 | 45.3 | 54.6 | |||||||||||||||||||||||||||||||||||
| Other financial liabilities | 78 | (25.0) | (25.2) | 78 | 69.7 | 95.6 | |||||||||||||||||||||||||||||||||||
| Other liabilities accounts | 292 | 2.2 | 2.5 | 292 | 12.4 | 27.7 | |||||||||||||||||||||||||||||||||||
| Total liabilities | 10,339 | 6.9 | 7.3 | 10,339 | 24.7 | 41.9 | |||||||||||||||||||||||||||||||||||
| Total equity | 892 | 0.8 | 0.8 | 892 | 5.7 | 21.0 | |||||||||||||||||||||||||||||||||||
| Memorandum items: | |||||||||||||||||||||||||||||||||||||||||
Gross loans and advances to customers (2) | 6,794 | 7.9 | 8.5 | 6,794 | 11.8 | 26.6 | |||||||||||||||||||||||||||||||||||
| Customer funds | 6,754 | 5.8 | 5.6 | 6,754 | 21.3 | 40.1 | |||||||||||||||||||||||||||||||||||
Customer deposits (3) | 6,716 | 5.9 | 5.7 | 6,716 | 21.3 | 40.1 | |||||||||||||||||||||||||||||||||||
| Mutual funds | 38 | 0.4 | (0.9) | 38 | 16.5 | 37.5 | |||||||||||||||||||||||||||||||||||
| Resources | |||||||||||||||||||||||||||||||||||||||||
| Number of employees | 2,052 | (1.8) | 2,052 | (0.4) | |||||||||||||||||||||||||||||||||||||
(1) Includes exchange differences.
(2) Excluding reverse repos.
(3) Excluding repos.
| 74 | | January - June 2020 | ||||||
| SANTANDER GLOBAL PLATFORM (primary segment) | |||||||||||||||||||||||||||||||||||||||||
| EUR million | |||||||||||||||||||||||||||||||||||||||||
| Underlying income statement | Q2'20 | Q1'20 | % | H1'20 | H1'19 | % | |||||||||||||||||||||||||||||||||||
| Net interest income | 32 | 31 | 5.1 | 63 | 46 | 38.2 | |||||||||||||||||||||||||||||||||||
| Net fee income | 18 | 13 | 31.5 | 31 | 2 | — | |||||||||||||||||||||||||||||||||||
Gains (losses) on financial transactions (1) | — | — | — | 0 | (2) | (95.0) | |||||||||||||||||||||||||||||||||||
| Other operating income | (6) | 1 | — | (5) | (7) | (32.7) | |||||||||||||||||||||||||||||||||||
| Total income | 44 | 45 | (3.4) | 89 | 39 | 129.2 | |||||||||||||||||||||||||||||||||||
| Administrative expenses and amortisations | (77) | (71) | 8.4 | (148) | (108) | 36.9 | |||||||||||||||||||||||||||||||||||
| Net operating income | (33) | (26) | 29.4 | (59) | (69) | (15.0) | |||||||||||||||||||||||||||||||||||
| Net loan-loss provisions | (1) | — | 22.9 | (1) | — | 121.7 | |||||||||||||||||||||||||||||||||||
| Other gains (losses) and provisions | (6) | (1) | 513.2 | (7) | (1) | 684.3 | |||||||||||||||||||||||||||||||||||
| Profit before tax | (40) | (27) | 47.4 | (67) | (70) | (5.0) | |||||||||||||||||||||||||||||||||||
| Tax on profit | 11 | 14 | (18.2) | 25 | 19 | 31.3 | |||||||||||||||||||||||||||||||||||
| Profit from continuing operations | (28) | (13) | 117.4 | (42) | (51) | (18.7) | |||||||||||||||||||||||||||||||||||
| Net profit from discontinued operations | — | — | — | — | — | — | |||||||||||||||||||||||||||||||||||
| Consolidated profit | (28) | (13) | 117.4 | (42) | (51) | (18.7) | |||||||||||||||||||||||||||||||||||
| Non-controlling interests | — | — | 34.8 | — | — | — | |||||||||||||||||||||||||||||||||||
| Underlying attributable profit to the parent | (28) | (13) | 118.7 | (41) | (51) | (19.6) | |||||||||||||||||||||||||||||||||||
| Balance sheet | |||||||||||||||||||||||||||||||||||||||||
| Loans and advances to customers | 834 | 791 | 5.5 | 834 | 515 | 62.1 | |||||||||||||||||||||||||||||||||||
| Cash, central banks and credit institutions | 9,737 | 9,423 | 3.3 | 9,737 | 8,938 | 8.9 | |||||||||||||||||||||||||||||||||||
| Debt instruments | 10 | 10 | (0.7) | 10 | 0 | — | |||||||||||||||||||||||||||||||||||
| Other financial assets | 218 | 205 | 6.4 | 218 | 147 | 48.0 | |||||||||||||||||||||||||||||||||||
| Other asset accounts | 766 | 318 | 141.0 | 766 | 132 | 480.7 | |||||||||||||||||||||||||||||||||||
| Total assets | 11,566 | 10,747 | 7.6 | 11,566 | 9,732 | 18.8 | |||||||||||||||||||||||||||||||||||
| Customer deposits | 9,998 | 9,674 | 3.3 | 9,998 | 9,106 | 9.8 | |||||||||||||||||||||||||||||||||||
| Central banks and credit institutions | 171 | 144 | 18.2 | 171 | 130 | 31.0 | |||||||||||||||||||||||||||||||||||
| Marketable debt securities | — | — | — | — | — | — | |||||||||||||||||||||||||||||||||||
| Other financial liabilities | 149 | 134 | 10.7 | 149 | 67 | 122.1 | |||||||||||||||||||||||||||||||||||
| Other liabilities accounts | 103 | 98 | 4.5 | 103 | 81 | 27.0 | |||||||||||||||||||||||||||||||||||
| Total liabilities | 10,420 | 10,051 | 3.7 | 10,420 | 9,384 | 11.0 | |||||||||||||||||||||||||||||||||||
| Total equity | 1,146 | 696 | 64.7 | 1,146 | 348 | 229.5 | |||||||||||||||||||||||||||||||||||
| Memorandum items: | |||||||||||||||||||||||||||||||||||||||||
Gross loans and advances to customers (2) | 838 | 794 | 5.5 | 838 | 518 | 61.8 | |||||||||||||||||||||||||||||||||||
| Customer funds | 10,534 | 10,127 | 4.0 | 10,534 | 9,500 | 10.9 | |||||||||||||||||||||||||||||||||||
Customer deposits (3) | 9,998 | 9,674 | 3.3 | 9,998 | 9,106 | 9.8 | |||||||||||||||||||||||||||||||||||
| Mutual funds | 536 | 453 | 18.3 | 536 | 394 | 36.3 | |||||||||||||||||||||||||||||||||||
| Resources | |||||||||||||||||||||||||||||||||||||||||
| Number of employees | 1,528 | 1,424 | 7.3 | 1,528 | 597 | 155.9 | |||||||||||||||||||||||||||||||||||
(1) Includes exchange differences.
(2) Excluding reverse repos.
(3) Excluding repos.
January - June 2020 | | 75 | ||||||
| CORPORATE CENTRE | |||||||||||||||||||||||||||||||||||||||||
| EUR million | |||||||||||||||||||||||||||||||||||||||||
| Underlying income statement | Q2'20 | Q1'20 | % | H1'20 | H1'19 | % | |||||||||||||||||||||||||||||||||||
| Net interest income | (354) | (304) | 16.3 | (658) | (600) | 9.7 | |||||||||||||||||||||||||||||||||||
| Net fee income | (6) | (9) | (33.8) | (15) | (27) | (42.5) | |||||||||||||||||||||||||||||||||||
Gains (losses) on financial transactions (1) | 64 | 14 | 375.3 | 78 | (171) | — | |||||||||||||||||||||||||||||||||||
| Other operating income | (18) | (5) | 273.5 | (22) | (25) | (11.4) | |||||||||||||||||||||||||||||||||||
| Total income | (313) | (304) | 2.8 | (617) | (822) | (24.9) | |||||||||||||||||||||||||||||||||||
| Administrative expenses and amortisations | (82) | (85) | (3.6) | (166) | (193) | (13.8) | |||||||||||||||||||||||||||||||||||
| Net operating income | (395) | (389) | 1.4 | (784) | (1,015) | (22.8) | |||||||||||||||||||||||||||||||||||
| Net loan-loss provisions | (8) | (3) | 127.0 | (11) | (13) | (10.0) | |||||||||||||||||||||||||||||||||||
| Other gains (losses) and provisions | (370) | (20) | — | (391) | (127) | 208.7 | |||||||||||||||||||||||||||||||||||
| Profit before tax | (773) | (413) | 87.2 | (1,186) | (1,155) | 2.7 | |||||||||||||||||||||||||||||||||||
| Tax on profit | 585 | (524) | — | 61 | 36 | 67.9 | |||||||||||||||||||||||||||||||||||
| Profit from continuing operations | (188) | (937) | (79.9) | (1,125) | (1,118) | 0.6 | |||||||||||||||||||||||||||||||||||
| Net profit from discontinued operations | — | — | — | — | — | — | |||||||||||||||||||||||||||||||||||
| Consolidated profit | (188) | (937) | (79.9) | (1,125) | (1,118) | 0.6 | |||||||||||||||||||||||||||||||||||
| Non-controlling interests | 94 | (94) | — | (1) | 10 | — | |||||||||||||||||||||||||||||||||||
| Underlying attributable profit to the parent | (94) | (1,031) | (90.8) | (1,125) | (1,108) | 1.6 | |||||||||||||||||||||||||||||||||||
| Balance sheet | |||||||||||||||||||||||||||||||||||||||||
| Loans and advances to customers | 5,205 | 5,989 | (13.1) | 5,205 | 6,231 | (16.5) | |||||||||||||||||||||||||||||||||||
| Cash, central banks and credit institutions | 48,530 | 46,304 | 4.8 | 48,530 | 31,895 | 52.2 | |||||||||||||||||||||||||||||||||||
| Debt instruments | 1,340 | 1,292 | 3.7 | 1,340 | 952 | 40.7 | |||||||||||||||||||||||||||||||||||
| Other financial assets | 2,058 | 3,745 | (45.1) | 2,058 | 2,446 | (15.9) | |||||||||||||||||||||||||||||||||||
| Other asset accounts | 127,904 | 131,526 | (2.8) | 127,904 | 132,086 | (3.2) | |||||||||||||||||||||||||||||||||||
| Total assets | 185,037 | 188,856 | (2.0) | 185,037 | 173,610 | 6.6 | |||||||||||||||||||||||||||||||||||
| Customer deposits | 770 | 740 | 4.0 | 770 | 953 | (19.3) | |||||||||||||||||||||||||||||||||||
| Central banks and credit institutions | 19,119 | 27,484 | (30.4) | 19,119 | 14,650 | 30.5 | |||||||||||||||||||||||||||||||||||
| Marketable debt securities | 63,010 | 56,906 | 10.7 | 63,010 | 51,326 | 22.8 | |||||||||||||||||||||||||||||||||||
| Other financial liabilities | 1,901 | 803 | 136.8 | 1,901 | 2,617 | (27.4) | |||||||||||||||||||||||||||||||||||
| Other liabilities accounts | 8,225 | 8,917 | (7.8) | 8,225 | 9,743 | (15.6) | |||||||||||||||||||||||||||||||||||
| Total liabilities | 93,024 | 94,849 | (1.9) | 93,024 | 79,290 | 17.3 | |||||||||||||||||||||||||||||||||||
| Total equity | 92,012 | 94,007 | (2.1) | 92,012 | 94,320 | (2.4) | |||||||||||||||||||||||||||||||||||
| Memorandum items: | |||||||||||||||||||||||||||||||||||||||||
Gross loans and advances to customers (2) | 5,367 | 6,135 | (12.5) | 5,367 | 6,330 | (15.2) | |||||||||||||||||||||||||||||||||||
| Customer funds | 786 | 751 | 4.7 | 786 | 964 | (18.4) | |||||||||||||||||||||||||||||||||||
Customer deposits (3) | 770 | 740 | 4.0 | 770 | 953 | (19.3) | |||||||||||||||||||||||||||||||||||
| Mutual funds | 17 | 11 | 55.9 | 17 | 11 | 53.9 | |||||||||||||||||||||||||||||||||||
| Resources | |||||||||||||||||||||||||||||||||||||||||
| Number of employees | 1,773 | 1,697 | 4.5 | 1,773 | 1,644 | 7.8 | |||||||||||||||||||||||||||||||||||
(1) Includes exchange differences.
(2) Excluding reverse repos.
(3) Excluding repos.
| 76 | | January - June 2020 | ||||||
| RETAIL BANKING | |||||||||||||||||||||||||||||||||||||||||
| EUR million | |||||||||||||||||||||||||||||||||||||||||
| / | Q1'20 | / | H1'19 | ||||||||||||||||||||||||||||||||||||||
| Underlying income statement | Q2'20 | % | % excl. FX | H1'20 | % | % excl. FX | |||||||||||||||||||||||||||||||||||
| Net interest income | 7,141 | (9.4) | (2.5) | 15,026 | (8.4) | (0.8) | |||||||||||||||||||||||||||||||||||
| Net fee income | 1,495 | (26.1) | (18.9) | 3,518 | (18.4) | (10.3) | |||||||||||||||||||||||||||||||||||
Gains (losses) on financial transactions (1) | 403 | 709.9 | 578.0 | 452 | 96.3 | 87.5 | |||||||||||||||||||||||||||||||||||
| Other operating income | (179) | — | — | (165) | — | — | |||||||||||||||||||||||||||||||||||
| Total income | 8,859 | (11.2) | (4.5) | 18,831 | (10.6) | (3.5) | |||||||||||||||||||||||||||||||||||
| Administrative expenses and amortisations | (4,084) | (9.8) | (3.9) | (8,611) | (8.8) | (2.3) | |||||||||||||||||||||||||||||||||||
| Net operating income | 4,775 | (12.3) | (4.9) | 10,220 | (12.1) | (4.4) | |||||||||||||||||||||||||||||||||||
| Net loan-loss provisions | (2,846) | (26.8) | (21.0) | (6,735) | 59.1 | 74.4 | |||||||||||||||||||||||||||||||||||
| Other gains (losses) and provisions | (218) | (35.5) | (27.9) | (555) | (29.5) | (23.5) | |||||||||||||||||||||||||||||||||||
| Profit before tax | 1,711 | 40.5 | 54.2 | 2,930 | (55.7) | (52.0) | |||||||||||||||||||||||||||||||||||
| Tax on profit | (536) | 28.9 | 43.0 | (953) | (54.9) | (50.1) | |||||||||||||||||||||||||||||||||||
| Profit from continuing operations | 1,175 | 46.4 | 59.9 | 1,977 | (56.0) | (52.9) | |||||||||||||||||||||||||||||||||||
| Net profit from discontinued operations | — | — | — | — | — | — | |||||||||||||||||||||||||||||||||||
| Consolidated profit | 1,175 | 46.4 | 59.9 | 1,977 | (56.0) | (52.9) | |||||||||||||||||||||||||||||||||||
| Non-controlling interests | (193) | 14.6 | 19.1 | (361) | (50.7) | (47.3) | |||||||||||||||||||||||||||||||||||
| Underlying attributable profit to the parent | 982 | 54.9 | 71.2 | 1,616 | (57.1) | (53.9) | |||||||||||||||||||||||||||||||||||
(1) Includes exchange differences.
| CORPORATE & INVESTMENT BANKING | |||||||||||||||||||||||||||||||||||||||||
| EUR million | |||||||||||||||||||||||||||||||||||||||||
| / | Q1'20 | / | H1'19 | ||||||||||||||||||||||||||||||||||||||
| Underlying income statement | Q2'20 | % | % excl. FX | H1'20 | % | % excl. FX | |||||||||||||||||||||||||||||||||||
| Net interest income | 713 | 6.3 | 14.1 | 1,384 | 2.2 | 12.1 | |||||||||||||||||||||||||||||||||||
| Net fee income | 406 | 0.5 | 6.9 | 810 | 11.6 | 20.3 | |||||||||||||||||||||||||||||||||||
Gains (losses) on financial transactions (1) | 259 | 56.8 | 77.4 | 424 | 36.7 | 70.9 | |||||||||||||||||||||||||||||||||||
| Other operating income | 48 | (20.4) | (21.5) | 108 | (39.6) | (40.1) | |||||||||||||||||||||||||||||||||||
| Total income | 1,426 | 9.7 | 17.9 | 2,726 | 6.1 | 16.7 | |||||||||||||||||||||||||||||||||||
| Administrative expenses and amortisations | (507) | (5.4) | (0.4) | (1,043) | (6.9) | (1.5) | |||||||||||||||||||||||||||||||||||
| Net operating income | 919 | 20.2 | 31.0 | 1,683 | 16.2 | 31.8 | |||||||||||||||||||||||||||||||||||
| Net loan-loss provisions | (245) | — | — | (249) | 357.6 | 371.6 | |||||||||||||||||||||||||||||||||||
| Other gains (losses) and provisions | (28) | 84.7 | 92.9 | (43) | 13.0 | 19.1 | |||||||||||||||||||||||||||||||||||
| Profit before tax | 646 | (13.2) | (4.0) | 1,391 | 2.6 | 17.1 | |||||||||||||||||||||||||||||||||||
| Tax on profit | (179) | (17.8) | (8.0) | (398) | (2.1) | 12.3 | |||||||||||||||||||||||||||||||||||
| Profit from continuing operations | 467 | (11.3) | (2.4) | 994 | 4.6 | 19.1 | |||||||||||||||||||||||||||||||||||
| Net profit from discontinued operations | — | — | — | — | — | — | |||||||||||||||||||||||||||||||||||
| Consolidated profit | 467 | (11.3) | (2.4) | 994 | 4.6 | 19.1 | |||||||||||||||||||||||||||||||||||
| Non-controlling interests | (30) | (16.6) | (4.2) | (66) | (26.5) | (15.0) | |||||||||||||||||||||||||||||||||||
| Underlying attributable profit to the parent | 437 | (10.9) | (2.3) | 928 | 7.8 | 22.6 | |||||||||||||||||||||||||||||||||||
(1) Includes exchange differences.
January - June 2020 | | 77 | ||||||
| WEALTH MANAGEMENT & INSURANCE | |||||||||||||||||||||||||||||||||||||||||
| EUR million | |||||||||||||||||||||||||||||||||||||||||
| / | Q1'20 | / | H1'19 | ||||||||||||||||||||||||||||||||||||||
| Underlying income statement | Q2'20 | % | % excl. FX | H1'20 | % | % excl. FX | |||||||||||||||||||||||||||||||||||
| Net interest income | 104 | (21.8) | (17.8) | 236 | (16.8) | (13.0) | |||||||||||||||||||||||||||||||||||
| Net fee income | 279 | (12.8) | (8.9) | 599 | 4.9 | 9.8 | |||||||||||||||||||||||||||||||||||
Gains (losses) on financial transactions (1) | 22 | 3.3 | 12.2 | 43 | (39.1) | (36.2) | |||||||||||||||||||||||||||||||||||
| Other operating income | 78 | (31.0) | (25.8) | 191 | 19.4 | 30.6 | |||||||||||||||||||||||||||||||||||
| Total income | 482 | (17.7) | (13.4) | 1,069 | (1.5) | 3.7 | |||||||||||||||||||||||||||||||||||
| Administrative expenses and amortisations | (220) | (9.9) | (7.0) | (464) | (2.8) | — | |||||||||||||||||||||||||||||||||||
| Net operating income | 263 | (23.3) | (18.1) | 605 | (0.6) | 6.8 | |||||||||||||||||||||||||||||||||||
| Net loan-loss provisions | (5) | (18.2) | (19.2) | (12) | — | — | |||||||||||||||||||||||||||||||||||
| Other gains (losses) and provisions | (3) | 86.1 | 88.5 | (4) | (2.9) | 1.5 | |||||||||||||||||||||||||||||||||||
| Profit before tax | 255 | (23.9) | (18.5) | 589 | (3.5) | 3.5 | |||||||||||||||||||||||||||||||||||
| Tax on profit | (59) | (27.9) | (23.2) | (142) | (0.9) | 6.1 | |||||||||||||||||||||||||||||||||||
| Profit from continuing operations | 195 | (22.6) | (17.0) | 447 | (4.3) | 2.8 | |||||||||||||||||||||||||||||||||||
| Net profit from discontinued operations | — | — | — | — | — | — | |||||||||||||||||||||||||||||||||||
| Consolidated profit | 195 | (22.6) | (17.0) | 447 | (4.3) | 2.8 | |||||||||||||||||||||||||||||||||||
| Non-controlling interests | (9) | (24.5) | (14.9) | (20) | (10.6) | 5.8 | |||||||||||||||||||||||||||||||||||
| Underlying attributable profit to the parent | 186 | (22.5) | (17.1) | 427 | (4.0) | 2.6 | |||||||||||||||||||||||||||||||||||
(1) Includes exchange differences.
| SANTANDER GLOBAL PLATFORM (secondary segment) | |||||||||||||||||||||||||||||||||||||||||
| EUR million | |||||||||||||||||||||||||||||||||||||||||
| / | Q1'20 | / | H1'19 | ||||||||||||||||||||||||||||||||||||||
| Underlying income statement | Q2'20 | % | % excl. FX | H1'20 | % | % excl. FX | |||||||||||||||||||||||||||||||||||
| Net interest income | 112 | 8.8 | 16.6 | 214 | 11.8 | 24.3 | |||||||||||||||||||||||||||||||||||
| Net fee income | 109 | (4.6) | 5.8 | 224 | (20.1) | (6.5) | |||||||||||||||||||||||||||||||||||
Gains (losses) on financial transactions (1) | 33 | (22.0) | (17.7) | 75 | 7.5 | 15.6 | |||||||||||||||||||||||||||||||||||
| Other operating income | (4) | — | — | (4) | (52.2) | (51.0) | |||||||||||||||||||||||||||||||||||
| Total income | 250 | (4.1) | 4.1 | 510 | (4.6) | 8.6 | |||||||||||||||||||||||||||||||||||
| Administrative expenses and amortisations | (183) | (1.7) | 3.9 | (369) | 3.8 | 13.1 | |||||||||||||||||||||||||||||||||||
| Net operating income | 67 | (10.0) | 4.9 | 141 | (21.2) | (1.6) | |||||||||||||||||||||||||||||||||||
| Net loan-loss provisions | (14) | 176.4 | 193.1 | (20) | 8.2 | 18.8 | |||||||||||||||||||||||||||||||||||
| Other gains (losses) and provisions | (6) | — | — | (4) | 430.9 | 407.6 | |||||||||||||||||||||||||||||||||||
| Profit before tax | 46 | (35.6) | (21.9) | 117 | (26.7) | (6.8) | |||||||||||||||||||||||||||||||||||
| Tax on profit | (18) | (8.4) | 17.0 | (37) | (33.7) | (14.4) | |||||||||||||||||||||||||||||||||||
| Profit from continuing operations | 28 | (45.6) | (35.4) | 80 | (23.0) | (2.9) | |||||||||||||||||||||||||||||||||||
| Net profit from discontinued operations | — | — | — | — | — | — | |||||||||||||||||||||||||||||||||||
| Consolidated profit | 28 | (45.6) | (35.4) | 80 | (23.0) | (2.9) | |||||||||||||||||||||||||||||||||||
| Non-controlling interests | (8) | (8.8) | (0.7) | (17) | (13.0) | (3.4) | |||||||||||||||||||||||||||||||||||
| Underlying attributable profit to the parent | 20 | (53.2) | (42.7) | 63 | (25.3) | (2.7) | |||||||||||||||||||||||||||||||||||
(1) Includes exchange differences.
| 78 | | January - June 2020 | ||||||
ALTERNATIVE PERFORMANCE MEASURES (APMs)
In addition to the financial information prepared under IFRS, this consolidated directors’ report contains financial measures that constitute alternative performance measures (‘APMs’) to comply with the guidelines on alternative performance measures issued by the European Securities and Markets Authority on 5 October 2015 and non-IFRS measures.
The financial measures contained in this consolidated directors’ report that qualify as APMs and non-IFRS measures have been calculated using the financial information from Santander but are not defined or detailed in the applicable financial information framework or under IFRS and have neither been audited nor reviewed by our auditors.
We use these APMs and non-IFRS measures when planning, monitoring and evaluating our performance. We consider these APMs and non-IFRS financial measures to be useful metrics for management and investors to facilitate operating performance comparisons from period to period. While we believe that these APMs and non-IFRS financial measures are useful in evaluating our business, this information should be considered as supplemental in nature and is not meant as a substitute of IFRS measures. In addition, the way in which Santander defines and calculates these
APMs and non-IFRS measures may differ from the calculations and by other companies with similar measures and, therefore, may not be comparable.
The APMs and non-IFRS measures we use in this document can be categorised as follows:
Underlying results
In addition to IFRS results measures, we present some results measures which are non-IFRS measures and which we refer to as underlying measures. These underlying measures allow in our view a better year-on-year comparability as they exclude items outside the ordinary course performance of our business which are grouped in the non-IFRS line net capital gains and provisions and are further detailed on page 14 of this report.
In addition, the results by business areas in the 'Geographic businesses' section are presented only on an underlying basis in accordance with IFRS 8, and reconciled on an aggregate basis to our IFRS consolidated results to the consolidated financial statements, which are set out below.
| Reconciliation of underlying results to statutory results | ||||||||||||||||||||
| EUR million | ||||||||||||||||||||
| January-June 2020 | ||||||||||||||||||||
| Underlying results | Adjustments | Statutory results | ||||||||||||||||||
| Net interest income | 16,202 | — | 16,202 | |||||||||||||||||
| Net fee income | 5,136 | — | 5,136 | |||||||||||||||||
Gains (losses) on financial transactions (1) | 1,073 | — | 1,073 | |||||||||||||||||
| Other operating income | 107 | (250) | (143) | |||||||||||||||||
| Total income | 22,518 | (250) | 22,268 | |||||||||||||||||
| Administrative expenses and amortisations | (10,653) | (54) | (10,707) | |||||||||||||||||
| Net operating income | 11,865 | (304) | 11,561 | |||||||||||||||||
| Net loan-loss provisions | (7,027) | — | (7,027) | |||||||||||||||||
| Other gains (losses) and provisions | (997) | (9,947) | (10,944) | |||||||||||||||||
| Profit before tax | 3,841 | (10,251) | (6,410) | |||||||||||||||||
| Tax on profit | (1,468) | (2,460) | (3,928) | |||||||||||||||||
| Profit from continuing operations | 2,373 | (12,711) | (10,338) | |||||||||||||||||
| Net profit from discontinued operations | — | — | — | |||||||||||||||||
| Consolidated profit | 2,373 | (12,711) | (10,338) | |||||||||||||||||
| Non-controlling interests | (465) | 5 | (460) | |||||||||||||||||
| Attributable profit to the parent | 1,908 | (12,706) | (10,798) | |||||||||||||||||
(1) Includes exchange differences.
Explanation of adjustments:
Adjustment to the valuation of goodwill of EUR -10,100 million, adjustment has been made to deferred tax assets of the Spanish consolidated fiscal group of EUR -2,500 million and restructuring costs and other for a net impact of EUR -106 million.
January - June 2020 | | 79 | ||||||
| Reconciliation of underlying results to statutory results | ||||||||||||||||||||
| EUR million | ||||||||||||||||||||
| January-June 2019 | ||||||||||||||||||||
| Underlying results | Adjustments | Statutory results | ||||||||||||||||||
| Net interest income | 17,636 | — | 17,636 | |||||||||||||||||
| Net fee income | 5,863 | — | 5,863 | |||||||||||||||||
| Gains (losses) on financial transactions (1) | 511 | — | 511 | |||||||||||||||||
| Other operating income | 426 | — | 426 | |||||||||||||||||
| Total income | 24,436 | — | 24,436 | |||||||||||||||||
| Administrative expenses and amortisations | (11,587) | — | (11,587) | |||||||||||||||||
| Net operating income | 12,849 | — | 12,849 | |||||||||||||||||
| Net loan-loss provisions | (4,313) | — | (4,313) | |||||||||||||||||
| Other gains (losses) and provisions | (957) | (1,048) | (2,005) | |||||||||||||||||
| Profit before tax | 7,579 | (1,048) | 6,531 | |||||||||||||||||
| Tax on profit | (2,679) | 230 | (2,449) | |||||||||||||||||
| Profit from continuing operations | 4,900 | (818) | 4,082 | |||||||||||||||||
| Net profit from discontinued operations | — | — | — | |||||||||||||||||
| Consolidated profit | 4,900 | (818) | 4,082 | |||||||||||||||||
| Non-controlling interests | (855) | 4 | (851) | |||||||||||||||||
| Attributable profit to the parent | 4,045 | (814) | 3,231 | |||||||||||||||||
(1) Includes exchange differences.
Explanation of adjustments:
Net capital gains from the sale of our stake in Prisma of EUR 150 million, net capital losses of EUR -180 million related to real estate assets (Spain), PPI of EUR -80 million and restructuring costs for a net impact of EUR -704 million.
Profitability and efficiency ratios
The purpose of the profitability and efficiency ratios is to measure the ratio of profit to capital, to tangible capital, to assets and to risk weighted assets, while the efficiency ratio measures how much general administrative expenses (personnel and other) and amortisation costs are needed to generate revenue.
In the quarter, underlying RoE and underlying RoA ratios have been incorporated as we believe they better reflect the underlying business performance. These complement the underlying RoTE and RoRWA measures that were already being presented.
Additionally, the goodwill adjustments have been removed from the RoTE numerator as, since they are not considered in the denominator, we believe this calculation is more correct.
| 80 | | January - June 2020 | ||||||
| Ratio | Formula | Relevance of the metric | ||||||||||||
| RoE | Attributable profit to the parent | This ratio measures the return that shareholders obtain on the funds invested in the Bank and as such measures the company's ability to pay shareholders. | ||||||||||||
| (Return on equity) | Average stockholders’ equity 1 (excl. minority interests) | |||||||||||||
| Underlying RoE | Underlying attributable profit to the parent | This ratio measures the return that shareholders obtain on the funds invested in the Bank excluding non-recurring results. | ||||||||||||
Average stockholders’ equity 1 (excl. minority interests) | ||||||||||||||
| RoTE | Attributable profit to the parent2 | This indicator is used to evaluate the profitability of the company as a percentage of its tangible equity. It's measured as the return that shareholders receive as a percentage of the funds invested in the entity less intangible assets. | ||||||||||||
| (Return on tangible equity) | Average stockholders' equity 1 (excl. minority interests) - intangible assets | |||||||||||||
| Underlying RoTE | Underlying attributable profit to the parent | This indicator measures the profitability of the tangible equity of a company arising from ordinary activities, i.e. excluding results from non-recurring operations. | ||||||||||||
Average stockholders' equity 1 (excl. minority interests) - intangible assets | ||||||||||||||
| RoA | Consolidated profit | This metric measures the profitability of a company as a percentage of its total assets. It is an indicator that reflects the efficiency of the company's total funds in generating profit. | ||||||||||||
| (Return on assets) | Average total assets | |||||||||||||
| Underlying RoA | Underlying consolidated profit | This metric measures the profitability of a company as a percentage of its total assets, excluding non-recurring results. It is an indicator that reflects the efficiency of the company's total funds in generating underlying profit. | ||||||||||||
| Average total assets | ||||||||||||||
| RoRWA | Consolidated profit | The return adjusted for risk is an derivative of the RoA metric. The difference is that RoRWA measures profit in relation to the bank's risk weighted assets. | ||||||||||||
| (Return on risk weighted assets) | Average risk weighted assets | |||||||||||||
| Underlying RoRWA | Underlying consolidated profit | This relates the consolidated profit (excluding non-recurring results) to the bank's risk weighted assets. | ||||||||||||
| Average risk weighted assets | ||||||||||||||
| Efficiency ratio | Operating expenses 3 | One of the most commonly used indicators when comparing productivity of different financial entities. It measures the amount of funds used to generate the bank's total income. | ||||||||||||
| Total income | ||||||||||||||
1. Stockholders’ equity = Capital and Reserves + Accumulated other comprehensive income + Attributable profit to the parent + Dividends.
2. Excluding the adjustment to the valuation of goodwill.
3. Operating expenses = Administrative expenses + amortisations.
January - June 2020 | | 81 | ||||||
Profitability and efficiency(1) (2) (3) (4) | Q2'20 | Q1'20 | H1'20 | H1'19 | ||||||||||||||||||||||
| RoE | -7.06 | % | 1.47 | % | -9.28 | % | 7.41 | % | ||||||||||||||||||
| Attributable profit to the parent | -6,536 | 1,462 | -8,890 | 7,276 | ||||||||||||||||||||||
| Average stockholders' equity (excluding minority interests) | 92,528 | 99,221 | 95,803 | 98,191 | ||||||||||||||||||||||
| Underlying RoE | 6.62 | % | 1.52 | % | 3.98 | % | 8.24 | % | ||||||||||||||||||
| Attributable profit to the parent | -6,536 | 1,462 | -8,890 | 7,276 | ||||||||||||||||||||||
| (-) Net capital gains and provisions | -12,660 | -46 | -12,706 | -814 | ||||||||||||||||||||||
| Underlying attributable profit to the parent | 6,124 | 1,508 | 3,816 | 8,090 | ||||||||||||||||||||||
| Average stockholders' equity (excluding minority interests) | 92,528 | 99,221 | 95,803 | 98,191 | ||||||||||||||||||||||
| RoTE | 5.19 | % | 2.04 | % | 1.73 | % | 10.51 | % | ||||||||||||||||||
| Attributable profit to the parent | -6,536 | 1,462 | -8,890 | 7,276 | ||||||||||||||||||||||
| (+) Goodwill impairment | 10,100 | — | 10,100 | — | ||||||||||||||||||||||
| Attributable profit to the parent (excluding goodwill impairment) | 3,564 | 1,462 | 1,210 | 7,276 | ||||||||||||||||||||||
| Average stockholders' equity (excluding minority interests) | 92,528 | 99,221 | 95,803 | 98,191 | ||||||||||||||||||||||
| (-) Average intangible assets | 23,920 | 27,721 | 25,712 | 28,952 | ||||||||||||||||||||||
| Average stockholders' equity (excl. minority interests) - intangible assets | 68,608 | 71,500 | 70,091 | 69,239 | ||||||||||||||||||||||
| Underlying RoTE | 8.93 | % | 2.11 | % | 5.44 | % | 11.68 | % | ||||||||||||||||||
| Attributable profit to the parent | -6,536 | 1,462 | -8,890 | 7,276 | ||||||||||||||||||||||
| (-) Net capital gains and provisions | -12,660 | -46 | -12,706 | -814 | ||||||||||||||||||||||
| Underlying attributable profit to the parent | 6,124 | 1,508 | 3,816 | 8,090 | ||||||||||||||||||||||
| Average stockholders' equity (excl. minority interests) - intangible assets | 68,608 | 71,500 | 70,091 | 69,239 | ||||||||||||||||||||||
| RoA | -0.38 | % | 0.18 | % | -0.51 | % | 0.60 | % | ||||||||||||||||||
| Consolidated profit | -5,954 | 2,735 | -7,965 | 8,981 | ||||||||||||||||||||||
| Average total assets | 1,558,854 | 1,536,725 | 1,548,851 | 1,492,954 | ||||||||||||||||||||||
| Underlying RoA | 0.43 | % | 0.18 | % | 0.31 | % | 0.66 | % | ||||||||||||||||||
| Consolidated profit | -5,954 | 2,735 | -7,965 | 8,981 | ||||||||||||||||||||||
| (-) Net capital gains and provisions | -12,662 | -49 | -12,711 | -819 | ||||||||||||||||||||||
| Underlying consolidated profit | 6,708 | 2,784 | 4,746 | 9,800 | ||||||||||||||||||||||
| Average total assets | 1,558,854 | 1,536,725 | 1,548,851 | 1,492,954 | ||||||||||||||||||||||
| RoRWA | -1.02 | % | 0.45 | % | -1.34 | % | 1.48 | % | ||||||||||||||||||
| Consolidated profit | -5,954 | 2,735 | -7,965 | 8,981 | ||||||||||||||||||||||
| Average risk weighted assets | 586,210 | 603,069 | 595,166 | 605,979 | ||||||||||||||||||||||
| Underlying RoRWA | 1.14 | % | 0.46 | % | 0.80 | % | 1.62 | % | ||||||||||||||||||
| Consolidated profit | -5,954 | 2,735 | -7,965 | 8,981 | ||||||||||||||||||||||
| (-) Net capital gains and provisions | -12,662 | -49 | -12,711 | -819 | ||||||||||||||||||||||
| Underlying consolidated profit | 6,708 | 2,784 | 4,746 | 9,800 | ||||||||||||||||||||||
| Average risk weighted assets | 586,210 | 603,069 | 595,166 | 605,979 | ||||||||||||||||||||||
| Efficiency ratio | 47.4 | % | 47.2 | % | 47.3 | % | 47.4 | % | ||||||||||||||||||
| Underlying operating expenses | 5,076 | 5,577 | 10,653 | 11,587 | ||||||||||||||||||||||
| Operating expenses | 5,118 | 5,589 | 10,707 | 11,587 | ||||||||||||||||||||||
| Net capital gains and provisions impact in operating expenses | -42 | -12 | -54 | — | ||||||||||||||||||||||
| Underlying total income | 10,704 | 11,814 | 22,518 | 24,436 | ||||||||||||||||||||||
| Total income | 10,459 | 11,809 | 22,268 | 24,436 | ||||||||||||||||||||||
| Net capital gains and provisions impact in total income | 245 | 5 | 250 | — | ||||||||||||||||||||||
| (1) Averages included in the RoE, RoTE, RoA and RoRWA denominators are calculated using 4 months' worth of data in the case of quarterly figures (from March to June in Q2 and December to March in Q1) and 7 months in the case of annual figures (from December to June). | ||||||||||||||||||||||||||
| (2) For periods less than one year, and if there are results in the net capital gains and provisions line, the profit used to calculate RoE and RoTE is the annualised underlying attributable profit to which said results are added without annualising. | ||||||||||||||||||||||||||
| (3) For periods less than one year, and if there are results in the net capital gains and provisions line, the profit used to calculate RoA and RoRWA is the annualised underlying consolidated profit, to which said results are added without annualising. | ||||||||||||||||||||||||||
| (4) The risk weighted assets included in the denominator of the RoRWA metric are calculated in line with the criteria laid out in the CRR (Capital Requirements Regulation). | ||||||||||||||||||||||||||
| 82 | | January - June 2020 | ||||||
| Efficiency ratio | ||||||||||||||||||||||||||||||||
| H1'20 | H1'19 | |||||||||||||||||||||||||||||||
| % | Total income | Operating expenses | % | Total income | Operating expenses | |||||||||||||||||||||||||||
| Europe | 54.8 | 9,551 | 5,237 | 53.7 | 10,413 | 5,591 | ||||||||||||||||||||||||||
| Spain | 54.9 | 3,350 | 1,841 | 55.2 | 3,706 | 2,044 | ||||||||||||||||||||||||||
| Santander Consumer Finance | 43.4 | 2,266 | 983 | 44.6 | 2,321 | 1,035 | ||||||||||||||||||||||||||
| United Kingdom | 66.0 | 2,077 | 1,370 | 60.4 | 2,388 | 1,442 | ||||||||||||||||||||||||||
| Portugal | 44.3 | 668 | 296 | 43.8 | 712 | 312 | ||||||||||||||||||||||||||
| Poland | 42.4 | 742 | 315 | 42.8 | 817 | 349 | ||||||||||||||||||||||||||
| North America | 41.5 | 5,642 | 2,341 | 42.1 | 5,672 | 2,386 | ||||||||||||||||||||||||||
| US | 42.5 | 3,730 | 1,585 | 42.3 | 3,734 | 1,581 | ||||||||||||||||||||||||||
| Mexico | 39.5 | 1,912 | 756 | 41.6 | 1,938 | 806 | ||||||||||||||||||||||||||
| South America | 35.2 | 7,854 | 2,761 | 36.2 | 9,134 | 3,309 | ||||||||||||||||||||||||||
| Brazil | 31.8 | 5,788 | 1,839 | 32.4 | 6,864 | 2,227 | ||||||||||||||||||||||||||
| Chile | 40.3 | 1,137 | 458 | 41.8 | 1,255 | 524 | ||||||||||||||||||||||||||
| Argentina | 54.0 | 628 | 339 | 59.8 | 720 | 431 | ||||||||||||||||||||||||||
| Underlying RoTE | ||||||||||||||||||||||||||||||||
| H1'20 | H1'19 | |||||||||||||||||||||||||||||||
| % | Underlying attributable profit to the parent | Average stockholders' equity (excl. minority interests) - intangible assets | % | Underlying attributable profit to the parent | Average stockholders' equity (excl. minority interests) - intangible assets | |||||||||||||||||||||||||||
| Europe | 4.44 | 2,150 | 48,420 | 9.72 | 4,707 | 48,442 | ||||||||||||||||||||||||||
| Spain | 3.24 | 501 | 15,484 | 9.31 | 1,388 | 14,915 | ||||||||||||||||||||||||||
| Santander Consumer Finance | 11.02 | 954 | 8,661 | 15.36 | 1,316 | 8,565 | ||||||||||||||||||||||||||
| United Kingdom | 1.95 | 278 | 14,215 | 7.81 | 1,164 | 14,901 | ||||||||||||||||||||||||||
| Portugal | 8.52 | 319 | 3,751 | 12.54 | 520 | 4,150 | ||||||||||||||||||||||||||
| Poland | 4.63 | 147 | 3,168 | 9.61 | 300 | 3,119 | ||||||||||||||||||||||||||
| North America | 5.88 | 1,233 | 20,968 | 9.54 | 1,779 | 18,637 | ||||||||||||||||||||||||||
| US | 2.68 | 422 | 15,763 | 6.38 | 930 | 14,578 | ||||||||||||||||||||||||||
| Mexico | 15.46 | 811 | 5,247 | 20.47 | 849 | 4,145 | ||||||||||||||||||||||||||
| South America | 16.56 | 2,766 | 16,700 | 20.76 | 3,922 | 18,894 | ||||||||||||||||||||||||||
| Brazil | 17.12 | 1,990 | 11,624 | 21.65 | 2,965 | 13,696 | ||||||||||||||||||||||||||
| Chile | 11.23 | 366 | 3,261 | 17.63 | 623 | 3,532 | ||||||||||||||||||||||||||
| Argentina | 28.76 | 218 | 758 | 16.95 | 146 | 863 | ||||||||||||||||||||||||||
January - June 2020 | | 83 | ||||||
Credit risk indicators
The credit risk indicators measure the quality of the credit portfolio and the percentage of non-performing loans covered by provisions.
| Ratio | Formula | Relevance of the metric | ||||||||||||
NPL ratio (Non-performing loans) | Non-performing loans and advances to customers, customer guarantees and customer commitments granted | The NPL ratio is an important variable regarding financial institutions' activity since it gives an indication of the level of risk the entities are exposed to. It calculates risks that are, in accounting terms, declared to be non-performing as a percentage of the total outstanding amount of customer credit and contingent liabilities. | ||||||||||||
Total Risk 1 | ||||||||||||||
| Coverage ratio | Provisions to cover impairment losses on loans and advances to customers, customer guarantees and customer commitments granted | The coverage ratio is a fundamental metric in the financial sector. It reflects the level of provisions as a percentage of the non-performing assets (credit risk). Therefore it is a good indicator of the entity's solvency against client defaults both present and future. | ||||||||||||
| Non-performing loans and advances to customers, customer guarantees and customer commitments granted | ||||||||||||||
| Cost of Credit | Allowances for loan-loss provisions over the last 12 months | This ratio quantifies loan-loss provisions arising from credit risk over a defined period of time for a given loan portfolio. As such, it acts as an indicator of credit quality. | ||||||||||||
| Average loans and advances to customers over the last 12 months | ||||||||||||||
(1) Total risk = Total loans and advances and guarantees to customers (performing and non-performing) + non-performing contingent liabilities.
| Credit risk | Jun-20 | Mar-20 | Jun-20 | Jun-19 | ||||||||||
| NPL ratio | 3.26 | % | 3.25 | % | 3.26 | % | 3.51 | % | ||||||
| Non-performing loans and advances to customers customer guarantees and customer commitments granted | 32,782 | 32,743 | 32,782 | 34,421 | ||||||||||
| Total risk | 1,006,796 | 1,008,275 | 1,006,796 | 980,885 | ||||||||||
| Coverage ratio | 72 | % | 71 | % | 72 | % | 68 | % | ||||||
| Provisions to cover impairment losses on loans and advances to customers, customer guarantees and customer commitments granted | 23,635 | 23,361 | 23,635 | 23,432 | ||||||||||
| Non-performing loans and advances to customers customer guarantees and customer commitments granted | 32,782 | 32,743 | 32,782 | 34,421 | ||||||||||
| Cost of credit | 1.26 | % | 1.17 | % | 1.26 | % | 0.98 | % | ||||||
| Allowances for loan-loss provisions over the last 12 months | 12,035 | 11,058 | 12,035 | 8,889 | ||||||||||
| Average loans and advances to customers over the last 12 months | 953,470 | 944,853 | 953,470 | 910,753 | ||||||||||
| 84 | | January - June 2020 | ||||||
| NPL ratio | ||||||||||||||||||||||||||||||||
| H1'20 | H1'19 | |||||||||||||||||||||||||||||||
| % | Non-performing loans and advances to customers customer guarantees and customer commitments granted | Total risk | % | Non-performing loans and advances to customers customer guarantees and customer commitments granted | Total risk | |||||||||||||||||||||||||||
| Europe | 3.24 | 23,698 | 731,824 | 3.48 | 24,156 | 694,083 | ||||||||||||||||||||||||||
| Spain | 6.55 | 14,729 | 224,902 | 7.02 | 15,619 | 222,449 | ||||||||||||||||||||||||||
| Santander Consumer Finance | 2.52 | 2,579 | 102,214 | 2.24 | 2,263 | 100,974 | ||||||||||||||||||||||||||
| United Kingdom | 1.08 | 2,828 | 262,615 | 1.13 | 2,863 | 253,953 | ||||||||||||||||||||||||||
| Portugal | 4.43 | 1,762 | 39,751 | 5.00 | 1,916 | 38,362 | ||||||||||||||||||||||||||
| Poland | 4.57 | 1,489 | 32,602 | 4.21 | 1,353 | 32,129 | ||||||||||||||||||||||||||
| North America | 1.73 | 2,487 | 143,824 | 2.29 | 3,120 | 136,013 | ||||||||||||||||||||||||||
| US | 1.49 | 1,648 | 110,324 | 2.32 | 2,317 | 99,660 | ||||||||||||||||||||||||||
| Mexico | 2.50 | 839 | 33,500 | 2.21 | 803 | 36,353 | ||||||||||||||||||||||||||
| South America | 4.74 | 5,964 | 125,937 | 4.81 | 6,909 | 143,638 | ||||||||||||||||||||||||||
| Brazil | 5.07 | 3,647 | 71,915 | 5.27 | 4,571 | 86,736 | ||||||||||||||||||||||||||
| Chile | 4.99 | 2,056 | 41,228 | 4.52 | 1,969 | 43,537 | ||||||||||||||||||||||||||
| Argentina | 3.15 | 157 | 4,995 | 3.79 | 231 | 6,102 | ||||||||||||||||||||||||||
| Coverage ratio | ||||||||||||||||||||||||||||||||
| H1'20 | H1'19 | |||||||||||||||||||||||||||||||
| % | Provisions to cover impairment losses on loans and advances to customers, customer guarantees and customer commitments granted | Non-performing loans and advances to customers customer guarantees and customer commitments granted | % | Provisions to cover impairment losses on loans and advances to customers, customer guarantees and customer commitments granted | Non-performing loans and advances to customers customer guarantees and customer commitments granted | |||||||||||||||||||||||||||
| Europe | 53.4 | 12,650 | 23,698 | 49.9 | 12,047 | 24,156 | ||||||||||||||||||||||||||
| Spain | 43.3 | 6,382 | 14,729 | 42.9 | 6,699 | 15,619 | ||||||||||||||||||||||||||
| Santander Consumer Finance | 106.1 | 2,736 | 2,579 | 105.9 | 2,397 | 2,263 | ||||||||||||||||||||||||||
| United Kingdom | 46.0 | 1,300 | 2,828 | 31.9 | 914 | 2,863 | ||||||||||||||||||||||||||
| Portugal | 60.9 | 1,072 | 1,762 | 52.9 | 1,015 | 1,916 | ||||||||||||||||||||||||||
| Poland | 69.0 | 1,028 | 1,489 | 69.7 | 942 | 1,353 | ||||||||||||||||||||||||||
| North America | 206.5 | 5,135 | 2,487 | 150.3 | 4,689 | 3,120 | ||||||||||||||||||||||||||
| US | 253.1 | 4,171 | 1,648 | 158.4 | 3,670 | 2,317 | ||||||||||||||||||||||||||
| Mexico | 114.9 | 963 | 839 | 126.9 | 1,019 | 803 | ||||||||||||||||||||||||||
| South America | 93.0 | 5,544 | 5,964 | 93.0 | 6,429 | 6,909 | ||||||||||||||||||||||||||
| Brazil | 110.2 | 4,020 | 3,647 | 105.5 | 4,821 | 4,571 | ||||||||||||||||||||||||||
| Chile | 54.7 | 1,126 | 2,056 | 59.1 | 1,165 | 1,969 | ||||||||||||||||||||||||||
| Argentina | 165.7 | 261 | 157 | 126.4 | 292 | 231 | ||||||||||||||||||||||||||
January - June 2020 | | 85 | ||||||
Other indicators
The market capitalisation indicator provides information on the volume of tangible equity per share. The loan-to-deposit ratio (LTD) identifies the relationship between net customer loans and advances and customer deposits, assessing the proportion of loans and advances granted by the Group that are funded by customer deposits.
The Group also uses gross customer loan magnitudes excluding reverse repurchase agreements (repos) and customer deposits excluding repos. In order to analyse the evolution of the traditional commercial banking business of granting loans and capturing deposits, repos and reverse repos are excluded, as they are mainly treasury business products and highly volatile.
| Ratio | Formula | Relevance of the metric | ||||||||||||
| TNAV per share | Tangible book value 1 | This is a very commonly used ratio used to measure the company's accounting value per share having deducted the intangible assets. It is useful in evaluating the amount each shareholder would receive if the company were to enter into liquidation and had to sell all the company's tangible assets. | ||||||||||||
| (Tangible equity net asset value per share) | Number of shares excluding treasury stock | |||||||||||||
| Price / tangible book value per share (X) | Share price | This is one of the most commonly used ratios by market participants for the valuation of listed companies both in absolute terms and relative to other entities. This ratio measures the relationship between the price paid for a company and its accounting equity value. | ||||||||||||
| TNAV per share | ||||||||||||||
| LTD ratio | Net loans and advances to customers | This is an indicator of the bank's liquidity. It measures the total (net) loans and advances to customers as a percentage of customer deposits. | ||||||||||||
| (Loan-to-deposit) | Customer deposits | |||||||||||||
| Loans and advances (excl. reverse repos) | Gross loans and advances to customers excluding reverse repos | In order to aid analysis of the commercial banking activity, reverse repos are excluded as they are highly volatile treasury products. | ||||||||||||
| Deposits (excl. repos) | Customer deposits excluding repos | In order to aid analysis of the commercial banking activity, repos are excluded as they are highly volatile treasury products. | ||||||||||||
| PAT + After tax fees paid to SAN (in Wealth Management & Insurance) | Net profit + fees paid from Santander Asset Management and Santander Insurance to Santander, net of taxes, excluding Private Banking customers | Metric to assess Wealth Management & Insurance's total contribution to Grupo Santander profit. | ||||||||||||
(1) Tangible book value = Stockholders' equity - intangible assets
| Others | Jun-20 | Mar-20 | Jun-20 | Jun-19 | ||||||||||
| TNAV (tangible book value) per share | 4.00 | 4.21 | 4.00 | 4.30 | ||||||||||
| Tangible book value | 66,316 | 69,795 | 66,316 | 69,834 | ||||||||||
| Number of shares excl. treasury stock (million) | 16,593 | 16,590 | 16,593 | 16,233 | ||||||||||
| Price / Tangible book value per share (X) | 0.54 | 0.53 | 0.54 | 0.95 | ||||||||||
| Share price (euros) | 2.175 | 2.218 | 2.175 | 4.081 | ||||||||||
| TNAV (tangible book value) per share | 4.00 | 4.21 | 4.00 | 4.30 | ||||||||||
| Loan-to-deposit ratio | 110 | % | 115 | % | 110 | % | 111 | % | ||||||
| Net loans and advances to customers | 934,796 | 935,407 | 934,796 | 908,235 | ||||||||||
| Customer deposits | 846,832 | 815,459 | 846,832 | 814,751 | ||||||||||
| Q2'20 | Q1'20 | H1'20 | H1'19 | |||||||||||
| PAT + After tax fees paid to SAN (in WM&I) (Constant EUR million) | 512 | 572 | 1,085 | 1,100 | ||||||||||
| Profit after tax | 203 | 244 | 447 | 435 | ||||||||||
| Net fee income net of tax | 310 | 328 | 638 | 665 | ||||||||||
| 86 | | January - June 2020 | ||||||
Local currency measures
We make use of certain financial measures in local currency to help in the assessment of our ongoing operating performance. These non-IFRS financial measures include the results of operations of our subsidiary banks located outside the Eurozone, excluding the impact of foreign exchange. Because changes in foreign currency exchange rates do not have an operating impact on the results, we believe that evaluating their performance on a local currency basis provides an additional and meaningful assessment of performance to both management and the company’s investors.
The Group presents, at both the Group level as well as the business unit level, the real changes in the income statement as well as the changes excluding the exchange rate effect, as it considers the latter facilitates analysis, since it enables businesses movements to be identified without taking into account the impact of converting each local currency into euros.
Said variations, excluding the impact of exchange rate movements, are calculated by converting P&L lines for the different business units comprising the Group into our presentation currency, the euro, applying the average exchange rate for the first half of 2020 to all periods contemplated in the analysis.
The Group presents, at both the Group level as well as the business unit level, the changes in euros in the balance sheet as well as the changes excluding the exchange rate effect for loans and advances to customers excluding reverse repos and customer funds (which comprise deposits and mutual funds) excluding repos. As with the income statement, the reason is to facilitate analysis by isolating the changes in the balance sheet that are not caused by converting each local currency into euros.
These changes excluding the impact of exchange rate movements are calculated by converting loans and advances to customers excluding reverse repos and customer funds excluding repos, into our presentation currency, the euro, applying the closing exchange rate on the last working day of June 2020 to all periods contemplated in the analysis.
The average and period-end exchange rates for the main currencies in which the Group operates are set out in the table below.
| Exchange rates: 1 euro / currency parity | |||||||||||||||||||||||||||||
| Average (income statement) | Period-end (balance sheet) | ||||||||||||||||||||||||||||
| H1'20 | H1'19 | Jun-20 | Mar-20 | Jun-19 | |||||||||||||||||||||||||
| US dollar | 1.102 | 1.130 | 1.126 | 1.096 | 1.138 | ||||||||||||||||||||||||
| Pound sterling | 0.874 | 0.873 | 0.910 | 0.886 | 0.897 | ||||||||||||||||||||||||
| Brazilian real | 5.345 | 4.341 | 6.161 | 5.700 | 4.351 | ||||||||||||||||||||||||
| Mexican peso | 23.604 | 21.647 | 25.959 | 26.177 | 21.820 | ||||||||||||||||||||||||
| Chilean peso | 895.071 | 762.804 | 922.992 | 934.656 | 773.897 | ||||||||||||||||||||||||
| Argentine peso | 70.957 | 46.643 | 79.304 | 70.546 | 48.291 | ||||||||||||||||||||||||
| Polish zloty | 4.409 | 4.292 | 4.444 | 4.551 | 4.250 | ||||||||||||||||||||||||
January - June 2020 | | 87 | ||||||
| Response to the COVID-19 crisis Business model | ||||||||||||||||||||||||||
| Interim condensed consolidated financial statements | ||||||||||||||||||||||||||
INTERIM CONDENSED CONSOLIDATED FINANCIAL STATEMENTS
•CONSOLIDATED BALANCE SHEET
•CONSOLIDATED INCOME STATEMENT
NOTE: The following financial information for the first six months of 2020 and 2019 (attached herewith) corresponds to the condensed consolidated financial statements prepared in accordance with the International Financial Reporting Standards.
| Interim condensed consolidated balance sheet | ||||||||||||||||||||
| EUR million | ||||||||||||||||||||
| ASSETS | Jun-20 | Dic-19 | Jun-19 | |||||||||||||||||
| Cash, cash balances at central banks and other deposits on demand | 138,266 | 101,067 | 104,104 | |||||||||||||||||
| Financial assets held for trading | 124,145 | 108,230 | 102,574 | |||||||||||||||||
| Memorandum items:lent or delivered as guarantee with disposal or pledge rights | 15,479 | 28,445 | 28,424 | |||||||||||||||||
| Non-trading financial assets mandatorily at fair value through profit or loss | 5,902 | 4,911 | 5,393 | |||||||||||||||||
| Memorandum items:lent or delivered as guarantee with disposal or pledge rights | 392 | 224 | — | |||||||||||||||||
| Financial assets designated at fair value through profit or loss | 91,368 | 62,069 | 73,420 | |||||||||||||||||
| Memorandum items: lent or delivered as guarantee with disposal or pledge rights | 10,933 | 8,430 | 8,221 | |||||||||||||||||
| Financial assets at fair value through other comprehensive income | 122,560 | 125,708 | 118,062 | |||||||||||||||||
| Memorandum items: lent or delivered as guarantee with disposal or pledge rights | 22,870 | 29,116 | 26,458 | |||||||||||||||||
| Financial assets at amortised cost | 976,298 | 995,482 | 981,046 | |||||||||||||||||
| Memorandum items: lent or delivered as guarantee with disposal or pledge rights | 23,070 | 19,993 | 20,466 | |||||||||||||||||
| Hedging derivatives | 11,999 | 7,216 | 8,451 | |||||||||||||||||
| Changes in the fair value of hedged items in portfolio hedges of interest risk | 2,387 | 1,702 | 1,621 | |||||||||||||||||
| Investments | 8,668 | 8,772 | 7,788 | |||||||||||||||||
| Joint ventures entities | 1,249 | 1,325 | 962 | |||||||||||||||||
| Associated entities | 7,419 | 7,447 | 6,826 | |||||||||||||||||
| Assets under insurance or reinsurance contracts | 307 | 292 | 311 | |||||||||||||||||
| Tangible assets | 33,271 | 35,235 | 33,755 | |||||||||||||||||
| Property, plant and equipment | 32,335 | 34,262 | 32,651 | |||||||||||||||||
| For own-use | 13,527 | 15,041 | 14,522 | |||||||||||||||||
| Leased out under an operating lease | 18,808 | 19,221 | 18,129 | |||||||||||||||||
| Investment property | 936 | 973 | 1,104 | |||||||||||||||||
| Of which : Leased out under an operating lease | 799 | 823 | 794 | |||||||||||||||||
| Memorandum items: acquired in lease | 4,541 | 5,051 | 6,608 | |||||||||||||||||
| Intangible assets | 15,946 | 27,687 | 28,794 | |||||||||||||||||
| Goodwill | 12,595 | 24,246 | 25,613 | |||||||||||||||||
| Other intangible assets | 3,351 | 3,441 | 3,181 | |||||||||||||||||
| Tax assets | 26,218 | 29,585 | 30,102 | |||||||||||||||||
| Current tax assets | 5,639 | 6,827 | 6,502 | |||||||||||||||||
| Deferred tax assets | 20,579 | 22,758 | 23,600 | |||||||||||||||||
| Other assets | 10,627 | 10,138 | 12,140 | |||||||||||||||||
| Insurance contracts linked to pensions | 186 | 192 | 207 | |||||||||||||||||
| Inventories | 6 | 5 | 5 | |||||||||||||||||
| Other | 10,435 | 9,941 | 11,928 | |||||||||||||||||
| Non-current assets held for sale | 4,919 | 4,601 | 4,535 | |||||||||||||||||
| TOTAL ASSETS | 1,572,881 | 1,522,695 | 1,512,096 | |||||||||||||||||
| 88 | | January - June 2020 | ||||||
| Response to the COVID-19 crisis Business model | ||||||||||||||||||||||||||
| Interim condensed consolidated financial statements | ||||||||||||||||||||||||||
| Interim condensed consolidated balance sheet | |||||||||||||||||
| EUR million | |||||||||||||||||
| LIABILITIES | Jun-20 | Dic-19 | Jun-19 | ||||||||||||||
| Financial liabilities held for trading | 97,700 | 77,139 | 74,187 | ||||||||||||||
| Financial liabilities designated at fair value through profit or loss | 59,619 | 60,995 | 60,237 | ||||||||||||||
| Memorandum items: subordinated liabilities | — | — | — | ||||||||||||||
| Financial liabilities at amortised cost | 1,283,581 | 1,230,745 | 1,224,194 | ||||||||||||||
| Memorandum items: subordinated liabilities | 20,653 | 21,062 | 21,419 | ||||||||||||||
| Hedging derivatives | 6,583 | 6,048 | 7,267 | ||||||||||||||
| Changes in the fair value of hedged items in portfolio hedges of interest rate risk | 255 | 269 | 296 | ||||||||||||||
| Liabilities under insurance or reinsurance contracts | 2,246 | 739 | 731 | ||||||||||||||
| Provisions | 11,948 | 13,987 | 14,571 | ||||||||||||||
| Pensions and other post-retirement obligations | 5,516 | 6,358 | 6,216 | ||||||||||||||
| Other long term employee benefits | 1,196 | 1,382 | 1,708 | ||||||||||||||
| Taxes and other legal contingencies | 2,341 | 3,057 | 3,153 | ||||||||||||||
| Contingent liabilities and commitments | 666 | 739 | 728 | ||||||||||||||
| Other provisions | 2,229 | 2,451 | 2,766 | ||||||||||||||
| Tax liabilities | 8,844 | 9,322 | 9,838 | ||||||||||||||
| Current tax liabilities | 2,521 | 2,800 | 3,230 | ||||||||||||||
| Deferred tax liabilities | 6,323 | 6,522 | 6,608 | ||||||||||||||
| Other liabilities | 10,246 | 12,792 | 10,790 | ||||||||||||||
| Liabilities associated with non-current assets held for sale | — | — | — | ||||||||||||||
| TOTAL LIABILITIES | 1,481,022 | 1,412,036 | 1,402,111 | ||||||||||||||
| EQUITY | |||||||||||||||||
| Shareholders' equity | 112,899 | 124,239 | 120,054 | ||||||||||||||
| Capital | 8,309 | 8,309 | 8,118 | ||||||||||||||
| Called up paid capital | 8,309 | 8,309 | 8,118 | ||||||||||||||
| Unpaid capital which has been called up | — | — | — | ||||||||||||||
| Share premium | 52,446 | 52,446 | 50,993 | ||||||||||||||
| Equity instruments issued other than capital | 611 | 598 | 581 | ||||||||||||||
| Equity component of the compound financial instrument | — | — | — | ||||||||||||||
| Other equity instruments issued | 611 | 598 | 581 | ||||||||||||||
| Other equity | 172 | 146 | 155 | ||||||||||||||
| Accumulated retained earnings | 67,594 | 61,028 | 61,049 | ||||||||||||||
| Revaluation reserves | — | — | — | ||||||||||||||
| Other reserves | (3,708) | (3,110) | (4,061) | ||||||||||||||
| (-) Own shares | (65) | (31) | (12) | ||||||||||||||
| Profit attributable to shareholders of the parent | (10,798) | 6,515 | 3,231 | ||||||||||||||
| (-) Interim dividends | (1,662) | (1,662) | — | ||||||||||||||
| Other comprehensive income (loss) | (30,637) | (24,168) | (21,425) | ||||||||||||||
| Items not reclassified to profit or loss | (5,010) | (4,288) | (3,625) | ||||||||||||||
| Items that may be reclassified to profit or loss | (25,627) | (19,880) | (17,800) | ||||||||||||||
| Non-controlling interest | 9,597 | 10,588 | 11,356 | ||||||||||||||
| Other comprehensive income | (1,697) | (982) | (1,149) | ||||||||||||||
| Other items | 11,294 | 11,570 | 12,505 | ||||||||||||||
| TOTAL EQUITY | 91,859 | 110,659 | 109,985 | ||||||||||||||
| TOTAL LIABILITIES AND EQUITY | 1,572,881 | 1,522,695 | 1,512,096 | ||||||||||||||
| MEMORANDUM ITEMS: OFF BALANCE SHEET AMOUNTS | |||||||||||||||||
| Loan commitments granted | 228,767 | 241,179 | 223,954 | ||||||||||||||
| Financial guarantees granted | 12,166 | 13,650 | 12,077 | ||||||||||||||
| Other commitments granted | 78,654 | 68,895 | 94,785 | ||||||||||||||
January - June 2020 | | 89 | ||||||
| Response to the COVID-19 crisis Business model | ||||||||||||||||||||||||||
| Interim condensed consolidated financial statements | ||||||||||||||||||||||||||
| Interim condensed consolidated income statement | ||||||||||||||
| EUR million | ||||||||||||||
| 1S'20 | 1S'19 | |||||||||||||
| Interest income | 24,499 | 28,669 | ||||||||||||
| Financial assets at fair value with changes in other comprehensive income | 1,973 | 2,020 | ||||||||||||
| Financial assets at amortised cost | 21,255 | 24,396 | ||||||||||||
| Other interest income | 1,271 | 2,253 | ||||||||||||
| Interest expense | (8,297) | (11,033) | ||||||||||||
| Interest income/ (charges) | 16,202 | 17,636 | ||||||||||||
| Dividend income | 265 | 361 | ||||||||||||
| Income from companies accounted for using the equity method | (135) | 306 | ||||||||||||
| Commission income | 6,716 | 7,502 | ||||||||||||
| Commission expense | (1,580) | (1,639) | ||||||||||||
| Gain or losses on financial assets and liabilities not measured at fair value through profit or loss, net | 688 | 350 | ||||||||||||
| Financial assets at amortised cost | (27) | 105 | ||||||||||||
| Other financial assets and liabilities | 715 | 245 | ||||||||||||
| Gain or losses on financial assets and liabilities held for trading, net | 1,848 | (12) | ||||||||||||
| Reclassification of financial assets from fair value with changes in other comprehensive income | — | — | ||||||||||||
| Reclassification of financial assets from amortised cost | — | — | ||||||||||||
| Other gains or (-) losses | 1,848 | (12) | ||||||||||||
| Gains or losses on non-trading financial assets and liabilities mandatorily at fair value through profit or loss | 27 | 215 | ||||||||||||
| Reclassification of financial assets from fair value with changes in other comprehensive income | — | — | ||||||||||||
| Reclassification of financial assets from amortised cost | — | — | ||||||||||||
| Other gains or (-) losses | 27 | 215 | ||||||||||||
| Gain or losses on financial assets and liabilities measured at fair value through profit or loss, net | (129) | (207) | ||||||||||||
| Gain or losses from hedge accounting, net | (26) | (26) | ||||||||||||
| Exchange differences, net | (1,335) | 191 | ||||||||||||
| Other operating income | 765 | 855 | ||||||||||||
| Other operating expenses | (1,122) | (1,136) | ||||||||||||
| Income from assets under insurance and reinsurance contracts | 715 | 1,630 | ||||||||||||
| Expenses from liabilities under insurance and reinsurance contracts | (631) | (1,590) | ||||||||||||
| Total income | 22,268 | 24,436 | ||||||||||||
| Administrative expenses | (9,288) | (10,110) | ||||||||||||
| Staff costs | (5,470) | (6,080) | ||||||||||||
| Other general and administrative expenses | (3,818) | (4,030) | ||||||||||||
| Depreciation and amortisation | (1,419) | (1,477) | ||||||||||||
| Provisions or reversal of provisions, net | (614) | (1,916) | ||||||||||||
| Impairment or reversal of impairment at financial assets not measured at fair value through profit or loss, net | (7,030) | (4,368) | ||||||||||||
| Financial assets at fair value through other comprehensive income | (3) | (6) | ||||||||||||
| Financial assets at amortised cost | (7,027) | (4,362) | ||||||||||||
| Impairment of investments in subsidiaries, joint ventures and associates, net | — | — | ||||||||||||
| Impairment on non-financial assets, net | (10,241) | (27) | ||||||||||||
| Tangible assets | (93) | (19) | ||||||||||||
| Intangible assets | (10,146) | (2) | ||||||||||||
| Others | (2) | (6) | ||||||||||||
| Gain or losses on non financial assets and investments, net | 27 | 250 | ||||||||||||
| Negative goodwill recognised in results | 6 | — | ||||||||||||
| Gains or losses on non-current assets held for sale not classified as discontinued operations | (119) | (257) | ||||||||||||
| Operating profit/(loss) before tax | (6,410) | 6,531 | ||||||||||||
| Tax expense or income from continuing operations | (3,928) | (2,449) | ||||||||||||
| Profit for the period from continuing operations | (10,338) | 4,082 | ||||||||||||
| Profit or loss after tax from discontinued operations | — | — | ||||||||||||
| Profit for the period | (10,338) | 4,082 | ||||||||||||
| Profit attributable to non-controlling interests | 460 | 851 | ||||||||||||
| Profit attributable to the parent | (10,798) | 3,231 | ||||||||||||
| Earnings per share | ||||||||||||||
| Basic | (0.67) | 0.18 | ||||||||||||
| Diluted | (0.67) | 0.18 | ||||||||||||
| 90 | | January - June 2020 | ||||||
GLOSSARY
•Active customer: Those customers who comply with the minimum balance, income and/or transactionality requirements as defined according to the business area
•ADR: American Depositary Receipt
•AFS: Available for sale
•ALCO: Assets and Liabilities Committee
•APM: Alternative Performance Measures
•bps: basis points
•CBILS: Coronavirus Business Interruption Loan Scheme
•CDI: CREST Depository Interest
•CET1: Core equity tier 1
•CJEU: Court of Justice of the European Union
•CLBILS: Coronavirus Large Business Interruption Loan Scheme
•CNMV: Spanish National Securities Market Commission (Comisión Nacional del Mercado de Valores)
•COVID-19: Corona Virus Disease 19
•Digital customers: Every consumer of a commercial bank’s services who has logged on to their personal online banking and/or mobile banking in the last 30 days
•EBA: European Banking Authority
•ECB: European Central Bank
•EPS: Earnings per share
•ESG: Environmental, Social and Governance
•ESMA: European Securities and Markets Authority
•FCA: Financial Conduct Authority (UK)
•Fed: Federal Reserve
•FX: Foreign Exchange
•GDP: Gross Domestic Product
•GPTW: Great Place to Work
•ICO: Insitituto de Crédito Oficial (Official Credit Institution)
•IFRS 9: International Financial Reporting Standard 9, regarding financial instruments
•IFRS 16: International Financial Reporting Standard 16, regarding leases
•Loyal customers: Active customers who receive most of their financial services from the Group according to the commercial segment that they belong to. Various engaged customer levels have been defined taking profitability into account.
•LCR: Liquidity Coverage Ratio
•NPLs: Non-performing loans
•NPS: Net Promoter Score
•P/E ratio: Price / earnings per share ratio
•PBT: Profit before tax
•POS: Point of Sale
•pp: percentage points
•PPI: Payment protection insurance
•Repos: Repurchase agreements
•RoA: Return on assets
•RoE: Return on equity
•RoRWA: Return on risk weighted assets
•RoTE: Return on tangible equity
•RWAs: Risk weighted assets
•SAM: Santander Asset Management
•SBNA: Santander Bank N.A.
•SCF: Santander Consumer Finance
•SCIB: Santander Corporate & Investment Banking
•SC USA: Santander Consumer USA
•SEC: Securities and Exchanges Commission
•SGP: Santander Global Platform
•SH USA: Santander Holdings USA, Inc.
•SMEs: Small and medium enterprises
•SPF: Simple, Personal and Fair
•SREP: Supervisory Review and Evaluation Process
•SSM: Single Supervisory Mechanism, the system of banking supervision in Europe. It comprises the ECB and the national supervisory authorities of the participating countries
•T1: Tier 1
•TLAC: The total loss-absorption capacity requirement which is required to be met under the CRD V package
•TNAV: Tangible net asset value
•TRIM: Targeted review of internal models
•VaR: Value at Risk
•WM&I: Wealth Management & Insurance
January - June 2020 | | 91 | ||||||
| Response to the COVID-19 crisis Business model | ||||||||||||||||||||||||||
| Important information | ||||||||||||||||||||||||||
Important information
Non-IFRS and alternative performance measures
In addition to the financial information prepared in accordance with International Financial Reporting Standards (“IFRS”), this report contains certain financial measures that constitute alternative performance measures (“APMs”) as defined in the Guidelines on Alternative Performance Measures issued by the European Securities and Markets Authority (ESMA) on 5 October 2015 (ESMA/2015/1415en) and other non-IFRS measures (“Non-IFRS Measures”). The financial measures contained in this report that qualify as APMs and non-IFRS measures have been calculated using the financial information from Santander Group but are not defined or detailed in the applicable financial reporting framework and have neither been audited nor reviewed by our auditors. We use these APMs and non-IFRS measures when planning, monitoring and evaluating our performance. We consider these APMs and non-IFRS measures to be useful metrics for management and investors to facilitate operating performance comparisons from period to period, as these measures exclude items outside the ordinary course performance of our business, which are grouped in the “management adjustment” line and are further detailed in Section 3.2 of the Economic and Financial Review in our Directors´ Report included in our Annual Report on Form 20-F for the year ended 31 December 2019. While we believe that these APMs and Non-IFRS Measures are useful in evaluating our business, this information should be considered as supplemental in nature and is not meant as a substitute of IFRS measures. In addition, other companies, including companies in our industry, may calculate or use such measures differently, which reduces their usefulness as comparative measures. For further details of the APMs and non-IFRS measures used, including its definition or a reconciliation between any applicable management indicators and the financial data presented in the consolidated financial statements prepared under IFRS, please see the 2019 Annual Report on Form 20-F, filed with the U.S. Securities and Exchange Commission on 6 March 2020, as well as the section “Alternative performance measures” of the annex to this report. Underlying measures, which are included in this report, are non-IFRS measures.
The businesses included in each of our geographic segments and the accounting principles under which their results are presented here may differ from the included businesses and local applicable accounting principles of our public subsidiaries in such geographies. Accordingly, the results of operations and trends shown for our geographic segments may differ materially from those of such subsidiaries.
Forward-looking statements
Banco Santander, S.A. (“Santander”) cautions that this report contains statements that constitute “forward-looking statements” within the meaning of the U.S. Private Securities Litigation Reform Act of 1995. Forward-looking statements may be identified by words such as “expect”, “project”, “anticipate”, “should”, “intend”, “probability”, “risk”, “VaR”, “RoRAC”, “RoRWA”, “TNAV”, “target”, “goal”, “objective”, “estimate”, “future” and similar expressions. These forward-looking statements are found in various places throughout this report and include, without limitation, statements concerning our future business development and economic performance and our shareholder remuneration policy. While these forward-looking statements represent our judgment and future expectations concerning the development of our business, a number of risks, uncertainties and other important factors could cause actual developments and results to differ materially from our expectations. The following important factors, in addition to those discussed elsewhere in this report, and in our annual report on Form 20-F for the year ended 31 December 2019, filed with the U.S. Securities and Exchange Commission, could affect our future results and could cause outcomes to differ materially from those anticipated in any forward-looking statement: (1) general economic or industry conditions in areas in which we have significant business activities or investments, including a worsening of the economic environment, increasing in the volatility of the capital markets, inflation or deflation, changes in demographics, consumer spending, investment or saving habits, and the effects of the COVID-19 pandemic in the global economy; (2) exposure to various types of market risks, principally including interest rate risk, foreign exchange rate risk, equity price risk and risks associated with the replacement of benchmark indices; (3) potential losses associated with prepayment of our loan and investment portfolio, declines in the value of collateral securing our loan portfolio, and counterparty risk; (4) political stability in Spain, the UK, other European countries, Latin America and the US; (5) changes in laws, regulations or taxes, including changes in regulatory capital and liquidity requirements, including as a result of the UK exiting the European Union and increased regulation in light of the global financial crisis; (6) our ability to integrate successfully our acquisitions and the challenges inherent in diverting management’s focus and resources from other strategic opportunities and from operational matters while we integrate these acquisitions; and (7) changes in our ability to access liquidity and funding on acceptable terms, including as a result of changes in our credit spreads or a downgrade in our credit ratings or those of our more significant subsidiaries. Numerous factors could affect the future results of Santander and could result in those results deviating materially from those anticipated in the forward-looking statements. Other unknown or unpredictable factors could cause actual results to differ materially from those in the forward-looking statements.
Forward-looking statements speak only as of the date of this report and are based on the knowledge, information available and views taken on such date; such knowledge, information and views may change at any time. Santander does not undertake any obligation to update or revise any forward-looking statement, whether as a result of new information, future events or otherwise.
| 92 | | January - June 2020 | ||||||
| Response to the COVID-19 crisis Business model | ||||||||||||||||||||||||||
| Important information | ||||||||||||||||||||||||||
No offer
The information contained in this report is subject to, and must be read in conjunction with, all other publicly available information, including, where relevant any fuller disclosure document published by Santander. Any person at any time acquiring securities must do so only on the basis of such person’s own judgment as to the merits or the suitability of the securities for its purpose and only on such information as is contained in such public information having taken all such professional or other advice as it considers necessary or appropriate in the circumstances and not in reliance on the information contained in this report. No investment activity should be undertaken on the basis of the information contained in this report. In making this report available Santander gives no advice and makes no recommendation to buy, sell or otherwise deal in shares in Santander or in any other securities or investments whatsoever.
Neither this report nor any of the information contained therein constitutes an offer to sell or the solicitation of an offer to buy any securities. No offering of securities shall be made in the United States except pursuant to registration under the U.S. Securities Act of 1933, as amended, or an exemption therefrom. Nothing contained in this report is intended to constitute an invitation or inducement to engage in investment activity for the purposes of the prohibition on financial promotion in the U.K. Financial Services and Markets Act 2000.
Historical performance is not indicative of future results
Statements as to historical performance or financial accretion are not intended to mean that future performance, share price or future earnings (including earnings per share) for any period will necessarily match or exceed those of any prior period. Nothing in this report should be construed as a profit forecast.
| This document is a translation of a document originally issued in Spanish. Should there be any discrepancies between the English and the Spanish versions, only the original Spanish version should be binding. | ||
January - June 2020 | | 93 | ||||||
SIGNATURE
Pursuant to the requirements of the Securities Exchange Act of 1934, the registrant has duly caused this report to be signed on its behalf by the undersigned, thereunto duly authorized.
| Banco Santander, S.A. | |||||||||||
| Date: 29 July 2020 | By: | /s/ José García Cantera | |||||||||
| Name: | José García Cantera | ||||||||||
| Title: | Chief Financial Officer | ||||||||||