SECURITIES AND EXCHANGE COMMISSION
Washington, D.C. 20549
FORM 20-F
(Mark One) |
| REGISTRATION STATEMENT PURSUANT TO SECTION 12(b) |
|
| ANNUAL REPORT PURSUANT TO SECTION 13 OR 15(d) |
|
| TRANSITION REPORT PURSUANT TO SECTION 13 OR 15(d) |
|
| SHELL COMPANY REPORT PURSUANT TO SECTION 13 OR 15(d) |
BANCO SANTANDER CENTRAL HISPANO, S.A.
(Exact name of Registrant as specified in its charter)
Kingdom of Spain
(Jurisdiction of incorporation)
Ciudad Grupo Santander
28660 Boadilla del Monte (Madrid), Spain
(address of principal executive offices)
Securities registered or to be registered, pursuant to Section 12(b) of the Act
Title of each class |
| Name of each exchange |
| ||
American Depositary Shares, each representing the right to receive one Share of Capital Stock of Banco Santander Central Hispano, S.A., par value Euro 0.50 each |
| New York Stock Exchange |
Shares of Capital Stock of Banco Santander Central Hispano, S.A., par value Euro 0.50 each |
| New York Stock Exchange |
Non-cumulative Guaranteed Preferred Stock of Santander Finance Preferred, S.A. Unipersonal, Series 1 |
| New York Stock Exchange |
Guarantee of Non-cumulative Guaranteed Preferred Stock of Santander Finance Preferred, S.A. Unipersonal |
|
|
* | Banco Santander Central Hispano Shares are not listed for trading, but only in connection with the registration of the American Depositary Shares, pursuant to requirements of the New York Stock Exchange. |
Securities registered or to be registered pursuant to Section 12(g) of the Act.
None.
(Title of Class)
Securities for which there is a reporting obligation pursuant to Section 15(d) of the Act
None.
(Title of Class)
The number of outstanding shares of each class of Stock of Banco Santander Central Hispano, S.A. at
December 31, 2005 was:
Shares par value Euro 0.50 each: 6,254,296,579
The number of outstanding shares of each class of stock of Santander Finance Preferred, S.A. Unipersonal benefiting from a guarantee of Banco Santander Central Hispano, S.A. at December 31, 2005 was:
Non-cumulative Preferred Securities, Series 1 |
| 7,600,000 |
Indicate by check mark if the registrant is a well-known seasoned issuer, as defined in Rule 405 of the Securities Act.
Yes  No
No ![]()
If this report is an annual or transition report, indicate by check mark if the registrant is not required to file reports pursuant to Section 13 or 15(d) of the Securities Exchange Act of 1934.
Yes ![]() No
No
Indicate by check mark whether the registrant (1) has filed all reports required to be filed by Section 13 or 15(d) of the Securities Exchange Act of 1934 during the preceding 12 months (or for such shorter period that the registrant was required to file such reports), and (2) has been subject to such filing requirements for the past 90 days.
Yes No ![]()
Indicate by check mark whether the registrant is a large accelerated filer, an accelerated filer, or a non-accelerated filer. See definition of “accelerated filer and large accelerated filer” in Rule 12b-2 of the Exchange Act. (Check one):
Large accelerated filer Accelerated filer ![]() Non-accelerated filer
Non-accelerated filer ![]()
Indicate by check mark which financial statement item the registrant has elected to follow.
Item 17 ![]() Item 18
Item 18
If this is an annual report, indicate by check mark whether the registrant is a shell company (as defined in Rule 12b-2 of the Exchange Act).
Yes ![]() No
No
BANCO SANTANDER CENTRAL HISPANO, S.A.
|
|
| Page |
|
|
|
|
PART I |
|
|
|
|
|
|
|
| |||
|
|
|
|
| |||
|
|
|
|
| |||
|
|
|
|
|
| ||
|
| ||
|
| ||
|
| ||
|
|
|
|
| |||
|
|
|
|
|
| ||
|
| ||
|
| ||
|
| ||
|
|
|
|
| |||
|
|
|
|
| |||
|
|
|
|
|
| ||
|
| ||
|
| ||
|
| ||
|
| ||
|
| ||
|
|
|
|
| |||
|
|
|
|
|
| ||
|
| ||
|
| ||
|
| ||
|
| ||
|
|
|
|
| |||
|
|
|
|
|
| ||
|
| ||
|
| ||
|
|
|
|
| |||
|
|
|
|
|
| ||
|
| ||
|
|
|
|
1
2
PRESENTATION OF FINANCIAL AND OTHER INFORMATION
Accounting Principles
Except where noted otherwise, the financial information contained in this report has been prepared according to the International Financial Reporting Standards as adopted by the European Union (“IFRS”) and the Bank of Spain Circular 4/2004. Because this is the first year that we have prepared our financial statements under IFRS, this report contains changes to our accounting principles, the presentation of our financial statements and the structure of our business areas. Our financial statements for the fiscal year ending December 31, 2004 have been restated using IFRS standards. Financial information prepared according to Bank of Spain Circular 4/91 (“previous Spanish GAAP”) is not comparable with that prepared under IFRS. A description of the significant differences between these accounting standards is included in Note 57 to our consolidated financial statements, and Note 58 to our consolidated financial statements contains a description of significant differences between IFRS and U.S. GAAP.
We have formatted our financial information according to the classification format for banks used in Spain. We have not reclassified the line items to comply with Article 9 of Regulation S-X. Article 9 is a regulation of the U.S. Securities and Exchange Commission that contains formatting requirements for bank holding company financial statements. We have, however, included summary financial information that reflects the required reclassifications in Note 58 to our consolidated financial statements.
Our auditors, Deloitte, S.L., have audited our consolidated financial statements in respect of the two years ended December 31, 2005 and 2004 in accordance with IFRS and without qualification. The IFRS data for 2004 differ from those contained in the statutory consolidated financial statements for that year, as approved at the Annual General Meeting on June 18, 2005, which were prepared in accordance with previous Spanish GAAP.
See page F-1 to our consolidated financial statements for the 2005 and 2004 reports prepared by our independent registered public accounting firm.
Acquisition of Abbey National plc
In November 2004, we acquired 100% of the capital of Abbey National plc (“Abbey”). Our acquisition of Abbey was reflected on our financial statements as if the acquisition had occurred on December 31, 2004. Accordingly, Abbey’s assets and liabilities were consolidated into our balance sheet as of December 31, 2004, but Abbey’s results of operations had no impact on our income statement for the year ended December 31, 2004. Therefore, the income statement for the year ended December 31, 2005 is the first to reflect the acquisition of Abbey.
General Information
Our consolidated financial statements are in Euros, which are denoted “euro”, “euros”, EUR or “€” throughout this annual report. Also, throughout this annual report, when we refer to:
• | “dollars”, US$ or “$”, we mean United States dollars; and |
• | “one billion”, we mean 1,000 million. |
When we refer to average balances for a particular period, we mean the average of the month-end balances for that period, unless otherwise noted. We do not believe that monthly averages present trends that are materially different from trends that daily averages would show. We included in interest income any interest payments we received on non-accruing loans if they were received in the period when due. We have not reflected consolidation adjustments in any financial information about our subsidiaries or other units.
When we refer to loans, we mean loans, leases, discounted bills and accounts receivable, unless otherwise noted.
When we refer to impaired assets, we mean impaired loans, securities and other assets to collect.
When we refer to the allowances for credit losses, we mean the specific allowances for credit losses, and unless otherwise noted, the general allowance for credit losses including any allowances for country-risk. See “Item 4. Information on the Company—B. Business Overview—Selected Statistical Information—Classified Assets—Bank of Spain Allowances for Credit Losses and Country-Risk Requirements”.
CAUTIONARY STATEMENT REGARDING FORWARD-LOOKING STATEMENTS
This annual report contains statements that constitute “forward-looking statements” within the meaning of the U.S. Private Securities Litigation Reform Act of 1995. Forward-looking statements include information regarding:
• | exposure to various types of market risks; |
3
• | management strategy; |
• | capital expenditures; |
• | earnings and other targets; and |
• | asset portfolios. |
Forward-looking statements may be identified by words such as “expect,” “project,” “anticipate,” “should,” “intend,” “probability,” “risk,” “VaR,” “DCaR,” “ACaR,” “RORAC,” “target,” “goal,” “objective,” “estimate,” “future” and similar expressions. We include forward-looking statements in the “Operating and Financial Review Prospects,” “Information on the Company” and “Qualitative and Quantitative Disclosures About Market Risk” sections. Forward-looking statements are not guarantees of future performance and involve risks and uncertainties, and actual results may differ materially from those in the forward-looking statements.
You should understand that adverse changes in the following important factors, in addition to those discussed in “Risk Factors”, “Operating and Financial Review and Prospects,” “Information on the Company” and elsewhere in this annual report, could affect our future results and could cause those results or other outcomes to differ materially from those anticipated in any forward-looking statement:
Economic and Industry Conditions
• | exposure to various types of market risks, principally including interest rate risk, foreign exchange rate risk and equity price risk; |
• | general economic or industry conditions in Spain, the United Kingdom, other European countries, Latin America and the other areas in which we have significant business activities or investments; |
• | the effects of a decline in real estate prices, particularly in Spain and the UK; |
• | monetary and interest rate policies of the European Central Bank and various central banks; |
• | inflation or deflation; |
• | the effects of non-linear market behavior that cannot be captured by linear statistical models, such as the VaR/DCaR/ACaR model we use; |
• | changes in competition and pricing environments; |
• | the inability to hedge some risks economically; |
• | the adequacy of loss reserves; |
• | acquisitions, including our acquisition of Abbey, or restructurings; |
• | changes in demographics, consumer spending or saving habits; and |
• | changes in competition and pricing environments as a result of the progressive adoption of the internet for conducting financial services and/or other factors. |
Political and Governmental Factors
• | political stability in Spain, the United Kingdom, other European countries and Latin America; and |
• | changes in Spanish, UK, EU or foreign laws, regulations or taxes. |
Transaction and Commercial Factors
• | our ability to integrate successfully our acquisitions, including Abbey, and the challenges inherent in diverting management’s focus and resources from other strategic opportunities and from operational matters while we integrate these acquisitions; and |
• | the outcome of our negotiations with business partners and governments. |
Operating Factors
• | technical difficulties and the development and use of new technologies by us and our competitors; |
• | the impact of changes in the composition of our balance sheet on future net interest income; and |
• | potential losses associated with an increase in the level of substandard loans or non-performance by counterparties to other types of financial instruments. |
4
The forward-looking statements contained in this annual report speak only as of the date of this annual report. We do not undertake to update any forward-looking statement to reflect events or circumstances after that date or to reflect the occurrence of unanticipated events.
5
PART I
Item 1. Identity of Directors, Senior Management and Advisers
A. Directors and Senior Management.
Not applicable.
B. Advisers.
Not applicable.
C. Auditors.
Not applicable.
Item 2. Offer Statistics and Expected Timetable
A. Offer Statistics.
Not applicable.
B. Method and Expected Timetable.
Not applicable.
Selected Consolidated Financial Information
We have selected the following financial information from our consolidated financial statements. You should read this information in connection with, and it is qualified in its entirety by reference to, our consolidated financial statements.
Except where noted otherwise, the financial information contained in this report has been prepared according to IFRS and the Bank of Spain Circular 4/2004. Because this is the first year that we have prepared our financial statements under IFRS, this report contains changes to our accounting principles, the presentation of our financial statements and the structure of our business areas. Our financial statements for the fiscal year ending December 31, 2004 have been restated using IFRS standards. Financial information prepared according to previous Spanish GAAP is not comparable with that prepared under IFRS. A description of the significant differences between these accounting standards is included in Note 57 to our consolidated financial statements, and Note 58 to our consolidated financial statements contains a description of significant differences between IFRS and U.S. GAAP. In addition, our financial information is presented in Spanish format.
In the F-pages of this Form 20-F, audited financial statements for the years 2005 and 2004 are presented. Audited financial statements for the years 2003, 2002 and 2001 are not included in this document, but they can be found in our previous annual reports on Form 20-F.
In November 2004, we acquired 100% of the capital of Abbey. Under IFRS, our acquisition of Abbey was reflected on our financial statements as if the acquisition had occurred on December 31, 2004. Accordingly, Abbey’s assets and liabilities were consolidated into our balance sheet as of December 31, 2004, but Abbey’s results of operations had no impact on our income statement for the year ended December 31, 2004. Therefore, the income statement for the year ended December 31, 2005 is the first to reflect the acquisition of Abbey.
6
|
| (IFRS) |
| ||
|
|
| |||
|
| 2004 |
| 2005 |
|
|
|
|
| ||
| Consolidated Income Statement Data | (thousands of euros, except percentages and per share data) | ||||
Interest and similar income |
| 17,461,238 |
| 32,958,556 |
|
Interest expense and similar charges |
| (10,274,776 | ) | (22,800,696 | ) |
Income from equity instruments |
| 389,038 |
| 335,610 |
|
Net interest income |
| 7,575,500 |
| 10,493,470 |
|
Share of results of entities accounted for using the equity method |
| 449,011 |
| 619,166 |
|
Net fees and commissions (1) |
| 4,768,637 |
| 6,313,849 |
|
Insurance activity income |
| 161,374 |
| 815,519 |
|
Gains (losses) on financial transactions (2) |
| 1,100,725 |
| 1,565,281 |
|
Gross income |
| 14,055,247 |
| 19,807,285 |
|
Net income from non-financial activities (3) |
| 347,811 |
| 426,032 |
|
Other operating income (4) |
| (62,941 | ) | (103,745 | ) |
General administrative expenses |
| (6,839,867 | ) | (9,823,438 | ) |
Personnel expenses |
| (4,324,662 | ) | (5,817,397 | ) |
Other general administrative expenses |
| (2,515,205 | ) | (4,006,041 | ) |
Depreciation and amortization |
| (838,674 | ) | (1,021,211 | ) |
Net operating income |
| 6,661,576 |
| 9,284,923 |
|
Impairment losses (net) |
| (1,843,415 | ) | (1,806,983 | ) |
Net gains on disposal of investments in associates (5) |
| 30,891 |
| 1,299,046 |
|
Net results on other disposals, provisions and other income (6) |
| (267,749 | ) | (622,517 | ) |
Profit before tax |
| 4,581,303 |
| 8,154,469 |
|
Income tax |
| (596,792 | ) | (1,391,176 | ) |
Profit from continuing operations |
| 3,984,511 |
| 6,763,293 |
|
Profit from discontinued operations (net) |
| 11,723 |
| (13,523 | ) |
Consolidated profit for the year |
| 3,996,234 |
| 6,749,770 |
|
Profit attributed to minority interests |
| 390,364 |
| 529,666 |
|
Profit attributed to the Group |
| 3,605,870 |
| 6,220,104 |
|
|
|
|
| ||
Per Share Information: |
|
|
|
|
|
Average number of shares (thousands) (7) |
| 4,950,498 |
| 6,240,611 |
|
Profit attributed to the Group per average share |
| 0.7284 |
| 0.9967 |
|
Diluted earnings per share (in euros) |
| 0.7271 |
| 0.9930 |
|
Dividends paid (in euros) |
| 0.33 |
| 0.42 |
|
Dividends paid (in US$) |
| 0.39 |
| 0.49 |
|
7
Consolidated Balance Sheet Data: |
| (IFRS) |
| ||
|
|
| |||
|
| 2004 |
| 2005 |
|
|
|
|
| ||
Consolidated Balance Sheet Data: |
| (thousands of euros, except percentages and per share data) |
| ||
Total assets |
| 664,486,300 |
| 809,106,914 |
|
Loans and advances to credit institutions (8) |
| 58,379,774 |
| 59,773,022 |
|
Loans and advances to customers (net) (8) |
| 369,350,064 |
| 435,828,795 |
|
Investment Securities (9) |
| 138,753,764 |
| 203,938,360 |
|
Investments: Associates |
| 3,747,564 |
| 3,031,482 |
|
Liabilities |
|
|
|
|
|
Deposits from central banks and credit institutions (10) |
| 83,750,339 |
| 148,622,407 |
|
Customer deposits (10) |
| 283,211,616 |
| 305,765,280 |
|
Debt securities (10) |
| 113,838,603 |
| 148,840,346 |
|
Capitalization |
|
|
|
|
|
Guaranteed Subordinated debt |
| 9,369,939 |
| 8,973,699 |
|
Secured Subordinated debt |
| 508,039 |
| — |
|
Other Subordinated debt |
| 12,300,179 |
| 13,016,989 |
|
Preferred securities (11) |
| 5,292,016 |
| 6,772,768 |
|
Preferred shares (11) |
| 2,124,222 |
| 1,308,847 |
|
Minority interests (including profit attributed to minority interests) |
| 2,085,316 |
| 2,848,223 |
|
Stockholders’ equity (12) |
| 34,414,942 |
| 39,778,476 |
|
Total capitalization |
| 66,094,652 |
| 72,699,002 |
|
Stockholders’ Equity per Share (12) |
| 6.95 |
| 6.37 |
|
Other managed funds |
|
|
|
|
|
Mutual funds |
| 97,837,724 |
| 109,480,095 |
|
Pension funds |
| 21,678,522 |
| 28,619,183 |
|
Managed portfolio |
| 8,998,388 |
| 14,746,329 |
|
Total other managed funds |
| 128,514,634 |
| 152,845,607 |
|
Consolidated Ratios |
|
|
|
|
|
Profitability Ratios |
|
|
|
|
|
Net Yield (13) |
| 2.20 | % | 1.57 | % |
Efficiency ratio (14) |
| 52.00 | % | 52.55 | % |
Return on average total assets (ROA) |
| 1.01 | % | 0.91 | % |
Return on average stockholders’ equity (ROE) |
| 19.74 | % | 19.86 | % |
Capital Ratio: |
|
|
|
|
|
Average stockholders’ equity to average total assets |
| 4.62 | % | 4.24 | % |
Ratio of earnings to fixed charges (15) |
|
|
|
|
|
Excluding interest on deposits |
| 1.89 | % | 1.82 | % |
Including interest on deposits |
| 1.39 | % | 1.32 | % |
Credit Quality Data |
|
|
|
|
|
Allowances for impaired assets (excluding country-risk) |
| 6,813,354 |
| 7,902,225 |
|
Allowances for impaired assets as a percentage of total loans |
| 1.81 | % | 1.78 | % |
Impaired assets (16) |
| 4,114,691 |
| 4,341,500 |
|
Impaired assets as a percentage of total loans |
| 1.09 | % | 0.98 | % |
Allowances for impaired assets as a percentage of impaired assets |
| 165.59 | % | 182.02 | % |
Net loan charge-offs as a percentage of total loans |
| 0.16 | % | 0.23 | % |
(1) | Equals “Fee and commission income” less “Fee and commission expense” as stated in our consolidated financial statements. |
(2) | Equals the sum of “Gains/losses on financial assets and liabilities (net)” and “Exchange differences (net)” as stated in our consolidated financial statements. |
8
(3) | Equals the sum of “Sales and income from the provision of non-financial services” and “Cost of sales” as stated in our consolidated financial statements. |
(4) | Equals the sum of “Other operating income” and “Other operating expenses” as stated in our consolidated financial statements. |
(5) | Equals the sum of “Other gains: Gains on disposal of investments in associates” and “Other losses: Losses on disposal of investments in associates” as stated in our consolidated financial statements. |
(6) | Includes “Provisions (net)”, “Finance income from non-financial activities”, “Finance expense from non-financial activities”, “Other gains: Gains on disposal of tangible assets”, “Other gains: Other”, “Other losses: Losses on disposal of tangible assets” and “Other losses: Other” as stated in our consolidated financial statements. |
(7) | Average number of shares have been calculated on the basis of the weighted average number of shares outstanding in the relevant year, net of treasury stock. |
(8) | Equals the sum of the amounts included under the headings “Financial assets held for trading”, “Other financial assets at fair value through profit or loss” and “Loans and receivables” as stated in our consolidated financial statements. |
(9) | Equals the amounts included as “Debt instruments” and “Other equity instruments” under the headings “Financial assets held for trading”, “Other financial assets at fair value through profit or loss”, “Available-for-sale financial assets” and “Loans and receivables” as stated in our consolidated financial statements. |
(10) | Equals the sum of the amounts included under the headings “Financial liabilities held for trading”, “Other financial liabilities at fair value through profit or loss” and “Financial liabilities at amortized cost” included in Notes 20, 21 and 22 to our consolidated financial statements. |
(11) | In our consolidated financial statements preferred securities are included under “Subordinated liabilities” and preferred shares are stated as “Equity having the substance of a financial liability”. |
(12) | Equals the sum of the amounts included at the end of each year as “Own funds” and “Valuation adjustments” as stated in our consolidated financial statements. We have deducted the book value of treasury stock from stockholders’ equity. |
(13) | Net yield is the total of net interest income (including dividends on equity securities) divided by average earning assets. See “Item 4 Information on the Company—B. Business Overview—Selected Statistical Information—Earnings Assets—Yield Spread”. |
(14) | Efficiency ratio equals the sum of “General administrative expenses from financial activities”, “Depreciation and amortization costs” less “Offsetting fees” (see Note 48 to our consolidated financial statements), divided by the sum of “Gross income” and “Net income from non-financial activities” less “General administrative expenses from non-financial activities”. |
(15) | For the purpose of calculating the ratio of earnings to fixed charges, earnings consist of income from continuing operations before taxation and minority interests, plus fixed charges and after deduction of the unremitted pre-tax income of companies accounted for by the equity method. Fixed charges consist of total interest expense, including or excluding interest on deposits as appropriate, and the proportion of rental expense deemed representative of the interest factor. Fixed charges include dividends and interest paid on preferred shares. |
(16) | Impaired assets reflect Bank of Spain classifications. Such classifications differ from the classifications applied by U.S. banks in reporting loans as non-accrual, past due, restructured and potential problem loans. See “Item 4. Information on the Company—B. Business Overview—Selected Statistical Information—Classified Assets—Bank of Spain Classification Requirements”. |
9
The following table shows net income, stockholders’ equity, total assets and certain ratios on a U.S. GAAP basis.
|
| Year Ended December 31, | ||||||||
|
| |||||||||
US GAAP |
| 2001 |
| 2002 |
| 2003 |
| 2004 |
| 2005 |
|
|
|
|
|
| |||||
|
| (In thousands of euros, except ratios and per share data) | ||||||||
Net income (1) |
| 2,176,711 |
| 2,286,959 |
| 2,264,332 |
| 3,940,866 |
| 6,318,460 |
Stockholders’ equity (1)(2) |
| 29,944,012 |
| 23,114,475 |
| 25,093,234 |
| 38,671,623 |
| 43,784,335 |
Total assets |
| 367,264,418 |
| 321,804,691 |
| 350,662,064 |
| 604,084,270 |
| 845,345,463 |
Net Income per share (3) |
| 0.48 |
| 0.48 |
| 0.47 |
| 0.80 |
| 1.01 |
Stockholders’ equity per share (2)(3) |
| 6.56 |
| 4.89 |
| 5.26 |
| 7.78 |
| 7.02 |
Ratio of earnings to fixed charges: (4) |
|
|
|
|
|
|
|
|
|
|
Excluding interest on deposits |
| 1.26 |
| 1.61 |
| 1.79 |
| 1.86 |
| 1.86 |
Including interest on deposits |
| 1.10 |
| 1.22 |
| 1.30 |
| 1.36 |
| 1.33 |
Ratio of earnings to combined fixed charges and preferred stock dividends: (5) |
|
|
|
|
|
|
|
|
|
|
Excluding interest on deposits |
| 1.18 |
| 1.49 |
| 1.64 |
| 1.77 |
| 1.84 |
Including interest on deposits |
| 1.07 |
| 1.18 |
| 1.26 |
| 1.33 |
| 1.32 |
(1) | For information concerning reconciliation between IFRS and U.S. GAAP and a discussion of the principal U.S. GAAP adjustments to net income and stockholders’ equity, see Note 58 to our consolidated financial statements. |
(2) | As of the end of each period. The book value of our treasury stock has been deducted from stockholders’ equity. |
(3) | Per share data have been calculated on the basis of the weighted average number of our shares outstanding in the relevant year, including treasury stock. |
(4) | For the purpose of calculating the ratio of earnings to fixed charges, earnings consist of income from continuing operations before taxation and minority interests, plus fixed charges and after deduction of the unremitted pre-tax income of companies accounted for by the equity method. Fixed charges consist of total interest expense, including or excluding interest on deposits as appropriate, and the proportion of rental expense deemed representative of the interest factor. |
(5) | For the purpose of calculating the ratio of earnings to combined fixed charges and preferred stock dividends, earnings consist of income from continuing operations before taxation and minority interest, plus fixed charges and after deduction of the unremitted pre-tax income of companies accounted for by the equity method. Fixed charges consist of total interest expense, including or excluding interest on deposits as appropriate, preferred stock dividend requirements (corresponding to minority interest participation and, accordingly, not eliminated in consolidation), and the proportion of rental expense deemed representative of the interest factor. Preferred stock dividends for any year represent the amount of pre-tax earnings required to pay dividends on preferred stock outstanding during such year. Under IFRS all payments from preferred securities are accounted for as interest expenses and consequently this ratio is not necessary. (For details of the different accounting treatment given to preferred securities under IFRS and U.S.GAAP see Notes 58.2, 58.5 and 58.6.g to our consolidated financial statements). |
Exchange Rates
Fluctuations in the exchange rate between euros and dollars have affected the dollar equivalent of the share prices on Spanish Stock Exchanges and, as a result, are likely to affect the dollar market price of our American Depositary Shares, or ADSs, in the United States. In addition, dividends paid to the depositary of the ADSs are denominated in euros and fluctuations in the exchange rate affect the dollar conversion by the depositary of cash dividends paid on the shares to the holders of the ADSs. Fluctuations in the exchange rate of euros against other currencies may also affect the euro value of our non-euro denominated assets, liabilities, earnings and expenses.
10
The following tables set forth, for the periods and dates indicated, certain information concerning the exchange rate for euros and dollars (expressed in dollars per euro), based on the Noon Buying Rate as announced by the Federal Reserve Bank of New York for the dates and periods indicated.
|
| Rate During Period | ||
|
| |||
Calendar Period |
| Period End |
| Average Rate(1) |
|
|
| ||
2001 |
| 0.8901 |
| 0.8909 |
2002 |
| 1.0485 |
| 0.9495 |
2003 |
| 1.2597 |
| 1.411 |
2004 |
| 1.3538 |
| 1.2478 |
2005 |
| 1.1842 |
| 1.2449 |
(1) | The average of the Noon Buying Rates for euros on the last day of each month during the period. |
|
| Rate During Period | ||
|
| |||
Last six months |
| High $ |
| Low $ |
|
|
| ||
2005 |
|
|
|
|
December |
| 1.2041 |
| 1.1699 |
2006 |
|
|
|
|
January |
| 1.2287 |
| 1.1980 |
February |
| 1.2100 |
| 1.1860 |
March |
| 1.2197 |
| 1.1886 |
April |
| 1.2624 |
| 1.2091 |
May |
| 1.2888 |
| 1.2607 |
June (through June 23, 2006) |
| 1.2953 |
| 1.2522 |
On June 23, 2006, the exchange rate for euros and dollars (expressed in dollars per euro), based on the Noon Buying Rate, was $1.2522.
For a discussion of the accounting principles used in translation of foreign currency-denominated assets and liabilities to euros, see Note 2(a) of our consolidated financial statements.
B. Capitalization and indebtedness.
Not Applicable.
C. Reasons for the offer and use of proceeds.
Not Applicable.
Risks Relating to Our Operations
Since our loan portfolio is concentrated in Continental Europe, the United Kingdom and Latin America, adverse changes affecting the Continental European, the United Kingdom or certain Latin American economies could adversely affect our financial condition.
Our loan portfolio is mainly concentrated in Continental Europe (in particular, Spain), the United Kingdom and Latin America. At December 31, 2005, Continental Europe accounted for approximately 49% of our total loan portfolio (Spain accounted for 36% of our total loan portfolio), while the United Kingdom and Latin America accounted for 39% and 12%, respectively. Therefore, adverse changes affecting the economies of Continental Europe (in particular Spain), the United Kingdom or the Latin American countries where we operate would likely have a significant adverse impact on our loan portfolio and, as a result, on our financial condition, cash flows and results of operations. See “Item 4. Information on the Company—B. Business Overview.”
Some of our business is cyclical and our income may decrease when demand for certain products or services is in a down cycle.
The level of income we derive from certain of our products and services depends on the strength of the economies in the regions where we operate and certain market trends prevailing in those areas. While we attempt to diversify our businesses, negative cycles may adversely affect our income in the future.
11
Since our principal source of funds is short term deposits, a sudden shortage of these funds could increase our cost of funding.
Historically, our principal source of funds has been customer deposits (demand, time and notice deposits). At December 31, 2005, 17.2% of these customer deposits are time deposits in amounts greater than $100,000. Time deposits have represented 51.7% (under previous Spanish GAAP) and 46.9% of total customer deposits at the end of 2003 and 2004, respectively, and 43.5% at the end of 2005. Large-denomination time deposits may be a less stable source of deposits than other type of deposits. In addition, since we rely heavily on short-term deposits for our funding, there can be no assurance that we will be able to maintain our levels of funding without incurring higher funding costs or liquidating certain assets.
Risks concerning borrower credit quality and general economic conditions are inherent in our business.
Risks arising from changes in credit quality and the recoverability of loans and amounts due from counterparties are inherent in a wide range of our businesses. Adverse changes in the credit quality of our borrowers and counterparties or a general deterioration in Spanish, UK, Latin American or global economic conditions, or arising from systemic risks in the financial systems, could reduce the recoverability and value of our assets and require an increase in our level of provisions for credit losses. Deterioration in the economies in which we operate could reduce the profit margins for our banking and financial services businesses.
Increased exposure to real estate makes us more vulnerable to developments in this market.
The decrease in interest rates globally has caused an increase in the demand of mortgage loans in the last few years. This has had repercussions in housing prices, which have also risen significantly. As real estate mortgages are one of our main assets, comprising 53% of our loan portfolio at December 31, 2005, we are currently highly exposed to developments in real estate markets. A strong increase in interest rates might have a significant negative impact in mortgage payment delinquency rates. An increase in such delinquency rates could have an adverse effect on our business, financial condition and results of operations.
The Group may generate lower revenues from brokerage and other commission- and fee-based businesses.
Market downturns are likely to lead to declines in the volume of transactions that the Group executes for its customers and, therefore, to declines in the Group’s non-interest revenues. In addition, because the fees that the Group charges for managing its clients’ portfolios are in many cases based on the value or performance of those portfolios, a market downturn that reduces the value of the Group’s clients’ portfolios or increases the amount of withdrawals would reduce the revenues the Group receives from its asset management and private banking and custody businesses.
Even the absence of a market downturn, below-market performance by the Group’s mutual funds may result in increased withdrawals and reduced inflows, which would reduce the revenue the Group receives from its asset management business.
Market risks associated with fluctuations in bond and equity prices and other market factors are inherent in the Group’s business. Protracted market declines can reduce liquidity in the markets, making it harder to sell assets and leading to material losses.
The performance of financial markets may cause changes in the value of the Group’s investment and trading portfolios. In some of the Group’s business, protracted adverse market movements, particularly asset price decline, can reduce the level of activity in the market or reduce market liquidity. These developments can lead to material losses if the Group cannot close out deteriorating positions in a timely way. This may especially be the case for assets of the Group for which there are not very liquid markets to begin with. Assets that are not traded on stock exchanges or other public trading markets, such as derivative contracts between banks, may have values that the Group calculates using models other than publicly quoted prices. Monitoring the deterioration of prices of assets like these is difficult and could lead to losses that the Group did not anticipate.
12
Despite the Group’s risk management policies, procedures and methods, the Group may nonetheless be exposed to unidentified or unanticipated risks.
The Group has devoted significant resources to developing its risk management policies, procedures and assessment methods and intends to continue to do so in the future. Nonetheless, the Group’s risk management techniques and strategies may not be fully effective in mitigating the Group’s risk exposure in all economic market environments or against all types of risk, including risks that the Group fails to identify or anticipate. Some of the Group’s qualitative tools and metrics for managing risk are based upon the Group’s use of observed historical market behavior. The Group applies statistical and other tools to these observations to arrive at quantifications of its risk exposures. These tools and metrics may fail to predict future risk exposures. These risk exposures could, for example, arise from factors the Group did not anticipate or correctly evaluate in its statistical models. This would limit the Group’s ability to manage its risks. The Group’s losses thus could be significantly greater than the historical measures indicate. In addition, the Group’s quantified modeling does not take all risks into account. The Group’s more qualitative approach to managing those risks could prove insufficient, exposing it to material unanticipated losses. If existing or potential customers believe the Group’s risk management is inadequate, they could take their business elsewhere. This could harm the Group’s reputation as well as its revenues and profits.
Our acquisition of Abbey, and any future acquisitions may not be successful and may be disruptive to our business.
We have acquired controlling interests in various companies, and more recently, we completed the acquisition of Abbey. Although we expect to realize strategic, operational and financial benefits as a result of the Abbey acquisition, we cannot predict whether and to what extent such benefits will be achieved. In particular, the success of the Abbey acquisition will depend, in part, on our ability to realize the anticipated cost savings from assuming the control of Abbey’s business. In addition, we will face certain challenges as we work to integrate Abbey’s operations into our businesses. Moreover, the Abbey acquisition increased our total assets by 51.7% (under previous Spanish GAAP) as of December 31, 2004, thereby presenting us with significant challenges as we work to manage the increases in scale resulting from the acquisition. Our failure to successfully integrate and operate Abbey, and to realize the anticipated benefits of the acquisition, could adversely affect our operating, performing and financial results. See “Item 4. Information on the Company—A. History and development of the company.” Additionally, we may consider other strategic acquisitions and partnerships from time to time. There can be no assurances that we will be successful in our plans regarding the operation of past or future acquisitions and strategic partnerships.
We can give you no assurance that our acquisition and partnership activities will perform in accordance with our expectations. Despite our due diligence efforts, we must necessarily base any assessment of potential acquisitions and partnerships on inexact and incomplete information and assumptions with respect to operations, profitability and other matters that may prove to be incorrect. We can give no assurance that our expectations with regards to integration and synergies will materialize.
Increased competition in the countries where we operate may adversely affect our growth prospects and operations.
Most of the financial systems in which we operate are highly competitive. Recent financial sector reforms in the markets in which we operate have increased competition among both local and foreign financial institutions, and we believe that this trend will continue. In particular, price competition in Europe and Latin America has increased recently. Our success in the European and Latin American markets will depend on our ability to remain competitive with other financial institutions. In addition, there has been a trend towards consolidation in the banking industry, which has created larger and stronger banks with which we must now compete. There can be no assurance that this increased competition will not adversely affect our growth prospects, and therefore our operations. We also face competition from non-bank competitors, such as brokerage companies, department stores (for some credit products), leasing companies and factoring companies, mutual fund and pension fund management companies and insurance companies.
Volatility in interest rates may negatively affect our net interest income and increase our non-performing loan portfolio.
Changes in market interest rates could affect the interest rates charged on interest-earning assets differently than the interest rates paid on interest-bearing liabilities. This difference could result in an increase in interest expense relative to interest income leading to a reduction in our net interest income. Income from treasury operations is particularly vulnerable to interest rate volatility. Since the majority of our loan portfolio reprices in less than one year, rising interest rates may also bring about an increasing non-performing loan portfolio. Interest rates are highly sensitive to many factors beyond our control, including deregulation of the financial sector, monetary policies, domestic and international economic and political conditions and other factors.
13
Foreign exchange rate fluctuations may negatively affect our earnings and the value of our assets and shares.
Fluctuations in the exchange rate between the euro and the U.S. dollar will affect the U.S. dollar equivalent of the price of our securities on the stock exchanges in which our shares and ADRs are traded. These fluctuations will also affect the conversion to U.S. dollars of cash dividends paid in euros on our shares.
In the ordinary course of our business, we have a percentage of our assets and liabilities denominated in currencies other than the euro. Fluctuations in the value of the euro against other currencies may adversely affect our profitability. For example, the appreciation of the euro against some Latin American currencies and the U.S. dollar will depress earnings from our Latin American operations, and the appreciation of the euro against the sterling will depress earnings from our UK operations. Additionally, while most of the governments of the countries in which we operate have not imposed prohibitions on the repatriation of dividends, capital investment or other distributions, no assurance can be given that these governments will not institute restrictive exchange control policies in the future. Moreover, fluctuations among the currencies in which our shares and ADRs trade could reduce the value of your investment.
Changes in the regulatory framework in the jurisdictions where we operate could adversely affect our business.
A number of banking regulations designed to maintain the safety and soundness of banks and limit their exposure to risk apply in the different jurisdictions in which our subsidiaries operate. Changes in regulations, which are beyond our control, may have a material effect on our business and operations. As some of the banking laws and regulations have been recently adopted, the manner in which those laws and related regulations are applied to the operations of financial institutions is still evolving. Moreover, no assurance can be given generally that laws or regulations will be adopted, enforced or interpreted in a manner that will not have an adverse affect on our business.
Operational risks are inherent in our business.
Our businesses depend on the ability to process a large number of transactions efficiently and accurately. Losses can result from inadequate personnel, inadequate or failed internal control processes and systems, or from external events that interrupt normal business operations.
Different disclosure and accounting principles between Spain and the U.S. may provide you with different or less information about us than you expect.
There may be less publicly available information about us than is regularly published about companies in the United States. While we are subject to the periodic reporting requirements of the Securities Exchange Act of 1934 (the “Exchange Act”), the disclosure required from foreign issuers under the Exchange Act is more limited than the disclosure required from U.S. issuers. Additionally, we present our financial statements under IFRS which differs from US GAAP. See Note 58 to our consolidated financial statements.
In 2005, the Group adopted IFRS, which has affected the manner in which the Group reports its financial results, as IFRS differs in significant respects from previous Spanish GAAP.
Until December 31, 2004, the Group prepared its financial statements in accordance with previous Spanish GAAP. In June 2002, the Council of Ministers of the EU adopted new regulations requiring all listed EU companies, including Santander, to apply IFRS (previously known as “International Accounting Standards” or “IAS”) in preparing their consolidated financial statements beginning January 1, 2005. Because IFRS emphasizes the measure of the fair value of certain assets and liabilities, applying these standards to our financial statements has had a considerable impact on a number of important areas, including, among others, goodwill and intangible assets, employee benefits and financial instruments, and accounting for share-based payments, long-term assets and business combinations. Because our financial statements prepared in accordance with IFRS differ from our financial statements prepared in accordance with previous Spanish GAAP, the methods used by the financial community to assess our financial performance and value our publicly-traded securities could be affected.
14
If we are not able to adequately implement the requirements of Section 404 of the Sarbanes-Oxley Act of 2002 and are the subject of sanctions or investigation, our results of operations and our ability to provide timely and reliable financial information may be adversely affected.
Changing laws, regulations and standards relating to corporate governance and public disclosure, including the Sarbanes-Oxley Act of 2002 and related regulations implemented by the SEC are creating uncertainty for public companies, increasing legal and financial compliance costs and making some activities more time consuming. We are evaluating our internal control over financial reporting to allow management to report on, and our registered independent public accounting firm to attest to, our internal controls over financial reporting. We will be performing the system and process evaluation and testing (and any necessary remediation) required to comply with the management certification and auditor attestation requirements of Section 404 of the Sarbanes-Oxley Act, which we are required to comply with in our annual report which we will file in 2007 for our 2006 fiscal year. As a result, we expect to incur substantial additional expenses and diversion of management’s time. While we anticipate being able to fully implement the requirements relating to internal controls and all other aspects of Section 404 by our deadline, we cannot be certain as to the timing of completion of our evaluation, testing and any remediation actions or the impact of the same on our operations since there is presently no precedent available by which to measure compliance adequacy. If we are not able to implement the requirements of Section 404 in a timely manner or with adequate compliance, we might be subject to sanctions or investigation by regulatory authorities such as the SEC. Any such action could adversely affect our financial results or investors’ confidence in our company and could cause the price of our securities to fall. In addition, if we fail to develop and maintain effective controls and procedures, we may be unable to provide the financial information in a timely and reliable manner.
We are exposed to risk of loss from legal and regulatory proceedings.
The Group and its subsidiaries are the subject of a number of legal proceedings and regulatory actions. An adverse result in one or more of these proceedings could have a material adverse effect on our operating results for any particular period. For information relating to the legal proceedings involving our businesses, see “Item 8 — Financial Information – A. Consolidated statements and other financial information. – Legal proceedings”.
Risks Relating to Latin America
Our Latin American subsidiaries’ growth, asset quality and profitability may be adversely affected by volatile macroeconomic conditions.
The economy of the 9 Latin American countries where we operate has experienced significant volatility in recent decades, characterized, in some cases, by slow or regressive growth, declining investment and hyperinflation. This volatility has resulted in fluctuations in the levels of deposits and in the relative economic strength of various segments of the economies to which we lend. Latin American banking activities (including Retail Banking, Asset Management and Private Banking and Global Wholesale Banking) accounted for €1,776 million of our net attributable income for the year ended December 31, 2005 (an increase of 21% from €1,470 million for the year ended December 31, 2004). Negative and fluctuating economic conditions, such as a changing interest rate environment, impact our profitability by causing lending margins to decrease and leading to decreased demand for higher margin products and services.
Additionally, the recent economic and political crisis in Argentina which led to the conversion by the Argentine government of all the U.S. dollar-denominated debt which was subject to Argentine laws and jurisdictions into Argentine peso-denominated debt had a negative impact on the Group’s Argentine banking subsidiaries. The negative effects on the Group’s operations in Argentina included losses generated by this forced conversion of U.S. dollar-denominated debt to Argentine pesos at below market rates, lower lending and deposit-making activities, increased restrictions on the transferability of funds and a larger number of defaults by Argentine customers. Although Argentina’s economy continued to recover in 2005, and the results of operations of the Group’s Argentine banking subsidiaries have also improved, it is possible that, despite its recent economic growth, Argentina could return to a period of economic and political instability. If this were to occur, the financial condition and results of operations of the Group’s Argentine subsidiaries could be materially and adversely affected.
Significant competition in some Latin American countries could intensify price competition and limit our ability to increase our market share in those markets.
Because some of the Latin American countries in which we operate (i) only raise limited regulatory barriers to market entry, (ii) generally do not make any differentiation between locally or foreign-owned banks, (iii) have permitted consolidation of their banks, and (iv) do not restrict capital movements, we face significant competition in Latin America from both domestic and foreign commercial and investment banks.
15
Latin American economies can be directly and negatively affected by adverse developments in other countries.
Financial and securities markets in Latin American countries where we operate are, to varying degrees, influenced by economic and market conditions in other countries in Latin America and beyond. Negative developments in the economy or securities markets in one country, particularly in an emerging market, may have a negative impact on other emerging market economies. These developments may adversely affect the business, financial condition and operating results of our subsidiaries in Latin America.
Item 4. Information on the Company
A. History and development of the company
Introduction
Banco Santander Central Hispano, S.A. (“Santander” or “the Bank”) is the parent bank of Grupo Santander. It was established on March 21, 1857 and incorporated in its present form by a public deed executed in Santander, Spain, on January 14, 1875.
On January 15, 1999, the boards of directors of Banco Santander, S.A. and Banco Central Hispanoamericano, S.A. agreed to merge Banco Central Hispanoamericano, S.A. into Banco Santander, S.A., and to change Banco Santander’s name to Banco Santander Central Hispano, S.A. The shareholders of Banco Santander, S.A. and Banco Central Hispanoamericano, S.A. approved the merger on March 6, 1999, at their respective general meetings. The merger and the name change were registered with the Mercantile Registry of Santander, Spain, by the filing of a merger deed. Effective April 17, 1999, Banco Central Hispanoamericano, S.A. shares were extinguished by operation of law and Banco Central Hispanoamericano, S.A. shareholders received new Banco Santander shares at a ratio of three shares of Banco Santander, S.A. for every five shares of Banco Central Hispanoamericano, S.A. formerly held. On the same day, Banco Santander, S.A. changed its legal name to Banco Santander Central Hispano, S.A.
We are incorporated under, and governed by the laws of the Kingdom of Spain. We conduct business under the commercial name “Grupo Santander”. Our corporate offices are located in Ciudad Grupo Santander, Avda. de Cantabria s/n, 28660 Boadilla del Monte (Madrid), Spain. Telephone: (011) 34-91-259-6520.
Principal Capital Expenditures and Divestitures
Acquisitions, Dispositions, Reorganizations
The principal holdings acquired by us in 2004 and 2005 and other significant corporate transactions were as follows:
Sovereign Bancorp, Inc. (“Sovereign”). On May 31, 2006, Santander acquired shares of common stock of Sovereign equal to 19.8% of Sovereign’s outstanding shares after giving effect to such purchase. The purchase price was $27 per share, for an aggregate purchase price of $2.4 billion. The proceeds of the sale were used by Sovereign to finance a portion of the $3.6 billion cash purchase price that Sovereign paid to acquire Independence Community Bank Corp. (‘‘Independence’’).
Sovereign’s board of directors has elected two Santander designees to its board of directors, and Santander’s Annual General Meeting of Shareholders held on June 17, 2006 elected the chief executive officer of Sovereign to Santander’s Board of Directors. Sovereign and Independence together constitute the 18th largest bank in the United States as measured by assets and deposits with a significant presence in the Northeastern United States.
Under the Investment Agreement dated October 24, 2005 between Santander and Sovereign, as amended (the ‘‘Investment Agreement’’), Santander has the right to increase its stake to 24.99% of Sovereign’s outstanding shares at market prices. Unless otherwise approved by Sovereign’s shareholders, shares so purchased will be held in a voting trust and voted in direct proportion to the votes of Sovereign’s shareholders other than Santander and its affiliates. In addition, following the second anniversary of the closing and until the end of the fifth year after the closing, Santander will have the option to make an offer to acquire all of Sovereign, subject to certain conditions and limitations agreed between the parties. If such an offer is made by Santander and the offer is either the highest offer resulting from an auction of Sovereign or at least equal to a full and fair price for Sovereign as determined pursuant to a competitive valuation procedure agreed to by the parties, the Sovereign board must accept the offer; provided that, during the third year after the closing, any offer made by Santander must be at a price of at least $40 per share. Even if the Sovereign board accepts the offer, Santander will not be permitted to complete an acquisition of Sovereign unless a majority of the shareholders other than Santander and its affiliates who vote at the relevant Sovereign shareholder meeting approve the acquisition. In addition, for five years following the closing, Santander will have a right of first negotiation and a matching right with respect to third party offers to acquire Sovereign. Finally, with certain exceptions, Santander has agreed that, during this five year period, it will not sell or otherwise dispose of its Sovereign shares.
16
Santander has several options with respect to its investment. Santander can hold its investment in Sovereign indefinitely, after two years seek to acquire 100% of Sovereign or, subject to the terms of the Investment Agreement, sell or otherwise dispose of its investment. Santander currently expects to seek to increase its interest in Sovereign to 24.99% through open market purchases. As of June 27, 2006, Santander held 22.1% of Sovereign’s outstanding shares.
Interbanco S.A. (“Interbanco”). On September 14, 2005 we reached an agreement with SAG (Soluções Automóvel Globlais) of Portugal to form an alliance that will conduct consumer and vehicle financing operations in Portugal, as well as operational car leasing in Spain and Portugal. In January 2006, we paid €118 million to acquire 50.001% of Interbanco’s capital stock. Upon the closing of this transaction, we will combine our consumer and vehicle finance businesses in Portugal with those of SAG through the merger of Interbanco and Hispamer Portugal. We will own 60% of the capital stock of the combined company and SAG will own the remaining 40%. We expect that the new company will be leader in the Portuguese car financing business.
Abbey National plc (“Abbey”). On July 25, 2004, our Board of Directors and the board of directors of Abbey announced that they had reached an agreement on the terms of a recommended acquisition by us of the total ordinary shares of Abbey by means of a scheme of arrangement under the United Kingdom Companies Act.
After the approval of shareholders at the respective shareholders’ meetings of both companies, held in October 2004, and once all conditions of the transaction were met, on November 12, 2004, the acquisition was completed through the delivery of one new share of Santander for every Abbey share. The capital increase amounted to €12,540.9 million, representing 1,485,893,636 new shares of €0.50 par value each and a share premium of €7.94 each.
ELCON Finans A.S. (“Elcon”) and Bankia Bank A.S.A. (“Bankia”). In September 2004, we acquired 100% of the capital stock of Elcon, a leading Norwegian vehicle finance company, for 3.44 billion Norwegian Kroners (approximately €400 million). Subsequently, we agreed to sell Elcon´s equipment leasing and factoring businesses for approximately €160 million. This transaction generated goodwill of €120 million.
In March 2005, we launched a tender offer for Bankia (a Norwegian bank). In May 2005, we acquired 100% of Bankia’s capital stock of for a total price of €54 million. This transaction generated goodwill of €45 million.
In December 2005, Elcon and Bankia were merged to form Santander Consumer Bank A.S.
Polskie Towarzystwo Finansowe, S.A. (“PTF”). In February 2004, we acquired 100% of the capital stock of PTF, a Polish consumer finance company (including its credit portfolio) for €524 million, of which €460 million represented the nominal value of the credit portfolio. This transaction generated goodwill of €59 million.
Abfin B.V. (“Abfin”). In September 2004, we acquired Abfin, a Dutch vehicle finance company, for €22 million. This transaction generated goodwill of €1.6 million.
Finconsumo Banca S.p.A. (“Finconsumo”). In 2003, we resolved to acquire the remaining 50% of the capital stock of Finconsumo that we did not own and acquired 20% of such capital stock for €60 million. In January 2004, we acquired the remaining 30% for €80 million, generating goodwill of €55 million.
In May 2006, Finconsumo changed its name to Santander Consumer Bank S.p.A.
Santander Central Hispano Previsión, S.A., de Seguros y Reaseguros (“Previsión”). In 2003, we reached an agreement for the sale of our entire investment in the capital stock of Previsión. Once all regulatory approvals were obtained, we completed the transaction in June 2004 for €162 million.
Grupo Financiero Santander Serfin, S.A. de C.V. (“Serfin”) and Banco Santander Mexicano, S.A. In December 2002, we reached an agreement with Bank of America Corporation whereby the latter acquired 24.9% of Serfin for $1,600 million, for which we recognized in 2003 capital gains of €681 million. Under this agreement, Bank of America Corporation must maintain its share holding in Serfin for at least three years, and after this period it may use, if it deems it appropriate, several liquidity mechanisms to reduce its share holding, including the listing of its Serfín shares on the stock exchange and the right to sell its Serfin shares to us, at one time, at its book value at the time of the sale, calculated in accordance with international accounting standards.
17
The sale of the 24.9% stake was completed in the first quarter of 2003. As of December 31, 2003, we had a 74.0% holding in the capital stock of Serfin.
In June 2004, the shareholders of Serfin increased its capital by €163.4 million, of which we subscribed €122.5 million.
The shareholders, at the General Shareholders’ Meetings of Banco Santander Mexicano, S.A. (a 100% owned subsidiary of Serfin), Banca Serfin, S.A. (a 100% owned subsidiary of Serfin), Factoring Santander Serfin, S.A. de C.V. (a 98.8% owned subsidiary of Serfin) and Fonlyser, S.A. de C.V. (a 99.9% owned subsidiary of Serfin), held on November 29, 2004, agreed to the merger of these entities, with Banco Santander Mexicano, S.A. being the surviving entity. For accounting purposes, the merger was effective as of December 31, 2004. Banco Santander Mexicano, S.A. subsequently changed its legal name to Banco Santander Serfin, S.A.
Compañía Española de Petróleos, S.A. (“Cepsa”). In 2003, we launched a tender offer for up to 42,811,991 Cepsa shares. The offer was accepted by 32,461,948 shares, representing an investment by us of €909 million.
For a description of certain legal proceedings relating to the Cepsa tender offer, see “Item 8. Financial Information—A . Consolidated statements and other financial information—Legal Proceedings”.
The Royal Bank of Scotland Group, plc. (“RBS”). In 2002 we made a net divestment of 3% of our holding in RBS, giving rise to gains of approximately €806 million. As of December 31, 2002, our ownership interest was 5.04% in RBS.
As of December 31, 2003, following several purchases and sales made during the year, our holding in RBS was 5.05%. The sales gave rise to gains of €217 million.
In May 2004, we subscribed to a capital increase for sterling 150 million, in order to prevent dilution of our holding.
In September 2004, we sold 79 million of our RBS shares, representing 2.51% of our holding, at a capital gain of approximately €472 million. As of December 31, 2004, our ownership interest in RBS was 2.54%.
In January 2005, we sold our entire holding in RBS for €2,007 million at a capital gain of €717 million.
Unión Eléctrica Fenosa, S.A. (“Unión Fenosa”). In 2002, we acquired several holdings in the capital stock of Unión Fenosa for a total amount of €465 million. In 2004, we sold 1% of our holding that as of December 31, 2004, was 22.02%.
In September 2005, we agreed to sell our entire stake in Unión Fenosa, equivalent to 22.07% of its capital stock, to ACS Actividades de Construcción y Servicios, S.A. (ACS) for a price of €2,219 million. As a result of this sale, we realized capital gains of €1,157 million.
Grupo Sacyr-Vallehermoso, S.A. (“Sacyr-Vallehermoso”). In 2002, we divested 24.5% of our holding in Sacyr-Vallehermoso at a capital gain of approximately €301 million.
18
In 2004, we sold our entire holding in Sacyr-Vallehermoso for €92 million at a capital gain of €47 million.
Vodafone Airtouch plc (“Vodafone”). During 2002, we reduced our stake in Vodafone from 1.53% to 0.97%, realizing capital gains of €274 million. In 2003, we sold 0.67% of our holding, realizing capital gains of €369 million. In 2004, we sold the remainder of our holding in Vodafone, realizing capital gains of €242 million.
Auna Operadores de Telecomunicaciones, S.A. (“Auna”). In 2002, we acquired a 12.62% stake in Auna for €939 million, thus increasing to 23.49% our total holding in this company. This stake was increased by an additional 2.5% in 2004, for approximately €217 million. Furthermore, during 2004, we made purchases for an additional 1.5% stake in Auna for approximately €120 million. As of December 31, 2004, we had a 27.34% holding in the capital stock of Auna, with an investment of €2,031 million.
In January 2005, we acquired an additional 4.74% stake in Auna for €422 million, thus increasing to 32.08% our total holding in this company.
In November 2005, we sold 27.07% of our holding in Auna to France Télécom at a capital gain of €355 million. As of December 31, 2005, we had a 5.01% holding in the capital stock of Auna.
Shinsei Bank, Ltd (“Shinsei”). In 2003, we increased our holding in the capital stock of the Japanese bank Shinsei from 6.5% as of December 31, 2002, to 11.4% as of December 31, 2003. The total cost of the investment at that date was approximately €144 million. During 2004, we sold 4.0% of our holding at a capital gain of approximately €118 million. After this transaction, we held 7.4% of the capital stock of Shinsei. In the first quarter of 2005, we sold 2.7% of our holding at a capital gain of €49 million. As of December 31, 2005, we held 4.82% of the capital stock of Shinsei.
Commerzbank AG (“Commerzbank”). During 2005 we sold our 3.38% holding in Commerzbank at a capital gain of €24 million.
In addition to expanding our existing operations, we continually review possible acquisitions of, and investments in, businesses in markets in which we believe we have particular advantages.
Capital Increases
As of December 31, 2002 and 2003, our capital stock consisted of 4,768,402,943 fully subscribed and paid shares of €0.5 par value each.
19
As of December 31, 2004, our capital had increased by 1,485,893,636 shares, or 31.16% of our total capital as of December 31, 2003, to 6,254,296,579 shares through the following transaction:
Abbey Acquisition
| • | Capital increase of 1,485,893,636 new shares of €0.5 par value each and share premium of €7.94 each for an effective amount of €12,540.9 million, which were paid in full through the contribution of shares representing all the capital stock of Abbey, in accordance with the resolutions adopted at our Extraordinary Shareholders’ Meeting held on October 21, 2004. These shares were issued on November 12, 2004. |
As of December 31, 2005, our capital stock consisted of 6,254,296,579 fully subscribed and paid shares of €0.5 par value each.
Recent Events
Island Finance. On January 23, 2006, our subsidiary in Puerto Rico, Santander BanCorp, and Wells Fargo & Company reached an agreement through which we would acquire the assets and business operations in Puerto Rico of Island Finance, a consumer finance company, from Wells Fargo for $742 million. The transaction was closed in the first quarter of 2006 and generated goodwill of $116 million.
Banco Santa Cruz S.A. (“Banco Santa Cruz”). On April 18, 2006 we sold our entire stake in the capital stock of our subsidiary in Bolivia, Banco Santa Cruz.
Abbey. On June, 7, 2006 we announced that Abbey has entered into an agreement with Resolution plc (“Resolution”) under which Abbey will sell its entire life insurance business to Resolution for a fixed cash consideration of €5.2 billion (£3.6 billion). This represents 97% of the embedded value of the businesses being sold as reported by Abbey as of December 31, 2005, and will not generate capital gains for Grupo Santander.
The life insurance businesses being sold are Scottish Mutual Assurance plc, Scottish Provident Limited and Abbey National Life plc, as well as the two offshore life insurance companies, Scottish Mutual International plc and Scottish Provident International Life Assurance Limited. Abbey will retain all of its branch-based investment and asset management business and James Hay, its self-invested personal pension company, and its Wrap business.
Separately, in order to provide continuity of product supply and service to its customers, Abbey has entered into two distribution agreements with Resolution under which (i) Abbey will distribute through its retail network Abbey-branded life and pensions products manufactured by Resolution; and (ii) Abbey will continue to be the exclusive distributor of Scottish Provident protection products to intermediaries.
In addition, Abbey has secured exclusive access to provide retail banking products to Resolution’s five million policyholders.
It is envisaged that some 2,000 Abbey employees will transfer to Resolution as part of the transaction. Resolution will continue to operate the life operations from the existing Abbey premises in Glasgow. Resolution will also maintain the operations in Dublin, the Isle of Man and Hong Kong.
We expect the transaction to be completed during the third quarter of 2006 and is conditional upon, among other things, approval from the U.K. Financial Services Authority and relevant overseas regulators and the approval of Resolution’s shareholders.
We are a financial group operating principally in Spain, the United Kingdom, other European countries and Latin America, offering a wide range of financial products. At December 31, 2005, we were one of the ten largest banking groups in the world by market capitalization and the largest banking group in the euro zone with a stock market capitalization of €69.7 billion, stockholders’ equity of €39.8 billion and total assets of €809.1 billion. We had an additional €152.8 billion in mutual funds, pension funds and other assets under management at that date. As of December 31, 2005, we had 45,207 employees and 5,389 branch offices in Continental Europe, 21,080 employees and 712 branches in the United Kingdom, 62,161 employees and 4,100 branches in Latin America and 748 employees in other geographic areas (For a full breakdown of employees by country, see “Item 6. Directors, Senior Management and Employees - D. Employees”).
Our principal operations are in Spain, the United Kingdom, Portugal, Germany, Italy and Latin America. We also have significant operations in New York as well as financial investments in San Paolo IMI, Attijariwafa Bank Société Anonyme (formerly, Banque Commerciale du Maroc) (“Attijariwafa Bank”). In Latin America, we have majority shareholdings in banks in Argentina, Brazil, Chile, Colombia, Mexico, Puerto Rico, Uruguay and Venezuela.
20
Recent Reorganization of Business Areas
As a result of the entry into force of the IFRS in 2005, we have redefined our business areas for 2004 and 2005 for financial reporting purposes. These areas are defined by management and reflect, in the case of the secondary level (or business), the way business is conducted.
The new areas reflect the incorporation of Abbey, following our consolidation of its balance sheet at the end of 2004. In addition to applying the general accounting changes set out in Note 2 to our consolidated financial statements to the different business areas, some internal criteria have been changed, in accordance with IFRS principles, to better identify the risks and returns of each business. The main changes are as follows:
• | Centralized costs. Although we maintain the principle of applying to each unit the costs of central services incurred by it for support and control, corporate and institutional expenses related to the Group are excluded. These are now recorded in Financial Management and Equity Stakes. On the other hand, the non-corporate costs related to projects underway, primarily spending on IT systems, have been applied to the corresponding business. |
• | Provisions and allowances for country-risk. Both country-risk, as well as its provisions, are applied to the business area responsible for its management and where the net revenues of these operations are reflected. Only those intra-group operations which maintain the provisions, where risk disappears on an accounting basis, continue to be recorded, as before, in Financial Management and Equity Stakes. |
• | Pension provisions. Each business generally assumes the cost for pensions, including both the normal allocation as well as that of possible deficits. The only exception relates to amortization derived from the initial deficit that surpasses the “corridor” (see Note 2.v to our consolidated financial statements). In these cases, as the aforementioned amortization occurred because of a corporate decision by the Group, and provided it happens within five years and with the limit of the initial deficit, its cost will be assumed by Financial Management and Equity Stakes. |
• | Shareholders’ equity. In line with the development in the Group of processes for calculating and managing economic capital, the adjustment for regulatory capital maintained has been eliminated. Each business maintains the shareholders’ equity it manages. Use above this level will be penalized only in those cases where this figure is higher than the economic capital. Otherwise no payment will be made to the business. |
In accordance with the criteria established by the IFRS, the structure of the operating business areas has been segmented into two levels:
Principal level (or geographic). The activity of our operating units is segmented by geographical areas. This coincides with our first level of management and reflects our positioning in the world’s three main currency areas. The reported segments are:
| • | Continental Europe. This covers all retail banking business (including Banco Banif, S.A. (“Banif”), our specialized private bank), asset management and insurance and wholesale banking conducted in Europe, with the exception of Abbey. This segment includes the following units: Santander Network, Banco Español de Crédito, S.A. (“Banesto”), Santander Consumer Finance and Portugal. |
| In addition, small units outside the three geographic areas, whose relative importance to our total business is not significant and which are extensions of the main areas, are included in Continental Europe. |
| • | United Kingdom (Abbey). This covers only Abbey’s business, mainly focused on retail banking and insurance in the UK. |
| • | Latin America. This embraces all the financial activities conducted via our subsidiary banks and other subsidiaries. It also includes the specialized units in International Private Banking, as an independent globally managed unit. |
21
Secondary level (or business). This segments the activity of our operating units by type of business. The reported segments are:
| • | Retail Banking. This covers all customer banking businesses (except those of Corporate Banking, which are managed globally throughout the world). |
| • | Asset Management and Insurance. This includes our units that design and manage mutual and pension funds and insurance. |
| • | Global Wholesale Banking. This business reflects the returns from Global Corporate Banking, Investment Banking and Markets worldwide, including all treasuries with global management, as well as our equities business. |
In addition to these operating units, which cover everything by geographic area and business, we continue to maintain a separate Financial Management and Equity Stakes area. This area incorporates the centralized activities relating to equity stakes in industrial and financial companies, financial management of the structural exchange rate position and of the parent Bank’s structural interest rate risk, as well as management of liquidity and of shareholders’ equity through issues and securitizations. As the Group’s holding entity, it manages all capital and reserves and allocations of capital and liquidity.
Principal level (or geographic):
Continental Europe
This area covers the banking activities of the different networks and specialized units in Europe, principally with individual clients and small and medium sized companies (“SMEs”), as well as private and public institutions. During 2005 there were four units within this area: Santander Network, Banesto, Santander Consumer Finance and Portugal including retail banking, asset management, insurance and global wholesale banking.
Continental Europe is the largest business area of Grupo Santander. At the end of 2005, it accounted for 43% of total customer funds under management, 49% of total loans and credits and 54% of net attributable income of the Group’s main business areas.
The area had 5,389 branches and 43,867 employees (direct and assigned) at the end of 2005.
The area experienced a 19.8% increase in net operating income, primarily due to increased revenue from commissions, contained costs, improved efficiency and growth in net interest income.
In 2005, the efficiency ratio improved by 3.1% to 42.9% (from 46.8% in 2004). Net attributable income increased 38.2% to €2,984.3 million. Return on equity, “ROE”, in 2005 was 22.1%, a 3.8% increase from 2004.
Santander Network
The retail banking activity is carried out through the branch network of Santander, with support from an increasing number of automated cash dispensers, savings books updaters, telephone banking services, electronic and internet banking.
At the end of 2005, we had 2,669 branches and a total of 19,092 employees (direct and assigned), of which 827 employees were temporary, dedicated to retail banking in Spain. Compared to 2004, there was a net increase of 98 branches and a net reduction of 88 employees.
In 2005, the Santander Network grew by approximately 17.1% in lending, 17.2% in net operating income and 44.1% in net attributable income. It also improved its efficiency ratio from 48.3% in 2004 to 44.0% in 2005 and continued high standards of quality in credit risk.
Gross income from the Santander Network was €3,826 million in 2005, an 8.3% increase from 2004.
In 2005, net attributable income from the Santander Network was €1,285 million, 44.1% higher than net attributable income in 2004, while the ROE reached 22.8% (as compared to 17.8% in 2004).
The 17.1% growth in lending in 2005 versus 2004 came from mortgages (16% increase as compared to 2004, mainly for individual customers) as well as other loans and credits (19% increase as compared to 2004), leasing and renting (14% increase as compared to 2004) and commercial bills (1% increase as compared to 2004).
22
Customer deposits increased by 2.7%, while mutual and pension funds increased by 13.8% and 5.9%, respectively.
Banesto
At the end of 2005, Banesto had 1,703 branches and 10,577 employees (direct and assigned), of which 514 employees were temporary (an increase of 20 branches and a reduction of 507 employees as compared to the end of 2004).
For purposes of our financial statements and this annual report on Form 20-F, we have calculated Banesto’s results of operations using the criteria described on page 21 of this annual report on Form 20-F. As a result, the data set forth herein may not coincide with the data published independently by Banesto.
In 2005, Banesto grew by approximately 26.7% in lending, 24.4% in customer deposits and 14.8% in off-balance sheet customer funds.
In 2005, gross income from Banesto was €1,794 million, an 8.4% increase from 2004. Net attributable income from Banesto was €498 million, a 24.0% increase from 2004, while the ROE reached 19.4% (as compared to 16.9% in 2004) and the efficiency ratio improved to 42.6% (as compared to 46.6% in 2004).
Santander Consumer Finance
Our consumer financing activities are conducted through our subsidiary Santander Consumer Finance S.A. and its group of companies. Most of the activity is in the business of auto financing, personal loans, credit cards, insurance and customer deposits. These consumer financing activities are mainly focused on Spain, Portugal, Germany and Italy (through Santander Consumer Bank S.p.A.). We also conduct this business in the UK, Austria, Hungary, the Czech Republic, the Netherlands, Norway, Poland and Sweden.
At the end of 2005, this unit had 267 branches (as compared to 256 at the end of 2004) and 5,118 employees (direct and assigned) (as compared to 5,245 employees at the end of 2004), of which 310 employees were temporary.
In 2005, this unit generated gross income of €1,604 million, a 25.9% increase from 2004. Net attributable income was €487 million, a 46.3% increase from 2004, while the ROE reached 46.1% (as compared to 47.6% in 2004) and the efficiency ratio improved to 33.9% (as compared to 37.6% in 2004).
At the end of 2005 total managed assets equaled €31,849 million. New lending increased 24% to €18,999 million (17% increase as compared to 2004, excluding the new incorporations of Bankia in Norway and Interbanco in Portugal). Of note was the 22% rise in auto finance, which outpaced the sale of cars in Europe producing a further gain in market share. The three large traditional markets, which account for 88% of total business, also registered strong growth: Spain and Portugal grew 15% as compared to 2004, Germany grew 9% as compared to 2004 and Italy grew 30% as compared to 2004.
Portugal
Our main Portuguese operations are conducted by Banco Santander Totta, S.A., and our Portuguese investment banking operations are conducted by Banco Santander de Negocios Portugal, S.A.
At the end of 2005, Portugal operated 693 branches (as compared to 670 branches at the end of 2004) and had 6,308 employees (direct and assigned) (as compared to 6,478 employees at the end of 2004), of which 170 employees were temporary.
In 2005, gross income from our activities in Portugal was €995 million, a 7.2% increase from 2004. Net attributable income was €345 million, 35.7% higher than in 2004, while the ROE reached 20.8% (16.5% in 2004) and the efficiency ratio improved to 49.4% (from 52.4% in 2004).
Others
The rest of our businesses (Banif, Asset Management, Insurance and Global Wholesale Banking) generated attributable income of €368 million, 32.1% more than in 2004.
23
United Kingdom (Abbey)
Abbey became part of Grupo Santander on November 12, 2004 and only its balance sheet was consolidated with the Group as of December 31, 2004. Its results were consolidated with the Group’s for the first time in 2005.
Abbey is a significant financial services provider in the United Kingdom, being the second largest residential mortgage lender, third largest savings brand, and operates across the full range of personal financial services serving approximately 18 million customers.
At the end of 2005, Abbey had 712 branches and a total of 21,121 employees (direct and assigned) of which 244 employees were temporary. Compared to 2004, there was a net decrease of 18 branches and a net reduction of 4,210 employees.
For purposes of our financial statements and this annual report on Form 20-F, we have calculated Abbey’s results of operations using the criteria described on page 21 of this annual report on Form 20-F. As a result, the data set forth herein may not coincide with the data published independently by Abbey.
In 2005, Abbey contributed net operating income of €1,408 million and €811 million of attributable income (14% of the Group’s total operating areas). Loans and advances experienced growth of approximately 9.6% and customer funds under management increased by 4.3% during the same period. ROE was 35.7% and the efficiency ratio was 63.2%.
Gross income was €3,787 million for 2005.
Operating costs were €2,416 million, excluding restructuring costs of €219 million.
The 9.6% increase in loans and credits was accompanied by good credit risk quality. The non-performing loans ratio was 0.67% at the end of 2005, 0.03% less than in 2004. For mortgage loans, Abbey’s credit quality indices (0.65% in arrears of more than three months) are better than the market’s average.
Latin America
At December 31, 2005, we had 4,100 offices and 62,746 employees (direct and assigned) in Latin America (as compared to 4,011 offices and 60,503 employees, respectively, at December 31, 2004), of which 1,267 were temporary employees.
Net attributable income from Latin America was €1,776 million, a 20.8% increase from 2004, while the ROE reached 23.1% (as compared to 24.0% in 2004) and the efficiency ratio improved to 52.2% (as compared to 54.9% in 2004). Our Latin American banking business is principally conducted by the following banking subsidiaries:
Percentage Held |
|
| Percentage Held | ||
|
|
| |||
Banco Río de la Plata, S.A. (Argentina) | 99.30 |
| Banco Santander Colombia, S.A. | 97.64 |
|
Banco Santa Cruz, S.A. (Bolivia) (*) | 96.33 |
| Banco Santander Serfin, S.A. | 74.92 |
|
Banco Santander Brasil, S.A. (Brazil) | 97.93 |
| Banco Santander Puerto Rico | 90.77 |
|
Banco Santander Meridional, S.A. (Brazil) | 98.18 |
| Banco Santander, S.A. (Uruguay) | 100.00 |
|
Banco do Estado de Sao Paulo, S.A. (Brazil) | 98.06 |
| Banco de Venezuela, S.A. Banco Universal | 98.42 |
|
Banco Santander Chile | 83.94 |
|
|
|
|
(*) As of April 18, 2006, we sold our stake in Banco Santa Cruz, S.A. See “-A. History and development of the company - Recent events”.
We engage in a full range of retail banking activities in Latin America, although the range of our activities varies from country to country. We seek to take advantage of whatever particular business opportunities local conditions present. We engage in a wide array of deposit taking activities throughout Latin America, and other retail banking activities in Argentina, Brazil, Chile and Mexico. Our primary lending operations are in Chile, Mexico, Brazil and Puerto Rico. Our principal mutual fund operations are in Brazil, Mexico, Chile and Puerto Rico, and our main pension fund operations are in Chile, Mexico, Argentina, Peru and Colombia.
24
Our significant position in Latin America is attributable to our financial strength, high degree of diversification (by countries, businesses, products, etc.), and breadth and depth of our franchise.
Detailed below are the performance highlights of the main Latin American countries in which we operate:
Brazil. Santander Banespa is one of the main financial franchises in Brazil. We have 1,897 branches and 7.1 million individual customers.
Santander Banespa focused in 2005 on growing its retail businesses and on gaining market share. Lending rose 42%, in local currency, with strong growth to individual customers (credit cards, loans linked to payrolls, auto financing, etc.), SMEs and companies. Our market share in total loans reached 5.8%. Deposits (excluding REPOs) and mutual funds increased 24% (market share of deposits and mutual funds equaled approximately 4.4%). The emphasis on growth in retail savings pushed up this segment’s market share in mutual funds to 8.0%.
Net attributable income from Brazil in 2005 was €591 million (a 14% decrease in local currency). The efficiency ratio was 52.5%, ROE was 23.1%, the ratio of non-performing loans (“NPL”) was 2.9% at the end of 2005 and the NPL coverage was 138.5%.
Mexico. Banco Santander Serfin, S.A. is one of the leading financial services companies in Mexico. It heads the third largest banking group in Mexico in terms of business volume, with a market share in total loans of 15.2%, 15.8% in deposits and mutual funds and 7.8% in pensions. The Group has a network of 1,005 branches and 6.3 million banking customers in Mexico.
Net attributable income from Mexico increased 16.0% to €376 million (an increase of 12.1% in local currency). The efficiency ratio was 54.1%, ROE was 20.4%, the ratio of non-performing loans was 0.9% at the end of 2005 and the NPL coverage was 273.4%.
Chile. Banco Santander Chile heads the largest financial group in the country with substantial business in loans, deposits and mutual funds and pension funds. The Group has 401 branches and 2.2 million banking customers.
In 2005, lending increased 19% (including a 25% increase to individuals), while deposits (without REPOs) and mutual funds grew 16% (in local currency).
Net attributable income from Chile increased 45.2% to €338 million (a 33.2% increase in local currency). The efficiency ratio stood at 45.4%, ROE was 25.0%, the ratio of non-performing loans was 2.3% and the NPL coverage was 165.6%.
Puerto Rico. Banco Santander Puerto Rico is one of the largest financial institutions in Puerto Rico. The Group has 73 branches and market shares of 10.9% in total loans, 12.9% in deposits and 21.3% in mutual funds.
In 2005, Santander Puerto Rico focused on growth in consumer loans and mortgages and loans to medium-sized companies. Lending increased 9% and deposits (excluding REPOs) and mutual funds rose 13%, representing a gain of 0.5 points in market share to 15.3%.
Net attributable income from Puerto Rico was €49 million, 2.5% higher than in 2004 (a 2.7% increase in local currency). The efficiency ratio was 65.8%, ROE was 12.5%, the ratio of non-performing loans stood at 1.8% and the NPL coverage was 168%.
Venezuela. Banco de Venezuela, S.A. Banco Universal is one of the country’s largest banks with market shares of 13.6% in total loans and 11.6% in deposits. It has 252 branches and 2.2 million banking customers.
Management’s main focus in 2005 was growth in the profitability of business and increasing recurrent revenues. Lending, after eliminating the exchange rate impact, increased 46% (including a 75% increase to individual customers) and the aggregate of deposits (excluding REPOs) and mutual funds rose 27%.
Net attributable income from Venezuela grew to €133 million (a 55.4% increase in local currency). The efficiency ratio was 48.4%, ROE stood at 42.2%, the ratio of non-performing loans was 1.5% and the NPL coverage was 400%.
Colombia. The Colombian economy grew by approximately 5% in 2005. We concentrated on selective growth on business and efficient management of costs. Lending increased 11% and deposits (excluding REPOs) and mutual funds rose 22%.
25
Net attributable income from Colombia was €40 million, 60.90% higher than in 2004 in local currency.
Others
Argentina consolidated its economic recovery during 2005 and made a positive contribution to Group earnings (net attributable income was €78 million in 2005). Lending to the private sector rose 73% and was very focused on SMEs and individuals, while deposits (excluding REPOs) and mutual funds increased 33%.
Uruguay improved notably, generating net attributable income of €29 million in 2005, 28.2% higher than 2004 in local currency.
Peru, where we focus on pension funds, generated net attributable income of €16 million in 2005 (13.9% increase in local currency).
Net attributable income from Bolivia during 2005 grew to €10 million in 2005 (159% increase as compared to 2004). On April 18, 2006 we sold our entire stake in the capital stock of our subsidiary in Bolivia, Banco Santa Cruz.
Santander Private Banking performed well with attributable income up 25% (in dollars) during 2005.
Secondary level (or business)
Retail Banking
Retail Banking generated 84% of total gross income and 78% of income before taxes of the operating areas. This segment had 117,655 employees at the end of 2005.
Retail Banking in Continental Europe continued its growth in volume and earnings. Net interest income increased 14.3%, net operating income increased 21.3% and income before taxes increased 39.1%. All units (Santander Network, Banesto Retail, Santander Consumer Finance, Portugal Retail and Banif) grew at double digit rates in net operating income and income before taxes.
There were four main drivers of these results: business growth, better price management in a more stable interest rate environment, cost control and the lower needs for loan-loss provisions.
In its first year as part of Grupo Santander, Abbey’s Retail Banking operations generated gross income of €3,232 million, net operating income of €1,228 million and income before taxes of €986 million.
The strong earnings from Retail Banking in Latin America was based on growth in customer business, the excellent results in net interest income and net fees and costs. These were reflected in a 22.9% rise in commercial revenue, 38.2% in net operating income and 36.2% in income before taxes.
Asset Management and Insurance
This segment comprises all of our companies whose activity is the management of mutual and pension funds and insurance.
In 2005, Asset Management and Insurance generated gross income of €1,367 million, 113.4% higher than in 2004. Income before taxes was €688 million, 85.6% higher than in 2004. This segment had 7,902 employees at the end of 2005.
This segment accounted for 7% of the Group’s gross income in 2005 and 9% of income before taxes which, at €688 million, was 85.6% higher than in 2004 (37.2% increase excluding Abbey).
Total revenues from mutual and pension funds and insurance activity, including those recorded by the distribution networks, amounted to €3,696 million, 62.9% more than in 2004 (20.3% increase excluding Abbey). These revenues are of high quality and recurrence and represented 20% of our commercial revenue.
26
Managed assets in mutual and pension funds increased 16% to more than €138,000 million and the liabilities from insurance contracts totaled €45,000 million (5% increase from 2004).
Asset Management. The global business of mutual and pension funds integrated in Santander Asset Management generated total fees of €1,956 million, 23.5% higher than in 2004 (15.9% increase without Abbey). Income before taxes, after deducting the fees paid to the distribution networks and operating costs, was €349 million (29.0% increase from 2004).
In Spain, Santander Asset Management managed more than €75,000 million in funds and investment companies, making it the sector’s leader (with a market share of 25% in mutual and real estate funds, according to Inverco).
In Portugal, mutual and pension funds managed by Asset Management increased 17% and 7%, respectively, to a total of €7,000 million.
In Latin America, Santander Asset Management had €22,500 million under management in its mutual funds, 24% more than in 2004 excluding the exchange rate effect. Mexico, Brazil and Chile, which account for more than 90% of assets, registered strong growth. Knowledge of the markets and of local needs combined with exploiting the Group’s global capacities in managing and developing high value-added products resulted in higher growth than the markets. Mexico’s managed mutual funds increased 36% (excluding the exchange rate effect) to €6,700 million and increased its market share by almost 1% to 17%. Brazil, whose managed assets increased 21% (excluding the exchange rate impact) to €11,100 million, focused on the retail segment where its market share reached 8% (a 0.3% increase). Chile’s managed assets rose 11% to €2,700 million (excluding the exchange rate impact) and market share increased by close to 1%.
Insurance. Total revenues generated by our insurance companies, including fees paid to branch networks, amounted to €1,740 million (increases of 153.8% and 30.4% excluding Abbey from 2004). Income before taxes rose three fold to €340 million due to the incorporation of Abbey, which contributed €179 million, and the good performance of other insurance activity (59.2% increase in income before taxes).
In Spain, Santander Seguros y Reaseguros, Compañía Aseguradora, S.A. consolidated its bancassurance business, developing new businesses and boosting its sales capacity (two new channels, Hispamer and Unión de Crédito Inmobiliario S.A. (UCI), joined Santander Branch Network). Their total contribution to the Group, including net fees and income before taxes, was €205 million, 25% more than in 2004. Premium income increased 28%.
In Portugal, the distribution of risk insurance, largely linked to credit operations and capitalization-savings products, was expanded to include new and unlinked life-risk products. Premium income increased 49% and the total contribution to the Group rose 36%.
In the rest of Continental Europe, the various units of Santander Consumer Finance, which mainly sells products linked to consumer lending, generated €263 million of fees, 30% more than in 2004.
In the United Kingdom, Abbey’s insurance business continued to be strong. At the end of 2005, Abbey’s insurance activity balance stood at €36,500 million, and its total contribution to the Group (fees plus income before taxes) was €437 million, following a significant reduction in the area’s costs. On June 7, 2006, we announced that Abbey had entered into an agreement with Resolution under which Abbey will sell its entire life insurance business to Resolution (see “- A. History and development of the company – Recent events”).
In Latin America, the Group continued to develop its strategy of growth in the distribution of insurance via local banks. Further progress was made in selling bancassurance products through personalized offers (life, auto and household products).
Global Wholesale Banking
This area covers our corporate banking, treasury and investment banking activities throughout the world.
This segment contributed 9% of gross income and 13% of income before taxes. Income before taxes amounted to €1,069 million, a 21.9% increase from 2004. This segment had 2,177 employees at the end of 2005.
Gross operating revenue increased 9.2%. Revenue from value-added businesses (transactional banking, trade finance, custody, investment banking, equities and treasury for customers) rose 22%.
27
Operating costs grew 11.9%, due to business expansion and new project launches in Europe, such as Santander Global Connect (SGC) and Santander Global Markets (SGM).
In 2005, we consolidated a new Global Wholesale Banking model based on a double vector (product-customer) system. In the customer vector, the Global Customer Relation Model, established in 2003 to foster global management by product and country, consists of global teams comprising an executive responsible at the global level, local executives in the markets where customers operate and product specialists. The model generated gross income of €501 million, after six straight quarters of sustained growth.
The product vector consists of three large areas:
| • | Corporate products. This covers transactional banking, trade finance, custody and basic financing. Their gross income increased 8.8% from 2004. |
| • | Investment Banking. This embraces financing solutions and corporate finance. Gross income increased 16.0%, strongly backed by corporate finance. Project finance operations formalized in 2005 amounted to €1,074 million. In financing of acquisitions, operations amounted to €962 million. Syndicated loans amounted to €3,700 million. |
| • | Markets. This integrates equities and treasuries. Gross income rose 6.3%, supported by customer related revenues and a lower contribution from own-account activity. |
By businesses, the gross income from equities was 28.0% higher, consolidating leadership in brokerage in Spain (13% market share including Banesto Bolsa, S.A., S.V.B.) and in Portugal (9% market share).
Global Treasury performed well in 2005 with SGC and SGM driving growth in Spain. SGM develops the distribution capacities for corporate and institutional clients in target markets and supports the production and distribution of structured products in the main Latin American countries, while obtaining synergies in products, books and organization.
In Spain, sales revenues attributed to both projects – SGC for retail clients and SGM for wholesale clients – increased 34.7%. Portugal’s growth was 33.3% following the extension of SGC and the good performance of the wholesale sector.
Treasury in New York consolidated its structure in order to help the Latin American treasuries sell structured derivatives and increase the range of value-added products on offer.
Our treasury operations manage money, foreign exchange and fixed-income trading, using conventional instruments and derivatives, for our own account and for the accounts of our customers. We also participate in fixed income capital market activities.
In Latin America, our treasury operations continued to be preeminent in the region. The increasing coordination of local treasuries with Madrid and New York is enabling more global solutions to be offered to clients and greater cross-selling of products. This is producing notable growth in revenues (+22.2%) and is enhancing our presence in the professional markets.
Financial Management and Equity Stakes
This area is responsible for a series of centralized activities and acts as our holding entity, managing all capital and reserves and assigning capital and liquidity to the other businesses. It also incorporates centrally managed business, which can be divided into the following sub areas:
• | Equity Stakes: this area centralizes the management of equity stakes in financial and industrial companies. | |
| Net attributable income from industrial stakes was €1,739 million, up from €492 million in 2004. The much higher figure was mainly due to the larger capital gains and the greater contribution from companies accounted for by the equity method, principally Cepsa. | ||
28
• | Financial management: this area carries out the global functions of managing our structural exchange rate position, the structural interest rate risk of the parent Bank and the liquidity risk. The latter is conducted through securities issuances and securitizations. It also manages shareholders’ equity. | |
| The cost of hedging the capital of our non euro-denominated investments is another activity managed by this sub-area. The hedging policy is aimed at protecting the capital invested and the year’s results through various instruments that are deemed to be the most appropriate for their management. The main units with exchange risk, except for Brazil, were hedged during 2005. | ||
This sub-area also manages shareholders’ equity, the allocation of capital to each business unit, and the cost of financing investments.
Gross income from Financial Management and Equity Stakes was €-222 million in 2005, compared with €112 million in 2004. Net attributable income was €650 million in 2005 compared with a net attributable loss of €24 million in 2004.
At the end of 2005, this area had 1,462 employees (direct and assigned) (1,433 employees at the end of 2004), of which 404 were temporary.
Equity Stakes
Alliances and Financial Investments
We have financial investments in a number of banking companies, principally in Europe. The following summarizes our most important financial investments:
San Paolo IMI. At December 31, 2005, we owned 8.5% of the capital stock of San Paolo IMI, one of the largest banking groups in Italy in terms of assets. San Paolo IMI controls Intereuropa Bank, a Hungarian bank in which we own a 10% stake.
Attijariwafa Bank. At December 31, 2005, we had a 14.5% interest in Attijariwafa Bank, which engages mainly in trade finance and foreign investment activities. Together with Attijariwafa Bank we have a 50% joint venture in Attijari International Bank Société Anonyme, which specializes in trade finance in Tangier’s free trade zone.
Industrial Portfolio
The majority of our industrial holdings portfolio consists of investments in strategic sectors related to the growth of the Spanish economy. Through our investments in these areas, we aim to contribute to the Group’s consolidated results.
The following table summarizes our main industrial holdings at December 31, 2005:
Company |
| Business |
| Percentage Held |
|
| |||
Antena 3 de Televisión, S.A. |
| Mass Media |
| 10.01 |
Cepsa (*) |
| Oil and Petrochemicals |
| 32.27 |
Grupo Corporativo ONO, S.A. |
| Cable |
| 15.91 |
Inmobiliaria Urbis, S.A.(**) |
| Real Estate |
| 45.34 |
(*) | 12.35% is held directly and 19.92% is held indirectly by the Group through Somaen Dos, S.L. The latter figure represents the Group’s indirect economic participation in Cepsa since Santander only controls the percentage of shares of Somaen Dos, S.L. that it owns, which in turn corresponds to 19.92% of Cepsa’s capital stock. |
(**) | As of December 31, 2005, Santander held 51.11% of the voting rights. |
In 2005, we realized capital gains of more than €1,650 million with divestments in Unión Fenosa, S,A. (22.02%), Auna (27.07%), MRBS Capital Partners (31.03%), Técnicas Reunidas, S.A. (38.02%) and Probitas Pharma, S.A. (11.62%), among others.
As of December 31, 2005, our unrealized capital gains in listed industrial and financial stakes were approximately €2,500 million.
29
Total Revenues by Activity and Geographic Location
For a breakdown of our total revenues by category of activity and geographic market please see Note 54 to our consolidated financial statements.
Selected Statistical Information
The following tables show our selected statistical information.
Average Balance Sheets and Interest Rates
The following tables show, by domicile of customer, our average balances and interest rates for each of the past three years.
You should read the following tables and the tables included under “Changes in Net Interest Income—Volume and Rate Analysis” and “Earning Assets—Yield Spread” in light of the following observations:
| • | We have included interest received on non-accruing assets in interest income only if we received such interest during the period in which it was due; |
| • | We have included loan fees in interest income; |
| • | We have not recalculated tax-exempt income on a tax-equivalent basis because the effect of doing so would not be significant; |
| • | We have included income and expenses from interest-rate hedging transactions as a separate line item under interest income and expenses if these transactions qualify for hedge accounting under IFRS (or previous Spanish GAAP under the 2003 table). If these transactions did not qualify for such treatment, we included income and expenses on these transactions elsewhere in our income statement; |
| • | We have stated average balance on a gross basis, before netting our allowances for credit losses, except for the total average asset figures, which reflect such netting. See Note 2 to our consolidated financial statements for a discussion of our accounting policies for hedging activities; and |
| • | All average data have been calculated using month-end balances, which is not significantly different than having used daily averages. |
As stated above under “Item 4. Information on the Company – A. History and development of the company – Principal Capital Expenditures and Divestitures – Acquisitions, Dispositions and Divestitures”, on November 12, 2004, we completed the acquisition of Abbey. For consolidation purposes, Abbey’s assets and liabilities were consolidated into our balance sheet as of December 31, 2004, but Abbey’s results of operations had no impact on our income statement for 2004. Therefore, 2005 is the first year to reflect the full impact of the acquisition of Abbey.
As stated above under “Presentation of Financial Information”, we have prepared our financial statements for 2004 and 2005 under IFRS. Data for earlier years has been prepared under previous Spanish GAAP, which is not comparable to data prepared under IFRS.
30
Average Balance Sheet - Assets and Interest Income
|
| (IFRS) |
| ||||||||||
|
|
| |||||||||||
|
| 2004 |
| 2005 |
| ||||||||
|
|
|
| ||||||||||
ASSETS |
| Average Balance |
| Interest |
| Average Rate |
| Average Balance |
| Interest |
| Average Rate |
|
|
|
|
|
|
|
| |||||||
|
| (in thousand of Euros, except percentages) |
| ||||||||||
Cash and due from central banks |
|
|
|
|
|
|
|
|
|
|
|
|
|
Domestic |
| 2,699,593 |
| 35,957 |
| 1.33 | % | 3,137,115 |
| 44,121 |
| 1.41 | % |
International |
| 5,373,324 |
| 200,573 |
| 3.73 | % | 8,562,044 |
| 227,184 |
| 2.65 | % |
|
|
|
|
|
|
|
| ||||||
| 8,072,917 |
| 236,530 |
| 2.93 | % | 11,699,159 |
| 271,305 |
| 2.32 | % | |
Due from credit entities |
|
|
|
|
|
|
|
|
|
|
|
|
|
Domestic |
| 11,777,227 |
| 282,136 |
| 2.40 | % | 13,676,170 |
| 340,950 |
| 2.49 | % |
International |
| 29,431,662 |
| 808,519 |
| 2.75 | % | 54,178,617 |
| 2,032,721 |
| 3.75 | % |
|
|
|
|
|
|
|
| ||||||
| 41,208,889 |
| 1,090,655 |
| 2.65 | % | 67,854,787 |
| 2,373,671 |
| 3.50 | % | |
Loans and credits |
|
|
|
|
|
|
|
|
|
|
|
|
|
Domestic |
| 120,245,790 |
| 4,504,867 |
| 3.75 | % | 141,072,158 |
| 5,291,967 |
| 3.75 | % |
International |
| 75,723,096 |
| 5,934,723 |
| 7.84 | % | 248,794,772 |
| 16,127,608 |
| 6.48 | % |
|
|
|
|
|
|
|
| ||||||
| 195,968,886 |
| 10,439,590 |
| 5.33 | % | 389,866,930 |
| 21,419,575 |
| 5.49 | % | |
Debt securities |
|
|
|
|
|
|
|
|
|
|
|
|
|
Domestic |
| 29,007,318 |
| 933,402 |
| 3.22 | % | 23,461,903 |
| 778,971 |
| 3.32 | % |
International |
| 41,231,435 |
| 2,709,512 |
| 6.57 | % | 99,314,211 |
| 3,558,943 |
| 3.58 | % |
|
|
|
|
|
|
|
| ||||||
| 70,238,753 |
| 3,642,914 |
| 5.19 | % | 122,776,114 |
| 4,337,914 |
| 3.53 | % | |
Income from hedging operations |
|
|
|
|
|
|
|
|
|
|
|
|
|
Domestic |
|
|
| 280,562 |
|
|
|
|
| 2,404,944 |
|
|
|
International |
|
|
| 1,425,634 |
|
|
|
|
| 1,709,334 |
|
|
|
|
|
|
|
|
| ||||||||
|
|
| 1,706,196 |
|
|
|
|
| 4,114,278 |
|
|
| |
Other interest earning assets |
|
|
|
|
|
|
|
|
|
|
|
|
|
Domestic |
| 10,654,166 |
| 345,353 |
| 3.24 | % | 37,428,241 |
| 441,813 |
| 1.18 | % |
International |
| — |
| — |
| — |
| — |
| — |
| — |
|
|
|
|
|
|
|
|
| ||||||
| 10,654,166 |
| 345,353 |
| 3.24 | % | 37,428,241 |
| 441,813 |
| 1.18 | % | |
Total interest-earning assets |
|
|
|
|
|
|
|
|
|
|
|
|
|
Domestic |
| 174,384,094 |
| 6,382,277 |
| 3.66 | % | 218,775,587 |
| 9,302,766 |
| 4.25 | % |
International |
| 151,759,517 |
| 11,078,961 |
| 7.30 | % | 410,849,644 |
| 23,655,790 |
| 5.76 | % |
|
|
|
|
|
|
|
| ||||||
| 326,143,611 |
| 17,461,238 |
| 5.35 | % | 629,625,231 |
| 32,958,556 |
| 5.23 | % | |
Investments in equity securities |
|
|
|
|
|
|
|
|
|
|
|
|
|
Domestic |
| 4,024,823 |
| 261,357 |
| 6.49 | % | 5,823,044 |
| 196,263 |
| 3.37 | % |
International |
| 11,111,874 |
| 127,681 |
| 1.15 | % | 28,060,383 |
| 139,347 |
| 0.50 | % |
|
|
|
|
|
|
|
| ||||||
| 15,136,697 |
| 389,038 |
| 2.57 | % | 33,883,427 |
| 335,610 |
| 0.99 | % | |
Investments in affiliated companies |
|
|
|
|
|
|
|
|
|
|
|
|
|
Domestic |
| 3,168,233 |
| — |
| — |
| 3,218,629 |
| — |
| — |
|
International |
| 389,031 |
| — |
| — |
| 391,826 |
| — |
| — |
|
|
|
|
|
|
|
|
| ||||||
| 3,557,264 |
| — |
| — |
| 3,610,455 |
| — |
| — |
| |
Total earning assets |
|
|
|
|
|
|
|
|
|
|
|
|
|
Domestic |
| 181,577,150 |
| 6,643,634 |
| 3.66 | % | 227,817,260 |
| 9,499,029 |
| 4.17 | % |
International |
| 163,260,422 |
| 11,206,642 |
| 6.86 | % | 439,301,853 |
| 23,795,137 |
| 5.42 | % |
|
|
|
|
|
|
|
| ||||||
| 344,837,572 |
| 17,850,276 |
| 5.18 | % | 667,119,113 |
| 33,294,166 |
| 4.99 | % | |
Other assets |
| 29,486,845 |
|
|
|
|
| 53,780,152 |
|
|
|
|
|
|
|
|
|
|
|
|
|
|
|
|
|
|
|
Total average assets |
| 374,324,417 |
| 17,850,276 |
| 4.77 | % | 720,899,265 |
| 33,294,166 |
| 4.62 | % |
|
|
|
|
|
|
|
| ||||||
31
Average Balance Sheet - Liabilities and Interest Expense
|
| (IFRS) |
| ||||||||||
|
| ||||||||||||
|
| 2004 |
| 2005 |
| ||||||||
|
|
| |||||||||||
LIABILITY AND STOCKHOLDERS EQUITY |
| Average Balance |
| Interest |
| Average Rate |
| Average Balance |
| Interest |
| Average Rate |
|
|
|
|
|
|
|
| |||||||
|
| (in thousand of Euros, except percentages) |
| ||||||||||
Due to credit entities |
|
|
|
|
|
|
|
|
|
|
|
|
|
Domestic |
| 19,029,151 |
| 436,035 |
| 2.29 | % | 17,084,225 |
| 410,174 |
| 2.40 | % |
International |
| 44,897,644 |
| 1,703,731 |
| 3.79 | % | 97,676,422 |
| 3,182,489 |
| 3.26 | % |
|
|
|
|
|
|
|
| ||||||
| 63,926,795 |
| 2,139,766 |
| 3.35 | % | 114,760,647 |
| 3,592,663 |
| 3.13 | % | |
Customers deposits |
|
|
|
|
|
|
|
|
|
|
|
|
|
Domestic |
| 92,514,205 |
| 1,357,707 |
| 1.47 | % | 98,217,404 |
| 1,653,302 |
| 1.68 | % |
International |
| 74,258,287 |
| 2,370,509 |
| 3.19 | % | 187,638,987 |
| 7,742,070 |
| 4.13 | % |
|
|
|
|
|
|
|
| ||||||
| 166,772,492 |
| 3,728,216 |
| 2.24 | % | 285,856,391 |
| 9,395,372 |
| 3.29 | % | |
Marketable debt securities |
|
|
|
|
|
|
|
|
|
|
|
|
|
Domestic |
| 30,654,245 |
| 967,251 |
| 3.16 | % | 56,259,922 |
| 1,507,745 |
| 2.68 | % |
International |
| 23,338,251 |
| 873,060 |
| 3.74 | % | 67,836,730 |
| 2,754,656 |
| 4.06 | % |
|
|
|
|
|
|
|
| ||||||
| 53,992,496 |
| 1,840,311 |
| 3.41 | % | 124,096,652 |
| 4,262,401 |
| 3.43 | % | |
Subordinated debt |
|
|
|
|
|
|
|
|
|
|
|
|
|
Domestic |
| 4,377,978 |
| 168,965 |
| 3.86 | % | 7,457,156 |
| 329,883 |
| 4.42 | % |
International |
| 10,126,460 |
| 571,906 |
| 5.65 | % | 20,310,747 |
| 1,261,618 |
| 6.21 | % |
|
|
|
|
|
|
|
| ||||||
| 14,504,438 |
| 740,871 |
| 5.11 | % | 27,767,903 |
| 1,591,501 |
| 5.73 | % | |
Equity having the substance of a financial liability |
|
|
|
|
|
|
|
|
|
|
|
|
|
Domestic |
| — |
| — |
| — |
| — |
| — |
| — |
|
International |
| 2,201,122 |
| 151,952 |
| 6.90 | % | 1,614,121 |
| 118,389 |
| 7.33 | % |
|
|
|
|
|
|
|
| ||||||
| 2,201,122 |
| 151,952 |
| 6.90 | % | 1,614,121 |
| 118,389 |
| 7.33 | % | |
Other interest bearing liabilities |
|
|
|
|
|
|
|
|
|
|
|
|
|
Domestic |
| 18,116,991 |
| 802,069 |
| 4.43 | % | 56,739,036 |
| 876,092 |
| 1.54 | % |
International |
| — |
| — |
| — |
| — |
| — |
| — |
|
|
|
|
|
|
|
|
| ||||||
| 18,116,991 |
| 802,069 |
| 4.43 | % | 56,739,036 |
| 876,092 |
| 1.54 | % | |
Expenses from hedging operations |
|
|
|
|
|
|
|
|
|
|
|
|
|
Domestic |
|
|
| (314,413 | ) |
|
|
|
| 1,638,632 |
|
|
|
International |
|
|
| 1,186,004 |
|
|
|
|
| 1,325,646 |
|
|
|
|
|
|
|
|
|
|
|
|
|
|
| ||
|
|
| 871,591 |
|
|
|
|
| 2,964,278 |
|
|
| |
Total interest-bearing liabilities |
|
|
|
|
|
|
|
|
|
|
|
|
|
Domestic |
| 164,692,570 |
| 3,417,614 |
| 2.08 | % | 235,757,743 |
| 6,415,828 |
| 2.72 | % |
International |
| 154,821,764 |
| 6,857,162 |
| 4.43 | % | 375,077,007 |
| 16,384,868 |
| 4.37 | % |
|
|
|
|
|
|
|
| ||||||
| 319,514,334 |
| 10,274,776 |
| 3.22 | % | 610,834,750 |
| 22,800,696 |
| 3.73 | % | |
|
|
|
|
|
|
|
|
|
|
|
|
|
|
Other liabilities |
| 29,548,078 |
|
|
|
|
| 70,851,390 |
|
|
|
|
|
Minority interest |
| 2,028,335 |
|
|
|
|
| 2,449,118 |
|
|
|
|
|
Stockholders’ Equity |
| 23,233,670 |
|
|
|
|
| 36,764,007 |
|
|
|
|
|
|
|
|
|
|
|
|
|
|
|
|
|
|
|
Total average Liabilities and Stockholders’ Equity |
| 374,324,417 |
| 10,274,776 |
| 2.74 | % | 720,899,265 |
| 22,800,696 |
| 3.16 | % |
|
|
|
|
|
|
|
| ||||||
32
Average Balance Sheet - Assets and Interest Income |
| (Previous Spanish GAAP) |
| ||||
|
|
| |||||
|
| 2003 |
| ||||
|
|
| |||||
| Average Balance |
| Interest |
| Average Rate |
| |
|
|
|
|
| |||
|
| (in thousands of euros, except percentages) |
| ||||
ASSETS | |||||||
Cash and due from central banks |
|
|
|
|
|
|
|
Domestic |
| 3,075,228 |
| 37,266 |
| 1.21 | % |
International |
| 4,596,131 |
| 258,840 |
| 5.63 | % |
|
|
|
|
| |||
|
| 7,671,359 |
| 296,106 |
| 3.86 | % |
Due from credit institutions (1) |
|
|
|
|
|
|
|
Domestic |
| 12,760,763 |
| 315,720 |
| 2.47 | % |
International |
| 25,886,472 |
| 1,062,087 |
| 4.10 | % |
|
|
|
|
| |||
|
| 38,647,235 |
| 1,377,807 |
| 3.57 | % |
Government debt securities |
|
|
|
|
|
|
|
Domestic |
| 29,809,839 |
| 1,228,723 |
| 4.12 | % |
International |
| — |
| — |
| — |
|
|
|
|
|
| |||
|
| 29,809,839 |
| 1,228,723 |
| 4.12 | % |
Debentures and other fixed-income securities |
|
|
|
|
|
|
|
Domestic |
| 3,404,886 |
| 100,830 |
| 2.96 | % |
International |
| 32,132,708 |
| 2,084,048 |
| 6.49 | % |
|
|
|
|
| |||
|
| 35,537,594 |
| 2,184,878 |
| 6.15 | % |
Loans and credits (1) |
|
|
|
|
|
|
|
Domestic |
| 100,009,531 |
| 4,551,898 |
| 4.55 | % |
International |
| 72,349,184 |
| 5,785,164 |
| 8.00 | % |
|
|
|
|
| |||
|
| 172,358,715 |
| 10,337,062 |
| 6.00 | % |
Income from hedging operations (2) |
|
|
|
|
|
|
|
Domestic |
|
|
| 437,209 |
|
|
|
International |
|
|
| 1,341,955 |
|
|
|
|
|
|
|
|
|
| |
|
|
|
| 1,779,164 |
|
|
|
Total interest-earning assets |
|
|
|
|
|
|
|
Domestic |
| 149,060,247 |
| 6,671,646 |
| 4.48 | % |
International |
| 134,964,495 |
| 10,532,094 |
| 7.80 | % |
|
|
|
|
| |||
|
| 284,024,742 |
| 17,203,740 |
| 6.06 | % |
Equity securities (3) |
|
|
|
|
|
|
|
Domestic |
| 7,085,648 |
| 310,074 |
| 4.38 | % |
International |
| 7,730,451 |
| 131,419 |
| 1.70 | % |
|
|
|
|
| |||
|
| 14,816,099 |
| 441,493 |
| 2.98 | % |
Total earning assets |
|
|
|
|
|
|
|
Domestic |
| 156,145,895 |
| 6,981,720 |
| 4.47 | % |
International |
| 142,694,946 |
| 10,663,513 |
| 7.47 | % |
|
|
|
|
| |||
|
| 298,840,841 |
| 17,645,233 |
| 5.90 | % |
Allowance for credit losses |
| (5,019,135 | ) |
|
|
|
|
Premises and equipment |
| 4,583,335 |
|
|
|
|
|
Other assets |
| 40,596,589 |
|
|
|
|
|
Total average assets |
| 339,001,630 |
| 17,645,233 |
| 5.21 | % |
|
|
|
|
| |||
(1) | Includes securities purchased under agreements to resell. |
(2) | Includes income from instruments to hedge interest-rate transactions. |
(3) | Includes both portfolio investments in equity securities and investments in Group and non-Group companies. Amounts shown as “interest” consist of dividends received. Includes dividends from companies accounted for by the equity method of €309,506 thousands for 2003. |
33
Average Balance Sheet - Liabilities and Interest Expense |
| (Previous Spanish GAAP) |
| ||||
|
|
| |||||
|
| 2003 |
| ||||
|
|
| |||||
| Average Balance |
| Interest |
| Average Rate |
| |
|
|
|
|
| |||
|
| (in thousands of euros, except percentages) |
| ||||
LIABILITY AND STOCKHOLDERS’ EQUITY | |||||||
Due to credit institutions (1) |
|
|
|
|
|
|
|
Domestic |
| 20,123,870 |
| 451,448 |
| 2.24 | % |
International |
| 41,598,221 |
| 1,516,954 |
| 3.65 | % |
|
|
|
|
| |||
|
| 61,722,091 |
| 1,968,402 |
| 3.19 | % |
Customers deposits (1) |
|
|
|
|
|
|
|
Domestic |
| 90,777,806 |
| 1,522,022 |
| 1.68 | % |
International |
| 72,815,172 |
| 2,793,579 |
| 3.84 | % |
|
|
|
|
| |||
|
| 163,592,978 |
| 4,315,601 |
| 2.64 | % |
Marketable debt securities |
|
|
|
|
|
|
|
Domestic |
| 12,825,157 |
| 541,583 |
| 4.22 | % |
International |
| 24,062,569 |
| 799,861 |
| 3.32 | % |
|
|
|
|
| |||
|
| 36,887,726 |
| 1,341,444 |
| 3.64 | % |
Subordinated debt |
|
|
|
|
|
|
|
Domestic |
| 1,361,897 |
| 51,351 |
| 3.77 | % |
International |
| 10,505,451 |
| 627,469 |
| 5.97 | % |
|
|
|
|
| |||
|
| 11,867,348 |
| 678,820 |
| 5.72 | % |
Expenses from hedging operations (2) |
|
|
|
|
|
|
|
Domestic |
|
|
| — |
|
|
|
International |
|
|
| 663,903 |
|
|
|
|
|
|
|
|
|
| |
|
|
|
| 663,903 |
|
|
|
Total interest-bearing liabilities |
|
|
|
|
|
|
|
Domestic |
| 125,088,730 |
| 2,566,404 |
| 2.05 | % |
International |
| 148,981,413 |
| 6,401,766 |
| 4.30 | % |
|
|
|
|
| |||
|
| 274,070,143 |
| 8,968,170 |
| 3.27 | % |
Other liabilities (3) |
| 38,749,780 |
| 718,726 |
|
|
|
Minority interest |
| 6,602,448 |
|
|
|
|
|
Stockholders’ Equity (4) |
| 19,579,259 |
|
|
|
|
|
Total average Liabilities and Stockholders’ Equity |
| 339,001,630 |
| 9,686,896 |
| 2.86 | % |
|
|
|
|
| |||
(1) | Includes securities sold under agreements to repurchase. |
(2) | Includes expenses from instruments to hedge interest-rate transactions. |
(3) | Includes interest allocated to Grupo Santander pension plans. |
(4) | For calculation of the ROE ratio and the average stockholders’ equity as a percentage of average total assets ratio, the amount of average stockholders’ equity considered was €18,035,039 thousand for the year 2003. The main difference is the effect of net attributable income on average stockholders’ equity. |
34
Changes in Net Interest Income—Volume and Rate Analysis
The following tables allocate, by domicile of customer, changes in our net interest income between changes in average volume and changes in average rate for 2005 compared to 2004. We have calculated volume variances based on movements in average balances over the period and rate variance based on changes in interest rates on average interest-earning assets and average interest-bearing liabilities. We have allocated variances caused by changes in both volume and rate to volume. You should read the following tables and the footnotes thereto in light of our observations noted in the preceding sub-section entitled “Average Balance Sheets and Interest Rates”, and the footnotes thereto.
| (IFRS) |
| |||||
Volume and rate analysis |
| Increase (Decrease) due to changes in |
| ||||
|
| Volume |
| Rate |
| Net change |
|
|
| (in thousand of Euros) |
| ||||
Interest and similar revenues (1) |
|
|
|
|
|
|
|
Cash and due from central banks |
|
|
|
|
|
|
|
Domestic |
| 6,004 |
| 2,160 |
| 8,164 |
|
International |
| 84,643 |
| (58,032 | ) | 26,611 |
|
|
|
|
|
| |||
|
| 90,647 |
| (55,872 | ) | 34,775 |
|
Due from credit entities |
|
|
|
|
|
|
|
Domestic |
| 48,214 |
| 10,600 |
| 58,814 |
|
International |
| 929,885 |
| 294,317 |
| 1,224,202 |
|
|
|
|
|
| |||
|
| 978,099 |
| 304,917 |
| 1,283,016 |
|
Loans and credits (1) |
|
|
|
|
|
|
|
Domestic |
| 787,100 |
| — |
| 787,100 |
|
International |
| 11,222,719 |
| (1,029,834 | ) | 10,192,885 |
|
|
|
|
|
| |||
|
| 12,009,819 |
| (1,029,834 | ) | 10,979,985 |
|
Debt securities |
|
|
|
|
|
|
|
Domestic |
| (183,438 | ) | 29,007 |
| (154,431 | ) |
International |
| 2,082,251 |
| (1,232,820 | ) | 849,431 |
|
|
|
|
|
| |||
|
| 1,898,813 |
| (1,203,813 | ) | 695,000 |
|
Other interest earning assets |
|
|
|
|
|
|
|
Domestic |
| 315,936 |
| (219,476 | ) | 96,460 |
|
International |
| — |
| — |
| — |
|
|
|
|
|
| |||
|
| 315,936 |
| (219,476 | ) | 96,460 |
|
Total interest-earning assets |
|
|
|
|
|
|
|
Domestic |
| 973,816 |
| (177,709 | ) | 796,107 |
|
International |
| 14,319,498 |
| (2,026,369 | ) | 12,293,129 |
|
|
|
|
|
| |||
|
| 17,701,396 |
| (2,204,078 | ) | 15,497,318 |
|
Investments in equity securities |
|
|
|
|
|
|
|
Domestic |
| 60,480 |
| (125,574 | ) | (65,094 | ) |
International |
| 83,893 |
| (72,227 | ) | 11,666 |
|
|
|
|
|
| |||
|
| 144,373 |
| (197,801 | ) | (53,428 | ) |
Total earning assets |
|
|
|
|
|
|
|
Domestic |
| 1,034,296 |
| (303,283 | ) | 731,013 |
|
International |
| 14,403,391 |
| (2,098,596 | ) | 12,304,795 |
|
|
|
|
|
| |||
|
| 15,437,687 |
| (2,401,879 | ) | 13,035,808 |
|
(1) Without interest income or interest expense from interest-rate hedging transactions.
35
Volume and rate analysis |
| (Previous Spanish GAAP) |
| ||||
|
|
| |||||
|
| Increase (Decrease) due to changes in |
| ||||
|
|
| |||||
|
| Volume |
| Rate |
| Net change |
|
|
|
|
|
| |||
| (in thousand of Euros) |
| |||||
Interest and similar revenues (1) | |||||||
Cash and due from central banks |
|
|
|
|
|
|
|
Domestic |
| 1,151 |
| (2,460 | ) | (1,309 | ) |
International |
| 12,973 |
| (71,240 | ) | (58,267 | ) |
|
|
|
|
| |||
| 14,124 |
| (73,700 | ) | (59,576 | ) | |
Due from credit institutions |
|
|
|
|
|
|
|
Domestic |
| (78,565 | ) | 48,491 |
| (30,074 | ) |
International |
| 66,317 |
| (326,170 | ) | (259,853 | ) |
|
|
|
|
| |||
| (12,248 | ) | (277,679 | ) | (289,927 | ) | |
Government debt securities |
|
|
|
|
|
|
|
Domestic |
| (312,736 | ) | (113,277 | ) | (426,013 | ) |
International |
| — |
| — |
| — |
|
|
|
|
|
| |||
| (312,736 | ) | (113,277 | ) | (426,013 | ) | |
Domestic |
| 74,072 |
| (13,620 | ) | 60,452 |
|
International |
| 660,011 |
| (51,412 | ) | 608,599 |
|
|
|
|
|
| |||
| 734,083 |
| (65,032 | ) | 669,051 |
| |
Loans and credits (1) |
|
|
|
|
|
|
|
Domestic |
| 721,299 |
| (580,055 | ) | 141,244 |
|
International |
| 853,293 |
| (687,317 | ) | 165,976 |
|
|
|
|
|
| |||
| 1,574,592 |
| (1,267,372 | ) | 307,220 |
| |
Total interest-earning assets |
|
|
|
|
|
|
|
Domestic |
| 405,221 |
| (660,921 | ) | (255,700 | ) |
International |
| 1,592,594 |
| (1,136,139 | ) | 456,455 |
|
|
|
|
|
| |||
| 1,997,815 |
| (1,797,060 | ) | 200,755 |
| |
Equity securities |
|
|
|
|
|
|
|
Domestic |
| 58,709 |
| 87,862 |
| 146,571 |
|
International |
| 6,042 |
| 53,340 |
| 59,382 |
|
|
|
|
|
| |||
| 64,751 |
| 141,202 |
| 205,953 |
| |
Total earning assets |
|
|
|
|
|
|
|
Domestic |
| 463,930 |
| (573,059 | ) | (109,129 | ) |
International |
| 1,598,636 |
| (1,082,799 | ) | 515,837 |
|
|
|
|
|
| |||
| 2,062,566 |
| (1,655,858 | ) | 406,708 |
| |
|
|
|
|
| |||
(1) | Without interest income or interest expense from interest-rate hedging transactions. |
36
Volume and rate analysis
|
| (IFRS) |
| ||||
|
|
| |||||
|
| Increase (Decrease) due to changes in |
| ||||
|
|
| |||||
|
| Volume |
| Rate |
| Net change |
|
|
|
|
|
| |||
|
| (in thousand of Euros) |
| ||||
Interest and similar expenses (1) |
|
|
|
|
|
|
|
Due to credit entities |
|
|
|
|
|
|
|
Domestic |
| (46,793 | ) | 20,932 |
| (25,861 | ) |
International |
| 1,716,716 |
| (237,958 | ) | 1,478,758 |
|
|
|
|
|
| |||
| 1,669,923 |
| (217,026 | ) | 1,452,897 |
| |
Customers deposits |
|
|
|
|
|
|
|
Domestic |
| 101,315 |
| 194,280 |
| 295,595 |
|
International |
| 4,673,533 |
| 698,028 |
| 5,371,561 |
|
|
|
|
|
| |||
| 4,774,848 |
| 892,308 |
| 5,667,156 |
| |
Marketable debt securities |
|
|
|
|
|
|
|
Domestic |
| 687,634 |
| (147,140 | ) | 540,494 |
|
International |
| 1,806,914 |
| 74,682 |
| 1,881,596 |
|
|
|
|
|
| |||
| 2,494,548 |
| (72,458 | ) | 2,422,090 |
| |
Subordinated debt |
|
|
|
|
|
|
|
Domestic |
| 136,401 |
| 24,517 |
| 160,918 |
|
International |
| 633,004 |
| 56,708 |
| 689,712 |
|
|
|
|
|
| |||
| 769,405 |
| 81,225 |
| 850,630 |
| |
Equity having the substance of a financial liability |
|
|
|
|
|
|
|
Domestic |
| — |
| — |
| — |
|
International |
| (43,028 | ) | 9,465 |
| (33,563 | ) |
|
|
|
|
| |||
| (43,028 | ) | 9,465 |
| (33,563 | ) | |
Other interest bearing liabilities |
|
|
|
|
|
|
|
Domestic |
| 597,604 |
| (523,581 | ) | 74,023 |
|
International |
| — |
| — |
| — |
|
|
|
|
|
| |||
| 597,604 |
| (523,581 | ) | 74,023 |
| |
Total interest-bearing liabilities |
|
|
|
|
|
|
|
Domestic |
| 1,476,161 |
| (430,992 | ) | 1,045,169 |
|
International |
| 8,787,139 |
| 600,925 |
| 9,388,064 |
|
|
|
|
|
| |||
| 10,263,300 |
| 169,933 |
| 10,433,233 |
| |
(1) | Without interest income or interest expense from interest-rate hedging transactions. |
37
|
| (Previous Spanish GAAP) |
| ||||
|
|
| |||||
|
| Increase (Decrease) due to changes in |
| ||||
|
|
| |||||
|
| Volume |
| Rate |
| Net change |
|
|
|
|
|
| |||
|
| (in thousand of Euros) |
| ||||
Interest and similar expenses (1) |
|
|
|
|
|
|
|
Due to credit institutions |
|
|
|
|
|
|
|
Domestic |
| (13,405 | ) | 8,050 |
| (5,355 | ) |
International |
| 210,835 |
| (4,160 | ) | 206,675 |
|
|
|
|
|
| |||
| 197,430 |
| 3,890 |
| 201,320 |
| |
Customers deposits |
|
|
|
|
|
|
|
Domestic |
| 39,205 |
| (181,556 | ) | (142,351 | ) |
International |
| 334,526 |
| (757,278 | ) | (422,752 | ) |
|
|
|
|
| |||
| 373,731 |
| (938,834 | ) | (565,103 | ) | |
Marketable debt securities |
|
|
|
|
|
|
|
Domestic |
| 451,679 |
| (96,189 | ) | 355,490 |
|
International |
| 1,888 |
| 57,750 |
| 59,638 |
|
|
|
|
|
| |||
| 453,567 |
| (38,439 | ) | 415,128 |
| |
Subordinated debt |
|
|
|
|
|
|
|
Domestic |
| 34,220 |
| 27,919 |
| 62,139 |
|
International |
| (588 | ) | (54,628 | ) | (55,216 | ) |
|
|
|
|
| |||
| 33,632 |
| (26,709 | ) | 6,923 |
| |
Total interest-bearing liabilities |
|
|
|
|
|
|
|
Domestic |
| 511,699 |
| (241,776 | ) | 269,923 |
|
International |
| 546,661 |
| (758,316 | ) | (211,655 | ) |
|
|
|
|
| |||
| 1,058,360 |
| (1,000,092 | ) | 58,268 |
| |
|
|
|
|
| |||
(1) | Without interest income or interest expense from interest-rate hedging transactions. |
38
Assets
Earning Assets—Yield Spread
The following table analyzes, by domicile of customer, our average earning assets, interest income and dividends on equity securities and net interest income and shows gross yields, net yields and yield spread for each of the years indicated. You should read this table and the footnotes thereto in light of our observations noted in the preceding sub-section entitled “Average Balance Sheets and Interest Rates”, and the footnotes thereto.
| (IFRS) |
| |||
Earning Assets - Yield Spread |
| Year Ended December 31, |
| ||
|
|
| |||
| 2004 |
| 2005 |
| |
|
|
| |||
|
| (in thousand of Euros, except percentages) |
| ||
Average earning assets |
|
|
|
|
|
Domestic |
| 181,577,150 |
| 227,817,260 |
|
International |
| 163,260,422 |
| 439,301,853 |
|
|
|
|
| ||
|
| 344,837,572 |
| 667,119,113 |
|
Interest and dividends on equity securities (1) |
|
|
|
|
|
Domestic |
| 6,643,634 |
| 9,499,029 |
|
International |
| 11,206,642 |
| 23,795,137 |
|
|
|
|
| ||
|
| 17,850,276 |
| 33,294,166 |
|
Net interest income |
|
|
|
|
|
Domestic |
| 3,226,020 |
| 3,083,201 |
|
International |
| 4,349,480 |
| 7,410,269 |
|
|
|
|
| ||
|
| 7,575,500 |
| 10,493,470 |
|
Gross yield (2) |
|
|
|
|
|
Domestic |
| 3.66 | % | 4.17 | % |
International |
| 6.86 | % | 5.42 | % |
|
|
|
| ||
|
| 5.18 | % | 4.99 | % |
Net yield (3) |
|
|
|
|
|
Domestic |
| 1.78 | % | 1.35 | % |
International |
| 2.66 | % | 1.69 | % |
|
|
|
| ||
|
| 2.20 | % | 1.57 | % |
Yield spread (4) |
|
|
|
|
|
Domestic |
| 1.58 | % | 1.45 | % |
International |
| 2.43 | % | 1.05 | % |
|
|
|
| ||
|
| 1.96 | % | 1.26 | % |
(1) | Dividends on equity securities include dividends from companies accounted for by the equity method. |
(2) | Gross yield is the quotient of interest and dividends on equity securities divided by average earning assets. |
(3) | Net yield is the quotient of net interest income (that includes dividends on equity securities) divided by average earning assets. |
(4) | Yield spread is the difference between gross yield on earning assets and the average cost of interest-bearing liabilities. For a discussion of the changes in yield spread over the periods presented, see “Item 5. Operating and Financial Review and Prospects – Net Interest Income”. |
39
|
| (Previous Spanish GAAP) |
|
|
|
| |
|
| 2003 |
|
|
|
| |
|
| (in thousands of euros |
|
Average earning assets |
|
|
|
Domestic |
| 156,145,895 |
|
International |
| 142,694,946 |
|
|
|
| |
|
| 298,840,841 |
|
Interest and dividends on equity securities (1) |
|
|
|
Domestic |
| 6,981,720 |
|
International |
| 10,663,513 |
|
|
|
| |
|
| 17,645,233 |
|
Net interest income |
|
|
|
Domestic |
| 3,985,021 |
|
International |
| 3,973,316 |
|
|
|
| |
|
| 7,958,337 |
|
Gross yield (2) |
|
|
|
Domestic |
| 4.47 | % |
International |
| 7.47 | % |
|
|
| |
|
| 5.90 | % |
Net yield (3) |
|
|
|
Domestic |
| 2.55 | % |
International |
| 2.78 | % |
|
|
| |
|
| 2.66 | % |
Yield spread (4) |
|
|
|
Domestic |
| 2.42 | % |
International |
| 3.17 | % |
|
|
| |
|
| 2.63 | % |
Net interest margin (3) |
|
|
|
Domestic |
| 2.47 | % |
International |
| 2.85 | % |
|
|
| |
|
| 2.65 | % |
(1) | Dividends on equity securities include dividends from companies accounted for by the equity method. |
(2) | Gross yield is the quotient of interest and dividends on equity securities divided by average earning assets. |
(3) | Net yield is the quotient of net interest income (that includes dividends on equity securities) divided by average earning assets. Net interest margin is calculated in the same way as net yield but excludes dividends from income and equity securities from average earning assets. |
(4) | Yield spread is the difference between gross yield on earning assets and the average cost of interest-bearing liabilities. |
40
Return on Equity and Assets
The following table presents our selected financial ratios for the years indicated.
|
| (Previous |
| (IFRS) |
| ||
|
|
|
| ||||
|
| Year Ended December 31, |
| ||||
|
|
| |||||
|
| 2003 |
| 2004 |
| 2005 |
|
|
|
|
|
| |||
ROA: Return on average total assets |
| 0.95 | % | 1.01 | % | 0.91 | % |
ROE: Return on average stockholders’ equity |
| 14.48 | % | 19.74 | % | 19.86 | % |
PAY-OUT: Dividends per average share as a percentage of net attributable income per average share |
| 55.32 | % | 50.95 | % | 41.88 | % |
Average stockholders’ equity as a percentage of average total assets |
| 5.32 | % | 4.62 | % | 4.24 | % |
Interest-Earning Assets
The following table shows, by domicile of customer, the percentage mix of our average interest-earning assets for the years indicated. You should read this table in light of our observations noted in the preceding sub-section entitled “Average Balance Sheets and Interest Rates”, and the footnotes thereto.
Interest earning assets
|
| (IFRS) |
| ||
|
|
| |||
|
| 2004 |
| 2005 |
|
|
|
|
| ||
Cash and due from Central Banks |
|
|
|
|
|
Domestic |
| 0.83 | % | 0.51 | % |
International |
| 1.65 | % | 1.36 | % |
|
|
|
| ||
|
| 2.48 | % | 1.87 | % |
Due from credit entities |
|
|
|
|
|
Domestic |
| 3.61 | % | 2.17 | % |
International |
| 9.02 | % | 8.60 | % |
|
|
|
| ||
|
| 12.63 | % | 10.77 | % |
Loans and credits |
|
|
|
|
|
Domestic |
| 36.87 | % | 22.41 | % |
International |
| 23.22 | % | 39.51 | % |
|
|
|
| ||
|
| 60.09 | % | 61.92 | % |
Debt securities |
|
|
|
|
|
Domestic |
| 8.89 | % | 3.73 | % |
International |
| 12.64 | % | 15.77 | % |
|
|
|
| ||
|
| 21.53 | % | 19.50 | % |
Other interest earning assets |
|
|
|
|
|
Domestic |
| 3.27 | % | 5.94 | % |
International |
| 0.00 | % | 0.00 | % |
|
|
|
| ||
|
| 3.27 | % | 5.94 | % |
Total interest-earning assets |
|
|
|
|
|
Domestic |
| 53.47 | % | 34.76 | % |
International |
| 46.53 | % | 65.24 | % |
|
|
|
| ||
|
| 100.00 | % | 100.00 | % |
41
|
| (Previous Spanish GAAP) |
|
|
|
| |
Cash and due from Central Banks |
|
|
|
Domestic |
| 1.09 | % |
International |
| 1.62 | % |
|
|
| |
|
| 2.71 | % |
Due from credit institutions |
|
|
|
Domestic |
| 4.49 | % |
International |
| 9.11 | % |
|
|
| |
|
| 13.60 | % |
Government debt securities |
|
|
|
Domestic |
| 10.50 | % |
International |
| — |
|
|
|
| |
|
| 10.50 | % |
Debentures and other fixed-income securities |
|
|
|
Domestic |
| 1.20 | % |
International |
| 11.31 | % |
|
|
| |
|
| 12.51 | % |
Loans and credits |
|
|
|
Domestic |
| 35.21 | % |
International |
| 25.47 | % |
|
|
| |
|
| 60.68 | % |
Total interest-earning assets |
|
|
|
Domestic |
| 52.49 | % |
International |
| 47.51 | % |
|
|
| |
|
| 100.00 | % |
42
Loans and Advances to Credit Institutions
The following tables show our short-term funds deposited with other banks at each of the dates indicated.
|
| (IFRS) |
| ||
|
|
| |||
|
| 2004 |
| 2005 |
|
|
|
| |||
| thousand of euros |
| |||
Reciprocal accounts |
| 118,536 |
| 345,104 |
|
Time deposits |
| 23,204,031 |
| 21,962,472 |
|
Reverse repurchase agreements |
| 31,495,786 |
| 33,634,326 |
|
Other accounts |
| 3,561,421 |
| 3,831,120 |
|
|
|
| |||
|
| 58,379,774 |
| 59,773,022 |
|
Less- Impairment losses |
| (53,879 | ) | (36,046 | ) |
|
|
| |||
|
| 58,325,895 |
| 59,736,976 |
|
The table below contains information prepared under previous Spanish GAAP, which is not comparable to information prepared under IFRS. For a description of the differences between these accounting standards, see Note 57 to our consolidated financial statements.
|
| (Previous Spanish GAAP) |
| ||||
|
| At December 31, |
| ||||
|
|
| |||||
|
| 2001 |
| 2002 |
| 2003 |
|
|
|
|
|
| |||
Demand deposits- |
| (in thousands of euros) |
| ||||
Current accounts |
| 215,667 |
| 105,816 |
| 103,734 |
|
Other accounts |
| 5,396,981 |
| 3,043,095 |
| 1,599,804 |
|
|
|
|
|
| |||
|
| 5,612,648 |
| 3,148,911 |
| 1,703,538 |
|
Other deposits- |
|
|
|
|
|
|
|
Deposits in credit institutions |
| 20,992,205 |
| 15,865,145 |
| 14,635,787 |
|
Securities purchased under agreements to resell |
| 16,491,544 |
| 21,332,856 |
| 21,390,247 |
|
|
|
|
|
| |||
|
| 37,483,749 |
| 37,198,001 |
| 36,026,034 |
|
Less- Allowance for credit losses (1) |
| (107,107 | ) | (90,522 | ) | (111,735 | ) |
|
|
|
|
| |||
|
| 42,989,290 |
| 40,256,390 |
| 37,617,837 |
|
|
|
|
|
| |||
(1) | The purpose of this allowance for credit losses was to recognize the loss related to the collectibility of these balances due to transfer risk and credit risk. This allowance was determined, in accordance with Bank of Spain requirements, based on debt servicing, on debtor credit rating, and on the outstanding settlement and transfer risks of the country in which the debtor is located. |
The allowance for credit losses reduces the fair value of the balances included in Due from Credit Institutions after evaluating their collectibility. All estimated losses considered in the calculation of this allowance are related to claims due from non-OECD financial institutions.
Investment Securities
At December 31, 2005, the book value of our investment securities was €203.9 billion (representing 25.2% of our total assets). These investment securities had a yield of 2.98% in 2005, compared with a yield of 4.72% earned during 2004. €19.6 billion, or 9.6%, of our investment securities consisted of Spanish Government and government agency securities. For a discussion of how we value our investment securities, see Note 2 to our consolidated financial statements.
43
The following tables show the book values of our investment securities by type and domicile of counterparty at each of the dates indicated.
|
| (IFRS) |
| ||
|
| At December 31, |
| ||
|
|
| |||
Debt securities |
| 2004 |
| 2005 |
|
|
|
|
| ||
Domestic- |
| (in thousands of euros) |
| ||
Spanish Government |
| 17,252,328 |
| 19,595,333 |
|
Other domestic issuer: |
|
|
|
|
|
Public authorities |
| 217,457 |
| 121,328 |
|
Other domestic issuer |
| 5,652,988 |
| 6,569,398 |
|
|
|
|
| ||
Total domestic |
| 23,122,773 |
| 26,286,059 |
|
International- |
|
|
|
|
|
United States: |
|
|
|
|
|
U.S. Treasury and other U.S. Government agencies |
| 1,397,595 |
| 874,569 |
|
States and political subdivisions |
| 691,401 |
| 95,167 |
|
Other securities |
| 6,153,787 |
| 5,331,903 |
|
|
|
|
| ||
Total United States |
| 8,242,783 |
| 6,301,639 |
|
Other: |
|
|
|
|
|
Governments |
| 13,995,188 |
| 70,913,815 |
|
Other securities |
| 67,063,965 |
| 56,244,892 |
|
Total Other |
| 81,059,153 |
| 127,158,707 |
|
|
|
|
| ||
Total International |
| 89,301,936 |
| 133,460,346 |
|
|
|
|
|
|
|
Less- Impairment losses |
| (219,635 | ) | (80,000 | ) |
|
|
|
| ||
Total Debt Securities |
| 112,205,074 |
| 159,666,405 |
|
|
|
|
|
|
|
Equity securities |
|
|
|
|
|
Domestic |
| 4,231,724 |
| 7,556,389 |
|
International- |
|
|
|
|
|
United States |
| 291,239 |
| 247,711 |
|
Other |
| 22,056,652 |
| 36,485,513 |
|
|
|
|
| ||
Total international |
| 22,347,891 |
| 36,733,224 |
|
|
|
|
|
|
|
Less- Impairment losses |
| (30,925 | ) | (17,658 | ) |
|
|
|
|
|
|
Total Equity Securities |
| 26,548,690 |
| 44,271,955 |
|
|
|
|
| ||
Total Investment Securities |
| 138,753,764 |
| 203,938,360 |
|
|
|
|
| ||
44
The table below contains information prepared under previous Spanish GAAP which is not comparable to information prepared under IFRS. See main differences between both accounting standards in Note 57 to our consolidated financial statements.
|
| (Previous Spanish GAAP) |
| ||||
|
|
| |||||
| 2001 |
| 2002 |
| 2003 |
| |
|
|
|
|
| |||
Debt securities |
| (in thousands of euros) |
| ||||
Domestic- |
|
|
| ||||
Spanish Government |
| 24,705,072 |
| 24,988,526 |
| 31,118,523 |
|
Other domestic issuer: |
|
|
|
|
|
|
|
Public authorities |
| 89,845 |
| 216,012 |
| 275,146 |
|
Other domestic issuer |
| 2,297,014 |
| 2,802,959 |
| 5,327,211 |
|
|
|
|
|
| |||
Total domestic |
| 27,091,931 |
| 28,007,497 |
| 36,720,880 |
|
International- |
|
|
|
|
|
|
|
United States: |
|
|
|
|
|
|
|
U.S. Treasury and other U.S. Government agencies |
| 290,878 |
| 596,589 |
| 1,140,134 |
|
States and political subdivisions |
| 2,095,609 |
| 2,145,256 |
| 98,306 |
|
Other securities |
| 2,451,210 |
| 781,884 |
| 696,328 |
|
|
|
|
|
| |||
Total United Status |
| 4,837,697 |
| 3,523,729 |
| 1,934,768 |
|
Other: |
|
|
|
|
|
|
|
Governments |
| 27,750,580 |
| 19,896,934 |
| 26,542,838 |
|
Other securities |
| 7,816,487 |
| 5,980,499 |
| 10,434,092 |
|
|
|
|
|
| |||
Total Other |
| 35,567,067 |
| 25,877,433 |
| 36,976,930 |
|
|
|
|
|
| |||
Total International |
| 40,404,764 |
| 29,401,162 |
| 38,911,698 |
|
|
|
|
|
|
|
|
|
Less- Allowance for credit losses |
| (188,453 | ) | (135,552 | ) | (185,978 | ) |
Less- Security price fluctuation allowance |
| (308,957 | ) | (198,453 | ) | (61,682 | ) |
|
|
|
|
| |||
Total Debt Securities |
| 66,999,285 |
| 57,074,654 |
| 75,384,918 |
|
|
|
|
|
| |||
|
|
|
|
|
|
|
|
Equity securities |
|
|
|
|
|
|
|
Domestic |
| 3,057,091 |
| 3,849,006 |
| 4,766,673 |
|
International- |
|
|
|
|
|
|
|
United States |
| 299,532 |
| 57,359 |
| 346,003 |
|
Other |
| 4,973,928 |
| 4,530,102 |
| 5,900,207 |
|
|
|
|
|
| |||
Total international |
| 5,273,460 |
| 4,587,461 |
| 6,246,210 |
|
|
|
|
|
|
|
|
|
Less- Security price fluctuation allowance |
| (522,640 | ) | (569,715 | ) | (948,761 | ) |
|
|
|
|
|
|
|
|
|
|
|
|
| |||
Total Equity Securities |
| 7,807,911 |
| 7,866,752 |
| 10,064,122 |
|
|
|
|
|
| |||
Total Investment Securities |
| 74,807,196 |
| 64,941,406 |
| 85,449,040 |
|
|
|
|
|
| |||
The following table analyzes the aggregate book value and aggregate market value of the securities of single issuers, other than the Government of the United States, that exceeded 10% of our stockholders’ equity as of December 31, 2005.
|
| Aggregate as of December 31, 2005 |
| ||
|
|
| |||
|
| Book value |
| Market value |
|
|
|
|
| ||
|
| (in millions of euros) |
| ||
Debt securities: |
|
|
| ||
-Mexican Government |
| 24,280.9 |
| 24,280.9 |
|
-Spanish Government |
| 19,716.7 |
| 19,716.7 |
|
-French Government |
| 14,977.3 |
| 14,977.3 |
|
-Germany Government |
| 10,293.8 |
| 10,293.8 |
|
-Brazilian Government |
| 9,286.9 |
| 9,286.9 |
|
-The Royal Bank of Scotland Group Plc |
| 4,860.3 |
| 4,860.3 |
|
-HBOS plc |
| 4,573.1 |
| 4,573.1 |
|
-Lloyds TSB Group plc |
| 4,013.5 |
| 4,013.5 |
|
45
The following table analyzes the maturities and weighted average yields of our debt investment securities (before impairment allowances) at December 31, 2005. Yields on tax-exempt obligations have not been calculated on a tax-equivalent basis because we do not believe the effect of such a calculation would be material.
|
| (IFRS) |
| ||||||||
|
|
| |||||||||
|
| Maturing |
| Maturing |
| Maturing |
| Maturing |
| Total |
|
|
|
|
|
|
|
| |||||
|
| (in thousands of euros) |
| ||||||||
Debt securities |
|
|
|
|
|
|
|
|
|
|
|
Domestic: |
|
|
|
|
|
|
|
|
|
|
|
Spanish Government |
| 6,302,116 |
| 8,634,342 |
| 4,545,706 |
| 113,169 |
| 19,595,333 |
|
Other domestic issuer: |
|
|
|
|
|
|
|
|
|
|
|
Public authorities |
| 98,148 |
| 17,739 |
| 4,336 |
| 1,105 |
| 121,328 |
|
Other domestic issuer |
| 435,009 |
| 1,543,709 |
| 589,995 |
| 4,000,685 |
| 6,569,398 |
|
|
|
|
|
|
|
| |||||
Total domestic |
| 6,835,273 |
| 10,195,790 |
| 5,140,037 |
| 4,114,959 |
| 26,286,059 |
|
International: |
|
|
|
|
|
|
|
|
|
|
|
United States: |
|
|
|
|
|
|
|
|
|
|
|
U.S. Treasury and other U.S. Government agencies |
| 308,411 |
| 165,722 |
| 397,504 |
| 2,932 |
| 874,569 |
|
States and political subdivisions |
| 31,648 |
| 31,436 |
| 24,894 |
| 7,189 |
| 95,167 |
|
Other securities |
| 3,893,831 |
| 428,206 |
| 229,720 |
| 780,146 |
| 5,331,903 |
|
|
|
|
|
|
|
| |||||
Total United States |
| 4,233,890 |
| 625,364 |
| 652,118 |
| 790,267 |
| 6,301,639 |
|
Other: |
|
|
|
|
|
|
|
|
|
|
|
Governments |
| 8,509,624 |
| 52,882,238 |
| 5,450,045 |
| 4,071,908 |
| 70,913,815 |
|
Other securities |
| 37,903,998 |
| 14,039,077 |
| 1,502,115 |
| 2,799,702 |
| 56,244,892 |
|
|
|
|
|
|
|
| |||||
Total Other |
| 46,413,622 |
| 66,921,315 |
| 6,952,160 |
| 6,871,610 |
| 127,158,707 |
|
|
|
|
|
|
|
| |||||
Total International |
| 50,647,512 |
| 67,546,679 |
| 7,604,278 |
| 7,661,877 |
| 133,460,346 |
|
|
|
|
|
|
|
| |||||
|
|
|
|
|
|
|
|
|
|
|
|
Total debt investment securities |
| 57,482,785 |
| 77,742,469 |
| 12,744,315 |
| 11,776,836 |
| 159,746,405 |
|
|
|
|
|
|
|
| |||||
|
|
|
|
|
|
|
|
|
|
|
|
Yield |
| 5.28 | % | 4.78 | % | 5.65 | % | 5.85 | % | 5.10 | % |
Loan Portfolio
At December 31, 2005, our total loans and advances to customers equaled €443.4 billion (54.8% of our total assets). Net of allowances for credit losses, loans and advances to customers equaled €435.8 billion (53.8% of our total assets). In addition to loans, we had outstanding at December 31, 2001, 2002, 2003, 2004 and 2005, €49.6 billion, €49.1 billion, €48.6 billion, €63.1 billion and €77.7 billion, respectively, of undrawn balances available to third parties (2001, 2002 and 2003 calculated under previous Spanish GAAP).
46
Loans by Geographic Area and Type of Customer
The following tables analyze our loans and advances to customers (including securities purchased under agreement to resell), by domicile and type of customer, at each of the dates indicated (as prepared under IFRS).
|
| (IFRS) |
| ||
|
| At December 31, |
| ||
|
|
| |||
|
| 2004 |
| 2005 |
|
|
|
|
| ||
Borrowers in Spain: |
| (in thousands of euros) |
| ||
Spanish Government |
| 5,741,016 |
| 5,242,938 |
|
Commercial, financial, agricultural and industrial |
| 48,110,367 |
| 54,799,113 |
|
Real estate-construction |
| 5,417,473 |
| 7,834,447 |
|
Real estate-mortgage |
| 53,456,477 |
| 65,940,697 |
|
Installment loans to individuals |
| 11,295,350 |
| 14,343,281 |
|
Lease financing |
| 6,097,620 |
| 7,276,200 |
|
Other |
| 2,764,974 |
| 3,345,467 |
|
|
|
|
| ||
Total |
| 132,883,277 |
| 158,782,143 |
|
|
|
|
|
|
|
Borrowers outside Spain: |
|
|
|
|
|
Governments |
| 5,713,770 |
| 6,608,103 |
|
Banks and other Financial Institutions |
| 17,681,264 |
| 2,109,420 |
|
Commercial and industrial |
| 55,500,956 |
| 108,145,797 |
|
Mortgage loans |
| 144,827,500 |
| 161,147,496 |
|
Other |
| 19,588,512 |
| 6,645,761 |
|
|
|
|
| ||
Total |
| 243,312,002 |
| 284,656,577 |
|
|
|
|
|
|
|
Total loans and advances to customers, gross |
| 376,195,279 |
| 443,438,720 |
|
|
|
|
|
|
|
Allowance for credit losses |
| (6,845,215 | ) | (7,609,925 | ) |
|
|
|
| ||
Loans and advances to customers, net of allowances |
| 369,350,064 |
| 435,828,795 |
|
|
|
|
| ||
47
The table below contains information prepared under previous Spanish GAAP, which is not comparable to information prepared under IFRS. See main differences between both accounting standards in Note 57 to our consolidated financial statements.
|
| (Previous Spanish GAAP) |
| ||||
|
|
| |||||
|
| 2001 |
| 2002 |
| 2003 |
|
|
|
|
|
| |||
|
| (in thousands of euros) |
| ||||
Borrowers in Spain: |
|
|
|
|
|
|
|
Spanish Government |
| 4,249,672 |
| 4,897,118 |
| 5,487,358 |
|
Commercial, financial, |
|
|
|
|
|
|
|
agricultural and industrial |
| 36,024,192 |
| 37,407,850 |
| 40,082,919 |
|
Real estate-construction |
| 3,655,286 |
| 3,537,343 |
| 4,048,386 |
|
Real estate-mortgage |
| 26,999,828 |
| 30,940,525 |
| 41,091,269 |
|
Installment loans to individuals |
| 10,560,897 |
| 10,579,255 |
| 8,894,956 |
|
Lease financing |
| 4,326,669 |
| 4,441,411 |
| 5,198,113 |
|
Other |
| 3,154,829 |
| 1,969,754 |
| 4,199,954 |
|
|
|
|
|
| |||
Total |
| 88,971,373 |
| 93,773,256 |
| 109,002,955 |
|
|
|
|
|
|
|
|
|
Borrowers outside Spain: |
|
|
|
|
|
|
|
Governments |
| 14,180,623 |
| 10,303,475 |
| 5,824,432 |
|
Banks and other Financial Institutions |
| 2,526,301 |
| 726,373 |
| 1,398,685 |
|
Commercial and industrial |
| 38,927,471 |
| 28,371,091 |
| 37,915,142 |
|
Other (1) |
| 34,503,592 |
| 34,736,966 |
| 23,479,482 |
|
|
|
|
|
| |||
Total |
| 90,137,987 |
| 74,137,905 |
| 68,617,741 |
|
|
|
|
|
|
|
|
|
Total loans and credits, gross |
| 179,109,360 |
| 167,911,161 |
| 177,620,696 |
|
|
|
|
|
| |||
|
|
|
|
|
|
|
|
Allowance for credit losses |
| (5,287,314 | ) | (4,938,204 | ) | (5,116,683 | ) |
|
|
|
|
| |||
|
|
|
|
|
|
|
|
Loans and credits, net of allowances |
| 173,822,046 |
| 162,972,957 |
| 172,504,013 |
|
|
|
|
|
| |||
(1) | Of which €16.9 billion, €14.9 billion and €11.9 billion, respectively, at December 31, 2001, 2002 and 2003, are real-estate mortgages. The remaining amount corresponds to other types of customers, with no “loan concentration” as defined by Item III-C of Industry Guide 3. |
At December 31, 2005, our loans and advances to associated companies and jointly controlled entities amounted to €215 million (see “Item 7 —Major Shareholders and Related Party Transactions —B. Related Party Transactions”). Excluding government-related loans and advances, the largest outstanding exposure at December 31, 2005 was €2.4 billion (0.5% of total loans and advances, including government-related loans), and the five next largest exposures totaled €6.3 billion (1.4% of total loans, including government-related loans).
48
Maturity
The following table sets forth an analysis by maturity of our loans and advances to customers by domicile and type of customer at December 31, 2005.
|
| (IFRS) |
| ||||||||||||||
|
|
| |||||||||||||||
|
| Less than |
| One to five |
| Over five |
| Total |
| ||||||||
|
|
|
|
|
| ||||||||||||
|
| Balance % of Total |
| Balance % of Total |
| Balance % of Total |
| Balance % of Total |
| ||||||||
|
|
|
|
|
| ||||||||||||
|
| (in thousands of euros except percentages) |
| ||||||||||||||
Loans to borrowers in Spain: |
|
|
|
|
|
|
|
|
|
|
|
|
|
|
|
|
|
Spanish Government |
| 3,426,738 |
| 2.67 | % | 483,049 |
| 0.56 | % | 1,333,151 |
| 0.58 | % | 5,242,938 |
| 1.18 | % |
Commercial, financial, agricultural and industrial |
| 29,842,042 |
| 23.25 | % | 15,177,649 |
| 17.66 | % | 9,779,422 |
| 4.27 | % | 54,799,113 |
| 12.36 | % |
Real estate: |
|
|
|
|
|
|
|
|
|
|
|
|
|
|
|
|
|
Construction |
| 359,957 |
| 0.28 | % | 1,063,241 |
| 1.24 | % | 6,411,249 |
| 2.80 | % | 7,834,447 |
| 1.77 | % |
Mortgage |
| 6,270,115 |
| 4.88 | % | 4,266,129 |
| 4.96 | % | 55,404,453 |
| 24.18 | % | 65,940,697 |
| 14.87 | % |
Installment loans to individuals |
| 4,920,137 |
| 3.83 | % | 6,036,242 |
| 7.02 | % | 3,386,902 |
| 1.48 | % | 14,343,281 |
| 3.23 | % |
Lease financing |
| 2,423,910 |
| 1.89 | % | 3,956,358 |
| 4.60 | % | 895,932 |
| 0.39 | % | 7,276,200 |
| 1.64 | % |
Other |
| 2,158,030 |
| 1.68 | % | 995,387 |
| 1.16 | % | 192,050 |
| 0.08 | % | 3,345,467 |
| 0.75 | % |
|
|
|
|
|
|
|
|
|
| ||||||||
Total borrowers in Spain |
| 49,400,929 |
| 38.48 | % | 31,978,055 |
| 37.21 | % | 77,403,159 |
| 33.78 | % | 158,782,143 |
| 35.81 | % |
Loans to borrowers outside Spain |
|
|
|
|
|
|
|
|
|
|
|
|
|
|
|
|
|
Governments |
| 1,630,454 |
| 1.27 | % | 3,438,051 |
| 4.00 | % | 1,539,598 |
| 0.67 | % | 6,608,103 |
| 1.49 | % |
Banks and Other Financial Institutions |
| 1,632,618 |
| 1.27 | % | 195,277 |
| 0.23 | % | 281,525 |
| 0.12 | % | 2,109,420 |
| 0.48 | % |
Commercial and Industrial |
| 64,742,709 |
| 50.44 | % | 30,242,080 |
| 35.19 | % | 13,161,008 |
| 5.74 | % | 108,145,797 |
| 24.39 | % |
Mortgage loans |
| 7,451,445 |
| 5.80 | % | 18,153,015 |
| 21.13 | % | 135,543,036 |
| 59.15 | % | 161,147,496 |
| 36.34 | % |
Other |
| 3,509,703 |
| 2.73 | % | 1,923,340 |
| 2.24 | % | 1,212,718 |
| 0.53 | % | 6,645,761 |
| 1.50 | % |
|
|
|
|
|
|
|
|
|
| ||||||||
Total loans to borrowers outside Spain |
| 78,966,929 |
| 61.52 | % | 53,951,763 |
| 62.79 | % | 151,737,885 |
| 66.22 | % | 284,656,577 |
| 64.19 | % |
|
|
|
|
|
|
|
|
|
|
|
|
|
|
|
|
|
|
|
|
|
|
|
|
|
|
|
| ||||||||
Total loans and advances to customers, gross |
| 128,367,858 |
| 100.00 | % | 85,929,818 |
| 100.00 | % | 229,141,044 |
| 100.00 | % | 443,438,720 |
| 100.00 | % |
|
|
|
|
|
|
|
|
|
| ||||||||
Fixed and Variable Rate Loans
The following table sets forth a breakdown of our fixed and variable rate loans having a maturity of more than one year at December 31, 2005.
|
| Loans having a maturity of more than one year |
| ||||
|
|
| |||||
|
| Domestic |
| International |
| Total |
|
|
|
|
|
| |||
|
| (in thousands of euros) |
| ||||
Fixed rate |
| 15,585,953 |
| 77,421,828 |
| 93,007,781 |
|
Variable rate |
| 93,795,261 |
| 128,267,820 |
| 222,063,081 |
|
|
|
|
|
|
|
|
|
|
|
|
|
| |||
Total |
| 109,381,214 |
| 205,689,648 |
| 315,070,862 |
|
|
|
|
|
| |||
49
Cross-Border Outstandings
The following table sets forth, as of the end of the years indicated, the aggregate amount of our cross-border outstandings (which consist of loans, interest-bearing deposits with other banks, acceptances and other monetary assets denominated in a currency other than the home-country currency of the office where the item is booked) where outstandings in the borrower’s country exceeded 0.75% of our total assets. Cross-border outstandings do not include local currency loans made by subsidiary banks in other countries to the extent that such loans are funded in the local currency or hedged. As a result, they do not include the vast majority of the loans by Abbey or our Latin American subsidiaries.
|
| (IFRS) |
| ||||||
Cross-Border Outstandings |
| 2004 |
| 2005 |
| ||||
|
|
| |||||||
|
| (in thousands of euros except percentages) |
| ||||||
|
|
|
| % of total |
|
|
| % of total |
|
|
|
|
|
|
|
|
| ||
OECD Countries: (1) |
|
|
|
|
|
|
|
|
|
France |
| 1,982,782 |
| 0.34 | % | 22,992,147 |
| 2.84 | % |
Germany |
| 2,449,377 |
| 0.43 | % | 19,405,650 |
| 2.40 | % |
United Kingdom |
| 5,411,129 |
| 0.94 | % | 15,492,849 |
| 1.91 | % |
United States |
| 12,021,223 |
| 2.09 | % | 11,797,617 |
| 1.46 | % |
Italy |
| 1,171,670 |
| 0.20 | % | 2,539,602 |
| 0.31 | % |
Ireland |
| 7,989,843 |
| 1.39 | % | 841,519 |
| 0.10 | % |
Other OECD Countries (2) |
| 3,279,864 |
| 0.57 | % | 7,610,573 |
| 0.94 | % |
|
|
|
|
|
| ||||
Total OECD |
| 34,305,888 |
| 5.96 | % | 80,679,957 |
| 9.96 | % |
|
|
|
|
|
|
|
|
|
|
Non-OECD Countries |
|
|
|
|
|
|
|
|
|
Latin American Countries (2) (3) |
| 4,310,301 |
| 0.75 | % | 8,937,626 |
| 1.10 | % |
Other (2) |
| 3,982,155 |
| 0.69 | % | 4,670,386 |
| 0.58 | % |
|
|
|
|
|
| ||||
Total Non-OECD |
| 8,292,456 |
| 1.44 | % | 13,608,012 |
| 1.68 | % |
Total |
| 42,598,344 |
| 7.40 | % | 94,287,969 |
| 11.64 | % |
|
|
|
|
|
| ||||
Cross-Border Outstandings |
| (Previous Spanish GAAP) |
| ||
|
|
| |||
|
| (in thousands of euros except percentages) |
| ||
|
|
|
|
|
|
|
|
|
| % of total |
|
|
|
|
|
| |
OECD Countries: (1) |
|
|
|
|
|
France |
| 4,604,918 |
| 1.31 | % |
Germany |
| 8,025,373 |
| 2.28 | % |
United Kingdom |
| 6,734,066 |
| 1.91 | % |
United States |
| 8,646,986 |
| 2.46 | % |
Italy |
| 2,769,619 |
| 0.79 | % |
Ireland |
| 2,012,356 |
| 0.57 | % |
Other OECD Countries (2) |
| 6,741,597 |
| 1.92 | % |
|
|
|
| ||
Total OECD |
| 39,534,915 |
| 11.24 | % |
Non-OECD Countries |
|
|
|
|
|
Latin American Countries (2) (3) |
| 5,803,880 |
| 1.65 | % |
Other (2) |
| 3,815,278 |
| 1.08 | % |
|
|
|
| ||
Total Non-OECD |
| 9,619,158 |
| 2.73 | % |
Total |
| 49,154,073 |
| 13.97 | % |
|
|
|
| ||
(1) | The Organization for Economic Cooperation and Development. |
(2) | Aggregate outstandings in any single country in this category do not exceed 0.75% of our total assets. |
(3) | With regards to these cross-border outstandings, at December 31, 2003, 2004 and 2005, we had allowances for country-risk equal to €404.9 (calculated under previous Spanish GAAP), €83.3, and €281.4 million, respectively. Such allowances for country-risk exceeded the Bank of Spain’s minimum requirements at such dates. |
50
The following table sets forth the amounts of our cross-border outstandings as of December 31 of each year by type of borrower where outstandings in the borrower’s country exceeded 0.75% of total assets.
|
|
|
| Banks and other |
| Commercial and |
|
|
|
|
| Governments |
| Financial Institutions |
| Industrial |
| Total |
|
|
|
|
|
|
| ||||
|
| (in thousands of euros) |
| ||||||
2003 (Previous Spanish GAAP) |
|
|
|
|
|
|
|
|
|
United States |
| 349,739 |
| 4,407,801 |
| 3,889,446 |
| 8,646,986 |
|
Germany |
| 4,820,845 |
| 2,868,810 |
| 335,718 |
| 8,025,373 |
|
United Kingdom |
| 14,751 |
| 5,191,399 |
| 1,527,916 |
| 6,734,066 |
|
France |
| 2,612,000 |
| 1,619,706 |
| 373,212 |
| 4,604,918 |
|
Italy |
| 2,245,866 |
| 345,008 |
| 178,745 |
| 2,769,619 |
|
|
|
|
|
|
| ||||
Total |
| 10,043,201 |
| 14,432,724 |
| 6,305,037 |
| 30,780,962 |
|
|
|
|
|
|
| ||||
2004 (IFRS) |
|
|
|
|
|
|
|
|
|
United States |
| 26,902 |
| 11,481,187 |
| 513,134 |
| 12,021,223 |
|
Ireland |
| — |
| 30,915 |
| 7,958,928 |
| 7,989,843 |
|
United Kingdom |
| 12,558 |
| 4,990,900 |
| 407,671 |
| 5,411,129 |
|
|
|
|
|
|
| ||||
Total |
| 39,460 |
| 16,503,002 |
| 8,879,733 |
| 25,422,195 |
|
|
|
|
|
|
| ||||
2005 (IFRS) |
|
|
|
|
|
|
|
|
|
France |
| 15,000,031 |
| 6,695,742 |
| 1,296,374 |
| 22,992,147 |
|
Germany |
| 15,020,893 |
| 4,053,190 |
| 331,567 |
| 19,405,650 |
|
United Kingdom |
| 144 |
| 13,113,700 |
| 2,379,005 |
| 15,492,849 |
|
United States |
| 152,942 |
| 9,131,079 |
| 2,513,596 |
| 11,797,617 |
|
|
|
|
|
|
| ||||
Total |
| 30,174,010 |
| 32,993,711 |
| 6,520,542 |
| 69,688,263 |
|
|
|
|
|
|
| ||||
Classified Assets
In the following pages, we describe Bank of Spain requirements for classification of non-performing assets and credit loss recognition. Unlike under U.S. GAAP, Bank of Spain regulations establish a credit loss recognition process that is independent of the process for balance sheet classification and removal of impaired loans from the balance sheet. In Notes 58.2 and 58.3 to our consolidated financial statements, we include a summary of significant valuation and income recognition differences under IFRS and U.S. GAAP and a net income and stockholders’ equity reconciliation.
The description below sets forth the minimum requirements that are followed and applied by all of our subsidiaries. Nevertheless, if the regulatory authority of the country where a particular subsidiary is located imposes stricter or more conservative requirements, the more strict or conservative requirements are followed.
The classification described below applies to all debt instruments not measured at fair value through profit or loss, and to contingent liabilities.
51
Bank of Spain Classification Requirements
a) Standard Assets
Standard assets include loans, fixed-income securities, guarantees and certain other extensions of credit that are not classified in any other category. Under this category, assets that require special watch should be identified, including restructured loans and standard assets with clients that have other outstanding risks classified as Non-performing Past Due. Standard assets are subdivided as follows:
(i) Negligible risk
• | All types of credits made to, or guaranteed by, any European Union country or certain other specified public entities of the countries classified in category 1 of the country-risk categories; |
• | Advance payments for pensions or payrolls for the following month, when paid by any public entity and deposited at Santander; |
• | Those credits guaranteed by public entities of the countries classified in category 1 of the country-risk categories whose principal activity is to provide guarantees; |
• | Credits made to banks; |
• | Credits personally, jointly and unconditionally secured by banks or mutual guaranty companies payable on first demand; |
• | Credits secured under the name of the “Fondo de Garantía de Depósitos” if their credit risk quality is comparable with that of the European Union; or |
• | All credits collateralized by cash or by money market and treasury funds or securities issued by the central administrations or credit entities of countries listed in category 1 for country-risk purposes when the outstanding exposure is 90% or less than the redemption value of the money market and treasury funds and of the market value of the securities given as collateral. |
(ii) Low risk
Assets in this category include:
• | assets qualified as a guaranty for monetary policy transactions in the European System of Central Banks, except those included in (i) above; |
• | fully-secured mortgages and financial leases on finished residential properties when outstanding risk is less than 80% of the appraised value of such property; |
• | ordinary mortgage backed securities; |
• | assets from entities whose long term debt is rated “A” or better by a qualified rating agency; and |
• | securities denominated in local currency and issued by government entities in countries other than those classified in category 1 of the country-risk categories, when such securities are registered in the books of the bank’s branch located in the issuer country. |
(iii) Medium-low risk
Assets in this category include financial leases and mortgages and pledges on tangible assets that are not included in other categories, provided that the estimated value of the financial leases and the collateral totally covers the outstanding risk.
(iv) Medium risk
Assets in this category include those with Spanish residents or residents of countries classified in categories 1 or 2, provided that such assets are not included in other categories.
52
(v) Medium-high risk
Assets in this category include loans to individuals for the acquisition of durable consumption goods, other goods or current services not for professional use, except those registered in the Registry of Sales of Movable Assets (“Registro de Ventas de Bienes Muebles”); and risks with residents of countries classified in categories 3 to 6, to the extent not covered by country-risk allowances.
(vi) High risk
Assets in this category include credit card balances; current account overdrafts and excesses in credit accounts (except those included in categories (i) and (ii)).
b) Sub-standard Assets
This category includes all types of credits and off-balance sheet risks that cannot be classified as non performing or charged-off assets but that have certain weaknesses that may result in losses for the bank higher than those described in the previous category. Credits and off-balance sheet risks with insufficient documentation must also be classified under this category.
c) Non-Performing Past-Due Assets
The Bank of Spain requires Spanish banks to classify as non-performing the entire outstanding principal amount of an accrued interest on any loan, fixed-income security, guarantee and certain other extensions of credit on which any payment of principal or interest is 90 days or more past due (“non-performing past-due assets”).
In relation to the aggregate risk exposure (including off-balance sheet risks) to a single obligor, if the amount of non-performing balances exceeds 25% of the total outstanding risks (excluding non-accrued interest on loans to such borrower), then the bank must classify all outstanding risks to such borrower as non-performing.
Once any portion of a loan is classified as non-performing, the entire loan is placed on a non-accrual status. Accordingly, even the portion of any such a loan which may still be identified as performing will be recorded on non-accrual status.
d) Other Non-Performing Assets
The Bank of Spain requires Spanish banks to classify any loan, fixed-income security, guarantee and certain other extensions of credit as non-performing if they have a reasonable doubt that these extensions of credit will be collected (“other non-performing assets”), even if any past due payments have been outstanding for less than 90 days or the asset is otherwise performing. When a bank classifies an asset as non-performing on this basis, it must classify the entire principal amount of the asset as non-performing.
Once any of such assets is classified as non-performing, it is placed on a non-accrual status.
e) Charged off assets
Credit losses are generally recognized through provisions to allowances for credit losses, well before the removal from the balance sheet. Under certain unusual circumstances (such as bankruptcy, insolvency, etc.), the loss could be directly recognized through write-offs.
The Bank of Spain requires Spanish banks to charge-off immediately those non-performing assets that management believes will never be repaid. Otherwise, the Bank of Spain requires Spanish banks to charge-off non-performing assets four years after they were classified as non-performing. Accordingly, even if allowances have been established equal to 100% of a non-performing asset (in accordance with the Bank of Spain criteria discussed below), the Spanish bank may maintain that non-performing asset, fully provisioned, on its balance sheet for the full four-year period if management believes based on objective factors that there is some possibility of recoverability of that asset.
These classification criteria differ from U.S. GAAP requirements, but do not generate balance sheet presentation differences, since loans are always presented net of their allowances.
Because the Bank of Spain does not permit partial write-offs of impaired loans, when a loan is deemed partially uncollectible, the credit loss is charged against earnings through provisions to credit allowances instead of through partial write-offs of the loan. If a loan becomes entirely uncollectible, its allowance is increased until it reaches 100% of the loan balance. Generally, credit loss recognition under IFRS is similar in amounts and in time to credit loss recognition under U.S. GAAP.
53
The credit loss recognition process is independent of the process for the removal of impaired loans from the balance sheet. The entire loan balance is kept on the balance sheet until any portion of it has been classified as non-performing for 4 years, or up to 6 years for some secured mortgage loans (maximum period established in the Bank of Spain regulations), depending on our management’s view as to the recoverability of the loan. After that period the loan balance and its 100% specific allowance are removed from the balance sheet and recorded in off-balance sheet accounts, with no resulting impact on net income at that time. Under U.S. GAAP, this loan would be removed from the balance sheet earlier.
Country-Risk Outstandings
The Bank of Spain requires Spanish banks to classify as country-risk outstandings all loans, fixed-income securities and other outstandings to any countries, or residents of countries, that the Bank of Spain has identified as being subject to transfer risk or sovereign risk and the remaining risks derived from the international financial activity.
All outstandings should be assigned to the country of residence of the client except in the following cases:
• | Outstandings guaranteed by residents in other countries in a better category should be classified in the category of the guarantor. |
• | Fully secured loans, when the guaranty covers sufficiently the outstanding risk and can be sold in Spain or in any other “category 1” country, should be classified as category 1. |
• | Outstanding risks with foreign branches of a bank should be classified according to the residence of the headquarters of those branches. |
The Bank of Spain has established six categories to classify such countries, as shown in the following table:
Country-Risk Categories |
| Description |
| ||
1 |
| Countries in which risks are negotiable in primary or secondary markets |
2 |
| Countries included in no other category |
3 |
| Countries with transitory difficulties |
4 |
| Countries with serious difficulties |
5 |
| Doubtful countries |
6 |
| Bankrupt countries |
The Bank of Spain allows each bank to decide how to classify the listed countries within this classification scheme, subject to the Bank of Spain’s oversight. The classification is made based on criteria such as the payment record (in particular, compliance with renegotiation agreements), the level of the outstanding debt and of the charges for debt services, the debt quotations in the international secondary markets and other indicators and factors of each country as well as all the criteria indicated by the Bank of Spain. All credit extensions and off-balance sheet risks included in country-risk categories 3 to 6, except the excluded cases described below, will be classified as follows:
• | Sub-standard assets: All outstandings in categories 3 and 4 except when they should be classified as non-performing or charged-off assets due to credit risk attributable to the client. |
• | Non-performing assets: All outstandings in category 5 and off-balance sheet risks classified in category 6, except when they should be classified as non-performing or charged-off assets due to credit risk attributable to the client. |
• | Charged-off assets: All other outstandings in category 6 and all others that should be classified as non-performing or charged-off assets due to credit risk attributable to the client. |
The Bank of Spain excludes from country-risk outstandings:
• | risks with residents in a country regardless of the currency of denomination registered in subsidiary companies or multigroup companies in the country of residence of the holder; |
• | any trade credits established by letter of credit or documentary credit with a due date of one year or less after the drawdown date; |
54
| • | any interbank obligations of branches of foreign banks in the European Economic Space and of the Spanish branches of foreign banks; |
| • | private sector risks in countries included in the monetary zone of a currency issued by a country classified in category 1; and |
| • | any negotiable financial assets purchased at market prices for placement with third parties within the framework of a portfolio separately managed for that purpose, held for less than six months by the company. |
Non-Accrual of Interest Requirements
According to IFRS and Bank of Spain requirements, we stop accruing interest on the entire principal amount of any asset that is classified as an impaired asset and on category 3 (transitory difficulties), category 4 (serious difficulties), category 5 (doubtful) and category 6 (bankrupt) country-risk outstandings, whether or not they are classified as impaired. The banks must account for such collected interest on a cash basis, recording interest payments as interest income when collected.
The following table shows the amount of interest owed on non-accruing assets and the amount of such interest that was received:
|
| (IFRS) |
| ||
|
|
| |||
|
| 2004 |
| 2005 |
|
|
|
|
| ||
|
| (in thousands of euros) |
| ||
Interest owed on non-accruing assets |
|
|
|
|
|
Domestic |
| 36,273 |
| 38,751 |
|
International |
| 184,090 |
| 273,834 |
|
|
|
|
| ||
Total |
| 220,363 |
| 312,585 |
|
Interest received on non-accruing assets |
|
|
|
|
|
Domestic |
| 83,535 |
| 79,183 |
|
International |
| 105,273 |
| 77,602 |
|
|
|
|
| ||
Total |
| 188,808 |
| 156,785 |
|
Guarantees
The Bank of Spain requires some guarantees to be classified as non-performing in the following amounts:
| • | in cases involving past-due guaranteed debt: (i) for non-financial guarantees, the amount demanded by the beneficiary and outstanding under the guarantee; and (ii) for financial guarantees, at least the amount classified as non-performing of the guaranteed risk; and |
| • | in all other cases, the entire amount of the guaranteed debt when the debtor has declared bankruptcy or has demonstrated serious solvency problems, even if the guaranteed beneficiary has not reclaimed payment. |
Bank of Spain Allowances for Credit Losses and Country-Risk Requirements
The Bank of Spain requires that we calculate simultaneously the allowances required due to credit risk attributable to the client and to country-risk and apply the ones that are more demanding.
The Bank of Spain requires that we develop internal models to calculate the allowances for both credit risk and country-risk based on historical experience. While these models are not yet approved by the Bank of Spain, we are required to calculate the allowances according to the instructions described below.
The global allowances will be the sum of those corresponding to losses in specific transactions (Specific Allowances) and those not specifically assigned (General Allowance) due to credit risk, plus the Allowances for Country-Risk.
55
Specific Allowances for Credit Losses
The specific allowance is calculated based on the loan recovery expectations and, at a minimum, by application of the coefficients stipulated in the following tables.
Non-Performing Past-Due Assets. Except for fully secured past-due mortgage assets and financial leases on certain types of properties, the Bank of Spain requires Spanish banks to set aside specific allowances for non-performing past-due assets. The minimum required allowance is the product of the amount of the asset treated as non-performing (see “Bank of Spain Classification Requirements—Non-Performing Past-Due Assets” above) times the percentages set forth in the following table. The allowance must be maintained for so long as the non-performing portion of the asset is carried as an asset on the banks’ balance sheets.
|
| Allowance |
| ||
|
|
| |||
Period Overdue |
| Companies |
| Other clients |
|
|
|
| |||
3-6 months |
| 5.3 | % | 4.5 | % |
6-12 months |
| 27.8 | % | 27.4 | % |
12-18 months |
| 65.1 | % | 60.5 | % |
18-24 months |
| 95.8 | % | 93.3 | % |
More than 24 months |
| 100 | % | 100 | % |
Fully-Secured Non-Performing Past-Due Mortgage Assets and financial leases on certain types of properties. If a non-performing asset is a fully secured non-performing past-due mortgage or a financial lease and certain conditions are met, the amount of the required allowance is the product of the amount of such asset times the percentages set forth in the following table. Such asset must satisfy three conditions: first, the asset is secured by a mortgage or a right of ownership (in case of a financial lease) on a finished residential property; second, such mortgage or right of ownership was placed on the property at the time the extension of credit was made; and third, the outstanding risk does not exceed 80% of the appraisal value of such mortgaged or leased property.
Period Overdue |
| Allowance |
|
|
| ||
3 months-3 years |
| 2 | % |
3-4 years |
| 25 | % |
4-5 years |
| 50 | % |
5-6 years |
| 75 | % |
More than 6 years |
| 100 | % |
The only exception to these requirements is that when a bank treats otherwise performing assets to a single borrower as non-performing because non-performing assets exceed 25% of the bank´s total exposure to the borrower as set forth in “Bank of Spain Classification Requirements—Non-Performing Past-Due Assets” above, the Bank of Spain requires the bank to carry an allowance of 1% against any asset that has no overdue principal or interest payments.
Other Fully-Secured Non-Performing Past-Due Assets. For Non-Performing Past-Due Assets fully secured with properties other than those described in the previous paragraphs, the amount of the required allowance is the product of the amount of such asset times the percentages set forth in the following table:
|
| Allowance |
| ||
|
|
| |||
Period Overdue |
| Companies |
| Other clients |
|
|
|
| |||
3-6 months |
| 4.5 | % | 3.8 | % |
6-12 months |
| 23.6 | % | 23.3 | % |
12-18 months |
| 55.3 | % | 47.2 | % |
18-24 months |
| 81.4 | % | 79.3 | % |
More than 24 months |
| 100 | % | 100 | % |
Other Non-Performing Assets. If a non-performing asset is an “other non-performing asset”, see “Item 4. Information on the Company—B. Business Overview—Bank of Spain Classification Requirements—Other Non-Performing Assets”, the amount of the required allowance will be the difference between the amount outstanding and the current value of the expected collectable cash flows. The minimum allowance will be 25% and up to 100% of the amounts treated as non-performing, depending on management’s opinion of the loan recovery expectations. When the treatment of such asset as a non-performing asset is due to, in management’s opinion, an inadequate financial or economical condition of the borrower, and the amount estimated as non-collectible is less than 25% of the outstanding debt, the amount of the required allowance will be at least 10% of the outstanding debt.
56
Sub-standard Assets. The necessary allowance for assets classified in this category is determined as the difference between its outstanding balance and the current value of the expected collectable cash flows. In every case, the amount of the required allowance must be higher than the general allowance that would correspond in case of being classified as standard asset and lower than would correspond if classified as non-performing asset. When assets are classified as sub-standard due to insufficient documentation and being the outstanding balance higher than €25,000, the applicable allowance is 10%.
General Allowance
In addition to the Bank of Spain specific allowance requirements, the Bank of Spain requires Spanish banks to set aside a general allowance for the coverage of all types of credits and off-balance sheet risks classified as standard, calculated with statistical methods based on the experience of deterioration of the portfolio.
Allowances for Country-Risk
The Bank of Spain requires Spanish banks to set aside an allowance for country-risk on all country-risk outstandings. See the above sub-section entitled “Bank of Spain Classification Requirements—Country-Risk Outstandings”. The amount of the required provision is the product of the amount of the outstanding loans and credits and off-balance sheet risks times the percentages set forth in the following table.
Categories: |
| Minimum percentage of coverage |
|
|
| ||
Category 3 |
| 10.1 | % |
Category 4 |
| 22.8 | % |
Category 5 |
| 83.5 | % |
Category 6 |
| 100 | % |
Guarantees
Allowances for non-performing guarantees will be equal to the amount that, with a prudent criterion, is considered irrecoverable.
Bank of Spain Foreclosed Assets Requirements
If a Spanish bank eventually acquires the properties (residential or not) that are securing loans or credits, the Bank of Spain requires that the credit risk allowances previously established be reversed, provided that the acquisition cost less the estimated selling costs (which shall be at least 30% of such value) exceeds the amount of the debt disregarding allowances, unless the acquisition cost is greater than the mortgage value, in which case the latter shall be taken as reference value.
Bank of Spain Charge-off Requirements
The Bank of Spain does not permit non-performing assets to be partially charged-off.
The Bank of Spain requires Spanish banks to charge-off immediately those non-performing assets that management believes will never be repaid or that were made to category 6 (“bankrupt”) countries or residents of such category 6 countries. See the above sub-section entitled “Item 4. Information on the Company—B. Business Overview—Bank of Spain Classification Requirements—Country-Risk Outstandings”. Otherwise, the Bank of Spain requires Spanish banks to charge-off non-performing assets four years after they were classified as non-performing. Spanish banks may carry fully secured past-due mortgage loans beyond this four-year deadline for up to six years if there are objective factors that indicate an improved likelihood of recovery. Accordingly, even if allowances have been established equal to 100% of a non-performing asset (in accordance with the Bank of Spain criteria discussed above), the Spanish bank may maintain that non-performing asset, fully provisioned, on its balance sheet for the full four or six-year period if management believes based on objective factors that there is some possibility of recoverability of that asset.
57
Movements in Allowances for Credit Losses
The following table analyzes movements in our allowances for credit losses and movements, by domicile of customer, for the years indicated. See “Presentation of Information”. For further discussion of movements in the allowances for credit losses, see “Item 5. Operating and Financial Review and Prospects—A. Operating Results—Net Provisions for Credit Losses”.
|
| (IFRS) |
| ||
| |||||
|
| 2004 |
| 2005 |
|
| |||||
|
| (in thousands of euros) |
| ||
Allowance for credit losses at beginning of year (1) |
|
|
|
|
|
Borrowers in Spain |
| 1,849,001 |
| 2,836,564 |
|
Borrowers outside Spain |
| 3,172,452 |
| 4,160,864 |
|
| |||||
Total |
| 5,021,453 |
| 6,997,428 |
|
| |||||
Inclusion of acquired companies’ credit loss allowances |
|
|
|
|
|
Borrowers in Spain |
| 1,972 |
| — |
|
Borrowers outside Spain |
| 1,044,042 |
| 4,006 |
|
| |||||
Total |
| 1,046,014 |
| 4,006 |
|
| |||||
Recoveries of loans previously charged-off (2) |
|
|
|
|
|
Borrowers in Spain |
| 145,591 |
| 105,800 |
|
Borrowers outside Spain |
| 259,777 |
| 381,217 |
|
| |||||
Total |
| 405,368 |
| 487,017 |
|
| |||||
Net provisions for credit losses (2) |
|
|
|
|
|
Borrowers in Spain |
| 868,520 |
| 746,519 |
|
Borrowers outside Spain |
| 713,220 |
| 1,009,527 |
|
| |||||
Total |
| 1,581,740 |
| 1,756,046 |
|
| |||||
Charge-offs against credit loss allowance (2) |
|
|
|
|
|
Borrowers in Spain |
| (344,392 | ) | (226,036 | ) |
Borrowers outside Spain |
| (681,036 | ) | (1,293,458 | ) |
| |||||
Total |
| (1,025,428 | ) | (1,519,494 | ) |
| |||||
Other movements (3) |
| (31,719 | ) | 31,672 |
|
Allowance for credit losses at end of year |
|
|
|
|
|
Borrowers in Spain |
| 2,836,564 |
| 3,664,349 |
|
Borrowers outside Spain |
| 4,160,864 |
| 4,092,326 |
|
| |||||
Total |
| 6,997,428 |
| 7,756,675 |
|
| |||||
(1) | Opening balances for 2004 include IFRS First Application adjustments and therefore are not the same as closing balances for 2003. |
(2) | We have not included separate line items for charge-offs of loans not previously provided for (loans charged-off against income) and recoveries of loans previously charged-off as these are not permitted under IFRS. |
(3) | The shift in “Other Movements” from 2003 to 2004, and to 2005 principally reflects foreign exchange differences. |
58
The table below contains information prepared under previous Spanish GAAP which is not comparable to information prepared under IFRS.
|
| (Previous Spanish GAAP) |
| ||||
|
|
| |||||
|
| 2001 |
| 2002 |
| 2003 |
|
|
|
|
|
| |||
| (in thousands of euros) |
| |||||
Allowance for credit losses at beginning of year | |||||||
Borrowers in Spain |
| 1,360,253 |
| 1,771,321 |
| 1,725,606 |
|
Borrowers outside Spain |
| 4,290,217 |
| 3,811,553 |
| 3,438,672 |
|
|
|
|
|
| |||
Total |
| 5,650,470 |
| 5,582,874 |
| 5,164,278 |
|
|
|
|
|
| |||
Inclusion of acquired companies’ credit loss allowances |
|
|
|
|
|
|
|
Borrowers in Spain |
| — |
| — |
| — |
|
Borrowers outside Spain |
| 108 |
| 9,034 |
| — |
|
|
|
|
|
| |||
Total |
| 108 |
| 9,034 |
| — |
|
|
|
|
|
| |||
Loans charged-off against income (1) |
|
|
|
|
|
|
|
Borrowers in Spain |
| (13,258 | ) | (14,921 | ) | (12,729 | ) |
Borrowers outside Spain |
| (40,040 | ) | (117,474 | ) | (91,110 | ) |
|
|
|
|
| |||
Total |
| (53,298 | ) | (132,395 | ) | (103,839 | ) |
|
|
|
|
| |||
Recoveries of loans previously charged-off (1) |
|
|
|
|
|
|
|
Borrowers in Spain |
| 151,845 |
| 141,850 |
| 108,722 |
|
Borrowers outside Spain |
| 341,760 |
| 251,804 |
| 248,765 |
|
|
|
|
|
| |||
Total |
| 493,605 |
| 393,654 |
| 357,487 |
|
|
|
|
|
| |||
Net provisions for credit losses (1) |
|
|
|
|
|
|
|
Borrowers in Spain |
| 499,982 |
| 318,656 |
| 681,234 |
|
Borrowers outside Spain |
| 1,086,035 |
| 1,329,536 |
| 814,453 |
|
|
|
|
|
| |||
Total |
| 1,586,017 |
| 1,648,192 |
| 1,495,687 |
|
|
|
|
|
| |||
Charge-offs against credit loss allowance |
|
|
|
|
|
|
|
Borrowers in Spain |
| (205,498 | ) | (249,757 | ) | (259,366 | ) |
Borrowers outside Spain |
| (1,821,549 | ) | (1,223,617 | ) | (811,719 | ) |
|
|
|
|
| |||
Total |
| (2,027,047 | ) | (1,473,374 | ) | (1,071,085 | ) |
|
|
|
|
| |||
Other movements (2) |
| (66,981 | ) | (863,707 | ) | (428,132 | ) |
Allowance for credit losses at end of year |
|
|
|
|
|
|
|
Borrowers in Spain |
| 1,771,321 |
| 1,725,606 |
| 1,681,017 |
|
Borrowers outside Spain |
| 3,811,553 |
| 3,438,672 |
| 3,733,379 |
|
|
|
|
|
| |||
Total |
| 5,582,874 |
| 5,164,278 |
| 5,414,396 |
|
|
|
|
|
| |||
(1) | We have included separate line items for charge-offs of loans not previously provided for (loans charged-off against income) and recoveries of loans previously charged-off in order to satisfy the SEC’s requirement to show all charge-offs and recoveries in this table. We have increased provisions for credit losses for purposes of this table by the amount of charge-offs of loans not previously provided for and decreased it by the amount of recoveries of loans previously provided for to produce the line item “net provisions for credit losses” in this table. This has also allowed the figures for net provisions for credit losses in this table to match the amounts recorded under “Write-offs and credit loss provisions (net)” in our Consolidated Income Statement. |
(2) | The shift in “Other Movements” from 2001 to 2002, and to 2003 principally reflects foreign exchange differences. |
59
The table below shows a breakdown of recoveries, net provisions and charge-offs against credit loss allowance by type and domicile of borrower for the years indicated.
|
| (IFRS) |
| ||
|
|
| |||
|
| 2004 |
| 2005 |
|
|
|
|
| ||
| (in thousands of euros) |
| |||
Recoveries of loans previously charged off- | |||||
Domestic: |
|
|
|
|
|
Commercial, financial, agricultural, industrial |
| 60,113 |
| 51,649 |
|
Real estate-construction |
| 2,488 |
| 140 |
|
Real estate-mortgage |
| 24,799 |
| 5,226 |
|
Installment loans to individuals |
| 44,340 |
| 32,303 |
|
Lease finance |
| 4,050 |
| 2,903 |
|
Other |
| 9,800 |
| 13,579 |
|
|
|
|
| ||
Total Borrowers in Spain |
| 145,591 |
| 105,800 |
|
Borrowers outside Spain |
|
|
|
|
|
Government and official institutions |
| 1,958 |
| 1 |
|
Bank and other financial institutions |
| 10,373 |
| 1,691 |
|
Commercial and industrial |
| 141,324 |
| 292,279 |
|
Mortgage loans |
| 8,288 |
| 3,468 |
|
Other |
| 97,834 |
| 83,778 |
|
|
|
|
| ||
Borrowers outside Spain |
| 259,777 |
| 381,217 |
|
|
|
|
| ||
Total |
| 405,368 |
| 487,017 |
|
|
|
|
| ||
Net provisions for credit losses- |
|
|
|
|
|
Domestic: |
|
|
|
|
|
Commercial, financial, agricultural, industrial |
| 333,801 |
| 296,879 |
|
Real estate-construction |
| (621 | ) | 49,925 |
|
Real estate-mortgage |
| 46,016 |
| 62,526 |
|
Installment loans to individuals |
| 121,574 |
| 161,027 |
|
Lease finance |
| 22,977 |
| 19,838 |
|
Other |
| 344,774 |
| 156,324 |
|
|
|
|
| ||
Total Borrowers in Spain |
| 868,520 |
| 746,519 |
|
Borrowers outside Spain |
|
|
|
|
|
Government and official institutions |
| (5,085 | ) | 16,836 |
|
Bank and other financial institutions |
| 46,117 |
| 1,698 |
|
Commercial and industrial |
| 472,200 |
| 829,058 |
|
Mortgage loans |
| 64,375 |
| 88,812 |
|
Other |
| 135,613 |
| 73,123 |
|
|
|
|
| ||
Borrowers outside Spain |
| 713,220 |
| 1,009,527 |
|
|
|
|
| ||
Total |
| 1,581,740 |
| 1,756,046 |
|
|
|
|
| ||
Charge offs against credit loss allowance |
|
|
|
|
|
Domestic: |
|
|
|
|
|
Commercial, financial, agricultural, industrial |
| (158,248 | ) | (113,357 | ) |
Real estate-construction |
| (667 | ) | (8 | ) |
Real estate-mortgage |
| (36,253 | ) | (14,674 | ) |
Installment loans to individuals |
| (113,652 | ) | (67,554 | ) |
Lease finance |
| (2,249 | ) | (8,007 | ) |
Other |
| (33,323 | ) | (22,436 | ) |
|
|
|
| ||
Total Borrowers in Spain |
| (344,392 | ) | (226,036 | ) |
Borrowers outside Spain |
|
|
|
|
|
Government and official institutions |
| (1,706 | ) | 0 |
|
Bank and other financial institutions |
| (85,339 | ) | (86 | ) |
Commercial and industrial |
| (551,804 | ) | (1,120,180 | ) |
Mortgage loans |
| (4,923 | ) | (30,562 | ) |
Other |
| (37,265 | ) | (142,630 | ) |
|
|
|
| ||
Borrowers outside Spain |
| (681,036 | ) | (1,293,458 | ) |
|
|
|
| ||
Total |
| (1,025,428 | ) | (1,519,494 | ) |
|
|
|
| ||
60
The table below contains information prepared under previous Spanish GAAP which is not comparable to information prepared under IFRS.
|
| (Previous Spanish GAAP) |
| ||||
|
|
| |||||
|
| 2001 |
| 2002 |
| 2003 |
|
|
|
|
|
| |||
|
| (in thousands of euros) |
| ||||
Loans charged off against income- |
|
|
|
|
|
|
|
Borrowers in Spain: |
|
|
|
|
|
|
|
Commercial, financial, agricultural, industrial |
| (1,655 | ) | (685 | ) | (2,917 | ) |
Real estate-construction |
| (6 | ) | (4 | ) | (3 | ) |
Real estate-mortgage |
| (347 | ) | (465 | ) | (1,042 | ) |
Installment loans to individuals |
| (222 | ) | (10,927 | ) | (7,763 | ) |
Lease finance |
| (3,409 | ) | (2,491 | ) | (992 | ) |
Other |
| (7,619 | ) | (349 | ) | (12 | ) |
|
|
|
|
| |||
Total Borrowers in Spain |
| (13,258 | ) | (14,921 | ) | (12,729 | ) |
Borrowers outside Spain |
|
|
|
|
|
|
|
Government and official institutions |
| — |
| — |
| — |
|
Bank and other financial institutions |
| — |
| — |
| (2,762 | ) |
Commercial and industrial |
| (36,664 | ) | (71,433 | ) | (15,384 | ) |
Other |
| (3,376 | ) | (46,041 | ) | (72,964 | ) |
|
|
|
|
| |||
Total borrowers outside Spain |
| (40,040 | ) | (117,474 | ) | (91,110 | ) |
|
|
|
|
| |||
Total |
| (53,298 | ) | (132,395 | ) | (103,839 | ) |
|
|
|
|
| |||
Recoveries of loans previously charged off- |
|
|
|
|
|
|
|
Domestic: |
|
|
|
|
|
|
|
Commercial, financial, agricultural, industrial |
| 23,662 |
| 58,131 |
| 47,069 |
|
Real estate-construction |
| 2,163 |
| 478 |
| 425 |
|
Real estate-mortgage |
| 36,695 |
| 24,847 |
| 15,164 |
|
Installment loans to individuals |
| 33,387 |
| 38,117 |
| 35,389 |
|
Lease finance |
| 3,884 |
| 3,981 |
| 1,644 |
|
Other |
| 52,054 |
| 16,296 |
| 9,031 |
|
|
|
|
|
| |||
Total Borrowers in Spain |
| 151,845 |
| 141,850 |
| 108,722 |
|
Borrowers outside Spain |
|
|
|
|
|
|
|
Government and official institutions |
| — |
| — |
| 1,766 |
|
Bank and other financial institutions |
| 4,428 |
| 3,097 |
| 13,485 |
|
Commercial and industrial |
| 137,396 |
| 121,316 |
| 109,577 |
|
Other |
| 199,936 |
| 127,391 |
| 123,937 |
|
|
|
|
|
| |||
Borrowers outside Spain |
| 341,760 |
| 251,804 |
| 248,765 |
|
|
|
|
|
| |||
Total |
| 493,605 |
| 393,654 |
| 357,487 |
|
|
|
|
|
| |||
Net provisions for credit losses- |
|
|
|
|
|
|
|
Domestic: |
|
|
|
|
|
|
|
Commercial, financial, agricultural, industrial |
| 99,362 |
| 119,155 |
| 318,538 |
|
Real estate-construction |
| (481 | ) | 1,139 |
| 759 |
|
Real estate-mortgage |
| 4,455 |
| 17,632 |
| 18,973 |
|
Installment loans to individuals |
| 113,771 |
| 93,545 |
| 91,799 |
|
Lease finance |
| 28,367 |
| 19,007 |
| 36,267 |
|
Other |
| 254,508 |
| 68,178 |
| 214,898 |
|
|
|
|
|
| |||
Total Borrowers in Spain |
| 499,982 |
| 318,656 |
| 681,234 |
|
Borrowers outside Spain |
|
|
|
|
|
|
|
Government and official institutions |
| (9,628 | ) | (1,966 | ) | (3,350 | ) |
Bank and other financial institutions |
| (42,656 | ) | 69,459 |
| (19,983 | ) |
Commercial and industrial |
| 454,555 |
| 892,446 |
| 434,725 |
|
Other |
| 683,764 |
| 369,597 |
| 403,061 |
|
|
|
|
|
| |||
Borrowers outside Spain |
| 1,086,035 |
| 1,329,536 |
| 814,453 |
|
|
|
|
|
| |||
Total |
| 1,586,017 |
| 1,648,192 |
| 1,495,687 |
|
|
|
|
|
| |||
Charge offs against credit loss allowance |
|
|
|
|
|
|
|
Domestic: |
| (34,957 | ) | (112,943 | ) | (154,360 | ) |
Real estate-construction |
| (43 | ) | (197 | ) | (811 | ) |
Real estate-mortgage |
| (10,795 | ) | (11,506 | ) | (19,109 | ) |
Installment loans to individuals |
| (32,341 | ) | (61,131 | ) | (59,334 | ) |
Lease finance |
| (1,153 | ) | (1,085 | ) | (1,885 | ) |
Other |
| (126,209 | ) | (62,895 | ) | (23,867 | ) |
|
|
|
|
| |||
Total Borrowers in Spain |
| (205,498 | ) | (249,757 | ) | (259,366 | ) |
Borrowers outside Spain |
|
|
|
|
|
|
|
Government and official institutions |
| — |
| — |
| (451 | ) |
Bank and other financial institutions |
| (6,208 | ) | (665 | ) | (196,662 | ) |
Commercial and industrial |
| (747,772 | ) | (384,373 | ) | (288,151 | ) |
Other |
| (1,067,569 | ) | (838,579 | ) | (326,455 | ) |
|
|
|
|
| |||
Borrowers outside Spain |
| (1,821,549 | ) | (1,223,617 | ) | (811,719 | ) |
|
|
|
|
| |||
Total |
| (2,027,047 | ) | (1,473,374 | ) | (1,071,085 | ) |
|
|
|
|
| |||
61
Allowances for Credit Losses |
| (IFRS) |
| ||||||
|
|
| |||||||
|
| 2004 |
| Percent of |
| 2005 |
| Percent of |
|
|
|
|
|
|
| ||||
|
| (in thousands of euros except percentages) |
| ||||||
Borrowers in Spain: |
|
|
|
|
|
|
|
|
|
Commercial, financial, agricultural, industrial |
| 1,494,605 |
| 21.36 | % | 2,056,003 |
| 26.51 | % |
Real estate-construction |
| 7,929 |
| 0.11 | % | 270,369 |
| 3.49 | % |
Real estate-mortgage |
| 206,461 |
| 2.95 | % | 243,335 |
| 3.14 | % |
Installment loans to individuals |
| 491,698 |
| 7.03 | % | 612,564 |
| 7.90 | % |
Lease finance |
| 105,101 |
| 1.50 | % | 98,830 |
| 0.13 | % |
Other |
| 530,771 |
| 7.59 | % | 383,248 |
| 4.94 | % |
|
|
|
|
|
| ||||
Total Borrowers in Spain |
| 2,836,564 |
| 40.54 | % | 3,664,349 |
| 47.24 | % |
Borrowers outside Spain |
|
|
|
|
|
|
|
|
|
Government and official institutions |
| 53,966 |
| 0.77 | % | 41,302 |
| 0.53 | % |
Bank and other financial institutions |
| 176,115 |
| 2.52 | % | 68,122 |
| 0.88 | % |
Commercial and industrial |
| 3,551,929 |
| 50.76 | % | 3,413,736 |
| 44.01 | % |
Mortgage loans |
| 199,022 |
| 2.84 | % | 363,980 |
| 0.47 | % |
Other |
| 179,832 |
| 2.57 | % | 205,186 |
| 2.65 | % |
|
|
|
|
|
| ||||
Total borrowers outside Spain |
| 4,160,864 |
| 59.46 | % | 4,092,326 |
| 52.76 | % |
|
|
|
|
|
| ||||
Total |
| 6,997,428 |
| 100.00 | % | 7,756,675 |
| 100.00 | % |
|
|
|
|
|
| ||||
The table below contains information prepared under previous Spanish GAAP which is not comparable to information prepared under IFRS.
Allowances for Credit Losses |
| (Previous Spanish GAAP) |
| ||
|
| ||||
|
| 2003 |
| Percent of loans in each |
|
|
|
|
| ||
|
| (in thousands of euros except percentages) |
| ||
Borrowers in Spain: |
|
|
|
|
|
Commercial, financial, agricultural, industrial |
| 738,291 |
| 13.64 | % |
Real estate-construction |
| 5,673 |
| 0.10 | % |
Real estate-mortgage |
| 187,635 |
| 3.47 | % |
Installment loans to individuals |
| 250,750 |
| 0.46 | % |
Lease finance |
| 57,686 |
| 1.07 | % |
Other |
| 440,982 |
| 8.14 | % |
|
|
|
| ||
Total Borrowers in Spain |
| 1,681,017 |
| 31.05 | % |
Borrowers outside Spain |
|
|
|
|
|
Government and official institutions |
| 23,688 |
| 0.44 | % |
Bank and other financial institutions |
| 152,958 |
| 2.83 | % |
Commercial and industrial |
| 3,131,665 |
| 57.84 | % |
Other |
| 425,068 |
| 7.85 | % |
|
|
|
| ||
Total borrowers outside Spain |
| 3,733,379 |
| 68.95 | % |
Total |
| 5,414,396 |
| 100.00 | % |
|
|
|
| ||
62
Impaired Assets
The following tables show our impaired assets, excluding country-risk. We do not keep records classifying assets as non-accrual, past due, restructured or potential problem loans, as those terms are defined by the SEC. However, we have estimated the amount of our assets that would have been so classified, to the extent possible, below.
|
| (IFRS) |
| ||
|
|
| |||
|
| 2004 |
| 2005 |
|
|
|
|
| ||
|
| (in thousands of euros except percentages) |
| ||
Past-due and other non-performing assets: (1) (2) |
|
|
|
|
|
Domestic |
| 1,018,088 |
| 1,110,784 |
|
International |
| 3,096,603 |
| 3,230,716 |
|
|
|
|
| ||
Total |
| 4,114,691 |
| 4,341,500 |
|
|
|
|
| ||
|
|
|
|
|
|
Impaired assets as a percentage of total loans |
| 1.09 | % | 0.98 | % |
Net loan charge-offs as a percentage of total loans |
| 0.16 | % | 0.23 | % |
(1) | We estimate that the total amount of our non-performing assets fully provisioned under IFRS and which under U.S. GAAP would have been charged-off from the balance sheet was €1,567.0 million and €1,302.6 million at December 31, 2004 and 2005, respectively. |
(2) | Non-performing assets due to country-risk were €117.1 million and 40.3 million at December 31, 2004 and 2005, respectively. |
The table below contains information prepared under previous Spanish GAAP which is not comparable to information prepared under IFRS.
|
| (Previous Spanish GAAP) |
| ||||
|
|
| |||||
|
| 2001 |
| 2002 |
| 2003 |
|
|
|
|
|
| |||
|
| (in thousands of euros except percentages) |
| ||||
Non-performing assets |
|
|
|
|
|
|
|
Past-due and other non-performing assets: (1)(2)(3) |
|
|
|
|
|
|
|
Domestic |
| 1,011,023 |
| 1,003,851 |
| 931,583 |
|
International |
| 2,884,491 |
| 2,672,616 |
| 2,290,921 |
|
|
|
|
|
| |||
Total |
| 3,895,514 |
| 3,676,467 |
| 3,222,504 |
|
|
|
|
|
| |||
Non-performing assets as a percentage of total loans |
| 2.17 | % | 2.19 | % | 1.81 | % |
Net loan charge-offs as a percentage of total loans |
| 0.88 | % | 0.72 | % | 0.46 | % |
(1) | The figures in this table do not reflect the entire principal amount of loans having payments 90 days or more past due unless the entire principal amount of the loan is classified as non-performing under Bank of Spain regulations as described above under “Bank of Spain Classification Requirements”. We estimate that the entire principal amount of such loans would have been €4,150.6 million, €4,486.0 million and €3,823.4 million at December 31, 2001, 2002 and 2003. |
(2) | We estimate that at December 31, 2001, 2002 and 2003, (i) the total amount of our non-performing past-due assets was €2,737.3 million, €2,208.8 million and €2,327.3 million, respectively, and (ii) the total amount of our other non-performing assets was €1,158.2 million, €1,467.6 million and €895.2 million, respectively. |
(3) | We estimate that the total amount of our non-performing assets fully provisioned under previous Spanish GAAP and which under U.S. GAAP would have been charged-off from the balance sheet was €341.8 million at December 31, 2003. |
We do not believe that there is a material amount of assets not included in the foregoing table where known information about possible credit risk at December 31, 2005 (not related to transfer risk inherent in cross-border lending activities) gave rise to serious doubts as to the ability of the borrowers to comply with the loan repayment terms at such date.
63
Evolution of Impaired Assets
The following tables show the movement in our impaired assets (excluding country-risk, see “Country-Risk Outstandings”).
|
| (IFRS) |
| ||||||||
|
|
| |||||||||
|
| Total year |
| Quarter ended |
| ||||||
|
|
|
| ||||||||
|
| Dec-04 |
| Mar-05 |
| Jun-05 |
| Sep-05 |
| Dec-05 |
|
|
|
| |||||||||
|
| (in thousands of euros) |
| ||||||||
Opening balance |
| 3,512,727 |
| 4,114,691 |
| 4,427,095 |
| 4,327,792 |
| 4,375,129 |
|
Net additions |
| 1,627,392 |
| 495,531 |
| 366,565 |
| 442,333 |
| 433,263 |
|
Write-offs |
| (1,025,428 | ) | (183,127 | ) | (465,868 | ) | (394,996 | ) | (466,892 | ) |
Closing balance (1) |
| 4,114,691 |
| 4,427,095 |
| 4,327,792 |
| 4,375,129 |
| 4,341,500 |
|
(1) Non-performing assets due to country-risk were €117.1 million and €40.3 million at December 31, 2004 and 2005, respectively.
The table below contains information prepared under previous Spanish GAAP which is not comparable to information prepared under IFRS.
|
| (Previous Spanish GAAP) |
| ||||
|
|
| |||||
|
| Dec-03 |
| Dec-02 |
| Dec-01 |
|
|
|
|
|
| |||
|
| (in thousands of euros) |
| ||||
Opening balance |
| 3,676,467 |
| 3,895,514 |
| 4,527,454 |
|
Net additions |
| 720,500 |
| 1,356,366 |
| 1,438,866 |
|
Write-offs |
| (1,174,463 | ) | (1,575,413 | ) | (2,070,806 | ) |
|
|
|
|
| |||
Closing balance |
| 3,222,504 |
| 3,676,467 |
| 3,895,514 |
|
|
|
|
|
| |||
Impaired Asset Ratios
The following tables show the ratio of our impaired assets to total computable credit risk and our coverage ratio at December 31, 2004 and 2005.
|
| (IFRS) |
| ||
|
|
| |||
|
| 2004 |
| 2005 |
|
|
|
|
| ||
|
| (in thousands of euros except percentages) |
| ||
Computable credit risk (1) |
| 411,482,598 |
| 489,662,040 |
|
Impaired assets |
|
|
|
|
|
Mortgage loans |
| 1,352,564 |
| 1,209,137 |
|
Other |
| 2,762,127 |
| 3,132,363 |
|
Total impaired assets |
| 4,114,691 |
| 4,341,500 |
|
|
|
|
|
|
|
Allowances for impaired assets (2) |
| 6,813,354 |
| 7,902,225 |
|
Ratios |
|
|
|
|
|
Impaired assets to computable credit risk |
| 1.00 | % | 0.89 | % |
Coverage ratio (3) |
| 165.59 | % | 182.02 | % |
(1) | Computable credit risk is the sum of the face amounts of loans and credits, guarantees and documentary credits (including impaired assets and excluding country-risk). |
(2) | Including allowances for credit losses and allowances for off-balance sheet credit risk and excluding country-risk. |
(3) | Allowances for impaired assets as a percentage of impaired assets. |
64
The table below contains information prepared under previous Spanish GAAP which is not comparable to information prepared under IFRS.
|
| (Previous Spanish GAAP) |
| ||||
|
|
| |||||
|
| (in thousands of euros except percentages) |
| ||||
|
| 2003 |
| 2002 |
| 2001 |
|
|
|
|
|
| |||
Computable credit risk (1) |
| 207,979,474 |
| 194,917,391 |
| 209,289,435 |
|
Non-performing assets |
|
|
|
|
|
|
|
Mortgage loans |
| 510,265 |
| 361,076 |
| 405,671 |
|
Other |
| 2,712,239 |
| 3,315,391 |
| 3,489,843 |
|
|
|
|
|
| |||
Total non performing assets |
| 3,222,504 |
| 3,676,467 |
| 3,895,514 |
|
|
|
|
|
| |||
Allowances for non-performing assets (2) |
| 5,323,127 |
| 5,144,855 |
| 5,583,018 |
|
Ratios |
|
|
|
|
|
|
|
Non-performing assets to computable credit risk |
| 1.55 | % | 1.89 | % | 1.86 | % |
Coverage ratio (3) |
| 165.19 | % | 139.94 | % | 143.32 | % |
(1) | Computable credit risk is the sum of the face amounts of loans and credits, guarantees and documentary credits (including non-performing assets and excluding country-risk). |
(2) | Including allowances for credit losses and allowances for off-balance sheet credit risk and excluding country-risk. |
(3) | Allowances for non-performing assets as a percentage of non-performing assets. |
Country-Risk Outstandings
The following tables set forth our country-risk outstandings with third parties for the years shown.
|
| (IFRS) |
| ||
|
|
| |||
|
| 2004 |
| 2005 |
|
|
|
|
| ||
|
| (in millions of euros) |
| ||
Risk (gross) |
| 1,063.7 |
| 668.1 |
|
Allowances |
| 275.0 |
| 313.0 |
|
|
|
|
| ||
Risk (net) |
| 788.8 |
| 355.1 |
|
|
|
|
| ||
The table below contains information prepared under previous Spanish GAAP which is not comparable to information prepared under IFRS.
|
| Year ended December 31, |
| ||||
|
|
| |||||
|
| 2003 |
| 2002 |
| 2001 |
|
|
|
|
|
| |||
|
| (in millions of euros) |
| ||||
Risk (gross) |
| 497.0 |
| 409.5 |
| 1,216.3 |
|
Allowances |
| (406.0 | ) | (337.5 | ) | (323.2 | ) |
|
|
|
|
| |||
Risk (net) |
| 91.0 |
| 72.0 |
| 893.1 |
|
|
|
|
|
| |||
65
Other Non-Accruing Assets
As described above under “Item 4. Information on the Company—B. Business Overview—Bank of Spain Classification Requirements”, we do not classify our loans to borrowers in countries with transitory difficulties (category 3) and countries in serious difficulties (category 4) as impaired assets. However, as described above under “Item 4. Information on the Company — B. Business Overview — Bank of Spain Allowances for Credit Losses and Country-Risk Requirements—Allowances for Country-Risk” and “Bank of Spain Non-Accrual of Interest Requirements”, the Bank of Spain requires us to account for such loans on a cash basis (non-accruing) and to set aside certain allowances for such loans. We treat category 5 (doubtful countries) country-risk outstandings as both non-accruing and impaired asset. Total other non-accruing assets at December 31, 2001, 2002, 2003, 2004 and 2005 were €1,172.2 million, €259.5 million, €249.7 million, €717.5 million and €626.5 million, respectively (2001, 2002 and 2003 calculated under previous Spanish GAAP).
|
| (IFRS) |
| ||
|
|
| |||
|
| 2004 |
| 2005 |
|
|
|
|
| ||
|
| (in millions of euros) |
| ||
Assets classified as non-performing assets |
| 4,114.7 |
| 4,341.5 |
|
Non-performing assets due to country-risk |
| 117.1 |
| 40.3 |
|
Other assets on non-accrual status due to country-risk |
| 717.5 |
| 626.5 | |
|
|
|
| ||
Total non-accrual assets |
| 4,949.3 |
| 5,008.3 |
|
|
|
|
| ||
The table below contains information prepared under previous Spanish GAAP which is not comparable to information prepared under IFRS. As described in our 2004 Form 20-F under “Item 4. Information on the Company — B. Business Overview — Bank of Spain Classification Requirements”, under previous Spanish GAAP loans could be partially classified as performing and non-performing. As a result, this table includes an additional line for the performing portion of loans that are partially classified as non-performing.
|
| (Previous Spanish GAAP) |
| ||||
|
|
| |||||
|
| 2001 |
| 2002 |
| 2003 |
|
|
|
|
|
| |||
|
| (in millions of euros) |
| ||||
Assets classified as non-performing assets |
| 3,895.5 |
| 3,676.5 |
| 3,222.5 |
|
Remaining balances of loans partially classified as non-performing |
| 255.1 |
| 809.5 |
| 600.9 |
|
Other assets on non-accrual status due to country-risk |
| 1,172.2 |
| 259.5 | �� | 249.7 |
|
|
|
|
|
| |||
Total non-accrual assets |
| 5,322.8 |
| 4,745.5 |
| 4,073.1 |
|
|
|
|
|
| |||
Both under IFRS or previous Spanish GAAP we do not have any loans past-due 90 days or more that are accruing interest, in accordance with the Bank of Spain’s requirements.
As of December 31, 2003, 2004 and 2005, the amounts of “restructured loans”, none of which were classified as non-performing, were €147.6 million, €193.2 million and 322.4 million, respectively (2003 calculated under previous Spanish GAAP).
Foreclosed Assets
The tables below set forth the movements in our foreclosed assets for the periods shown.
Movement of foreclosed assets |
| (IFRS) |
| ||||||||||
|
|
| |||||||||||
|
| Total Year |
| Quarterly movements |
| Total Year |
| ||||||
|
|
|
|
| |||||||||
|
| Dec-04 |
| Mar-05 |
| Jun-05 |
| Sep-05 |
| Dec-05 |
| Dec-05 |
|
|
|
|
|
|
|
| |||||||
|
| (in thousands of euros, except percentages) |
| ||||||||||
Opening balance |
| 242,155 |
| 372,519 |
| 349,320 |
| 361,426 |
| 418,687 |
| 364,552 |
|
Foreclosures |
| 455,024 |
| 98,326 |
| 154,659 |
| 41,488 |
| 147,985 |
| 442,458 |
|
Sales and other movements |
| (324,660) |
| (121,525) |
| (142,553) |
| 15,773 |
| (158,630) |
| (398,968) |
|
Gross foreclosed assets |
| 372,519 |
| 349,320 |
| 361,426 |
| 418,687 |
| 408,042 |
| 408,042 |
|
Allowances established |
| 89,773 |
| 79,962 |
| 78,094 |
| 82,429 |
| 115,683 |
| 115,683 |
|
Allowance as a percentage of foreclosed assets |
| 24.10 | % | 22.89 | % | 21.61 | % | 19.69 | % | 28.35 | % | 28.35 | % |
Closing balance (net) |
| 282,746 |
| 269,358 |
| 283,332 |
| 336,258 |
| 292,359 |
| 292,359 |
|
66
The table below contains information prepared under previous Spanish GAAP which is not comparable to information prepared under IFRS.
Movement of foreclosed assets |
| (Previous Spanish GAAP) |
|
|
|
| |
|
| 2003 |
|
|
| ||
|
| (in thousands of euros, |
|
Opening balance |
| 679,543 |
|
Foreclosures |
| 256,979 |
|
Sales and other movements |
| (383,257 | ) |
Gross foreclosed assets |
| 553,265 |
|
Allowances established |
| 316,164 |
|
Allowance as a percentage of foreclosed assets |
| 57.15 | % |
Closing balance (net) |
| 237,101 |
|
Liabilities
Deposits
The principal components of our deposits are customer demand, time and notice deposits, and international and domestic interbank deposits. Our retail customers are the principal source of our demand, time and notice deposits. For an analysis, by domicile of customer, of average domestic and international deposits by type for 2003, 2004 and 2005, see “Average Balance Sheets and Interest Rates—Liabilities and Interest Expense”.
We compete actively with other commercial banks and with savings banks for domestic deposits. Our share of customer deposits in the Spanish banking system (including Cajas de Ahorros) was 15.6% at December 31, 2005, according to figures published by the Spanish Banking Association (AEB) and the Confederación Española de Cajas de Ahorros (“CECA”). See “Item 4. Information on the Company—B. Business Overview—Competition”.
67
The following tables analyze our year-end deposits.
Deposits (from central banks and credit institutions and Customers) by type of deposit
|
| IFRS |
| ||
|
| At December 31, |
| ||
|
| 2004 |
| 2005 |
|
| |||||
Deposits from central banks and credit institutions- |
| (in thousands of euros) |
| ||
Reciprocal accounts |
| 39,162 |
| 190,885 |
|
Time deposits |
| 42,459,721 |
| 47,224,471 |
|
Other demand accounts |
| 4,191,073 |
| 7,383,695 |
|
Repurchase agreements |
| 33,920,297 |
| 91,399,196 |
|
Central bank credit account drawdowns |
| 3,107,895 |
| 2,369,406 |
|
Other financial liabilities associated with transferred financial assets |
| — |
| 7,170 |
|
Hybrid financial liabilities |
| 32,191 |
| 47,584 |
|
|
|
|
| ||
Total |
| 83,750,339 |
| 148,622,407 |
|
Customer deposits- |
|
|
|
|
|
Demand deposits- |
|
|
|
|
|
Current accounts |
| 67,714,687 |
| 80,631,188 |
|
Savings accounts |
| 78,849,072 |
| 90,471,827 |
|
Other demand deposits |
| 3,720,956 |
| 1,747,720 |
|
Time deposits- |
|
|
|
|
|
Fixed-term deposits |
| 80,052,445 |
| 77,166,817 |
|
Home-purchase savings accounts |
| 289,779 |
| 269,706 |
|
Discount deposits |
| 10,163,257 |
| 16,128,577 |
|
Funds received under financial asset transfers |
| — |
| 1 |
|
Hybrid financial liabilities |
| 1,873,863 |
| 4,141,071 |
|
Other financial liabilities associated with transferred financial assets |
| — |
| 20,346 |
|
Other time deposits |
| 498,961 |
| 351,620 |
|
Notice deposits |
| 24,911 |
| 33,713 |
|
Repurchase agreements |
| 40,023,685 |
| 34,802,694 |
|
|
|
|
| ||
Total |
| 283,211,616 |
| 305,765,280 |
|
|
|
|
| ||
Total deposits |
| 366,961,955 |
| 454,387,687 |
|
|
|
|
| ||
68
The table below contains information prepared under previous Spanish GAAP which is not comparable to information prepared under IFRS. For a description of the main differences between both accounting standards, see Note 57 to our consolidated financial statements.
|
| (Previous Spanish GAAP) |
|
|
|
| |
|
| 2003 |
|
| |||
Due to credit institutions - |
| (in thousands of euros) |
|
Demand deposits |
| 1,760,401 |
|
Other- |
|
|
|
Securities sold under agreements to resell |
| 43,404,015 |
|
Time deposits |
| 30,415,896 |
|
|
|
| |
Total |
| 75,580,312 |
|
|
|
| |
Customer deposits- |
|
|
|
Saving deposits |
|
|
|
Demand |
| 76,613,017 |
|
Time |
| 46,973,305 |
|
Other |
|
|
|
Demand |
| 309,402 |
|
Securities sold under agreement to repurchase |
| 26,587,985 |
|
Other |
| 8,851,863 |
|
|
|
| |
Total |
| 159,335,572 |
|
|
|
| |
Total deposits |
| 234,915,884 |
|
|
|
|
Deposits (from central banks and credit institutions and Customers) by location of office
|
| (IFRS) |
| ||
|
|
| |||
|
| 2004 |
| 2005 |
|
|
|
|
| ||
Deposits from central banks and credit institutions |
| (in thousands of euros) |
| ||
Offices in Spain |
| 29,594,503 |
| 76,504,500 |
|
Offices outside Spain: |
|
|
|
|
|
Other EU countries |
| 9,559,941 |
| 9,647,389 |
|
United States |
| 2,536,104 |
| 1,439,643 |
|
Other OECD countries (1) |
| 26,844,609 |
| 36,905,723 |
|
Central and South America (1) |
| 14,974,332 |
| 23,926,745 |
|
Other |
| 240,850 |
| 198,407 |
|
|
|
|
| ||
Total offices outside Spain |
| 54,155,836 |
| 72,117,907 |
|
|
|
|
| ||
Total |
| 83,750,339 |
| 148,622,407 |
|
|
|
|
| ||
Customer deposits |
|
|
|
|
|
Offices in Spain |
| 102,249,913 |
| 107,117,818 |
|
Offices outside Spain: |
|
|
|
|
|
Other EU countries |
| 135,209,492 |
| 133,274,597 |
|
United States |
| 6,037,483 |
| 7,578,598 |
|
Other OECD countries (1) |
| 74,859 |
| 106,151 |
|
Central and South America (1) |
| 38,499,807 |
| 56,395,157 |
|
Other |
| 1,140,062 |
| 1,292,959 |
|
|
|
|
| ||
Total offices outside Spain |
| 180,961,703 |
| 198,647,462 |
|
|
|
|
| ||
Total |
| 283,211,616 |
| 305,765,280 |
|
|
|
|
| ||
Total deposits |
| 366,961,955 |
| 454,387,687 |
|
|
|
|
| ||
(1) | On this table Mexico is classified under “Central and South America”. |
69
The table below contains information prepared under previous Spanish GAAP which is not comparable to information prepared under IFRS. For a description of the main differences between both accounting standards, see Note 57 to our consolidated financial statements.
|
| (Previous Spanish GAAP) |
|
| |
|
| 2003 |
|
| |
Due to credit institutions |
| (in thousands of euros) |
Offices in Spain |
| 55,918,657 |
Offices outside Spain: |
|
|
Other EU countries |
| 7,140,474 |
United States |
| 3,660,371 |
Other OECD countries (1) |
| 14,913 |
Central and South America (1) |
| 8,572,270 |
Other |
| 273,627 |
|
| |
Total offices outside Spain |
| 19,661,655 |
|
| |
Total |
| 75,580,312 |
|
| |
Customer deposits |
|
|
Offices in Spain |
| 91,799,908 |
Offices outside Spain: |
|
|
Other EU countries |
| 25,040,806 |
United States |
| 6,342,920 |
Other OECD countries (1) |
| 255,490 |
Central and South America (1) |
| 34,618,654 |
Other |
| 1,277,794 |
|
| |
Total offices outside Spain |
| 67,535,664 |
|
| |
Total |
| 159,335,572 |
|
| |
Total deposits |
| 234,915,884 |
|
|
(1) | On this table Mexico is classified under “Central and South America”. |
The following table shows the maturity of time deposits (excluding inter-bank deposits) in denominations of $100,000 or more for the year ended December 31, 2005. Large denomination customer deposits may be a less stable source of funds than demand and savings deposits.
|
| At December 31, 2005 | ||||
|
| |||||
|
| Domestic |
| International |
| Total |
|
|
|
| |||
|
| (in thousands of euros) | ||||
Under 3 months |
| 6,760,049 |
| 22,632,229 |
| 29,392,278 |
3 to 6 months |
| 2,509,060 |
| 3,488,589 |
| 5,997,649 |
6 to 12 months |
| 4,015,927 |
| 4,561,640 |
| 8,577,567 |
Over 12 months |
| 2,968,682 |
| 5,768,118 |
| 8,736,800 |
|
|
|
| |||
Total |
| 16,253,718 |
| 36,450,576 |
| 52,704,294 |
|
|
|
| |||
The aggregate amount of deposits held by non-resident depositors (banks and customers) in our domestic branch network was €31.9 million (under previous Spanish GAAP), €18.7 million and €64.4 million at December 31, 2003, 2004 and 2005.
70
Short-term Borrowings
|
| (IFRS) |
| ||||||
|
|
| |||||||
|
| 2004 |
| 2005 |
| ||||
|
|
|
| ||||||
|
| Amount |
| Avg. |
| Amount |
| Avg. |
|
|
| (in thousands of euros except percentages) |
| ||||||
Securities sold under agreements to repurchase (principally Spanish Treasury notes and bills): |
|
|
|
|
|
|
|
|
|
At December 31 |
| 67,856,642 |
| 1.55 | % | 126,201,890 |
| 3.55 | % |
Average during year |
| 62,726,813 |
| 3.24 | % | 91,458,502 |
| 3.65 | % |
Maximum month-end balance |
| 69,575,864 |
| — |
| 129,563,533 |
| — |
|
Other short-term borrowings: |
|
|
|
|
|
|
|
|
|
At December 31 |
| 18,727,698 |
| 2.66 | % | 25,157,976 |
| 2.34 | % |
Average during year |
| 14,975,003 |
| 2.26 | % | 21,249,880 |
| 4.23 | % |
Maximum month-end balance |
| 18,752,237 |
| — |
| 26,688,044 |
| — |
|
Total short-term borrowings at year-end |
| 86,584,340 |
| 1.79 | % | 151,359,866 |
| 3.35 | % |
The table below contains information prepared under previous Spanish GAAP which is not comparable to information prepared under IFRS. For a description of the main differences between both accounting standards, see Note 57 to our consolidated financial statements.
|
| (Previous Spanish GAAP) |
| ||
|
|
| |||
|
| 2003 |
| ||
|
|
| |||
|
| Amount |
| Avg. |
|
|
|
|
| ||
|
| (in thousands of euros |
| ||
Securities sold under agreements to repurchase (principally Spanish Treasury notes and bills): |
|
|
|
|
|
At December 31 |
| 69,992,000 |
| 2.85 | % |
Average during year |
| 64,299,341 |
| 3.13 | % |
Maximum month-end balance |
| 72,291,382 |
| — |
|
Other short-term borrowings: |
|
|
|
|
|
At December 31 |
| 15,602,313 |
| 1.78 | % |
Average during year |
| 13,758,824 |
| 2.04 | % |
Maximum month-end balance |
| 15,745,228 |
| — |
|
Total short-term borrowings at year-end |
| 85,594,313 |
| 2.66 | % |
|
|
|
| ||
Competition
We face strong competition in all of our principal areas of operation from other banks, savings banks, credit co-operatives, brokerage houses, insurance companies and other financial services firms.
Banks
Two Spanish banking groups dominate the retail banking sector in Spain. These two groups are headed by Banco Bilbao Vizcaya Argentaria, S.A. and Santander.
At the end of December 2005, these two Spanish banking groups accounted for approximately 60.2% of loans and 64.1% of deposits of all Spanish banks, which in turn represented 29.4% of loans and 29.2% of deposits of the financial system, according to figures published by the Spanish Banking Association (AEB) and the Confederación Española de Cajas de Ahorro (“CECA”). These banking groups also hold significant investments in Spanish industry.
71
Foreign banks also have a presence in the Spanish banking system as a result of liberalization measures adopted by the Bank of Spain since 1978. At December 31, 2005, there were 65 foreign banks (of which 57 were from European Union countries) with branches in Spain. In addition, there were 21 Spanish subsidiary banks of foreign banks (of which 16 were from European Union countries).
Spanish law provides that any financial institution organized and licensed in another Member State of the European Union may conduct business in Spain from an office outside Spain. They do not need prior authorization from Spanish authorities to do so. Once the Bank of Spain receives notice from the institution’s home country supervisory authority about the institution’s proposed activities in Spain, the institution is automatically registered and the proposed activities are automatically authorized.
The opening of a branch of any financial institution authorized in another Member State of the European Union does not need prior authorization or specific allocation of resources. The opening is subject to the reception by the Bank of Spain of a notice from the institution’s home country supervisory authority containing, at least, the following information:
| • | Program of activities detailing the transactions to be made and the corporate structure of the branch. |
| • | Address in Spain of the branch. |
| • | Name and curriculum vitae of the branch’s managers. |
| • | Stockholders’ equity and liquidity ratio of the financial institution and its consolidated group. |
| • | Detailed information about any deposit guarantee scheme that assures the protection of the branch’s depositors. |
Once the Bank of Spain receives the notice, it notifies the financial institution, thereby permitting the branch to be registered in the Mercantile Register and, then, in the Special Register of the Bank of Spain.
Spanish law requires prior approval by the Bank of Spain for a Spanish bank to acquire shares of a bank organized outside the European Union, create a new bank outside the European Union or open a branch outside the European Union. Spanish banks must provide prior notice to the Bank of Spain to conduct any other business outside the European Union.
When a new bank is created, the following information has to be provided to the Bank of Spain:
| • | amount of the investment, |
| • | percentage of the share capital and of the total voting rights, |
| • | name of the companies through which the investment will be made, |
| • | draft of the by-laws, |
| • | program of activities, setting out the types of business envisaged, the administrative and accounting organization and the internal control procedures, including those established to prevent money laundering transactions, |
| • | list of the persons who will be members of the first board of directors and of the senior management, |
| • | list of partners with significant holdings; and |
| • | detailed description of the banking, tax and anti-money laundering regulations of the State where it will be located. |
The opening of branches outside Spain requires prior application to the Bank of Spain, including information about the State where the branch will be located, the address, program of activities and names of the branch’s managers. The opening of representative offices requires prior notice to the Bank of Spain detailing the activities to perform.
72
In addition, we face strong competition outside Spain, particularly in Argentina, Brazil, Chile, Mexico, Portugal and the United Kingdom.
Abbey’s main competitors are established UK banks, building societies and insurance companies and other financial services providers (such as supermarket chains and large retailers). In recent years, customer access, choice and mobility have increased.
Savings Banks
Spanish savings banks (“Cajas de Ahorros”) are mutual organizations which engage in the same activities as banks, but primarily take deposits and make loans, principally to individual customers and small to medium-sized companies. The Spanish savings banks provide strong competition for the demand and savings deposits which form an important part of our deposit base. Spanish savings banks, which traditionally were regional institutions, are permitted to open branches and offices throughout Spain. In the last few years, mergers among savings banks increased. The Spanish savings banks’ share of domestic deposits and loans were 61.4% and 51.3%, at December 31, 2005.
Credit Co-operatives
Credit co-operatives are active principally in rural areas. They provide savings and loan services including financing of agricultural machinery and supplies.
Brokerage Services
We face competition in our brokerage activities in Spain from brokerage houses of other financial institutions.
Spanish law provides that any investment services company authorized to operate in another Member State of the European Union may conduct business in Spain from an office outside Spain, once the National Securities Market Commission (Comisión Nacional del Mercado de Valores – “CNMV”) receives notice from the institution’s home country supervisory authority about the institution’s proposed activities in Spain.
However, Spanish law provides that credit entities have access, as members, to the Spanish stock exchanges, in accordance with the provisions established by the Investment Services Directive.
We also face strong competition in our mutual funds, pension funds and insurance activities from other banks, savings banks, insurance companies and other financial services firms.
Supervision and Regulation
Bank of Spain and the European Central Bank
The Bank of Spain, which operates as Spain’s autonomous central bank, supervises all Spanish financial institutions, including us. Until January 1, 1999, the Bank of Spain was also the entity responsible for implementing Spanish monetary policy. As of that date, the start of Stage III of the European Monetary Union, the European System of Central Banks and the European Central Bank became jointly responsible for Spain’s monetary policy. The European System of Central Banks consists of the national central banks of the twenty five Member States belonging to the European Union, whether they have adopted the euro or not, and the European Central Bank. The “Eurosystem” is the term used to refer to the European Central Bank and the national central banks of the Member States which have adopted the euro. The European Central Bank is responsible for the monetary policy of the European Union. The Bank of Spain, as a member of the European System of Central Banks, takes part in the development of the European System of Central Banks’ powers including the design of the European Union’s monetary policy.
The European System of Central Banks is made up of three decision-making bodies:
| • | the Governing Council, comprised of the members of the Executive Board of the European Central Bank and the governors of the national central banks of the 12 Member States which have adopted the euro; |
| • | the Executive Board, comprised of the President, Vice-President and four other members; and |
73
| • | the General Council of the European Central Bank, comprised of the President and Vice-President of the European Central Bank and the governors of the national central banks of the 25 European Union Member States. |
The Governing Council is the body in charge of formulating monetary policy for the euro area and adopting the guidelines and decisions necessary to perform the Euro system’s tasks. The Executive Board is the body in charge of implementing the monetary policy for the euro area laid out by the Governing Council and providing the instructions necessary to carry out monetary policy to the euro area national central banks.
The European Central Bank has delegated the authority to issue the euro to the central banks of each country participating in Stage III. These central banks will also be in charge of executing the European Union’s monetary policy in their respective countries. The countries that have not adopted the euro will have a seat in the European System of Central Banks, but will not have a say in the monetary policy or instructions laid out by the governing council to the national central banks.
Since January 1, 1999, the Bank of Spain has performed the following basic functions attributed to the European System of Central Banks:
| • | executing the European Union monetary policy; |
| • | conducting currency exchange operations consistent with the provisions of Article 109 of the Treaty on European Union, and holding and managing the States’ official currency reserves; |
| • | promoting the sound working of payment systems in the euro area; and |
| • | issuing legal tender bank notes. |
Notwithstanding the European Monetary Union, the Bank of Spain continues to be responsible for:
| • | maintaining, administering and managing the foreign exchange and precious metal reserves; |
| • | promoting the sound working and stability of the financial system and, without prejudice to the functions of the European System of Central Banks, of national payment systems; |
| • | placing coins in circulation and the performance, on behalf of the State, of all such other functions entrusted to it in this connection; |
| • | preparing and publishing statistics relating to its functions, and assisting the European Central Bank in the compilation of the necessary statistical information; |
| • | rendering treasury services to the Spanish Treasury and to the regional governments, although the granting of loans or overdrafts in favor of the State, the regional governments or other bodies referred to in Article 104 of the European Union Treaty, is generally prohibited; |
| • | rendering services related to public debt to the State and regional governments; and |
| • | advising the Spanish Government and preparing the appropriate reports and studies. |
The Bank of Spain has the following supervisory powers over Spanish banks, subject to applicable laws, rules and regulations issued by the Spanish Government and its Ministry of Economy and Finance:
| • | to conduct periodic inspections of Spanish banks to test compliance with current regulations concerning, among other matters, preparation of financial statements, account structure, credit policies and provisions and capital adequacy; |
| • | to advise a bank’s board of directors and management when its dividend policy is deemed inconsistent with the bank’s financial results; |
| • | to undertake extraordinary inspections of banks concerning any matters relating to their banking activities; |
| • | to participate with, as the case may be, other authorities in appropriate cases in the imposition of penalties to banks for infringement or violation of applicable regulations; and |
74
| • | to take control of credit entities and to replace directors of credit entities when a Spanish credit entity faces an exceptional situation that poses a risk to the financial status of the relevant entity. |
Liquidity Ratio
European Central Bank regulations require credit institutions in each Member State that participates in the European Monetary Union, like us, to place a specific percentage of their “Qualifying Liabilities” with their respective central banks in the form of interest bearing deposits as specified below (the “Liquidity Ratio”).
The European Central Bank requires the maintenance of a minimum liquidity ratio at all credit institutions established in the Member States of the European Monetary Union. Branches located in the euro zone of institutions not registered in this area are also subject to this ratio, while the branches located outside the euro zone of institutions registered in the euro zone are not subject to this ratio.
“Qualifying Liabilities” are broadly defined as deposits and debt securities issued. The Liquidity Ratio is 2% over Qualifying Liabilities except in relation to deposits with stated maturity greater than two years, deposits redeemable at notice after two years, repos and debt securities with a stated maturity greater than two years, for which the ratio is 0%.
Liabilities of institutions subject to the Liquidity Ratio and liabilities of the European Central Bank and national central banks of a participating Member State of the European Monetary Union are not included in the base of “Qualifying Liabilities”.
Investment Ratio
The Spanish Government has the power to require credit institutions to invest a portion of certain “Qualifying Liabilities” in certain kinds of public sector debt or public-interest financing (the “investment ratio”), and has exercised this power in the past. Although the investment ratio has been 0% since December 31, 1992, the law which authorizes it has not been abolished, and the Spanish Government could reimpose the ratio, subject to EU requirements.
Capital Adequacy Requirements
The Bank and its Spanish bank subsidiaries are subject to Spanish capital adequacy requirements that implement the European Union Capital Adequacy Directive.
The Spanish capital adequacy requirements distinguish between “basic” and “complementary” capital and require certain ratios of basic and total capital to risk-weighted assets. Basic capital generally includes ordinary shares, non-cumulative preferred securities and most reserves, less interim dividends, goodwill and intangible assets, treasury stock and financing for the acquisition (by persons other than the issuer’s employees) of the issuer’s shares. Complementary capital generally includes cumulative preferred securities, revaluation and similar reserves, dated and perpetual subordinated debt, generic credit allowances and capital gains.
The Bank’s total capital is reduced by certain deductions that need to be made with respect to its investments in other financial institutions.
The computation of both basic and complementary capital is subject to provisions limiting the type of stockholding and the level of control which these stockholdings grant to a banking group. The level of dated subordinated debt taken into account for the calculation of complementary capital may not exceed 50% of basic capital, the level of non-cumulative preferred securities may not exceed 30% of basic capital, the level of hybrid securities may not exceed 15% of basic capital and the total amount of complementary capital admissible for computing total capital may not exceed the total amount of basic capital.
The consolidated total capital of a banking group calculated in the manner described above may not be less than 8% of the group’s risk-weighted assets net of specified provisions and amortizations. The calculation of total risk-weighted assets applies minimum multipliers of 0%, 10%, 20%, 50% and 100% to the group’s assets.
| • | The following loans receive a 0% weighting: |
| • | loans to the Spanish Government and the Bank of Spain, the Organization for Economic Cooperation and Development and European Union countries’ governments or central banks; |
75
| • | loans to governments or central banks of countries that have entered into certain special loan agreements with the International Monetary Fund (provided such countries had not renegotiated their external debt within the five years preceding the loan); |
| • | credits against the European Union; |
| • | credits against Spanish autonomous governmental bodies, the Spanish social security fund and certain Spanish governmental public entities, or credits expressly guaranteed by certain entities mentioned above; |
| • | certain securitized debt related to the Spanish nuclear moratorium; |
| • | debt securities of Spanish autonomous communities and local councils (provided such securities have been approved by the Spanish Government); and |
| • | credits given in the debtors’ local currency against, or guaranteed by governments or central banks of such other countries not mentioned above subject to certain exceptions. |
| • | 10% weighting is requested to mortgage securities and territorial bonds issued by credit institutions and to fixed income securities issued by credit institutions authorized in the European Union to which their home country supervisory authorities apply a 10% weighting. |
| • | Loans to Spanish autonomous communities and local councils, to the Organization for Economic Cooperation and Development regional and local governments, to banks, savings banks and brokerage firms and to the European Investment Bank and multilateral development banks receive at least a 20% weighting. |
| • | Residential mortgage loans receive at least a 50% weighting. |
| • | All other loans are weighted at 100%; however, such weighting may be lower if the loan is guaranteed or secured. Off-balance-sheet assets are also included in the calculation of risk-weighted assets. |
Spanish regulations provide that, if certain requirements are met, Spanish banks may include the net credit exposure arising from certain interest rate -and foreign exchange-related derivative contracts (rather than the entire notional amount of such contracts) in their total risk-adjusted assets for purposes of calculating their capital adequacy ratios.
At December 31, 2005, our eligible capital exceeded the minimum required by the Bank of Spain by approximately €10.4 billion. Our Spanish subsidiary banks were, at December 31, 2005, each in compliance with these capital adequacy requirements, and all our foreign subsidiary banks were in compliance with their local regulation.
Banks or consolidated banking groups should communicate immediately to the Bank of Spain if they fail to satisfy minimum capital requirements, and within the next month should present a plan to recover the solvency. This plan could be modified by the Bank of Spain. While the deficit persists, the payment of dividends by any of the entities of the banking group must be approved by Bank of Spain, and will be limited to a maximum of 50% of net attributable income. Payment of dividends could be forbidden if the deficit of capital is greater than 20% of the minimum capital requirements. See “Item 4. Information on the Company-B. Business Overview-Restrictions on Dividends”.
The Basel Committee on Banking Regulations and Supervisory Practices, which includes the supervisory authorities of thirteen major industrial countries, has adopted an international framework (the “Basel Accord”) for capital measurement and capital standards of banking institutions. The framework provides:
| • | definitions for “Tier 1” capital and “Tier 2” capital; |
| • | a system for weighting assets and off-balance sheet items according to credit risk; and |
| • | a requirement that banks engaged in international operations maintain Tier 1 capital of at least 4% of risk-weighted assets and “total” capital (Tier 1 capital plus up to an equal amount of Tier 2 capital) of at least 8% of risk-weighted assets. |
As described above, the capital adequacy of Spanish banks is regulated by European Union directives applicable to the Spanish banking system as well as to the banking systems of other European Union Member States. Certain European Union Member States are parties to the Basel Accord. Spain joined the Accord on February 1, 2001. Each national authority which is a party to the Basel Accord has implemented the Accord in a significantly different fashion. The capital requirements imposed by the Basel Accord are in many respects similar to those imposed by European Union directives, Spanish law and the Bank of Spain. Based purely on the capital framework itself, and making assumptions that we consider appropriate, we estimate that, at December 31, 2005, we had (1) a total capital to risk-weighted assets ratio of 12.94%, and (2) a Tier 1 capital to risk-weighted assets ratio of 7.88%.
76
After continuing consultation, the Basel Committee has developed a new framework to replace the 1988 Capital Accord, which the European Union has adopted and issued as Capital Adequacy Directive Three. The Basel Committee on Banking Supervision on June 26, 2004 published the Basel 2 Accord which amends the Basel 1 1988 Accord. Basel 2 promotes more risk sensitive approaches to the determination of minimum regulatory capital requirements which would further strengthen the soundness and stability of the international banking system. Banks will be able to choose between three levels of sophistication to calculate regulatory capital for credit and operational risk and this will change the way that many banks evaluate, measure and report capital adequacy. To ensure that the most appropriate approaches are being used, banks are incentivized to move to the more sophisticated methods by a reduction in the regulatory capital charge. Under the current timetable, the new Accord will become fully effective at the end of 2007.
The Basel 2 Capital Accord will be implemented into European Union law through the Capital Requirements Directive which was passed through its first reading by the Council of Ministers and the European Parliament on October 27, 2005.
The New Accord introduces more emphasis on risk sensitivity, supervisory review and market discipline (through more extensive disclosures). The impact of the new regulation is not expected to increase the capital requirements, but will increase its volatility.
Concentration of Risk
Spanish banks may not have exposure to a single person or group in excess of 25% (20% in the case of an affiliate) of the bank’s or group’s consolidated equity. Any exposure to a person or group exceeding 10% of a bank’s or group’s consolidated equity is deemed a concentration and the total amount of exposure represented by all of such concentrations must not exceed 800% of such equity.
Legal Reserve and Other Reserves
Spanish banks are subject to legal and other restricted reserves requirements. In addition, we must allocate profits to certain other reserves as described under Note 33 to our consolidated financial statements.
Allowances for Credit Losses and Country-Risk
For a discussion of Bank of Spain regulations relating to allowances for credit losses and country-risk, see “Item 4. Information on the Company—B.Business Overview—Selected Statistical Information—Classified Assets—Bank of Spain Classification Requirements”.
Employee Pension Plans
At December 31, 2005, our pension plans were all funded according to Bank of Spain requirements. See Note 25 to our consolidated financial statements.
Restrictions on Dividends
We may only pay dividends (including interim dividends) if such payment is in compliance with the Bank of Spain’s minimum capital requirement (described under “Item 4. Information on the Company—B. Business Overview—Capital Adequacy Requirements”) and other requirements or, as described below, under certain circumstances when we have capital that is 20% or less below the Bank of Spain’s minimum capital requirements.
If a banking group meets this capital requirement, it may dedicate all of its net profits to the payment of dividends, although in practice Spanish banks normally consult with the Bank of Spain before declaring a dividend. Even if a banking group meets the capital requirement as a group, any consolidated Spanish credit entity that is a subsidiary that does not meet the capital requirement on its own will be subject to the limitations on dividends described below. If a banking group or any Spanish credit entity subsidiary of the group has capital that is 20% or less below the Bank of Spain’s minimum capital requirement, it must devote an amount of net profits (at least 50%) determined by the Bank of Spain to reserves, and dividends may be paid out of the remainder only with the prior approval of the Bank of Spain. If the capital is 20% or more below the minimum requirement, it may not pay any dividends and must allocate all profits to reserves. In the case of a banking group failing to meet the capital requirement, however, consolidated subsidiaries in the group may pay dividends without restriction, so long as they are at least 90% owned by group companies and, if they are credit entities, independently comply with the capital requirement.
77
If a bank has no net profits, its board of directors may propose at the general meeting of shareholders that a dividend be declared out of retained earnings. However, once the board of directors has proposed the dividend to be paid, it must submit the proposal to the Minister of Economy and Finance who, in consultation with the Bank of Spain, may in his discretion authorize or reject the proposal of the board.
Compliance with such requirements notwithstanding, the Bank of Spain is empowered to advise a bank against the payment of dividends on security and soundness grounds. If such advice is not followed, the Bank of Spain may require that notice of such advice be included in the bank’s annual report registered before the Mercantile Register. In no event may dividends be paid from certain legal reserves.
Interim dividends of any given year may not exceed the net profits for the period from the closing of the previous fiscal year to the date on which interim dividends are declared. In addition, the Bank of Spain recommends that interim dividends not exceed an amount equal to one-half of all net income from the beginning of the corresponding fiscal year. Although banks are not legally required to seek prior approval from the Bank of Spain before declaring interim dividends, the Bank of Spain has asked that banks consult with it on a voluntary basis before declaring interim dividends.
Limitations On Types Of Business
Spanish banks generally are not subject to any prohibitions on the types of businesses that they may conduct, although they are subject to certain limitations on the types of businesses they may conduct directly.
The activities that credit institutions authorized in another Member State of the European Union may conduct and which benefit from the mutual recognition within the European Union are detailed in article 52 of Law 26/1988 (July 29, 1988).
Deposit Guarantee Fund
The Deposit Guarantee Fund on Credit Institutions (“Fondo de Garantía de Depósitos”, or the “FGD”), which operates under the guidance of the Bank of Spain, guarantees in the case of our Spanish banking subsidiaries: (i) bank deposits up to €20,000 per depositor; and (ii) securities and financial instruments which have been relied to a credit institution for its deposit, register or for such other service, up to €20,000 per investor. Pursuant to regulations affecting the FGD, the FGD may purchase non-performing loans or may acquire, recapitalize and sell banks which experience difficulties.
The FGD is funded by annual contributions from member banks. The amount of such bank’s contributions is currently 0.6 per thousand (0.4 per thousand for savings banks and 0.8 per thousand for credit cooperatives) of the year-end amount of deposits to which the guarantee extends. For that purpose, the calculation basis will take into consideration the bank deposits, plus 5% of the market quotation (or nominal value or redemption value in case the securities are not traded in any secondary market) of the guaranteed securities at the end of the financial year. Nevertheless, the Minister of Economy and Finance may reduce the member bank contributions once the capital of the FGD resources exceeds its requirements, and suspend further contributions when the FGD’s funds exceed the requirement by 1% or more of the calculation basis.
At December 31, 2005, the Bank and its domestic bank subsidiaries were members of the FGD and thus were obligated to make annual contributions to it.
Data Protection
Law 15/1999, dated December 13, 1999, establishes the requirements relating to the treatment of customers’ personal data by credit entities. This law requires credit entities to notify the Spanish Data Protection Agency prior to creating files with a customer’s personal information. Furthermore, this law requires the credit entity to identify the persons who will be responsible for the files and the measures that will be taken to preserve the security of those files. The files must then be recorded in the Data Protection General Registry, once compliance with the relevant requirements has been confirmed. Credit entities that breach this law may be subject to claims by the interested parties before the Data Protection Agency. The Agency, which has investigatory and sanctioning capabilities, is the Spanish Authority responsible for the control and supervision of the enforcement of this law.
78
Recent Legislation
Royal Legislative Decree 3/2004, consolidated all the existing legislation regarding personal income tax into a single law and abolished existing law on the subject, including Law 40/1998 which was the primary source of regulation.
Royal Legislative Decree 4/2004, consolidated all the existing legislation regarding corporate income tax into a single law and abolished existing law on the subject, including Law 43/1995 which was the primary source of regulation.
Royal Legislative Decree 5/2004, consolidated all the existing legislation regarding taxation of non-resident individuals and entities into a single law and abolished existing law on the subject, including Law 41/1998 which was the primary source of regulation.
Royal Decree 1777/2004 further developed Royal Decree Law 4/2004 relating to corporate income tax.
On July 30, 2004, Royal Decree 1778/2004 was approved, introducing reporting obligations for (i) preferred participations and other debt instruments and (ii) certain income generated by individuals in the European Union.
Royal Legislative Decree 6/2004, consolidated the existing legislation regarding the regulation and supervision of private insurance.
Circular 4/2004 (December 22, 2004) of the Bank of Spain to financial institutions sets standards on public and restricted information and official forms for financial statements, in order to adapt the accounting system of Spanish credit institutions to IFRS. See “Item 3. Key Information –D. Risk factors”.
Law 3/2004 (December 29, 2004) establishes measures against non-performance of commercial transactions.
Royal Decree 54/2005 modifies the regulations on prevention of money laundering, to adapt to Law 19/2003, approved by Royal Decree 925/1995, and other standards to regulate the banking, finance and insurance systems.
Royal Decree Law 5/2005 (i) amends the Securities Market Law 24/1988 in order to implement the Directive 2003/71/EC of the European Parliament and of the Council on the prospectus to be published when securities are offered to the public or admitted to trading; and (ii) implements the Directive 2002/47/EC of the European Parliament and of the Council on financial collateral arrangements. See “Item 9. The Offer and Listing – C. Markets – Spanish Securities Market – Securities Market Legislation”.
Circular 1/2005 of the CNMV, amends the official forms used to report periodic public information of the companies whose securities are traded on Spanish Stock Exchanges.
Law 6/2005 (April 22) relates to solvency and liquidation of credit entities.
Law 5/2005 (April 22) on supervision of financial conglomerates, amends other laws applicable to the financial sector. This law partially implements the Directive 2002/87/EC of the European Parliament and of the Council on the supplementary supervision of credit institutions, insurance undertakings and investment firms in a financial conglomerate. The two objectives of this law are (i) to establish a specific regime of prudential supervision for financial conglomerates that provide services and products in different sectors of the financial markets and (ii) to harmonize the existing sectorial rules between the different groups with homogeneous financial activities, such as credit institutions, insurance undertakings and investment firms with the rules of the financial conglomerates.
Royal Decree 1309/2005 (November 4) approves the regulations of Law 35/2003 referred for undertakings of collective investments, and adapts the tax regime of such undertakings.
Royal Decree 1310/2005 (November 4) partially develops title III and IV of the Securities Market Law, in relation to the admission to trading of securities in Spanish official secondary markets, the public offerings of securities and the prospectus required to those effects. This Royal Decree completes the implementation into Spanish law of the EU Prospectus Directive (2003/71/EC), relating to the prospectus that must be published when securities are offered to the public or admitted to trading.
Law 19/2005 (November 14), on the European public limited-liability companies domiciled in Spain, encourages the establishment of this new corporate form in the Spanish legal system. It makes the relevant amendments to the Spanish “Ley de Sociedades Anónimas” (“Companies Law”) and to the Securities Market Law, to implement the Council Regulation number 2157/2001/EC on the Statute for the European public limited-liability company.
79
Law 25/2005 (November 24) regulates capital risk entities and their management companies and introduces a more flexible legal framework for such entities.
Royal Decree 1332/2005 (November 11) develops Law 5/2005 and amends other laws relating to supervision of financial conglomerates. This Royal Decree implements the Directive 2002/87/EC of the European Parliament and of the Council on the supplementary supervision of credit institutions, insurance undertakings and investment firms in a financial conglomerate, which was initially implemented by Law 5/2005.
Royal Decree 1333/2005 (November 11) develops the Securities Market Law and completes the implementation of the European community regulation relating to market abuse. This Royal Decree on market abuse refers to the definition and public disclosure of insider dealing and the definition of market manipulation, the notification of managers’ transactions, and the fair presentation of investment recommendations and the disclosure of conflicts of interest.
Also, please see our above discussion of the New Basel Capital Accord under “Capital Adequacy Requirements”.
United Kingdom Regulation
FSA
Since our acquisition of Abbey in 2004, Abbey has continued to be regulated by the UK Financial Services Authority. Our branch in the United Kingdom is also regulated by the Financial Services Authority. The Financial Services Authority is the single statutory regulator responsible for regulating deposit taking, mortgages, insurance and investment business pursuant to the Financial Services and Markets Act 2000. It is a criminal offense for any person to carry on any of the activities regulated under this Act in the United Kingdom by way of business unless that person is authorized by the Financial Services Authority or falls under an exemption.
The Financial Services Authority has authorized Abbey, as well as some of its subsidiaries, to carry on certain regulated activities. The regulated activities they are authorized to engage in depend upon permissions granted by the Financial Services Authority. The main permitted activities of Abbey and its subsidiaries are described below.
Mortgages
Lending secured on land at least 40% of which is used as a dwelling by an individual borrower or relative has been regulated by the Financial Services Authority since October 31, 2004. Abbey is authorized to enter into, advise and arrange regulated mortgage contracts.
Banking
Deposit taking is a regulated activity that requires a firm to be authorized and supervised by the Financial Services Authority. Abbey has permission to carry on deposit taking as do several of its subsidiaries, including Abbey National Treasury Services plc and Cater Allen Limited.
Insurance
United Kingdom banking groups may provide insurance services through other group companies. Insurance business in the United Kingdom is divided between two main categories: long-term assurance (whole life, endowments, life insurance investment bonds) and general insurance (building and contents cover and motor insurance). Under the Financial Services and Markets Act 2000, effecting or carrying out any contract of insurance, whether general or long-term, is a regulated activity requiring authorization. Life insurance mediation has been subject to regulation for many years. Brokering of long-term insurance (for example, critical illness) became regulated on October 31, 2004. General insurance mediation has been subject to regulation by the Financial Services Authority since January 14, 2005.
Abbey has a number of subsidiaries which are authorized by the Financial Services Authority to effect contracts of insurance. Abbey also acts as a broker, receiving commissions for the policies arranged.
80
Investment business
Investment business such as dealing in, arranging deals in, managing and giving investment advice in respect of most types of securities and other investments, including options, futures and contracts for differences (which would include interest rate and currency swaps) and long-term assurance contracts are all regulated activities under the Financial Services and Markets Act 2000 and require authorization by the Financial Services Authority.
Abbey and a number of its subsidiaries have permission to engage in a wide range of wholesale and retail investment businesses including selling certain life assurance and pension products, unit trust products and Individual Savings Accounts (tax exempt saving products) and providing certain retail equity products and services.
OFT
The Office of Fair Trading in the United Kingdom (“OFT”) has a role in ensuring that business practices are fair and competitive.
The Office of Fair Trading Payments Systems Task Force was established to consider issues relating to competition, innovation and efficiency in the UK payments systems. Its initial focus is on a faster electronic payments scheme in the UK.
The OFT also has the power to investigate terms in consumer contracts which are reported as unfair.
United States Regulation
By virtue of the operation of our branch in New York City, our agency in Miami and Banesto’s branch in New York City, as well as our ownership of a bank in Puerto Rico, we are subject to the U.S. Bank Holding Company Act of 1956, as amended, and the U.S. International Banking Act of 1978, as amended. These statutes impose limitations on the types of business conducted by us in the United States and on the location and expansion of our banking business in the United States. We are subject to supervision and regulation by the Board of Governors of the Federal Reserve System. In addition, our branch and agency offices are subject to supervision and regulation by state banking departments in the states in which they operate, and Sovereign is subject to supervision and regulation as a savings-and-loan holding company by the Office of Thrift Supervision.
Monetary Policy and Exchange Controls
The decisions of the European System of Central Banks influence conditions in the money and credit markets, thereby affecting interest rates, the growth in lending, the distribution of lending among various industry sectors and the growth of deposits. Monetary policy has had a significant effect on the operations and profitability of Spanish banks in the past and this effect is expected to continue in the future. Similarly, the monetary policies of governments in other countries in which we have operations, particularly in Latin America and, following the acquisition of Abbey, in the United Kingdom, affect our operations and profitability in those countries. We cannot predict the effect which any changes in such policies may have upon our operations in the future, but we do not expect it to be material.
The European Monetary Union has had a significant effect upon foreign exchange and bond markets and has involved modification of the internal operations and systems of banks and of inter-bank payments systems. Since January 1, 1999, the start of Stage III, see “Item 4. Information on the Company—B. Business Overview — Supervision and Regulation—Bank of Spain and the European Central Bank,” Spanish monetary policy has been affected in several ways. The euro has become the national currency of the twelve participating countries and the exchange rates between the currencies of these countries were fixed to the euro. Additionally, the European System of Central Banks became the entity in charge of the European Union’s monetary policy.
Banco Santander Central Hispano, S.A. is the parent company of the Group which was comprised at December 31, 2005 of 664 companies that consolidate by the global integration method. In addition, there are 99 companies that are accounted for by the equity method.
See Exhibits I, II and III to our consolidated financial statements included in this Form 20-F, for details on our consolidated and non-consolidated companies.
81
D. Property, plant and equipment.
During 2005, the Bank and its bank subsidiaries either leased or owned premises in Spain and abroad, which at December 31, 2005 included 4,510 branch offices in Spain and 5,691 abroad. See Note 16 to our consolidated financial statements.
Item 4A. Unresolved Staff Comments
As of the date of filing of this annual report on Form 20-F, we have not received any written comments from the SEC regarding our periodic reports that remain unresolved.
Item 5. Operating and Financial Review and Prospects
Critical Accounting Policies
Our primary financial statements have, for the first time, been prepared in accordance with International Financial Reporting Standards as adopted by the European Union (“IFRS”), which also comply with International Financial Reporting Standards as issued by International Accounting Standards Board (“IASB”). A broader and more detailed description of the accounting policies we employ is shown in Notes 1 and 2 to our consolidated financial statements.
The date of our transition to IFRS and the date of our opening IFRS balance sheet was January 1, 2004. Additional information about the transition from previous Spanish GAAP to IFRS may be found in Note 57 to our consolidated financial statements. On initial adoption of IFRS, the main exemptions applied by us from the requirements of IFRS and from their retroactive application as permitted by IFRS 1 “First-time Adoption of International Financial Reporting Standards” (IFRS 1) were as follows:
| 1. | Cumulative exchange differences: previous cumulative exchange differences of all foreign operations, which amounted to €3,254 million, were definitively charged against reserves as of January 1, 2004. There was no impact on stockholders’ equity. |
| 2. | Derecognition of financial instruments: financial assets and liabilities derecognized at December 31, 2003 under previous Spanish GAAP were not recognized in the opening balance sheet. The impact of this exemption is not significant. |
| 3. | Non-current assets held for sale: the allowances recorded for foreclosed assets existing at January 1, 2004 and still held at the reporting date reduced the value of these assets. This change has no impact on our financial statements. |
| 4. | Business combinations: the accounting treatment of business combinations discussed in Note 2-b to our consolidated financial statements is not applicable to business combinations performed prior to January 1, 2004. The impact of this exemption on our financial statements can not be calculated without making assumptions with significant uncertainty. |
Additionally, the application of certain IFRS accounting principles requires a significant amount of judgment based upon estimates and assumptions that could involve significant uncertainty at the time they are made (see Note 1-c to our consolidated financial statements). Also changes in assumptions may have a significant impact on the financial statements in the periods where assumptions are changed. Following our accounting procedures, these judgments or changes in assumptions are submitted to our Audit and Compliance Committee and/or to our regulatory authorities and are disclosed in the notes to our consolidated financial statements.
Management bases its estimates and judgment on historical experience and on various other factors that are believed to be reasonable under these circumstances. Actual results may differ from these estimates under different assumptions and conditions.
82
We believe that of our significant accounting policies, the following may involve a high degree of judgment:
Fair value of financial instruments
Trading assets or liabilities, financial instruments that are classified at fair value through profit or loss, available for sale securities, and all derivatives, are recorded at fair value on the balance sheet. The fair value of financial instruments is the value at which the financial instrument could be bought or sold in a current transaction between willing parties. If a quoted market price is available for an instrument, the fair value is calculated based on the market price.
If there is no market price for a given financial asset, its fair value is estimated on the basis of the price established in recent transactions involving similar instruments and, in the absence thereof, on the basis of valuation techniques sufficiently used by the international financial community, taking into account the specific features of the instrument to be measured and, particularly, the various types of risk associated with it.
We use derivative financial instruments for both trading and non-trading activities. The principal types of derivatives used are interest rate swaps, future rate agreements, interest rate options and futures, foreign exchange forwards, foreign exchange futures, foreign exchange options, foreign exchange swaps, cross currency swaps, equity index futures and equity options. The fair value of standard derivatives is calculated based on market price.
The fair value of over-the-counter (“OTC”) derivatives is taken to be the sum of the future cash flows arising from the instrument, discounted to present value at the date of measurement (“present value” or “theoretical close”) using valuation techniques commonly used by the financial markets: “net present value” (NPV), option pricing models and other methods. Financial derivatives whose underlyings are equity instruments the fair value of which cannot be reliably measured and which are settled through delivery thereof are measured at cost. The determination of fair value requires us to make estimates and certain assumptions. If quoted market prices are not available, we have to calculate the fair value from commonly used pricing models that consider contractual prices for the underlying financial instruments, yield curves and other relevant factors. Our use of different estimates or assumptions in these pricing models could lead to different amounts being recorded in our consolidated financial statements.
Equity instruments whose fair value cannot be determined in a sufficiently objective manner and financial derivatives that have those instruments as their underlying and are settled by delivery of those instruments are measured at acquisition cost adjusted, where appropriate, by any related impairment loss.
Following is a summary of the various valuation techniques used by us to measure the financial instruments included in “Financial Assets Held for Trading” and “Other Financial Assets at Fair Value through Profit or Loss” on the asset side of the consolidated balance sheet and in “Financial Liabilities Held for Trading”, “Financial Liabilities at Fair Value through Profit or Loss” and “Financial Liabilities at Fair Value through Equity” on the liability side of the consolidated balance sheet at December 31, 2005:
Market Value Based on: |
| Assets |
| Liabilities |
|
|
|
| |||
Public price quotations in active markets |
| 61.3 | % | 35.2 | % |
Internal valuation models with observable market data |
| 38.5 | % | 64.5 | % |
Internal valuation models with non-market data |
| 0.2 | % | 0.3 | % |
|
|
|
| ||
| 100.0 | % | 100.0 | % | |
|
|
|
|
Allowances for credit losses
Financial assets accounted for at amortized cost and contingent liabilities are assessed for objective evidence of impairment and required allowances and provisions are estimated in accordance with IAS 39. Impairment exists if the book value of a claim or a portfolio of claims exceeds the present value of the cash flows actually expected in future periods.
Impairment losses on these impaired assets and contingent liabilities are assessed as follows:
| • | Individually, for all significant debt instruments and for instruments which, although not material, are not susceptible to being classified in homogeneous groups of instruments with similar risk characteristics: instrument type, debtor’s industry and geographical location, type of guarantee or collateral, and age of past-due amounts, taking into account: (i) the present value of future cash flows, discounted at an appropriate discount rate; (ii) the debtor’s financial situation; and (iii) any guarantees in place. |
| • | Collectively in all other cases. We classify transactions on the basis of the nature of the obligors, the conditions of the countries in which they reside, transaction status and type of collateral or guarantee, and age of past-due amounts. For each risk group, we establish the appropriate impairment losses (“identified losses”) that must be recognized. |
| • | Additional allowance for credit losses: Additionally, we recognize an impairment allowance for credit losses taking into account the historical loss experience and other circumstances known at the time of assessment. For these purposes, credit losses are losses incurred at the reporting date calculated using statistical methods that have not yet been allocated to specific transactions. |
The Group has implemented a methodology which complies with IFRS and is consistent with by the Bank of Spain requirements related to the determination of the level of provisions required to cover inherent losses. The aforementioned methodology takes as the first step the classification of portfolios considered as normal risk (debt instruments not valued at their fair value with changes in the income statement, as with contingent risks and contingent commitments) in the following groups, according to the associated level of risk:
| (i) | No appreciable risk. | |
| (ii) | Low risk. | |
| (iii) | Medium-low risk. | |
| (iv) | Medium risk. | |
| (v) | Medium-high risk. | |
| (vi) | High risk. |
Once the portfolios have been classified in the aforementioned groups, the Bank of Spain, based on its experience and the information available to it with respect to the Spanish banking sector, has determined the method and amount of the parameters that entities should apply in the calculation of the provisions for inherent losses in debt instruments and contingent risks classified as normal risk.
The methodology of the calculation establishes that the charge for inherent losses to be made in each period will be equal to: (i) the sum of multiplying the value, positive or negative, of the variation in the period of the balance of each class of risk by the constant α corresponding to that class, plus (ii) the sum of multiplying the total amount of the operations included in each class at the end of the period by the relevant β, minus (iii) the amount of the net charge for the specific provision made in the period.
The parameters α and β as determined by Bank of Spain's guidance take into account historic inherent losses and adjustments to reflect the current economic circumstances.
The provision for credit losses recorded by the Santander Group as at December 31, 2005, taking into account this methodology as outlined above, was €8,213 million.
83
Additionally, and with the objective of ensuring that the provisions resulting from the application of the statutory criteria are reasonable, our Group estimates the provisions to be made to create these allowances using models based on our own credit loss experience and management’s estimates of future credit losses. The Group has developed internal risk models, based on historical information available for each country and type of risk (homogenous portfolios); a full disclosure of our credit risk management system is included in Item 11. Quantitative and Qualitative Disclosures about Market Risk Part 3. Credit Risk. These models produce a range of results that comprises the level of provisions that we arrive to using the model established by the Bank of Spain as explained below. These internal models may be applied in future periods but are subject to local regulatory review (the Bank of Spain). In order for each internal model to be considered valid by the local regulator, the calculation should be methodologically correct, and be supported by historical information which covers at least one complete economic cycle and stored in databases which are consistent with information that has been audited by both the Group Internal Audit function and external Auditors.
With respect to this matter, since 1993 the Group has employed its own models for assigning solvency and internal ratings, which aim to measure the degree of risk of a client or transaction. Each rating corresponds to a certain probability of default or non-payment, based on the Group’s past experience. The development of the internal model has led to the introduction of databases that can be used to accurately estimate the risk parameters required in the calculation of capital and expected loss, following best practices on the market and the guidelines of the New Capital Accord (Basel II).
Generally speaking, although there should be no substantial difference in the calculation of loan allowances between IFRS and U.S. GAAP, however, the Bank has included in the reconciliation of stockholders equity and net income a difference between IFRS and U.S. GAAP related to the determination of allowance losses not allocated to specific loans.
According to U.S. GAAP, the loan loss allowance should represent the best estimate of probable losses in possible scenarios. Under IFRS and following Bank of Spain’s regulations, the Bank has additionally applied the statistical percentages obtained from historical trends as determined by the Bank of Spain’ guidance (Circular). As a result, the loan allowances not allocated to specific loans, as determined by the Circular, are higher than those meeting the requirements of U.S. GAAP, being the amounts determined under both GAAP within the range of possible estimated losses calculated internally by the Group.
The estimates of the portfolio’s inherent risks and overall recovery vary with changes in the economy, individual industries, countries and individual borrowers’ or counterparties’ ability and willingness to repay their obligations. The degree to which any particular assumption affects the allowance for credit losses depends on the severity of the change and its relationship to the other assumptions.
Key judgments used in determining the allowance for loan losses include: (i) risk ratings for pools of commercial loans and leases, (ii) market and collateral values and discount rates for individually evaluated loans, (iii) product type classifications for consumer and commercial loans and leases, (iv) loss rates used for consumer and commercial loans and leases, (v) adjustments made to assess current events and conditions, (vi) considerations regarding domestic, global and individual countries economic uncertainty, and (vii) overall credit conditions.
CLASSIFICATION DIFFERENCES BETWEEN IFRS AND U.S. GAAP
Credit losses are generally recognized through provisions to allowances for credit losses, well before the removal from the balance sheet. Under certain unusual circumstances (for example: bankruptcy, insolvency, etc.), the loss could be directly recognized through write-offs.
Provisions to specific allowances come from the impairment process. Loans are identified as impaired and placed on a non-accrual basis when it is determined that collection of the payment of interest or principal is doubtful or when the interest or principal has been past due for 90 days or more, except when the loan is well secured and in the process of collection.
Globally managed clients, corporate, sovereign and other large balance loans are evaluated on an individual basis based on the borrower’s overall financial condition, resources, guarantees and payment record. Impairment is determined when there are doubts about collection, or when interest or principal is past due for 90 days or more.
Consumer mortgage, installment, revolving credit and other consumer loans are evaluated collectively, and their impairment is established when interest or principal is past due for 90 days or more.
According to Bank of Spain requirements non-performing loans must be 100% provisioned (hence all the credit loss recognized) when they are more than 24 months overdue (more than 6 years in secured mortgage loans).
When a loan is deemed partially uncollectible, the credit loss is charged against earnings through provisions to credit allowances instead of through partial write-offs of the loan, since Bank of Spain does not permit partial write-offs of impaired loans. If a loan becomes entirely uncollectible, its allowance is increased until it reaches 100% of the loan balance. Generally speaking, credit loss recognition under IFRS and U.S. GAAP are similar.
The credit loss recognition process is independent of the process for the removal of impaired loans from the balance sheet. The entire loan balance is kept on the balance sheet until any portion of it has been classified as non-performing for 4 years, or up to 6 years for some secured mortgage loans (maximum period established in the Bank of Spain regulations), depending on our management’s view as to the recoverability of the loan. After that period the loan balance and its 100% specific allowance are removed from the balance sheet and recorded in off-balance sheet accounts, with no resulting impact on net income attributable to the Group at that time. Under U.S. GAAP, this loan would be removed from the balance sheet earlier.
An additional allowance for credit losses attributed to the remaining portfolio is established via a process that considers the potential loss inherent in the portfolio. Also, an allowance is recorded for those exposures where the transfer risk adds some doubts as to the collection of debts (the Country-risk Allowance).
Given that loans are presented on the balance sheet net of their credit allowances, there are no significant differences of presentation in the amounts disclosed on the balance sheet under IFRS or U.S. GAAP. However, our non-performing loans under IFRS include balances that would have been removed from the balance sheet under U.S. GAAP. This classification difference is precisely the specific allowance for credit losses, which does not exist under U.S. GAAP.
Impairment of goodwill
Management, as explained in Notes 2 and 17 to our consolidated financial statements, have to consider at least annually (or whenever there is any indication of impairment), whether the current carrying value of goodwill is impaired (i.e. a potential reduction in its recoverable value to below its carrying amount). An impairment loss recognized for goodwill may not be reversed in a subsequent period.
The first step of the impairment review process requires the identification of the cash-generating units (a CGU is the smallest identifiable group of assets that, as a result of continuing operations, generates cash inflows that are largely independent of the cash inflows from other assets or groups of assets). The goodwill is then allocated to these cash-generating units; this allocation is reviewed following business reorganization. The carrying value of the cash-generating unit, including the allocated goodwill, is compared to its fair value to determine whether any impairment exists. To calculate these fair values, management may use quoted prices, if available, appraisals made by independent external experts or internal estimations.
Assumptions about expected future cash flows require management to make estimations and judgments. For this purpose, management analyzes the following: (i) certain macroeconomic variables that might affect its investments (including population data, political situation, economic situation as well as the banking system’s penetration level); (ii) various microeconomic variables comparing our investments with the financial industry of the country in which we carry on most of our business activities (breakdown of the balance sheet, total funds under management, results, efficiency ratio, capital ratio, return on equity, among others); and (iii) the price earnings (P/E) ratio of the investments as compared with the P/E ratio of the stock market in the country in which the investments are located and that of comparable local financial institutions.
84
The goodwill impairment testing in 2005 indicated that none of the goodwill was impaired. In 2004 we recorded goodwill impairment losses of €138.2 million under IFRS (mainly related to our investments in Venezuela and Colombia, which were adjusted in prior years for U.S. GAAP reconciliation purposes).
Retirement Benefit Obligations
We provide pension plans in most parts of the world. For defined contributions plans, the pension cost registered in the consolidated income statement represents the contribution payable to the scheme. For defined benefit plans, the pension cost is assessed in accordance with the advice of a qualified external actuary using the projected unit credit method. This cost is annually charged to the consolidated income statement.
The actuarial valuation is dependent upon a series of assumptions, the key ones being as follows:
| • | assumed interest rates; |
| • | mortality tables; |
| • | annual social security pension revision rate; |
| • | price inflation; |
| • | annual salary growth rate, and |
| • | the method used to calculate vested commitments to current employees. |
The difference between the fair value of the plan assets and the present value of the defined benefit obligation at the balance sheet date, adjusted for any historic unrecognized actuarial gains or losses and past service cost, is recognized as a liability in the balance sheet.
Further information on retirement benefit obligations is set out in Notes 2 and 25 to our consolidated financial statements.
Significant accounting policies with respect to our reconciliation from IFRS to U.S. GAAP
We include a reconciliation of net income and stockholders’ equity between our primary financial statements under IFRS and U.S. GAAP within Note 58 to our consolidated financial statements. The preparation of this reconciliation requires management to consider accounting policies under U.S. GAAP to determine whether or not a difference in GAAP exists, and to quantify the amount of that difference where appropriate. These policies may also be based on difficult or subjective judgments, estimates based on past experience and assumptions determined to be reasonable and realistic based on the related circumstances.
Unless indicated otherwise, all of the significant accounting policies identified above, are equally critical to the preparation of the U.S. GAAP reconciliation, and involve similar judgment and assumptions by management.
Business combinations and goodwill
Goodwill and intangible assets include the cost of acquired subsidiaries in excess of the fair value of the tangible net assets recorded in connection with acquisitions. Acquired intangible assets include core deposits, customer lists, brands and assets under management. Accounting for goodwill and acquired intangible assets requires management’s estimate regarding: (1) the fair value of the acquired intangible assets and the initial amount of goodwill to be recorded, (2) the amortization period (for identified intangible assets other than goodwill) and (3) the recoverability of the carrying value of acquired intangible assets.
To determine the initial amount of goodwill to be recorded upon an acquisition, we have to determine the consideration and the fair value of the net assets acquired. We use independent appraisers and our internal analysis, generally based on discounted cash flow techniques, to determine the fair value of the net assets acquired and non-cash components of the consideration paid. The actual fair value of net assets acquired could differ from the fair value determined, resulting in an under- or over-statement of goodwill.
We test goodwill for impairment at the reporting unit level. We determine our reporting units one level below our business segment, based on our management structure. We keep those reporting units unchanged unless business segment reorganization occurs.
The useful lives of acquired intangible assets are estimated based on the period over which the assets are expected to contribute directly or indirectly to the future cash flows of the acquired entity.
85
The amortization period under U.S. GAAP is reviewed annually in light of the above factors for acquired intangible assets. In making these assumptions, we consider historical results, adjusted to reflect current and anticipated operating conditions. Because a change in these assumptions can result in a significant change in the recorded amount of acquired intangible assets, we believe the accounting for business combinations is one of our critical accounting estimates.
In 2004, we acquired Abbey. As a result of this transaction a significant amount of goodwill was registered (see Note 17 to our consolidated financial statements). As the business combination was performed close to the end of the year and because of the complexity of the process, the determination of goodwill for U.S. GAAP purposes as well as the identification and recognition of intangible assets was not yet concluded. Management required an independent appraisal for the intangible assets identification and valuation. In 2005, as a result of these appraisals, we revised our allocation of the goodwill resulting from the Abbey acquisition. As a result, the goodwill in acquisition under U.S.GAAP was €1,437,078 thousand lower than the IFRS calculation. See details of the revision in Note 58.6.H to our consolidated financial statements.
In 2005 we have not recorded any goodwill impairment losses under U.S. GAAP.
Investment Securities
Under IFRS when there is evidence that a reduction in the fair value of a debt security is due to impairment, the unrealized loss is charged to net income but, if afterwards it recovers its value, the impairment losses are subsequently reversed. The process is similar in the case of equity securities except that any recovery in the value of the equity security is registered as a positive valuation adjustment with no profit being recognized.
Under U.S. GAAP, impairment losses cannot be reversed, and the criterion to determine if other-than-temporary impairment exists is different.
We conduct reviews to assess whether other-than-temporary impairment exists. These reviews consist (i) on the identification of the securities that maintain impairments during the last six months, and (ii) on the determination of the value of the impairment that is not expected to be easily recovered. Changing global and regional conditions and conditions related to specific issuers or industries, could adversely affect these values. Changes in the fair values of trading securities are recognized in earnings.
Variable Interest Entities
FIN 46-R defines and identifies “Variable Interest Entity” (VIE) if it has (1) equity that is insufficient to permit the entity to finance its activities without additional subordinated financial support from other parties, (2) equity investors that cannot make significant decisions about the entity’s operations, or that do not absorb the expected losses or receive the expected returns of the entity or (3) equity investors that have voting rights that are not proportionate to their economic interests and substantially all the activities of the entity involved, or are conducted on behalf of, an investor with a disproportionately small voting interest. A VIE is consolidated by its primary beneficiary, which is the party involved with the VIE that has a majority of the expected losses or a majority of the expected residual returns or both. FIN 46-R requires evaluating many Special Purposed Vehicles and in some cases making some judgments.
Under IFRS, these companies are consolidated by using the global integration method or the proportional consolidation method. The use of one method instead of the other has no impact on the consolidated stockholders’ equity or on the consolidated net income attributable to shareholders. The adoption of FIN 46-R had no effect on stockholders’ equity or net income, but changed the consolidation perimeter under U.S. GAAP, requiring the consolidation of some entities that previously were not consolidated (such as some securitization vehicles) and excluding others that previously were consolidated. Most of these changes in the consolidation perimeter were the same as those arising in the first adoption of IFRS.
We have based the following discussion on our consolidated financial statements. You should read it along with these financial statements, and it is qualified in its entirety by reference to them. On January 1, 2005, the IFRS came into effect in Spain. As a result, our financial statements for the year ended December 31, 2005, have been prepared according to IFRS and the financial statements for the year ended December 31, 2004, have been restated according to the same criteria. We have identified the significant differences between IFRS and U.S. GAAP in Note 58 to our consolidated financial statements included in this annual report on Form 20-F. Note 58.3 also includes reconciliations to U.S. GAAP of net income and stockholders’ equity as reported in our consolidated financial statements. Note 54 to our consolidated financial statements includes financial information for our main business segments.
86
In November 2004, we acquired 100% of the ordinary capital of Abbey. Our acquisition of Abbey was reflected on our financial statements as if the acquisition had occurred on December 31, 2004. Accordingly, Abbey’s assets and liabilities were consolidated into our balance sheet as of December 31, 2004, but Abbey’s results of operations had no impact on our income statement for the year ended December 31, 2004. Beginning January 1, 2005, Abbey’s results of operations were consolidated with the Group’s on our income statement.
In a number of places in this report, in order to analyze changes in our business from period to period, we have isolated the effects of foreign exchange rates on our results of operations and financial condition. In particular, we have isolated the effects of depreciation of local currencies against the euro because we believe that doing so is useful to understand the evolution of our business. For these purposes, we calculate the effect of movements in the exchange rates by multiplying the previous period balances in local currencies by the difference between the exchange rate to the euro of the current and the previous period.
General
We are a financial group whose main business focus is retail banking, complemented by asset management, insurance and global wholesale banking businesses.
Our main source of income is the interest that we earn from our lending activities, by borrowing funds from customers and money markets at certain rate and lending them to other customers at different rates. We also make money from the interest and dividends that we receive from our investments in fixed/variable income and equity securities and from our trading activities with such securities and derivatives, by buying and selling them to take advantage of current and/or expected differences between purchase and sale prices.
Another source of income is the commissions that we earn from the different banking and other financial services that we provide (credit and debit cards, insurance, account management, bill discounting, guarantees and other contingent liabilities, advisory and custody services, etc.) and from our mutual and pension funds management services.
In addition, an occasional source of income comes from the capital gains we can make from the selling of our holdings in Group companies.
2005 Overview
We believe that the following factors had a significant impact on our results of operations and financial condition as of and for the year ended December 31, 2005.
We conducted our business against a background of growth in the global economy of more than 4%. The United States and emerging markets in Asia, particularly China, were again the most dynamic regions. Latin America, which has enjoyed three straight years of robust growth, and Eastern Europe benefited from this expansion. Japan’s economy also continued to recover, and the Euro zone showed signs of improvement as well. The main risks facing this continued expansion are related to the U.S. current account deficit, historically high oil prices, an over-heated real estate market in some countries and consumer confidence.
The U.S. economy grew 3.5% in 2005. The Fed continued to increase its key interest rate, and more interest rate rises are expected given the economy’s strength.
Latin America, as a whole, grew 4% and ended the year with new signs of vitality and lower inflation in Mexico and Brazil, which produced further cuts in interest rates. The region’s currencies appreciated, backed by a positive international context and solid external accounts.
The Euro zone, as a whole, grew 1.4%. Business confidence data, the employment situation and that of companies heralded a faster pace of growth in the first months of 2006. Inflation, driven by oil prices, was 2.4%, above the European Central Bank’s 2% target. The European Central Bank is likely to further increase its repo rate after the increase made in November 2005 (to 2.25%) and in February 2006 (2.50%). The euro slid 13% against the dollar during 2005, ending the year at US$1.18/euro.
The Spanish economy grew 3.4% in 2005, 2% more than the Euro zone. The main drivers were consumption, construction and investment in capital goods, which offset the external sector’s negative contribution. The outlook points to a stabilization at this level, although inflation (4.2% year-on-year in January) and the current account deficit are still high.
87
The UK economy consolidated the slight upturn in the summer (2.5% annualized growth in Q405), thanks to consumption and a still buoyant housing market. Inflation remains at around 2%. The Bank of England held its base rate at 4.5% after decreasing the rate by 25 basis points in August 2005.
Exchange rates had a positive impact of around 4% in 2005, both on earnings and on the balance sheet, as a result of the appreciation of most Latin American currencies.
In this environment, we expanded our business, strongly increased net operating income, made further progress in integrating Abbey, developed global projects and took steps to strengthen our position in order to face future challenges.
Results of Operations for Santander Group
The table below sets forth our results of operations in 2004 and 2005 (with and without consolidating Abbey). Our results of operations for the year ended December 31, 2005 include the consolidation of Abbey line by line and render such information incompatible to the comparable data for the year ended December 31, 2004. We have provided in the table below, and in certain other parts of this annual report, our pro forma results of operations for the year ended December 31, 2005 without consolidating Abbey. This is a non GAAP financial measure that we include in order to facilitate comparison of our results of operations for these periods.
|
| Year ended December 31 |
| ||||||
|
|
| |||||||
|
|
|
| 2005 |
| ||||
|
|
|
|
| |||||
|
| 2004 |
| With |
| Without | Effect of Abbey in consolidation |
| |
|
|
| |||||||
|
| (in thousands of euros) |
| ||||||
Net interest income |
| 7,575,500 |
| 10,493,470 |
| 8,602,510 | 1,890,960 |
| |
Gross income |
| 14,055,247 |
| 19,807,285 |
| 16,020,255 | 3,787,030 |
| |
Net operating income |
| 6,661,576 |
| 9,284,923 |
| 7,877,138 | 1,407,785 |
| |
Profit before tax |
| 4,581,303 |
| 8,154,469 |
| 6,026,230 | 2,128,239 |
| |
Profit from continuing operations |
| 3,984,511 |
| 6,763,293 |
| 5,952,123 | 811,170 |
| |
Consolidated profit for the year |
| 3,996,234 |
| 6,749,770 |
| 5,938,600 | 811,170 |
| |
Profit attributed to minority interests |
| 390,364 |
| 529,666 |
| 529,666 | — |
| |
Profit attributed to the Group |
| 3,605,870 |
| 6,220,104 |
| 5,408,934 | 811,170 |
| |
Summary
Net attributable income as reported in our consolidated financial statements for the year ended December 31, 2005 was €6,220.1 million, an increase of 72.5% from €3,605.9 million in 2004. The 2005 increase was mainly due to net capital gains, increases in net interest income, net fees and commissions, insurance activity and gains on financial transactions all of which were partially offset by increases in operating expenses, depreciation and amortization and corporate taxes.
Excluding Abbey, net attributable income for the year ended December 31, 2005 would have been €5,408.9 million, an increase of 50.0% from €3,605.9 million in 2004.
Capital gains from the sale of our stakes in RBS, Unión Fenosa and Auna amounted to €2,229 million.
Net Interest Income
Net interest income was €10,493.5 million in 2005, a 38.5% or €2,918.0 million increase from €7,575.5 million in 2004. Excluding dividends, net interest income was €10,157.9 million in 2005, a 41.3% or €2,971.4 million increase from €7,186.5 million in 2004.
The €2,918.0 million increase in net interest income is mainly due to the incorporation of Abbey (which accounts for €1,891.0 million of the increase) and, to a lesser extent, to increased business volumes both in Spain and abroad, as well as to the steps taken by our business units to defend customer spreads that offset the decrease in interest rates experienced in some countries.
88
Average total earning assets were €667,119.1 million for the year ended December 31, 2005, a 93.5% or €322,281.5 million increase from €344,837.6 million for the same period in 2004. This increase was due to an increase of €46,240.1 million in the average balances of our domestic total earning assets (mainly due to an increase of €20,826.4 million in the average balances of our domestic loans and credits portfolio and an increase of €26,774.1 million in the average balances of other interest earning assets (mainly derivatives) partially offset by a decrease of €5,545.4 million in the average balances of our debt securities portfolio) and an increase of €276,041.4 million in the average balance of our international total earning assets (mainly due to an increase of €173,071.7 million in the average balances of our international loan and credit portfolio and an increase of €58,082.8 million in the average balances of our debt securities portfolio, increases which are mainly due to the incorporation of Abbey). Our loans and credits balance grew in Spain because of increased secured loans (mainly mortgage lending) and loans to companies resulting in part from continued low interest rates during 2005.
Our overall net yield spread decreased from 2.20% in 2004 to 1.57% in 2005. Domestic net yield spread decreased from 1.78% in 2004 to 1.35% in 2005. This change reflected continued pressure on margins in Spain which was offset by adjustments to our domestic asset mix. The margin pressure in Spain was due to continued low domestic interest rates as well as the continued effects of competition. Expanded volumes in our domestic loans and credits portfolio, which yielded relatively higher returns, improved our domestic asset mix. International net yield spreads decreased from 2.66% in 2004 to 1.69% in 2005 due primarily to the incorporation of Abbey, whose portfolios are affected by lower interest rates and lower margins than our operations in certain Latin American countries.
Share of Results of Entities Accounted for using the Equity Method
Share of results of entities accounted for using the equity method was €619.2 million in 2005, a 37.9% or €170.2 million increase from €449.0 million in 2004. Excluding dividends from companies accounted for by the equity method, share of results of entities accounted for using such method was €438.0 million in 2005, a 60.7% or €165.4 million increase from €272.6 million in 2004.
The €170.2 million increase in 2005 is mainly due to the higher contribution of Cepsa.
The entities providing the largest portions of the contributions in 2005 include the following:
| Percent Owned |
| Contributions to Net Income (1) |
| |
|
|
| |||
Investment |
| Dec. 31, 2005 |
| 2005 |
|
|
|
| |||
|
| (in millions of euros except percentages) |
| ||
Cepsa |
| 32.3 | % | 476.2 |
|
Unión Fenosa |
| 0.0 | %(2) | 78.6 |
|
UCI. |
| 50.0 | % | 19.8 |
|
Attijariwafa Bank |
| 14.5 | % | 16.7 |
|
(1) | Contributions to income from companies accounted for by the equity method include dividends. |
(2) | During 2005, we sold our 22.07% stake in Unión Fenosa. |
Net Fees and Commissions
Net fees and commissions were €6,313.8 million in 2005, a 32.4% or €1,545.2 million increase from €4,768.6 million in 2004. Excluding Abbey, net fees and commissions were €5,355.9 million in 2005, a 12.3% or €587.3 million increase from 2004’s figure.
Net fees and commissions for 2005 and 2004 were as follows:
|
| 2005 | 2004 | Amount Change | % |
| |||
|
| (in millions of euros except percentages) |
| ||||||
Commissions for services |
| 3,717.8 |
| 2,675.6 |
| 1,042.2 |
| 38.9 | % |
Credit and debit cards |
| 621.1 |
| 559.6 |
| 61.5 |
| 11.0 | % |
Insurance |
| 924.5 |
| 524.3 |
| 400.2 |
| 76.3 | % |
Account management |
| 544.9 |
| 446.3 |
| 98.6 |
| 22.1 | % |
Bill discounting |
| 218.4 |
| 268.7 |
| (50.3 | ) | (18.7 | %) |
Contingent liabilities |
| 253.7 |
| 227.2 |
| 26.5 |
| 11.7 | % |
Other operations |
| 1,155.2 |
| 649.5 |
| 505.7 |
| 77.9 | % |
Mutual and pension funds |
| 1,955.9 |
| 1,583.2 |
| 372.7 |
| 23.5 | % |
Securities services |
| 640.1 |
| 509.8 |
| 130.3 |
| 25.6 | % |
|
|
|
|
|
| ||||
Total net fees and commissions |
| 6,313.8 |
| 4,768.6 |
| 1,545.2 |
| 32.4 | % |
|
|
|
|
|
| ||||
89
The €1,545.2 million increase in 2005 resulted mainly from a €400.2 million or 76.3% increase in fees from insurance due to increased activity, a €505.7 million or 77.9% increase in fees from other operations (principally checks) also due to increased activity and a €503 million or 24% increase in fees from mutual and pension funds and securities services due to higher volumes, partially offset by a €50.3 million or 18.7% decrease in fees from bill discounting.
Average balances of mutual funds under management in Spain rose 5.0% from €66.2 billion in 2004 to €69.5 billion in 2005. Average balances of mutual funds abroad increased by 48.6% from €22.2 billion in 2004 to €33.0 billion in 2005, mainly due to the incorporation of Abbey and increased activity in Mexico, Brazil and Switzerland.
Average balances of pension funds in Spain increased by 16.2% from €6.8 billion in 2004 to €7.9 billion in 2005, mainly due to increased activity in individual pension funds. Average balances of pension funds abroad increased by 82.7% from €15.0 billion in 2004 to €27.4 billion in 2005 mainly due to the incorporation of Abbey and increased activity in Chile.
Insurance activity income
Net income from the insurance business was €815.5 million in 2005, a 405.4% or €654.1 million increase from €161.4 million in 2004. This increase was due to a €1,807.0 million or 79.4% increase in insurance and reinsurance premium income, a €4,166.6 million or 841.8% increase in financial income, partially offset by a €5,308.2 million or 528.8% increase on benefits paid and other insurance-related expenses. Abbey’s contribution to this line item accounts for 90% or €589 million of the increase.
Gains (Losses) on Financial Transactions
Net gains on financial transactions were €1,565.3 million in 2005, a 42.2% or €464.6 million increase from €1,100.7 million in 2004. Gains (losses) on financial transactions include gains and losses arising from the following: marking to market our trading portfolio and derivative instruments, including spot market foreign exchange transactions, sales of investment securities and liquidation of our corresponding hedge or other derivative positions, and exchange differences. See Notes 45 and 46 to our consolidated financial statements.
Without considering exchange rate differences, Abbey’s gains on financial transactions represents 74.6%, or €346.8 million, of this increase.
Excluding exchange differences, net gains on financial transactions in 2005 includes net gains of €799.6 million on fixed-income securities (net gains of €438.8 million in 2004); net gains of €686.9 million on equity securities (net gains of €484.0 million in 2004) and net gains of €2.7 million in financial derivatives (net losses of €182.9 million in 2004). In the case of hedging transactions entered into to reduce market risk exposure, any gains and losses on exchange differences and derivatives are generally symmetrical to the gains (losses) recorded on fixed-income securities and equity securities. Net exchange differences in 2005 produced gains of €76.1 million in 2005 as compared to €360.8 million in 2004.
Net Income from Non-financial Activities
Net income from non-financial services generated gains of €426.0 million in 2005, a 22.5% or €78.2 million increase from €347.8 million in 2004. Net income from non-financial services consists mainly of sales of goods and income from services rendered by non-financial companies that consolidate in the Group. Excluding Abbey, net income from non-financial services was €373.9 million in 2005, a 7.5% or €26.1 million increase from 2004.
The amount of the sales of assets and income from the provision of services and the related costs of sales for 2005 and 2004 were as follows:
|
| Thousands of Euros |
| ||||||
|
|
| |||||||
|
| 2005 |
| 2004 |
| ||||
|
|
|
| ||||||
|
| Sales/ |
| Cost of |
| Sales/ |
| Cost of |
|
|
|
|
|
| |||||
Property |
| 960,923 |
| (627,904 | ) | 744,875 |
| (500,829 | ) |
Rail transport |
| 285,207 |
| (233,085 | ) | — |
| — |
|
Other |
| 165,384 |
| (124,493 | ) | 283,583 |
| (179,818 | ) |
|
| 1,411,514 |
| (985,482 | ) | 1,028,458 |
| (680,647 | ) |
90
General Administrative Expenses
General administrative expenses were €9,823.4 million in 2005, a 43.6% or €2,983.5 million increase from €6,839.9 million in 2004.
General administrative expenses for 2005 and 2004 were as follows:
|
| 2005 |
| 2004 |
| Amount |
| % |
|
|
|
|
|
|
| ||||
|
| (in millions of euros except percentages) |
| ||||||
Personnel expenses |
| 5,817.4 |
| 4,324.7 |
| 1,492.7 |
| 34.5 | % |
Other administrative expenses |
| 4,006.0 |
| 2,515.2 |
| 1,490.8 |
| 59.3 | % |
Building and premises |
| 913.7 |
| 542.8 |
| 370.9 |
| 68.3 | % |
Other expenses |
| 904.8 |
| 462.8 |
| 442.0 |
| 95.5 | % |
Information technology |
| 480.5 |
| 326.7 |
| 153.8 |
| 47.1 | % |
Advertising |
| 404.4 |
| 295.9 |
| 108.5 |
| 36.7 | % |
Communications |
| 402.1 |
| 232.6 |
| 169.5 |
| 72.9 | % |
Technical reports |
| 295.8 |
| 204.8 |
| 91.0 |
| 44.4 | % |
Per diems and travel expenses |
| 229.5 |
| 156.8 |
| 72.7 |
| 46.4 | % |
Taxes (other than income tax) |
| 183.6 |
| 125.3 |
| 58.3 |
| 46.5 | % |
Guard and cash courier services |
| 160.3 |
| 138.5 |
| 21.7 |
| 15.7 | % |
Insurance premiums |
| 31.3 |
| 28.9 |
| 2.4 |
| 8.3 | % |
Total general administrative expenses |
| 9,823.4 |
| 6,839.9 |
| 2,983.5 |
| 43.6 | % |
|
|
|
|
|
| ||||
The 43.6% increase in general administrative expenses in 2005 reflected a 34.5% increase in personnel expenses and a 59.3% increase in other administrative expenses. The incorporation of Abbey explains €1,235.7 million of the increase in personnel expenses and €1,078.4 million of the increase in other administrative expenses. Excluding Abbey these increases would have been 5.9% and 16.4%, respectively.
The growth of our operating expenses can be divided into three groups. In Europe, the increases were very contained (even the Santander Network declined a little), except in Santander Consumer Finance that continued to grow during 2005.
The growth in costs in Latin America was concentrated in two countries: Mexico, because of greater activity and infrastructure, and Brazil, very affected by exchange rates as the rise in local currency terms was 4% (below the inflation rate), and on a downward trend (around 10% at the beginning of the year). The pace of growth in the other countries was moderate.
The rise in costs in Financial Management and Equity Stakes was mainly due to corporate projects (for example, technology).
In short, the rise in expenses in the most mature markets was in line with inflation or below it. The businesses whose costs rose were those whose revenues increased the most, which enabled us to improve the level of efficiency for the Group (without Abbey) and in all the main units.
The performance of revenues and cost control measured by the efficiency ratio was 52.6% in 2005 as compared to 52.0% in 2004. Excluding Abbey, this ratio would have been 50.1%, 2.0% better than in 2004.
91
Depreciation and Amortization
Depreciation and amortization was €1,021.2 million in 2005, a 21.8% or €182.5 million increase from €838.7 million in 2004. Excluding Abbey, the increase would have been of 7.8%.
Impairment Losses (net)
Impairment losses (net) were €1,807.0 million in 2005, a 2.0% decrease or €36.4 million from €1,843.4 million in 2004. Excluding Abbey, impairment losses (net) were €1,488.6 million in 2005, a 19.3% or €354.8 million decrease from 2004.
Impairment losses (net) in 2005 includes principally net gains of €118.9 million on available-for-sale financial assets (loss of €19.4 million in 2004), net loss of €1,756.0 million on loans (loss of €1,581.7 million in 2004) and net loss of €131.0 million in other intangible assets (€0 in 2004).
Our net provisions for credit losses (including loans and advances and debt securities) were €1,615.2 million in 2005, a 2.7% or €42.4 million increase from €1,572.8 million in 2004. Excluding Abbey, our net provisions for credit losses were €1,297.0 million in 2005, a 17.5% or €276.0 million decrease from 2004.
The €42.4 million increase in net provisions for credit losses reflected a €121.0 million increase in gross provisions for credit losses (gross provisions for credit losses were €2,014.1 million in 2005 compared to €1,893.1 million in 2004), a €3.1 million increase in provisions for country-risk (provisions for country-risk were €88.1 million in 2005 compared to €85.0 million in 2004), and a €81.7 million increase in recoveries of loans previously charged-off (recoveries totaled €487.0 million in 2005 compared to €405.3 million in 2004).
The €121.0 million increase in gross provisions for credit losses is due to an increase of €519.0 million in specific provisions partially offset by a decrease of €398.0 million in general provisions (see “Item 4. Information on the Company—B. Business Overview—Classified Assets—Bank of Spain Classification Requirements”).
Our total allowances for credit losses (excluding country-risk) increased by €1,088.8 million to €7,902.2 million at December 31, 2005, from €6,813.4 million at December 31, 2004. Excluding Abbey, our total allowances for credit losses increased by €1,164.0 million to €6,956.7 million at December 31, 2005, from €5,792.7 million at December 31, 2004.
Non-performing loans (excluding country-risk) increased by €226.8 million to €4,341.5 million at December 31, 2005, compared to €4,114.7 million at December 31, 2004. Our coverage ratio was 182.0% at December 31, 2005, and 165.6% at December 31, 2004. Excluding Abbey, non-performing loans increased by €127.0 million to €3,125.0 million at December 31, 2005, compared to €2,998.0 million at December 31, 2004. Without Abbey, our coverage ratio was 222.6% at December 31, 2005, and 193.2% at December 31, 2004. See “Selected Statistical Information—Non-Performing Asset Ratios”.
Net gains on disposal of investments in associates
Net gains on disposal of investments in associates were €1,299.0 million in 2005, a €1,268.1 million increase from €30.9 million in 2004. This increase is mainly due to the sale of our 22.07% stake in Unión Fenosa.
|
| 2005 |
| 2004 |
| Amount |
| % |
|
|
|
|
|
|
| ||||
|
| (in millions of euros except percentages) |
| ||||||
On disposal of investments |
| 1,299.0 |
| 30.9 |
| 1,268.1 |
| 4,103.9 | % |
Of which: Unión Fenosa |
| 1,156.6 |
| — |
|
|
|
|
|
Net results on other disposals, provisions and other income
Net loss on other disposals, provisions and other income was €622.5 million in 2005, a 132.5% or €354.8 million increase from a loss of €267.7 million in 2004.
Results on other disposals include gains and losses, not included in other items, obtained from non-ordinary activities. Results on other disposals were gains of €1,217.9 million in 2005, a 36.6% or €326.6 million increase from €891.3 million in 2004.
92
Results on other disposals |
| 2005 |
| 2004 |
| Amount |
| % |
|
|
|
|
|
|
| ||||
|
| (in millions of euros except percentages) |
| ||||||
On disposal of tangible assets |
| 83.3 |
| 179.9 |
| (96.6 | ) | (53.7 | %) |
Other |
| 1,134.6 |
| 711.4 |
| 423.2 |
| 59.5 | % |
Of which, obtained on the disposal of: |
|
|
|
|
|
|
|
|
|
RBS |
| 717.4 |
| 472.2 |
|
|
|
|
|
Auna |
| 354.8 |
| — |
|
|
|
|
|
Vodafone |
| — |
| 241.8 |
|
|
|
|
|
Shinsei |
| — |
| 117.6 |
|
|
|
|
|
|
|
|
|
|
| ||||
Net gains |
| 1,217.9 |
| 891.3 |
| 326.6 |
| 36.6 | % |
|
|
|
|
|
| ||||
Net provisions were €1,808.5 million in 2005, a 58.4% or €666.9 million increase from €1,141.6 million in 2004. This item includes additions charged to the income statement in relation with provisions for pensions and similar obligations, provisions for contingent liabilities and commitments and other provisions (mainly provisions for restructuring costs and tax and legal litigation). See Note 25 to our consolidated financial statements.
Under other income, we include net income from non-financial activities. In 2005, we had net losses of €31.9 million as compared to net losses of €17.4 million in 2004.
Income Tax
The provision for corporate income tax was €1,391.2 million in 2005, a 133.1% or €794.4 million increase from €596.8 million in 2004. The effective tax rate was 17.1% in 2005 and 13.0% in 2004. For information about factors affecting effective tax rates, see Note 27 to our consolidated financial statements.
Profit attributed to minority interests
Profit attributed to minority interests were €529.7 million in 2005, a 35.7% or €139.3 million increase from €390.4 million in 2004.
The €139.3 million increase in 2005 in profit attributed to minority shareholders is principally the result of important increases in the net income of the consolidated companies Somaen-Dos S.L., Banesto and our subsidiaries in Mexico and Chile.
Net Income Information on U.S. GAAP Basis
Our consolidated financial statements have been prepared in accordance with IFRS. IFRS differs in certain significant respects from U.S. GAAP. For a summary of the most significant adjustments required to arrive at net income on U.S. GAAP basis, see Note 58 to our consolidated financial statements.
|
| Year ended December 31, |
| ||
|
|
| |||
|
| 2005 |
| 2004 |
|
|
|
|
| ||
|
| (in thousands of euros, except per share data) |
| ||
As Reported |
|
|
|
|
|
Net attributable income |
| 6,220,104 |
| 3,605,870 |
|
Net attributable income per average share (1) |
| 1.00 |
| 0.73 |
|
U.S. GAAP |
|
|
|
|
|
Net income |
| 6,318,460 |
| 3,940,866 |
|
Net income per average share (1) |
| 1.01 |
| 0.80 |
|
(1) | Based on the average number of shares outstanding in the relevant year. |
93
Results of Operations by Business Areas
Our results of operations by business areas can be summarized as follows (see “Item 4. Information on the company– B. Business overview. Recent reorganization of business areas”):
Principal level (geographic):
|
| Millions of Euros |
| ||||||||||||||||||
|
|
| |||||||||||||||||||
| 2005 |
| 2004 |
| |||||||||||||||||
|
|
|
| ||||||||||||||||||
| Continental |
| United |
| Latin |
| Financial |
| Total |
| Continental |
| United |
| Latin |
| Financial |
| Total |
| |
|
|
|
|
|
|
|
|
|
|
|
| ||||||||||
|
|
|
|
|
|
|
|
|
|
|
|
|
|
|
|
|
|
|
|
|
|
Profit attributed to the Group |
| 2,983 |
| 811 |
| 1,776 |
| 650 |
| 6,220 |
| 2,159 |
| — |
| 1,470 |
| (23 | ) | 3,606 |
|
|
|
|
|
|
|
|
|
|
|
|
|
|
|
|
|
|
|
|
|
|
|
Continental Europe
|
| Continental Europe |
| Variation |
| ||||
|
|
|
| ||||||
|
| 2005 |
| 2004 |
| Amount |
| % |
|
|
|
| |||||||
|
| (millions of euros except percentages) |
| ||||||
Net interest income |
| 5,398 |
| 4,770 |
| 628 |
| 13.2 | % |
Share of results of entities accounted for using the equity method |
| 26 |
| 33 |
| (7 | ) | (21.2 | )% |
Net fee and commission income |
| 3,331 |
| 3,142 |
| 189 |
| 6.0 | % |
Insurance activity income |
| 116 |
| 87 |
| 29 |
| 33.3 | % |
Gains/losses on financial assets and liabilities and Exchange differences |
| 512 |
| 404 |
| 108 |
| 26.7 | % |
Gross income |
| 9,383 |
| 8,436 |
| 947 |
| 11.2 | % |
Sales and income from the provision of non-financial services (net) and Other operating income/expense |
| 351 |
| 313 |
| 38 |
| 12.1 | % |
Non-financial personnel expenses |
| (47 | ) | (72 | ) | 25 |
| (34.7 | )% |
Non-financial general expenses |
| (24 | ) | (34 | ) | 10 |
| (29.4) | % |
General administrative expenses: |
|
|
|
|
|
|
|
|
|
Personnel expenses |
| (2,563 | ) | (2,502 | ) | (61 | ) | 2.4 | % |
Other administrative expenses |
| (1,171 | ) | (1,097 | ) | (74 | ) | 6.7 | % |
Depreciation and amortization |
| (499 | ) | (514 | ) | 15 |
| (2.9 | )% |
Net operating income |
| 5,430 |
| 4,530 |
| 900 |
| 19.9 | % |
Net impairment losses |
| (973 | ) | (1,265 | ) | 292 |
| (23.1 | )% |
Other gains/losses |
| (43 | ) | (47 | ) | 4 |
| (8.5 | )% |
Profit before tax |
| 4,414 |
| 3,218 |
| 1,196 |
| 37.2 | % |
Profit from continuing operations |
| 3,148 |
| 2,272 |
| 876 |
| 38.6 | % |
Consolidated profit for the year |
| 3,135 |
| 2,272 |
| 863 |
| 38.0 | % |
Profit attributed to the Group |
| 2,983 |
| 2,159 |
| 824 |
| 38.2 | % |
Net interest income for the Continental Europe segment was €5,398 million in 2005, a 13.2% increase from €4,770 million in 2004. This increase was due to both increased business volumes and more stable spreads.
This performance reflected the greater activity, mainly lending, which continued to grow strongly, better efficiency ratios (-3.9 percentage points) and higher productivity.
Net fees and commissions and insurance activity income for the Continental Europe segment were in 2005 €3,331 million and €116 million, respectively, 6.0% and 33.3% higher than in 2004. Of note was the growth in Portugal and Banif, and more moderately in the Santander Branch Network and Banesto. Santander Consumer Finance’s net fees and insurance activity declined because of reduced securitization business.
Gross income was €9,383 million in 2005, an 11.2% or €947 million increase from €8,436 million in 2004.
94
General administrative expenses and depreciation and amortization were in 2005 €3,805 million (a 2.7% increase from 2004) and €499 million (a 2.9% decrease from 2004) respectively.
Stronger gross income and costs that increased by less than 3% produced an improvement of 3.9 percentage points in the efficiency ratio to 42.9% (37.7%, without depreciation and amortization costs).
Efficiency improved in all business units in Continental Europe. Santander Network, Banesto and Santander Consumer Finance already have efficiency ratios below 40% (excluding depreciation and amortization costs) and Portugal’s stands at 43%.
Net operating income rose 19.9% to €5,430 million. This growth is consistent and diversified, as the four main retail banking units (Santander Network, Banesto, Santander Consumer Finance and Portugal), which generate 89% of total net operating income for the segment, increased their net operating income by more than 15%.
Net impairment losses in 2005 were €973 million, a €292 million or 23.1% decrease from €1,265 million in 2004. This reduction is due to the fact that the level of general allowance of provisions for credit losses reached was considered sufficient, and so, as of now, additional provisions only need to be added for any increases in lending.
Profit attributed to the Group for the year ended December 31, 2005, was €2,983 million, an increase of 38.2% from €2,159 million in 2004. There were two main drivers: first, the 19.9% rise in net operating income, as a result of an 11.2% increase in gross income and a 2.9% increase in costs in nominal terms (flat in real terms); and second, lower loan-loss provisions, given the already high coverage ratios in accordance with IFRS.
United Kingdom (Abbey)
|
| Abbey |
| ||
|
|
| |||
|
| 2005 |
| 2004 |
|
|
|
|
| ||
|
| (millions of euros) |
| ||
Net interest income |
| 1,891 |
| — |
|
Share of results of entities accounted for using the equity method |
| 2 |
| — |
|
Net fee and commission income |
| 958 |
| — |
|
Insurance activity income |
| 589 |
| — |
|
Gains/losses on financial assets and liabilities and Exchange differences |
| 347 |
| — |
|
Gross income |
| 3,787 |
| — |
|
Sales and income from the provision of non financial services (net) and Other operating income/expense |
| 52 |
| — |
|
Non-financial personnel expenses |
| (8 | ) | — |
|
Non-financial general expenses |
| (8 | ) | — |
|
General administrative expenses: |
|
|
|
|
|
Personnel expenses |
| (1,228 | ) | — |
|
Other administrative expenses |
| (1,071 | ) | — |
|
Depreciation and amortization |
| (117 | ) | — |
|
Net operating income |
| 1,407 |
| — |
|
Net impairment losses |
| (318 | ) | — |
|
Other gains/losses |
| 76 |
| — |
|
Profit before tax |
| 1,165 |
| — |
|
Profit from continuing operations |
| 811 |
| — |
|
Consolidated profit for the year |
| 811 |
| — |
|
Profit attributed to the Group |
| 811 |
| — |
|
The income statement for the year ended December 31, 2005, is the first to reflect the acquisition of Abbey. Therefore, we do not compare Abbey’s results with those of the year ended December 31, 2004
95
Net interest income for the United Kingdom (Abbey) segment in 2005 was €1,891 million and gross income amounted to €3,787 million for the whole year, after increasing during three straight quarters and reaching in the fourth quarter around €1,000 million (15% more than the first quarter). Both net interest income and fees were significantly higher than in the first quarter, due to the strong performance of banking business and spreads.
General administrative expenses and depreciation and amortization in 2005 were €2,315 million and €117 million, respectively. General administrative expenses do not include restructuring costs relating to the Abbey acquisition (£150 million) because the whole amount scheduled for 2005-07 (£450 million gross) was charged against the income statement of Financial Management and Equity Stakes segment.
For the full year, Abbey contributed net operating income of €1,407 million (14% of the Group’s total operating areas).
Net impairment losses were in 2005 €318 million, with a high degree of stability in specific provisions throughout 2005. The nonperforming loans ratio was 0.67% at the end of 2005 and coverage was 78%, respectively 17 basis points less and 6 percentage points more against March 2005.
Profit before tax in 2005 was €1,165 million and was generated by Abbey’s retail banking operations (€986 million) and insurance business (€179 million).
In its first full year as part of Grupo Santander, Abbey generated profit attributed to the Group in 2005 of €811 million, after achieving the three basic objectives set for the year, which were to stabilize recurrent revenues, increase sales and cut costs.
Latin America
|
| Latin America |
| Variation |
| ||||
|
|
|
| ||||||
|
| 2005 |
| 2004 |
| Amount |
| % |
|
|
|
|
|
|
| ||||
|
| (millions of euros except percentages) |
| ||||||
Net interest income |
| 3,946 |
| 3,328 |
| 618 |
| 18.6 | % |
Share of results of entities accounted for using the equity method |
| 7 |
| 4 |
| 3 |
| 75.0 | % |
Net fee and commission income |
| 2,043 |
| 1,639 |
| 404 |
| 24.6 | % |
Insurance activity income |
| 109 |
| 78 |
| 31 |
| 39.7 | % |
Gains/losses on financial assets and liabilities and Exchange differences |
| 755 |
| 458 |
| 297 |
| 64.8 | % |
Gross income |
| 6,860 |
| 5,507 |
| 1,353 |
| 24.6 | % |
Sales and income from the provision of non-financial services (net) and Other operating income/expense |
| (91 | ) | (44 | ) | (47 | ) | 106.8 | % |
Non-financial personnel expenses |
| — |
| (1 | ) |
|
|
|
|
Non-financial general expenses |
| — |
| (4 | ) |
|
|
|
|
General administrative expenses: |
|
|
|
|
|
|
|
|
|
Personnel expenses |
| (1,770 | ) | (1,541 | ) | (229 | ) | 14.9 | % |
Other administrative expenses |
| (1,545 | ) | (1,256 | ) | (289 | ) | 23.0 | % |
Depreciation and amortization |
| (330 | ) | (287 | ) | (43 | ) | 15.0 | % |
Net operating income |
| 3,124 |
| 2,374 |
| 750 |
| 31.6 | % |
Net impairment losses |
| (442 | ) | (397 | ) | (45 | ) | 11.3 | % |
Other gains/losses |
| (214 | ) | (112 | ) | (102 | ) | 91.1 | % |
Profit before tax |
| 2,468 |
| 1,865 |
| 603 |
| 32.3 | % |
Profit from ordinary activities |
| 2,006 |
| 1,650 |
| 356 |
| 21.6 | % |
Consolidated profit for the year |
| 2,006 |
| 1,661 |
| 345 |
| 20.8 | % |
Profit attributed to the Group |
| 1,776 |
| 1,470 |
| 306 |
| 20.8 | % |
Net interest income in 2005 for the Latin America segment was €3,946 million, 18.6% or €618 million higher as compared with €3,328 million in 2004.
96
Gross income in 2005 was €6,860 million, a 24.6% or €1,353 million increase from €5,507 million in 2004 (14.1% increase excluding the exchange rate impact). A positive factor was the strong growth in business with customers. However, while the rise in short-term nominal interest rates (24% for the whole region) positively benefited the spreads on retail businesses, the spreads on financial businesses were negatively affected by the profile adopted by the interest rate curve.
The Group’s strong drive to develop banking/business services that generate fees (credit cards, cash management, foreign trade, mutual funds and insurance) produced growth of 24.6% in net fee and commission income.
General administrative expenses and depreciation and amortization in 2005 were €3,315 million (a 18.3% increase from 2004) and €330 million (a 15% increase from 2004), respectively. The increase in general administrative expenses was 7.9% excluding the exchange rate impact.
The efficiency (52.2%, including depreciation and amortization costs) and recurrence (61.6%) ratios were also better than in 2004 (54.9% and 58.6%, respectively).
Net operating income in 2005 was €3,124 million, a 31.6% or €750 million increase from €2,374 million in 2004.
Net impairment losses were €442 million, 11.3% higher than in 2004. Net impairment losses on loans were 7.8% lower (18.1% excluding the exchange rate impact), despite the growth in lending and the change of mix of portfolios that point to higher provisions in the future. This was because of the reduced need for country-risk provisions and the large volume of recoveries. The non-performing loans ratio was 1.91% at the end of 2005 (1.03 points lower than in 2004) and coverage 183% (+28 percentage points).
The impairment loss on other assets was particularly affected by the special charge of US$ 150 million for the early amortization of IT equipment and computers in Brazil.
Profit before tax in 2005 was €2,468 million, a 32.3% increase as compared to 2004. Retail Banking continued to be the engine of growth, reflecting the rise in customer business. As a result, its profit before tax rose 36.2% (+27.1% excluding the exchange rate impact).
Profit attributed to the Group in Latin America was €1,776 million, 20.8% more than in 2004 (+11.6% excluding the exchange rate impact).
97
Financial Management and Equity Stakes
|
| Financial Management and |
| Variation |
| ||||
|
|
|
| ||||||
|
| 2005 |
| 2004 |
| Amount |
| % |
|
|
|
|
|
|
| ||||
|
| (millions of euros except percentages) |
| ||||||
Net interest income |
| (742 | ) | (522 | ) | (220 | ) | 42.1 | % |
Share of results of entities accounted for using the equity method |
| 584 |
| 412 |
| 172 |
| 41.7 | % |
Net fee and commission income |
| (18 | ) | (12 | ) | (6 | ) | 50.0 | % |
Insurance activity income |
| 2 |
| (4 | ) | 6 |
| — |
|
Gains/losses on financial assets and liabilities and Exchange differences |
| (49 | ) | 239 |
| (288 | ) | — |
|
Gross income |
| (223 | ) | 113 |
| (336 | ) | — |
|
Sales and income from the provision of non-financial services (net) and Other operating income/expense |
| 10 |
| 16 |
| (6 | ) | (37.5 | )% |
Non-financial personnel expenses |
| (19 | ) | (16 | ) | (3 | ) | 18.8 | % |
Non-financial general expenses |
| (16 | ) | (18 | ) | 2 |
| (11.1 | )% |
General administrative expenses: |
|
|
|
|
|
|
|
|
|
Personnel expenses |
| (183 | ) | (193 | ) | 10 |
| (5.2 | )% |
Other administrative expenses |
| (171 | ) | (106 | ) | (65 | ) | 61.3 | % |
Depreciation and amortization |
| (74 | ) | (38 | ) | (36 | ) | 94.7 | % |
Net operating income |
| (676 | ) | (242 | ) | (434 | ) | 179.3 | % |
Net impairment losses |
| (74 | ) | (181 | ) | 107 |
| (59.1 | )% |
Other gains/losses |
| 857 |
| (79 | ) | 936 |
| — |
|
Profit before tax |
| 107 |
| (502 | ) | 609 |
| — |
|
Profit from continuing operations |
| 798 |
| 63 |
| 735 |
| 1,166.7 | % |
Consolidated profit for the year |
| 798 |
| 63 |
| 735 |
| 1,166.7 | % |
Profit attributed to the Group |
| 650 |
| (23 | ) | 673 |
| — |
|
Financial Management and Equity Stakes, the non-operating area of the Group, generated €650 million of profit attributed to the Group (as compared to a loss of €23 million in 2004).
The higher figure was mainly due to the larger capital gains from the sale of equity stakes and the greater contribution from companies accounted for by the equity method, primarily Cepsa.
The main development in 2005 was the sale (in the first quarter) of 2.57% of RBS, which produced a capital gain of €717 million. Of note among the sale of equity stakes were those in Unión Fenosa and Auna (gross capital gains of €1,157 million and €355 million, respectively). The main sales in 2004 were 0.46% of Vodafone, 1% of Unión Fenosa and 3.1% of Sacyr-Vallehermoso.
The results of this segment were offset by extraordinary charges taken during 2005 for the amortization of Abbey’s restructuring costs (€658 million) and early retirements (€608 million).
Secondary level (business):
|
| Millions of Euros |
| ||||||||||||||||||
|
|
| |||||||||||||||||||
|
| 2005 |
| 2004 |
| ||||||||||||||||
|
|
|
| ||||||||||||||||||
|
| Retail |
| Asset |
| Global |
| Financial |
| Total |
| Retail |
| Asset |
| Global |
| Financial |
| Total |
|
|
|
|
|
|
|
|
|
|
|
|
| ||||||||||
Profit before tax | 6,290 | 688 | 1,069 | 107 | 8,154 | 3,834 | 371 | 878 | (502 | ) | 4,581 | ||||||||||
98
Retail Banking |
|
| Retail Banking |
| Variation |
| ||||
|
|
|
| ||||||
| 2005 |
| 2004 |
| Amount |
| % |
| |
|
|
|
|
|
| ||||
|
| (millions of euros except percentages) |
| ||||||
Net interest income |
| 10,766 |
| 7,404 |
| 3,362 |
| 45.4 | % |
Share of results of entities accounted for using the equity method |
| 35 |
| 42 |
| (7 | ) | (16.7 | )% |
Net fee and commission income |
| 5,191 |
| 3,937 |
| 1,254 |
| 31.9 | % |
Insurance activity income |
| — |
| — |
|
|
|
|
|
Gains/losses on financial assets and liabilities and Exchange differences |
| 927 |
| 323 |
| 604 |
| 187.0 | % |
Gross income |
| 16,919 |
| 11,706 |
| 5,213 |
| 44.5 | % |
Sales and income from the provision of non-financial services (net) and Other operating income/expense |
| 335 |
| 292 |
| 43 |
| 14.7 | % |
Non-financial personnel expenses |
| (55 | ) | (73 | ) | 18 |
| (24.7 | )% |
Non-financial general expenses |
| (32 | ) | (38 | ) | 6 |
| (15.8 | )% |
General administrative expenses: |
|
|
|
|
|
|
|
|
|
Personnel expenses |
| (4,914 | ) | (3,593 | ) | (1,321 | ) | 36.8 | % |
Other administrative expenses |
| (3,228 | ) | (2,067 | ) | (1,161 | ) | 56.2 | % |
Depreciation and amortization |
| (870 | ) | (735 | ) | (135 | ) | 18.4 | % |
Net operating income |
| 8,155 |
| 5,492 |
| 2,663 |
| 48.5 | % |
Net impairment losses |
| (1,669 | ) | (1,502 | ) | (167 | ) | 11.1 | % |
Other gains/losses |
| (196 | ) | (156 | ) | (40 | ) | 25.6 | % |
Profit before tax |
| 6,290 |
| 3,834 |
| 2,456 |
| 64.1 | % |
Retail Banking generated 84% of gross income and 78% of income before taxes of the Group’s operating areas.
Net interest income in 2005 for the Retail Banking segment was €10,766 million, a 45.4% increase or €3,362 million from €7,404 million in 2004.
Net fees and commission income grew 31.9% to €5,191 million. The main drivers were business growth, stronger in lending but also in customer funds, and better management of prices in a more stable environment of interest rates, which is stabilizing spreads.
As a result, gross income was in 2005 €16,919 million, a 44.5% or €5,213 million higher than in 2004.
General administrative expenses in 2005 were €8,142 million, a 43.9% increase from 2004. The cost control policy implemented has been particularly successful at the Santander Network and Portugal.
Net operating income for the Retail Banking segment was €8,155 million in 2005, a 48.5% or €2,663 million increase from €5,492 million in 2004.
Net impairment losses for the Retail Banking segment, €1,669 million in 2005, grew only 11.1% due to the decreased needs for loan-loss provisions, because of the high credit risk quality and the coverage levels already reached.
Profit before tax was 64.1% higher at €6,290 million (38.3% excluding Abbey).
Retail Banking in Continental Europe continued its growth trends in volume and earnings. Net interest income rose 14.3%, net operating income increased 21.3% and income before taxes was up 39.1%. All units (Santander Network, Banesto Retail, Santander Consumer Finance, Portugal Retail and Banif) grew at double digit in net operating income and income before taxes.
In its first year as part of Grupo Santander, Abbey’s Retail Banking operations generated gross income of €3,232 million, net operating income of €1,228 million and income before taxes of €986 million.
99
The good earnings performance of Retail Banking in Latin America was based on strong growth in customer business, strong results in net interest income and net fees and cost control. All of this was reflected in a 38.2% rise in net operating income and 36.2% in income before taxes for Latin America, all in euros.
The increasing proportion of customer activity in all countries, due to the strong development of business in the last two years, was generally reflected in rises in net operating income and profit before tax.
Asset Management and Insurance |
|
| Asset Management and Insurance |
| Variation |
| ||||
|
|
|
| ||||||
|
| 2005 |
| 2004 |
| Amount |
| % |
|
|
|
|
|
|
| ||||
|
| (millions of euros except percentages) |
| ||||||
Net interest income |
| (146 | ) | 17 |
| (163 | ) | — |
|
Share of results of entities accounted for using the equity method |
| — |
| (5 | ) |
|
|
|
|
Net fee and commission income |
| 668 |
| 452 |
| 216 |
| 47.8 | % |
Insurance activity income |
| 814 |
| 165 |
| 649 |
| 393.3 | % |
Gains/losses on financial assets and liabilities and Exchange differences |
| 32 |
| 11 |
| 21 |
| 190.9 | % |
Gross income |
| 1,368 |
| 640 |
| 728 |
| 113.8 | % |
Sales and income from the provision of non- financial services (net) and Other operating income/expense |
| — |
| 1 |
|
|
|
|
|
Non-financial personnel expenses |
| — |
| — |
|
|
|
|
|
Non-financial general expenses |
| — |
| — |
|
|
|
|
|
General administrative expenses: |
|
|
|
|
|
|
|
|
|
Personnel expenses |
| (308 | ) | (151 | ) | (157 | ) | 104.0 | % |
Other administrative expenses |
| (355 | ) | (99 | ) | (256 | ) | 258.6 | % |
Depreciation and amortization |
| (20 | ) | (16 | ) | (4 | ) | 25.0 | % |
Net operating income |
| 685 |
| 375 |
| 310 |
| 82.7 | % |
Net impairment losses |
| — |
| 2 |
|
|
|
|
|
Other gains/losses |
| 3 |
| (6 | ) | 9 |
| (150.0 | )% |
Profit before tax |
| 688 |
| 371 |
| 317 |
| 85.4 | % |
The Asset Management and Insurance segment accounted for 7% of the gross income of the Group’s areas in 2005 and 9% of profit before tax.
Gross income for this segment in 2005 was 1,368 million, a 113.8% or €728 million increase from €640 million in 2004. This strong growth (47.8% in net fee and commission income and 393.3% in insurance activity income) is mainly due to the incorporation of Abbey to the Group.
Total revenues from mutual and pension funds and insurance activity, including that recorded by the distribution networks, amounted to €3,696 million, 62.9% more than in 2004 (+20.3% excluding Abbey).
Profit before tax was 85.6% higher at €688 million (+37.2% excluding Abbey).
Asset Management. The global business of mutual and pension funds integrated in Santander Asset Management generated total fees for the Group of €1,956 million, 23.5% higher than in 2004 (+15.9% without Abbey). After deducting the fees paid to the distribution networks, net fees and commission income for Asset Management were €668 million (+47.8%).
Insurance. Total revenues generated by the Group’s insurance companies, including fees paid to branch networks, amounted to €1,740 million (+153.8% and +30.4% excluding Abbey). After deducting the fees paid to the distribution networks, insurance activity income was €814 million (+393.3%). This strong increase was due to the incorporation of Abbey and the good performance of other insurance activity.
100
Global Wholesale Banking |
|
| Global Wholesale Banking |
| Variation |
| ||||
|
|
|
| ||||||
|
| 2005 |
| 2004 |
| Amount |
| % |
|
|
|
|
|
|
| ||||
|
| (millions of euros except percentages) |
| ||||||
Net interest income |
| 615 |
| 677 |
| (62 | ) | (9.2) | % |
Share of results of entities accounted for using the equity method |
| — |
| — |
|
|
|
|
|
Net fee and commission income |
| 473 |
| 392 |
| 81 |
| 20.7 | % |
Insurance activity income |
| — |
| — |
|
|
|
|
|
Gains/losses on financial assets and liabilities and Exchange differences |
| 655 |
| 528 |
| 127 |
| 24.1 | % |
Gross income |
| 1,743 |
| 1,597 |
| 146 |
| 9.1 | % |
Sales and income from the provision of non-financial services (net) and Other operating income/expense |
| (23 | ) | (24 | ) | 1 |
| (4.2) | % |
Non-financial personnel expenses |
| — |
| — |
|
|
|
|
|
Non-financial general expenses |
| — |
| — |
|
|
|
|
|
General administrative expenses: |
|
|
|
|
|
|
|
|
|
Personnel expenses |
| (339 | ) | (299 | ) | (40 | ) | 13.4 | % |
Other administrative expenses |
| (204 | ) | (187 | ) | (17 | ) | 9.1 | % |
Depreciation and amortization |
| (56 | ) | (50 | ) | (6 | ) | 12.0 | % |
Net operating income |
| 1,121 |
| 1,037 |
| 84 |
| 8.1 | % |
Net impairment losses |
| (64 | ) | (162 | ) | 98 |
| (60.5) | % |
Other gains/losses |
| 12 |
| 3 |
| 9 |
| 300.0 | % |
Profit before tax |
| 1,069 |
| 878 |
| 191 |
| 21.8 | % |
The Global Wholesale Banking segment contributed 9% of gross income and 13% of income before taxes of the Group areas.
Net interest income in 2005 was €615 million, a 9.2% decrease from €677 million in 2004.
Net fee and commission income was €473 million, a 20.7% increase from €392 million in 2004.
Gross income in 2005 was €1,743 million, a 9.1% or €146 million increase from €1,597 million in 2004. Value-added businesses (transactional banking, trade finance, custody, investment banking, equities and treasury for customers) and capital gains offset the lower contribution from basic financing and own account treasury operations.
General administrative expenses and depreciation and amortization grew 11.7% and 12.0%, respectively while net impairment losses decreased by 60.5%. Operating costs grew 11.9%, due to business expansion and the launch of projects, such as Santander Global Connect and Santander Global Markets, in Europe (+€19 million). Appropriate risk management and lower use of credit lines with a more efficient consumption of capital reduced the need for loan loss provisions.
Profit before tax amounted to €1,069 million, 21.8% more than in 2004. This was largely due to the growing contribution of value-added business with clients, the development of new projects and lower needs for loan-loss provisions.
101
Financial Condition
Assets and Liabilities
Our total assets were €809,106.9 million at December 31, 2005, a 21.8% or €144,620.6 million increase from total assets of €664,486.3 million at December 31, 2004. Our gross loans and advances to corporate clients, individual clients and government and public entities which include the trading portfolio, other financial assets at fair value and loans, increased by 17.9% to €443,438.7 million at December 31, 2005 from €376,195.3 million at December 31, 2004, due to increased business in most areas, mainly in Spain, Portugal, Germany, United States of America and Latin America (principally Mexico, Chile and Brazil). Customer deposits, which are basically deposits from clients and securities sold to clients under agreements to repurchase, increased by 8.0% from €283,211.6 million at December 31, 2004, to €305,765.3 million at December 31, 2005, mainly due to increased volumes in Latin America (principally in Mexico and Brazil) and Spain. Other managed funds, including mutual funds, pension funds and managed portfolios, increased by 18.9% from €128,514.6 million at December 31, 2004, to €152,845.6 million at December 31, 2005, mainly due to increased volumes both in Spain and abroad.
In addition, and as part of the global financing strategy during 2005, the Group issued €14,209 million of mortgage and other covered bonds with maturities ranging between 5 and 15 years, as well as €24,364 million of senior debt and €1,617 million of subordinated debt. A total of €1,000 million of preferred shares was also issued.
During 2005 €11,047 million of senior debt and €309 million of mortgage bonds matured, and €947 million of preferred shares and €2,607 million of subordinated debt (counter value) were amortized ahead of schedule.
Goodwill, excluding Abbey, stood at €14,018 million at the end of 2005, of which €2,113 million corresponded to Latin America and €11,905 million to Europe. The reduction in goodwill during 2005 amounted to €1,072 million (mainly due to the definitive assessment of goodwill arisen from the acquisition of Abbey; see Note 17 to our consolidated financial statements).
Capital
Stockholders’ equity, net of treasury stock, at December 31, 2005, was €39,778.5 million, an increase of €5,363.6 million or 15.6% from €34,414.9 million at December 31, 2004, mainly due to the increase on reserves and on net attributable income.
At December 31, 2005, our eligible capital exceeded the minimum required by the Bank of Spain by approximately €10.4 billion. See “Item 4. Information on the Company—B. Business Overview—Supervision and Regulation—Capital Adequacy Requirements.”
We estimate that our Tier 1 capital ratios, calculated in accordance with Basel Committee guidelines, and our total capital ratios, which include Tier 1 and Tier 2 capital, at December 31, 2005 and 2004 were as set forth:
|
| December 31, |
| ||
|
|
| |||
|
| 2005 |
| 2004 |
|
|
|
|
| ||
Tier 1 Capital Ratio |
| 7.88 | % | 7.16 | % |
Total Capital Ratio — Tier 1 and Tier 2 |
| 12.94 | % | 13.01 | % |
B. Liquidity and capital resources
Management of liquidity
For information about our liquidity risk management process, see “Item 11. Quantitative and Qualitative Disclosures About Market Risk — Part.7 Market Risk — Statistical Tools for Measuring and Managing Market Risk — Non Trading Activity — Liquidity Risk” and “—Quantitative analysis — B. Non Trading Activity — Liquidity Risk — Management of structural liquidity”.
Sources of funding
As a financial group, our main source of liquidity is our customer deposits which consist primarily of demand, time and notice deposits. In addition, we complement our customer deposits through the access to the interbank market (overnight and time deposits) and to the domestic and international capital markets. For this purpose, we have in place a series of domestic and international programs for the issuance of commercial paper and medium and long term debt. We also maintain a diversified portfolio of liquid assets and securitized assets throughout the year. In addition, another source of liquidity is the generation of cash flow.
102
We raised €41 billion in 2005 through medium- and long-term issues in the wholesale markets and €13 billion of assets were securitized. As a result, recourse to the short-term market remained at the same levels as in 2004.
At December 31, 2005, we had outstanding €148.8 billion of senior debt, of which €51.0 billion were mortgage bonds and €25.2 billion promissory notes. Additionally, we had €28.8 billion in subordinated debt (which includes €6.8 billion preferred securities) and €1.3 billion in preferred shares.
The following table shows the average balances during the years 2005 and 2004 of our principal sources of funds:
|
| 2005 |
| 2004 |
|
|
|
|
| ||
|
| (In thousands of euros) |
| ||
Due to credit entities |
| 114,760,647 |
| 63,926,795 |
|
Customer deposits |
| 285,856,391 |
| 166,772,492 |
|
Marketable debt securities |
| 124,096,652 |
| 53,992,496 |
|
Subordinated debt |
| 27,767,903 |
| 14,504,438 |
|
|
|
|
| ||
Total |
| 552,481,593 |
| 299,196,221 |
|
The average maturity of our outstanding debt as of December 31, 2005 is the following:
• Senior debt | 4.3 years |
• Mortgage debt | 11.1 years |
• Dated subordinated debt | 6.8 years |
Exhibits V and VI to our consolidated financial statements included herein show a detail of our senior and subordinated long-term debt, including their maturities.
The cost and availability of debt financing are influenced by our credit ratings. A reduction in these ratings could increase the cost of, and reduce our market access to debt financing. Our credit ratings are as follows:
| Long-Term |
| Short-Term |
| Financial Strength |
|
|
| |||
Moody’s | Aa3 |
| P1 |
| B |
Standard & Poor’s | AA- |
| A1 |
|
|
Fitch | AA |
| F1+ |
| A/B |
Our total customer deposits, excluding assets sold under repurchase agreements, totaled €271.0 billion at December 31, 2005. Loans and advances to customers (gross) totaled €443.4 billion at the same date.
We remain well placed to access various wholesale funding sources from a wide range of counterparties and markets, and the changing mix evident between customer deposits and repos, deposits by banks and debt securities in issue primarily reflects comparative pricing, maturity considerations and investor counterparty demand rather than any material perceived trend.
We use our liquidity to funding our lending and investment securities activities, for the payment of interest expense, for dividends paid to shareholders and the repayment of debt.
We, Grupo Santander, are a European and Latin American financial group. Although, at this moment, except for Argentina and Venezuela, we are not aware of any legal or economic restrictions on the ability of our subsidiaries to transfer funds to the Bank (the parent company) in the form of cash dividends, loans or advances, capital repatriation and other forms, there is no assurance that in the future such restrictions will not be adopted or how they would affect our business. Nevertheless, the geographic diversification of our businesses limits the effect of any restrictions that could be adopted in any given country.
In prevailing economic conditions and with interest rates starting to rise from historically low levels in Spain, UK and the rest of Europe, it is anticipated that the growth in demand for further borrowing by customers may slow down and in the medium term, our dependence on the wholesale market for funding may be reduced as a result of a probable increase of our customer deposits.
We believe that our working capital is sufficient for our present requirements and to pursue our planned business strategies.
103
As of December 31, 2005 and to the present date, we did not, and presently do not, have any material commitments for capital expenditures, except as disclosed in Item 4. “Information on the Company — A. History and development on the company - Sovereign”.
Other contingent liabilities and commitments
As of December 31, 2005 and December 31, 2004, we had outstanding the following contingent liabilities and commitments:
|
| (IFRS) |
| ||
|
|
| |||
|
| 2005 |
| 2004 |
|
|
|
|
| ||
|
| (in thousands of euros) |
| ||
Contingent liabilities: |
|
|
|
|
|
Guarantees and other sureties |
| 48,199,671 |
| 31,511,567 |
|
Bank guarantees and other indemnities provided |
| 44,251,411 |
| 28,533,973 |
|
Credit derivatives sold |
| 180,000 |
| — |
|
Irrevocable documentary credits |
| 3,767,022 |
| 2,977,594 |
|
Other financial guarantees |
| 1,238 |
| — |
|
Assets assigned to sundry obligations |
| 24 |
| 24 |
|
Other contingent liabilities |
| 253,880 |
| 302,291 |
|
|
|
|
| ||
|
| 48,453,575 |
| 31,813,882 |
|
|
|
|
| ||
Commitments: |
|
|
|
|
|
Balances drawable by third parties |
| 77,678,333 |
| 63,110,699 |
|
Other commitments |
| 18,584,929 |
| 11,749,833 |
|
|
|
|
| ||
|
| 96,263,262 |
| 74,860,532 |
|
|
|
|
| ||
|
| 144,716,837 |
| 106,674,414 |
|
|
|
|
| ||
Relationship with unconsolidated companies
We have holdings in companies over which we are in a position to exercise significant influence, but that we do not control or jointly control. According to IFRS, these investments in associated companies are accounted for using the equity method (see a detail of these companies in Exhibit II to our consolidated financial statements).
Transactions with these companies are made at market conditions and are closely monitored by our regulatory authorities. See Note 55 to our consolidated financial statements for further information.
Also, we use special purpose vehicles (“fondos de titulización”) in our securitization activity. According to IFRS, only those vehicles that meet certain requirements are consolidated in the Group’s financial statements. We are not required to repurchase assets or contribute additional assets to any of these special purpose vehicles. We do, however, provide in the ordinary course of business certain loans (amounting to €284.2 million to “fondos de titulización” in Spain) to some of these special purpose vehicles, which are provisioned in accordance with the risks involved. In 2005, the Group securitized €13.0 billion of medium and long-term assets.
In the ordinary course of business, Abbey enters into securitization transactions using special purpose securitization companies which are consolidated and included in Abbey’s financial statements as quasi-subsidiaries. Except for some mortgage indemnity guarantees assigned to some transactions made before January 1, 2002, Abbey is under no obligation to support any losses that may be incurred by the securitization companies or the holders of the securities, and has no right or obligation to repurchase any securitized loan. Abbey has made some interest bearing subordinated loans to these securitization companies.
We do not have transactions with un-consolidated entities other than the aforementioned ones.
C. Research and development, patents and licenses, etc.
We do not currently conduct any significant research and development activities.
104
The European financial services sector is likely to remain competitive with an increasing number of financial service providers and alternative distribution channels. Further, consolidation in the sector (through mergers, acquisitions or alliances) is likely to occur as the other major banks look to increase their market share or combine with complementary businesses. It is foreseeable that regulatory changes will take place in the future that will diminish barriers in the markets.
The following are the most important trends, uncertainties and events that are reasonably likely to have a material adverse effect on the Bank or that would cause the disclosed financial information not to be indicative of our future operating results or our financial condition:
• | a downturn in real estate markets, and a corresponding increase in mortgage defaults; |
• | the recent interest rate hikes in the United States; |
• | uncertainties relating to economic growth expectations and interest rates cycles, especially in the United States, Spain, the United Kingdom, other European countries and Latin America, and the impact they may have over the yield curve and exchange rates; |
• | the effect that an economic slowdown may have over Latin America and fluctuations in local interest and exchange rates; |
• | the chance that changes in the macroeconomic environment will deteriorate the quality of our customers` credit; |
• | a possible downturn in capital markets; |
• | a drop in the value of the euro relative to the US dollar, the Sterling pound or Latin American currencies; |
• | inflationary pressures, because of the effect they may have in relation to increases of interest rates and decreases of growth; |
• | increased consolidation of the European financial services sector; and |
• | although it is foreseeable that entry barriers to domestic markets in Europe will be lowered, our possible plans of expansion into other markets could be affected by regulatory requirements of the national authorities of these countries. |
E. Off-balance sheet arrangements
We have no off-balance sheet arrangements that have, or are reasonably likely to have, a current or future material effect on our financial condition, revenues or expenses, results of operations, liquidity, capital expenditures or capital resources.
F. Tabular disclosure of contractual obligations
The following table summarizes our contractual obligations by remaining maturity at December 31, 2005:
Contractual obligations |
| Less than |
| More than |
| More than |
| Total |
|
|
|
|
|
| |||||
Marketable debt securities (1) |
| 29,865 |
| 46,826 |
| 40,518 |
| 117,209 |
|
Subordinated debt (1) |
| 1,660 |
| 4,240 |
| 22,863 |
| 28,763 |
|
Operating lease obligations |
| 178 |
| 648 |
| 1,255 |
| 2,081 |
|
Purchase obligations |
| 105 |
| 336 |
| 215 |
| 656 |
|
Other long-term liabilities (1) |
| 54 |
| — |
| 4,942 |
| 4,996 |
|
|
|
|
|
|
| ||||
Total |
| 31,862 |
| 52,051 |
| 69,793 |
| 153,706 |
|
|
|
|
|
|
|
(1) Includes the outstanding principal and the accrued interests.
105
Contractual obligations maturing in “more than 1 year but less than 3” and in “more than 3 years but less than 5” have been grouped according to the disclosure given in Note 53 to our consolidated financial statements.
The maturity of deposits from credit institutions and from customer deposits, neither of which is reflected in the above table, is given in Note 53 to our consolidated financial statements.
For a description of our trading and hedging derivatives, which are not reflected in the above table, see Note 36 to our consolidated financial statements.
106
Item 6. Directors, Senior Management and Employees
Directors and senior management. |
We are managed by our Board of Directors which currently consists of 19 members. In accordance with our By-laws (Estatutos), the Board shall consist of at least 14 and not more than 30 members. Each member of the Board is elected to a three-year term by our stockholders at a general meeting, with approximately one-third of the members being elected each year, but they can be re-elected.
At our last Shareholders’ Meeting, which was held on June 17, 2006, our shareholders approved a number of proposals, including the appointment of a new Director and amendments to our By-laws that, once such amendments are registered on the Mercantile Registry, would, among other changes, reduce the maximum number of Directors to 22 Directors, extend from three to five years the Board terms and reduce from one third to one fifth the portion of our Board members that are elected each year. For more information on the proposals to appoint a new Director see below “C. Board practices” and for the cited amendments to our By-laws see “Item 10. Additional Information—B. Memorandum and articles of association”.
Our Board of Directors meets approximately nine times per year. In 2005, it met 9 times. Our Board of Directors elects our Chairman and Vice Chairmen from among its members, as well as the Chief Executive Officer. Between board meetings, lending and other board powers reside with the Executive Committee (Comisión Ejecutiva) and with the Risk Committee (Comisión Delegada de Riesgos). The Chairman is the Bank’s most senior officer and, as a result, has delegated to him all such powers as may be delegated under Spanish Law, our By-laws and the Regulations of the Board. The Chairman leads the Bank’s management team, in accordance with the decisions made and the criteria set by our shareholders at the General Shareholders’ Meeting and by the Board.
The Chief Executive Officer by delegation and under the direction of the Board and of the Chairman (as the Bank’s most senior officer) leads the business and assumes the Bank’s highest executive functions.
Our Board holds ultimate lending authority and it delegates such authority to the Risk Committee, which generally meets twice a week. Members of our senior management are appointed and removed by the Board.
The current members of our Board of Directors are:
Name | Position with Santander | Director Since | ||
|
| |||
Emilio Botín (1) |
| Chairman |
| 1960 |
Fernando de Asúa |
| First Vice Chairman |
| 1999 |
Alfredo Sáenz |
| Second Vice Chairman and Chief Executive Officer |
| 1994 |
Matías R. Inciarte |
| Third Vice Chairman |
| 1988 |
Manuel Soto |
| Fourth Vice Chairman |
| 1999 |
Assicurazioni Generali, S.p.A. |
| Director |
| 1999 |
Antonio Basagoiti |
| Director |
| 1999 |
Ana P. Botín (1) |
| Director |
| 1989 |
Javier Botín (1) |
| Director |
| 2004 |
Lord Burns |
| Director |
| 2004 |
Guillermo de la Dehesa |
| Director |
| 2002 |
Rodrigo Echenique |
| Director |
| 1988 |
Antonio Escámez |
| Director |
| 1999 |
Francisco Luzón |
| Director |
| 1997 |
Abel Matutes |
| Director |
| 2002 |
Mutua Madrileña Automovilista |
| Director |
| 2004 |
Luis Ángel Rojo |
| Director |
| 2005 |
Luis Alberto Salazar-Simpson |
| Director |
| 1999 |
Jay S. Sidhu |
| Director |
| 2006 |
(1) | Ana P. Botín and Javier Botín are daughter and son, respectively, of Emilio Botín. |
107
Our current Executive Officers are:
Name |
| Position with Banco Santander Central Hispano |
| ||
Emilio Botín |
| Chairman of the Board of Directors and of the Executive Committee |
Alfredo Sáenz |
| Second Vice Chairman of the Board of Directors and Chief Executive Officer |
Matías R. Inciarte (1) |
| Third Vice Chairman of the Board of Directors and Chairman of the Risk Committee |
Ana P. Botín |
| Chairwoman, Banesto |
Francisco Luzón |
| Director, Executive Vice President, America |
José A. Alvarez |
| Executive Vice President, Financial Management |
David Arce |
| Executive Vice President, Internal Auditing |
Ignacio Benjumea |
| Executive Vice President, General Secretariat and of the Board |
Teodoro Bragado |
| Executive Vice President, Risk |
Juan Manuel Cendoya |
| Executive Vice President, Communications and Research |
José María Espí |
| Executive Vice President, Risk |
Enrique G. Candelas |
| Executive Vice President, Santander Branch Network - Spain |
Francisco G. Roldán |
| Chief Executive Officer, Abbey |
Joan-David Grimà |
| Executive Vice President, Asset Management and Insurance |
Juan Guitard |
| Executive Vice President, General Secretariat and of the Board |
Gonzalo de las Heras |
| Executive Vice President, Global Wholesale Banking |
Antonio H. Osorio |
| Executive Vice President, Santander Totta |
Adolfo Lagos |
| Executive Vice President, Global Wholesale Banking |
Jorge Maortua |
| Executive Vice President, Global Wholesale Banking |
Pedro Mateache |
| Executive Vice President, Administration and Human Resources |
Serafín Méndez |
| Executive Vice President, Administration and Human Resources |
Jorge Morán |
| Chief Operating Officer, Abbey |
Javier Peralta |
| Executive Vice President, Risk |
Marcial Portela |
| Executive Vice President, America |
Juan R. Inciarte (1) |
| Executive Vice President, Consumer Finance |
José Manuel Tejón |
| Executive Vice President, Financial Accounting and Control |
Jesús Mª Zabalza |
| Executive Vice President, America |
(1) | Matías and Juan R. Inciarte are brothers. |
Following is a summary description of the relevant business experience and principal business activities of our current Directors and Executive Officers performed both within and outside Santander:
Emilio Botín (Chairman of the Board of Directors and of the Executive Committee)
Born in 1934. He joined Banco Santander in 1958 and in 1986 he was appointed Chairman of the Board. He is also a Director of Shinsei Bank, Limited and Sovereign Bancorp, Inc.
Fernando de Asúa (First Vice Chairman of the Board of Directors and Chairman of the Appointments and Remuneration Committee)
Born in 1932. Former Vice Chairman of Banco Central Hispanoamericano from 1991 to 1999. He was appointed Director in April 1999 and First Vice Chairman in July 2004. He is a former Chairman of IBM España, S.A., and he is currently the Honorary Chairman. In addition, he is a Director of Cepsa, Técnicas Reunidas, S.A., Air Liquide España, S.A. and Constructora Inmobiliaria Urbanizadora Vasco-Aragonesa, S.A.
Alfredo Sáenz (Second Vice Chairman of the Board of Directors and Chief Executive Officer)
Born in 1942. Former Chief Executive Officer and Vice Chairman of Banco Bilbao Vizcaya and Chairman of Banca Catalana until 1993. In 1994, he was appointed Chairman of Banesto and in February 2002, Second Vice Chairman and Chief Executive Officer of Santander. He is also Vice Chairman of Cepsa and a Director of San Paolo IMI SpA and France Telecom Operadores de Telecomunicaciones, S.A. (formerly known as Auna Operadores de Telecomunicaciones, S.A.).
Matías R. Inciarte (Third Vice Chairman of the Board of Directors and Chairman of the Risk Committee)
Born in 1948. He joined Banco Santander in 1984 and was appointed Executive Vice President and Chief Financial Officer in 1986. In 1988 he was appointed Director and in 1994 Second Vice Chairman. He is also Chairman of Unión de Crédito Inmobiliario, S.A., Second Vice Chairman of Grupo Corporativo Ono, S.A. and Director of Banesto, Financiera Ponferrada, S.A. and Operador del Mercado Ibérico de Energía Polo Español, S.A. He was Minister of the Presidency of the Spanish Government (1981-1982).
108
Manuel Soto (Fourth Vice Chairman of the Board of Directors)
Born in 1940. He was appointed Director in April 1999. He is Vice Chairman of Indra Sistemas, S.A. and a Director of Inversiones Inmobiliarias Lar, S.A. and Corporación Financiera Alba, S.A. He is also Chairman of the Advisory Board of Mercapital, S.L. and member of the Consultive Committee of Occidental Hoteles Management, S.A. In addition, he was formerly Chairman of Arthur Andersen’s Global Board and manager for EMEA (Europe Middle East and Africa) and India.
Assicurazioni Generali, S.p.A. (“Assicurazioni”)
An Italian insurance company represented on our Board by its Chairman, Antoine Bernheim. Assicurazioni is a former Director of Banco Central Hispanoamericano from 1994 to 1999. Assicurazioni was appointed Director in April 1999.
Antoine Bernheim (Representative of the Company Director Assicurazioni)
Born in 1924. He joined the board of directors of Assicurazioni Generali in 1973 becoming the company’s Vice-Chairman in 1990 and Chairman from 1995 to 1999. He was re-elected Chairman in 2002. He is a former Vice-Chairman of Mediobanca and was board member of that bank. In addition, he is a former senior partner at Lazard Frérers & Cie (1967 to 2000).
Antonio Basagoiti
Born in 1942. Former Executive Vice President of Banco Central Hispanoamericano. He was appointed Director in July 1999. He is Vice Chairman of Faes Farma, S.A. and of Golf La Moraleja, S.A. and a Director of Pescanova, S.A. He is a former Chairman of Unión Fenosa, S.A.
Ana P. Botín
Born in 1960. Former Executive Vice President of Banco Santander, S.A. and former Chief Executive Officer of Banco Santander de Negocios from 1994 to 1999. In February 2002, she was appointed Chairwoman of Banesto. She is also a Director of Inmobiliaria Urbis, S.A. and Assicurazioni Generali, SpA.
Javier Botín
Born in 1973. He was appointed Director in July 2004. He is also an executive Director of M&B Capital Advisers, Sociedad de Valores, S.A.
Lord Burns
Born in 1944. He was appointed Director in December 2004. He is also Chairman of Abbey and Glas Cymru (Welsh Water) and a non-executive Director of Pearson Group plc and a Deputy Chairman of Marks and Spencer plc. He was Permanent Secretary to the UK Treasury and chaired the UK Parliamentary Financial Services and Markets Bill Joint Committee and was a non-executive Director of British Land plc and Legal & General Group plc.
Guillermo de la Dehesa
Born in 1941. Former Secretary of State of Economy and Secretary General of Commerce of the Spanish Government and Chief Executive Officer of Banco Pastor. He was appointed Director in June 2002. He is Chairman of AVIVA Vida y Pensiones, S.A. and a Director of Campofrío Alimentación, S.A., Unión Fenosa, S.A., Tele Pizza, S.A., Goldman Sachs Europe Ltd. and AVIVA plc. He is also Chairman of the Centre for Economic Policy Research (CEPR) in London, member of the Group of Thirty of Washington, and Chairman of the Board of Trustees of the Instituto de Empresa.
Rodrigo Echenique
Born in 1946. Former Director and Chief Executive Officer of Banco Santander, S.A. from 1988 to 1994. He is Chairman of the Social Economic Council of the Carlos III University (Madrid) and a Director of Recoletos Grupo de Comunicación, S.A. and Inversiones Inmobiliarias Lar, S.A.
109
Antonio Escámez
Born in 1951. Former Director and Executive Vice President of Banco Central Hispanoamericano from 1988 to 1999. He was appointed Director in April 1999. He is also Chairman of Santander Consumer Finance, S.A., Open Bank Santander Consumer, S.A. and Arena Communications España, S.A., and Vice Chairman of Attijariwafa Bank.
Francisco Luzón
Born in 1948. He joined Banco Santander in 1996 as Executive Vice President, Adjoint to the Chairman. Former Chairman of Banco Exterior de España (from 1988 to 1996), Caja Postal (from 1991 to 1996), Corporación Bancaria de España (from 1991 to 1996) and of Argentaria (1996). He is also a Director of Industria de Diseño Textil, S.A. and Chairman of the Social Council of the University of Castilla-La Mancha.
Abel Matutes
Born in 1941. Former Foreign Minister of the Spanish Government and EU Commissioner for the portfolios of Loans and Investment, Financial Engineering and Policy for Small and Medium-sized Companies (1989); North-South Relations, Mediterranean Policy and Relations with Latin America and Asia (1989) and of the Transport and Energy and Supply Agency of Euroatom (1993). He is also a Chairman of Fiesta Hotels & Resorts, S.L. and a Director of Assicurazione Internazionale di Providenza and FCC Construcción, S.A.
Mutua Madrileña Automovilista
Spanish car insurance company represented on our Board by Luis Rodríguez. Mutua Madrileña Automovilista was appointed Director in April 2004.
Luis Rodríguez (Representative of the Company Director Mutua Madrileña Automovilista)
Born in 1941. In 2002 he joined the board of directors of Mutua Madrileña Automovilista and is currently First Vice Chairman of that board. He is also Chairman of Ibérica de Maderas y Aglomerados, S.A. and of Mutuactivos, the mutual fund institution of Mutua Madrileña and Vice Chairman of Arosa Seguros Generales.
Luis Ángel Rojo (Chairman of the Audit and Compliance Committee)
Born in 1934. Former Head of Economics, Statistics and Research Department, Deputy Governor and Governor of the Bank of Spain. He has been a member of the Governing Council of the European Central Bank, Vice-Chairman of the European Monetary Institute, member of United Nations’ Development Planning Committee and Treasurer of the International Association of Economy. He is Professor emeritus of the Complutense University of Madrid, member of the Group of Wise Men appointed by the ECOFIN Council for the study of integration of the European financial markets, member of the Royal Academy of Moral and Political Sciences and of the Royal Academy of the Spanish Language. He is also a Director of Corporation of Corporación Financiera Alba, S.A.
Luis Alberto Salazar-Simpson
Born in 1940. He is Chairman of France Telecom Operadores de Telecomunicaciones, S.A. (formerly known as Auna Operadores de Telecomunicaciones, S.A.) and Constructora Inmobiliaria Urbanizadora Vasco-Aragonesa, S.A. and Joint Admnistrator of Retevisión Móvil, S.A., a Director of Mutua Madrileña Automovilista and Saint Gobain Cristalería, S.A.
Jay S. Sidhu
Born in 1952. He became President and Chief Executive Officer of Sovereign Bancorp, Inc. in November 1989, and was named President and Chief Executive Officer of Sovereign Bank in March 1989. Previously, he served as Treasurer and Chief Financial Officer of Sovereign Bancorp, Inc. since the organization of Sovereign Bancorp, Inc. in 1987. He became a director of Sovereign Bancorp, Inc. in 1988 and of Sovereign Bank in 1987. In April 2002, he was elected Chairman of Sovereign Bancorp, Inc. He serves on Sovereign Bancorp, Inc.’s Executive and Retirement Savings Plan Committees and as Chairperson of Sovereign Bancorp, Inc.’s Mergers and Acquisition Committee. He also serves as a member of Sovereign Bank’s Executive, Asset Liability, Risk Management and CRA Committees.
110
José A. Alvarez
Born in 1960. He joined the Bank in 2002. In 2004, he was appointed Executive Vice President, Financial Management.
David Arce
Born in 1943. He joined Banco Santander in 1964. In 1994, he was appointed Executive Vice President, Internal Auditing of Banco Santander and Banesto. He is also a Director of Banesto.
Ignacio Benjumea
Born in 1952. He joined Banco Santander in 1987 as General Secretary of Banco Santander de Negocios. In 1994 he was appointed General Secretary and Secretary of the Board of Banco Santander. In 1999, he was appointed Executive Vice President, Secretary General and of the Board of Santander. He is also a Director of Bolsas y Mercados Españoles, Sociedad Holding de Mercados y Sistemas Financieros, S.A., Sociedad Rectora de la Bolsa de Madrid, S.A. and La Unión Resinera Española, S.A.
Teodoro Bragado
Born in 1944. He joined the Bank in 1985. He was appointed Executive Vice President, Risk, in March 2003. He is also a Vice Chairman of Compañía Española de Seguros de Crédito a la Exportación (“CESCE”) and a Director of Compañía Española de Financiación del Desarrollo, S.A., Consorcio Mexicano de Aseguradores de Crédito, S.A., Consorcio Internacional de Aseguradores de Crédito, S.A. and the Social Economic Council of the Carlos III University (Madrid).
Juan Manuel Cendoya
Born in 1967. Former Manager of the Legal and Tax Departament of Bankinter, S.A. from 1999 to 2001. He joined the Bank on July 23, 2001 as Executive Vice President, Communications and Research.
José María Espí
Born in 1944. He joined the Bank in 1985 and, in 1988, was appointed Executive Vice President, Human Resources. In 1999 he was appointed Executive Vice President, Risk. He is also Chairman of Unión de Crédito Inmobiliario, S.A., E.F.C. and Director of Unión de Crédito Inmobiliario, S.A.
Enrique G. Candelas
Born in 1953. He joined Banco Santander in 1975 and was appointed Senior Vice President in 1993. He was appointed Executive Vice President, Santander Branch Network Spain in January 1999. He is also a Director of Mobipay España, S.A.
Francisco G. Roldán
Born in 1953. Former Chief Executive Officer of Grupo Argentaria, Caja Postal and Banco Hipotecario from 1996 to June 2000, and of Banesto from June 2000 until March 2002. In March 2002, he was appointed Chief Financial Officer of Santander and in November 2004, Chief Executive Officer of Abbey. He is also a Director of Bolsas y Mercados Españoles and Sociedad Holding de Mercados y Sistemas Financieros, S.A.
Joan-David Grimà
Born in 1953. He joined Banco Central Hispanoamericano in 1993. In June 2001 he was appointed Executive Vice President, Industrial Portfolio and in December 2005 he was appointed Executive Vice President, Asset Management and Insurance. He was formerly Vice Chairman and Chief Executive Officer of Auna Operadores de Telecomunicaciones, S.A. from January 2002 to November 2005. He is also a Director of Antena 3 de Televisión, S.A., Teka Industrial, S.A. and ACS Actividades de Construcción y Servicios, S.A.
Juan Guitard
Born in 1960. Former General Secretary of the Board of Banco Santander de Negocios (from 1994 to 1999) and Manager of the Investment Banking Department of the Bank (from 1999 to 2000). He rejoined the Bank in 2002, being appointed Executive Vice President, Vice-Secretary General of the Board.
111
Gonzalo de las Heras
Born in 1940. He joined the Bank in 1990. He was appointed Executive Vice President in 1991 and supervises the North American business of the Group.
Antonio H. Osorio
Born in 1964. He joined Banco Santander in 1993 and was appointed Executive Vice President, Portugal, in January 2000. He is Chairman of the Executive Committee of Banco Santander Totta, S.A., Chairman of the Executive Committee of Banco Santander de Negocios Portugal, S.A. and non-executive Director of Abbey.
Adolfo Lagos
Born in 1948. Former Chief Executive Officer of Grupo Financiero Serfin since 1996. He was appointed Executive Vice President, America, in October 2002 and Executive Vice President, Global Wholesale Banking, in April 2003.
Jorge Maortua
Born in 1961. Former Executive Vice President of Banesto since 2001, he joined the Bank in 2003 as Head of Global Treasury and was appointed Executive Vice President, Global Wholesale Banking, in 2004.
Pedro Mateache
Born in 1959. Former partner-director of McKinsey & Co. He was appointed Executive Vice President, Administration and Human Resources in 2003.
Serafín Méndez
Born in 1947. He joined the Bank in 1964. He is the Manager of the Premises and Security Area and was appointed Executive Vice President, Administration and Human Resources in 2004.
Jorge Morán
Born in 1964. He joined the Bank in 2002. He was appointed Executive Vice President, Asset Management and Insurance in 2004. In December 2005, he was appointed Executive Director and Chief Operating Officer of Abbey.
Javier Peralta
Born in 1950. He joined the Bank in 1989 and in 1993 was appointed Executive Vice President. In 2002, he was appointed Executive Vice President, Risk.
Marcial Portela
Born in 1945. He joined the Bank in 1998 as Executive Vice President in charge of operations, human resources and costs. In 1999, he was appointed Executive Vice President, America. He is also a Director of Best Global, S.A.
Juan R. Inciarte
Born in 1952. He joined Banco Santander in 1985 as Director and Executive Vice President of Banco Santander de Negocios. In 1989 he was appointed Executive Vice President and from 1991 to 1999 he was a Director of Banco Santander. He is also Chief Executive Officer of Santander Consumer Finance, Deputy Chairman of Abbey National plc and a Director of Sovereign Bancorp, Inc. He is also a Director of Cepsa and NIBC Bank N.V.
José Tejón
Born in 1951. He joined the Bank in 1989. In 2002 he was appointed Executive Vice President, Financial Accounting and Control.
Jesús Mª Zabalza
Born in 1958. Former Executive Vice President of La Caixa (from 1996 to 2002). He joined the Bank in 2002, being appointed Executive Vice President, America.
112
The following is a description of arrangements or understandings with major shareholders, customers, suppliers or others pursuant to which any person referred to above was appointed.
There are two Directors that are international financial institutions that have a holding in the Bank: Assicurazioni Generali S.p.A. (represented by Antoine Bernheim) and Mutua Madrileña Automovilista (represented by Luis Rodríguez).
B. Compensation.
Directors’ compensation
By-law stipulated fees
Article 38 of the Bank’s By-laws provides that the members of our Board of Directors (together with our Executive Vice Presidents) may receive an amount up to 5% of the Bank’s net income for any fiscal year, for performing their duties as Directors. At our last Shareholders’ Meeting, which was held on June 17, 2006, our shareholders approved an amendment to our By-laws such that, once it is registered on the Mercantile Registry, would reduce this limit from 5% to 1% and no longer include our Executive Vice Presidents as part of this compensation.
The Board of Directors, making use of the powers conferred on it, applied 0.152% of the Bank’s income for 2005 (as compared to 0.169% for 2004), as compensation for itself.
Consequently, the gross amount received by each Director as compensation in 2005 was €89,500 (as compared to €71,400 in 2004). Additionally, the Executive Committee members received additional compensation, the gross amount of which was €179,500 in 2005 (as compared to €155,100 in 2004).
The members of the Audit and Compliance Committee received additional compensation in 2005, the gross amount of which was €50,000 (as compared to €35,700 in 2004).
The members of the Appointments and Remuneration Committee received additional compensation in 2005, the gross amount of which was €30,000. The First Vice-Chairman and the Forth Vice-Chairman each received an additional gross amount of €36,000. No compensation was assigned to these positions in 2004.
Salary compensation
As provided by our By-laws, the members of the Board and of the Executive Committee are entitled to be remunerated for discharging duties within the Bank other than those duties performed in their capacity as a Director.
Consequently, the Bank’s executive Directors (who as of December 31, 2005, 2004 and 2003 are Emilio Botín, Alfredo Sáenz, Matías R. Inciarte, Ana P. Botín, and Francisco Luzón) received the following salary compensation:
|
| Thousands of Euros |
| ||||
|
|
| |||||
|
| 2005 |
| 2004 |
| 2003 |
|
|
|
|
|
| |||
Total aggregate salary compensation |
| 18,494 |
| 16,179 |
| 14,784 |
|
Of which: Variable compensation |
| 11,412 |
| 9,395 |
| 8,373 |
|
113
The remuneration and other compensation granted to the Directors in 2005 is as follows:
| Thousands of Euros | |||||||||||||||||||||||
| ||||||||||||||||||||||||
| 2005 |
| 2004 | |||||||||||||||||||||
|
| |||||||||||||||||||||||
| Bylaw-Stipulated Emoluments |
| Attendance Fees |
| Salary of |
|
|
|
|
|
| |||||||||||||
|
|
|
|
|
|
|
|
| ||||||||||||||||
Directors |
| Board |
| Executive |
| Audit and |
| Appointments and |
| Board |
| Other |
| Fixed |
| Variable |
| Total |
| Other |
| Total |
| Total |
|
|
|
|
|
|
|
|
|
|
|
| |||||||||||||
Emilio Botín |
| 90 |
| 180 |
| — |
| — |
| 18 |
| 5 |
| 1,047 |
| 1,694 |
| 2,741 |
| 1 |
| 3,035 |
| 2,749 |
Fernando de Asúa |
| 126 |
| 180 |
| 50 |
| 30 |
| 16 |
| 117 |
| — |
| — |
| — |
| — |
| 519 |
| 407 |
Alfredo Sáenz |
| 90 |
| 180 |
| — |
| — |
| 18 |
| 5 |
| 2,639 |
| 3,876 |
| 6,515 |
| 353 |
| 7,161 |
| 6,252 |
Matías R. Inciarte |
| 90 |
| 180 |
| — |
| — |
| 18 |
| 106 |
| 1,333 |
| 2,097 |
| 3,430 |
| 146 |
| 3,970 |
| 3,545 |
Manuel Soto |
| 126 |
| — |
| 50 |
| 30 |
| 18 |
| 22 |
| — |
| — |
| — |
| — |
| 246 |
| 150 |
Assicurazioni Generali, Spa. |
| 104 |
| — |
| — |
| — |
| 6 |
| — |
| — |
| — |
| — |
| — |
| 110 |
| 76 |
Antonio Basagoiti |
| 90 |
| 180 |
| — |
| — |
| 18 |
| 105 |
| — |
| — |
| — |
| 21 |
| 414 |
| 279 |
Ana P. Botín |
| 90 |
| 180 |
| — |
| — |
| 18 |
| 2 |
| 1,000 |
| 1,438 |
| 2,438 |
| 5 |
| 2,733 |
| 2,252 |
Javier Botín |
| 90 |
| — |
| — |
| — |
| 16 |
| — |
| — |
| — |
| — |
| — |
| 106 |
| 42 |
Lord Burns (***) |
| 90 |
| — |
| — |
| — |
| 15 |
| — |
| — |
| — |
| — |
| — |
| 105 |
| 4 |
Guillermo de la Dehesa |
| 90 |
| 180 |
| — |
| 30 |
| 18 |
| 8 |
| — |
| — |
| — |
| — |
| 326 |
| 258 |
Rodrigo Echenique |
| 90 |
| 180 |
| 29 |
| 30 |
| 18 |
| 80 |
| — |
| — |
| — |
| 902 |
| 1,329 |
| 1,113 |
Antonio Escámez |
| 90 |
| 180 |
| — |
| — |
| 18 |
| 116 |
| — |
| — |
| — |
| 933 |
| 1,337 |
| 1,088 |
Francisco Luzón |
| 90 |
| 180 |
| — |
| — |
| 18 |
| 2 |
| 1,063 |
| 2,307 |
| 3,370 |
| 343 |
| 4,003 |
| 3,538 |
Luis Ángel Rojo (****) |
| 49 |
| — |
| 27 |
| 16 |
| 12 |
| 9 |
| — |
| — |
| — |
| — |
| 113 |
| — |
Abel Matutes |
| 90 |
| — |
| 50 |
| — |
| 18 |
| 14 |
| — |
| — |
| — |
| — |
| 172 |
| 144 |
Mutua Madrileña Automovilista |
| 104 |
| — |
| — |
| — |
| 18 |
| — |
| — |
| — |
| — |
| — |
| 122 |
| 62 |
Luis Alberto Salazar-Simpson |
| 90 |
| — |
| 50 |
| — |
| 18 |
| 15 |
| — |
| — |
| — |
| — |
| 173 |
| 143 |
Emilio Botín O. (**) |
| 81 |
| — |
| — |
| — |
| 16 |
| 1 |
| — |
| — |
| — |
| — |
| 98 |
| 94 |
Elías Masaveu (**) |
| 35 |
| — |
| — |
| 12 |
| — |
| — |
| — |
| — |
| — |
| — |
| 47 |
| 81 |
Jaime Botín (*) |
| — |
| — |
| — |
| — |
| — |
| — |
| — |
| — |
| — |
| — |
| — |
| 48 |
Juan Abelló (*) |
| — |
| — |
| — |
| — |
| — |
| — |
| — |
| — |
| — |
| — |
| — |
| 121 |
José Manuel Arburúa (*) |
| — |
| — |
| — |
| — |
| — |
| — |
| — |
| — |
| — |
| — |
| — |
| 120 |
Sir George Ross Mathewson (*) |
| — |
| — |
| — |
| — |
| — |
| — |
| — |
| — |
| — |
| — |
| — |
| 69 |
Antonio de Sommer (*) |
| — |
| — |
| — |
| — |
| — |
| — |
| — |
| — |
| — |
| — |
| — |
| 25 |
|
|
|
|
|
|
|
|
|
|
|
| |||||||||||||
Total 2005 | 1,795 | 1,800 | 256 | 148 | 315 | 607 | 7,082 | 11,412 | 18,494 | 2,704 | 26,119 | — | ||||||||||||
|
|
|
|
|
|
|
|
|
|
|
|
| ||||||||||||
Total 2004 | 1,435 | 1,463 | 214 | — | 387 | 697 | 6,784 | 9,395 | 16,179 | 2,285 | — | 22,660 | ||||||||||||
|
|
|
|
|
|
|
|
|
|
|
|
| ||||||||||||
(*) | Directors who served on the Board of Directors for part of 2004 but who resigned prior to December 31, 2004. |
(**) | Directors who served on the Board of Directors for part of 2005 but who resigned prior to December 31, 2005. |
(***) | Appointed as member of the Bank’s Board of Directors on December 20, 2004 and subsequently ratified by the shareholders at the Annual General Meeting on June 18, 2005. |
(****) | Appointed as member of the Bank’s Board of Directors on April 25, 2005 and subsequently ratified by the shareholders at the Annual General Meeting on June 18, 2005. |
(a) | Accrued in 2005. |
114
The remuneration and other compensation granted to the Directors in 2005 is as follows:
Compensation to the Board Members as representatives of the Bank and to Senior Management
Representation on other boards
By resolution of the Executive Committee, all the compensation received by the Bank’s Directors who represent the Bank on the boards of directors of listed companies in which the Bank has a stake (at the expense of those companies) relating to appointments made after March 18, 2002, will accrue to the Group. The compensation received in 2005 in connection with representation duties of this kind, relating to appointments made after March 18, 2002, was as follows:
| Company |
| Thousands |
|
| ||
Emilio Botín | Shinsei |
| 58.7 |
Fernando de Asúa | Cepsa |
| 89.9 |
Antonio Escámez | Attijariwafa Bank |
| 5.1 |
|
|
| |
|
|
| 153.7 |
|
|
|
In 2005 Emilio Botín received options to acquire 25,000 shares of Shinsei at a price of JPY601 each. Considering the market price of Shinsei at December 30, 2005 (JPY682) and the Japanese yen/euro exchange rate at that date (JPY139.48/€1), the value of the attributed options is €14,518.21.
Additionally, other Directors received a total amount of €739,000 during 2005 for sitting on the boards of companies belonging to the Group (Lord Burns received €685,000 from Abbey, Rodrigo Echenique received €30,000 from Banif and Matías R. Inciarte received €24,000 from UCI).
Senior management
Additionally, below are the details of the aggregate compensation paid to the Bank’s Executive Officers (*) in 2005, 2004 and 2003:
Year |
| Number |
| Thousands of Euros | ||||||||
| ||||||||||||
| Salary Compensation |
|
|
|
| |||||||
|
|
|
|
| ||||||||
| Fixed |
| Variable |
| Total |
| Other |
| Total | |||
|
|
|
|
|
| |||||||
2003 |
| 20 |
| 12,924 |
| 16,664 |
| 29,588 |
| 4,703 |
| 34,291 |
2004 |
| 23 |
| 15,156 |
| 24,399 |
| 39,555 |
| 1,727 |
| 41,282 |
2005 |
| 24 |
| 16,450 |
| 27,010 |
| 43,460 |
| 2,708 |
| 46,168 |
(*) | Excluding Executive Directors’ compensation, which is detailed above. |
Pension commitments, other insurance and other items
The total balance of supplementary pension obligations assumed by the Group over the years for its current and retired employees, which amounted to €22,461 million (covered mostly by in-house allowances) as of December 31, 2005, includes the obligations to those who have been Directors of the Bank during the year and who discharge (or have discharged) executive functions. The total pension commitments for these Directors, together with the total sum insured under life insurance policies at that date and other items, amounted to €182 million as of December 31, 2005 (€178 million as of December 31, 2004 and €162 million as of December 31, 2003).
115
The following table provides information on the obligations undertaken and covered by the Group relating to pension commitments and other insurance for the Bank’s executive Directors:
|
| Thousands of euros | ||||||||||
| ||||||||||||
| 2005 |
| 2004 |
| 2003 | |||||||
|
|
| ||||||||||
| Total Accrued |
| Other |
| Total Accrued |
| Other |
| Total Accrued |
| Other | |
|
|
|
|
|
|
| ||||||
Emilio Botín |
| 11,785 |
| — |
| 10,700 |
| — |
| 10,028 |
| — |
Alfredo Sáenz |
| 45,444 |
| 7,917 |
| 46,061 |
| 7,724 |
| 52,807 |
| 7,573 |
Matías R. Inciarte |
| 28,953 |
| 3,997 |
| 27,752 |
| 3,900 |
| 27,442 |
| 3,900 |
Ana P. Botín |
| 12,232 |
| 1,373 |
| 9,742 |
| 1,258 |
| 7,736 |
| 1,258 |
Francisco Luzón |
| 39,188 |
| 6,380 |
| 35,703 |
| 6,224 |
| 19,448 |
| 4,886 |
|
|
|
|
|
|
| ||||||
Total |
| 137,602 |
| 19,667 |
| 129,958 |
| 19,106 |
| 117,461 |
| 17,617 |
|
|
|
|
|
|
| ||||||
The amounts in the “Accrued Pension Obligations” column in the foregoing table relate to the present actuarial value of the accrued future annual payments to be made by us which the beneficiaries are not entitled to receive in a single payment. These amounts were obtained from actuarial calculations and cover the commitments to pay the Directors’ respective pension supplements, which were calculated as follows:
In the case of Emilio Botín, 100% of the fixed annual salary received by him at the date of effective retirement.
In all other cases, 100% of the sum of the fixed annual salary received at the date of effective retirement plus 30% of the arithmetical mean of the last three variable salary payments received. In addition, in the case of Francisco Luzón, to the amount thus calculated will be added the amounts received by him in the year before retirement or early retirement in his capacity as a member of the Board of Directors of the Bank or of other consolidable Group companies.
Pension charges recognized and reversed in 2005 amounted to €4,414 thousand and €4,449 thousand, respectively.
Additionally, other Directors benefit from life insurance policies at the Group’s expense, the related insured sum being €3 million as of December 31, 2005, 2004 and 2003.
In addition, the total pension commitments, together with the total sum insured under life insurance policies for the Bank’s Executive Officers (excluding executive Directors), amounted to €187 million as of December 31, 2005.
Stock option plan
Our By-laws provide that Directors may also receive compensation in the form of shares of the Bank or options over the shares, or other remuneration linked to the share value following a resolution adopted by the shareholders at the General Shareholders’ Meeting (conducted in accordance with our By-laws, the Rules of Procedure of the Shareholder’s Meeting and applicable Spanish legislation).
116
The details of the Bank’s stock options granted to the Board members as of December 31, 2005, are as follows:
|
|
|
|
|
|
|
| Exercised Options |
|
|
|
|
|
|
|
| ||||
|
|
|
|
|
|
|
|
|
|
|
|
|
| |||||||
Options at |
| Exercise |
| Options |
| Number |
| Exercise |
| Market Price |
| Options at |
| Exercise |
| Date of |
| Date of | ||
|
|
|
|
|
| |||||||||||||||
Managers Plan 2000: |
|
|
|
|
|
|
|
|
|
|
|
|
|
|
|
|
|
|
|
|
Emilio Botín |
| 150,000 |
| 10.545 |
| — |
| (150,000 | ) | 10.545 |
| 11.12 |
| — |
| — |
| 12/30/03 |
| 12/29/05 |
Alfredo Sáenz |
| 100,000 |
| 10.545 |
| — |
| (100,000 | ) | 10.545 |
| 11.14 |
| — |
| — |
| 12/30/03 |
| 12/29/05 |
Matías R. Inciarte |
| 125,000 |
| 10.545 |
| — |
| (125,000 | ) | 10.545 |
| 11.14 |
| — |
| — |
| 12/30/03 |
| 12/29/05 |
Antonio Escámez |
| 100,000 |
| 10.545 |
| — |
| (100,000 | ) | 10.545 |
| 11.07 |
| — |
| — |
| 12/30/03 |
| 12/29/05 |
Francisco Luzón |
| 100,000 |
| 10.545 |
| — |
| (100,000 | ) | 10.545 |
| 11.14 |
| — |
| — |
| 12/30/03 |
| 12/29/05 |
|
|
|
|
|
|
|
|
|
|
|
|
| ||||||||
|
| 575,000 |
| 10.545 |
| — |
| (575,000 | ) | 10.545 |
| 11.12 |
| — |
| — |
|
|
|
|
|
|
|
|
|
|
|
|
|
|
|
|
| ||||||||
Long-term incentive plan (I-06): |
|
|
|
|
|
|
|
|
|
|
|
|
|
|
|
|
|
|
|
|
Emilio Botín |
| 541,400 |
| 9.07 |
| — |
| — |
| — |
| — |
| 541,400 |
| 9.07 |
| 01/15/08 |
| 01/15/09 |
Alfredo Sáenz |
| 1,209,100 |
| 9.07 |
| — |
| — |
| — |
| — |
| 1,209,100 |
| 9.07 |
| 01/15/08 |
| 01/15/09 |
Matías R. Inciarte |
| 665,200 |
| 9.07 |
| — |
| — |
| — |
| — |
| 665,200 |
| 9.07 |
| 01/15/08 |
| 01/15/09 |
Ana P. Botín (*) |
| 293,692 |
| 9.07 |
| — |
| — |
| — |
| — |
| 293,692 |
| 9.07 |
| 01/15/08 |
| 01/15/09 |
Francisco Luzón |
| 639,400 |
| 9.07 |
| — |
| — |
| — |
| — |
| 639,400 |
| 9.07 |
| 01/15/08 |
| 01/15/09 |
|
|
|
|
|
|
|
|
|
|
|
|
| ||||||||
|
| 3,348,792 |
| 9.07 |
| — |
| — |
| — |
| — |
| 3,348,792 |
| 9.07 |
|
|
|
|
|
|
|
|
|
|
|
|
|
|
|
|
| ||||||||
(*) Approved by Banesto’s shareholders at its General Meeting on February 28, 2006.
Description of Stock Option and Compensation Plans
In recent years, the Bank has put in place compensation systems for its managers and employees linked to the market performance of the Bank’s shares based on the achievement of certain objectives. Below is a summary of the different stock option and compensation plans in effect as of January 1, 2005:
Plan Four
Five of our officers participated in an option plan known as “Plan Four”. Each option received under this plan granted its holder the right to receive one share of Santander ordinary common stock, par value €0.50. The exercise price of the shares subject to this plan was €7.84, and plan participants could exercise these options until December 30, 2005. Plan participants must hold the shares acquired through this plan for a period of twelve months following the date of exercise of the options. During 2005, 228,000 options were exercised and the plan expired.
Investment Bank Plan
56 of our officers from the Global Wholesale Banking Division participated in an equity incentive plan known as the “Investment Bank Plan”. The number of options received by plan participants under this plan was based on the extent to which certain business objectives were achieved. Each option received under this plan granted its holder the right to receive one share of Santander ordinary common stock, par value €0.50. The exercise price of the shares subject to this plan was €10.25, and plan participants could exercise the first 50% of the options granted from June 16, 2003, and the remaining 50% from June 16, 2004. The exercise period ended in both cases on June 15, 2005. During 2005, no options were exercised and the plan expired.
Young Executives Plan
111 of our officers participated in an option plan known as the “Young Executives Plan”. Each option received under this plan granted its holder the right to receive one share of Santander ordinary common stock, par value €0.50. The exercise price of the shares subject to this plan was €2.29, and plan participants could have exercised the first 50% of the options granted from July 1, 2003 until June 30, 2005 and the remaining 50% from July 1, 2004 until June 30, 2005. Plan participants must hold the shares acquired through this plan for a period of twelve months following the date of exercise of the options. During 2005, 329,000 options were exercised and the plan expired.
Managers Plan 2000
970 of our officers participated in an option plan known as the “Managers Plan 2000”. Each option received under this plan granted its holder the right to receive one share of Santander ordinary common stock, par value €0.50. The exercise price of the options subject to this plan is €10.55, and plan participants could exercise these options from December 30, 2003 until December 29, 2005. Plan participants must hold the shares acquired through this plan for a period of twelve months following the date of exercise of the options. During 2005, 12,389,000 options were exercised and the plan expired.
117
European Branches Plan
27 of our officers participated in an incentive plan known as the “European Branches Plan”. Subject to the achievement of certain objectives, the beneficiaries of this plan received a payment in cash or in shares of Santander. For purposes of the calculation of the number of shares to be delivered, the share price was calculated at the average quoted price of the month previous to the incorporation to the branch and plan participants could exercise 1,615,000 of the options granted from July 1, 2004 until July 15, 2004, and could exercise the remaining options granted from July 1, 2005 until July 15, 2005. During 2005, 2,660,000 options were exercised and the plan expired.
I 06 Plan
On December 20, 2004, the Board of Directors decided to implement, subject to the approval of our General Shareholders’ Meeting held on June 18, 2005, a new long-term incentive plan (I-06) in the form of stock options tied to the achievement of two objectives: a revaluation of the Bank’s share price and growth in earnings per share, in both cases above a sample of comparable banks. 2,601 officers are covered by this plan with a total of 99,900,000 options of Bank shares already granted at an exercise price of €9.07. The exercise period is from January 15, 2008 to January 15, 2009. This plan was approved by our shareholders at the Annual General Meeting on June 18, 2005.
The above table indicates the number of Santander share options held by our Directors under this plan. All the beneficiaries are executive Directors since it is the Bank’s policy not to apply remunerations based on stock options to non-executive Directors.
Additionally, the following plans were cancelled during 2004:
Managers Plan 1999
As of January 1, 2004, 243 of our officers participated in an option plan known as the “Managers Plan 1999”. Each option received under this plan granted its holder the right to receive one share of Santander ordinary common stock, par value €0.50. The exercise price of the shares subject to this plan was €2.29, and plan participants could exercise these options from December 31, 2001 until December 30, 2004. Plan participants must hold the shares acquired through this plan for a period of twelve months following the date of exercise of the options. During 2004, 1,139,488 options were exercised.
Additional Managers Plan 1999
As of January 1, 2004, 14 of our officers participated in an option plan known as the “Additional Managers Plan 1999”. Each option received under this plan granted its holder the right to receive one share of Santander ordinary common stock, par value €0.50. The exercise price of the shares subject to this plan was €2.41, and plan participants could exercise these options from April 1, 2002 until December 30, 2004. Plan participants must hold the shares acquired through this plan for a period of nine months following the date of exercise of the options. During 2004, 55,668 options were exercised.
118
Stock Option and Compensation Plans
|
| Number |
| Euros |
| Year |
| Qualifying |
| Number |
| Date of |
| Date of |
|
|
|
|
|
|
|
| |||||||
Plans in force at January 1, 2003 |
| 27,308,303 |
| 9.32 |
|
|
|
|
|
|
|
|
|
|
Options granted |
| 1,410,000 |
| 6.55 |
|
|
|
|
|
|
|
|
|
|
Of which: |
|
|
|
|
|
|
|
|
|
|
|
|
|
|
European branches plan |
| 1,410,000 |
| 6.55 |
|
|
|
|
|
|
|
|
|
|
Options exercised |
| (965,087 | ) | 2.29 |
|
|
|
|
|
|
|
|
|
|
Of which: |
|
|
|
|
|
|
|
|
|
|
|
|
|
|
Managers Plan 99 |
| (678,325 | ) | 2.29 |
|
|
|
|
|
|
|
|
|
|
Young Executives Plan |
| (262,250 | ) | 2.29 |
|
|
|
|
|
|
|
|
|
|
Additional Managers Plan 99 |
| (24,512 | ) | 2.41 |
|
|
|
|
|
|
|
|
|
|
Options canceled or not exercised |
| (2,013,250 | ) | — |
|
|
|
|
|
|
|
|
|
|
|
|
|
|
|
|
|
|
|
|
|
|
| ||
Plans in force at December 31, 2003 |
| 25,739,966 |
| 9.38 |
|
|
|
|
|
|
|
|
|
|
|
|
|
|
|
|
|
|
|
|
|
|
| ||
Options exercised |
| (1,934,406 | ) | (2.83 | ) |
|
|
|
|
|
|
|
|
|
Of which: |
|
|
|
|
|
|
|
|
|
|
|
|
|
|
Plan Four |
| (36,000 | ) | 7.84 |
|
|
|
|
|
|
|
|
|
|
Managers Plan 99 |
| (1,139,488 | ) | 2.29 |
|
|
|
|
|
|
|
|
|
|
Additional Managers Plan 99 |
| (55,668 | ) | 2.41 |
|
|
|
|
|
|
|
|
|
|
Young Executives Plan |
| (562,250 | ) | 2.29 |
|
|
|
|
|
|
|
|
|
|
European branches plan |
| (140,000 | ) | 8.23 |
|
|
|
|
|
|
|
|
|
|
Options canceled or not exercised |
| (2,678,810 | ) | — |
|
|
|
|
|
|
|
|
|
|
|
|
|
|
|
|
|
|
|
|
|
|
| ||
Plans in force at December 31, 2004 |
| 21,126,750 |
| 9.94 |
|
|
|
|
|
|
|
|
|
|
|
|
|
|
|
|
|
|
|
|
|
|
| ||
Of which: |
|
|
|
|
|
|
|
|
|
|
|
|
|
|
Plan Four |
| 228,000 |
| 7.84 |
| 1998 |
| Managers |
| 5 |
| 01/09/03 |
| 12/30/05 |
Investment Bank Plan |
| 4,503,750 |
| 10.25 |
| 2000 |
| Managers |
| 56 |
| 06/16/03 |
| 06/15/05 |
Young Executives Plan |
| 364,000 |
| 2.29 |
| 2000 |
| Managers |
| 111 |
| 07/01/03 |
| 06/30/05 |
Managers Plan 2000 |
| 13,341,000 |
| 10.55 |
| 2000 |
| Managers |
| 970 |
| 12/30/03 |
| 12/29/05 |
European branches plan |
| 2,690,000 |
| 7.60 | (*) | 2002 and 2003 |
| Managers |
| 27 |
| 07/01/05 |
| 07/15/05 |
Plans in force at January 1, 2005 |
| 21,126,750 |
| 9.94 |
|
|
|
|
|
|
|
|
|
|
Options granted (I-06) |
| 99,900,000 |
| 9.07 |
| 2005 |
| Managers |
| 2,601 |
| 01/15/08 |
| 01/15/09 |
Options exercised |
| (15,606,000 | ) | (9.83 | ) |
|
|
|
|
|
|
|
|
|
Of which: |
|
|
|
|
|
|
|
|
|
|
|
|
|
|
Plan Four |
| (228,000 | ) | 7.84 |
|
|
|
|
|
|
|
|
|
|
Investment Bank Plan |
| — |
| — |
|
|
|
|
|
|
|
|
|
|
Young Executives Plan |
| (329,000 | ) | 2.29 |
|
|
|
|
|
|
|
|
|
|
Managers Plan 2000 |
| (12,389,000 | ) | 10.55 |
|
|
|
|
|
|
|
|
|
|
European branches plan |
| (2,660,000 | ) | 7.60 | (*) |
|
|
|
|
|
|
|
|
|
Options canceled or not exercised |
| (5,520,750 | ) | — |
|
|
|
|
|
|
|
|
|
|
Plans in force at December 31, 2005 |
| 99,900,000 |
| 9.07 |
| 2005 |
| Managers |
| 2,601 |
| 01/15/08 |
| 01/15/09 |
(*) | The average exercise price ranges from €5.65 to €10.15 per share. |
119
The option plans on shares of the Bank originally granted by management of Abbey to its employees (on Abbey shares) are as follows:
|
| Number |
| Pounds (*) |
| Year |
| Qualifying |
| Number |
| Date of |
| Date of |
|
|
|
|
|
|
|
| |||||||
Plans in force at December 31, 2004 |
| 17,675,567 |
| 3.58 |
|
|
|
|
|
|
|
|
|
|
|
|
|
|
|
|
|
|
|
|
|
|
| ||
Of which: |
|
|
|
|
|
|
|
|
|
|
|
|
|
|
Executive Options |
| 358,844 |
| 4.16 |
|
|
|
|
|
|
|
|
|
|
Employee Options |
| 56,550 |
| 5.90 |
|
|
|
|
|
|
|
|
|
|
Sharesave |
| 17,260,173 |
| 3.56 |
|
|
|
|
|
|
|
|
|
|
Plans in force at January 1, 2005 |
| 17,675,567 |
| 3.58 |
|
|
|
|
|
|
|
|
|
|
Options exercised |
| (1,769,216 | ) | 4.45 |
|
|
|
|
|
|
|
|
|
|
Of which: |
|
|
|
|
|
|
|
|
|
|
|
|
|
|
Executive Options |
| (89,305 | ) | 4.43 |
|
|
|
|
|
|
|
|
|
|
Employee Options |
| (2,550 | ) | 5.90 |
|
|
|
|
|
|
|
|
|
|
Sharesave |
| (1,677,361 | ) | 4.45 |
|
|
|
|
|
|
|
|
|
|
Options canceled or not exercised |
| (1,783,670 | ) | — |
|
|
|
|
|
|
|
|
|
|
Plans in force at December 31, 2005 |
| 14,122,681 |
| 3.41 |
|
|
|
|
|
|
|
|
|
|
Of which: |
|
|
|
|
|
|
|
|
|
|
|
|
|
|
Executive Options |
| 269,539 |
| 4.07 |
| 2003-2004 |
| Managers |
| 20 |
| 06/26/2006 |
| 04/04/2014 |
Employee Options |
| 54,000 |
| 5.90 |
| 1996 |
| Employees |
| 363 |
| 01/09/2001 |
| 09/08/2006 |
Sharesave |
| 13,799,142 |
| 3.38 |
| 1998-2004 |
| Employees |
| 8,495 | (**) | 04/01/2005 |
| 09/01/2011 |
(*) | At December 31, 2005, the euro/pound sterling exchange rate was €1.4592 per pound (December 31, 2004: €1.4183 per pound). |
(**) | Number of accounts / contracts. One employee can own more than one account / contract. |
Additionally, in 2005 the Group designed a medium-term incentive plan (MTIP) involving the delivery of Bank shares to Abbey executives. Under the plan, which was approved by the shareholders at the last Annual General Meeting held on June 17, 2006, the granting and distribution of the shares in 2008 is tied to the achievement of business targets by Abbey (in terms of net profit and income). The plan has 185 beneficiaries and involves the delivery of up to a maximum of 3,150,000 shares of Santander, representing approximately 0.05% of the Bank’s share capital. Effective delivery of the shares is scheduled for 2008, provided the related targets are met.
Date of expiration of the current term of office of the directors and the period during which the directors have served in that office:
The period during which the Directors have served in their office is shown in the table under Section A of this Item 6.
The date of expiration of the current term of office is shown in the table below:
Name |
| Date of expiration |
| ||
Emilio Botín |
| 1st half 2008 |
Fernando de Asúa |
| 1st half 2011 |
Alfredo Sáenz |
| 1st half 2011 |
Matías R. Inciarte |
| 1st half 2008 |
Manuel Soto |
| 1st half 2008 |
Assicurazioni Generali, S.p.A. |
| 1st half 2007 |
Antonio Basagoiti |
| 1st half 2007 |
Ana P. Botín |
| 1st half 2011 |
Javier Botín |
| 1st half 2008 |
Lord Burns |
| 1st half 2011 |
Guillermo de la Dehesa |
| 1st half 2008 |
Rodrigo Echenique |
| 1st half 2011 |
Antonio Escámez |
| 1st half 2007 |
Francisco Luzón |
| 1st half 2007 |
Abel Matutes |
| 1st half 2008 |
Mutua Madrileña Automovilista |
| 1st half 2007 |
Luis Ángel Rojo |
| 1st half 2008 |
Luis Alberto Salazar-Simpson |
| 1st half 2007 |
Jay S. Sidhu |
| 1st half 2011 |
120
At our last Shareholders’ Meeting, which was held on June 17, 2006, our shareholders approved the appointment of Jay S. Sidhu, the Chairman, President and Chief Executive Officer of Sovereign Bancorp, Inc., and the re-election of Fernando de Asúa, Alfredo Sáenz, Ana P. Botín, Rodrigo Echenique and Lord Burns. Each of them was elected by our shareholders at the Annual General Meeting to serve for a five year term.
In addition, at such Annual General Meeting a proposal to amend our By-laws to extend board terms from three to five years was approved but it only will be effective once the amendment is registered on the Mercantile Registry.
The date of expiration indicated on the above table for Jay S. Sidhu, Fernando de Asúa, Alfredo Sáenz, Ana P. Botín, Rodrigo Echenique and Lord Burns assumes the entry into force of the extension from three to five years of the board terms. Otherwise, their expiration dates would be the first half of 2009.
The essential terms and conditions of the contracts subscribed by the Bank with its executive Directors Alfredo Sáenz, Matías R. Inciarte, Ana P. Botín and Francisco Luzón are as follows:
(i) Exclusivity and non-competition
Executive Directors may not enter into other service contracts with other companies or institutions, unless prior authorization is obtained from the Board of Directors, an obligation of non-competition being established with respect to companies and activities of a nature similar to that of the Bank and its consolidated Group.
(ii) Code of Conduct
Mention is made of the obligation to strictly observe the provisions of Grupo Santander’s General Code of Conduct and the Code of Conduct in the Securities Market, specifically with respect to rules of confidentiality, professional ethics and conflict of interests.
(iii) Remuneration
The remuneration for undertaking their executive responsibilities consists basically of a fixed amount, to be reviewed yearly, and a variable amount in terms of the criteria established by the Bank from time to time.
In addition, executive Directors are entitled to receive a pension supplement in the event of early retirement or retirement, which may be externalized by the Bank. The Bank may request executive Directors to take early retirement, provided they have reached the age of 50 and have served more than 10 years in the Bank and/or other Group companies, although the Bank may order an extension of their professional duties for six months in order to arrange for another person to take over their responsibilities. Likewise, executive Directors may take early retirement at their own request if they are over 55 and have served the Bank and/or other Group companies for 10 years. In any event, any decision with respect to retirement or early retirement should be presented with 60 days’ notice.
Pension rights are also recognized in favor of the spouse (widow) and children (orphans) in cases of death and permanent disability of the executive Director.
Generally, the amount of such pension supplement consists of the amount necessary to reach an annual gross amount equivalent to 100% of the fixed salary received by the Director in question at the time when he or she actually ceased working, plus 30% of the average of the last three variable remuneration amounts received. In certain cases, if the early retirement occurs at the request of the Director, the amount resulting after applying the above criterion would be reduced by percentages ranging from 20% to 4% in terms of the Director’s age on early retirement.
Receipt of pension supplements will be incompatible with the rendering of services to competitors of the Bank or its Group, unless the Bank’s express authorization is received.
Remuneration for undertaking executive responsibilities is compatible with the receipt of amounts specified by the By-laws (participation in earnings) and fees applicable to them merely in their capacity as members of the Board of Directors, as expressly established by the By-laws and the Regulations of the Board of Directors.
121
(iv) Termination
The duration of these contracts is indefinite. However, if a contract is terminated owing to a breach of an executive Director’s responsibilities or of his or her own free will, he or she will not be entitled to any financial compensation.
Whenever termination is attributable to the Bank or due to objective circumstances, such as those that affect the functional and organic status of the executive Director, the Director will be entitled to receive the following items of remuneration:
| 1. | In the case of Matías R. Inciarte and Francisco Luzón, the pension supplements recognized upon changing to early retired status. At December 31, 2005 these were €1,801 thousand per year for Matías R. Inciarte and €1,938 thousand per year for Francisco Luzón. |
| 2. | In the case of Ana P. Botín, the indemnity, which, for an amount up to 5 years’ fixed annual salary, is established in the contract depending on the date on which termination occurs. At December 31, 2005 the amount was €4.0 million. Receipt of this amount would exclude receipt of a pension. |
| 3. | In the case of Alfredo Sáenz, a choice between retirement pension or receipt of a payment equivalent to 40% of his fixed annual salary multiplied by his number of years in banking, up to ten years. At December 31, 2005, the former option would entitle him to a payment of €3,421 thousand per year, while the latter would entitle him to a lump sum payment of €26.4 million. These choices are mutually exclusive; thus, if Alfredo Sáenz were to opt for the lump sum payment he would receive no pension. |
(v) Insurance
The Bank provides life and accident insurance to its executive Directors, with coverage varying in each case depending on the policy established by the Bank for its senior management, as well as health insurance consisting of reimbursement.
(vi) Confidentiality and return of documents
A strict confidentiality obligation is established throughout the duration of the Director’s relationship with the Bank and also following termination of such relationship, consisting of the obligation to return to the Bank all documents and objects in possession of the executive Director relating to his or her activity.
Compliance with NYSE Listing Standards on Corporate Governance
On November 4, 2003, the SEC approved new rules proposed by the New York Stock Exchange (NYSE) intended to strengthen corporate governance standards for listed companies. In compliance therewith, the following is a summary of the significant differences between our corporate governance practices and those applicable to domestic issuers under the NYSE listing standards.
Independence of the Directors on the Board of Directors
Under the NYSE corporate governance rules, a majority of the Board of Directors must be composed of independent directors, the independence of whom is determined in accordance with highly detailed rules promulgated by the NYSE. Spanish law does not contain any such requirements. The Board of Directors of Santander has six independent directors (out of nineteen Directors total), as defined in Article 5 of the Regulations of the Board of Directors. We have not determined whether or not the Directors on the Santander Board would be considered independent under the NYSE rules except in the case of the members of our Audit and Compliance Committee where we have determined that all of them meet the NYSE independence criteria for foreign private issuers. Article 5 of the Regulations of the Board of Directors defines the concept of an independent director as follows:
“Independent directors shall be deemed to be those external or non-executive Directors who: (i) are not, and do not represent, shareholders who have the power to influence the control of the Company; (ii) have not held executive positions therein in the last three years; (iii) are not connected to executive Directors by a family or professional bond; or (iv) do not maintain and have not maintained any relations with the Company or the Group which may impair their independence.”
122
Independence of the Directors on the Audit and Compliance Committee
Under the NYSE corporate governance rules, a majority of the audit committee must be composed of independent directors and by July 31, 2005, all members of the audit committee must be independent. Independence is determined in accordance with highly detailed rules promulgated by the NYSE. Such independence criteria are met by all members of our Audit and Compliance Committee.
The Audit and Compliance Committee of the Board of Directors of Santander is composed of five Directors. All members are non-executive independent Directors and its Chairman is independent in accordance with the standards set forth in the previously mentioned Article 5 of the Regulations of the Board. These independence standards may not necessarily be consistent with, or as stringent as, the director independence standards established by the NYSE. Under Spanish law, a majority of the members and the chairman of the audit committee must be non-executive. The composition of the Audit and Compliance Committee is described under “Item 6. Directors, Senior Management and Employees—C. Board Practices—Audit and Compliance Committee and Appointments and Remuneration Committee”.
Independence of the Directors on the Appointments and Remuneration Committee
In accordance with the NYSE corporate governance rules, all U.S. companies listed on the NYSE must have a compensation committee and a nominations committee and all members of such committees must be independent in accordance with highly detailed rules promulgated by the NYSE. Under Spanish law, these committees are not required, though there is a non-binding recommendation for listed companies in Spain to have these committees and for them to be composed of non-executive directors. Santander satisfies this non-binding recommendation. The composition of the Appointments and Remuneration Committee is described under “Item 6. Directors, Senior Management and Employees—C. Board Practices—Audit and Compliance Committee and Appointments and Remuneration Committee”.
Separate Meetings for Non-Management Directors
In accordance with the NYSE corporate governance rules, non-management directors must meet periodically outside of the presence of management. Under Spanish law, this practice is not contemplated and as such, the non-management Directors on the Board of Directors of Santander do not meet outside of the presence of the Directors who also serve in a management capacity.
Code of Ethics
Under the NYSE corporate governance rules, all U.S. companies listed on the NYSE must adopt a Code of Business Conduct and Ethics which contains certain required topics. In March 2000, Santander adopted a “General Code of Conduct”, which applies to all members of the boards of the companies of the Group, to all employees subject to the Code of Conduct in the Securities Market, including the Bank’s Chairman, Chief Executive Officer, Chief Financial Officer and Chief Accounting Officer, and to all those employees designated by the Human Resources Division that have been specifically informed of their subjection to this General Code of Conduct. On July 28, 2003, the Board approved amendments to the General Code of Conduct to conform it to the requirements of Law 44/2002 (November 2, 2002) on reform measures of the financial system. The new Code entered into force on August 1, 2003 and replaced the previous one. The General Code of Conduct establishes the principles that guide the actions of officers and Directors including ethical conduct, professional standards and confidentiality. It also establishes the limitations and defines the conflicts of interests arising from their status as senior executives or Directors.
As of December 31, 2005, no waivers with respect to the General Code of Conduct had been applied for or granted.
In addition, the Group abides by a Code of Conduct in the Securities Market, which was also updated on July 28, 2003. This code establishes standards and obligations in relation to securities trading, conflicts of interest and the treatment of price sensitive information.
Both Codes are available to the public on our website, which does not form part of this annual report on Form 20-F, at www.gruposantander.com under the heading “Information for shareholders and investors - Corporate Governance – Internal Code of Conduct”.
123
Audit and Compliance Committee and Appointments and Remuneration Committee
An Audit and Compliance Committee and an Appointments and Remuneration Committee operate as part of the Board of Directors. The Audit and Compliance Committee consists exclusively of 5 external Directors (all of whom are independent in accordance with the principles set forth in Article 5 of the Regulations of the Board). The Appointments and Remuneration Committee consists of 5 external Directors (4 of whom are independent in accordance with the principles set forth in Article 5 of the Regulations of the Board). These independence standards may not necessarily be consistent with, or as stringent as, the director independence standards established by the NYSE.
The Audit and Compliance Committee:
The Audit and Compliance Committee was created to provide support and specialization in the tasks of controlling and reviewing the accounts and compliance. Its mission, which has been defined and approved by the Board, is established in the By-laws and in the Regulations of the Board. Only non-executive Directors can be members of this Committee with independent Directors (as defined in the Regulations of the Board) having a majority representation. Its Chairman must always be an independent Director (as defined in the Regulations of the Board) and someone who has the necessary knowledge and experience of accounting techniques and principles. Currently, the Chairman of the Audit and Compliance Committee is Luis Ángel Rojo.
Functions of the Audit and Compliance Committee:
| • | Have its Chairman and/or Secretary report to the General Shareholders’ Meeting with respect to matters raised therein by shareholders regarding its powers. |
| • | Propose the appointment of the Auditor, as well as the conditions in which such Auditor will be hired, the scope of its professional duties and, if applicable, the revocation or non-renewal of its appointment. |
| • | Review the accounts of the Bank and the Group, monitor compliance with legal requirements and the proper application of generally accepted accounting principles, and report on the proposals for alterations to the accounting principles and standards suggested by management. |
| • | Supervise the internal audit services. |
| • | Know the process for gathering financial information and the internal control systems. |
| • | Serve as a channel of communication between the Board and the Auditor, assess the results of each audit and the response of the management team to its recommendations, and act as a mediator in the event of disagreement between the Board and the Auditor regarding the principles and standards to be applied in the preparation of the financial statements. Specifically, it shall endeavor to ensure that the statements ultimately drawn up by the Board are submitted to the General Shareholders’ Meeting without any qualifications or reservations in the Auditor’s report. |
| • | Supervise the fulfillment of the audit contract, endeavoring to ensure that the opinion on the annual financial statements and the main contents of the Auditor’s report are set forth in a clear and accurate fashion. |
| • | Watch over the independence of the Auditor, by taking notice of those circumstances or issues that might risk such independence and any others related to the development of the auditing procedure, as well as receive information and maintain such communication with the Auditor as is provided for in legislation regarding the auditing of financial statements and in technical auditing regulations. And, specifically, verify the percentage represented by the fees paid for any and all reasons of the total income of the audit firm, and the length of service of the partner who leads the audit team in the provision of such services to the Company. The annual report registered before the Mercantile Register shall set forth the fees paid to the audit firm, including information relating to fees paid for professional services other than audit work. |
| • | Review, before dissemination thereof, all periodical financial information which, in addition to the annual information, is provided to the markets and the supervising authorities thereof, and supervise that such information is prepared in accordance with the same principles and practices applicable to the annual financial statements. |
124
| • | Supervise the observance of the Code of Conduct of the Group in the Securities Markets, the Manuals and procedures for the prevention of money laundering and, in general, the rules of governance and compliance in effect in the Company, and make such proposals as are deemed necessary for the improvement thereof. In particular, the Committee shall have the duty to receive information and, if applicable, issue a report on disciplinary penalties to be imposed upon members of the Senior Management. |
| • | Review compliance with such courses of action and measures as result from the reports issued or the inspection proceedings carried out by the administrative authorities having functions of supervision and control. |
| • | Know and, if applicable, respond to the initiatives, suggestions or complaints put forward or raised by the shareholders regarding the area of authority of this Committee and which are submitted to it by the Office of the General Secretary of the Company. It also corresponds to the Committee: (i) to receive, deal and keep a record of the claims received by the Bank on matters related to the process for gathering financial information, auditing and internal controls; and (ii) to receive on a confidential and on an anonymous basis possible communications from Group employees who express their concern on possible questionable practices in the areas of accounting or auditing. |
| • | Report on any proposed amendments to the Regulations of the Board prior to the approval thereof by the Board of Directors. |
The Audit and Compliance Committee has issued a report which was distributed together with the Group’s 2005 annual report and which comprised a detailed account of the following points:
| • | Composition, function and procedures of the Committee. |
| • | Activity during 2005, grouped according to the different basic functions of the Committee: |
| — | Financial Information |
| — | The Auditor |
| — | Internal Group control systems |
| — | Internal Auditing |
| — | Compliance and Prevention of Money-Laundering |
| — | Corporate Governance |
| — | Measures proposed by the Supervisory Authorities |
| — | Information provided to the Board and to the shareholders at the General Shareholders Meeting, and evaluation of efficiency and compliance with the rules and procedures of governance of the Bank. |
| • | Evaluation by the Committee of the fulfillment of its duties in 2005. |
The Group’s 2005 Audit and Compliance Committee report is available on the Group’s website, which does not form part of this annual report on Form 20-F, at www.gruposantander.com under the heading “Information for Shareholders and Investors – Corporate Governance – Committees Report”.
The following are the current members of the Audit and Compliance Committee:
Name |
| Position |
| ||
Luis Ángel Rojo |
| Chairman |
Fernando de Asúa |
| Member |
Manuel Soto |
| Member |
Abel Matutes |
| Member |
Luis Alberto Salazar-Simpson |
| Member |
125
Ignacio Benjumea also acts as Secretary to the Audit and Compliance Committee but is classified as a non-member.
The Appointments and Remuneration Committee:
The Regulations of the Board state that the members of this Committee must all be non-executive Directors with independent Directors (as defined in the Regulations of the Board) having a majority representation and an independent Director as Chairman (as defined in the Regulations of the Board).
Currently, the Chairman of the Appointments and Remuneration Committee is Fernando de Asúa, the First Vice Chairman of the Board of Directors.
Functions of the Appointments and Remuneration Committee
| • | Establish and review the standards to be followed in order to determine the composition of the Board and select those persons who will be proposed to serve as Directors. |
| • | Prepare, by following standards of objectiveness and conformance to the corporate interests, the proposals for appointment, re-election and ratification of Directors provided for in Article 19, section 2 of the Regulations of the Board, as well as the proposals for appointment of the members of each of the Committees of the Board of Directors. Likewise, following the same aforementioned standards, prepare the proposals for the appointment of positions on the Board of Directors and its Committees. |
| • | Propose to the Board the form and amount of, and the procedures relating to, the annual compensation of the Directors – both for their performance as such and for their performance in the Bank of duties other than those of a Director – and of the Executive Vice Presidents, and periodically review the compensation programs, assessing the appropriateness and yield thereof and endeavoring to ensure that the compensation of Directors shall conform to standards of moderation and correspondence to the earnings of the Bank. |
| • | Watch over the transparency of such compensation and the inclusion in the annual report registered before the Mercantile Register and in the annual corporate governance report of information regarding the compensation of Directors and, for such purposes, submit to the Board any and all information that may be appropriate. |
| • | Watch over compliance by the Directors with the duties prescribed in Article 28 of the Regulations of the Board, prepare the reports provided for therein and receive information, and, if applicable, prepare a report on the measures to be adopted with respect to the Directors in the event of non-compliance with the above- mentioned duties or with the Code of Conduct of the Group in the Securities Markets. |
The Appointments and Remuneration Committee issued a report which was distributed together with the Group’s 2005 annual report and which comprised a detailed account of the following points:
| • | Composition |
| • | Functions |
| • | Activity during 2005, grouped according to the different functions of the Committee |
| — | Appointment and dismissal of Directors |
| — | Remuneration, policy and implementation |
| — | Board’s self-assessment |
The Group’s 2005 Appointments and Remuneration Committee report is available on the Group’s website, which does not form part of this annual report on Form 20-F, at www.gruposantander.com under the heading “Information for Shareholders and Investors – Corporate Governance – Committees Report”.
126
The following are the members of the Appointments and Remuneration Committee:
Name |
| Position |
| ||
Fernando de Asúa |
| Chairman |
Manuel Soto |
| Member |
Guillermo de la Dehesa |
| Member |
Rodrigo Echenique |
| Member |
Luis Ángel Rojo |
| Member |
Ignacio Benjumea also acts as Secretary to the Appointments and Remuneration Committee but is classified as a non-member.
At December 31, 2005, we had 129,196 employees (as compared to 132,001 employees in 2004 and 103,038 in 2003) of which 34,813 were employed in Spain (as compared to 35,048 in 2004 and 34,956 in 2003) and 94,383 were employed outside Spain (as compared to 96,953 in 2004 and 68,082 in 2003), of which 21,080 in the United Kingdom (as compared to 25,393 in 2004). The terms and conditions of employment in the private sector banks in Spain are negotiated on an industry-wide basis with the trade unions. This process has historically produced collective agreements binding upon all the private banks and their employees. A new agreement was signed on May 11, 2005 and expires on December 31, 2006.
127
The table below shows our employees by geographic area:
|
| Number of employees |
| ||||
|
|
| |||||
|
| 2005 |
| 2004 |
| 2003 |
|
|
|
|
|
| |||
SPAIN |
| 34,813 |
| 35,048 |
| 34,956 |
|
LATIN AMERICA |
| 62,161 |
| 59,905 |
| 57,048 |
|
Argentina |
| 5,975 |
| 5,907 |
| 5,342 |
|
Bolivia |
| 328 |
| 323 |
| 319 |
|
Brazil |
| 20,489 |
| 21,097 |
| 21,841 |
|
Chile |
| 11,408 |
| 11,408 |
| 8,970 |
|
Colombia |
| 1,730 |
| 1,737 |
| 1,808 |
|
Mexico |
| 14,562 |
| 12,596 |
| 11,852 |
|
Peru |
| 1,492 |
| 536 |
| 472 |
|
Puerto Rico |
| 1,611 |
| 1,630 |
| 1,621 |
|
Uruguay |
| 251 |
| 253 |
| 250 |
|
Venezuela |
| 4,315 |
| 4,418 |
| 4,573 |
|
|
|
|
|
|
|
|
|
EUROPE |
| 31,474 |
| 36,310 |
| 10,287 |
|
Czech Republic |
| 192 |
| 275 |
| 229 |
|
Germany |
| 1,875 |
| 1,824 |
| 2,081 |
|
Belgium |
| 27 |
| 58 |
| 59 |
|
France |
| 17 |
| 28 |
| 30 |
|
Hungary |
| 76 |
| 72 |
| 67 |
|
Ireland |
| 5 |
| 8 |
| 7 |
|
Italy |
| 720 |
| 622 |
| 511 |
|
Norway |
| 269 |
| 496 |
| — |
|
Poland |
| 646 |
| 801 |
| 50 |
|
Portugal |
| 6,317 |
| 6,503 |
| 7,035 |
|
Switzerland |
| 188 |
| 173 |
| 149 |
|
The Netherlands |
| 62 |
| 57 |
| — |
|
United Kingdom |
| 21,080 |
| 25,393 |
| 69 |
|
|
|
|
|
|
|
|
|
USA |
| 649 |
| 636 |
| 653 |
|
|
|
|
|
|
|
|
|
ASIA |
| 11 |
| 10 |
| 11 |
|
Hong Kong |
| 7 |
| 6 |
| 5 |
|
Japan |
| 4 |
| 4 |
| 6 |
|
|
|
|
|
|
|
|
|
OTHERS |
| 88 |
| 92 |
| 83 |
|
Bahamas |
| 65 |
| 70 |
| 64 |
|
Others |
| 23 |
| 22 |
| 19 |
|
|
|
|
|
| |||
Total |
| 129,196 |
| 132,001 |
| 103,038 |
|
|
|
|
|
| |||
In those cases where an employee is working from one country but is technically employed by a group company located in a different country, we designate that employee as working from his/her country of residence.
128
The table below shows our employees by type of business:
|
| Number of employees |
| ||||
|
|
| |||||
|
| 2005 |
| 2004 |
| 2003 |
|
|
|
|
|
| |||
Retail Banking |
| 117,655 |
| 122,262 |
| 93,873 |
|
Asset Management and Insurance |
| 7,902 |
| 6,108 |
| 6,606 |
|
Global Wholesale Banking |
| 2,177 |
| 2,198 |
| 2,288 |
|
Financial Management and Equity Stakes |
| 1,462 |
| 1,433 |
| 271 |
|
|
|
|
|
| |||
Total |
| 129,196 |
| 132,001 |
| 103,038 |
|
|
|
|
|
| |||
As of December 31, 2005, we had 3,795 temporary employees (as compared to 2,832 as of December 31, 2004 and 2,172 as of December 31, 2003). In 2005, the average number of temporary employees working for the Group was 3,087 employees.
As of June 23, 2006, the direct, indirect and represented holdings of our current Directors were as follows:
Directors |
| Direct |
| Indirect stake |
| Total shares |
| % of |
|
|
|
|
|
| |||||
Emilio Botín (1) |
| 1,638,712 |
| 114,303,860 |
| 115,942,572 |
| 2.178 | % |
Fernando de Asúa |
| 24,926 |
| 27,400 |
| 52,326 |
| 0.001 | % |
Alfredo Sáenz |
| 365,063 |
| 1,243,532 |
| 1,608,595 |
| 0.026 | % |
Matías R. Inciarte |
| 551,620 |
| 122,944 |
| 674,564 |
| 0.011 | % |
Manuel Soto |
| — |
| 240,000 |
| 240,000 |
| 0.004 | % |
Assicurazioni Generali S.p.A |
| 9,734,622 |
| 71,486,777 |
| 81,221,399 |
| 1.299 | % |
Antonio Basagoiti |
| 516,541 |
| — |
| 516,541 |
| 0.008 | % |
Ana P. Botín (1) |
| 4,977,323 |
| 4,224,646 |
| 9,201,969 |
| 0.000 | % |
Javier Botín (2) |
| 8,793,481 |
| 2,300,000 |
| 11,093,481 |
| 0.000 | % |
Lord Burns (Terence) |
| 100 |
| 27,001 |
| 27,101 |
| 0.000 | % |
Guillermo de la Dehesa |
| 100 |
| — |
| 100 |
| 0.000 | % |
Rodrigo Echenique |
| 651,598 |
| 7,344 |
| 658,942 |
| 0.011 | % |
Antonio Escámez |
| 559,508 |
| 0 |
| 559,508 |
| 0.009 | % |
Francisco Luzón |
| 1,297,821 |
| 723 |
| 1,298,544 |
| 0.021 | % |
Abel Matutes |
| 52,788 |
| 86,150 |
| 138,938 |
| 0.002 | % |
Mutua Madrileña Automovilista |
| 69,882,339 |
| 135,000 |
| 70,017,339 |
| 1.120 | % |
Luis Ángel Rojo |
| 1 |
| — |
| 1 |
| 0.000 | % |
Luis Alberto Salazar-Simpson |
| 87,865 |
| 4,464 |
| 92,329 |
| 0.001 | % |
Jay S. Sidhu (3) |
| 10,000 |
| — |
| 10,000 |
| 0.000 | % |
| 99,144,408 |
| 194,209,841 |
| 293,354,249 |
| 4.690 | % |
(1) | Emilio Botín has attributed the right of vote in a General Shareholders’ Meeting of 81,075,628 shares (1.30% of the capital stock) held by the Marcelino Botín Foundation, of 8,096,742 shares held by Jaime Botín, of 96,047 shares held by Paloma O’Shea, of 9,041,480 shares held by Emilio Botín O., of 9,201,459 shares held by Ana P. Botín and of 11,093,481 shares held by Javier Botín. This table shows the direct and indirect shareholding of the two latter who are Directors, but in the column showing the percentage of the capital these shareholdings are calculated together with those that belong or are also represented by Emilio Botín. |
(2) | Javier Botín is a proprietary Director as he represents in the Board of Directors a 2.178% of the Bank’s capital stock which corresponds to the holdings of the Marcelino Botín Foundation, Emilio Botín, Ana P. Botín, Emilio Botín O., Jaime Botín, Paloma O’Shea and his own. |
(3) | Directly held by Jay S. Sidhu in the form of American Depositary Shares. |
The options granted to the Bank´s Directors, managers and employees are described in the table under “Section B. Compensation” above.
129
Santander’s capital is comprised of only one class of shares, all of which are ordinary and have the same rights.
As of June 23, 2006 our current Executive Officers (not Directors) referred to above under Section A of this Item 6 as a group beneficially owned, directly or indirectly, 2,534,670 ordinary shares, or 0.04% of our issued and outstanding share capital as of that date. Together with the options granted, no individual executive officer beneficially owns, directly or indirectly, one percent or more of the outstanding share capital as of that date.
Item 7. Major Shareholders and Related Party Transactions
As of December 31, 2005, to our knowledge no person beneficially owned, directly or indirectly, 5% or more of our shares.
At December 31, 2005 a total of 604,262,129 shares, or 9.66% of our share capital, were held by 790 registered holders with registered addresses in the United States and Puerto Rico, including JPMorgan Chase, as depositary of our American Depositary Share Program. These shares were held by 610 record holders. Since certain of such shares and ADRs are held by nominees, the foregoing figures are not representative of the number of beneficial holders. Our Directors and Executive Officers did not own any ADRs as of December 31, 2005.
To our knowledge, we are not controlled directly or indirectly, by any other corporation, government or any other natural or legal person. We do not know of any arrangements which would result in a change of our control.
Shareholders’ agreements
The Bank was informed in February 2006 of an agreement among certain shareholders. The agreement was also communicated to the National Securities Market Commission (CNMV), following the filing of the relevant document both with the mentioned supervisory body and in the Mercantile Registry of Cantabria.
The agreement was entered into by Emilio Botín, Ana P. Botín, Emilio Botín O., Javier Botín, Simancas, S.A., Puente San Miguel, S.A., Puentepumar, S.L., Latimer Inversiones, S.L. and Cronje, S.L. Unipersonal and relates to the shares of the Bank held by them or those over which they have voting rights.
Under this agreement and through the establishment of restrictions on the free transferability of their shares and the regulation of the exercising of the voting rights inherent in them, these shareholders have agreed to act in a coordinated manner, in order to develop a common, lasting and stable policy and an effective and unified presence and representation in the Bank’s governing bodies.
The agreement comprises a total of 44,396,513 shares of the Bank (0.710% of its share capital). In addition, and in accordance with the first Clause of the syndication agreement, the agreement will be extended only in terms of the exercising of voting rights to other shares of the Bank that are subsequently held, directly or indirectly, by the signatories or those over which they have voting rights. As a result, as of the date of filing of this annual report on Form 20-F, another 3,126,090 shares (0.050% of the Bank’s share capital) are also included in the Syndicate.
The chairman of the Syndicate of shareholders is the person who is at any time the chairman of the Marcelino Botín Foundation, which is currently Emilio Botín.
Members of the Syndicate are obliged to group together the voting rights and other political rights inherent in the syndicated shares, so that the exercising of such rights and, in general, the conduct of the members of the Syndicate before the Bank, is done in a coordinated and unified fashion. For such purpose, the representation of such shares is attributed to the chairman of the Syndicate as the common representative of the members of the Syndicate.
Except for the transfers made in favor of other members of the syndicate or the Marcelino Botín Foundation, the prior authorization of the syndicate is required and it can freely authorize or deny the planned transfer.
130
B. Related party transactions.
Loans made to members of our Board of Directors and to our Executive Officers
Our direct risk exposure to the Bank’s Directors as of December 31, 2005, amounted to €1.6 million (€10.8 and €10.1 million as of December 31, 2004 and 2003 respectively) of loans and credits to such Directors and €0.1 million (€0.2 and €0.4 million as of December 31, 2004 and 2003, respectively) of guarantees provided to them. These loans and credits and guarantees were granted at market rates in all cases, except for those granted to Antonio Escámez and Francisco Luzón, to whom employee conditions were applied; accordingly, they were allocated the related remuneration in kind (€4,000 and €19,000, respectively).
The detail by Director as of December 31, 2005, is as follows:
|
| Thousands of Euros |
| ||||
|
|
| |||||
|
| Loans and |
| Guarantees |
| Total |
|
|
|
|
|
| |||
Fernando de Asúa |
| 4 |
| — |
| 4 |
|
Alfredo Sáenz |
| 16 |
| — |
| 16 |
|
Matías R. Inciarte |
| 8 |
| 10 |
| 18 |
|
Manuel Soto |
| 3 |
| — |
| 3 |
|
Antonio Basagoiti |
| 145 |
| 1 |
| 146 |
|
Javier Botín |
| 60 |
| — |
| 60 |
|
Rodrigo Echenique |
| 5 |
| — |
| 5 |
|
Antonio Escámez |
| 295 |
| — |
| 295 |
|
Francisco Luzón |
| 1,026 |
| — |
| 1,026 |
|
Mutua Madrileña Automovilista |
| 5 |
| 47 |
| 52 |
|
Emilio Botín O. |
| 2 |
| — |
| 2 |
|
|
|
|
|
| |||
| 1,569 |
| 58 |
| 1,627 |
| |
|
|
|
|
| |||
Additionally, the total amount of loans and credits made by us to our Executive Officers who are not Directors, as of December 31, 2005, amounted to €8 million (see Note 55 to our consolidated financial statements).
Loans extended to related parties were made in the ordinary course of business, on substantially the same terms, including interest rates and collateral, as those prevailing at the time for comparable transactions with other persons, and did not involve more than the normal risk of collectibility or present other unfavorable features.
Loans made to other Related Parties
The companies of the Group engage, on a regular and routine basis, in a number of customary transactions among Group members, including:
| • | overnight call deposits; |
| • | foreign exchange purchases and sales; |
| • | derivative transactions, such as forward purchases and sales; |
| • | money market fund transfers; |
| • | letters of credit for imports and exports; |
and others within the scope of the ordinary course of the banking business, such as loans and other banking services to our shareholders, to employees of all levels, and the associates and the members of the families of all the above-mentioned, as well as those other businesses conducted by the companies of the Group. All these transactions are made:
| • | in the ordinary course of business; |
| • | on substantially the same terms, including interest rates and collateral, as those prevailing for comparable transactions with other persons; and |
| • | did not involve more than the normal risk of collectibility or present other unfavorable features. |
As of December 31, 2005 our loans and credits to associated and jointly controlled entities, amounted to €215 million. Those loans and credits represented 0.05% of our total net loans and credits and 0.5% of our total stockholders’ equity as of December 31, 2005.
For more information, see Notes 3 and 55 to our consolidated financial statements.
131
C. Interests of experts and counsel.
Not Applicable
A. Consolidated statements and other financial information.
Financial Statements
See Item 18 for our consolidated financial statements.
| (a) | Index to consolidated financial statements of Santander |
|
| Page |
|
| |
Report of Deloitte, S.L. |
| F-1 |
Consolidated Balance Sheets as of December 31, 2005 and 2004 |
| F-2 |
Consolidated Statements of Income for the Years Ended December 31, 2005 and 2004 |
| F-3 |
Notes to the Consolidated Financial Statements |
| F-7 |
Legal Proceedings
Banco Santander Central Hispano, S.A. (the “Bank”)
The resolutions adopted at the Bank’s general shareholders’ meetings held on January 18, 2000 and on March 4, 2000, approving the capital increases agreed in connection with the exchange offer made by The Royal Bank of Scotland Group plc. with National Westminster Bank plc., and in connection with the Bank’s acquisitions of the Portuguese banks Banco Totta & Açores and Crédito Predial Portugués and the resolution adopted the Bank’s general shareholders’ meeting held on March 4, 2000 approving the capital increase necessary to carry out the exchange offers for shares of Banco Rio de la Plata, were challenged under Spanish law. One plaintiff shareholder, in the case of the resolutions adopted in the first meeting and two plaintiff shareholders, in the case of the resolutions adopted in the second meeting, have challenged these resolutions on the grounds that, among other things, they were provided with insufficient information in connection with the vote on these resolutions and that the resolutions excluding the preemptive rights of shareholders were not validly adopted. In the proceedings, the plaintiffs have requested the court to declare that the above resolutions (and other ones adopted in the same meetings) are null and void. The first claim was rejected by the court in April 2001, and the plaintiff appealed the court’s rejection of his claim. The plaintiff´s appeal was then rejected by the court on December 2, 2002. The plaintiff has appealed for redress and the Bank has asked the court not to admit such appeal. The second claim was rejected by the courts of the city of Santander on November 29, 2002 and the plaintiffs appealed. Such appeal was subsequently rejected by the court on July 5, 2004. The plaintiffs responded and the court admitted the response of one of the plaintiffs and dismissed the other. The Bank has requested that the appeals not be admitted. The Bank cannot anticipate the outcome of these claims. Under Spanish law, if the claims were to prevail, the capital increase resolutions adopted on January 18, 2000, and on March 4, 2000, could be declared null and void. The effect under Spanish law of the declaration of nullity of a listed company’s share capital increase is highly uncertain and the Bank is unable to anticipate what the outcome for it and its shareholders would be if these claims were to prevail.
The resolutions adopted at the Bank’s shareholders’ meeting held on March 10, 2001, were challenged under Spanish law by three shareholders who filed their claim before the courts of the city of Santander. These shareholders claimed that the Bank did not comply with certain provisions of Spanish corporate law with respect to the resolutions adopted in said shareholders’ meeting. The challenged resolutions include the approval of the Bank’s annual accounts, the approval of a capital increase in exchange of cash, the approval of a capital increase in exchange of shares of Banco Río de la Plata and BRS Investments and the approval of various issuances of bonds. In their complaints, the plaintiff shareholders asked the Court to declare the resolutions null and void and that the registration of the resolutions in the Commercial Registry also be annulled. The claim was rejected by the court in March 2002. The plaintiff shareholders appealed such rejection and, although the court allowed the admission of new evidence, the claim was again rejected on April 13, 2004. One of the plaintiffs has appealed for redress before the Spanish Supreme Court and the Bank has asked the court that this appeal not be admitted.
132
The resolutions adopted at the Bank’s shareholders’ meeting held on February 9, 2002, were challenged under Spanish law by one shareholder who filed his claim before the courts of the city of Santander. The challenged resolutions include the approval of the payment of an interim dividend, the re-election of Arthur Andersen y Cía, S. Com. as the external auditor of the Bank, the approval of a capital increase in exchange of shares of the German Company AKB Holding Gmbh and the approval of various issuances of bonds. Among other things, the plaintiff alleges the infringement of the shareholders’ rights of participation during the meeting and of receipt of information regarding the different issues to be voted on in the meeting; and that the resolutions excluding the preemptive rights of shareholders were not validly adopted. The plaintiff shareholder asked the Court to declare the above resolutions (and others adopted in the same meeting) null and void and that the registration of the resolutions in the Commercial Registry also be annulled. On September 9, 2002 the Court rejected the claim. The plaintiff appealed the rejection but the court rejected the appeal on January 14, 2004. The plaintiff has appealed for redress before the Spanish Supreme Court and the Bank has asked the Court not to admit such appeal.
The resolutions adopted at the Bank’s shareholders’ meeting held on June 24, 2002 were challenged under Spanish law by one shareholder who filed his claim before the courts of the city of Santander. The challenged resolutions include the approval of the Bank’s annual accounts and the rejection by the shareholders’ meeting of the proposals made by the plaintiff shareholder and another shareholder to file a claim requesting the declaration of the Directors’ liability in connection with the investments made by the Bank in Argentina, as well as the proposal made by another shareholder for the dismissal of one of the Directors. The Bank responded to the claim on October 5, 2002. During the term to respond to this claim, the Bank was required to respond to another claim, filed by a different shareholder, challenging some of the resolutions adopted at the same meeting. The claim was admitted by the same court of the city of Santander that was in charge of the first proceeding and was joined to this proceeding, so both proceedings were carried out jointly. The Bank responded to this second claim on October 25, 2002. The hearing took place on April 21, 22, and 24, and the court dismissed the claim on May 29, 2003. Such judgment was appealed by the plaintiffs but the appeals were rejected by the court on November 15, 2005. Subsequently, the court’s decision of rejecting the appeals has in turn been appealed by the plaintiffs.
Since fiscal year 1992, the Madrid Central Pre-Trial Investigation Court No. 3 has maintained pre-trial investigative proceedings – now Summary Proceedings – in order to determine liabilities of the Bank, its Chairman and three of its Officers with respect to certain credit assignment transactions (operaciones de cesión de crédito) carried out by Banco Santander, S.A. between fiscal years 1987 and 1989. In the opinion of the Bank and its internal and external advisors, the final result of this litigation will be favourable to the Bank, its Chairman and three of its Officers, and does not require a specific additional reserve. On July 16, 1996, the Madrid Central Pre-Trial Investigation Court No. 3, pursuant to a request made to such effect by the Attorney General after having consulted the Spanish Tax Authority, dismissed certain but not all the claims against the Bank, its Chairman and three of its Officers. Thereafter, the Attorney General – representative of the Tax Authority – and the Office of the Public Prosecutor repeatedly requested the dismissal of the remaining claims and the removal of the case from the docket. However, on June 27, 2002, the court changed the cited proceedings into a Summary Proceeding. Such decision was appealed by the Office of the Public Prosecutor, the Bank, its Chairman and three of its Officers. On June 23, 2003, the Panel Two of the Criminal Division of the National Criminal and Administrative Court (Audiencia Nacional) admitted partially such appeals, explicitly acknowledging that the marketing of the credit assignment transactions with clients had been legal, and reducing the number of transactions under scrutiny – and with respect to which the Bank’s possible involvement is still being alleged – from 138 to 38. With respect to the remaining 38 transactions under scrutiny, the Attorney General and the Office of the Public Prosecutor have generally requested the dismissal of claims and their removal from the docket on the grounds that no crime had been committed. Following the conclusion of the indictment proceedings – with repeated requests by the the Office of the Public Prosecutor and the Attorney General for the dismissal of the proceedings and their removal from the docket, – and based on the complaint filed by the citizen complainant, Asociación para la Defensa de Inversores y Clientes (Investor and Customer Defense Association), the Court, in an order dated October 6, 2004, decreed the commencement of oral evidentiary proceedings against the Chairman of the Bank and three of its Officers for one continuing crime of falsification of an official document, three continuing crimes of falsification of a commercial document, and thirty crimes against the public finance, ordering that a bond be jointly posted for €67.8 million, which amount was later reduced to €40.1 million, as a fine and for costs. The order designated Panel One of the Criminal Division of the National Criminal and Administrative Court as the competent court to hear the oral evidentiary proceedings. Relevant documentation has already been sent to the Court.
In December 1995, the Spanish tax authorities issued an “Acta” (writ) requiring Banco Santander, S.A. to pay €26.2 million in back withholding taxes, interest and penalties relating to the Bank’s alleged failure to comply with a purported obligation to withhold income tax on payments to clients with respect to certain credit assignment transactions held by such clients. Although a similar case in an amount of €3.8 million was successfully appealed by the Bank in June 2003 (and then appealed in turn by the Regional tax authorities), the Bank’s appeal against this writ was rejected. The Bank filed a second appeal which was partially admitted by the court on October 30, 2003. Both the Bank and the Attorney General have appealed such decision before the Supreme Court and are awaiting the Court’s decision with respect to the appeals.
133
The resolutions adopted at the Bank’s shareholders’ meeting held on June 21, 2003 were challenged under Spanish law by three shareholders who filed their claims before the courts of the city of Santander. The three plaintiff shareholders challenged the resolution approving the annual accounts and the management of the Bank and of the Group for 2002. In addition, two out of the three plaintiff shareholders challenged the resolutions approving the profit allocation for 2002 and the Procedural Rules of the Bank’s Shareholders’ Meetings. On October 10, 2003, the Bank answered the claims. The preliminary hearing took place on January 21, 2004. On February 11, 2004 the Court decided to suspend the proceedings until the preliminary proceedings 352/2002 being carried out by the Madrid Central Court number 3 (referred to hereinbelow) were finalized. On September 29, 2004, the Bank also responded to a separate claim filed by another shareholder challenging the resolutions adopted at the same meeting. The preliminary hearing for this claim took place on January 19, 2005. The Court decided to carry out jointly all the proceedings related to the same meeting and to apply to all such proceedings the suspension ordered by the Court on February 11, 2004.
The resolutions adopted at the Bank’s shareholders’ meeting held on June 19, 2004 were challenged under Spanish law by three shareholders who filed their claims before the courts of Santander. The challenged resolutions include the approval of the Bank’s annual accounts, the profit allocation and the approval of the Procedural Rules of the Bank’s Shareholders’ Meetings. The Bank has already responded to the three claims and requested that all such claims be joined into one single proceeding. The Court granted the Bank’s request to carry out all the three proceedings jointly. The preliminary hearing took place on February 7, 2005 and the trial was held on May 9 and 10, 2005. On October 28, 2005, the court decided to reject the claims. The three plaintiff shareholders appealed the judgment to the court of appeal. On January 27, 2006, the Bank has responded that it was opposed to such appeal.
The resolutions adopted at the Bank’s shareholders’ meeting held on June 18, 2005 have been challenged under Spanish law by two shareholders who filed their claims before the courts of the city of Santander. The challenged resolutions include the approval of the Bank’s annual accounts, the profit allocation, and authorization to the Board to increase under certain conditions the Bank’s share capital. The claims will be carried out jointly. The Bank already responded to both claims. The preliminary hearing took place on May 5, 2006, and the trial has been scheduled for July 17, 18 and 19, 2006.
Inversión Hogar, S.A. filed in 2001 a suit against the Bank, carried out before the Court of 1st Instance no. 11 of Madrid, seeking the termination of a transactional agreement dated December 11, 1992 between the Bank and the plaintiff. On May 19, 2006, a judgment was rendered whereby the agreement is deemed terminated and the Bank is ordered: (i) to pay €1.8 million plus legal interests accrued since February 1997; (ii) to return a property which had been assigned to the Bank pursuant to the agreement; (iii) to pay an additional amount of €72.9 million as restoration of goods which had been sold by the Bank after foreclosure; and (iv) to bear the legal costs of the proceeding. The Bank will file an appeal against such judgment before July 18, 2006.
Lanetro, S.A. filed a suit against the Bank, carried out before the Court of 1st Instance no. 34 of Madrid, Complaint of Plenary Suit no. 558/2002, principally alleging that the Bank breached its alleged obligation to subscribe to the increase in capital stock of the plaintiff in the amount of €30,050,605.22. The court rejected the claim on December 16, 2003, but the plaintiff has appealed. The Bank has answered the appeal and is presently awaiting the Court’s decision with respect to the appeal.
For informational purposes, it is also mentioned that several persons, who allegedly have funds deposited in Banco Río de la Plata, S.A., filed an application for conciliation before the courts of the city of Madrid against the Bank, the persons who were members of the Board during 2001 and 2002 and others. According to Spanish Law, this application did not start proper judicial proceedings against the Bank. The claimants only intended that the defendants acknowledge the facts alleged in their application, regarding the Bank and its Directors’ claimed obligation to reimburse the funds deposited by the claimants in Banco Río de la Plata, S.A. The conciliation hearing was held on July 16, 2002. The Bank and the members of the Board refused to accept the facts and allegations of the application. This meant the termination of the conciliation. In January 2004, there was a preliminary hearing in connection with a similar case, in which a person who allegedly deposited funds in Banco Río de la Plata, S.A. is claiming $8,365.71. The Court has not determined the date for the next hearing yet.
For the same informational purposes, it is mentioned that the Madrid Central Court number 3 carried forward preliminary proceedings 352/2002 in connection with complaints filed by two shareholders against the Chairman of the Bank, regarding the economic terms of the retirement in August 2001 of the former co-chairman, Mr. José María Amusátegui and the economic terms of the resignation in February 2002 of the former first vice-chairman and chief executive officer, Mr. Angel Corcóstegui. The prosecutor and the defendants requested the dismissal of the case, which was opposed by the plaintiff shareholders. On October 16, 2003 the Court decided to change the cited proceedings to a summary proceeding. The Office of the Public Prosecutor and the Chairman of the Bank and the other two accused appealed the decision. The hearing of the appeals took place on February 9, 2004, and on February 18, 2004 the Court decided not to admit such appeals without entering into the merits of the matter. The Chairman of the Bank then appealed to the Constitutional Court. The Office of the Public Prosecutor again requested the dismissal of the case. On April 26, 2004, the Madrid Central Court number 3 decided to commence oral evidentiary proceedings. On May 10, 2004, with two dissenting votes, and in spite of the favourable report of the Office of the Public Prosecutor, the Constitutional Court decided not to admit the appeal. At the oral hearing, the Office of the Public Prosecutor requested the acquittal of those accused on the grounds that the facts do not amount to a criminal offense. On April 13, 2005, the Court decided to acquit those accused since the facts do not amount to a criminal offense. A cassation appeal filed by the plaintiffs against such decision has been admitted.
On September 25, 2003, the Bank announced that it would launch a public offering in Spain for the acquisition of up to 16% of the share capital of Compañía Española de Petróleos, S.A. (“Cepsa”), a Spanish oil and petrochemical company. On October 21, 2003, the Spanish National Securities Commission authorized the Bank to launch the offering. The acceptance term of the offering expired on November 24, 2003. The bid was accepted by shares representing 12.13% of Cepsa’s share capital.
134
The Bank decided to launch the bid for Cepsa once the agreements with the French group Total (“Total”), an oil and petrochemical group and major shareholder of Cepsa, to act in concert with respect to the parties’ investments in Cepsa had become ineffective after the enactment of Law 26/2003 of July 17, 2003 (“Ley de Transparencia”). These agreements included those related to the company Somaen Dos, S.L. (“Somaen Dos”), a holding company in which the Bank, Total and Unión Fenosa, S.A. (“Unión Fenosa”) have participations of approximately 60%, 25% and 15%, respectively. Somaen Dos owns shares representing 33.23% of Cepsa’s share capital, of which 19.92% belong to the Bank, 8.31% to Total and 5.00% to Unión Fenosa.
After the Bank’s announcement to launch the public offering, Total requested a summary arbitral proceeding with the Netherlands Arbitration Institute seeking the adoption of certain injunctive measures. On November 25, 2003, that arbitration institute made public a ruling that, among other measures, imposed a temporary prohibition of the sale or encumbrance of the Cepsa shares owned by Somaen Dos as well as the Cepsa shares that the Bank had acquired in the bid. Furthermore, the ruling instructed both the Bank and Total to presently respect the supermajority rules contained in the agreements to act in concert in Cepsa and the rules, also established in those agreements, governing the right to appoint Directors of the boards of Cepsa and Somaen Dos.
Additionally, on October 20, 2003, the Total group filed a request for an arbitral proceeding with the Netherlands Arbitration Institute seeking a determination on the merits of its claim. The Bank responded that it was opposed to such request.
In such proceeding, Total requested the Netherlands Arbitration Institute inter alia to instruct the Bank to return to the market the Cepsa shares that the Bank acquired in the bid, to declare that the conditions for Total to exercise a call option for 4.35% of Cepsa’s share capital have been fulfilled, and to pay various indemnities, some of which have to be quantified during the course of the proceeding.
On October 15, 2004, the Bank answered the claim made by Total. The Bank requested: (i) the dismissal of all the requests made by Total in its claim, except for those related to the admission of Total’s right to the restoration of its economic participation in Cepsa that Total owns through Somaen, and to the Bank’s abstention from actions that could lead to the transfer or encumbrance of such participation, as these two requests have been repeatedly accepted by the Bank; (ii) the suspension of the presently existing injunctive measures described above; (iii) the declaration of ineffectiveness of the agreements signed by the Bank and Total to act in concert with respect to their investments in Cepsa; (iv) the express declaration that irreconcible differences between the parties (“disputa insuperable”), within the meaning of the signed agreements, has not occurred between the Bank and Total; (v) the imposition to Total of the obligation to negotiate in bona fide with the Bank the most favourable way for both parties and for Unión Fenosa to separate their economic participations in Cepsa and those that are owned by Somaen; and (vi) the sentence of Total to indemnify the Bank for damages caused to the latter by the dispute between both parties and for damages derived from the adoption of the injunctive measures.
On November 30, 2004, Total answered the Bank’s pleadings and the Bank responded on January 21, 2005. After the hearings held by the Netherlands Arbitration Institute, the proceedings continued with a simultaneous submission of two conclusion filings by each party. As of May 31, 2005, both the Bank and Total submitted the first of such filings. The second filing was submitted on June 30, 2005.
On April 3, 2006, the ruling of the Netherlands Arbitration Institute was notified to the parties. The Institute: (i) accepted the interpretation that the Bank has been sustaining and accordingly acknowledged that the agreements to act in concert with respect to the parties’ investments in Cepsa had become ineffective after the enactment of Law 26/2003 of July 17, 2003, and (ii) rejected the claims made by Total demanding the Bank to pay an indemnity for moral damages and to bear the tax costs resulting from the liquidation of Somaen Dos.
In addition, the ruling requested that Somaen Dos be liquidated (the Bank will receive from Somaen Dos 19.92% of the share capital of Cepsa, and Total will receive 8.31% of the share capital of Cepsa), and acknowledged that Total has the right to exercise its call option on 4.35% of Cepsa’s share capital at the price resulting from the original agreement between Total and the Bank, which is lower than the current market price.
135
Certain issues (possible damages derived specifically for launching the tender offer without previous consultation with Total and the expenses and costs incurred in the arbitral proceeding) will be resolved by a complementary decision. In any event, as announced by the Bank and Total on May 25, 2006, the parties were negotiating at that date a definitive agreement to settle the proceeding.
While the ruling is being executed, the injunctive measures on the Cepsa shares owned by Somaen Dos are still in force but not the measures applicable to 12.13% of Cepsa’s share capital which was acquired by the Bank through the tender offer.
In May 2004, Chadia Limited, S.A. filed a suit against the Bank, carried out before the Court of 1st Instance number 48 of Madrid, proceeding number 420/2004, alleging that the Bank breached an alleged agreement for the sale to the plaintiff of certain buildings and seeking damages in the amount of €133 million. The Court’s decision rejecting the claim has been confirmed by the court of appeal of Madrid. Chadia Limited, S.A. has filed a cassation appeal against such confirmation.
The Bank is presently subject to a claim made by the Instituto Nacional de Vías de Colombia (INVIAS) in connection with the execution of an order declaring the expiration of a concession to build and operate a toll motorway in Colombia. The Bank formed part of the consortium (COMMSA) who was awarded that concession. Apart from certain injunctive measures, INVIAS is requesting from COMMSA and its shareholders (jointly and severally) the payment of USD 137.1 million. There is an undertaking by some of the shareholders of COMMSA to indemnify the Bank in full in connection with losses it may incur as a result of the claim.
In May 2004, INVIAS and the shareholders of COMMSA reached a transactional agreement which was turned down by resolution of the State Council of Colombia of December 9, 2004. The shareholders of COMMSA filed an appeal against such resolution, but the State Council upheld its decision.
Separately, COMMSA and its shareholders filed an appeal against the unilateral termination of the concession agreement by INVIAS, but such appeal was rejected on October 28, 2005. COMMSA and its shareholders are currently assessing the possibility to challenge such rejection.
The Bank is involved in Preliminary proceedings 2973/2006 carried forward by the Madrid Pre-Trial Investigation Court No. 11 in connection with a complaint filed by one shareholder of the Bank against the Chairman of the Bank and others, and against the Bank and its affiliated companies Santusa Holding, S.L. and Santander Holding Gestión, S.L. regarding alleged misappropriation, deceitful accounting and disloyal management.
On May 23, 2006, the Court admitted the filing of the complaint, although such admission was only partial. The Bank will challenge the complaint in due course.
Banco Español de Crédito, S.A. (“Banesto”)
In 1995 and 1996, the former directors of Banesto, who had been replaced by decision of the Bank of Spain’s Executive Council on December 28, 1993, filed claims challenging certain corporate resolutions adopted by the shareholders’ meetings held on March 26, 1994 and February 15, 1995 approving, among other things, Banesto’s financial reorganization plan and the 1994 financial statements of Banesto and the Banesto Group. In 2000, Madrid Appellate Court decisions rejected all the appeals filed by the plaintiffs in connection with the claim filed challenging the legality of the corporate resolutions approving the financial restructuring plan; the plaintiffs subsequently filed a cassation appeal against these decisions and Banesto has answered such cassation appeal. On March 5, 2002 the courts decided not to admit the cassation appeal against the Madrid Appellate Court’s decision rejecting the claims of some of the plaintiffs regarding the invalidity of the constitution of the shareholders’ meeting held on March 26, 1994. On July 22, 2003, the court admitted the cassation appeal filed by the remaining plaintiffs. Banesto filed its answer on September 20, 2003. On March 31, 2005, the parties were informed of a request made by some of the plaintiffs to bring the case to the European Court of Justice. Banesto has already opposed such request. The Office of the Public Prosecutor has responded that it was opposed to bringing the case to the European Court of Justice. A separate request to bring the case to the European Court of Justice has been received. The Office of the Public Prosecutor and the parties have been informed and their respective answers are awaited. Banesto has already responded to such request. The claim filed against the approval by the shareholders’ meeting held on February 15, 1995 of the 1994 financial statements of Banesto was also rejected in 2000 by the Court of First Instance and was subsequently appealed by the plaintiffs. The appeal was dismissed by judgment of the Court of Appeals of Madrid, rendered on May 20, 2003. In September 2003, the plaintiffs’ appeal of this judgment was also dismissed. The plaintiffs have since appealed to the Supreme Court.
Banesto’s directors and legal advisers do not believe that these claims will have any effect on the financial statements of Banesto or its Group. The plaintiffs seek that the resolutions be declared null and void, not damages. It is very difficult to assess what the practical consequences of an adverse judgment would be.
136
Abbey National Treasury Services plc
Abbey National Treasury Services plc received a demand from a foreign Tax Authority relating to the repayment of certain tax credits and related charges. Following certain modifications to the demand its nominal amount now stands at 57 million Pounds sterling (101 million Pounds sterling as of December 31, 2004). As of December 31, 2005, additional interest in relation to the demand could amount to 17 million Pounds sterling. Abbey National Treasury Services plc has received legal advice that it has strong grounds to challenge the validity of the demand.
Banco do Estado de Sao Paulo, S.A. (“Banespa”)
Pursuant to the Brazilian labor regulations applicable to Banespa, this bank had recorded as of December 31, 2000, the pension allowances arising from the commitments to certain employees, which amounted to approximately 4,000 million Brazilian reais. Since 1987, the Directors of Banespa, as advised by their tax advisers, treated these expenses as deductible expenses in calculating the Brazilian corporate income tax. However, in September 1999, the “Secretaria de Receita Federal” issued a decision according to which these expenses, in an amount of approximately Brazilian reais 2,867 million would not be tax deductible. In October 1999, the Board of Directors of Banespa filed an appeal challenging this decision together with an “acción cautelar” regarding fiscal years 1999 and 2000, posted a deposit of Brazilian reais 1,297 million and recorded a provision of Brazilian reais 2,600 million for this contingency. Such provision was recorded in 1999 with a charge to income, after recording the related deferred tax asset of Brazilian reais 1,200 million.
In this respect, the Board of Directors of Banespa has decided to accept the Medida Provisória nº 66 of the Secretaría da Receita Federal dated August 29, 2002 and to pay Brazilian reais 2,110 million in order to settle the proceedings. The company disputes any liability with respect to an additional amount of Brazilian reais 103 million relating to costs and surcharges imposed in connection with the dispute relating to the principal amount. The company has asked for a cautionary judicial action posting a deposit which at December 31, 2005 amounts to reais 164 million.
Santander Distribuidora de Títulos e Valores Mobiliarios, Ltda. (formerly known as Santander Brasil DTVM, Ltda.) and Banco Santander Brasil, S.A.
On May 19, 2003, the Secretaria de Receita Federal issued an “Auto de Infração” requiring from our Brazilian affiliate Santander Distribuidora de Títulos e Valores Mobiliarios, Ltda. the payment of Brazilian reais 290 million in taxes allegedly incurred in connection with certain cash management services rendered by such company to its clients which the company had treated during 2000, 2001 and the two first months of 2002 as exempt from the Tax on Financial Transactions, following the advice of its tax advisers. The Board of Directors of Santander Distribuidora de Títulos e Valores Mobiliarios, Ltda. appealed this decision in June 2003. The Tax Authorities confirmed the “Auto de Infrançao” and the Board of Directors appealed to “Conselho de Contribuintes” (final administrative court). The Court decision is pending. On December 31, 2005, the amount involved in the action was equivalent to reais 352 million.
Also on May 29, 2003, the Secretaria de Receita Federal issued another “Auto de Infração” requiring from our Brazilian affiliate Banco Santander Brasil, S.A. the payment of Brazilian reais 290 million in taxes allegedly incurred in connection with certain clearing services rendered by such company to Santander Distribuidora de Títulos e Valores Mobiliarios, Ltda. pursuant to an agreement between these two companies. Following the advice of its tax advisers, Banco Santander Brasil, S.A. had treated during 2000, 2001 and the two first months of 2002 such services as exempt from the Tax on Financial Transactions. The Board of Directors of Banco Santander Brasil, S.A. appealed this decision in June 2003. The Tax Authorities confirmed the “Auto de Infrançao” and the Board of Directors appealed to “Conselho de Contribuintes” (final administrative court). The Court decision is pending. On December 31, 2005, the amount involved in the action was equivalent to reais 352 million.
Casa de Bolsa Santander Serfín, S.A. de C.V. (“Casa de Bolsa”) (Grupo Financiero Santander Serfín)
In 1997 Casa de Bolsa was sued for an alleged breach of various stock brokerage contracts. On July 6, 1999, Civil Court number thirty-one of the Federal District handed down a judgment ordering Casa de Bolsa to return to the plaintiff 2,401,588 shares of the investment vehicle México 1 and 11,219,730 shares of the investment vehicle México 4 at their market value and to pay MXP 15 million, plus interest calculated at the average percentage cost of deposit-taking (C.P.P.) multiplied by four.
After several appeals had been filed, this judgment was declared final on June 21, 2004. On November 5, 2004, a writ of execution was issued in which the interest was quantified at MXP 37,646 million and Casa de Bolsa was ordered to deliver the claimed shares.
Successive appeals were filed against this writ of execution. On February 14, 2006, Civil Chamber number two of the High Court of Justice of Mexico City handed down a decision on the latest appeal, setting aside the writ of execution since the payment of the MXP 37,646 million was deemed to be unjustified and the procedure to calculate the interest had been incorrect. An appeal for protection of constitutional rights was filed against this decision. On June 20, 2006 the Court confirmed that the decision of the Civil Chamber number two dated February 14, 2006 regarding the way in which the interest should be calculated does not violate constitutional rights. An appeal for judicial review can be filed against the decision handed down on June 20, 2006.
Other Litigation
In addition to the above described matters, the Bank and its subsidiaries are from time to time subject to certain claims and parties to certain legal proceedings incidental to the normal course of our business, including in connection with the Group’s lending activities, relationships with the Group’s employees and other commercial or tax matters. In view of the inherent difficulty of predicting the outcome of legal matters, particularly where the claimants seek very large or indeterminate damages, or where the cases present novel legal theories, involve a large number of parties or are in early stages of discovery, the Bank cannot state with confidence what the eventual outcome of these pending matters will be, what the timing of the ultimate resolution of these matters will be or what the eventual loss, fines or penalties related to each pending matter may be. The Bank believes that it has made adequate reserves related to the costs anticipated to be incurred in connection with these various claims and legal proceedings and believes that liabilities related to such claims and proceedings should not have, in the aggregate, a material adverse effect on the Group’s business, financial condition, or results of operations. However, in light of the uncertainties involved in such claims and proceedings, there is no assurance that the ultimate resolution of these matters will not significantly exceed the reserves currently accrued by the Bank; as a result, the outcome of a particular matter may be material to the Bank’s operating results for a particular period, depending upon, among other factors, the size of the loss or liability imposed and the level of the Bank’s income for that period.
Dividend Policy
We have normally paid an annual dividend in quarterly installments. The table below sets forth the historical per share and per ADS (each of which represents the right to receive one of our shares) amounts of interim and total dividends in respect of each fiscal year indicated.
|
| Euro per Share Interim |
| Dollars per ADS Interim |
| ||||||||||||||||
|
|
|
| ||||||||||||||||||
|
| First |
| Second |
| Third |
| Fourth |
| Total |
| First |
| Second |
| Third |
| Fourth |
| Total |
|
|
|
|
|
|
|
|
|
|
|
|
| ||||||||||
2001 |
| 0.07513 |
| 0.07513 |
| 0.07513 |
| 0.06311 |
| 0.2885 |
| 0.0656 |
| 0.0673 |
| 0.0661 |
| 0.0568 |
| 0.2558 |
|
2002 |
| 0.0775 |
| 0.07513 |
| 0.07513 |
| 0.06073 |
| 0.2885 |
| 0.0754 |
| 0.0612 |
| 0.0804 |
| 0.0680 |
| 0.2850 |
|
2003 |
| 0.0775 |
| 0.0775 |
| 0.0775 |
| 0.0704 |
| 0.3029 |
| 0.08602 |
| 0.0899 |
| 0.0842 |
| 0.08801 |
| 0.36235 |
|
2004 |
| 0.0830 |
| 0.0830 |
| 0.0830 |
| 0.0842 |
| 0.3332 |
| 0.08484 |
| 0.08971 |
| 0.09175 |
| 0.09191 |
| 0.35821 |
|
2005 |
| 0.09296 |
| 0.09296 |
| 0.09296 |
| 0.13762 |
| 0.4165 |
| 0.09591 |
| 0.09466 |
| 0.09523 |
| 0.139202 |
| 0.425002 |
|
137
On August 1, 2006, we will pay the first dividend on account of the earnings for the 2006 financial year for a gross amount of €0.106904 per share.
For a discussion of regulatory and legal restrictions on our payments of dividends, see “Item 4. Information on the Company—B.Business Overview—Supervision and Regulation—Restrictions on Dividends”.
For a discussion of Spanish taxation of dividends, see “Item 10. Additional information—E.Taxation—Spanish Taxation of Dividends”.
The dividends paid on the guaranteed non-cumulative preference stock of certain of our subsidiaries are limited by our Distributable Profits in the fiscal year preceding a dividend payment. “Distributable Profits” with respect to any year means our reported net profits after tax and extraordinary items for such year as derived from the parent Bank’s non-consolidated audited profit and loss account prepared in accordance with Bank of Spain requirements and guidelines in effect at the time of such preparation. Such requirements and guidelines may be expected to reflect the Bank of Spain regulatory policies applicable to us, including without limitation those relating to the maintenance of minimum levels of capital. See “Item 4. Information on the Company—B. Business Overview—Supervision and Regulation—Capital Adequacy Requirements” and “Item 4. Information on the Company—B. Business Overview—Restrictions on Dividends”. According to our interpretation of the relevant Bank of Spain requirements and guidelines, Distributable Profits during the preceding five years were:
Year Ended December 31, |
| ||||||||||
| |||||||||||
Previous Spanish GAAP |
| IFRS |
| ||||||||
|
| ||||||||||
2001 |
| 2002 |
| 2003 |
| 2004 (*) |
| 2004 |
| 2005 |
|
|
|
|
|
|
| ||||||
(in thousands of euros) |
| ||||||||||
1,329,931 |
| 1,376,178 |
| 1,445,033 |
| 1,837,424 |
| 1,935,992 |
| 2,605,009 |
|
(*) | Statutory Distributable Profits |
The portion of our net income attributable to our subsidiaries has increased steadily in recent years as our subsidiaries have grown and we have acquired new subsidiaries. Such profits are available to us only in the form of dividends from our subsidiaries and we are dependent to a certain extent upon such dividends in order to have Distributable Profits sufficient to allow payment of dividends on our guaranteed preference stock of our subsidiaries as well as dividends on our shares (although the payment of dividends on the shares is limited in the event of the non-payment of preference share dividends). We generally control a sufficient proportion of our consolidated subsidiaries’ voting capital to enable us to require such subsidiaries to pay dividends to the extent permitted under the applicable law. As a result of our growth, the Bank, as the holding entity of the shares of our various companies, has added investments in our subsidiaries, the financial costs of which are borne by us.
For significant changes that have occurred since December 31, 2005, see our Form 6-K relating to our first quarter 2006 results filed with the Securities and Exchange Commission on May 3, 2006.
Item 9. The Offer and Listing.
Market Price and Volume Information
Santander’s Shares
During the last year, our shares were the shares with the highest trading volume on the Spanish stock exchanges. At December 31, 2005, our shares represented 16.94% of the IBEX 35 Stock Exchange Index, the highest percentage among all Spanish issuers represented in this index. Our market capitalization of €69,735.4 million at 2005 year-end was the largest of any Spanish company, according to information published by the Sociedad de Bolsas, S.A. (“Sociedad de Bolsas”).
At December 31, 2005, we had 2,443,831 registered holders of our shares and, as of such date, a total of 604,262,129 of our shares or 9.66% were held by 790 registered holders with registered addresses in the United States and Puerto Rico, including JP Morgan Chase, as depositary of our American Depositary Share program.
138
Our shares are traded on Spain’s automated “continuous market”, the national, centralized market which integrates by computer quotations originating in the four Spanish stock exchanges (Madrid, Barcelona, Valencia and Bilbao) (the “Automated Quotation Systems”). Our shares also are listed on the New York (in the form of American Depositary Shares), London, Milan, Lisbon, Buenos Aires and Mexico Stock Exchanges. In 2001, we delisted our shares from the Tokyo Stock Exchange and in 2003 we delisted our shares from the London, Paris, Frankfurt and Swiss Exchanges. At December 31, 2005, 57.8% of our shares were held of record by non-residents of Spain.
The table below sets forth the high, low and last daily sales prices in euros for our shares on the continuous market for the periods indicated.
|
| Euros per Share |
| ||||
|
|
| |||||
|
| High |
| Low |
| Last |
|
|
|
|
|
| |||
2001 Annual |
| 12.38 |
| 6.93 |
| 9.41 |
|
|
|
|
|
|
|
|
|
2002 Annual |
| 10.47 |
| 4.99 |
| 6.54 |
|
|
|
|
|
|
|
|
|
2003 Annual |
| 9.44 |
| 5.01 |
| 9.39 |
|
|
|
|
|
|
|
|
|
2004 Annual |
| 9.77 |
| 7.70 |
| 9.13 |
|
First Quarter |
| 9.77 |
| 8.36 |
| 8.85 |
|
Second Quarter |
| 9.57 |
| 8.17 |
| 8.53 |
|
Third Quarter |
| 8.70 |
| 7.70 |
| 7.90 |
|
Fourth Quarter |
| 9.27 |
| 7.83 |
| 9.13 |
|
|
|
|
|
|
|
|
|
2005 Annual |
| 11.18 |
| 8.92 |
| 11.15 |
|
First Quarter |
| 9.83 |
| 8.94 |
| 9.39 |
|
Second Quarter |
| 9.65 |
| 8.92 |
| 9.59 |
|
Third Quarter |
| 10.99 |
| 9.21 |
| 10.93 |
|
Fourth Quarter |
| 11.18 |
| 10.25 |
| 11.15 |
|
|
|
|
|
|
|
|
|
Last six months |
|
|
|
|
|
|
|
2005 |
|
|
|
|
|
|
|
December |
| 11.18 |
| 10.60 |
| 11.15 |
|
2006 |
|
|
|
|
|
|
|
January |
| 11.87 |
| 10.88 |
| 11.84 |
|
February |
| 12.41 |
| 11.52 |
| 12.25 |
|
March |
| 12.40 |
| 11.74 |
| 12.05 |
|
April |
| 12.29 |
| 11.55 |
| 12.29 |
|
May |
| 12.27 |
| 10.93 |
| 11.27 |
|
June (through June 23, 2006) |
| 11.45 |
| 10.44 |
| 11.10 |
|
On June 23, 2006, the reported last sale price of our shares on the continuous market was €11.10.
American Depositary Shares (ADSs)
Our ADSs have been listed and traded on the New York Stock Exchange since July 30, 1987. Each ADS represents one of our shares and is evidenced by an American Depositary Receipt, or ADR. The deposit agreement, pursuant to which ADRs have been issued, is among us, JP Morgan Chase, as depositary, and the holders from time to time of ADRs. At December 31, 2005, a total of 111,467,871 of our ADSs were held by 610 registered holders. Since certain of such of our shares and our ADSs are held by nominees, the number of record holders may not be representative of the number of beneficial owners.
139
The table below sets forth the reported high, low and last sale prices for our ADSs on the New York Stock Exchange for the periods indicated.
|
| Dollars Per ADS |
| ||||
|
|
| |||||
|
| High |
| Low |
| Last |
|
|
|
|
|
| |||
2001 Annual |
| 11.94 |
| 6.40 |
| 7.54 |
|
2002 Annual |
| 9.49 |
| 4.75 |
| 7.05 |
|
2003 Annual |
| 12.01 |
| 5.68 |
| 12.01 |
|
2004 |
|
|
|
|
|
|
|
Annual |
| 12.47 |
| 9.43 |
| 12.37 |
|
First Quarter |
| 12.40 |
| 10.18 |
| 10.98 |
|
Second Quarter |
| 11.49 |
| 9.86 |
| 10.50 |
|
Third Quarter |
| 10.65 |
| 9.43 |
| 9.78 |
|
Fourth Quarter |
| 12.47 |
| 9.95 |
| 12.37 |
|
2005 |
|
|
|
|
|
|
|
Annual |
| 13.27 |
| 11.37 |
| 13.19 |
|
First Quarter |
| 12.80 |
| 11.68 |
| 12.16 |
|
Second Quarter |
| 12.30 |
| 11.37 |
| 11.58 |
|
Third Quarter |
| 13.27 |
| 11.50 |
| 13.17 |
|
Fourth Quarter |
| 13.20 |
| 12.41 |
| 13.19 |
|
Last six months |
|
|
|
|
|
|
|
2005 |
|
|
|
|
|
|
|
December |
| 13.20 |
| 12.56 |
| 13.19 |
|
2006 |
|
|
|
|
|
|
|
January |
| 14.27 |
| 13.30 |
| 14.27 |
|
February |
| 14.64 |
| 14.01 |
| 14.62 |
|
March |
| 14.79 |
| 14.12 |
| 14.61 |
|
April |
| 15.34 |
| 14.16 |
| 15.34 |
|
May |
| 15.62 |
| 14.21 |
| 14.45 |
|
June (through June 23, 2006) |
| 14.61 |
| 13.16 |
| 13.82 |
|
On June 23, 2006, the reported last sale price of our ADSs on the New York Stock Exchange was $13.82.
Not Applicable
General
Spanish Securities Market
The Spanish securities market for equity securities (the “Spanish Stock Exchanges”) consists of the four stock exchanges located in Madrid, Barcelona, Bilbao and Valencia (the “local exchanges”). The majority of the transactions conducted on them are done through the Automated Quotation System (Sistema Interbancario Bursátil Español or “S.I.B.E.”). During the year ended December 31, 2005, the Automated Quotation System accounted for the majority of the total trading volume of equity securities on the Spanish Stock Exchanges. According to statistics of the CNMV, the shares of Spanish banks are among the most heavily-traded securities on the Spanish Stock Exchanges.
Automated Quotation System
The Automated Quotation System was introduced in 1989 and links the four local exchanges, providing those securities listed on it with a uniform continuous market that eliminates most of the differences among the local exchanges. The principal feature of the system is the computerized matching of buy and sell orders at the time of entry of the order. Each order is executed as soon as a matching order is entered, but can be modified or canceled until executed. The activity of the market can be continuously monitored by investors and brokers. The Automated Quotation System is operated and regulated by the Sociedad de Bolsas, a corporation owned by the companies that manage the local exchanges. All trades on the Automated Quotation System must be placed through a bank, brokerage firm, an official stock broker or a dealer firm member of a Spanish stock exchange directly.
140
There is a pre-opening session held from 8:30 a.m. to 9:00 a.m. each trading day on which orders are placed at that time. The computerized trading hours are from 9:00 a.m. to 5:30 p.m. Each session will end with a 5 minute auction, between 5:30 and 5:35 p.m., with a random closedown of 30 seconds. The price resulting from each auction will be the closing price of the session.
From May 14, 2001, new rules came into effect regarding the maximum price fluctuations in the price of stocks. Under the new rules, each stock in the continuous market is assigned a static and a dynamic range within which the price of stocks can fluctuate. The price of a stock may rise or fall by its static range (which is published once a month and is calculated according to the stock’s average historic price volatility) above or below its opening price (which shall be the closing price of the previous session). When the stock trades outside of this range, the trading of the stock is suspended for 5 minutes, during which an auction takes place. After this auction, the price of the stock can once again rise or fall by its static range above or below its last auction price (which will be considered as the new static price before triggering another auction). Furthermore, the price of a stock cannot rise or fall by more than its dynamic price range (which is fixed and published once a month and is calculated according to the stock’s average intra-day volatility), from the last price at which it has traded. If the price variation exceeds the stock’s dynamic range a five minutes auction is triggered.
Between 5:30 p.m. and 8:00 p.m., trades may occur outside the computerized matching system without prior authorization of the Sociedad de Bolsas, at a price within the range of 5% above the higher of the average price and closing price for the day and 5% below the lower of the average price and closing price for the day, if there are no outstanding bids or offers, as the case may be, on the system matching or bettering the terms of the proposed off-system transaction, and if the trade involves more than €300,000 and more than 20% of the average daily trading volume of the stock during the preceding quarter. At any time before 8:00 p.m., trades may take place (with the prior authorization of the Sociedad de Bolsas) at any price if:
| • | the trade involves more than €1.5 million and more than 40% of average daily trading volume of the stock during the preceding quarter; |
| • | relates to a merger or spin-off of a listed company; |
| • | relates to the reorganization of a business group; |
| • | the transaction is executed for the purposes of settling litigation; |
| • | involves certain types of contracts or complex transactions; or |
| • | the Sociedad de Bolsas finds other justifiable cause. |
Information with respect to computerized trades between 9:00 a.m. and 5:30 p.m. is made public immediately, and information with respect to trades outside the computerized matching system is reported to the Sociedad de Bolsas and published in the Boletín de Cotización and in the computer system by the next trading day.
During 1998, the Block Market (“el mercado de bloques”) was implemented, allowing for block trades between buyers and sellers. Under certain conditions, this market allows cross-transactions of trades at prices different than at normal market sessions. Trading in the Block Market is subject to certain limits with regard to stocks and volumes.
Clearance and Settlement System
Until April 1, 2003, transactions carried out on the regional Spanish stock exchanges and the continuous market were cleared and settled through the Servicio de Compensación y Liquidación de Valores, S.A. (the “SCL”). Since April 1, 2003, the settlement and clearance of all trades on the Spanish stock exchanges, the Public Debt Market (Mercado de Deuda Pública), the AIAF Fixed Income Market (“Mercado AIAF de Renta Fija”) and Latibex - the Latin American stock - exchange denominated in euros, are made through the Sociedad de Gestión de los Sistemas de Registro, Compensación y Liquidación de Valores (“Iberclear”), which was formed as a result of a merger between SCL and Central de Anotaciones del Mercado de Deuda Pública (CADE), which was managed by the Bank of Spain.
Book-Entry System
Ownership of shares listed on any Spanish stock exchange is required to be represented by entries in a register maintained by Iberclear, and transfers or changes in ownership are effected by entries in such register. The securities register system is structured in two levels: the central registry managed by Iberclear which keeps the securities balances of the participants, and a detailed registry managed by the participants where securities are listed by holder’s name.
141
Securities Market Legislation
The Spanish Securities Markets Act, which came into effect in 1989, among other things:
| • | established an independent regulatory authority, the CNMV, to supervise the securities markets; |
| • | established a framework for the regulation of trading practices, tender offers and insider trading; |
| • | required stock exchange members to be corporate entities; |
| • | required companies listed on a Spanish stock exchange to file annual audited financial statements and to make public quarterly financial information; |
| • | established a framework for integrating quotations on the four Spanish stock exchanges by computer; |
| • | exempted the sale of securities from transfer and value added taxes; |
| • | deregulated brokerage commissions as of 1992; and |
| • | provided for transfer of shares by book-entry or by delivery of evidence of title. |
The Securities Markets Act was amended by Law 37/1998, which implemented two European Union directives into Spanish law. The first is Directive 93/22/CE, relating to investment services within securities, later amended by Directive 95/26/CE of European Parliament and Council. The second is Directive 97/9/CE of European Parliament and Council, relating to indemnity systems.
Law 37/1998 introduced some innovations to the Securities Markets Act. The first was the recognition that both Spanish and other European Union Member State companies authorized to provide investment services have full access to the official secondary markets, with full capacity to operate, thereby enabling the direct admission of banking entities into the stock exchange area. The second innovation was that the scope of the Securities Markets Act was enlarged to include a list of financial instruments, such as financial exchange contracts, or installment financial contracts, which expanded the category of securities.
The Securities Markets Act has been further amended by Law 44/2002 (November 22, 2002) on reform measures of the financial system, which introduced certain modifications to the laws governing financial markets and corporations, generally, including:
| • | provisions regarding market transparency such as: requiring listed companies to establish an audit committee, redefining the reporting requirements for relevant events, rules relating to the treatment of confidential and insider information and related party transactions, and prevention of manipulative and fraudulent practices with respect to market prices; |
| • | the establishment of Iberclear; and |
| • | the authorization to the Minister of Economy to regulate the financial services electronic contracts. |
On July 17, 2003, the Securities Market law was amended by Law 26/2003 in order to reinforce the transparency of listed companies. It introduced:
| • | information and transparency obligations including detailed requirements of the contents of the corporate website of listed companies and the obligation to file with the CNMV an annual corporate governance report; and |
| • | the obligation to implement a series of corporate governance rules including, among others, regulations regarding the boards of directors and the general shareholders’ meeting. |
142
On March 11, 2005 Royal Decree Law 5/2005 was approved, modifying the Securities Market Law in order to implement the Directive 2003/71/EC of the European Parliament and of the Council on the prospectus to be published when securities are offered to the public or admitted to trading. The Directive: (i) harmonizes the requirements for the process of approval of the prospectuses in order to grant to the issuer a single passport for such document, valid throughout the European Union; (ii) it incorporates the application of the country of origin principle by which the prospectus will be approved by the Member States of the European Union where the issuer has its registered office but it also introduces as a new matter the possibility that in certain circumstances, such as issues with high minimum denominations (€1,000 or more), the issuer may designate the relevant European Union competent authority for prospectus approval.
On April 22, 2005, the Securities Market Law was amended by Law 5/2005 on supervision of financial conglomerates in order to make the sectoral rules applicable to investment firms more consistent with other sectoral rules applicable to other groups with similar financial activities, such as credit institutions and insurance undertakings.
On November 14, 2005 the Securities Market Law was further amended by Law 19/2005, which refers to the European public limited-liability companies with registered offices in Spain and, on November 24, 2005, by Law 25/2005, of November 24, 2005, which regulates the capital risk entities (see “Item 4. Information on the Company—B. Business Overview— Recent legislation).
Royal Decree 1310/2005 (November 4) partially developed the Securities Market Law 24/1988, in relation to the admission to trading of securities in the official secondary markets, the sales or subscription public offers and the prospectus required to those effects (see “Item 4. Information on the Company—B. Business Overview— Recent legislation).
Royal Decree 1333/2005 (November 11), which developed the Securities Market Law 24/1988, in relation to market abuse (see “Item 4. Information on the Company—B. Business Overview— Recent legislation).
Trading by Santander’s Subsidiaries in the Shares
Some of our subsidiaries, in accordance with customary practice in Spain, and as permitted under Spanish law, have regularly purchased and sold our shares both for their own account and for the accounts of customers. Our subsidiaries have intervened in the market for our shares primarily in connection with customer transactions and, occasionally, in connection with transactions by non-customers that are undertaken for commercial purposes or to supply liquidity to the market when it is reasonable to do so. Such trading activity also has provided a mechanism for accumulating shares that were used to meet conversions into our shares of bonds issued by us and other affiliated companies and to make offerings of shares. We expect that our subsidiaries may continue to purchase and sell our shares from time to time.
Our trading activities in our shares are limited to those set forth above. No affiliated company acts as a “market maker” as that term is understood in the United States securities markets. The continuous market is driven by orders, which are matched by the market’s computer system according to price and time entered. Santander and Banesto’s broker subsidiaries, Santander Investment Bolsa, S.V., S.A., and Banesto Bolsa, S.A., S.V.B., and the other brokers authorized to trade on the continuous market (“Member Firms”) are not required to and do not serve as market makers maintaining independently established bid and ask prices. Rather, Member Firms place orders for their customers, or for their own account, into the market’s computer system. If an adequate counterparty order is not available on the continuous market at that time, the Member Firm may solicit counterparty orders from among its own clients and/or may accommodate the client by filling the client’s order as principal.
Under the Companies Law of Spain, a company and its subsidiaries are prohibited from purchasing shares of the company in the primary market. However, purchase of the shares is permitted in the secondary market provided that: (1) the aggregate of such purchases (referred to as “treasury stock” or “autocartera”) and the shares previously held by the company and its subsidiaries does not exceed 5% of the total capital stock of the company, (2) the purchases are authorized at a meeting of the shareholders of the acquiring company and the acquiring company’s parent, if any and (3) the acquiring company and its parent, if any, create reserves equal to the book value of the treasury stock included in its assets.
The law requires that the CNMV be notified each time the acquisitions of treasury stock made since the last notification reaches 1% of the outstanding capital stock, regardless of any other preceding sales. The Companies Law establishes, in relation to the treasury stock shares (held by us and our affiliates), that the exercise of the right to vote and other non-financial rights attached to them shall be suspended. Financial rights arising from treasury stock held directly by us, with the exception of the right to allotment of new bonus shares, shall be attributed proportionately to the rest of the shares.
143
The portion of trading volume in the shares represented by purchases by our subsidiaries has varied widely from day to day and from month to month and may be expected to do so in the future. In 2005, 10.66% of the volume traded of the shares was effected not as a principal by Santander Investment Bolsa, S.V., S.A. and 5.95% was effected not as a principal by Banesto Bolsa, S.A., S.V.B. The portion of trading volume in the shares allocable to purchases and sales as principal by our companies was approximately 6.5% in the same period. The monthly average percentage of outstanding shares held by our subsidiaries ranged from 0.057% to 0.702% in 2005. Our subsidiaries held 4,800,711 of our shares (0.077% of our total capital stock) at December 31, 2005.
Not Applicable
Not Applicable
Not Applicable
Item 10. Additional Information.
Not Applicable
B. Memorandum and articles of association.
The following summary of the material terms of our By-laws is not meant to be complete and is qualified by reference to our By-laws. Because this is a summary, it does not contain all the information that may be important to you. You should read our By-laws carefully before you decide to invest. Copies of our By-laws are incorporated by reference.
At our last Shareholders’ Meeting, which was held on June 17, 2006, our shareholders approved a number of proposals, including amendments to articles 16, 20, 30 and 38 of our By-laws. Such amendments will enter into force once they are registered on the Mercantile Registry.
For more information on the resolutions adopted by the Shareholder’s Meeting held on June 17, 2006, see our Form 6-K filed with the Securities Exchange Commission on June 20, 2006.
General
As of December 31, 2005, the Bank’s share capital was €3,127,148,289.50, represented by a single class of 6,254,296,579 book-entry Santander shares with a nominal value of €0.50 each. Since that date, our share capital has not changed. All of our shares are fully paid and non-assessable. Spanish law requires that bank-listed equity securities be issued in book-entry form only.
Register
Santander is registered with the Commercial Registry of Santander (Finance Section). The Bank is also recorded in the Special Registry of Banks and Bankers with registration number 0049, and its fiscal identification number is A-39000013.
Corporate Object and Purpose
Article 12 of our By-laws states that the corporate objective and purpose of Santander consist of carrying-out all types of activities, operations and services specific to the banking business in general and which are permitted under current legislation and the acquisition, holding and disposal of all types of securities.
144
Certain Provisions Regarding Shareholder Rights
As of the date of the filing of this report, Santander’s capital is comprised of only one class of shares, all of which are ordinary shares and have the same rights.
Our By-laws do not contain any provisions relating to sinking funds.
Our By-laws do not specify what actions or quorums are required to change the rights of holders of our stock. Under Spanish law, the rights of holders of stock may only be changed by an amendment to the by-laws of the company that complies with the requirements explained below under “Meetings and Voting Rights.”
Meetings and Voting Rights
We hold our annual general shareholders’ meeting during the first six months of each fiscal year on a date fixed by the Board of Directors. Extraordinary meetings may be called from time to time by the Board of Directors whenever the Board considers it advisable in corporate interests, and whenever so requested by stockholders representing at least 5% of the outstanding share capital of Santander. Notices of all meetings are published in the Official Gazette of the Mercantile Register and in one of the local newspapers having the largest circulation in the province where the registered office of Santander is located. In addition, under Spanish law, the agenda of the meeting must be sent to the CNMV and the Spanish Stock Exchanges and published on the company’s website. Our last ordinary general meeting of shareholders was held on June 17, 2006 and our last extraordinary general meeting of shareholders was held on October 21, 2004.
At our last Shareholders’ Meeting, which was held on June 17, 2006, our shareholders approved a proposal to amend article 20 of our By-laws such that, once the amendment is registered on the Mercantile Registry, would stipulate that the convening of the shareholders’ meetings will have to be done at least 30 days in advance, as it is currently required by Spanish law.
Each Santander share entitles the holder to one vote. Registered holders of any number of shares who are current in the payment of capital calls will be entitled to attend shareholders’ meetings. Our By-laws do not contain provisions regarding cumulative voting.
Any Santander share may be voted by proxy. Subject to the limitations imposed by Spanish law, proxies may be given only to shareholders who are entitled to attend the shareholders’ meeting and are acting in their individual capacity, must be in writing or by remote means of communication and are valid only for a single meeting.
In accordance with the Procedural Rules of the General Shareholders’ Meeting and in the manner established by such Rules, the Group’s website includes from the date when the call of the General Shareholders’ Meeting is published, the text of all resolutions proposed by the Board of Directors with respect the agenda items and the details regarding the manner and procedures for shareholders to follow to confer representation on any other shareholder who is eligible to attend the General Shareholders’ Meeting in his own right and to vote by proxy. The manner and procedures for electronic delegation and voting via the Internet are also indicated.
At our last Shareholders’ Meeting our shareholders approved a proposal to amend article 16 of our By-laws such that, once the amendment is registered on the Mercantile Registry, representation at a Shareholders’ Meeting can also be conferred to a person who is not a shareholder.
At both General Shareholders’ Meetings held in 2004 (the Annual General Meeting of June 19, 2004 and the Extraordinary General Meeting of October 21, 2004) our shareholders could exercise their voting and representation rights prior to the meetings by electronic means (via the Internet). In addition, at the Extraordinary General Shareholders’ Meeting of October 21, 2004, our shareholders could vote by mail and in the Annual General Meetings held on June 18, 2005 and June 17, 2006, our shareholders, besides exercising their voting and representation rights prior to the meeting by mail or via the Internet, were able to attend (besides attending and voting in person) via the Internet and were also able to vote in real time on the Internet on the resolutions considered at the meeting.
Only registered holders of Santander shares of record at least five days prior to the day on which a meeting is scheduled to be held may attend and vote at such meeting. As a registered shareholder, the depositary will be entitled to vote the Santander shares underlying the Santander ADSs. The deposit agreement requires the depositary to accept voting instructions from holders of Santander ADSs and to execute such instructions to the extent permitted by law.
145
In general, resolutions passed by a general meeting are binding upon all shareholders. In certain circumstances, Spanish law gives dissenting or absent shareholders the right to have their Santander shares redeemed by us at prices determined in accordance with established formulae or criteria. Santander shares held by the Bank or its affiliates are counted for purposes of determining quorums but may not be voted by the Bank or by its affiliates.
Resolutions at general meetings are passed provided that, regarding the voting capital present or represented at the meeting, the number of votes in favor is higher than the number of votes against or in blank and abstentions.
In accordance with Spanish law, a quorum on first call for a duly constituted ordinary or extraordinary general meeting of shareholders requires the presence in person or by proxy of shareholders representing 25% of our subscribed voting capital. On second call there is no quorum requirement. Notwithstanding the above, a quorum of 50% of our subscribed voting capital is required on the first call to approve any of the following actions:
|
| (i) | issuance of bonds; |
|
| (ii) | increase or reduction of share capital; |
|
| (iii) | transformation of Santander (change in corporate nature); |
|
| (iv) | merger, split or spin-off; |
|
| (v) | any other amendment of our By-laws; and |
|
| (vi) | dissolution. |
A quorum of 25% of the subscribed voting capital is required to vote on such actions on the second call. A two-third majority of our present or represented voting capital is required to approve all of the above listed actions when the shareholders’ meeting is held on second call and less than 50% of our subscribed voting capital is present.
For purposes of determining the quorum, those shareholders who vote by mail or through the Internet are counted as being present at the meeting, as provided by the Procedural Rules of the Bank’s General Shareholders’ Meetings.
Changes in Capital
Any increase or reduction in share capital must be approved at the general meeting in accordance with the procedures explained above in the section entitled “Meetings and Voting Rights.”
Dividends
We normally pay a yearly dividend in advance in quarterly installments in August, November and February and a complementary dividend that is generally paid in May of the following year. We and our domestic banking subsidiaries are subject to certain restrictions on dividend payments, as prescribed by the Ministry of Economy and the Bank of Spain. See “Item 4. Information on the Company—B. Business Overview—Supervision and Regulation—Restrictions on Dividends”.
Our By-laws establish that any available profits shall be distributed in the following order: first, the legally required amounts are placed into the compulsory reserves. Next, our Board of Directors will assign such amounts it considers appropriate to voluntary reserves and “fondos de previsión” (general allowances). After separating the amount which should be carried forward, if the Board deems it advisable, the remaining amount will be divided equally amongst our shareholders under the limitations imposed by Spanish law.
Our By-laws also dictate that non-voting shares shall receive a minimum annual dividend of 5% of the capital paid out in respect of each such share in accordance with the Companies Law.
The amount, time and form of payment of the dividends, to be distributed amongst the shareholders in proportion to their paid-in capital will be established by resolutions adopted at the general meeting. The Board of Directors is entitled to distribute sums on account of future dividends; said distributions must be eventually approved by the general meeting.
A shareholder’s dividend entitlement lapses five (5) years after the dividend payment date.
146
Preemptive Rights
In the event of a capital increase, or the issuance of convertible debt, each shareholder has a preferential right by operation of law to subscribe for shares in proportion to its shareholding in each new issue of Santander shares. However, this right may be excluded under certain circumstances by specific approval at the shareholders’ meeting and this right is deemed excluded in the relevant capital increase when the shareholders approve:
|
| • | capital increases following conversion of convertible bonds into Santander shares; or |
|
| • | capital increases due to the absorption of another company or of part of the spun-off assets of another company, when the new shares are issued in exchange for the new assets received. |
If capital is increased by the issuance of new shares in return for capital from certain reserves, the resulting new Santander shares will be distributed pro rata to existing shareholders.
Redemption
Our By-laws do not contain any provisions relating to redemption of shares. Nevertheless, pursuant to Spanish law, redemption rights may be created at a duly held general shareholders’ meeting. Such meeting will establish the specific terms of any redemption rights created.
Registration and Transfers
The Santander shares are in book-entry form. We maintain a registry of shareholders. We do not recognize, at any given time, more than one person as the person entitled to vote each share in the shareholders meeting.
Under Spanish law and regulations, transfers of shares quoted on a stock exchange are normally made through a “Sociedad y Agencia de Valores”, credit entities and investment services companies, that are members of the Spanish stock exchange.
Transfers executed through stock exchange systems are implemented pursuant to the stock exchange clearing and settlement procedures of Iberclear. Transfers executed “over the counter” are implemented pursuant to the general legal regime for book entry transfer, including registration by Iberclear.
Liquidation Rights
Upon a liquidation of Santander, our shareholders would be entitled to receive pro rata any assets remaining after the payment of our debts, taxes and expenses of the liquidation. Holders of non-voting shares, if any, are entitled to receive reimbursement of the amount paid before any amount is distributed to the holders of voting shares.
Change of Control
Our By-laws do not contain any provisions that would have an effect of delaying, deferring or preventing a change in control of the company and that would operate only with respect to a merger, acquisition or corporate restructuring involving Santander or any of our subsidiaries. Nonetheless, certain aspects of Spanish law described in the following section may delay, defer or prevent a change of control of the Bank or any of our subsidiaries in the event of a merger, acquisition or corporate restructuring.
Legal Restrictions on Acquisitions of Shares in Spanish Banks
Certain provisions of Spanish law require notice to the Bank of Spain prior to the acquisition by any individual or corporation of a substantial number of shares of a Spanish bank.
Any individual or corporation that wishes to acquire, directly or indirectly, a significant participation (participación significativa) in a Spanish bank must give advance notice to the Bank of Spain describing the size of such participation, its terms and conditions, and the anticipated closing date of the acquisition. “Significant participation” is defined as 5% of the outstanding share capital or voting rights of the bank or any lesser participation that gives the acquirer effective influence or control over the target bank.
147
In addition, advance notice must be given to the Bank of Spain of any increase, direct or indirect, in any significant participation at each of the following levels of ownership: 10%; 15%; 20%; 25%; 33%; 40%; 50%; 66% and 75%. Notice to the Bank of Spain is also required from anyone who, as a result of the contemplated acquisition, may attain sufficient power to control the credit entity.
Any acquisition mentioned in the preceding sentence to which the required notice was not given or even if given, a three month period after receipt of notice has not yet elapsed, or that is opposed by the Bank of Spain will have the following effects: (1) the acquired shares will have no voting rights, (2) the Bank of Spain may seize control of the bank or replace its board of directors, and (3) a fine may be levied on the acquirer.
The Bank of Spain has three months after the receipt of notice to object to a proposed transaction. Such objection may be based on finding the acquirer unsuitable on the basis, inter alia, of its commercial or professional reputation, its solvency or the transparency of its corporate structure. If three months elapse without any word from the Bank of Spain, its authorization is deemed granted. However, absent objection by the Bank of Spain, it may extend the period for closing the proposed transaction.
Any individual or institution that plans to sell its significant participation, or reduce it to one of the above-mentioned levels of ownership, or because of any sale will lose control of the entity, must provide advance notice to the Bank of Spain indicating the amount of the transaction and its anticipated closing date. Failure to comply with these requirements may subject the offending party to penalties.
Credit entities must notify the Bank of Spain as soon as they become aware of any acquisition or transfer of significant shares of its stock capital that exceeds the above-mentioned percentages. In addition, credit entities are required to provide periodic reports to the Bank of Spain describing the composition of and significant alterations to the ownership of the capital stock of the credit entity. This information must also provide the level of ownership, regardless of the amount, of any other financial entities in the capital stock of the credit entity.
If the Bank of Spain determines at any time that the influence of a person who owns a significant participation of a bank may adversely affect that bank’s financial situation, it may request that the Ministry of Economy and Finance: (1) suspend the voting rights of such person’s shares for a period not exceeding 3 years; (2) seize control of the bank or replace its board of directors; or (3) revoke the bank’s license.
The Bank of Spain also requires each bank to publish a list, dated on the last day of each quarter and during April, July, October and January of all its shareholders that are financial institutions and all other shareholders that own at least 0.25% of the bank’s total equity. Furthermore, banks are required to inform the Bank of Spain as soon as they become aware, and in any case not later than in 15 days after, of each acquisition by a person or a group of at least 1% of such a bank’s total equity.
Tender Offers
Royal Decree 432/2003 of April 11, 2003 (“RD 432/2003”) modified previous regulations on tender offers set forth by Royal Decree 1197/1991 of July 26, 1991 (“RD 1197/1991”) reinforcing the protection of minority shareholders and introducing certain changes intended to make the tender offer regime more flexible.
RD 432/2003 introduced additional scenarios which impose the mandatory launching of a tender offer. A person or entity must first launch a tender offer if it proposes to acquire a significant shareholding (25% or more) in the voting stock of the target company’s shares (or certain other equivalent securities that may directly or indirectly give the right to subscribe for shares) of a publicly-traded Spanish company. The tender offer must be for shares representing, at least, 10% and up to 100% of the target’s company capital, contingent on the final percentage of the capital of such target company to be acquired (basically, 25% or more or 50% or more). Also, the launching of a tender offer is mandatory for the acquisition of shares representing 6% or more of the capital of the target company during any twelve-month period when the offeror holds a stake between 25% and 50% of the target’s company capital.
Tender offers are mandatory also, even without reaching the stake thresholds mentioned above, if such person or entity intends to appoint more than one third but less than half plus one of the target company’s board or more than half of the directors of the target company’s board.
These new cases also require the mandatory launching of a tender offer if, within two years from the date of the acquisition, the offeror nominates and appoints more than one third but less than half plus one of the target company’s board or more than one half of the target company’s board.
148
Finally, RD 432/2003 modifies the exceptions to the mandatory launching of a tender offer; it allows for conditional tender offers upon certain requirements being met and it substantially modifies the regime of competing tender offers.
Reporting Requirements
The acquisitions or transfers of shares of any company listed on a Spanish Stock Exchange where, following the transaction, the acquiror’s ownership participation reaches 5% or any multiple of 5% of the capital stock of such company, or the seller’s participation is reduced from one of the above mentioned levels of ownership, must be reported, within 7 business days after such acquisition or transfer. The reporting must be made to the company that issued the traded shares, to the Governing Companies (Sociedades Rectoras) of the Spanish stock exchanges on which such company is listed, and to the CNMV. This threshold percentage will be 1%, or any multiple of 1%, whenever the acquirer, or the person who acts on his/her behalf, is a resident of a tax haven as defined in accordance with Royal Decree 1080/1991, or of a country or territory where there is no authority entrusted with the supervision of the securities markets, or when the designated authority declines to exchange information with the CNMV. The Minister of Finance is required to specify countries and territories in such cases, as proposed by the CNMV.
In addition, any company listed on a Spanish stock exchange must report any acquisition by such company (or a subsidiary) of the company’s own shares if the acquisition, together with any acquisitions since the date of the last report, causes the company’s ownership of its own shares to exceed 1% of its capital stock. See “Item 9. The Offer and Listing—Santander Shares—Trading by Santander’s Subsidiaries in the Shares.”
The directors of any company listed on a Spanish stock exchange must report to the CNMV to the Governing Companies (Sociedades Rectoras) of the Stock Exchanges on which the company is listed, and to the company itself, the amount of shares or option rights over the company’s shares that they hold at the time of their appointment (or, if applicable, report that they own no shares or options) directly or through companies they control or any other intermediary, regardless of the amount, and must report all acquisitions or transmissions of shares in the company, regardless of the amount that they carry out by themselves or by means of either the companies they control or an intermediary. The directors must also report the acquisition or transfer of option rights over the company’s shares.
In addition, managers of any listed company must report to the CNMV the acquisition of shares and option rights over shares as a result of a compensation plan related to the shares’ price. Any change of the aforesaid plans must be also reported.
Board of Directors
Our Board of Directors may be made up of a minimum of 14 and a maximum of 30 members, appointed by the general meeting of shareholders. At our last Shareholders’ Meeting our shareholders approved an amendment to article 30 of our By-laws such that, once it is registered on the Mercantile Registry, will reduce the maximum number of Directors from 30 to 22, while the minimum number of Directors would remain 14.
Members of the Board of Directors are elected for an initial term of three years but can be re-elected. One third of the members of the Board are elected each year. At our last Shareholders’ Meeting our shareholders approved a proposal to amend our By-laws which would, once the amendment is registered on the Mercantile Registry, extend such terms from three to five years and reduce from one third to one fifth the portion of the Board elected each year. The term for Directors designated by co-opting and ratified by the subsequent Shareholders´ Meeting will be the same as that of the Directors they are replacing.
A Director could serve for a term shorter than the one for which he or she has been initially elected if the shareholders acting at a duly called General Meeting decide that that Director be replaced before completing his or her term.
Although there is no provision in Spanish law regarding the composition of a board of directors, the Regulation of the Board provide that in exercising its powers to make proposals at the General Shareholders’ Meeting and to designate Directors by interim appointment to fill vacancies, the Board shall endeavor to ensure that the external or non-executive Directors represent a majority over the executive Directors and that the former include a reasonable number of independent Directors.
These independence standards may not necessarily be consistent with, or as stringent as, the director independence standards established by the NYSE. See “Item 6. Directors, Senior Management and Employees — C. Board Practices — Independence of the Directors on the Board of Directors”. The Bank currently complies with this requirement.
149
Certain Powers of the Board of Directors
The actions of the members of the Board are limited by Spanish law and certain general provisions contained in our By-laws. For instance, Article 32 of our By-laws states that the Directors will be liable to Santander, to our shareholders and to our corporate creditors for any damages that they may cause by acts or omissions which are contrary to law or to the By-laws or by acts or omissions contrary to the duties inherent in the exercise of their office.
A Director’s power to vote on a proposal, arrangement or contract in which such Director is materially interested is not regulated by our By-laws. Conflicts of interest are regulated by Article 28 of the Regulations of the Board. Under Article 28, a Director is obliged to inform the Board of any direct or indirect conflict of interest which may exist with the Bank. If such a conflict relates to a particular transaction, then the Director (i) may not undertake the transaction without the Board’s authorization (such authorization can only be granted following a report of the Appointments and Remuneration Committee); and (ii) the Director may not take part in the discussion or voting regarding the transaction to which the conflict relates.
Our By-laws provide that the Directors may, by resolution of the Board, direct the subscription, acquisition, purchase, exchange, pledge and sale of public securities, shares, debentures, bonds and warrants. The Board is empowered to exercise borrowing powers without restriction as to limit or otherwise on behalf of the Bank, subject only to the power to authorize the issue of bonds, which is vested in the shareholders.
The Board of Directors may pass resolutions in order to establish the amount of each payment of any capital call with respect to partially paid-in shares. The Board will also establish the period within which the payments must be made and other details, all of which must be published in the “Boletín Oficial del Registro Mercantil” (the Official Gazette of the Mercantile Register). Any delays in the payment of capital calls will bear interest starting from the day when the payment is due and without the need for any judicial or extra-judicial summons. We will also be able to take any action authorized by law to collect such sums.
Article 38 of the Bank’s By-laws provides that the members of our Board of Directors (together with our Executive Vice Presidents) may receive an amount up to 5% of the Bank’s net income for any fiscal year, for performing their duties as Directors, provided, however, that the Board may resolve that such percentage be reduced in those years in which the Board deems it justified. In practice, the amount so distributed is lower than the 5% limit mentioned above. An amendment to our By-laws was approved by our shareholders at the last Shareholders’ Meeting that would reduce, once the amendment is registered on the Mercantile Registry, this limit from 5% to 1% and exclude the reference to the Bank’s Executive Vice Presidents. In addition, the Board shall distribute the resulting payment among the participants in such manner and amount as may resolved annually by the Board with respect to each of them.
In order to set the specific amount corresponding to such participation, the percentage decided by the Board shall be applied to the year’s results.
In any event, before any payments in respect of the Directors’ participation can be made, the Bank must have made all allocations that have priority to such participation pursuant to applicable legislation.
Regardless of the foregoing, the members of the Board and of the Executive Committee are entitled to receive attendance fees, as well as such remuneration as may be applicable for the performance of their duties within the Bank other than their duties as a Director. These amounts are approved by the Board of Directors with the prior proposal from the Appointments and Remuneration Committee.
Directors may also receive compensation in the form of shares of the Bank or options over the shares, or other remuneration linked to share value following a resolution adopted by the shareholders at the General Shareholders’ Meeting (conducted in accordance with our By-laws and applicable Spanish legislation).
Board of Directors Qualification
There are no mandatory retirement provisions due to age for Board members in our By-laws or in the regulations of our Board of Directors. These regulations contain provisions relating to the cessation of directorship for other reasons.
150
Subject to legal limitations, any person will be eligible to serve as a Director of Santander without having to be a shareholder of the Bank.
During the past two years, the Bank was not a party to any contract outside its ordinary course of business that was material to the Group as a whole, except as disclosed in “Item 4. Information on the Company — Principal Capital Expenditures and Divestitures — Acquisitions, Dispositions, Reorganizations — Sovereign”.
Restrictions on Foreign Investments
Under present regulations, foreign investors may transfer invested capital, capital gains and dividends out of Spain without limitation on the amount other than applicable taxes. See “Taxation”. On July 4, 2003, Law 19/2003 was approved which updates Spanish exchange control and money laundering prevention provisions, by recognizing the principle of freedom of the movement of capital between Spanish residents and non residents. The law establishes procedures for the declaration of capital movements for purposes of administrative or statistical information and authorizes the Spanish Government to take measures which are justified on grounds of public policy or public security. It also provides the mechanism to take exceptional measures with regard to third countries if such measures have been approved by the European Union or by an international organization to which Spain is a party. The Spanish stock exchanges and securities markets are open to foreign investors. Royal Decree 664/1999, on Foreign Investments (April 23, 1999), established a new framework for the regulation of foreign investments in Spain which, on a general basis, will no longer require any prior consents or authorizations from authorities in Spain (without prejudice to specific regulations for several specific sectors, such as television, radio, mining, telecommunications, etc.). Royal Decree 664/1999 requires notification of all foreign investments in Spain and liquidations of such investments upon completion of such investments to the Investments Registry of the Ministry of Economy, strictly for administrative statistical and economical purposes. Only investments from “tax haven” countries (as they are defined in Royal Decree 1080/1991), shall require notice before and after performance of the investment, except that no prior notice shall be required for: (1) investments in securities or participations in funds of the investment that are registered with the CNMV, and (2) investments that do not increase the foreign ownership of the capital stock of a Spanish company to over 50%. In specific instances, the Counsel of Ministers may agree to suspend, all or part of, Royal Decree 664/1999 following a proposal of the Minister of Economy, or, in some cases, a proposal by the head of the government department with authority for such matters and a report of the Foreign Investment Body. These specific instances include a determination that the investments, due to their nature, form or condition, affect activities, or may potentially affect activities relating to the exercise of public powers, national security or public health. Royal Decree 664/1999 is currently suspended for investments relating to national defense. Whenever Royal Decree 664/1999 is suspended, the affected investor must obtain prior administrative authorization in order to carry out the investment.
The following is a discussion of the material Spanish and U.S. federal income tax consequences to you of the acquisition, ownership and disposition of the ADSs or shares.
The discussion of Spanish tax consequences below applies to you only if you are a non-resident of Spain and ownership of ADSs or shares is not effectively connected with a permanent establishment or fiscal base in Spain and only to U.S. residents entitled to the benefits of the Convention Between the United States and the Kingdom of Spain for the Avoidance of Double Taxation and the Prevention of Fiscal Evasion with Respect to Taxes on Income (the “Treaty”).
You should consult your own tax adviser as to the particular tax consequences to you of owning the shares or ADSs including your eligibility for the benefits of any treaty between Spain and the country of your residence for the avoidance of double taxation, the applicability or effect of any special rules to which you may be subject, and the applicability and effect of state, local, foreign and other tax laws and possible changes in tax law.
Spanish tax considerations
The following is a summary of material Spanish tax matters and is not exhaustive of all the possible tax consequences to you of the acquisition, ownership and disposition of ADSs or shares. This discussion is based upon the tax laws of Spain and regulations thereunder, which are subject to change, possibly with retroactive effect.
151
Taxation of dividends
Under Spanish law, dividends paid by a Spanish resident company to a holder of ordinary shares or ADSs not residing in Spain for tax purposes and not operating through a permanent establishment in Spain are subject to Spanish Non-Resident Income Tax at a 15% rate, which is also the rate to which you may be entitled to under the Treaty.
We will levy the withholding tax on the gross amount of dividends at a 15% tax rate, following the procedures set forth by the Order of April 13, 2000.
Taxation of capital gains
Under Spanish law, any capital gains derived from securities issued by persons residing in Spain for tax purposes are considered to be Spanish source income and, therefore, are taxable in Spain. For Spanish tax purposes, income obtained by you if you are a U.S. resident from the sale of ADSs or shares will be treated as capital gains. Spanish non-resident income tax is currently levied at a 35% tax rate on capital gains obtained by persons not residing in Spain for tax purposes who are not entitled to the benefit of any applicable treaty for the avoidance of double taxation.
Notwithstanding the above, capital gains derived from the transfer of shares on an official Spanish secondary stock market by any holder who is a resident at a country that has entered into a treaty for the avoidance of double taxation with Spain containing an “exchange of information” clause will be exempt from taxation in Spain. In addition, under the Treaty, capital gains realized by you upon the disposition of ADSs or shares will not be taxed in Spain provided you have not held, directly or indirectly, 25% of our stock during the twelve months preceding the disposition of the stock. You are required to establish that you are entitled to this exemption by providing to the relevant Spanish tax authorities an IRS certificate of residence in the United States, together with the appropriate Spanish tax form, not later than 30 days after the capital gain was realized.
Spanish wealth tax
Individuals not residing in Spain who hold shares or ADSs located in Spain are subject to the Spanish wealth tax (Spanish Law 19/1991), which imposes a tax on property located in Spain on the last day of any year. The Spanish tax authorities may take the view that all shares of Spanish corporations and all ADSs representing such shares are located in Spain for Spanish tax purposes. If such a view were to prevail, non-residents of Spain who held shares or ADSs on the last day of any year would be subject to the Spanish wealth tax for such year at marginal rates varying between 0.2% and 2.5% of the average market value of such shares or ADSs during the last quarter of such year.
Spanish inheritance and gift taxes
Transfers of shares or ADSs upon death or by gift are subject to Spanish inheritance and gift taxes (Spanish Law 29/1987) if the transferee is a resident in Spain for tax purposes, or if the shares or ADSs are located in Spain at the time of gift or death, or the rights attached thereto could be exercised or have to be fulfilled in the Spanish territory, regardless of the residence of the beneficiary. In this regard, the Spanish tax authorities may determine that all shares of Spanish corporations and all ADSs representing such shares are located in Spain for Spanish tax purposes. The applicable tax rate, after applying all relevant factors, ranges between 0 and 81.6% for individuals.
Gifts granted to corporations non-resident in Spain are subject to Spanish Non-Resident Income Tax at a 35% tax rate on the fair market value of the shares as a capital gain. If the donee is a United States corporation, the exclusions available under the Treaty described in the section “Taxation of capital gains” above will be applicable.
Expenses of transfer
Transfers of ADSs or shares will be exempt from any transfer tax or value-added tax. Additionally, no stamp tax will be levied on such transfers.
152
U.S. Tax Considerations
The following summary describes the material U.S. federal income tax consequences of the acquisition, ownership and disposition of ADSs or shares, but it does not purport to be a comprehensive description of all of the tax considerations that may be relevant to a particular person’s decision to acquire such securities. The summary applies only to U.S. Holders (as defined below) that hold ADSs or shares as capital assets for tax purposes and does not address special classes of holders, such as:
• | certain financial institutions; |
• | insurance companies; |
• | dealers and traders in securities or foreign currencies; |
• | holders holding ADSs or shares as part of a hedge, straddle, conversion transaction or other integrated transaction; |
• | holders whose “functional currency” is not the U.S. dollar; |
• | holders liable for alternative minimum tax; |
• | tax exempt organizations; |
• | partnerships or other entities classified as partnerships for U.S. federal income tax purposes; |
• | holders that own 10% or more of our voting shares; or |
• | persons who acquired our ADSs or shares pursuant to the exercise of any employee stock option or otherwise as compensation. |
The summary is based upon tax laws of the United States including the Internal Revenue Code of 1986, as amended to the date hereof (the “Code”), administrative pronouncements, judicial decisions and final, temporary and proposed Treasury Regulations, changes to any of which may affect the tax consequences described herein possibly with retroactive effect. In addition, the summary is based on the Treaty and is based in part on representations of the Depositary and assumes that each obligation provided for in or otherwise contemplated by the Deposit Agreement or any other related document will be performed in accordance with its terms. Prospective purchasers of the ADSs or shares are urged to consult their own tax advisers as to the U.S., Spanish or other tax consequences of the acquisition, ownership and disposition of ADSs or shares in their particular circumstances.
As used herein, a “U.S. Holder” is a beneficial owner of ADSs or shares that is, for U.S. federal income tax purposes:
|
| • | a citizen or resident of the United States; |
|
| • | a corporation, or other entity taxable as a corporation, created or organized in or under the laws of the United States or of any political subdivision thereof; or |
|
| • | an estate or trust the income of which is subject to U.S. federal income taxation regardless of its source. |
In general, for U.S. federal income tax purposes, U.S. Holders of ADSs will be treated as the holders of the underlying shares represented by those ADSs. Accordingly, no gain or loss will be recognized if a U.S. Holder exchanges ADSs for the underlying shares represented by those ADSs.
The U.S. Treasury has expressed concerns that parties to whom ADSs are pre-released may be taking actions that are inconsistent with the claiming of foreign tax credits for U.S. holders of ADSs. Such actions would also be inconsistent with the claiming of the reduced rate of tax, described below, applicable to dividends received by certain non-corporate holders. Accordingly, the creditability of Spanish taxes and the availability of the reduced tax rate for dividends received by certain non-corporate holders, each described below, could be affected by actions taken by parties to whom the ADSs are pre-released.
Taxation of Distributions
Subject to the discussion of the passive foreign investment company rules below, to the extent paid out of our current or accumulated earnings and profits (as determined in accordance with U.S. federal income tax principles), distributions, including any Spanish withholding tax, made with respect to ADSs or shares (other than certain pro rata distributions of our capital stock or rights to subscribe for shares of our capital stock) will be includible in the income of a U.S. Holder as foreign source ordinary dividend income. Such dividends will not be eligible for the “dividends received deduction” generally allowed to corporations receiving dividends from domestic corporations under the Code. The amount of the distribution will equal the U.S. dollar value of the euros received, calculated by reference to the exchange rate in effect on the date such distribution is received (which, for U.S. Holders of ADSs, will be the date such distribution is received by the Depositary), whether or not the Depositary or U.S. Holder in fact converts any euros received into U.S. dollars at that time. Any gains or losses resulting from the conversion of euros into U.S. dollars will be treated as ordinary income or loss, as the case may be, of the U.S. Holder and will be U.S. source.
153
Subject to applicable limitations and the discussion above regarding concerns expressed by the U.S. Treasury, dividends paid to a non-corporate U.S. holder paid in taxable years beginning before January 1, 2011 will be taxed at a maximum rate of 15%. Non-corporate holders should consult their own tax advisers to determine the implications of the rules regarding this favorable rate in their particular circumstances. The amount of dividend will include any amounts withheld by us or our paying agent in respect of Spanish taxes.
Subject to certain generally applicable limitations that may vary depending upon your circumstances and subject to the discussion above regarding concerns expressed by the U.S. Treasury, a U.S. Holder will be entitled to a credit against its U.S. federal income tax liability for Spanish withholding taxes. The limitation on foreign taxes eligible for credit is calculated separately with regard to specific classes of income. Instead of claiming a credit, a U.S. Holder may, at its election, deduct such otherwise creditable Spanish taxes in computing taxable income, subject to generally applicable limitations under U.S. law.
A U.S. Holder must satisfy minimum holding period requirements in order to be eligible to claim a foreign tax credit for foreign taxes withheld on dividends. The rules governing foreign tax credits are complex and, therefore, U.S. Holders are urged to consult their own tax advisers to determine whether they are subject to any special rules that limit their ability to make effective use of foreign tax credits.
Sale and Other Disposition of ADSs or Shares
Subject to the discussion of the passive foreign investment company rules below, gain or loss realized by a U.S. Holder on the sale or exchange of ADSs or shares will be subject to U.S. federal income tax as capital gain or loss (and will be long-term capital gain or loss if the U.S. Holder held the shares or ADSs for more than one year) in an amount equal to the difference between the U.S. Holder’s tax basis in the ADSs or shares and the amount realized on the disposition. Gain or loss, if any, will be U.S. source for foreign tax credit purposes. The deductibility of capital losses is subject to limitations. Long-term capital gain of a non-corporate U.S. holder is generally taxed at a preferential rate.
Passive Foreign Investment Company Rules
We believe that we are not a “passive foreign investment company” (“PFIC”), for U.S. federal income tax purposes for the taxable year 2005. However, since our PFIC status depends upon the composition of our income and assets and the market value of our assets (including, among others, less than 25 percent owned equity investments) from time to time, and based upon certain proposed Treasury Regulations that are not yet in effect but are generally proposed to become effective for taxable years after December 31, 1994, there can be no assurance that we will not be considered a PFIC for any taxable year.
If we are treated as a PFIC for any taxable year, gain recognized by a U.S. Holder on a sale or other disposition of ADSs or shares would be allocated ratably over the U.S. Holder’s holding period for the ADSs or shares. The amounts allocated to the taxable year of the sale or other exchange and to any year before we became a PFIC would be taxed as ordinary income. The amount allocated to each other taxable year would be subject to tax at the highest rate in effect for individuals or corporations, as appropriate, and an interest charge would be imposed on the amount allocated to such taxable year. Further, any distribution in respect of ADSs or ordinary shares in excess of 125 percent of the average of the annual distributions on ADSs or ordinary shares received by the U.S. Holder during the preceding three years or the U.S. Holder’s holding period, whichever is shorter, would be subject to taxation as described above. Certain elections may be available (including a mark to market election) to U.S. persons that may mitigate the adverse consequences resulting from PFIC status.
In addition, if we were to be treated as a PFIC in a taxable year in which we pay a dividend or the prior taxable year, the 15% dividend rate discussed above with respect to dividends paid to non-corporate holders would not apply.
Information Reporting and Backup Withholding
Payment of dividends and sales proceeds that are made within the United States or through certain U.S.-related financial intermediaries generally are subject to information reporting and to backup withholding unless (i) you are a corporation or other exempt recipient or (ii) in the case of backup withholding, you provide a correct taxpayer identification number and certify that you are not subject to backup withholding. The amount of any backup withholding from a payment to a U.S. Holder will be allowed as a credit against the U.S. Holder’s U.S. federal income tax liability and may entitle the U.S. Holder to a refund, provided that the required information is furnished to the Internal Revenue Service.
154
F. Dividends and paying agents.
Not Applicable
Not Applicable
We are subject to the information requirements of the Exchange Act, except that as a foreign issuer, we are not subject to the proxy rules or the short-swing profit disclosure rules of the Exchange Act. In accordance with these statutory requirements, we file or furnish reports and other information with the SEC. Reports and other information filed or furnished by us with the SEC may be inspected and copied at the public reference facilities maintained by the SEC at Room 1024, 450 Fifth Street, N.W., Washington, D.C. 20549, and at the SEC’s regional offices at 233 Broadway, New York, New York 10279 and Northwestern Atrium Center, 500 West Madison Street, Suite 1400, Chicago, Illinois 60661-2511. Copies of such material may also be inspected at the offices of the New York Stock Exchange, 11 Wall Street, New York, New York 10005, on which our ADSs are listed. In addition, the SEC maintains a website that contains information filed electronically with the SEC, which can be accessed over the internet at http://www.sec.gov.
Not Applicable
155
Item 11. Quantitative and Qualitative Disclosures About Market Risk
Our risk management activities involve the integrated qualification and quantification of the different types of risk (credit risk, operational risk, reputational risk and market risk) which are assumed by our business units in their activities.
We have divided this section in the following seven parts:
|
| • | Organization of Risk Management; |
|
| • | Global Risk Analysis Profile; |
|
| • | Credit Risk; |
|
| • | Operational Risk; |
|
| • | Reputational Risk; |
|
| • | Risk Training Activities; and |
|
| • | Market Risk |
Excellent risk management is one of the basic pillars of our business strategy, a necessity for creating value.
Throughout our history, we have combined prudence (for example, in loan-loss provisions) with use of advanced risk management techniques, which have been shown to be very efficient in the recurrent and balanced generation of earnings and the creation of shareholder value.
The importance attached to the quality of risk has traditionally been, and continues to be, one of the hallmarks of our corporate culture and management style.
For these reasons, we fully identify with the New Basle Capital Accord (BIS II), as it sets out and regulates the most advanced risk management practices of the banking industry.
The entry into force of this Accord will also enable us to reflect our strength in this sphere and our capacity to successfully apply the system of Advanced Internal Models of risk and their appropriate integration with our global management. Significant progress was made in this area during 2005. With this, not only will we continue to be one of the leaders in risk management matters, but the markets, under the framework of Pillar III of Basle II, will have at their disposal all the elements needed for an evaluation of our business.
We are making the necessary investment in human and technological resources to satisfy the New Accord’s demanding requirements in a reasonable time period, and are strongly committed to continuing to do this in order to keep up, as we are sure of beneficial results that it will continue to produce.
Our risk management is based on the following principles:
• | Independent working with shared hierarchy. The objectives and methodologies are established by the Risks Division, while the organizational structure is adapted to business needs and proximity to the customer, while maintaining risk quality criteria. |
• | Executive capacity supported by knowledge and closeness to the customer, as well as collective decisions via the corresponding Risks Committees. |
• | Global scope (different types of risk) and single treatment of the customer (non-admission of risks from different units), without detriment to specialization by risk type and customer segment. |
156
• | Collective decision-making (including at the branch) which ensures different opinions and does not make results dependent on individual decisions. |
• | Medium-low risk profiles as a target, without detriment to their predictable nature, which entails a culture of consistency in a series of policies and procedures, among which are the following: |
| - | Special emphasis on monitoring of risks in order to have sufficient warning of possible problems. |
| - | Risk diversification limiting, in general, the Group’s relative exposure to the overall risk of customers in the credit system. |
| - | Avoiding exposure to companies with ratings deemed to be below par, even when this would entail a risk premium proportionate to the level of internal rating. |
We have been using a series of techniques and tools for many years, which are mentioned in other parts of this report. Of note among them, given that we implemented them ahead of time and for being in line with BIS II, are:
• | Internal qualitative and quantitative ratings; with valuation of the different components which, by client and facility, enable the probabilities of failure to be estimated and then the expected loss on the basis of historical data. |
• | Return on Risk Adjusted Capital (RORAC), used for pricing operations (bottom up) and for the analysis of portfolios and units (top down). |
• | Economic capital estimated by valuating all kinds of risks, both as a reference of the management by different building blocks and the return obtained, as well as in admission processes and reference limit of the global classifications of large clients. |
• | Value at risk as an element of control and for setting the market risk limits of the different trading portfolios. |
• | Stress testing to complement the analysis of market and credit risk, in order to assess the impact of alternative scenarios, including on provisions and capital. |
Part 1. Organization of Risk Management
Our governing bodies and senior management have the knowledge and experience to carry out their tasks effectively, objectively and independently in order to supervise execution of the general strategy. The senior management sets business plans, supervises daily decisions and ensures they are in line with the objectives and policies set by the Board.
The Risk Committee, delegated by the Board:
• | Sets our risk policies, in accordance with the Board’s Executive Committee. |
• | Ensures that the risk levels assumed at the individual and global level meet the targets set. |
• | Resolves operations beyond the powers delegated to bodies immediately below, as well as the global limits of pre-classification of economic groups or in relation to exposures by classes of risk. |
• | Empowers other committees lower down the hierarchy to deal with risks. |
• | Receives information on the significant issues that it must know about and decide upon. |
• | Regularly reviews the exposures to main clients, economic sectors, geographic areas and risk categories. |
• | Knows and supervises the fulfillment of risk objectives, the tools used to manage risk, the measures being taken to improve risk management and any other actions undertaken in this area. |
157
• | Receives, evaluates and monitors the observations and recommendations which, for varying reasons, are made by the supervisory authorities. |
• | Ensures that our measures are consistent with the appetite of risks previously decided. |
The Committee deals with all types of risk: credit, market, operational, liquidity, etc.
The collective bodies for risk matters are the committees that have been assigned powers for making decisions, controlling and monitoring risks. In order of seniority they are:
Sphere |
| Level in the hierarchy |
| Name |
|
|
|
|
|
Centralised |
| Executive |
| Executive Committee |
|
| |||
|
| Risks Division |
| Risks Management Committee |
| ||||
|
| Areas and Departments reporting to the Risks Division |
| Risk Wholesale Banking Risk Committee |
| ||||
Decentralised |
| Units Committees |
| Risks Committee in Banks of the Group/Countries |
Our Risks Division reports directly to the third Vice-Chairman and to the Chairman of the Board’s Risk Committee.
The risks function has a global reach and “multilocal” execution. It covers the different geographic areas where we operate. This Division’s mission is to always maintain the quality of risk while providing agile, effective and efficient service to customers.
The Division is divided in two:
• | General Directorate of Risks, and |
• | General Directorate of Internal Control and Integral Valuation of Risk. |
The General Directorate of Risks is responsible for the executive functions of credit and market risk management and it is adapted to the structure of the business, by type of client as well as by activity and geographic area (global view / local view).
This structure strengthens the capacity to anticipate changes in the financial conditions of a client or a market, maintaining the quality and standards of our risk profile and promoting dynamic and integrated management. In addition, under this General Directorate there is an area that monitors use of the best practices in measurement and tools in order to be able to offer a better range of complex products and better analysis of risks.
In line with this, its objectives are:
• | Collaborate with senior management in defining the risk appetite level. |
• | Implement risk policies, communicate them to risk-taking areas, facilitate their understanding and oversee their fulfillment. |
• | Report on risk exposures and ensure they are in line with the established objectives. |
Segmentation is one of the key pillars of the risks function, as it enables risk to be classified on the basis of certain criteria in order to conduct efficient management, in accordance with the following objectives:
158
• | Analyze risk differently on the basis of its type. |
• | Better evaluate the return and risks of each institution. |
• | Decision-taking based on more appropriate information. |
And in accordance with the following types of segmentation:
• | Geographic |
• | Sectors |
• | Business |
• | Products |
• | Activity |
• | Customer |
The Directorate General of Risks distributes its functions among the following areas:
• | Planning and Projects |
• | Customer Areas |
- | Wholesale Banking and Company Risks | |
| - | Standardized Risks |
| - | Recoveries |
• | Control and Monitoring Areas |
| - | Lending |
| - | Wholesale Risks |
| - | Financial Risks |
• | Quantitative analysis and infrastructure |
The General Directorate of Internal Control and Integral Valuation of Risk has the responsibilities and functions of an independent unit which, in line with BIS II and as the expert team in such accord, is responsible for controlling and valuating risk, in all its dimensions, with the following specific responsibilities for the whole Group:
• | Quantitative validation of the internal risk models. |
• | Qualitative validation of the rating systems, internal processes and treatment of data in order to evaluate their suitability and adjustment to the requirements of the internal models, in accordance with BIS II rules and the prevailing legislation. |
• | Calculate the internal parameters for economic and regulatory capital (Pillar 1). |
• | Provide our units with methodological support related to BIS II. |
• | Measurement, control and monitoring of our operational risk. |
• | Meeting the requirements of BIS II in Pillars 2 and 3 (Report, rating agencies, analysts, etc.) |
• | Co-ordination and monitoring of recommendations set by regulatory bodies and auditors in risk maters. |
Both Directorates report to the Risks Division and to the third Vice-Chairman of the Group, ensuring the functioning of the appropriate coordination mechanisms.
159
Part 2. Global Risk Analysis Profile
Our risk profile at December 31, 2005 for all our activities by types of risk and by business units, measured in terms of distribution of economic capital, is shown below:
Distribution of economic capital | Distribution of economic capital | ||||||
| by types of risk | by business units | ||||||
Credit |
| 55.4% |
| Latin America |
| 32.5% |
|
Equity Stakes |
| 11.4% |
| Financial Management and Equity Investments |
| 17.8% |
|
Rest of Market |
| 7.6% |
| Abbey |
| 14.2% |
|
Structural Interest |
| 8.4% |
| Santander Network in Spain |
| 11.1% |
|
Business |
| 8.4% |
| Banesto |
| 8.9% |
|
Operational |
| 6.8% |
| Wholesale Banking in Spain* |
| 7.0% |
|
Insurance (Abbey) |
| 2.0% |
| Portugal |
| 4.2% |
|
| Santander Consumer |
| 3.8% |
| |||
| Asset Management and Insurance Spain |
| 0 4% |
| |||
| Banif Group |
| 0.1% |
| |||
| * Global Wholesale Banking represents 13.5% |
|
|
|
By types of risk, credit continues to be the main source of our risk (55% of the global economic capital). The market risk of equity stakes (11%) was the second largest (as compared to 23% in 2004), and trading positions accounted for 8%. The rest of risks (including, for the first time, the risk of Abbey’s insurance business) accounted for 26% of our capital.
We have been using the Integral Framework of Risks (“IFR”) since 2003 as the tool to quantify, aggregate and assign economic capital and to measure our risk adjusted return and that of our main business units.
In accordance with the assumptions used in this model, our geographic diversification, the result of the multinational and multi-business nature of our activity, provides a diversification benefit of 28%. In other words, our global risk, measured in terms of economic capital, is 28% less than the sum of the risk of our business units considered on their own.
Our economic capital is calculated under the premise of supporting the risk of activity with a confidence level of 99.97%, equivalent to a rating of AA. Comparing these figures of economic capital with the capital funds available at December 2005 shows that we were sufficiently capitalized for an AA rating.
The IFR risks show a risk adjusted return for the Group of 14.7% in 2005, which, with an estimated cost of capital for 2006 of 8.6%, means a high capacity to generate shareholder value.
This model is used to set the risk adjusted return objectives for our main business units, taking into account not only the return on the activity but also the risk incurred to achieve it and the return required by our shareholders.
We believe that this model will also enable us to meet the regulatory requirements of Pillar 2 of the New Basle Accord, both with respect to having a process to permanently evaluate capital sufficiency in accordance with the risk profile, as well as the integral evaluation of all risks.
Part 3. Credit risk
Credit risk is the possibility of financial loss stemming from the failure of our clients or counterparties to meet their obligations with us.
Credit risk is our main source of risk (55% of the aggregate economic capital), and so identifying, measuring and managing it is vital in order to generate value on a sustained basis.
Our view of risk and its management is global in its conception and local in execution. The risks function is based on common principles and criteria shared by the various units. In order to develop it properly, we have a series of policies, procedures and management tools which, based on a common basic model, are adapted to each market’s specific features.
Our credit risk management is also carried out from an integral perspective, taking into account the correlation with other risks and valuating the risk adjusted return of different exposures.
160
Another defining feature of our credit risk management is its pro-active nature during the full credit cycle (acceptance, monitoring and recovery). Customers are pre-classified during the acceptance phase in order to respond quickly to business needs. During the subsequent monitoring, exposures are constantly evaluated, portfolios are actively managed and, if there are signs of potential impairment of risks, early action is taken, offsetting the risks and reducing the exposures in order to reduce the potential loss and optimize the risk/return relation.
The table below sets out the global credit risk exposure in nominal amounts (except for derivatives and repos exposure, which are expressed in equivalent credit risk) as of December 31, 2005.
Grupo Santander - Gross Exposure to Credit Risk
|
| Outstanding |
| Commitments |
| Sovereign |
| Private |
| Outstanding |
| Commitments |
| Derivatives |
| Total |
| % |
|
|
|
|
|
|
|
|
|
|
|
| |||||||||
Spain |
| 195,806 |
| 47,254 |
| 44,740 |
| 5,161 |
| 16,894 |
| 1,112 |
| 13,996 |
| 324,962 |
| 47.8 | % |
Parent bank |
| 119,127 |
| 32,722 |
| 38,108 |
| 2,719 |
| 13,469 |
| 885 |
| 9,187 |
| 216,217 |
| 31.8 | % |
Banesto |
| 56,477 |
| 8,700 |
| 6,470 |
| 2,255 |
| 1,559 |
| 208 |
| 4,773 |
| 80,442 |
| 11.8 | % |
Others |
| 20,202 |
| 5,832 |
| 161 |
| 187 |
| 1,866 |
| 19 |
| 36 |
| 28,303 |
| 4.2 | % |
Rest of Europe |
| 205,678 |
| 10,803 |
| 766 |
| 9,003 |
| 6,947 |
| 0 |
| 10,105 |
| 243,302 |
| 35.8 | % |
Germany |
| 12,912 |
| 1,716 |
| 20 |
| 20 |
| 279 |
| 0 |
| 5 |
| 14,953 |
| 2.2 | % |
Portugal |
| 27,825 |
| 4,739 |
| 682 |
| 1,455 |
| 2,400 |
| 0 |
| 1,025 |
| 38,125 |
| 5.6 | % |
UK (Abbey) |
| 154,914 |
| 4,010 |
| 0 |
| 7,528 |
| 3,680 |
| 0 |
| 8,045 |
| 178,177 |
| 26.2 | % |
Others |
| 10,027 |
| 338 |
| 64 |
| 0 |
| 588 |
| 0 |
| 1,030 |
| 12,048 |
| 1.8 | % |
Latin America |
| 55,010 |
| 18,220 |
| 12,124 |
| 2,507 |
| 13,423 |
| 34 |
| 5,167 |
| 106,484 |
| 15.7 | % |
Brazil |
| 12,541 |
| 3,055 |
| 5,363 |
| 447 |
| 4,990 |
| 0 |
| 810 |
| 27,207 |
| 4.0 | % |
Chile |
| 15,914 |
| 3,254 |
| 180 |
| 939 |
| 1,681 |
| 1 |
| 2,587 |
| 24,557 |
| 3.6 | % |
Mexico |
| 13,882 |
| 9,272 |
| 4,670 |
| 63 |
| 4,107 |
| 33 |
| 1,465 |
| 33,492 |
| 4.9 | % |
Puerto Rico |
| 6,804 |
| 1,360 |
| 323 |
| 1,057 |
| 159 |
| 0 |
| 287 |
| 9,989 |
| 1.5 | % |
Venezuela |
| 2,269 |
| 835 |
| 1,114 |
| 0 |
| 1,675 |
| 0 |
| 0 |
| 5,892 |
| 0.9 | % |
Others |
| 3,600 |
| 443 |
| 475 |
| 0 |
| 810 |
| 0 |
| 18 |
| 5,347 |
| 0.8 | % |
Rest of World |
| 1,246 |
| 257 |
| 70 |
| 1,396 |
| 2,411 |
| 0 |
| 85 |
| 5,466 |
| 0.8 | % |
|
|
|
|
|
|
|
|
|
|
| |||||||||
Total Group |
| 457,740 |
| 76,533 |
| 57,701 |
| 18,066 |
| 39,675 |
| 1,145 |
| 29,354 |
| 680,214 |
| 100 | % |
|
|
|
|
|
|
|
|
|
|
| |||||||||
% of Total |
| 67.3 | % | 11.3 | % | 8.5 | % | 2.7 | % | 5.8 | % | 0.2 | % | 4.3 | % | 100.0 | % |
|
|
|
|
|
|
|
|
|
|
|
|
|
Data at 31.12.05. Derivatives expressed in equivalent credit risk, including repos.
Doubtful loans are excluded.
Balances with customers exclude repos (27,581 million).
Balances with credit entities (excluding repos and trading) include EUR 13,475 million of deposits in central banks.
The charts below demonstrate the distribution of the credit exposure, adjusted in terms of exposure at default (EaD) (after applying conversion factors to off-balance sheet exposures) according to the rating and expected loss of each of the main credit risk groupings.
161
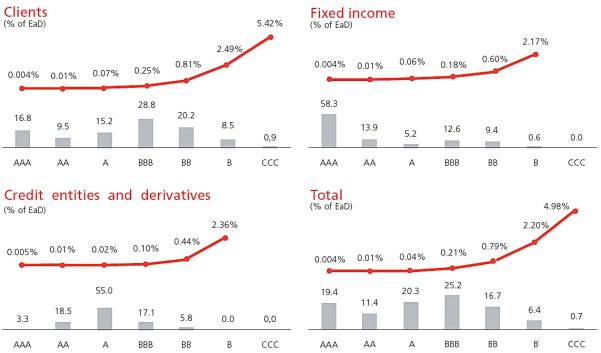
The rating distribution in our portfolio of clients is typical for commercial banks. Most of the ratings below BBB are the portfolios of SMEs, consumer loans, consumer credit cards, and a portion of our mortgage portfolios. These portfolios below BBB have a high degree of fragmentation, lower proportional consumption of capital and levels of expected loss comfortably covered by the spread on the operations.
The table below sets out the distribution by segments of the credit exposure to customers in terms of exposure at default (EaD). Approximately 81% of risk pertains to SMEs and individuals, underlining the predictability of our risk. Expected loss from customer exposure is 0.51%, or 0.39% of our total loan exposure, which can be considered a medium-to-low assumed loan risk profile.
Distribution of exposure by customer
|
| EaD exposure |
| % |
| Expected loss(%) |
|
|
|
|
|
| |||
Public sector |
| 6,107 |
| 1.3 |
| 0.16 |
|
Corporate |
| 82,654 |
| 17.4 |
| 0.25 |
|
SMEs |
| 111,652 |
| 23.6 |
| 0.62 |
|
Mortgages (individuals) |
| 208,372 |
| 44.0 |
| 0.12 |
|
Rest of individuals |
| 64,427 |
| 13.6 |
| 1.90 |
|
Rest of segments |
| 513 |
| 0.1 |
| 4.06 |
|
|
|
|
|
| |||
Total |
| 473,725 |
| 100.0 |
| 0.51 |
|
|
|
|
|
|
3.1. Customer segmentation for credit risk management
Credit risk management is conducted according to the Risk Management Divisions for customer segments and the features of products.
The Wholesale Banking and Companies Risks Area views customers on a global basis (governments, large corporations, multinational financial groups), as well as the segment of portfolio companies.
There is a pre-classification model for large corporations, based on a system of measurement and monitoring of economic capital, which allows us to set a maximum internal risk limit for the corporation. The treatment of financial institutions has been specialized and technical monitoring of structured finance has been optimized.
162
The Wholesale Banking and Companies Risks Area has strengthened the identification of business opportunities in order to improve business issues by setting common business-risk goals, in line with the strategy for supporting business areas.
For its part, the more streamlined pre-classification model established for this segment, aimed at those companies which meet certain requirements (high knowledge, rating, etc.), confirmed its positive contribution to the improved efficiency of admission circuits.
The Standardized Risks Area deals with retail clients (small companies, businesses and individuals). They are managed on a decentralized basis, following policies and measures that are designed centrally, and is supported by automatic systems for valuation and decision-taking that produce effective risk management which is also efficient in terms of resources.
Valuation Tools
|
| Management |
| Valuation tool |
| Analysis criterion |
|
|
|
| |||
Governments, financial institutions and global corporates |
| Centralised Group |
| Rating |
| 100% view of analyst |
Local corporations |
| Centralised entity |
| Rating |
| 100% view of analyst |
Companies |
| Decentralised |
| Scoring |
| Automatic valuation (quantitative areas) + |
Micro companies and businesses |
| Decentralised |
| Scoring |
| Automatic valuation |
Individuals |
| Decentralised |
| Scoring |
| Automatic valuation |
3.2 Rating tools
Since 1993 we have been using our own models for assigning solvency and internal ratings. These models aim to measure the degree of risk of a client or transaction. Each rating corresponds to a certain probability of default or non-payment, based upon the Bank’s prior experience. We use more than 140 internal rating models for risk admission and monitoring.
In the case of corporate and company risks, the process for assigning ratings varies according to the segment. The weight of the view of the analyst is greater in the case of large clients, which involve more complex analysis, while the rating of clients and operations in retail segments is based more on pre-established rules of valuation where a more computerized treatment can be used. The process of assessment varies depending on the business sector (financial institutions, public institutions, industrial companies, real estate development, etc.).
During the tracking phase the ratings are reviewed at least once a year, and new financial information and experience gained over the course of the banking relationship are taken into account. The regularity of the reviews increases in the case of clients who reach certain levels in the automatic warning systems and in those classified as special watch.
In the case of standardized risks (retail), both for transactions with companies (micro firms, businesses) as well as individuals, different automatic systems (scoring models) are applied on the basis of the segment, product and channel (for example, mortgages via branches, consumer loans via agents, loans to businesses, etc.). We have used our own automatic scoring models for operations with individuals since 1994. These admission systems for new operations are complemented by performance assessment models which are very predictive, on the basis of the available information in the Group on the performance of clients in their banking relationship (balances maintained, movements, fulfillment of quotas, etc.).
Each of the yield curves of the charts below reflects the non-performing loans of operations with individuals granted in the parent Bank in Spain every year (“vintages”) until maturity. The age of this base enables us to simulate future performances.
163
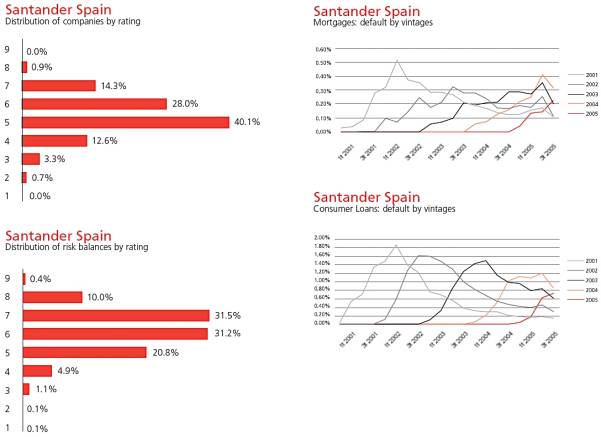
3.3 Master Ratings Scale
In order to make the internal ratings of the various models -corporate, sovereign, financial institutions, etc. -comparable and so as to be able to make comparisons with the ratings of external rating agencies, we have a Master Ratings Scale.
The comparisons are established via the probability of default associated with each rating. These internally estimated probabilities are compared with the rates of default associated with external ratings, which are periodically published by rating agencies.
For reasons of comparison, the definition of default used for internal measurements for the purposes of the Master Scale is not based on 90 days of non payment but on the entry into dispute, as this definition is closer to the concept of default utilized by external rating agencies. However, for the purposes of economic and regulatory capital (BIS II), the definition of default used internally is 90 days.
Master Ratings Scale
Internal |
| Probability of |
| Standard |
| Moody’s |
|
|
|
|
| ||||
9.3 |
| 0.017% |
| AAA |
| Aaa |
|
9.2 |
| 0.018% |
| AA+ |
| Aa1 |
|
9.0 |
| 0.022% |
| AA |
| Aa2 |
|
8.5 |
| 0.035% |
| AA- |
| Aa3 |
|
8.0 |
| 0.06% |
| A+ |
| Al |
|
7.5 |
| 0.09% |
| A |
| A2 |
|
7.0 |
| 0.14% |
| A- |
| A3 |
|
6.5 |
| 0.23% |
| BBB+ |
| Baa1 |
|
6.0 |
| 0.36% |
| BBB |
| Baa2 |
|
5.5 |
| 0.57% |
| BBB- |
| Baa3 |
|
5.0 |
| 0.92% |
| BB+ |
| Ba1 |
|
4.5 |
| 1.46% |
| BB |
| Ba2 |
|
4.0 |
| 2.33% |
| BB/BB- |
| Ba2/Ba3 |
|
3.5 |
| 3.71% |
| BB-/B+ |
| Ba3/B1 |
|
3.0 |
| 5.92% |
| B+/B |
| B1/B2 |
|
2.5 |
| 9.44% |
| B |
| B2 |
|
2.0 |
| 15.05% |
| B- |
| B3 |
|
1.5 |
| 24.00% |
| CCC |
| Caa1 |
|
1.0 |
| 38.26% |
| CC/C |
| Caa1/Caa2 |
|
164
3.4 Concept of expected loss
In addition to an assessment of the client, our analysis of potential transactions includes a review of factors such as the maturity, the type of product and the collateral that exists, each of which is reflected in the initial rating. As a result, not only is the probability of default (PD) taken into account, but also the exposure at default (EaD) and the loss given default (LGD).
By estimating these three factors the expected loss of each operation can be calculated. Its correct calculation is very important so that the price adequately reflects the resulting risk premium, and the expected loss is reflected as one more cost of the activity.
The charts below reflect data on non-performing loans in Spain, including the distribution of delinquent consumer and mortgage loans since 2001, according to the percentage of recoveries and after deducting all costs incurred in recovery.
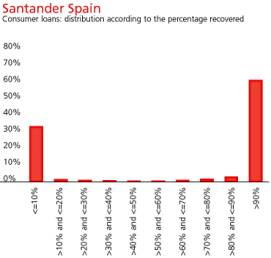 | 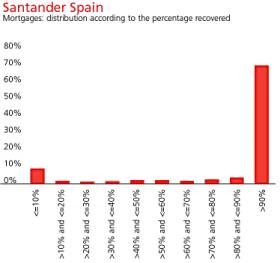 |
In the international sphere, the new Basle Capital Accord (BIS II) uses the concept of expected loss in order to determine the minimum levels of regulatory capital based on internal ratings. Our long experience in the use of internal rating models and measurement of expected loss puts us in a prime position to take advantage of the possibilities of these new regulatory frameworks.
3.5 Measurements of expected loss and economic capital by credit risk
Our expected credit risk loss, at the end of 2005, was 0.39% of the credit exposure, measured in terms of adjusted exposure (EaD). The economic capital by credit risk, in turn, represented 3.1% of this exposure. The distribution of the expected loss by areas is shown below:
Segment |
| Expected |
| Capital by |
|
|
|
| |||
Santander Network-Spain |
| 0.53 |
| 3.0 |
|
Banesto |
| 0.21 |
| 3.0 |
|
Abbey |
| 0.14 |
| 1.2 |
|
Portugal |
| 0.36 |
| 3.6 |
|
Consumer loans Europe |
| 1.18 |
| 3.2 |
|
Latin America |
| 1.02 |
| 7.2 |
|
Global Wholesale* |
| 0.22 |
| 5.9 |
|
Santander Group |
| 0.39 |
| 3.1 |
|
* Transversal measurement: some clients of Global Wholesale Banking are in other segments of the portfolio.
165
3.6 | Test of reasonableness in expected loss of the parent Bank |
To test the calculation model for the expected loss of the parent Bank in Spain, the following table compares the specific provisions, net of recoveries, allocated on the average portfolio of customers with the estimated expected loss.
Net loan-loss provisions and expected loss: Parent bank - Spain (% of average risk)
|
|
|
|
|
|
|
|
|
|
|
|
|
|
|
|
|
|
|
|
|
|
|
| Average |
|
|
|
|
|
|
|
|
|
|
|
|
|
|
|
|
|
|
|
|
|
|
|
|
| 95-05 |
| adjusted |
| Expected |
|
1995 |
| 1996 |
| 1997 |
| 1998 |
| 1999 |
| 2000 |
| 2001 |
| 2002 |
| 2003 |
| 2004 |
| 2005 |
| average |
| to the cicle |
| loss |
|
|
|
|
|
|
|
|
|
|
|
|
|
|
| ||||||||||||||
0.90% |
| 0.53 | % | 0.40 | % | 0.12 | % | 0.07 | % | 0.11 | % | 0.21 | % | 0.27 | % | 0.19 | % | 0.16 | % | 0.02 | % | 0.27 | % | 0.39 | % | 0.45 | % |
Loan-loss provisions fell substantially during 1995-99, grew in the subsequent years as a result of the slowdown in the Spanish economy, reflecting their cyclical nature, and declined again in 2003. The average losses must be adjusted to the effect of the economic cycle. The average of 0.39% adjusted in terms of the cycle is close to the 0.45% envisaged in the internal model in the case of the parent Bank.
3.7 | Measurements of cost of credit (observed loss) |
The following charts show the cost of credit risk at Grupo Santander and its main business areas during 2005 and its comparison with previous years, measured through different approaches.
The cost of credit for the Group has been falling significantly over the years in terms of specific allocations and net write-offs. In terms of net entries, the appreciation of Latin American currencies against the euro resulted in 2005 in an increase of this magnitude both in Latin America and the Group.
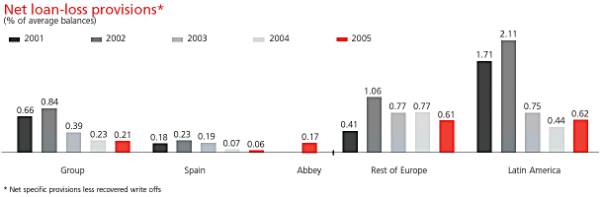
166
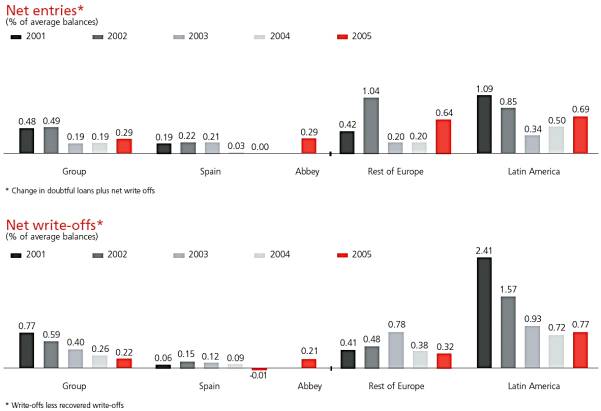
167
3.8 Quantifying the risk premium
Our risk policy focuses on maintaining a medium-low and predictable risk profile, both in credit risk and market risk.
In credit risk this qualitative objective can be quantified in terms of expected loss. The expected loss (cost of credit or risk premium) target for business in Spain must not exceed 0.40% of the outstanding balance of risk, while for the Group as a whole it must not be more than 0.75% (1% before the acquisition of Abbey).
3.9 Concept of economic capital. RORAC methodology
Credit losses revolve around expected loss and can be lower or higher. While the purpose of provisions is to cover expected losses, institutions endow themselves with capital to cover the contingency of higher than expected credit losses. The provisions for expected losses should be considered as one more cost of the operations, affecting all of them - bad debts and good ones. The margin of operations must be sufficient to cover this cost (i.e. to absorb the expected loss and also obtain additional profits). For its part, the economic capital must be adequate to cover the unexpected losses, ensuring the continuity of business.
Conceptually, economic capital cannot cover with 100% probability all the losses that eventually could occur. The maximum loss, in credit risk, will be produced if all the assets are in default at the same time and nothing is recovered. Such an event, highly unlikely, is not fully covered by the economic capital, which nevertheless is allocated to cover very high losses, most unlikely but susceptible of threatening continued activity.
We must decide the level of losses we want to cover with economic capital (the level of confidence with which we want to ensure the continuation of our business). In our case, this confidence level is 99.97%, higher than the 99.90% assumed by the regulatory capital formulas proposed in the New Basle Capital Accord. The difference between both levels means assuming a default probability for the Group of 0.03% instead of 0.1%, three times lower (i.e. three times better) than the proposal of BIS II.
In terms of external rating, a confidence level of 99.97% requires having sufficient capital to be rated AA, while 99.90% would only allow a rating of A-, given the higher probability of default associated.
Traditionally, the concept of economic capital has been contrasted with that of regulatory capital.
The RORAC methodology enables an analysis of whether the return on a transaction covers the risk cost - expected loss - and the cost of the capital invested by an institution in the transaction.
In order to provide an adequate return, the minimum return on capital which a transaction must obtain is determined by the cost of capital. If an operation or portfolio obtains a positive return on capital, it is contributing to our profits, but does not enhance shareholder value if the rate of return does not cover the cost of capital.
We regularly review our cost of capital estimates, which is the minimum remuneration required by our shareholders. The cost of capital can be calculated objectively by adding to the risk-free rate of return the premium that shareholders require to invest in our Group. This premium depends essentially on the higher or lower volatility of our share price in relation to the market’s performance. The cost of capital calculated for 2006 is 8.6%.
In 2005, all our main business units registered a RORAC well above the cost of capital.
RORAC methodology enables the return on operations, clients, portfolios and businesses to be made on a homogeneous basis, identifying those that obtain a risk adjusted return higher than the cost of our capital, and so aligning risk and business management with the overall objective of maximizing the creation of value.
We have been using RORAC methodology in our credit risk management since 1993, with the following purposes:
• | To analyze and set prices during the decision-making process for operations (admission) and clients (monitoring). |
• | To estimate the capital consumption of each client, portfolio or business segment, in order to facilitate the optimal allocation of economic capital. |
• | To calculate the level of provisions that correspond to average expected losses. |
168
3.10 Internal systems of risk
One of the main objectives of the New Basle Accord is to foster the adoption of rigorous risk management practices in the banking sector and Grupo Santander is at the forefront of these practices.
For example, in 1999, when the Bank of Spain introduced statistical or anti-cyclical provisions which anticipated the rules and discipline of BIS II, we were the pioneer among large Spanish banks in requesting and obtaining recognition of its internal credit models. These models incorporated quantitative and qualitative requirements similar to those established for the Internal Rating Based (IRB) focuses of BIS II.
This validation by the Bank of Spain of our models has been very fruitful, enabling us to anticipate with a high degree of accuracy and security what will shortly be the internal models of BIS II, facilitating and ensuring a transition that, in other circumstances, might be very difficult and complex.
Our experience in this field has also confirmed the usefulness and necessity of independent functions of control and validation, within the structure of Risks, which we have applied in line with the New Capital Accord (BIS II).
As a continuation of this policy, we requested recognition from the Bank of Spain of its new internal model for calculating coverage as referred to in Circular 4/2004.
3.11 New Capital Accord (BIS II)
We have been firmly committed to the principles behind the Revised Framework of International Convergence of Capital Measurement and Capital Standards (Basle II), and we are involved in different forums on the issue, both Spanish and international. We have also actively communicated with the regulatory and supervisory authorities in different countries, contributing constructively to improving those technical aspects that could be asymmetric, unfavorable or far from the main objectives of the Basle II agreement.
We recently completed our participation in the fifth Quantitative Impact Study (QIS 5), and have been selected for and have taken part in all such studies since 2001.
The aim of these studies was the simultaneous calculation of the regulatory capital (consolidated and by credit, market and operational risk) in accordance with the current accord (BIS I) and all the focuses of BIS II, from the simplest to the most complex.
Although our participation in these studies involved a great effort, they constituted a means to help the authorities in order to change undesired effects of BIS II and confirm others and they allowed us to evaluate the impact of the new rules by unit, classes of risk, etc.
On the basis of the estimates made for the whole Group, using data through June 2005, we can conclude that, according to the table below, the impact on minimum regulatory capital of the new Accord (Pillar 1) will be slightly favorable in its current state, even after incorporating the new requirements for operational risk and applying scenarios of greater tension to recovery data (downturn LGD), in accordance with the latest requirements.
Estimate of Regulatory Capital BIS II (QIS 5)
EUR million
Minimum regulatory |
| BIS I |
| Standard |
| Advanced |
| IRB |
|
|
|
|
|
| |||||
Credit risk |
| 27,918 |
| 25,134 |
| 21,098 |
| (24.4 | ) |
Market risk1 |
| 3,033 |
| 3,033 |
| 3,033 |
| 0.0 |
|
Operational risk |
| 0 |
| 2,661 |
| 2,2202 |
|
|
|
|
|
|
|
|
| ||||
Total |
| 30,951 |
| 30,828 |
| 26,351 |
| (14.9 | ) |
|
|
|
|
|
|
(1) Market risk under BIS I regulatory coefficient methodology.
(2) Operational risk under standardised BIS approach.
At the same time, we stated our desire to aspire for formal recognition of our internal risk models, in accordance with the requirements of BIS II.
169
We launched a corporate project whose objectives include:
• | Development of Master Plans adapted to the needs of specific units. |
• | Adjustments and updates adapted to Basle II in admission tools. |
• | Appointment of local risk controllers in each country/unit, in full coordination with local organizations. |
• | Identification of information requirements in applications and systems, both current and future, and storage of current information, ensuring maintenance and availability. |
• | Teams of operational risk coordinators in each unit or country. |
Additionally, we have been supplying the supervisory authorities with as many clarifications and documentation on systems, processes, projects underway, etc. as have been requested.
In accordance with the demanding process established by the Bank of Spain (July 29, 2005), Grupo Santander formally adhered to the process of recognition of its internal risk models, in line with the requirements established in BIS II (IRB focus).
This process involves a series of commitments by the Group, including:
• | Dedicating the necessary human and technological resources to ensure the process is completed. |
• | Participating in parallel calculations of capital. |
• | Satisfying as many requirements as are formulated by the supervisory authorities and resolve identified shortcomings. |
• | Make the improvements which are identified and provide, in advance, extensive information which enables the degree of compliance with the requirements established to be diagnosed. |
The drawing up, compilation and integration of all necessary information in order to comply with the requirements of the supervisor, and maintenance of this information in the IRB Notebooks. These documents are structured into nine large chapters, with the following contents:
• | Categorization of exposures. |
• | Adopting the IRB focus in various classes of segments (roll-out). |
• | Estimating the minimum regulatory capital requirements. |
• | Techniques for mitigating risk. |
• | Exposures to sovereigns, financial institutions and companies. |
• | Retail exposures. |
• | Equities. |
• | Treatment of the collection rights acquired. |
• | Treatment of the securitization processes. |
The appendix of these notebooks must contain the internal and external auditing reports, which must be regularly updated.
The scope of this work requires a notebook for each institution that aspires for IRB focus, which in our case means 11 notebooks. As of December 31, 2005, four had been delivered to the Bank of Spain. The rest are gradually being prepared and should be completed by June 30, 2006.
In accordance with the roll-out presented to the supervisory bodies and based on current exposure figures, we could place in internal IRB models 76.7% of our EaD at January 1, 2008 and the rest as follows:
|
| Accumulated EaD |
|
|
|
| |
2008 |
| 76.7 | % |
2009 |
| 79.1 | % |
2010 |
| 88.9 | % |
2012 |
| 90.6 | % |
2013 |
| 94.7 | % |
2014 |
| 95.2 | % |
The co-ordination of these calendars takes into account the requirements of local regulators.
170
Of note among the various tasks to be carried out during this period are those relating to the function of internal validation which will affect approximately 150 models. This task, being completed by the independent unit of Internal Control and Integral Valuation, part of the Risks Division, will be carried out in accordance with the rules of the BIS II Accord, the working documents of the Committee, the European Directive and in the rules of Committee of European Banking Supervisors. In accordance with this, the scope of the validation covers the following dimensions:
• | Procedural (processes and procedures) |
• | Qualitative (features of models and methodologies for estimating) |
• | Quantitative (statistical tests) |
• | Technological (solutions adopted) |
In order to guarantee the execution and appropriate co-ordination of the different tasks undertaken in the sphere of this corporate project, a Corporate Supervision Committee was established, chaired by the third Vice-Chairman, responsible for Grupo Santander’s Risks. Its mission is to supervise the launch of the project’s sub-processes and main activities. It also controls their compliance, assigns responsibilities, approves the budgets and controls their execution, as well as assuming the Group’s institutional representation for these purposes. For its operational functioning, this structure is completed with a Corporate Technical Committee and respective Local Technical Committees (one for each country/unit) whose responsibility is to carry out the project’s plans in its respective sphere, in accordance with the indications and objectives.
Technology in the Basle II Project
Regarding the technological environment, the Basle II Corporate Project is supported by our IT platforms in each country or region. These platforms incorporate new applications for extracting and capturing data from the applications. In addition, a Basle II Platform has been designed and put into effect, consisting of a repository of local data (local data mart in a corporate definition), a global repository in the parent Bank, which groups together all the necessary information for consolidation (consolidated data mart) and an infrastructure application for estimating parameters (EaD, PD, LGD) and calculating Basle II capital (calculation motor), with the corresponding information management tool.
The design of the various local data marts is the same for the entire Group. All of them have a specific part of each institution for storing all the information requirements of each installation, as well as for meeting local regulations.
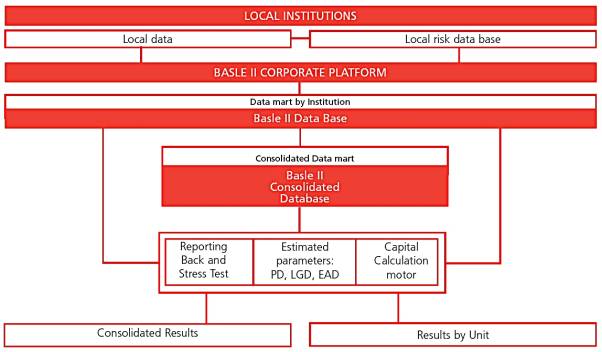
171
3.12 Control and monitoring systems
A solid control environment is necessary to ensure appropriate management of credit risk and maintain a risk profile within the parameters set by the Board and by senior management. At the same time, from the regulatory standpoint (Sarbanes-Oxley, BIS II), financial institutions are required to have a control system that is adequate for the dimension and complexity of each organization.
During 2005, within the corporate framework established in the Group for complying with the Sarbanes-Oxley Act, the Risks Division documented all the relevant sub-processes in the parent Bank (58 in total) regarding:
• | Approving new risk products. |
• | Studing and classify risk. |
• | Determining the economic provisions. |
• | Determining market data. |
• | Approving and validate risk methodologies. |
• | Generating information on risks. |
This task required the incorporation of additional elements of control and discipline to already existing processes.
Within the Risks Division, and with the independence from the business areas that characterizes its system for risk management, decision-making in the admission phase is subject to a system of powers delegated by the Board’s Risk Committee. Decisions made in the admission phase are always collective.
In order to control credit quality, as well as perform the tasks conducted by the Internal Auditing Division, the Directorate General of Risks has a specific function to monitor risks, for which resources and executives are identified. This function is based on permanent attention to ensure there is a timely reimbursement of operations and anticipating circumstances that could affect its normal development.
We have a system called Companies in Special Watch (FEVE) which identifies four levels on the basis of the degree of concern arising from the negative circumstances (extinguish, secure, reduce, track). The inclusion in these levels means automatically reducing the delegated powers. Clients in FEVE are reviewed at least every six months, and every quarter for the most serious cases. A company can end up in special watch as a result of monitoring, a change in the rating assigned, a review conducted by internal auditing or automatic warnings.
Ratings are reviewed at least every year, but if weaknesses are detected or on the basis of the rating it is done more regularly.
The control and monitoring units of the General Directorate of Risks also conduct control and monitoring tasks. Their main functions are to obtain a global view of risk, analyze possible future scenarios and undertake a global treatment of information for management, as well as to promote and continue common risk policies and their impact on the Group, ensuring compliance with local and Spanish legislation.
The General Directorate of Integral Management and Internal Valuation of Risk, under the principles of organic and functional independence for management of risk admission as required by the New Basle Accord, controls and monitors the internal credit risk models.
The recognition by the regulatory authorities of internal credit risk management models is a further guarantee of the degree of internal control, as it is a requirement for the validation of these models.
Ratings of risk balances according to the FEVE monitoring system
|
| Extinguish |
| Secure |
| Reduce |
| Track |
| Total |
|
|
|
|
|
|
|
| |||||
Spain- parent bank |
| 287 |
| 78 |
| 1,575 |
| 7,243 |
| 9,183 |
|
Portugal |
| 214 |
| 85 |
| 231 |
| 1,056 |
| 1,586 |
|
Latin America |
| 332 |
| 7 |
| 474 |
| 2,509 |
| 3,321 |
|
in millions of euros at December 2005
172
3.13. Performance of the main magnitudes in 2005
The Group’s ratio of non-performing loans (NPLs) and that of our main business areas continued to decline in 2005. Our NPL ratio at the end of 2005 was 0.89%, down from 1.00% a year earlier. NPL coverage rose by more than 16 points to 182.0%.
The specific loan-loss provisions in 2005, net of recovered write-offs, amounted to EUR 970 million, 0.21% of the credit exposure to customers (year’s average lending plus guarantees) compared with 0.23% at the end of 2004.
Our NPL ratio in Spain declined to a record low of 0.57%, while coverage was 55 points higher at a robust 317.9%.
Portugal’s NPL ratio was 0.78%, 28 basis points lower than at the end of 2004 despite a still weak economic context. Coverage was 243.2%, 49 points higher than at the end of 2004.
Abbey’s NPL ratio, meanwhile, was 0.67% at the end of 2005. Coverage was 77.7%.
The NPL ratio of Santander Consumer Finance rose by 12 basis points to 2.40%, due to a rise in doubtful balances in Germany in a still unfavorable economic environment. The financial margin of business, however, mostly retail, continued to comfortably offset the NPLs, confirming the favorable risk adjusted return of this portfolio. Coverage was virtually unchanged at 125.2%.
Latin America’s NPL ratio fell by more than a point to 1.91%, while coverage rose 28 points to 183.4%. The decline of more than 10 points in Argentina’s NPL ratio to 1.48% was particularly significant.
Investment grade rated countries (Mexico, Chile and Puerto Rico) accounted for 63% of the region’s credit risk with customers.
Specific loan-loss provisions in Latin America, net of recovered write-offs, amounted to EUR 315.6 million, 0.62% of the portfolio compared with EUR 155.9 million and 0.41%, respectively, in 2004. This increase was largely due to the strong appreciation of Latin American currencies against the euro and the return of the cost of credit to more normal rates, although still below the average of the last few years.
Our risk management in Latin America shares the common corporate culture. The principles that are the hallmark of the parent Bank are applied in the region. The organization of the risks function in each Latin American bank is the same as in Spain, with the necessary adjustments for the local markets.
Latin America: Risk, NPL Ratio and Coverage
|
| Risk (million euros) |
| NPL ratio (%) |
| Coverage (%) |
| ||||||
|
|
|
|
| |||||||||
|
| Dec-05 |
| Dec-04 |
| Dec-05 |
| Dec-04 |
| Dec-05 |
| Dec-04 |
|
|
|
|
| �� |
|
|
| ||||||
Argentina |
| 2,201 |
| 1,928 |
| 1.48 |
| 11.71 |
| 245.1 |
| 130.3 |
|
Brazil |
| 13,570 |
| 7,109 |
| 2.88 |
| 2.85 |
| 138.5 |
| 188.2 |
|
Colombia |
| 1,174 |
| 885 |
| 0.68 |
| 0.39 |
| 414.5 |
| 884.1 |
|
Chile |
| 16,975 |
| 11,555 |
| 2.31 |
| 3.53 |
| 165.6 |
| 126.8 |
|
Mexico |
| 14,052 |
| 10,518 |
| 0.89 |
| 1.28 |
| 273.4 |
| 213.5 |
|
Puerto Rico |
| 5,399 |
| 4,282 |
| 1.75 |
| 2.39 |
| 167.6 |
| 129.2 |
|
Venezuela |
| 2,319 |
| 1,549 |
| 1.52 |
| 2.65 |
| 399.9 |
| 271.9 |
|
Rest |
| 2,167 |
| 1,803 |
| 1.25 |
| 2.53 |
| 304.2 |
| 107.7 |
|
Total |
| 57,856 |
| 39,627 |
| 1.91 |
| 2.94 |
| 183.4 |
| 155.0 |
|
173
Latin America: Cost of credit.
2005 million euros
| Net specific |
| Write-off |
| Cost of |
| % |
| |
|
|
|
|
| |||||
Argentina |
| (9.7 | ) | 20.9 |
| (30.6 | ) | (1.50 | ) |
Brazil |
| 291.1 |
| 56.8 |
| 234.3 |
| 2.12 |
|
Chile |
| 159.8 |
| 66.4 |
| 93.4 |
| 0.64 |
|
Colombia |
| 10.5 |
| 2.6 |
| 7.9 |
| 0.74 |
|
Mexico |
| 45.1 |
| 38.5 |
| 6.6 |
| 0.05 |
|
Puerto Rico |
| 11.9 |
| 4.1 |
| 7.8 |
| 0.15 |
|
Venezuela |
| 19.3 |
| 7.3 |
| 12.0 |
| 0.63 |
|
Rest |
| (10.3 | ) | 5.5 |
| (15.8 | ) | (0.83 | ) |
Latin America |
| 517.7 |
| 202.1 |
| 315.6 |
| 0.62 |
|
3.14. Risk concentration
Risk concentration, within the sphere of credit risk, is a fundamental element of management. We continuously track the degree of concentration of our credit risk portfolios using various criteria including geographic areas and by countries, economic sectors, products and groups of clients.
The Risk Committee of the Board of Directors establishes the policies and reviews the appropriate exposure limits for adequate management of the degree of concentration of credit risk portfolios.
Our geographic diversification, accentuated after Abbey’s incorporation in December 2004, enables a profit in the aggregate economic capital of around 28%. In other words, our global risk profile, measured in terms of economic capital, declines with geographic diversification as it is 28% lower than the sum of the different units considered on their own.
No sector accounts for more than 10% of the total exposure, as shown in the table below.
We are subject to the Bank of Spain regulation on “large risks” (those that exceed 10% of eligible shareholders’ equity). In accordance with Circular 5/93, no individual exposure, including all types of credit risks and equities, can exceed 25% of our shareholders’ equity. Also, the total of “large risks” cannot be more than eight times higher than equity (excluding exposures to OECD governments).
At the end of 2005, the 20 largest economic and financial groups, excluding public and lending entities, represented 5.1% of the outstanding credit risk of our clients (lending plus guarantees), down from 9.7% in 2004, a low degree of risk concentration.
Within the framework of the IFR model for the measurement and aggregation of economic capital, particular importance is attached to the risk of concentration risk by wholesale portfolios (large companies, counterparty and sovereign risks). For this purpose we use as an additional reference the portfolio model of Moody’s-KMV which is widely used by other banks.
Our Risks Division works closely with the Financial Management Division to actively manage credit portfolios. Its activities include reducing the concentration of exposures through various techniques such as using credit derivatives and securitization in order to optimize the risk-return relation of the whole portfolio.
174
Contribution by sector to total risk
|
| Spain |
| Portugal |
| Latam |
| Abbey |
| Rest |
| Total |
|
|
|
|
|
|
|
|
| ||||||
Agriculture |
| 0.6 |
| 0.0 |
| 0.0 |
| 0.0 |
| 0.0 |
| 0.6 |
|
Manufacturing |
| 4.6 |
| 0.4 |
| 2.7 |
| 0.0 |
| 1.4 |
| 9.1 |
|
Energy |
| 1.2 |
| 0.2 |
| 0.3 |
| 0.0 |
| 0.1 |
| 1.8 |
|
Construction |
| 2.9 |
| 0.4 |
| 0.7 |
| 0.0 |
| 0.1 |
| 4.1 |
|
Distribution |
| 2.8 |
| 0.3 |
| 1.0 |
| 0.0 |
| 0.2 |
| 4.4 |
|
Hotel |
| 0.8 |
| 0.0 |
| 0.1 |
| 0.0 |
| 0.0 |
| 0.9 |
|
Transport |
| 1.0 |
| 0.3 |
| 0.2 |
| 0.0 |
| 0.1 |
| 1.6 |
|
Telecommunications |
| 0.7 |
| 0.2 |
| 0.4 |
| 0.0 |
| 0.3 |
| 1.6 |
|
Financial intermediaries |
| 1.0 |
| 0.5 |
| 0.4 |
| 0.0 |
| 1.0 |
| 2.9 |
|
Insurance |
| 0.1 |
| 0.0 |
| 0.1 |
| 0.0 |
| 0.6 |
| 0.7 |
|
Real estate |
| 6.1 |
| 0.2 |
| 0.2 |
| 2.2 |
| 0.0 |
| 8.7 |
|
Services |
| 3.1 |
| 0.3 |
| 2.3 |
| 0.0 |
| 0.0 |
| 5.8 |
|
Public Administration |
| 1.1 |
| 0.2 |
| 0.5 |
| 0.0 |
| 0.0 |
| 1.8 |
|
Physical persons without economic activity |
| 11.9 |
| 1.7 |
| 2.1 |
| 28.0 |
| 0.0 |
| 43.7 |
|
Other/unclassified |
| 2.6 |
| 1.0 |
| 0.4 |
| 7.0 |
| 1.3 |
| 12.3 |
|
|
|
|
|
|
|
|
| ||||||
Total |
| 40.5 |
| 5.7 |
| 11.5 |
| 37.2 |
| 5.1 |
| 100.0 | % |
|
|
|
|
|
|
|
|
% of total risk used (lending + guarantees)
Figures at December 2005.
Note: the manufacturing industries include eight individual sectors
3.15. Country-risk
Country-risk is a credit risk component in all cross-border credit operations. Its main elements are sovereign risk, transfer risk and the risk of sharp fluctuations of local currencies.
Our regulatory country-risk exposure to third parties in emerging countries stood at US$788.1 million at the end of 2005, down from US$1,254.9 million a year earlier. The risk net of write-offs at the end of 2005 was US$418.9 million (US$930.4 million a year earlier).
The change in country-risk exposure was largely due to optimization of cross-border limits, which implies a streamlining of operations that need hedging. This explains the reduction in the risk needing provisions. Brazil continues to account for a large share of total net risk (US$408 million).
Within the year-to-year changes, the capitalization of debt of our Argentine subsidiary and the reclassification of the instruments in the fixed-income portfolio under IFRS were noteworthy.
The principles of country-risk management continued to follow prudent criteria; country-risk is assumed very selectively in operations that are clearly profitable for the Bank and which enhance the global relation with customers.
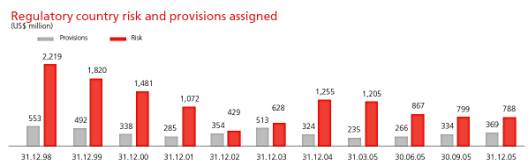
3.16. Environmental risk
Analysis of the environmental risk of credit operations is one of the commitments of the Strategic Plan of Corporate Social Responsibility.
175
Since the beginning of 2004, we have been using an Environmental Risks Valuation System (VIDA), developed in cooperation with the Spanish Export Credit Insurance Company (CESCE) and Garrigues Medioambiental. It evaluates the environmental risk inherent in each company, whether they are current or future clients.
This system gives us an environmental risk map of the portfolio of evaluated companies (very low, low, medium and high) which, if necessary, provides the option of new and more in depth specific reviews.
3.17 Counterparty risk
Counterparty risk is a variant of credit risk. This area includes all types of exposure with credit entities as well as the risk of solvency assumed in treasury operations (bonds and derivatives) with other types of clients.
Control is carried out in real time through an integrated system which provides information on the available credit line of any counterparty, in any product and maturity and at any of our branches.
Risk is measured by its current as well as potential value (the value of the risk positions taking into account the future variation of the underlying market factors in contracts). The Net Replacement Value (NRV) of the portfolios of OTC derivative products that we maintained with our counterparties at December 31, 2005 amounted to EUR 7,071 million (EUR 3,570 million relating to Abbey), 0.43% of the nominal value of these contracts. The Equivalent Credit Risk (that is, the sum of the NRV and the maximum potential value of these contracts in the future) was EUR 26,091 million (EUR 7,247 million relating to Abbey).
Derivatives transactions continued to be carried out with counterparties that enjoy excellent credit quality; 88.2% of counterparty risk has a rating equal to or superior to A-.
20.4% of our counterparty risk is with Spanish counterparties, 17.6% is with UK counterparties (mainly operations from Abbey), 31.2% is with counterparties in the remainder of Europe, 18.2% is with US counterparties and 11.8% is with Latin American counterparties.
Distribution of risk in OTC derivatives by geographical areas
Spain |
| 20.4 | % |
United Kingdom |
| 17.6 | % |
Rest of Europe |
| 31.2 | % |
Latin America |
| 11.8 | % |
U.S. |
| 18.2 | % |
Others |
| 0.8 | % |
|
|
| |
Total |
| 100.00 | % |
|
|
|
Lastly, 76% of our counterparty risk is with banks, 13% is with large corporations and 11% is with SMEs.
176
Notional derivative products by maturity at December 31, 2005
Million euros
|
|
|
|
|
|
|
|
|
| Notional values | ||||
|
|
|
|
|
|
|
|
| ||||||
| < 1 year |
| 1-5 years |
| 5-10 years |
| >10 years |
| Trade |
| Hedge |
| Total | |
|
|
|
|
|
|
|
| |||||||
CDS protection acquired |
| 2,871 |
| 21,573 |
| 3,599 |
| 1,268 |
| 26,898 |
| 2,413 |
| 29,311 |
CDS protection sold |
| 627 |
| 8,486 |
| 2,221 |
| 0 |
| 9,871 |
| 1,462 |
| 11,333 |
CD Swaptions |
| 35 |
| 0 |
| 0 |
| 0 |
| 0 |
| 35 |
| 35 |
|
|
|
|
|
|
|
| |||||||
Total credit derivatives |
| 3,533 |
| 30,058 |
| 5,819 |
| 1,268 |
| 36,769 |
| 3,910 |
| 40,679 |
|
|
|
|
|
|
|
| |||||||
Equity forwards |
| 1,245 |
| 973 |
| 0 |
| 0 |
| 0 |
| 2,218 |
| 2,218 |
Equity options |
| 5,183 |
| 15,238 |
| 5,220 |
| 7,616 |
| 18,691 |
| 14,567 |
| 33,257 |
Equity swaps |
| 1,587 |
| 86 |
| 58 |
| 0 |
| 0 |
| 1,731 |
| 1,731 |
|
|
|
|
|
|
|
| |||||||
Total equity derivatives |
| 8,015 |
| 16,296 |
| 5,278 |
| 7,616 |
| 18,691 |
| 18,515 |
| 37,206 |
|
|
|
|
|
|
|
| |||||||
Fixed-income forwards |
| 3,125 |
| 19 |
| (13 | ) | 1 |
| 1,746 |
| 1,386 |
| 3,131 |
Fixed-income swaps |
| 530 |
| 0 |
| 0 |
| 0 |
| 530 |
| 0 |
| 530 |
|
|
|
|
|
|
|
| |||||||
Total fixed-income derivatives |
| 3,654 |
| 19 |
| (13 | ) | 1 |
| 2,275 |
| 1,386 |
| 3,661 |
|
|
|
|
|
|
|
| |||||||
Exchange-rate swaps |
| 4,029 |
| 9,324 |
| 7,967 |
| 1,853 |
| 3,832 |
| 19,341 |
| 23,173 |
Exchange-rate forwards |
| 65,277 |
| 2,688 |
| 346 |
| 0 |
| 4,828 |
| 63,483 |
| 68,311 |
Exchange-rate options |
| 31,211 |
| 27,669 |
| 2,411 |
| 2,914 |
| 29,542 |
| 34,663 |
| 64,206 |
|
|
|
|
|
|
|
| |||||||
Total exchange-rate derivatives |
| 100,518 |
| 39,681 |
| 10,724 |
| 4,767 |
| 38,203 |
| 117,487 |
| 155,689 |
|
|
|
|
|
|
|
| |||||||
Asset Swaps |
| 330 |
| 412 |
| 610 |
| 859 |
| 652 |
| 1,558 |
| 2,210 |
Call Money Swaps |
| 51,991 |
| 4,483 |
| 2,963 |
| 0 |
| 55,443 |
| 3,994 |
| 59,437 |
IRS | 284,382 | 668,782 | 222,561 | 133,913 | 961,720 |
| 347,919 | 1,309,638 | ||||||
Interest-rate structures |
| 3,813 |
| 16,375 |
| 451 |
| 99 |
| 20,739 |
| 0 |
| 20,739 |
|
|
|
|
|
|
|
| |||||||
Total interest-rate derivatives |
| 340,516 |
| 690,052 |
| 226,585 |
| 134,871 |
| 1,038,554 |
| 353,471 |
| 1,392,025 |
|
|
|
|
|
|
|
| |||||||
Total derivatives |
| 456,236 |
| 776,106 |
| 248,394 |
| 148,523 |
| 1,134,492 |
| 494,768 |
| 1,629,260 |
|
|
|
|
|
|
|
| |||||||
Distribution by net replacement value and credit risk equivalent at December 31, 2005
Million euros
|
| Total NRV |
| Total CRE |
| ||||||||
|
|
|
| ||||||||||
|
| Trade |
| Hedge |
| Total |
| Trade |
| Hedge |
| Total |
|
|
|
|
|
|
|
|
| ||||||
CDS protection acquired |
| (4 | ) | 0 |
| (4 | ) | 176 |
| 45 |
| 221 |
|
CDS protection sold |
| 21 |
| 2 |
| 23 |
| 19 |
| 2 |
| 21 |
|
CD Swaptions |
| 0 |
| 0 |
| 0 |
| 0 |
| 0 |
| 0 |
|
|
|
|
|
|
|
|
| ||||||
Total credit derivatives |
| 17 |
| 2 |
| 19 |
| 195 |
| 47 |
| 242 |
|
|
|
|
|
|
|
|
| ||||||
Equity forwards |
| 0 |
| 0 |
| 0 |
| 0 |
| 375 |
| 375 |
|
Equity options |
| 103 |
| 60 |
| 163 |
| 334 |
| 823 |
| 1,157 |
|
Equity swaps |
| 0 |
| 0 |
| 0 |
| 0 |
| 40 |
| 40 |
|
|
|
|
|
|
|
|
| ||||||
Total equity derivatives |
| 103 |
| 60 |
| 163 |
| 334 |
| 1,239 |
| 1,573 |
|
|
|
|
|
|
|
|
| ||||||
Fixed-income forwards |
| (3 | ) | 1 |
| (3 | ) | 51 |
| 16 |
| 67 |
|
Fixed-income swaps |
| 0 |
| 0 |
| 0 |
| 0 |
| 0 |
| 0 |
|
|
|
|
|
|
|
|
| ||||||
Total fixed-income derivatives |
| (3 | ) | 1 |
| (3 | ) | 51 |
| 16 |
| 67 |
|
|
|
|
|
|
|
|
| ||||||
Exchange-rate swaps |
| 38 |
| 257 |
| 296 |
| 461 |
| 2,367 |
| 2,828 |
|
Exchange-rate forwards |
| 27 |
| 457 |
| 484 |
| 269 |
| 3,256 |
| 3,525 |
|
Exchange-rate options |
| 132 |
| 164 |
| 295 |
| 408 |
| 625 |
| 1,033 |
|
|
|
|
|
|
|
|
| ||||||
Total exchange-rate derivatives |
| 197 |
| 879 |
| 1,075 |
| 1,138 |
| 6,249 |
| 7,386 |
|
|
|
|
|
|
|
|
| ||||||
Asset Swaps |
| 60 |
| 81 |
| 141 |
| 38 |
| 81 |
| 119 |
|
Call Money Swaps |
| 12 |
| 4 |
| 16 |
| 83 |
| 62 |
| 145 |
|
IRS |
| 3,173 |
| 2,250 |
| 5,423 |
| 12,488 |
| 5,801 |
| 18,289 |
|
Interest-rate structures |
| 236 |
| 0 |
| 236 |
| 767 |
| 0 |
| 767 |
|
|
|
|
|
|
|
|
| ||||||
Total interest-rate derivatives |
| 3,482 |
| 2,335 |
| 5,817 |
| 13,375 |
| 5,944 |
| 19,319 |
|
|
|
|
|
|
|
|
| ||||||
Total derivatives |
| 3,795 |
| 3,276 |
| 7,071 |
| 15,092 |
| 13,496 |
| 28,587 |
|
|
|
|
|
|
|
|
| ||||||
Collateral |
| 0 |
| (2,496 | ) | (2,496 | ) | 0 |
| (2,496 | ) | (2,496 | ) |
|
|
|
|
|
|
|
| ||||||
Total |
| 3,795 |
| 780 |
| 4,575 |
| 15,092 |
| 10,999 |
| 26,091 |
|
|
|
|
|
|
|
|
| ||||||
177
Distribution of risk in OTC derivates by counterparty rating
Rating |
| % |
|
|
| ||
AAA |
| 0.6 | % |
AA |
| 55.9 | % |
A |
| 31.8 | % |
BBB |
| 8.6 | % |
BB |
| 3.0 | % |
B |
| 0.1 | % |
Without rating |
| 0.0 | % |
Total |
| 100.0 | % |
4.1 Definition and objectives
We define operational risk as “the risk of losses from defects or failures in its internal processes, employees or systems, or those arising from unforeseen circumstances”. These are purely operational events, which makes them different from market or credit risks. We aim to identify, valuate, mitigate and monitor this risk. Our greatest need, therefore, is to identify and eliminate risk clusters, regardless of whether they produce losses or not. Measurement also helps management as it enables priorities to be established and a hierarchy created for taking decisions.
We have opted, in principle, to use the standardized approach for calculating BIS II regulatory capital by operational risk, but we do not rule out using an internal model in the future. We use the following guidelines:
1. Priority is given to mitigating in daily management operational risk.
2. A large part of the basic foundations of an internal model are already incorporated to the standard model and to Grupo Santander’s management of operational risk.
4.2. Management model
The main principles of the organizational structure are:
| - | The Risks Division is responsible for evaluating and controlling this risk category. |
| - | The Central Unit that supervises operational risks within the Risks Division is responsible for the global corporate program. |
| - | The management structure of operational risk is based on the knowledge and experience of executives and experts in the different areas and units, with particular importance attached to the role of operational risk coordinators, who are the key figures. |
This framework satisfies the qualitative criteria contained in the New Basle Capital Accord (revised BIS II document June 2004), both for standard methods and advanced measurement, as well as in the CEBS document-Expert Group on Capital Requirements - June 2005). Internal Auditing also keeps its independence with regard to management of operational risk, without detriment to reviewing the management structure in this area.
178
We have adopted the framework outlined in the graphic below for the phases of the process for management of operational risk:
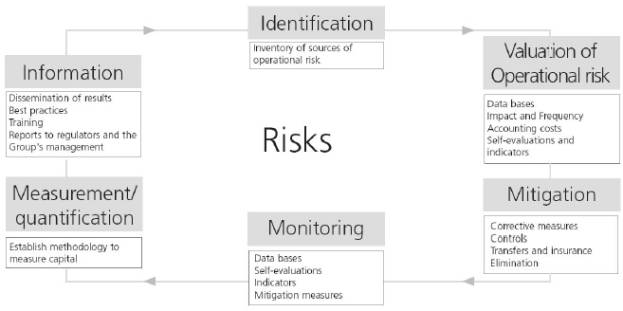
The main advantages of our management structure are:
| • | Integral and effective management of operational risk (identification, evaluation, monitoring, control/mitigation and report). |
| • | Improved knowledge of existing operational risks and the responsibility for them by managers of the business and the support lines. |
| • | Loss data collection enables operational risk to be quantified for calculating both the economic and the regulatory capital. |
| • | Operational risk information helps to improve the processes and controls, reduce losses and the volatility of revenues. |
4.3 Implementing the model: global initiatives and results
The Corporate Department of Management and Control of Operational Risk, part of the Risks Division, has been operating since 2001. Since then, its main functions, activities and global initiatives have included:
| • | Presentations to senior management and development of internal rules. |
| • | Designation of coordinators and the creation of operational risk departments. |
| • | Training and exchange of experiences. |
| • | Designing and implementation of qualitative and quantitative operational risk tools. |
| • | Reconciliation of data bases of losses - accounting. |
| • | Developments for the automatic capturing of events through accounting systems. |
| • | Drive in mitigation plans and communication of best practices. |
| • | Development of the corporate operational risk tool in a web-based environment. |
| • | Cooperation with the procurement area regarding its function in managing banking insurance related to operational risk (BBB policies, damage, civil responsibility and life). |
179
| • | Capital calculation using the standard method and progress in the methodology for the internal model. |
The project began to be installed in our different units in 2002. Almost all our units have been incorporated to the project with a high degree of uniformity. Nonetheless, due to different paces of adoption, stages, schedules and the historical depth of the relevant data bases, the degree of implementation varies from country to country.
On a general basis:
| - | Data bases of losses classified by errors and operational types are received every month. Our data base shows a total of 757,809 events, without exclusions for reasons of amount, and with both the accounting impact (including positive effects) as well as the non-accounting impact. |
| - | Self-evaluation questionnaires filled in by almost all our units are received and analyzed. |
| - | Operational risk indicators are available, regularly defined and updated by the main management units. |
| - | There are always a sufficient number of coordinators in the business and back-up areas. |
| - | The main events are identified and analyzed, and mitigation measures taken which, in significant cases, are disseminated to the Group’s other units as a Best Practices guide. |
| - | Processes to conciliate data bases with accounting. |
Our operational risk “image” is reflected in the following charts:
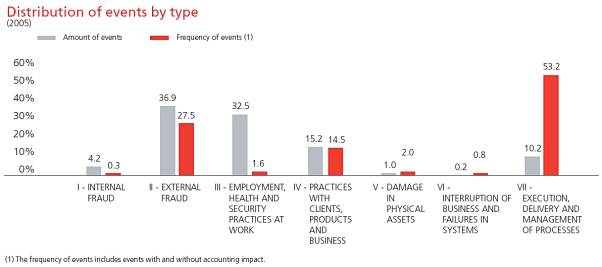
180
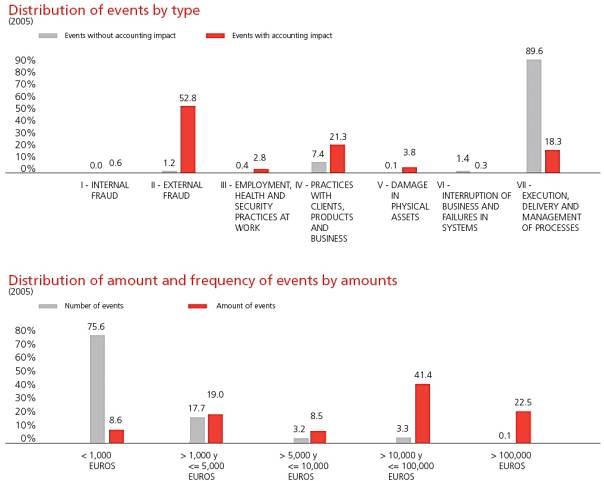
The following is an example of the self-evaluation questionnaires used in Grupo Santander and shows the consolidated results for Banco Santander Totta, S.A.
Santander Totta: Operational Risk Self-assessment Questionnaires
General questions
|
| Average of |
| Average of |
| Average of |
| ||||||||
|
| all areas |
| business areas |
| support areas |
| ||||||||
By category of event |
| Impact |
|
|
| Impact |
|
|
| Impact |
|
|
|
|
|
|
| OR |
| Coverage |
| OR |
| Coverage |
| OR |
| Coverage |
| Total |
|
|
|
|
|
|
|
|
| ||||||||
I- Internal fraud |
| 3.04 |
| 2.36 |
| 3.05 |
| 2.28 |
| 3.04 |
| 2.38 |
| 7 |
|
II-External fraud |
| 2.89 |
| 2.17 |
| 3.00 |
| 2.50 |
| 2.88 |
| 2.11 |
| 6 |
|
III- Employment practices, health and security at work |
| 3.19 |
| 2.50 |
| 3.31 |
| 2.71 |
| 3.12 |
| 2.45 |
| 8 |
|
IV- Practices with clients, products and business |
| 3.61 |
| 2.26 |
| 3.63 |
| 2.50 |
| 3.55 |
| 2.21 |
| 8 |
|
V- Damage to physical assets |
| 3.20 |
| 3.35 |
| 2.63 |
| 3.00 |
| 3.33 |
| 3.42 |
| 11 |
|
VI- Interruption in business and systems failure |
| 3.46 |
| 2.53 |
| 3.30 |
| 2.61 |
| 3.46 |
| 2.51 |
| 9 |
|
VII- Execution, delivery and management of processes |
| 3.21 |
| 2.35 |
| 3.12 |
| 2.41 |
| 3.19 |
| 2.33 |
| 8 |
|
|
|
|
|
|
|
|
| ||||||||
Total average |
| 3.23 |
| 2.50 |
| 3.15 |
| 2.57 |
| 3.22 |
| 2.49 |
| 8 |
|
|
|
|
|
|
|
|
| ||||||||
181
The Corporate Department of Operational Risk developed during 2005 a system for Integral Management of Operational Risk Information, updated every quarter, which consolidates the information available from each country/unit in the operational risk sphere, so that there is an integral vision with the following features:
| • | It provides two levels of information: one corporate and the other individualized for each country/unit. |
| • | It enables, via maintaining a data base of events and mitigating measures, the best practices to be disseminated among countries/Grupo Santander units. |
| This tool collects the following information: |
| • | Our management model for operational risk |
| • | Human resources and perimeter of action |
| • | Analysis of the data base of errors and events |
| • | Self-assessment questionnaires |
| • | Indicators |
| • | Mitigating measures/asset management |
| • | Contingency plans |
| • | Regulatory framework: BIS II |
| • | Insurance |
| • | Other activities of the Operational Risk Department |
| • | Next steps |
This information acts as the base for meeting the reporting needs with senior management (the Board’s Risk Committee, among others), regulators, etc.
4.4 BIS II Project - corporate operational risk tool
Within the general framework of the BIS II Project developed in Grupo Santander, the Operational Risk Department is working, together with Technology, on designing and establishing a corporate operational risk tool which, in an Internet environment, integrates the different management instruments used so far, via local applications, in the different units managing operational risk.
This tool is being developed in various phases and modules, beginning, from the onset, in satisfying the basic management requirements and, then, adding other more advanced functions.
182
The main modules are as follows:
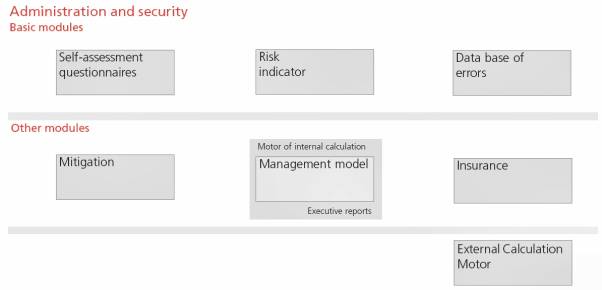
The basic features of each model are as follows:
Database of Events. This is the model with the most advanced development. It is already installed in some of our entities and enables the accounting systems to automatically capture operational risk events (SGO, for entities in the Partenón environment) and manual capturing. It will also enable entities with non-Partenón environment common access via the web.
Self-assessment Questionnaire. This model includes both general and specific questionnaires, as well as different types of qualitative and quantitative questions for evaluating present and future operational risk.
Risk Indicators. This model captures, via automatic or manual feeding, activity and control indicators, all of them managed under a common format.
Mitigation. Its main use is centralized and integrated management of corrective measures. Questions, indicators or events/types of event are captured on the data base which exceed a certain threshold (scores or limits).
Financial Information Management Model. This allows dynamic management of the information model by selecting information, weightings, scenarios, impact of corrective measures.
Insurance. This incorporates basic information related to insurance contracted by each entity, linking it to the data base of events.
We, in all our areas, regard the reputational risk function of our activities as being of the utmost importance. The management of this risk is conducted by:
5.1 Global Committee of New Products
All new products or services that any institution of Grupo Santander wants to market must be submitted to this Committee for approval.
The Committee held 13 meetings in 2005 at which 126 products or families of products were analyzed.
A Local Committee of New Products is established in each country where we have an institution. Once a new product or service is ready, this Committee must request permission from the Global Committee for it to be marketed. In Spain, the Local Committee falls within the Global Committee.
183
The areas that participate in the Global Committee are: Tax Advice, Legal Advice, Customer Service, Internal Auditing, Retail Banking, Global Corporate Banking, International Private Banking, Financial Accounting and Control, Financial Operations and Markets, Operations and Services, Organization, Prevention of Money-laundering, Global Wholesale Banking Risks, Credit Risk, Financial Risks, Operational Risk, Technology, Global Treasury and, lastly, the unit proposing the new product or the Local Committee of New Products.
Before a new product or service is launched, these areas, as well as, where applicable, other independent experts considered necessary in order to correctly evaluate the risks incurred, exhaustively analyze the aspects that could affect the process, stating their opinion on each product or service.
The Global New Products Committee, in the light of the documentation received, and after checking that all the requirements for approving the new product or service have been met and bearing in mind the risk guidelines set by the Board’s Risk Committee approves, rejects or sets conditions for the proposed new product or service.
The Global Committee gives particular consideration to the suitability of the new product or service to the framework where it is going to be marketed. Importance is attached to ensuring that:
| - | Each product or service is sold by those who know how to sell it. |
| - | The client understands the risk of each product or service in which he or she is investing, and this can be accredited with documents. |
| - | Each product or service is sold where permissible, not only with respect to legal or tax reasons (i.e. it is in compliance the legal and tax regime of each country), but also on the basis of the financial culture. |
| - | When a product or service is approved, the maximum limit is set for the amount that can be sold in each country. |
5.2 Manual of Procedures for the Marketing of Financial Products
This manual is used by Santander for the retail marketing of financial products in Spain.
The objective of this manual is to improve the quality of information made available to investors and ensure they understand the features, return and risk of the products.
The manual segments customers into three categories, which initially coincide with those of Private Banking, Personal Banking and Banking for Individuals. Products are also segmented into three categories, green, red and yellow, on the basis of their complexity and the guarantees they provide for recovering capital and obtaining a certain return.
The manual covers financing savings products sold to retail individuals, such as participations in mutual funds and shares in public placements. The Global Committee of New Products can include others in the sphere of the manual. In 2005, Insurance-Investment products were added to the manual.
In 2005, 75 products covered by the manual were submitted for approval. Most of them were mutual funds, but there were also other categories such as warrants, hedging products, preferred shares and public offerings and/or subscription to securities.
Of the 75 products, 25 were new ones submitted to the Global Committee and 50 were not new and were submitted to the Office of the Manual, created to ensure enforcement of the manual and part of the Compliance Management. The 75 products were categorized as follows: 30 were green (40%), 30 yellow (40%) and 15 red (20%). The office reported on all the products approved to the CNMV.
Implementing the manual requires: (i) rigorous use of business documentation and contracts, and (ii) paying attention to the segment to which the customer belongs before offering the product.
5.3 The Board’s Risk Committee
The Risk Committee, which constitutes the highest body responsible for global risk management, evaluates reputational risk as part of its activities.
184
Part 6. Risk training activities
The aims of the Corporate School of Risks are:
| - | Help to consolidate the culture and corporate policies for risks in the Group. |
| - | Ensure the capabilities and development of all staff in risks, with homogeneous criteria. |
| - | Create a pool of risks professionals. |
| - | Enhance leadership and talent management of executives and high potential staff working on our Risks’ Units. |
| - | Ensure alignment of the programmes with the requirements of the risks function and the business goals. |
In 2005, 5,622 employees received 76,626 hours of training.
185
Generally
We are exposed to market risk mainly as a result of the following activities:
| • | Trading in financial instruments, which involves interest rate, foreign exchange rate, equity price and volatility risks. |
| • | Engaging in retail banking activities, which involves interest rate risk since a change in interest rates affects interest income, interest expense and customer behavior. This interest rate risk arises from the gap (maturity and repricing) between assets and liabilities. |
| • | Investing in assets (including subsidiaries) whose returns or accounts are denominated in currencies other than the Euro, which involves foreign exchange rate risk between the Euro and such other currencies. |
| • | Investing in subsidiaries and other companies, which subject us to equity price risk. |
| • | Liquidity risk is embedded in all activities, trading and non-trading. |
Primary Market Risks and How They Arise
The primary market risks to which we are exposed are interest rate risk, foreign exchange rate risk, equity price risk, volatility risk and liquidity risk. We are exposed to interest rate risk whenever there is a mismatch between interest rate sensitive assets and liabilities, subject to any hedging with interest rate swaps or other off-balance sheet derivative instruments. Interest rate risk arises in connection with both our trading and non-trading activities.
We are exposed to foreign exchange rate risk as a result of mismatches between assets and liabilities, and off-balance sheet items denominated in different currencies, either as a result of trading or in the normal course of business. We maintain non-trading open currency positions arising from our investments in overseas subsidiaries, affiliates and their currency funding. The principal non-trading currency exposures are the euro to the US dollar and the euro to the main Latin American currencies. Trading foreign exchange rate open risk is not material compared to non-trading foreign exchange risk.
We are exposed to equity price risk in connection with both our trading and non-trading investments in equity securities.
We are also exposed to liquidity risk. Market depth is the main liquidity driver in our trading portfolio, even though our policy is to trade the most liquid assets. Our liquidity risk also arises in non-trading activity due to the maturity gap between assets and liabilities in the retail banking business.
We use derivatives for both trading and non-trading activities. Trading derivatives are used to eliminate, to reduce or to modify risk in trading portfolios (interest rate, foreign exchange and equity), and to provide financial services to clients. Our principal counterparties for this activity are financial institutions. The principal types of derivatives used are: interest rate swaps, future rate agreements, interest rate options and futures, foreign exchange forwards, foreign exchange futures, foreign exchange options, foreign exchange swaps, cross currency swaps, equity index futures and equity options.
Derivatives are also used in non-trading activity in order to manage the interest rate risk and foreign exchange risk arising from asset and liability management activity. Interest rate and foreign exchange non-optional derivatives are used in non-trading activity.
The Group also has an incipient activity in credit derivatives to diversify its global credit portfolio.
Procedures for Measuring and Managing Market Risk
Our Board, through its Risk Committee, is responsible for establishing our policies, procedures and limits with respect to market risks, including which businesses to enter and maintain. The Committee also monitors our overall performance in light of the risks assumed. Together with the local and global Assets and Liabilities Committees (“ALCO”), each Market Risk Unit measures and monitors our market risks, and provides figures to ALCO to use in managing such risks, as well as liquidity risk.
186
Our market risk policy is to maintain a medium to low risk profile in business units. The risk activity is regulated and controlled through certain policies, documented in our Market and Liquidity Risk Management Policies Manual (as described below), and through a limit structure on our exposure to these market and liquidity risks which includes global limits for the entire Group (total risk limit unit) to specific portfolio limits; in addition, authorized products are listed and reviewed periodically.
These policies, procedures and limits on market risk are applicable to all units, businesses or portfolios susceptible to market risk.
1. Market and Liquidity Risk Management Policies Manual
The Market and Liquidity Risk Management Policies Manual is a compilation of policies that describe the control framework used by our Group to identify, measure and manage market risk exposures inherent to our activities in the financial markets. The Manual is employed for market risk management purposes at all involved levels in the Group and subsidiaries, providing a general and global action framework and establishing risk rules for all levels.
The Manual’s main objective is to describe and report all risk policies and controls that our Board of Directors has established as well as its risk predisposition.
All Group managers must ensure that each business activity is performed in accordance with the policies established in the Manual. The Manual is applied to all business units and activities, directly or indirectly, related to market risk decision-making.
2. Market Risk Management Procedures
All the functions developed by a risk manager are documented and regulated by different procedures, including measurement, control and reporting responsibilities. Internal and external auditors audit the compliance with this internal regulation control in order to ensure that our market risk policies are being followed.
3. Market Risk Limit Structure
The market risk limit structure can be defined as the Board of Director’s risk “appetite” and is managed by the Global Market Risk Function that accounts for all Group business units.
Its main functions are to:
| • | Constrain all market risk within the business management and defined risk strategy. |
| • | Quantify and inform all business units of the risk levels and profiles defined by the Board of Directors in order to avoid non-desired levels or types of risk. |
| • | Maintain risks levels over all businesses in accordance with market and business strategy changes, and which are consistent with the Board of Directors’ positions. |
| • | Allow business units reasonable but sufficient risk-taking flexibility in order to meet established business objectives. |
The Global Market Risk Function defines the limit structure while the Risk Committee reviews and approves it. Business managers then administer their activities within these limits. The limit structure covers both our trading and non-trading portfolios and it includes limits on fixed income instruments, equity securities, foreign exchange and other derivative instruments.
Limits considered to be global limits refer to the business unit level. Local business managers set lower level limits, such as portfolio or trader limits. To date, system restrictions prevent intra-day limits.
Business units must always comply with approved limits. Potential excesses will require a range of actions carried out by the Global Market Risk Function unit including:
| • | Providing risk reducing levels suggestions and controls. These actions are the result of breaking “alarm” limits. |
187
| • | Taking executive actions that require risk takers to close out positions to reduce risk levels. |
Statistical Tools for Measuring and Managing Market Risk
1. Trading activity
The Trading Portfolio is defined as proprietary positions in financial instruments held for resale and/or bought to take advantage of current and/or expected differences between purchase and sale prices. These portfolios also include positions in financial instruments deriving from market-making, sale and brokering activity.
As a result of trading fixed income securities, equity securities and foreign exchange, we are exposed to interest rate, equity price and foreign exchange rate risks. We are also exposed to volatility when derivatives (options) are used.
Market risk arising from proprietary trading and market-making activities is actively managed through the use of cash and derivative financial instruments traded in OTC and organized markets.
Interest rate risk derived from market-making is typically hedged by buying or selling very liquid cash securities such as government bonds, or futures contracts listed in organized markets like Liffe, Eurex, Meff and CBOT.
Foreign exchange rate risk is managed through spot transactions executed in the global foreign exchange inter-bank market, as well as through forward foreign exchange, cross currency swaps and foreign exchange options.
Equity price risk is hedged by buying or selling the underlying individual stocks in the organized equity markets in which they are traded or futures contracts on individual stocks listed in organized markets like Meff and Liffe.
In the case of equity indexes such as S&P 500, Euro STOXX 50, or IBEX 35, the hedging is done through futures contracts listed in the aforementioned organized markets.
Volatility risk arising from market-making in options and option-related products is hedged by, either buying and selling option contracts listed in organized markets like Eurex, Meff, and CBOT, or entering risk reversal transactions in the inter-bank OTC market.
Correlation risk is managed through the use of credit derivatives.
We use Value at Risk (“VaR”) to measure our market risk associated with all our trading activity.
1.1 VaR Model
We use a variety of mathematical and statistical models, including VaR models, historical simulations, stress testing and evaluations of Return on Risk Adjusted Capital (“RORAC”) to measure, monitor, report and manage market risk. We call our VaR figures daily or annual “capital at risk” figures (“DCaR” or “ACaR”), depending on their time horizon, since we use them to allocate economic capital to various activities in order to evaluate the RORAC of such activities.
As calculated by us, DCaR is an estimate of the expected maximum loss in the market value of a given portfolio over a one-day time horizon at a 99% confidence interval. It is the maximum one-day loss that we estimate we would suffer on a given portfolio 99% of the time, subject to certain assumptions and limitations discussed below. Conversely, it is the figure that we would expect to exceed only 1% of the time, or approximately three days per year. DCaR provides a single estimate of market risk that is comparable from one market risk to the other.
The standard methodology used is based on historical simulation (520 days). In order to capture recent market volatility in the model, our DCaR figure is the maximum between the 1% percentile and the 1% weighted percentile of the simulated profit and loss distribution.
We use DCaR estimates to alert senior management whenever the statistically estimated losses in our portfolios exceed prudent levels. Limits on DCaR are used to control exposure on a portfolio-by-portfolio basis. DCaR is also used to calculate the RORAC for a particular activity in order to make risk-adjusted performance evaluations.
188
1.2 Assumptions and Limitations
Our DCaR and VaR methodology should be interpreted in light of the limitations of our model, which include:
| • | A one-day time horizon may not fully capture the market risk of positions that cannot be liquidated or hedged within one day. |
| • | At present, we compute DCaR at the close of business and trading positions may change substantially during the course of the trading day. |
1.3 Scenario Analysis and Calibration Measures
Because of these limitations in DCaR and VaR methodology, in addition to historical simulation, we use stress testing to analyze the impact of extreme market movements and to adopt policies and procedures in an effort to protect our capital and results of operation against such contingencies.
In order to calibrate our VaR model, we use back testing processes. Back testing is a comparative analysis between VaR estimates and the daily clean p&l (theoretical result generated assuming the Mark-to-Market daily variation of the portfolio only considering the movement of the market variables). The purpose of these tests is to verify and measure the precision of the models used to calculate VaR.
The analyses of our back testing comply, at a minimum, with the BIS recommendations regarding the verification of the internal systems used to measure and manage market risks.
2. Non Trading activity
2.1 Foreign Exchange Risk and Equity Price Risk
Due to its nature, changes in strategic positions have to be approved by local/global functions in ALCO committee. Position limits with respect to these investments are established, although they will be measured under VaR and other methods that attempt to implement immediate action plans if a particular loss level is reached.
Our foreign exchange rate risk with respect to our non-trading activity can be either permanent or temporary. The permanent risk reflects the book value of investments net of the initial goodwill, while the temporary risk basically stems from purchase/sale operations made to hedge the exchange rate risk derived from dividend flows and expected results. The exchange rate differences generated for each position are recorded in reserves and in profit and loss account respectively.
In order to manage the exchange rate risk of the book value of permanent investments, our general policy is to finance the investment in local currency, provided there is a deep market which allows it and that the cost of doing so is justified by the expected depreciation. If local markets were not deep enough, our investments in foreign currency would be financed in euros and so would generate an exchange-rate risk. Certain one-off hedges of permanent investments are made when it is believed that a local currency could weaken against the euro more quickly than the market is discounting. In addition, operations are carried out to hedge the currency risk of the Group’s results and dividends in Latin America.
Our equity price risk arises from our portfolio of investments in industrial and strategic shareholdings. However, in the last few years the Group equity price risk has decreased due to divestments in the industrial and strategic equity portfolio.
2.2 Interest Rate Risk
We analyze the sensitivity of net interest revenue and net worth to changes in interest rates. This sensitivity arises from gaps in maturity dates and review of interest rates in the different asset and liability accounts. Certain re-pricing hypotheses are used for products without explicit contractual maturities based on the economic environment (financial and commercial).
We manage investments by determining a target range for each sensitivity and providing the appropriate hedge (mainly with government debt, interest rate swaps and interest rate options) in order to maintain these sensitivities within that range.
The measures used to control interest rate risk are the interest rate gap and the sensitivity of net interest revenue and net worth to changes in interest rates, VaR and analysis of scenarios.
a) Interest rate gap of assets and liabilities
189
The interest rate gap is based on the analysis of the gaps between the maturities of the asset, liability and off-balance sheet items. Gap analysis provides a basic representation of the balance sheet structure and enables concentrations of interest rate risk by maturity to be identified. It is also a useful tool for estimating the possible impact of eventual interest rate movements on net interest revenue and net worth.
b) Net interest revenue sensitivity (NIR)
The sensitivity of net interest revenue measures the change in the short/medium term in the accruals expected over a particular period (12 months), in response to a parallel shift in the yield curve.
c) Net worth sensitivity (MVE)
Net worth sensitivity measures in the long term (the whole life of the operation) the interest risk implicit in net worth (equity) on the basis of the effect that a change in interest rates has on the current values of financial assets and liabilities.
d) Value at Risk (VaR)
The Value at Risk for balance sheet activity is calculated with the same standard as for trading: historic simulation with a confidence level of 99% and a time frame of one day.
e) Analysis of scenarios
Two scenarios for the performance of interest rates are established: maximum volatility and sudden crisis. These scenarios are applied to the balance sheet, obtaining the impact on net worth as well as the projections of net interest revenue for the year.
2.3 Liquidity Risk
Liquidity risk is associated with our capacity to finance our commitments, at reasonable market prices, as well as to carry out our business plans with stable sources of funding. We permanently monitor maximum gap profiles.
We have a diversified portfolio of assets that are liquid or can be made so in the short term. We also have an active presence in a wide and diversified series of financing and securitization markets, limiting our dependence on specific markets and keeping open the capacity of recourse to alternative markets.
The measures used to control liquidity risk are the liquidity gap, liquidity ratio, stress scenarios and contingency plans.
a) Liquidity gap
The liquidity gap provides information on contractual and expected cash inflows and outflows for a certain period of time, for each of the currencies in which we operate. The gap measures the net need or excess of funds at a particular date, and reflects the level of liquidity maintained under normal market conditions.
b) Liquidity ratios
The liquidity coefficient compares liquid assets available for sale (after applying the relevant discounts and adjustments) with total liabilities to be settled, including contingencies. This coefficient shows, for currencies that cannot be consolidated, the level of immediate response of the entity to firm commitments.
c) Analysis of scenarios/Contingency Plan
Our liquidity management focuses on preventing a crisis. Liquidity crises, and their immediate causes, cannot always be predicted. Consequently, our Contingency Plan concentrates on creating models of potential crises by analyzing different scenarios, identifying crisis types, internal and external communications and individual responsibilities.
The Contingency Plan covers the activity of a local unit and of central headquarters. Each local unit must prepare a Plan of Contingency Financing, indicating the amount it would potentially require as aid or financing from headquarters during a crisis. Each unit must inform headquarters (Madrid) of its plan at least every six months so that it can be reviewed and updated. These plans, however, must be updated more frequently if market circumstances make it advisable.
190
Quantitative analysis1
A. Trading activity
Quantitative analysis of daily VaR in 2005
Our risk performance with regard to trading activity in financial markets during 2005, measured by daily Value at Risk “VaRD”, is shown in the following graph.
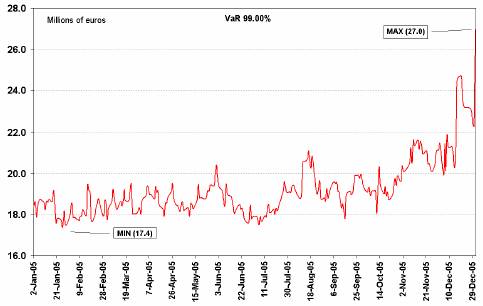
Abbey’s trading portfolio was included in our profile as of the first day of the year. Although Abbey’s trading activity showed an initial risk level of €9.6 million in terms of VaRD, the total VaRD increased by a lesser amount, €4 millions, to €18.3 million, as a result of the diversification effect.
Through 2005, the reported VaRD has been conditioned by the reclassification of portfolios due to accounting changes (IFRS), although this did not imply an effective increase on our total risk. This process was intensified at the end of the year, due to the changes in Mexican (December 19) and Brazilian (December 30) portfolios. These changes involved fixed income derivatives (primarily interest rate swaps), which must be Marked-to-Market under IFRS.
Such movements increased the VaRD performance as compared to that observed over the last few years. Nevertheless, we maintain a low/medium risk profile in relative terms and when compared to other similar financial groups. Dynamic risk management allows changes in strategy to take advantage of opportunities in an environment of uncertainty.
The maximum risk level (€27 million in terms of VaRD) was reached on December 30, 2005 due to the aforementioned portfolio reclassification in Brazil. The minimum level (€17.4 million in terms of VaRD) was reached on January 25, due to the reduction of interest rate positions in Mexico. The annual average risk was €19.3 million in terms of VaRD.
The risk histogram below shows the frequency distribution of average risk in terms of daily VaRD during 2005. It demostrates that for 92.9% of the period regarded the risk levels fluctuated between €18 million and €21.5 million. The days during which VaRD was higher than €23 million are concentrated in December and correspond with the above mentioned portfolio reclassifications in Mexico and Brazil.
1 | All figures in this report are measured in euros. This must be taken into account for comparison purposes (in previous Form 20-Fs, figures were measured in US dollars). The exchange rate used is the one quoted in the market on the reference date. |
191
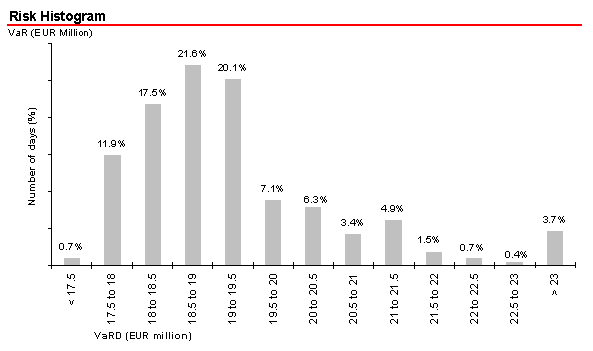
Risk by product
The minimum, maximum, average and year-end 2005 risk values in VaRD terms were as follows:
|
|
|
| Minimum |
| Average |
| Maximum |
| Year-End |
|
|
|
|
|
|
|
|
| ||||
Total Trading |
| Total VaRD |
| 17.4 |
| 19.3 |
| 27.0 |
| 27.0 |
|
|
|
|
|
|
|
|
| ||||
|
| Diversification effect |
| (6.9 | ) | (9.1 | ) | (10.8 | ) | (7.5 | ) |
|
|
|
|
|
|
|
| ||||
|
| Fixed-Income VaRD |
| 12.0 |
| 15.5 |
| 25.3 |
| 25.3 |
|
|
| Equity VaRD |
| 2.5 |
| 4.2 |
| 6.6 |
| 2.9 |
|
|
|
|
|
|
|
|
| ||||
|
| FX VarD |
| 5.7 |
| 8.7 |
| 11.2 |
| 6.2 |
|
|
|
|
|
|
|
|
|
|
|
|
|
LATIN AMERICA |
| VaRD Total |
| 13.2 |
| 16.9 |
| 25.9 |
| 25.9 |
|
|
|
|
|
|
|
|
| ||||
|
| Diversification effect |
| (5.0 | ) | (7.0 | ) | (9.2 | ) | (6.3 | ) |
|
|
|
|
|
|
|
| ||||
|
| Fixed-Income VaRD |
| 9.1 |
| 14.0 |
| 24.6 |
| 24.6 |
|
|
| Equity VaRD |
| 0.2 |
| 1.4 |
| 3.3 |
| 1.8 |
|
|
| FX VarD |
| 5.1 |
| 8.5 |
| 11.2 |
| 5.7 |
|
USA |
| VaRD Total |
| 0.8 |
| 2.1 |
| 4.7 |
| 2.7 |
|
|
|
|
|
|
|
|
| ||||
|
| Diversification effect |
| (0.0 | ) | (0.5 | ) | (1.3 | ) | (0.6 | ) |
|
|
|
|
|
|
|
| ||||
|
| Fixed-Income VaRD |
| 0.7 |
| 1.9 |
| 4.5 |
| 2.3 |
|
|
| Equity VaRD |
| 0.0 |
| 0.1 |
| 0.2 |
| 0.0 |
|
|
| FX VarD |
| 0.1 |
| 0.6 |
| 2.2 |
| 1.0 |
|
EUROPE |
| VaRD Total |
| 6.3 |
| 8.6 |
| 13.0 |
| 7.1 |
|
|
|
|
|
|
|
|
| ||||
|
| Diversification effect |
| (1.5 | ) | (2.8 | ) | (4.9 | ) | (2.8 | ) |
|
|
|
|
|
|
|
| ||||
|
| Fixed-Income VaRD |
| 4.0 |
| 5.9 |
| 8.6 |
| 5.4 |
|
|
| Equity VaRD |
| 2.1 |
| 3.9 |
| 6.4 |
| 2.2 |
|
|
| FX VarD |
| 0.5 |
| 1.6 |
| 5.0 |
| 2.2 |
|
EUR million
192
Our activity in credit derivatives increased in 2005. However, because this business is comparatively small, the credit risk factor is included in the fixed income factor. In the future, it will be shown separately if warranted by the amount of this activity or risk level.
Our risks were concentrated in fixed income and currencies, with average VaRD levels of €15.5 million and €8.7 million respectively.
Distribution of risks and results
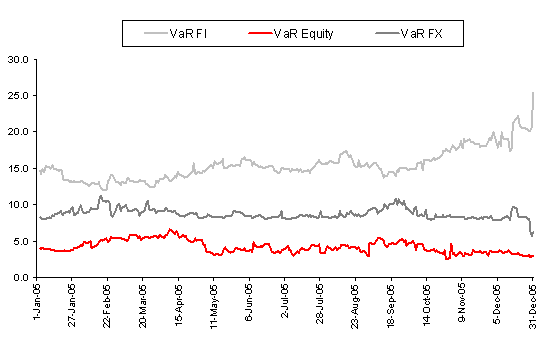
The VaRD performance demostrates our flexibility and agility in adapting its risk profile on the basis of changes in strategy resulting from different perceptions to market expectations.
• | Geographic distribution |
Partially due to Abbey’s inclusion, Europe’s VaRD has proportionally increased with respect to our total trading VaRD. Nevertheless, Latin America is the largest geographic contributor to the Group’s average total VaRD, with an average VaRD of €16.9 million, ending the year with a VaRD of €25.9 million.
As shown in the graph below, in terms of trading activity, Latin America’s contribution to our average total VaRD in 2005 was 61%, and its contribution to income was 31%. Meanwhile Europe contributed 31% of the Group’s total VaRD while generating 66% of the Group’s total income, European treasury activities are more focused on client facilitation than other business units in the Group.
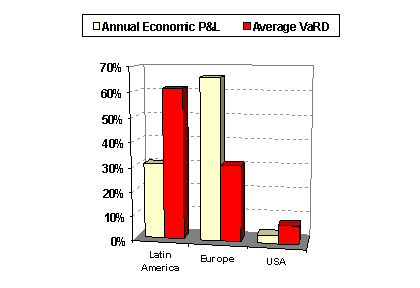
193
The minimum, average, maximum and year-end risk values in daily VaRD terms, by geographic area, are shown in the following table.
Risks statistics in 2005
(EUR million)
|
| Minimum |
| Average |
| Maximum |
| Year-End |
|
|
|
|
|
|
| ||||
TOTAL |
| 16.6 |
| 19.3 |
| 27.0 |
| 27.0 |
|
|
|
|
|
|
| ||||
EUROPE |
| 6.3 |
| 8.6 |
| 13.0 |
| 7.1 |
|
USA |
| 0.8 |
| 2.1 |
| 4.7 |
| 2.7 |
|
LATIN AMERICA |
| 13.2 |
| 16.9 |
| 25.9 |
| 25.9 |
|
• | Distribution by period |
The chart below shows the performance of risk versus monthly results for our trading activity. VaRD increases at the end of 2005 correspond to the aforementioned portfolio reclassifications in Brazil and Mexico.
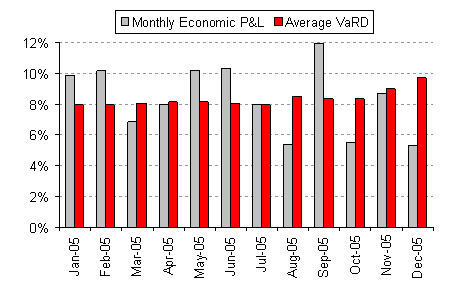
Histogram of the frequency of daily marked-to-market results
The histogram below details the frequency distribution of daily Marked-to-Market (“MtM”) results on the basis of size. The most common yield interval was between €-1 million and €3 million, which occurred on 121 days of the year (48% of the days of the year).
194
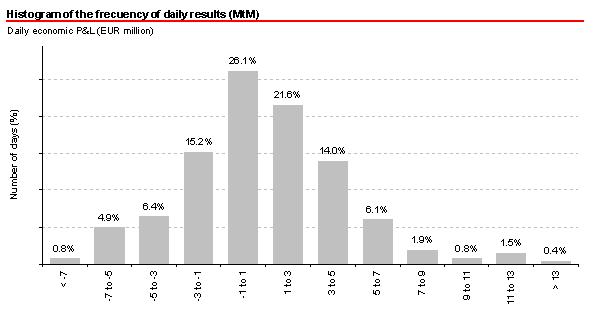
Risk management of structured derivatives
Our structured derivatives activity (non-organized markets) is mainly focused on structuring investment and hedging products for clients. These transactions include options on equities, currencies and fixed-income instruments.
This business is conducted by business units primarily located in Madrid, Portugal, Brazil, Chile, Mexico and New York.
The 2005 average VaRD was €2.4 million, the maximum €6.9 million and the minimum €0.6 million.
Test and calibration measures
In accordance with the BIS recommendations for gauging and monitoring the effectiveness of internal market risk measurement and management systems, in 2005 we carried out regular analysis and contrasting measures which confirmed the reliability of the model.
Scenario Analysis
Different stress test scenarios were analyzed during 2005. A scenario of maximum volatility, which applies six standard deviations to different market factors as of December 31, 2005, generated results that are presented below.
Maximum volatility scenario
The table below shows, at December 31, 2005, the maximum losses for each product (fixed-income, equities and currencies), in a scenario in which volatility equivalent to six standard deviations in a normal distribution is applied (decrease in equity prices, increases in local and external interest rates, depreciation of local currencies against USD).
Maximum volatility Stress
EUR million |
| Fixed income |
| Equities |
| Exchange rate |
| Volatility |
| Total |
|
|
|
|
|
|
| ||||||
Total Trading |
| (107.7 | ) | (10.7 | ) | 1.5 |
| 3.4 |
| (110.1 | ) |
Europe |
| (5.6 | ) | (2.9 | ) | (10.2 | ) | 2.8 |
| (14.4 | ) |
Latin America |
| (94.2 | ) | (7.7 | ) | 14.3 |
| 1.3 |
| (85.5 | ) |
USA (New York) |
| (7.8 | ) | (0.1 | ) | (2.5 | ) | (0.7 | ) | (10.1 | ) |
195
The stress test shows that we would post an economic loss of €110.1 million, if this scenario materialized in the market.
B. Non-Trading Activity
B.1. Asset and liability management
We actively manage the market risks inherent in retail banking. Management addreses the structural risks of interest rates, liquidity, exchange rates and credit.
The purpose of financial management is to make net interest revenue from our commercial activities more stable and recurrent, maintaining adequate levels of liquidity and solvency.
The Financial Management Area analyzes structural interest rate risk derived from mismatches in maturity and revision dates for assets and liabilities in each of the currencies in which we operate. For each currency, the risk measured is the interest gap, the sensitivity of net interest revenue, the economic value and the duration of equity.
The Financial Management Area manages structural risk on a centralized basis. This allows the use of homogenous methodologies, adapted to each local market where we operate.
In the euro-dollar area, the Financial Management Area directly manages the risks of the parent Bank and coordinates management of the rest of the units that operate in convertible currencies. There are local teams in the banks in Latin America that manage balance sheet risks under the same frameworks, in coordination with the global area of Financial Management.
The Asset and Liability Committees (Alco’s) of each country and, where necessary, the Markets Committee of the parent Bank are responsible for the risk management decisions.
B.1.1. Quantitative analysis of interest rate risk in 2005
a) Europe
As of December 31, 2005, the sensitivity of net interest revenue to a parallel movement of 100 basis points in the yield curve was a negative €615 million, mainly concentrated (70%) in Santander (our parent company). This risk position represents the concentration of a greater amount of liabilities with a time horizon of 12 months than assets that repay in the same term.
For the same accounting parameter, the sensitivity of net worth to a parallel movement of 100 basis points in the yield curve amounted at December 31, 2005, to €55.6 million (not including Abbey). This figure represents a reduced net risk, mainly due to the compensation among units, although each one of them individually does not hold risk positions either remarkable.
196
Structural Gap. Santander Parent Company (December 31, 2005)
EUR million |
| Not sensitive |
| 0-1 year |
| 1-3 years |
| 3-5 years |
| > 5 years |
| TOTAL |
|
|
|
|
|
|
|
| |||||||
Interbank Market & Short Term Instruments |
| 33,854 |
| 21,645 |
| 33,276 |
| 397 |
| 3,385 |
| 92,557 |
|
|
|
|
|
|
|
|
| ||||||
Loans to Customers |
| — |
| 76,666 |
| 13,738 |
| 2,981 |
| 2,088 |
| 95,472 |
|
|
|
|
|
|
|
|
| ||||||
Other Assets |
| 6,069 |
| 19,981 |
| — |
| — |
| — |
| 26,050 |
|
|
|
|
|
|
|
|
| ||||||
Total Assets |
| 39,924 |
| 118,292 |
| 47,014 |
| 3,378 |
| 5,473 |
| 214,079 |
|
|
|
|
|
|
|
|
| ||||||
Interbank Market & Short Term Instruments |
| — |
| 44,950 |
| 52 |
| — |
| — |
| 45,002 |
|
|
|
|
|
|
|
|
| ||||||
Customer Accounts |
| — |
| 16,906 |
| 9,612 |
| 8,120 |
| 10,369 |
| 45,006 |
|
|
|
|
|
|
|
|
| ||||||
Debt Securities in Issue |
| — |
| 62,976 |
| 2,353 |
| 315 |
| 949 |
| 66,593 |
|
|
|
|
|
|
|
|
| ||||||
Shareholders’ Funds and Other Liabilities |
| 40,598 |
| 21,568 |
| 1,077 |
| 889 |
| 2,064 |
| 66,197 |
|
|
|
|
|
|
|
|
| ||||||
Total Liabilities |
| 40,598 |
| 146,400 |
| 13,094 |
| 9,324 |
| 13,382 |
| 222,798 |
|
|
|
|
|
|
|
|
| ||||||
Gap |
| (675 | ) | (28,109 | ) | 33,920 |
| (5,946 | ) | (7,909 | ) | (8,719 | ) |
|
|
|
|
|
|
|
| ||||||
Structural Off-balance Gap |
| (1,208 | ) | 8,751 |
| 3,270 |
| (436 | ) | (241 | ) | 10,136 |
|
|
|
|
|
|
|
|
| ||||||
Total Structural Gap |
| (1,883 | ) | (19,357 | ) | 37,190 |
| (6,382 | ) | (8,150 | ) | 1,417 |
|
|
|
|
|
|
|
|
| ||||||
Cumulative Gap |
| — |
| (19,357 | ) | 17,832 |
| 11,450 |
| 3,300 |
| — |
|
|
|
|
|
|
|
|
|
b) Latin America
The interest rate risk of Latin American balance sheets, measured in terms of net interest revenue to a parallel movement of 100 basis points in the yield curves, kept stable at low levels throughout 2005 and moved in a narrow band. In terms of net worth sensitivity, net worth increased gradually in the second half of the 2005, mainly as a result of the growing positions in public titles denominated in local currency in Mexico and Brazil, held to cover possible margin losses in the future.
For the whole of Latin America, the risk consumption in terms of net worth sensitivity (to 100 basis points) was €387 million, while risk consumption in terms of net interest revenue sensitivity (to 100 basis points) was €22 million.
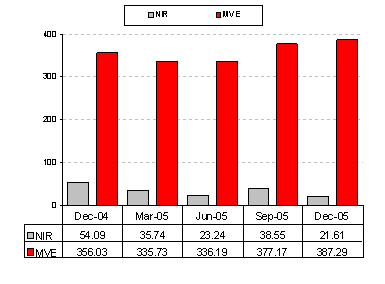
197
Interest rate risk profile at December 31, 2005
The gap tables below show the distribution of risk by maturity in Latin America as of December 31, 2005 (Figures in millions of euros).
Gaps in local currency |
| Total |
| 0-6 months |
| 6-12 months |
| 1-3 years |
| > 3 years |
| Not sensitive |
|
|
|
|
|
|
|
| |||||||
Assets |
| 112,478 |
| 67,796 |
| 6,144 |
| 11,105 |
| 18,076 |
| 9,319 |
|
Liabilities |
| 111,817 |
| 79,463 |
| 1,822 |
| 12,638 |
| 3,231 |
| 14,665 |
|
Off-balance sheet |
| (102 | ) | 1,581 |
| 2,909 |
| (4,658 | ) | 64 |
| 2 |
|
Gap |
| 559 |
| (9,421 | ) | 7,355 |
| (5,613 | ) | 13,862 |
| (5,624 | ) |
US$ Gaps |
| Total |
| 0-6 months |
| 6-12 months |
| 1-3 years |
| > 3 years |
| Not sensitive |
|
|
|
|
|
|
|
| |||||||
Assets |
| 25,611 |
| 15,298 |
| 1,809 |
| 2,286 |
| 4,408 |
| 1,811 |
|
Liabilities |
| 26,271 |
| 14,158 |
| 2,447 |
| 3,272 |
| 4,242 |
| 2,152 |
|
Off-balance sheet |
| 102 |
| 94 |
| (121 | ) | (202 | ) | 304 |
| 26 |
|
Gap |
| (559 | ) | 1,234 |
| (760 | ) | (1,188 | ) | 470 |
| (315 | ) |
Net interest revenue sensitivity
For Latin America, the consumption at December 31, 2005 was €22 million (sensitivity of net interest revenue at one year to 100 basis points). 2005 has been characterized by very low levels of net revenue risk, even below those in 2004. The geographic distribution of net interest revenue is shown below.
NIR Sensitivity by countries
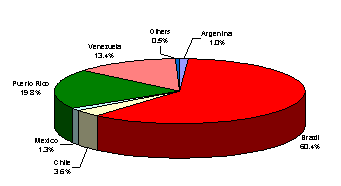
Others: Bolivia, Colombia, Panama and Uruguay
Net worth sensitivity
For the whole of Latin America, the consumption at December 31, 2005 was €387 million (net worth sensitivity to a parallel movement of 100 basis points in the yield curve). The geographic distribution of net worth sensitivity is shown below.
MVE Sensitivity by countries
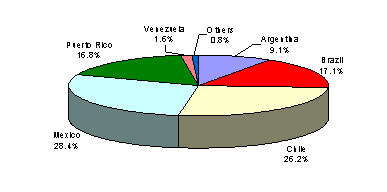
Others: Bolivia, Colombia, Panama and Uruguay
198
Three countries (Mexico, Chile and Brazil) account for approximately 72% of the net worth sensitivity risk.
2005 has been characterized by a risk increase in two of the main countries in the Latin American region, Mexico and Brazil, during the second half of the year. Such increase has been consequence of the portfolio purchases to hedge possible margin losses in the future, due to the expectations of decreasing official interest rates.
B.1.2. Credit risk
The recent development of both the financial instruments related to the credit and the methodologies to measure credit risk makes possible the transmission of this risk. The Financial Management Area analyzes globally the credit risk of the different portfolios that expose us to credit risk, and makes proposals to optimize its creation of value. The active management of credit risk allows us to diversify our credit portfolio and diminish the concentrations that naturally arise from the commercial banking activity. The proposals include both the sale and the purchase of assets that imply diversification for our credit portfolio as a whole.
B.1.3. Liquidity risk
The purpose of structural liquidity management is to finance our recurrent business in optimal conditions in terms of maturities and cost, preventing the assumption of undesired liquidity risks.
We have a diversified portfolio of assets that are liquid or can be made so in the short term, adjusted to our positions. We also have an active presence in a wide and diversified series of financing markets, limiting our dependence on specific markets and keeping open the capacity of recourse to markets.
Management of structural liquidity involves planning the funding needs, structuring the financing sources (optimizing the diversification by maturity, instrument and market) and drawing up contingency plans.
An annual liquidity plan is drawn up based on the financing needs arising from the business budgets. On the basis of these needs and taking into account the limits of recourse to the short-term markets, an issuance and securitization plan is established for the year. The real situation of the financing needs is closely tracked during the year, resulting in changes to the plan when necessary.
During 2005 we obtained a total of €41,000 million in medium and long-term issuances and assets securitizations amounting to €13,000 million were made. As a result financing in short term markets finished 2005 in the same levels than in 2004.
The banks in Latin America are autonomous in terms of liquidity, and do not resort to the lines of the parent Bank for financing the activity. Each bank has its own liquidity and contingency plan without calling on the Group’s financing. The cross-border and reputation risks arising from external financing are limited and authorized by the parent Bank.
Unlike what generally happens in the convertible currencies area, the business activity of the Latin American banks has a surplus of funds and does not require structural financing from the markets.
The control and analysis of liquidity risk performed in order to guarantee that we keep acceptable liquidity levels to cover its financing needs in the short and long term under normal market situations.
In addition, several scenario analyses are performed, considering potential additional financing needs as a consequence of such scenarios. The purpose is to cover a wide range of possible situations where we could be with a certain probability, and to be ready for such situations.
B.2. Exchange rate risk; Portfolio of industrial and strategic shareholdings
B.2.1. Exchange rate risk
Structural exchange rate risk is largely derived from our currency operations, mainly including permanent financial investments, and their consequent collection of earnings and dividends.
199
Exchange risk management is dynamic, and intends to limit the impact of currency depreciation in shareholders’ equity, optimizing the hedging financial cost.
In order to manage the exchange rate risk of the book value of permanent investments, our general policy is to finance it in local currency provided there is a deep market which allows it and that the cost of doing so is justified by the expected depreciation. Additionally certain one-off hedges of permanent investments are made when it is believed that a local currency could weaken against the euro more quickly than the market is discounting.
As of December 31, 2005, there was only one significant position with uncovered exchange rate risk, for capital investment in Brazil, amounting to approximately €2,700 million.
In addition, a management of the exchange rate risk stemming from our expected earnings is carried out in those units where the base currency is different from the euro. The Latin American local units manage the exchange rate risk between their local currencies and the US dollar, which is their currency for budgeting purposes. Global Financial Management is responsible of the management of exchange rate risk between its local currency and the US dollar.
B.2.2. Portfolio of industrial and strategic shareholdings
In 2005, we reduced our exposure in industrial and strategic equity portfolios after selling our stakes in the RBS, Unión Fenosa (Spanish electricity company) and Auna (Spanish telecommunications company). The VaRD at the end of December was €286.7 million, 3.5% lower than that at the end of 2004. This risk reduction would have been greater if the equity prices had increased in a lesser extent.
The average daily VaRD for the year 2005 was €268.8 million, with a minimum of €229.7 million and a maximum of €367.5 million.
C. Capital Management
Capital management’s objective is to optimize its structure and its cost, from the regulatory and economic perspectives. Therefore, different tools and policies are utilized, such as capital increases and computable issuances (preferred and subordinated), results, dividend policy and securitizations.
In accordance with the criteria of the Bank for International Settlements (BIS), our shareholders’ equity amounted to €53,426 million, €9,066 million more than at the end of 2004 (+20.4%). The surplus over the minimum requirement was €20,407 million.
Our capital ratios significantly improved. Core capital recovered to 6.05% in a year of strong growth in risk assets. Tier I was 7.88% and the BIS ratio 12.94%. These ratios reflect the high recurrent income together with the Group’s pay-out policy, better allocation of capital and the positive impact of the valuation of Abbey’s intangibles.
We are progressively incorporating the creation of value as a tool to (i) measure the contribution of the different units that are part of the portfolio of business and (ii) assess the management of each unit.
200
D. Market Risk: VaR Consolidated Analysis
Our total daily VaR as of December 31, 2004 and December 31, 2005, broken down by trading and structural (non-trading) portfolios, were as follows:
Figures in millions of EUR
|
|
|
| Dec-05 |
| ||||||
|
|
|
|
| |||||||
|
| Dec-04 |
| Low |
| Average |
| High |
| Period End |
|
|
|
|
|
|
|
| |||||
TOTAL |
| 334.8 |
| 240.1 |
| 296.4 |
| 399.1 |
| 353.3 |
|
| |||||||||||
Trading |
| 15.1 |
| 16.6 |
| 19.3 |
| 27.0 |
| 27.0 |
|
Non-Trading |
| 334.5 |
| 239.5 |
| 295.8 |
| 398.1 |
| 352.2 |
|
Diversification Effect |
| (14.8 | ) | (16.1 | ) | (18.6 | ) | (26.0 | ) | (25.9 | ) |
Our daily VaR estimates of interest rate risk, foreign exchange rate risk and equity price risk, were as follows:
Interest Rate Risk
Figures in millions of EUR
|
|
|
| Dec-05 |
| ||||||
|
|
|
|
| |||||||
|
| Dec-04 |
| Low |
| Average |
| High |
| Period End |
|
|
|
|
|
|
|
| |||||
Interest Rate Risk |
|
|
|
|
|
|
|
|
|
|
|
Trading |
| 12.3 |
| 12.0 |
| 15.5 |
| 25.3 |
| 25.3 |
|
Non-Trading |
| 85.1 |
| 86.1 |
| 92.2 |
| 107.6 |
| 94.4 |
|
Diversification Effect |
| (11.5 | ) | (11.2 | ) | (14.2 | ) | (22.4 | ) | (22.0 | ) |
| |||||||||||
TOTAL |
| 86.0 |
| 86.9 |
| 93.5 |
| 110.5 |
| 97.7 |
|
Foreign Exchange Rate Risk
Figures in millions of EUR
|
|
|
| Dec-05 |
| ||||||
|
|
|
|
| |||||||
|
| Dec-04 |
| Low |
| Average |
| High |
| Period End |
|
|
|
|
|
|
|
| |||||
Exchange Rate Risk |
|
|
|
|
|
|
|
|
|
|
|
Trading |
| 7.6 |
| 5.7 |
| 8.7 |
| 11.2 |
| 6.2 |
|
Non-Trading |
| 69.3 |
| 51.6 |
| 69.7 |
| 113.4 |
| 85.9 |
|
Diversification Effect |
| (7.2 | ) | (5.4 | ) | (8.2 | ) | (10.7 | ) | (6.0 | ) |
| |||||||||||
TOTAL |
| 69.8 |
| 51.9 |
| 70.3 |
| 113.9 |
| 86.1 |
|
Equity Price Risk
Figures in millions of EUR
|
|
|
| Dec-05 |
| ||||||
|
|
|
|
| |||||||
|
| Dec-04 |
| Low |
| Average |
| High |
| Period End |
|
|
|
|
|
|
|
| |||||
Equity Price Risk |
|
|
|
|
|
|
|
|
|
|
|
Trading |
| 1.6 |
| 2.5 |
| 4.2 |
| 6.6 |
| 2.9 |
|
Non-Trading |
| 297.2 |
| 229.7 |
| 268.8 |
| 367.5 |
| 286.7 |
|
Diversification Effect |
| (1.6 | ) | (2.5 | ) | (4.2 | ) | (6.5 | ) | (2.9 | ) |
| |||||||||||
TOTAL |
| 297.2 |
| 229.7 |
| 268.9 |
| 367.6 |
| 286.7 |
|
201
Our daily VaR estimates by activity, were as follows:
Figures in millions of EUR
|
|
|
| Dec-05 |
| ||||||
|
|
|
|
| |||||||
|
| Dec-04 |
| Low |
| Average |
| High |
| Period End |
|
|
|
|
|
|
|
| |||||
Trading |
|
|
|
|
|
|
|
|
|
|
|
Interest Rate |
| 12.3 |
| 12.0 |
| 15.5 |
| 25.3 |
| 25.3 |
|
Exchange Rate |
| 7.6 |
| 5.7 |
| 8.7 |
| 11.2 |
| 6.2 |
|
Equity |
| 1.5 |
| 2.5 |
| 4.2 |
| 6.6 |
| 2.9 |
|
| |||||||||||
TOTAL |
| 15.1 |
| 16.6 |
| 19.3 |
| 27.0 |
| 27.0 |
|
|
|
|
|
|
|
|
|
|
| ||
Balance |
|
|
|
|
|
|
|
|
|
|
|
Interest Rate |
| 85.1 |
| 86.1 |
| 92.2 |
| 107.6 |
| 94.4 |
|
| |||||||||||
Non-Trading FX |
|
|
|
|
|
|
|
|
|
|
|
Exchange Rate |
| 69.4 |
| 51.6 |
| 69.7 |
| 113.4 |
| 85.9 |
|
| |||||||||||
Non-Trading Eq |
|
|
|
|
|
|
|
|
|
|
|
Equity |
| 297.2 |
| 229.7 |
| 268.8 |
| 367.5 |
| 286.7 |
|
| |||||||||||
TOTAL |
| 334.8 |
| 240.1 |
| 296.4 |
| 399.1 |
| 353.3 |
|
| |||||||||||
Interest Rate |
| 86.0 |
| 86.9 |
| 93.5 |
| 110.5 |
| 97.7 |
|
Exchange Rate |
| 69.8 |
| 51.9 |
| 70.3 |
| 113.9 |
| 86.1 |
|
Equity |
| 297.2 |
| 229.7 |
| 268.9 |
| 367.6 |
| 286.7 |
|
Item 12. Description of Securities Other than Equity Securities.
Not Applicable
Not Applicable
Not Applicable
D. American Depositary Shares.
Not Applicable
202
PART II
Item 13. Defaults, Dividend Arrearages and Delinquencies.
Not Applicable
Item 14. Material Modifications to the Rights of Security Holders and Use of Proceeds.
A. Not Applicable
B. Not Applicable
C. Not Applicable
D. Not Applicable
Not Applicable
Item 15. Controls and Procedures
(a) Evaluation of disclosure controls and procedures. Our Chief Executive Officer and our Chief Financial Officer, after evaluating the effectiveness of the Company’s “disclosure controls and procedures” (as defined in Exchange Act Rules 13a-15(e) and 15d-15(e)), have concluded that as of December 31, 2005, our disclosure controls and procedures were adequate and effective and designed to ensure that material information relating to us and our consolidated subsidiaries would be made known to them by others within those entities.
(b) Not Applicable
(c) Not Applicable
(d) Changes in internal controls over financial reporting. There was no change in our internal control over financial reporting that occurred during the period covered by this annual report that has materially affected, or is reasonably likely to materially affect, our internal control over financial reporting.
Item 16. [Reserved]
Item 16A. Audit committee financial expert
The Audit and Compliance Committee has five members, all of whom are non-executive independent Directors (as defined by Article 5 of the Regulations of the Board). All members of the Audit and Compliance Committee also meet the independence criteria set by the NYSE for foreign private issuers. Our Regulations of the Board provide that the chairman of the Audit and Compliance Committee must be an independent director (as defined by Article 5 of the Regulations of the Board) and someone who has the necessary knowledge and experience of accounting techniques and principles. Currently, the chairman of the Audit and Compliance Committee is Luis Ángel Rojo. Our standards for director independence may not necessarily be consistent with, or as stringent as, the standards for director independence established by the NYSE.
Our Board of Directors has determined that Manuel Soto is an “Audit Committee Financial Expert” in accordance with SEC rules and regulations.
We have adopted a code of ethics (the “General Code of Conduct”) that is applicable to all members of the boards of the companies of the Group, to all employees subject to the Code of Conduct of the Securities Market, including the Bank’s Chairman, Chief Executive Officer, Chief Financial Officer and Chief Accounting Officer, and to all those employees designated by the Human Resources Division that have been specifically informed of their subjection to this General Code of Conduct. This Code establishes the principles that guide these officers’ and directors’ respective actions: ethical conduct, professional standards and confidentiality. It also establishes the limitations and defines the conflicts of interest arising from their status as senior executives or Directors.
This Code is available on our website, which does not form part of this annual report on Form 20-F, at www.gruposantander.com under the heading “Information for shareholders and investors - Corporate Governance – Internal Code of Conduct”.
203
Item 16C. Principal Accountant Fees and Services
Amounts paid to the firms belonging to the Deloitte worldwide organization, the Group’s principal auditor, for statutory audit and other services were as follows:
|
| 2003 |
| 2004 |
| 2005 |
|
|
|
|
|
| |||
|
| (in millions of euros) |
| ||||
Audit Fees (1) |
| 8.9 |
| 15.9 |
| 15.8 |
|
Audit Related Fees (2) |
| 2.2 |
| 4.1 |
| 9.3 |
|
Tax Fees (3) |
| 1.5 |
| 1.3 |
| 1.4 |
|
All Other Fees (4) |
| 3.2 |
| 6.1 |
| 3.7 |
|
|
|
|
|
| |||
Total |
| 15.8 |
| 27.4 |
| 30.2 |
|
(1) | Fees for annual company audits of the Group. |
(2) | Fees for professional services rendered to comply with Sarbanes-Oxley Act and for other reports required by legal regulations emanating from different national supervisory organizations in the countries in which the Group operates. |
(3) | Fees for professional services rendered for tax compliance, tax advice, and tax planning in the countries in which the Group operates. |
(4) | Fees for other services provided. These fees were mainly for financial advisory, due diligence services and systems reviews. |
The Audit and Compliance Committee proposes to the Board the fees to be paid to the external auditor and the scope of its professional mandate.
The Audit and Compliance Committee is required to pre-approve the main audit contract of the Bank or of any other company of the Group with its principal auditing firm. This main contract sets forth the scope of the audit services and audit-related services to be provided by the auditing firm, the term (typically, three years), the fees to be paid and the Group companies to which it will be applied. Once the term of the first contract expires, it can be rolled over by subsequent periods of one year upon approval by the Audit and Compliance Committee.
If a new Group company is required to engage an auditing firm for audit and audit-related services, those services have to be pre-approved by the Audit and Compliance Committee.
All non-audit services provided by the Group’s principal auditing firm or other auditing firms in 2005 (i.e.: tax services and all other services) were approved by the Audit and Compliance Committee, and all such non-audit services to be provided in the future will also require approval from the Audit and Compliance Committee.
The Audit and Compliance Committee is regularly informed of all fees paid to the auditing firms by the Group companies.
Item 16D. Exemption from the Listing Standards for Audit Companies
Not applicable.
204
Item 16E. Purchases of Equity Securities by the Issuer and Affiliated Purchasers.
The following table shows the repurchases of shares made by the Bank or any of its Affiliated Purchasers during 2005:
2005 |
| (a) Total number of |
| (b) Average |
| (c) Total number of shares (or |
| (d) Maximum number (or |
| ||
|
|
|
|
| |||||||
January |
| 75,478,040 |
| € | 9.14 |
| 350,000 |
| 179,407,395 |
| |
February |
| 48,174,572 |
| € | 9.39 |
| 850,000 |
| 186,569,686 |
| |
March |
| 17,951,014 |
| € | 9.49 |
| 0 |
| 0 |
| |
April |
| 63,353,267 |
| € | 9.10 |
| — |
| — |
| |
May |
| 70,502,304 |
| € | 9.16 |
| — |
| — |
| |
June |
| 9,208,482 |
| € | 9.38 |
| — |
| — |
| |
July |
| 39,226,812 |
| € | 10.05 |
| — |
| — |
| |
August |
| 55,207,255 |
| € | 9.98 |
| — |
| — |
| |
September |
| 23,002,528 |
| € | 10.48 |
| — |
| — |
| |
October |
| 40,580,669 |
| € | 10.55 |
| — |
| — |
| |
November |
| 30,735,780 |
| € | 10.16 |
| — |
| — |
| |
December |
| 49,123,061 |
| € | 10.70 |
| — |
| — |
| |
Total |
| 522,543,784 |
| € | 9.71 |
| — |
| — |
| |
(1) | The figures set forth in this column reflect the number of shares that could have been purchased at the end of the relevant month. |
Share repurchase program
At a General Shareholders’ Meeting held on June 19, 2004, the Bank was authorized to purchase its shares substantially on the same terms as those authorized in the previous shareholders’ meetings.
Since the date when the Bank announced its offer to acquire Abbey on July 26, 2004, the Bank purchased its shares under the authorization described above through a repurchase program which was authorized by the Board aimed at reducing the Bank’s share capital by the net amount of the purchases and sales made under such program. The Repurchase Program expired on March 31,2005, and was carried out according to the following terms:
(i) the maximum number of shares which could be held in treasury was 190 million shares; and
(ii) the maximum acquisition price was €9.77 per share.
205
PART III
Item 17. Financial Statements.
We have responded to Item 18 in lieu of this item.
Item 18. Financial Statements.
Reference is made to Item 19 for a list of all financial statements filed as part of this Form 20-F.
(a) Index to Financial Statements
|
| Page |
|
| |
|
|
|
Report of Deloitte, S.L. |
| F-1 |
|
|
|
Consolidated Balance Sheets as of December 31, 2005 and 2004 |
| F-2 |
|
|
|
Consolidated Statements of Income for the Years Ended December 31, 2005 and 2004 |
| F-3 |
|
|
|
Consolidated Statements Of Changes In Shareholders’ Equity for the Years Ended December 31, 2005 and 2004 |
| F-4 |
|
|
|
Consolidated Cash Flow Statement for the Years Ended December 31, 2005 and 2004 |
| F-5 |
|
|
|
Notes to the Consolidated Financial Statements |
| F-7 |
(b) List of Exhibits.
Exhibit |
| Description |
| ||
1.1 |
| By-laws (Estatutos) of Banco Santander Central Hispano, S.A., as amended (incorporated by reference to Exhibit 1.1 to our Annual Report on Form 20-F for the year ended December 31, 2004, filed with the Securities and Exchange Commission on June 30, 2005). |
1.2 |
| By-laws (Estatutos) of Banco Santander Central Hispano, S.A., as amended (English translation) (incorporated by reference to Exhibit 1.2 to our Annual Report on Form 20-F for the year ended December 31, 2004, filed with the Securities and Exchange Commission on June 30, 2005). |
4.1 |
| Investment Agreement, dated as of October 24, 2005, between Banco Santander Central Hispano, S.A. and Sovereign Bancorp, Inc. |
4.2 |
| Amendment to Investment Agreement, dated as of November 22, 2005, between Banco Santander Central Hispano, S.A. and Sovereign Bancorp, Inc. |
4.3 |
| Second Amendment to Investment Agreement, dated as of May 31, 2006, between Banco Santander Central Hispano, S.A. and Sovereign Bancorp, Inc. |
8.1 |
| List of Subsidiaries (incorporated by reference as Exhibits I, II and III of our Financial Pages filed with this Form 20-F). |
12.1 |
| Section 302 Certification by the Chief Executive Officer |
12.2 |
| Section 302 Certification by the Chief Financial Officer |
13.1 |
| Section 906 Certification |
15.1 |
| Consent of Deloitte, S.L. |
We will furnish to the Securities and Exchange Commission, upon request, copies of any unfiled instruments that define the rights of holders of long-term debt of Banco Santander Central Hispano, S.A.
206
SIGNATURES
The registrant hereby certifies that it meets all of the requirements for filing on Form 20-F and that it has duly caused and authorized the undersigned to sign this annual report on its behalf.
|
| BANCO SANTANDER CENTRAL HISPANO, S.A. | |
| By: |
| |
|
| ||
|
| Name: | José Antonio Álvarez |
|
| Title: | Chief Financial Officer |
Date: June 30, 2006
(a) | Index to Financial Statements |
|
| Page |
|
| |
|
|
|
| ||
|
|
|
Consolidated Balance Sheets as of December 31, 2005, and 2004 |
| |
|
|
|
Consolidated Statements of Income for the Years Ended December 31, 2005 and 2004 |
| |
|
|
|
|
REPORT OF INDEPENDENT REGISTERED PUBLIC ACCOUNTING FIRM
To the Board of Directors and Shareholders of
Banco Santander Central Hispano, S.A.:
We have audited the accompanying consolidated balance sheets of Banco Santander Central Hispano, S.A. (the “Bank”) and Companies composing, together with the Bank, the Santander Group (the “Group”), as of December 31, 2005 and 2004, and the related consolidated income statements, consolidated cash flow statements, consolidated statements of changes in equity for the years then ended. These consolidated financial statements are the responsibility of the controlling Company’s directors. Our responsibility is to express an opinion on these consolidated financial statements based on our audits.
We conducted our audits in accordance with the standards of the Public Company Accounting Oversight Board (United States of America). Those standards require that we plan and perform the audit to obtain reasonable assurance about whether the consolidated financial statements are free of material misstatement. The Bank is not required to have, nor were we engaged to perform, an audit of its internal control over financial reporting. Our audits included consideration of internal control over financial reporting as a basis for designing audit procedures that are appropriate in the circumstances, but not for the purpose of expressing an opinion on the effectiveness of the Bank’s internal control over financial reporting. Accordingly, we express no such opinion. An audit includes examining, on a test basis, evidence supporting the amounts and disclosures in the consolidated financial statements. An audit also includes assessing the accounting principles used and significant estimates made by management, as well as evaluating the overall financial statements presentation. We believe that our audits provide a reasonable basis for our opinion.
In our opinion the consolidated financial statements referred to above present fairly, in all material respects, the financial position of Banco Santander Central Hispano, S.A. and Companies composing the Santander Group as of December 31, 2005 and 2004, and the results of their operations and their cash flows for the years then ended in conformity with International Financial Reporting Standards, as adopted by the European Union (EU-IFRS).
The consolidated financial statements referred to above are the first that the Group has prepared in accordance with the EU-IFRS, which require, in general, that financial statements present comparative information. In this regard, as required by EU-IFRS 1, First Time Adoption of International Financial Reporting Standards, for comparison purposes the Parent’s directors present, in addition to the consolidated figures for 2005 for each item in the consolidated balance sheet, consolidated cash flow statement, consolidated statement of changes in equity and notes to the consolidated financial statements, the figures for 2004, which were obtained by applying the EU-IFRS in force at December 31, 2005. Accordingly, the figures for 2004 differ from those contained in the approved consolidated financial statements for 2004, which were prepared in accordance with the accounting principles generally accepted in Spain in force in that year. The differences arising from the application of EU-IFRS to the consolidated equity at January, 1 and December, 31 2004, and to the Group’s consolidated net income for 2004 are detailed in Note 57 to the consolidated financial statements referred to above.
EU-IFRS vary in certain significant respects from accounting principles generally accepted in the United States of America (U.S. GAAP). Information relating to the nature and effect of such differences is presented in Note 58 to the consolidated financial statements.
/s/ Deloitte, S.L.
Deloitte, S.L.
Madrid-Spain, March 27, 2006, except for Note 58 as to which the date is June 30, 2006
F-1
CONSOLIDATED BALANCE SHEETS AT December 31, 2005 AND 2004 (NOTES 1 to 4)
(Thousands of Euros)
ASSETS |
| Note |
| 2005 |
| 2004 |
| LIABILITIES AND EQUITY |
| Note |
| 2005 |
| 2004 |
|
|
|
|
|
|
|
|
| ||||||||
CASH AND BALANCES WITH CENTRAL BANKS |
|
|
| 16,086,458 |
| 8,801,412 |
| FINANCIAL LIABILITIES HELD FOR TRADING: |
|
|
| 112,466,429 |
| 91,526,435 |
|
|
|
|
|
|
|
| Deposits from credit institutions |
| 20 |
| 31,962,919 |
| 25,224,743 |
| |
FINANCIAL ASSETS HELD FOR TRADING: |
|
|
| 154,207,859 |
| 111,755,936 |
| Customer deposits |
| 21 |
| 14,038,543 |
| 20,541,225 |
|
Loans and advances to credit institutions |
| 6 |
| 10,278,858 |
| 12,878,171 |
| Debt securities |
| 22 |
| 19,821,087 |
| 11,791,579 |
|
Loans and advances to customers |
| 10 |
| 26,479,996 |
| 17,507,585 |
| Trading derivatives |
| 9 |
| 29,228,080 |
| 25,243,768 |
|
Debt instruments |
| 7 |
| 81,741,944 |
| 55,869,629 |
| Short positions |
| 9 |
| 17,415,800 |
| 8,725,120 |
|
Other equity instruments |
| 8 |
| 8,077,867 |
| 4,419,338 |
|
|
|
|
|
|
|
| |
Trading derivatives |
| 9 |
| 27,629,194 |
| 21,081,213 |
| OTHER FINANCIAL LIABILITIES AT FAIR |
|
|
|
|
|
|
|
|
|
|
|
|
|
| VALUE THROUGH PROFIT OR LOSS |
|
|
| 11,809,874 |
| 11,243,800 |
| |
OTHER FINANCIAL ASSETS AT FAIR VALUE |
|
|
|
|
|
|
| Debt securities |
| 22 |
| 11,809,874 |
| 11,243,800 |
|
THROUGH PROFIT OR LOSS: |
|
|
| 48,862,267 |
| 45,759,095 |
|
|
|
|
|
|
|
| |
Loans and advances to credit institutions |
| 6 |
| 2,428,663 |
| 6,524,070 |
| FINANCIAL LIABILITIES AT FAIR VALUE |
|
|
|
|
|
|
|
Loans and advances to customers |
| 10 |
| 6,431,197 |
| 5,291,551 |
| THROUGH EQUITY |
|
|
| — |
| — |
|
Debt instruments |
| 7 |
| 9,699,237 |
| 19,632,958 |
|
|
|
|
|
|
|
| |
Other equity instruments |
| 8 |
| 30,303,170 |
| 14,310,516 |
| FINANCIAL LIABILITIES AT AMORTIZED COST: |
|
|
| 565,651,643 |
| 447,831,156 |
|
|
|
|
|
|
|
| Deposits from central banks |
| 20 |
| 22,431,194 |
| 8,067,860 |
| |
|
|
|
|
|
|
| Deposits from credit institutions |
| 20 |
| 94,228,294 |
| 50,457,736 |
| |
AVAILABLE-FOR-SALE FINANCIAL ASSETS |
|
|
| 73,944,939 |
| 44,521,323 |
|
|
|
|
|
|
|
| |
Debt instruments |
| 7 |
| 68,054,021 |
| 36,702,487 |
| Money market operations through counterparties |
|
|
| — |
| 2,499,000 |
|
Other equity instruments |
| 8 |
| 5,890,918 |
| 7,818,836 |
| Customer deposits |
| 21 |
| 291,726,737 |
| 262,670,391 |
|
|
|
|
|
|
|
| Debt securities |
| 22 |
| 117,209,385 |
| 90,803,224 |
| |
LOANS AND RECEIVABLES: |
|
|
| 459,783,749 |
| 394,431,900 |
| Subordinated liabilities |
| 23 |
| 28,763,456 |
| 27,470,172 |
|
Loans and advances to credit institutions |
| 6 |
| 47,065,501 |
| 38,977,533 |
| Other financial liabilities |
| 24 |
| 11,292,577 |
| 5,862,773 |
|
|
|
|
|
|
|
|
|
|
|
|
|
|
|
|
|
Money market operations through counterparties |
|
|
| — |
| 3,907,905 |
| CHANGES IN THE FAIR VALUE OF HEDGED |
|
|
|
|
|
|
|
Loans and advances to customers |
| 10 |
| 402,917,602 |
| 346,550,928 |
| ITEMS IN PORTFOLIO HEDGES OF INTEREST RATE RISK |
|
|
| — |
| — |
|
Debt instruments |
| 7 |
| 171,203 |
| — |
|
|
|
|
|
|
|
| |
Other financial assets |
| 24 |
| 9,629,443 |
| 4,995,534 |
| HEDGING DERIVATIVES |
| 11 |
| 2,310,729 |
| 2,895,321 |
|
|
|
|
|
|
|
|
|
|
|
|
|
|
|
|
|
HELD-TO-MATURITY INVESTMENTS |
|
|
| — |
| — |
| LIABILITIES ASSOCIATED WITH NON-CURRENT |
|
|
|
|
|
|
|
|
|
|
|
|
|
| ASSETS HELD FOR SALE: |
|
|
| 7,967 |
| — |
| |
CHANGES IN THE FAIR VALUE OF HEDGED |
|
|
|
|
|
|
| Other liabilities |
|
|
| 7,967 |
| — |
|
ITEMS IN PORTFOLIO HEDGES OF INTEREST RATE RISK |
|
|
| — |
| — |
|
|
|
|
|
|
|
| |
|
|
|
|
|
|
|
|
|
|
|
|
|
|
|
|
HEDGING DERIVATIVES |
| 11 |
| 4,126,104 |
| 3,824,936 |
| LIABILITIES UNDER INSURANCE CONTRACTS |
| 15 |
| 44,672,300 |
| 42,344,776 |
|
|
|
|
|
|
|
|
|
|
|
|
|
|
|
|
|
NON-CURRENT ASSETS HELD FOR SALE: |
|
|
| 336,324 |
| 2,097,164 |
| PROVISIONS: |
|
|
| 19,822,990 |
| 18,023,924 |
|
Equity instruments |
| 12 |
| — |
| 1,814,418 |
| Provisions for pensions and similar obligations |
| 25 |
| 14,172,961 |
| 13,441,357 |
|
Tangible assets |
| 12 |
| 336,324 |
| 282,746 |
| Provisions for contingent liabilities and commitments |
| 25 |
| 487,048 |
| 360,594 |
|
|
|
|
|
|
|
| Other provisions |
| 25 |
| 5,162,981 |
| 4,221,973 |
| |
INVESTMENTS: |
|
|
| 3,031,482 |
| 3,747,564 |
|
|
|
|
|
|
|
| |
Associates |
| 13 |
| 3,031,482 |
| 3,747,564 |
| TAX LIABILITIES: |
|
|
| 3,867,795 |
| 3,496,212 |
|
|
|
|
|
|
|
| Current |
|
|
| 1,100,567 |
| 625,340 |
| |
|
|
|
|
|
|
| Deferred |
| 27 |
| 2,767,228 |
| 2,870,872 |
| |
|
|
|
|
|
|
|
|
|
|
|
|
|
|
|
|
INSURANCE CONTRACTS LINKED TO PENSIONS |
| 14 |
| 2,676,365 |
| 2,753,816 |
| ACCRUED EXPENSES AND DEFERRED INCOME |
| 18 |
| 3,048,733 |
| 4,382,034 |
|
|
|
|
|
|
|
|
|
|
|
|
|
|
|
|
|
REINSURANCE ASSETS |
| 15 |
| 2,387,701 |
| 3,045,804 |
| OTHER LIABILITIES: |
|
|
| 1,512,908 |
| 4,118,162 |
|
|
|
|
|
|
|
| Other |
| 19 |
| 1,512,908 |
| 4,118,162 |
| |
TANGIBLE ASSETS: |
|
|
| 9,993,207 |
| 10,585,193 |
|
|
|
|
|
|
|
| |
For own use |
| 16 |
| 5,204,931 |
| 4,925,231 |
| EQUITY HAVING THE SUBSTANCE OF A |
|
|
|
|
|
|
|
Investment property |
| 16 |
| 667,449 |
| 2,115,823 |
| FINANCIAL LIABILITY |
| 26 |
| 1,308,847 |
| 2,124,222 |
|
|
|
|
|
|
|
|
|
|
|
|
|
|
| ||
Other assets leased out under an operating lease |
| 16 |
| 4,120,827 |
| 3,544,139 |
| TOTAL LIABILITIES |
|
|
| 766,480,215 |
| 627,986,042 |
|
|
|
|
|
|
|
|
|
|
|
|
|
|
| ||
|
|
|
|
|
|
|
|
|
|
|
|
|
|
|
|
Memorandum item: Acquired under a finance lease |
|
|
| 83,459 |
| 41,117 |
| MINORITY INTERESTS |
| 28 |
| 2,848,223 |
| 2,085,316 |
|
|
|
|
|
|
|
|
|
|
|
|
|
|
|
|
|
|
|
|
|
|
|
| VALUATION ADJUSTMENTS: |
|
|
| 3,077,096 |
| 1,777,564 |
| |
INTANGIBLE ASSETS: |
|
|
| 16,229,271 |
| 15,503,274 |
| Available-for-sale financial assets |
| 29 |
| 1,941,690 |
| 1,936,818 |
|
Goodwill |
| 17 |
| 14,018,245 |
| 15,090,541 |
| Cash flow hedges |
| 29 |
| 70,406 |
| (1,787 | ) |
Other intangible assets |
| 17 |
| 2,211,026 |
| 412,733 |
|
|
|
|
|
|
|
| |
|
|
|
|
|
|
| Hedges of net investments in foreign operations |
| 29 |
| (384,606 | ) | 638,227 |
| |
TAX ASSETS: |
|
|
| 10,127,059 |
| 9,723,970 |
| Exchange differences |
| 29 |
| 1,449,606 |
| (795,694 | ) |
Current |
|
|
| 1,217,646 |
| 1,381,722 |
|
|
|
|
|
|
|
| |
Deferred |
| 27 |
| 8,909,413 |
| 8,342,248 |
| OWN FUNDS: |
| 30 |
| 36,701,380 |
| 32,637,378 |
|
|
|
|
|
|
|
| Issued capital |
| 31 |
| 3,127,148 |
| 3,127,148 |
| |
PREPAYMENTS AND ACCRUED INCOME |
| 18 |
| 2,969,219 |
| 3,029,728 |
| Share premium |
| 32 |
| 20,370,128 |
| 20,370,128 |
|
|
|
|
|
|
|
| Reserves: |
|
|
| 8,703,789 |
| 6,877,827 |
| |
OTHER ASSETS: |
|
|
| 4,344,910 |
| 4,905,185 |
| Accumulated reserves |
| 33 |
| 8,100,140 |
| 6,256,632 |
|
Inventories |
|
|
| 2,457,842 |
| 1,582,675 |
| Reserves of entities accounted for using the |
|
|
|
|
|
|
|
Other |
| 19 |
| 1,887,068 |
| 3,322,510 |
| equity method: |
|
|
| 603,649 |
| 621,195 |
|
|
|
|
|
|
|
|
|
|
|
|
|
|
| ||
TOTAL ASSETS |
|
|
| 809,106,914 |
| 664,486,300 |
| Associates |
| 33 |
| 603,649 |
| 621,195 |
|
|
|
|
|
|
|
|
|
|
|
|
|
|
| ||
|
|
|
|
|
|
| Other equity instruments: |
| 34 |
| 77,478 |
| 93,567 |
| |
CONTINGENT LIABILITIES: |
|
|
| 48,453,575 |
| 31,813,882 |
| Equity component of compound financial instruments |
|
|
| 34,977 |
| — |
|
Financial guarantees |
| 35 |
| 48,199,671 |
| 31,511,567 |
| Other |
|
|
| 42,501 |
| 93,567 |
|
Assets earmarked for third-party obligations |
| 35 |
| 24 |
| 24 |
| Treasury shares |
| 34 |
| (53,068 | ) | (126,500 | ) |
Other contingent liabilities |
| 35 |
| 253,880 |
| 302,291 |
| Profit attributed to the Group |
| 30 |
| 6,220,104 |
| 3,605,870 |
|
|
|
|
|
|
|
| Dividends and remuneration |
| 30 |
| (1,744,199 | ) | (1,310,662 | ) | |
|
|
|
|
|
|
|
|
|
|
|
|
|
| ||
CONTINGENT COMMITMENTS: |
|
|
| 96,263,262 |
| 74,860,532 |
| TOTAL EQUITY |
|
|
| 42,626,699 |
| 36,500,258 |
|
|
|
|
|
|
|
|
|
|
|
|
|
|
| ||
Drawable by third parties |
| 35 |
| 77,678,333 |
| 63,110,699 |
| TOTAL LIABILITIES AND EQUITY |
|
|
| 809,106,914 |
| 664,486,300 |
|
|
|
|
|
|
|
|
|
|
|
|
|
|
| ||
Other commitments |
| 35 |
| 18,584,929 |
| 11,749,833 |
|
|
|
|
|
|
|
|
The accompanying Notes 1 to 58 and Exhibits I to VII are an integral part of the Consolidated Balance Sheet at December 31, 2005 and 2004.
F-2
CONSOLIDATED INCOME STATEMENTS
FOR THE YEARS ENDED December 31, 2005 AND 2004 (NOTES 1 to 4)
(Thousands of Euros)
|
|
|
| (Debit) Credit |
| ||
|
|
|
|
| |||
|
| Note |
| 2005 |
| 2004 |
|
|
|
|
|
| |||
INTEREST AND SIMILAR INCOME |
| 38 |
| 32,958,556 |
| 17,461,238 |
|
|
|
|
|
|
|
|
|
INTEREST EXPENSE AND SIMILAR CHARGES: |
| 39 |
| (22,800,696 | ) | (10,274,776 | ) |
Return on equity having the substance of a financial liability |
|
|
| (118,389 | ) | (151,952 | ) |
Other |
|
|
| (22,682,307 | ) | (10,122,824 | ) |
|
|
|
|
|
|
|
|
INCOME FROM EQUITY INSTRUMENTS |
| 40 |
| 335,610 |
| 389,038 |
|
NET INTEREST INCOME |
|
|
| 10,493,470 |
| 7,575,500 |
|
SHARE OF RESULTS OF ENTITIES ACCOUNTED FOR USING THE EQUITY METHOD: |
| 41 |
| 619,166 |
| 449,011 |
|
Associates |
|
|
| 619,166 |
| 449,011 |
|
|
|
|
|
|
|
|
|
FEE AND COMMISSION INCOME |
| 42 |
| 7,481,686 |
| 5,696,129 |
|
FEE AND COMMISSION EXPENSE |
| 43 |
| (1,167,837 | ) | (927,492 | ) |
INSURANCE ACTIVITY INCOME: |
| 44 |
| 815,519 |
| 161,374 |
|
Insurance and reinsurance premium income |
|
|
| 4,082,613 |
| 2,275,655 |
|
Reinsurance premiums paid |
|
|
| (100,537 | ) | (65,389 | ) |
Benefits paid and other insurance-related expenses |
|
|
| (6,311,999 | ) | (1,003,769 | ) |
Reinsurance income |
|
|
| 88,452 |
| 14,413 |
|
Net provisions for insurance contract liabilities |
|
|
| (1,473,435 | ) | (1,497,692 | ) |
Finance income |
|
|
| 4,661,502 |
| 494,947 |
|
Finance expense |
|
|
| (131,077 | ) | (56,791 | ) |
|
|
|
|
|
|
|
|
GAINS/LOSSES ON FINANCIAL ASSETS AND LIABILITIES (net): |
| 45 |
| 1,489,223 |
| 739,932 |
|
Held for trading |
|
|
| 1,001,065 |
| 481,238 |
|
Other financial instruments at fair value through profit or loss |
|
|
| 26,532 |
| 8,380 |
|
Available-for-sale financial assets |
|
|
| 533,770 |
| 364,154 |
|
Loans and receivables |
|
|
| 70,645 |
| 49,428 |
|
Other |
|
|
| (142,789 | ) | (163,268 | ) |
|
|
|
|
|
|
|
|
EXCHANGE DIFFERENCES (net) |
| 46 |
| 76,058 |
| 360,793 |
|
GROSS INCOME |
|
|
| 19,807,285 |
| 14,055,247 |
|
SALES AND INCOME FROM THE PROVISION OF NON-FINANCIAL SERVICES |
| 47 |
| 1,411,514 |
| 1,028,458 |
|
COST OF SALES |
| 47 |
| (985,482 | ) | (680,647 | ) |
OTHER OPERATING INCOME |
| 48 |
| 256,229 |
| 201,145 |
|
PERSONNEL EXPENSES |
| 49 |
| (5,817,397 | ) | (4,324,662 | ) |
OTHER GENERAL ADMINISTRATIVE EXPENSES |
| 50 |
| (4,006,041 | ) | (2,515,205 | ) |
DEPRECIATION AND AMORTIZATION: |
|
|
| (1,021,211 | ) | (838,674 | ) |
Tangible assets |
| 16 |
| (622,359 | ) | (490,555 | ) |
Intangible assets |
| 17 |
| (398,852 | ) | (348,119 | ) |
|
|
|
|
|
|
|
|
OTHER OPERATING EXPENSES |
| 51 |
| (359,974 | ) | (264,086 | ) |
NET OPERATING INCOME |
|
|
| 9,284,923 |
| 6,661,576 |
|
IMPAIRMENT LOSSES (net): |
|
|
| (1,806,983 | ) | (1,843,415 | ) |
Available-for-sale financial assets |
| 8 |
| 118,933 |
| (19,431 | ) |
Loans and receivables |
| 10 |
| (1,756,047 | ) | (1,581,740 | ) |
Non-current assets held for sale |
| 12 |
| (15,372 | ) | (90,822 | ) |
Tangible assets |
| 16 |
| (15,112 | ) | (8,948 | ) |
Goodwill |
| 17 |
| — |
| (138,200 | ) |
Other intangible assets |
| 17 |
| (130,977 | ) | — |
|
Other assets |
|
|
| (8,408 | ) | (4,274 | ) |
|
|
|
|
|
|
|
|
PROVISIONS (net) |
| 25 |
| (1,808,478 | ) | (1,141,571 | ) |
FINANCE INCOME FROM NON-FINANCIAL ACTIVITIES |
|
|
| 3,115 |
| 20,161 |
|
FINANCE EXPENSE FROM NON-FINANCIAL ACTIVITIES |
|
|
| (34,993 | ) | (37,606 | ) |
OTHER GAINS: |
| 52 |
| 2,775,554 |
| 1,488,166 |
|
Gains on disposal of tangible assets |
|
|
| 160,766 |
| 265,113 |
|
Gains on disposal of investments in associates |
|
|
| 1,306,468 |
| 35,729 |
|
Other |
|
|
| 1,308,320 |
| 1,187,324 |
|
|
|
|
|
|
|
|
|
OTHER LOSSES: |
| 52 |
| (258,669 | ) | (566,008 | ) |
Losses on disposal of tangible assets |
|
|
| (77,494 | ) | (85,247 | ) |
Losses on disposal of investments in associates |
|
|
| (7,422 | ) | (4,838 | ) |
Other |
|
|
| (173,753 | ) | (475,923 | ) |
PROFIT BEFORE TAX |
|
|
| 8,154,469 |
| 4,581,303 |
|
INCOME TAX |
| 27 |
| (1,391,176 | ) | (596,792 | ) |
PROFIT FROM CONTINUING OPERATIONS |
|
|
| 6,763,293 |
| 3,984,511 |
|
PROFIT FROM DISCONTINUED OPERATIONS (net) |
|
|
| (13,523 | ) | 11,723 |
|
CONSOLIDATED PROFIT FOR THE YEAR |
|
|
| 6,749,770 |
| 3,996,234 |
|
PROFIT ATTRIBUTED TO MINORITY INTERESTS |
| 28 |
| (529,666 | ) | (390,364 | ) |
PROFIT ATTRIBUTED TO THE GROUP |
|
|
| 6,220,104 |
| 3,605,870 |
|
The accompanying Notes 1 to 58 and Exhibits I to VII are an integral part of the Consolidated Income Statement at December 31, 2005 and 2004.
F-3
SANTANDER GROUP
CONSOLIDATED STATEMENTS OF CHANGES IN EQUITY
FOR THE YEARS ENDED December 31, 2005 AND 2004 (NOTES 1 to 4)
(Thousands of Euros)
|
| 2005 |
| 2004 |
|
|
|
|
| ||
|
|
|
|
|
|
NET INCOME RECOGNIZED DIRECTLY IN EQUITY: |
| 1,299,532 |
| (265,796 | ) |
Available-for-sale financial assets- |
| 4,872 |
| (111,871 | ) |
Revaluation gains/losses |
| 911,814 |
| 925,454 |
|
Amounts transferred to income statement |
| (883,474 | ) | (821,555 | ) |
Income tax |
| (23,468 | ) | (215,770 | ) |
Cash flow hedges- |
| 72,193 |
| 3,542 |
|
Revaluation gains/losses |
| 83,216 |
| 19,315 |
|
Income tax |
| (11,023 | ) | (15,773 | ) |
Hedges of net investments in foreign operations- |
| (1,022,833 | ) | 638,227 |
|
Revaluation gains/losses |
| (1,022,833 | ) | 638,227 |
|
Exchange differences- |
| 2,245,300 |
| (795,694 | ) |
Translation gains/losses |
| 2,411,831 |
| (799,080 | ) |
Amounts transferred to income statement |
| (166,531 | ) | 3,386 |
|
|
|
|
|
|
|
CONSOLIDATED PROFIT FOR THE YEAR: |
| 6,749,770 |
| 3,996,234 |
|
Published consolidated profit for the year |
| 6,749,770 |
| 3,996,234 |
|
|
|
|
|
|
|
TOTAL INCOME AND EXPENSES FOR THE YEAR: |
| 8,049,302 |
| 3,730,438 |
|
Parent |
| 7,519,636 |
| 3,340,074 |
|
Minority interests |
| 529,666 |
| 390,364 |
|
TOTAL |
| 8,049,302 |
| 3,730,438 |
|
The accompanying Notes 1 to 58 and Exhibits I to VII are an integral part of the Consolidated Statement of Changes in Equity at December 31, 2005 and 2004.
F-4
SANTANDER GROUP
CONSOLIDATED CASH FLOW STATEMENTS
FOR THE YEARS ENDED December 31, 2005 AND 2004 (NOTES 1 to 4)
(Thousands of Euros)
|
| 2005 |
| 2004 |
|
|
|
|
| ||
1. CASH FLOWS FROM OPERATING ACTIVITIES |
|
|
|
|
|
Consolidated profit for the year |
| 6,749,770 |
| 3,996,234 |
|
Adjustments to profit- |
| 5,499,799 |
| 5,258,376 |
|
Depreciation of tangible assets |
| 622,359 |
| 490,555 |
|
Amortization of intangible assets |
| 398,852 |
| 348,119 |
|
Impairment losses (net) |
| 1,806,983 |
| 1,843,415 |
|
Net provisions for insurance contract liabilities |
| 1,473,435 |
| 1,497,692 |
|
Provisions (net) |
| 1,808,478 |
| 1,141,571 |
|
Gains/losses on disposal of tangible assets |
| (83,272 | ) | (179,866 | ) |
Gains/losses on disposal of investments in associates |
| (1,299,046 | ) | (30,891 | ) |
Share of results of entities accounted for using the equity method |
| (619,166 | ) | (449,011 | ) |
Taxes |
| 1,391,176 |
| 596,792 |
|
|
|
|
| ||
Adjusted profit |
| 12,249,569 |
| 9,254,610 |
|
|
|
|
| ||
Net increase/decrease in operating assets: |
| (142,040,506 | ) | (13,882,427 | ) |
Financial assets held for trading- |
| (42,451,923 | ) | (6,976,058 | ) |
Loans and advances to credit institutions |
| 2,599,313 |
| — |
|
Loans and advances to customers |
| (8,972,411 | ) | — |
|
Debt instruments |
| (25,872,315 | ) | (4,005,998 | ) |
Other equity instruments |
| (3,658,529 | ) | (214,066 | ) |
Trading derivatives |
| (6,547,981 | ) | (2,755,994 | ) |
|
|
|
|
|
|
Other financial assets at fair value through profit or loss- |
| (3,103,172 | ) | (3,252,226 | ) |
Loans and advances to credit institutions |
| 4,095,407 |
| (110,835 | ) |
Loans and advances to customers |
| (1,139,646 | ) | (1,220,842 | ) |
Debt instruments |
| 9,933,721 |
| (1,213,512 | ) |
Other equity instruments |
| (15,992,654 | ) | (707,037 | ) |
|
|
|
|
|
|
Available-for-sale financial assets- |
| (28,550,639 | ) | 26,133,878 |
|
Debt instruments |
| (31,229,897 | ) | 23,809,729 |
|
Other equity instruments |
| 2,679,258 |
| 2,324,149 |
|
|
|
|
|
|
|
Loans and receivables- |
| (67,550,354 | ) | (31,434,661 | ) |
Loans and advances to credit institutions |
| (8,087,968 | ) | 3,662,338 |
|
Money market operations through counterparties |
| 3,907,905 |
| (3,621,813 | ) |
Loans and advances to customers |
| (58,565,179 | ) | (31,417,021 | ) |
Debt instruments |
| (171,203 | ) | — |
|
Other financial assets |
| (4,633,909 | ) | (58,165 | ) |
Other operating assets |
| (384,418 | ) | 1,646,640 |
|
|
|
|
|
|
|
Net increase/decrease in operating liabilities: |
| 95,494,609 |
| (7,464,190 | ) |
Financial liabilities held for trading- |
| 14,736,090 |
| (788,302 | ) |
Deposits from credit institutions |
| 6,738,176 |
| — |
|
Customer deposits |
| (6,502,682 | ) | — |
|
Debt securities |
| 1,825,604 |
| (2,905,781 | ) |
Trading derivatives |
| 3,984,312 |
| 4,410,392 |
|
Short positions |
| 8,690,680 |
| (2,292,913 | ) |
|
|
|
|
|
|
Other financial liabilities at fair value through profit or loss- |
| 555,299 |
| 619,124 |
|
Debt securities |
| 555,299 |
| 619,124 |
|
|
|
|
|
|
|
Financial liabilities at amortized cost- |
| 82,195,979 |
| (685,483 | ) |
Deposits from central banks |
| 14,363,334 |
| (2,313,955 | ) |
Deposits from credit institutions |
| 43,770,558 |
| (14,132,950 | ) |
Money market operations through counterparties |
| (2,499,000 | ) | 504,479 |
|
Customer deposits |
| 29,056,346 |
| 12,776,724 |
|
Debt securities |
| (7,925,063 | ) | 1,676,830 |
|
Other financial liabilities |
| 5,429,804 |
| 803,389 |
|
|
|
|
|
|
|
Other operating liabilities |
| (1,992,759 | ) | (6,609,529 | ) |
|
|
|
| ||
Total net cash flows from operating activities (1) |
| (34,296,328 | ) | (12,092,007 | ) |
|
|
|
|
F-5
SANTANDER GROUP
CONSOLIDATED CASH FLOW STATEMENTS
FOR THE YEARS ENDED December 31, 2005 AND 2004 (NOTES 1 to 4)
(Thousands of Euros)
|
| 2005 |
| 2004 |
|
|
|
|
| ||
2. CASH FLOWS FROM INVESTING ACTIVITIES |
|
|
|
|
|
Investments- |
| (2,478,073 | ) | (3,650,892 | ) |
Subsidiaries, jointly controlled entities and associates |
| (18,470 | ) | (232,758 | ) |
Tangible assets |
| (1,990,867 | ) | (2,666,205 | ) |
Intangible assets |
| (454,107 | ) | (416,541 | ) |
Other financial assets |
| — |
| (335,388 | ) |
Other assets |
| (14,629 | ) | — |
|
|
|
|
|
|
|
Divestments- |
| 6,616,203 |
| 2,677,725 |
|
Subsidiaries, jointly controlled entities and associates |
| 1,750,237 |
| 85,785 |
|
Tangible assets |
| 2,482,232 |
| 2,276,973 |
|
Other financial assets |
| 1,814,418 |
| — |
|
Other assets |
| 569,316 |
| 314,967 |
|
|
|
|
| ||
Total net cash flows from investing activities (2) |
| 4,138,130 |
| (973,167 | ) |
|
|
|
| ||
|
|
|
|
|
|
3. CASH FLOWS FROM FINANCING ACTIVITIES |
|
|
|
|
|
Acquisition of own equity instruments |
| — |
| (87,378 | ) |
Disposal of own equity instruments |
| 73,432 |
| — |
|
Issuance/Redemption of other equity instruments |
| (16,089 | ) | 35,000 |
|
Redemption of equity having the substance of a financial liability |
| (944,968 | ) | (2,624,283 | ) |
Issuance of subordinated liabilities |
| 2,507,872 |
| 5,283,872 |
|
Redemption of subordinated liabilities |
| (2,410,288 | ) | (465,323 | ) |
Issuance of other long-term liabilities |
| 52,669,694 |
| 19,477,021 |
|
Redemption of other long-term liabilities |
| (14,269,479 | ) | (5,893,627 | ) |
Increase/Decrease in minority interests |
| 233,241 |
| (266,195 | ) |
Dividends/Interest paid |
| (2,208,518 | ) | (1,496,840 | ) |
Other items related to financing activities |
| 1,500,947 |
| (1,345,097 | ) |
|
|
|
| ||
Total net cash flows from financing activities (3) |
| 37,135,844 |
| 12,617,150 |
|
|
|
|
| ||
|
|
|
|
|
|
4. EFFECT OF EXCHANGE RATE CHANGES ON CASH AND CASH EQUIVALENTS (4) |
| 307,400 |
| (348,269 | ) |
|
|
|
| ||
|
|
|
|
|
|
5. NET INCREASE/DECREASE IN CASH AND CASH EQUIVALENTS (1+2+3+4) |
| 7,285,046 |
| (796,293 | ) |
|
|
|
| ||
|
|
|
|
|
|
Cash and cash equivalents at beginning of year |
| 8,801,412 |
| 8,915,883 |
|
Cash and cash equivalents at end of year |
| 16,086,458 |
| 8,119,590 |
|
|
|
|
|
The accompanying Notes 1 to 58 and Exhibits I to VII are an integral part of the Consolidated Cash Flow Statement at December 31, 2005 and 2004.
F-6
Notes to the consolidated financial statements
for the year ended December 31, 2005
1. Introduction, basis of presentation of the consolidated financial statements and other information |
| a) | Introduction |
Banco Santander Central Hispano, S.A. (“the Bank” or “Banco Santander”) is a private-law entity subject to the rules and regulations applicable to banks operating in Spain. The bylaws and other public information on the Bank can be consulted on the website of the Bank (www.gruposantander.com) and at its registered office at Paseo de Pereda 9-12, Santander.
In addition to the operations carried on directly by it, the Bank is the head of a group of subsidiaries that engage in various business activities and which compose, together with it, the Santander Group (“the Group” or “the Santander Group”). Therefore, the Bank is obliged to prepare, in addition to its own individual financial statements, the Group’s consolidated financial statements, which also include the interests in joint ventures and investments in associates.
The Group’s consolidated financial statements for 2004 were approved by the shareholders at the Annual General Meeting of the Bank on June 18, 2005. The 2005 consolidated financial statements of the Group and the 2005 financial statements of the Bank and almost all the Group entities have not yet been approved by their shareholders at the respective Annual General Meetings. However, the Bank’s Board of Directors considers that the aforementioned financial statements will be approved without any changes. See Note 58.6.m.
| b) | Basis of presentation of the consolidated financial statements |
Under Regulation (EC) no. 1606/2002 of the European Parliament and of the Council of July 19, 2002, all companies governed by the law of an EU Member State and whose securities are admitted to trading on a regulated market of any Member State must prepare their consolidated financial statements for the years beginning on or after January 1, 2005 in conformity with the International Financial Reporting Standards (IFRS) previously adopted by the European Union.
In order to adapt the accounting system of Spanish credit institutions to the new standards, the Bank of Spain issued Circular 4/2004, of December 22, on Public and Confidential Financial Reporting Rules and Formats.
The Group’s consolidated financial statements for 2005 were prepared by the Bank’s directors (at the Board meeting on March 27, 2006) in accordance with IFRS, as adopted by the European Union, and with Bank of Spain Circular 4/2004, using the basis of consolidation, accounting policies and measurement bases set forth in Note 2 and, accordingly, they present fairly the Group’s equity and financial position at December 31, 2005, and the consolidated results of its operations, the changes in consolidated equity and the consolidated cash flows in 2005. These consolidated financial statements were prepared from the individual accounting records of the Bank and of each of the companies composing the Group, and include certain adjustments and reclassifications required to unify the accounting policies and measurement bases applied by the Group.
F-7
The consolidated financial statements for the year ended December 31, 2005 were the first to be prepared in accordance with IFRS, as adopted by the European Union. These standards entail, with respect to the standards in force when the Group’s consolidated financial statements for 2004 were prepared (Bank of Spain Circular 4/1991):
| - | Significant changes in accounting policies, measurement bases and presentation of the financial statements; |
| - | The inclusion in the consolidated financial statements of two new financial statements, namely the consolidated statement of changes in equity and the consolidated cash flow statement; and |
| - | A significant increase in the volume of disclosures in the Notes to the consolidated financial statements. |
Note 57 to the consolidated financial statements contains the reconciliation of the consolidated balance sheet balances at the beginning and end of the year ended December 31, 2004 and the related results for 2004 –which, therefore, were reflected in the Group’s consolidated financial statements for that year– to the corresponding balances for 2004 determined in accordance with the new standards.
The Notes to the consolidated financial statements contain supplementary information to that presented in the consolidated balance sheet, consolidated income statement, consolidated statement of changes in equity and consolidated cash flow statement. The Notes provide, in a clear, relevant, reliable and comparable manner, narrative descriptions and breakdowns of these financial statements.
All accounting policies and measurement bases with a material effect on the consolidated financial statements were applied in their preparation.
| c) | Use of estimates |
The consolidated results and the determination of consolidated equity are sensitive to the accounting policies, measurement bases and estimates used by the directors of the Bank in preparing the consolidated financial statements. The main accounting policies and rules and measurement bases are set forth in Note 2.
In the consolidated financial statements estimates were occasionally made by the senior executives of the Bank and of the consolidated entities in order to quantify certain of the assets, liabilities, income, expenses and commitments reported herein. These estimates, which were made on the basis of the best information available, relate basically to the following:
| - | The impairment losses on certain assets (Notes 6, 7, 8, 10, 12, 13, 16 and 17); |
| - | The assumptions used in the actuarial calculation of the post-employment benefit liabilities and commitments and other obligations (Note 25); |
| - | The useful life of the tangible and intangible assets (Notes 16 and 17); |
| - | The measurement of goodwill arising on consolidation (Note 17); and |
| - | The fair value of certain unquoted assets (Notes 8, 9 and 11). |
| d) | Other matters |
| i. Disputed corporate resolutions |
The directors of the Bank and their legal advisers consider that the objection to certain resolutions adopted by the Bank’s shareholders at the General Meetings on January 18, 2000, March 4, 2000, March 10, 2001, February 9, 2002, June 24, 2002, June 21, 2003, June 19, 2004 and June 18, 2005 will have no effect on the financial statements of the Bank and the Group.
On April 25, 2002, the Santander Court of First Instance number 1 rejected in full a claim contesting resolutions adopted at the General Meeting on January 18, 2000. The plaintiff filed an appeal against the judgment. On December 2, 2002, the Cantabria Provincial Appellate Court dismissed the appeal. A cassation appeal has been filed against the judgment of the Cantabria Provincial Appellate Court.
F-8
On November 29, 2002, the Santander Court of First Instance number 2 rejected in full the claims contesting resolutions adopted at the General Meeting on March 4, 2000. The plaintiffs filed an appeal against the judgment. On July 5, 2004, the Cantabria Provincial Appellate Court dismissed the appeal. One of the appellants has prepared and filed an extraordinary appeal on grounds of procedural infringements and a cassation appeal against the judgment.
On March 12, 2002, the Santander Court of First Instance number 4 rejected in full the claims contesting resolutions adopted at the General Meeting on March 10, 2001. The plaintiffs filed an appeal against the judgment. On April 13, 2004, the Cantabria Provincial Appellate Court dismissed the appeals. One of the appellants has prepared and filed an extraordinary appeal on grounds of procedural infringements and a cassation appeal against the judgment.
On September 9, 2002, the Santander Court of First Instance number 5 rejected in full the claim contesting resolutions adopted at the General Meeting on February 9, 2002. The plaintiff filed an appeal against the judgment. On January 14, 2004, the Cantabria Provincial Appellate Court dismissed the appeal. The appellant has prepared and filed an extraordinary appeal on grounds of procedural infringements and a cassation appeal against the judgment.
On May 29, 2003, the Santander Court of First Instance number 6 rejected in full the claim contesting the resolutions adopted at the General Meeting on June 24, 2002. An appeal has been filed against the judgment.
Despite the amount of time elapsed, the Santander Court of First Instance number 7 has yet to hand down its judgment on the objection to the resolutions adopted by the shareholders at the General Meeting on June 21, 2003, since it was agreed that the proceedings should be stayed on grounds of the need for an interlocutory decision in the criminal jurisdiction derived from the preliminary proceedings conducted at Central Examining Court number 3 in respect of the amounts paid when Mr. Amusátegui and Mr. Corcóstegui retired from the Bank. In this matter, an acquittal was handed down on April 13, 2005, and a cassation appeal was filed against it by the private prosecution. A new claim has also been filed with the Santander Court of First Instance number 7 to contest the resolutions adopted by the shareholders at the same General Meeting on June 21, 2003. This proceeding has been joined with the foregoing proceeding, which means that it is subject to the effects of the stay on grounds of the need for an interlocutory decision in the criminal jurisdiction.
On October 28, 2005, the Santander Court of First Instance number 8 rejected in full the claims contesting the resolutions adopted at the General Meeting on June 19, 2004. An appeal has been filed against the judgment.
The claims contesting the resolutions adopted at the General Meeting on June 18, 2005, are currently being processed at the Santander Court of First Instance number 10.
| ii. Credit assignment transactions |
Following the investigations carried out since 1992 by the Madrid Central Examining Court number 3, “abbreviated” proceeding no. 53/92 is currently underway under Article 757 of the Spanish Criminal Procedure Law, to determine the liabilities related to certain credit assignment transactions carried out by Banco Santander, S.A. from 1987 to 1989.
The Court handed down an order on July 16, 1996, following a request to this effect from the Government Lawyer and after having consulted the State Tax Agency, to dismiss the actions against the Bank and its executives in respect of the income derived from the aforementioned transactions. Subsequently, the Government Lawyer, as the representative of the Public Treasury, and the Public Prosecutor’s Office have repeatedly applied to have the case against the Bank and its executives dismissed and struck out. However, a decision was rendered on June 27, 2002 to turn the aforementioned preliminary court proceedings into an “abbreviated” proceeding under Article 757 of the Spanish Criminal Procedure Law. The Public Prosecutor’s Office, the Bank and its executives have appealed against this decision.
F-9
On June 23, 2003, Panel Two of the Criminal Chamber of the National Appellate Court partially upheld these appeals, and explicitly recognized that the assignments of naked credit ownership were lawfully marketed and reduced the proceedings from 138 to 38 customer transactions (it should be noted that the Government Lawyer and the Public Prosecutor’s Office have also requested dismissal and strike-out of the case on grounds that no offence had been committed) with respect to which the Bank’s possible involvement is still being alleged.
Following the submissions phase, in which the Public Prosecutor’s Office and the Government Lawyer reiterated their petition to have the proceedings dismissed and struck out, based on the class accusation filed by the Association for the Defense of Investors and Consumers, on October 6, 2004 the Court ordered commencement of a trial for cumulative offences of misrepresentation and forgery of official documents, three cumulative offences of misrepresentation and forgery of commercial documents and thirty offences against the Public Treasury, against the Chairman of the Bank and three executives and ordered that they post a bond to cover fines and costs, on a joint and several basis, for EUR 67.8 million which has been subsequently reduced to EUR 40.1 million. Pursuant to the order, Section One of the Criminal Chamber of the National Appellate Court has been designated as the body with jurisdiction to conduct the trial.
| e) | Information relating to 2004 |
The information relating to 2004 contained in these Notes to the consolidated financial statements is presented with the information relating to 2005 for comparison purposes only and, accordingly, it does not constitute the Group’s statutory consolidated financial statements for 2004.
| f) | Capital requirements |
Through the publication of Law 13/1992, of June 1, and of Bank of Spain Circular 5/1993 and subsequent amendments thereto, the regulations governing the minimum capital requirements for credit institutions –both at entity level and at consolidated group level– came into force.
At December 31, 2005, the Group’s eligible capital exceeded the minimum requirements by EUR 10,384 million.
| g) | Environmental impact |
In view of the business activities carried on by the Group entities, the Group does not have any environmental liability, expenses, assets, provisions or contingencies that might be material with respect to its consolidated equity, financial position or results. Therefore, no specific disclosures relating to environmental issues are included in these Notes to the consolidated financial statements.
| h) | Subsequent events |
From January 1, 2006 to the date on which these consolidated financial statements were authorized for issue there were no events significantly affecting them. See also Note 58.6.m.
F-10
2. Accounting policies and rules and measurement basis |
The accounting policies and rules and measurement bases applied in preparing the consolidated financial statements were as follows:
| a) | Foreign currency transactions |
| i. | Functional currency |
The Group’s functional currency is the euro. Therefore, all balances and transactions denominated in currencies other than the euro are deemed to be denominated in “foreign currency”.
| ii. | Translation of foreign currency balances |
Foreign currency balances are translated to euros in two consecutive stages:
| - | Translation of foreign currency to the functional currency (currency of the main economic environment in which the Group operates); and |
| - | Translation to euros of the balances held in the functional currencies of entities whose functional currency is not the euro. |
Translation of foreign currency to the functional currency
Foreign currency transactions performed by consolidated entities (or entities accounted for using the equity method) not located in EMU countries are initially recognized in their respective currencies. Monetary items in foreign currency are subsequently translated to their functional currencies using the closing rate.
Furthermore:
| - | Non-monetary items measured at historical cost are translated to the functional currency at the exchange rate at the date of acquisition. |
| - | Non-monetary items measured at fair value are translated at the exchange rate on the date when the fair value was determined. |
| - | Income and expenses are translated at the average exchange rates for the period for all the transactions performed during the year. |
| - | The balances arising from non-hedging forward foreign currency/foreign currency and foreign currency/euro purchase and sale transactions are translated at the closing rates prevailing in the forward foreign currency market for the related maturity. |
Translation of functional currencies to euros
If the functional currency is not the euro, the balances in the financial statements of the consolidated entities (or entities accounted for using the equity method) are translated to euros as follows:
| - | Assets and liabilities, at the closing rate. |
| - | Income and expenses, at the average exchange rates for the year. |
| - | Equity items, at the historical exchange rates. |
F-11
| iii. | Recognition of exchange differences |
The exchange differences arising on the translation of foreign currency balances to the functional currency are generally recognized at their net amount under “Exchange Differences” in the consolidated income statement, except for exchange differences arising on financial instruments at fair value through profit or loss, which are recognized in the consolidated income statement without distinguishing them from other changes in fair value, and exchange differences arising on non-monetary items measured at fair value through equity, which are recognized under “Valuation Adjustments - Exchange Differences”.
The exchange differences arising on the translation to euros of the financial statements in functional currencies other than the euro are recognized under “Valuation Adjustments - Exchange Differences” in the consolidated balance sheet until the related item is derecognized, when they are recognized in the consolidated income statement.
| iv. | Entities located in hyperinflationary economies |
None of the functional currencies of the consolidated subsidiaries and associates located abroad relate to hyperinflationary economies as defined by the IFRS adopted by the European Union. Accordingly, at 2005 year-end it was not necessary to adjust the financial statements of any of the consolidated subsidiaries or associates to correct for the effect of inflation.
| v. | Exposure to foreign currency risk |
At December 31, 2005, the Group’s highest levels of exposure on more temporary positions (with a potential impact on the income statement) were concentrated, in descending order, on the US dollar, the Chilean peso, the pound sterling and the Mexican peso. At that date, its highest levels of exposure on more permanent positions (with a potential impact on equity) were concentrated, in descending order, on the Brazilian real, the pound sterling, the Mexican peso and the US dollar.
| b) | Basis of consolidation |
| i. | Subsidiaries |
“Subsidiaries” are defined as entities over which the Bank has the capacity to exercise management control; this capacity is, in general but not exclusively, presumed to exist when the Parent owns directly or indirectly half or more of the voting power of the investee or, even if this percentage is lower or zero, when, as in the case of agreements with shareholders of the investee, the Bank is granted control. Control is the power to govern the financial and operating policies of an entity so as to obtain benefits from its activities.
The financial statements of the subsidiaries are fully consolidated with those of the Bank. Accordingly, all balances and transactions between consolidated entities are eliminated on consolidation.
On acquisition of a subsidiary, its assets, liabilities and contingent liabilities are recognized at fair value at the date of acquisition. Any positive differences between the acquisition cost and the fair values of the identifiable net assets acquired are recognized as goodwill (Note 17). Negative differences are charged to income on the date of acquisition.
The share of third parties of the Group’s equity is presented under “Minority Interests” in the consolidated balance sheet (Note 28) and their share of the profit for the year is presented under “Profit Attributed to Minority Interests” in the consolidated income statement.
The results of subsidiaries acquired during the year are included in the consolidated income statement from the date of acquisition to year-end. Similarly, the results of subsidiaries disposed of during the year are included in the consolidated income statement from the beginning of the year to the date of disposal.
F-12
The Exhibits contain significant information on these entities.
| ii. | Interests in joint ventures (jointly controlled entities) |
“Joint ventures” are deemed to be ventures that are not subsidiaries but which are jointly controlled by two or more unrelated entities. This is evidenced by contractual arrangements whereby two or more entities (“venturers”) acquire interests in entities (jointly controlled entities) or undertake operations or hold assets so that strategic financial and operating decisions affecting the joint venture require the unanimous consent of the venturers.
The financial statements of investees classified as joint ventures are proportionately consolidated with those of the Bank and, therefore, the aggregation of balances and subsequent eliminations are made only in proportion to the Group’s ownership interest in the capital of these entities.
The Exhibits contain significant information on these entities.
| iii. | Associates |
Associates are entities over which the Bank is in a position to exercise significant influence, but not control or joint control, usually because it holds 20% or more of the voting power of the investee.
In the consolidated financial statements, investments in associates are accounted for using the equity method, i.e. at the Group’s share of net worth of the investee, after taking into account the dividends received therefrom and other equity eliminations. In the case of transactions with an associate, the related profits or losses are eliminated to the extent of the Group’s interest in the associate.
The Exhibits contain significant information on these entities.
| iv. | Other matters |
The companies less than 50% owned by the Group that constituted a decision-making unit at December 31, 2005 and which, therefore, were accounted for as subsidiaries are: (i) Inmuebles B de V 1985 C.A. and (ii) Servicios Universia Venezuela S.U.V., S.A., in which the Group held ownership interests of 35.11% and 33.37%, respectively, at that date (Exhibit I).
The companies less than 20% owned by the Group over which it exercises significant influence and which, therefore, were accounted for as associates are: (i) Attijariwafa Bank Société Anonyme (Attijariwafa) and (ii) Sociedad Operadora de la Cámara de Compensación de Pagos de Alto Valor, S.A., in which the Group held ownership interests of 14.55% and 15.28%, respectively, at that date (Exhibit II).
| v. | Business combinations |
A business combination is the bringing together of two or more separate entities or economic units into one single entity or group of entities.
Business combinations performed on or after January 1, 2004 whereby the Group obtains control over an entity are recognized for accounting purposes as follows:
| - | The Group measures the cost of the business combination, defined as the fair value of the assets given, the liabilities incurred and the equity instruments issued, if any, by the entity. |
| - | The fair values of the assets, liabilities and contingent liabilities of the acquiree, including any intangible assets which might have not been recognized by the acquiree, are estimated and recognized in the consolidated balance sheet. |
F-13
| - | Any negative difference between the net fair value of the assets, liabilities and contingent liabilities of the acquiree and the business combination cost is recognized as discussed in Note 2-m; any positive difference is recognized in “Other Gains” in the consolidated income statement. |
When shares in an entity are acquired in stages, the following criteria are applied until as a result of a given purchase the Group obtains control over the investee:
| - | The cost of the business combination is the aggregate cost of the individual transactions. |
| - | At each of the share acquisition dates, and until control over the acquiree is obtained, goodwill or negative goodwill is calculated separately for each transaction using the criteria explained above in this Note. |
| - | Any difference between the fair value of the items of the acquiree on each of the successive acquisition dates and their fair value on the date of acquisition of control of the acquiree is recognized as a revaluation of the related assets and liabilities. |
Furthermore, purchases of minority interests subsequent to the date on which control of an entity is obtained are recognized as equity transactions; i.e. the difference between the price paid and the proportion of ownership interest acquired from minority interests at the carrying amount is recognized in consolidated equity.
| vi. | Acquisitions and disposals |
Note 3 provides information on the most significant acquisitions and disposals in 2005 and 2004.
| c) | Definitions and classification of financial instruments |
| i. | Definitions |
A “financial instrument” is any contract that gives rise to a financial asset of one entity and, simultaneously, to a financial liability or equity instrument of another entity.
An “equity instrument” is any agreement that evidences a residual interest in the assets of the issuing entity after deducting all of its liabilities.
A “financial derivative” is a financial instrument whose value changes in response to the change in an observable market variable (such as an interest rate, foreign exchange rate, financial instrument price, market index or credit rating), whose initial investment is very small compared with other financial instruments with a similar response to changes in market factors, and which is generally settled at a future date.
“Hybrid financial instruments” are contracts that simultaneously include a non-derivative host contract together with a derivative, known as an embedded derivative, that is not separately transferable and has the effect that some of the cash flows of the hybrid contract vary in a way similar to a stand-alone derivative.
“Compound financial instruments” are contracts that simultaneously create for their issuer a financial liability and an own equity instrument (such as convertible bonds, which entitle their holders to convert them into equity instruments of the issuer).
The following transactions are not treated for accounting purposes as financial instruments:
| - | Investments in subsidiaries, joint ventures and associates (Note 13). |
| - | Rights and obligations under employee benefit plans (Note 25). |
| - | Rights and obligations under insurance contracts (Note 15). |
F-14
| - | Contracts and obligations relating to employee remuneration based on own equity instruments (Note 33). |
| ii. | Classification of financial assets for measurement purposes |
Financial assets are initially classified into the various categories used for management and measurement purposes, unless they have to be presented as “non-current assets held for sale” or they relate to “cash and balances with central banks”, “changes in the fair value of hedged items in portfolio hedges of interest rate risk” (asset side), “hedging derivatives” and “investments”, which are reported separately.
Financial assets are included for measurement purposes in one of the following categories:
| - | Financial assets held for trading (at fair value through profit or loss): this category includes the financial assets acquired for the purpose of generating a profit in the near term from fluctuations in their prices and financial derivatives that are not designated as hedging instruments. |
| - | Other financial assets at fair value through profit or loss: this category includes hybrid financial assets not held for trading that are measured entirely at fair value and financial assets not held for trading that are managed jointly with “liabilities under insurance contracts” measured at fair value or with derivative financial instruments whose purpose and effect is to significantly reduce exposure to variations in fair value, or that are managed jointly with financial liabilities and derivatives for the purpose of significantly reducing overall exposure to interest rate risk. |
Financial instruments included in this category (and “Other Financial Liabilities at Fair Value through Profit or Loss”) are permanently subject to an integrated and consistent system of measuring, managing and controlling risks and returns that enables all the financial instruments involved to be monitored and identified and allows the effective reduction of risk to be checked.
| - | Available-for-sale financial assets: this category includes debt instruments not classified as “held-to-maturity investments” or as “financial assets at fair value through profit or loss”, and equity instruments issued by entities other than subsidiaries, associates and jointly controlled entities, provided that such instruments have not been classified as “financial assets held for trading” or as “other financial assets at fair value through profit or loss”. |
| - | Loans and receivables: this category includes financing granted to third parties, based on their nature, irrespective of the type of borrower and the form of financing, including finance lease transactions in which the consolidated entities act as lessors. |
The consolidated entities generally intend to hold the loans and credits granted by them until their final maturity and, therefore, they are presented in the consolidated balance sheet at their amortized cost (which includes the required adjustments to reflect estimated impairment losses).
| - | Held-to-maturity investments: this category includes debt instruments with fixed maturity and with fixed or determinable payments. |
| iii. | Classification of financial assets for presentation purposes |
Financial assets are classified by nature into the following items in the consolidated balance sheet:
| - | Cash and balances with central banks: cash balances and balances receivable on demand relating to deposits with the Bank of Spain and other central banks. |
| - | Loans and advances to credit institutions: credit of any nature in the name of credit institutions. |
| - | Money market operations through counterparties: amount of the money market operations conducted through central counterparties. |
F-15
| - | Loans and advances to customers: all credit granted by the Group, other than that represented by marketable securities, money market operations through central counterparties, finance lease receivables and loans and advances to credit institutions. |
| - | Debt instruments: bonds and other securities that represent a debt for their issuer, that generate an interest return, and that are in the form of certificates or book entries. |
| - | Other equity instruments: financial instruments issued by other entities, such as shares and non-voting equity units, which have the nature of equity instruments for the issuer, unless they are investments in subsidiaries, jointly controlled entities or associates. Mutual fund units are included in this item. |
| - | Trading derivatives: includes the fair value in favor of the Group of derivatives which do not form part of hedge accounting. |
| - | Other financial assets: other debit balances in favor of the Group in respect of transactions which do not have the nature of credit (such as checks drawn on credit institutions, the amounts receivable from clearing houses and settlement agencies for transactions on the stock exchange and organized markets, bonds given in cash, capital calls, and fees and commissions receivable for financial guarantees). |
| - | Changes in the fair value of hedged items in portfolio hedges of interest rate risk: this item is the balancing entry for the amounts credited to the consolidated income statement in respect of the measurement of the portfolios of financial instruments which are efficiently hedged against interest rate risk through fair value hedging derivatives. |
| - | Hedging derivatives: includes the fair value in favor of the Group of derivatives designated as hedging instruments in hedge accounting. |
| - | Investments: includes the investments in the share capital of associates. |
| iv. | Classification of financial liabilities for measurement purposes |
Financial liabilities are initially classified into the various categories used for management and measurement purposes, unless they have to be presented as “liabilities associated with non-current assets held for sale” or they relate to “hedging derivatives”, “changes in the fair value of hedged items in portfolio hedges of interest rate risk” (liability side) and “equity having the substance of a financial liability”, which are reported separately.
Financial liabilities are classified for measurement purposes into one of the following categories:
| - | Financial liabilities held for trading (at fair value through profit or loss): this category includes the financial liabilities issued for the purpose of generating a profit in the near term from fluctuations in their prices, financial derivatives not considered to qualify for hedge accounting and financial liabilities arising from the outright sale of financial assets purchased under reverse repurchase agreements or borrowed (“short positions”). |
| - | Other financial liabilities at fair value through profit or loss: this category includes all hybrid financial liabilities not held for trading that have to be measured entirely at fair value, including life insurance linked to mutual funds that does not expose the issuer of the contract to a significant insurance risk, when the financial assets to which they are linked are also measured at fair value through profit or loss. |
| - | Financial liabilities at fair value through equity: financial liabilities associated with available-for-sale financial assets arising as a result of transfers of assets in which the (consolidated entity) transferors neither transfer nor retain substantially all the risks and rewards of ownership of the assets. |
| - | Financial liabilities at amortized cost: financial liabilities not included in any of the above-mentioned categories which arise from the ordinary deposit-taking activities carried on by financial institutions, irrespective of their instrumentation and maturity. |
F-16
v. | Classification of financial liabilities for presentation purposes |
Financial liabilities are classified by nature into the following items in the consolidated balance sheet: |
| - | Deposits from credit institutions: deposits of any nature, including credit and money market operations received in the name of credit institutions. |
| - | Money market operations through counterparties: amount of the money market operations conducted through central counterparties. |
| - | Customer deposits: includes all repayable balances received in cash by the Group, other than those represented by marketable securities, money market operations through central counterparties, subordinated liabilities and deposits from central banks and credit institutions. |
| - | Debt securities: includes the amount of bonds and other debt represented by marketable securities, other than subordinated liabilities. This item includes the component considered to be a financial liability of issued securities that are compound financial instruments. |
| - | Trading derivatives: includes the fair value of the Group’s liability in respect of derivatives which do not form part of hedge accounting. |
| - | Deposits from central banks: deposits of any nature received from the Bank of Spain or other central banks. |
| - | Short positions: includes the amount of financial liabilities arising from the outright sale of financial assets purchased under reverse repurchase agreements or borrowed. |
| - | Subordinated liabilities: amount of financing received which, for the purposes of payment priority, ranks behind ordinary debt. |
| - | Other financial liabilities: includes the amount of payment obligations having the nature of financial liabilities not included in other items. |
| - | Changes in the fair value of hedged items in portfolio hedges of interest rate risk: this item is the balancing entry for the amounts charged to the consolidated income statement in respect of the measurement of the portfolios of financial instruments which are efficiently hedged against interest rate risk through fair value hedging derivatives. |
| - | Hedging derivatives: includes the fair value of the Group’s liability in respect of derivatives designated as hedging instruments in hedge accounting. |
| - | Equity having the substance of a financial liability: amount of the financial instruments issued by the consolidated entities that, although equity for legal purposes, do not meet the requirements for classification as equity. |
F-17
d) | Measurement of financial assets and liabilities and recognition of fair value changes |
In general, financial assets and liabilities are initially recognized at fair value which, in the absence of evidence to the contrary, is deemed to be the transaction price, and are subsequently measured at each period-end as follows: |
| i. | Measurement of financial assets |
Financial assets are measured at fair value, except for loans and receivables, held-to-maturity investments, equity instruments whose fair value cannot be determined in a sufficiently objective manner and financial derivatives that have those equity instruments as their underlying and are settled by delivery of those instruments.
The “fair value” of a financial instrument on a given date is taken to be the amount for which it could be bought or sold on that date by two knowledgeable, willing parties in an arm’s length transaction acting prudently. The most objective and common reference for the fair value of a financial instrument is the price that would be paid for it on an active, transparent and deep market (“quoted price” or “market price”).
If there is no market price for a given financial instrument, its fair value is estimated on the basis of the price established in recent transactions involving similar instruments and, in the absence thereof, of valuation techniques sufficiently used by the international financial community, taking into account the specific features of the instrument to be measured and, particularly, the various types of risk associated with it.
All derivatives are recognized in the balance sheet at fair value from the trade date. If the fair value is positive, they are recognized as an asset and if the fair value is negative, they are recognized as a liability. The fair value on the trade date is deemed, in the absence of evidence to the contrary, to be the transaction price. The changes in the fair value of derivatives from the trade date are recognized with a balancing entry in “Gains/Losses on Financial Assets and Liabilities” in the consolidated income statement. Specifically, the fair value of standard financial derivatives included in the portfolios of financial assets or liabilities held for trading is deemed to be their daily quoted price and if, for exceptional reasons, the quoted price cannot be determined on a given date, these financial derivatives are measured using methods similar to those used to measure OTC derivatives.
The fair value of OTC derivatives is taken to be the sum of the future cash flows arising from the instrument, discounted to present value at the date of measurement (“present value” or “theoretical close”) using valuation techniques commonly used by the financial markets: “net present value” (NPV), option pricing models and other methods.
Financial derivatives whose underlyings are equity instruments the fair value of which cannot be reliably measured and which are settled through delivery thereof are measured at cost.
“Loans and Receivables” and “Held-to-Maturity Investments” are measured at amortized cost using the effective interest method. “Amortized cost” is understood to be the acquisition cost of a financial asset or liability plus or minus, as appropriate, the principal repayments and the cumulative amortization (as reflected in the consolidated income statement) of the difference between the initial cost and the maturity amount. In the case of financial assets, amortized cost furthermore includes any reductions for impairment. In the case of loans and receivables hedged in fair value hedges, the changes in the fair value of these assets related to the risk or risks being hedged are recognized.
The effective interest rate is the discount rate that exactly matches the initial amount of a financial instrument to its estimated cash flows during its remaining life. For fixed rate financial instruments, the effective interest rate coincides with the contractual interest rate established on the acquisition date plus, where applicable, the fees and transaction costs that, because of their nature, form part of their financial performance. In the case of floating rate financial instruments, the effective interest rate coincides with the rate of return prevailing in all connections until the date on which the reference interest rate is to be revised again.
Unquoted equity instruments whose fair value cannot be determined in a sufficiently objective manner and financial derivatives that have those instruments as their underlying and are settled by delivery of those instruments are measured at acquisition cost adjusted, where appropriate, by any related impairment loss.
F-18
| ii. | Measurement of financial liabilities |
In general, financial liabilities are measured at amortized cost, as defined above, except for those included under “Financial Liabilities Held for Trading”, “Other Financial Liabilities at Fair Value through Profit or Loss” and “Financial Liabilities at Fair Value through Equity” and financial liabilities designated as hedged items (or hedging instruments) in fair value hedges, which are measured at fair value.
| iii. | Valuation techniques |
Following is a summary of the various valuation techniques used by the Group to measure the financial instruments included in “Financial Assets Held for Trading” and “Other Financial Assets at Fair Value through Profit or Loss” on the asset side of the consolidated balance sheet and in “Financial Liabilities Held for Trading”, “Financial Liabilities at Fair Value through Profit or Loss” and “Financial Liabilities at Fair Value through Equity” on the liability side of the consolidated balance sheet at December 31, 2005:
Market Value Based on: |
| Assets |
| Liabilities |
|
| |||
Public price quotations in active markets |
| 61.3% |
| 35.2% |
Internal valuation models with observable market data |
| 38.5% |
| 64.5% |
Internal valuation models with non-market data |
| 0.2% |
| 0.3% |
|
|
| ||
|
| 100.0% | 100.0% | |
| iv. | Recognition of fair value changes |
As a general rule, changes in the carrying amount of financial assets and liabilities are recognized in the consolidated income statement, distinguishing between those arising from the accrual of interest and similar items –which are recognized under “Interest and Similar Income” or “Interest Expense and Similar Charges”, as appropriate– and those arising for other reasons, which are recognized at their net amount under “Gains/Losses on Financial Assets and Liabilities”.
Adjustments due to changes in fair value arising from:
| - | “Available-for-Sale Financial Assets” are recognized temporarily in equity under “Valuation Adjustments – Available-for-Sale Financial Assets”, unless they relate to exchange differences, in which case they are recognized in “Valuation Adjustments – Exchange Differences (exchange differences arising on monetary financial assets are recognized in “Exchange Differences” in the consolidated income statement). |
| - | Items charged or credited to “Valuation Adjustments – Available-for-Sale Financial Assets” and “Valuation Adjustments – Exchange Differences” remain in the Group’s consolidated equity until the related assets are derecognized, whereupon they are charged to the consolidated income statement. |
| - | Unrealized gains on available-for-sale financial assets classified as “Non-Current Assets Held for Sale” because they form part of a disposal group or a discontinued operation are recognized with a balancing entry in “Valuation Adjustments - Non-Current Assets Held For Sale”. |
| - | “Financial Liabilities at Fair Value through Equity” are recognized with a balancing entry in “Valuation Adjustments – Financial Liabilities at Fair Value through Equity”. |
F-19
v. | Hedging transactions |
The consolidated entities use financial derivatives for the purpose of trading with customers who request these instruments in order to manage their own market and credit risks and for investment purposes; for the purpose of managing the risks of the Group entities’ own positions and assets and liabilities (“hedging derivatives”); or for the purpose of obtaining gains from changes in the prices of these derivatives.
Financial derivatives that do not qualify for hedge accounting are treated for accounting purposes as trading derivatives.
A derivative qualifies for hedge accounting if it meets all of the following conditions:
| 1. | The derivative hedges one of the following three types of exposure: |
| a. | Changes in the fair value of assets and liabilities due to fluctuations in, inter alia, the interest rate and/or exchange rate to which the position or balance to be hedged is subject (“fair value hedge”); |
| b. | Changes in the estimated cash flows arising from financial assets and liabilities, commitments and highly probable forecast transactions (“cash flow hedge”); |
| c. | The net investment in a foreign operation (“hedge of a net investment in a foreign operation”). |
| 2. | It is effective in offsetting exposure inherent in the hedged item or position throughout the expected term of the hedge, which means that: |
| a. | At the date of arrangement the hedge is expected, under normal conditions, to be highly effective (“prospective effectiveness”). |
| b. | There is sufficient evidence that the hedge was fully effective during the whole life of the hedged item or position (“retrospective effectiveness”). |
| 3. | There must be adequate documentation evidencing the specific designation of the financial derivative to hedge certain balances or transactions and how this hedge was intended to be achieved and measured, provided that this is consistent with the Group’s management of own risks. |
The changes in value of financial instruments qualifying for hedge accounting are recognized as follows:
| a. | In fair value hedges, the changes arising on both the hedging instruments and the hedged items (attributable to the type of risk being hedged) are recognized directly in the consolidated income statement. |
In fair value hedges of interest rate risk on a portfolio of financial instruments, the gains or losses that arise on measuring the hedging instruments are recognized directly in the consolidated income statement, whereas the gains or losses due to changes in the fair value of the hedged amount (attributable to the hedged risk) are recognized in the consolidated income statement with a balancing entry under “Changes in the Fair Value of Hedged Items in Portfolio Hedges of Interest Rate Risk” on the asset or liability side of the balance sheet, as appropriate.
| b. | In cash flow hedges, the effective portion of the change in value of the hedging instrument is recognized temporarily in equity under “Valuation Adjustments - Cash Flow Hedges” until the forecast transactions occur, when it is recognized in the consolidated income statement, unless, if the forecast transactions result in the recognition of non-financial assets or liabilities, it is included in the cost of the non-financial asset or liability. The ineffective portion of the changes in value of the hedging derivatives is recognized directly in the consolidated income statement. |
F-20
| c. | In hedges of a net investment in a foreign operation, the gains and losses attributable to the portion of the hedging instruments qualifying as an effective hedge are recognized temporarily in equity under “Valuation Adjustments - Hedges of Net Investments in Foreign Operations” until the gains or losses on the hedged item are recognized in the consolidated income statement. |
| d. | The ineffective portion of the gains and losses on the hedging instruments of cash flow hedges and hedges of a net investment in a foreign operation are recognized directly under “Gains/Losses on Financial Assets and Liabilities” in the consolidated income statement. |
Derivatives embedded in other financial instruments or in other host contracts are accounted for separately as derivatives if their risks and characteristics are not closely related to those of the host contracts, provided that the host contracts are not classified as “Other Financial Assets/Liabilities at Fair Value through Profit or Loss” or as “Financial Assets/Liabilities Held for Trading”.
e) | Derecognition of financial assets and liabilities |
The accounting treatment of transfers of financial assets depends on the extent to which the risks and rewards associated with the transferred assets are transferred to third parties:
| 1. | If the Group transfers substantially all the risks and rewards to third parties –unconditional sale of financial assets, sale of financial assets under an agreement to repurchase them at their fair value at the repurchase date, sale of financial assets with a purchased call option or written put option that is deeply out of the money, securitization of assets in which the transferor does not retain a subordinated debt or grant any credit enhancement to new holders and other similar cases-, the transferred financial asset is derecognized and any right or obligation retained or created in the transfer is recognized simultaneously. |
| 2. | If the Group retains substantially all the rights and rewards associated with the transferred financial asset –sale of financial assets under an agreement to repurchase them for a fixed price or the sale price plus interest, a securities lending agreement in which the borrower undertakes to return the same or similar assets and other similar cases–, the transferred financial asset is not derecognized and continues to be measured by the same criteria used before the transfer. However: |
| a. | An associated financial liability is recognized for an amount equal to the consideration received. This liability is subsequently measured at amortized cost. |
| b. | The income from the transferred financial asset not derecognized and any expense incurred on the new financial liability are recognized in the consolidated income statement. |
| 3. | If the Group neither transfers nor retains substantially all the risks and rewards associated with the transferred financial asset –sale of financial assets with a purchased call option or written put option that is not deeply in or out of the money, securitization of assets in which the transferor retains a subordinated debt or other type of credit enhancement for a portion of the transferred asset and other similar cases–, the following distinction must be made: |
| a. | If the transferor does not retain control, the transferred financial asset is derecognized and any right or obligation retained or created in the transfer is recognized. |
| b. | If the transferor retains control, it continues to recognize the transferred financial asset for an amount equal to its exposure to changes in value and recognizes a financial liability associated with the transferred financial asset. The net carrying amount of the transferred asset and the associated liability shall be the amortized cost of the rights and obligations retained, if the transferred asset is measured at amortized cost, or the fair value of the rights and obligations retained, if the transferred asset is measured at fair value. |
Accordingly, financial assets are only derecognized when the rights on the cash flows they generate have been extinguished or when substantially all the inherent risks and rewards have been transferred. Similarly, financial liabilities are only derecognized when the obligations they generate have been extinguished or when they are acquired (with the intention either to cancel them or to re-place them).
F-21
f) | Offsetting of financial instruments |
Financial asset and liability balances are offset, i.e. presented in the consolidated balance sheet at their net amount, only if the subsidiaries currently have a legally enforceable right to set off the recognized amounts and intend either to settle them on a net basis or to realize the asset and pay the liability simultaneously.
g) | Impairment of financial assets | |||
i. | Definition |
A financial asset is considered to be impaired –and therefore its carrying amount is adjusted to reflect the effect of impairment– when there is objective evidence that events have occurred which:
| - | In the case of debt instruments (loans and debt securities), give rise to a negative impact on the future cash flows that were estimated at the transaction date. |
| - | In the case of equity instruments, mean that their carrying amount cannot be fully recovered. |
As a general rule, the carrying amount of impaired financial instruments is adjusted with a charge to the consolidated income statement for the period in which the impairment becomes evident, and the reversal of previously recognized impairment losses, if any, is recognized in the consolidated income statement for the year in which the impairment ceases to exist or is reduced.
Balances are deemed to be impaired, and the interest accrual is suspended, when there are reasonable doubts as to their full recovery and/or the collection of the related interest for the amounts and on the dates initially agreed upon, after taking into account the guarantees received by the consolidated entities to secure (fully or partially) collection of the related balances. Collections relating to impaired loans and advances are used to recognize the accrued interest and the remainder, if any, to reduce the principal amount outstanding.
When the recovery of any recognized impairment is considered unlikely, the amount of the impairment is derecognized, without prejudice to any actions that the consolidated entities may initiate to seek collection of the amount receivable until their contractual rights are extinguished by expiry of the statute-of-limitations period, forgiveness or any other cause.
ii. | Debt instruments measured at amortized cost |
The amount of an impairment loss incurred on a debt instrument measured at amortized cost is equal to the difference between its carrying amount and the present value of its estimated future cash flows, and is presented as a reduction of the balance of the asset adjusted.
In estimating the future cash flows of debt instruments the following should be taken into account:
| - | All the amounts that are expected to be obtained over the residual life of the instrument; including, where appropriate, those which may result from the collateral provided for the instrument (less the costs for obtaining and subsequently selling the collateral). The impairment loss takes into account the likelihood of collecting accrued interest receivable. |
| - | The various types of risk to which each instrument is subject, and | |
| - | The circumstances in which collections will foreseeably be made. |
These cash flows are subsequently discounted using the instrument’s effective interest rate (if its contractual rate is fixed) or the effective contractual rate at the discount date (if it is variable).
Specifically as regards impairment losses resulting from materialization of the insolvency risk of the obligors (credit risk), a debt instrument is impaired due to insolvency:
F-22
| - | When there is evidence of a deterioration of the obligor’s ability to pay, either because it is in arrears or for other reasons, and/or |
| - | When country-risk materializes: country-risk is considered to be the risk associated with debtors resident in a given country due to circumstances other than normal commercial risk. |
Impairment losses on these assets are assessed as follows:
| - | Individually, for all significant debt instruments and for instruments which, although not material, are not susceptible to being classified in homogeneous groups of instruments with similar risk characteristics: instrument type, debtor’s industry and geographical location, type of guarantee or collateral, and age of past-due amounts. |
| - | Collectively in all other cases. The Group classifies transactions on the basis of the nature of the obligors, the conditions of the countries in which they reside, transaction status and type of collateral or guarantee, and age of past-due amounts. For each risk group, it establishes the minimum impairment losses (“identified losses”) that must be recognized. |
In addition to the recognition of identified losses, the Group recognizes an impairment allowance for losses inherent to debt instruments not measured at fair value through profit or loss and to contingent liabilities classified as standard risk taking into account the historical loss experience and other circumstances known at the time of assessment. For these purposes, inherent losses are losses incurred at the reporting date, calculated using statistical methods, that have not yet been allocated to specific transactions.
The inherent impairment losses on risks accounted for by the Spanish entities (and on transactions performed in the name of residents in Spain and accounted for by the foreign consolidated entities) are quantified by application of the parameters established by the Bank of Spain based on its experience and on the information available to it on the Spanish banking industry.
The Group has in place a corporate methodology for the classification of credit risk and the criteria applied by it for the calculation of impairment losses at its foreign subsidiaries are consistent with those used for the Spanish financial institutions.
The impairment losses recognized at any given time are the sum of the losses on specific transactions and the inherent impairment losses.
| iii. | Debt or equity instruments classified as available-for-sale |
The amount of the impairment losses on these instruments is the positive difference between their acquisition cost (net of any principal repayment or amortization in the case of debt instruments) and their fair value less any impairment loss previously recognized in the consolidated income statement.
When there is objective evidence that the losses arising on measurement of these instruments are due to impairment, they are no longer recognized in equity under “Valuation Adjustments – Available-for-Sale Financial Assets” and are recorded, for the cumulative amount at the date of measurement, in the consolidated income statement. If all or part of the impairment losses are subsequently reversed, the reversed amount is recognized in the consolidated income statement for the year in which the reversal occurred (under “Valuation Adjustments – Available-for-Sale Financial Assets” in the case of equity instruments).
| iv. | Equity instruments measured at cost |
The impairment loss on equity instruments measured at cost is the difference between the carrying amount and the present value of the expected future cash flows discounted at the market rate of return for similar securities.
F-23
Impairment losses are recognized in the consolidated income statement for the period in which they arise as a direct reduction of the cost of the instrument. These losses can only be reversed subsequently in the case of the sale of the related assets.