Table of Contents
| o | REGISTRATION STATEMENT PURSUANT TO SECTION 12(b) OR (g) OF THE SECURITIES EXCHANGE ACT OF 1934 |
| þ | ANNUAL REPORT PURSUANT TO SECTION 13 OR 15(d) OF THE SECURITIES EXCHANGE ACT OF 1934 |
| o | TRANSITION REPORT PURSUANT TO SECTION 13 OR 15(d) OF THE SECURITIES EXCHANGE ACT OF 1934 |
| o | SHELL COMPANY REPORT PURSUANT TO SECTION 13 OR 15(d) OF THE SECURITIES EXCHANGE ACT OF 1934 |
(Jurisdiction of incorporation)
Ciudad Grupo Santander
28660 Boadilla del Monte (Madrid), Spain
(address of principal executive offices)
Banco Santander, S.A.
Ciudad Grupo Santander
28660 Boadilla del Monte
Madrid, Spain
Tel: +34 91 289 32 80
Fax: +34 91 257 12 82
(Name, Telephone, E-mail and/or Facsimile number and Address of Company Contact Person)
| Name of each exchange | ||||
| Title of each class | on which registered | |||
| American Depositary Shares, each representing the right to receive one Share of Capital Stock of Banco Santander, S.A., par value Euro 0.50 each | New York Stock Exchange | |||
| Shares of Capital Stock of Banco Santander, S.A., par value Euro 0.50 each | New York Stock Exchange | |||
| Non-cumulative Guaranteed Preferred Stock of Santander Finance Preferred, S.A. Unipersonal, Series 1, 4, 5 and 6 | New York Stock Exchange | |||
| Guarantee of Non-cumulative Guaranteed Preferred Stock of Santander Finance Preferred, S.A. Unipersonal, Series 1,4,5 and 6 | ||||
| * | Banco Santander Shares are not listed for trading, but only in connection with the registration of the American Depositary Shares, pursuant to requirements of the New York Stock Exchange. |
None.
(Title of Class)
Securities for which there is a reporting obligation pursuant to Section 15(d) of the Act
None.
(Title of Class)
Shares par value Euro 0.50 each: 6,254,296,579
| Non-cumulative Preferred Securities, Series 1 | 7,600,000 | |||
| Non-cumulative Preferred Securities, Series 4 | 20,000,000 | |||
| Non-cumulative Preferred Securities, Series 5 | 24,000,000 | |||
| Non-cumulative Preferred Securities, Series 6 | 14,000,000 |
| �� | ||||||
| Large accelerated filerþ | Accelerated filero | Non-accelerated filero |
12b-2 of the Exchange Act).
Table of Contents
| Page | ||||
| 3 | ||||
| 4 | ||||
| 6 | ||||
| 6 | ||||
| 6 | ||||
| 6 | ||||
| 11 | ||||
| 11 | ||||
| 11 | ||||
| 16 | ||||
| 16 | ||||
| 25 | ||||
| 81 | ||||
| 81 | ||||
| 81 | ||||
| 81 | ||||
| 87 | ||||
| 113 | ||||
| 115 | ||||
| 115 | ||||
| 116 | ||||
| 117 | ||||
| 118 | ||||
| 118 | ||||
| 125 | ||||
| 145 | ||||
| 155 | ||||
| 157 | ||||
| 158 | ||||
| 158 | ||||
| 159 | ||||
| 159 | ||||
| 160 | ||||
| 160 | ||||
| 163 | ||||
Table of Contents
| Page | ||||||||
| 163 | ||||||||
| 163 | ||||||||
| 165 | ||||||||
| 165 | ||||||||
| 170 | ||||||||
| 170 | ||||||||
| 170 | ||||||||
| 170 | ||||||||
| 170 | ||||||||
| 170 | ||||||||
| 178 | ||||||||
| 178 | ||||||||
| 178 | ||||||||
| 183 | ||||||||
| 183 | ||||||||
| 183 | ||||||||
| 183 | ||||||||
| 184 | ||||||||
| 184 | ||||||||
| 186 | ||||||||
| 186 | ||||||||
| 202 | ||||||||
| 205 | ||||||||
| 207 | ||||||||
| 210 | ||||||||
| 213 | ||||||||
| 214 | ||||||||
| 234 | ||||||||
| 234 | ||||||||
| 234 | ||||||||
| 234 | ||||||||
| 234 | ||||||||
| 235 | ||||||||
| 235 | ||||||||
| 235 | ||||||||
| 235 | ||||||||
| 238 | ||||||||
| 238 | ||||||||
| 238 | ||||||||
| 239 | ||||||||
| 239 | ||||||||
| 240 | ||||||||
| 240 | ||||||||
| 240 | ||||||||
| Exhibit 1.1 | ||||||||
| Exhibit 1.2 | ||||||||
| Exhibit 1.3 | ||||||||
| Exhibit 1.4 | ||||||||
| Exhibit 12.1 | ||||||||
| Exhibit 12.2 | ||||||||
| Exhibit 12.3 | ||||||||
| Exhibit 13.1 | ||||||||
| Exhibit 15.1 | ||||||||
| Exhibit 15.2 | ||||||||
Table of Contents
3
Table of Contents
| • | “dollars”, US$ or “$”, we mean United States dollars; |
| • | “pounds” or “£”, we mean United Kingdom pounds; and |
| • | “one billion”, we mean 1,000 million. |
| • | exposure to various types of market risks; |
| • | management strategy; |
| • | capital expenditures; |
| • | earnings and other targets; and |
| • | asset portfolios. |
4
Table of Contents
| • | exposure to various types of market risks, principally including interest rate risk, foreign exchange rate risk and equity price risk; |
| • | general economic or industry conditions in Spain, the United Kingdom, other European countries, Latin America and the other areas in which we have significant business activities or investments; |
| • | the effects of a decline in real estate prices, particularly in Spain and the UK; |
| • | monetary and interest rate policies of the European Central Bank and various central banks; |
| • | inflation or deflation; |
| • | the effects of non-linear market behavior that cannot be captured by linear statistical models, such as the VaR/DCaR/ACaR model we use; |
| • | changes in competition and pricing environments; |
| • | the inability to hedge some risks economically; |
| • | the adequacy of loss reserves; |
| • | acquisitions or restructurings of businesses that may not perform in accordance with our expectations; |
| • | changes in demographics, consumer spending or saving habits; and |
| • | changes in competition and pricing environments as a result of the progressive adoption of the internet for conducting financial services and/or other factors. |
| • | political stability in Spain, the United Kingdom, other European countries and Latin America; and |
| • | changes in Spanish, UK, EU or foreign laws, regulations or taxes. |
| • | our ability to integrate successfully our acquisitions and the challenges inherent in diverting management’s focus and resources from other strategic opportunities and from operational matters while we integrate these acquisitions; and |
| • | the outcome of our negotiations with business partners and governments. |
| • | technical difficulties and the development and use of new technologies by us and our competitors; |
| • | the impact of changes in the composition of our balance sheet on future net interest income; and |
| • | potential losses associated with an increase in the level of substandard loans or non-performance by counterparties to other types of financial instruments. |
5
Table of Contents
6
Table of Contents
| Year Ended December 31, | ||||||||||||||||
| 2007 | 2006 | 2005 | 2004 | |||||||||||||
| (in thousands of euros, except percentages and per share data) | ||||||||||||||||
| Interest and similar income | 45,803,354 | 36,832,823 | 33,088,647 | 17,438,432 | ||||||||||||
| Interest expense and similar charges | (30,921,470 | ) | (24,757,027 | ) | (22,764,846 | ) | (10,271,876 | ) | ||||||||
| Income from equity instruments | 413,242 | 404,000 | 335,576 | 388,876 | ||||||||||||
Net interest income | 15,295,126 | 12,479,796 | 10,659,377 | 7,555,432 | ||||||||||||
| Share of results from entities accounted for by the equity method | 441,457 | 426,921 | 619,157 | 448,220 | ||||||||||||
| Net fees and commissions (1) | 8,040,175 | 7,024,195 | 6,061,196 | 4,550,753 | ||||||||||||
| Insurance activity income | 319,353 | 253,084 | 201,466 | 144,529 | ||||||||||||
| Gains on financial transactions (2) | 2,972,358 | 2,149,174 | 1,534,360 | 1,090,343 | ||||||||||||
Gross income | 27,068,469 | 22,333,170 | 19,075,556 | 13,789,277 | ||||||||||||
| Net income from non-financial activities (3) | 152,072 | 118,913 | 156,178 | 118,308 | ||||||||||||
| Other operating expenses (4) | (118,639 | ) | (118,625 | ) | (88,706 | ) | (61,064 | ) | ||||||||
| General administrative expenses | (11,018,329 | ) | (9,969,171 | ) | (9,364,408 | ) | (6,683,623 | ) | ||||||||
Personnel | (6,551,201 | ) | (5,967,873 | ) | (5,611,308 | ) | (4,232,981 | ) | ||||||||
Other general and administrative expenses | (4,467,128 | ) | (4,001,298 | ) | (3,753,100 | ) | (2,450,642 | ) | ||||||||
| Depreciation and amortization | (1,267,880 | ) | (1,146,547 | ) | (1,013,943 | ) | (830,621 | ) | ||||||||
Net operating income | 14,815,693 | 11,217,740 | 8,764,677 | 6,332,277 | ||||||||||||
| Impairment losses (net) | (5,078,513 | ) | (2,550,570 | ) | (1,801,934 | ) | (1,787,871 | ) | ||||||||
| Net gains on disposal of investments in associates (5) | 16,388 | 271,961 | 1,298,935 | 30,891 | ||||||||||||
| Net results on other disposals, provisions, and other income (6) | 1,421,673 | 56,255 | (600,781 | ) | (219,573 | ) | ||||||||||
Profit before tax | 11,175,241 | 8,995,386 | 7,660,897 | 4,355,724 | ||||||||||||
| Income tax | (2,335,686 | ) | (2,254,598 | ) | (1,241,830 | ) | (491,922 | ) | ||||||||
Profit from continuing operations | 8,839,555 | 6,740,788 | 6,419,067 | 3,863,802 | ||||||||||||
| Profit from discontinued operations | 796,595 | 1,504,965 | 330,703 | 132,432 | ||||||||||||
Consolidated profit for the year | 9,636,150 | 8,245,753 | 6,749,770 | 3,996,234 | ||||||||||||
| Profit attributed to minority interests | 575,892 | 649,806 | 529,666 | 390,364 | ||||||||||||
Profit attributed to the Group | 9,060,258 | 7,595,947 | 6,220,104 | 3,605,870 | ||||||||||||
Per Share Information: | ||||||||||||||||
| Average number of shares (thousands) (7) | 6,341,771 | 6,248,376 | 6,240,611 | 4,950,498 | ||||||||||||
| Basic earnings per share (in euros) | 1.4287 | 1.2157 | 0.9967 | 0.7284 | ||||||||||||
Basic earnings per share – continued operations (in euros) | 1.3170 | 1.0127 | 0.9599 | 0.7142 | ||||||||||||
| Diluted earnings per share (in euros) | 1.4139 | 1.2091 | 0.9930 | 0.7271 | ||||||||||||
| Dividends paid (in euros) | 0.25 | 0.52 | 0.42 | 0.33 | ||||||||||||
| Dividends paid (in US$) | 0.36 | 0.65 | 0.49 | 0.39 | ||||||||||||
7
Table of Contents
| Year ended December 31, | ||||||||||||||||
| 2007 | 2006 | 2005 | 2004 | |||||||||||||
| (in thousands of euros, except percentages and per share data) | ||||||||||||||||
Total assets | 912,914,971 | 833,872,715 | 809,106,914 | 664,486,300 | ||||||||||||
| Loans and advances to credit institutions (8) | 50,919,499 | 60,174,538 | 59,773,022 | 58,379,774 | ||||||||||||
| Loans and advances to customers (net) (8) | 565,477,011 | 523,345,864 | 435,828,795 | 369,350,064 | ||||||||||||
| Investment Securities (9) | 132,035,268 | 136,760,433 | 203,938,360 | 138,753,764 | ||||||||||||
| Investments: Associates | 15,689,127 | 5,006,109 | 3,031,482 | 3,747,564 | ||||||||||||
Liabilities | ||||||||||||||||
| Deposits from central banks and credit institutions (10) | 112,896,023 | 113,035,937 | 148,622,407 | 83,750,339 | ||||||||||||
| Customer deposits (10) | 355,704,302 | 331,222,601 | 305,765,280 | 283,211,616 | ||||||||||||
| Debt securities (10) | 233,634,496 | 204,069,390 | 148,840,346 | 113,838,603 | ||||||||||||
Capitalization | ||||||||||||||||
| Guaranteed Subordinated debt excluding preferred securities (11) | 16,742,134 | 11,186,480 | 8,973,699 | 9,369,939 | ||||||||||||
| Secured Subordinated debt | — | — | — | 508,039 | ||||||||||||
| Other Subordinated debt | 11,666,663 | 12,399,771 | 13,016,989 | 12,300,178 | ||||||||||||
| Preferred securities (11) | 7,261,382 | 6,836,570 | 6,772,768 | 5,292,016 | ||||||||||||
| Preferred shares (11) | 522,558 | 668,328 | 1,308,847 | 2,124,222 | ||||||||||||
| Minority interest (including net income of the period) | 2,358,269 | 2,220,743 | 2,848,223 | 2,085,316 | ||||||||||||
| Stockholders’ equity (12) | 55,199,882 | 44,851,559 | 39,778,476 | 34,414,942 | ||||||||||||
| Total capitalization | 93,750,888 | 78,163,451 | 72,699,002 | 66,094,652 | ||||||||||||
| Stockholders’ Equity per Share (12) | 8.70 | 7.18 | 6.37 | 6.95 | ||||||||||||
Other managed funds | ||||||||||||||||
| Mutual funds | 119,210,503 | 119,838,418 | 109,480,095 | 97,837,724 | ||||||||||||
| Pension funds | 11,952,437 | 29,450,103 | 28,619,183 | 21,678,522 | ||||||||||||
| Managed portfolio | 19,814,340 | 17,835,031 | 14,746,329 | 8,998,388 | ||||||||||||
| Savings–insurance policies | 9,008,968 | 6,384,994 | 15,145,607 | 16,843,995 | ||||||||||||
| Total other managed funds | 159,986,248 | 173,508,546 | 167,991,214 | 145,358,629 | ||||||||||||
Consolidated Ratios | ||||||||||||||||
| Profitability Ratios: | ||||||||||||||||
| Net Yield (13) | 1.84 | % | 1.67 | % | 1.68 | % | 2.21 | % | ||||||||
| Efficiency ratio (14) | 44.26 | % | 48.53 | % | 52.82 | % | 53.18 | % | ||||||||
| Return on average total assets (ROA) | 1.10 | % | 1.00 | % | 0.91 | % | 1.01 | % | ||||||||
| Return on average stockholders’ equity (ROE) | 21.91 | % | 21.39 | % | 19.86 | % | 19.74 | % | ||||||||
| Capital Ratio: | ||||||||||||||||
| Average stockholders’ equity to average total assets | 4.71 | % | 4.36 | % | 4.24 | % | 4.62 | % | ||||||||
| Ratio of earnings to fixed charges (15) | ||||||||||||||||
| Excluding interest on deposits | 1.66 | % | 1.76 | % | 1.80 | % | 1.90 | % | ||||||||
| Including interest on deposits | 1.34 | % | 1.35 | % | 1.31 | % | 1.39 | % | ||||||||
Credit Quality Data | ||||||||||||||||
| Allowances for impaired assets (excluding country risk) | 9,302,230 | 8,626,937 | 7,902,225 | 6,813,354 | ||||||||||||
| Allowances for impaired assets as a percentage of total loans | 1.62 | % | 1.62 | % | 1.78 | % | 1.81 | % | ||||||||
| Impaired assets (16) | 6,178,655 | 4,607,547 | 4,341,500 | 4,114,691 | ||||||||||||
| Impaired assets as a percentage of total loans | 1.07 | % | 0.87 | % | 0.98 | % | 1.09 | % | ||||||||
| Allowances for impaired assets as a percentage of impaired assets | 150.55 | % | 187.23 | % | 182.02 | % | 165.59 | % | ||||||||
| Net loan charge-offs as a percentage of total loans | 0.47 | % | 0.34 | % | 0.23 | % | 0.16 | % | ||||||||
8
Table of Contents
| (1) | Equals “Fee and commission income” less “Fee and commission expense” as stated in our consolidated financial statements. | |
| (2) | Equals the sum of “Gains/losses on financial assets and liabilities (net)” and “Exchange differences (net)” as stated in our consolidated financial statements. | |
| (3) | Equals the sum of “Sales and income from the provision of non-financial services” and “Cost of sales” as stated in our consolidated financial statements. | |
| (4) | Equals the sum of “Other operating income” and “Other operating expenses” as stated in our consolidated financial statements. | |
| (5) | Equals the sum of “Other gains: Gains on disposal of investments in associates” and “Other losses: Losses on disposal of investments in associates” as stated in our consolidated financial statements. | |
| (6) | Includes “Provisions (net)”, “Finance income from non-financial activities”, “Finance expense from non-financial activities”, “Other gains: Gains on disposal of tangible assets”, “Other gains: Other”, “Other losses: Losses on disposal of tangible assets” and “Other losses: Other” as stated in our consolidated financial statements. | |
| (7) | Average number of shares have been calculated on the basis of the weighted average number of shares outstanding in the relevant year, net of treasury stock. | |
| (8) | Equals the sum of the amounts included under the headings “Financial assets held for trading”, “Other financial assets at fair value through profit or loss” and “Loans and receivables” as stated in our consolidated financial statements. | |
| (9) | Equals the amounts included as “Debt instruments” and “Other equity instruments” under the headings “Financial assets held for trading”, “Other financial assets at fair value through profit or loss”, “Available-for-sale financial assets” and “Loans and receivables” as stated in our consolidated financial statements. | |
| (10) | Equals the sum of the amounts included under the headings “Financial liabilities held for trading”, “Other financial liabilities at fair value through profit or loss” and “Financial liabilities at amortized cost” included in Notes 20, 21 and 22 to our consolidated financial statements. | |
| (11) | In our consolidated financial statements preferred securities are included under “Subordinated liabilities” and preferred shares are stated as “Equity having the substance of a financial liability”. | |
| (12) | Equals the sum of the amounts included at the end of each year as “Own funds” and “Valuation adjustments” as stated in our consolidated financial statements. We have deducted the book value of treasury stock from stockholders’ equity. | |
| (13) | Net yield is the total of net interest income (including dividends on equity securities) divided by average earning assets. See “Item 4. Information on the Company—B. Business Overview—Financial Management and Equity Stakes—Assets—Earning Assets—Yield Spread”. | |
| (14) | Efficiency ratio equals the sum of “General administrative expenses from financial activities”, “Depreciation and amortization costs” less “Offsetting fees” (see Note 48 to our consolidated financial statements), divided by the sum of “Gross income” and “Net income from non-financial activities” less “General administrative expenses from non-financial activities”. | |
| (15) | For the purpose of calculating the ratio of earnings to fixed charges, earnings consist of income from continuing operations before taxation and minority interests plus fixed charges and after deduction of the unremitted pre-tax income of companies accounted for by the equity method. Fixed charges consist of total interest expense, including or excluding interest on deposits as appropriate, and the proportion of rental expense deemed representative of the interest factor. Fixed charges include dividends and interest paid on preferred shares. | |
| (16) | Impaired assets reflect Bank of Spain classifications. Such classifications differ from the classifications applied by U.S. banks in reporting loans as non-accrual, past due, restructured and potential problem loans. See “Item 4. Information on the Company—B. Business Overview—Financial Management and Equity Stakes—Classified Assets—Bank of Spain Classification Requirements”. |
9
Table of Contents
| As of and for the year ended December 31, | ||||||||||||||||||||
| 2007 | 2006 | 2005 | 2004 | 2003 | ||||||||||||||||
| (in thousands of euros, except ratios and per share data) | ||||||||||||||||||||
| Net income (1) | 7,296,817 | 7,414,571 | 6,318,460 | 3,940,866 | 2,264,332 | |||||||||||||||
| Of which: | ||||||||||||||||||||
| Continuing operations | 6,724,962 | 6,305,470 | 6,088,760 | 3,870,587 | 2,264,332 | |||||||||||||||
| Discontinued operations | 571,855 | 1,109,101 | 229,700 | 70,279 | — | |||||||||||||||
| Stockholders’ equity (1)(2) | 57,393,597 | 48,703,540 | 43,784,335 | 38,671,623 | 25,093,234 | |||||||||||||||
| Total assets | 899,911,121 | 841,939,558 | 845,345,463 | 604,084,270 | 350,662,064 | |||||||||||||||
| Basic earnings per share (3) | 1.15 | 1.19 | 1.01 | 0.80 | 0.47 | |||||||||||||||
| Basic earnings per share – continued operations | 1.06 | 1.01 | 0.98 | 0.78 | 0.47 | |||||||||||||||
| Stockholders’ equity per share (2)(3) | 9.05 | 7.79 | 7.02 | 7.81 | 5.26 | |||||||||||||||
| Ratio of earnings to fixed charges: (4) | ||||||||||||||||||||
| Excluding interest on deposits | 1.47 | 1.66 | 1.81 | 1.94 | 1.79 | |||||||||||||||
| Including interest on deposits | 1.24 | 1.30 | 1.31 | 1.39 | 1.30 | |||||||||||||||
| Ratio of earnings to combined fixed charges and preferred stock dividends: (5) | ||||||||||||||||||||
| Excluding interest on deposits | 1.46 | 1.65 | 1.79 | 1.86 | 1.64 | |||||||||||||||
| Including interest on deposits | 1.24 | 1.30 | 1.30 | 1.37 | 1.26 | |||||||||||||||
| (1) | For information concerning the reconciliation between the EU-IFRS required to be applied under Bank of Spain’s Circular 4/2004 and U.S. GAAP and a discussion of the significant U.S. GAAP adjustments to net income and stockholders’ equity, see Note 57 to our consolidated financial statements. | |
| (2) | As of the end of each period. The book value of our treasury stock has been deducted from stockholders’ equity. | |
| (3) | Per share data have been calculated on the basis of the weighted average number of our shares outstanding in the relevant year, deducting treasury stock. | |
| (4) | For the purpose of calculating the ratio of earnings to fixed charges, earnings consist of income from continuing operations before taxation and minority interests, plus fixed charges and after deduction of the unremitted pre-tax income of companies accounted for by the equity method. Fixed charges consist of total interest expense, including or excluding interest on deposits as appropriate, and the proportion of rental expense deemed representative of the interest factor. | |
| (5) | For the purpose of calculating the ratio of earnings to combined fixed charges and preferred stock dividends, earnings consist of income from continuing operations before taxation and minority interest, plus fixed charges and after deduction of the unremitted pre-tax income of companies accounted for by the equity method. Fixed charges consist of total interest expense, including or excluding interest on deposits as appropriate, preferred stock dividend requirements (corresponding to minority interest participation and, accordingly, not eliminated in consolidation), and the proportion of rental expense deemed representative of the interest factor. Preferred stock dividends for any year represent the amount of pre-tax earnings required to pay dividends on preferred stock outstanding during such year. Under the EU-IFRS required to be applied under Bank of Spain’s Circular 4/2004 all payments from preferred securities are accounted for as interest expenses and consequently this ratio is not necessary. (For details of the different accounting treatment given to preferred securities under the EU-IFRS required to be applied under Bank of Spain’s Circular 4/2004 and U.S. GAAP see Notes 57.2, 57.5 and 57.6 to our consolidated financial statements). |
10
Table of Contents
| Rate During Period | ||||||||
| Period End | Average Rate(1) | |||||||
| Calendar Period | ($) | ($) | ||||||
| 2003 | 1.2597 | 1.411 | ||||||
| 2004 | 1.3538 | 1.2478 | ||||||
| 2005 | 1.1842 | 1.2449 | ||||||
| 2006 | 1.3197 | 1.2661 | ||||||
| 2007 | 1.4603 | 1.3797 | ||||||
| (1) | The average of the Noon Buying Rates for euros on the last day of each month during the period. |
| Rate During Period | ||||||||
| Last six months | High $ | Low $ | ||||||
| 2007 | ||||||||
| December | 1.4759 | 1.4344 | ||||||
| 2008 | ||||||||
| January | 1.4877 | 1.4574 | ||||||
| February | 1.5187 | 1.4495 | ||||||
| March | 1.5805 | 1.5195 | ||||||
| April | 1.6010 | 1.5568 | ||||||
| May | 1.5784 | 1.5370 | ||||||
| June (through June 19, 2008) | 1.5731 | 1.5368 | ||||||
11
Table of Contents
12
Table of Contents
13
Table of Contents
14
Table of Contents
15
Table of Contents
16
Table of Contents
17
Table of Contents
18
Table of Contents
19
Table of Contents
20
Table of Contents
21
Table of Contents
22
Table of Contents
23
Table of Contents
24
Table of Contents
| • | Continental Europe. This covers all retail banking business (including Banco Banif, S.A. (“Banif”), our specialized private bank), wholesale banking and asset management and insurance conducted in Europe, with the exception of Abbey. This segment includes the following units: the Santander Branch Network, Banco Español de Crédito, S.A. (“Banesto”), Santander Consumer Finance and Portugal. |
| • | United Kingdom (Abbey). This covers only Abbey’s business, mainly focused on retail banking in the UK. |
| • | Latin America. This embraces all the financial activities conducted via our subsidiary banks and other subsidiaries in Latin America. It also includes the specialized units in International Private Banking, as an independent globally managed unit. Our business in New York is also managed in this area. |
| • | Retail Banking. This covers all customer banking businesses (except those of Corporate Banking, which are managed globally throughout the world). |
| • | Global Wholesale Banking. This business reflects the returns from Global Corporate Banking, Investment Banking and Markets worldwide, including all treasury activities under global management, as well as our equities business. |
| • | Asset Management and Insurance. This includes our units that design and manage mutual and pension funds and insurance. |
25
Table of Contents
26
Table of Contents
| • | moderate growth in its traditional European businesses; |
| • | successful integration of Drive, which performed better than its initial established goals. Drive has had a significant positive impact on the performance of Santander Consumer Finance; and |
| • | expansion of new business areas to stimulate the future growth of the Group’s consumer business. |
27
Table of Contents
| Percentage Held | ||||||||||
| at December 31, 2007 | ||||||||||
| Banco Santander Río, S.A. (Argentina) | 99.30 | |||||||||
| Banco Santander, S.A. (Brazil) | 98.08 | |||||||||
| Banco Santander Chile | 76.73 | |||||||||
| Banco Santander Colombia, S.A. | 97.64 | |||||||||
| Banco Santander, S.A. (Mexico) | 74.95 | |||||||||
| Banco Santander Puerto Rico | 90.59 | |||||||||
| Banco Santander, S.A. (Uruguay) | 100.00 | |||||||||
| Banco de Venezuela, S.A. Banco Universal | 98.42 | |||||||||
28
Table of Contents
29
Table of Contents
30
Table of Contents
31
Table of Contents
32
Table of Contents
33
Table of Contents
34
Table of Contents
| Percentage Held | ||||||
| Company | Business | At December 31, 2007 | ||||
| France Telecom España, S.A. | Telecommunications | 5.01 | ||||
| CEPSA | Oil and Petrochemicals | 31.64 | ||||
| Grupo Corporativo ONO, S.A. | Telecommunications | 4.47 | ||||
35
Table of Contents
| • | We have included interest received on non-accruing assets in interest income only if we received such interest during the period in which it was due; |
| • | We have included loan fees in interest income; |
| • | We have not recalculated tax-exempt income on a tax-equivalent basis because the effect of doing so would not be significant; |
| • | We have included income and expenses from interest-rate hedging transactions as a separate line item under interest income and expenses if these transactions qualify for hedge accounting under the EU-IFRS required to be applied under Bank of Spain’s Circular 4/2004. If these transactions did not qualify for such treatment, we have included income and expenses on these transactions elsewhere in our income statement. See Note 2 to our consolidated financial statements for a discussion of our accounting policies for hedging activities; |
| • | We have stated average balances on a gross basis, before netting our allowances for credit losses, except for the total average asset figures, which includes such netting; and |
| • | All average data have been calculated using month-end balances, which is not significantly different from having used daily averages. |
36
Table of Contents
| 2007 | 2006 | 2005 | ||||||||||||||||||||||||||||||||||
| Average Balance | Interest | Average Rate | Average Balance | Interest | Average Rate | Average Balance | Interest | Average Rate | ||||||||||||||||||||||||||||
| (in thousand of Euros, except percentages) | ||||||||||||||||||||||||||||||||||||
ASSETS | ||||||||||||||||||||||||||||||||||||
Cash and due from central banks | ||||||||||||||||||||||||||||||||||||
Domestic | 3,502,564 | 123,432 | 3.52 | % | 1,974,832 | 68,969 | 3.49 | % | 3,133,279 | 44,121 | 1.41 | % | ||||||||||||||||||||||||
International | 15,546,087 | 506,675 | 3.26 | % | 12,436,361 | 405,884 | 3.26 | % | 8,487,516 | 227,184 | 2.68 | % | ||||||||||||||||||||||||
| 19,048,651 | 630,107 | 3.31 | % | 14,411,193 | 474,853 | 3.30 | % | 11,620,795 | 271,305 | 2.33 | % | |||||||||||||||||||||||||
Due from credit entities | ||||||||||||||||||||||||||||||||||||
Domestic | 8,928,024 | 578,484 | 6.48 | % | 11,519,832 | 460,640 | 4.00 | % | 13,674,911 | 340,950 | 2.49 | % | ||||||||||||||||||||||||
International | 56,819,791 | 2,306,065 | 4.06 | % | 48,664,439 | 2,044,393 | 4.20 | % | 51,572,888 | 2,032,703 | 3.94 | % | ||||||||||||||||||||||||
| 65,747,815 | 2,884,549 | 4.39 | % | 60,184,271 | 2,505,033 | 4.16 | % | 65,247,799 | 2,373,653 | 3.64 | % | |||||||||||||||||||||||||
Loans and credits | ||||||||||||||||||||||||||||||||||||
Domestic | 213,315,709 | 11,437,122 | 5.36 | % | 177,426,121 | 7,678,628 | 4.33 | % | 141,048,015 | 5,291,967 | 3.75 | % | ||||||||||||||||||||||||
International | 331,569,337 | 23,765,799 | 7.17 | % | 297,802,187 | 18,819,786 | 6.32 | % | 249,372,127 | 16,122,945 | 6.47 | % | ||||||||||||||||||||||||
| 544,885,046 | 35,202,921 | 6.46 | % | 475,228,308 | 26,498,414 | 5.58 | % | 390,420,142 | 21,414,912 | 5.49 | % | |||||||||||||||||||||||||
Debt securities | ||||||||||||||||||||||||||||||||||||
Domestic | 20,222,647 | 747,248 | 3.70 | % | 20,025,278 | 762,274 | 3.81 | % | 23,461,682 | 778,971 | 3.32 | % | ||||||||||||||||||||||||
International | 92,293,671 | 3,302,693 | 3.58 | % | 105,609,655 | 3,805,616 | 3.60 | % | 91,140,722 | 3,693,715 | 4.05 | % | ||||||||||||||||||||||||
| 112,516,318 | 4,049,941 | 3.60 | % | 125,634,933 | 4,567,890 | 3.64 | % | 114,602,404 | 4,472,686 | 3.90 | % | |||||||||||||||||||||||||
Income from hedging operations | ||||||||||||||||||||||||||||||||||||
Domestic | 580,530 | 225,696 | 2,404,944 | |||||||||||||||||||||||||||||||||
International | 2,010,890 | 2,017,358 | 1,709,334 | |||||||||||||||||||||||||||||||||
| 2,591,420 | 2,243,054 | 4,114,278 | ||||||||||||||||||||||||||||||||||
Other interest-earning assets | ||||||||||||||||||||||||||||||||||||
Domestic | 34,107,718 | 182,987 | 0.54 | % | 23,798,216 | 190,253 | 0.80 | % | 16,092,704 | 172,307 | 1.07 | % | ||||||||||||||||||||||||
International | 21,172,214 | 261,428 | 1.23 | % | 19,471,268 | 353,326 | 1.81 | % | 21,332,189 | 269,506 | 1.26 | % | ||||||||||||||||||||||||
| 55,279,932 | 444,415 | �� | 0.80 | % | 43,269,484 | 543,579 | 1.26 | % | 37,424,893 | 441,813 | 1.18 | % | ||||||||||||||||||||||||
Total interest-earning assets | ||||||||||||||||||||||||||||||||||||
Domestic | 280,076,662 | 13,649,803 | 4.87 | % | 234,744,279 | 9,386,460 | 4.00 | % | 197,410,591 | 9,033,260 | 4.58 | % | ||||||||||||||||||||||||
International | 517,401,100 | 32,153,550 | 6.21 | % | 483,983,910 | 27,446,363 | 5.67 | % | 421,905,442 | 24,055,387 | 5.70 | % | ||||||||||||||||||||||||
| 797,477,762 | 45,803,353 | 5.74 | % | 718,728,189 | 36,832,823 | 5.12 | % | 619,316,033 | 33,088,647 | 5.34 | % | |||||||||||||||||||||||||
Investments in equity securities | ||||||||||||||||||||||||||||||||||||
Domestic | 8,277,045 | 200,880 | 2.43 | % | 6,778,956 | 233,975 | 3.45 | % | 5,823,044 | 196,263 | 3.37 | % | ||||||||||||||||||||||||
International | 15,198,137 | 212,362 | 1.40 | % | 16,308,238 | 170,025 | 1.04 | % | 5,425,764 | 139,313 | 2.57 | % | ||||||||||||||||||||||||
| 23,475,182 | 413,242 | 1.76 | % | 23,087,194 | 404,000 | 1.75 | % | 11,248,808 | 335,576 | 2.98 | % | |||||||||||||||||||||||||
Investments in affiliated companies | ||||||||||||||||||||||||||||||||||||
Domestic | 2,547,829 | — | 0.00 | % | 3,125,583 | — | — | 3,581,100 | — | — | ||||||||||||||||||||||||||
International | 6,201,797 | — | 0.00 | % | 1,561,780 | — | — | 391,543 | — | — | ||||||||||||||||||||||||||
| 8,749,626 | — | 0.00 | % | 4,687,363 | — | — | 3,972,643 | — | — | |||||||||||||||||||||||||||
Total earning assets | ||||||||||||||||||||||||||||||||||||
Domestic | 290,901,536 | 13,850,683 | 4.76 | % | 244,648,818 | 9,620,435 | 3.93 | % | 206,814,735 | 9,229,523 | 4.46 | % | ||||||||||||||||||||||||
International | 538,801,034 | 32,365,912 | 6.01 | % | 501,853,928 | 27,616,388 | 5.50 | % | 427,722,749 | 24,194,700 | 5.66 | % | ||||||||||||||||||||||||
| 829,702,570 | 46,216,595 | 5.57 | % | 746,502,746 | 37,236,823 | 4.99 | % | 634,537,484 | 33,424,223 | 5.27 | % | |||||||||||||||||||||||||
Other assets | 47,046,528 | 43,465,098 | 45,200,837 | |||||||||||||||||||||||||||||||||
Assets from discontinued operations | 933,182 | 24,264,613 | 41,160,945 | |||||||||||||||||||||||||||||||||
Total average assets | 877,682,280 | 814,232,457 | 720,899,266 | |||||||||||||||||||||||||||||||||
37
Table of Contents
| Year Ended December 31, | ||||||||||||||||||||||||||||||||||||
| 2007 | 2006 | 2005 | ||||||||||||||||||||||||||||||||||
| Average Balance | Interest | Average Rate | Average Balance | Interest | Average Rate | Average Balance | Interest | Average Rate | ||||||||||||||||||||||||||||
| (in thousands of Euros, except percentages) | ||||||||||||||||||||||||||||||||||||
LIABILITIES AND STOCKHOLDERS EQUITY | ||||||||||||||||||||||||||||||||||||
Due to credit entities | ||||||||||||||||||||||||||||||||||||
Domestic | 16,252,916 | 713,601 | 4.39 | % | 15,450,460 | 452,377 | 2.93 | % | 15,781,853 | 410,174 | 2.60 | % | ||||||||||||||||||||||||
International | 95,768,411 | 3,147,350 | 3.29 | % | 108,302,721 | 3,145,329 | 2.90 | % | 100,192,474 | 3,182,489 | 3.18 | % | ||||||||||||||||||||||||
| 112,021,327 | 3,860,951 | 3.45 | % | 123,753,181 | 3,597,706 | 2.91 | % | 115,974,327 | 3,592,663 | 3.10 | % | |||||||||||||||||||||||||
Customers deposits | ||||||||||||||||||||||||||||||||||||
Domestic | 111,318,636 | 2,974,509 | 2.67 | % | 104,310,458 | 2,479,998 | 2.38 | % | 98,165,752 | 1,653,302 | 1.68 | % | ||||||||||||||||||||||||
International | 225,121,982 | 9,370,167 | 4.16 | % | 211,167,728 | 8,603,441 | 4.07 | % | 187,806,588 | 7,742,070 | 4.12 | % | ||||||||||||||||||||||||
| 336,440,618 | 12,344,676 | 3.67 | % | 315,478,186 | 11,083,439 | 3.51 | % | 285,972,340 | 9,395,372 | 3.29 | % | |||||||||||||||||||||||||
Marketable debt securities | ||||||||||||||||||||||||||||||||||||
Domestic | 119,308,485 | 5,231,367 | 4.38 | % | 87,819,976 | 2,862,427 | 3.26 | % | 56,259,922 | 1,507,745 | 2.68 | % | ||||||||||||||||||||||||
International | 108,319,384 | 4,120,238 | 3.80 | % | 86,557,319 | 2,966,498 | 3.43 | % | 67,925,712 | 2,718,923 | 4.00 | % | ||||||||||||||||||||||||
| 227,627,869 | 9,351,605 | 4.11 | % | 174,377,295 | 5,828,925 | 3.34 | % | 124,185,634 | 4,226,668 | 3.40 | % | |||||||||||||||||||||||||
Subordinated debt | ||||||||||||||||||||||||||||||||||||
Domestic | 16,620,042 | 841,017 | 5.06 | % | 10,264,689 | 466,520 | 4.54 | % | 7,457,156 | 329,883 | 4.42 | % | ||||||||||||||||||||||||
International | 16,282,109 | 1,212,360 | 7.45 | % | 19,289,808 | 1,227,217 | 6.36 | % | 19,829,925 | 1,261,618 | 6.36 | % | ||||||||||||||||||||||||
| 32,902,151 | 2,053,377 | 6.24 | % | 29,554,497 | 1,693,737 | 5.73 | % | 27,287,081 | 1,591,501 | 5.83 | % | |||||||||||||||||||||||||
Equity having the substance of a financial liability | ||||||||||||||||||||||||||||||||||||
Domestic | — | 5,932 | — | — | — | — | — | — | — | |||||||||||||||||||||||||||
International | 619,048 | 41,357 | 6.68 | % | 1,161,537 | 85,229 | 7.34 | % | 1,614,121 | 118,389 | 7.33 | % | ||||||||||||||||||||||||
| 619,048 | 47,289 | 7.64 | % | 1,161,537 | 85,229 | 7.34 | % | 1,614,121 | 118,389 | 7.33 | % | |||||||||||||||||||||||||
Other interest-bearing liabilities | ||||||||||||||||||||||||||||||||||||
Domestic | 46,303,178 | 563,849 | 1.22 | % | 31,366,911 | 530,095 | 1.69 | % | 24,394,377 | 525,585 | 2.15 | % | ||||||||||||||||||||||||
International | 29,728,313 | 207,522 | 0.70 | % | 33,980,821 | 530,565 | 1.56 | % | 32,336,733 | 350,390 | 1.08 | % | ||||||||||||||||||||||||
| 76,031,491 | 771,371 | 1.01 | % | 65,347,732 | 1,060,660 | 1.62 | % | 56,731,110 | 875,975 | 1.54 | % | |||||||||||||||||||||||||
Expenses from hedging operations | ||||||||||||||||||||||||||||||||||||
Domestic | 480,014 | (298,065 | ) | 1,638,632 | ||||||||||||||||||||||||||||||||
International | 2,012,186 | 1,705,396 | 1,325,646 | |||||||||||||||||||||||||||||||||
| 2,492,200 | 1,407,331 | 2,964,278 | ||||||||||||||||||||||||||||||||||
Total interest-bearing liabilities | ||||||||||||||||||||||||||||||||||||
Domestic | 309,803,257 | 10,810,289 | 3.49 | % | 249,212,494 | 6,493,352 | 2.61 | % | 202,059,060 | 6,065,321 | 3.00 | % | ||||||||||||||||||||||||
International | 475,839,247 | 20,111,180 | 4.23 | % | 460,459,934 | 18,263,675 | 3.97 | % | 409,705,553 | 16,699,525 | 4.08 | % | ||||||||||||||||||||||||
| 785,642,504 | 30,921,469 | 3.94 | % | 709,672,428 | 24,757,027 | 3.49 | % | 611,764,613 | 22,764,846 | 3.72 | % | |||||||||||||||||||||||||
Other liabilities | 41,719,064 | 38,792,532 | 34,089,787 | |||||||||||||||||||||||||||||||||
Minority interest | 2,239,676 | 2,264,300 | 2,056,087 | |||||||||||||||||||||||||||||||||
Stockholders’ Equity | 47,147,854 | 39,308,194 | 31,827,833 | |||||||||||||||||||||||||||||||||
Liabilities from discontinued operations | 933,182 | 24,195,003 | 41,160,946 | |||||||||||||||||||||||||||||||||
Total average Liabilities and Stockholders’ Equity | 877,682,280 | 30,921,469 | 814,232,457 | 720,899,266 | ||||||||||||||||||||||||||||||||
38
Table of Contents
| EU – IFRS (*) | ||||||||||||
| 2007/2006 | ||||||||||||
| Volume and rate analysis | Increase (Decrease) due to changes in | |||||||||||
| Volume | Rate | Net change | ||||||||||
| (in thousands of euros) | ||||||||||||
Interest and similar revenues | ||||||||||||
Cash and due from central banks | ||||||||||||
Domestic | 53,871 | 592 | 54,463 | |||||||||
International | 100,791 | — | 100,791 | |||||||||
| 154,662 | 592 | 155,254 | ||||||||||
Due from credit entities | ||||||||||||
Domestic | (167,848 | ) | 285,692 | 117,844 | ||||||||
International | 329,802 | (68,130 | ) | 261,672 | ||||||||
| 161,954 | 217,562 | 379,516 | ||||||||||
Loans and credits | ||||||||||||
Domestic | 1,931,005 | 1,827,489 | 3,758,494 | |||||||||
International | 2,414,694 | 2,531,319 | 4,946,013 | |||||||||
| 4,345,699 | 4,358,808 | 8,704,507 | ||||||||||
Debt securities | ||||||||||||
Domestic | 7,002 | (22,028 | ) | (15,026 | ) | |||||||
International | (481,801 | ) | (21,122 | ) | (502,923 | ) | ||||||
| (474,799 | ) | (43,150 | ) | (517,949 | ) | |||||||
Other interest-earning assets | ||||||||||||
Domestic | 54,609 | (61,875 | ) | (7,266 | ) | |||||||
International | 21,035 | (112,933 | ) | (91,898 | ) | |||||||
| 75,644 | (174,808 | ) | (99,164 | ) | ||||||||
Total interest-earning assets | ||||||||||||
Domestic | 1,878,639 | 2,029,870 | 3,908,509 | |||||||||
International | 2,384,521 | 2,329,134 | 4,713,655 | |||||||||
| 4,263,160 | 4,359,004 | 8,622,164 | ||||||||||
Investments in equity securities | ||||||||||||
Domestic | 36,050 | (69,145 | ) | (33,095 | ) | |||||||
International | (16,373 | ) | 58,710 | 42,337 | ||||||||
| 19,677 | (10,435 | ) | 9,242 | |||||||||
Total earning assets without hedging operations | ||||||||||||
Domestic | 1,914,689 | 1,960,725 | 3,875,414 | |||||||||
International | 2,368,148 | 2,387,844 | 4,755,992 | |||||||||
| 4,282,837 | 4,348,569 | 8,631,406 | ||||||||||
Income from hedging operations | ||||||||||||
Domestic | 354,834 | — | 354,834 | |||||||||
International | (6,468 | ) | — | (6,468 | ) | |||||||
| 348,366 | — | 348,366 | ||||||||||
Total earning assets | ||||||||||||
Domestic | 2,269,523 | 1,960,725 | 4,230,248 | |||||||||
International | 2,361,680 | 2,387,844 | 4,749,524 | |||||||||
| 4,631,203 | 4,348,569 | 8,979,772 | ||||||||||
| (*) | The EU-IFRS required to be applied under Bank of Spain’s Circular 4/2004 |
39
Table of Contents
| EU – IFRS (*) | ||||||||||||
| 2006/2005 | ||||||||||||
| Volume and rate analysis | Increase (Decrease) due to changes in | |||||||||||
| Volume | Rate | Net change | ||||||||||
| (in thousands of euros) | ||||||||||||
Interest and similar revenues | ||||||||||||
Cash and due from central banks | ||||||||||||
Domestic | (40,324 | ) | 65,172 | 24,848 | ||||||||
International | 129,472 | 49,228 | 178,700 | |||||||||
| 89,148 | 114,400 | 203,548 | ||||||||||
Due from credit entities | ||||||||||||
Domestic | (86,801 | ) | 206,491 | 119,690 | ||||||||
International | (122,400 | ) | 134,090 | 11,690 | ||||||||
| (209,201 | ) | 340,581 | 131,380 | |||||||||
Loans and credits | ||||||||||||
Domestic | 1,568,583 | 818,078 | 2,386,661 | |||||||||
International | 3,070,899 | (374,058 | ) | 2,696,841 | ||||||||
| 4,639,482 | 444,020 | 5,083,502 | ||||||||||
Debt securities | ||||||||||||
Domestic | (131,659 | ) | 114,962 | (16,697 | ) | |||||||
International | 522,034 | (410,133 | ) | 111,901 | ||||||||
| 390,375 | (295,171 | ) | 95,204 | |||||||||
Other interest-earning assets | ||||||||||||
Domestic | 61,396 | (43,450 | ) | 17,946 | ||||||||
International | (33,507 | ) | 117,327 | 83,820 | ||||||||
| 27,889 | 73,877 | 101,766 | ||||||||||
Total interest-earning assets | ||||||||||||
Domestic | 1,371,195 | 1,161,253 | 2,532,448 | |||||||||
International | 3,566,498 | (483,546 | ) | 3,082,952 | ||||||||
| 4,937,693 | 677,707 | 5,615,400 | ||||||||||
Investments in equity securities | ||||||||||||
Domestic | 33,054 | 4,658 | 37,712 | |||||||||
International | 113,726 | (83,014 | ) | 30,712 | ||||||||
| 146,780 | (78,356 | ) | 68,424 | |||||||||
Total earning assets without hedging operations | ||||||||||||
Domestic | 1,404,249 | 1,165,911 | 2,570,160 | |||||||||
International | 3,680,224 | (566,560 | ) | 3,113,664 | ||||||||
| 5,084,473 | 599,351 | 5,683,824 | ||||||||||
Income from hedging operations | ||||||||||||
Domestic | (2,179,248 | ) | — | (2,179,248 | ) | |||||||
International | 308,024 | — | 308,024 | |||||||||
| (1,871,224 | ) | — | (1,871,224 | ) | ||||||||
Total earning assets | ||||||||||||
Domestic | (774,999 | ) | 1,165,911 | 390,912 | ||||||||
International | 3,988,248 | (566,560 | ) | 3,421,688 | ||||||||
| 3,213,249 | 599,351 | 3,812,600 | ||||||||||
| (*) | The EU-IFRS required to be applied under Bank of Spain’s Circular 4/2004 |
40
Table of Contents
| EU – IFRS (*) | ||||||||||||
| 2007/2006 | ||||||||||||
| Volume and rate analysis | Increase (Decrease) due to changes in | |||||||||||
| Volume | Rate | Net change | ||||||||||
| (in thousands of euros) | ||||||||||||
Interest and similar expenses | ||||||||||||
Due to credit entities | ||||||||||||
Domestic | 35,647 | 225,577 | 261,224 | |||||||||
International | (420,360 | ) | 422,381 | 2,021 | ||||||||
| (384,713 | ) | 647,958 | 263,245 | |||||||||
Customers deposits | ||||||||||||
Domestic | 192,011 | 302,500 | 494,511 | |||||||||
International | 576,675 | 190,051 | 766,726 | |||||||||
| 768,686 | 492,551 | 1,261,237 | ||||||||||
Marketable debt securities | ||||||||||||
Domestic | 1,385,356 | 983,584 | 2,368,940 | |||||||||
International | 833,478 | 320,262 | 1,153,740 | |||||||||
| 2,218,834 | 1,303,846 | 3,522,680 | ||||||||||
Subordinated debt | ||||||||||||
Domestic | 321,121 | 53,376 | 374,497 | |||||||||
International | (225,116 | ) | 210,259 | (14,857 | ) | |||||||
| 96,005 | 263,635 | 359,640 | ||||||||||
Equity having the substance of a financial liability | ||||||||||||
Domestic | 5,932 | — | 5,932 | |||||||||
International | (36,206 | ) | (7,666 | ) | (43,872 | ) | ||||||
| (30,274 | ) | (7,666 | ) | (37,940 | ) | |||||||
Other interest-bearing liabilities | ||||||||||||
Domestic | 181,178 | (147,424 | ) | 33,754 | ||||||||
International | (30,808 | ) | (292,235 | ) | (323,043 | ) | ||||||
| 150,370 | (439,659 | ) | (289,289 | ) | ||||||||
Total interest-bearing liabilities without hedging operations | ||||||||||||
Domestic | 2,121,245 | 1,417,613 | 3,538,858 | |||||||||
International | 697,663 | 843,052 | 1,540,715 | |||||||||
| 2,818,908 | 2,260,665 | 5,079,573 | ||||||||||
Expenses from hedging operations | ||||||||||||
Domestic | 778,079 | — | 778,079 | |||||||||
International | 306,790 | — | 306,790 | |||||||||
| 1,084,869 | — | 1,084,869 | ||||||||||
Total interest-bearing liabilities | ||||||||||||
Domestic | 2,899,324 | 1,417,613 | 4,316,937 | |||||||||
International | 1,004,453 | 843,052 | 1,847,505 | |||||||||
| 3,903,777 | 2,260,665 | 6,164,442 | ||||||||||
| (*) | The EU-IFRS required to be applied under Bank of Spain’s Circular 4/2004 |
41
Table of Contents
| EU – IFRS (*) | ||||||||||||
| 2006/2005 | ||||||||||||
| Volume and rate analysis | Increase (Decrease) due to changes in | |||||||||||
| Volume | Rate | Net change | ||||||||||
| (in thousands of euros) | ||||||||||||
Interest and similar expenses | ||||||||||||
Due to credit entities | ||||||||||||
Domestic | (9,877 | ) | 52,080 | 42,203 | ||||||||
International | 243,379 | (280,539 | ) | (37,160 | ) | |||||||
| 233,502 | (228,459 | ) | 5,043 | |||||||||
Customers deposits | ||||||||||||
Domestic | 139,536 | 687,160 | 826,696 | |||||||||
International | 955,274 | (93,903 | ) | 861,371 | ||||||||
| 1,094,810 | 593,257 | 1,688,067 | ||||||||||
Marketable debt securities | ||||||||||||
Domestic | 1,028,374 | 326,308 | 1,354,682 | |||||||||
International | 634,752 | (387,177 | ) | 247,575 | ||||||||
| 1,663,126 | (60,869 | ) | 1,602,257 | |||||||||
Subordinated debt | ||||||||||||
Domestic | 127,688 | 8,949 | 136,637 | |||||||||
International | (34,401 | ) | — | (34,401 | ) | |||||||
| 93,287 | 8,949 | 102,236 | ||||||||||
Equity having the substance of a financial liability | ||||||||||||
Domestic | — | — | — | |||||||||
International | (33,321 | ) | 161 | (33,160 | ) | |||||||
| (33,321 | ) | 161 | (33,160 | ) | ||||||||
Other interest-bearing liabilities | ||||||||||||
Domestic | 116,724 | (112,214 | ) | 4,510 | ||||||||
International | 24,959 | 155,216 | 180,175 | |||||||||
| 141,683 | 43,002 | 184,685 | ||||||||||
Total interest-bearing liabilities without hedging operations | ||||||||||||
Domestic | 1,402,445 | 962,283 | 2,364,728 | |||||||||
International | 1,790,642 | (606,242 | ) | 1,184,400 | ||||||||
| 3,193,087 | 356,041 | ) | 3,549,128 | |||||||||
Expenses from hedging operations | ||||||||||||
Domestic | (1,936,697 | ) | — | (1,936,697 | ) | |||||||
International | 379,750 | — | 379,750 | |||||||||
| (1,556,947 | ) | — | (1,556,947 | ) | ||||||||
Total interest-bearing liabilities | ||||||||||||
Domestic | (534,252 | ) | 962,283 | 428,031 | ||||||||
International | 2,170,392 | (606,242 | ) | 1,564,150 | ||||||||
| 1,636,140 | 356,041 | 1,992,181 | ||||||||||
| (*) | The EU-IFRS required to be applied under Bank of Spain’s Circular 4/2004 |
42
Table of Contents
| EU – IFRS (*) | ||||||||||||
| Earning Assets — Yield Spread | Year Ended December 31, | |||||||||||
| 2007 | 2006 | 2005 | ||||||||||
| (in thousands of euros, except percentages) | ||||||||||||
Average earning assets | ||||||||||||
| Domestic | 290,901,536 | 244,648,818 | 206,814,735 | |||||||||
| International | 538,801,034 | 501,853,928 | 427,722,749 | |||||||||
| 829,702,570 | 746,502,746 | 634,537,484 | ||||||||||
Interest and dividends on equity securities (1) | ||||||||||||
| Domestic | 13,850,683 | 9,620,435 | 9,229,523 | |||||||||
| International | 32,365,912 | 27,616,388 | 24,194,700 | |||||||||
| 46,216,595 | 37,236,823 | 33,424,223 | ||||||||||
Net interest income | ||||||||||||
| Domestic | 3,040,394 | 3,127,083 | 3,164,202 | |||||||||
| International | 12,254,732 | 9,352,713 | 7,495,175 | |||||||||
| 15,295,126 | 12,479,796 | 10,659,377 | ||||||||||
Gross yield (2) | ||||||||||||
| Domestic | 4.76 | % | 3.93 | % | 4.46 | % | ||||||
| International | 6.01 | % | 5.50 | % | 5.66 | % | ||||||
| 5.57 | % | 4.99 | % | 5.27 | % | |||||||
Net yield (3) | ||||||||||||
| Domestic | 1.05 | % | 1.28 | % | 1.53 | % | ||||||
| International | 2.27 | % | 1.86 | % | 1.75 | % | ||||||
| 1.84 | % | 1.67 | % | 1.68 | % | |||||||
Yield spread (4) | ||||||||||||
| Domestic | 1.27 | % | 1.32 | % | 1.46 | % | ||||||
| International | 1.78 | % | 1.53 | % | 1.58 | % | ||||||
| 1.63 | % | 1.50 | % | 1.55 | % | |||||||
| (*) | The EU-IFRS required to be applied under Bank of Spain’s Circular 4/2004 | |
| (1) | Dividends on equity securities include dividends from companies accounted for by the equity method. | |
| (2) | Gross yield is the quotient of interest and dividends on equity securities divided by average earning assets. | |
| (3) | Net yield is the quotient of net interest income (that includes dividends on equity securities) divided by average earning assets. | |
| (4) | Yield spread is the difference between gross yield on earning assets and the average cost of interest-bearing liabilities. For a discussion of the changes in yield spread over the periods presented, see “Item 5. Operating and Financial Review and Prospects—A. Operating results—Results of Operations for Santander—Net Interest Income”. |
43
Table of Contents
| EU – IFRS (*) | ||||||||||||
| Year Ended December 31, | ||||||||||||
| 2007 | 2006 | 2005 | ||||||||||
ROA: Return on average total assets | 1.10 | % | 1.00 | % | 0.91 | % | ||||||
ROE:Return on average stockholders’ equity | 21.91 | % | 21.39 | % | 19.86 | % | ||||||
PAY-OUT:Dividends per average share as a percentage of net attributable income per average share | 44.92 | % | 42.87 | % | 41.88 | % | ||||||
| Average stockholders’ equity as a percentage of average total assets | 4.71 | % | 4.36 | % | 4.24 | % | ||||||
| (*) | The EU-IFRS required to be applied under Bank of Spain’s Circular 4/2004 |
| EU – IFRS (*) | ||||||||||||
| Interest earning assets | Year Ended December 31, | |||||||||||
| 2007 | 2006 | 2005 | ||||||||||
Cash and due from Central Banks | ||||||||||||
Domestic | 0.44 | % | 0.28 | % | 0.50 | % | ||||||
International | 1.95 | % | 1.73 | % | 1.37 | % | ||||||
| 2.39 | % | 2.01 | % | 1.87 | % | |||||||
Due from credit entities | ||||||||||||
Domestic | 1.12 | % | 1.60 | % | 2.21 | % | ||||||
International | 7.12 | % | 6.77 | % | 8.33 | % | ||||||
| 8.24 | % | 8.37 | % | 10.54 | % | |||||||
Loans and credits | ||||||||||||
Domestic | 26.75 | % | 24.69 | % | 22.77 | % | ||||||
International | 41.58 | % | 41.43 | % | 40.27 | % | ||||||
| 68.33 | % | 66.12 | % | 63.04 | % | |||||||
Debt securities | ||||||||||||
Domestic | 2.54 | % | 2.79 | % | 3.79 | % | ||||||
International | 11.57 | % | 14.69 | % | 14.72 | % | ||||||
| 14.11 | % | 17.48 | % | 18.51 | % | |||||||
Other interest earning assets | ||||||||||||
Domestic | 4.28 | % | 3.31 | % | 2.60 | % | ||||||
International | 2.65 | % | 2.71 | % | 3.44 | % | ||||||
| 6.93 | % | 6.02 | % | 6.04 | % | |||||||
Total interest-earning assets | ||||||||||||
Domestic | 35.13 | % | 32.67 | % | 31.87 | % | ||||||
International | 64.87 | % | 67.33 | % | 68.13 | % | ||||||
| 100.00 | % | 100.00 | % | 100.00 | % | |||||||
| (*) | The EU-IFRS required to be applied under Bank of Spain’s Circular 4/2004 |
44
Table of Contents
| EU – IFRS (*) | ||||||||||||||||
| At December 31, | ||||||||||||||||
| 2007 | 2006 | 2005 | 2004 | |||||||||||||
| (in thousands of euros) | ||||||||||||||||
| Reciprocal accounts | 417,438 | 503,299 | 345,104 | 118,536 | ||||||||||||
| Time deposits | 13,569,362 | 16,842,601 | 21,962,472 | 23,204,031 | ||||||||||||
| Reverse repurchase agreements | 30,276,080 | 37,010,008 | 33,634,326 | 31,495,786 | ||||||||||||
| Other accounts | 6,656,619 | 5,818,630 | 3,831,120 | 3,561,421 | ||||||||||||
| 50,919,499 | 60,174,538 | 59,773,022 | 58,379,774 | |||||||||||||
Less- Impairment allowances | (18,487 | ) | (12,727 | ) | (36,046 | ) | (53,879 | ) | ||||||||
| 50,901,012 | 60,161,811 | 59,736,976 | 58,325,895 | |||||||||||||
| (*) | The EU-IFRS required to be applied under Bank of Spain’s Circular 4/2004 |
| Previous Spanish GAAP | ||||
| At December 31, | ||||
| 2003 | ||||
| (in thousands of euros) | ||||
Demand deposits- | ||||
| Current accounts | 103,734 | |||
| Clearing House | — | |||
| Other accounts | 1,599,804 | |||
| 1,703,538 | ||||
Other deposits- | ||||
| Deposits in credit entities | 14,635,787 | |||
| Securities purchased under agreements to resell | 21,390,247 | |||
| 36,026,034 | ||||
Less- Allowance for credit losses(1) | (111,735 | ) | ||
| 37,617,837 | ||||
| (1) | The purpose of the allowance for credit losses was to recognize the loss related to the collectibility of these balances due to transfer risk and credit risk. This allowance was determined, in accordance with Bank of Spain requirements, based on debt servicing, on debtor credit rating, and on the outstanding settlement and transfer risks of the country in which the debtor is located. | |
| The allowance for credit losses reduces the fair value of the balances included in Due from Credit Institutions after evaluating their collectibility. All estimated losses considered in the calculation of this allowance are related to claims due from non-OECD financial institutions. |
45
Table of Contents
| EU – IFRS (*) | ||||||||||||
| At December 31, | ||||||||||||
| 2007 | 2006 | 2005 | ||||||||||
| (in thousands of euros) | ||||||||||||
Debt securities | ||||||||||||
| Domestic- | ||||||||||||
| Spanish Government | 14,471,176 | 12,596,984 | 19,595,333 | |||||||||
| Other domestic issuer: | ||||||||||||
| Public authorities | 904,382 | 179,317 | 121,328 | |||||||||
| Other domestic issuer | 9,988,780 | 5,900,637 | 6,569,398 | |||||||||
| Total domestic | 25,364,338 | 18,676,938 | 26,286,059 | |||||||||
| International- | ||||||||||||
| United States: | ||||||||||||
| U.S. Treasury and other U.S. Government agencies | 1,870,152 | 1,073,246 | 874,569 | |||||||||
| States and political subdivisions | 281,453 | 50,218 | 95,167 | |||||||||
| Other securities | 9,717,623 | 5,707,115 | 5,331,903 | |||||||||
| Total United States | 11,869,229 | 6,830,579 | 6,301,639 | |||||||||
| Other: | ||||||||||||
| Governments | 19,465,853 | 21,127,122 | 70,913,815 | |||||||||
| Other securities | 52,650,983 | 68,042,118 | 56,244,892 | |||||||||
| Total Other | 72,116,836 | 89,169,240 | 127,158,707 | |||||||||
| Total International | 83,986,065 | 95,999,820 | 133,460,346 | |||||||||
| Less- Allowance for credit losses | (91,753 | ) | (90,322 | ) | (80,000 | ) | ||||||
| Less- Price fluctuation allowance | — | — | ||||||||||
Total Debt Securities | 109,258,650 | 114,586,436 | 159,666,405 | |||||||||
Equity securities | ||||||||||||
| Domestic | 8,283,198 | 7,312,113 | 7,556,389 | |||||||||
| International- | ||||||||||||
| United States | 1,629,755 | 604,922 | 247,711 | |||||||||
| Other | 12,874,902 | 14,270,821 | 36,485,513 | |||||||||
| Total international | 14,504,658 | 14,875,743 | 36,733,224 | |||||||||
| Less- Price fluctuation allowance | (11,238 | ) | (13,859 | ) | (17,658 | ) | ||||||
Total Equity Securities | 22,776,618 | 22,173,997 | 44,271,955 | |||||||||
Total Investment Securities | 132,035,268 | 136,760,433 | 203,938,360 | |||||||||
| (*) | The EU-IFRS required to be applied under Bank of Spain’s Circular 4/2004 |
46
Table of Contents
| Aggregate as of December 31, 2007 | ||||||||
| Book value | Market value | |||||||
| (in thousands of euros) | ||||||||
Debt securities: | ||||||||
Exceed 10% of stockholders’ equity: | ||||||||
| Spanish Government | 15,375,559 | 15,375,559 | ||||||
| RFS Holdings B.V. | 12,784,749 | 12,784,749 | ||||||
| Mexican Government | 9,530,990 | 9,530,990 | ||||||
| Brazilian Government | 7,364,333 | 7,364,333 | ||||||
Near 10% of stockholders’ equity: | ||||||||
| RBS | 4,161,652 | 4,161,652 | ||||||
| Barclays Bank plc | 3,614,181 | 3,614,181 | ||||||
| At December 31, 2007 | ||||||||||||||||||||
| Maturing | Maturing | |||||||||||||||||||
| Maturing | Between | Between | Maturing | |||||||||||||||||
| Within | 1 and | 5 and | After | |||||||||||||||||
| 1 Year | 5 Years | 10 Years | 10 Years | Total | ||||||||||||||||
| (in thousands of euros) | ||||||||||||||||||||
DEBT SECURITIES | ||||||||||||||||||||
Domestic: | ||||||||||||||||||||
| Spanish Government | 5,796,762 | 3,152,995 | 5,250,094 | 271,326 | 14,471,176 | |||||||||||||||
| Other domestic issuer: | ||||||||||||||||||||
| Public authorities | 151,035 | 478,898 | 230,066 | 44,382 | 904,382 | |||||||||||||||
| Other domestic issuer | 2,120,076 | 3,672,580 | 1,859,355 | 2,336,769 | 9,988,780 | |||||||||||||||
| Total domestic | 8,067,873 | 7,304,474 | 7,339,515 | 2,652,477 | 25,364,338 | |||||||||||||||
International: | ||||||||||||||||||||
| United States: | ||||||||||||||||||||
| U.S. Treasury and other U.S. Government agencies | 1,675,438 | 61,250 | 3,958 | 129,506 | 1,870,152 | |||||||||||||||
| States and political subdivisions | 160,154 | 73,305 | 11,364 | 36,630 | 281,453 | |||||||||||||||
| Other securities | 3,024,707 | 2,986,962 | 2,686,005 | 1,019,949 | 9,717,623 | |||||||||||||||
| Total United States | 4,860,299 | 3,121,517 | 2,701,327 | 1,186,085 | 11,869,229 | |||||||||||||||
| Other: | ||||||||||||||||||||
| Governments | 2,598,448 | 6,991,497 | 8,584,700 | 1,291,208 | 19,465,853 | |||||||||||||||
| Other securities | 23,162,446 | 15,822,795 | 5,059,630 | 8,606,113 | 52,650,983 | |||||||||||||||
| Total Other | 25,760,894 | 22,814,291 | 13,644,330 | 9,897,321 | 72,116,836 | |||||||||||||||
| Total International | 30,621,193 | 25,935,809 | 16,345,657 | 11,083,406 | 83,986,065 | |||||||||||||||
Total debt investment securities | 38,689,066 | 33,240,283 | 23,685,171 | 13,735,883 | 109,350,403 | |||||||||||||||
47
Table of Contents
| EU – IFRS (*) | ||||||||||||||||
| At December 31, | ||||||||||||||||
| 2007 | 2006 | 2005 | 2004 | |||||||||||||
| (in thousands of euros) | ||||||||||||||||
| Borrowers in Spain: | ||||||||||||||||
| Spanish Government | 5,633,422 | 5,328,526 | 5,242,938 | 5,741,016 | ||||||||||||
| Commercial, financial, agricultural and industrial | 45,169,824 | 71,412,545 | 54,799,113 | 48,110,367 | ||||||||||||
| Real estate-construction | 46,837,281 | 12,391,306 | 7,834,447 | 5,417,473 | ||||||||||||
| Real estate-mortgage | 59,268,463 | 81,718,186 | 65,940,697 | 53,456,477 | ||||||||||||
| Installment loans to individuals | 21,533,074 | 20,058,666 | 14,343,281 | 11,295,350 | ||||||||||||
| Lease financing | 9,643,516 | 8,668,599 | 7,276,200 | 6,097,620 | ||||||||||||
| Other | 46,060,262 | 5,668,234 | 3,345,467 | 2,764,974 | ||||||||||||
| Total | 234,145,842 | 205,246,062 | 158,782,143 | 132,883,277 | ||||||||||||
| Borrowers outside Spain: | ||||||||||||||||
| Governments | 2,295,763 | 4,969,713 | 6,608,103 | 5,713,770 | ||||||||||||
| Banks and other financial institutions | 1,951,381 | 767,765 | 2,109,420 | 17,681,264 | ||||||||||||
| Commercial and industrial | 143,045,869 | 128,438,265 | 108,145,797 | 55,500,956 | ||||||||||||
| Mortgage loans | 179,163,680 | 177,631,731 | 161,147,496 | 144,827,500 | ||||||||||||
| Other | 13,569,679 | 14,455,772 | 6,645,761 | 19,588,512 | ||||||||||||
| Total | 340,026,373 | 326,263,246 | 284,656,577 | 243,312,002 | ||||||||||||
| Total loans and leases, gross | 574,172,215 | 531,509,308 | 443,438,720 | 376,195,279 | ||||||||||||
| Allowance for possible loan losses | (8,695,204 | ) | (8,163,444 | ) | (7,609,925 | ) | (6,845,215 | ) | ||||||||
| Loans and leases, net of allowances | 565,477,011 | 523,345,864 | 435,828,795 | 369,350,064 | ||||||||||||
| (*) | The EU-IFRS required to be applied under Bank of Spain’s Circular 4/2004 |
48
Table of Contents
| Previous Spanish GAAP | ||||
| At December 31, | ||||
| 2003 | ||||
| (in thousands of euros) | ||||
| Borrowers in Spain: | ||||
| Spanish Government | 5,487,358 | |||
| Commercial, financial, agricultural and industrial | 40,082,919 | |||
| Real estate-construction | 4,048,386 | |||
| Real estate-mortgage | 41,091,269 | |||
| Installment loans to individuals | 8,894,956 | |||
| Lease financing | 5,198,113 | |||
| Other | 4,199,954 | |||
| Total | 109,002,955 | |||
| Borrowers outside Spain: | ||||
| Governments | 5,824,432 | |||
| Banks and other financial institutions | 1,398,685 | |||
| Commercial and industrial | 37,915,142 | |||
| Other (1) | 23,479,482 | |||
| Total | 68,617,741 | |||
| Total loans and leases, gross | 177,620,696 | |||
| Allowance for possible loan losses | (5,116,683 | ) | ||
| Loans and leases, net of allowances | 172,504,013 | |||
| (1) | Of which€11.9 billion are real-estate mortgages. The remaining amount corresponds to other types of customers, with no “loan concentration” as defined by Item III-C of Industry Guide 3. |
49
Table of Contents
| Maturity | ||||||||||||||||||||||||||||||||
| Less than | One to five | Over five | ||||||||||||||||||||||||||||||
| one year | years | years | Total | |||||||||||||||||||||||||||||
| % of | % of | % of | % of | |||||||||||||||||||||||||||||
| Balance | Total | Balance | Total | Balance | Total | Balance | Total | |||||||||||||||||||||||||
| (in thousands of euros, except percentages) | ||||||||||||||||||||||||||||||||
| Loans to borrowers in Spain: | ||||||||||||||||||||||||||||||||
| Spanish Government | 2,269,084 | 1.36 | % | 829,170 | 0.71 | % | 2,535,169 | 0.87 | % | 5,633,422 | 0.98 | % | ||||||||||||||||||||
| Commercial, financial, agriculture and industrial | 23,343,645 | 13.95 | % | 14,638,719 | 12.60 | % | 7,187,461 | 2.47 | % | 45,169,824 | 7.87 | % | ||||||||||||||||||||
| Real estate: | ||||||||||||||||||||||||||||||||
| Construction | 1,335,290 | 0.80 | % | 2,346,159 | 2.02 | % | 43,155,831 | 14.85 | % | 46,837,281 | 8.16 | % | ||||||||||||||||||||
| Mortgage | 4,040,988 | 2.41 | % | 5,390,272 | 4.64 | % | 49,837,203 | 17.15 | % | 59,268,463 | 10.32 | % | ||||||||||||||||||||
| Installment loans to individuals | 5,561,216 | 3.32 | % | 7,199,475 | 6.20 | % | 8,772,383 | 3.02 | % | 21,533,074 | 3.75 | % | ||||||||||||||||||||
| Lease financing | 3,586,992 | 2.14 | % | 4,727,445 | 4.07 | % | 1,329,079 | 0.46 | % | 9,643,516 | 1.68 | % | ||||||||||||||||||||
| Other | 26,885,768 | 16.06 | % | 13,582,450 | 11.69 | % | 5,592,044 | 1.92 | % | 46,060,262 | 8.02 | % | ||||||||||||||||||||
| Total borrowers in Spain | 67,022,983 | 40.04 | % | 48,713,690 | 41.94 | % | 118,409,170 | 40.74 | % | 234,145,842 | 40.78 | % | ||||||||||||||||||||
| Loans to borrowers outside Spain | ||||||||||||||||||||||||||||||||
| Other Governments | 858,747 | 0.51 | % | 900,986 | 0.78 | % | 536,030 | 0.18 | % | 2,295,763 | 0.40 | % | ||||||||||||||||||||
| Financial | 556,527 | 0.33 | % | 1,254,964 | 1.08 | % | 139,890 | 0.05 | % | 1,951,381 | 0.34 | % | ||||||||||||||||||||
| Commercial and Industrial | 77,834,291 | 46.50 | % | 47,609,423 | 40.99 | % | 17,602,155 | 6.06 | % | 143,045,869 | 24.91 | % | ||||||||||||||||||||
| Mortgage loans | 14,467,328 | 8.64 | % | 12,086,934 | 10.41 | % | 152,609,418 | 52.51 | % | 179,163,680 | 31.20 | % | ||||||||||||||||||||
| Other | 6,631,752 | 3.96 | % | 5,591,497 | 4.81 | % | 1,346,430 | 0.46 | % | 13,569,679 | 2.36 | % | ||||||||||||||||||||
| Total loans to borrowers outside Spain | 100,348,645 | 59.96 | % | 67,443,804 | 58.06 | % | 172,233,924 | 59.26 | % | 340,026,373 | 59.22 | % | ||||||||||||||||||||
Total loans and leases, gross | 167,371,628 | 100.00 | % | 116,157,494 | 100.00 | % | 290,643,093 | 100.00 | % | 574,172,215 | 100.00 | % | ||||||||||||||||||||
| Fixed and variable rate loans | ||||||||||||
| having a maturity of more than one year | ||||||||||||
| Domestic | International | Total | ||||||||||
| (in thousands of euros, except percentages) | ||||||||||||
| Fixed rate | 29,820,420 | 118,583,356 | 148,403,776 | |||||||||
| Variable rate | 137,302,440 | 121,094,372 | 258,396,811 | |||||||||
Total | 167,122,860 | 239,677,728 | 406,800,588 | |||||||||
50
Table of Contents
| EU — IFRS (*) | ||||||||||||||||||||||||
| 2007 | 2006 | 2005 | ||||||||||||||||||||||
| % of | % of | % of | ||||||||||||||||||||||
| total | total | total | ||||||||||||||||||||||
| assets | assets | assets | ||||||||||||||||||||||
| (in thousands of euros, except percentages) | ||||||||||||||||||||||||
| OECD Countries: (1) | ||||||||||||||||||||||||
| United Kingdom | 10,553,863 | 1.16 | % | 8,504,530 | 1.02 | % | 9,563,816 | 1.18 | % | |||||||||||||||
| United States | 7,139,888 | 0.78 | % | 3,643,184 | 0.44 | % | 4,791,568 | 0.59 | % | |||||||||||||||
| Other OECD Countries (2) | 5,396,045 | 0.59 | % | 9,799,540 | 1.18 | % | 8,028,563 | 0.99 | % | |||||||||||||||
| Total OECD | 23,925,113 | 2.62 | % | 26,094,738 | 3.13 | % | 28,953,330 | 3.58 | % | |||||||||||||||
| Non-OECD Countries | ||||||||||||||||||||||||
| Latin American Countries (2) (3) | 8,221,028 | 0.90 | % | 10,106,062 | 1.21 | % | 8,059,507 | 1.00 | % | |||||||||||||||
| Other (2) | 2,379,944 | 0.26 | % | 2,028,035 | 0.24 | % | 2,439,866 | 0.30 | % | |||||||||||||||
| Total Non-OECD | 10,600,972 | 1.16 | % | 12,134,097 | 1.46 | % | 10,499,373 | 1.30 | % | |||||||||||||||
Total | 34,526,085 | 3.78 | % | 38,228,835 | 4.58 | % | 39,452,702 | 4.88 | % | |||||||||||||||
| (*) | The EU-IFRS required to be applied under Bank of Spain’s Circular 4/2004 | |
| (1) | The Organization for Economic Cooperation and Development. | |
| (2) | Aggregate outstandings in any single country in this category do not exceed 0.75% of our total assets. | |
| (3) | With regards to these cross-border outstandings, at December 31, 2005, 2006 and 2007, we had allowances for country-risk equal to €161.5 million, €151.0 million and €105.0 million, respectively. Such allowances for country-risk exceeded the Bank of Spain’s minimum requirements at such dates. |
51
Table of Contents
| Banks and other | ||||||||||||||||
| Financial | Commercial and | |||||||||||||||
| Government | Institutions | Industrial | Total | |||||||||||||
| (in thousands of euros) | ||||||||||||||||
2005 | ||||||||||||||||
| United Kingdom | 89 | 8,095,155 | 1,468,572 | 9,563,816 | ||||||||||||
Total | 89 | 8,095,155 | 1,468,572 | 9,563,816 | ||||||||||||
2006 | ||||||||||||||||
| United Kingdom | 2,796 | 5,626,606 | 2,875,127 | 8,504,530 | ||||||||||||
Total | 2,796 | 5,626,606 | 2,875,127 | 8,504,530 | ||||||||||||
2007 | ||||||||||||||||
| United Kingdom | 616 | 3,870,351 | 6,682,896 | 10,553,863 | ||||||||||||
| United States | 483,863 | 3,203,901 | 3,452,125 | 7,139,888 | ||||||||||||
Total | 484,479 | 7,074,252 | 10,135,020 | 17,693,751 | ||||||||||||
| (i) Negligible risk | • | All types of credits made to, or guaranteed by, any European Union country or certain other specified public entities of the countries classified in category 1 of the country-risk categories; |
| • | Advance payments for pensions or payrolls for the following month, when paid by any public entity and deposited at Santander; | |
| • | Those credits guaranteed by public entities of the countries classified in category 1 of the country-risk categories whose principal activity is to provide guarantees; | |
| • | Credits made to banks; | |
52
Table of Contents
| • | Credits personally, jointly and unconditionally guaranteed by banks or mutual guaranty companies payable on first demand; | |
| • | Credits guaranteed under the name of the “Fondo de Garantía de Depósitos” if their credit risk quality is comparable with that of the European Union; or | |
| • | All credits collateralized by cash or by money market and treasury funds or securities issued by the central administrations or credit entities of countries listed in category 1 for country-risk purposes when the outstanding exposure is 90% or less than the redemption value of the money market and treasury funds and of the market value of the securities given as collateral. | |
| (ii) Low risk | Assets in this category include: | |
| • | assets qualified as collateral for monetary policy transactions in the European System of Central Banks, except those included in (i) above; | |
| • | fully-secured mortgages and financial leases on finished residential properties when outstanding risk is less than 80% of the appraised value of such property; | |
| • | ordinary mortgage backed securities; | |
| • | assets from entities whose long term debt is rated “A” or better by a qualified rating agency; and | |
| • | securities denominated in local currency and issued by government entities in countries other than those classified in category 1 of the country-risk categories, when such securities are registered in the books of the bank’s branch located in the issuer country. | |
| (iii) Medium-low risk | Assets in this category include financial leases and mortgages and pledges on tangible assets that are not included in other categories, provided that the estimated value of the financial leases and the collateral totally covers the outstanding risk. | |
| (iv) Medium risk | Assets in this category include those with Spanish residents or residents of countries classified in categories 1 or 2, provided that such assets are not included in other categories. | |
53
Table of Contents
| (v) Medium-high risk | Assets in this category include (unless these assets qualify as “high risk” assets) loans to individuals for the acquisition of durable consumption goods, other goods or current services not for professional use, except those registered in the Registry of Sales of Movable Assets (“Registro de Ventas de Bienes Muebles”); and risks with residents of countries classified in categories 3 to 6, to the extent not covered by country-risk allowances. | |
| (vi) High risk | Assets in this category include credit card balances; current account overdrafts and excesses in credit accounts (except those included in categories (i) and (ii)). | |
54
Table of Contents
| • | Outstandings guaranteed by residents in other countries in a better category should be classified in the category of the guarantor. | ||
| • | Fully secured loans, when the security covers sufficiently the outstanding risk and can be enforced in Spain or in any other “category 1” country, should be classified as category 1. | ||
| • | Outstanding risks with foreign branches of a bank should be classified according to the residence of the headquarters of those branches. |
| The Bank of Spain has established six categories to classify such countries, as shown in the following table: |
| Country-Risk Categories | Description | |
| 1 | European Union, Norway, Switzerland, Iceland, USA, Canada, Japan, Australia and New Zealand | |
| 2 | Low risk countries not included in 1 | |
| 3 | Countries with transitory difficulties | |
| 4 | Countries with serious difficulties | |
| 5 | Doubtful countries | |
| 6 | Bankrupt countries |
| • | Sub-standard assets: All outstandings in categories 3 and 4 except when they should be classified as non-performing or charged-off assets due to credit risk attributable to the client. | ||
| • | Non-performing assets: All outstandings in category 5 and off-balance sheet risks classified in category 6, except when they should be classified as non-performing or charged-off assets due to credit risk attributable to the client. | ||
| • | Charged-off assets: All other outstandings in category 6 except when they should be classified as charged-off assets due to credit risk attributable to the client. |
55
Table of Contents
| EU — IFRS (*) | ||||||||||||
| At December 31, | ||||||||||||
| 2007 | 2006 | 2005 | ||||||||||
| (in thousands of euros) | ||||||||||||
| Interest owed on non-accruing assets | ||||||||||||
| Domestic | 80,133 | 49,537 | 38,751 | |||||||||
| International | 291,987 | 218,216 | 273,834 | |||||||||
| Total | 372,120 | 267,754 | 312,585 | |||||||||
| Interest received on non-accruing assets | ||||||||||||
| Domestic | 81,233 | 86,370 | 79,183 | |||||||||
| International | 110,015 | 70,435 | 77,602 | |||||||||
| Total | 191,248 | 156,805 | 156,785 | |||||||||
| (*) | The EU-IFRS required to be applied under Bank of Spain’s Circular 4/2004 |
56
Table of Contents
| Allowance | ||||||||
| Period Overdue | Companies | Other clients | ||||||
| 3-6 months | 5.3 | % | 4.5 | % | ||||
| 6-12 months | 27.8 | % | 27.4 | % | ||||
| 12-18 months | 65.1 | % | 60.5 | % | ||||
| 18-24 months | 95.8 | % | 93.3 | % | ||||
| More than 24 months | 100 | % | 100 | % | ||||
| Period Overdue | Allowance | |||
| 3 months-3 years | 2 | % | ||
| 3-4 years | 25 | % | ||
| 4-5 years | 50 | % | ||
| 5-6 years | 75 | % | ||
| More than 6 years | 100 | % | ||
| Allowance | ||||||||
| Period Overdue | Companies | Other clients | ||||||
| 3-6 months | 4.5 | % | 3.8 | % | ||||
| 6-12 months | 23.6 | % | 23.3 | % | ||||
| 12-18 months | 55.3 | % | 47.2 | % | ||||
| 18-24 months | 81.4 | % | 79.3 | % | ||||
| More than 24 months | 100 | % | 100 | % | ||||
57
Table of Contents
| Minimum percentage of | ||||
| Categories: | coverage | |||
| Category 3 | 10.1 | % | ||
| Category 4 | 22.8 | % | ||
| Category 5 | 83.5 | % | ||
| Category 6 | 100 | % | ||
58
Table of Contents
| EU – IFRS (*) | ||||||||||||||||
| Year Ended December 31, | ||||||||||||||||
| 2007 | 2006 | 2005 | 2004 | |||||||||||||
| (in thousands of euros) | ||||||||||||||||
Allowance for credit losses at beginning of year | ||||||||||||||||
| Borrowers in Spain | 4,318,320 | 3,664,349 | 2,836,564 | 1,849,001 | ||||||||||||
| Borrowers outside Spain | 3,969,808 | 4,092,326 | 4,160,864 | 3,172,452 | ||||||||||||
| Total | 8,288,128 | 7,756,675 | 6,997,428 | 5,021,453 | ||||||||||||
Inclusion of acquired companies’ credit loss allowances | ||||||||||||||||
| Borrowers in Spain | — | — | — | 1,972 | ||||||||||||
| Borrowers outside Spain | 7,356 | 164,530 | 4,006 | 1,044,042 | ||||||||||||
| Total | 7,356 | 164,530 | 4,006 | 1,046,014 | ||||||||||||
Recoveries of loans previously charged off (1) | ||||||||||||||||
| Borrowers in Spain | 148,849 | 123,566 | 105,800 | 145,591 | ||||||||||||
| Borrowers outside Spain | 475,371 | 428,040 | 381,217 | 259,777 | ||||||||||||
| Total | 624,220 | 551,606 | 487,017 | 405,368 | ||||||||||||
Net provisions for credit losses (1) | ||||||||||||||||
| Borrowers in Spain | 658,989 | 793,898 | 746,519 | 868,520 | ||||||||||||
| Borrowers outside Spain | 2,837,069 | 1,689,964 | 1,001,381 | 713,220 | ||||||||||||
| Total | 3,496,058 | 2,483,862 | 1,747,900 | 1,581,740 | ||||||||||||
Charge offs against credit loss allowance | ||||||||||||||||
| Borrowers in Spain | (573,787 | ) | (269,559 | ) | (226,036 | ) | (344,392 | ) | ||||||||
| Borrowers outside Spain | (2,746,375 | ) | (2,100,306 | ) | (1,293,458 | ) | (681,036 | ) | ||||||||
| Total | (3,320,162 | ) | (2,369,865 | ) | (1,519,494 | ) | (1,025,428 | ) | ||||||||
Other movements (2) | (299,229 | ) | (298,680 | ) | 39,818 | (31,719 | ) | |||||||||
Allowance for credit losses at end of year | ||||||||||||||||
| Borrowers in Spain | 4,512,000 | 4,318,320 | 3,664,349 | 2,836,564 | ||||||||||||
| Borrowers outside Spain | 4,284,371 | 3,969,808 | 4,092,326 | 4,160,864 | ||||||||||||
| Total | 8,796,371 | 8,288,128 | 7,756,675 | 6,997,428 | ||||||||||||
| (*) | The EU-IFRS required to be applied under Bank of Spain’s Circular 4/2004 |
| • | We have not included separate line items for charge-offs of loans not previously provided for (loans charged-off against income) and recoveries of loans previously charged-off as these are not permitted under the EU-IFRS required to be applied under Bank of Spain’s Circular 4/2004. | ||
| • | The shift in “Other Movements” from 2004 to 2005, to 2006, and to 2007 principally reflects foreign exchange differences. |
59
Table of Contents
| Previous Spanish GAAP | ||||
| Year Ended December 31, | ||||
| 2003 | ||||
| (in thousands of euros) | ||||
Allowance for credit losses at beginning of year | ||||
| Borrowers in Spain | 1,725,606 | |||
| Borrowers outside Spain | 3,438,672 | |||
| Total | 5,164,278 | |||
Inclusion of acquired companies’ credit loss allowances | ||||
| Borrowers in Spain | — | |||
| Borrowers outside Spain | — | |||
| Total | — | |||
Loans charged off against income (1) | ||||
| Borrowers in Spain | (12,729 | ) | ||
| Borrowers outside Spain | (91,110 | ) | ||
| Total | (103,839 | ) | ||
Recoveries of loans previously charged off (1) | ||||
| Borrowers in Spain | 108,722 | |||
| Borrowers outside Spain | 248,765 | |||
| Total | 357,487 | |||
Net provisions for credit losses (1) | ||||
| Borrowers in Spain | 681,234 | |||
| Borrowers outside Spain | 814,453 | |||
| Total | 1,495,687 | |||
Charge offs against credit loss allowance | ||||
| Borrowers in Spain | (259,366 | ) | ||
| Borrowers outside Spain | (811,719 | ) | ||
| Total | (1,071,085 | ) | ||
Other movements | (428,132 | ) | ||
Allowance for credit losses at end of year | ||||
| Borrowers in Spain | 1,681,017 | |||
| Borrowers outside Spain | 3,733,379 | |||
| Total | 5,414,396 | |||
| (1) | We have included separate line items for charge-offs of loans not previously provided for (loans charged-off against income) and recoveries of loans previously charged-off in order to satisfy the SEC’s requirement to show all charge-offs and recoveries in this table. We have increased provisions for credit losses for the purposes of this table by the amount of charge-offs of loans not previously provided for and decreased it by the amount of recoveries of loans previously provided for to produce the line item “net provisions for credit losses”. This has also allowed the figures for net provisions for credit losses in this table to match the amounts recorded under “Write-offs and credit loss provisions (net)” in our Consolidated Income Statement. |
60
Table of Contents
| EU — IFRS (*) | ||||||||||||||||
| Year Ended December 31, | ||||||||||||||||
| 2007 | 2006 | 2005 | 2004 | |||||||||||||
| (in thousands of euros) | ||||||||||||||||
Recoveries of loans previously charged off- | ||||||||||||||||
| Domestic: | ||||||||||||||||
| Commercial, financial, agricultural, industrial | 32,045 | 37,879 | 51,649 | 60,113 | ||||||||||||
| Real estate-construction | 10,718 | 5,646 | 140 | 2,488 | ||||||||||||
| Real estate-mortgage | 17,644 | 11,249 | 5,226 | 24,799 | ||||||||||||
| Installment loans to individuals | 70,082 | 59,726 | 32,303 | 44,340 | ||||||||||||
| Lease finance | 4,517 | 5,023 | 2,903 | 4,050 | ||||||||||||
| Other | 13,844 | 4,043 | 13,579 | 9,800 | ||||||||||||
| Total Borrowers in Spain | 148,849 | 123,566 | 105,800 | 145,591 | ||||||||||||
| Borrowers outside Spain | ||||||||||||||||
| Government and official institutions | 8 | 1,126 | 1 | 1,958 | ||||||||||||
| Bank and other financial institutions | 2,735 | 21 | 1,691 | 10,373 | ||||||||||||
| Commercial and industrial | 397,126 | 299,302 | 292,279 | 141,324 | ||||||||||||
| Mortgage loans | 30,360 | 7,751 | 3,468 | 8,288 | ||||||||||||
| Other | 45,141 | 119,840 | 83,778 | 97,834 | ||||||||||||
| Borrowers outside Spain | 475,371 | 428,040 | 381,217 | 259,777 | ||||||||||||
| Total | 624,220 | 551,606 | 487,017 | 405,368 | ||||||||||||
Net provisions for credit losses- | ||||||||||||||||
| Domestic: | ||||||||||||||||
| Commercial, financial, agricultural, industrial | (278,356 | ) | 405,914 | 296,879 | 333,801 | |||||||||||
| Real estate-construction | 240,462 | 20,430 | 49,925 | (621 | ) | |||||||||||
| Real estate-mortgage | 298,645 | 96,209 | 62,526 | 46,016 | ||||||||||||
| Installment loans to individuals | 383,582 | 278,223 | 161,027 | 121,574 | ||||||||||||
| Lease finance | 16,038 | 55,894 | 19,838 | 22,977 | ||||||||||||
| Other | (1,383 | ) | (62,772 | ) | 156,324 | 344,774 | ||||||||||
| Total Borrowers in Spain | 658,989 | 793,898 | 746,519 | 868,520 | ||||||||||||
| Borrowers outside Spain | ||||||||||||||||
| Government and official institutions | (1,797 | ) | 2,035 | 16,836 | (5,085 | ) | ||||||||||
| Bank and other financial institutions | (35,598 | ) | 72,479 | 1,698 | 46,117 | |||||||||||
| Commercial and industrial | 2,016,115 | 1,128,005 | 820,912 | 472,200 | ||||||||||||
| Mortgage loans | 237,553 | 11,612 | 88,812 | 64,375 | ||||||||||||
| Other | 620,796 | 475,833 | 73,123 | 135,613 | ||||||||||||
| Borrowers outside Spain | 2,837,069 | 1,689,964 | 1,001,381 | 713,220 | ||||||||||||
| Total | 3,496,058 | 2,483,862 | 1,747,900 | 1,581,740 | ||||||||||||
Charge offs against credit loss allowance | ||||||||||||||||
| Domestic: | ||||||||||||||||
| Commercial, financial, agricultural, industrial | (140,715 | ) | (55,982 | ) | (113,357 | ) | (158,248 | ) | ||||||||
| Real estate-construction | (29,466 | ) | (18,911 | ) | (8 | ) | (667 | ) | ||||||||
| Real estate-mortgage | (11,807 | ) | (7,284 | ) | (14,674 | ) | (36,253 | ) | ||||||||
| Installment loans to individuals | (356,532 | ) | (184,218 | ) | (67,554 | ) | (113,652 | ) | ||||||||
| Lease finance | (1,344 | ) | (1,775 | ) | (8,007 | ) | (2,249 | ) | ||||||||
| Other | (33,924 | ) | (1,389 | ) | (22,436 | ) | (33,323 | ) | ||||||||
| Total Borrowers in Spain | (573,787 | ) | (269,559 | ) | (226,036 | ) | (344,392 | ) | ||||||||
| Borrowers outside Spain | ||||||||||||||||
| Government and official institutions | — | (174 | ) | — | (1,706 | ) | ||||||||||
| Bank and other financial institutions | (2,432 | ) | (12,189 | ) | (86 | ) | (85,339 | ) | ||||||||
| Commercial and industrial | (1,969,576 | ) | (1,333,617 | ) | (1,120,180 | ) | (551,804 | ) | ||||||||
| Mortgage loans | (6,693 | ) | (46,603 | ) | (30,562 | ) | (4,923 | ) | ||||||||
| Other | (767,674 | ) | (707,723 | ) | (142,630 | ) | (37,265 | ) | ||||||||
| Borrowers outside Spain | (2,746,375 | ) | (2,100,306 | ) | (1,293,458 | ) | (681,036 | ) | ||||||||
| Total | (3,320,162 | ) | (2,369,865 | ) | (1,519,494 | ) | (1,025,428 | ) | ||||||||
| (*) | The EU-IFRS required to be applied under Bank of Spain’s Circular 4/2004 |
61
Table of Contents
| Previous Spanish GAAP | ||||
| Year Ended December 31, | ||||
| 2003 | ||||
| (in thousands of euros) | ||||
Loans charged off against income- | ||||
| Borrowers in Spain: | ||||
| Commercial, financial, agricultural, industrial | (2,917 | ) | ||
| Real estate-construction | (3 | ) | ||
| Real estate-mortgage | (1,042 | ) | ||
| Installment loans to individuals | (7,763 | ) | ||
| Lease finance | (992 | ) | ||
| Other | (12 | ) | ||
| Total Borrowers in Spain | (12,729 | ) | ||
| Borrowers outside Spain | ||||
| Government and official institutions | — | |||
| Bank and other financial institutions | (2,762 | ) | ||
| Commercial and industrial | (15,384 | ) | ||
| Other | (72,964 | ) | ||
| Total borrowers outside Spain | (91,110 | ) | ||
| Total | (103,839 | ) | ||
Recoveries of loans previously charged off- | ||||
| Domestic: | ||||
| Commercial, financial, agricultural, industrial | 47,069 | |||
| Real estate-construction | 425 | |||
| Real estate-mortgage | 15,164 | |||
| Installment loans to individuals | 35,389 | |||
| Lease finance | 1,644 | |||
| Other | 9,031 | |||
| Total Borrowers in Spain | 108,722 | |||
| Borrowers outside Spain | ||||
| Government and official institutions | 1,766 | |||
| Bank and other financial institutions | 13,485 | |||
| Commercial and industrial | 109,577 | |||
| Other | 123,937 | |||
| Borrowers outside Spain | 248,765 | |||
| Total | 357,487 | |||
Provisions for credit losses- | ||||
| Domestic: | ||||
| Commercial, financial, agricultural, industrial | 318,538 | |||
| Real estate-construction | 759 | |||
| Real estate-mortgage | 18,973 | |||
| Installment loans to individuals | 91,799 | |||
| Lease finance | 36,267 | |||
| Other | 214,898 | |||
| Total Borrowers in Spain | 681,234 | |||
| Borrowers outside Spain | ||||
| Government and official institutions | (3,350 | ) | ||
| Bank and other financial institutions | (19,983 | ) | ||
| Commercial and industrial | 434,725 | |||
| Other | 403,061 | |||
| Borrowers outside Spain | 814,453 | |||
| Total | 1,495,687 | |||
Charge offs against credit loss allowance | ||||
| Domestic: | ||||
| Commercial, financial, agricultural, industrial | (154,360 | ) | ||
| Real estate-construction | (811 | ) | ||
| Real estate-mortgage | (19,109 | ) | ||
| Installment loans to individuals | (59,334 | ) | ||
| Lease finance | (1,885 | ) | ||
| Other | (23,867 | ) | ||
| Total Borrowers in Spain | (259,366 | ) | ||
| Borrowers outside Spain | ||||
| Government and official institutions | (451 | ) | ||
| Bank and other financial institutions | (196,662 | ) | ||
| Commercial and industrial | (288,151 | ) | ||
| Other | (326,455 | ) | ||
| Borrowers outside Spain | (811,719 | ) | ||
| Total | (1,071,085 | ) | ||
62
Table of Contents
| EU – IFRS (*) | ||||||||||||||||||||||||||||||||
| December 31, | ||||||||||||||||||||||||||||||||
| 2007 | % | 2006 | % | 2005 | % | 2004 | % | |||||||||||||||||||||||||
| (in thousands of euros, except percentages) | ||||||||||||||||||||||||||||||||
| Borrowers in Spain: | ||||||||||||||||||||||||||||||||
| Commercial, financial, agricultural, industrial | 2,058,128 | 23.40 | 2,302,546 | 27.78 | 2,056,003 | 26.51 | 1,494,605 | 21.36 | ||||||||||||||||||||||||
| Real estate-construction | 475,907 | 5.41 | 267,771 | 3.23 | 270,369 | 3.49 | 7,929 | 0.11 | ||||||||||||||||||||||||
| Real estate-mortgage | 805,437 | 9.16 | 457,132 | 5.52 | 243,335 | 3.14 | 206,461 | 2.95 | ||||||||||||||||||||||||
| Installment loans to individuals | 926,917 | 10.53 | 889,283 | 10.73 | 612,564 | 7.90 | 491,698 | 7.03 | ||||||||||||||||||||||||
| Lease finance | 162,405 | 1.85 | 166,542 | 2.01 | 98,830 | 1.27 | 105,101 | 1.50 | ||||||||||||||||||||||||
| Other | 83,207 | 0.95 | 235,046 | 2.84 | 383,248 | 4.94 | 530,771 | 7.59 | ||||||||||||||||||||||||
| Total Borrowers in Spain | 4,512,000 | 51.30 | 4,318,320 | 52.10 | 3,664,349 | 47.24 | 2,836,564 | 40.54 | ||||||||||||||||||||||||
| Borrowers outside Spain: | ||||||||||||||||||||||||||||||||
| Government and official institutions | 25,650 | 0.29 | 30,054 | 0.36 | 41,302 | 0.53 | 53,966 | 0.77 | ||||||||||||||||||||||||
| Bank and other financial institutions | 101,387 | 1.15 | 149,729 | 1.81 | 68,122 | 0.88 | 176,115 | 2.52 | ||||||||||||||||||||||||
| Commercial and industrial | 2,762,325 | 31.40 | 2,670,075 | 32.22 | 3,413,736 | 44.01 | 3,551,929 | 50.76 | ||||||||||||||||||||||||
| Mortgage loans | 1,354,866 | 15.40 | 831,972 | 10.04 | 363,980 | 4.69 | 199,022 | 2.84 | ||||||||||||||||||||||||
| Other | 40,142 | 0.46 | 287,978 | 3.47 | 205,186 | 2.65 | 179,832 | 2.57 | ||||||||||||||||||||||||
| Total Borrowers outside Spain | 4,284,371 | 48.70 | 3,969,808 | 47.90 | 4,092,326 | 52.76 | 4,160,864 | 59.46 | ||||||||||||||||||||||||
| Total | 8,796,371 | 100.00 | 8,288,128 | 100.00 | 7,756,675 | 100.00 | 6,997,428 | 100.00 | ||||||||||||||||||||||||
| (*) | The EU-IFRS required to be applied under Bank of Spain’s Circular 4/2004 |
| Previous Spanish GAAP | ||||||||
| At December 31, | ||||||||
| (in thousands of euros, except percentages) | 2003 | % | ||||||
| Borrowers in Spain: | ||||||||
| Commercial, financial, agricultural, industrial | 738,291 | 13.64 | ||||||
| Real estate-construction | 5,673 | 0.10 | ||||||
| Real estate-mortgage | 187,635 | 3.47 | ||||||
| Installment loans to individuals | 250,750 | 4.63 | ||||||
| Lease finance | 57,686 | 1.07 | ||||||
| Other | 440,982 | 8.14 | ||||||
| Total Borrowers in Spain | 1,681,017 | 31.05 | ||||||
| Borrowers outside Spain: | ||||||||
| Government and official institutions | 23,688 | 0.44 | ||||||
| Bank and other financial institutions | 152,958 | 2.83 | ||||||
| Commercial and industrial | 3,131,665 | 57.83 | ||||||
| Other | 425,068 | 7.85 | ||||||
| Total Borrowers outside Spain | 3,733,379 | 68.95 | ||||||
| Total | 5,414,396 | 100.00 | ||||||
63
Table of Contents
| EU – IFRS (*) | ||||||||||||||||
| At December 31, | ||||||||||||||||
| Non-performing assets | 2007 | 2006 | 2005 | 2004 | ||||||||||||
| (in thousands of euros, except percentages) | ||||||||||||||||
| Past-due and other non-performing assets (1) (2) (3): | ||||||||||||||||
| Domestic | 1,887,167 | 1,288,857 | 1,110,784 | 1,018,088 | ||||||||||||
| International | 4,291,488 | 3,318,690 | 3,230,716 | 3,096,603 | ||||||||||||
Total | 6,178,655 | 4,607,547 | 4,341,500 | 4,114,691 | ||||||||||||
| Non-performing loans as a percentage of total loans | 1.07 | % | 0.87 | % | 0.98 | % | 1.09 | % | ||||||||
| Net loan charge-offs as a percentage of total loans | 0.47 | % | 0.34 | % | 0.23 | % | 0.16 | % | ||||||||
| (*) | The EU-IFRS required to be applied under Bank of Spain’s Circular 4/2004 | |
| (1) | We estimate that the total amount of our non-performing assets fully provisioned under the EU-IFRS required to be applied under Bank of Spain’s Circular 4/2004 and which under U.S. GAAP would have been charged-off from the balance sheet was €1,567.0 million, €1,302.6 million, €1,206.5 million and €1,582.0 million at December 31, 2004, 2005, 2006 and 2007 respectively. | |
| (2) | Non-performing assets due to country risk were €122.4 million, €121.1 million, €83.0 million and €6.7 million at December 31, 2004, 2005, 2006 and 2007, respectively. | |
| (3) | We estimate that at December 31, 2004, 2005, 2006 and 2007, (i) the total amount of our non-performing past-due assets was €3,501.0 million, €3,367.1 million, €3,841.2 million and €4,918.2 million, respectively, and (ii) the total amount of our other non-performing assets was €613.7 million, €974.4 million, €766.3 million and €1,260.5 million, respectively. |
| Previous Spanish GAAP | ||||
| At December 31, | ||||
| 2003 | ||||
| (in thousands of euros, | ||||
| except percentages) | ||||
| Past-due and other non-performing assets (1) (2) (3): | ||||
| Domestic | 931,583 | |||
| International | 2,290,921 | |||
Total | 3,222,504 | |||
| Non-performing loans as a percentage of total loans | 1.81 | % | ||
| Net loan charge-offs as a percentage of total loans | 0.46 | % | ||
| (1) | The figures in this table do not reflect the entire principal amount of loans having payments 90 days or more past due unless the entire principal amount of the loan is classified as non-performing under Bank of Spain regulations as described above under “—Bank of Spain Classification Requirements”. We estimate that the entire principal amount of such loans would have been €3,823.4 million at December 31, 2003. | |
| (2) | We estimate that at December 31, 2003, (i) the total amount of our non-performing past-due assets was €2,327.3 million and (ii) the total amount of our other non-performing assets was €895.2 million. | |
| (3) | We estimate that the total amount of our non-performing assets fully provisioned under Spanish GAAP and which under U.S. GAAP would have been charged-off from the balance sheet was €341.8 million at December 31, 2003. |
64
Table of Contents
| EU – IFRS (*) | ||||||||||||||||||||||||||||||||
| Quarter ended | Year ended | Year ended | Year ended | Year ended | ||||||||||||||||||||||||||||
| Mar. 31, | Jun. 30, | Sep. 30, | Dec. 31, | Dec. 31, | Dec. 31, | Dec. 31, | Dec. 31, | |||||||||||||||||||||||||
| (in thousands of euros) | 2007 | 2007 | 2007 | 2007 | 2007 | 2006 | 2005 | 2004 | ||||||||||||||||||||||||
| Opening balance | 4,607,547 | 4,936,052 | 5,353,641 | 5,737,934 | 4,607,547 | 4,341,500 | 4,114,691 | 3,512,727 | ||||||||||||||||||||||||
| Net additions | 1,058,004 | 1,046,786 | 1,255,895 | 1,530,586 | 4,891,270 | 2,635,912 | 1,737,692 | 1,627,392 | ||||||||||||||||||||||||
| Writeoffs | (729,499 | ) | (629,197 | ) | (871,602 | ) | (1,089,865 | ) | (3,320,162 | ) | (2,369,865 | ) | (1,510,833 | ) | (1,025,428 | ) | ||||||||||||||||
Closing balance(1) | 4,936,052 | 5,353,641 | 5,737,934 | 6,178,655 | 6,178,655 | 4,607,547 | 4,341,500 | 4,114,691 | ||||||||||||||||||||||||
| (*) | The EU-IFRS required to be applied under Bank of Spain’s Circular 4/2004 | |
| (1) | Non-performing assets due to country-risk were €6.7 million, €83.0 million and €121.1 million at December 31, 2007, 2006 and 2005, respectively. |
| Previous Spanish GAAP | ||||
| Year ended December 31, | ||||
| 2003 | ||||
| (in thousands of euros) | ||||
| Opening balance | 3,676,467 | |||
| Net additions | 720,500 | |||
| Writeoffs | (1,174,463 | ) | ||
Closing balance | 3,222,504 | |||
65
Table of Contents
| EU – IFRS (*) | ||||||||||||||||
| At December 31, | ||||||||||||||||
| 2007 | 2006 | 2005 | 2004 | |||||||||||||
| (in thousands of euros, except percentages) | ||||||||||||||||
| Computable credit risk (1) | 649,342,484 | 588,372,837 | 489,662,040 | 411,482,598 | ||||||||||||
| Non-performing assets | ||||||||||||||||
| Mortgage loans | 1,843,628 | 1,364,317 | 1,209,137 | 1,352,564 | ||||||||||||
| Other | 4,335,027 | 3,243,230 | 3,132,363 | 2,762,127 | ||||||||||||
Total non performing assets | 6,178,655 | 4,607,547 | 4,341,500 | 4,114,691 | ||||||||||||
| Allowances for non-performing assets | 9,302,230 | 8,626,937 | 7,902,225 | 6,813,354 | ||||||||||||
| Ratios | ||||||||||||||||
Non-performing assets to computable credit risk | 0.95 | % | 0.78 | % | 0.89 | % | 1.00 | % | ||||||||
Coverage ratio (2) | 150.55 | % | 187.23 | % | 182.02 | % | 165.59 | % | ||||||||
| (*) | The EU-IFRS required to be applied under Bank of Spain’s Circular 4/2004 | |
| (1) | Computable credit risk is the sum of the face amounts of loans and leases (including non-performing assets but excluding country risk loans), guarantees and documentary credits. | |
| (2) | Allowances for non-performing assets as a percentage of non-performing assets. |
| Previous Spanish GAAP | ||||
| At December 31, 2003 | ||||
| (in thousands of euros, | ||||
| except percentages) | ||||
| Computable credit risk (1) | 207,979,474 | |||
| Non-performing assets | ||||
| Mortgage loans | 510,265 | |||
| Other | 2,712,239 | |||
Total non performing assets | 3,222,504 | |||
| Allowances for non-performing assets | 5,323,127 | |||
| Ratios | ||||
Non-performing assets to computable credit risk | 1.55 | % | ||
Coverage ratio (2) | 165.19 | % | ||
| (1) | Computable credit risk is the sum of the face amounts of loans and leases (including non-performing assets but excluding country risk loans), guarantees and documentary credits. | |
| (2) | Allowances for non-performing assets as a percentage of non-performing assets. |
66
Table of Contents
| EU – IFRS (*) | ||||||||||||||||
| Year ended December 31, | ||||||||||||||||
| 2007 | 2006 | 2005 | 2004 | |||||||||||||
| (in millions of euros) | ||||||||||||||||
| Risk (gross) | 844.5 | 899.1 | 668.1 | 1,063.7 | ||||||||||||
| Provisions | 124.0 | 233.5 | 313.0 | 275.0 | ||||||||||||
Risk (net) | 720.5 | 665.6 | 355.1 | 788.8 | ||||||||||||
| (*) | The EU-IFRS required to be applied under Bank of Spain’s Circular 4/2004 |
| Previous Spanish GAAP | ||||
| Year ended December 31, | ||||
| 2003 | ||||
| (in millions of euros) | ||||
| Risk (gross) | 497.0 | |||
| Provisions | 406.0 | |||
Risk (net) | 91.0 | |||
| (*) | The EU-IFRS required to be applied under Bank of Spain’s Circular 4/2004 |
| EU – IFRS (*) | ||||||||||||||||
| Summary of non-accrual assets | Year Ended December 31, | |||||||||||||||
| 2007 | 2006 | 2005 | 2004 | |||||||||||||
| (in millions of euros) | ||||||||||||||||
| Assets classified as Non Performing Assets | 6,178.7 | 4,607.5 | 4,341.5 | 4,114.7 | ||||||||||||
| Non Performing Assets due to country risk | 6.7 | 23.7 | 40.3 | 117.1 | ||||||||||||
| Other assets on non-accrual status due to country risk | 893.6 | 874.5 | 626.5 | 717.5 | ||||||||||||
Total non-accruing assets | 7,078.9 | 5,505.7 | 5,008.3 | 4,949.3 | ||||||||||||
| (*) | The EU-IFRS required to be applied under Bank of Spain’s Circular 4/2004 |
67
Table of Contents
| Previous Spanish GAAP | ||||
| Year Ended December 31, | ||||
| Summary of non-accrual assets | 2003 | |||
| (in millions of euros) | ||||
| Assets classified as Non Performing Assets | 3,222.5 | |||
| Outstanding balances of loans partially classified as non-performing | 600.9 | |||
| Other assets on non-accrual status due to country risk | 249.7 | |||
Total non-accruing assets | 4,073.1 | |||
| EU – IFRS (*) | ||||||||||||||||||||||||||||
| Year ended | ||||||||||||||||||||||||||||
| Quarterly movements | December 31, | |||||||||||||||||||||||||||
| Mar. 31, | Jun. 30, | Sep. 30, | Dec. 31, | |||||||||||||||||||||||||
| 2007 | 2007 | 2007 | 2007 | 2007 | 2006 | 2005 | ||||||||||||||||||||||
| (in thousands of euros, except percentages) | ||||||||||||||||||||||||||||
| Opening balance | 408,450 | 410,830 | 414,016 | 428,805 | 408,450 | 408,042 | 372,519 | |||||||||||||||||||||
| Foreclosures | 182,050 | 185,446 | 199,069 | 284,587 | 851,152 | 639,808 | 442,458 | |||||||||||||||||||||
| Sales | (179,670 | ) | (182,260 | ) | (184,280 | ) | (218,825 | ) | (765,035 | ) | (639,400 | ) | (406,935 | ) | ||||||||||||||
| Gross foreclosed assets | 410,830 | 414,016 | 428,805 | 494,567 | 494,567 | 408,450 | 408,042 | |||||||||||||||||||||
| Allowances established | 129,447 | 117,926 | 116,501 | 111,026 | 111,026 | (129,611 | ) | (115,683 | ) | |||||||||||||||||||
| Allowance as a percentage of foreclosed assets | 31.51 | % | 28.48 | % | 27.17 | % | 22.45 | % | 22.45 | % | 31.73 | % | 28.35 | % | ||||||||||||||
Closing balance (net) | 281,383 | 296,090 | 312,304 | 383,541 | 383,541 | 278,839 | 292,359 | |||||||||||||||||||||
| (*) | The EU-IFRS required to be applied under Bank of Spain’s Circular 4/2004 |
68
Table of Contents
| EU – IFRS (*) | ||||||||||||
| At December 31, | ||||||||||||
| Deposits from central banks and credit institutions- | 2007 | 2006 | 2005 | |||||||||
| (in thousands of euros) | ||||||||||||
| Reciprocal accounts | 562,619 | 411,314 | 190,885 | |||||||||
| Time deposits | 71,226,437 | 63,589,635 | 47,224,471 | |||||||||
| Other demand accounts | 2,466,370 | 2,225,037 | 7,383,695 | |||||||||
| Repurchase agreements | 36,615,910 | 45,417,839 | 91,399,196 | |||||||||
| Central bank credit account drawdowns | 2,008,927 | 1,348,815 | 2,369,406 | |||||||||
| Other financial liabilities associated with transferred financial assets | — | 8,445 | 7,170 | |||||||||
| Hybrid financial liabilities | 15,760 | 34,852 | 47,584 | |||||||||
Total | 112,896,023 | 113,035,937 | 148,622,407 | |||||||||
Customer deposits- | ||||||||||||
| Demand deposits- | ||||||||||||
| Current accounts | 87,136,743 | 89,151,030 | 80,631,188 | |||||||||
| Savings accounts | 90,727,525 | 93,717,633 | 90,471,827 | |||||||||
| Other demand deposits | 3,593,720 | 2,025,095 | 1,747,720 | |||||||||
| Time deposits- | ||||||||||||
| Fixed-term deposits | 92,673,147 | 86,345,788 | 77,166,817 | |||||||||
| Home-purchase savings accounts | 296,768 | 324,262 | 269,706 | |||||||||
| Discount deposits | 9,933,139 | 7,132,341 | 16,128,577 | |||||||||
| Funds received under financial asset transfers | — | — | 1 | |||||||||
| Hybrid financial liabilities | 8,494,773 | 4,994,535 | 4,141,071 | |||||||||
| Other financial liabilities associated with transferred financial assets | — | — | 20,346 | |||||||||
| Other time deposits | 113,562 | 470,140 | 351,620 | |||||||||
| Notice deposits | 283,301 | 45,849 | 33,713 | |||||||||
| Repurchase agreements | 62,451,624 | 47,015,928 | 34,802,694 | |||||||||
Total | 355,704,302 | 331,222,601 | 305,765,280 | |||||||||
Total deposits | 468,600,325 | 444,258,538 | 454,387,687 | |||||||||
| (*) | The EU-IFRS required to be applied under Bank of Spain’s Circular 4/2004 |
69
Table of Contents
| EU – IFRS (*) | ||||||||||||
| At December 31, | ||||||||||||
| Deposits from central banks and credit institutions- | 2007 | 2006 | 2005 | |||||||||
| (in thousands of euros) | ||||||||||||
Due to credit institutions | ||||||||||||
| Offices in Spain | 66,137,878 | 45,786,284 | 76,504,500 | |||||||||
| Offices outside Spain: | ||||||||||||
| Other EU countries | 31,782,431 | 47,733,849 | 9,647,389 | |||||||||
| United States | 421,513 | 300,336 | 1,439,643 | |||||||||
| Other OECD countries (1) | 44,136 | 24,509 | 36,905,723 | |||||||||
| Central and South America (1) | 14,502,083 | 19,146,367 | 23,926,745 | |||||||||
| Other | 7,982 | 44,592 | 198,407 | |||||||||
| Total offices outside Spain | 46,758,145 | 67,249,653 | 72,117,907 | |||||||||
Total | 112,896,023 | 113,035,937 | 148,622,407 | |||||||||
Customer deposits | ||||||||||||
| Offices in Spain | 132,008,374 | 120,485,991 | 107,117,818 | |||||||||
| Offices outside Spain: | ||||||||||||
| Other EU countries | 134,620,750 | 136,730,342 | 133,274,597 | |||||||||
| United States | 17,888,682 | 7,512,963 | 7,578,598 | |||||||||
| Other OECD countries (1) | 189,548 | 79,117 | 106,151 | |||||||||
| Central and South America (1) | 69,361,574 | 64,984,913 | 56,395,157 | |||||||||
| Other | 1,635,374 | 1,429,275 | 1,292,959 | |||||||||
| Total offices outside Spain | 223,695,928 | 210,736,610 | 198,647,462 | |||||||||
Total | 355,704,302 | 331,222,601 | 305,765,280 | |||||||||
Total deposits | 468,600,325 | 444,258,538 | 454,387,687 | |||||||||
| (*) | The EU-IFRS required to be applied under Bank of Spain’s Circular 4/2004 | |
| (1) | In this schedule Mexico is classified under “Central and South America” |
| December 31, 2007 | ||||||||||||
| Domestic | International | Total | ||||||||||
| (in thousands of euros) | ||||||||||||
| Under 3 months | 12,802,297 | 21,430,235 | 34,232,532 | |||||||||
| 3 to 6 months | 2,581,027 | 4,650,391 | 7,231,418 | |||||||||
| 6 to 12 months | 2,897,014 | 4,798,172 | 7,695,187 | |||||||||
| Over 12 months | 1,243,727 | 11,604,655 | 12,848,382 | |||||||||
Total | 19,524,066 | 42,483,453 | 62,007,519 | |||||||||
70
Table of Contents
| EU – IFRS (*) | ||||||||||||||||||||||||
| Short-Term Borrowings | At December 31, | |||||||||||||||||||||||
| 2007 | 2006 | 2005 | ||||||||||||||||||||||
| Average | Average | Average | ||||||||||||||||||||||
| Amount | Rate | Amount | Rate | Amount | Rate | |||||||||||||||||||
| (in thousands of euros, except percentages) | ||||||||||||||||||||||||
| Securities sold under agreements to repurchase (principally Spanish Treasury notes and bills): | ||||||||||||||||||||||||
| At December 31 | 99,067,534 | 3.66 | % | 92,433,767 | 4.39 | % | 126,201,890 | 3.55 | % | |||||||||||||||
| Average during year | 90,977,794 | 3.86 | % | 101,682,243 | 3.74 | % | 91,458,502 | 3.65 | % | |||||||||||||||
| Maximum month-end balance | 99,067,534 | 129,816,503 | 129,563,533 | |||||||||||||||||||||
| Other short-term borrowings: | ||||||||||||||||||||||||
| At December 31 | 32,706,892 | 7.29 | % | 35,385,525 | 2.50 | % | 25,157,976 | 2.34 | % | |||||||||||||||
| Average during year | 27,071,238 | 5.42 | % | 25,501,630 | 2.66 | % | 21,249,880 | 4.23 | % | |||||||||||||||
| Maximum month-end balance | 44,052,354 | 35,385,525 | 26,688,044 | |||||||||||||||||||||
Total short-term borrowings at year-end | 131,774,426 | 4.56 | % | 127,819,292 | 3.87 | % | 151,359,866 | 3.35 | % | |||||||||||||||
| (*) | The EU-IFRS required to be applied under Bank of Spain’s Circular 4/2004 |
| • | Program of activities detailing the transactions to be made and the corporate structure of the branch. | ||
| • | Address in Spain of the branch. | ||
| • | Name and curriculum vitae of the branch’s managers. | ||
| • | Stockholders’ equity and solvency ratio of the financial institution and its consolidated group. | ||
| • | Detailed information about any deposit guarantee scheme that assures the protection of the branch’s depositors. |
71
Table of Contents
| • | amount of the investment, | ||
| • | percentage of the share capital and of the total voting rights, | ||
| • | name of the companies through which the investment will be made, | ||
| • | draft of the By-laws, | ||
| • | program of activities, setting out the types of business envisaged, the administrative and accounting organization and the internal control procedures, including those established to prevent money laundering transactions, | ||
| • | list of the persons who will be members of the first board of directors and of the senior management, | ||
| • | list of partners with significant holdings, and | ||
| • | detailed description of the banking, tax and anti-money laundering regulations of the country where it will be located. |
72
Table of Contents
73
Table of Contents
74
Table of Contents
75
Table of Contents
76
Table of Contents
77
Table of Contents
78
Table of Contents
79
Table of Contents
80
Table of Contents
81
Table of Contents
| • | In the valuation of financial instruments permitting static hedging (principally forwards and swaps), and in the valuation of loans and advances, the “present value” method is used. Expected future cash flows are discounted using the interest rate curves of the applicable currencies. The interest rate curves are generally observable market data. | ||
| • | In the valuation of financial instruments requiring dynamic hedging (principally structured options and other structured instruments), the Black-Scholes model is generally used. Certain observable market inputs are used in the Black-Scholes model to generate variables such as the bid-offer spread, exchange rates, volatility, correlation between indexes and market liquidity, as appropriate. | ||
| • | In the valuation of financial instruments exposed to interest rate risk (such as interest rate futures, caps and floors), the present value method (futures) and Black-Scholes model (plain vanilla options) are used. For more structured instruments that require dynamic hedging, the Heath-Jarrow-Morton model is used. The main inputs used in these models are principally observable market data, including appropriate interest rate curves, volatilities, correlations and exchange rates. | ||
| • | In the case of linear instruments (such as bonds and fixed-income derivatives), credit risk is measured using dynamic models similar to those used in the measurement of interest rate risk. In the case of non-linear instruments, if they are exposed to portfolio credit risk (such as credit derivatives), the joint probability of default is determined using the Standard Gaussian Copula model. The main inputs used in the Standard Gaussian Copula model are generally data relating to individual issuers in the portfolio and correlations thereto. The main inputs used in determining the underlying cost of credit for credit risk derivatives are quoted credit spreads, and the correlation between individual issuers’ quoted credit derivatives. |
| • | Individually, for all significant debt instruments and for instruments which, although not material, are not susceptible to being classified in homogeneous groups of instruments with similar risk characteristics: instrument type, debtor’s industry and geographical location, type of guarantee or collateral, and age of past-due amounts, taking into account: (i) the present value of future cash flows, discounted at an appropriate discount rate; (ii) the debtor’s financial situation; and (iii) any guarantees in place. | ||
| • | Collectively, in all other cases, we group transactions on the basis of the nature of the obligors, the conditions of the countries in which they reside, transaction status, type of collateral or guarantee, and age of past-due amounts. For each group, we establish the appropriate impairment losses (“identified losses”) that must be recognized. |
82
Table of Contents
| (i) | No appreciable risk. | ||
| (ii) | Low risk. | ||
| (iii) | Medium-low risk. | ||
| (iv) | Medium risk. | ||
| (v) | Medium-high risk. | ||
| (vi) | High risk. |
83
Table of Contents
84
Table of Contents
85
Table of Contents
| • | assumed interest rates; |
| • | mortality tables; |
| • | annual social security pension revision rate; |
| • | price inflation; |
| • | annual salary growth rate, and |
| • | the method used to calculate vested commitments to current employees. |
86
Table of Contents
87
Table of Contents
88
Table of Contents
89
Table of Contents
90
Table of Contents
| Percent Owned | Contributions to Net Income (1) | |||||||
| Investment | Dec. 31, 2007 | 2007 | ||||||
| (in millions of euros, except percentages) | ||||||||
| CEPSA | 31.6 | % | 206.7 | |||||
| RFS Holdings | 27.9 | % | 141.3 | |||||
| Sovereign Bancorp | 24.4 | % | 43.4 | |||||
| Attijariwafa Bank Société Anonyme | 14.5 | % | 25.7 | |||||
| (1) | Contributions to income from companies accounted for by the equity method include dividends. |
| Percent Owned | Contributions to Net Income (1) | |||||||
| Investment | Dec. 31, 2006 | 2006 | ||||||
| (in millions of euros, except percentages) | ||||||||
| CEPSA | 30.0 | % | 370.2 | |||||
| Attijariwafa Bank Société Anonyme | 14.5 | % | 24.2 | |||||
| Sovereign Bancorp | 24.8 | % | 9.2 | |||||
| (1) | Contributions to income from companies accounted for by the equity method include dividends. |
| Amount | % | ||||||||||||||||
| 2007 | 2006 | Change | Change | ||||||||||||||
| (in thousands of euros, except percentages) | |||||||||||||||||
| Commissions for services | 5,168,366 | 4,461,041 | 707,325 | 15.86 | |||||||||||||
| Credit and debit cards | 853,084 | 663,717 | 189,367 | 28.53 | |||||||||||||
| Insurance | 1,431,876 | 1,184,723 | 247,153 | 20.86 | |||||||||||||
| Account management | 571,394 | 554,882 | 16,512 | 2.98 | |||||||||||||
| Bill discounting | 225,134 | 231,585 | (6,451 | ) | (2.79 | ) | |||||||||||
| Contingent liabilities | 349,878 | 302,033 | 47,845 | 15.84 | |||||||||||||
| Other operations | 1,737,000 | 1,524,101 | 212,899 | 13.97 | |||||||||||||
| Mutual and pension funds | 1,891,417 | 1,785,467 | 96,012 | 5.87 | |||||||||||||
| Securities services | 980,392 | 777,687 | 202,705 | 26.07 | |||||||||||||
Total net fees and commissions | 8,040,175 | 7,024,195 | 1,015,980 | 14.46 | |||||||||||||
91
Table of Contents
| Amount | % | |||||||||||||||
| 2006 | 2005 | Change | Change | |||||||||||||
| (in thousands of euros, except percentages) | ||||||||||||||||
| Commissions for services | 4,461,041 | 3,779,188 | 681,853 | 18.04 | ||||||||||||
| Credit and debit cards | 663,717 | 619,919 | 43,798 | 7.07 | ||||||||||||
| Insurance | 1,184,723 | 924,121 | 260,602 | 28.20 | ||||||||||||
| Account management | 554,882 | 544,629 | 10,253 | 1.88 | ||||||||||||
| Bill discounting | 231,585 | 218,464 | 13,121 | 6.01 | ||||||||||||
| Contingent liabilities | 302,033 | 253,868 | 49,165 | 19.44 | ||||||||||||
| Other operations | 1,524,101 | 1,219,187 | 304,914 | 25.01 | ||||||||||||
| Mutual and pension funds | 1,785,467 | 1,644,983 | 140,484 | 8.54 | ||||||||||||
| Securities services | 777,687 | 637,025 | 140,662 | 22.08 | ||||||||||||
Total net fees and commissions | 7,024,195 | 6,061,196 | 962,999 | 15.89 | ||||||||||||
92
Table of Contents
| 2007 | 2006 | |||||||||||||||
| Sales/ | Cost of | Sales/ | Cost of | |||||||||||||
| Income | Sales | Income | Sales | |||||||||||||
| (in thousands of euros) | ||||||||||||||||
| Property | 40,368 | (12,232 | ) | 45,875 | (17,531 | ) | ||||||||||
| Rail transport (*) | 251,545 | (188,514 | ) | 240,411 | (190,236 | ) | ||||||||||
| Other | 479,114 | (418,209 | ) | 448,316 | (407,922 | ) | ||||||||||
| 771,027 | (618,955 | ) | 734,602 | (615,689 | ) | |||||||||||
| (*) | Porterbrook (part of the Abbey Group) leases rail transport stock to UK railway operators. |
93
Table of Contents
| 2006 | 2005 | |||||||||||||||
| Sales/ | Cost of | Sales/ | Cost of | |||||||||||||
| Income | Sales | Income | Sales | |||||||||||||
| (in thousands of euros) | ||||||||||||||||
| Property | 45,875 | (17,531 | ) | 80,464 | (55,789 | ) | ||||||||||
| Rail transport (*) | 240,411 | (190,236 | ) | 285,207 | (233,085 | ) | ||||||||||
| Other | 448,316 | (407,922 | ) | 199,854 | (120,473 | ) | ||||||||||
| 734,602 | (615,689 | ) | 565,525 | (409,347 | ) | |||||||||||
| (*) | Porterbrook (part of the Abbey Group) leases rail transport stock to UK railway operators. |
| Amount | % | |||||||||||||||
| 2007 | 2006 | Change | Change | |||||||||||||
| (in thousands of euros, except percentages) | ||||||||||||||||
| Personnel expenses | 6,551,201 | 5,967,873 | 583,328 | 9.77 | ||||||||||||
| Other administrative expenses | 4,467,128 | 4,001,298 | 465,830 | 11.51 | ||||||||||||
| Building and premises | 989,663 | 972,933 | 16,730 | 1.72 | ||||||||||||
| Other expenses | 912,621 | 835,554 | 77,067 | 9.22 | ||||||||||||
| Information technology | 488,741 | 417,977 | 70,764 | 16.93 | ||||||||||||
| Advertising | 563,986 | 474,290 | 89,696 | 18.91 | ||||||||||||
| Communications | 417,587 | 346,854 | 70,733 | 20.39 | ||||||||||||
| Technical reports | 298,175 | 258,349 | 39,826 | 15.42 | ||||||||||||
| Per diems and travel expenses | 279,298 | 242,444 | 36,854 | 15.20 | ||||||||||||
| Taxes (other than income tax) | 279,093 | 227,835 | 51,258 | 22.50 | ||||||||||||
| Guard and cash courier services | 201,532 | 189,474 | 12,058 | 6.36 | ||||||||||||
| Insurance premiums | 36,432 | 35,588 | 844 | 2.37 | ||||||||||||
Total general administrative expenses | 11,018,329 | 9,969,171 | 1,049,158 | 10.52 | ||||||||||||
94
Table of Contents
| Amount | % | |||||||||||||||
| 2006 | 2005 | Change | Change | |||||||||||||
| (in thousands of euros, except percentages) | ||||||||||||||||
| Personnel expenses | 5,967,873 | 5,611,308 | 356,565 | 6.35 | ||||||||||||
| Other administrative expenses | 4,001,298 | 3,753,100 | 248,198 | 6.61 | ||||||||||||
| Building and premises | 972,933 | 880,117 | 92,816 | 10.55 | ||||||||||||
| Other expenses | 835,554 | 821,405 | 14,149 | 1.72 | ||||||||||||
| Information technology | 417,977 | 419,116 | (1,139 | ) | (0.27 | ) | ||||||||||
| Advertising | 474,290 | 390,202 | 84,088 | 21.55 | ||||||||||||
| Communications | 346,854 | 390,668 | (43,814 | ) | (11.22 | ) | ||||||||||
| Technical reports | 258,349 | 270,282 | (11,933 | ) | (4.42 | ) | ||||||||||
| Per diems and travel expenses | 242,444 | 214,553 | 27,891 | 13.00 | ||||||||||||
| Taxes (other than income tax) | 227,835 | 179,889 | 47,946 | 26.65 | ||||||||||||
| Guard and cash courier services | 189,474 | 158,566 | 30,908 | 19.49 | ||||||||||||
| Insurance premiums | 35,588 | 28,302 | 7,286 | 25.74 | ||||||||||||
Total general administrative expenses | 9,969,171 | 9,364,408 | 604,763 | 6.46 | ||||||||||||
95
Table of Contents
| Amount | ||||||||||||
| 2007 | 2006 | Change | ||||||||||
| (in thousands of euros) | ||||||||||||
| Loans and receivables | (3,496,058 | ) | (2,483,862 | ) | (1,012,196 | ) | ||||||
| Investments | (363,637 | ) | (380 | ) | (363,257 | ) | ||||||
| Goodwill | (599,982 | ) | (12,811 | ) | (587,178 | ) | ||||||
| Other intangible assets | (562,883 | ) | — | (562,883 | ) | |||||||
| Other | (55,953 | ) | (53,517 | ) | (2,429 | ) | ||||||
Total impairment losses (net) | (5,078,513 | ) | (2,550,570 | ) | (2,527,943 | ) | ||||||
96
Table of Contents
| Amount | % | |||||||||||||||
| 2007 | 2006 | Change | Change | |||||||||||||
| (in millions of euros, except percentages) | ||||||||||||||||
| On disposal of investments | 16.4 | 272.0 | (255.6 | ) | (93.97 | ) | ||||||||||
Of which: ADRs (Banco Santander Chile) | — | 269.8 | (269.8 | ) | — | |||||||||||
| Amount | % | |||||||||||||||
| 2006 | 2005 | Change | Change | |||||||||||||
| (in millions of euros, except percentages) | ||||||||||||||||
| On disposal of investments | 272.0 | 1,298.9 | (1,027.0 | ) | (79.06 | ) | ||||||||||
Of which: Unión Fenosa | — | 1,156.6 | (1,156.6 | ) | — | |||||||||||
| Amount | % | |||||||||||||||
| Results on other disposals | 2007 | 2006 | Change | Change | ||||||||||||
| (in millions of euros, except percentages) | ||||||||||||||||
| On disposal of tangible assets | 1,804.1 | 88.9 | 1,715.2 | 1,929.5 | % | |||||||||||
| Other | 322.8 | 1,044.9 | (722.1 | ) | (69.1 | )% | ||||||||||
Of which, obtained on the disposal of: | ||||||||||||||||
Antena 3 TV | — | 294.3 | (294.3 | ) | ||||||||||||
Intesa Sanpaolo(*) | 566.1 | 704.9 | (138.8 | ) | ||||||||||||
Net gains | 2,126.9 | 1,133.8 | 993.1 | 87.6 | % | |||||||||||
| (*) | Entity resulting from the merger of San Paolo-IMI and Intesa |
97
Table of Contents
| Amount | % | |||||||||||||||
| Results on other disposals | 2006 | 2005 | Change | Change | ||||||||||||
| (in millions of euros, except percentages) | ||||||||||||||||
| On disposal of tangible assets | 88.9 | 80.6 | 8.3 | 10.3 | % | |||||||||||
| Other | 1,044.9 | 1,133.8 | (89.0 | ) | (7.8 | %) | ||||||||||
Of which, obtained on the disposal of: | ||||||||||||||||
Antena 3 TV | 294.3 | — | 294.3 | |||||||||||||
San Paolo IMI | 704.9 | — | 704.9 | |||||||||||||
RBS | — | 717.4 | (717.4 | ) | ||||||||||||
Auna | — | 354.8 | (354.8 | ) | ||||||||||||
Net gains | 1,133.8 | 1,214.4 | (80.6 | ) | (6.6 | %) | ||||||||||
98
Table of Contents
| Year ended December 31, | ||||||||||||
| 2007 | 2006 | 2005 | ||||||||||
| As Reported | (in thousands of euros, except per share data) | |||||||||||
| Profit attributed to the Group | 9,060,258 | 7,595,947 | 6,220,104 | |||||||||
| Profit attributed to the Group per average share (1) | 1.43 | 1.22 | 1.00 | |||||||||
| U.S. GAAP | ||||||||||||
| Net income | 7,296,817 | 7,414,571 | 6,318,460 | |||||||||
| Net income per average share (1) | 1.15 | 1.19 | 1.01 | |||||||||
| (1) | Based on the average number of shares outstanding in the relevant year. |
99
Table of Contents
| Continental Europe | Variations | |||||||||||||||||||
| 2007 | 2006 | 2005 | 07/06 (%) | 06/05 (%) | ||||||||||||||||
| (in millions of euros, except percentages) | ||||||||||||||||||||
Net interest income | 7,894 | 6,206 | 5,366 | 27.20 | 15.65 | |||||||||||||||
| Share of results of entities accounted for using the equity method | 9 | 6 | 26 | 50.00 | (76.92 | ) | ||||||||||||||
| Net fee and commission income | 4,137 | 3,653 | 3,291 | 13.25 | 11.01 | |||||||||||||||
| Insurance activity income | 148 | 137 | 115 | 8.03 | 19.13 | |||||||||||||||
| Gains/losses on financial assets and liabilities and Exchange differences | 732 | 708 | 505 | 3.40 | 40.20 | |||||||||||||||
Gross income | 12,921 | 10,710 | 9,302 | 20.63 | 15.12 | |||||||||||||||
| Sales and income from the provision of non-financial services (net) and Other operating income/expense | 30 | 39 | 55 | (23.08 | ) | (29.09 | ) | |||||||||||||
| General administrative expenses: | (4,529 | ) | (3,957 | ) | (3,663 | ) | 14.44 | 8.01 | ||||||||||||
| Personnel expenses | (3,014 | ) | (2,684 | ) | (2,510 | ) | 12.30 | 6.93 | ||||||||||||
| Other administrative expenses | (1,513 | ) | (1,272 | ) | (1,154 | ) | 18.95 | 10.23 | ||||||||||||
| Depreciation and amortization | (559 | ) | (523 | ) | (489 | ) | 6.88 | 6.95 | ||||||||||||
Net operating income | 7,864 | 6,270 | 5,205 | 25.41 | 20.46 | |||||||||||||||
| Net impairment losses | (1,580 | ) | (1,355 | ) | (977 | ) | 16.61 | 38.69 | ||||||||||||
| Other gains/losses | 39 | (245 | ) | (18 | ) | (115.92 | ) | 1,261.11 | ||||||||||||
Profit before tax | 6,323 | 4,670 | 4,210 | 35.40 | 10.93 | |||||||||||||||
Profit from continuing operations | 4,546 | 3,269 | 3,020 | 39.06 | 8.25 | |||||||||||||||
| Profit from discontinued operations | — | 1,147 | 111 | (100.00 | ) | 933.33 | ||||||||||||||
Consolidated profit for the year | 4,546 | 4,416 | 3,131 | 2.94 | 41.04 | |||||||||||||||
Profit attributed to the Group | 4,439 | 4,144 | 2,980 | 7.12 | 39.06 | |||||||||||||||
100
Table of Contents
101
Table of Contents
| United Kingdom (Abbey) | Abbey | Variation | ||||||||||||||||||
| 2007 | 2006 | 2005 | 07/06 (%) | 06/05 (%) | ||||||||||||||||
| (in millions of euros, except percentages) | ||||||||||||||||||||
Net interest income | 2,335 | 2,108 | 2,083 | 10.77 | 1.20 | |||||||||||||||
| Share of results of entities accounted for using the equity method | 2 | 3 | 2 | (33.33 | ) | 50.00 | ||||||||||||||
| Net fee and commission income | 1,007 | 1,025 | 947 | (1.76 | ) | 8.24 | ||||||||||||||
| Insurance activity income | — | — | — | — | — | |||||||||||||||
| Gains/losses on financial assets and liabilities and Exchange differences | 436 | 424 | 345 | 2.83 | 22.90 | |||||||||||||||
Gross income | 3,780 | 3,560 | 3,377 | 6.18 | 5.42 | |||||||||||||||
| Sales and income from the provision of non-financial services (net) and Other operating income/expense | 51 | 42 | 36 | 21.43 | 16.67 | |||||||||||||||
| General administrative expenses: | (1,816 | ) | (1,877 | ) | (2,007 | ) | (3.25 | ) | (6.47 | ) | ||||||||||
| Personnel expenses | (1,037 | ) | (1,062 | ) | (1,119 | ) | (2.35 | ) | (5.09 | ) | ||||||||||
| Other administrative expenses | (780 | ) | (815 | ) | (888 | ) | (4.29 | ) | (8.22 | ) | ||||||||||
| Depreciation and amortization | (102 | ) | (105 | ) | (117 | ) | (2.86 | ) | (10.26 | ) | ||||||||||
Net operating income | 1,912 | 1,620 | 1,289 | 18.02 | 25.68 | |||||||||||||||
| Net impairment losses | (312 | ) | (387 | ) | (318 | ) | (19.38 | ) | 21.70 | |||||||||||
| Other gains/losses | 22 | — | 76 | — | (100.58 | ) | ||||||||||||||
Profit before tax | 1,622 | 1,233 | 1,047 | 31.55 | 17.77 | |||||||||||||||
Profit from continuing operations | 1,201 | 889 | 725 | 35.10 | 22.62 | |||||||||||||||
| Profit from discontinued operations | — | 114 | 86 | (100.00 | ) | 32.56 | ||||||||||||||
Consolidated profit for the year | 1,201 | 1,003 | 811 | 19.74 | 23.67 | |||||||||||||||
Profit attributed to the Group | 1,201 | 1,003 | 811 | 19.74 | 23.67 | |||||||||||||||
102
Table of Contents
103
Table of Contents
| Latin America | Latin America | Variations | ||||||||||||||||||
| 2007 | 2006 | 2005 | 07/06 (%) | 06/05 (%) | ||||||||||||||||
| (in millions of euros, except percentages) | ||||||||||||||||||||
Net interest income | 6,654 | 5,272 | 3,950 | 26.19 | 33.48 | |||||||||||||||
| Share of results of entities accounted for using the equity method | 4 | 7 | 7 | (45.69 | ) | 6.81 | ||||||||||||||
| Net fee and commission income | 2,866 | 2,357 | 1,842 | 21.59 | 27.98 | |||||||||||||||
| Insurance activity income | 171 | 120 | 734 | 42.62 | (17.75 | ) | ||||||||||||||
| Gains/losses on financial assets and liabilities and Exchange differences | 691 | 604 | 84 | 14.52 | 42.69 | |||||||||||||||
Gross income | 10,386 | 8,360 | 6,616 | 24.23 | 26.36 | |||||||||||||||
| Sales and income from the provision of non-financial services (net) and Other operating income/expense | (141 | ) | (118 | ) | (89 | ) | 19.49 | 32.58 | ||||||||||||
| General administrative expenses: | (4,089 | ) | (3,701 | ) | (3,249 | ) | 10.50 | 13.85 | ||||||||||||
| Personnel expenses | (2,222 | ) | (1,975 | ) | (1,743 | ) | 12.51 | 13.38 | ||||||||||||
| Other administrative expenses | (1,867 | ) | (1,726 | ) | (1,507 | ) | 8.17 | 14.53 | ||||||||||||
| Depreciation and amortization | (348 | ) | (305 | ) | (335 | ) | 14.10 | (8.68 | ) | |||||||||||
Net operating income | 5,808 | 4,236 | 2,943 | 37.11 | 43.89 | |||||||||||||||
| Net impairment losses | (1,660 | ) | (886 | ) | (433 | ) | 87.36 | 104.62 | ||||||||||||
| Other gains/losses | (368 | ) | (230 | ) | (213 | ) | 60.00 | 7.98 | ||||||||||||
Profit before tax | 3,780 | 3,120 | 2,297 | 21.15 | 35.77 | |||||||||||||||
Profit from continuing operations | 2,958 | 2,451 | 1,876 | 20.69 | 30.65 | |||||||||||||||
| Profit from discontinued operations | 112 | 124 | 134 | (9.68 | ) | (7.09 | ) | |||||||||||||
Consolidated profit for the year | 3,070 | 2,575 | 2,010 | 19.22 | 28.11 | |||||||||||||||
Profit attributed to the Group | 2,666 | 2,287 | 1,779 | 16.57 | 28.56 | |||||||||||||||
104
Table of Contents
105
Table of Contents
| Financial Management and | ||||||||||||||||||||
| Equity Stakes | Variations | |||||||||||||||||||
| 2007 | 2006 | 2005 | 07/06 (%) | 06/05 (%) | ||||||||||||||||
| (in millions of euros) | ||||||||||||||||||||
Net interest income | (1,588 | ) | (1,106 | ) | (740 | ) | 43.58 | 49.46 | ||||||||||||
| Share of results of entities accounted for using the equity method | 427 | 411 | 584 | 3.89 | (29.62 | ) | ||||||||||||||
| Net fee and commission income | 30 | (11 | ) | (19 | ) | (372.73 | ) | (42.11 | ) | |||||||||||
| Insurance activity income | — | (4 | ) | 3 | (100.00 | ) | (233.33 | ) | ||||||||||||
| Gains/losses on financial assets and liabilities and Exchange differences | 1,113 | 413 | (48 | ) | 169.49 | (960.42 | ) | |||||||||||||
Gross income | 18 | (297 | ) | (220 | ) | (93.94 | ) | 35.00 | ||||||||||||
| Sales and income from the provision of non-financial services (net) and Other operating income/expense | 15 | (33 | ) | (26 | ) | (145.45 | ) | 26.92 | ||||||||||||
| General administrative expenses: | (506 | ) | (364 | ) | (353 | ) | 38.95 | 3.25 | ||||||||||||
| Personnel expenses | (236 | ) | (204 | ) | (183 | ) | 15.69 | 11.48 | ||||||||||||
| Other administrative expenses | (270 | ) | (160 | ) | (170 | ) | 68.75 | (5.88 | ) | |||||||||||
| Depreciation and amortization | (259 | ) | (214 | ) | (74 | ) | 21.03 | 189.18 | ||||||||||||
Net operating income | (768 | ) | (908 | ) | (673 | ) | (15.42 | ) | 34.92 | |||||||||||
| Net impairment losses | (1,527 | ) | 77 | (74 | ) | (2,083.12 | ) | (204.05 | ) | |||||||||||
| Other gains/losses | 1,745 | 803 | 853 | 117.31 | (5.86 | ) | ||||||||||||||
Profit before tax | (550 | ) | (28 | ) | 106 | 1,864.29 | (126.42 | ) | ||||||||||||
Profit from continuing operations | 134 | 132 | 798 | 1.52 | (83.33 | ) | ||||||||||||||
| Profit from discontinued operations | 685 | 120 | — | 470.83 | n/a | |||||||||||||||
Consolidated profit for the year | 819 | 252 | 798 | 225.00 | (68.42 | ) | ||||||||||||||
Profit attributed to the Group | 754 | 162 | 650 | 365.43 | (75.08 | ) | ||||||||||||||
106
Table of Contents
107
Table of Contents
| Retail Banking | Variations | |||||||||||||||||||
| 2007 | 2006 | 2005 | 07/06 (%) | 06/05 (%) | ||||||||||||||||
| (in millions of euros) | ||||||||||||||||||||
Net interest income | 15,339 | 12,310 | 10,640 | 24.61 | 15.70 | |||||||||||||||
| Share of results of entities accounted for using the equity method | 15 | 16 | 35 | (6.25 | ) | (54.29 | ) | |||||||||||||
| Net fee and commission income | 6,668 | 5,966 | 5,196 | 11.77 | 14.82 | |||||||||||||||
| Gains/losses on financial assets and liabilities and Exchange differences | 1,349 | 1,042 | 927 | 29.46 | 12.41 | |||||||||||||||
Gross income | 23,371 | 19,334 | 16,798 | 20.88 | 15.10 | |||||||||||||||
| Sales and income from the provision of non-financial services (net) and Other operating income/expense | (30 | ) | (4 | ) | 25 | 650.00 | (116.00 | ) | ||||||||||||
| General administrative expenses: | (9,340 | ) | (8,620 | ) | (8,126 | ) | 8.33 | 6.10 | ||||||||||||
| Personnel expenses | (5,603 | ) | (5,165 | ) | (4,907 | ) | 8.48 | 5.26 | ||||||||||||
| Other administrative expenses | (3,737 | ) | (3,455 | ) | (3,219 | ) | 8.16 | 7.33 | ||||||||||||
| Depreciation and amortization | (899 | ) | (848 | ) | (868 | ) | 6.01 | (2.30 | ) | |||||||||||
Net operating income | 13,102 | 9,862 | 7,829 | 32.85 | 25.97 | |||||||||||||||
| Net impairment losses | (3,488 | ) | (2,324 | ) | (1,659 | ) | 50.09 | 40.08 | ||||||||||||
| Other gains/losses | (256 | ) | (412 | ) | (176 | ) | 37.86 | 134.09 | ||||||||||||
Profit before tax | 9,358 | 7,126 | 5,994 | 31.32 | 18.89 | |||||||||||||||
108
Table of Contents
109
Table of Contents
| Global Wholesale Banking | Global Wholesale Banking | Variations | |||||||||||||||||||
| 2007 | 2006 | 2005 | 07/06 (%) | 06/05 (%) | |||||||||||||||||
| (in millions of euros) | |||||||||||||||||||||
Net interest income | 1,492 | 1,241 | 724 | 20.23 | 71.41 | ||||||||||||||||
| Share of results of entities accounted for using the equity method | — | — | — | — | — | ||||||||||||||||
| Net fee and commission income | 919 | 646 | 488 | 42.26 | 32.38 | ||||||||||||||||
| Gains/losses on financial assets and liabilities and Exchange differences | 491 | 690 | 654 | (28.84 | ) | 5.47 | |||||||||||||||
Gross income | 2,902 | 2,577 | 1,866 | 12.61 | 38.10 | ||||||||||||||||
| Sales and income from the provision of non-financial services (net) and Other operating income/expense | (29 | ) | (33 | ) | (24 | ) | (12.12 | ) | 37.50 | ||||||||||||
| General administrative expenses: | (852 | ) | (699 | ) | (569 | ) | 22.17 | 22.68 | |||||||||||||
| Personnel expenses | (542 | ) | (447 | ) | (351 | ) | 21.25 | 27.71 | |||||||||||||
| Other administrative expenses | (310 | ) | (252 | ) | (219 | ) | 23.02 | 15.07 | |||||||||||||
| Depreciation and amortization | (91 | ) | (68 | ) | (59 | ) | 32.82 | 15.25 | |||||||||||||
Net operating income | 1,930 | 1,777 | 1,214 | 8.61 | 46.38 | ||||||||||||||||
| Net impairment losses | (63 | ) | (304 | ) | (69 | ) | (79.28 | ) | 340.58 | ||||||||||||
| Other gains/losses | (35 | ) | (48 | ) | 12 | (27.08 | ) | (500.00 | ) | ||||||||||||
Profit before tax | 1,832 | 1,425 | 1,157 | 28.56 | 23.16 | ||||||||||||||||
110
Table of Contents
| Asset Management and Insurance | Asset Management and Insurance | Variations | ||||||||||||||||||
| 2007 | 2006 | 2005 | 07/06 (%) | 06/05 (%) | ||||||||||||||||
| (in millions of euros) | ||||||||||||||||||||
Net interest income | 52 | 35 | 35 | 49.57 | — | |||||||||||||||
| Share of results of entities accounted for using the equity method | — | — | — | — | — | |||||||||||||||
| Net fee and commission income | 423 | 423 | 396 | — | 6.82 | |||||||||||||||
| Insurance activity income | 319 | 257 | 199 | 24.12 | 29.15 | |||||||||||||||
| Gains/losses on financial assets and liabilities and Exchange differences | 19 | 4 | 2 | 375.00 | 100.00 | |||||||||||||||
Gross income | 813 | 719 | 632 | 13.07 | 13.77 | |||||||||||||||
| Sales and income from the provision of non-financial services (net) and Other operating income/expense | (1 | ) | — | 1 | — | (100.00 | ) | |||||||||||||
| General administrative expenses: | (241 | ) | (215 | ) | (225 | ) | 12.27 | (4.89 | ) | |||||||||||
| Personnel expenses | (128 | ) | (109 | ) | (114 | ) | 17.43 | (4.39 | ) | |||||||||||
| Other administrative expenses | (113 | ) | (106 | ) | (111 | ) | 6.60 | (4.50 | ) | |||||||||||
| Depreciation and amortization | (19 | ) | (17 | ) | (13 | ) | 11.76 | 30.77 | ||||||||||||
Net operating income | 552 | 487 | 395 | 13.35 | 23.29 | |||||||||||||||
| Net impairment losses | (1 | ) | — | — | — | — | ||||||||||||||
| Other gains/losses | (16 | ) | (15 | ) | 9 | 6.67 | (266.67 | ) | ||||||||||||
Profit before tax | 535 | 472 | 404 | 13.35 | 16.83 | |||||||||||||||
111
Table of Contents
112
Table of Contents
| December 31, | ||||||||
| 2007 | 2006 | |||||||
| Tier 1 Capital Ratio | 7.71 | % | 7.42 | % | ||||
| Total Capital Ratio—Tier 1 and Tier 2 | 12.66 | % | 12.49 | % | ||||
113
Table of Contents
| 2007 | 2006 | 2005 | ||||||||||
| (in thousands of euros) | ||||||||||||
| Due to credit entities | 112,021,327 | 123,753,200 | 115,974,336 | |||||||||
| Customer deposits | 336,440,618 | 315,478,695 | 285,972,387 | |||||||||
| Marketable debt securities | 227,627,869 | 174,377,295 | 124,185,634 | |||||||||
| Subordinated debt | 32,902,151 | 29,554,497 | 27,287,081 | |||||||||
Total | 708,991,965 | 643,163,687 | 553,419,438 | |||||||||
| (1) Senior debt | 4.4 years | |||
| (2) Mortgage debt | 15.5 years | |||
| (3) Dated subordinated debt | 8.2 years | |||
| Long-Term | Short-Term | Financial Strength | ||||||||||
| Moody’s | Aa1 | P1 | B | |||||||||
| Standard & Poor’s | AA | A1+ | ||||||||||
| Fitch | AA | F1+ | A/B | |||||||||
114
Table of Contents
| • | a continued downturn in the Spanish and the U.K. real estate markets, and a corresponding increase in mortgage defaults; | |
| • | uncertainty regarding interest rates in the United States and other countries; | |
| • | uncertainties relating to economic growth expectations and interest rates cycles, especially in the United States, Spain, the United Kingdom, other European countries and Latin America, and the impact they may have over the yield curve and exchange rates; | |
| • | the effect that an economic slowdown may have over Latin America and fluctuations in local interest and exchange rates; | |
| • | the chance that changes in the macroeconomic environment will deteriorate the quality of our customers’ credit; | |
| • | increases in our cost of funding could adversely affect our net interest margin as a consequence of timing differences in the repricing of our assets and liabilities; | |
| • | a continued downturn in capital markets; | |
| • | a drop in the value of the euro relative to the US dollar, the Sterling pound or Latin American currencies; | |
| • | inflationary pressures, because of the effect they may have in relation to increases of interest rates and decreases of growth; | |
| • | increased consolidation of the European financial services sector, which could further reduce our spreads; | |
| • | although it is foreseeable that entry barriers to domestic markets in Europe will be lowered, our possible plans of expansion into other markets could be affected by regulatory requirements of the national authorities of these countries; | |
| • | acquisitions or restructurings of businesses that do not perform in accordance with our expectations; and | |
| • | the risk of further reductions in liquidity and increases of credit spreads as a consequence of the crisis in the financial markets arising from the U.S. sub-prime mortgage market, which could affect not only our cost of funding but also the value of our proprietary portfolios and our assets under management. |
115
Table of Contents
| 2007 | 2006 | 2005 | ||||||||||
| (in thousands of euros) | ||||||||||||
Contingent liabilities: | ||||||||||||
| Guarantees and other sureties | 76,316,446 | 58,205,412 | 48,199,671 | |||||||||
| Bank guarantees and other indemnities provided | 69,804,708 | 52,697,242 | 44,251,411 | |||||||||
| Credit derivatives sold | 708,250 | 478,250 | 180,000 | |||||||||
| Irrevocable documentary credits | 5,803,088 | 5,029,484 | 3,767,022 | |||||||||
| Other financial guarantees | 400 | 436 | 1,238 | |||||||||
| Assets assigned to sundry obligations | 3 | 4 | 24 | |||||||||
| Other contingent liabilities | 608,386 | 563,893 | 253,880 | |||||||||
| 76,924,835 | 58,769,309 | 48,453,575 | ||||||||||
Commitments: | ||||||||||||
| Balances drawable by third parties | 102,215,927 | 91,690,396 | 77,678,333 | |||||||||
| Other commitments | 12,460,636 | 11,559,034 | 18,584,929 | |||||||||
| 114,676,563 | 103,249,430 | 96,263,262 | ||||||||||
| 191,601,398 | 162,018,739 | 144,716,837 | ||||||||||
| 2007 | 2006 | 2005 | ||||||||||
| (in thousands of euros) | ||||||||||||
Contingent liabilities: | ||||||||||||
| Mutual funds | 119,210,503 | 119,838,418 | 109,480,095 | |||||||||
| Pension funds | 11,952,437 | 29,450,103 | 28,619,183 | |||||||||
| Other managed funds | 19,814,340 | 17,835,031 | 14,746,000 | |||||||||
| 150,977,280 | 167,123,552 | 152,845,278 | ||||||||||
116
Table of Contents
| Contractual obligations | More than | More than | ||||||||||||||||||
| 1 year but | 3 years but | |||||||||||||||||||
| Less than | less than 3 | less than 5 | More than | |||||||||||||||||
| (in millions of euros) | 1 year | years | years | 5 years | Total | |||||||||||||||
| Deposits from credit institutions | 40,817 | 3,002 | 3,111 | 1,756 | 48,686 | |||||||||||||||
| Customer deposits | 290,717 | 13,141 | 11,145 | 2,040 | 317,043 | |||||||||||||||
| Marketable debt securities | 55,976 | 35,294 | 26,745 | 88,250 | 206,265 | |||||||||||||||
| Subordinated debt | 726 | 4,065 | 2,357 | 28,522 | 35,670 | |||||||||||||||
| Operating lease obligations | 260 | 499 | 484 | 2,127 | 3,370 | |||||||||||||||
| Purchase obligations | 156 | 6 | 1 | — | 163 | |||||||||||||||
| Other long-term liabilities (1) | — | — | — | 11,820 | 11,820 | |||||||||||||||
Total | 388,652 | 56,007 | 43,843 | 134,515 | 623,017 | |||||||||||||||
| (1) | Other long-term liabilities relate to pensions and similar obligations. |
117
Table of Contents
| Director | ||||
| Name | Position with Santander | Since | ||
| Emilio Botín (1) | Chairman | 1960 | ||
| Fernando de Asúa | First Vice Chairman | 1999 | ||
| Alfredo Sáenz | Second Vice Chairman and Chief Executive Officer | 1994 | ||
| Matías R. Inciarte (2) | Third Vice Chairman | 1988 | ||
| Manuel Soto | Fourth Vice Chairman | 1999 | ||
| Assicurazioni Generali, S.p.A. | Director | 1999 | ||
| Antonio Basagoiti | Director | 1999 | ||
| Ana P. Botín (1) | Director | 1989 | ||
| Javier Botín (1) | Director | 2004 | ||
| Lord Burns | Director | 2004 | ||
| Guillermo de la Dehesa | Director | 2002 | ||
| Rodrigo Echenique | Director | 1988 | ||
| Antonio Escámez | Director | 1999 | ||
| Francisco Luzón | Director | 1997 | ||
| Abel Matutes | Director | 2002 | ||
| Juan R. Inciarte (2) | Director | 2008 | ||
| Luis Ángel Rojo | Director | 2005 | ||
| Luis Alberto Salazar-Simpson | Director | 1999 | ||
| Isabel Tocino | Director | 2007 |
| (1) | Ana P. Botín and Javier Botín are daughter and son, respectively, of Emilio Botín. | |
| (2) | Matías R. Inciarte and Juan R. Inciarte are brothers. |
118
Table of Contents
| Name | Position with Banco Santander | |
| Emilio Botín | Chairman of the Board of Directors and of the Executive Committee | |
| Alfredo Sáenz | Second Vice Chairman of the Board of Directors and Chief Executive Officer | |
| Matías R. Inciarte | Third Vice Chairman of the Board of Directors and Chairman of the Risk Committee | |
| Ana P. Botín | Chairwoman, Banesto | |
| Francisco Luzón | Director, Executive Vice President, America | |
| Juan R. Inciarte | Director, Executive Vice President, Strategy | |
| José A. Alvarez | Executive Vice President, Financial Management and Investor Relations | |
| Nuno Amado | Executive Vice President, Santander Totta | |
| David Arce | Executive Vice President, Internal Auditing | |
| Ignacio Benjumea | Executive Vice President, General Secretariat | |
| Juan Manuel Cendoya | Executive Vice President, Communications, Corporate Marketing and Research | |
| Fermín Colomés | Executive Vice President, Technology and Operations | |
| José María Espí | Executive Vice President, Risk | |
| José María Fuster | Executive Vice President, Technology and Operations | |
| José Luis G. Alciturri | Executive Vice President, Human Resources | |
| Enrique G. Candelas | Executive Vice President, Santander Branch Network - Spain | |
| Joan-David Grimà | Executive Vice President, Asset Management | |
| Juan Guitard | Executive Vice President, General Secretariat | |
| Gonzalo de las Heras | Executive Vice President, Global Wholesale Banking | |
| Antonio H. Osorio | Chief Executive Officer, Abbey | |
| Adolfo Lagos | Executive Vice President, Global Wholesale Banking | |
| Jorge Maortua | Executive Vice President, Global Wholesale Banking | |
| Javier Marín | Executive Vice President, Global Private Banking | |
| Jorge Morán | Executive Vice President, Insurance | |
| César Ortega | Executive Vice President, General Secretariat | |
| Javier Peralta | Executive Vice President, Risk | |
| Marcial Portela | Executive Vice President, America | |
| Magda Salarich | Executive Vice President, Santander Consumer Finance | |
| José Manuel Tejón | Executive Vice President, Financial Accounting and Control | |
Jesús Ma Zabalza | Executive Vice President, America |
119
Table of Contents
120
Table of Contents
121
Table of Contents
122
Table of Contents
123
Table of Contents
124
Table of Contents
125
Table of Contents
| 2007 | 2006 | 2005 | ||||||||||
| (in thousands of euros) | ||||||||||||
Total salaries | 24,315 | 20,970 | 18,494 | |||||||||
| Of which: variable compensation | 16,088 | 13,666 | 11,412 | |||||||||
126
Table of Contents
| In Thousands of Euros | ||||||||||||||||||||||||||||||||||||||||||||||||||||
| 2007 | 2006 | 2005 | ||||||||||||||||||||||||||||||||||||||||||||||||||
| By-law Stipulated Compensation | Attendance Fees | Salary of executive Directors (1) | ||||||||||||||||||||||||||||||||||||||||||||||||||
| Appointments | ||||||||||||||||||||||||||||||||||||||||||||||||||||
| Audit and | and | |||||||||||||||||||||||||||||||||||||||||||||||||||
| Executive | Compliance | Remuneration | Variable | Other | ||||||||||||||||||||||||||||||||||||||||||||||||
| Directors | Board | Committee | Committee | Committee | Board | Other Fees | Fixed | (2) | Total | Remuneration | Total | Total | Total | |||||||||||||||||||||||||||||||||||||||
| Emilio Botín | 118 | 237 | — | — | 25 | 5 | 1,187 | 2,337 | 3,524 | 1 | 3,910 | 3,459 | 3,035 | |||||||||||||||||||||||||||||||||||||||
| Fernando de Asúa | 158 | 237 | 55 | 33 | 25 | 169 | — | — | — | — | 677 | 590 | 519 | |||||||||||||||||||||||||||||||||||||||
| Alfredo Sáenz | 118 | 237 | — | — | 25 | 5 | 3,126 | 5,582 | 8,708 | 511 | 9,604 | 8,099 | 7,161 | |||||||||||||||||||||||||||||||||||||||
| Matías R. Inciarte | 118 | 237 | — | — | 25 | 141 | 1,510 | 2,945 | 4,455 | 178 | 5,154 | 4,501 | 3,970 | |||||||||||||||||||||||||||||||||||||||
| Manuel Soto | 158 | — | 55 | 33 | 25 | 35 | — | — | — | — | 306 | 271 | 246 | |||||||||||||||||||||||||||||||||||||||
| Assicurazioni Generali, Spa. | 137 | — | — | — | 6 | — | — | — | — | — | 143 | 136 | 110 | |||||||||||||||||||||||||||||||||||||||
| Antonio Basagoiti | 118 | 237 | — | — | 25 | 133 | — | — | — | 10 | 523 | 3,477 | (6) | 414 | ||||||||||||||||||||||||||||||||||||||
| Ana P. Botín | 118 | 237 | — | — | 25 | 2 | 1,133 | 1,985 | 3,118 | 17 | 3,517 | 3,084 | 2,733 | |||||||||||||||||||||||||||||||||||||||
| Javier Botín (3) | 118 | — | — | — | 25 | — | — | — | — | — | 143 | 128 | 106 | |||||||||||||||||||||||||||||||||||||||
| Lord Terence Burns (***) | 118 | — | — | — | 17 | — | — | — | — | — | 135 | 122 | 105 | |||||||||||||||||||||||||||||||||||||||
| Guillermo de la Dehesa | 118 | 237 | — | 33 | 25 | 14 | — | — | — | — | 427 | 381 | 326 | |||||||||||||||||||||||||||||||||||||||
| Rodrigo Echenique | 118 | 237 | — | 33 | 25 | 119 | — | — | — | 30 | 562 | 1,388 | 1,329 | |||||||||||||||||||||||||||||||||||||||
| Antonio Escámez | 118 | 237 | — | — | 25 | 128 | — | — | — | 42 | 550 | 1,329 | 1,337 | |||||||||||||||||||||||||||||||||||||||
| Francisco Luzón | 118 | 237 | — | — | 25 | 2 | 1,271 | 3,239 | 4,510 | 728 | 5,620 | 4,601 | 4,003 | |||||||||||||||||||||||||||||||||||||||
| Luís Ángel Rojo (****) | 118 | — | 55 | 33 | 14 | 29 | — | — | — | — | 249 | 232 | 113 | |||||||||||||||||||||||||||||||||||||||
| Abel Matutes | 118 | — | 55 | — | 25 | 15 | — | — | — | — | 213 | 189 | 172 | |||||||||||||||||||||||||||||||||||||||
| Mutua Madrileña Automovilista (4) | 137 | — | — | — | 16 | — | — | — | — | — | 153 | 148 | 122 | |||||||||||||||||||||||||||||||||||||||
| Luis Alberto Salazar-Simpson | 118 | — | 55 | — | 25 | 16 | — | — | — | — | 214 | 192 | 173 | |||||||||||||||||||||||||||||||||||||||
| Jay S. Sidhu (5) | — | — | — | — | — | — | — | — | — | — | 58 | — | ||||||||||||||||||||||||||||||||||||||||
| Emilio Botín (**) | — | — | — | — | — | — | — | — | — | — | — | — | 98 | |||||||||||||||||||||||||||||||||||||||
| Elías Masaveu (**) | — | — | — | — | — | — | — | — | — | — | — | — | 47 | |||||||||||||||||||||||||||||||||||||||
| Isabel Tocino (*) | 82 | — | — | — | 21 | — | — | — | — | — | 103 | — | — | |||||||||||||||||||||||||||||||||||||||
Total 2007 | 2,324 | 2,370 | 275 | 165 | 424 | 813 | 8,227 | 16,088 | 24,315 | 1,517 | 32,203 | — | — | |||||||||||||||||||||||||||||||||||||||
Total 2006 | 2,092 | 2,150 | 250 | 150 | 386 | 630 | 7,304 | 13,666 | 20,970 | 5,757 | — | 32,385 | — | |||||||||||||||||||||||||||||||||||||||
Total 2005 | 1,795 | 1,800 | 256 | 148 | 315 | 607 | 7,082 | 11,412 | 18,494 | 2,704 | — | — | 26,119 | |||||||||||||||||||||||||||||||||||||||
| (*) | Appointed by co-optation by the Board of Directors at its meeting on March 26, 2007. Isabel Tocino took office at the meeting held on April 23, 2007. Her appointment was ratified by the shareholders at the Annual General Meeting held on June 23, 2007. | |
| (**) | Directors who were Board members for some months in 2005 but ceased to be directors prior to December 31, 2005. | |
| (***) | Appointed as member of the Bank’s Board of Directors on December 20, 2004 and subsequently ratified by the shareholders at the Annual General Meeting on June 18, 2005. | |
| (****) | Appointed as member of the Bank’s Board of Directors on April 25, 2005 and subsequently ratified by the shareholders at the Annual General Meeting on June 18, 2005. | |
| (1) | Recognized under “Personnel expenses” in the income statement of the Bank, except for the salary of Ana P. Botín, which is recognized at Banco Español de Crédito, S.A. | |
| (2) | Accrued in 2007. | |
| (3) | Amounts contributed to Fundación Marcelino Botín. | |
| (4) | Ceased to be a Director on December 19, 2007. | |
| (5) | Appointed by the shareholders at the Annual General Meeting on June 17, 2006 and ceased to discharge his duties on December 31, 2006. | |
| (6) | Includes€3 million for duties discharged on the Board of Directors of Unión Fenosa during the period in which he belonged to this Board at the proposal of the Bank. At the proposal of the Appointments and Remuneration Committee, this remuneration was approved by the Bank’s Board of Directors at its meeting on February 6, 2006. |
127
Table of Contents
| Thousands of euros | ||||||||||||||||
| Company | 2007 | 2006 | 2005 | |||||||||||||
| Emilio Botín | Shinsei | 50.1 | 59.9 | 58.7 | ||||||||||||
| Fernando de Asúa | CEPSA | 97.2 | 95.6 | 89.9 | ||||||||||||
| Antonio Escámez | Attijariwafa Bank | 9.9 | 5.0 | 5.1 | ||||||||||||
| 157.2 | 160.5 | 153.7 | ||||||||||||||
| Number | In thousands of euros | |||||||||||||||||||||||
| of | Salary Compensation | Other | ||||||||||||||||||||||
| Year | People (1) | Fixed | Variable | Total | Compensation | Total | ||||||||||||||||||
| 2005 | 24 | 16,450 | 27,010 | 43,460 | 2,708 | 46,168 | ||||||||||||||||||
| 2006 | 26 | 19,119 | 34,594 | 53,713 | 11,054 | 64,767 | ||||||||||||||||||
| 2007 | 26 | 19,504 | 42,768 | 62,272 | 10,092 | 72,394 | ||||||||||||||||||
| (*) | Excluding executive Directors’ compensation, which is detailed above. | |
| (1) | The amounts reflect the annual compensation regardless of the number of months in which the position of Executive Vice President was occupied. |
128
Table of Contents
| In thousands of euros | ||||||||||||||||||||||||
| 2007 | 2006 | 2005 | ||||||||||||||||||||||
| Total Accrued | Total Accrued | Total Accrued | ||||||||||||||||||||||
| Pension | Other | Pension | Other | Pension | Other | |||||||||||||||||||
| Obligations | Insurance | Obligations | Insurance | Obligations | Insurance | |||||||||||||||||||
| Emilio Botín | 22,926 | — | 21,068 | — | 11,785 | — | ||||||||||||||||||
| Alfredo Sáenz | 68,070 | 9,378 | 55,537 | 8,155 | 45,444 | 7,917 | ||||||||||||||||||
| Matías R. Inciarte | 44,226 | 4,529 | 39,390 | 4,117 | 28,953 | 3,997 | ||||||||||||||||||
| Ana P. Botín | 17,975 | 1,403 | 15,045 | 1,402 | 12,232 | 1,373 | ||||||||||||||||||
| Francisco Luzón | 45,468 | 7,624 | 39,187 | 6,571 | 39,188 | 6,380 | ||||||||||||||||||
Total | 198,665 | 22,934 | 170,227 | 20,245 | 137,602 | 19,667 | ||||||||||||||||||
129
Table of Contents
130
Table of Contents
| Options | Options | Exercised | ||||||||||||||||||||||||||||||||||||||||||||||||||||||||||||||||||||||||||
| Granted | Exercised Options | Granted | Options | Concessions Granted | Exercised Options | |||||||||||||||||||||||||||||||||||||||||||||||||||||||||||||||||||||||
| Market | Market | Date of | Date of | |||||||||||||||||||||||||||||||||||||||||||||||||||||||||||||||||||||||||
| Options at | Exercise | Price | Options at | Exercise | Options at | Exercise | Exercise | Exercise | Price | Options at | Commencement | Expiry of | ||||||||||||||||||||||||||||||||||||||||||||||||||||||||||||||||
| January 1, | Price | Applied | December | Price | December | Price | Price | Price | Applied | December | of Exercise | Exercise | ||||||||||||||||||||||||||||||||||||||||||||||||||||||||||||||||
| 2005 | Number | Number | (Euros) | (Euros) | 31, 2005 | (Euros) | Number | Number | 31, 2006 | (Euros) | Number | (Euros) | Number | (Euros) | (Euros) | 31, 2007 | Period | Period | ||||||||||||||||||||||||||||||||||||||||||||||||||||||||||
Managers Plan 2000: | ||||||||||||||||||||||||||||||||||||||||||||||||||||||||||||||||||||||||||||
| Emilio Botín | 150,000 | — | (150,000 | ) | 10.545 | 11.12 | — | — | — | — | — | — | — | — | — | — | — | — | 12/30/03 | 12/29/05 | ||||||||||||||||||||||||||||||||||||||||||||||||||||||||
| Alfredo Sáenz | 100,000 | — | (100,000 | ) | 10.545 | 11.14 | — | — | — | — | — | — | — | — | — | — | — | — | 12/30/03 | 12/29/05 | ||||||||||||||||||||||||||||||||||||||||||||||||||||||||
| Matías R. Inciarte | 125,000 | — | (125,000 | ) | 10.545 | 11.14 | — | — | — | — | — | — | — | — | — | — | — | — | 12/30/03 | 12/29/05 | ||||||||||||||||||||||||||||||||||||||||||||||||||||||||
| Antonio Escámez | 100,000 | — | (100,000 | ) | 10.545 | 11.07 | — | — | — | — | — | — | — | — | — | — | — | — | 12/30/03 | 12/29/05 | ||||||||||||||||||||||||||||||||||||||||||||||||||||||||
| Francisco Luzón | 100,000 | — | (100,000 | ) | 10.545 | 11.14 | — | — | — | — | — | 12/30/03 | 12/29/05 | |||||||||||||||||||||||||||||||||||||||||||||||||||||||||||||||
| 575,000 | — | (575,000 | ) | 10.545 | 11.12 | — | — | — | — | — | — | — | — | — | — | — | — | |||||||||||||||||||||||||||||||||||||||||||||||||||||||||||
Long-Term Incentive Plan (I06): | ||||||||||||||||||||||||||||||||||||||||||||||||||||||||||||||||||||||||||||
| Emilio Botín | 541,400 | — | — | — | — | 541,400 | 9.09 | — | — | 541,400 | 9.09 | — | — | — | — | — | 541,400 | 01/15/08 | 01/15/09 | |||||||||||||||||||||||||||||||||||||||||||||||||||||||||
| Alfredo Sáenz | 1,209,100 | — | — | — | — | 1,209,100 | 9.09 | — | — | 1,209,100 | 9.09 | — | — | — | — | — | 1,209,100 | 01/15/08 | 01/15/09 | |||||||||||||||||||||||||||||||||||||||||||||||||||||||||
| Matías R. Inciarte | 665,200 | — | — | — | — | 665,200 | 9.09 | — | — | 665,200 | 9.09 | — | — | — | — | — | 665,200 | 01/15/08 | 01/15/09 | |||||||||||||||||||||||||||||||||||||||||||||||||||||||||
| Ana P. Botín (*) | 293,692 | — | — | — | — | 293,692 | 9.09 | — | — | 293,692 | 9.09 | — | — | — | — | — | 293,692 | 01/15/08 | 01/15/09 | |||||||||||||||||||||||||||||||||||||||||||||||||||||||||
| Francisco Luzón | 639,400 | — | — | — | — | 639,400 | 9.09 | — | — | 639,400 | 9.09 | — | — | — | — | — | 639,400 | 01/15/08 | 01/15/09 | |||||||||||||||||||||||||||||||||||||||||||||||||||||||||
| 3,348,792 | — | — | — | — | 3,348,792 | 9.09 | — | — | 3,348,792 | 9.09 | — | — | — | — | — | 3,348,792 | ||||||||||||||||||||||||||||||||||||||||||||||||||||||||||||
Long-Term Incentive Plan (I09): | ||||||||||||||||||||||||||||||||||||||||||||||||||||||||||||||||||||||||||||
| Emilio Botín | — | — | — | — | — | — | — | — | — | — | — | 41,785 | — | — | — | — | 41,785 | 06/23/07 | 07/31/09 | |||||||||||||||||||||||||||||||||||||||||||||||||||||||||
| Alfredo Sáenz | — | — | — | — | — | — | — | — | — | — | — | 110,084 | — | — | — | — | 110,084 | 06/23/07 | 07/31/09 | |||||||||||||||||||||||||||||||||||||||||||||||||||||||||
| Matías R. Inciarte | — | — | — | — | — | — | — | — | — | — | — | 53,160 | — | — | — | — | 53,160 | 06/23/07 | 07/31/09 | |||||||||||||||||||||||||||||||||||||||||||||||||||||||||
| Ana P. Botín (**) | — | — | — | — | — | — | — | — | — | — | — | 27,929 | — | — | — | — | 27,929 | 06/23/07 | 07/31/09 | |||||||||||||||||||||||||||||||||||||||||||||||||||||||||
| Francisco Luzón | — | — | — | — | — | — | — | — | — | — | — | 44,749 | — | — | — | — | 44,749 | 06/23/07 | 07/31/09 | |||||||||||||||||||||||||||||||||||||||||||||||||||||||||
| �� | ||||||||||||||||||||||||||||||||||||||||||||||||||||||||||||||||||||||||||||
| — | — | — | — | — | — | — | — | — | — | — | 277,707 | — | — | — | — | 277,707 | ||||||||||||||||||||||||||||||||||||||||||||||||||||||||||||
Long-Term Incentive Plan (I10) | ||||||||||||||||||||||||||||||||||||||||||||||||||||||||||||||||||||||||||||
| Emilio Botín | — | — | — | — | — | — | — | — | — | — | — | 62,589 | — | — | — | — | 62,589 | 06/23/07 | 07/31/10 | |||||||||||||||||||||||||||||||||||||||||||||||||||||||||
| Alfredo Sáenz | — | — | — | — | — | — | — | — | — | — | — | 164,894 | — | — | — | — | 164,894 | 06/23/07 | 07/31/10 | |||||||||||||||||||||||||||||||||||||||||||||||||||||||||
| Matías R. Inciarte | — | — | — | — | — | — | — | — | — | — | — | 79,627 | — | — | — | — | 79,627 | 06/23/07 | 07/31/10 | |||||||||||||||||||||||||||||||||||||||||||||||||||||||||
| Ana P. Botín (**) | — | — | — | — | — | — | — | — | — | — | — | 41,835 | — | — | — | — | 41,835 | 06/23/07 | 07/31/10 | |||||||||||||||||||||||||||||||||||||||||||||||||||||||||
| Francisco Luzón | — | — | — | — | — | — | — | — | — | — | — | 67,029 | — | — | — | — | 67,029 | 06/23/07 | 07/31/10 | |||||||||||||||||||||||||||||||||||||||||||||||||||||||||
| — | — | — | — | — | — | — | — | — | — | — | 415,974 | — | — | — | — | 415,974 | ||||||||||||||||||||||||||||||||||||||||||||||||||||||||||||
| (*) | Approved by Banesto’s shareholders at its Annual General Meeting on February 28, 2006. | |
| (**) | Without prejudice to the Banesto shares relating to Ana P. Botín by virtue of the Banesto Share-Based Payment Incentive Plan approved by the shareholders at the Annual General Meeting of Banesto held on June 27, 2007, the maximum number of shares shown in the foregoing table relates to the aforementioned executive director, based on the resolution adopted at the aforementioned Annual General Meeting. |
131
Table of Contents
| Executive Directors | Maximum Number of Shares | |||
| Emilio Botín | 16,306 | |||
| Alfredo Sáenz | 37,324 | |||
| Matías R. Inciarte | 20,195 | |||
| Ana P. Botín (*) | 13,610 | |||
| Francisco Luzón | 22,214 | |||
| Juan R. Inciarte | 14,617 | |||
| 124,266 | ||||
| (*) | The number of shares acquired by Ana P. Botín as beneficiary of this plan is consistent with the resolutions agreed to by the shareholders acting at the General Shareholders’ Meeting of Banco Santander and Banesto held on June 23, 2007 and June 27, 2007, respectively. |
132
Table of Contents
| Santander’s position in | Percentage of shares to be | Santander’s position in | Percentage of shares to be | |||
| the TSR ranking | delivered over maximum | the EPS growth ranking | delivered over maximum | |||
1st to 6th | 50% | 1st to 6th | 50% | |||
7th | 43% | 7th | 43% | |||
8th | 36% | 8th | 36% | |||
9th | 29% | 9th | 29% | |||
10th | 22% | 10th | 22% | |||
11th | 15% | 11th | 15% | |||
12th or more | 0% | 12th or more | 0% |
| Bank | Country | |
| ABN AMRO Holding | The Netherlands | |
| Banco Itau | Brazil | |
| Bank of America | United States | |
| Barclays | United Kingdom | |
| BBVA | Spain | |
| BNP Paribas | France | |
| Citigroup | United States | |
| Credit Agricole | France | |
| HBOS | United Kingdom | |
| HSBC Holdings | United Kingdom | |
| Intesa Sanpaolo | Italy | |
| JP Morgan Chase & Co. | United States | |
| Lloyds TSB Group | United Kingdom | |
| Mitsubishi | Japan | |
| Nordea Bank | Sweden | |
| Royal Bank of Canada | Canada | |
| Royal Bank of Scotland Group | United Kingdom | |
| Société Générale | France | |
| UBS | Switzerland | |
| Unicredito Italiano | Italy | |
| Wells Fargo & Co. | United States |
133
Table of Contents
| Executive Directors | First Cycle | Second Cycle | ||||||
| Emilio Botín | 41,785 | 62,589 | ||||||
| Alfredo Sáenz | 110,084 | 164,894 | ||||||
| Matías R. Inciarte | 53,160 | 79,627 | ||||||
| Francisco Luzón | 44,749 | 67,029 | ||||||
| Ana P. Botín | 27,929 | 41,835 | ||||||
134
Table of Contents
| First Cycle | Second Cycle | |||||||
| Juan R. Inciarte | 43,322 | 64,983 | ||||||
| Executive Directors | Maximum No. of shares | |||
| Emilio Botín | 16,306 | |||
| Alfredo Sáenz | 37,324 | |||
| Matías R. Inciarte | 20,195 | |||
| Francisco Luzón | 22,214 | |||
| Ana P. Botín | 13,610 | |||
135
Table of Contents
136
Table of Contents
137
Table of Contents
| Euros | Date of | Date of | ||||||||||||||||||||||||||
| Number of | Exercise | Year | Employee | Number | Commencement | Expiry of | ||||||||||||||||||||||
| Shares | Price | Granted | Group | of Persons | of Exercise Period | Exercise Period | ||||||||||||||||||||||
Plans outstanding at January 1, 2005 | 21,126,750 | 9.94 | ||||||||||||||||||||||||||
Options granted (Plan I06) | 99,900,000 | 9.09 | (**) | Managers | 2,601 | 01/15/2008 | 01/15/2009 | |||||||||||||||||||||
Options exercised | (15,606,000 | ) | (9.83 | ) | ||||||||||||||||||||||||
Of which: | ||||||||||||||||||||||||||||
Plan Four | (228,000 | ) | 7.84 | |||||||||||||||||||||||||
Young Executives Plan | (329,000 | ) | 2.29 | |||||||||||||||||||||||||
Managers Plan 2000 | (12,389,000 | ) | 10.545 | |||||||||||||||||||||||||
European Branches Plan | (2,660,000 | ) | 7.60 | (*) | ||||||||||||||||||||||||
Options cancelled or not exercised | (5,520,750 | ) | — | |||||||||||||||||||||||||
Plans outstanding at December 31, 2005 | 99,900,000 | 9.09 | ||||||||||||||||||||||||||
Options exercised | — | — | ||||||||||||||||||||||||||
Options cancelled, net (Plan I06) | (3,648,610 | ) | 9.09 | Managers | (44 | ) | 01/15/2008 | 01/15/2009 | ||||||||||||||||||||
Plans outstanding at December 31, 2006 | 96,251,390 | 9.09 | ||||||||||||||||||||||||||
Options granted (Plan I09) | 10,448,480 | — | Managers | 5,476 | 06/23/2007 | 07/31/2009 | ||||||||||||||||||||||
Options granted (Plan I10) | 15,690,283 | — | Managers | 5,506 | 06/23/2007 | 07/31/2010 | ||||||||||||||||||||||
Options cancelled, net (Plan I06) | (1,195,371 | ) | 9.09 | Managers | (45 | ) | 01/15/2008 | 01/15/2009 | ||||||||||||||||||||
Plans outstanding at December 31, 2007 | 121,194,782 | — | ||||||||||||||||||||||||||
Of which: | ||||||||||||||||||||||||||||
Plan I06 | 95,056,019 | 9.09 | ||||||||||||||||||||||||||
Plan I09 | 10,448,480 | — | ||||||||||||||||||||||||||
Plan I10 | 15,690,283 | — | ||||||||||||||||||||||||||
| (*) | The average exercise price ranges from€5.65 to€10.15 per share. | |
| (**) | The exercise price of the options under Plan I06 is€9.09 per share, which is the weighted average of the daily average market price of the Bank shares on the continuous market in the first 15 trading days of January 2005. This was the criterion established in the resolution approving Plan I06 adopted at the Annual General Meeting held on June 18, 2005. The documentation on the aforementioned resolution stated correctly the method to be used to set the exercise price but, by mistake, an amount of€9.07 per share was mentioned rather than the correct amount of€9.09 per share. |
138
Table of Contents
| Pounds | ||||||||||||||||||||||||||||
| Sterling (*) | Date of | Date of | ||||||||||||||||||||||||||
| Number of | Exercise | Year | Employee | Number | Commencement | Expiry of | ||||||||||||||||||||||
| Shares | Price (*) | Granted | Group | of Persons | of Exercise Period | Exercise Period | ||||||||||||||||||||||
Plans outstanding at December 31, 2005 | 17,675,567 | 3.58 | ||||||||||||||||||||||||||
Options exercised | (1,769,216 | ) | 4.45 | |||||||||||||||||||||||||
Of which: | ||||||||||||||||||||||||||||
Executive Options | (89,305 | ) | 4.43 | |||||||||||||||||||||||||
Employee Options | (2,550 | ) | 5.90 | |||||||||||||||||||||||||
Sharesave | (1,677,361 | ) | 4.45 | |||||||||||||||||||||||||
Options cancelled or not exercised | (1,783,670 | ) | — | |||||||||||||||||||||||||
Plans outstanding at December 31, 2005 | 14,122,681 | 3.41 | ||||||||||||||||||||||||||
Of which: | ||||||||||||||||||||||||||||
Executive Options | 269,539 | 4.07 | ||||||||||||||||||||||||||
Employee Options | 54,000 | 5.90 | ||||||||||||||||||||||||||
Sharesave | 13,799,142 | 3.38 | ||||||||||||||||||||||||||
Plans outstanding at December 31, 2005 | 14,122,681 | 3.41 | ||||||||||||||||||||||||||
Options granted (MTIP) | 2,825,123 | 7.50 | 2005 and 2006 | Managers | 174 | First half of 2008 | First half of 2008 | |||||||||||||||||||||
Options exercised | (5,214,171 | ) | 3.41 | |||||||||||||||||||||||||
Of which: | ||||||||||||||||||||||||||||
Executive Options | (87,659 | ) | 4.07 | |||||||||||||||||||||||||
Employee Options | (33,000 | ) | 5.90 | |||||||||||||||||||||||||
Sharesave | (5,093,512 | ) | 3.38 | |||||||||||||||||||||||||
Options cancelled or not exercised | (1,379,401 | ) | — | |||||||||||||||||||||||||
Plans outstanding at December 31, 2006 | 10,354,232 | 4.32 | ||||||||||||||||||||||||||
Of which: | ||||||||||||||||||||||||||||
Executive Options | 178,026 | 4.11 | 2003-2004 | Managers | 13 | 03/26/06 | 03/24/13 | |||||||||||||||||||||
Employee Options | — | — | — | — | — | — | — | |||||||||||||||||||||
Sharesave | 7,638,791 | 3.32 | 1998-2004 | Employees | 4.512 | (**) | 04/01/06 | 09/01/11 | ||||||||||||||||||||
MTIP | 2,537,415 | 9.39 | 2005 and 2006 | Managers | 170 | First half of 2008 | First half of 2008 | |||||||||||||||||||||
Options granted (MTIP) | — | — | ||||||||||||||||||||||||||
Options exercised | (1,535,325 | ) | 3.81 | |||||||||||||||||||||||||
Of which: | ||||||||||||||||||||||||||||
Executive Options | (33,904 | ) | 3.96 | |||||||||||||||||||||||||
Sharesave | (1,501,421 | ) | 3.81 | |||||||||||||||||||||||||
Options cancelled (net) or not exercised | (770,595 | ) | — | |||||||||||||||||||||||||
Plans outstanding at December 31, 2007 | 8,048,312 | 5.32 | ||||||||||||||||||||||||||
Of which: | ||||||||||||||||||||||||||||
Executive Options | 144,122 | 4.15 | 2003-2004 | Managers | 4 | 03/26/06 | 03/24/13 | |||||||||||||||||||||
Sharesave | 5,684,340 | 3.18 | 1998-2004 | Employees | 2.239 | (**) | 04/01/06 | 09/01/11 | ||||||||||||||||||||
MTIP | 2,219,850 | 10.88 | 2005 and 2006 | Managers | 157 | First half of 2008 | First half of 2008 | |||||||||||||||||||||
| (*) | At December 31, 2007, 2006 and 2005, the euro/pound sterling exchange rate was€1.36360/GBP1;€1.4892/GBP1 and€1.4592/GBP1, respectively. | |
| (**) | Number of accounts/contracts. A single employee may have more than one account/contract. |
139
Table of Contents
140
Table of Contents
| Santander’s position in the | Percentage of shares | Santander’s position in | Percentage of shares | |||
| TSR ranking | earned over maximum | the EPS growth ranking | earned over maximum | |||
1st to 6th | 50% | 1st to 6th | 50% | |||
7th | 43% | 7th | 43% | |||
8th | 36% | 8th | 36% | |||
9th | 29% | 9th | 29% | |||
10th | 22% | 10th | 22% | |||
11th | 15% | 11th | 15% | |||
12th onwards | 0% | 12th onwards | 0% |
| Bank | Country | |
| Banco Itaú | Brazil | |
| Bank of America | United States | |
| Barclays | United Kingdom | |
| BBVA | Spain | |
| BNP Paribas | France | |
| Citigroup | United States | |
| Cr��dit Agricole | France | |
| Deutsche Bank | Germany | |
| HBOS | United Kingdom | |
| HSBC Holdings | United Kingdom | |
| Intesa Sanpaolo | Italy | |
| JP Morgan Chase & Co. | United States | |
| Lloyds TSB Group | United Kingdom | |
| Mitsubishi | Japan | |
| Nordea Bank | Sweden | |
| Royal Bank of Canada | Canada | |
| Royal Bank of Scotland Group | United Kingdom | |
| Société Générale | France | |
| UBS | Switzerland | |
| Unicredito Italiano | Italy | |
| Wells Fargo & Co. | United States |
141
Table of Contents
| Executive Directors | Third Cycle | |||
| Emilio Botín | 68,848 | |||
| Alfredo Sáenz | 189,628 | |||
| Matías R. Inciarte | 87,590 | |||
| Francisco Luzón | 77,083 | |||
| Ana P. Botín | 46,855 | |||
| Juan R. Inciarte | 50,555 | |||
142
Table of Contents
| Executive Directors | Maximum no. of shares | |||
| Emilio Botín | 19,968 | |||
| Alfredo Sáenz | 47,692 | |||
| Matías R. Inciarte | 25,159 | |||
| Francisco Luzón | 27,675 | |||
| Ana P. Botín | 16,956 | |||
| Juan R. Inciarte | 14,738 | |||
143
Table of Contents
144
Table of Contents
| Name | Date of expiration (1) | |
| Emilio Botín | 1st half 2013 | |
| Fernando de Asúa | 1st half 2011 | |
| Alfredo Sáenz | 1st half 2011 | |
| Matías R. Inciarte | 1st half 2010 | |
| Manuel Soto | 1st half 2010 | |
| Assicurazioni Generali, S.p.A. | 1st half 2012 | |
| Antonio Basagoiti | 1st half 2012 | |
| Ana P. Botín | 1st half 2011 | |
| Javier Botín | 1st half 2010 | |
| Lord Burns | 1st half 2011 | |
| Guillermo de la Dehesa | 1st half 2010 | |
| Rodrigo Echenique | 1st half 2011 | |
| Antonio Escámez | 1st half 2012 | |
| Francisco Luzón | 1st half 2012 | |
| Abel Matutes | 1st half 2010 | |
| Juan R. Inciarte (2) | 1st half 2013 | |
| Luis Ángel Rojo | 1st half 2013 | |
| Luis Alberto Salazar-Simpson | 1st half 2013 | |
| Isabel Tocino | 1st half 2011 |
| (1) | Pursuant to the provisions of our By-laws, one-fifth of the Board will be renewed every year, based on length of service and according to the date and order of their respective appointments. | |
| (2) | The Board of Directors of the Bank, at its meeting of January 28, 2008, agreed to designate Juan R. Inciarte as Director of the Bank. This appointment has been ratified by the shareholders acting at the General Shareholders’ Meeting held on June 21, 2008. At the same meeting the shareholders resolved to re-elect Juan R. Inciarte for a period of 5 years. |
145
Table of Contents
146
Table of Contents
| 1. | In the case of Emilio Botín, to acquire the status of retiree and to accrue a pension supplement. At December 31, 2007, the annual pension supplement would amount to€1,706,000 (2006:€1,529,000). | ||
| 2. | In the cases of Matías R. Inciarte and Francisco Luzón, to acquire the status of early retirees and to accrue pension supplements. At December 31, 2007, the annual pension supplements would amount to€2,146,000 for Matías R. Inciarte and€2,293,000 for Francisco Luzón (2006:€1,916,000 and€1,972,000, respectively; 2005:€1,801,000 and€1,938,000, respectively). | ||
| 3. | In the case of Ana P. Botín, to receive a termination benefit amounting to up to five years’ annual fixed salary payments, as established in the related contract, based on the date on which the contract is terminated. At December 31, 2007, this benefit would amount to€3,399,000 (2006:€4,120,000; 2005:€4,000,000). Receipt of this termination benefit would preclude Ms. Botín from receiving a pension supplement. | ||
| 4. | In the case of Alfredo Sáenz, to acquire the status of retiree or, alternatively, to receive a termination benefit equal to 40% of his annual fixed salary multiplied by the number of years of service at the Bank, up to a maximum of ten times his annual fixed salary. At December 31, 2007, the amount relating to the first option would be€4,257,000 per year and that relating to the second option would be€31.3 million. The two alternatives are mutually exclusive and, therefore, if Alfredo Sáenz opted to receive the termination benefit, he would not receive any pension supplement (2006:€3,657,000 per year and€27.2 million, respectively; 2005:€3,421,000 per year and€26.4 million, respectively). | ||
| 5. | In the case of. Juan R. Inciarte, to acquire the status of special early retiree, early retiree or retiree and to accrue a pension supplement. At December 31, 2007 the annual pension supplement would amount to€930,000. |
147
Table of Contents
| By decision of | ||||||
| Date of current contract | By decision of the | the Director | ||||
| Advance notice period | (month/day/year) | Bank (months) | (months) | |||
| Emilio Botín | 01/02/2007 | (*) | (*) | |||
| Alfredo Sáenz | 12/09/1997 and 02/13/2002 | 4 | 4 | |||
| Matías R. Inciarte | 10/07/2002 | 4 | 4 | |||
| Ana P. Botín | 02/13/2002 | 4 | 4 | |||
| Francisco Luzón | 01/12/2004 | 6 | 4 | |||
| Juan R. Inciarte | 11/14/2002 | 4 | 4 |
| (*) | It is not contractually established. |
148
Table of Contents
149
Table of Contents
150
Table of Contents
151
Table of Contents
| • | The Committee’s regulation, duties, composition and attendance at its meetings in 2007 and operation. | ||
| • | Activity in 2007, grouped on the basis of the Committee’s various functions: |
| • | Conclusion |
152
Table of Contents
| Name | Position | |
| Luis Ángel Rojo | Chairman | |
| Fernando de Asúa | Member | |
| Manuel Soto | Member | |
| Abel Matutes | Member | |
| Luis Alberto Salazar-Simpson | Member |
153
Table of Contents
| • | The Committee’s regulation, duties, composition and attendance at its meetings in 2007 and operation. | ||
| • | Report on the remuneration policy for directors. | ||
| • | Report on the activities of the Appointment and Remuneration Committee. |
| • | Changes in the composition of the Board and its Committees. | ||
| • | Annual verification of the status of the directors. | ||
| • | Participation in the Board’s self-assessment process. | ||
| • | Adjustment to the Unified Code. Amendments to internal rules and regulations. | ||
| • | Appointment and remuneration of the members of Senior Management who are not directors. | ||
| • | New benefit policy for Bank’s Executives. |
154
Table of Contents
| • | Training. | ||
| • | Civil liability insurance. | ||
| • | Related-party transactions. | ||
| • | Institutional documentation. | ||
| • | Self-assessment. |
| • | Conclusion. |
| Name | Position | |
| Fernando de Asúa | Chairman | |
| Manuel Soto | Member | |
| Guillermo de la Dehesa | Member | |
| Rodrigo Echenique | Member | |
| Luis Ángel Rojo | Member |
155
Table of Contents
| Number of employees | ||||||||||||
| 2007 | 2006 (*) | 2005 (*) | ||||||||||
| SPAIN | 36,558 | 35,781 | 34,813 | |||||||||
| LATIN AMERICA | 64,899 | 65,967 | 62,161 | |||||||||
| Argentina | 6,621 | 6,566 | 5,975 | |||||||||
| Bolivia | — | — | 328 | |||||||||
| Brazil | 21,876 | 21,599 | 20,489 | |||||||||
| Chile | 13,025 | 12,533 | 11,408 | |||||||||
| Colombia | 1,312 | 1,893 | 1,730 | |||||||||
| Mexico | 14,053 | 15,820 | 14,562 | |||||||||
| Peru | 43 | 29 | 1,492 | |||||||||
| Puerto Rico | 2,227 | 2,249 | 1,611 | |||||||||
| Uruguay | 302 | 304 | 251 | |||||||||
| Venezuela | 5,439 | 4,974 | 4,315 | |||||||||
| EUROPE | 28,060 | 27,171 | 31,474 | |||||||||
| Czech Republic | 195 | 179 | 192 | |||||||||
| Germany | 1,846 | 1,845 | 1,875 | |||||||||
| Belgium | 12 | 11 | 27 | |||||||||
| Finland | 29 | — | — | |||||||||
| France | 32 | 18 | 17 | |||||||||
| Greece | 20 | — | — | |||||||||
| Hungary | 90 | 77 | 76 | |||||||||
| Ireland | 4 | 5 | 5 | |||||||||
| Italy | 798 | 780 | 720 | |||||||||
| Norway | 330 | 285 | 269 | |||||||||
| Poland | 638 | 588 | 646 | |||||||||
| Portugal | 6,759 | 6,190 | 6,317 | |||||||||
| Slovakia | 10 | — | — | |||||||||
| Switzerland | 203 | 194 | 188 | |||||||||
| The Netherlands | 51 | 57 | 62 | |||||||||
| United Kingdom | 17,043 | 16,942 | 21,080 | |||||||||
| USA | 1,978 | 734 | 649 | |||||||||
| ASIA | 17 | 11 | 11 | |||||||||
| Hong Kong | 13 | 7 | 7 | |||||||||
| Japan | 4 | 4 | 4 | |||||||||
| OTHERS | 307 | 85 | 88 | |||||||||
| Bahamas | 56 | 57 | 65 | |||||||||
| Others | 251 | 28 | 23 | |||||||||
Total | 131,819 | 129,749 | 129,196 | |||||||||
| (*) | Figures for 2006 and 2005 differ from those presented in our Annual Report. In the Annual Report, for comparison purposes, we do not include employees working for the companies that were discontinued during 2007 and 2006, such as our Latin American pension management companies or Abbey’s life insurance business. In this Annual Report on Form 20-F we include the total number of employees at those dates. |
156
Table of Contents
| Number of employees | ||||||||||||
| 2007 | 2006 | 2005 | ||||||||||
| Retail Banking | 126,119 | 119,346 | 117,655 | |||||||||
| Asset Management and Insurance | 1,585 | 7,132 | 7,902 | |||||||||
| Global Wholesale Banking | 2,589 | 1,774 | 2,177 | |||||||||
| Financial Management and Equity Stakes | 1,526 | 1,498 | 1,462 | |||||||||
Total | 131,819 | 129,749 | 129,196 | |||||||||
| Direct | Indirect stake | % of | ||||||||||||||
| Directors | Stake | and represented | Total shares | Capital stock | ||||||||||||
| Emilio Botín (1) | 2,196,518 | 134,992,890 | 137,189,408 | 2.500 | % | |||||||||||
| Fernando de Asúa | 26,806 | 44,500 | 71,306 | 0.001 | % | |||||||||||
| Alfredo Sáenz | 402,487 | 1,243,532 | 1,646,019 | 0.026 | % | |||||||||||
| Matías R. Inciarte (3) | 643,713 | 126,744 | 770,457 | 0.012 | % | |||||||||||
| Manuel Soto | 45,000 | 235,000 | 280,000 | 0.004 | % | |||||||||||
| Assicurazioni Generali S.p.A | 9,805,471 | 62,828,343 | 72,633,814 | 1.161 | % | |||||||||||
| Antonio Basagoiti | 640,000 | — | 640,000 | 0.010 | % | |||||||||||
| Ana P. Botín (1) | 4,991,033 | 4,024,306 | 9,015,339 | 0.000 | % | |||||||||||
| Javier Botín (1) (2) | 4,793,481 | 5,350,000 | 10,143,481 | 0.000 | % | |||||||||||
| Lord Burns (Terence) | 100 | 27,001 | 27,101 | 0.000 | % | |||||||||||
| Guillermo de la Dehesa | 100 | — | 100 | 0.000 | % | |||||||||||
| Rodrigo Echenique | 651,598 | 7,344 | 658,942 | 0.011 | % | |||||||||||
| Antonio Escámez | 559,508 | — | 559,508 | 0.009 | % | |||||||||||
| Francisco Luzón | 144,685 | 1,298,544 | 1,443,229 | 0.023 | % | |||||||||||
| Abel Matutes | 99,809 | 2,080,150 | 2,179,959 | 0.035 | % | |||||||||||
| Juan R. Inciarte | 1,011,357 | — | 1,011,357 | 0.016 | % | |||||||||||
| Luis Ángel Rojo | 1 | — | 1 | 0.000 | % | |||||||||||
| Luis Alberto Salazar-Simpson | 131,312 | 4,464 | 135,776 | 0.002 | % | |||||||||||
| Isabel Tocino | 6,495 | — | 6,495 | 0.000 | % | |||||||||||
| 26,149,474 | 212,262,818 | 238,412,292 | 3.812 | % | ||||||||||||
| (1) | Emilio Botín has attributed the right of vote in a General Shareholders’ Meeting of 90,715,628 shares (1.45% of the capital stock) held by the Marcelino Botín Foundation, of 8,096,742 shares held by Jaime Botín, of 96,047 shares held by Paloma O’Shea, of 9,041,480 shares held by Emilio Botín O., of 9,001,559 shares held by Ana P. Botín and of 11,093,481 shares held by Javier Botín. This table shows the direct and indirect shareholding of the two latter who are Directors, but in the column showing the percentage of the capital these shareholdings are calculated together with those that belong or are also represented by Emilio Botín. | |
| (2) | Javier Botín is a proprietary Director as he represents in the Board of Directors a 2.506% of the Bank’s capital stock which corresponds to the holdings of the Marcelino Botín Foundation, Emilio Botín, Ana P. Botín, Emilio Botín O., Jaime Botín, Paloma O’Shea and his own. | |
| (3) | Matías R. Inciarte has the right to vote 61,444 shares owned by two of his children. |
157
Table of Contents
158
Table of Contents
| In thousands of euros | ||||||||||||
| Loans and | ||||||||||||
| Credits | Guarantees | Total | ||||||||||
| Alfredo Sáenz | 6 | — | 6 | |||||||||
| Matías R. Inciarte | 18 | 10 | 28 | |||||||||
| Manuel Soto | 4 | — | 4 | |||||||||
| Antonio Basagoiti | 94 | 1 | 95 | |||||||||
| Rodrigo Echenique | 7 | — | 7 | |||||||||
| Antonio Escámez | 309 | — | 309 | |||||||||
| Francisco Luzón | 722 | — | 722 | |||||||||
| 1,160 | 11 | 1,171 | ||||||||||
| • | overnight call deposits; | ||
| • | foreign exchange purchases and sales; | ||
| • | derivative transactions, such as forward purchases and sales; | ||
| • | money market fund transfers; | ||
| • | letters of credit for imports and exports; |
| • | in the ordinary course of business; |
| • | on substantially the same terms, including interest rates and collateral, as those prevailing for comparable transactions with other persons; and |
| • | did not involve more than the normal risk of collectibility or other unfavorable features. |
159
Table of Contents
| Page | ||||
| F-1 | ||||
| F-2 | ||||
| F-3 | ||||
| F-7 | ||||
160
Table of Contents
161
Table of Contents
| Euro per Share Interim | Dollars per ADS Interim | |||||||||||||||||||||||||||||||||||||||
| First | Second | Third | Fourth | Total | First | Second | Third | Fourth | Total | |||||||||||||||||||||||||||||||
| 2002 | 0.0775 | 0.07513 | 0.07513 | 0.06073 | 0.2885 | 0.0754 | 0.0612 | 0.0804 | 0.0680 | 0.2850 | ||||||||||||||||||||||||||||||
| 2003 | 0.0775 | 0.0775 | 0.0775 | 0.0704 | 0.3029 | 0.08602 | 0.0899 | 0.0842 | 0.08801 | 0.36235 | ||||||||||||||||||||||||||||||
| 2004 | 0.0830 | 0.0830 | 0.0830 | 0.0842 | 0.3332 | 0.08484 | 0.08971 | 0.09175 | 0.09191 | 0.35821 | ||||||||||||||||||||||||||||||
| 2005 | 0.09296 | 0.09296 | 0.09296 | 0.13762 | 0.4165 | 0.09591 | 0.09466 | 0.09523 | 0.147016 | 0.432816 | ||||||||||||||||||||||||||||||
| 2006 | 0.106904 | 0.106904 | 0.106904 | 0.199913 | 0.5206 | 0.11582 | 0.11593 | 0.11400 | 0.222418 | 0.568168 | ||||||||||||||||||||||||||||||
| 2007 | 0.122940 | 0.122940 | 0.122940 | 0.281961 | 0.650781 | 0.137526 | 0.145308 | 0.149199 | 0.355829 | 0.787862 | ||||||||||||||||||||||||||||||
162
Table of Contents
| Year Ended December 31, | ||||||||||||||||||||
| Previous Spanish GAAP | EU-IFRS (*) | |||||||||||||||||||
| 2003 | 2004 (**) | 2004 | 2005 | 2006 | 2007 | |||||||||||||||
| (in thousands of euros) | ||||||||||||||||||||
| 1,445,033 | 1,837,424 | 1,935,992 | 2,605,009 | 3,256,190 | 4,070,247 | |||||||||||||||
| (*) | The EU-IFRS required to be applied under Bank of Spain’s Circular 4/2004 | |
| (**) | Statutory Distributable Profits |
163
Table of Contents
| Euros per Share | ||||||||||||
| High | Low | Last | ||||||||||
2003 Annual | 9.44 | 5.01 | 9.39 | |||||||||
2004 Annual | 9.77 | 7.70 | 9.13 | |||||||||
2005 Annual | 11.18 | 8.92 | 11.15 | |||||||||
2006 Annual | 14.37 | 10.54 | 14.14 | |||||||||
| First Quarter | 12.40 | 11.00 | 12.05 | |||||||||
| Second Quarter | 12.29 | 10.54 | 11.42 | |||||||||
| Third Quarter | 12.49 | 11.00 | 12.47 | |||||||||
| Fourth Quarter | 14.37 | 12.38 | 14.14 | |||||||||
2007 Annual | 15.00 | 12.56 | 14.79 | |||||||||
| First Quarter | 14.65 | 12.83 | 13.36 | |||||||||
| Second Quarter | 14.50 | 13.06 | 13.69 | |||||||||
| Third Quarter | 14.34 | 12.56 | 13.63 | |||||||||
| Fourth Quarter | 15.00 | 13.64 | 14.79 | |||||||||
Last six months | ||||||||||||
| 2007 | ||||||||||||
| December | 15.00 | 14.35 | 14.79 | |||||||||
| 2008 | ||||||||||||
| January | 14.59 | 11.27 | 11.83 | |||||||||
| February | 12.32 | 11.35 | 11.93 | |||||||||
| March | 12.76 | 11.17 | 12.62 | |||||||||
| April | 13.85 | 12.73 | 13.85 | |||||||||
| May | 14.22 | 13.08 | 13.39 | |||||||||
| June (through June 19, 2008) | 13.08 | 12.02 | 12.02 | |||||||||
| Dollars Per ADS | ||||||||||||
| High | Low | Last | ||||||||||
2003 Annual | 12.01 | 5.68 | 12.01 | |||||||||
2004 Annual | 12.47 | 9.43 | 12.37 | |||||||||
2005 Annual | 13.27 | 11.37 | 13.19 | |||||||||
2006 | ||||||||||||
Annual | 18.73 | 13.16 | 18.66 | |||||||||
| First Quarter | 14.79 | 13.30 | 14.61 | |||||||||
| Second Quarter | 15.62 | 13.16 | 14.62 | |||||||||
| Third Quarter | 15.88 | 13.81 | 15.79 | |||||||||
| Fourth Quarter | 18.73 | 15.83 | 18.66 | |||||||||
164
Table of Contents
| Dollars Per ADS | ||||||||||||
| High | Low | Last | ||||||||||
2007 | ||||||||||||
Annual | 22.14 | 17.29 | 21.54 | |||||||||
| First Quarter | 19.34 | 17.29 | 17.83 | |||||||||
| Second Quarter | 19.46 | 17.67 | 18.38 | |||||||||
| Third Quarter | 19.79 | 17.38 | 19.31 | |||||||||
| Fourth Quarter | 22.14 | 19.24 | 21.54 | |||||||||
Last six months | ||||||||||||
| 2007 | ||||||||||||
| December | 22.14 | 20.51 | 21.54 | |||||||||
| 2008 | ||||||||||||
| January | 21.35 | 17.21 | 17.52 | |||||||||
| February | 18.63 | 16.52 | 17.78 | |||||||||
| March | 19.94 | 17.19 | 19.94 | |||||||||
| April | 21.73 | 20.15 | 21.09 | |||||||||
| May | 22.22 | 20.66 | 20.90 | |||||||||
| June (through June 19, 2008) | 20.39 | 18.70 | 18.84 | |||||||||
165
Table of Contents
| • | the trade involves more than€1.5 million and more than 40% of average daily trading volume of the stock during the preceding quarter; | ||
| • | relates to a merger or spin-off of a listed company; | ||
| • | relates to the reorganization of a business group; | ||
| • | the transaction is executed for the purposes of settling litigation; | ||
| • | involves certain types of contracts or complex transactions; or | ||
| • | the Sociedad de Bolsas finds other justifiable cause. |
166
Table of Contents
| • | established an independent regulatory authority, the CNMV, to supervise the securities markets; |
| • | established a framework for the regulation of trading practices, tender offers and insider trading; |
| • | required stock exchange members to be corporate entities; |
| • | required companies listed on a Spanish stock exchange to file annual audited financial statements and to make public quarterly financial information; |
| • | established a framework for integrating quotations on the four Spanish stock exchanges by computer; |
| • | exempted the sale of securities from transfer and value added taxes; |
| • | deregulated brokerage commissions as of 1992; and |
| • | provided for transfer of shares by book-entry or by delivery of evidence of title. |
| • | provisions regarding market transparency such as: requiring listed companies to establish an audit committee, redefining the reporting requirements for relevant events, rules relating to the treatment of confidential and insider information and related party transactions, and prevention of manipulative and fraudulent practices with respect to market prices; |
| • | the establishment of Iberclear; and |
| • | the authorization of the Minister of Economy to regulate financial services electronic contracts. |
| • | information and transparency obligations including detailed requirements of the contents of the corporate website of listed companies and the obligation to file with the CNMV an annual corporate governance report; and |
| • | the obligation to implement a series of corporate governance rules including, among others, regulations regarding the boards of directors and the general shareholders’ meeting. |
167
Table of Contents
| • | anyone with a right to acquire, transfer or exercise voting rights granted by the shares, regardless of the actual ownership of the shares; and anyone owing, acquiring or transferring other securities or financial instruments which grant a right to acquire shares with voting rights, will also have to notify the holding of a significant stake in accordance with the developing regulations; | ||
| • | Directors of listed companies, in addition to notifying any transaction concerning the shares or other securities or financial instruments of the issuer which are linked to these shares, will have to inform the CNMV of their stake upon appointment or resignation; | ||
| • | Listed companies will be required to notify transactions concerning their treasury shares in certain cases, which will be established in the developing regulations. |
168
Table of Contents
169
Table of Contents
170
Table of Contents
| • | his appointment or ratification, removal, dismissal or withdrawal as director; | ||
| • | the institution of a derivative action against him; or | ||
| • | the approval or ratification of transactions between Santander and the director in question, companies controlled or represented by him, or persons acting for his account. |
171
Table of Contents
| • | issuance of bonds; | ||
| • | increase or reduction of share capital; | ||
| • | transformation of Santander (change in corporate nature); | ||
| • | merger, split or spin-off; | ||
| • | any other amendment of our By-laws; and | ||
| • | dissolution. |
172
Table of Contents
| • | the property or securities to be distributed are of the same nature; | ||
| • | the property or securities have been admitted to listing on an official market as of the effective date of the resolution, or liquidity is guaranteed by Santander within a maximum period of one year; and | ||
| • | the property or securities are not distributed for a value that is lower than the value at which they are recorded on Santander’s balance sheet. |
| • | capital increases following conversion of convertible bonds into Santander shares; |
| • | capital increases due to the absorption of another company or of part of the spun-off assets of another company, when the new shares are issued in exchange for the new assets received; or |
| • | capital increases due to Santander’s tender offer for securities using Santander’s shares as all or part of the consideration. |
173
Table of Contents
174
Table of Contents
175
Table of Contents
176
Table of Contents
177
Table of Contents
178
Table of Contents
| • | a Spanish 210 Form, | ||
| • | the certificate referred to in the preceding section, and | ||
| • | evidence that Spanish non-resident income tax was withheld with respect to you. |
179
Table of Contents
| • | certain financial institutions; | ||
| • | insurance companies; | ||
| • | dealers and traders in securities or foreign currencies; | ||
| • | holders holding ADSs or shares as part of a hedge, “straddle”, conversion transaction or integrated transaction; | ||
| • | holders whose “functional currency” is not the U.S. dollar; | ||
| • | holders liable for alternative minimum tax; |
180
Table of Contents
| • | tax exempt organizations; | ||
| • | partnerships or other entities classified as partnerships for U.S. federal income tax purposes; | ||
| • | holders that own 10% or more of our voting shares; or | ||
| • | persons who acquired our ADSs or shares pursuant to the exercise of any employee stock option or otherwise as compensation. |
| (i) | a citizen or resident of the United States; | |
| (ii) | a corporation, or other entity taxable as a corporation, created or organized in or under the laws of the United States or of any political subdivision thereof; or | |
| (iii) | an estate or trust the income of which is subject to U.S. federal income taxation regardless of its source. |
181
Table of Contents
182
Table of Contents
183
Table of Contents
| • | Organization of Risk Management; | ||
| • | Credit Risk; | ||
| • | Operational Risk; | ||
| • | Basel II Corporate project; | ||
| • | Economic Capital; | ||
| • | Reputational Risk; | ||
| • | Risk Training Activities; and | ||
| • | Market Risk. |
| • | Autonomy in each business area. Matías R. Inciarte, the Group’s third Vice-Chairman and Chairman of the Board’s Risk Committee, reports directly to the Executive Committee and to the Board. |
| • | Support for business, without eroding the principle of independence, in achieving commercial goals by maintaining the quality of risk. Consequently, the organizational structure is adapted to the commercial structure and business and risk managers cooperate. |
| • | Collective decisions (including at the branch) which ensures different opinions and does not make results dependent on decisions by individuals. |
| • | Longstanding tradition of using tools for internal rating and scoring, such as return on risk adjusted capital (“RORAC”), Value at Risk (“VaR”), economic capital, analysis of extreme scenarios, and so forth. |
184
Table of Contents
| • | Global focus, through integral treatment of all risk factors in all business units and using economic capital as the homogeneous metric of the risk assumed and the basis for measuring management. | ||
| • | Desire to maintain medium-low risk profiles as a target, accentuating their low volatility and predictable nature through: |
| • | the search for a high degree of diversification of risk, limiting concentrations in customers, groups, sectors, products and geographic areas; | ||
| • | maintaining a low degree of complexity in market activity; | ||
| • | continuous tracking of risks to prevent sufficiently far ahead possible deterioration of portfolios. |
| Our risk management and control is structured around the following phases: | |||
| • | Risk policies are set that reflect Santander’s risk management principles. | ||
| • | Risks are identified by continually reviewing and monitoring exposures, assessing new products and analyzing particular operations. | ||
| • | Risks are measured using methodologies and models that have been widely tested and proven. | ||
| • | The Group’s appetite for risk is quantified by setting global and specific limits for different types of risks, products, customers, groups, sectors and geographic areas. | ||
| • | A complete series of reports is drawn up and distributed, which are reviewed on a daily basis by those responsible for the management of Santander at all levels. | ||
| • | A system of risk control is executed, which verifies every day the extent to which Santander’s risk profile is in line with the approved risk policies and established limits. |
| • | Internal qualitative and quantitative ratings and scorings, with valuation of the different components which, by client and facility, enable the probability of failure to be estimated and then the expected loss on the basis of historical data. | ||
| • | Economic capital, as the homogeneous metric of the risk assumed and the basis for measuring management. | ||
| • | Return on Risk Adjusted Capital (RORAC), for pricing operations (bottom up) and analysis of portfolios and units (top down). | ||
| • | Value at Risk (VaR) as an element of control and for setting the market risk limits of the different trading portfolios. | ||
| • | Stress testing to complement the analysis of market and credit risk, in order to assess the impact of alternative scenarios, including on provisions and capital. |
185
Table of Contents
| • | Propose to the Board the risk policy for the Group, which must, in particular, identify: |
| • | The different types of risk (operational, technological, financial, legal and reputational, among others) facing the Bank; | ||
| • | The internal information and control systems used to control and manage these risks; | ||
| • | Set the level of risk considered acceptable; and | ||
| • | The measures envisaged to mitigate the impact of identified risks, in the event that they materialize. |
| • | Systematically review exposures with the main customers, economic sectors, geographic areas and types of risk. | ||
| • | Authorize the management tools and risk models as well as be familiar with the results of the internal validation. | ||
| • | Ensure that our actions are consistent with the previously decided risk tolerance level. | ||
| • | Resolve operations beyond the powers delegated to bodies immediately below, as well as the global limits of pre-classification of economic groups or in relation to exposures by classes of risk. |
186
Table of Contents
| Sovereign | Private | |||||||||||||||||||||||||||||||||||||||
| fixed | fixed | Out- | ||||||||||||||||||||||||||||||||||||||
| Outstanding | Commitments | income | income | standing | Commitments | Derivatives | ||||||||||||||||||||||||||||||||||
| to | to | (excluding | (excluding | to credit | to credit | and | Var. vs. | |||||||||||||||||||||||||||||||||
| customers | customers | trading) | trading) | entities | entities | Repos | Total | % | Dec-06 | |||||||||||||||||||||||||||||||
SPAIN | 298,281 | 56,290 | 14,460 | 8,334 | 24,092 | 1,008 | 13,135 | 415,600 | 49.6 | % | 15.9 | % | ||||||||||||||||||||||||||||
| Parent bank | 179,476 | 38,604 | 10,895 | 3,613 | 18,142 | 670 | 9,545 | 260,945 | 31.1 | % | 20.6 | % | ||||||||||||||||||||||||||||
| Banesto | 83,648 | 11,100 | 3,002 | 2,302 | 2,903 | 136 | 3,422 | 106,514 | 12.7 | % | 6.4 | % | ||||||||||||||||||||||||||||
| Others | 35,157 | 6,586 | 563 | 2,419 | 3,047 | 201 | 168 | 48,141 | 5.7 | % | 14.4 | % | ||||||||||||||||||||||||||||
Rest of Europe | 246,283 | 20,342 | 1,021 | 3,870 | 3,723 | 1 | 10,142 | 285,382 | 34.0 | % | 8.8 | % | ||||||||||||||||||||||||||||
| Germany | 17,195 | 2,181 | 100 | 60 | 388 | 0 | 5 | 19,931 | 2.4 | % | 13.6 | % | ||||||||||||||||||||||||||||
| Portugal | 23,017 | 6,431 | 794 | 290 | 1,046 | 1 | 1,845 | 33,423 | 4.0 | % | 1.9 | % | ||||||||||||||||||||||||||||
| UK | 165,158 | 6,961 | 0 | 3,227 | 975 | 0 | 8,199 | 185,521 | 22.0 | % | 2.2 | % | ||||||||||||||||||||||||||||
| Others | 40,913 | 4,769 | 127 | 293 | 1,313 | 0 | 93 | 47,508 | 5.5 | % | 50.6 | % | ||||||||||||||||||||||||||||
Latin America | 70,858 | 22,130 | 8,330 | 1,841 | 16,704 | 2,001 | 5,710 | 127,574 | 15.2 | % | 9.0 | % | ||||||||||||||||||||||||||||
| Brazil | 22,653 | 7,537 | 2,334 | 418 | 9,036 | 0 | 2,031 | 44,010 | 5.2 | % | 41.8 | % | ||||||||||||||||||||||||||||
| Chile | 18,291 | 3,448 | 704 | 550 | 936 | 1 | 2,027 | 25,959 | 3.1 | % | 12.2 | % | ||||||||||||||||||||||||||||
| Mexico | 14,134 | 7,384 | 4,165 | 0 | 3,123 | 2,000 | 1,440 | 32,444 | 3.8 | % | -17.1 | % | ||||||||||||||||||||||||||||
| Others | 15,780 | 3,761 | 1,126 | 872 | 3,609 | 0 | 212 | 25,361 | 3.0 | % | 6.0 | % | ||||||||||||||||||||||||||||
Rest of world* | 4,967 | 444 | 327 | 1,412 | 2,954 | 0 | 46 | 10,151 | 1.2 | % | 30.2 | % | ||||||||||||||||||||||||||||
TOTAL GROUP | 620,389 | 99,206 | 24,138 | 15,458 | 47,473 | 3,009 | 23,093 | 838,708 | 100 | % | 12.5 | % | ||||||||||||||||||||||||||||
| % of Total | 74.0 | % | 11.8 | % | 2.9 | % | 1.8 | % | 5.7 | % | 0.4 | % | 3.5 | % | 100.0 | % | ||||||||||||||||||||||||
| %Change, vs. Dec-06 | 11.9 | % | 10.3 | % | -4.0 | % | 61.0 | % | 49.9 | % | 75.8 | % | -13.1 | % | 12.5 | % | ||||||||||||||||||||||||
Data at December 31, 2007 based on the jurisdiction of incorporation of the Group company that has the exposure to the specified credit risk on its books |
| Derivatives and repos expressed in equivalent credit risk (ECR), |
| Balances with customers exclude repos (EUR 28,960 million), |
| Balances with credit entities (excluding repos and trading) include EUR 27,770 million of deposits in central banks, |
| * | It includes Drive’s assets (Santander Consumer Finance), among others. |
187
Table of Contents
| Credit risk | Spec, prov net of | |||||||||||||||||||||||||||||||||||||||
| with customers* | NPL ratio | Coverage | recovered write-offs | Credit cost | ||||||||||||||||||||||||||||||||||||
| (million euros) | (%) | (%) | (million euros) | (% of risk) | ||||||||||||||||||||||||||||||||||||
| 2007 | 2006 | 2007 | 2006 | 2007 | 2006 | 2007 | 2006 | 2007 | 2006 | |||||||||||||||||||||||||||||||
| Continental Europe | 358,933 | 319,861 | 0.90 | 0.73 | 188.1 | 244.9 | 1,042 | 388 | 0.30 | 0.13 | ||||||||||||||||||||||||||||||
| Santander Branch Network | 131,676 | 120,161 | 0.65 | 0.57 | 248.1 | 295.8 | 116 | 58 | 0.09 | 0.05 | ||||||||||||||||||||||||||||||
| Banesto | 86,601 | 72,714 | 0.47 | 0.42 | 332.9 | 396.1 | 72 | 3 | 0.09 | 0.00 | ||||||||||||||||||||||||||||||
| Santander Consumer Finance | 32,178 | 30,417 | 2.84 | 2.57 | 95.7 | 114.1 | 837 | 312 | 1.88 | 0.87 | ||||||||||||||||||||||||||||||
| Portugal | 47,556 | 40,742 | 1.25 | 0.53 | 117.4 | 305.1 | (12 | ) | 16 | 0.04 | 0.06 | |||||||||||||||||||||||||||||
| UK (Abbey) | 203,225 | 203,554 | 0.60 | 0.60 | 65.8 | 85.9 | 474 | 379 | 0.23 | 0.20 | ||||||||||||||||||||||||||||||
| Latin America | 84,073 | 70,582 | 1.87 | 1.38 | 134.4 | 167.3 | 1,527 | 934 | 1.99 | 1.47 | ||||||||||||||||||||||||||||||
| Brazil | 26,414 | 17,998 | 2.74 | 2.38 | 101.5 | 102.8 | 787 | 532 | 3.78 | 3.49 | ||||||||||||||||||||||||||||||
| Mexico | 15,012 | 16,598 | 1.20 | 0.64 | 192.3 | 279.2 | 452 | 182 | 2.91 | 1.26 | ||||||||||||||||||||||||||||||
| Chile | 19,198 | 16,741 | 2.11 | 1.59 | 118.5 | 152.6 | 121 | 182 | 0.67 | 1.07 | ||||||||||||||||||||||||||||||
| Puerto Rico | 5,067 | 5,467 | 3.17 | 1.67 | 101.7 | 161.7 | 111 | 46 | 2.08 | 0.85 | ||||||||||||||||||||||||||||||
| Venezuela | 4,452 | 3,238 | 0.98 | 0.98 | 371.3 | 435.5 | 21 | 6 | 0.53 | 0.24 | ||||||||||||||||||||||||||||||
| Colombia | 1,464 | 1,431 | 1.21 | 0.58 | 217.1 | 396.4 | 12 | 4 | 0.80 | 0.31 | ||||||||||||||||||||||||||||||
| Argentina | 2,898 | 2,565 | 1.24 | 1.25 | 235.9 | 258.2 | 20 | (10 | ) | 0.68 | (0.44 | ) | ||||||||||||||||||||||||||||
| Rest | 3,110 | (5,625 | ) | 90 | (1 | ) | ||||||||||||||||||||||||||||||||||
| Total Group | 649,342 | 588,372 | 0.95 | 0.78 | 150.6 | 187.2 | 3,132 | 1,700 | 0.50 | 0.32 | ||||||||||||||||||||||||||||||
| Memo item: | ||||||||||||||||||||||||||||||||||||||||
| Spain | 276,313 | 249,072 | 0.63 | 0.53 | 264.5 | 328.4 | 335 | 149 | 0.12 | 0.07 | ||||||||||||||||||||||||||||||
| * | Includes gross loans to customers, guarantees and documentary credits. |
| • | Firms under individualized management are those customers who have been assigned, explicitly or implicitly, a risk analyst (attached to a Company Analysis Unit, Corporate Banking Risks or Risks with Financial Institutions). This category includes the segments of corporate banking, financial institutions, sovereigns and part of retail banking companies. | ||
| • | Standardized firms are the customers who have not been assigned a specific risk analyst and whose actual or potential risk is less than a pre-determined amount. These customers include individuals, individual businessmen and retail banking companies that are not segmented. |
188
Table of Contents
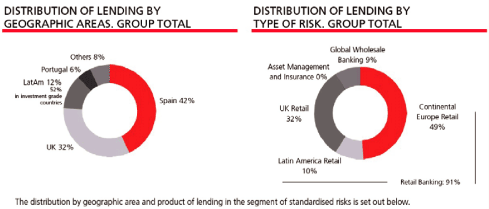
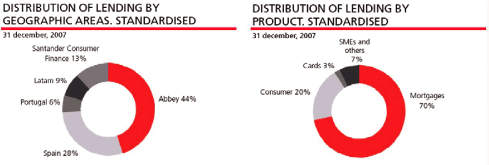
189
Table of Contents
| Extinguish | Secure | Reduce | Monitor | Total FEVE | ||||||||||||||||
| Spain-parent bank | 635 | 263 | 2,716 | 7,570 | 11,184 | |||||||||||||||
| Portugal | 154 | 54 | 203 | 1,337 | 1,748 | |||||||||||||||
| Latin America | 287 | 48 | 496 | 2,472 | 3,303 | |||||||||||||||
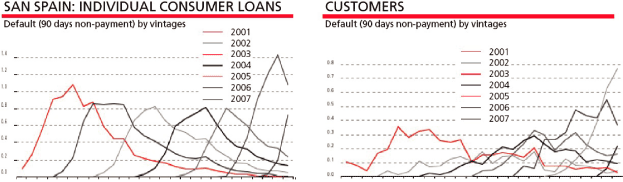
| % of | ||||||||
| Portfolio | loans | |||||||
| Mortgages for homes | 66,737 | 27.9 | % | |||||
| First residence | 63,818 | 95.6 | % | |||||
| Second residence | 2,920 | 4.4 | % | |||||
| Real estate development loans | 16,569 | 6.9 | % | |||||
| Total | 83,306 | 34.9 | % | |||||
190
Table of Contents

| % of | ||||||||
| Portfolio | loans | |||||||
| Mortgages for homes | 143,004 | 86.3 | % | |||||
| First Home Buyers | 141,085 | 98.7 | % | |||||
| Others | 1,919 | 1.3 | % | |||||
| Social Housing | 7,861 | 4.7 | % | |||||
| Total | 150,865 | 91.1 | % | |||||

191
Table of Contents
| • | The quantitative rating is calibrated with the market price of credit derivatives, specifically credit default swaps, and with balance sheet information, giving rise to a statistical model based on the financial statements, which can also be used for institutions that do not have a liquid price in these instruments. | ||
| • | There is then a review of the rating which has been automatically calculated by the analysts, producing a final rating. | ||
| • | Lastly, in the case of global wholesale banking the rating is adjusted when the customer belongs to a group from whom explicit support is received. |
192
Table of Contents
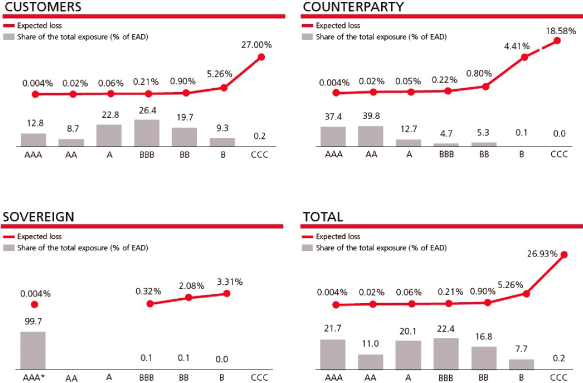
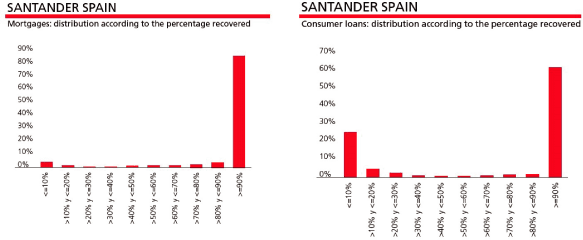
193
Table of Contents
| Equivalence with: | ||||||||
| Internal | Probability of | Standard & | ||||||
| Rating | default | Poor’s | Moody’s | |||||
| 9.3 | 0.017 | % | AAA | Aaa | ||||
| 9.2 | 0.018 | % | AA+ | Aa1 | ||||
| 9.0 | 0.022 | % | AA | Aa2 | ||||
| 8.5 | 0.035 | % | AA- | Aa3 | ||||
| 8.0 | 0.06 | % | A+ | A1 | ||||
| 7.5 | 0.09 | % | A | A2 | ||||
| 7.0 | 0.14 | % | A- | A3 | ||||
| 6.5 | 0.23 | % | BBB+ | Baa1 | ||||
| 6.0 | 0.36 | % | BBB | Baa2 | ||||
| 5.5 | 0.57 | % | BBB- | Baa3 | ||||
| 5.0 | 0.92 | % | BB+ | Ba1 | ||||
| 4.5 | 1.46 | % | BB | Ba2 | ||||
| 4.0 | 2.33 | % | BB/BB- | Ba2/Ba3 | ||||
| 3.5 | 3.71 | % | BB-/B+ | Ba3/B1 | ||||
| 3.0 | 5.92 | % | B+/B | B1/B2 | ||||
| 2.5 | 9.44 | % | B | B2 | ||||
| 2.0 | 15.05 | % | B- | B3 | ||||
| 1.5 | 24.00 | % | CCC | Caa1 | ||||
| 1.0 | 38.26 | % | CC/C | Caa1/Caa2 | ||||
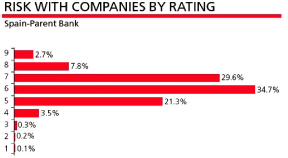
194
Table of Contents
BY SEGMENTS. Million euros
| EAD | % | PD Average | LGD Average | EL | ||||||||||||||||
| Sovereign | 56,827 | 7.6 | % | 0.03 | % | 25.3 | % | 0.01 | % | |||||||||||
| Counterparty | 69,887 | 9.4 | % | 0.19 | % | 41.2 | % | 0.08 | % | |||||||||||
| Public sector | 1,635 | 0.2 | % | 0.65 | % | 21.3 | % | 0.14 | % | |||||||||||
| Corporate | 101,383 | 13.6 | % | 0.67 | % | 40.4 | % | 0.27 | % | |||||||||||
| Companies | 154,076 | 20.6 | % | 2.27 | % | 29.3 | % | 0.67 | % | |||||||||||
| Mortgages | 257,001 | 34.4 | % | 2.72 | % | 7.1 | % | 0.19 | % | |||||||||||
| Consumer | 89,072 | 11.9 | % | 6.10 | % | 45.1 | % | 2.75 | % | |||||||||||
| Cards | 13,553 | 1.8 | % | 8.30 | % | 62.1 | % | 5.15 | % | |||||||||||
| Rest | 3,302 | 0.4 | % | 2.40 | % | 57.0 | % | 1.37 | % | |||||||||||
| Memo item customers | 620,022 | 83.0 | % | 2.88 | % | 28.0 | % | 0.81 | % | |||||||||||
| Total Group | 746,737 | 100.0 | % | 2.41 | % | 28.1 | % | 0.68 | % | |||||||||||
BY BUSINESS UNIT. Million euros
| EAD | % | PD Average | LGD Average | EL | ||||||||||||||||
| Santander Branch Network Spain | 146,117 | 19.6 | % | 2.25 | % | 18.2 | % | 0.41 | % | |||||||||||
| Banesto | 80,489 | 10.8 | % | 1.23 | % | 22.3 | % | 0.28 | % | |||||||||||
| Abbey | 213,275 | 28.6 | % | 2.61 | % | 14.0 | % | 0.37 | % | |||||||||||
| Portugal | 38,390 | 5.1 | % | 1.71 | % | 26.9 | % | 0.46 | % | |||||||||||
| SCF | 48,596 | 6.5 | % | 4.58 | % | 40.1 | % | 1.83 | % | |||||||||||
| Latin America | 130,663 | 17.5 | % | 3.63 | % | 47.1 | % | 1.71 | % | |||||||||||
| Others (vertical) | 89,205 | 11.9 | % | 0.56 | % | 29.9 | % | 0.17 | % | |||||||||||
| Global Wholesale* | 94,352 | 12.6 | % | 0.51 | % | 42.4 | % | 0.22 | % | |||||||||||
| Total Group | 746,737 | 100.0 | % | 2.41 | % | 28.1 | % | 0.68 | % | |||||||||||
| * | Transversal measurment: some clients of Global Wholesale Banking are in other segments of the portfolio. |
195
Table of Contents
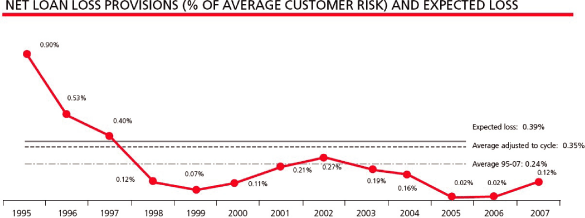
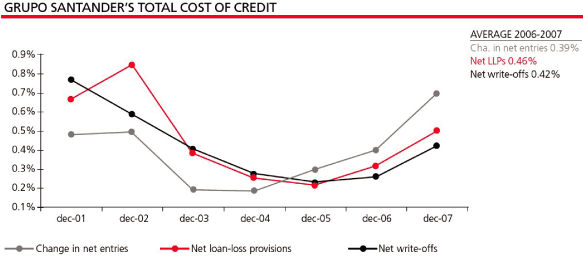
196
Table of Contents


197
Table of Contents
198
Table of Contents
Million euros at Decembers 31, 2007
| Notional values | ||||||||||||||||||||||||||||
| < 1 year | 1-5 years | 5-10 years | >10 years | Trade | Hedge | Total | ||||||||||||||||||||||
| CDS protection acquired | 5,706 | 85,472 | 12,555 | 5 | 100,199 | 3,539 | 103,738 | |||||||||||||||||||||
| CDS protection sold | 4,601 | 73,564 | 11,471 | 0 | 85,259 | 4,377 | 89,636 | |||||||||||||||||||||
| CDS options | 0 | 0 | 0 | 0 | 0 | 0 | 0 | |||||||||||||||||||||
| TOTAL CREDIT DERIVATIVES | 10,307 | 159,036 | 24,026 | 5 | 185,458 | 7,916 | 193,374 | |||||||||||||||||||||
| Equity forwards | 2,256 | 97 | 0 | 0 | 323 | 2,030 | 2,353 | |||||||||||||||||||||
| Equity options | 11,379 | 11,380 | 3,413 | 11 | 21,611 | 4,574 | 26,184 | |||||||||||||||||||||
| Equity swaps | 2,721 | 7,784 | 4,268 | 0 | 12,767 | 2,006 | 14,773 | |||||||||||||||||||||
| TOTAL EQUITY DERIVATIVES | 16,356 | 19,261 | 7,681 | 11 | 34,700 | 8,610 | 43,310 | |||||||||||||||||||||
| Fixed-income forwards | 809 | 65 | 0 | 0 | 565 | 310 | 874 | |||||||||||||||||||||
| Fixed-income options | 973 | 0 | 0 | 0 | 68 | 905 | 973 | |||||||||||||||||||||
| Fixed-income spot | 1,236 | 0 | 0 | 0 | 294 | 942 | 1,236 | |||||||||||||||||||||
| TOTAL FIXED INCOME DERIVATIVES | 3,018 | 65 | 0 | 0 | 927 | 2,157 | 3,083 | |||||||||||||||||||||
| Asset swaps | 31,973 | 4,362 | 277 | 189 | 488 | 36,312 | 36,801 | |||||||||||||||||||||
| Exchange-rate options | 41,609 | 4,296 | 633 | 11 | 25,312 | 21,237 | 46,548 | |||||||||||||||||||||
| Exchange-rate swaps | 61,950 | 27,534 | 22,300 | 5,139 | 22,286 | 94,637 | 116,923 | |||||||||||||||||||||
| Other exchange-rate derivatives | 171 | 82 | 0 | 0 | 211 | 41 | 253 | |||||||||||||||||||||
| TOTAL EXCHANGE RATES | 135,703 | 36,274 | 23,209 | 5,339 | 48,297 | 152,227 | 200,525 | |||||||||||||||||||||
| Asset swaps | 131 | 551 | 230 | 1,740 | 0 | 2,652 | 2,652 | |||||||||||||||||||||
| Call money swaps | 40,821 | 4,472 | 2,686 | 0 | 45,240 | 2,740 | 47,980 | |||||||||||||||||||||
| IRS | 474,211 | 678,418 | 302,562 | 125,459 | 1,053,906 | 526,745 | 1,580,651 | |||||||||||||||||||||
| Forward interest rates | 324,302 | 250 | 281 | 0 | 324,833 | 0 | 324,833 | |||||||||||||||||||||
| Other interest-rate derivatives | 80,629 | 114,309 | 35,170 | 53,692 | 68,824 | 214,976 | 283,800 | |||||||||||||||||||||
| Interest rate structures | 1,551 | 16,664 | 417 | 346 | 18,763 | 215 | 18,977 | |||||||||||||||||||||
| TOTAL INTEREST-RATE DERIVATIVES | 921,646 | 814,664 | 341,347 | 181,237 | 1,511,565 | 747,328 | 2,258,893 | |||||||||||||||||||||
| Commodities | 245 | 602 | 638 | 0 | 654 | 832 | 1,486 | |||||||||||||||||||||
| TOTAL COMMODITY DERIVATIVES | 245 | 602 | 638 | 0 | 654 | 832 | 1,486 | |||||||||||||||||||||
| TOTAL OTC DERIVATIVES | 1,087,275 | 1,029,903 | 396,901 | 186,592 | 1,781,601 | 919,070 | 2,700,671 | |||||||||||||||||||||
| % | ||||
| Banks | 53.7 | |||
| Corporates | 30.0 | |||
| SMEs | 15.6 | |||
| Public bodies | 0.7 | |||
199
Table of Contents
Million euros, December 31, 2007
| TOTAL NET NRV | TOTAL ECR | |||||||||||||||||||||||
| Trade | Hedge | Total | Trade | Hedge | Total | |||||||||||||||||||
| CDS protection acquired | 742 | 6 | 748 | 793 | -19 | 774 | ||||||||||||||||||
| CDS protection sold | 127 | 9 | 136 | -697 | 33 | -663 | ||||||||||||||||||
| CDS options | 0 | 0 | 0 | 0 | 0 | 0 | ||||||||||||||||||
| TOTAL CREDIT DERIVATIVES | 868 | 15 | 883 | 97 | 14 | 111 | ||||||||||||||||||
| Equity forwards | 0 | 27 | 27 | 0 | -33 | -33 | ||||||||||||||||||
| Equity options | 947 | 1,258 | 2,205 | -104 | 276 | 173 | ||||||||||||||||||
| Equity swaps | 0 | 252 | 252 | 0 | 60 | 60 | ||||||||||||||||||
| TOTAL EQUITY DERIVATIVES | 947 | 1,537 | 2,485 | -104 | 303 | 200 | ||||||||||||||||||
| Fixed-income forwards | 4 | 0 | 4 | 0 | 1 | 1 | ||||||||||||||||||
| Fixed- income options | 2 | 0 | 2 | 0 | 0 | 0 | ||||||||||||||||||
| Fixed- income spot | 0 | 0 | 0 | 0 | 0 | 0 | ||||||||||||||||||
| TOTAL FIXED INCOME DERIVATIVES | 6 | 0 | 6 | 1 | 1 | 2 | ||||||||||||||||||
| Asset swaps | 33 | 1,789 | 1,823 | 5 | 127 | 131 | ||||||||||||||||||
| Exchange-rate options | 209 | 232 | 441 | 32 | 293 | 325 | ||||||||||||||||||
| Exchange-rate swaps | 1,739 | 3,037 | 4,776 | 274 | -1,654 | -1,380 | ||||||||||||||||||
| Other exchange-rate derivatives | 44 | 1 | 45 | 25 | 0 | 26 | ||||||||||||||||||
| TOTAL EXCHANGE RATES | 2,025 | 5,060 | 7,085 | 336 | -1,234 | -898 | ||||||||||||||||||
| Asset swaps | 0 | 304 | 304 | 0 | -9 | -9 | ||||||||||||||||||
| Call money swaps | 62 | 25 | 87 | -38 | 0 | -38 | ||||||||||||||||||
| IRS | 6,609 | 2,382 | 8,990 | -723 | -298 | -1,022 | ||||||||||||||||||
| Forward interest rates | 117 | 0 | 117 | 114 | 0 | 114 | ||||||||||||||||||
| Other interest-rate derivatives | 1,576 | 738 | 2,313 | 880 | -721 | 159 | ||||||||||||||||||
| Interest rate structures | 989 | 5 | 994 | 332 | 1 | 333 | ||||||||||||||||||
| TOTAL INTEREST-RATE DERIVATIVES | 9,353 | 3,454 | 12,807 | 565 | -1,028 | -463 | ||||||||||||||||||
| Commodities | 6 | 17 | 23 | 0 | 7 | 7 | ||||||||||||||||||
| TOTAL COMMODITY DERIVATIVES | 6 | 17 | 23 | 0 | 7 | 7 | ||||||||||||||||||
| TOTAL OTC DERIVATIVES | 13,206 | 10,083 | 23,288 | 895 | -1,937 | -1,041 | ||||||||||||||||||
| CASH COLLATERAL | -1,853 | -1,136 | -2,989 | |||||||||||||||||||||
| BOND COLLATERAL | 0 | -30 | -30 | |||||||||||||||||||||
| EQUITY COLLATERAL | 0 | 0 | 0 | |||||||||||||||||||||
| COLLATERALS | -1,853 | -1,166 | -3,019 | |||||||||||||||||||||
| TOTAL | 11,353 | 8,916 | 20,269 | |||||||||||||||||||||
| * | Banesto not included |
Data at December 31, 2007
| % | ||||
| AAA | 0.9 | |||
| AA | 46.8 | |||
| A | 28.1 | |||
| BBB | 16.8 | |||
| BB | 3.9 | |||
| B | 0.2 | |||
| Without rating | 3.4 | |||
| % | ||||
| Spain | 27.0% | |||
| UK | 23.9% | |||
| Rest of Europe | 16.6% | |||
| Latin America | 19.0% | |||
| US | 12.7% | |||
| Others | 0.8% | |||
200
Table of Contents
201
Table of Contents
| • | Integral and effective management of operational risk (identification, evaluation, monitoring, control/mitigation and reporting). | ||
| • | Providing better knowledge of existing and potential operational risks and the allocation of responsibility for them by managers of the business and support lines. | ||
| • | Drawing up of data on losses, enabling operational risk to be quantified for calculating both the economic and the regulatory capital. | ||
| • | Operational risk information helps to improve the processes and controls, reduce losses and the volatility of revenues. |
202
Table of Contents
| • | Fostering mitigation plans: controlling implementation of corrective measures as well as projects underway. | ||
| • | Presentations to senior management and development of internal rules. | ||
| • | Designation of coordinators and the creation of operational risk departments. | ||
| • | Training and exchange of experiences to communicate the best practices within the Group. | ||
| • | Design and putting into effect qualitative and quantitative operational risk tools. | ||
| • | Conciliation of databases of losses — accounting. | ||
| • | Developments for the automatic capturing of events through accounting systems. | ||
| • | Development of the corporate operational risk tool in a web-based environment. | ||
| • | Collaboration with the procurement area regarding its function in managing banking insurance related to operational risk (BBB policies, damage, civil responsibility and life). | ||
| • | Fostering contingency and business continuity plans. |
| • | Databases of losses classified by errors and operational types are received every month. The Group’s data base shows events (i.e. without exclusions for reasons of amount and with both the accounting impact -including positive effects as well as the non-accounting impact). | ||
| • | Self-assessment questionnaires filled in by almost all of our units are received and analyzed. | ||
| • | Operational risk indicators are available, regularly defined and updated by the main management units. | ||
| • | There are always a sufficient number of coordinators in the business and back-up areas. | ||
| • | The main events are identified and analyzed, and mitigation measures taken which, in significant cases, are disseminated to the Group’s other units as a Best Practices guide. | ||
| • | Processes are conducted to conciliate data bases with accounting. |
203
Table of Contents
| • | Review of the valuation models and in general the valuation of portfolios | ||
| • | Capturing processes and independent validation of prices | ||
| • | Appropriate confirmation of operations with counterparties | ||
| • | Reviewing cancellations and modifications of operations | ||
| • | Reviewing and monitoring the effectiveness of guarantees, collateral and risk mitigation. |
| • | Two levels of information: one corporate and the other individualized for each country/unit. | ||
| • | It enables, via maintaining a data base of events and mitigating measures, the best practices to be disseminated among countries/Grupo Santander units. |
| • | Our management model for operational risk. | ||
| • | Human resources and perimeter of action | ||
| • | Analysis of the data base of errors and events | ||
| • | Operational Risk Cost and Accounting Reconciliation | ||
| • | Self-assessment questionnaires | ||
| • | Indicators | ||
| • | Mitigating measures/asset management | ||
| • | Contingency plans | ||
| • | Regulatory framework: BIS II | ||
| • | Insurance |
| • | Cooperation in presenting our operational risk control and management model to insurance and reinsurance companies. | ||
| • | Analysis and monitoring of recommendations and suggestions to improve operational risks made by insurance companies, via prior audits conducted by specialized companies, and the subsequent implementation of these recommendations and suggestions. |
204
Table of Contents
| • | Exchange of information generated in both areas in order to strengthen the quality of databases of errors and the perimeter of coverage of insurance policies on different operational risks. | ||
| • | Close cooperation between local coordinators of operational risk and local coordinators of insurance, in order to enhance mitigation of operational risk. | ||
| • | Regular meetings on specific activities, status updates and projects in both areas. | ||
| • | Active participation of both areas in the unit for Global Sourcing of Insurance, our highest technical body for setting coverage strategies and contracting insurance. |
| Object of protection | Type of coverage / BIS II category covered | Policy | ||
| Protection of the activity | Financial / I Internal fraud and II external fraud | Integral Banking Policy (BBB) | ||
| Cash and securities | ||||
| Safes | ||||
| Assets/ V Material damages | Material damages | |||
| Cars | ||||
| Civil responsibility / | Civil responsibility | |||
| IV Practices with clients, products and business and | Professional indemnity | |||
| V Damage to physical assets | Directors & Officers | |||
| Protection of employees | Employees / III Employment practices, health | Life and personal accident | ||
| and safety at work | Health | |||
| Product support | Products/I Internal fraud and II external fraud | Cards | ||
| Current accounts |
| The BBB policy protects us, for example, from disasters such as internal fraud, theft, electronic crime, forgery and fraudulent mortgages, |
205
Table of Contents
206
Table of Contents
207
Table of Contents
208
Table of Contents
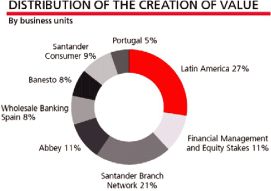
| • | to analyze and set prices during the decision-taking process for operations (admission) and clients (monitoring); | ||
| • | to estimate the capital consumption of each client, portfolio or business segment, in order to facilitate the optimal allocation of economic capital; and | ||
| • | to calculate the level of provisions that correspond to average expected losses. |
209
Table of Contents
| • | Own account transactions | |
| • | Related party transactions | |
| • | Conflicts of interest | |
| • | Treatment of sensitive information (confidential, reserved or privileged) | |
| • | Prevention of money-laundering | |
| • | Approval and marketing of financial products | |
| • | Preparation and dissemination of information and documents for markets (material facts, periodic public information, prospectus, etc.) | |
| • | Protection of personal data | |
| • | Institutional relations with regulatory bodies | |
| • | Handling of customers’ complaints | |
| • | Verifying specific aspects related to the Markets in Financial Instruments Directive (“MiFID”) |
210
Table of Contents
211
Table of Contents
212
Table of Contents
| Transactions | ||||||||||||||||
| Subsidiaries | Number of files | communicated to the | Number of employees | |||||||||||||
| Year 2007 | reviewed | investigated | authorities | trained | ||||||||||||
| Spain | 26 | 2,462 | 241 | 8,109 | ||||||||||||
| Abroad | 121 | 24,232 | 6,682 | 71,839 | ||||||||||||
Total | 147 | 26,694 | 6,923 | 79,948 | ||||||||||||
213
Table of Contents
| • | Trading in financial instruments, which involves interest rate, foreign exchange rate, equity price and volatility risks. | ||
| • | Engaging in retail banking activities, which involves interest rate risk since a change in interest rates affects interest income, interest expense and customer behavior. This interest rate risk arises from the gap (maturity and repricing) between assets and liabilities. | ||
| • | Investing in assets (including subsidiaries) whose returns or accounts are denominated in currencies other than the Euro, which involves foreign exchange rate risk between the Euro and such other currencies. | ||
| • | Investing in subsidiaries and other companies, which subject us to equity price risk. | ||
| • | Liquidity risk is embedded in all activities, trading and non-trading. |
214
Table of Contents
| • | Identify and define the main types of risk incurred efficiently and comprehensively to be consistent with the management and strategy of the business. | ||
| • | Quantify and inform the business areas of the risk levels and profile that senior management believes can be assumed, in order to avoid undesired risks. | ||
| • | Give flexibility to the business areas to build risk positions efficiently and on a timely basis according to changes in the market and in the business strategies, and always within the risk levels regarded as acceptable by the Group. | ||
| • | Allow the generators of business to take prudent risks which are sufficient to attain budgeted results. | ||
| • | Establish investment alternatives by limiting equity consumption. | ||
| • | Define the range of products and underlying assets with which each unit of Treasury can operate, taking into consideration features such as the model and valuation systems, the liquidity of the tools used, etc. This will help to constrain all market risk within the business management and defined risk strategy. |
215
Table of Contents
| • | Providing risk reducing levels suggestions and controls. These actions are the result of breaking “alarm” limits. | ||
| • | Taking executive actions that require risk takers to close out positions to reduce risk levels. |
216
Table of Contents
| • | A one-day time horizon may not fully capture the market risk of positions that cannot be liquidated or hedged within one day. | ||
| • | At present, we compute DCaR at the close of business and trading positions may change substantially during the course of the trading day. |
217
Table of Contents
218
Table of Contents
219
Table of Contents
| 1 | All figures in this report are measured in euros. The exchange rate used is the one quoted in the market on the reference date. | |
| 2 | Banesto is not included in the Group’s VaR for trading activity. |
220
Table of Contents
| Minimum | Average | Maximum | Last | |||||||||||||||
TOTAL TRADING | Total VaR | 19.6 | 28.9 | 56.1 | 27.7 | |||||||||||||
| Diversification effect | (3.1 | ) | (11.1 | ) | (17.3 | ) | (10.5 | ) | ||||||||||
| Fixed-Income VaR | 15.4 | 24.3 | 44.1 | 26.0 | ||||||||||||||
| Equity VaR | 3.7 | 5.8 | 12.1 | 4.6 | ||||||||||||||
| FX VaR | 5.4 | 9.8 | 17.4 | 7.6 | ||||||||||||||
LATIN AMERICA | VaR Total | 12.9 | 22.3 | 48.4 | 15.2 | |||||||||||||
| Diversification effect | (0.1 | ) | (8.6 | ) | (15.1 | ) | (10.0 | ) | ||||||||||
| Fixed-Income VaR | 11.2 | 20.1 | 38.9 | 16.9 | ||||||||||||||
| Equity VaR | 2.0 | 4.0 | 11.3 | 3.5 | ||||||||||||||
| FX VaR | 3.4 | 6.8 | 13.7 | 4.7 | ||||||||||||||
USA | VaR Total | 0.6 | 1.7 | 3.3 | 0.9 | |||||||||||||
| Diversification effect | 0.0 | (0.6 | ) | (2.6 | ) | (0.8 | ) | |||||||||||
| Fixed-Income VaR | 0.5 | 1.5 | 3.3 | 0.8 | ||||||||||||||
| Equity VaR | 0.0 | 0.2 | 1.6 | 0.3 | ||||||||||||||
| FX VaR | 0.1 | 0.5 | 2.5 | 0.5 | ||||||||||||||
EUROPE | VaR Total | 6.3 | 12.0 | 23.2 | 18.3 | |||||||||||||
| Diversification effect | (3.1 | ) | (6.0 | ) | (13.1 | ) | (4.6 | ) | ||||||||||
| Fixed-Income VaR | 4.7 | 9.3 | 18.0 | 15.6 | ||||||||||||||
| Equity VaR | 2.7 | 4.1 | 7.2 | 3.0 | ||||||||||||||
| FX VaR | 1.0 | 4.7 | 14.9 | 4.2 | ||||||||||||||
221
Table of Contents
| • | Geographic distribution |
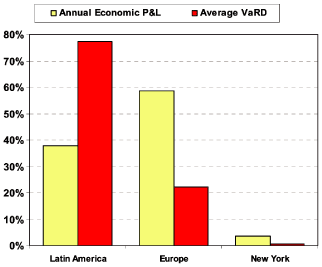
222
Table of Contents
| Minimum | Average | Maximum | Last | |||||||||||||
TOTAL | 19.6 | 28.9 | 56.1 | 27.7 | ||||||||||||
EUROPE | 6.3 | 12.0 | 23.2 | 18.3 | ||||||||||||
USA | 0.6 | 1.7 | 3.3 | 0.9 | ||||||||||||
LATIN AMERICA | 12.9 | 22.3 | 48.4 | 15.2 | ||||||||||||
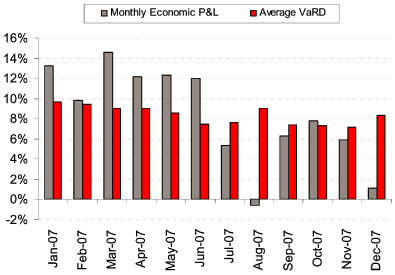
223
Table of Contents
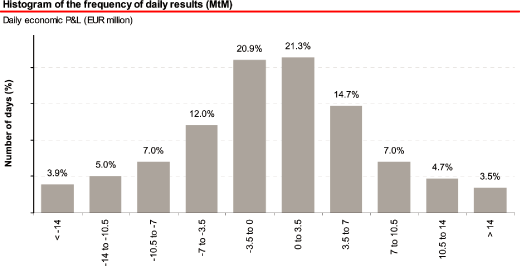
224
Table of Contents
| € million | Fixed income | Equities | Exchange rate | Volatility | Total | |||||||||||||||
Total Trading | -19.2 | -5.7 | -35.4 | 7.4 | -52.9 | |||||||||||||||
| Europe | 14.9 | 0.4 | -2.6 | 7.3 | 20.0 | |||||||||||||||
| Latin America | -36.2 | -5.5 | -34.1 | 0.1 | -75.7 | |||||||||||||||
| USA (New York) | 2.0 | -0.5 | 1.4 | 0.0 | 2.9 | |||||||||||||||
| 3. | Includes the total balance sheet except for trading portfolios |
225
Table of Contents
| Not | Up to 1 | More than 5 | ||||||||||||||||||||||
| €million | sensitive | year | 1-3 years | 3-5 years | years | TOTAL | ||||||||||||||||||
| Money and securities market | — | 28,444 | 111 | 2,723 | 8,824 | 40,102 | ||||||||||||||||||
| Loans | — | 114,366 | 24,309 | 3,048 | 2,380 | 144,103 | ||||||||||||||||||
| Permanent equity stakes | 71,956 | — | — | — | — | 71,956 | ||||||||||||||||||
| Other assets | 6,120 | 33,105 | — | — | — | 39,225 | ||||||||||||||||||
Total assets | 78,076 | 175,915 | 24,420 | 5,771 | 11,204 | 295,386 | ||||||||||||||||||
| Money market | — | 28,253 | 10 | 2 | — | 28,266 | ||||||||||||||||||
| Customer deposits | — | 16,601 | 10,139 | 12,562 | 13,121 | 52,423 | ||||||||||||||||||
| Debt Issues and securitizations | — | 120,565 | 113 | 1,107 | 245 | 122,231 | ||||||||||||||||||
| Shareholders’ equity and other liabilities | 59,931 | 38,527 | 1,089 | 831 | 1,695 | 102,074 | ||||||||||||||||||
Total liabilities | 59,931 | 203,946 | 11,552 | 14,502 | 15,062 | 304,994 | ||||||||||||||||||
Balance sheet Gap | 18,144 | (28,032 | ) | 12,869 | (8,732 | ) | (3,858 | ) | (9,608 | ) | ||||||||||||||
| Off-balance sheet structural Gap | — | 10,172 | 2,465 | 731 | (494 | ) | 12,873 | |||||||||||||||||
Total structural Gap | 18,144 | (17,859 | ) | 15,333 | (8,001 | ) | (4,352 | ) | 3,265 | |||||||||||||||
Accumulated Gap | — | (17,859 | ) | (2,526 | ) | (10,527 | ) | (14,879 | ) | — | ||||||||||||||
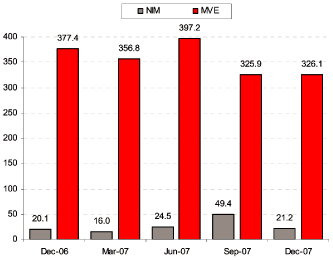
226
Table of Contents
| �� | ||||||||||||||||||||||||
| Gaps in Local Currency | TOTAL | 0-6 months | 6-12 months | 1-3 years | > 3 years | Not sensitive | ||||||||||||||||||
Assets | 104,788 | 57,014 | 3,957 | 14,557 | 14,937 | 14,208 | ||||||||||||||||||
Liabilities | 105,690 | 66,334 | 4,285 | 12,320 | 2,841 | 19,910 | ||||||||||||||||||
Off-balance Sheet | 77 | (806 | ) | 6,047 | (7,125 | ) | 1,435 | 526 | ||||||||||||||||
Gap | (825 | ) | (10,232 | ) | 7,096 | (5,381 | ) | 12,967 | (5,274 | ) | ||||||||||||||
| Gaps in Foreign Currency | TOTAL | 0-6 months | 6-12 months | 1-3 years | > 3 years | Not sensitive | ||||||||||||||||||
Assets | 23,636 | 13,984 | 2,165 | 1,985 | 3,504 | 1,998 | ||||||||||||||||||
Liabilities | 22,734 | 14,041 | 3,497 | 1,807 | 2,680 | 708 | ||||||||||||||||||
Off-balance Sheet | (77 | ) | (1,330 | ) | (11 | ) | 221 | 1,262 | (219 | ) | ||||||||||||||
Gap | 825 | (1,387 | ) | (1,343 | ) | 399 | 2,086 | 1,071 | ||||||||||||||||
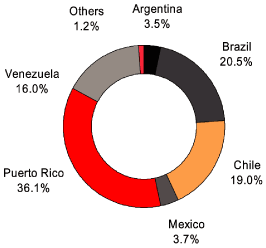
227
Table of Contents
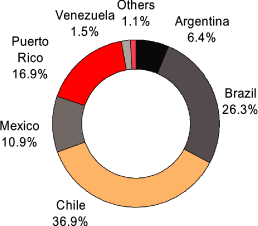
| • | €44,500 million of loans were securitized, of which€30,250 million were placed in the market. In the secondary market€1,000 million of securitization bonds (AAA and AA),€96.5 million (BBB) and€14.6 million (BB) were sold; | ||
| • | hedging of securitization bonds took place (€2,400 million); and | ||
| • | in the second half of 2007, due to the deterioration in the credit market,€2,500 million of AAA securitization bonds were re-purchased, as the high spreads did not justify their underlying risk. |
228
Table of Contents
| • | Comfortable structural liquidity position. Santander is fundamentally a retail bank, therefore customer deposits are the main source in its financing structure of liquidity. These deposits added to capital and the rest of similar instruments enable us to cover most of the Group’s liquidity needs, making financing from the wholesale markets small. | ||
| • | In Latin America, deposits are larger in volume than loans which means that financing in the wholesale markets is in practice residual, and principally for reasons of presence and diversification. For the rest of the Group (denominated as “area of convertible currencies”), the deposits added to the permanent funds in the balance sheet (capital and similar liabilities) cover around three-quarters of loans net of securitizations. In convertible currencies, only one-quarter of unsecuritized loans are financed via the wholesale markets with medium- and long-term debt with an adequate structure. | ||
| • | Ample access to the wholesale liquidity markets on the basis of high short-term and long-term ratings. In the last two years, all of the rating agencies have upgraded Santander’s long-term rating, bringing it to AA or higher (Moody’s rating is Aa1, equivalent to AA+; the other three put it at AA) at the end of 2007 and each with stable outlook. | ||
| • | Diversification of markets and instruments to obtain liquidity. The Group has an active presence in a broad and diversified series of financing markets, limiting dependence on specific markets and maintaining available a comfortable capacity of recourse to the markets. This enables us to have an adequate structure of medium-term and long-term issues, with reduced recourse to short-term wholesale financing. At the end of 2007, commercial paper and notes only accounted for 7% of total wholesale financing. This structure is based on securitizations (around one-third of the total) and a portfolio of medium-term and long-term issues (around 60% of the total), well diversified by products and with an average maturity of 4.4 years. | ||
| • | High capacity to obtain liquidity on the balance sheet. The Group maintains on its balance sheet a diversified portfolio of liquid assets, or those that can become so in the short term appropriate to their positions. In addition, the Group has a large amount of assets available in the European Central Bank that can be discounted (around€30 billion on average in the first quarter of 2008). | ||
| • | Independence of the subsidiaries in financing within a centralized management. The most important subsidiaries, except for Santander Consumer Finance, must obtain their financing in wholesale markets in accordance with their needs, establishing their own liquidity plans and contingencies, without recourse to lines from the parent Bank to finance their activity. |
| • | A liquidity plan is drawn up every year, based on the financing needs resulting from the business budgets. On the basis of these needs, and bearing in mind the limits on recourse to short-term markets, the annual issuance and securitization plan is established. | ||
| • | During the year the evolution of financing needs is regularly monitored, giving rise to changes to the plan. | ||
| • | Control and analysis of liquidity risk is also very important. Its first objective is to ensure that the Group maintains acceptable levels of liquidity to cover its financing needs in the short and long-term under normal market situations. Various measures are used to control the balance sheet such as the liquidity gap and liquidity ratios. |
229
Table of Contents
230
Table of Contents
| • | The existence of an appropriate valuation model to monitor the value of each exposure: Mark-to-Market, Mark-to-Model or Mark-to-Liquidity; | ||
| • | The availability in the market of the necessary inputs to apply this valuation model; | ||
| • | The availability of duly adapted and appropriate systems to calculate and monitor each day the results, positions and risks of the new operations raised; and | ||
| • | The degree of liquidity of the product or underlying assets, in order to make their coverage possible when deemed necessary. |
| • | CDOs and other complex credit instruments: the Group’s total exposure to these instruments is small (less than€25 million). | ||
| • | Hedge funds: the main exposure is via the financing to these funds (counterparty risk). This exposure, however, is not significant (€1,906 million at the end of the year, of which€101 million was in trading portfolios and the rest in investment portfolios) and with low levels of Loan-to-Value of around 45% (collateral of€4,227 million at the end of the year).The risk with this type of counterparty is analyzed case-by-case, establishing the percentages of collateral on the basis of the features and assets of each fund. | ||
| • | Investments in structured investment vehicles, SIV-Lites and other investment vehicles with high leverage: no exposure. | ||
| • | Conduits: at the end of 2007, the Group had two conduits promoted in the past, which have always been in the Group’s perimeter of consolidation: |
| • | Monolines: Santander’s exposure to these bond insurance companies at the end of 2007 was less than€350 million, mainly concentrated in the indirect exposure (€342 million), by virtue of the guarantee provided for this type of entity to various financing operations or traditional securitization. The exposure in this case is double default; the primary underlying assets are of high credit quality (mostly AA). The small remainder is direct exposure, for example, via purchase of protection against the risk of non-payment by some of these insurers via a credit default swap. |
231
Table of Contents
| Dec-07 | ||||||||||||||||||||
| Dec-06 | Low | Average | High | Period End | ||||||||||||||||
TOTAL | 353.3 | 397.1 | 484.0 | 586.5 | 586.5 | |||||||||||||||
| Trading | 36.8 | 23.9 | 30.7 | 36.4 | 25.2 | |||||||||||||||
| Non-Trading | 351.3 | 395.8 | 483.1 | 585.8 | 585.8 | |||||||||||||||
| Diversification Effect | (34.9 | ) | (22.6 | ) | (29.8 | ) | (35.7 | ) | (24.5 | ) | ||||||||||
| Dec-07 | ||||||||||||||||||||
| Dec-06 | Low | Average | High | Period End | ||||||||||||||||
Interest Rate Risk | ||||||||||||||||||||
| Trading | 29.7 | 20.0 | 25.9 | 30.7 | 22.2 | |||||||||||||||
| Non-Trading | 114.4 | 68.3 | 81.4 | 96.7 | 72.1 | |||||||||||||||
| Diversification Effect | (25.9 | ) | (17.1 | ) | (21.9 | ) | (26.0 | ) | (18.8 | ) | ||||||||||
TOTAL | 118.2 | 71.2 | 85.5 | 101.5 | 75.4 | |||||||||||||||
232
Table of Contents
| Dec-07 | ||||||||||||||||||||
| Dec-06 | Low | Average | High | Period End | ||||||||||||||||
Exchange Rate Risk | ||||||||||||||||||||
| Trading | 14.7 | 5.4 | 10.3 | 14.8 | 10.6 | |||||||||||||||
| Non-Trading | 90.3 | 89.2 | 102.7 | 157.8 | 157.8 | |||||||||||||||
| Diversification Effect | (13.5 | ) | (5.3 | ) | (9.7 | ) | (14.1 | ) | (10.3 | ) | ||||||||||
TOTAL | 91.5 | 89.3 | 103.2 | 158.5 | 158.1 | |||||||||||||||
| Dec-07 | ||||||||||||||||||||
| Dec-06 | Low | Average | High | Period End | ||||||||||||||||
Equity Price Risk | ||||||||||||||||||||
| Trading | 5.0 | 3.7 | 5.8 | 12.4 | 5.1 | |||||||||||||||
| Non-Trading | 277.6 | 297.8 | 394.3 | 469.7 | 411.3 | |||||||||||||||
| Diversification Effect | (5.0 | ) | (3.7 | ) | (5.8 | ) | (12.2 | ) | (5.0 | ) | ||||||||||
TOTAL | 277.7 | 297.8 | 394.4 | 469.9 | 411.3 | |||||||||||||||
| Dec-07 | ||||||||||||||||||||
| Dec-06 | Low | Average | High | Period End | ||||||||||||||||
Trading | ||||||||||||||||||||
| Interest Rate | 29.7 | 20.0 | 25.9 | 30.7 | 22.2 | |||||||||||||||
| Exchange Rate | 14.7 | 5.4 | 10.3 | 14.8 | 10.6 | |||||||||||||||
| Equity | 5.0 | 3.7 | 5.8 | 12.4 | 5.1 | |||||||||||||||
TOTAL | 36.8 | 23.9 | 30.7 | 36.4 | 25.2 | |||||||||||||||
Non-Trading Interest Rate | ||||||||||||||||||||
| Interest Rate | 114.4 | 68.3 | 81.4 | 96.7 | 72.1 | |||||||||||||||
Non-Trading Foreign Exchange | ||||||||||||||||||||
| Exchange Rate | 90.3 | 89.2 | 102.7 | 157.8 | 157.8 | |||||||||||||||
| �� | ||||||||||||||||||||
Non-Trading Equity | ||||||||||||||||||||
| Equity | 277.6 | 297.8 | 394.3 | 469.7 | 411.3 | |||||||||||||||
TOTAL | 353.3 | 397.1 | 484.0 | 586.5 | 586.5 | |||||||||||||||
| Interest Rate | 118.2 | 71.2 | 85.5 | 101.5 | 75.4 | |||||||||||||||
| Exchange Rate | 91.5 | 89.3 | 103.2 | 158.5 | 158.1 | |||||||||||||||
| Equity | 277.7 | 297.8 | 394.4 | 469.9 | 411.3 | |||||||||||||||
233
Table of Contents
234
Table of Contents
235
Table of Contents
| • | Pertain to the maintenance of records that in reasonable detail accurately and fairly reflect the transactions and dispositions of our assets; | ||
| • | Provide reasonable assurance that transactions are recorded as necessary to permit preparation of financial statements in accordance with generally accepted accounting principles, and that our receipts and expenditures are being made only in accordance with authorizations of our management and directors; and | ||
| • | Provide reasonable assurance regarding prevention or timely detection of unauthorized acquisition, use or disposition of our assets that could have a material effect on the financial statements. |
236
Table of Contents
Banco Santander, S.A.:
Madrid — Spain
June 27, 2008
237
Table of Contents
| 2007 | 2006 | 2005 | ||||||||||
| (in millions of euros) | ||||||||||||
| Audit Fees (1) | 15.9 | 15.6 | 15.8 | |||||||||
| Audit Related Fees (2) | 11.1 | 11.9 | 8.5 | |||||||||
| Tax Fees (3) | 2.5 | 1.9 | 1.4 | |||||||||
| All Other Fees (4) | 5.3 | 5.5 | 4.5 | |||||||||
| 34.8 | 34.9 | 30.2 | ||||||||||
| (1) | Fees for annual company audits of the Group. | |
| (2) | In recent years, in addition to the audits of financial statements, the internal control audit was performed in accordance with the requirements of the US Sarbanes-Oxley Act (for€4.8 million in 2007,€5.6 million in 2006 and€5.4 million in 2005) and other reports were prepared in accordance with the requirements of the legal and tax regulations issued by the national supervisory authorities of the countries in which the Group operates, including most notably the six-monthly audit reports and those which comply with the US SEC requirements (other than Sarbanes-Oxley Act) totaling€3.7 million,€3.9 million and€3.9 million in 2007, 2006 and 2005, respectively. Additionally, in 2007€1.4 million were paid in connection with the work relating to the Group’s adaptation to the new capital regulations (Basel — 2006:€1.0 million); while due diligence review and other corporate transaction services totaled€3.7 million (2006:€3.3 million; 2005:€0.6 million). | |
| (3) | Fees for professional services rendered for tax compliance, tax advice, and tax planning in the countries in which the Group operates. | |
| (4) | Other non-attest services provided by the Group’s auditors to various Group companies for€5.3 million in 2007,€5.5 million in 2006 and€4.5 million in 2005. |
238
Table of Contents
| (d) Maximum number (or | ||||||||||||||||
| (b) Average | (c) Total number of shares (or | approximate dollar value) of | ||||||||||||||
| (a) Total number of | price paid per | units) purchased as part of | shares (or units) that may yet | |||||||||||||
| shares (or units) | share (or | publicly announced plans or | be purchased under the plans | |||||||||||||
| 2007 | purchased | unit) | programs | or programs | ||||||||||||
| January | 57,718,813 | €14.37 | — | — | ||||||||||||
| February | 39,452,454 | €14.37 | — | — | ||||||||||||
| March | 30,707,371 | €13.23 | — | — | ||||||||||||
| April | 59,184,061 | €13.41 | — | — | ||||||||||||
| May | 51,948,497 | €13.27 | — | — | ||||||||||||
| June | 48,706,259 | €13.83 | — | — | ||||||||||||
| July | 73,672,787 | €13.73 | — | — | ||||||||||||
| August | 50,672,621 | €13.49 | — | — | ||||||||||||
| September | 43,275,561 | €13.18 | — | — | ||||||||||||
| October | 50,234,083 | €14.12 | — | — | ||||||||||||
| November | 57,722,035 | €14.58 | — | — | ||||||||||||
| December | 47,844,360 | €14.59 | — | — | ||||||||||||
Total | 611,138,902 | |||||||||||||||
239
Table of Contents
| Page | ||||
| F-1 | ||||
| F-2 | ||||
| F-3 | ||||
| F-4 | ||||
| F-5 | ||||
| F-7 | ||||
| Exhibit | ||
| Number | Description | |
| 1.1 | By-laws (Estatutos) of Banco Santander, S.A., as amended. | |
| 1.2 * | By-laws (Estatutos) of Banco Santander, S.A., as amended. | |
| 1.3 | By-laws (Estatutos) of Banco Santander, S.A., as amended (English translation of By-laws set forth in Exhibit 1.1 hereto). | |
| 1.4 | By-laws (Estatutos) of Banco Santander, S.A., as amended (English translation of the By-laws set forth in Exhibit 1.2 hereto). | |
| 4.1 ** | Consortium and Shareholders’ Agreement dated May 28, 2007, among the Royal Bank of Scotland Group plc, Banco Santander Central Hispano, S.A., Fortis SA/N.V. and RFS Holdings B.V. (incorporated by reference to Exhibit 4.1 to our Annual Report on Form 20-F for the year ended December 31, 2006, filed with the Securities and Exchange Commission on July 2, 2007). | |
| 8.1 | List of Subsidiaries (incorporated by reference as Exhibits I, II and III of our Financial Statements filed with this Form 20-F). | |
| 12.1 | Section 302 Certification by the Chief Executive Officer | |
| 12.2 | Section 302 Certification by the Chief Financial Officer | |
| 12.3 | Section 302 Certification by the Chief Accounting Officer | |
| 13.1 | Section 906 Certification by the Chief Executive Officer, the Chief Financial Officer and the Chief Acounting Officer | |
| 15.1 | Consent of Deloitte, S.L. | |
| 15.2 | Report submitted by the Board of Directors to the General Shareholders’ Meeting describing the By-laws amendments |
| * | These By-laws will go into effect (and replace the By-laws set forth in Exhibit 1.1) upon the granting of the necessary authorization by the Spanish Minister of Economy and Finance and their subsequent filing with the office of the Mercantile Registry in Santander. | |
| ** | Pursuant to a request for confidential treatment filed with the Securities and Exchange Commission, the confidential portions of this exhibit have been omitted and filed separately with the Securities and Exchange Commission. |
240
Table of Contents
| BANCO SANTANDER, S.A. | ||||
| By: | /s/ José Antonio Álvarez | |||
| Name: | José Antonio Álvarez | |||
| Title: | Chief Financial Officer | |||
Table of Contents
| Page | ||||
| F-1 | ||||
| F-2 | ||||
| F-3 | ||||
| F-7 | ||||
Table of Contents
To the Board of Directors and Shareholders of
Banco Santander, S.A.:
We have audited the accompanying consolidated balance sheets of Banco Santander, S.A. (the “Bank”) and Companies composing, together with the Bank, the Santander Group (the “Group”), as of December 31, 2007, 2006 and 2005, and the related consolidated income statements, statements of changes in equity (recognized income and expense), and cash flow statements for the years then ended. These consolidated financial statements are the responsibility of the Bank’s directors. Our responsibility is to express an opinion on these consolidated financial statements based on our audits.
We conducted our audits in accordance with the standards of the Public Company Accounting Oversight Board (United States). Those standards require that we plan and perform the audit to obtain reasonable assurance about whether the consolidated financial statements are free of material misstatement. An audit includes examining, on a test basis, evidence supporting the amounts and disclosures in the consolidated financial statements. An audit also includes assessing the accounting principles used and significant estimates made by management, as well as evaluating the overall financial statements presentation. We believe that our audits provide a reasonable basis for our opinion.
In our opinion, the consolidated financial statements referred to above present fairly, in all material respects, the financial position of Banco Santander, S.A. and Companies composing the Santander Group as of December 31, 2007, 2006 and 2005, and the results of their operations and their cash flows for the years then ended, in conformity with International Financial Reporting Standards, as adopted by the European Union (“EU-IFRS”) required to be applied under Bank of Spain’s Circular 4/2004 (Note 1.b).
The EU-IFRS required to be applied under Bank of Spain’s Circular 4/2004 vary in certain significant respects from accounting principles generally accepted in the United States of America (U.S. GAAP). Information relating to the nature and effect of such differences is presented in Notes 57 and 58 to the consolidated financial statements.
We have also audited, in accordance with the standards of the Public Company Accounting Oversight Board (United States), the Group’s internal control over financial reporting as of December 31, 2007, based on the criteria established inInternal Control–Integrated Frameworkissued by the Committee of Sponsoring Organizations of the Treadway Commission and our report dated June 27, 2008 expressed an unqualified opinion on the Group’s internal control over financial reporting.
/s/ DELOITTE, S.L.
Deloitte, S.L.
Madrid-Spain
June 27, 2008
F-1
Table of Contents
CONSOLIDATED BALANCE SHEETS AT DECEMBER 31, 2007, 2006 AND 2005 (NOTES 1 to 4)
(Thousands of Euros)
| Note | 2007 | 2006 | 2005 | |||||||||||||
| ASSETS | ||||||||||||||||
| CASH AND BALANCES WITH CENTRAL BANKS | 31,062,775 | 13,835,149 | 16,086,458 | |||||||||||||
| FINANCIAL ASSETS HELD FOR TRADING: | 158,800,435 | 170,422,722 | 154,207,859 | |||||||||||||
Loans and advances to credit institutions | 6 | 12,294,559 | 14,627,738 | 10,278,858 | ||||||||||||
Loans and advances to customers | 10 | 23,704,481 | 30,582,982 | 26,479,996 | ||||||||||||
Debt instruments | 7 | 66,330,811 | 76,736,992 | 81,741,944 | ||||||||||||
Other equity instruments | 8 | 9,744,466 | 13,490,719 | 8,077,867 | ||||||||||||
Trading derivatives | 9 | 46,726,118 | 34,984,291 | 27,629,194 | ||||||||||||
| OTHER FINANCIAL ASSETS AT FAIR VALUE THROUGH PROFIT OR LOSS: | 24,829,441 | 15,370,682 | 48,862,267 | |||||||||||||
Loans and advances to credit institutions | 6 | 6,865,073 | 185,485 | 2,428,663 | ||||||||||||
Loans and advances to customers | 10 | 8,021,623 | 7,972,544 | 6,431,197 | ||||||||||||
Debt instruments | 7 | 7,072,423 | 4,500,220 | 9,699,237 | ||||||||||||
Other equity instruments | 8 | 2,870,322 | 2,712,433 | 30,303,170 | ||||||||||||
| AVAILABLE-FOR-SALE FINANCIAL ASSETS: | 44,348,907 | 38,698,299 | 73,944,939 | |||||||||||||
Debt instruments | 7 | 34,187,077 | 32,727,454 | 68,054,021 | ||||||||||||
Other equity instruments | 8 | 10,161,830 | 5,970,845 | 5,890,918 | ||||||||||||
| LOANS AND RECEIVABLES: | 579,530,145 | 544,048,823 | 459,783,749 | |||||||||||||
Loans and advances to credit institutions | 6 | 31,759,867 | 45,361,315 | 47,065,501 | ||||||||||||
Money market operations through counterparties | — | 200,055 | — | |||||||||||||
Loans and advances to customers | 10 | 533,750,907 | 484,790,338 | 402,917,602 | ||||||||||||
Debt instruments | 7 | 1,668,339 | 621,770 | 171,203 | ||||||||||||
Other financial assets | 24 | 12,351,032 | 13,075,345 | 9,629,443 | ||||||||||||
| HELD-TO-MATURITY INVESTMENTS | — | — | — | |||||||||||||
| CHANGES IN THE FAIR VALUE OF HEDGED ITEMS IN PORTFOLIO HEDGES OF INTEREST RATE RISK | 36 | 297,131 | (259,254 | ) | — | |||||||||||
| HEDGING DERIVATIVES | 11 | 3,063,169 | 2,987,964 | 4,126,104 | ||||||||||||
| NON-CURRENT ASSETS HELD FOR SALE: | 10,156,429 | 327,384 | 336,324 | |||||||||||||
Loans and advances to credit institutions | 5,596 | — | — | |||||||||||||
Loans and advances to customers | 14,499 | — | — | |||||||||||||
Debt instruments | 20,321 | — | — | |||||||||||||
Equity instruments | 12 | 9,025,936 | — | — | ||||||||||||
Tangible assets | 12 | 1,061,743 | 327,384 | 336,324 | ||||||||||||
Other assets | 28,334 | — | — | |||||||||||||
| INVESTMENTS: | 15,689,127 | 5,006,109 | 3,031,482 | |||||||||||||
Associates | 13 | 15,689,127 | 5,006,109 | 3,031,482 | ||||||||||||
| INSURANCE CONTRACTS LINKED TO PENSIONS | 14 | 2,525,550 | 2,604,535 | 2,676,365 | ||||||||||||
| REINSURANCE ASSETS | 15 | 309,774 | 261,873 | 2,387,701 | ||||||||||||
| TANGIBLE ASSETS: | 9,459,033 | 10,110,996 | 9,993,207 | |||||||||||||
Property, plant and equipment for own use | 16 | 4,287,612 | 5,284,177 | 5,204,931 | ||||||||||||
Investment property | 16 | 460,725 | 374,547 | 667,449 | ||||||||||||
Other assets leased out under an operating lease | 16 | 4,710,696 | 4,452,272 | 4,120,827 | ||||||||||||
Memorandum item: Acquired under a finance lease | 394,187 | 200,838 | 83,459 | |||||||||||||
| INTANGIBLE ASSETS: | 16,033,042 | 16,956,841 | 16,229,271 | |||||||||||||
Goodwill | 17 | 13,830,708 | 14,512,735 | 14,018,245 | ||||||||||||
Other intangible assets | 17 | 2,202,334 | 2,444,106 | 2,211,026 | ||||||||||||
| TAX ASSETS: | 12,698,072 | 9,856,053 | 10,127,059 | |||||||||||||
Current | 1,845,310 | 699,746 | 1,217,646 | |||||||||||||
Deferred | 27 | 10,852,762 | 9,156,307 | 8,909,413 | ||||||||||||
| PREPAYMENTS AND ACCRUED INCOME | 18 | 1,749,193 | 1,581,843 | 2,969,219 | ||||||||||||
| OTHER ASSETS: | 2,362,748 | 2,062,696 | 4,344,910 | |||||||||||||
Inventories | 231,734 | 143,354 | 2,457,842 | |||||||||||||
Other | 19 | 2,131,014 | 1,919,342 | 1,887,068 | ||||||||||||
TOTAL ASSETS | 912,914,971 | 833,872,715 | 809,106,914 | |||||||||||||
MEMORANDUM ACCOUNTS: | ||||||||||||||||
| CONTINGENT LIABILITIES: | 76,924,835 | 58,769,309 | 48,453,575 | |||||||||||||
Financial guarantees | 35 | 76,316,446 | 58,205,412 | 48,199,671 | ||||||||||||
Assets earmarked for third-party obligations | 35 | 3 | 4 | 24 | ||||||||||||
Other contingent liabilities | 35 | 608,386 | 563,893 | 253,880 | ||||||||||||
| CONTINGENT COMMITMENTS: | 114,676,563 | 103,249,430 | 96,263,262 | |||||||||||||
Drawable by third parties | 35 | 102,215,927 | 91,690,396 | 77,678,333 | ||||||||||||
Other commitments | 35 | 12,460,636 | 11,559,034 | 18,584,929 | ||||||||||||
| LIABILITIES AND EQUITY | ||||||||||||||||
| FINANCIAL LIABILITIES HELD FOR TRADING | 122,753,987 | 123,996,445 | 112,466,429 | |||||||||||||
Deposits from credit institutions | 20 | 23,254,111 | 39,690,713 | 31,962,919 | ||||||||||||
Customer deposits | 21 | 27,992,480 | 16,572,444 | 14,038,543 | ||||||||||||
Marketable debt securities | 22 | 17,090,935 | 17,522,108 | 19,821,087 | ||||||||||||
Trading derivatives | 9 | 48,803,227 | 38,738,118 | 29,228,080 | ||||||||||||
Short positions | 9 | 5,613,234 | 11,473,062 | 17,415,800 | ||||||||||||
| OTHER FINANCIAL LIABILITIES AT FAIR VALUE THROUGH PROFIT OR LOSS | 33,155,674 | 12,411,328 | 11,809,874 | |||||||||||||
Deposits from credit institutions | 20 | 12,207,579 | — | — | ||||||||||||
Marketable debt securities | 22 | 10,279,037 | 12,138,249 | 11,809,874 | ||||||||||||
Customer deposits | 21 | 10,669,058 | 273,079 | — | ||||||||||||
| FINANCIAL LIABILITIES AT FAIR VALUE THROUGH EQUITY | — | — | — | |||||||||||||
| FINANCIAL LIABILITIES AT AMORTISED COST: | 652,952,005 | 605,302,821 | 565,651,643 | |||||||||||||
Deposits from central banks | 20 | 28,748,079 | 16,529,557 | 22,431,194 | ||||||||||||
Deposits from credit institutions | 20 | 48,686,254 | 56,815,667 | 94,228,294 | ||||||||||||
Money market operations through counterparties | — | — | — | |||||||||||||
Customer deposits | 21 | 317,042,764 | 314,377,078 | 291,726,737 | ||||||||||||
Marketable debt securities | 22 | 206,264,524 | 174,409,033 | 117,209,385 | ||||||||||||
Subordinated liabilities | 23 | 35,670,179 | 30,422,821 | 28,763,456 | ||||||||||||
Other financial liabilities | 24 | 16,540,205 | 12,748,665 | 11,292,577 | ||||||||||||
| CHANGES IN THE FAIR VALUE OF HEDGED ITEMS IN PORTFOLIO HEDGES OF INTEREST RATE RISK | 36 | (516,725 | ) | — | — | |||||||||||
| HEDGING DERIVATIVES | 11 | 4,134,571 | 3,493,849 | 2,310,729 | ||||||||||||
| LIABILITIES ASSOCIATED WITH NON- CURRENT ASSETS HELD FOR SALE: | 63,420 | — | 7,967 | |||||||||||||
Other liabilities | 63,420 | — | 7,967 | |||||||||||||
| LIABILITIES UNDER INSURANCE CONTRACTS | 15 | 13,033,617 | 10,704,258 | 44,672,300 | ||||||||||||
| PROVISIONS: | 16,570,899 | 19,226,513 | 19,822,990 | |||||||||||||
Provisions for pensions and similar obligations | 25 | 11,819,748 | 14,014,305 | 14,172,961 | ||||||||||||
Provisions for contingent liabilities and commitments | 25 | 636,316 | 598,735 | 487,048 | ||||||||||||
Other provisions | 25 | 4,114,835 | 4,613,473 | 5,162,981 | ||||||||||||
| TAX LIABILITIES: | 6,156,365 | 4,539,051 | 3,867,795 | |||||||||||||
Current | 2,412,133 | 761,529 | 1,100,567 | |||||||||||||
Deferred | 27 | 3,744,232 | 3,777,522 | 2,767,228 | ||||||||||||
| ACCRUED EXPENSES AND DEFERRED INCOME | 18 | 4,050,992 | 2,999,080 | 3,048,733 | ||||||||||||
| OTHER LIABILITIES: | 2,479,457 | 3,458,740 | 1,512,908 | |||||||||||||
Other | 19 | 2,479,457 | 3,458,740 | 1,512,908 | ||||||||||||
| EQUITY HAVING THE SUBSTANCE OF A FINANCIAL LIABILITY | 26 | 522,558 | 668,328 | 1,308,847 | ||||||||||||
TOTAL LIABILITIES | 855,356,820 | 786,800,413 | 766,480,215 | |||||||||||||
| MINORITY INTERESTS | 28 | 2,358,269 | 2,220,743 | 2,848,223 | ||||||||||||
| VALUATION ADJUSTMENTS: | 722,036 | 2,870,757 | 3,077,096 | |||||||||||||
Available-for-sale financial assets | 29 | 1,418,966 | 2,283,323 | 1,941,690 | ||||||||||||
Cash flow hedges | 29 | (58,655 | ) | 49,252 | 70,406 | |||||||||||
Hedges of net investments in foreign operations | 29 | 638,474 | (173,503 | ) | (384,606 | ) | ||||||||||
Exchange differences | 29 | (1,276,749 | ) | 711,685 | 1,449,606 | |||||||||||
| SHAREHOLDERS’ EQUITY: | 30 | 54,477,846 | 41,980,802 | 36,701,380 | ||||||||||||
Issued capital | 31 | 3,127,148 | 3,127,148 | 3,127,148 | ||||||||||||
Share premium | 32 | 20,370,128 | 20,370,128 | 20,370,128 | ||||||||||||
Reserves | 16,371,430 | 12,289,480 | 8,703,789 | |||||||||||||
Accumulated reserves | 33 | 15,475,993 | 11,491,670 | 8,100,140 | ||||||||||||
Reserves of entities accounted for using the equity method: | 895,437 | 797,810 | 603,649 | |||||||||||||
Associates | 33 | 895,437 | 797,810 | 603,649 | ||||||||||||
Other equity instruments: | 34 | 7,086,881 | 62,118 | 77,478 | ||||||||||||
Equity component of compound financial instruments | — | 12,118 | 34,977 | |||||||||||||
Other | 7,086,881 | 50,000 | 42,501 | |||||||||||||
Treasury shares | 34 | (192 | ) | (126,801 | ) | (53,068 | ) | |||||||||
Profit attributed to the Group | 30 | 9,060,258 | 7,595,947 | 6,220,104 | ||||||||||||
Dividends and remuneration | 30 | (1,537,807 | ) | (1,337,218 | ) | (1,744,199 | ) | |||||||||
TOTAL EQUITY | 57,558,151 | 47,072,302 | 42,626,699 | |||||||||||||
TOTAL LIABILITIES AND EQUITY | 912,914,971 | 833,872,715 | 809,106,914 | |||||||||||||
F-2
Table of Contents
FOR THE YEARS ENDED DECEMBER 31, 2007, 2006 AND 2005 (NOTES 1 to 4)
(Thousands of Euros)
| (Debit) Credit | ||||||||||||||||
| Note | 2007 | 2006 (*) | 2005 (*) | |||||||||||||
| INTEREST AND SIMILAR INCOME | 38 | 45,803,354 | 36,832,823 | 33,088,647 | ||||||||||||
| INTEREST EXPENSE AND SIMILAR CHARGES: | 39 | (30,921,470 | ) | (24,757,027 | ) | (22,764,846 | ) | |||||||||
Return on equity having the substance of a financial liability | (47,290 | ) | (85,229 | ) | (118,389 | ) | ||||||||||
Other | (30,874,180 | ) | (24,671,798 | ) | (22,646,457 | ) | ||||||||||
| INCOME FROM EQUITY INSTRUMENTS | 40 | 413,242 | 404,000 | 335,576 | ||||||||||||
NET INTEREST INCOME | 15,295,126 | 12,479,796 | 10,659,377 | |||||||||||||
| SHARE OF RESULTS OF ENTITIES ACCOUNTED FOR USING THE EQUITY METHOD: | 41 | 441,457 | 426,921 | 619,157 | ||||||||||||
Associates | 441,457 | 426,921 | 619,157 | |||||||||||||
| FEE AND COMMISSION INCOME | 42 | 9,479,986 | 8,288,580 | 7,153,947 | ||||||||||||
| FEE AND COMMISSION EXPENSE | 43 | (1,439,811 | ) | (1,264,385 | ) | (1,092,751 | ) | |||||||||
| INSURANCE ACTIVITY INCOME | 44 | 319,353 | 253,084 | 201,466 | ||||||||||||
Insurance and reinsurance premium income | 5,377,949 | 4,664,812 | 2,214,344 | |||||||||||||
Reinsurance premiums paid | (197,490 | ) | (137,129 | ) | (98,610 | ) | ||||||||||
Claims paid and other insurance-related expenses | (2,862,786 | ) | (2,049,620 | ) | (1,408,361 | ) | ||||||||||
Reinsurance income | 152,038 | 101,229 | 88,452 | |||||||||||||
Net provisions for insurance contract liabilities | (2,738,701 | ) | (2,948,083 | ) | (1,199,112 | ) | ||||||||||
Finance income | 597,503 | 840,838 | 735,830 | |||||||||||||
Finance expense | (9,160 | ) | (218,963 | ) | (131,077 | ) | ||||||||||
| GAINS/LOSSES ON FINANCIAL ASSETS AND LIABILITIES (Net): | 45 | 2,321,624 | 2,052,539 | 1,457,847 | ||||||||||||
Held for trading | 1,396,349 | 1,807,380 | 990,722 | |||||||||||||
Other financial instruments at fair value through profit or loss | 115,702 | (119,860 | ) | 6,879 | ||||||||||||
Available-for-sale financial assets | 1,051,914 | 338,263 | 532,310 | |||||||||||||
Loans and receivables | (141,995 | ) | 78,519 | 70,645 | ||||||||||||
Other | (100,346 | ) | (51,763 | ) | (142,709 | ) | ||||||||||
| EXCHANGE DIFFERENCES (net) | 46 | 650,734 | 96,635 | 76,513 | ||||||||||||
GROSS INCOME | 27,068,469 | 22,333,170 | 19,075,556 | |||||||||||||
| SALES AND INCOME FROM THE PROVISION OF NON-FINANCIAL SERVICES | 47 | 771,027 | 734,602 | 565,525 | ||||||||||||
| COST OF SALES | 47 | (618,955 | ) | (615,689 | ) | (409,347 | ) | |||||||||
| OTHER OPERATING INCOME | 48 | 351,097 | 323,900 | 256,123 | ||||||||||||
| PERSONNEL EXPENSES | 49 | (6,551,201 | ) | (5,967,873 | ) | (5,611,308 | ) | |||||||||
| OTHER GENERAL ADMINISTRATIVE EXPENSES | 50 | (4,467,128 | ) | (4,001,298 | ) | (3,753,100 | ) | |||||||||
| DEPRECIATION AND AMORTISATION: | (1,267,880 | ) | (1,146,547 | ) | (1,013,943 | ) | ||||||||||
Tangible assets | 16 | (621,271 | ) | (628,537 | ) | (618,109 | ) | |||||||||
Intangible assets | 17 | (646,609 | ) | (518,010 | ) | (395,834 | ) | |||||||||
| OTHER OPERATING EXPENSES | 51 | (469,736 | ) | (442,525 | ) | (344,829 | ) | |||||||||
NET OPERATING INCOME | 14,815,693 | 11,217,740 | 8,764,677 | |||||||||||||
| IMPAIRMENT LOSSES (net): | (5,078,513 | ) | (2,550,570 | ) | (1,801,934 | ) | ||||||||||
Available-for-sale financial assets | 8 | (6,546 | ) | 2,869 | 110,977 | |||||||||||
Loans and receivables | 10 | (3,496,058 | ) | (2,483,862 | ) | (1,747,900 | ) | |||||||||
Non-current assets held for sale | 12 | (27,299 | ) | (48,796 | ) | (10,536 | ) | |||||||||
Investments | 13 | (363,637 | ) | (380 | ) | — | ||||||||||
Tangible assets | 16 | (1,444 | ) | (6,457 | ) | (15,090 | ) | |||||||||
Goodwill | 13 and 17 | (599,989 | ) | (12,811 | ) | — | ||||||||||
Other intangible assets | 17 | (562,883 | ) | — | (130,977 | ) | ||||||||||
Other assets | (20,657 | ) | (1,133 | ) | (8,408 | ) | ||||||||||
| PROVISIONS (net) | 25 | (706,621 | ) | (1,079,337 | ) | (1,807,381 | ) | |||||||||
| FINANCE INCOME FROM NON-FINANCIAL ACTIVITIES | 4,617 | 7,386 | 2,846 | |||||||||||||
| FINANCE EXPENSES OF NON-FINANCIAL ACTIVITIES | (3,184 | ) | (5,553 | ) | (10,709 | ) | ||||||||||
| OTHER GAINS: | 52 | 2,631,570 | 1,672,944 | 2,760,566 | ||||||||||||
Gains on disposal of tangible assets | 1,859,383 | 147,763 | 151,043 | |||||||||||||
Gains on disposal of investments | 17,408 | 273,656 | 1,306,357 | |||||||||||||
Other | 754,779 | 1,251,525 | 1,303,166 | |||||||||||||
| OTHER LOSSES: | 52 | (488,321 | ) | (267,224 | ) | (247,168 | ) | |||||||||
Losses on disposal of tangible assets | (55,275 | ) | (58,869 | ) | (70,424 | ) | ||||||||||
Losses on disposal of investments | (1,020 | ) | (1,695 | ) | (7,422 | ) | ||||||||||
Other | (432,026 | ) | (206,660 | ) | (169,322 | ) | ||||||||||
PROFIT BEFORE TAX | 11,175,241 | 8,995,386 | 7,660,897 | |||||||||||||
| INCOME TAX | 27 | (2,335,686 | ) | (2,254,598 | ) | (1,241,830 | ) | |||||||||
PROFIT FROM CONTINUING OPERATIONS | 8,839,555 | 6,740,788 | 6,419,067 | |||||||||||||
| PROFIT FROM DISCONTINUED OPERATIONS (Net) | 37 | 796,595 | 1,504,965 | 330,703 | ||||||||||||
CONSOLIDATED PROFIT FOR THE YEAR | 9,636,150 | 8,245,753 | 6,749,770 | |||||||||||||
| PROFIT ATTRIBUTED TO MINORITY INTERESTS | 28 | (575,892 | ) | (649,806 | ) | (529,666 | ) | |||||||||
PROFIT ATTRIBUTED TO THE GROUP | 9,060,258 | 7,595,947 | 6,220,104 | |||||||||||||
EARNINGS PER SHARE: | ||||||||||||||||
| From continuing operations and discontinued operations | ||||||||||||||||
Basic earnings per share (euros) | 1.4287 | 1.2157 | 0.9967 | |||||||||||||
Diluted earnings per share (euros) | 1.4139 | 1.2091 | 0.9930 | |||||||||||||
| From continuing operations | ||||||||||||||||
Basic earnings per share (euros) | 1.3170 | 1.0127 | 0.9599 | |||||||||||||
Diluted earnings per share (euros) | 1.3033 | 1.0072 | 0.9563 | |||||||||||||
| (*) | Reclassified in order to reflect the operations classified as discontinued in 2007 (see Note 37). |
F-3
Table of Contents
(Thousands of Euros)
| 2007 | 2006 | 2005 | ||||||||||
NET INCOME RECOGNISED DIRECTLY IN EQUITY: | (2,148,721 | ) | (206,339 | ) | 1,299,532 | |||||||
| Available-for-sale financial assets- | (864,357 | ) | 341,633 | 4,872 | ||||||||
Revaluation gains/losses | 825,812 | 1,663,713 | 911,814 | |||||||||
Amounts transferred to income statement | (1,583,126 | ) | (1,177,308 | ) | (883,474 | ) | ||||||
Income tax | (107,043 | ) | (144,772 | ) | (23,468 | ) | ||||||
| Cash flow hedges- | (107,907 | ) | (21,154 | ) | 72,193 | |||||||
Revaluation gains/losses | (156,313 | ) | 9,087 | 83,216 | ||||||||
Amounts transferred to income statement | (14,227 | ) | — | — | ||||||||
Income tax | 62,633 | (30,241 | ) | (11,023 | ) | |||||||
| Hedges of net investments in foreign operations- | 811,977 | 211,103 | (1,022,833 | ) | ||||||||
Revaluation gains/losses | 811,977 | 211,103 | (1,022,833 | ) | ||||||||
| Exchange differences- | (1,988,434 | ) | (737,921 | ) | 2,245,300 | |||||||
Translation gains/losses | (2,048,430 | ) | (741,085 | ) | 2,411,831 | |||||||
Amounts transferred to income statement | 59,996 | 3,164 | (166,531 | ) | ||||||||
CONSOLIDATED PROFIT FOR THE YEAR: | 9,636,150 | 8,245,753 | 6,749,770 | |||||||||
| Published consolidated profit for the year | 9,636,150 | 8,245,753 | 6,749,770 | |||||||||
| 7,487,429 | 8,039,414 | 8,049,302 | ||||||||||
TOTAL INCOME AND EXPENSE FOR THE YEAR: | ||||||||||||
| Parent | 6,911,537 | 7,389,608 | 7,519,636 | |||||||||
| Minority interests (*) | 575,892 | 649,806 | 529,666 | |||||||||
TOTAL (*) | 7,487,429 | 8,039,414 | 8,049,302 | |||||||||
| (*) | In addition, in 2007 and 2006 the net revenue recognized directly in equity relating to minority interests amounted to (€175) million and (€121) million, respectively. |
(consolidated statement of recognized income and expense) for the year ended December 31, 2007.
F-4
Table of Contents
CONSOLIDATED CASH FLOW STATEMENTS
FOR THE YEARS ENDED DECEMBER 31, 2007, 2006 AND 2005 (NOTES 1 to 4)
(Thousands of Euros)
| 2007 | 2006 (*) | 2005 (*) | ||||||||||
1. CASH FLOWS FROM OPERATING ACTIVITIES | ||||||||||||
| Consolidated profit for the year | 9,636,150 | 8,245,753 | 6,749,770 | |||||||||
| Adjustments to profit- | 9,952,115 | 8,183,303 | 5,065,489 | |||||||||
Depreciation of tangible assets | 621,271 | 628,537 | 618,109 | |||||||||
Amortization of intangible assets | 646,609 | 518,010 | 395,834 | |||||||||
Impairment losses (net) | 5,702,733 | 2,550,570 | 1,801,934 | |||||||||
Net provisions for insurance contract liabilities | 2,738,701 | 2,948,083 | 1,199,112 | |||||||||
Provisions (net) | 706,621 | 1,079,337 | 1,807,381 | |||||||||
Gains/losses on disposal of tangible assets | (1,804,108 | ) | (88,894 | ) | (80,619 | ) | ||||||
Gains/losses on disposal of investments | (16,388 | ) | (271,961 | ) | (1,298,935 | ) | ||||||
Share of results of entities accounted for using the equity method | (294,809 | ) | (426,921 | ) | (619,157 | ) | ||||||
Other non-monetary items(and monetary items related to discontinuous operations) | (684,201 | ) | (1,008,056 | ) | — | |||||||
Taxes | 2,335,686 | 2,254,598 | 1,241,830 | |||||||||
Of which paid | 3,181,098 | 949,050 | 1,036,379 | |||||||||
| 19,588,265 | 16,429,056 | 11,815,259 | ||||||||||
Net increase/decrease in operating assets: | (48,589,631 | ) | (72,431,214 | ) | (142,040,315 | ) | ||||||
| Financial assets held for trading- | 11,289,111 | (17,673,307 | ) | (42,451,923 | ) | |||||||
Loans and advances to credit institutions | 2,333,179 | (4,346,626 | ) | 2,599,313 | ||||||||
Loans and advances to customers | 6,878,501 | (4,120,763 | ) | (8,972,411 | ) | |||||||
Debt instruments | 10,180,799 | 5,004,952 | (25,872,315 | ) | ||||||||
Other equity instruments | 3,640,211 | (5,412,852 | ) | (3,658,529 | ) | |||||||
Trading derivatives | (11,743,579 | ) | (8,798,018 | ) | (6,547,981 | ) | ||||||
| Other financial assets at fair value through profit or loss- | 3,578,501 | (1,385,171 | ) | (3,103,172 | ) | |||||||
Loans and advances to credit institutions | 6,471,028 | (662,145 | ) | 4,095,407 | ||||||||
Loans and advances to customers | (49,079 | ) | (1,541,615 | ) | (1,139,646 | ) | ||||||
Debt instruments | (2,572,203 | ) | (1,487,469 | ) | 9,933,721 | |||||||
Other equity instruments | (271,245 | ) | 2,306,058 | (15,992,654 | ) | |||||||
| Available-for-sale financial assets- | (6,424,418 | ) | 35,824,761 | (28,558,595 | ) | |||||||
Debt instruments | (1,507,435 | ) | 35,324,083 | (31,237,853 | ) | |||||||
Other equity instruments | (4,916,983 | ) | 500,678 | 2,679,258 | ||||||||
| Loans and receivables- | (53,673,405 | ) | (85,625,778 | ) | (67,542,207 | ) | ||||||
Loans and advances to credit institutions | 357,129 | 1,063,273 | (8,087,968 | ) | ||||||||
Money market operations through counterparties | 200,055 | (200,055 | ) | 3,907,905 | ||||||||
Loans and advances to customers | (53,908,199 | ) | (82,610,198 | ) | (58,557,032 | ) | ||||||
Debt instruments | (1,046,569 | ) | (461,403 | ) | (171,203 | ) | ||||||
Other financial assets | 724,179 | (3,417,395 | ) | (4,633,909 | ) | |||||||
| Other operating assets | (3,359,420 | ) | (3,571,719 | ) | (384,418 | ) | ||||||
Net increase/decrease in operating liabilities: | 23,791,209 | 3,861,319 | 95,919,375 | |||||||||
| Financial liabilities held for trading- | (9,059,282 | ) | 15,327,711 | 14,736,090 | ||||||||
Deposits from credit institutions | (16,436,602 | ) | 7,727,794 | 6,738,176 | ||||||||
Customer deposits | 11,420,036 | 2,533,901 | (6,502,682 | ) | ||||||||
Marketable debt securities | (8,247,997 | ) | 1,498,716 | 1,825,604 | ||||||||
Trading derivatives | 10,065,109 | 9,510,038 | 3,984,312 | |||||||||
Short positions | (5,859,828 | ) | (5,942,738 | ) | 8,690,680 | |||||||
| Other financial liabilities at fair value through profit or loss- | (3,021,055 | ) | (5,381,405 | ) | 555,299 | |||||||
Deposits from credit institutions | (6,071,507 | ) | 822,550 | — | ||||||||
Customer deposits | 3,050,452 | 282,806 | — | |||||||||
Marketable debt securities | — | (6,486,761 | ) | 555,299 | ||||||||
| Financial liabilities at amortized cost- | 41,805,727 | (4,453,117 | ) | 82,195,979 | ||||||||
Deposits from central banks | 12,218,526 | (5,901,637 | ) | 14,363,334 | ||||||||
Deposits from credit institutions | 10,149,673 | (36,075,478 | ) | 43,770,558 | ||||||||
Money market operations through counterparties | — | — | (2,499,000 | ) | ||||||||
Customer deposits | 10,011,213 | 22,733,508 | 29,056,346 | |||||||||
Marketable debt securities | 5,619,970 | 13,337,020 | (7,925,063 | ) | ||||||||
Other financial liabilities | 3,806,345 | 1,453,470 | 5,429,804 | |||||||||
| Other operating liabilities | (5,934,181 | ) | (1,631,870 | ) | (1,567,993 | ) | ||||||
Total net cash flows from operating activities (1) | (5,210,157 | ) | (52,140,839 | ) | (34,305,681 | ) | ||||||
| Of which: | ||||||||||||
| Interest and similar income collected (Note 38) | 45,237,669 | 36,412,213 | 31,326,727 | |||||||||
| Interest expense and similar charges paid (Note 39) | (29,436,256 | ) | (23,915,708 | ) | (18,819,373 | ) | ||||||
F-5
Table of Contents
CONSOLIDATED CASH FLOW STATEMENTS
FOR THE YEARS ENDED DECEMBER 31, 2007, 2006 AND 2005 (NOTES 1 to 4)
(Thousands of Euros)
| 2007 | 2006 (*) | 2005 (*) | ||||||||||
2. CASH FLOWS FROM INVESTING ACTIVITIES | ||||||||||||
| Investments- | (26,303,306 | ) | (7,546,963 | ) | (2,465,956 | ) | ||||||
| Subsidiaries, jointly controlled entities and associates (Note 13) | (12,285,132 | ) | (2,693,849 | ) | (18,479 | ) | ||||||
Tangible assets (Note 16) | (2,797,760 | ) | (3,380,790 | ) | (1,986,595 | ) | ||||||
Intangible assets (Note 17) | (1,862,422 | ) | (1,472,324 | ) | (451,089 | ) | ||||||
Other financial assets (Note 12) | (9,066,352 | ) | — | — | ||||||||
Other assets | (291,640 | ) | — | (9,793 | ) | |||||||
| Divestments- | 5,159,250 | 10,050,174 | 6,613,439 | |||||||||
Subsidiaries, jointly controlled entities and associates (Note 13) | 978,584 | 7,477,594 | 1,750,126 | |||||||||
Tangible assets (Note 16) | 3,496,430 | 1,957,246 | 2,479,579 | |||||||||
Other financial assets | — | — | 1,814,418 | |||||||||
Other assets | 684,236 | 615,334 | 569,316 | |||||||||
Total net cash flows from investing activities (2) | (21,144,056 | ) | 2,503,211 | 4,147,483 | ||||||||
3. CASH FLOWS FROM FINANCING ACTIVITIES | ||||||||||||
| Acquisition of own equity instruments (**) | (8,473,038 | ) | (73,733 | ) | — | |||||||
| Disposal of own equity instruments (**) | 8,599,647 | — | 73,432 | |||||||||
| Issuance/Redemption of other equity instruments (Note 34) | 7,024,763 | (15,360 | ) | (16,089 | ) | |||||||
| Redemption of equity having the substance of a financial liability | (94,912 | ) | (472,925 | ) | (944,968 | ) | ||||||
| Issuance of subordinated liabilities (Note 23) | 8,329,817 | 5,896,301 | 2,507,872 | |||||||||
| Redemption of subordinated liabilities (Note 23) | (2,339,981 | ) | (2,739,743 | ) | (2,410,288 | ) | ||||||
| Issuance of other long-term liabilities (Note 22) | 122,530,232 | 78,851,479 | 52,669,694 | |||||||||
| Redemption of other long-term liabilities (Note 22) | (85,674,400 | ) | (30,510,388 | ) | (14,269,479 | ) | ||||||
| Increase/Decrease in minority interests | (438,366 | ) | (124,026 | ) | 233,241 | |||||||
| Dividends paid (Note 30) | (3,456,732 | ) | (2,779,334 | ) | (2,208,518 | ) | ||||||
| Other items related to financing activities | (2,253,661 | ) | (767,419 | ) | 1,500,947 | |||||||
Total net cash flows from financing activities (3) | 43,753,369 | 47,264,852 | 37,135,844 | |||||||||
4. EFFECT OF EXCHANGE RATE CHANGES ON CASH AND CASH EQUIVALENTS (4) | (171,530 | ) | 121,467 | 307,400 | ||||||||
5. NET INCREASE/DECREASE IN CASH AND CASH EQUIVALENTS (1+2+3+4) | 17,227,626 | (2,251,309 | ) | 7,285,046 | ||||||||
Cash and cash equivalents at beginning of year | 13,835,149 | 16,086,458 | 8,801,412 | |||||||||
Cash and cash equivalents at end of year | 31,062,775 | 13,835,149 | 16,086,458 | |||||||||
| (*) | Restated in order to include the operations classified as discontinued in 2007 (see Note 37). | |
| (**) | The acquisitions and disposals of own equity instruments were presented at their net amount in 2006 and 2005. The acquisitions made in 2006 and 2005 amounted to€5,723 million and€5,073 million, respectively, and the disposals amounted to€5,649 million and€5,146 million, respectively. |
F-6
Table of Contents
for the years ended December 31, 2007, 2006 and 2005
| 1. | Introduction, basis of presentation of the consolidated financial statements and other information |
| a) | Introduction | ||
| Banco Santander, S.A. (“the Bank” or “Banco Santander”) is a private-law entity subject to the rules and regulations applicable to banks operating in Spain. The bylaws and other public information on the Bank can be consulted on the website of the Bank (www.santander.com) and at its registered office at Paseo de Pereda 9-12, Santander. | |||
| In addition to the operations carried on directly by it, the Bank is the head of a group of subsidiaries that engage in various business activities and which compose, together with it, the Santander Group (“the Group” or “the Santander Group”). Therefore, the Bank is obliged to prepare, in addition to its own individual financial statements, the Group’s consolidated financial statements, which also include the interests in joint ventures and investments in associates. | |||
| The Group’s consolidated financial statements for 2005 were approved by the shareholders at the Bank’s Annual General Meeting on June 17, 2006. The Group’s consolidated financial statements for 2006 were approved by the shareholders at the Bank’s Annual General Meeting on June 23, 2007. The 2007 consolidated financial statements of the Group and the 2007 financial statements of the Bank and of substantially all the Group companies have not yet been approved by their shareholders at the respective Annual General Meetings. However, the Bank’s Board of Directors considers that the aforementioned financial statements will be approved without any changes. |
| b) | Basis of presentation of the consolidated financial statements | ||
| Under Regulation (EC) no 1606/2002 of the European Parliament and of the Council of July 19, 2002, all companies governed by the law of an EU Member State and whose securities are admitted to trading on a regulated market of any Member State must prepare their consolidated financial statements in conformity with the International Financial Reporting Standards previously adopted by the European Union (“EU-IFRS”). Bank of Spain Circular 4/2004 of December 22, 2004 on Public and Confidential Financial Reporting Rules and Formats (“Circular 4/2004”) requires Spanish credit institutions to adapt their accounting systems to the principles derived from the adoption by the European Union of International Financial Reporting Standards. Therefore, the Group is required to prepare its consolidated financial statements for the year ended December 31, 2007 in conformity with the EU-IFRS required to be applied under Bank of Spain’s Circular 4/2004, which profit and loss account mandatory presentation excludes certain operating expenses, including various impairment and provision charges from “Net Operating Income”, and reduces “Gross Income” by certain expenses. | |||
| Under EU-IFRS financial institutions that have entity specific historical loss experience should evaluate impairment in future cash flows in a group of financial assets on the basis of such historical loss experience for assets with similar credit risk characteristics. The Group has such entity-specific historical loss experience. | |||
| The Group, in recognizing the inherent losses in such financial assets, and in contingent exposures classified as standard, has developed internal models that take into account our historical experience of impairment adjusted as appropriate for other objective observable data known at the time of assessment. | |||
| We utilize the inherent loss concept to quantify the cost of our credit risk in order to be able to incorporate such risk in the calculation of our risk adjusted return of operations. Additionally, the parameters necessary to calculate such return are used in the calculation of economic capital and, in the future, in the calculation of regulatory capital under the internal models of Basel II. |
F-7
Table of Contents
| The Bank of Spain’s Circular 4/2004 requires that the internal valuation allowance methodology described above shall be tested and validated by the Bank of Spain. The Bank of Spain has not yet verified such internal models (although it is in the process of reviewing them). The Bank of Spain’s Circular 4/2004 requires that until our internal models are so validated, the ratio of the allowance for loan losses to insolvencies incurred but not specifically identified for our Spanish operations must not be lower than would result under the application of the methodology established by the Bank of Spain, under Circular 4/2004, which is based on historical statistical data relating to the Spanish financial sector as a whole, as opposed to our specific historical loss experience (see Note 2-g). | |||
| The risk categories and the ranges of loan loss percentages that we must use to calculate the amounts needed to cover the impairment losses inherent in debt instruments and contingent exposures classified as standard, in each case for our Spanish operations, as of the balance sheet date are described in Note 2-g. | |||
| The Group’s consolidated financial statements for 2007 were prepared by the Bank’s directors (at the Board Meeting on March 24, 2008) in accordance with the EU-IFRS required to be applied under Bank of Spain’s Circular 4/2004, and applying the basis of consolidation, accounting policies and measurement bases set forth in Note 2 and, accordingly, they present fairly the Group’s equity and financial position at December 31, 2007, and the consolidated results of its operations, the changes in consolidated recognized income and expense and the consolidated cash flows in 2007. These consolidated financial statements were prepared from the individual accounting records of the Bank and of each of the companies composing the Group, and include the adjustments and reclassifications required to unify the accounting policies and measurement bases applied by the Group. | |||
| The notes to the consolidated financial statements contain supplementary information to that presented in the consolidated balance sheet, consolidated income statement, consolidated statement of recognized income and expense and consolidated cash flow statement, and provide, in a clear, relevant, reliable and comparable manner, narrative descriptions and breakdowns of these financial statements. | |||
| All accounting policies and measurement bases with a material effect on the consolidated financial statements were applied in their preparation. |
| i. | Adoption of new standards and interpretations |
Standards and interpretations in force in 2007 | |||
In 2007 the Group adoptedIFRS 7 Financial Instruments: Disclosure, which entered into force on January 1, 2007 for years beginning on or after that date, and the amendments toIAS 1 Presentation of Financial Statementsin relation to capital disclosures. | |||
Additionally, four IFRIC Interpretations became effective for the first time this year: IFRIC 7Applying the Restatement Approach under IAS 29 Financial Reporting in Hyperinflationary Economies; IFRIC 8Scope of IFRS 2; IFRIC 9Reassessment of Embedded Derivatives; and IFRIC 10Interim Financial Reporting and Impairment. The adoption of these interpretations did not have an impact on the consolidated financial statements. | |||
Standards and interpretations issued but not in force | |||
| At the date of preparation of these consolidated financial statements, the following standards and interpretations had been published by the IASB but had not yet entered into force, either because their effective date is subsequent to the date of the consolidated financial statements or because they had not yet been adopted by the European Union. The entry into force of these standards and interpretations will not have a material effect on the consolidated financial statements. |
F-8
Table of Contents
| Obligatory Application in | ||||
| the Years Beginning on | ||||
| Standards | or after: | |||
| IFRS 8 | Operating Segments | January 1, 2009 | ||
| Revision of IAS 23 (*) | Borrowing Costs | January 1, 2009 | ||
| Revision of IAS 1 (*) | Presentation of Financial Statements | January 1, 2009 | ||
| Revision of IFRS 3 (*) | Business Combinations | July 1, 2009 | ||
| Amendment to IAS 27 (*) | Consolidated and Separate Financial Statements | July 1, 2009 | ||
| Amendment to IFRS 2 (*) | Share-based Payments | January 1, 2009 | ||
| IFRIC 11 | IFRS 2 — Group and Treasure Share Transactions | March 1, 2007 | ||
| IFRIC 12 (*) | Service Concession Arrangements | January 1, 2008 | ||
| IFRIC 13 (*) | Customer Loyalty Programmes | July 1, 2009 | ||
| IFRIC 14 (*) | IAS 19 — Defined Benefit Asset | January 1, 2008 |
| (*) | Standards and interpretations not adopted by the European Union at the date of preparation of these consolidated financial statements. |
IFRS 8 Operating Segments | |||
| This standard replaces IAS 14. It requires an entity to disclose information on the financial performance of its business segments on the basis of the information used internally by management to assess the profit or loss of these segments. | |||
Revision of IAS 23 Borrowing Costs | |||
| The option of the immediate recognition as an expense of the borrowing costs relating to assets that take a substantial period of time to get ready for use or sale is eliminated. | |||
Review of IAS 1 Presentation of Financial Statements | |||
| This review affects mainly the presentation and disclosure requirements. | |||
Revision of IFRS 3 Business Combinations and Amendment to IAS 27 Consolidated and Separate Financial Statements | |||
| The revised IFRS 3 and the amendments to IAS 27 give rise to significant changes in several matters relating to the accounting for business combinations, which generally place more emphasis on the use of fair value. Since the changes are significant, set forth below are certain of these changes, merely for illustration purposes: acquisition costs, which will be expensed rather than be considered as an increase in the cost of the business combination as per the current accounting treatment; step acquisitions, in which the acquirer revalues the investment at fair value on the date on which control is obtained; or the option to measure at fair value the minority interests of the acquiree rather than measure them as the proportional part of the fair value of the net assets acquired as per the current accounting treatment. Since the standard will be applied prospectively, the business combinations already effected will not have any impact. | |||
Amendment to IFRS 2 Share-based Payment | |||
| The objective of the amendment is to clarify the concepts of vesting conditions and cancellations in share-based payments. | |||
IFRIC 11 IFRS 2 Group and Treasure Share Transactions | |||
| Treasury or group share-based payment transactions will be accounted for as equity-settled, regardless of how the equity instruments needed are obtained. | |||
IFRIC 12 Service Concession Arrangements and IFRIC 13 Customer Loyalty Programmes | |||
| Given the nature of these interpretations, their entry into force will not have any impact on the consolidated financial statements. |
F-9
Table of Contents
IFRIC 14 IAS 19 – The Limit on a Defined Benefit Asset, Minimum Funding Requirements and their Interaction | |||
| IFRIC 14 provides general guidance on how to assess the limit in IAS 19 Employee Benefits on the amount of the surplus that can be recognized as an asset. It also explains how pension assets or liabilities can be affected when there is a statutory or contractual minimum funding requirement and establishes that the entity needs to recognize an additional liability if it has a contractual obligation to make additional contributions to the plan and its capacity to recover them is restricted. The interpretation will standardize the practice and ensure that the entities recognize an asset in relation to a surplus on a consistent basis. |
| c) | Use of estimates | ||
| The consolidated results and the determination of consolidated equity are sensitive to the accounting policies, measurement bases and estimates used by the directors of the Bank in preparing the consolidated financial statements. The main accounting policies and measurement bases are set forth in Note 2. | |||
| In the consolidated financial statements estimates were occasionally made by the senior executives of the Bank and of the consolidated entities in order to quantify certain of the assets, liabilities, income, expenses and commitments reported herein. These estimates, which were made on the basis of the best information available, relate basically to the following: |
| • | The impairment losses on certain assets (Notes 6, 7, 8, 10, 12, 13, 16 and 17); | ||
| • | The assumptions used in the actuarial calculation of the post-employment benefit liabilities and commitments and other obligations (Note 25); | ||
| • | The useful life of the tangible and intangible assets (Notes 16 and 17); | ||
| • | The measurement of goodwill arising on consolidation (Note 17); and | ||
| • | The fair value of certain unquoted assets (Notes 8, 9 and 11). |
| d) | Other matters |
| i. | Disputed corporate resolutions |
| The directors of the Bank and their legal advisers consider that the objection to certain resolutions adopted by the Bank’s shareholders at the General Meetings on January 18, 2000, March 4, 2000, March 10, 2001, February 9, 2002, June 24, 2002, June 21, 2003, June 19, 2004 and June 18, 2005 will have no effect on the financial statements of the Bank and the Group. | |||
| On April 25, 2002, the Santander Court of First Instance number 1 dismissed in full the claim contesting the resolutions adopted by the shareholders at the General Meeting on January 18, 2000. The plaintiff filed an appeal against the judgment. On December 2, 2002, the Cantabria Provincial Appellate Court dismissed the appeal. A cassation appeal has been filed against the judgment of the Cantabria Provincial Appellate Court. | |||
| On November 29, 2002, the Santander Court of First Instance number 2 dismissed in full the claims contesting the resolutions adopted at the General Meeting on March 4, 2000. The plaintiffs filed an appeal against the judgment. On July 5, 2004, the Cantabria Provincial Appellate Court dismissed the appeal. One of the appellants prepared and filed an extraordinary appeal on grounds of procedural infringements and a cassation appeal against the judgment, which were not given leave to proceed by order of the Supreme Court of July 31, 2007. | |||
| On March 12, 2002, the Santander Court of First Instance number 4 dismissed in full the claims contesting the resolutions adopted at the General Meeting on March 10, 2001. The plaintiffs filed an appeal against the judgment. On April 13, 2004, the Cantabria Provincial Appellate Court dismissed the appeals. One of the appellants prepared and filed an extraordinary appeal on grounds of procedural infringements and a cassation appeal against the judgment, which were not given leave to proceed by order of the Supreme Court of November 6, 2007. | |||
| On September 9, 2002, the Santander Court of First Instance number 5 dismissed in full the claim contesting the resolutions adopted at the General Meeting on February 9, 2002. The plaintiff filed an appeal against the judgment. On January 14, 2004, the Cantabria Provincial Appellate Court dismissed the appeal. The appellant prepared and filed an extraordinary appeal on grounds of procedural infringements and a cassation appeal against the judgment, which were not given leave to proceed by order of the Supreme Court of May 8, 2007. |
F-10
Table of Contents
| On May 29, 2003, the Santander Court of First Instance number 6 dismissed in full the claim contesting the resolutions adopted at the General Meeting on June 24, 2002. The plaintiffs filed an appeal against the judgment. On November 15, 2005, the Cantabria Provincial Appellate Court dismissed the appeal in full. The appellants have prepared and filed an extraordinary appeal on grounds of procedural infringements and a cassation appeal against the judgment. | |||
| On November 23, 2007, the Santander Court of First Instance number 7 dismissed in full the claims contesting the resolutions adopted at the General Meeting on June 21, 2003. An appeal has been filed against the judgment. The Court has been notified of the recent death of one of the appellants and the appeals are currently being held in abeyance until his heirs have been identified. | |||
| On October 28, 2005, the Santander Court of First Instance number 8 dismissed in full the claims contesting the resolutions adopted at the General Meeting on June 19, 2004. The plaintiffs filed an appeal against the judgment, but the appeal was dismissed in full by the Cantabria Provincial Appellate Court. Against this judgment the plaintiffs have prepared and filed a cassation appeal and an extraordinary appeal on the grounds of procedural infringements. The cassation and extraordinary appeals for procedural infringement filed by one of the appellants were not given leave to proceed due to the death of the appellant and then non-appearance of his heirs. However, this decision has been appealed against by the legal representative of the late appellant. | |||
| On July 13, 2007, the Santander Court of First Instance number 10 dismissed in full the claims contesting the resolutions adopted at the General Meeting on June 18, 2005. An appeal has been filed against the judgment. |
| ii. | Credit assignment transactions |
| Following the investigations carried out since 1992 by the Madrid Central Examining Court number 3, and despite the fact that the Government Lawyer, as the representative of the Public Treasury, and the Public Prosecutor’s Office have repeatedly applied to have the case against the Bank and its executives dismissed and struck out, a decision was rendered on June 27, 2002 to turn the preliminary court proceedings into an “abbreviated” proceeding. The Public Prosecutor’s Office, the Bank and its executives have appealed against this decision. | |||
| On June 23, 2003, Panel Two of the Criminal Chamber of the National Appellate Court partially upheld these appeals, and explicitly recognized that the assignments of naked credit ownership were lawfully marketed and reduced the proceedings from 138 to 38 customer transactions (it should be noted that the Government Lawyer and the Public Prosecutor’s Office had also requested dismissal and strike-out of the case on grounds that no offence had been committed) with respect to which the Bank’s possible involvement continued to be alleged. | |||
| Following the submissions phase, in which the Public Prosecutor’s Office and the Government Lawyer reiterated their petition to have the proceedings dismissed and struck out, based on the class accusation filed by the Association for the Defence of Investors and Customers, on October 6, 2004 the Court ordered commencement of a trial against the Chairman of the Bank and three executives. | |||
| Once the trial had commenced at Panel One of the Criminal Chamber of the National Appellate Court and after the debate on preliminary issues was held at the end of November 2006, without the appearance of the Government Lawyer, in which the Public Prosecutor’s Office reiterated its appeal to set aside the trial and interrupt the proceedings, on December 20, 2006, the Criminal Chamber of the National Appellate Court ordered the dismissal of the proceedings, as requested by the Public Prosecutor’s Office and the private prosecution. | |||
| A cassation appeal was filed against the aforementioned order by the Association for the Defence of Investors and Customers and “Iniciativa per Catalunya Verds” and, following the opposition by the Public Prosecutor’s Office, the Government Lawyer and the remaining appearing parties, it was dismissed by a Supreme Court Decision handed down on December 17, 2007. | |||
| A decision has not yet been handed down by the Supreme Court on the ancillary suit for nullity of proceedings filed by the Association for the Defence of Investors and Customers. |
| e) | Information relating to 2006 and 2005 | ||
| The information relating to 2006 and 2005 contained in these notes to the consolidated financial statements does not constitute the Group’s statutory consolidated financial statements for those years. |
F-11
Table of Contents
| f) | Capital management | ||
| The Group’s capital management is performed at regulatory and economic levels. | |||
| Regulatory capital management is based on the analysis of the capital base and the capital ratios (core capital, TIER 1, etc.) using Basel (“BIS”) and Bank of Spain criteria. The aim is to achieve a capital structure that is as efficient as possible in terms of both cost and compliance with the requirements of regulators, ratings agencies and investors. Active capital management includes securitizations, sales of assets, and preference and subordinated issues of equity securities and hybrid instruments. | |||
| From an economic standpoint, capital management seeks to optimize value creation at the Group and at its different business units. To this end, the economic capital, return on risk adjusted capital (RORAC) and value creation data for each business unit are generated, analyzed and reported to the Management Committee on a quarterly basis. | |||
| In order to adequately manage the Group’s capital, it is essential to estimate and analyze future needs, in anticipation of the various phases of the business cycle. Projections of regulatory and economic capital are made based on reference to the budgetary information (balance sheet, income statement, etc.) and on macroeconomic scenarios defined by the Economic Research Service. These estimates are used by the Group as a reference to plan the management actions (issues, securitizations, etc.) required to achieve its capital targets. | |||
| In addition, certain stress scenarios are simulated in order to assess the availability of capital in adverse situations. These scenarios are based on sharp fluctuations in macroeconomic variables, GDP, interest rates, stock market indexes, etc. that mirror historical crises that could happen again. | |||
| It should be noted that the regulations governing compliance with minimum capital requirements for credit institutions, both as individual entities and as consolidated groups, came into force through the publication of Law 13/1992, of June 1, and of Bank of Spain Circular 5/1993 and subsequent amendments thereto. | |||
At December 31, 2007, the Group’s eligible capital exceeded the minimum requirements by€14,517 million (December 31, 2006:€11,172 million; December 31, 2005:€10,384 million). | |||
| Royal Decree 216/2008, of February 15, on the capital of financial institutions was published on February 16, 2008. Also, a series of amendments were introduced to Law 13/1985, of May 25, on investment ratios, capital and reporting requirements of financial intermediaries. The main purpose of these new regulations is to transpose into Spanish law Directive 2006/48/EC and Directive 2006/49/EC which, in turn, transpose into Community law the New Basel Capital Accord (“Basel II”- BIS II). | |||
| Accordingly, in 2008 the Bank and its Group must calculate their capital requirements in accordance with the aforementioned regulations, which change the way entities must calculate their minimum capital, including new risks that require the use of capital, such as operational risk, and introduce new calculation methodologies and models to be applied by the entities, and new requirements in terms of validation mechanisms and public information to be disclosed to the market. | |||
| The new regulations permit the use of internal parameters for the calculation of minimum capital requirements, which will become effective from June 30, 2008. | |||
| The Group intends to use, from the outset, advanced internal models to calculate the capital requirements for credit risk of the units with the largest credit risk exposure (the Parent Bank and Banco Español de Crédito -Banesto- in Spain and Abbey in the UK), and plans to extend these models to its other main units in the next few years. The use of advanced internal models is subject to stringent internal validation and supervisory approval requirements. Internal validation and supervisory review and approval of the models are not confined to the quantitative model, but also encompass qualitative requirements relating to the technological environment and the integration of the models into management. In the case of the Group, this has entailed the review and approval by the Bank of Spain and the Financial Services Authority (FSA) of 36 credit risk models applicable to the various business segments. | |||
| The calculation of the minimum capital requirements under the new regulations, the so-called Pillar 1, is supplemented by an internal capital adequacy assessment process (ICAAP) and supervisory review, also referred to as Pillar 2. In the case of the Group, this ICAAP is based on an internal model which is used to quantify the economic capital required, given the Group’s global risk profile, to maintain a target AA rating. Lastly, BIS II regulations establish, through the so-called Pillar 3, strict standards of transparency in the disclosure of risk information to the market. | |||
| We consider that the new regulations will give rise to significant savings with respect to the regulatory capital requirements as from their effective implementation on June 30, 2008. |
F-12
Table of Contents
| g) | Environmental impact | ||
| In view of the business activities carried on by the Group entities, the Group does not have any environmental liability, expenses, assets, provisions or contingencies that might be material with respect to its consolidated equity, financial position or results. Therefore, no specific disclosures relating to environmental issues are included in these notes to the consolidated financial statements. |
| h) | Events after the balance sheet date | ||
| It should be noted that from January 1, 2008 to the date on which these financial statements were authorized for issue, the following significant events occurred in the Santander Group: |
| • | Banco Santander entered into an agreement with the consortium led by Propinvest for the sale of the Santander business campus and the subsequent leaseback thereof for a period of 40 years, whereby the Bank also reserves a purchase option at the end of this period. | ||
This transaction is performed within the framework of the restricted private bid organized by Banco Santander for the sale and subsequent leaseback of a portfolio of properties owned by it in Spain, of which it is the last part. The price agreed upon for the Santander business campus is€1,900 million (Note 12). | |||
| • | Santander and Fortis entered into an agreement whereby Santander will acquire from Fortis the asset management activities of ABN AMRO in Brazil, which Fortis purchased as part of the ABN AMRO acquisition performed by the Consortium (RBS, Fortis and Santander). | ||
This transaction, which is valued at€209 million, is expected to be closed in the second quarter of 2008 and will be subject to the normal closing conditions and to the relevant regulatory approvals. |
| i) | Comparative information | ||
The accompanying consolidated income statement for 2006 differs from the consolidated income statement approved by the Bank’s Annual General Meeting in that, as a result of the Group’s divestment of the pensions business in Latin America, the results arising from the consolidation of these companies (€116 million) were reclassified for comparison purposes, as stipulated by the accounting standards, from the headings under which they were recorded in the approved consolidated financial statements for 2005 to “Profit from discontinued operations” in the accompanying consolidated income statement for 2006 (Note 37). | |||
Also, the results arising from the consolidation of the divested companies in the pensions business in Latin America (€106 million) and the results relating to the investments disposed of in 2006 –most notably Inmobiliaria Urbis, S.A. (Urbis) and Abbey’s insurance business (€238 million)- were reclassified in 2005 from the related headings in the consolidated income statement to “Profit from discontinued operations” in the accompanying consolidated income statement (Note 37). | |||
The gains arising in 2007 on the disposal of the investment in Intesa Sanpaolo and of the properties in Spain (€566 million and€1,620 million, respectively, recognized under “Other gains” — Note 52), the proceeds from the divestment of the pensions business in Latin America (€831 million, recognized under “Discontinued operations” — Note 37) and the gains on the disposal of the investment in Banco Portugués do Investimento (€107 million, recognized under “Gains/losses on financial assets and liabilities” — Note 45) were used to write down the investment in Sovereign (€1,053 million — Note 13-c), to write down intangible assets (€542 million — Note 17), to recognize special provisions for retirement and pension plans (€317 million — Note 52) and to recognize other provisions and write-downs (€117 million). Therefore, the gross gains realized in 2007 (€3,124 million) contributed€950 million, after the aforementioned uses and net of tax and minority interests, to “Profit attributed to the Group”. | |||
The gains arising in 2006 on the disposal of the investments in Banco Santander Chile, San Paolo ImI, S.p.A. (San Paolo) and Antena 3 (€270 million,€705 million and€294 million, respectively, recognized under “Other gains” — Note 52) and on the divestment of Urbis (€1,218 million recognized under “Discontinued operations” — Note 37) were used to fund a significant portion of the retirement plans detailed in Note 25-c (€716 million), to re-estimate the deferred tax assets and liabilities detailed in Note 2-y as a result of the reduction in the statutory tax rate for income tax purposes in Spain (€491 million) and to recognize the expense relating to the delivery of 100 Bank shares to each Group employee (€179 million). Accordingly, the gains realized in 2006 (€2,487 million, before tax) contributed€1,014 million, after the aforementioned uses and net of tax and minority interests, to the profit attributable to the Group. |
F-13
Table of Contents
In 2005, the gains on the disposal of the investments in Unión Fenosa, S.A., Royal Bank of Scotland Group Plc and Auna Operadores de Telecomunicaciones, S.A. (€1,157 million,€717 million and€355 million, respectively, recognized under “Other gains” — Note 52) were partially used to fund early retirement plans and to amortize early restructuring costs. Therefore, the realized gains (€2,229 million before tax) contributed€1,008 million, after the aforementioned uses and net of tax, to the profit attributed to the Group for 2005. |
| 2. | Accounting policies and measurement bases | |
| The accounting policies and measurement bases applied in preparing the consolidated financial statements were as follows: |
| a) | Foreign currency transactions |
| i. | Functional currency |
| The Group’s functional currency is the euro. Therefore, all balances and transactions denominated in currencies other than the euro are deemed to be denominated in “foreign currency”. |
| ii. | Translation of foreign currency balances |
| Foreign currency balances are translated to euros in two consecutive stages: |
| • | Translation of foreign currency to the functional currency (currency of the main economic environment in which the Group operates), and | ||
| • | Translation to euros of the balances held in the functional currencies of entities whose functional currency is not the euro. | ||
Translation of foreign currency to the functional currency | |||
| Foreign currency transactions performed by consolidated entities (or entities accounted for using the equity method) not located in EMU countries are initially recognized in their respective currencies. Monetary items in foreign currency are subsequently translated to their functional currencies using the closing rate. | |||
| Furthermore: |
| • | Non-monetary items measured at historical cost are translated to the functional currency at the exchange rate at the date of acquisition. | ||
| • | Non-monetary items measured at fair value are translated at the exchange rate at the date when the fair value was determined. | ||
| • | Income and expenses are translated at the average exchange rates for the period for all the transactions performed during the year. | ||
| • | The balances arising from non-hedging forward foreign currency/foreign currency and foreign currency/euro purchase and sale transactions are translated at the closing rates prevailing in the forward foreign currency market for the related maturity. |
Translation of functional currencies to euros | |||
| If the functional currency is not the euro, the balances in the financial statements of the consolidated entities (or entities accounted for using the equity method) are translated to euros as follows: |
| • | Assets and liabilities, at the closing rates. | ||
| • | Income and expenses, at the average exchange rates for the year. | ||
| • | Equity items, at the historical exchange rates. |
F-14
Table of Contents
| iii. | Recognition of exchange differences |
| The exchange differences arising on the translation of foreign currency balances to the functional currency are generally recognized at their net amount under “Exchange differences” in the consolidated income statement, except for exchange differences arising on financial instruments at fair value through profit or loss, which are recognized in the consolidated income statement without distinguishing them from other changes in fair value, and for exchange differences arising on non-monetary items measured at fair value through equity, which are recognized under “Valuation adjustments — Exchange differences”. | |||
| The exchange differences arising on the translation to euros of the financial statements in functional currencies other than the euro are recognized under “Valuation adjustments — Exchange differences” in the consolidated balance sheet until the related item is derecognized, when they are recognized in the consolidated income statement. |
| iv. | Entities located in hyperinflationary economies |
| None of the functional currencies of the consolidated entities and associates located abroad relate to hyperinflationary economies as defined by the EU-IFRS required to be applied under Bank of Spain’s Circular 4/2004 as adopted by the European Union. Accordingly, at 2007, 2006 and 2005 year-end it was not necessary to adjust the financial statements of any of the consolidated entities or associates to correct for the effect of inflation. |
| v. | Exposure to foreign currency risk |
| At December 31, 2007, the Group’s largest exposures on temporary positions (with a potential impact on the income statement) were concentrated, in descending order, on the US dollar and the pound sterling. At that date, its largest exposures on permanent positions (with a potential impact on equity) were concentrated, in descending order, on the Brazilian real, the pound sterling, the Mexican peso and the Chilean peso. The Group hedges a portion of these permanent positions using foreign exchange derivative financial instruments (Note 36-a). | |||
| At December 31, 2006, the Group’s largest exposures on temporary positions (with a potential impact on the income statement) were concentrated, in descending order, on the US dollar, the pound sterling and the Chilean peso. At that date, its largest exposure on permanent positions (with a potential impact on equity) were concentrated, in descending order, on the pound sterling, the Brazilian real, the Mexican peso and the Chilean peso. The Group hedges a portion of these permanent positions using foreign exchange derivative financial instruments (Note 36-a). | |||
| At December 31, 2005, the Group’s largest exposures on more temporary positions (with a potential impact on the income statement) were concentrated, in descending order, on the US dollar, the Chilean peso, the pound sterling and the Mexican peso. At that date, its largest exposures on more permanent positions (with a potential impact on equity) were concentrated, in descending order, on the Brazilian real, the pound sterling, the Mexican peso and the US dollar. The Group hedges a portion of these permanent positions using foreign exchange derivative financial instruments (Note 36-a). | |||
| The following tables show the sensitivity of consolidated profit and consolidated equity to changes in the Group’s financial instruments due to 1% variations in the various foreign currencies in which the Group had material balances. | |||
| The estimated effect on the Group’s consolidated equity and consolidated profit of a 1% appreciation of the euro against the related currency is as follows: |
| Millions of Euros | ||||||||||||||||||||||||
| Effect on Consolidated Equity | Effect on Consolidated Profit | |||||||||||||||||||||||
| Currency | 2007 | 2006 | 2005 | 2007 | 2006 | 2005 | ||||||||||||||||||
| US dollar | — | 0.1 | (10.1 | ) | 20.1 | 30.2 | 18.7 | |||||||||||||||||
| Chilean peso | (13.7 | ) | (9.8 | ) | (1.0 | ) | — | 2.2 | — | |||||||||||||||
| Pound sterling | (4.3 | ) | (49.0 | ) | (32.6 | ) | 12.2 | 23.2 | 13.4 | |||||||||||||||
| Mexican peso | (16.3 | ) | (20.5 | ) | (19.5 | ) | — | 5.2 | 1.9 | |||||||||||||||
| Brazilian real | (68.5 | ) | (25.4 | ) | (27.5 | ) | — | — | — | |||||||||||||||
F-15
Table of Contents
| Similarly, the estimated effect on the Group’s consolidated equity and consolidated profit of a 1% depreciation of the euro against the related currency is as follows: |
| Millions of Euros | ||||||||||||||||||||||||
| Effect on Consolidated Equity | Effect on Consolidated Profit | |||||||||||||||||||||||
| Currency | 2007 | 2006 | 2005 | 2007 | 2006 | 2005 | ||||||||||||||||||
| US dollar | — | (0.1 | ) | 10.3 | (20.5 | ) | (30.8 | ) | (19.1 | ) | ||||||||||||||
| Chilean peso | 14.5 | 10.9 | 1.0 | — | (6.0 | ) | — | |||||||||||||||||
| Pound sterling | 8.5 | 33.1 | 30.3 | (12.5 | ) | (16.7 | ) | (0.5 | ) | |||||||||||||||
| Mexican peso | 16.5 | 24.7 | 18.3 | — | (7.3 | ) | (1.3 | ) | ||||||||||||||||
| Brazilian real | 69.4 | 26.0 | 28.0 | — | — | — | ||||||||||||||||||
| The foregoing data were obtained by calculating the possible effect of a variation in the exchange rates on the various asset and liability items and on other foreign currency-denominated items, such as the Group’s derivative instruments, considering the offsetting effect of the various hedging transactions on these items. This effect was estimated using the exchange difference recognition methods set forth in Note 2-a-iii above. | |||
| The estimates used to obtain the foregoing data were performed taking into account the effects of the exchange rate fluctuations isolated from the effect of the performance of other variables, the changes in which would affect equity and profit, such as variations in the interest rates of the reference currencies or other market factors. Accordingly, all variables other than the exchange rate fluctuations remained unchanged with respect to their positions at December 31, 2007, 2006 and 2005. |
| b) | Basis of consolidation |
| i. | Subsidiaries |
| “Subsidiaries” are defined as entities over which the Bank has the capacity to exercise control; this capacity is, in general but not exclusively, presumed to exist when the Parent owns directly or indirectly half or more of the voting power of the investee or, even if this percentage is lower or zero, when, as in the case of agreements with shareholders of the investee, the Bank is granted control. Control is the power to govern the financial and operating policies of an entity so as to obtain benefits from its activities. | |||
| The financial statements of the subsidiaries are fully consolidated with those of the Bank. Accordingly, all balances and transactions between consolidated entities are eliminated on consolidation. | |||
| On acquisition of a subsidiary, its assets, liabilities and contingent liabilities are recognized at fair value at the date of acquisition. Any positive differences between the acquisition cost and the fair values of the identifiable net assets acquired are recognized as goodwill (Note 17). Negative differences are charged to income on the date of acquisition. | |||
| Additionally, the share of third parties of the Group’s equity is presented under “Minority interests” in the consolidated balance sheet (Note 28) and their share of the profit for the year is presented under “Profit attributed to minority interests” in the consolidated income statement. | |||
| The results of subsidiaries acquired during the year are included in the consolidated income statement from the date of acquisition to year-end. Similarly, the results of subsidiaries disposed of during the year are included in the consolidated income statement from the beginning of the year to the date of disposal. | |||
| The Exhibits contain significant information on these entities. |
| ii. | Interests in joint ventures (jointly controlled entities) |
| “Joint ventures” are deemed to be ventures that are not subsidiaries but which are jointly controlled by two or more unrelated entities. This is evidenced by contractual arrangements whereby two or more entities (“venturers”) acquire interests in entities (jointly controlled entities) or undertake operations or hold assets so that strategic financial and operating decisions affecting the joint venture require the unanimous consent of the venturers. |
F-16
Table of Contents
| The financial statements of investees classified as joint ventures are proportionately consolidated with those of the Bank and, therefore, the aggregation of balances and subsequent eliminations are made only in proportion to the Group’s ownership interest in the capital of these entities. | |||
| The Exhibits contain significant information on these entities. |
| iii. | Associates |
| Associates are entities over which the Bank is in a position to exercise significant influence, but not control or joint control, usually because it holds 20% or more of the voting power of the investee. | |||
| In the consolidated financial statements, investments in associates are accounted for using the equity method, i.e. at the Group’s share of net assets of the investee, after taking into account the dividends received therefrom and other equity eliminations. The profits and losses resulting from transactions with an associate are eliminated to the extent of the Group’s interest in the associate. | |||
| The Exhibits contain significant information on these entities. |
| iv. | Other matters |
| The companies less than 50% owned by the Group that constituted a decision-making unit at December 31, 2007 and which, therefore, were accounted for as subsidiaries are: (i) Inmuebles B de V 1985 C.A., (ii) Luri 1, S.A. and (iii) Luri 2, S.A. and (iv) Luri Land, S.A., in which the Group held ownership interests of 35.63%, 5.58%, 4.81% and 5.15%, respectively, at that date (Exhibit I). | |||
| The companies less than 20% owned by the Group over which it exercises significant influence and which, therefore, were accounted for as associates at December 31, 2007 are: (i) Attijariwafa Bank Société Anonyme and (ii) Sociedad Operadora de la Cámara de Compensación de Pagos de Alto Valor, S.A., in which the Group held ownership interests of 14.55% and 13.94%, respectively, at that date (Exhibit II). |
| v. | Business combinations |
| A business combination is the bringing together of two or more separate entities or economic units into one single entity or group of entities. | |||
| Business combinations performed on or after January 1, 2004 whereby the Group obtains control over an entity are recognized for accounting purposes as follows: |
| • | The Group measures the cost of the business combination, defined as the fair value of the assets given, the liabilities incurred and the equity instruments issued, if any, by the entity, plus any cost directly attributable to the business combinations, including the fees paid to the auditors, legal advisers, investment banks and other consultants. The amount recognized as an increase in the cost of the business combinations effected in 2007 (see the transaction described in Note 3-b), which required auditor’s reports to be issued by our auditors, amounted to€5.8 million. | ||
| • | The fair values of the assets, liabilities and contingent liabilities of the acquiree, including any intangible assets which might have not been recognized by the acquiree, are estimated and recognized in the consolidated balance sheet. | ||
| • | Any negative difference between the net fair value of the assets, liabilities and contingent liabilities of the acquiree and the business combination cost is recognized as discussed in Note 2-m; any positive difference is recognized in “Other gains” in the consolidated income statement. |
| vi. | Acquisitions and disposals |
| Note 3 provides information on the most significant acquisitions and disposals in 2007, 2006 and 2005. |
F-17
Table of Contents
| c) | Definitions and classification of financial instruments |
| i. | Definitions |
| A “financial instrument” is any contract that gives rise to a financial asset of one entity and, simultaneously, to a financial liability or equity instrument of another entity. | |||
| An “equity instrument” is any agreement that evidences a residual interest in the assets of the issuing entity after deducting all of its liabilities. | |||
| A “financial derivative” is a financial instrument whose value changes in response to the change in an observable market variable (such as an interest rate, foreign exchange rate, financial instrument price, market index or credit rating), whose initial investment is very small compared with other financial instruments with a similar response to changes in market factors, and which is generally settled at a future date. | |||
| “Hybrid financial instruments” are contracts that simultaneously include a non-derivative host contract together with a derivative, known as an embedded derivative, that is not separately transferable and has the effect that some of the cash flows of the hybrid contract vary in a way similar to a stand-alone derivative. | |||
| “Compound financial instruments” are contracts that simultaneously create for their issuer a financial liability and an own equity instrument (such as convertible bonds, which entitle their holders to convert them into equity instruments of the issuer). | |||
| The following transactions are not treated for accounting purposes as financial instruments: |
| • | Investments in subsidiaries, jointly controlled entities and associates (Note 13). | ||
| • | Rights and obligations under employee benefit plans (Note 25). | ||
| • | Rights and obligations under insurance contracts (Note 15). | ||
| • | Contracts and obligations relating to employee remuneration based on own equity instruments (Note 34). |
| ii. | Classification of financial assets for measurement purposes |
| Financial assets are initially classified into the various categories used for management and measurement purposes, unless they have to be presented as “Non-current assets held for sale” or they relate to “Cash and balances with central banks”, “Changes in the fair value of hedged items in portfolio hedges of interest rate risk” (asset side), “Hedging derivatives” and “Investments”, which are reported separately. | |||
| Financial assets are included for measurement purposes in one of the following categories: |
| • | Financial assets held for trading (at fair value through profit or loss): this category includes the financial assets acquired for the purpose of generating a profit in the near term from fluctuations in their prices and financial derivatives that are not designated as hedging instruments. | ||
| • | Other financial assets at fair value through profit or loss: this category includes hybrid financial assets not held for trading that are measured entirely at fair value and financial assets not held for trading that are managed jointly with “Liabilities under insurance contracts” measured at fair value or with derivative financial instruments whose purpose and effect is to significantly reduce exposure to variations in fair value, or that are managed jointly with financial liabilities and derivatives for the purpose of significantly reducing overall exposure to interest rate risk. | ||
| Financial instruments included in this category (and “Other financial liabilities at fair value through profit or loss”) are permanently subject to an integrated and consistent system of measuring, managing and controlling risks and returns that enables all the financial instruments involved to be monitored and identified and allows the effective reduction of risk to be checked. | |||
| • | Available-for-sale financial assets: this category includes debt instruments not classified as “Held-to-maturity investments” or as “Financial assets at fair value through profit or loss”, and equity instruments issued by entities other than subsidiaries, associates and jointly controlled entities, provided that such instruments have not been classified as “Financial assets held for trading” or as “Other financial assets at fair value through profit or loss”. |
F-18
Table of Contents
| • | Loans and receivables: this category includes financing granted to third parties, based on their nature, irrespective of the type of borrower and the form of financing, including finance lease transactions in which the consolidated entities act as lessors. | ||
| The consolidated entities generally intend to hold the loans and credits granted by them until their final maturity and, therefore, they are presented in the consolidated balance sheet at their amortized cost (which includes any reductions required to reflect the estimated losses on their recovery). | |||
| • | Held-to-maturity investments: this category includes debt instruments with fixed maturity and with fixed or determinable payments. |
| iii. | Classification of financial assets for presentation purposes |
| Financial assets are classified by nature into the following items in the consolidated balance sheet: |
| • | Cash and balances with central banks: cash balances and balances receivable on demand relating to deposits with the Bank of Spain and other central banks. | ||
| • | Loans and advances to credit institutions: credit of any nature in the name of credit institutions. | ||
| • | Money market operations through counterparties: amount of the money market operations conducted through central counterparties. | ||
| • | Loans and advances to customers: all credit granted by the Group, other than that represented by marketable securities, money market operations through central counterparties, finance lease receivables and loans and advances to credit institutions. | ||
| • | Debt instruments: bonds and other securities that represent a debt for their issuer, that generate an interest return, and that are in the form of certificates or book entries. | ||
| • | Other equity instruments: financial instruments issued by other entities, such as shares and non-voting equity units, which have the nature of equity instruments for the issuer, unless they are investments in subsidiaries, jointly controlled entities or associates. Investment fund units and shares are included in this item. | ||
| • | Trading derivatives: includes the fair value in favor of the Group of derivatives which do not form part of hedge accounting. | ||
| • | Other financial assets: other debit balances in favor of the Group in respect of transactions which do not have the nature of credit (such as cheques drawn on credit institutions, the amounts receivable from clearing houses and settlement agencies for transactions on the stock exchange and organized markets, bonds given in cash, capital calls, and fees and commissions receivable for financial guarantees). | ||
| • | Changes in the fair value of hedged items in portfolio hedges of interest rate risk: this item is the balancing entry for the amounts credited to the consolidated income statement in respect of the measurement of the portfolios of financial instruments which are efficiently hedged against interest rate risk through fair value hedging derivatives. | ||
| • | Hedging derivatives: includes the fair value in favor of the Group of derivatives designated as hedging instruments in hedge accounting. | ||
| • | Investments: includes the investments in the share capital of associates |
| iv. | Classification of financial liabilities for measurement purposes |
| Financial liabilities are initially classified into the various categories used for management and measurement purposes, unless they have to be presented as “Liabilities associated with non-current assets held for sale” or they relate to “Hedging derivatives”, “Changes in the fair value of hedged items in portfolio hedges of interest rate risk” (liability side) and “Equity having the substance of a financial liability”, which are reported separately. |
F-19
Table of Contents
| Financial liabilities are classified for measurement purposes into one of the following categories: |
| • | Financial liabilities held for trading (at fair value through profit or loss): this category includes the financial liabilities issued for the purpose of generating a profit in the near term from fluctuations in their prices, financial derivatives not considered to qualify for hedge accounting and financial liabilities arising from the outright sale of financial assets purchased under resale agreements or borrowed (“short positions”). | ||
| • | Other financial liabilities at fair value through profit or loss: this category includes all hybrid financial liabilities not held for trading that have to be measured entirely at fair value, including life insurance linked to investment funds that does not expose the issuer of the contract to a significant insurance risk, when the financial assets to which they are linked are also measured at fair value through profit or loss. | ||
| • | Financial liabilities at fair value through equity: financial liabilities associated with available-for-sale financial assets arising as a result of transfers of assets in which the consolidated entities as transferors neither transfer nor retain substantially all the risks and rewards of ownership of the assets. | ||
| • | Financial liabilities at amortized cost: financial liabilities, irrespective of their instrumentation and maturity, not included in any of the above-mentioned categories which arise from the funding-taking activities carried on by financial institutions. |
| v. | Classification of financial liabilities for presentation purposes |
| Financial liabilities are classified by nature into the following items in the consolidated balance sheet: |
| • | Deposits from credit institutions: deposits of any nature, including credit and money market operations received in the name of credit institutions. | ||
| • | Money market operations through counterparties: amount of the money market operations conducted through central counterparties. | ||
| • | Customer deposits: includes all repayable balances received in cash by the Group, other than those represented by marketable securities, money market operations through central counterparties, subordinated liabilities and deposits from central banks and credit institutions. | ||
| • | Marketable debt securities: includes the amount of bonds and other debt represented by marketable securities, other than subordinated liabilities. This item includes the component considered to be a financial liability of issued securities that are compound financial instruments. | ||
| • | Trading derivatives: includes the fair value of the Group’s liability in respect of derivatives which do not form part of hedge accounting. | ||
| • | Deposits from central banks: deposits of any nature received from the Bank of Spain or other central banks. | ||
| • | Short positions: includes the amount of financial liabilities arising from the outright sale of financial assets purchased under reverse repurchase agreements or borrowed. | ||
| • | Subordinated liabilities: amount of financing received which, for the purposes of payment priority, ranks behind ordinary debt. | ||
| • | Other financial liabilities: includes the amount of payment obligations having the nature of financial liabilities not included in other items. | ||
| • | Changes in the fair value of hedged items in portfolio hedges of interest rate risk: this item is the balancing entry for the amounts charged to the consolidated income statement in respect of the measurement of the portfolios of financial instruments which are efficiently hedged against interest rate risk through fair value hedging derivatives. | ||
| • | Hedging derivatives: includes the fair value of the Group’s liability in respect of derivatives designated as hedging instruments in hedge accounting. | ||
| • | Equity having the substance of a financial liability: amount of the financial instruments issued by the consolidated entities that, although equity for legal purposes, do not meet the requirements for classification as equity. |
F-20
Table of Contents
| d) | Measurement of financial assets and liabilities and recognition of fair value changes | ||
| In general, financial assets and liabilities are initially recognized at fair value which, in the absence of evidence to the contrary, is deemed to be the transaction price, and are subsequently measured at each period-end as follows: |
| i. | Measurement of financial assets |
| Financial assets are measured at fair value, except for loans and receivables, held-to-maturity investments, equity instruments whose fair value cannot be determined in a sufficiently objective manner and financial derivatives that have those equity instruments as their underlying and are settled by delivery of those instruments. | |||
| The “fair value” of a financial instrument on a given date is taken to be the amount for which it could be bought or sold on that date by two knowledgeable, willing parties in an arm’s length transaction acting prudently. The most objective and common reference for the fair value of a financial instrument is the price that would be paid for it on an organized, transparent and deep market (“quoted price” or “market price”). | |||
| If there is no market price for a given financial instrument, its fair value is estimated on the basis of the price established in recent transactions involving similar instruments and, in the absence thereof, of valuation techniques commonly used by the international financial community, taking into account the specific features of the instrument to be measured and, particularly, the various types of risk associated with it. | |||
| All derivatives are recognized in the balance sheet at fair value from the trade date. If the fair value is positive, they are recognized as an asset and if the fair value is negative, they are recognized as a liability. The fair value on the trade date is deemed, in the absence of evidence to the contrary, to be the transaction price. The changes in the fair value of derivatives from the trade date are recognized in “Gains/losses on financial assets and liabilities” in the consolidated income statement. Specifically, the fair value of standard financial derivatives included in the portfolios of financial assets or liabilities held for trading is deemed to be their daily quoted price and if, for exceptional reasons, the quoted price cannot be determined on a given date, these financial derivatives are measured using methods similar to those used to measure OTC derivatives. | |||
| The fair value of OTC derivatives is taken to be the sum of the future cash flows arising from the instrument, discounted to present value at the date of measurement (“present value” or “theoretical close”) using valuation techniques commonly used by the financial markets: “net present value” (NPV), option pricing models and other methods. | |||
| “Loans and receivables” and “Held-to-maturity investments” are measured at amortized cost using the effective interest method. “Amortized cost” is understood to be the acquisition cost of a financial asset or liability plus or minus, as appropriate, the principal repayments and the cumulative amortization (taken to the income statement) of the difference between the initial cost and the maturity amount. In the case of financial assets, amortized cost furthermore includes any reductions for impairment or uncollectability. In the case of loans and receivables hedged in fair value hedges, the changes in the fair value of these assets related to the risk or risks being hedged are recognized. | |||
| The “effective interest rate” is the discount rate that exactly matches the initial amount of a financial instrument to all its estimated cash flows of all kinds over its remaining life. For fixed rate financial instruments, the effective interest rate coincides with the contractual interest rate established on the acquisition date plus, where applicable, the fees and transaction costs that, because of their nature, form part of their financial return. In the case of floating rate financial instruments, the effective interest rate coincides with the rate of return prevailing in all connections until the next benchmark interest reset date. | |||
| Equity instruments whose fair value cannot be determined in a sufficiently objective manner and financial derivatives that have those instruments as their underlying and are settled by delivery of those instruments are measured at acquisition cost adjusted, where appropriate, by any related impairment loss. | |||
| The amounts at which the financial assets are recognized represent, in all material respects, the Group’s maximum exposure to credit risk at each reporting date. Also, the Group has received collateral and other credit enhancements to mitigate its exposure to credit risk, which consist mainly of mortgage guarantees, cash collateral, equity instruments and personal security, assets leased out under leasing and renting agreements, assets acquired under repurchase agreements, securities loans and derivatives. |
| ii. | Measurement of financial liabilities |
| In general, financial liabilities are measured at amortized cost, as defined above, except for those included under “Financial liabilities held for trading”, “Other financial liabilities at fair value through profit or loss” and “Financial liabilities at fair value through equity” and financial liabilities designated as hedged items (or hedging instruments) in fair value hedges, which are measured at fair value. |
F-21
Table of Contents
| iii. | Valuation techniques |
| The following table summarizes the recorded fair values at each of the dates set forth for the asset and liability classes below, broken down by valuation methodology used by the Group to determine their fair value: |
| December 31, | ||||||||||||||||||||||||||||||||||||
| 2007 | 2006 | 2005 | ||||||||||||||||||||||||||||||||||
| (in millions of euros) | ||||||||||||||||||||||||||||||||||||
| Published | Published | Published | ||||||||||||||||||||||||||||||||||
| Price | Price | Price | ||||||||||||||||||||||||||||||||||
| Quotations in | Quotations in | Quotations in | ||||||||||||||||||||||||||||||||||
| Active | Internal | Active | Internal | Active | Internal | |||||||||||||||||||||||||||||||
| Markets | Models (*) | Total | Markets | Models (*) | Total | Markets | Models (*) | Total | ||||||||||||||||||||||||||||
| Financial assets held for trading | 76,310 | 82,490 | 158,800 | 84,009 | 86,414 | 170,423 | 85,558 | 68,650 | 154,208 | |||||||||||||||||||||||||||
| Other financial assets at fair value through profit or loss | 6,945 | 17,884 | 24,829 | 4,543 | 10,828 | 15,371 | 39,020 | 9,842 | 48,862 | |||||||||||||||||||||||||||
| Available-for-sale financial assets | 37,908 | 6,441 | 44,349 | 32,111 | 6,587 | 38,698 | 72,909 | 1,036 | 73,945 | |||||||||||||||||||||||||||
| Hedging derivatives (assets) | — | 3,063 | 3,063 | — | 2,988 | 2,988 | — | 4,126 | 4,126 | |||||||||||||||||||||||||||
| Financial liabilities held for trading | 24,447 | 98,307 | 122,754 | 30,657 | 93,339 | 123,996 | 35,156 | 77,310 | 112,466 | |||||||||||||||||||||||||||
| Other financial liabilities at fair value through profit or loss | 117 | 33,039 | 33,156 | 259 | 12,152 | 12,411 | — | 11,810 | 11,810 | |||||||||||||||||||||||||||
| Hedging derivatives (liabilities) | 110 | 4,024 | 4,135 | — | 3,494 | 3,494 | — | 2,311 | 2,311 | |||||||||||||||||||||||||||
| Liabilities under insurance contracts | 5,678 | 7,356 | 13,034 | 5,760 | 4,944 | 10,704 | 13,076 | 31,596 | 44,672 | |||||||||||||||||||||||||||
| (*) | In substantially all cases, the principal variables that are input into these models are derived from observable market data. |
| Financial instruments carried at fair value and determined on the basis of published price quotations in active markets include government debt securities, private-sector debt securities, asset-backed securities, equity securities, short securities positions and fixed-income securities issued. | |||
| In the absence of published price quotations for a particular financial instrument, management uses internal models to make its best estimate of the price that the market would set for that financial instrument. In order to make these estimates, various techniques are employed, including extrapolation from observable market data. The best evidence of the fair value of a financial instrument on initial recognition is the transaction price, unless the value of the instrument can be evidenced by comparison with other observable market transactions involving the same or similar instruments or measured by using a valuation technique where variables include only observable market data, mainly interest rates. Under EU-IFRS required to be applied under Bank of Spain’s Circular 4/2004, any difference between the transaction price and the fair value based on valuation techniques is not initially recognized in the income statement. | |||
| Set forth below are the main valuation techniques employed in our internal models to measure the fair value of the financial instruments disclosed above at December 31, 2007: |
| • | In the valuation of financial instruments permitting static hedging (basically, forwards and swaps), and in the valuation of loans and advances, the “present value” method is used. Expected future cash flows are discounted using the interest rate curves of the applicable currencies. The interest rate curves are generally observable market data. | ||
| • | In the valuation of financial instruments requiring dynamic hedging (principally structured options and other structured instruments), the Black-Scholes model is generally used. Certain observable market inputs are used in the Black-Scholes model to generate variables such as the bid-offer spread, exchange rates, volatility, correlation between indexes and market liquidity, as appropriate. |
F-22
Table of Contents
| • | In the valuation of financial instruments exposed to interest rate risk (such as interest rate futures, caps and floors), the present value method (futures) and Black-Scholes model (plain vanilla options) are used. For more structured instruments that require dynamic hedging, the Heath-Jarrow-Morton model is employed. The main inputs used in these models are principally observable market data, including appropriate interest rate curves, volatilities, correlations and exchange rates. | ||
| • | In the case of linear instruments (for example, bonds and fixed-income derivatives), credit risk is measured using dynamic models similar to those used in the measurement of interest rate risk. In the case of non-linear instruments, if they are exposed to portfolio credit risk (for example, credit derivatives), the joint probability of default is determined using the Standard Gaussian Copula model. The main inputs used in the Standard Gaussian Copula model are generally data relating to individual issuers in the portfolio and correlations thereto. The main inputs used in determining the underlying cost of credit for credit risk derivatives are quoted credit spreads, and the correlation between individual issuers’ quoted credit derivatives. |
| The estimates thus obtained could vary if other methods or assumptions were used for interest rate risk, credit risk, market risk and foreign currency risk spreads, or for their related correlations and volatilities. Nevertheless, management considers that the financial assets and liabilities recognized at fair value in the consolidated balance sheet and the gains and losses arising from these financial instruments are reasonable. | |||
| The fair values of the financial instruments arising from the aforementioned internal models take into account, among other things, contract terms and observable market data, which include interest rates, credit risk, exchange rates, the quoted market price of raw materials and equity securities, volatility and prepayments. The valuation models are not significantly subjective, because they can be tested and, if necessary, recalibrated by the internal calculation of and |
F-23
Table of Contents
| subsequent comparison to market prices of actively traded securities. Set forth below are the financial instruments at fair value where measurement is based on internal models at December 31, 2007, and the potential effect on fair value as of such date to changes to other reasonably likely assumptions that are not based on observable market data: |
| In Millions of Euros | ||||||||||||||||
| Fair Value | ||||||||||||||||
| Calculated | Other reasonably likely | |||||||||||||||
| Using | assumptions | |||||||||||||||
| Internal | More | Less | ||||||||||||||
| Models | Valuation Techniques | Main Assumptions (*) | Favorable | Favorable | ||||||||||||
ASSETS: | ||||||||||||||||
Financial assets held for trading | 82,490 | 103 | (88 | ) | ||||||||||||
| Loans and advances to credit institutions (Note 6) | 12,295 | Present Value Method | Observable market data | — | — | |||||||||||
| Loans and advances to customers (**) (Note 10) | 23,704 | Present Value Method | Observable market data | — | — | |||||||||||
| Debt and equity interests | 2,087 | Present Value Method | Observable market data | — | — | |||||||||||
| Trading derivatives | 44,404 | 103 | (88 | ) | ||||||||||||
Swaps (***) | 28,312 | Present Value Method | Observable market data, Liquidity | 61 | (46 | ) | ||||||||||
Exchange rate options | 375 | Black-Scholes Model | Observable market | 1 | (1 | ) | ||||||||||
| data, Liquidity | ||||||||||||||||
Interest rate options | 8,683 | Black-Scholes Model | Observable market | 24 | (16 | ) | ||||||||||
| HJM Model | data, Liquidity, | |||||||||||||||
| Correlation | ||||||||||||||||
Interest rate futures | 1,039 | Present Value Method | Observable market data | — | — | |||||||||||
Index and securities options | 3,799 | Black-Scholes Model | Observable market | 17 | (25 | ) | ||||||||||
| data, Dividend, | ||||||||||||||||
| Correlation, | ||||||||||||||||
| Liquidity | ||||||||||||||||
Investment futures | 28 | Present Value Method | Observable market data | — | — | |||||||||||
Other | 2,168 | N/A | N/A | — | — | |||||||||||
Hedging derivatives | 3,063 | — | — | |||||||||||||
Swaps | 2,614 | Present Value Method | Observable market data | — | — | |||||||||||
Exchange rate options | 359 | Black-Scholes Model | Observable market data | — | — | |||||||||||
Interest rate options | 86 | Black-Scholes Model | Observable market data | — | — | |||||||||||
Other | 4 | N/A | — | — | ||||||||||||
Other financial assets at fair value Through profit or loss | 17,884 | |||||||||||||||
| Loans and advances to credit institutions (Note 6) | 6,865 | Present Value Method | Observable market data | — | — | |||||||||||
| Loans and advances to customers (****) (Note 10) | 8,022 | Present Value Method | Observable market data | — | — | |||||||||||
| Debt and equity interests | 2,997 | Present Value Method | Observable market data | — | — | |||||||||||
Available-for-sale financial assets | 6,441 | |||||||||||||||
| Debt and equity interests | 6,441 | Present Value Method | Observable market data | — | — | |||||||||||
LIABILITIES: | ||||||||||||||||
Financial liabilities held for trading | 98,307 | 108 | (90 | ) | ||||||||||||
| Deposits from credit institutions | 23,254 | Present Value Method | Observable market data | — | — | |||||||||||
| Customer deposits | 27,992 | Present Value Method | Observable market data | — | — | |||||||||||
| Trading derivatives | 47,061 | 108 | (90 | ) | ||||||||||||
Swaps (***) | 39,204 | Present Value Method | Observable market | 90 | (69 | ) | ||||||||||
| data, Liquidity | ||||||||||||||||
Exchange rate options | 907 | Black-Scholes Model | Observable market | 2 | (2 | ) | ||||||||||
| data, Liquidity | ||||||||||||||||
Interest rate options | 1,325 | Black-Scholes Model | Observable market | 4 | (2 | ) | ||||||||||
| HJM Model | data, Liquidity, | |||||||||||||||
| Correlation | ||||||||||||||||
Index and securities options | 2,527 | Black-Scholes Model | Observable market | 12 | (17 | ) | ||||||||||
| data, Dividend, | ||||||||||||||||
| Correlation, | ||||||||||||||||
| Liquidity | ||||||||||||||||
Forward purchase and sale contracts | 1,411 | N/A | N/A | — | — | |||||||||||
Interest rate and investment futures | 1,100 | Present Value Method | Observable market data | — | — | |||||||||||
Other | 587 | N/A | N/A | — | — | |||||||||||
Hedging derivatives | 4,024 | — | — | |||||||||||||
Swaps | 3,924 | Present Value Method | Observable market data | — | — | |||||||||||
Exchange rate options | 27 | Black-Scholes Model | Observable market data | — | — | |||||||||||
Interest rate options | 73 | Black-Scholes Model | Observable market data | — | — | |||||||||||
Other financial liabilities at fair value Through profit or loss | 33,039 | Present Value Method | Observable market data | — | — | |||||||||||
Liabilities under insurance contracts | 7,356 | Note 15 | — | — | ||||||||||||
TOTAL | 252,604 | 211 | (178 | ) | ||||||||||||
| (*) | The use of observable market data assumes that the markets in which the Group operates are operationally efficient and, hence that such data is meaningful. The following are the principal assumptions used in the valuation of the financial instruments listed in the table above that are measured by means of internal models in which non-observable market data is utilized: |
F-24
Table of Contents
| • | Correlation: assumptions regarding the correlation between the value of market-traded assets and those non-traded assets are based on the historical correlation between the impact of adverse movements in market data and the corresponding valuation of the associated non-traded assets. The valuation will vary depending on whether a more or less conservative degree of correlation scenario is selected. | ||
| • | Dividend: estimates of the dividends used as inputs in internal models are based on the expected dividend distributions from the issuer companies. Since the expected dividend may change or differ depending on the source of the dividend data (generally either historic data or market consensus for option pricing), and the dividend policy of companies may vary, the measurement is adapted to arrive at the best estimate of a reasonable level of expected dividend within more or less conservative scenarios. | ||
| • | Liquidity: assumptions include estimates in response to market liquidity. For example to take into account market liquidity or where the financial instrument is part of a new or developing market where, due to lack of market prices that reflect a reasonable price for those products, the standard calculation methodology and estimates available may result in a less accurate valuation of the instrument at that time. |
| (**) | Principally includes short-term loans and repurchase agreements with corporate non-bank customers (mainly brokerage and investment firms). | |
| (***) | Includes credit risk derivatives with a fair value of€2.5 million (for assets) and€3.3 million (for liabilities) recognized on the consolidated balance sheet. These are measured by means of the Standard Gaussian Copula model, discussed above. | |
| (****) | Includes loans to Housing Associations in the United Kingdom (which are regulated and part Government-funded) secured by UK residential property. The fair values of the loans are modelled using observable market inputs, including current market transactions for UK Housing Associations of similar size and security structure. Due to the Government involvement with these entities, credit spreads have remained stable and are homogeneous across the industry. Model output values are benchmarked against current market transaction prices. |
As detailed in the table above, the potential effect on the valuation of financial instruments of a change in the principal assumptions (models, correlations and dividends) to other reasonably likely assumptions that are less favorable in the lower end of the reasonably likely range would be to decrease gains, or increase losses, by€178 million (2006:€141 million; 2005:€140 million). The effect of the use of reasonable assumptions that are more favorable than those used by the Group, in the top end of the reasonably likely range, would increase gains, or decrease losses, by€211 million (2006:€183 million; 2005:€155 million). |
The total loss recognized in the consolidated income statement for 2007 arising from the aforementioned valuation models amounted to€479 million (2006: total loss of€1,005 million; 2005: total gain of€762 million). |
| iv. | Recognition of fair value changes |
| As a general rule, changes in the carrying amount of financial assets and liabilities are recognized in the consolidated income statement, distinguishing between those arising from the accrual of interest and similar items -which are recognized under “Interest and similar income” or “Interest expense and similar charges”, as appropriate- and those arising for other reasons, which are recognized at their net amount under “Gains/losses on financial assets and liabilities”. | |||
| Adjustments due to changes in fair value arising from: |
| • | “Available-for-sale financial assets” are recognized temporarily in equity under “Valuation adjustments — Available-for-sale financial assets”, unless they relate to exchange differences, in which case they are recognized in “Valuation adjustments - Exchange differences” (exchange differences arising on monetary financial assets are recognized in “Exchange differences” in the consolidated income statement). | ||
| • | Items charged or credited to “Valuation adjustments — Available-for-sale financial assets” and “Valuation adjustments — Exchange differences” remain in the Group’s consolidated equity until the related assets are derecognized, whereupon they are charged to the consolidated income statement. | ||
| • | Unrealized gains on available-for-sale financial assets classified as “Non-current assets held for sale” because they form part of a disposal group or a discontinued operation are recognized in “Valuation adjustments — Non-current assets held for sale”. | ||
| • | “Financial liabilities at fair value through equity” are recognized in “Valuation adjustments — Financial liabilities at fair value through equity”. | ||
| v. | Hedging transactions |
| The consolidated entities use financial derivatives for the purpose of trading with customers who request these instruments in order to manage their own market and credit risks and for investment purposes; for the purpose of managing the risks of the Group entities’ own positions and assets and liabilities (“hedging derivatives”); or for the purpose of obtaining gains from changes in the prices of these derivatives. | |||
| Financial derivatives that do not qualify for hedge accounting are treated for accounting purposes as trading derivatives. |
F-25
Table of Contents
| A derivative qualifies for hedge accounting if all the following conditions are met: |
| 1. | The derivative hedges one of the following three types of exposure: |
| a. | Changes in the fair value of assets and liabilities due to fluctuations, among others, in the interest rate and/or exchange rate to which the position or balance to be hedged is subject (“fair value hedge”); | ||
| b. | Changes in the estimated cash flows arising from financial assets and liabilities, commitments and highly probable forecast transactions (“cash flow hedge”); | ||
| c. | The net investment in a foreign operation (“hedge of a net investment in a foreign operation”). |
| 2. | It is effective in offsetting exposure inherent in the hedged item or position throughout the expected term of the hedge, which means that: |
| a. | At the date of arrangement the hedge is expected, under normal conditions, to be highly effective (“prospective effectiveness”). | ||
| b. | There is sufficient evidence that the hedge was actually effective during the whole life of the hedged item or position (“retrospective effectiveness”). |
| 3. | There must be adequate documentation evidencing the specific designation of the financial derivative to hedge certain balances or transactions and how this effective hedge was expected to be achieved and measured, provided that this is consistent with the Group’s management of own risks. | ||
| The changes in value of financial instruments qualifying for hedge accounting are recognized as follows: |
| a. | In fair value hedges, the gains or losses arising on both the hedging instruments and the hedged items attributable to the type of risk being hedged are recognized directly in the consolidated income statement. | ||
| In fair value hedges of interest rate risk on a portfolio of financial instruments, the gains or losses that arise on measuring the hedging instruments are recognized directly in the consolidated income statement, whereas the gains or losses due to changes in the fair value of the hedged amount (attributable to the hedged risk) are recognized in the consolidated income statement with a balancing entry under “Changes in the fair value of hedged items in portfolio hedges of interest rate risk” on the asset or liability side of the balance sheet, as appropriate. | |||
| b. | In cash flow hedges, the effective portion of the change in value of the hedging instrument is recognized temporarily in equity under “Valuation adjustments — Cash flow hedges” until the forecast transactions occur, when it is recognized in the consolidated income statement, unless, if the forecast transactions result in the recognition of non-financial assets or liabilities, it is included in the cost of the non-financial asset or liability. The ineffective portion of the change in value of hedging derivatives is recognized directly in the consolidated income statement. | ||
| c. | In hedges of a net investment in a foreign operation, the gains and losses attributable to the portion of the hedging instruments qualifying as an effective hedge are recognized temporarily in equity under “Valuation adjustments — Hedges of net investments in foreign operations” until the gains or losses on the hedged item are recognized in the consolidated income statement. | ||
| d. | The ineffective portion of the gains and losses on the hedging instruments of cash flow hedges and hedges of a net investment in a foreign operation are recognized directly under “Gains/losses on financial assets and liabilities” in the consolidated income statement. |
| If a derivative designated as a hedge no longer meets the requirements described above due to expiration, ineffectiveness or for any other reason, the derivative is classified as a trading derivative. | |||
| When fair value hedge accounting is discontinued, the adjustments previously recognized on the hedged item are transferred to profit or loss at the effective interest rate re-calculated at the date of hedge discontinuation. The adjustments must be fully amortized at maturity. | |||
| When cash flow hedges are discontinued, any cumulative gain or loss on the hedging instrument recognized in equity under “Valuation adjustments” (from the period when the hedge was effective) remains recognized in equity until the forecast transaction occurs at which time it is recognized in profit or loss, unless the transaction is no longer expected to occur, in which case any cumulative gain or loss is recognized immediately in profit or loss. |
F-26
Table of Contents
| Derivatives embedded in other financial instruments or in other host contracts are accounted for separately as derivatives if their risks and characteristics are not closely related to those of the host contracts, provided that the host contracts are not classified as “Other financial assets/liabilities at fair value through profit or loss” or as “Financial assets/liabilities held for trading”. |
| e) | Derecognition of financial assets and liabilities | ||
| The accounting treatment of transfers of financial assets depends on the extent to which the risks and rewards associated with the transferred assets are transferred to third parties: |
| 1. | If the Group transfers substantially all the risks and rewards to third parties - -unconditional sale of financial assets, sale of financial assets under an agreement to repurchase them at their fair value at the date of repurchase, sale of financial assets with a purchased call option or written put option that is deeply out of the money, securitization of assets in which the transferor does not retain a subordinated debt or grant any credit enhancement to the new holders, and other similar cases-, the transferred financial asset is derecognized and any rights or obligations retained or created in the transfer are recognized simultaneously. | ||
| 2. | If the Group retains substantially all the risks and rewards associated with the transferred financial asset -sale of financial assets under an agreement to repurchase them at a fixed price or at the sale price plus interest, a securities lending agreement in which the borrower undertakes to return the same or similar assets, and other similar cases-, the transferred financial asset is not derecognized and continues to be measured by the same criteria as those used before the transfer. However, the following items are recognized: |
| a. | An associated financial liability, for an amount equal to the consideration received; this liability is subsequently measured at amortized cost. | ||
| b. | The income from the transferred financial asset not derecognized and any expense incurred on the new financial liability. |
| 3. | If the Group neither transfers nor retains substantially all the risks and rewards associated with the transferred financial asset -sale of financial assets with a purchased call option or written put option that is not deeply in or out of the money, securitization of assets in which the transferor retains a subordinated debt or other type of credit enhancement for a portion of the transferred asset, and other similar cases-, the following distinction is made: |
| a. | If the transferor does not retain control of the transferred financial asset, the asset is derecognized and any rights or obligations retained or created in the transfer are recognized. | ||
| b. | If the transferor retains control of the transferred financial asset, it continues to recognize it for an amount equal to its exposure to changes in value and recognizes a financial liability associated with the transferred financial asset. The net carrying amount of the transferred asset and the associated liability is the amortized cost of the rights and obligations retained, if the transferred asset is measured at amortized cost, or the fair value of the rights and obligations retained, if the transferred asset is measured at fair value. |
| Accordingly, financial assets are only derecognized when the rights on the cash flows they generate have been extinguished or when substantially all the inherent risks and rewards have been transferred to third parties. Similarly, financial liabilities are only derecognized when the obligations they generate have been extinguished or when they are acquired (with the intention either to cancel them or to resell them). |
| f) | Offsetting of financial instruments | ||
| Financial asset and liability balances are offset, i.e. reported in the consolidated balance sheet at their net amount, only if the subsidiaries currently have a legally enforceable right to set off the recognized amounts and intends either to settle them on a net basis or to realize the asset and settle the liability simultaneously. |
F-27
Table of Contents
| g) | Impairment of financial assets |
| i. | Definition |
| A financial asset is considered to be impaired -and therefore its carrying amount is adjusted to reflect the effect of impairment- when there is objective evidence that events have occurred which: |
| • | In the case of debt instruments (loans and debt securities), give rise to an adverse impact on the future cash flows that were estimated at the transaction date. | ||
| • | In the case of equity instruments, mean that their carrying amount may not be fully recovered. |
| As a general rule, the carrying amount of impaired financial instruments is adjusted with a charge to the consolidated income statement for the period in which the impairment becomes evident, and the reversal, if any, of previously recognized impairment losses is recognized in the consolidated income statement for the period in which the impairment is reversed or reduced. | |||
| Balances are deemed to be impaired, and the interest accrual is suspended, when there are reasonable doubts as to their full recovery and/or the collection of the related interest for the amounts and on the dates initially agreed upon, after taking into account the guarantees received by the consolidated entities to secure (fully or partially) collection of the related balances. Collections relating to impaired loans and advances are used to recognize the accrued interest and the remainder, if any, to reduce the principal amount outstanding. The amount of the financial assets that would be deemed to be impaired had the conditions thereof not been renegotiated is not material with respect to the Group’s financial statements taken as a whole. | |||
| When the recovery of any recognized amount is considered unlikely, the amount is written off, without prejudice to any actions that the consolidated entities may initiate to seek collection until their contractual rights are extinguished due to expiry of the statute-of-limitations period, forgiveness or any other cause. |
| ii. | Debt instruments measured at amortized cost |
| The amount of an impairment loss incurred on a debt instrument measured at amortized cost is equal to the difference between its carrying amount and the present value of its estimated future cash flows, and is presented as a reduction of the balance of the asset adjusted. | |||
| In estimating the future cash flows of debt instruments the following factors are taken into account: |
| • | All the amounts that are expected to be obtained over the remaining life of the instrument; including, where appropriate, those which may result from the collateral provided for the instrument (less the costs for obtaining and subsequently selling the collateral). The impairment loss takes into account the likelihood of collecting accrued interest receivable. | ||
| • | The various types of risk to which each instrument is subject, and | ||
| • | The circumstances in which collections will foreseeably be made. |
| These cash flows are subsequently discounted using the instrument’s effective interest rate (if its contractual rate is fixed) or the effective contractual rate at the discount date (if it is variable). | |||
| Specifically as regards impairment losses resulting from materialization of the insolvency risk of the obligors (credit risk), a debt instrument is impaired due to insolvency: |
| • | When there is evidence of a deterioration of the obligor’s ability to pay, either because it is in arrears or for other reasons, and/or | ||
| • | When country risk materializes: country risk is considered to be the risk associated with debtors resident in a given country due to circumstances other than normal commercial risk. |
| The Group has certain policies, methods and procedures for covering its credit risk arising both from insolvency allocable to counterparties and from country risk. | |||
| These policies, methods and procedures are applied in the granting, examination and documentation of debt instruments, and contingent liabilities and commitments, the identification of their impairment and the calculation of the amounts necessary to cover the related credit risk. |
F-28
Table of Contents
| 1. | Specific credit risk allowance: |
| a. | Specific allowance: | ||
| The impairment of debt instruments not measured at fair value through profit or loss that are classified as doubtful are generally recognized in accordance with the criteria set forth below: |
| i. | Assets classified as doubtful due to counterparty arrears: | ||
| Debt instruments, whoever the obligor and whatever the guarantee or collateral, with amounts more than three months past due are assessed individually, taking into account the age of the past-due amounts, the guarantees or collateral provided and the financial situation of the counterparty and the guarantors. | |||
| The allowance percentages applied to unsecured transactions, based on the age of the past-due amounts, are as follows: |
| • | Less than 6 months: between 4.5% and 5.3% | ||
| • | More than 6 months and less than 12 months: between 27.4% and 27.8% | ||
| • | More than 12 months and less than 18 months: between 60.5% and 65.1% | ||
| • | More than 18 months and less than 24 months: between 93.3% and 95.8% | ||
| • | More than 24 months: 100% |
| • | Less than 3 years, provided that the outstanding loan does not exceed 80% of the appraisal value of the home: 2% | ||
| • | More than 3 years and less than 4 years: 25% | ||
| • | More than 4 years and less than 5 years: 50% | ||
| • | More than 5 years and less than 6 years: 75% | ||
| • | More than 6 years: 100% |
| • | Less than 6 months: between 3.8% and 4.5% | ||
| • | More than 6 months and less than 12 months: between 23.3% and 23.6% | ||
| • | More than 12 months and less than 18 months: between 47.2% and 55.3% | ||
| • | More than 18 months and less than 24 months: between 79.3% and 81.4% | ||
| • | More than 24 months: 100% |
| ii. | Assets classified as doubtful for reasons other than counterparty arrears: | ||
| Debt instruments which are not classifiable as doubtful due to arrears but for which there are reasonable doubts as to their repayment under the contractual terms are assessed individually, and their allowance is the difference between the amount recognized in assets and the present value of the cash flows expected to be received. |
| b. | General allowance for inherent losses: | ||
| The Group covers its losses inherent in debt instruments not measured at fair value through profit or loss and in contingent liabilities taking into account the historical experience of impairment and other circumstances known at the time of assessment. For these purposes, inherent losses are losses incurred at the reporting date, calculated using statistical methods, that have not yet been allocated to specific transactions. | |||
| The Group uses the expected loss concept to quantify the cost of the credit risk and include it in the calculation of the risk-adjusted return of its transactions. The parameters necessary for this calculation are also used to calculate economic capital and, in the future, to calculate BIS II regulatory capital under internal models (Note 1-f). | |||
| Expected loss is the expected cost, on average in a complete business cycle, of the credit risk of a transaction, considering the characteristics of the counterparty and the guarantees and collateral associated with the transaction. | |||
| The expected loss is calculated by multiplying three factors: “exposure at default”, “probability of default” and “loss given default”. |
F-29
Table of Contents
| • | Exposure at default (EAD) is the amount of risk exposure at the date of default by the counterparty. | ||
| • | Probability of default (PD) is the probability of the counterparty failing to meet its principal and/or interest payment obligations. The probability of default is associated with the rating/scoring of each counterparty/transaction. | ||
| PD is measured using a time horizon of one year; i.e. it quantifies the probability of the counterparty defaulting in the coming year. The definition of default used includes past-dues by 90 days or more and cases in which there is no default but there are doubts as to the solvency of the counterparty (subjective doubtful assets). | |||
| • | Loss given default (LGD) is the loss arising in the event of default. It depends mainly on the guarantees associated with the transaction. |
| 1. | Low default portfolios | ||
| In certain portfolios (sovereign risk, credit institutions or large corporations) the number of defaults observed is very small or zero. In these cases, the Group opted to use the data contained in the credit derivative spreads to estimate the expected loss discounted by the market and break it down into PD and LGD. | |||
| 2. | Top-down units | ||
| In the cases in which the Group does not have sufficient data to construct a sufficiently robust credit risk measurement model, the expected loss on the loan portfolios is estimated based on a top-down approximation in which the historically observed average cost of the loan portfolios is used as the best estimate of the expected loss. As the credit models are developed and bottom-up measurements are obtained, the top-down measurements used for these units are gradually replaced. |
| • | Negligible risk: 0% | ||
| • | Low risk: 0.20% — 0.75% | ||
| • | Medium-low risk: 0.50% — 1.88% | ||
| • | Medium risk: 0.59% — 2.25% | ||
| • | Medium-high risk: 0.66 — 2.50% | ||
| • | High risk: 0.83% — 3.13% |
| 2. | Country risk allowance: | ||
| Country risk is considered to be the risk associated with counterparties resident in a given country due to circumstances other than normal commercial risk (sovereign risk, transfer risk and risks arising from international financial activity). Based on the countries’ economic performance, political situation, regulatory and institutional framework, and payment capacity and record, the Group classifies all the transactions performed with third parties into six different groups, from group 1 (transactions with ultimate obligors resident in European Union countries, Norway, Switzerland, Iceland, the United States, Canada, Japan, Australia and New Zealand) to group 6 (transactions the recovery of which is considered remote due to circumstances attributable to the country), assigning to each group the credit loss allowance percentages resulting from the aforementioned analyses. |
F-30
Table of Contents
| However, due to the size of the Group and to the proactive management of its country risk exposure, the allowances recognized in this connection are not material with respect to the credit loss allowances recognized. | |||
| iii. | Debt or equity instruments classified as available for sale |
| iv. | Equity instruments measured at cost |
| The impairment loss on equity instruments measured at cost is the difference between the carrying amount and the present value of the expected future cash flows discounted at the market rate of return for similar securities. | |||
| Impairment losses are recognized in the consolidated income statement for the period in which they arise as a direct reduction of the cost of the instrument. These losses can only be reversed subsequently if the related assets are sold. | |||
| h) | Repurchase agreements and reverse repurchase agreements | ||
| Purchases (sales) of financial assets under a non-optional resale (repurchase) agreement at a fixed price (“repos”) are recognized in the consolidated balance sheet as financing granted (received), based on the nature of the debtor (creditor), under “Loans and advances to credit institutions” or “Loans and advances to customers” (“Deposits from credit institutions” or “Customer deposits”). | |||
| Differences between the purchase and sale prices are recognized as interest over the contract term. | |||
| i) | Non-current assets held for sale and Liabilities associated with non-current assets held for sale | ||
| “Non-current assets held for sale” includes the carrying amount of individual items or disposal groups or items forming part of a business unit earmarked for disposal (“Discontinued operations”), whose sale in their present condition is highly probable and is expected to occur within one year from the reporting date. Therefore, the carrying amount of these items -which can be of a financial nature or otherwise- will foreseeably be recovered through the proceeds from their disposal. Specifically, property or other non-current assets received by the consolidated entities as total or partial settlement of their debtors’ payment obligations to them are deemed to be non-current assets held for sale, unless the consolidated entities have decided to make continuing use of these assets. | |||
| “Liabilities associated with non-current assets” includes the credit balances arising from assets or disposal groups and from discontinued operations. | |||
| Non-current assets held for sale are generally measured at the lower of fair value less costs to sell and their carrying amount at the date of classification in this category. Non-current assets held for sale are not depreciated as long as they remain in this category. | |||
| Impairment losses on an asset or disposal group arising from a reduction in its carrying amount to its fair value (less costs to sell) are recognized under “Impairment losses — Non-current assets held for sale” in the consolidated income statement. The gains on a non-current asset held for sale resulting from subsequent increases in fair value (less costs to sell) increase its carrying amount and are recognized in the consolidated income statement up to an amount equal to the impairment losses previously recognized. |
F-31
Table of Contents
| j) | Reinsurance assets and Liabilities under insurance contracts | ||
| Insurance contracts involve the transfer of a certain quantifiable risk in exchange for a periodic or one-off premium. The effects on the Group’s cash flow will arise from a deviation in the payments forecast and/or an insufficiency in the premium set. | |||
| The Group controls its insurance risk as follows: |
| • | By applying of a strict methodology in the launch of products and in the assignment of value thereto. | ||
| • | By using deterministic and stochastic models for measuring commitments. | ||
| • | By using reinsurance as a risk mitigation technique as part of the credit quality guidelines in line with the Group’s general risk policy. | ||
| • | By establishing an operating framework for credit risks. | ||
| • | By actively managing asset and liability matching. | ||
| • | By applying security measures in processes. |
| • | Current estimates of future cash flows under the insurance contracts of the consolidated entities. These estimates include all contractual cash flows and any related cash flows, such as claims handling costs; and | ||
| • | The value recognized in the consolidated balance sheet for insurance liabilities (Note 15), net of any related deferred acquisition costs or related intangible assets, such as the amount paid to acquire, in the event of purchase by the entity, the economic rights held by a broker deriving from policies in the entity’s portfolio. |
F-32
Table of Contents
| k) | Tangible assets | ||
| “Tangible assets” includes the amount of buildings, land, furniture, vehicles, computer hardware and other fixtures owned by the consolidated entities or acquired under finance leases. Tangible assets are classified by use as follows: |
| i. | Property, plant and equipment for own use |
| Annual | ||||
| Rate | ||||
| Buildings for own use | 2 | |||
| Furniture | 7.5 – 10 | |||
| Fixtures | 6 – 10 | |||
| Office and IT equipment | 10 – 25 | |||
| Leasehold improvements | 5 – 10 | |||
| ii. | Investment property |
F-33
Table of Contents
| iii. | Other assets leased out under an operating lease |
| l) | Accounting for leases |
| i. | Finance leases |
| ii. | Operating leases |
| iii. | Sale and leaseback transactions |
| m) | Intangible assets | ||
| Intangible assets are identifiable non-monetary assets (separable from other assets) without physical substance which arise as a result of a legal transaction or which are developed internally by the consolidated entities. Only assets whose cost can be estimated reliably and from which the consolidated entities consider it probable that future economic benefits will be generated are recognized. | |||
| Intangible assets are recognized initially at acquisition or production cost and are subsequently measured at cost less any accumulated amortization and any accumulated impairment losses. |
F-34
Table of Contents
| i. | Goodwill |
| • | If it is attributable to specific assets and liabilities of the companies acquired, by increasing the value of the assets (or reducing the value of the liabilities) whose fair values were higher (lower) than the carrying amounts at which they had been recognized in the balance sheets of the acquirees. | ||
| • | If it is attributable to specific intangible assets, by recognizing it explicitly in the consolidated balance sheet provided that the fair value of these assets within 12 months following the date of acquisition can be measured reliably. | ||
| • | The remaining amount is recognized as goodwill, which is allocated to one or more specific cash-generating units (a cash generating unit is the smallest identifiable group of assets that, as a result of continuing operation, generates cash inflows that are largely independent of the cash inflows from other assets or groups of assets). The cash-generating units represent the Group’s geographical and/or business segments. |
| ii. | Other intangible assets |
F-35
Table of Contents
| n) | Prepayments and accrued income and Accrued expenses and deferred income | ||
| These items include all the balances of prepayments and accrued income and of accrued expenses and deferred income, excluding accrued interest. | |||
| ñ) | Other assets and Other liabilities | ||
| “Other assets” in the consolidated balance sheet includes the amount of assets not recorded in other items, the breakdown being as follows: |
| • | Inventories: this item includes the amount of assets, other than financial instruments, that are held for sale in the ordinary course of business, that are in the process of production, construction or development for such purpose, or that are to be consumed in the production process or in the provision of services. “Inventories” includes land and other property held for sale in the property development business. | ||
| Inventories are measured at the lower of cost and net realizable value, which is the estimated selling price of the inventories in the ordinary course of business, less the estimated costs of completion and the estimated costs required to make the sale. | |||
| Any write-downs of inventories -such as those due to damage, obsolescence or reduction of selling price- to net realizable value and other impairment losses are recognized as expenses for the year in which the impairment or loss occurs. Subsequent reversals are recognized in the consolidated income statement for the year in which they occur. | |||
| The carrying amount of inventories is derecognized and recognized as an expense in the period in which the revenue from their sale is recognized. This expense is included under “Cost of sales” in the accompanying consolidated income statements (Note 47) when it relates to activities of the non-financial entities that do not form part of the consolidable group of credit institutions or under “Other operating expenses” in all other cases. | |||
| • | Other: this item includes the amount of the difference between pension plan obligations and the value of the plan assets with a debit balance for the entity, when the net amount is to be reported in the consolidated balance sheet, and the amount of any other assets not included in other items. |
| o) | Provisions and contingent assets and liabilities | ||
| The directors of the consolidated entities, in preparing their respective financial statements, made a distinction between: |
| • | Provisions: credit balances covering present obligations at the balance sheet date arising from past events which could give rise to a loss for the consolidated entities, which is considered to be likely to occur and certain as to its nature but uncertain as to its amount and/or timing; and | ||
| • | Contingent liabilities: possible obligations that arise from past events and whose existence will be confirmed only by the occurrence or non-occurrence of one or more future events not wholly within the control of the consolidated entities. They include the present obligations of the consolidated entities when it is not probable that an outflow of resources embodying economic benefits will be required to settle them. | ||
| • | Contingent assets: possible assets that arise from past events and whose existence is conditional on, and will be confirmed only by, the occurrence or non-occurrence of events beyond the control of the Group. Contingent assets are not recognized in the consolidated balance sheet or in the consolidated income statement, but rather are disclosed in the notes, provided that it is probable that these assets will give rise to an increase in resources embodying economic benefits. |
F-36
Table of Contents
| • | Provisions for pensions and similar obligations: includes the amount of all the provisions made to cover post-employment benefits, including obligations to early retirees and similar obligations. | ||
| • | Provisions for taxes: includes the amount of the provisions made to cover tax contingencies. | ||
| • | Provisions for contingent liabilities and commitments: includes the amount of the provisions made to cover contingent liabilities -defined as those transactions in which the Group guarantees the obligations of a third party, arising as a result of financial guarantees granted or contracts of another kind- and contingent commitments -defined as irrevocable commitments that may give rise to the recognition of financial assets. | ||
| • | Other provisions: includes the amount of other provisions made by the consolidated entities. This item includes, inter alia, provisions for restructuring costs and litigation (Note 25). |
| p) | Litigation and/or claims in process | ||
| In addition to the disclosures made in Note 1, at the end of 2007 certain litigation and claims were in process against the consolidated entities arising from the ordinary course of their operations (Note 25). | |||
| q) | Own equity instruments | ||
| Own equity instruments are those meeting both of the following conditions: |
| • | The instruments do not include any contractual obligation for the issuer: (i) to deliver cash or another financial asset to a third party; or (ii) to exchange financial assets or financial liabilities with a third party under conditions that are potentially unfavorable to the issuer. | ||
| • | The instruments will or may be settled in the issuer’s own equity instruments and are: (i) a non-derivative that includes no contractual obligation for the issuer to deliver a variable number of its own equity instruments; or (ii) a derivative that will be settled by the issuer through the exchange of a fixed amount of cash or another financial asset for a fixed number of its own equity instruments. |
| r) | Equity-instrument-based employee remuneration | ||
| Equity instruments delivered to employees in consideration for their services, if the instruments are delivered once the specific period of service has ended, are recognized as an expense for services (with the corresponding increase in equity) as the services are rendered by employees during the service period. At the grant date the services received (and the related increase in equity) are measured at the fair value of the equity instruments granted. If the equity instruments granted are vested immediately, the Group recognizes in full, at the grant date, the expense for the services received. | |||
| When the requirements stipulated in the remuneration agreement include external market conditions (such as equity instruments reaching a certain quoted price), the amount ultimately to be recognized in equity will depend on the other conditions being met by the employees, irrespective of whether the market conditions are satisfied. If the conditions of the agreement are met but the external market conditions are not satisfied, the amounts previously recognized in equity are not reversed, even if the employees do not exercise their right to receive the equity instruments. |
F-37
Table of Contents
| s) | Recognition of income and expenses | ||
| The most significant criteria used by the Group to recognize its income and expenses are summarized as follows: |
| i. | Interest income, interest expenses and similar items |
| ii. | Commissions, fees and similar items |
| • | Fee and commission income and expenses relating to financial assets and financial liabilities measured at fair value through profit or loss are recognized when paid. | ||
| • | Those arising from transactions or services that are performed over a period of time are recognized over the life of these transactions or services. | ||
| • | Those relating to services provided in a single act are recognized when the single act is carried out. |
| iii. | Non-finance income and expenses |
| iv. | Deferred collections and payments |
| v. | Loan arrangement fees |
| t) | Financial guarantees | ||
| “Financial guarantees” are defined as contracts whereby an entity undertakes to make specific payments for a third party if the latter does not do so, irrespective of the various legal forms they may have, such as guarantees, irrevocable documentary credits issued or confirmed by the entity, insurance and credit derivatives. | |||
| The Group initially recognizes the financial guarantees provided on the liability side of the consolidated balance sheet at fair value, which is generally the present value of the fees, commissions and similar interest receivable from these contracts over the term thereof, and simultaneously the Group recognizes, on the asset side of the consolidated balance sheet, the amount of the fees, commissions and interest received at the start of the transactions and the amounts receivable at the present value of the fees, commissions and interest receivable. | |||
| Financial guarantees, regardless of the guarantor, instrumentation or other circumstances, are reviewed periodically so as to determine the credit risk to which they are exposed and, if appropriate, to consider whether a provision is required. The credit risk is determined by application of criteria similar to those established for quantifying impairment losses on debt instruments measured at amortized cost as described in section g) above. |
F-38
Table of Contents
| The provisions made for these transactions are recognized under “Provisions — Provisions for contingent liabilities and commitments” in the consolidated balance sheet (Note 25). These provisions are recognized and reversed with a charge or credit, respectively, to “Provisions (net)” in the consolidated income statement. | |||
| If a specific provision is required for financial guarantees, the related unearned commissions recognized under “Accrued expenses and deferred income” in the consolidated balance sheet are reclassified to the appropriate provision. | |||
| u) | Assets under management and investment and pension funds managed by the Group | ||
| Assets owned by third parties and managed by the consolidated entities are not presented on the face of the consolidated balance sheet. Management fees are included in “Fee and commission income” in the consolidated income statement. Note 36-b contains information on the third-party assets managed by the Group. | |||
| The investment funds and pension funds managed by the consolidated entities are not presented on the face of the Group’s consolidated balance sheet since the related assets are owned by third parties. The fees and commissions earned in the year for the services rendered by the Group entities to these funds (asset management and custody services) are recognized under “Fee and commission income” in the consolidated income statement. | |||
| v) | Post-employment benefits | ||
| Under the collective labor agreements currently in force and other arrangements, the Spanish banks included in the Group and certain other Spanish and foreign consolidated entities have undertaken to supplement the public social security system benefits accruing to certain employees, and to their beneficiary right holders, for retirement, permanent disability or death, the benefits and indemnity payments payable, the contributions to employee welfare systems for early retirees and the post-employment welfare benefits. | |||
| The Group’s post-employment obligations to its employees are deemed to be “defined contribution plans” when the Group makes pre-determined contributions (recognized in “Personnel expenses” in the consolidated income statement) to a separate entity and will have no legal or effective obligation to make further contributions if the separate entity cannot pay the employee benefits relating to the service rendered in the current and prior periods. Post-employment obligations that do not meet the aforementioned conditions are classified as “defined benefit plans” (Note 25). | |||
Defined contribution plans | |||
| The contributions made in this connection in each year are recognized under “Personnel expenses” in the consolidated income statement. The amounts not yet contributed at each year-end are recognized, at their present value, under “Provisions — Provisions for pensions and similar obligations” on the liability side of the consolidated balance sheet. | |||
Defined benefit plans | |||
| The Group recognizes under “Provisions — Provisions for pensions and similar obligations” on the liability side of the consolidated balance sheet (or under “Other assets — Other” on the asset side, as appropriate) the present value of its defined benefit post-employment obligations, net of the fair value of the plan assets and of the net unrecognized cumulative actuarial gains and/or losses disclosed in the valuation of these obligations, which are deferred using a corridor approach, and net of the past service cost, which is deferred over time, as explained below. | |||
| “Plan assets” are defined as those that will be directly used to settle obligations and that meet the following conditions: |
| • | They are not owned by the consolidated entities, but by a legally separate third party that is not a party related to the Group. | ||
| • | They can only be used to pay or finance post-employment benefits and cannot be returned to the consolidated entities unless the assets remaining in the plan are sufficient to meet all obligations of the plan and of the entity relating to current or former employee benefits, or to reimburse employee benefits already paid by the Group. |
F-39
Table of Contents
| • | Current service cost -defined as the increase in the present value of the obligations resulting from employee service in the current period-, under “Personnel expenses”. | ||
| • | Interest cost -defined as the increase during the year in the present value of the obligations as a result of the passage of time-, under “Interest expense and similar charges”. When obligations are presented on the liability side of the consolidated balance sheet, net of the plan assets, the cost of the liabilities recognized in the income statement relates exclusively to the obligations recognized as liabilities. | ||
| • | The expected return on plan assets and the gains or losses on the value of the plan assets, less any plan administration costs and less any applicable taxes, under “Interest and similar income”. | ||
| • | The actuarial gains and losses calculated using the corridor approach and the unrecognized past service cost, under “Provisions (net)” in the consolidated income statement. |
| w) | Other long-term employee benefits | ||
| “Other long-term employee benefits”, defined as obligations to early retirees -taken to be those who have ceased to render services at the entity but who, without being legally retired, continue to have economic rights vis-à-vis the entity until they acquire the legal status of retiree-, long-service bonuses, obligations for death of spouse or disability before retirement that depend on the employee’s length of service at the entity and other similar items, are treated for accounting purposes, where applicable, as established above for defined benefit post-employment plans, except that all past service costs and actuarial gains and losses are recognized immediately (Note 25). | |||
| x) | Termination benefits | ||
| Termination benefits are recognized when there is a detailed formal plan identifying the basic changes to be made, provided that implementation of the plan has begun, its main features have been publicly announced or objective facts concerning its implementation have been disclosed. | |||
| y) | Income tax | ||
| The expense for Spanish corporation tax and other similar taxes applicable to the foreign consolidated entities is recognized in the consolidated income statement, except when it results from a transaction recognized directly in equity, in which case the tax effect is also recognized in equity. | |||
| The current income tax expense is calculated as the sum of the current tax resulting from application of the appropriate tax rate to the taxable profit for the year (net of any deductions allowable for tax purposes), and of the changes in deferred tax assets and liabilities recognized in the consolidated income statement. | |||
| Deferred tax assets and liabilities include temporary differences, which are identified as the amounts expected to be payable or recoverable on differences between the carrying amounts of assets and liabilities and their related tax bases, and tax loss and tax credit carryforwards. These amounts are measured at the tax rates that are expected to apply in the period when the asset is realized or the liability is settled. |
F-40
Table of Contents
| “Tax assets” includes the amount of all tax assets, which are broken down into “current” - -amounts of tax to be recovered within the next twelve months- and “deferred” -amounts of tax to be recovered in future years, including those arising from unused tax losses or tax credits. | |||
| “Tax liabilities” includes the amount of all tax liabilities (except provisions for taxes), which are broken down into “current” -the amount payable in respect of the income tax on the taxable profit for the year and other taxes in the next twelve months- and “deferred” -the amount of income tax payable in future years. | |||
| Deferred tax liabilities are recognized in respect of taxable temporary differences associated with investments in subsidiaries, associates or joint ventures, except when the Group is able to control the timing of the reversal of the temporary difference and, in addition, it is probable that the temporary difference will not reverse in the foreseeable future. | |||
| Deferred tax assets are only recognized for temporary differences to the extent that it is considered probable that the consolidated entities will have sufficient future taxable profits against which the deferred tax assets can be utilized, and the deferred tax assets do not arise from the initial recognition (except in a business combination) of other assets and liabilities in a transaction that affects neither taxable profit or accounting profit. Other deferred tax assets (tax loss and tax credit carryforwards) are only recognized if it is considered probable that the consolidated entities will have sufficient future taxable profits against which they can be utilized. | |||
| Income and expenses recognized directly in equity are accounted for as temporary differences. | |||
| The deferred tax assets and liabilities recognized are reassessed at each balance sheet date in order to ascertain whether they still exist, and the appropriate adjustments are made on the basis of the findings of the analyses performed. | |||
| Law 35/2006, of 28 November, on personal income tax and partially amending the Spanish Corporation Tax, Non-resident Income Tax and Wealth Tax Laws, establishes, inter alia, a reduction over two years of the standard tax rate for Spanish corporation tax purposes, which until December 31, 2006 was 35%, as follows: |
| Tax Periods | ||||
| Beginning on or after | Tax Rate | |||
| January 1, 2007 | 32.5 | % | ||
| January 1, 2008 | 30.0 | % | ||
| z) | Residual maturity periods and average interest rates | ||
| The analysis of the maturities of the balances of certain items in the consolidated balance sheets and the average interest rates at 2007, 2006 and 2005 year-end is provided in Note 53. | |||
| aa) | Consolidated cash flow statements | ||
| The following terms are used in the consolidated cash flow statements with the meanings specified: |
| • | Cash flows: inflows and outflows of cash and cash equivalents, which are short-term, highly liquid investments that are subject to an insignificant risk of changes in value. | ||
| • | Operating activities: the principal revenue-producing activities of credit institutions and other activities that are not investing or financing activities. | ||
| • | Investing activities: the acquisition and disposal of long-term assets and other investments not included in cash and cash equivalents. | ||
| • | Financing activities: activities that result in changes in the size and composition of the equity and liabilities that are not operating activities. |
F-41
Table of Contents
| 3. | Santander Group |
| a) | Banco Santander, S.A. and international Group structure | ||
| The growth of the Group in the last decade has led the Bank to also act, in practice, as a holding entity of the shares of the various companies in its Group, and its results are becoming progressively less representative of the performance and earnings of the Group. Therefore, each year the Bank determines the amount of the dividends to be distributed to its shareholders on the basis of the consolidated net profit, while maintaining the Group’s traditionally high level of capitalization and taking into account that the transactions of the Bank and of the rest of the Group are managed on a consolidated basis (notwithstanding the allocation to each company of the related net worth effect). | |||
| At international level, the various banks and other subsidiaries, jointly controlled entities and associates of the Group are integrated in a corporate structure comprising various holding companies which are the ultimate shareholders of the banks and subsidiaries abroad. | |||
| The purpose of this structure, all of which is controlled by the Bank, is to optimize the international organization from the strategic, economic, financial and tax standpoints, since it makes it possible to define the most appropriate units to be entrusted with acquiring, selling or holding stakes in other international entities, the most appropriate financing method for these transactions and the most appropriate means of remitting the profits obtained by the Group’s various operating units to Spain. | |||
| The Exhibits provide relevant data on the consolidated Group companies and on the companies accounted for using the equity method. | |||
| b) | ABN AMRO Holding N.V. (“ABN AMRO”) | ||
| On July 20, 2007, having obtained the regulatory authorizations required to publish the documentation on the takeover bid for ABN AMRO, the Bank, together with the Royal Bank of Scotland Group plc, Fortis N.V. and Fortis S.A./N.V. (together, “the Banks”) formally launched, through RFS Holdings B.V., the offer for all the ordinary shares, ADSs and previously convertible preference shares of ABN AMRO. The initial acceptance period of this offer (“the Offer”) ended on October 5, 2007. | |||
| On October 10, 2007 the Banks declared the Offer to be unconditional. At that date, the owners of 86% of the ordinary share capital of ABN AMRO had accepted the Offer (including certain shares that the Banks already owned and had undertaken to contribute to RFS Holdings B.V.). | |||
| On this same date the commencement of an additional offer period was announced, during which the holders of ordinary shares and ADSs of ABN AMRO could sell them, under the same terms and conditions as those of the Offer, until October 31, 2007. | |||
| Once the aforementioned additional offer period had ended, the owners of 98.8% of the ordinary share capital of ABN AMRO (excluding its treasury shares) had definitively accepted the Offer. | |||
The investment made by the Bank amounts to€20,615 million and, at December 31, 2007, consisted of the Bank’s 27.9% ownership interest in the share capital of RFS Holdings B.V., the holding entity of the shares of ABN AMRO. | |||
| Following all these actions, the spin-off of the business lines of ABN AMRO commenced with a view to their subsequent integration into each of the Banks. The following correspond to Banco Santander: the Latin American Business Unit of ABN AMRO -basically Banco ABN AMRO Real S.A. (“Banco Real”) in Brazil-, the Banca Antoniana Popolare Veneta Spa Banking Group (“Antonveneta”), the cash relating to the sale of the consumer banking unit of ABN AMRO in the Netherlands -Interbank and DMC Consumer Finance-, plus 27.9% of the assets that were not allocated to any of the Banks of the consortium and which are intended to be disposed of. The finalization of the asset spin-off and integration process is subject to approval, among other regulators, by the Dutch Central Bank, which is expected to be obtained in 2008. |
F-42
Table of Contents
On November 15, 2007, ABN AMRO sold the aforementioned consumer finance units located in the Netherlands for€98 million. Additionally, on November 8, 2007, the Bank entered into an agreement with Monte dei Paschi di Siena for the sale, at the earliest possible date and no later than September 2008, of Antonveneta (excluding Interbanca, the corporate banking division of Antonveneta, whose net investment value amounts to approximately€800 million) for€9,000 million. The transaction is subject to the approval of the competent authorities (Note 12). | |||
Accordingly, once the sale of Antonveneta to Monte dei Paschi di Siena has been authorized, the net investment made by the Bank, basically in Banco Real and Interbanca, will amount to approximately€11,615 million (Note 13). | |||
Banco Real | |||
| Banco Real is the fourth-largest bank in Brazil in terms of volume of loans, deposits and income. It has an extensive distribution network (1,900 branches and 8,700 ATMs), which enables it to carry on in full the retail and wholesale banking activities throughout Brazil, catering for over 13 million customers. It also has entities specializing in private banking and vehicle financing, the last-mentioned business activity being related to more than 15,000 car dealers. | |||
| Owing to the potential and the geographical and business complementarity of Santander Brazil and Banco Real, their combination grants them a banking leadership in all of Brazil, with a market share and an infrastructure equal to those of the two leading private banks, and gives rise to the second-largest bank in terms of deposits, the third-largest in terms of lending and network size, and the fourth-largest in terms of income. | |||
At December 31, 2006, Banco Real had assets amounting to BRL 120,830 million (€50,000 million), equity amounting to BRL 9,779 million (€4,000 million) and attributed profit amounting to BRL 2,480 million (€1,000 million). | |||
| c) | Acquisitions and disposals | ||
| The other main equity investments acquired and sold by the Group in 2007, 2006 and 2005 and other significant corporate transactions were as follows: |
| i. | Abbey National plc (Abbey) |
| ii. | Abbey’s insurance business |
| iii. | Interbanco, S.A. (Interbanco) |
F-43
Table of Contents
| iv. | Elcon Finans AS (Elcon) and Bankia Bank ASA (Bankia) |
| v. | Compañía Española de Petróleos, S.A. (Cepsa) |
| vi. | Unión Eléctrica Fenosa, S.A. (Unión Fenosa) |
F-44
Table of Contents
| vii. | Sovereign Bancorp Inc. (Sovereign) |
| viii. | Island Finance |
| ix. | Drive Consumer USA, Inc. (Drive) |
F-45
Table of Contents
| x. | Banco Santander Chile |
| xi. | Merger |
| xii. | Inmobiliaria Urbis, S.A. (Urbis) |
| xiii. | Unifin S.p.A. (Unifin) |
| xiv. | Banco Portugués de Investimento (BPI) |
F-46
Table of Contents
| xv. | Santander Consumer Chile |
| xvi. | Orígenes AFJP and Orígenes Seguros de Retiro |
| xvii. | Pension fund managers |
| xviii. | CB Extrobank |
| d) | Off-shore entities | ||
| At December 31, 2007, the Group had ownership interests in the share capital of 19 subsidiaries resident in tax havens, excluding Abbey subsidiaries, which are dealt with at the end of this note. | |||
| The individual results of these subsidiaries, calculated in accordance with local accounting principles, are shown in the Exhibits to these consolidated financial statements together with other data thereon. | |||
| It should be noted that the individual results include transactions performed with other Group companies, such as dividend collection, recognition and reversal of provisions and corporate restructuring results which, in accordance with accounting standards, are eliminated on consolidation in order to avoid the duplication of profit or the recognition of intra-Group results. Individual results also include the profit attributable to the holders of preference shares. Therefore, they are not representative of the Group’s operations in these countries or of the results contributed to the Santander Group. | |||
These banks and companies, whose activities are detailed below, contributed€146 million to the Group’s consolidated profit. | |||
| These Group entities operate mainly in the Bahamas and have a total of 137 employees. | |||
| The business activities of these entities are classified into four categories, namely: |
F-47
Table of Contents
| i. | Operating subsidiaries engaging in banking or financial activities |
| • | Santander Bank and Trust, Ltd., a bank resident in the Bahamas which engages mainly in international private banking for foreign customers. It also handles investments in bonds and equities and financing transactions. | ||
| • | Banco Santander Bahamas International, Ltd., an entity resident in the Bahamas which engages mainly in financing transactions and equities trading. | ||
| • | Santander Investment Limited, a company resident in the Bahamas which is managed from the New York branch. It performs brokerage and investment activities in the US market, mainly related to Latin American fixed-income securities. | ||
| • | Santander Trade Services, Ltd. (Hong Kong), an intermediary in export documentary credits | ||
| • | Banco Santander (Panamá), S.A. performs a limited banking activity. | ||
| ii. | Inactive or mere asset holding subsidiaries |
| • | Santander Merchant Bank, Ltd., (Bahamas), inactive. | ||
| • | Santander Investment Bank, Ltd., (Bahamas), a mere asset holding company. | ||
| • | Pan American Bank, Ltd., a Bahamas-resident bank which is inactive. | ||
| • | Serfin International Bank and Trust, Ltd. (Cayman Islands), a bank which is virtually inactive. | ||
| • | Larix Limited, an Isle of Man-resident property and marketable securities holding company. | ||
| iii. | Holding companies |
F-48
Table of Contents
| iv. | Issuing companies |
| 1. | Issuers of preferred securities: |
| • | Banesto Holdings, Ltd. (Guernsey) | ||
| • | Totta & Açores Financing, Limited (Cayman Islands) | ||
| • | Pinto Totta International Finance, Limited (Cayman Islands): its last issue expired in August 2007 and, accordingly, it is expected to be liquidated in 2008. |
| 2. | Issuers of debt: |
| • | Banesto Issuances, Ltd. (Cayman Islands) | ||
| • | Santander Central Hispano Financial Services, Ltd. (Cayman Islands) | ||
| • | Santander Central Hispano International, Ltd. (Cayman Islands) | ||
| • | Santander Central Hispano Issuances, Ltd. (Cayman Islands) |
| Millions | ||||||
| Unit | Location | of Euros | ||||
| Santander Bank & Trust, Ltd. | Bahamas | 219 | ||||
| Santander Investment Limited | Bahamas | (30 | ) | |||
| Banco Santander Bahamas International, Ltd. | Bahamas | 45 | ||||
| Santander Trade Services, Ltd. | Hong Kong | 7 | ||||
| Holbah, Ltd. | Bahamas | (87 | ) | |||
| Holbah II, Ltd. | Bahamas | (13 | ) | |||
F-49
Table of Contents
| • | Insurance, carried on by two subsidiaries: James Hay Insurance Company Limited in Jersey and Baker Street Risk and Insurance (Guernsey) Limited in Guernsey. | ||
| • | Issuance, carried on by two subsidiaries in Jersey: Abbey National GP (Jersey) Limited and AN Structured Issues Limited. | ||
| • | Banking, performed by one subsidiary in Jersey: Abbey National International Limited. | ||
| • | Four portfolio or asset holding companies, of which three are located in Jersey –Abbey National Offshore Holdings Limited, Abbey National Jersey International Limited and Brettwood Limited– and one in Gibraltar –Abbey National (Gibraltar) Limited (which was virtually inactive at year-end). | ||
| • | US equities trading, performed by Abbey National Financial and Investment Services (Jersey) Limited. | ||
| • | Services, mainly administrative services, performed by Abbey National Secretariat Services (Jersey) Limited. | ||
| • | Also, eight subsidiaries continued to be inactive at 2007 year-end and their possible liquidation is being assessed. Six are located in Jersey –Whitewick Limited, Cater Allen Trust Company (Jersey) Limited, Sandywick Limited, Cater Allen Nominees (Jersey) Limited, Cater Allen Registrars Limited and Abbey National Financial Investments No. 2 Limited–, one in the Isle of Man –Abbey National Treasury International (IOM) Limited–, and one in Guernsey –Carfax (Guernsey) Limited. |
| 4. | Distribution of the Bank’s profit and Earnings per share |
| a) | Distribution of the Bank’s profit | ||
| The distribution of the Bank’s net profit for 2007 that the Board of Directors will propose for approval by the shareholders at the Annual General Meeting is as follows: |
| Thousands | ||||
| of Euros | ||||
| Interim dividends | 4,070,179 | |||
Of which: | ||||
Distributed at December 31, 2007 (*) | 1,537,807 | |||
Third interim dividend | 768,903 | |||
Fourth interim dividend | 1,763,469 | |||
| Voluntary reserves | 68 | |||
Net profit for the year | 4,070,247 | |||
| (*) | Recognized under “Shareholders’ equity — Dividends and remuneration”. |
F-50
Table of Contents
| Millions of Euros | ||||||||||||||||
| 31/05/07 | 30/09/07 | 31/12/07 | 31/12/07 | |||||||||||||
| First | Second | Third (*) | Fourth (*) | |||||||||||||
| Profit after tax | 1,252 | 2,600 | 4,070 | 4,070 | ||||||||||||
| Dividends paid | — | (769 | ) | (1,538 | ) | (2,307 | ) | |||||||||
| 1,252 | 1,831 | 2,532 | 1,763 | |||||||||||||
Interim dividends | 769 | 769 | 769 | 1,763 | ||||||||||||
| Accumulated interim dividends | 769 | 1,538 | 2,307 | 4,070 | ||||||||||||
| Gross dividend per share (euros) | 0.12294 | 0.12294 | 0.12294 | 0.28196 | ||||||||||||
| Date of payment | 01/08/07 | 01/11/07 | 01/02/08 | 01/05/08 | ||||||||||||
| (*) | Dividends not distributed at December 31, 2007. |
| b) | Earnings per share in continuing operations and discontinued operations |
| i. | Basic earnings per share |
| 2007 | 2006 | 2005 | ||||||||||
| Profit attributable to the Group (thousands of euros) | 9,060,258 | 7,595,947 | 6,220,104 | |||||||||
| Weighted average number of shares outstanding | 6,241,049,030 | 6,248,375,663 | 6,240,611,051 | |||||||||
| Assumed conversion of convertible debt | 100,721,755 | — | — | |||||||||
Adjusted number of shares | 6,341,770,785 | 6,248,375,663 | 6,240,611,051 | |||||||||
Basic earnings per share (euros) | 1.4287 | 1.2157 | 0.9967 | |||||||||
| ii. | Diluted earnings per share |
F-51
Table of Contents
| Thousands of Euros | ||||||||||||
| 2007 | 2006 | 2005 | ||||||||||
| Profit attributable to the Group | 9,060,258 | 7,595,947 | 6,220,104 | |||||||||
| Dilutive effect of changes in profit for the year arising from potential conversion of ordinary shares | — | — | — | |||||||||
| 9,060,258 | 7,595,947 | 6,220,104 | ||||||||||
| Weighted average number of shares outstanding | 6,241,049,030 | 6,248,375,663 | 6,240,611,051 | |||||||||
| Dilutive effect of: | ||||||||||||
| Assumed conversion of convertible debt (Note 34) | 100,721,755 | — | — | |||||||||
| Options | 66,362,931 | 34,052,536 | 23,325,614 | |||||||||
Adjusted number of shares | 6,408,133,716 | 6,282,428,199 | 6,263,936,665 | |||||||||
Diluted earnings per share (euros) | 1.4139 | 1.2091 | 0.9930 | |||||||||
| 5. | Remuneration and other benefits paid to the Bank’s directors and senior managers |
| a) | Remuneration of directors |
| i. | Bylaw-stipulated directors’ emoluments and attendance fees |
| • | Risk Committee and Audit and Compliance Committee:€1,500 for resident directors and€1,212 for non-resident directors. | ||
| • | Other Committees:€1,155 for resident directors and€935 for non-resident directors. |
F-52
Table of Contents
| ii. | Salaries |
| Thousands of Euros | ||||||||||||
| 2007 | 2006 | 2005 | ||||||||||
| Total salaries | 24,315 | 20,970 | 18,494 | |||||||||
Of which: variable remuneration | 16,088 | 13,666 | 11,412 | |||||||||
F-53
Table of Contents
| iii. | Detail by director |
| Thousands of Euros | ||||||||||||||||||||||||||||||||||||||||||||||||||||
| 2007 | 2006 | 2005 | ||||||||||||||||||||||||||||||||||||||||||||||||||
| Bylaw-Stipulated Emoluments | Attendance Fees | Salary of Executive Directors (1) | ||||||||||||||||||||||||||||||||||||||||||||||||||
| Appointments | ||||||||||||||||||||||||||||||||||||||||||||||||||||
| Audit and | and | |||||||||||||||||||||||||||||||||||||||||||||||||||
| Executive | Compliance | Remuneration | Other | Variable | Other | |||||||||||||||||||||||||||||||||||||||||||||||
| Board | Committee | Committee | Committee | Board | Fees | Fixed | (a) | Total | Remuneration | Total | Total | Total | ||||||||||||||||||||||||||||||||||||||||
| Mr. Emilio Botín-Sanz de Sautuola y García de los Ríos | 118 | 237 | — | — | 25 | 5 | 1,187 | 2,337 | 3,524 | 1 | 3,910 | 3,459 | 3,035 | |||||||||||||||||||||||||||||||||||||||
| Mr. Fernando de Asúa Álvarez | 158 | 237 | 55 | 33 | 25 | 169 | — | — | — | — | 677 | 590 | 519 | |||||||||||||||||||||||||||||||||||||||
| Mr. Alfredo Sáenz Abad | 118 | 237 | — | — | 25 | 5 | 3,126 | 5,582 | 8,708 | 511 | 9,604 | 8,099 | 7,161 | |||||||||||||||||||||||||||||||||||||||
| Mr. Matías Rodríguez Inciarte | 118 | 237 | — | — | 25 | 141 | 1,510 | 2,945 | 4,455 | 178 | 5,154 | 4,501 | 3,970 | |||||||||||||||||||||||||||||||||||||||
| Mr. Manuel Soto Serrano | 158 | — | 55 | 33 | 25 | 35 | — | — | — | — | 306 | 271 | 246 | |||||||||||||||||||||||||||||||||||||||
| Assicurazioni Generali, Spa. | 137 | — | — | — | 6 | — | — | — | — | — | 143 | 136 | 110 | |||||||||||||||||||||||||||||||||||||||
| Mr. Antonio Basagoiti García Tuñón | 118 | 237 | — | — | 25 | 133 | — | — | — | 10 | 523 | 3,477 | (4) | 414 | ||||||||||||||||||||||||||||||||||||||
| Ms. Ana Patricia Botín-Sanz de Sautuola y O’Shea | 118 | 237 | — | — | 25 | 2 | 1,133 | 1,985 | 3,118 | 17 | 3,517 | 3,084 | 2,733 | |||||||||||||||||||||||||||||||||||||||
| Mr. Francisco Javier Botín-Sanz de Sautuola y O’Shea (2) | 118 | — | — | — | 25 | — | — | — | — | — | 143 | 128 | 106 | |||||||||||||||||||||||||||||||||||||||
| Lord Terence Burns (***) | 118 | — | — | — | 17 | — | — | — | — | — | 135 | 122 | 105 | |||||||||||||||||||||||||||||||||||||||
| Mr. Guillermo de la Dehesa Romero | 118 | 237 | — | 33 | 25 | 14 | — | — | — | — | 427 | 381 | 326 | |||||||||||||||||||||||||||||||||||||||
| Mr. Rodrigo Echenique Gordillo | 118 | 237 | — | 33 | 25 | 119 | — | — | — | 30 | 562 | 1,388 | 1,329 | |||||||||||||||||||||||||||||||||||||||
| Mr. Antonio Escámez Torres | 118 | 237 | — | — | 25 | 128 | — | — | — | 42 | 550 | 1,329 | 1,337 | |||||||||||||||||||||||||||||||||||||||
| Mr. Francisco Luzón López | 118 | 237 | — | — | 25 | 2 | 1,271 | 3,239 | 4,510 | 728 | 5,620 | 4,601 | 4,003 | |||||||||||||||||||||||||||||||||||||||
| Mr. Luís Ángel Rojo Duque (****) | 118 | — | 55 | 33 | 14 | 29 | — | — | — | — | 249 | 232 | 113 | |||||||||||||||||||||||||||||||||||||||
| Mr. Abel Matutes Juan | 118 | — | 55 | — | 25 | 15 | — | — | — | — | 213 | 189 | 172 | |||||||||||||||||||||||||||||||||||||||
| Mutua Madrileña Automovilista (3) | 137 | — | — | — | 16 | — | — | — | — | — | 153 | 148 | 122 | |||||||||||||||||||||||||||||||||||||||
| Mr. Luis Alberto Salazar-Simpson Bos | 118 | — | 55 | — | 25 | 16 | — | — | — | — | 214 | 192 | 173 | |||||||||||||||||||||||||||||||||||||||
| Mr. Jay S. Sidhu (b) | — | — | — | — | — | — | — | — | — | — | 58 | — | ||||||||||||||||||||||||||||||||||||||||
| Mr. Emilio Botín-Sanz de Sautuola y O’Shea (**) | — | — | — | — | — | — | — | — | — | — | — | — | 98 | |||||||||||||||||||||||||||||||||||||||
| Mr. Elías Masaveu Alonso del Campo (**) | — | — | — | — | — | — | — | — | — | — | — | — | 47 | |||||||||||||||||||||||||||||||||||||||
| Ms. Isabel Tocino Biscarolasaga (*) | 82 | — | — | — | 21 | — | — | — | — | — | 103 | — | — | |||||||||||||||||||||||||||||||||||||||
Total 2007 | 2,324 | 2,370 | 275 | 165 | 424 | 813 | 8,227 | 16,088 | 24,315 | 1,517 | 32,203 | — | — | |||||||||||||||||||||||||||||||||||||||
Total 2006 | 2,092 | 2,150 | 250 | 150 | 386 | 630 | 7,304 | 13,666 | 20,970 | 5,757 | — | 32,385 | — | |||||||||||||||||||||||||||||||||||||||
Total 2005 | 1,795 | 1,800 | 256 | 148 | 315 | 607 | 7,082 | 11,412 | 18,494 | 2,704 | — | — | 26,119 | |||||||||||||||||||||||||||||||||||||||
| (*) | Appointed by co-optation by the Board of Directors at its meeting on March 26, 2007, Ms. Isabel Tocino Biscarolasaga took office at the meeting held on April 23, 2007. Her appointment was ratified by the shareholders at the Annual General Meeting held on June 23, 2007. | |
| (**) | Directors who were Board members for some months in 2005 but ceased to be directors prior to December 31, 2005. | |
| (***) | Appointed as member of the Bank’s Board of Directors on December 20, 2004 and subsequently ratified by the shareholders at the Annual General Meeting on June 18, 2005. | |
| (****) | Appointed as member of the Bank’s Board of Directors on April 25, 2005 and subsequently ratified by the shareholders at the Annual General Meeting on June 18, 2005. | |
| (a) | Accrued in 2007. | |
| (b) | Appointed by the shareholders at the Annual General Meeting on June 17, 2006 and ceased to discharge his duties on December 31, 2006. | |
| (1) | Recognized under “Personnel expenses” in the income statement of the Bank, except for the salary of Ms. Ana Patricia Botín-Sanz de Sautuola y O’Shea, which is recognized at Banco Español de Crédito, S.A. | |
| (2) | Amounts contributed to Fundación Marcelino Botín. | |
| (3) | Ceased to be a director on December 19, 2007. | |
| (4) | Includes€3 million for duties discharged on the Board of Directors of Unión Fenosa during the period in which he belonged to this Board at the proposal of the Bank. At the proposal of the Appointments and Remuneration Committee, this remuneration was approved by the Bank’s Board of Directors at its meeting on February 6, 2006. |
F-54
Table of Contents
| iv. | Other remuneration |
| b) | Remuneration of the Board members as representatives of the Bank | ||
| By resolution of the Executive Committee, all the remuneration received by the Bank’s directors who represent the Bank on the Boards of Directors of listed companies in which the Bank has a stake (at the expense of those companies) and which relates to appointments made after March 18, 2002, will accrue to the Group. The remuneration received in respect of representation duties of this kind, relating to appointments agreed upon before March 18, 2002, was as follows: |
| Thousands of Euros | ||||||||||||||
| Company | 2007 | 2006 | 2005 | |||||||||||
| Mr. Emilio Botín-Sanz de Sautuola y García de los Ríos | Shinsei Bank, Ltd. | 50.1 | 59.9 | 58.7 | ||||||||||
| Mr. Fernando de Asúa Álvarez | Cepsa | 97.2 | 95.6 | 89.9 | ||||||||||
| Mr. Antonio Escámez Torres | Attijariwafa Bank Société Anonyme | 9.9 | 5.0 | 5.1 | ||||||||||
| 157.2 | 160.5 | 153.7 | ||||||||||||
| c) | Post-employment and other long-term benefits | ||
The total balance of supplementary pension obligations assumed by the Group over the years to its current and retired employees, which amounted to€11,820 million (covered mostly by in-house provisions) at December 31, 2007, includes the obligations to those who have been directors of the Bank during the year and who discharge (or have discharged) executive functions. The total pension obligations to these directors, together with the total sum insured under life insurance policies and other items, amounted to€264 million at December 31, 2007 (December 31, 2006:€234 million; December 31, 2005:€182 million). | |||
| The following table provides information on: (i) the pension obligations assumed and covered by the Group; and (ii) other insurance -the premiums of which are paid by the Group, the related cost being included in the “Other remuneration” column in the table in Note 5-a.iii-, in both cases in respect of the Bank’s executive directors: |
| Thousands of Euros | ||||||||||||||||||||||||
| 2007 | 2006 | 2005 | ||||||||||||||||||||||
| Accrued | Accrued | Accrued | ||||||||||||||||||||||
| Pension | Other | Pension | Other | Pension | Other | |||||||||||||||||||
| Obligations | Insurance | Obligations | Insurance | Obligations | Insurance | |||||||||||||||||||
| Mr. Emilio Botín-Sanz de Sautuola y García de los Ríos | 22,926 | — | 21,068 | — | 11,785 | — | ||||||||||||||||||
| Mr. Alfredo Sáenz Abad | 68,070 | 9,378 | 55,537 | 8,155 | 45,444 | 7,917 | ||||||||||||||||||
| Mr. Matías Rodríguez Inciarte | 44,226 | 4,529 | 39,390 | 4,117 | 28,953 | 3,997 | ||||||||||||||||||
| Ms. Ana Patricia Botín-Sanz de Sautuola y O’Shea | 17,975 | 1,403 | 15,045 | 1,402 | 12,232 | 1,373 | ||||||||||||||||||
| Mr. Francisco Luzón López | 45,468 | 7,624 | 39,187 | 6,571 | 39,188 | 6,380 | ||||||||||||||||||
| 198,665 | 22,934 | 170,227 | 20,245 | 137,602 | 19,667 | |||||||||||||||||||
F-55
Table of Contents
F-56
Table of Contents
| d) | Share option plans granted to directors |
| Options | Options | Exercised | ||||||||||||||||||||||||||||||||||||||||||||||||||||||||||||||||||||||||||||
| Granted | Exercised Options | Granted | Options | Concessions Granted | Exercised Options | Date of | Date of | |||||||||||||||||||||||||||||||||||||||||||||||||||||||||||||||||||||||
| Options at | Exercise | Market | Options at | Exercise | Options at | Exercise | Exercise | Exercise | Market | Options at | Commencement | Expiry of | ||||||||||||||||||||||||||||||||||||||||||||||||||||||||||||||||||
| 1 January | Price | Price | December | Price | December | Price | Price | Price | Price | December 31, | of Exercise | Exercise | ||||||||||||||||||||||||||||||||||||||||||||||||||||||||||||||||||
| 2005 | Number | Number | (Euros) | Applied (Euros) | 31, 2005 | (Euros) | Number | Number | 31, 2006 | (Euros) | Number | (Euros) | Number | (Euros) | Applied (Euros) | 2007 | Period | Period | ||||||||||||||||||||||||||||||||||||||||||||||||||||||||||||
Managers Plan 2000: | ||||||||||||||||||||||||||||||||||||||||||||||||||||||||||||||||||||||||||||||
| Mr. Emilio Botín-Sanz de Sautuola y García de los Ríos | 150,000 | — | (150,000 | ) | 10.545 | 11.12 | — | — | — | — | — | — | — | — | — | — | — | — | 30/12/03 | 29/12/05 | ||||||||||||||||||||||||||||||||||||||||||||||||||||||||||
| Mr. Alfredo Sáenz Abad | 100,000 | — | (100,000 | ) | 10.545 | 11.14 | — | — | — | — | — | — | — | — | — | — | — | — | 30/12/03 | 29/12/05 | ||||||||||||||||||||||||||||||||||||||||||||||||||||||||||
| Mr. Matías Rodríguez Inciarte | 125,000 | — | (125,000 | ) | 10.545 | 11.14 | — | — | — | — | — | — | — | — | — | — | — | — | 30/12/03 | 29/12/05 | ||||||||||||||||||||||||||||||||||||||||||||||||||||||||||
| Mr. Antonio Escámez Torres | 100,000 | — | (100,000 | ) | 10.545 | 11.07 | — | — | — | — | — | — | — | — | — | — | — | — | 30/12/03 | 29/12/05 | ||||||||||||||||||||||||||||||||||||||||||||||||||||||||||
| Mr. Francisco Luzón López | 100,000 | — | (100,000 | ) | 10.545 | 11.14 | — | — | — | — | — | 30/12/03 | 29/12/05 | |||||||||||||||||||||||||||||||||||||||||||||||||||||||||||||||||
| 575,000 | — | (575,000 | ) | 10.545 | 11.12 | — | — | — | — | — | — | — | — | — | — | — | — | |||||||||||||||||||||||||||||||||||||||||||||||||||||||||||||
| Long-Term Incentive Plan (I06) (Note 49): | ||||||||||||||||||||||||||||||||||||||||||||||||||||||||||||||||||||||||||||||
| Mr. Emilio Botín-Sanz de Sautuola y García de los Ríos | 541,400 | — | — | — | — | 541,400 | 9.09 | — | — | 541,400 | 9.09 | — | — | — | — | — | 541,400 | 15/01/08 | 15/01/09 | |||||||||||||||||||||||||||||||||||||||||||||||||||||||||||
| Mr. Alfredo Sáenz Abad | 1,209,100 | — | — | — | — | 1,209,100 | 9.09 | — | — | 1,209,100 | 9.09 | — | — | — | — | — | 1,209,100 | 15/01/08 | 15/01/09 | |||||||||||||||||||||||||||||||||||||||||||||||||||||||||||
| Mr. Matías Rodríguez Inciarte | 665,200 | — | — | — | — | 665,200 | 9.09 | — | — | 665,200 | 9.09 | — | — | — | — | — | 665,200 | 15/01/08 | 15/01/09 | |||||||||||||||||||||||||||||||||||||||||||||||||||||||||||
| Ms. Ana Patricia Botín-Sanz de | ||||||||||||||||||||||||||||||||||||||||||||||||||||||||||||||||||||||||||||||
| Sautuola y O’Shea (*) | 293,692 | — | — | — | — | 293,692 | 9.09 | — | — | 293,692 | 9.09 | — | — | — | — | — | 293,692 | 15/01/08 | 15/01/09 | |||||||||||||||||||||||||||||||||||||||||||||||||||||||||||
| Mr. Francisco Luzón López | 639,400 | — | — | — | — | 639,400 | 9.09 | — | — | 639,400 | 9.09 | — | — | — | — | — | 639,400 | 15/01/08 | 15/01/09 | |||||||||||||||||||||||||||||||||||||||||||||||||||||||||||
| 3,348,792 | — | — | — | — | 3,348,792 | 9.09 | — | — | 3,348,792 | 9.09 | — | — | — | — | — | 3,348,792 | ||||||||||||||||||||||||||||||||||||||||||||||||||||||||||||||
| Long-Term Incentive Plan (I09) (Note 49): | ||||||||||||||||||||||||||||||||||||||||||||||||||||||||||||||||||||||||||||||
| Mr. Emilio Botín-Sanz de Sautuola y García de los Ríos | — | — | — | — | — | — | — | — | — | — | — | 41,785 | — | — | — | — | 41,785 | 23/06707 | 31/07/09 | |||||||||||||||||||||||||||||||||||||||||||||||||||||||||||
| Mr. Alfredo Sáenz Abad | — | — | — | — | — | — | — | — | — | — | — | 110,084 | — | — | — | — | 110,084 | 23/06/07 | 31/07/09 | |||||||||||||||||||||||||||||||||||||||||||||||||||||||||||
| Mr. Matías Rodríguez Inciarte | — | — | — | — | — | — | — | — | — | — | — | 53,160 | — | — | — | — | 53,160 | 23/06/07 | 31/07/09 | |||||||||||||||||||||||||||||||||||||||||||||||||||||||||||
| Ms. Ana Patricia Botín-Sanz | ||||||||||||||||||||||||||||||||||||||||||||||||||||||||||||||||||||||||||||||
| de Sautuola y O’Shea (**) | — | — | — | — | — | — | — | — | — | — | — | 27,929 | — | — | — | — | 27,929 | 23/06/07 | 31/07/09 | |||||||||||||||||||||||||||||||||||||||||||||||||||||||||||
| Mr. Francisco Luzón López | — | — | — | — | — | — | — | — | — | — | — | 44,749 | — | — | — | — | 44,749 | 23/06/07 | 31/07/09 | |||||||||||||||||||||||||||||||||||||||||||||||||||||||||||
| — | — | — | — | — | — | — | — | — | — | — | 277,707 | — | — | — | — | 277,707 | ||||||||||||||||||||||||||||||||||||||||||||||||||||||||||||||
| Long-Term Incentive Plan (I10) (Note 49): | ||||||||||||||||||||||||||||||||||||||||||||||||||||||||||||||||||||||||||||||
| Mr. Emilio Botín-Sanz de Sautuola y García de los Ríos | — | — | — | — | — | — | — | — | — | — | — | 62,589 | — | — | — | — | 62,589 | 23/06/07 | 31/07/10 | |||||||||||||||||||||||||||||||||||||||||||||||||||||||||||
| Mr. Alfredo Sáenz Abad | — | — | — | — | — | — | — | — | — | — | — | 164,894 | — | — | — | — | 164,894 | 23/06/07 | 31/07/10 | |||||||||||||||||||||||||||||||||||||||||||||||||||||||||||
| Mr. Matías Rodríguez Inciarte | — | — | — | — | — | — | — | — | — | — | — | 79,627 | — | — | — | — | 79,627 | 23/06/07 | 31/07/10 | |||||||||||||||||||||||||||||||||||||||||||||||||||||||||||
| Ms. Ana Patricia Botín-Sanz de Sautuola y O’Shea (**) | — | — | — | — | — | — | — | — | — | — | — | 41,835 | — | — | — | — | 41,835 | 23/06/07 | 31/07/10 | |||||||||||||||||||||||||||||||||||||||||||||||||||||||||||
| Mr. Francisco Luzón López | — | — | — | — | — | — | — | — | — | — | — | 67,029 | — | — | — | — | 67,029 | 23/06/07 | 31/07/10 | |||||||||||||||||||||||||||||||||||||||||||||||||||||||||||
| — | — | — | — | — | — | — | — | — | — | — | 415,974 | — | — | — | — | 415,974 | ||||||||||||||||||||||||||||||||||||||||||||||||||||||||||||||
| (*) | Approved by Banesto’s shareholders at its Annual General Meeting on February 28, 2006. | |
| (**) | Without prejudice to the Banesto shares relating to Ms. Ana Patricia Botín-Sanz de Sautuola y O’Shea by virtue of the Banesto Share-Based Payment Incentive Plan approved by the shareholders at the Annual General Meeting of Banesto held on June 27, 2007, the maximum number of shares shown in the foregoing table relate to the aforementioned executive director, based on the resolution adopted at the aforementioned Annual General Meeting. |
F-57
Table of Contents
| Maximum | ||||
| Number of | ||||
| Executive Directors | Shares | |||
| Mr. Emilio Botín-Sanz de Sautuola y García de los Ríos | 16,306 | |||
| Mr. Alfredo Sáenz Abad | 37,324 | |||
| Mr. Matías Rodríguez Inciarte | 20,195 | |||
| Ms. Ana Patricia Botín-Sanz de Sautuola y O’Shea (*) | 13,610 | |||
| Mr. Francisco Luzón López | 22,214 | |||
| 109,649 | ||||
| (*) | In accordance with the resolution adopted by the shareholders at the Annual General Meeting of Banco Santander held on June 23, 2007, the maximum number of shares relating to Ms. Ana Patricia Botín-Sanz de Sautuola y O’Shea is that shown in the foregoing table, in accordance with the resolution adopted by the shareholders at the Annual General Meeting of Banesto held on June 27, 2007. |
| e) | Loans | ||
| The Group’s direct risk exposure to the Bank’s directors and the guarantees provided for them are detailed below. These transactions were made on an arm’s-length basis or the related compensation in kind was charged: |
| Thousands of Euros | ||||||||||||||||||||||||||||||||||||
| 2007 | 2006 | 2005 | ||||||||||||||||||||||||||||||||||
| Loans and | Loans and | Loans and | ||||||||||||||||||||||||||||||||||
| Credits | Guarantees | Total | Credits | Guarantees | Total | Credits | Guarantees | Total | ||||||||||||||||||||||||||||
| Mr. Emilio Botín-Sanz de Sautuola y García de los Ríos | — | — | — | — | — | — | 2 | — | 2 | |||||||||||||||||||||||||||
| Mr. Fernando de Asúa Álvarez | — | — | — | — | — | — | 4 | — | 4 | |||||||||||||||||||||||||||
| Mr. Alfredo Sáenz Abad | 6 | — | 6 | 21 | — | 21 | 16 | — | 16 | |||||||||||||||||||||||||||
| Mr. Matías Rodríguez Inciarte | 18 | 10 | 28 | — | — | — | 8 | 10 | 18 | |||||||||||||||||||||||||||
| Mr. Manuel Soto Serrano | 4 | — | 4 | 4 | — | 4 | 3 | — | 3 | |||||||||||||||||||||||||||
| Mr. Antonio Basagoiti García Tuñón | 94 | 1 | 95 | 125 | 1 | 126 | 145 | 1 | 146 | |||||||||||||||||||||||||||
| Ms. Ana Patricia Botín-Sanz de Sautuola y O’Shea | — | — | — | 2 | — | 2 | — | — | — | |||||||||||||||||||||||||||
| Mr. Francisco Javier Botín-Sanz de Sautuola y O’Shea | — | — | — | — | — | — | 60 | — | 60 | |||||||||||||||||||||||||||
| Mr. Rodrigo Echenique Gordillo | 7 | — | 7 | 33 | — | 33 | 5 | — | 5 | |||||||||||||||||||||||||||
| Mr. Antonio Escámez Torres | 309 | — | 309 | 289 | — | 289 | 295 | — | 295 | |||||||||||||||||||||||||||
| Mr. Francisco Luzón López | 722 | — | 722 | 875 | — | 875 | 1,026 | — | 1,026 | |||||||||||||||||||||||||||
| 1,160 | 11 | 1,171 | 1,489 | 64 | 1,553 | 1,569 | 58 | 1,627 | ||||||||||||||||||||||||||||
| f) | Senior managers | ||
| Following is a detail of the remuneration paid to the Bank’s General Managers (*) in 2007, 2006 and 2005: |
| Number of | Thousands of Euros | |||||||||||||||||||||||
| Managers | Salary | Other | ||||||||||||||||||||||
| Year | (1) | Fixed | Variable | Total | Remuneration | Total | ||||||||||||||||||
| 2005 | 24 | 16,450 | 27,010 | 43,460 | 2,708 | 46,168 | ||||||||||||||||||
| 2006 | 26 | 19,119 | 34,594 | 53,713 | 11,054 | 64,767 | ||||||||||||||||||
| 2007 | 26 | 19,504 | 42,768 | 62,272 | 10,092 | 72,364 | ||||||||||||||||||
| (*) | Excluding executive directors’ remuneration, which is detailed above. | |
| (1) | At some point in the year they occupied the position of General Manager. The amounts reflect the annual remuneration regardless of the number of months in which the position of General Manager was occupied. |
F-58
Table of Contents
| g) | Post-employment benefits to former directors and former general managers | ||
| The post-employment benefits paid in 2007 to former directors of the Bank and former general managers amounted to €7.9 million and €8.7 million, respectively €2006: €7.6 million and €6.7 million, respectively; 2005: €7.3 million and €6.3 million, respectively). | |||
| The expense recognized in the consolidated income statement for 2007 in connection with pension and similar obligations assumed by the Group to former directors of the Bank and former general managers amounted to €308 thousand and €99 thousand, respectively €2006: €2.8 million and €0.3 million, respectively; 2005: €2.4 million and 9.6 million, respectively. | |||
| Furthermore, “Provisions — Provisions for pensions and similar obligations” in the consolidated balance sheet at December 31, 2007 included €89.2 million and €142.9 million in respect of the post-employment benefit obligations to former directors of the Bank and former general managers, respectively €2006: €91.7 million and €95.9 million, respectively; 2005: €91.5 million and €110.3 million, respectively). |
| h) | Termination benefits | ||
| The Bank has signed contracts with all its executive directors. | |||
| The Bank’s executive directors have indefinite-term employment contracts. However, executive directors whose contracts are terminated voluntarily or due to breach of duties are not entitled to receive any economic compensation. If the contracts are terminated for reasons attributable to the Bank or due to objective circumstances €such as those affecting the executive directors’ functional and organic statute), the directors will be entitled, at the date of termination of their employment relationships with the Bank, to the following: |
| • | In the case of Mr. Emilio Botín-Sanz de Sautuola y García de los Ríos, to acquire the status of retiree and to accrue a pension supplement. At December 31, 2007, the annual pension supplement would amount to €1,706 thousand €December 31, 2006: €1,529 thousand). | ||
| • | In the cases of Mr. Matías Rodríguez Inciarte and Mr. Francisco Luzón López, to acquire the status of early retirees and to accrue pension supplements. At December 31, 2007, the annual pension supplements would amount to €2,146 thousand for Mr. Matías Rodríguez Inciarte and €2,293 thousand for Mr. Francisco Luzón López €2006: €1,916 thousand and €1,972 thousand, respectively; 2005: €1,801 thousand and €1,938 thousand, respectively). | ||
| • | In the case of Ms. Ana Patricia Botín-Sanz de Sautuola y O’Shea, to receive a termination benefit amounting to up to five years’ annual fixed salary payments, as established in the related contract, based on the date on which the contract is terminated. At December 31, 2007, this benefit would amount to €3,399 thousand €December 31, 2006: €4,120 thousand; December 31, 2005: €4,000 thousand). Receipt of this termination benefit is incompatible with that of a pension supplement. | ||
| • | In the case of Mr. Alfredo Sáenz Abad, to acquire the status of retiree or, alternatively, to receive a termination benefit equal to 40% of his annual fixed salary multiplied by the number of years of service at the Bank, up to a maximum of ten times his annual fixed salary. At December 31, 2007, the amount relating to the first option would be €4,257 thousand per year and that relating to the second option would be €31.3 million. The two alternatives are mutually exclusive and, therefore, if Mr. Alfredo Sáenz Abad opted to receive the termination benefit, he would not receive any pension supplement €December 31, 2006: €3,657 thousand per year and €27.2 million, respectively; December 31, 2005: €3,421 thousand per year and €26.4 million, respectively). | ||
| • | In the case of Mr. Juan Rodríguez Inciarte, to acquire the status of special early retiree, early retiree or retiree and to accrue a pension supplement. At December 31, 2007 the annual pension supplement would amount to €930 thousand. |
F-59
Table of Contents
| i) | Detail of the directors’ investments in companies with similar business activities and performance by directors, as independent professionals or as employees, of similar activities | ||
| In accordance with the requirements of Article 127 ter.4 of the Spanish Companies Law, in order to enhance the transparency of listed companies, following is a detail of the directors’ investments in the share capital of entities engaging in banking, financing or lending; and of the management or governing functions, if any, that the directors discharge thereat: |
| Number of | ||||||||
| Director | Corporate Name | Shares | Functions | |||||
| Mr. Emilio Botín-Sanz de Sautuola | Bankinter, S.A. | 3,300,395 | — | |||||
| y García de los Ríos | Royal Bank of Scotland Group plc | 8,230,000 | — | |||||
| Shinsei Bank, Limited | — | Director (1) | ||||||
| Bank of America Corporation | 560 | — | ||||||
| Santander Investment, S.A. | — | Chairman (1) | ||||||
| Mr. Fernando de Asúa Álvarez | Banco Bilbao Vizcaya Argentaria, S.A. | 16,905 | — | |||||
| Commerzbank, AG | 5,000 | — | ||||||
| UBS | 950 | — | ||||||
| Unibanco | 630 | — | ||||||
| Mr. Alfredo Sáenz Abad | Banco Bilbao Vizcaya Argentaria, S.A. | 25,000 | — | |||||
| HSBC Holdings | 8,298 | — | ||||||
| Lloyds TSB | 218 | — | ||||||
| Banco Banif, S.A. | — | Chairman (1) | ||||||
| Santander Investment, S.A. | — | Deputy Chairman (1) | ||||||
| Mr. Matías Rodríguez Inciarte | Banesto | 27,575 | Director (1) | |||||
| Banco Santander Totta, S.A. | — | Deputy Chairman (1) | ||||||
| Mr. Manuel Soto Serrano | Banco Bilbao Vizcaya Argentaria, S.A. | 72,000 | — | |||||
| BNP Paribas | 13,000 | — | ||||||
| Istituto per le Opere di Religione (IOR) | — | Director (2) | ||||||
| UniCredito Italiano S.p.A. | 294,000 | — | ||||||
F-60
Table of Contents
| Number of | ||||||||
| Director | Corporate Name | Shares | Functions | |||||
| Assicurazioni Generali S.p.A. (3) | BSI SA | 4,400,000 | — | |||||
| Commerzbank, AG | 57,480,386 | — | ||||||
| Intesa Sanpaolo | 623,154,355 | — | ||||||
| Mediobanca - Banca di Credito Finanziario S.p.A. | 16,381,963 | — | ||||||
| Bank Leumi le-Israel B.M. | 19,711,333 | — | ||||||
| Erste Bank AG | 3,248,964 | — | ||||||
| Banca Monte dei Paschi di Siena S.p.A. | 22,062,700 | — | ||||||
| UniCredito Italiano S.p.A. | 105,996,338 | — | ||||||
| Société Générale | 1,841,117 | — | ||||||
| Deustche Bank, A.G. | 920,619 | — | ||||||
| Banesto | 760,000 | — | ||||||
| Mr. Antonio Basagoiti García-Tuñón | Banco Popular Español, S.A. | 800 | — | |||||
| Banco Bilbao Vizcaya Argentaria, S.A. | 850 | — | ||||||
| Ms. Ana Patricia Botín-Sanz | Banesto | 356,848 | Chairman | |||||
| de Sautuola y O’Shea | Santander Investment, S.A. | — | Director (1) | |||||
| BSN-Banco Santander de Negocios Portugal, S.A. | — | Director (1) | ||||||
| Bankinter, S.A. | 5 | — | ||||||
| Lord Burns (Terence) | Abbey National plc | — | Chairman (1) | |||||
| Mr. Guillermo de la Dehesa Romero | Goldman Sachs & Co. | 12,888 | — | |||||
| Goldman Sachs Europe Ltd. | — | Director (1) | ||||||
| Banco Pastor, S.A. | 11,088 | — | ||||||
| Mr. Rodrigo Echenique Gordillo | Banco Popular Español, S.A. | 12,600 | — | |||||
| Banco Bilbao Vizcaya Argentaria, S.A. | 13,580 | — | ||||||
| Mitsubishi UFJ FIN | 6,000 | — | ||||||
| Royal Bank of Scotland Group plc | 5,975 | — | ||||||
| Mizuho Financial Group, Inc. | 5 | — | ||||||
| Banco Banif, S.A. | — | Second Deputy | ||||||
| Chairman (1) | ||||||||
| Santander Investment, S.A. | — | Director (1) | ||||||
| Allfunds Bank, S.A. | — | Chairman (1) | ||||||
| Banco Santander International | — | Director(1) | ||||||
| Mr. Antonio Escámez Torres | Attijariwafa Bank | 10 | Deputy Chairman (1) | |||||
| Banco de Valencia, S.A. | 349 | — | ||||||
| Santander Consumer Finance, S.A. | — | Chairman (1) | ||||||
| Open Bank Santander Consumer, S.A. | — | Chairman (1) | ||||||
| Mr. Francisco Luzón López | Banco Santander, S.A. (4) | — | Director (1) | |||||
| Banco Santander International | — | Director (1) | ||||||
F-61
Table of Contents
| Number of | ||||||||
| Director | Corporate Name | Shares | Functions | |||||
| Mr. Abel Matutes Juan | Intesa Sanpaolo | 2,359,665 | — | |||||
| Eurizon Financial Group | — | Director (1) | ||||||
| Banco Bilbao Vizcaya Argentaria, S.A. | 554,366 | — | ||||||
| Banesto | 11,980 | — | ||||||
| Mr. Luis Alberto Salazar-Simpson Bos | Bankinter, S.A. | 2,798 | — | |||||
| Ms. Isabel Tocino Biscarolasaga | Banco Banif, S.A. | — | Director (5) | |||||
| Mr. Antoine Bernheim (6) | BNP Paribas | 14,400 | — | |||||
| UBS | 40,164 | — | ||||||
| Crédit Suisse | 35,200 | — | ||||||
| Intesa Sanpaolo | 398,533 | Deputy Chairman (7) | ||||||
| Mediobanca - Banca di Credito Finanziario S.p.A. | 60,000 | Director (1) | ||||||
| UniCredito Italiano S.p.A. | 126,455 | — | ||||||
| Royal Bank of Scotland Group plc | 11,998 | — | ||||||
| Bank of New York Mellon | 10,000 | — | ||||||
| BSI SA | — | Director (1) | ||||||
| (1) | Non-executive. | |
| (2) | Non-executive member of the Control Committee. | |
| (3) | More detailed information on the ownership interests held by Assicurazioni Generali, S.p.A. can be consulted in the notes to the financial statements of this company or on its website (www.generali.it). | |
| (4) | Formerly Banco Santander Serfin, S.A. | |
| (5) | Ceased to be non-executive director of Banco Banif, S.A., since he was appointed as director of Banco Banif, S.A. | |
| (6) | Representative on the Bank’s Board of Directors of the non-executive nominee director Assicurazioni Generali S.p.A. | |
| (7) | (Non-executive) Deputy Chairman of the Supervisory Board. |
| 6. | Loans and advances to credit institutions | |
| The breakdown, by classification, type and currency, of the balances of “Loans and advances to credit institutions” in the consolidated balance sheets is as follows: |
F-62
Table of Contents
| Thousands of Euros | ||||||||||||
| 2007 | 2006 | 2005 | ||||||||||
Classification: | ||||||||||||
| Financial assets held for trading (Note 2.d.iii) | 12,294,559 | 14,627,738 | 10,278,858 | |||||||||
| Other financial assets at fair value through profit or loss (Note 2.d.iii) | 6,865,073 | 185,485 | 2,428,663 | |||||||||
| Loans and receivables | 31,759,867 | 45,361,315 | 47,065,501 | |||||||||
| 50,919,499 | 60,174,538 | 59,773,022 | ||||||||||
Type: | ||||||||||||
| Reciprocal accounts | 417,438 | 503,299 | 345,104 | |||||||||
| Time deposits | 13,569,362 | 16,842,601 | 21,962,472 | |||||||||
| Reverse repurchase agreements | 30,276,080 | 37,010,008 | 33,634,326 | |||||||||
| Other accounts | 6,656,619 | 5,818,630 | 3,831,120 | |||||||||
| 50,919,499 | 60,174,538 | 59,773,022 | ||||||||||
Currency: | ||||||||||||
| Euro | 28,547,895 | 33,380,000 | 33,537,338 | |||||||||
| Pound sterling | 6,139,274 | 4,364,111 | 5,313,338 | |||||||||
| US dollar | 11,486,584 | 16,150,735 | 16,848,462 | |||||||||
| Other currencies | 4,764,233 | 6,292,419 | 4,109,930 | |||||||||
| Impairment losses | (18,487 | ) | (12,727 | ) | (36,046 | ) | ||||||
| 50,919,499 | 60,174,538 | 59,773,022 | ||||||||||
| 7. | Debt instruments | |
| The breakdown, by classification, type and currency, of the balances of “Debt instruments” is as follows: |
F-63
Table of Contents
| Thousands of Euros | ||||||||||||
| 2007 | 2006 | 2005 | ||||||||||
Classification: | ||||||||||||
| Financial assets held for trading | 66,330,811 | 76,736,992 | 81,741,944 | |||||||||
| Other financial assets at fair value through profit or loss | 7,072,423 | 4,500,220 | 9,699,237 | |||||||||
| Available-for-sale financial assets | 34,187,077 | 32,727,454 | 68,054,021 | |||||||||
| Loans and receivables | 1,668,339 | 621,770 | 171,203 | |||||||||
| 109,258,650 | 114,586,436 | 159,666,405 | ||||||||||
Type: | ||||||||||||
| Spanish government debt securities- Treasury bills | 5,558,420 | 3,160,674 | 3,948,045 | |||||||||
| Government bonds | 376,393 | 535,584 | 3,287,406 | |||||||||
| Other book-entry debt securities | 9,440,746 | 9,080,043 | 12,481,210 | |||||||||
| Foreign government debt securities | 21,617,457 | 22,250,587 | 48,120,701 | |||||||||
| Issued by financial institutions | 43,443,566 | 56,063,543 | 61,080,306 | |||||||||
| Other fixed-income securities | 28,913,821 | 23,586,327 | 30,828,737 | |||||||||
| Impairment losses | (91,753 | ) | (90,322 | ) | (80,000 | ) | ||||||
Of which: on available-for-sale financial assets | (91,753 | ) | (90,322 | ) | (80,000 | ) | ||||||
| 109,258,650 | 114,586,436 | 159,666,405 | ||||||||||
Currency: | ||||||||||||
| Euro | 55,013,063 | 43,708,401 | 79,195,677 | |||||||||
| Pound sterling | 16,164,296 | 22,488,577 | 32,983,211 | |||||||||
| US dollar | 13,341,949 | 12,483,749 | 12,591,314 | |||||||||
| Other currencies | 24,831,095 | 35,996,031 | 34,976,203 | |||||||||
| Impairment losses | (91,753 | ) | (90,322 | ) | (80,000 | ) | ||||||
| 109,258,650 | 114,586,436 | 159,666,405 | ||||||||||
| 8. | Other equity instruments |
| a) | Breakdown | ||
| The breakdown, by classification and type, of the balances of “Other equity instruments” is as follows: |
F-64
Table of Contents
| Thousands of Euros | ||||||||||||
| 2007 | 2006 | 2005 | ||||||||||
| Classification: | ||||||||||||
| Financial assets held for trading | 9,744,466 | 13,490,719 | 8,077,867 | |||||||||
| Other financial assets at fair value through profit or loss | 2,870,322 | 2,712,433 | 30,303,170 | |||||||||
| Available-for-sale financial assets | 10,161,830 | 5,970,845 | 5,890,918 | |||||||||
Of which: | ||||||||||||
Disregarding impairment losses | 10,173,068 | 5,984,704 | 5,908,576 | |||||||||
Impairment losses | (11,238 | ) | (13,859 | ) | (17,658 | ) | ||||||
| 22,776,618 | 22,173,997 | 44,271,955 | ||||||||||
| Type: | ||||||||||||
| Shares of Spanish companies | 6,375,891 | 5,185,206 | 5,707,494 | |||||||||
| Shares of foreign companies | 9,787,139 | 11,138,458 | 8,256,086 | |||||||||
| Investment fund units and shares | 4,068,215 | 3,410,494 | 18,563,343 | |||||||||
Of which: Abbey | 602,067 | 669,689 | 17,041,821 | |||||||||
| Pension fund units | — | 144,320 | 133,918 | |||||||||
| Other securities | 2,556,611 | 2,309,378 | 11,628,772 | |||||||||
Of which: unit linked | 2,556,611 | 2,309,378 | 11,628,772 | |||||||||
| Impairment losses | (11,238 | ) | (13,859 | ) | (17,658 | ) | ||||||
| 22,776,618 | 22,173,997 | 44,271,955 | ||||||||||
| b) | Changes | ||
| The changes in the balance of “Available-for-sale financial assets”, disregarding impairment losses, were as follows: |
| Millions of Euros | ||||||||||||
| 2007 | 2006 | 2005 | ||||||||||
| Balance at beginning of year | 5,985 | 5,909 | 7,850 | |||||||||
| Net additions /disposals | 3,096 | (1,232 | ) | (2,984 | ) | |||||||
Of which: | ||||||||||||
Antena 3 Televisión, S.A. | — | (398 | ) | — | ||||||||
San Paolo IMI, S.p.A. | — | (1,499 | ) | — | ||||||||
Assicurazioni Generali, S.p.A. | — | 399 | — | |||||||||
Royal Bank of Scotland Group, plc | 1,368 | — | (2,028 | ) | ||||||||
Commerzbank AG | — | — | (306 | ) | ||||||||
Shinsei Bank, Ltd. | — | — | (52 | ) | ||||||||
Fortis SA/NV | 892 | — | — | |||||||||
Iberdrola, S.A. | 1,503 | — | — | |||||||||
BPI | (229 | ) | — | — | ||||||||
Intesa Sanpaolo | (1,206 | ) | — | — | ||||||||
| Transfers | — | — | 396 | |||||||||
| Valuation adjustments | 1,092 | 1,308 | 647 | |||||||||
Of which: | ||||||||||||
San Paolo IMI, S.p.A. | — | 607 | 414 | |||||||||
Companhía Energética de Sao Paulo | 331 | — | — | |||||||||
Bovespa Holding, S.A. | 330 | — | — | |||||||||
Balance at end of year | 10,173 | 5,985 | 5,909 | |||||||||
F-65
Table of Contents
| i. | Shinsei Bank, Ltd. (Shinsei) |
| ii. | Royal Bank of Scotland Group Plc (RBS) |
| iii. | Auna Operadores de Telecomunicaciones, S.A. (Auna) |
| iv. | Commerzbank AG |
| v. | Antena 3 Televisión, S.A. (“Antena 3”) |
| vi. | San Paolo IMI, S.p.A. (“San Paolo”) |
| vii. | Intesa Sanpaolo |
| viii. | Banco BPI, S.A. (“BPI”) |
| ix. | Other holdings |
F-66
Table of Contents
| c) | Notifications of acquisitions of investments | ||
| The notifications made by the Bank in 2007, in compliance with Article 86 of the Spanish Companies Law and Article 53 of Securities Market Law 24/1998, of the acquisitions and disposals of holdings in investees are listed in Exhibit IV. | |||
| d) | Impairment losses | ||
| Following is a summary of the changes in the impairment losses on these items and on debt instruments classified as “Available-for-sale financial assets” (Note 7): |
| Thousands of Euros | ||||||||||||
| 2007 | 2006 | 2005 | ||||||||||
| Balance at beginning of year | 104,181 | 97,658 | 250,560 | |||||||||
| Net impairment losses for the year | 6,546 | (2,869 | ) | (110,977 | ) | |||||||
Of which: | ||||||||||||
Impairment losses charged to income | 34,341 | 6,737 | 36,156 | |||||||||
Impairment losses reversed with a credit to income | (27,795 | ) | (9,606 | ) | (147,133 | ) | ||||||
| Net changes in the scope of consolidation | (6,737 | ) | — | — | ||||||||
| Write-off of impaired balances against recorded impairment allowance | (97 | ) | (4,009 | ) | (21,471 | ) | ||||||
| Transfers between allowances | (3,928 | ) | 18,349 | (26,402 | ) | |||||||
| Exchange differences and other items | 3,026 | (4,948 | ) | 5,948 | ||||||||
Balance at end of year | 102,991 | 104,181 | 97,658 | |||||||||
Of which: | ||||||||||||
By geographical location of risk: | ||||||||||||
Spain | 57,931 | 52,225 | 31,868 | |||||||||
Rest of Europe | 6,964 | 3,122 | 2,553 | |||||||||
Latin America | 38,096 | 48,834 | 63,237 | |||||||||
By type of asset covered: | ||||||||||||
Debt instruments — Available-for-sale financial assets (Note 7) | 91,753 | 90,322 | 80,000 | |||||||||
Other equity instruments — Available-for-sale financial assets | 11,238 | 13,859 | 17,658 | |||||||||
| 9. | Trading derivatives (assets and liabilities) and Short positions |
| a) | Trading derivatives | ||
| The detail, by type of inherent risk, of the fair value of the trading derivatives arranged by the Group is as follows (Note 36): |
| Thousands of Euros | ||||||||||||||||||||||||
| 2007 | 2006 | 2005 | ||||||||||||||||||||||
| Debit | Credit | Debit | Credit | Debit | Credit | |||||||||||||||||||
| Balance | Balance | Balance | Balance | Balance | Balance | |||||||||||||||||||
| Interest rate risk | 33,298,794 | 35,195,843 | 24,522,311 | 24,785,804 | 23,944,965 | 23,733,558 | ||||||||||||||||||
| Foreign currency risk | 4,369,032 | 6,809,887 | 3,416,681 | 4,204,816 | 1,325,399 | 1,330,493 | ||||||||||||||||||
| Price risk | 6,365,243 | 6,068,122 | 5,121,227 | 7,938,554 | 1,949,054 | 3,695,552 | ||||||||||||||||||
| Other risks | 2,693,049 | 729,375 | 1,924,072 | 1,808,944 | 409,776 | 468,477 | ||||||||||||||||||
| 46,726,118 | 48,803,227 | 34,984,291 | 38,738,118 | 27,629,194 | 29,228,080 | |||||||||||||||||||
F-67
Table of Contents
| b) | Short positions | ||
| Following is a breakdown of the short positions: |
| Thousands of Euros | ||||||||||||
| 2007 | 2006 | 2005 | ||||||||||
Borrowed securities: | ||||||||||||
| Debt instruments | 2,424,447 | 5,459,927 | 7,033,121 | |||||||||
Of which: Abbey | 1,783,832 | 4,574,639 | 6,156,838 | |||||||||
| Equity instruments | 1,596,775 | 4,151,317 | 6,279,410 | |||||||||
Of which: | ||||||||||||
Bank | 277,595 | 8,800 | 1,193,790 | |||||||||
Abbey | 1,285,989 | 3,995,291 | 4,975,258 | |||||||||
Short sales: | ||||||||||||
| Debt instruments | 1,582,052 | 1,842,729 | 4,051,078 | |||||||||
Of which: the Bank | 1,485,173 | 1,721,742 | 3,876,223 | |||||||||
| Equity instruments | 9,960 | 19,089 | 52,191 | |||||||||
| 5,613,234 | 11,473,062 | 17,415,800 | ||||||||||
| 10. | Loans and advances to customers |
| a) | Breakdown | ||
| The breakdown, by classification, of the balances of “Loans and advances to customers” in the consolidated balance sheets is as follows: |
| Thousands of Euros | ||||||||||||
| 2007 | 2006 | 2005 | ||||||||||
| Financial assets held for trading (*) (Note 2.d.iii) | 23,704,481 | 30,582,982 | 26,479,996 | |||||||||
| Other financial assets at fair value through profit or loss (*) (Note 2.d.iii) | 8,021,623 | 7,972,544 | 6,431,197 | |||||||||
| Loans and receivables (**) (Note 53) | 533,750,907 | 484,790,338 | 402,917,602 | |||||||||
Of which: | ||||||||||||
Disregarding impairment losses | 542,446,111 | 492,953,782 | 410,527,527 | |||||||||
Impairment losses | (8,695,204 | ) | (8,163,444 | ) | (7,609,925 | ) | ||||||
| 565,477,011 | 523,345,864 | 435,828,795 | ||||||||||
Loans and advances to customers disregarding impairment losses | 574,172,215 | 531,509,308 | 443,438,720 | |||||||||
| (*) | Relate to loans originated under wholesale banking operations. | |
| (**) | Relate to the commercial banking loan portfolio. |
F-68
Table of Contents
| b) | Detail | ||
| Following is a detail, by loan type and status, borrower sector, geographical area of residence and interest rate formula, of the loans and advances to customers, which reflect the Group’s exposure to credit risk in its core business, disregarding impairment losses: |
| Millions of Euros | ||||||||||||
| 2007 | 2006 | 2005 | ||||||||||
Loan type and status: | ||||||||||||
| Commercial credit | 22,364 | 21,565 | 16,931 | |||||||||
| Secured loans | 322,269 | 302,361 | 255,041 | |||||||||
| Reverse repurchase agreements | 29,089 | 30,502 | 27,581 | |||||||||
| Other term loans | 171,931 | 148,110 | 119,179 | |||||||||
| Finance leases | 15,727 | 13,991 | 11,899 | |||||||||
| Receivable on demand | 6,722 | 10,367 | 8,452 | |||||||||
| Impaired assets | 6,070 | 4,613 | 4,356 | |||||||||
| 574,172 | 531,509 | 443,439 | ||||||||||
Borrower sector: | ||||||||||||
| Public sector — Spain | 5,633 | 5,329 | 5,243 | |||||||||
| Public sector — Other countries | 2,296 | 4,970 | 6,608 | |||||||||
| Households | 316,129 | 302,451 | 248,615 | |||||||||
| Energy | 7,820 | 4,616 | 5,583 | |||||||||
| Construction | 21,137 | 19,659 | 13,694 | |||||||||
| Manufacturing | 31,839 | 28,682 | 25,649 | |||||||||
| Services | 98,548 | 91,592 | 63,585 | |||||||||
| Other sectors | 90,770 | 74,210 | 74,462 | |||||||||
| 574,172 | 531,509 | 443,439 | ||||||||||
Geographical area: | ||||||||||||
| Spain | 234,146 | 205,246 | 158,782 | |||||||||
| European Union (excluding Spain) | 235,849 | 231,445 | 203,111 | |||||||||
| United States and Puerto Rico | 32,070 | 31,385 | 25,884 | |||||||||
| Other OECD countries | 6,633 | 6,020 | 3,943 | |||||||||
| Latin America | 60,753 | 54,274 | 49,227 | |||||||||
| Rest of the world | 4,721 | 3,139 | 2,492 | |||||||||
| 574,172 | �� | 531,509 | 443,439 | |||||||||
Interest rate formula: | ||||||||||||
| Fixed interest rate | 228,434 | 178,423 | 143,316 | |||||||||
| Floating rate | 345,738 | 353,086 | 300,123 | |||||||||
| 574,172 | 531,509 | 443,439 | ||||||||||
F-69
Table of Contents
| c) | Impairment losses | ||
| The changes in the impairment losses on the assets making up the balances of “Loans and receivables — Loans and advances to customers”, “Loans and receivables — Loans and advances to credit institutions” (Note 6) and “Other financial assets” (Note 24) were as follows: |
| Thousands of Euros | ||||||||||||
| 2007 | 2006 | 2005 | ||||||||||
| Balance at beginning of year | 8,288,128 | 7,756,675 | 6,997,428 | |||||||||
| Impairment losses charged to income for the year: | 4,120,278 | 3,035,468 | 2,234,186 | |||||||||
Of which: | ||||||||||||
Individually assessed | 4,223,069 | 2,584,434 | 1,874,413 | |||||||||
Collectively assessed | 1,077,785 | 1,151,376 | 636,836 | |||||||||
Impairment losses reversed with a credit to income | (1,180,576 | ) | (700,342 | ) | (277,063 | ) | ||||||
| Inclusion of entities in the Group in the year | 7,356 | 164,530 | 4,006 | |||||||||
| Write-off of impaired balances against recorded impairment allowance | (3,320,162 | ) | (2,369,865 | ) | (1,519,494 | ) | ||||||
| Exchange differences and other changes | (316,169 | ) | (261,034 | ) | 267,090 | |||||||
| Transfers between allowances | 16,940 | (37,646 | ) | (226,541 | ) | |||||||
Balance at end of year | 8,796,371 | 8,288,128 | 7,756,675 | |||||||||
Of which: | ||||||||||||
By method of assessment: | ||||||||||||
Individually assessed | 3,356,264 | 3,190,220 | 3,520,985 | |||||||||
Of which: country risk (Note 2-g) | 51,522 | 159,024 | 281,389 | |||||||||
Of which: on loans and advances to credit institutions (Note 6) | 18,487 | 12,727 | 36,046 | |||||||||
Of which: on other financial assets (Note 24) | 82,680 | 111,957 | 110,704 | |||||||||
Collectively assessed | 5,440,107 | 5,097,908 | 4,235,690 | |||||||||
By geographical location of risk: | ||||||||||||
Spain | 4,512,000 | 4,318,320 | 3,664,349 | |||||||||
Rest of Europe | 2,250,127 | 2,358,448 | 2,153,620 | |||||||||
Americas | 2,034,244 | 1,611,360 | 1,938,706 | |||||||||
| d) | Impaired assets | ||
| The detail of the changes in the balance of the financial assets classified as loans and receivables and considered to be impaired due to credit risk is as follows: |
| Millions of Euros | ||||||||||||
| 2007 | 2006 | 2005 | ||||||||||
| Balance at beginning of year | 4,613 | 4,356 | 4,208 | |||||||||
| Net additions | 4,898 | 2,723 | 1,356 | |||||||||
| Written-off assets | (3,320 | ) | (2,370 | ) | (1,519 | ) | ||||||
| Exchange differences and other | (120 | ) | (96 | ) | 311 | |||||||
Balance at end of year | 6,070 | 4,613 | 4,356 | |||||||||
F-70
Table of Contents
| Millions of Euros | ||||||||||||||||||||||||||||
| With no | ||||||||||||||||||||||||||||
| Past-Due | ||||||||||||||||||||||||||||
| Balances or | ||||||||||||||||||||||||||||
| Less than | With Balances Past Due by | |||||||||||||||||||||||||||
| 3 Months | 3 to 6 | 6 to 12 | 12 to 18 | 18 to 24 | More than | |||||||||||||||||||||||
| Past Due | Months | Months | Months | Months | 24 Months | Total | ||||||||||||||||||||||
| Spain | 209 | 708 | 524 | 206 | 71 | 64 | 1782 | |||||||||||||||||||||
| European Union (excluding Spain) | 121 | 1,422 | 530 | 172 | 115 | 244 | 2,604 | |||||||||||||||||||||
| United States and Puerto Rico | 32 | 168 | 22 | 15 | 8 | 35 | 279 | |||||||||||||||||||||
| Other OECD countries | 15 | 146 | 14 | 2 | 1 | 1 | 178 | |||||||||||||||||||||
| Latin America | 53 | 350 | 348 | 42 | 17 | 409 | 1,219 | |||||||||||||||||||||
| Rest of the world | — | 6 | 1 | — | — | — | 7 | |||||||||||||||||||||
| 429 | 2,799 | 1,440 | 436 | 212 | 754 | 6,070 | ||||||||||||||||||||||
| Millions of Euros | ||||||||||||||||||||||||||||
| With no | ||||||||||||||||||||||||||||
| Past-Due | ||||||||||||||||||||||||||||
| Balances or | ||||||||||||||||||||||||||||
| Less than | With Balances Past Due by | |||||||||||||||||||||||||||
| 3 Months | 3 to 6 | 6 to 12 | 12 to 18 | 18 to 24 | More than | |||||||||||||||||||||||
| Past Due | Months | Months | Months | Months | 24 Months | Total | ||||||||||||||||||||||
| Spain | 159 | 491 | 210 | 370 | 73 | 98 | 1,401 | |||||||||||||||||||||
| European Union (excluding Spain) | 15 | 515 | 275 | 1,060 | 87 | 173 | 2,125 | |||||||||||||||||||||
| United States and Puerto Rico | — | 118 | 8 | 41 | 3 | 15 | 185 | |||||||||||||||||||||
| Other OECD countries | 4 | 19 | 21 | 4 | 2 | 83 | 133 | |||||||||||||||||||||
| Latin America | 40 | 180 | 177 | 103 | 10 | 252 | 762 | |||||||||||||||||||||
| Rest of the world | 5 | — | — | — | — | 2 | 7 | |||||||||||||||||||||
| 223 | 1,323 | 691 | 1,578 | 175 | 623 | 4,613 | ||||||||||||||||||||||
| e) | Securitization | ||
| “Loans and advances to customers” includes, inter alia, the securitized loans transferred to third parties on which the Group has retained risks, albeit partially, and which therefore, in accordance with the applicable accounting standards, cannot be derecognized. The breakdown of the securitized loans, by type of financial instrument, and of the securitized loans derecognized because the stipulated requirements were met (Note 2-e) is shown below. Note 22 details the liabilities associated with these securitization transactions. |
| Millions of Euros | ||||||||||||
| 2007 | 2006 | 2005 | ||||||||||
| Derecognized | 3,742 | 4,901 | 6,065 | |||||||||
Of which: mortgage-backed securities | 2,479 | 2,981 | 2,897 | |||||||||
| Retained on the balance sheet | 92,023 | 59,426 | 46,523 | |||||||||
Of which: mortgage-backed securities | 60,056 | 36,363 | 33,085 | |||||||||
Total | 95,765 | 64,327 | 52,588 | |||||||||
F-71
Table of Contents
| f) | Guarantees | ||
| At December 31, 2007, financial assets securing liabilities or contingent liabilities amounted to €109,019 million (Note 22), the detail being as follows: |
| Millions | ||||
| of Euros | ||||
| Commercial paper (promissory notes) | 183 | |||
| Asset-backed securities | 63,172 | |||
| Other mortgage securities | 45,664 | |||
Of which: mortgage bonds (cédulas hipotecarias) | 32,264 | |||
Total | 109,019 | |||
| • | First mortgage on principal residence. | ||
| • | Loans current in payment, with minimum experience of payments being honored. | ||
| • | Appraisal conducted by specialist valuer. | ||
| • | The amount of the loan must not exceed 80% of the appraised value. | ||
| • | Arrangement of insurance contract for an amount not less than the appraised value. |
| 11. | Hedging derivatives | |
| The detail, by type of risk hedged, of the fair value of the derivatives qualifying for hedge accounting is as follows (Note 36): |
| Thousands of Euros | ||||||||||||||||||||||||
| 2007 | 2006 | 2005 | ||||||||||||||||||||||
| Assets | Liabilities | Assets | Liabilities | Assets | Liabilities | |||||||||||||||||||
| Fair value hedges | 2,662,762 | (3,862,500 | ) | 2,866,213 | (3,340,480 | ) | 3,757,503 | (1,710,911 | ) | |||||||||||||||
Of which: Portfolio hedges | 398,143 | 826,178 | — | — | — | — | ||||||||||||||||||
| Cash flow hedges | 101,629 | (238,277 | ) | 98,220 | (132,658 | ) | 368,601 | (344,717 | ) | |||||||||||||||
Of which: Recognized in equity (Note 29) | — | 58,655 | — | (49,252 | ) | — | (70,406 | ) | ||||||||||||||||
| Hedges of net investments in foreign operations | 298,778 | (33,794 | ) | 23,531 | (20,711 | ) | — | (255,101 | ) | |||||||||||||||
| 3,063,169 | (4,134,571 | ) | 2,987,964 | (3,493,849 | ) | 4,126,104 | (2,310,729 | ) | ||||||||||||||||
F-72
Table of Contents
| 12. | Non-current assets held for sale | |
| The breakdown of “Non-current assets held for sale” is as follows: |
| Thousands of Euros | ||||||||||||
| 2007 | 2006 | 2005 | ||||||||||
Equity instruments: | ||||||||||||
| Antonveneta (Note 3-b) | 9,000,000 | — | — | |||||||||
| Other instruments | 25,936 | — | — | |||||||||
| 9,025,936 | — | — | ||||||||||
Tangible assets: | ||||||||||||
| Foreclosed assets | 364,345 | 265,311 | 271,574 | |||||||||
| Assets recovered from finance leases | 19,196 | 13,528 | 20,785 | |||||||||
| Other assets | 678,202 | 48,545 | 43,965 | |||||||||
Of which: Ciudad Financiera business campus | 625,124 | — | — | |||||||||
| 1,061,743 | 327,384 | 336,324 | ||||||||||
| 13. | Investments — Associates |
| a) | Breakdown | ||
| The breakdown, by company, of the balance of “Investments — Associates” (Note 2-c) is as follows: |
| Thousands of Euros | ||||||||||||
| 2007 | 2006 | 2005 | ||||||||||
| RFS Holdings B.V. (Note 3-b) | 11,778,624 | — | — | |||||||||
| Cepsa | 2,548,035 | 2,291,599 | 2,619,264 | |||||||||
| Sovereign | 1,026,826 | 2,246,824 | — | |||||||||
| Attijariwafa Bank Société Anonyme | 188,149 | 177,048 | 166,225 | |||||||||
| Vaporeón, S.L. | 41,050 | 35,985 | — | |||||||||
| Abbey companies | 5,104 | 3,531 | 34,103 | |||||||||
| Other companies | 101,339 | 251,122 | 211,890 | |||||||||
| 15,689,127 | 5,006,109 | 3,031,482 | ||||||||||
Of which: | ||||||||||||
Euros | 14,431,945 | 2,544,864 | 2,793,030 | |||||||||
Listed | 3,763,010 | 4,715,471 | 2,785,489 | |||||||||
Goodwill | 8,942,799 | 1,502,441 | 664,768 | |||||||||
Of which: | ||||||||||||
RFS Holdings B.V. (Note 3-b) | 7,993,875 | — | — | |||||||||
Cepsa | 940,199 | 833,241 | 650,949 | |||||||||
Sovereign | — | 653,946 | — | |||||||||
F-73
Table of Contents
| b) | Changes | ||
| The changes in the balance of this item were as follows: |
| Thousands of Euros | ||||||||||||
| 2007 | 2006 | 2005 | ||||||||||
| Balance at beginning of year | 5,006,109 | 3,031,482 | 3,747,564 | |||||||||
| Acquisitions and capital increases (Note 3) | 11,773,567 | 2,618,196 | 18,470 | |||||||||
Of which: | ||||||||||||
Sovereign | — | 2,299,893 | — | |||||||||
RFS Holdings B.V. | 11,614,871 | — | — | |||||||||
| Disposals and capital reductions (Note 3) | (27,421 | ) | (753,071 | ) | (1,168,585 | ) | ||||||
Of which: | ||||||||||||
Unión Fenosa | — | — | (1,083,305 | ) | ||||||||
Cepsa | — | (711,393 | ) | — | ||||||||
| Effect of equity accounting | 441,457 | 426,921 | 619,157 | |||||||||
| Impairment losses | (1,052,673 | ) | (380 | ) | — | |||||||
| Dividends paid | (147,820 | ) | (164,606 | ) | (181,179 | ) | ||||||
| Change in consolidation method | (13,389 | ) | (84,503 | ) | (39,608 | ) | ||||||
| Exchange differences and other changes | (290,703 | ) | (67,930 | ) | 35,663 | |||||||
Balance at end of year | 15,689,127 | 5,006,109 | 3,031,482 | |||||||||
| c) | Impairment losses | ||
| No impairment was detected with respect to investments in associates in 2005. In 2006 impairment losses amounting to €380 thousand were recognized and in 2007 an impairment of €1,053 million was recognized on the investment in Sovereign. Of this amount, €586 million relate to goodwill inherent in Sovereign and €104 million to exchange differences. | |||
| d) | Other disclosures | ||
| Following is a summary of the financial information on the associates (obtained from the information available at the reporting date): |
| Millions of Euros | ||||||||
| 2007 | 2006 | |||||||
| Total assets | 168,320 | 91,987 | ||||||
| Total liabilities | (151,891 | ) | (78,869 | ) | ||||
| Minority interests | (355 | ) | (203 | ) | ||||
| Net assets | 16,074 | 12,915 | ||||||
| Group’s share of the net assets of associates | 6,746 | 3,504 | ||||||
| Goodwill | 8,943 | 1,502 | ||||||
Total Group share | 15,689 | 5,006 | ||||||
| Total income | 16,058 | 16,195 | ||||||
| Total profit | 1,211 | 1,237 | ||||||
Group’s share of the profit of associates | 441 | 427 | ||||||
F-74
Table of Contents
| 14. | Insurance contracts linked to pensions | |
| The detail of the balance of “Insurance contracts linked to pensions” (Note 25-c) is as follows: |
| Thousands of Euros | ||||||||||||
| 2007 | 2006 | 2005 | ||||||||||
Assets relating to insurance contracts covering post-employment benefit plan obligations: | ||||||||||||
| Bank | 2,220,638 | 2,272,786 | 2,320,512 | |||||||||
| Banesto | 257,633 | 274,400 | 285,573 | |||||||||
| Other Spanish companies | 33,286 | 34,442 | 35,526 | |||||||||
Assets relating to insurance contracts covering other similar obligations: | ||||||||||||
| Bank | 10,663 | 18,713 | 29,576 | |||||||||
| Other Spanish companies | 3,330 | 4,194 | 5,178 | |||||||||
| 2,525,550 | 2,604,535 | 2,676,365 | ||||||||||
| 15. | Liabilities under insurance contracts and Reinsurance assets | |
| The breakdown of the balances of “Liabilities under insurance contracts” and “Reinsurance assets” in the consolidated balance sheets (Note 2-j) is as follows: |
| Thousands of Euros | ||||||||||||||||||||||||||||||||||||
| 2007 | 2006 | 2005 | ||||||||||||||||||||||||||||||||||
| Direct | Direct | Direct | ||||||||||||||||||||||||||||||||||
| Insurance | Insurance | Insurance | ||||||||||||||||||||||||||||||||||
| and | Total | and | Total | and | Total | |||||||||||||||||||||||||||||||
| Reinsurance | Reinsurance | (Balance | Reinsurance | Reinsurance | (Balance | Reinsurance | Reinsurance | (Balance | ||||||||||||||||||||||||||||
| Technical Provisions for: | Assumed | Ceded | Payable) | Assumed | Ceded | Payable) | Assumed | Ceded | Payable) | |||||||||||||||||||||||||||
| Unearned premiums and unexpired risks | 351,799 | (128,663 | ) | 223,136 | 172,226 | (78,340 | ) | 93,886 | 119,114 | (39,376 | ) | 79,738 | ||||||||||||||||||||||||
| Life insurance: | ||||||||||||||||||||||||||||||||||||
| Unearned premiums and unexpired risks | 120,747 | (23,580 | ) | 97,167 | 119,867 | (11,031 | ) | 108,836 | 113,381 | (31,615 | ) | 81,766 | ||||||||||||||||||||||||
| Mathematical provisions | 2,885,581 | (17,727 | ) | 2,867,854 | 3,049,875 | (10,496 | ) | 3,039,379 | 28,523,561 | (2,200,524 | ) | 26,323,037 | ||||||||||||||||||||||||
| Claims outstanding | 364,878 | (29,213 | ) | 335,665 | 162,484 | (37,362 | ) | 125,122 | 350,865 | (15,798 | ) | 335,067 | ||||||||||||||||||||||||
| Bonuses and rebates | 15,957 | (13,359 | ) | 2,598 | 11,414 | (5,399 | ) | 6,015 | 579,895 | (5,246 | ) | 574,649 | ||||||||||||||||||||||||
| Equalization | — | — | — | — | — | — | 25 | — | 25 | |||||||||||||||||||||||||||
| Life insurance policies where the investment risk is borne by the Policyholders | 9,097,620 | (90,395 | ) | 9,007,225 | 7,175,926 | (118,993 | ) | 7,056,933 | 14,855,872 | (94,732 | ) | 14,761,140 | ||||||||||||||||||||||||
| Other technical provisions | 197,035 | (6,837 | ) | 190,198 | 12,466 | (252 | ) | 12,214 | 129,587 | (410 | ) | 129,177 | ||||||||||||||||||||||||
| 13,033,617 | (309,774 | ) | 12,723,843 | 10,704,258 | (261,873 | ) | 10,442,385 | 44,672,300 | (2,387,701 | ) | 42,284,599 | |||||||||||||||||||||||||
F-75
Table of Contents
| 16. | Tangible assets |
| a) | Changes | ||
| The changes in “Tangible assets” in the consolidated balance sheets were as follows: |
| Thousands of Euros | ||||||||||||||||
| Property, | Other Assets | |||||||||||||||
| Plant and | Leased out | |||||||||||||||
| Equipment | Investment | under an | ||||||||||||||
| for Own Use | Property | Operating Lease | Total | |||||||||||||
Cost: | ||||||||||||||||
| Balances at January 1, 2005 | 9,541,389 | 2,148,841 | 5,398,778 | 17,089,008 | ||||||||||||
| Additions/Disposals (net) | 315,027 | (1,480,536) | (*) | 441,162 | (724,346 | ) | ||||||||||
| Exchange differences (net) | 561,772 | 49,393 | 133,883 | 745,048 | ||||||||||||
| Balances at December 31, 2005 | 10,418,188 | 717,698 | 5,973,823 | 17,109,710 | ||||||||||||
| Additions/Derecognitions (net) due to change in the scope of consolidation | (3,938 | ) | (557,549 | ) | 180,492 | (380,995 | ) | |||||||||
| Additions/Disposals (net) | (358,066 | ) | 240,900 | 366,485 | 249,319 | |||||||||||
| Transfers and other changes | (32,271 | ) | — | — | (32,271 | ) | ||||||||||
| Exchange differences | (182,605 | ) | (55 | ) | 97,526 | (85,134 | ) | |||||||||
| Balances at December 31, 2006 | 9,841,308 | 400,994 | 6,618,326 | 16,860,629 | ||||||||||||
| Additions/Derecognitions (net) due to change in the scope of consolidation | (43,055 | ) | — | — | (43,055 | ) | ||||||||||
| Additions/Disposals (net) | (1,156,036 | ) | 77,285 | 545,769 | (532,982 | ) | ||||||||||
| Transfers and other changes | (713,511 | ) | 9,680 | 86,768 | (617,063 | ) | ||||||||||
| Exchange differences (net) | (97,641 | ) | (511 | ) | (411,297 | ) | (509,449 | ) | ||||||||
Balances at December 31, 2007 | 7,831,065 | 487,448 | 6,839,566 | 15,158,079 | ||||||||||||
Accumulated depreciation: | ||||||||||||||||
| Balances at January 1, 2005 | (4,572,468 | ) | (33,018 | ) | (1,786,713 | ) | (6,392,199 | ) | ||||||||
| Disposals | 224,135 | 1,588 | 57,969 | 283,692 | ||||||||||||
| Charge for the year | (606,510 | ) | (2,007 | ) | (9,592 | ) | (618,109 | ) | ||||||||
| Exchange differences and other items | (245,261 | ) | (5,745 | ) | (44,714 | ) | (295,720 | ) | ||||||||
| Balances at December 31, 2005 | (5,200,104 | ) | (39,182 | ) | (1,783,050 | ) | (7,022,336 | ) | ||||||||
| Additions/Derecognitions (net) due to change in the scope of consolidation | 8,421 | 24,743 | (35,748 | ) | (2,584 | ) | ||||||||||
| Disposals | 1,174,842 | 1,314 | 274,008 | 1,450,164 | ||||||||||||
| Transfers and other changes | 7,624 | — | (508,549 | ) | (500,925 | ) | ||||||||||
| Charge for the year | (618,135 | ) | (2,876 | ) | (7,526 | ) | (628,537 | ) | ||||||||
| Exchange differences | 81,301 | 2 | (33,805 | ) | 47,498 | |||||||||||
| Balances at December 31, 2006 | (4,546,051 | ) | (15,999 | ) | (2,094,670 | ) | (6,656,720 | ) | ||||||||
| Additions/Derecognitions (net) due to change in the scope of consolidation | 21,681 | — | — | 21,681 | ||||||||||||
| Disposals | 1,440,435 | 14,363 | 202,503 | 1,657,301 | ||||||||||||
| Transfers and other changes | 110,941 | (12,629 | ) | (304,805 | ) | (206,493 | ) | |||||||||
| Charge for the year | (600,454 | ) | (3,561 | ) | (17,256 | ) | (621,271 | ) | ||||||||
| Exchange differences and other items | 40,848 | 1,451 | 156,020 | 198,319 | ||||||||||||
Balances at December 31, 2007 | (3,532,600 | ) | (16,375 | ) | (2,058,208 | ) | (5,607,183 | ) | ||||||||
Impairment losses: | ||||||||||||||||
| Balances at January 1, 2005 | (43,689 | ) | — | (67,927 | ) | (111,616 | ) | |||||||||
| Impairment charge for the year | (12,463 | ) | (2,564 | ) | (63 | ) | (15,090 | ) | ||||||||
| Exchange differences | 43,000 | (8,504 | ) | (1,957 | ) | 32,539 | ||||||||||
| Balances at December 31, 2005 | (13,152 | ) | (11,068 | ) | (69,947 | ) | (94,167 | ) | ||||||||
| Additions/Derecognitions (net) due to change in the scope of consolidation | 755 | — | — | 755 | ||||||||||||
| Net impairment charge | (7,091 | ) | 634 | — | (6,457 | ) | ||||||||||
| Exchange differences and other changes | 8,408 | (14 | ) | (1,438 | ) | 6,956 | ||||||||||
| Balances at December 31, 2006 | (11,080 | ) | (10,448 | ) | (71,385 | ) | (92,913 | ) | ||||||||
| Impairment charge for the year | (1,452 | ) | 8 | — | (1,444 | ) | ||||||||||
| Additions/Derecognitions (net) due to change in the scope of consolidation | 549 | — | — | 549 | ||||||||||||
| Exchange differences | 1,130 | 92 | 723 | 1,945 | ||||||||||||
Balances at December 31, 2007 | (10,853 | ) | (10,348 | ) | (70,662 | ) | (91,863 | ) | ||||||||
Tangible assets, net | ||||||||||||||||
| Balances at December 31, 2005 | 5,204,931 | 667,449 | 4,120,827 | 9,993,207 | ||||||||||||
| Balances at December 31, 2006 | 5,284,177 | 374,547 | 4,452,272 | 10,110,996 | ||||||||||||
Balances at December 31, 2007 | 4,287,612 | 460,725 | 4,710,696 | 9,459,033 | ||||||||||||
| (*) | Mainly Abbey. |
F-76
Table of Contents
| b) | Property, plant and equipment for own use | ||
| The detail, by class of asset, of the balance of “Property, plant and equipment for own use” in the consolidated balance sheets is as follows: |
| Millions of Euros | ||||||||||||||||
| Accumulated | Impairment | Net | ||||||||||||||
| Cost | Depreciation | Losses | Balance | |||||||||||||
| Land and buildings | 3,835 | (851 | ) | (13 | ) | 2,971 | ||||||||||
| IT equipment and fixtures | 2,619 | (1,957 | ) | — | 662 | |||||||||||
| Furniture and vehicles | 3,786 | (2,275 | ) | — | 1,511 | |||||||||||
| Construction in progress and other items | 178 | (117 | ) | — | 61 | |||||||||||
Balances at December 31, 2005 | 10,418 | (5,200 | ) | (13 | ) | 5,205 | ||||||||||
| Land and buildings | 3,704 | (848 | ) | (11 | ) | 2,845 | ||||||||||
| IT equipment and fixtures | 2,059 | (1,495 | ) | — | 564 | |||||||||||
| Furniture and vehicles | 3,838 | (2,114 | ) | — | 1,724 | |||||||||||
| Construction in progress and other items | 240 | (89 | ) | — | 151 | |||||||||||
Balances at December 31, 2006 | 9,841 | (4,546 | ) | (11 | ) | 5,284 | ||||||||||
| Land and buildings | 2,632 | (682 | ) | (11 | ) | 1,939 | ||||||||||
| IT equipment and fixtures | 1,903 | (1,303 | ) | — | 600 | |||||||||||
| Furniture and vehicles | 3,019 | (1,460 | ) | — | 1,559 | |||||||||||
| Construction in progress and other items | 277 | (88 | ) | — | 189 | |||||||||||
Balances at December 31, 2007 | 7,831 | (3,533 | ) | (11 | ) | 4,287 | ||||||||||
| • | Approximately €5,335 million relating to property, plant and equipment owned by Group entities and branches located abroad (December 31, 2006: €5,272 million; December 31, 2005: €5,171 million). | ||
| • | Approximately €394 million relating to property, plant and equipment being acquired under finance leases by the consolidated entities (Note 2-l discloses additional information on these items — December 31, 2006: €183 million; December 31, 2005: €83 million). |
| c) | Investment property | ||
| The fair value of investment property at December 31, 2007, 2006 and 2005 amounted to €588 million, €425 million and €944 million, respectively. | |||
| The rental income earned from investment property and the direct costs related both to investment properties that generated rental income in 2007, 2006 and 2005 and to investment properties that did not generate rental income in those years are not material in the context of the consolidated financial statements. | |||
| d) | Sale of properties | ||
On November 14, 2007, the Group sold ten singular properties to two companies in the Pontegadea Group for €458 million and recognized a net gain of €216 million. At the same time, an operating lease agreement for the aforementioned properties (with maintenance, insurance and taxes payable by the Group) was entered into with these companies, with compulsory terms of between 12 and 15 years, during which the rent (currently set at €1,722 thousand per month) will be reviewed annually on the date of completion of each year of the lease term, based on the percentage variation in the Spanish Consumer Price Index (CPI) in the preceding twelve months, except in the fifth year (effective from the sixth year), in which the rent for nine of the ten properties will be reviewed on the basis of the CPI plus three percentage points. In nine of the ten lease agreements, the agreement is renewable for five additional five-year periods and a last three-year renewal period, up to a total of 40 years. In one of the ten lease agreements, the agreement is renewable for five additional five-year periods up to a total of 40 years. Nine of the ten lease agreements provide for adjustment of the rent to market in each renewal period. One of the ten lease agreements provides for adjustment of the rent to market in 2017, with subsequent adjustments to market taking place every five years from 2017 onwards. Also, the lease agreements include a purchase option exercisable by the Group on final expiry of the agreements (2047), with the exception of one of the leases, which envisages the possibility of exercising the purchase option in March 2023, March 2028, March 2033, March 2038, March 2043 and March 2047. In all the lease agreements, the value of the properties in the event that the purchase option is exercised shall be the market value of the properties on the related dates; this market value will be determined, if appropriate, by independent appraisers. |
F-77
Table of Contents
| Also, on November 23, 2007 the Group sold 1,152 of its branch offices to the Pearl Group for €2,040 million and recognized a net gain of €860 million. Simultaneously, an operating lease agreement for the aforementioned branch offices (with maintenance, insurance and taxes payable by the Group) was entered into with the Pearl Group, with compulsory terms of 24, 25 or 26 years (depending on the property), during which the rent (currently set at €8,417 thousand per month, payable quarterly) will be reviewed annually on the date of completion of each year of the lease term: (i) during the first ten years of the agreement, based on the percentage variation in the Spanish CPI in the preceding twelve months, plus 215 basis points; and (ii) from the eleventh year onwards, based on variations in the CPI. The agreement is renewable for a maximum of three additional seven-year periods, up to a total of 45, 46 or 47 years (depending on the property), the rent being adjusted to market at the end of the compulsory term and of each renewal period, and includes an option, exercisable by the Group on final expiry of the lease (45, 46 or 47 years, depending on the property) to purchase the properties at their market value on the expiry date; this market value will be determined, if appropriate, by independent appraisers. | |||
| The most noteworthy feature of the other agreed terms and conditions, all of which are customary market conditions for operating lease agreements, is that none of the aforementioned lease agreements provides for the transfer of ownership of the properties to the Group on expiry thereof, and the Group is entitled not to renew the rentals beyond the minimum compulsory term. Furthermore, the Group has not granted any guarantee to the buyers for any losses that might arise from the early termination of the agreements or for possible fluctuations in the residual value of the aforementioned properties. | |||
| The Group was advised in the above-mentioned transactions by independent advisors, who estimated the economic lives of the transferred properties at the transaction date, which in all cases were more than 60 years. These advisors also analyzed both the selling prices of the properties and the agreed subsequent rental payments, and concluded that they had been set at fair market values at that date. | |||
| The rental expense recognized by the Group in 2007 in connection with these agreements amounted to €10 million, which related in full to the minimum contractual payments. The present value of the minimum future payments that the Group will incur during the compulsory term (since it is considered that the agreements will not be renewed and the existing purchase options will not be exercised) amounts to €122 million payable within one year, €443 million payable at between one and five years -€117 million in 2009, €113 million in 2010, €109 million in 2011 and €105 million in 2012-, and €1,253 million payable at more than five years. |
| 17. | Intangible assets |
| a) | Goodwill | ||
| The breakdown of “Goodwill”, based on the companies giving rise thereto (Note 3-c), is as follows: |
| Thousands of Euros | ||||||||||||
| 2007 | 2006 | 2005 | ||||||||||
| Abbey (UK) | 8,167,868 | 8,920,188 | 8,740,560 | |||||||||
| Totta Group (Portugal) | 1,640,746 | 1,640,746 | 1,639,560 | |||||||||
| CC Holding (AKB Germany) | 824,483 | 824,483 | 824,483 | |||||||||
| Banco Santander Chile | 680,937 | 717,957 | 908,879 | |||||||||
| Grupo Financiero Santander Serfin (Mexico) | 498,074 | 560,327 | 633,638 | |||||||||
| Meridional Group (Brazil) | 501,192 | 458,202 | 469,372 | |||||||||
| Drive Group | 419,481 | 412,986 | — | |||||||||
| Banesto | 372,655 | 373,562 | 380,008 | |||||||||
| Santander Consumer Bank AS (Norway) | 133,742 | 116,568 | 120,262 | |||||||||
| Finconsumo (Italy) | 105,921 | 105,921 | 105,921 | |||||||||
| Banco Santander Consumer Portugal, S.A. | 163,438 | 89,743 | — | |||||||||
| Bansander Leasing, Corp. (Island Finance) | 58,888 | 80,873 | — | |||||||||
| Banco Santander Internacional | 38,384 | 42,905 | 47,899 | |||||||||
| CB Extrobank | 36,767 | — | — | |||||||||
| Unifin | 36,437 | 37,490 | — | |||||||||
| PTF (Poland) | 23,956 | 22,471 | 22,303 | |||||||||
| Other entities | 127,739 | 108,313 | 125,360 | |||||||||
| 13,830,708 | 14,512,735 | 14,018,245 | ||||||||||
F-78
Table of Contents
| Millions of Euros | ||||||||||||
| 2007 | 2006 | 2005 | ||||||||||
| Balance at beginning of year | 14,513 | 14,018 | 15,090 | |||||||||
| Additions (Note 3) | 252 | 650 | 62 | |||||||||
Of which: | ||||||||||||
Drive Group | 97 | 422 | — | |||||||||
Santander Central Hispano Inc. (Island Finance) | — | 96 | — | |||||||||
Banco Santander Consumer Portugal, S.A. | 74 | 90 | — | |||||||||
Unifin | — | 37 | — | |||||||||
Santander BanCorp | — | — | 11 | |||||||||
CB Extrobank | 38 | — | — | |||||||||
Santander Consumer Bank AS (by Bankia) | — | 45 | ||||||||||
| Definitive assessment of acquisitions | (50 | ) | — | (1,856 | ) | |||||||
Of which (transfer to other intangible assets): | — | |||||||||||
Abbey | — | — | (1,753 | ) | ||||||||
Santander Consumer Bank AS (by Elcon) | — | — | (28 | ) | ||||||||
Santander Consumer Bank AS (by Bankia) | — | — | (22 | ) | ||||||||
PTF | — | — | (52 | ) | ||||||||
Of which other: | — | |||||||||||
Drive Group | (49 | ) | — | — | ||||||||
| Impairment losses | (15 | ) | (13 | ) | — | |||||||
Of which: | ||||||||||||
Cambios Sol, S.A. | — | (7 | ) | — | ||||||||
Santander Financial Services Inc. (Island Finance) | (14 | ) | (6 | ) | — | |||||||
| Disposals | (6 | ) | (76 | ) | (2 | ) | ||||||
Of which: | ||||||||||||
Banco Santander Chile | — | (67 | ) | — | ||||||||
| Exchange differences and other items | (863 | ) | (66 | ) | 724 | |||||||
Balance at end of year | 13,831 | 14,513 | 14,018 | |||||||||
F-79
Table of Contents
| b) | Other intangible assets | ||
| The breakdown of the balance of “Other intangible assets” is as follows: |
| Estimated | Thousands of Euros | |||||||||||||||
| Useful Life | 2007 | 2006 | 2005 | |||||||||||||
With indefinite useful life: | ||||||||||||||||
| Brand name | — | 446,175 | 487,177 | 459,680 | ||||||||||||
Of which: Abbey | — | 429,536 | 469,099 | 459,680 | ||||||||||||
With finite useful life: | ||||||||||||||||
| Customer deposits (Abbey) | 10 years | 1,175,428 | 1,283,693 | 1,257,843 | ||||||||||||
| Credit cards (Abbey) | 5 years | 32,727 | 35,741 | 35,021 | ||||||||||||
| IT developments | 3 years | 1,574,969 | 1,309,678 | 1,207,606 | ||||||||||||
| Other assets | — | 233,352 | 323,026 | 163,199 | ||||||||||||
| Accumulated amortization | (1,234,838 | ) | (980,530 | ) | (704,345 | ) | ||||||||||
| Impairment losses | (25,479 | ) | (14,679 | ) | (207,978 | ) | ||||||||||
| 2,202,334 | 2,444,106 | 2,211,026 | ||||||||||||||
| �� | ||||||||||||||||
| The changes in “Other intangible assets” were as follows: |
| Millions of Euros | ||||||||||||
| 2007 | 2006 | 2005 | ||||||||||
| Balance at beginning of year | 2,444 | 2,211 | 413 | |||||||||
| Additions/Disposals (net) | 1,074 | 757 | 403 | |||||||||
| Exchange differences and other changes (net) | (107 | ) | (6 | ) | 66 | |||||||
| Impairment losses | (563 | ) | — | (131 | ) | |||||||
| Transfers from “Goodwill” | 1 | — | 1,856 | |||||||||
| Amortization | (647 | ) | (518 | ) | (396 | ) | ||||||
Balance at end of year | 2,202 | 2,444 | 2,211 | |||||||||
| At 2007 year-end, the useful lives of certain intangible assets acquired during the year were revised, and the carrying amounts of these assets were adjusted on the basis of the estimated economic benefits that are expected to be obtained therefrom following the purchases described in Note 3. |
| 18. | Prepayments and accrued income and Accrued expenses and deferred income | |
| The breakdown of the balances of “Prepayments and accrued income” and “Accrued expenses and deferred income” is as follows: |
| Thousands of Euros | ||||||||||||||||||||||||
| Assets | Liabilities | |||||||||||||||||||||||
| 2007 | 2006 | 2005 | 2007 | 2006 | 2005 | |||||||||||||||||||
| Prepayments (*) | 594,506 | 521,246 | 1,792,886 | — | — | — | ||||||||||||||||||
| Accrued expenses | — | — | — | (2,444,509 | ) | (2,197,921 | ) | (2,012,861 | ) | |||||||||||||||
| Other | 1,154,687 | 1,060,597 | 1,176,333 | (1,606,483 | ) | (801,159 | ) | (1,035,872 | ) | |||||||||||||||
| 1,749,193 | 1,581,843 | 2,969,219 | (4,050,992 | ) | (2,999,080 | ) | (3,048,733 | ) | ||||||||||||||||
| (*) | Of the amount for 2005,€1,160 million relate to Abbey’s insurance business. |
F-80
Table of Contents
| 19. | Other assets — Other and Other liabilities — Other | |
| The breakdown of the balances of these items is as follows: |
| Thousands of Euros | ||||||||||||||||||||||||
| Assets | Liabilities | |||||||||||||||||||||||
| 2007 | 2006 | 2005 | 2007 | 2006 | 2005 | |||||||||||||||||||
| Transactions in transit | 147,392 | 163,655 | 122,316 | (150,609 | ) | (311,283 | ) | (469,211 | ) | |||||||||||||||
| Net pension plan assets (Note 25) | 239,392 | 223,851 | 54,693 | — | — | — | ||||||||||||||||||
| Other | 1,744,230 | 1,531,836 | 1,710,059 | (2,328,848 | ) | (3,147,457 | ) | (1,043,697 | ) | |||||||||||||||
| 2,131,014 | 1,919,342 | 1,887,068 | (2,479,457 | ) | (3,458,740 | ) | (1,512,908 | ) | ||||||||||||||||
| 20. | Deposits from central banks and Deposits from credit institutions | |
| The breakdown, by classification, counterparty, type and currency, of the balances of these items is as follows: |
| Thousands of Euros | ||||||||||||
| 2007 | 2006 | 2005 | ||||||||||
Classification: | ||||||||||||
| Financial liabilities held for trading | 23,254,111 | 39,690,713 | 31,962,919 | |||||||||
| Other financial liabilities at fair value through profit or loss | 12,207,579 | — | — | |||||||||
| Financial liabilities at amortized cost | 77,434,333 | 73,345,224 | 116,659,488 | |||||||||
Of which: | ||||||||||||
Deposits from central banks | 28,748,079 | 16,529,557 | 22,431,194 | |||||||||
Deposits from credit institutions | 48,686,254 | 56,815,667 | 94,228,294 | |||||||||
| 112,896,023 | 113,035,937 | 148,622,407 | ||||||||||
Type: | ||||||||||||
| Reciprocal accounts | 562,619 | 411,314 | 190,885 | |||||||||
| Time deposits | 71,226,437 | 63,589,635 | 47,224,471 | |||||||||
| Other demand accounts | 2,466,370 | 2,225,037 | 7,383,695 | |||||||||
| Repurchase agreements | 36,615,910 | 45,417,839 | 91,399,196 | |||||||||
| Central bank credit account drawdowns | 2,008,927 | 1,348,815 | 2,369,406 | |||||||||
| Other financial liabilities associated with transferred financial assets | — | 8,445 | 7,170 | |||||||||
| Hybrid financial liabilities | 15,760 | 34,852 | 47,584 | |||||||||
| 112,896,023 | 113,035,937 | 148,622,407 | ||||||||||
Currency: | ||||||||||||
| Euro | 58,327,694 | 43,828,306 | 79,664,528 | |||||||||
| Pound sterling | 14,947,746 | 24,543,241 | 26,488,413 | |||||||||
| US dollar | 28,930,017 | 27,883,219 | 20,307,158 | |||||||||
| Other currencies | 10,690,566 | 16,781,171 | 22,162,308 | |||||||||
| 112,896,023 | 113,035,937 | 148,622,407 | ||||||||||
| Note 53 contains a detail of the residual maturity periods of financial liabilities at amortized cost and of the related average interest rates. |
F-81
Table of Contents
| 21. | Customer deposits |
| The breakdown, by classification, geographical area and type, of the balances of “Customer deposits” is as follows: |
| Thousands of Euros | ||||||||||||
| 2007 | 2006 | 2005 | ||||||||||
Classification: | ||||||||||||
| Financial liabilities held for trading | 27,992,480 | 16,572,444 | 14,038,543 | |||||||||
| Other financial liabilities at fair value through profit or loss | 10,669,058 | 273,079 | — | |||||||||
| Financial liabilities at amortized cost | 317,042,764 | 314,377,078 | 291,726,737 | |||||||||
| 355,704,302 | 331,222,601 | 305,765,280 | ||||||||||
Geographical area: | ||||||||||||
| Spain | 132,008,374 | 120,485,991 | 107,117,818 | |||||||||
| European Union (excluding Spain) | 134,620,750 | 136,730,342 | 133,274,597 | |||||||||
| United States and Puerto Rico | 17,888,682 | 7,512,963 | 7,578,598 | |||||||||
| Other OECD countries | 189,548 | 79,117 | 106,151 | |||||||||
| Latin America | 69,361,574 | 64,984,913 | 56,395,157 | |||||||||
| Rest of the world | 1,635,374 | 1,429,275 | 1,292,959 | |||||||||
| 355,704,302 | 331,222,601 | 305,765,280 | ||||||||||
Type: | ||||||||||||
| Demand deposits- | ||||||||||||
| Current accounts | 87,136,743 | 89,151,030 | 80,631,188 | |||||||||
| Savings accounts | 90,727,525 | 93,717,633 | 90,471,827 | |||||||||
| Other demand deposits | 3,593,720 | 2,025,095 | 1,747,720 | |||||||||
| Time deposits- | ||||||||||||
| Fixed-term deposits | 92,673,147 | 86,345,788 | 77,166,817 | |||||||||
| Home-purchase savings accounts | 296,768 | 324,262 | 269,706 | |||||||||
| Discount deposits | 9,933,139 | 7,132,341 | 16,128,577 | |||||||||
| Funds received under financial asset transfers | — | — | 1 | |||||||||
| Hybrid financial liabilities | 8,494,773 | 4,994,535 | 4,141,071 | |||||||||
| Other financial liabilities associated with transferred financial assets | — | — | 20,346 | |||||||||
| Other time deposits | 113,562 | 470,140 | 351,620 | |||||||||
| Notice deposits | 283,301 | 45,849 | 33,713 | |||||||||
| Repurchase agreements | 62,451,624 | 47,015,928 | 34,802,694 | |||||||||
| 355,704,302 | 331,222,601 | 305,765,280 | ||||||||||
| Note 53 contains a detail of the residual maturity periods of financial liabilities at amortized cost and of the related average interest rates. | ||
| 22. | Marketable debt securities |
| a) | Breakdown | ||
| The breakdown, by classification and type, of the balances of “Marketable debt securities” is as follows: |
| Thousands of Euros | ||||||||||||
| 2007 | 2006 | 2005 | ||||||||||
Classification: | ||||||||||||
| Financial liabilities held for trading | 17,090,935 | 17,522,108 | 19,821,087 | |||||||||
| Other financial liabilities at fair value through profit or loss | 10,279,037 | 12,138,249 | 11,809,874 | |||||||||
| Financial liabilities at amortized cost | 206,264,524 | 174,409,033 | 117,209,385 | |||||||||
| 233,634,496 | 204,069,390 | 148,840,346 | ||||||||||
Type: | ||||||||||||
| Bonds and debentures outstanding | 200,905,082 | 168,661,356 | 123,566,864 | |||||||||
| Notes and other securities | 32,729,414 | 35,408,034 | 25,273,482 | |||||||||
| 233,634,496 | 204,069,390 | 148,840,346 | ||||||||||
| At December 31, 2007, 2006 and 2005, none of these issues was convertible into Bank shares or granted privileges or rights which, in certain circumstances, make them convertible into shares (except for the Santander Securities (“Valores Santander”), which are described in Note 34-a). | |||
At December 31, 2007, asset-backed securities amounted to€63,172 million. In 2007 asset-backed securities amounting to€28,520 million were issued, of which€15,924 million were issued by Abbey,€2,666 million by Fondo de Titulización de Activos Santander Empresas 3,€2,585 million by Santander Consumer Bank AG,€1,733 million by Hipototta No. 5 plc. and€1,659 million by Fondo de Titulización de Activos Santander Consumer Spain Auto 07 – 1. |
F-82
Table of Contents
Additionally, total mortgage bonds at December 31, 2007 amounted to€45,664 million. In 2007 the Bank and Banesto issued mortgage bonds (cédulas hipotecarias) amounting to€4,500 million and€1,750 million, respectively. The mortgage bonds outstanding in connection with these issues totaled€39,264 million at December 31, 2007. | |||
At December 31, 2006, asset-backed securities amounted to€48,226 million (December 31, 2005:€27,997 million). In 2006 asset-backed securities amounting to€21,380 million were issued, of which€11,004 million were issued by Abbey,€4,374 million by the Bank and€1,769 million by Santander Consumer Bank AG. | |||
Additionally, total mortgage bonds at December 31, 2006 amounted to€42,425 million. In 2006 the Bank and Banesto issued mortgage bonds (cédulas hipotecarias) amounting to€7,500 million and€3,000 million, respectively. The mortgage bonds outstanding in connection with these issues totaled€36,224 million at December 31, 2006 (December 31, 2005:€27,250 million). | |||
| Note 53 contains a detail of the residual maturity periods of financial liabilities at amortized cost and of the related average interest rates in each year. |
| b) | Bonds and debentures outstanding | ||
| The breakdown, by currency of issue, of the balance of this account is as follows: |
| December 31, 2007 | ||||||||||||||||||||
| Outstanding | ||||||||||||||||||||
| Issue Amount | ||||||||||||||||||||
| in Foreign | Annual | |||||||||||||||||||
| Millions of Euros | Currency | Interest | ||||||||||||||||||
| Currency of Issue | 2007 | 2006 | 2005 | (Millions) | Rate (%) | |||||||||||||||
| Euro | 132,031 | 112,622 | 78,499 | 132,032 | 4.39 | |||||||||||||||
| US dollar | 38,864 | 30,001 | 20,429 | 57,212 | 5.54 | |||||||||||||||
| Pound sterling | 23,154 | 21,128 | 19,274 | 16,980 | 6.24 | |||||||||||||||
| Chilean peso | 2,239 | 1,725 | 1,701 | 1,640,995 | 4.54 | |||||||||||||||
| Other currencies | 4,617 | 3,185 | 3,664 | — | — | |||||||||||||||
Balance at end of year | 200,905 | 168,661 | 123,567 | |||||||||||||||||
F-83
Table of Contents
| The changes in “Bonds and debentures outstanding” were as follows: |
| Millions of Euros | ||||||||||||
| 2007 | 2006 | 2005 | ||||||||||
| Balance at beginning of year | 168,661 | 123,567 | 83,021 | |||||||||
| Net inclusion of entities in the Group | 36 | 1,895 | — | |||||||||
| Issues | 122,530 | 76,956 | 52,670 | |||||||||
Of which: | ||||||||||||
Banco Santander, S.A.- | ||||||||||||
Non-convertible debentures February and December — floating rate | — | 4,374 | — | |||||||||
Mortgage bonds — fixed rate | 4,500 | 7,500 | 7,000 | |||||||||
Banesto- | ||||||||||||
Mortgage bonds — fixed rate | 1,708 | 3,000 | 4,000 | |||||||||
Bonds | 5,006 | 5,547 | 3,750 | |||||||||
Santander International Debt, S.A., Sole-Shareholder Company- | ||||||||||||
Bonds — floating rate | 10,059 | 11,709 | 10,169 | |||||||||
Abbey- | ||||||||||||
Holmes Financing Series 10 | — | 5,581 | — | |||||||||
Holmes Master Issuer plc | 15,924 | 5,153 | — | |||||||||
Holmes Financing Series 9 | — | — | 5,540 | |||||||||
Bonds in pounds sterling | 26,613 | 6,608 | 3,729 | |||||||||
Bonds in other currencies | 41,122 | 7,284 | 9,156 | |||||||||
Santander US Debt, S.A., Sole-Shareholder Company- | ||||||||||||
Debentures — floating rate | 2,038 | 3,785 | 5,086 | |||||||||
Santander Consumer Bank AG- | ||||||||||||
Asset-backed securities | 2,585 | 1,769 | 1,668 | |||||||||
Banco Santander Totta, S.A.- | ||||||||||||
Asset-backed securities | 890 | 3,808 | 736 | |||||||||
FTA Santander Consumer Spain Auto 06- | ||||||||||||
Asset-backed securities | — | 1,350 | — | |||||||||
| Redemptions | (85,674 | ) | (30,510 | ) | (14,269 | ) | ||||||
Of which: | ||||||||||||
Banco Santander, S.A. | (3,987 | ) | (3,038 | ) | (1,000 | ) | ||||||
Banesto | (2,358 | ) | (2,037 | ) | (2,000 | ) | ||||||
Santander Consumer Bank S.p.A. | (26 | ) | (179 | ) | (102 | ) | ||||||
Abbey | (70,535 | ) | (21,210 | ) | (7,503 | ) | ||||||
| Exchange differences | (2,864 | ) | (1,557 | ) | 958 | |||||||
| Other changes | (1,748 | ) | (1,690 | ) | 1,187 | |||||||
Balance at end of year | 200,905 | 168,661 | 123,567 | |||||||||
| c) | Notes and other securities | ||
| These notes were basically issued by Banco Santander, S.A.; Abbey National North America LLC; Abbey National Treasury Services, plc; Abbey National, plc; Santander Central Hispano Finance (Delaware) Inc.; Banco Santander, S.A.; Institución de Banca Múltiple, Grupo Financiero Santander; Santander Consumer Finance, S.A.; Banco Santander Puerto Rico; Banesto and CB Extrobank. |
F-84
Table of Contents
| 23. | Subordinated liabilities |
| a) | Breakdown | ||
| The detail, by currency of issue, of the balance of “Subordinated liabilities” is as follows: |
| Thousands of Euros | December 31, 2007 | |||||||||||||||||||
| Outstanding | ||||||||||||||||||||
| Issue | ||||||||||||||||||||
| Amount | ||||||||||||||||||||
| in Foreign | Annual | |||||||||||||||||||
| Currency | Interest Rate | |||||||||||||||||||
| Currency of Issue | 2007 | 2006 | 2005 | (Millions) | (%) | |||||||||||||||
| Euro | 19,224,529 | 16,309,049 | 14,706,164 | 19,224 | 5.15 | |||||||||||||||
| US dollar | 7,358,576 | 6,898,455 | 7,843,846 | 10,832 | 7.11 | |||||||||||||||
| Pound sterling | 6,918,511 | 5,631,867 | 5,761,408 | 5,073 | 7.10 | |||||||||||||||
| Other currencies | 2,168,563 | 1,583,450 | 452,038 | — | — | |||||||||||||||
Balance at end of year | 35,670,179 | 30,422,821 | 28,763,456 | |||||||||||||||||
| Note 53 contains a detail of the residual maturity periods of subordinated liabilities at each year-end and of the related average interest rates in each year. | |||
| b) | Changes | ||
| The changes in the balance of “Subordinated liabilities” were as follows: |
| Millions of Euros | ||||||||||||
| 2007 | 2006 | 2005 | ||||||||||
| Balance at beginning of year | 30,423 | 28,763 | 27,470 | |||||||||
| Net inclusion of entities in the Group | — | (459 | ) | — | ||||||||
Of which: | ||||||||||||
Scottish Pensions Limited | — | (292 | ) | — | ||||||||
| Issues | 8,330 | 5,881 | 2,507 | |||||||||
Of which: | ||||||||||||
Santander Consumer Finance, S.A. | ||||||||||||
Banco do Estado de Sao Paulo, S.A. (Banespa) | — | 995 | 420 | |||||||||
Abbey | — | — | 793 | |||||||||
Santander Central Hispano Issuances, Limited | 5,908 | 3,484 | — | |||||||||
Santander Finance Capital, S.A., Sole-Shareholder Company | — | — | 1,000 | |||||||||
Santander Perpetual, S.A., Sole-Shareholder Company | 1,019 | — | — | |||||||||
Santander Finance Preferred, S.A., Sole-Shareholder Company | 1,072 | — | — | |||||||||
| Redemptions | (2,340 | ) | (2,265 | ) | (2,410 | ) | ||||||
Of which: | ||||||||||||
Abbey | (944 | ) | (763 | ) | (551 | ) | ||||||
Santander Central Hispano Issuances, Limited | (1,188 | ) | (1,369 | ) | (1,189 | ) | ||||||
| Exchange differences | (1,353 | ) | (1,093 | ) | 659 | |||||||
| Other changes | 610 | (404 | ) | 537 | ||||||||
Balance at end of year | 35,670 | 30,423 | 28,763 | |||||||||
| c) | Other information | ||
| For the purposes of payment priority preference shares are junior to all general creditors and to subordinated deposits. The payment of dividends on these shares, which have no voting rights, is conditional upon the obtainment of sufficient distributable profit and upon the limits imposed by Spanish banking regulations on equity. | |||
| The other issues are subordinated and, therefore, rank junior to all general creditors of the issuers. The issues launched by Santander Central Hispano Issuances, Limited, Santander Central Hispano Financial Services, Limited, Santander Issuances, S.A., Sole-Shareholder Company, Santander Perpetual, S.A., Sole-Shareholder Company, Santander Finance Capital, S.A., Sole-Shareholder Company, and Santander Finance Preferred S.A., Sole-Shareholder Company, are guaranteed by the Bank or by restricted deposits arranged by the Bank for this purpose. |
F-85
Table of Contents
| Except for those described in Note 34-a), at December 31, 2007 none of these issues was convertible into Bank shares or granted privileges or rights which, in certain circumstances, make them convertible into shares. Abbey has a GBP 200 million subordinated debt issue which is convertible, at Abbey’s option, into preference shares of Abbey, at a price of GBP 1 per share. Banco Santander, S.A. Institución de Banca Múltiple, Grupo Financiero Santander has two USD 150 million issues of unguaranteed subordinated preference debentures that are voluntarily convertible into ordinary shares of Banco Santander, S.A. Institución de Banca Múltiple, Grupo Financiero Santander. |
| 24. | Other financial assets and Other financial liabilities | |
| The breakdown of the balances of these items is as follows: |
| Thousands of Euros | ||||||||||||||||||||||||
| 2007 | 2006 | 2005 | ||||||||||||||||||||||
| Other | Other | Other | Other | Other | Other | |||||||||||||||||||
| Financial | Financial | Financial | Financial | Financial | Financial | |||||||||||||||||||
| Assets | Liabilities | Assets | Liabilities | Assets | Liabilities | |||||||||||||||||||
| Declared dividends payable | — | — | — | — | — | (581,400 | ) | |||||||||||||||||
| Trade receivables (payables) | 105,255 | (3,350,422 | ) | 104,281 | (3,070,870 | ) | 808,401 | (2,907,828 | ) | |||||||||||||||
| Clearing houses | 1,872,444 | (1,106,714 | ) | 760,839 | (544,004 | ) | 913,953 | (408,700 | ) | |||||||||||||||
| Public agency revenue collection accounts | — | (2,040,547 | ) | — | (2,031,137 | ) | — | (1,758,574 | ) | |||||||||||||||
| Factoring accounts payable | — | (326,107 | ) | — | (284,331 | ) | — | (169,627 | ) | |||||||||||||||
| Bonds | 5,582,063 | (994,572 | ) | 3,478,722 | (41,447 | ) | 2,639,426 | (15,988 | ) | |||||||||||||||
| Unsettled financial transactions | 2,455,085 | (2,994,299 | ) | 6,548,625 | (1,978,120 | ) | 3,653,275 | (1,369,389 | ) | |||||||||||||||
| Other financial assets (liabilities) | 2,336,185 | (5,727,544 | ) | 2,182,878 | (4,798,756 | ) | 1,614,388 | (4,081,071 | ) | |||||||||||||||
| 12,351,032 | (16,540,205 | ) | 13,075,345 | (12,748,665 | ) | 9,629,443 | (11,292,577 | ) | ||||||||||||||||
At December 31, 2007, 2006 and 2005, impairment losses amounted to€82,680 thousand,€111,957 thousand and€110,704 thousand, respectively (Note 10-c). |
| Note 53 contains a detail of the residual maturity periods of other financial assets and liabilities at each year-end. |
| 25. | Provisions |
| a) | Breakdown | ||
| The breakdown of the balance of “Provisions” is as follows: |
| Thousands of Euros | ||||||||||||
| 2007 | 2006 | 2005 | ||||||||||
| Provisions for pensions and similar obligations | 11,819,748 | 14,014,305 | 14,172,961 | |||||||||
| Provisions for contingent liabilities and commitments (Note 2) | 636,316 | 598,735 | 487,048 | |||||||||
Of which: country risk | 48,831 | 57,216 | 11,529 | |||||||||
| Other provisions | 4,114,835 | 4,613,473 | 5,162,981 | |||||||||
Total provisions | 16,570,899 | 19,226,513 | 19,822,990 | |||||||||
F-86
Table of Contents
| b) | Changes | ||
| The changes in “Provisions” were as follows: |
| Millions of Euros | ||||||||||||||||||||||||||||||||||||||||||||||||
| 2007 | 2006 | 2005 | ||||||||||||||||||||||||||||||||||||||||||||||
| Contingent | Contingent | Contingent | ||||||||||||||||||||||||||||||||||||||||||||||
| Liabilities and | Other | Liabilities and | Other | Liabilities and | Other | |||||||||||||||||||||||||||||||||||||||||||
| Pensions | Commitments | Provisions | Total | Pensions | Commitments | Provisions | Total | Pensions | Commitments | Provisions | Total | |||||||||||||||||||||||||||||||||||||
| Balances at beginning of year | 14,014 | 599 | 4,614 | 19,227 | 14,173 | 487 | 5,163 | 19,823 | 13,441 | 361 | 4,222 | 18,024 | ||||||||||||||||||||||||||||||||||||
| Net inclusion of entities in the Group | (2 | ) | — | (35 | ) | (37 | ) | — | — | 1 | 1 | (1 | ) | — | — | (1 | ) | |||||||||||||||||||||||||||||||
| Additions charged to income: | ||||||||||||||||||||||||||||||||||||||||||||||||
| Interest expense and similar charges (Note 39) | 488 | — | — | 488 | 735 | — | — | 735 | 641 | — | — | 641 | ||||||||||||||||||||||||||||||||||||
| Personnel expenses (Note 49) | 209 | — | — | 209 | 223 | — | — | 223 | 246 | — | — | 246 | ||||||||||||||||||||||||||||||||||||
| Additions to provisions | 114 | 96 | 497 | 707 | 984 | 96 | (1 | ) | 1,079 | 776 | 20 | 1,011 | 1,807 | |||||||||||||||||||||||||||||||||||
| Other additions (Note 52) | 317 | — | — | 317 | — | — | — | — | — | — | — | — | ||||||||||||||||||||||||||||||||||||
| Other additions arising from insurance contracts linked to pensions | (17 | ) | — | — | (17 | ) | (6 | ) | — | — | (6 | ) | (10 | ) | — | — | (10 | ) | ||||||||||||||||||||||||||||||
| Payments to pensioners and early retirees with a charge to internal provisions | (1,109 | ) | — | — | (1,109 | ) | (1,422 | ) | — | — | (1,422 | ) | (1,258 | ) | — | — | (1,258 | ) | ||||||||||||||||||||||||||||||
| Insurance premiums paid | (6 | ) | — | — | (6 | ) | (2 | ) | — | — | (2 | ) | (8 | ) | — | — | (8 | ) | ||||||||||||||||||||||||||||||
| Payments to external funds | (2,168 | ) | — | — | (2,168 | ) | (743 | ) | — | — | (743 | ) | (212 | ) | — | — | (212 | ) | ||||||||||||||||||||||||||||||
| Amount used | — | — | (921 | ) | (921 | ) | — | — | (982 | ) | (982 | ) | — | (9 | ) | (560 | ) | (569 | ) | |||||||||||||||||||||||||||||
| Transfers, exchange differences and other changes | (20 | ) | (59 | ) | (40 | ) | (119 | ) | 72 | 16 | 433 | 521 | 558 | 115 | 491 | 1,164 | ||||||||||||||||||||||||||||||||
Balances at end of year | 11,820 | 636 | 4,115 | 16,571 | 14,014 | 599 | 4,614 | 19,227 | 14,173 | 487 | 5,164 | 19,823 | ||||||||||||||||||||||||||||||||||||
F-87
Table of Contents
| c) | Provisions for pensions and similar obligations | ||
| The breakdown of the balance of “Provisions for pensions and similar obligations” is as follows: |
| Millions of Euros | ||||||||||||
| 2007 | 2006 | 2005 | ||||||||||
| Provisions for post-employment plans — Spanish entities | 5,723 | 5,647 | 5,657 | |||||||||
Of which, defined benefit | 5,626 | 5,647 | 5,657 | |||||||||
| Provisions for other similar obligations — Spanish entities | 4,001 | 4,527 | 4,269 | |||||||||
Of which: early retirements | 3,950 | 4,481 | 4,215 | |||||||||
| Provisions for post-employment plans — Abbey | 1,275 | 1,642 | 1,788 | |||||||||
| Provisions for post-employment plans and other similar obligations | ||||||||||||
| — Other foreign subsidiaries | 821 | 2,198 | 2,459 | |||||||||
Provisions for pensions and similar obligations | 11,820 | 14,014 | 14,173 | |||||||||
| i. | Spanish entities — Post-employment plans and other similar obligations |
At each year-end, the Spanish consolidated entities had post-employment benefit obligations under defined benefit plans. At its meeting on December 17, 2007, the Bank’s Board of Directors approved the implementation of a defined contribution retirement plan for executives of the Bank. This plan recognizes an extraordinary contribution totaling€97 million for services rendered, and subsequent current contributions. On July 25, 2006, the Bank entered into an agreement with the employee representatives to promote a defined contribution plan aimed at all current personnel. Also, in 2007, 2006 and 2005 some of the consolidated entities offered certain of their employees the possibility of taking early retirement and, therefore, provisions were recognized in those years for the obligations to employees taking early retirement —in terms of salaries and other employee welfare costs— from the date of early retirement to the date of effective retirement. | |||
At each year-end, the Spanish entities had post-employment benefit obligations under defined contribution and defined benefit plans. The expenses incurred in respect of contributions to defined contribution plans amounted to€14 million in 2007,€13 million in 2006 and€2 million in 2005. | |||
| The amount of defined benefit obligations was determined by independent actuaries using the following actuarial techniques: |
| 1. | Valuation method: projected unit credit method, which sees each year of service as giving rise to an additional unit of benefit entitlement and measures each unit separately. | ||
| 2. | Actuarial assumptions used: unbiased and mutually compatible. Specifically, the most significant actuarial assumptions used in the calculations were as follows: |
| Post-Employment Plans | Other Similar Obligations | |||||||||||
| 2007 | 2006 | 2005 | 2007 | 2006 | 2005 | |||||||
| Annual discount rate | 4.0% | 4.0% | 4.0% | 4.0% | 4.0% | 4.0% | ||||||
| Mortality tables | GRM/F-95 (PERM/F-2000 in the case of Banesto) | GRM/F-95 (PERM/F-2000 in the case of Banesto) | GRM/F-95 (PERM/F-2000 in the case of Banesto) | GRM/F-95 (PERM/F-2000 in the case of Banesto) | GRM/F-95 (PERM/F-2000 in the case of Banesto) | GRM/F-95 (PERM/F-2000 in the case of Banesto) | ||||||
| Cumulative annual CPI growth | 1.5% | 1.5% | 1.5% | 1.5% | 1.5% | 1.5% | ||||||
| Annual salary increase rate | 2.50% (2.9% in the case of Banesto) | 2.50% (2.9% in the case of Banesto) | 2.50% (2.9% in the case of Banesto) | |||||||||
| Annual social security pension increase rate | 1.5% | 1.5% | 1.5% | n/a | n/a | n/a | ||||||
| Annual benefit increase rate | n/a | n/a | n/a | 0% to 1.5% | 0% to 1.5% | 0% to 1.5% | ||||||
F-88
Table of Contents
| 3. | The estimated retirement age of each employee is the first at which the employee is entitled to retire or the agreed-upon age, as appropriate. | ||
| The fair value of insurance contracts was determined as the present value of the related payment obligations, taking into account the following assumptions: |
| Post-Employment Plans | Other Similar Obligations | |||||||||||||||||||||||
| 2007 | 2006 | 2005 | 2007 | 2006 | 2005 | |||||||||||||||||||
| Expected rate of return on plan assets | 4.0 | % | 4.0 | % | 4.0 | % | — | — | — | |||||||||||||||
| Expected rate of return on reimbursement rights | 4.0 | % | 4.0 | % | 4.0 | % | 4.0 | % | 4.0 | % | 4.0 | % | ||||||||||||
| The funding status of the defined benefit obligations is as follows: |
| Millions of Euros | ||||||||||||||||||||||||
| Post-Employment Plans | Other Similar Obligations | |||||||||||||||||||||||
| 2007 | 2006 | 2005 | 2007 | 2006 | 2005 | |||||||||||||||||||
Present value of the obligations: | ||||||||||||||||||||||||
| To current employees | 1,259 | 1,215 | 1,207 | — | — | — | ||||||||||||||||||
| Vested obligations to retired employees | 4,876 | 4,958 | 4,942 | — | — | — | ||||||||||||||||||
| To early retirees | — | — | — | 3,950 | 4,481 | 4,215 | ||||||||||||||||||
| Long-service bonuses and other obligations | — | — | — | 50 | 46 | 54 | ||||||||||||||||||
| Other | 174 | 164 | 225 | 1 | — | — | ||||||||||||||||||
| 6,309 | 6,337 | 6,374 | 4,001 | 4,527 | 4,269 | |||||||||||||||||||
| Less: | ||||||||||||||||||||||||
| Fair value of plan assets | 192 | 203 | 211 | — | — | — | ||||||||||||||||||
| Unrecognized actuarial (gains)/losses | 487 | 482 | 506 | — | — | — | ||||||||||||||||||
| Unrecognized past service cost | 4 | 5 | — | — | — | — | ||||||||||||||||||
Provisions — Provisions for pensions | 5,626 | 5,647 | 5,657 | 4,001 | 4,527 | 4,269 | ||||||||||||||||||
Of which: | ||||||||||||||||||||||||
Internal provisions for pensions | 3,114 | 3,065 | 3,015 | 3,987 | 4,504 | 4,235 | ||||||||||||||||||
Insurance contracts linked to pensions (Note 14) | 2,512 | 2,582 | 2,642 | 14 | 23 | 34 | ||||||||||||||||||
| The amounts recognized in the consolidated income statement in relation to the aforementioned defined benefit obligations are as follows: |
| Millions of Euros | ||||||||||||||||||||||||
| Post-Employment Plans | Other Similar Obligations | |||||||||||||||||||||||
| 2007 | 2006 | 2005 | 2007 | 2006 | 2005 | |||||||||||||||||||
| Current service cost | 56 | 55 | 54 | 5 | 3 | 6 | ||||||||||||||||||
| Interest cost | 242 | 239 | 255 | 166 | 156 | 150 | ||||||||||||||||||
| Expected return on plan assets | (8 | ) | (8 | ) | (9 | ) | — | — | — | |||||||||||||||
| Expected return on insurance contracts linked to pensions | (102 | ) | (103 | ) | (105 | ) | (1 | ) | (1 | ) | (2 | ) | ||||||||||||
| Extraordinary charges: | ||||||||||||||||||||||||
| Actuarial (gains)/losses recognized in the year | 6 | 8 | 13 | 13 | 16 | 14 | ||||||||||||||||||
| Past service cost | 58 | 151 | 35 | — | — | — | ||||||||||||||||||
| Early retirement cost | 2 | (24 | ) | (13 | ) | 39 | 799 | 671 | ||||||||||||||||
| Other | (16 | ) | (21 | ) | (38 | ) | (22 | ) | (10 | ) | (2 | ) | ||||||||||||
Total | 238 | 297 | 192 | 201 | 963 | 837 | ||||||||||||||||||
F-89
Table of Contents
| The changes in the present value of the accrued defined benefit obligations were as follows: |
| Millions of Euros | ||||||||||||||||||||||||
| Post-Employment Plans | Other Similar Obligations | |||||||||||||||||||||||
| 2007 | 2006 | 2005 | 2007 | 2006 | 2005 | |||||||||||||||||||
Present value of the obligations at beginning of year | 6,337 | 6,374 | 6,433 | 4,527 | 4,269 | 4,099 | ||||||||||||||||||
| Net inclusion of entities in the Group | — | — | — | — | — | — | ||||||||||||||||||
| Current service cost | 56 | 55 | 54 | 5 | 3 | 6 | ||||||||||||||||||
| Interest cost | 242 | 239 | 255 | 166 | 156 | 150 | ||||||||||||||||||
| Early retirement cost | 2 | (24 | ) | (13 | ) | 39 | 799 | 671 | ||||||||||||||||
| Effect of curtailment/settlement | (16 | ) | (21 | ) | (38 | ) | (22 | ) | (10 | ) | (2 | ) | ||||||||||||
| Benefits paid | (350 | ) | (415 | ) | (324 | ) | (729 | ) | (708 | ) | (673 | ) | ||||||||||||
| Past service cost | 58 | 156 | 35 | 1 | — | — | ||||||||||||||||||
| Actuarial (gains)/losses | (19 | ) | (25 | ) | (26 | ) | 13 | 16 | 14 | |||||||||||||||
| Other | (1 | ) | (2 | ) | (2 | ) | 1 | 2 | 4 | |||||||||||||||
Present value of the obligations at end of year | 6,309 | 6,337 | 6,374 | 4,001 | 4,527 | 4,269 | ||||||||||||||||||
| The changes in the fair value of plan assets and of insurance contracts linked to pensions were as follows: | |||
Plan assets |
| Millions of Euros | ||||||||||||
| Post-Employment Plans | ||||||||||||
| 2007 | 2006 | 2005 | ||||||||||
Fair value of plan assets at beginning of year | 203 | 211 | 212 | |||||||||
| Expected return on plan assets | 8 | 8 | 9 | |||||||||
| Actuarial gains/(losses) | (12 | ) | (4 | ) | 1 | |||||||
| Contributions | 6 | 2 | 8 | |||||||||
| Benefits paid | (13 | ) | (14 | ) | (19 | ) | ||||||
Fair value of plan assets at end of year | 192 | 203 | 211 | |||||||||
Insurance contracts linked to pensions |
| Millions of Euros | ||||||||||||||||||||||||
| Post-Employment Plans | Other Similar Obligations | |||||||||||||||||||||||
| 2007 | 2006 | 2005 | 2007 | 2006 | 2005 | |||||||||||||||||||
Fair value of insurance contracts linked to pensions at beginning of year | 2,582 | 2,642 | 2,703 | 23 | 34 | 51 | ||||||||||||||||||
| Expected return on insurance contracts (Note 38) | 102 | 103 | 105 | 1 | 1 | 2 | ||||||||||||||||||
| Actuarial gains/(losses) | (17 | ) | (6 | ) | (10 | ) | — | — | — | |||||||||||||||
| Premiums paid | 12 | 11 | 12 | — | — | — | ||||||||||||||||||
| Benefits paid | (165 | ) | (168 | ) | (168 | ) | (10 | ) | (12 | ) | (19 | ) | ||||||||||||
| Exchange differences | (2 | ) | — | — | — | — | — | |||||||||||||||||
Fair value of insurance contracts linked to pensions at beginning of year | 2,512 | 2,582 | 2,642 | 14 | 23 | 34 | ||||||||||||||||||
| In 2008 the Group expects to make contributions in Spain to fund its defined benefit pension obligations for amounts similar to those made in 2007. | |||
| The plan assets and the insurance contracts linked to pensions are instrumented through insurance policies. | |||
| The following table shows the estimated benefits payable at December 31, 2007 for the next ten years: |
| Millions | ||||
| of Euros | ||||
| 2008 | 1,026 | |||
| 2009 | 969 | |||
| 2010 | 908 | |||
| 2011 | 844 | |||
| 2012 | 788 | |||
| 2013 to 2017 | 2,941 | |||
| 7,476 | ||||
F-90
Table of Contents
| ii. | Abbey |
At the end of each of the last three years, Abbey had post-employment benefit obligations under defined contribution and defined benefit plans. The expenses incurred in respect of contributions to defined contribution plans amounted to€10 million in 2007,€5 million in 2006 and€6 million in 2005. | |||
| The amount of the defined benefit obligations was determined by independent actuaries using the following actuarial techniques: |
| 1. | Valuation method: projected unit credit method, which sees each year of service as giving rise to an additional unit of benefit entitlement and measures each unit separately. | ||
| 2. | Actuarial assumptions used: unbiased and mutually compatible. Specifically, the most significant actuarial assumptions used in the calculations were as follows: |
| 2007 | 2006 | 2005 | ||||||||||
| Annual discount rate | 5.30 | % | 5.20 | % | 4.85 | % | ||||||
| Mortality tables | PA92MC C2006 | PA92MC C2006 | PA92MC C2005 | |||||||||
| Cumulative annual CPI growth | 3.0 | % | 3.0 | % | 2.8 | % | ||||||
| Annual salary increase rate | 4.0 | % | 4.0 | % | 4.3 | % | ||||||
| Annual pension increase rate | 3.0 | % | 3.0 | % | 2.8 | % | ||||||
| The funding status of the defined benefit obligations is as follows: |
| Millions of Euros | ||||||||||||
| 2007 | 2006 | 2005 | ||||||||||
| Present value of the obligations | 6,248 | 6,350 | 6,337 | |||||||||
| Less: | ||||||||||||
| Fair value of plan assets | 4,913 | 4,810 | 4,326 | |||||||||
| Unrecognized actuarial (gains)/losses | 60 | (102 | ) | 223 | ||||||||
| Unrecognized past service cost | — | — | — | |||||||||
Provisions — Provisions for pensions | 1,275 | 1,642 | 1,788 | |||||||||
| The amounts recognized in the consolidated income statement in relation to the aforementioned defined benefit obligations are as follows: |
| Millions of Euros | ||||||||||||
| 2007 | 2006 | 2005 | ||||||||||
| Current service cost | 97 | 119 | 131 | |||||||||
| Interest cost | 322 | 309 | 294 | |||||||||
| Expected return on plan assets | (284 | ) | (263 | ) | (240 | ) | ||||||
| Extraordinary charges: | ||||||||||||
| Actuarial gains/losses recognized in the year | (1 | ) | — | — | ||||||||
| Past service cost | — | — | — | |||||||||
| Early retirement cost | — | 3 | — | |||||||||
Total | 134 | 168 | 185 | |||||||||
| The changes in the present value of the accrued defined benefit obligations were as follows: |
| Millions of Euros | ||||||||||||
| 2007 | 2006 | 2005 | ||||||||||
| Present value of the obligations at beginning of year | 6,350 | 6,337 | 5,232 | |||||||||
| Net inclusion of entities in the Group | — | — | — | |||||||||
| Current service cost | 97 | 119 | 131 | |||||||||
| Interest cost | 322 | 309 | 294 | |||||||||
| Early retirement cost | — | 3 | — | |||||||||
| Benefits paid | (175 | ) | (178 | ) | (102 | ) | ||||||
| Actuarial (gains)/losses | 200 | (342 | ) | 570 | ||||||||
| Exchange differences and other items | (546 | ) | 102 | 212 | ||||||||
Present value of the obligations at end of year | 6,248 | 6,350 | 6,337 | |||||||||
F-91
Table of Contents
| The changes in the fair value of the plan assets were as follows: |
| Millions of Euros | ||||||||||||
| 2007 | 2006 | 2005 | ||||||||||
| Fair value of plan assets at beginning of year | 4,810 | 4,326 | 3,504 | |||||||||
| Net inclusion of entities in the Group | — | — | — | |||||||||
| Expected return on plan assets | 284 | 263 | 240 | |||||||||
| Actuarial gains/losses | 45 | (13 | ) | 347 | ||||||||
| Contributions | 387 | 303 | 238 | |||||||||
| Benefits paid | (175 | ) | (178 | ) | (102 | ) | ||||||
| Exchange differences | (438 | ) | 109 | 99 | ||||||||
Fair value of plan assets at end of year | 4,913 | 4,810 | 4,326 | |||||||||
| Through Abbey, the Group expects to make contributions in 2008 to fund these defined benefit pension obligations for amounts similar to those made in 2007. | |||
| The main categories of plan assets as a percentage of total plan assets are as follows: |
| 2007 | 2006 | 2005 | ||||||||||
| Equity instruments | 46 | % | 46 | % | 51 | % | ||||||
| Debt instruments | 52 | % | 51 | % | 48 | % | ||||||
| Other | 1 | % | 3 | % | 1 | % | ||||||
| The expected return on plan assets was determined on the basis of the market expectations for returns over the duration of the related obligations. | |||
| The following table shows the estimated benefits payable at December 31, 2007 for the next ten years: |
| Millions | ||||
| of Euros | ||||
| 2008 | 174 | |||
| 2009 | 187 | |||
| 2010 | 202 | |||
| 2011 | 217 | |||
| 2012 | 233 | |||
| 2013 to 2017 | 1,466 | |||
| 2,479 | ||||
| iii. | Other foreign subsidiaries |
| Certain of the consolidated foreign entities have acquired commitments to their employees similar to post-employment benefits. | |||
At December 31, 2007, 2006 and 2005, these entities had defined contribution and defined benefit post-employment benefit obligations. The expenses incurred in respect of contributions to defined contribution plans amounted to€23 million in 2007,€19 million in 2006 and€13 million in 2005. | |||
| The actuarial assumptions used by these entities (discount rates, mortality tables and cumulative annual CPI growth) are consistent with the economic and social conditions prevailing in the countries in which they are located. |
F-92
Table of Contents
| The funding status of the obligations similar to post-employment benefits is as follows: |
| Millions of Euros | ||||||||||||
| 2007 | 2006 | 2005 | ||||||||||
| Present value of the obligations | 7,264 | 6,198 | 5,481 | |||||||||
| Less: | ||||||||||||
| Fair value of plan assets | 6,725 | 3,917 | 2,523 | |||||||||
| Unrecognized actuarial (gains)/losses | 134 | 517 | 760 | |||||||||
| Unrecognized past service cost | — | — | 2 | |||||||||
21. Provisions — Provisions for pensions | 405 | 1,764 | 2,196 | |||||||||
Of which: | ||||||||||||
Internal provisions for pensions | 821 | 2,198 | 2,459 | |||||||||
Net assets for pensions | (239 | ) | (224 | ) | (55 | ) | ||||||
Unrecognized net assets for pensions | (177 | ) | (210 | ) | (208 | ) | ||||||
| In January 2007 Banco do Estado de Sao Paulo, S.A.- Banespa (which merged with Banco Santander Banespa, S.A. on August 31, 2006) externalized a portion of the pension obligations to employees for which it still recognized an internal provision and for this purpose arranged an external plan or fund managed by Banesprev. As a result of this externalization, the related assets and liabilities were transferred to Banesprev, and “Provisions — Provisions for Pensions and Similar Obligations” at December 31, 2007 included the present value of the aforementioned obligations, net of the fair value of the related plan assets and the net unrecognized cumulative actuarial gains and/or losses. | |||
| The amounts recognized in the consolidated income statement in relation to these obligations are as follows: |
| Millions of Euros | ||||||||||||
| 2007 | 2006 | 2005 | ||||||||||
| Current service cost | 51 | 46 | 54 | |||||||||
| Interest cost | 608 | 574 | 413 | |||||||||
| Expected return on plan assets | (559 | ) | (271 | ) | (222 | ) | ||||||
| Extraordinary charges: | ||||||||||||
| Actuarial gains/losses recognized in the year | 22 | 93 | 35 | |||||||||
| Past service cost | — | 29 | — | |||||||||
| Early retirement cost | 16 | 72 | 62 | |||||||||
| Other | 216 | (132 | ) | — | ||||||||
Total | 354 | 411 | 342 | |||||||||
| The changes in the present value of the accrued obligations were as follows: |
| Millions of Euros | ||||||||||||
| 2007 | 2006 | 2005 | ||||||||||
| Present value of the obligations at beginning of year | 6,198 | �� | 5,481 | 4,092 | ||||||||
| Current service cost | 51 | 46 | 54 | |||||||||
| Interest cost | 608 | 574 | 413 | |||||||||
| Early retirement cost | 16 | 72 | 62 | |||||||||
| Effect of curtailment/settlement | (4 | ) | (132 | ) | — | |||||||
| Benefits paid | (492 | ) | (513 | ) | (423 | ) | ||||||
| Past service cost | — | 27 | 2 | |||||||||
| Actuarial (gains)/losses | 707 | 72 | 455 | |||||||||
| Exchange differences and other items | 180 | 571 | 826 | |||||||||
Present value of the obligations at end of year | 7,264 | 6,198 | 5,481 | |||||||||
F-93
Table of Contents
| The changes in the fair value of the plan assets were as follows: |
| Millions of Euros | ||||||||||||
| 2007 | 2006 | 2005 | ||||||||||
| Fair value of plan assets at beginning of year | 3,917 | 2,523 | 1,962 | |||||||||
| Expected return on plan assets | 559 | 271 | 222 | |||||||||
| Actuarial gains/(losses) | 586 | 12 | 9 | |||||||||
| Contributions | 1,863 | 461 | 168 | |||||||||
| Benefits paid | (452 | ) | (199 | ) | (165 | ) | ||||||
| Exchange differences and other items | 252 | 849 | 327 | |||||||||
Fair value of plan assets at end of year | 6,725 | 3,917 | 2,523 | |||||||||
| In 2008 the Group expects to make contributions to fund these obligations for amounts similar to those made in 2007. | |||
| The main categories of plan assets as a percentage of total plan assets are as follows: |
| 2007 | 2006 | 2005 | ||||||||||
| Equity instruments | 27 | % | 27 | % | 28 | % | ||||||
| Debt instruments | 66 | % | 61 | % | 64 | % | ||||||
| Properties | 2 | % | 3 | % | 4 | % | ||||||
| Other | 5 | % | 8 | % | 4 | % | ||||||
| The expected return on plan assets was determined on the basis of the market expectations for returns over the duration of the related obligations. | |||
| The following table shows the estimated benefits payable at December 31, 2007 for the next ten years: |
| Millions | ||||
| of Euros | ||||
| 2008 | 441 | |||
| 2009 | 455 | |||
| 2010 | 471 | |||
| 2011 | 488 | |||
| 2012 | 507 | |||
| 2013 to 2017 | 2,799 | |||
| 5,159 | ||||
F-94
Table of Contents
| d) | Other provisions | ||
| The balance of “Provisions — Other provisions”, which includes, inter alia, provisions for restructuring costs and tax and legal litigation, was estimated using prudent calculation procedures in keeping with the uncertainty inherent in the obligations covered. The definitive date of the outflow of resources embodying economic benefits for the Group depends on each obligation; in certain cases, these obligations have no fixed settlement period and, in other cases, are based on litigation in progress. | |||
| The breakdown of the balance of “Provisions — Other provisions” is as follows: |
| Millions of Euros | ||||||||||||
| 2007 | 2006 | 2005 | ||||||||||
Provisions for contingencies and commitments in operating units: | ||||||||||||
| Recognized by Spanish companies | 814 | 892 | 937 | |||||||||
Of which: | ||||||||||||
Bank | 326 | 400 | 376 | |||||||||
Banesto | 197 | 249 | 331 | |||||||||
| Recognized by other EU companies | 886 | 1,230 | 1,876 | |||||||||
Of which: Abbey | 584 | 931 | 1,458 | |||||||||
| Recognized by other companies | 2,415 | 2,492 | 2,350 | |||||||||
Of which: | ||||||||||||
Brazil | 1,989 | 1,795 | 1,318 | |||||||||
Mexico | 159 | 193 | 233 | |||||||||
| 4,115 | 4,614 | 5,163 | ||||||||||
| e) | Litigation |
| i. | Tax litigation |
| At December 31, 2007, the main tax litigation concerning the Group was as follows: |
| • | The “Mandado de Segurança” filed by Banco Santander Banespa, S.A. claiming its right to pay the Brazilian social contribution tax on net income at a rate of 8%. On January 14, 2008, an unfavorable judgment was handed down by the Federal Regional Court, against which the directors of Banco Santander S.A. (Brazil) intend to file an appeal at a higher court. | ||
| • | The “Mandado de Segurança” filed by Banco Santander Banespa, S.A. claiming its right to consider the social contribution tax on net income as deductible in the calculation of Brazilian corporation tax. This action was declared unwarranted and an appeal was filed at the Federal Regional Court, requesting to have the claimability of the tax credit stayed and obtaining permission to deposit with the courts the disputed amounts. On October 1, 2007, an unfavorable judgment was handed down by the Federal Regional Court, which was appealed against by Banco Santander S.A. (Brazil) through the presentation of “Embargos de Declaraçao” on October 8, 2007. A decision has not yet been handed down by the Court. | ||
| • | The “Mandado de Segurança” filed by Banco Santander, S.A. and other Group entities claiming their right to pay the Brazilian PIS and COFINS social contributions only on the income from the provision of services. The “Mandado de Segurança” was declared unwarranted and an appeal was filed at the Federal Regional Court. On September 13, 2007, this Court handed down a favorable judgment. Unión Federal has filed an appeal against this judgment at a higher court. | ||
| • | A claim was filed against Abbey National Treasury Services plc by tax authorities abroad in relation to the refund of certain tax credits and other associated amounts. The legal advisers of Abbey National Treasury Services plc considered that the grounds to contest this claim were well-founded, proof of which is that a favorable judgment was handed down at first instance in September 2006, although the judgment was appealed against by the tax authorities in January 2007. However, in December 2006 an unfavorable judgment for another taxpayer was handed down on another proceeding which might affect this case. |
| At December 31, 2007, other less significant tax litigation was in progress. |
F-95
Table of Contents
| ii. | Legal litigation |
| At December 31, 2007, the main legal litigation concerning the Group was as follows: |
| • | Misselling: claims associated with the sale by Abbey of certain financial products to its customers. | ||
| The provisions recorded by Abbey in this connection were calculated on the basis of the best estimate of the number of claims that will be received, of the percentage of claims that will be upheld and of the related amounts. |
| • | LANETRO, S.A.: claim (ordinary lawsuit no. 558/2002) filed by LANETRO, S.A. against Banco Santander, S.A. at Madrid Court of First Instance no. 34, requesting that the Bank comply with the obligation to subscribe to€30.05 million of a capital increase at the plaintiff. | ||
| On December 16, 2003, a judgment was handed down dismissing the plaintiff’s request. The subsequent appeal filed by LANETRO was upheld by a decision of the Madrid Provincial Appellate Court on October 27, 2006. | |||
| The Bank has filed extraordinary appeals on grounds of procedural infringements and an extraordinary cassation appeal against the aforementioned decision. | |||
| • | Galesa de Promociones, S.A.: small claims proceeding at Elche Court of First Instance no. 4 (case no. 419/1994), in connection with the claim filed by Galesa de Promociones, S.A. (Galesa) requesting the Court to annul a previous legal foreclosure proceeding brought by the Bank against the plaintiff in 1992, which culminated in the foreclosure of certain properties that were subsequently sold by auction. | ||
The judgments handed down at first and second instance were in the Bank’s favor. The cassation appeal filed by Galesa at the Supreme Court was upheld by virtue of a decision on November 24, 2004 which ordered the reversal of the legal foreclosure proceeding to before the date on which the auctions were held. On June 8, 2006, Galesa filed a claim for the enforcement of the decision handed down by the Supreme Court, requesting that the Bank be ordered to pay€56 million, the estimated value of the properties, plus a further€33 million for loss of profit. The Bank challenged this claim on the grounds that the Supreme Court decision could not be enforced —since no order had been pronounced against the Bank, but rather a proceeding had merely been annulled— and it also argued that the damages requested would have to be ruled upon by an express court decision, which had not been pronounced. | |||
| The Elche Court of First Instance, by virtue of an order dated September 18, 2006, found in favor of the Bank, and referred the plaintiff to the appropriate ordinary proceeding for the valuation of the aforementioned damages. | |||
| Galesa filed an appeal for reconsideration, which was dismissed by a resolution on 11 November 2006. Galesa lodged an appeal against this resolution at the Alicante Provincial Appellate Court. This appeal was in turn contested by the Bank and a favorable judgment was handed down. | |||
| • | Declaratory large claims action brought at Madrid Court of First Instance no. 19 (case no. 87/2001) in connection with a claim filed by Inversión Hogar, S.A. against the Bank. This claim sought the termination of a settlement agreement entered into between the Bank and the plaintiff on December 11, 1992. | ||
On May 19, 2006, a judgment was handed down at first instance, whereby the agreement was declared to be terminated and the Bank was ordered to pay€1.8 million, plus the related legal interest since February 1997, to return a property that was given in payment under the aforementioned agreement, to pay an additional€72.9 million relating to the replacement value of the assets foreclosed, and subsequently sold, by the Bank, and to pay all the related court costs. The Bank and Inversión Hogar, S.A. filed appeals against the judgment. | |||
| On July 30, 2007, the Madrid Provincial Appellate Court handed down a decision upholding in full the appeal filed by the Bank, revoking the ruling issued at first instance and dismissing the appeal lodged by Inversión Hogar, S.A. Inversión Hogar, S.A. has announced that, on completion of the clarification procedure, it will file a cassation appeal against the aforementioned decision at the Civil Chamber of the Supreme Court. | |||
| • | Complaint in an ordinary proceeding filed by Inés Arias Domínguez and a further 17 persons against Santander Investment, S.A. at Madrid Court of First Instance no. 13 (case no. 928/2007), seeking damages of approximately€43 million, plus interest and costs. The plaintiffs, who are former shareholders of Yesocentro S.A. (Yesos y Prefabricados del Centro, S.A.) allege that Santander Investment, S.A. breached the advisory services agreement entered into on October 19, 1989 between the former Banco Santander de Negocios, S.A. and the plaintiffs, the purpose of which was the sale of shares owned by the plaintiffs to another company called Invercámara, S.A. | ||
| This complaint was duly contested by Santander Investment, S.A. on November 5, 2007. The parties are currently awaiting notification of the hearing to be held prior to the court proceeding. |
| At December 31, 2007, other less significant legal litigation was in progress. |
F-96
Table of Contents
| At the end of each of the last three years, the Group had recorded provisions that reasonably cover any contingencies that might arise from the aforementioned tax and legal litigation. | |||
| Following is a description of the developmemts in 2007 in the litigation against Casa de Bolsa Santander, S.A. de C.V. Grupo Financiero Santander (Casa de Bolsa): |
| • | In 1997 Casa de Bolsa was sued for an alleged breach of various stock brokerage contracts. On July 6, 1999, Civil Court number thirty-one of the Federal District handed down a judgment ordering Casa de Bolsa to return to the plaintiff 2,401,588 shares of México 1 and 11,219,730 shares of México 4 at their market value and to pay MXP 15 million, plus interest calculated at the average percentage borrowing cost (C.P.P.) multiplied by four. | ||
| After numerous appeals were filed concerning the method used for calculating this interest, a final judgment was handed down ruling that the interest should not be capitalized. | |||
| Following this judgment, the amount owed was paid in full and there are currently no claims outstanding in this connection. |
| 26. | Equity having the substance of a financial liability | |
| This category includes the financial instruments issued by the consolidated companies which, although equity for legal purposes, do not meet the requirements for classification as equity. | ||
| These shares do not carry any voting rights and are non-cumulative. They were subscribed to by non-Group third parties and, except for the shares of Abbey amounting to GBP 325 million, are redeemable at the discretion of the issuer, based on the terms and conditions of each issue. | ||
| The changes in the balance of “Equity having the substance of a financial liability” were as follows: |
| Thousands of Euros | ||||||||||||
| 2007 | 2006 | 2005 | ||||||||||
| Balance at beginning of year | 668,328 | 1,308,847 | 2,124,222 | |||||||||
| Redemptions | (94,912 | ) | (472,925 | ) | (944,968 | ) | ||||||
Of which: | ||||||||||||
Totta & Açores Financing, Limited | — | (118,483 | ) | — | ||||||||
Abbey National, plc | — | (354,442 | ) | — | ||||||||
BSCH Finance, Ltd. | — | — | (754,774 | ) | ||||||||
BCH Capital, Ltd. | — | — | (190,194 | ) | ||||||||
Pinto Totta Internacional Finance, Limited | (94,912 | ) | — | — | ||||||||
| Exchange differences and other changes | (50,858 | ) | (167,594 | ) | 129,593 | |||||||
Balance at end of year | 522,558 | 668,328 | 1,308,847 | |||||||||
| The detail of the issuers and of the most significant terms and conditions of the issues is as follows: |
| Millions of Euros | ||||||||||||||||||||||||||||||||
| 2007 | 2006 | 2005 | Annual | |||||||||||||||||||||||||||||
| Equivalent | Foreign | Equivalent | Foreign | Equivalent | Foreign | Interest | Redemption | |||||||||||||||||||||||||
| Issuer and Currency of Issue | Euro Value | Currency | Euro Value | Currency | Euro Value | Currency | Rate (%) | Option (1) | ||||||||||||||||||||||||
| Banesto Holdings Ltd. (US dollar) | 53 | 77 | 59 | 77 | 66 | 77 | 10.50% | 30/06/12 | ||||||||||||||||||||||||
| Totta & Açores Financing, Limited (US dollar) | — | — | — | — | 127 | 150 | — | — | ||||||||||||||||||||||||
| Pinto Totta International Finance, Limited (US dollar) | — | — | 95 | 125 | 212 | 250 | — | — | ||||||||||||||||||||||||
| Abbey (US dollar) | — | — | — | — | 381 | 450 | — | — | ||||||||||||||||||||||||
| Abbey (Pound sterling) | 443 | 325 | 484 | 325 | 474 | 325 | 8.63% to 10.38% | No option | ||||||||||||||||||||||||
| Valuation adjustments | 27 | — | 30 | — | 49 | — | — | — | ||||||||||||||||||||||||
Balance at end of year | 523 | 668 | 1,309 | |||||||||||||||||||||||||||||
| (1) | From these dates, the issuer can redeem the shares, subject to prior authorization by the national supervisor. |
F-97
Table of Contents
| 27. | Tax matters |
| a) | Consolidated Tax Group | ||
| Pursuant to current legislation, the consolidated tax group includes Banco Santander , S.A. (as the Parent) and the Spanish subsidiaries that meet the requirements provided for in Spanish legislation regulating the taxation of the consolidated profits of corporate groups (as the controlled entities). | |||
| The other Group banks and companies file income tax returns in accordance with the tax regulations applicable in each country. | |||
| b) | Years open for review by the tax authorities | ||
| At December 31, 2007, the consolidated tax group had, in addition to the two years mentioned below, 2003, 2004, 2005, 2006 and 2007 open for review in relation to the main taxes applicable to it. | |||
| The other consolidated entities have the corresponding years open for review, pursuant to their respective tax regulations. | |||
| The tax audit of 2001 and 2002 for the main taxes applicable to the consolidated tax group was completed in March 2007. Most of the tax assessments issued were signed on a contested basis. | |||
| In 2007 there were no significant developments in connection with the tax disputes at the different instances, which were pending resolution at December 31, 2006. | |||
| Because of the possible different interpretations which can be made of the tax regulations, the outcome of the tax audits of the years reviewed and of the open years might give rise to contingent tax liabilities which cannot be objectively quantified. However, the Group’s tax advisers consider that the possibility of such contingent liabilities becoming actual liabilities is remote, and that in any event the tax charge which might arise therefrom would not materially affect the consolidated financial statements of the Group. | |||
| c) | Reconciliation | ||
| The reconciliation of the corporation tax expense calculated at the standard tax rate to the income tax expense recognized is as follows: |
| Millions of Euros | ||||||||||||
| 2007 | 2006 | 2005 | ||||||||||
| Consolidated profit before tax: | ||||||||||||
| From continuing operations | 11,175 | 8,995 | 7,661 | |||||||||
| From discontinued operations | 973 | 1,840 | 480 | |||||||||
| 12,148 | 10,835 | 8,141 | ||||||||||
| Corporation tax at 32.5% (*) | 3,948 | 3,792 | 2,849 | |||||||||
| Decreases due to permanent differences | (1,062 | ) | (1,022 | ) | (981 | ) | ||||||
Of which: | ||||||||||||
Due to effect of different tax rates | (851 | ) | (1,364 | ) | (627 | ) | ||||||
Due to effect on deferred taxes of change in Spanish tax rate | — | 491 | - | |||||||||
| Income tax of Group companies, per local books | 2,886 | 2,770 | 1,868 | |||||||||
| Net increases (decreases) due to other permanent differences | (577 | ) | (568 | ) | (539 | ) | ||||||
| Other, net | 204 | 388 | 62 | |||||||||
Current income tax | 2,513 | 2,590 | 1,391 | |||||||||
Of which: | ||||||||||||
Ordinary activities | 2,336 | 2,255 | 1,242 | |||||||||
Discontinued operations | 177 | 335 | 149 | |||||||||
Of which: | ||||||||||||
Current tax | 2,805 | 2,003 | 837 | |||||||||
Deferred taxes | (292 | ) | 587 | 554 | ||||||||
Taxes paid in the year | 3,181 | 949 | 1,036 | |||||||||
| (*) | 35% for 2006 and 2005. |
F-98
Table of Contents
| The effective tax rate is as follows: |
| Millions of Euros | ||||||||||||
| 2007 | 2006 | 2005 | ||||||||||
| Consolidated tax group | 5,043 | 4,212 | 3,281 | |||||||||
| Other Spanish entities | 50 | 1,518 | 389 | |||||||||
| Foreign entities | 7,055 | 5,105 | 4,471 | |||||||||
| 12,148 | 10,835 | 8,141 | ||||||||||
Income tax | 2,513 | 2,590 | 1,391 | |||||||||
Effective tax rate | 20.69 | % | 23.90 | % | 17.09 | % | ||||||
| d) | Tax recognized in equity | ||
| In addition to the income tax recognized in the consolidated income statement, the Group recognized the following amounts in consolidated equity: |
| Millions of Euros | ||||||||||||
| 2007 | 2006 | 2005 | ||||||||||
Tax charged to equity | (497 | ) | (418 | ) | (438 | ) | ||||||
| Measurement of available-for-sale fixed-income securities | (104 | ) | (276 | ) | (184 | ) | ||||||
| Measurement of available-for-sale equity securities | (393 | ) | (99 | ) | (230 | ) | ||||||
| Measurement of cash flow hedges | — | (43 | ) | (24 | ) | |||||||
Tax credited to equity | 20 | — | — | |||||||||
| Measurement of cash flow hedges | 20 | — | — | |||||||||
Total | (477 | ) | (418 | ) | (438 | ) | ||||||
| e) | Deferred taxes | ||
| The balance of “Tax assets” in the consolidated balance sheets includes debit balances with the tax authorities relating to deferred tax assets. The balance of “Tax liabilities” includes the liability for the Group’s various deferred tax liabilities. | |||
| The detail of the balances of “Deferred tax assets” and “Deferred tax liabilities” is as follows: |
| Millions of Euros | ||||||||||||
| 2007 | 2006 | 2005 | ||||||||||
Deferred tax assets | 10,853 | 9,156 | 8,909 | |||||||||
Of which: | ||||||||||||
Banespa | 1,905 | 1,577 | 1,201 | |||||||||
Abbey | 1,257 | 1,517 | 1,390 | |||||||||
Early retirements | 1,167 | 1,482 | 1,286 | |||||||||
Other pensions | 1,167 | 966 | 1,225 | |||||||||
Prepaid taxes- Investments | 965 | — | — | |||||||||
Deferred tax liabilities | 3,744 | 3,778 | 2,767 | |||||||||
Of which: | ||||||||||||
Abbey | 741 | 799 | 957 | |||||||||
Banespa | 253 | 149 | 33 | |||||||||
Banco Santander, S.A. Institución de Banca Múltiple Grupo Financiero Santander | 101 | 159 | 6 | |||||||||
Santander Consumer Bank Aktiengesellschaft | 104 | 104 | 83 | |||||||||
Valuation adjustments | 534 | 425 | 560 | |||||||||
F-99
Table of Contents
| The changes in the balances of “Deferred tax assets” and “Deferred tax liabilities” were as follows: |
| Millions of Euros | ||||||||||||||||||||||||
| Foreign | ||||||||||||||||||||||||
| Currency | Charge/Credit | |||||||||||||||||||||||
| Balance | to Asset | |||||||||||||||||||||||
| Balances at | Translation | and Liability | Acquisitions | Balances at | ||||||||||||||||||||
| December 31, | (Charge)/Credit | Differences and | Revaluation | for the Year | December 31, | |||||||||||||||||||
| 2005 | to Income | Other Items | Reserve | (Net) | 2006 | |||||||||||||||||||
| Deferred tax assets | 8,909 | 148 | 225 | (22 | ) | (104 | ) | 9,156 | ||||||||||||||||
| Deferred tax liabilities | (2,767 | ) | (735 | ) | (252 | ) | 112 | (136 | ) | (3,778 | ) | |||||||||||||
Total | 6,142 | (587 | ) | (27 | ) | 90 | (240 | ) | 5,378 | |||||||||||||||
| Millions of Euros | ||||||||||||||||||||||||||||
| Foreign | ||||||||||||||||||||||||||||
| Currency | Charge/Credit | |||||||||||||||||||||||||||
| Balance | to Asset | |||||||||||||||||||||||||||
| Balances at | Translation | and Liability | Acquisitions | Balances at | ||||||||||||||||||||||||
| December 31, | (Charge)/Credit | Differences and | Revaluation | Prepaid | for the Year | December 31, | ||||||||||||||||||||||
| 2006 | to Income | Other Items | Reserve | Taxes | (Net) | 2007 | ||||||||||||||||||||||
| Deferred tax assets | 9,156 | 419 | 230 | 110 | 965 | (27 | ) | 10,853 | ||||||||||||||||||||
| Deferred tax liabilities | (3,778 | ) | (127 | ) | 252 | (128 | ) | — | 37 | (3,744 | ) | |||||||||||||||||
Total | 5,378 | 292 | 482 | (18 | ) | 965 | 10 | 7,109 | ||||||||||||||||||||
| f) | Other information | ||
| In conformity with the Listing Rules Instrument 2005 published by the UK Financial Services Authority, it is hereby stated that shareholders of the Bank resident in the United Kingdom will be entitled to a tax credit in respect of the withholdings the Bank is required to make from the dividends to be paid to them. The shareholders of the Bank resident in the United Kingdom who hold their ownership interest in the Bank through Grupo Santander Nominee Service will be informed directly of the amount thus withheld and of any other data they may require to complete their tax returns in the United Kingdom. The other shareholders of the Bank resident in the United Kingdom should contact their bank or securities broker. |
F-100
Table of Contents
| 28. | Minority interests | |
| “Minority interests” include the net amount of the equity of subsidiaries attributable to equity instruments that do not belong, directly or indirectly, to the Bank, including the portion attributed to them of profit for the year. |
| a) | Breakdown | ||
| The detail, by Group company, of the balance of “Equity — Minority interests” is as follows: |
| Thousands of Euros | ||||||||||||
| 2007 | 2006 | 2005 | ||||||||||
| Grupo Financiero Santander, S.A. de C.V. | 649,291 | 657,013 | 609,728 | |||||||||
| Banesto | 476,152 | 303,889 | 767,833 | |||||||||
| Banco Santander Chile | 241,726 | 234,726 | 146,192 | |||||||||
| Brazil Group | 56,062 | 45,161 | 44,275 | |||||||||
| Santander BanCorp | 30,701 | 31,311 | 29,539 | |||||||||
| Other companies | 328,445 | 298,837 | 720,990 | |||||||||
| 1,782,377 | 1,570,937 | 2,318,557 | ||||||||||
| Profit for the year attributed to minority interests | 575,892 | 649,806 | 529,666 | |||||||||
Of which: | ||||||||||||
Banesto Group | 81,467 | 260,591 | 149,143 | |||||||||
Grupo Financiero Santander, S.A. de C.V. | 281,186 | 166,103 | 139,885 | |||||||||
Banco Santander Chile | 138,781 | 84,640 | 58,153 | |||||||||
Somaen-Dos, S.L. | — | 77,177 | 138,919 | |||||||||
Brazil Group | 7,005 | 10,568 | 11,559 | |||||||||
Santander BanCorp | 1,626 | 3,053 | 6,680 | |||||||||
| 2,358,269 | 2,220,743 | 2,848,223 | ||||||||||
| b) | Changes | ||
| The changes in the balance of “Minority interests” are summarized as follows: |
| Millions of Euros | ||||||||||||
| 2007 | 2006 | 2005 | ||||||||||
| Balance at beginning of year | 2,221 | 2,848 | 2,085 | |||||||||
| (Net) inclusion of companies in the Group and changes in scope of consolidation | (9 | ) | (1,050 | ) | 34 | |||||||
| Change in proportion of ownership interest | (117 | ) | 72 | (1 | ) | |||||||
| Valuation adjustments | (57 | ) | 15 | 49 | ||||||||
| Dividends paid to minority interests | (360 | ) | (160 | ) | (137 | ) | ||||||
| Changes in share capital | 220 | (29 | ) | (25 | ) | |||||||
| Exchange differences and other items | (116 | ) | (125 | ) | 313 | |||||||
| Profit for the year attributed to minority interests | 576 | 650 | 530 | |||||||||
Balance at end of year | 2,358 | 2,221 | 2,848 | |||||||||
F-101
Table of Contents
| 29. | Valuation adjustments | |
| The balances of “Valuation adjustments” include the amounts, net of the related tax effect, of adjustments to the assets and liabilities recognized temporarily in equity through the statement of changes in equity until they are extinguished or realized, when they are recognized definitively as shareholders’ equity through the consolidated income statement. The amounts arising from subsidiaries, jointly controlled entities and associates are presented, on a line by line basis, in the appropriate items according to their nature. | ||
| “Valuation adjustments” include the following items: |
| a) | Available-for-sale financial assets |
| Thousands of Euros | ||||||||||||
| 2007 | 2006 | 2005 | ||||||||||
| Balance at beginning of year | 2,283,323 | 1,941,690 | 1,936,818 | |||||||||
| Revaluation gains | 825,812 | 1,663,713 | 911,814 | |||||||||
| Income tax | (107,043 | ) | (144,772 | ) | (23,468 | ) | ||||||
| Amounts transferred to income | (1,583,126 | ) | (1,177,308 | ) | (883,474 | ) | ||||||
Balance at end of year | 1,418,966 | 2,283,323 | 1,941,690 | |||||||||
Of which: | ||||||||||||
Fixed-income | 157,698 | 594,719 | 407,084 | |||||||||
Equities | 1,261,268 | 1,688,604 | 1,534,606 | |||||||||
| b) | Cash flow hedges | ||
| This item includes the net amount of changes in the value of financial derivatives designated as hedging instruments in cash flow hedges, for the portion of these changes considered as effective hedges (Note 11). | |||
| The changes in this item were as follows: |
| Thousands of Euros | ||||||||||||
| 2007 | 2006 | 2005 | ||||||||||
| Balance at beginning of year | 49,252 | 70,406 | (1,787 | ) | ||||||||
| Valuation gains/(losses) | (156,313 | ) | 9,087 | 83,216 | ||||||||
| Income tax | 62,633 | (30,241 | ) | (11,023 | ) | |||||||
| Amounts transferred to income | (14,227 | ) | — | — | ||||||||
Balance at end of year | (58,655 | ) | 49,252 | 70,406 | ||||||||
Of which: | ||||||||||||
Spain | (53,294 | ) | (54,498 | ) | 43,709 | |||||||
Mexico | 16,863 | 83,608 | 17,439 | |||||||||
Italy | 20,393 | 17,825 | — | |||||||||
United States | (36,987 | ) | — | — | ||||||||
Other countries | (5,630 | ) | 2,317 | 9,258 | ||||||||
F-102
Table of Contents
| c) | Hedges of net investments in foreign operations and Exchange differences | ||
| “Hedges of net investments in foreign operations” include the net amount of changes in the value of hedging instruments in hedges of net investments in foreign operations, for the portion of these changes considered as effective hedges (Note 11). | |||
| “Exchange differences” include the net amount of exchange differences arising on non-monetary items whose fair value is adjusted against equity and the differences arising on the translation to euros of the balances of the consolidated entities whose functional currency is not the euro (Note 2-a). |
| The changes in these two items were as follows: |
| Thousands of Euros | ||||||||||||
| 2007 | 2006 | 2005 | ||||||||||
| Balance at beginning of year | 538,182 | 1,065,000 | (157,467 | ) | ||||||||
| Revaluation gains (losses) | (1,236,453 | ) | (529,982 | ) | 1,388,998 | |||||||
| Amounts transferred to income | 59,996 | 3,164 | (166,531 | ) | ||||||||
Balance at end of year | (638,275 | ) | 538,182 | 1,065,000 | ||||||||
Of which: | ||||||||||||
Arising on consolidation: | ||||||||||||
Subsidiaries: | (663,779 | ) | 549,211 | 1,061,515 | ||||||||
Brazil Group | 696,462 | 456,412 | 544,228 | |||||||||
Chile Group | (130,186 | ) | (40,677 | ) | 178,260 | |||||||
Mexico Group | (508,264 | ) | (217,746 | ) | 87,093 | |||||||
Abbey Group | (562,990 | ) | 490,771 | 264,769 | ||||||||
Other | (158,801 | ) | (139,549 | ) | (12,835 | ) | ||||||
Associates (Note 13) | 25,504 | (11,029 | ) | 3,485 | ||||||||
F-103
Table of Contents
| 30. | Shareholders’ equity | |
| “Shareholders’ equity” includes the amounts of equity contributions from shareholders, accumulated profit or loss recognized through the consolidated income statement, and components of compound financial instruments having the substance of permanent equity. Amounts arising from subsidiaries and jointly controlled entities are presented in the appropriate items based on their nature. |
| The changes in “Shareholders’ equity” were as follows: |
| Thousands of Euros | ||||||||||||||||||||||||||||||||||||
| Reserves of | ||||||||||||||||||||||||||||||||||||
| Entities | ||||||||||||||||||||||||||||||||||||
| Accounted | Profit | |||||||||||||||||||||||||||||||||||
| for Using | Other | Attributed | ||||||||||||||||||||||||||||||||||
| Share | Share | Accumulated | the Equity | Equity | Treasury | to the | Dividends and | |||||||||||||||||||||||||||||
| Capital | Premium | Reserves | Method | Instruments | Shares | Group | Remuneration | Total | ||||||||||||||||||||||||||||
Balances at January 1, 2005 | 3,127,148 | 20,370,128 | 6,256,632 | 621,195 | 93,567 | (126,500 | ) | 3,605,870 | (1,310,662 | ) | 32,637,378 | |||||||||||||||||||||||||
| Profit attributable to the Group for the year | — | — | — | — | — | — | 6,220,104 | — | 6,220,104 | |||||||||||||||||||||||||||
| Appropriation of profit for the year | — | — | 3,279,608 | 326,262 | — | — | (3,605,870 | ) | — | — | ||||||||||||||||||||||||||
| Dividends/Remuneration | — | — | (1,721,691 | ) | (115,582 | ) | — | — | — | (433,537 | ) | (2,270,810 | ) | |||||||||||||||||||||||
| Issues (reductions) | — | — | (2,531 | ) | — | — | — | — | — | (2,531 | ) | |||||||||||||||||||||||||
| Purchase and sale of own equity instruments | — | — | 26,421 | — | — | 73,432 | — | — | 99,853 | |||||||||||||||||||||||||||
| Payments with equity instruments | — | — | — | — | 19,167 | — | — | — | 19,167 | |||||||||||||||||||||||||||
| Transfers | — | — | 267,052 | (243,462 | ) | (23,590 | ) | — | — | — | — | |||||||||||||||||||||||||
| Other | — | — | (5,351 | ) | 15,236 | (11,666 | ) | — | — | — | (1,781 | ) | ||||||||||||||||||||||||
Balances at December 31, 2005 | 3,127,148 | 20,370,128 | 8,100,140 | 603,649 | 77,478 | (53,068 | ) | 6,220,104 | (1,744,199 | ) | 36,701,380 | |||||||||||||||||||||||||
| Profit attributable to the Group for the year | — | — | — | — | — | — | 7,595,947 | — | 7,595,947 | |||||||||||||||||||||||||||
| Appropriation of profit for the year | — | — | 5,828,922 | 391,182 | — | — | (6,220,104 | ) | — | — | ||||||||||||||||||||||||||
| Dividends/Remuneration | — | — | (2,495,742 | ) | (109,173 | ) | — | — | — | 406,981 | (2,197,934 | ) | ||||||||||||||||||||||||
| Issues (reductions) | — | — | (4,163 | ) | — | — | — | — | — | (4,163 | ) | |||||||||||||||||||||||||
| Purchase and sale of own equity instruments | — | — | 9,627 | — | — | (73,733 | ) | — | — | (64,106 | ) | |||||||||||||||||||||||||
| Payments with equity instruments | — | — | — | — | 19,167 | — | — | — | 19,167 | |||||||||||||||||||||||||||
| Transfers | — | — | 79,346 | (44,369 | ) | (34,977 | ) | — | — | — | — | |||||||||||||||||||||||||
| Other | — | — | (26,460 | ) | (43,479 | ) | 450 | — | — | — | (69,489 | ) | ||||||||||||||||||||||||
Balances at December 31, 2006 | 3,127,148 | 20,370,128 | 11,491,670 | 797,810 | 62,118 | (126,801 | ) | 7,595,947 | (1,337,218 | ) | 41,980,802 | |||||||||||||||||||||||||
| Profit attributable to the Group for the year | — | — | — | — | — | — | 9,060,258 | — | 9,060,258 | |||||||||||||||||||||||||||
| Appropriation of profit for the year | — | — | 7,169,330 | 426,617 | — | — | (7,595,947 | ) | — | — | ||||||||||||||||||||||||||
| Dividends/Remuneration | — | — | (3,117,057 | ) | (139,086 | ) | — | — | — | (200,589 | ) | (3,456,732 | ) | |||||||||||||||||||||||
| Issues (reductions) | — | — | (1,704 | ) | — | 7,000,000 | — | — | — | 6,998,296 | ||||||||||||||||||||||||||
| Purchase and sale of own equity instruments | — | — | 4,575 | — | — | 126,609 | — | — | 131,184 | |||||||||||||||||||||||||||
| Payments with equity instruments | — | — | — | — | 48,548 | — | — | — | 48,548 | |||||||||||||||||||||||||||
| Transfers | — | — | 207,364 | (195,246 | ) | (12,118 | ) | — | — | — | — | |||||||||||||||||||||||||
| Other | — | — | (278,185 | ) | 5,342 | (11,667 | ) | — | — | — | (284,510 | ) | ||||||||||||||||||||||||
Balances at December 31, 2007 | 3,127,148 | 20,370,128 | 15,475,993 | 895,437 | 7,086,881 | (192 | ) | 9,060,258 | (1,537,807 | ) | 54,477,846 | |||||||||||||||||||||||||
Parent | 3,127,148 | 20,370,128 | 7,696,864 | — | 7,078,622 | — | 4,070,247 | (1,537,807 | ) | 40,805,202 | ||||||||||||||||||||||||||
Subsidiaries | — | — | 7,687,422 | — | 8,259 | (192 | ) | 4,501,609 | — | 12,197,098 | ||||||||||||||||||||||||||
Jointly controlled entities | — | — | 91,707 | — | — | — | 46,945 | — | 138,652 | |||||||||||||||||||||||||||
Associates | — | — | — | 895,437 | — | — | 441,457 | — | 1,336,894 | |||||||||||||||||||||||||||
| 31. | Issued capital |
| a) | Changes | ||
At the end of each of the last three years, the share capital consisted of 6,254,296,579 shares and amounted to€3,127,148,290. | |||
| The Bank’s shares are listed on the computerized trading system of the Spanish stock exchanges and on the New York, London, Milan, Lisbon, Buenos Aires and Mexico stock exchanges, and all of them have the same features and rights. At December 31, 2007, the only shareholders with an ownership interest in the Bank’s share capital of over 3% were Chase Nominees Ltd. (with a 10.80% holding), State Street Bank & Trust (with an 8.13% holding) and EC Nominees Ltd. (with a 5.85% holding). |
| b) | Other considerations | ||
At December 31, 2006, the additional share capital authorized by the shareholders at the Annual General Meeting of the Bank amounted to€1,564 million. | |||
The shareholders at the Annual General Meeting on June 23, 2007 resolved to increase capital by€375 million, and fully empowered the Board of Directors to set and establish, within a period of one year, the terms and conditions for this capital increase in all matters not already provided for by the Annual General Meeting. In exercising these powers, the Board of Directors must determine whether the capital increase is to be performed through the issuance of new shares or by increasing the par value of the shares outstanding. |
F-104
Table of Contents
Also, the aforementioned Annual General Meeting authorized the Bank’s Board of Directors to issue fixed-income securities for up to a maximum amount of€35,000 million (or the equivalent amount in another currency) by any lawful means. The shareholders at the Annual General Meeting on June 21, 2003 authorized the Board to issue fixed-income securities, convertible into new shares or exchangeable for outstanding shares, for up to€4,000 million over a five-year period, and empowered the Bank’s Board of Directors to increase capital by the required amount to cater for the requests for conversion. Of the aforementioned amount,€2,000 million are still available for issue. | |||
| At December 31, 2007, the shares of the following companies were listed on official stock markets: Banco Río, S.A.; Banco de Venezuela, S.A.; Banco Universal; Banco Santander Colombia, S.A.; Santander BanCorp (Puerto Rico); Grupo Financiero Santander, S.A. de C.V.; Banco Santander Chile; Cartera Mobiliaria, S.A., S.I.C.A.V.; Inversiones Tesoreras, S.I.C.A.V., S.A.; Santander Chile Holding, S.A.; Inmuebles B de V 1985 C.A.; Banco Santander, S.A. (Brazil); Banco Español de Crédito, S.A.; Portada, S.A. and Capital Variable S.I.C.A.V., S.A. | |||
| At December 31, 2007, the number of Bank shares owned by third parties and managed by Group management companies (mainly portfolio, collective investment undertaking and pension fund managers) was 31,899,321, which represented 0.51% of the Bank’s share capital. In addition, the number of Bank shares owned by third parties and received as security was 14,767,478 (equal to 0.236% of the Bank’s share capital). | |||
| At December 31, 2007, the capital increases in progress at Group companies and the additional capital authorized by their shareholders at the respective Annual General Meetings were not material at Group level. |
| 32. | Share premium | |
| “Share premium” includes the amount paid up by the Bank’s shareholders in capital issues in excess of the par value. | ||
| The Consolidated Spanish Companies Law expressly permits the use of the share premium account balance to increase capital at the entities at which it is recognized and does not establish any specific restrictions as to its use. |
| 33. | Reserves |
| a) | Definitions | ||
| The balance of “Shareholders’ equity – Reserves – Accumulated reserves” includes the net amount of the accumulated profit or loss recognized in previous years through the consolidated income statement that, in the distribution of profit, was appropriated to equity, and the own equity instrument issuance expenses and the differences between the selling price of treasury shares and the cost of acquisition thereof. | |||
| The balance of “Shareholders’ equity – Reserves of entities accounted for using the equity method” includes the net amount of the accumulated profit or loss generated in previous years by entities accounted for using the equity method, recognized through the consolidated income statement. |
F-105
Table of Contents
| b) | Breakdown | ||
| The breakdown of the balances of these reserve accounts is as follows: |
| Thousands of Euros | ||||||||||||
| 2007 | 2006 | 2005 | ||||||||||
Accumulated reserves: | ||||||||||||
| Restricted reserves- | ||||||||||||
| Legal reserve | 625,430 | 625,430 | 625,430 | |||||||||
| Reserve for treasury shares | 218,603 | 378,700 | 173,103 | |||||||||
| Revaluation reserve Royal Decree-Law 7/1996 | 42,666 | 42,666 | 42,666 | |||||||||
| Reserve for retired capital | 10,610 | 10,610 | — | |||||||||
| Voluntary reserves (*) | 3,668,316 | 3,711,534 | 3,791,677 | |||||||||
| Consolidation reserves attributed to the Bank | 3,131,239 | 1,831,093 | 992,066 | |||||||||
| Reserves at subsidiaries | 7,779,129 | 4,891,637 | 2,475,198 | |||||||||
| 15,475,993 | 11,491,670 | 8,100,140 | ||||||||||
Reserves of entities accounted for using the equity method: | ||||||||||||
| Associates | 895,437 | 797,810 | 603,649 | |||||||||
Of which: | ||||||||||||
Cepsa | 734,719 | 662,172 | 469,763 | |||||||||
Attijariwafa Bank | 126,626 | 111,701 | 102,692 | |||||||||
| 16,371,430 | 12,289,480 | 8,703,789 | ||||||||||
| (*) | Include the reserves stipulated by Article 81 of the Consolidated Spanish Companies Law for an amount equal to the loans granted by Group companies to third parties for the acquisition of treasury shares. |
| i. | Legal reserve |
| ii. | Reserve for treasury shares |
| iii. | Revaluation reserve Royal Decree Law 7/1996, of 7 June |
F-106
Table of Contents
| iv. | Reserves at subsidiaries and jointly controlled entities |
| Millions of Euros | ||||||||||||
| 2007 | 2006 | 2005 | ||||||||||
| Banco Español de Crédito, S.A. (Banesto) (Consolidated Group) | 3,319 | 2,312 | 1,809 | |||||||||
| Banco Santander, S.A., Institución de Banca Múltiple, Grupo Financiero Santander (Consolidated Group) | 1,819 | 1,336 | 998 | |||||||||
| Abbey Group | 1,419 | 742 | — | |||||||||
| Banespa (Consolidated Group) | 1,036 | 976 | 927 | |||||||||
| Banco Santander Totta, S.A. (Consolidated Group) | 939 | 784 | 642 | |||||||||
| Banco Santander Chile (Consolidated Group) | 589 | 473 | 215 | |||||||||
| Banco de Venezuela, S.A., Banco Universal (Consolidated Group) | 502 | 402 | 272 | |||||||||
| Grupo Santander Consumer Finance, S.A. | 323 | 304 | 302 | |||||||||
| Cartera Mobiliaria, S.A., S.I.C.A.V. | 298 | 281 | 241 | |||||||||
| Santander Investment, S.A. | 181 | 167 | 129 | |||||||||
| Banco Santander International (United States) | 178 | 156 | 138 | |||||||||
| Banco Santander (Suisse), S.A. | 139 | 110 | 90 | |||||||||
| BSN — Banco Santander de Negocios Portugal, S.A. | 78 | 63 | 44 | |||||||||
| Banco Santander Río, S.A. | (525 | ) | (587 | ) | (379 | ) | ||||||
| Exchange differences | (3,167 | ) | (3,167 | ) | (3,167 | ) | ||||||
| Consolidation adjustments and other companies | 652 | 540 | 214 | |||||||||
Total | 7,779 | 4,892 | 2,475 | |||||||||
Of which: restricted | 925 | 740 | 556 | |||||||||
| 34. | Other equity instruments and Treasury shares |
| a) | Other equity instruments | ||
| “Other equity instruments” includes the equity component of compound financial instruments, the increase in equity due to personnel remuneration, and other items not recognized in other “Shareholders’ equity” items. | |||
Valores Santander | |||
In 2007, in order to partially finance the takeover bid launched on ABN AMRO (Note 3), Santander Emisora 150, S.A.U. issued securities mandatorily convertible into newly-issued ordinary shares of the Bank (“Valores Santander") amounting to€7,000 million. These securities can be voluntarily exchanged for Bank shares on 4 October 2008, 2009, 2010 and 2011, and must be mandatorily exchanged on October 4, 2012. | |||
The reference price of the Bank’s share for conversion purposes was set at€16.04 per share, and the conversion ratio of the bonds –i.e. the number of Bank shares corresponding to eachValor Santanderfor conversion purposes– is 311.76 shares for eachValor Santander. The nominal interest rate on these securities is 7.30% until October 4, 2008 and Euribor plus 2.75% thereafter until the securities are exchanged for shares. |
| b) | Treasury shares | ||
| The balance of “Shareholders’ equity – Treasury shares” includes the amount of equity instruments held by all the Group entities. | |||
| Transactions involving own equity instruments, including their issuance and cancellation, are recognized directly in equity, and no profit or loss may be recognized on these transactions. The costs of any transaction involving own equity instruments are deducted directly from equity, net of any related tax effect. | |||
| The shareholders at the Bank’s Annual General Meeting on June 23, 2007 set the maximum number of Bank shares that the Bank and/or any Group subsidiary are authorized to acquire at 5% of the fully paid share capital amount, at a minimum share price which cannot be lower than par value and a maximum share price of up to 3% higher than the quoted price on the computerized trading system of the Spanish stock exchanges at the date of acquisition. |
F-107
Table of Contents
| The Bank shares owned by the consolidated companies accounted for less than 0.01% of issued capital (also less than 0.01% including derivatives on own equity instruments) at December 31, 2007 (December 31, 2006: 0.15%; December 31, 2005: 0.08%). | |||
The average purchase price of the Bank’s shares in 2007 was€13.86 per share and the average selling price was€13.86 per share. | |||
The effect on equity arising from transactions involving Bank shares (gains of€5 million in 2007, gains of€10 million in 2006 and gains of€26 million in 2005) was recognized in equity. |
| 35. | Off-balance-sheet items | |
| “Off-balance-sheet items” relate to balances representing rights, obligations and other legal situations that in the future may have an impact on net assets, as well as any other balances needed to reflect all transactions performed by the consolidated entities although they may not impinge on their net assets. |
| a) | Contingent liabilities | ||
| “Contingent liabilities” includes all transactions under which an entity guarantees the obligations of a third party and which result from financial guarantees granted by the entity or from other types of contract. The breakdown is as follows: |
| i. | Financial guarantees |
| Millions of Euros | ||||||||||||
| 2007 | 2006 | 2005 | ||||||||||
| Bank guarantees and other indemnities provided | 69,805 | 52,697 | 44,251 | |||||||||
| Credit derivatives sold | 708 | �� | 478 | 180 | ||||||||
| Irrevocable documentary credits | 5,803 | 5,029 | 3,767 | |||||||||
| Other financial guarantees | — | 1 | 2 | |||||||||
| 76,316 | 58,205 | 48,200 | ||||||||||
| ii. | Assets earmarked for third-party obligations |
| iii. | Other contingent liabilities |
F-108
Table of Contents
| b) | Contingent commitments | ||
| “Contingent commitments” includes those irrevocable commitments that could give rise to the recognition of financial assets. |
| The breakdown of “Contingent commitments” is as follows: |
| Millions of Euros | ||||||||||||
| 2007 | 2006 | 2005 | ||||||||||
| Drawable by third parties | 102,216 | 91,690 | 77,678 | |||||||||
| Financial asset forward purchase commitments | 1,440 | 1,449 | 991 | |||||||||
| Regular way financial asset purchase contracts | 4,181 | 3,202 | 9,886 | |||||||||
| Securities subscribed but not paid | 107 | 83 | 196 | |||||||||
| Securities placement and underwriting commitments | 33 | 3 | 16 | |||||||||
| Documents delivered to clearing houses | 5,988 | 6,013 | 6,030 | |||||||||
| Other contingent commitments | 711 | 809 | 1,466 | |||||||||
| 114,676 | 103,249 | 96,263 | ||||||||||
| 36. | Other disclosures |
| a) | Notional amounts and market values of trading and hedging derivatives | ||
| The breakdown of the notional and/or contractual amounts and the market values of the trading and hedging derivatives held by the Group is as follows: |
| Millions of Euros | ||||||||||||||||||||||||
| 2007 | 2006 | 2005 | ||||||||||||||||||||||
| Notional | Market | Notional | Market | Notional | Market | |||||||||||||||||||
| Amount | Value | Amount | Value | Amount | Value | |||||||||||||||||||
Trading derivatives: | ||||||||||||||||||||||||
| Interest rate risk- | ||||||||||||||||||||||||
| Forward rate agreements | 330,315 | (878 | ) | 116,858 | (267 | ) | 16,332 | 3 | ||||||||||||||||
| Interest rate swaps | 1,923,372 | (455 | ) | 1,466,880 | 761 | 1,156,681 | (2,019 | ) | ||||||||||||||||
| Options and futures | 953,315 | (463 | ) | 825,795 | (780 | ) | 419,628 | 345 | ||||||||||||||||
| Foreign currency risk- | ||||||||||||||||||||||||
| Foreign currency purchases and sales | 117,868 | (505 | ) | 81,612 | (142 | ) | 63,203 | 108 | ||||||||||||||||
| Foreign currency options | 62,723 | (566 | ) | 62,852 | (464 | ) | 39,091 | (223 | ) | |||||||||||||||
| Currency swaps | 75,090 | (1,020 | ) | 56,096 | (366 | ) | 45,458 | (154 | ) | |||||||||||||||
| Securities and commodities derivatives | 157,807 | 1,809 | 138,628 | (2,496 | ) | 90,547 | 341 | |||||||||||||||||
| 3,620,490 | (2,078 | ) | 2,748,721 | (3,754 | ) | 1,830,940 | (1,599 | ) | ||||||||||||||||
Hedging derivatives: | ||||||||||||||||||||||||
| Interest rate risk- | ||||||||||||||||||||||||
| Forward rate agreements | — | — | 1 | — | 737 | (3 | ) | |||||||||||||||||
| Interest rate swaps | 120,822 | (1,159 | ) | 103,564 | 547 | 89,713 | 1,630 | |||||||||||||||||
| Futures and options | 10,660 | (112 | ) | 9,793 | (66 | ) | 106,341 | (28 | ) | |||||||||||||||
| Foreign currency risk- | ||||||||||||||||||||||||
| Foreign currency purchases and sales | 28 | 6 | 1,745 | 3 | 6,856 | (25 | ) | |||||||||||||||||
| Foreign currency options | 16,630 | 292 | 15,266 | 6 | 110 | — | ||||||||||||||||||
| Currency swaps | 16,372 | (99 | ) | 26,372 | (989 | ) | 20,563 | 248 | ||||||||||||||||
| Securities and commodities derivatives | 155 | 1 | 622 | (7 | ) | 2,307 | (7 | ) | ||||||||||||||||
| 164,667 | (1,071 | ) | 157,363 | (506 | ) | 226,627 | 1,815 | |||||||||||||||||
Total | 3,785,157 | (3,149 | ) | 2,906,084 | (4,259 | ) | 2,057,567 | 216 | ||||||||||||||||
F-109
Table of Contents
| Millions of Euros | ||||||||||||
| 2007 | 2006 | 2005 | ||||||||||
| Credit derivatives | 1,008 | 709 | 242 | |||||||||
| Securities derivatives | 3,227 | 2,148 | 1,573 | |||||||||
| Fixed-income derivatives | 405 | 9 | 67 | |||||||||
| Currency derivatives | 7,990 | 7,498 | 7,386 | |||||||||
| Interest rate derivatives | 17,507 | 18,084 | 19,319 | |||||||||
| Commodities derivatives | 23 | 4 | — | |||||||||
| Collateral received | (3,084 | ) | (1,562 | ) | (2,496 | ) | ||||||
Total | 27,076 | 26,890 | 26,091 | |||||||||
| Millions of Euros | ||||||||||||
| 2007 | 2006 | 2005 | ||||||||||
| Fair value hedges | (1,199 | ) | (474 | ) | 2,046 | |||||||
| Cash flow hedges | (137 | ) | (35 | ) | 24 | |||||||
| Hedges of net investments in foreign operations | 265 | 3 | (255 | ) | ||||||||
| (1,071 | ) | (506 | ) | 1,815 | ||||||||
| i. | Fair value hedges |
| ii. | Foreign currency hedges (net investments in foreign operations) |
F-110
Table of Contents
| b) | Off-balance-sheet funds under management | ||
| The detail of off-balance-sheet funds managed by the Group is as follows: |
| Millions of Euros | ||||||||||||
| 2007 | 2006 | 2005 | ||||||||||
| Investment funds | 119,211 | 119,838 | 109,480 | |||||||||
| Pension funds | 11,952 | 29,450 | 28,619 | |||||||||
| Assets under management | 19,814 | 17,836 | 14,746 | |||||||||
| 150,977 | 167,124 | 152,845 | ||||||||||
| 37. | Discontinued operations |
| a) | Description of divestments |
| i. | Abbey’s insurance business (Note 3-c.ii) |
| ii. | Inmobiliaria Urbis (Note 3-c.xvi) |
| iii. | Pension fund managers (AFPs) |
F-111
Table of Contents
| b) | Profit and net cash flows from discontinued operations | ||
| The detail of the profit from discontinued operations is set forth below. |
| The comparative figures for 2006 and 2005 were restated in order to reflect the operations classified as discontinued in 2007. |
| Thousands of Euros | ||||||||||||
| 2007 | 2006 | 2005 | ||||||||||
| Net interest income | 5,476 | (74,950 | ) | (164,223 | ) | |||||||
| Share of results of entities accounted for using the equity method | — | 123 | 9 | |||||||||
| Net fee and commission income | 177,892 | 220,997 | 254,826 | |||||||||
| Insurance activity income | 74,179 | 378,106 | 614,053 | |||||||||
| Gains/Losses on financial assets and liabilities | 17,741 | 49,040 | 31,376 | |||||||||
| Exchange differences | (94 | ) | 72 | (168 | ) | |||||||
Gross income | 275,194 | 573,388 | 735,873 | |||||||||
| Sales and income from the provision of non-financial services | — | 762,041 | 845,989 | |||||||||
| Cost of sales | — | (455,817 | ) | (576,135 | ) | |||||||
| Other operating income (Net) | (1,780 | ) | (4,920 | ) | (14,404 | ) | ||||||
| Personnel expenses | (73,552 | ) | (173,536 | ) | (208,638 | ) | ||||||
| Other general administrative expenses | (45,375 | ) | (131,743 | ) | (252,941 | ) | ||||||
| Depreciation and amortization | (4,530 | ) | (7,734 | ) | (7,268 | ) | ||||||
Net operating income | 149,957 | 561,679 | 522,476 | |||||||||
| Other gains (Net) | (7,703 | ) | (28,988 | ) | (42,427 | ) | ||||||
Profit before tax | 142,254 | 532,691 | 480,049 | |||||||||
| Income tax | (29,860 | ) | (152,056 | ) | (149,346 | ) | ||||||
| Profit from divestments | 830,928 | 1,307,033 | — | |||||||||
| Income tax on profit from divestments | �� | (146,727 | ) | (182,703 | ) | — | ||||||
Profit from discontinued operations | 796,595 | 1,504,965 | 330,703 | |||||||||
| Thousands of Euros | ||||||||||||
| 2007 | 2006 | 2005 | ||||||||||
| Cash and cash equivalents at beginning of year | 59 | 78,701 | 76,625 | |||||||||
| Cash flows from operating activities | (28,849 | ) | 180,407 | (2,065,721 | ) | |||||||
| Cash flows from investing activities | 65 | (64,253 | ) | 1,639,319 | ||||||||
| Cash flows from financing activities | 28,780 | (127,380 | ) | 428,478 | ||||||||
Cash and cash equivalents at end of year | 55 | 67,475 | 78,701 | |||||||||
F-112
Table of Contents
| c) | Consideration received | ||
| The breakdown of the assets and liabilities associated with discontinued operations is as follows: |
| Millions of Euros | ||||||||
| 2007 | 2006 | |||||||
ASSETS: | ||||||||
| Cash and balances with central banks | — | 68 | ||||||
| Financial assets held for trading | 426 | 1,495 | ||||||
Of which: Abbey Insurance | — | 1,482 | ||||||
Orígenes Seguros de Retiro | 348 | — | ||||||
| Other financial assets at fair value through profit or loss | 110 | 35,837 | ||||||
Of which: Abbey Insurance | — | 35,812 | ||||||
Orígenes Seguros de Retiro | ||||||||
| Available-for-sale financial assets | 43 | 6 | ||||||
| Loans and receivables | 422 | 1,461 | ||||||
Of which: Abbey Insurance | — | 1,105 | ||||||
Orígenes Seguros de Retiro | 410 | — | ||||||
| Non-current assets held for sale | — | 8 | ||||||
| Investments | — | 10 | ||||||
| Reinsurance assets | — | 2,361 | ||||||
Of which: Abbey Insurance | — | 2,361 | ||||||
| Tangible assets | 18 | 726 | ||||||
| Intangible assets | — | 31 | ||||||
| Tax assets | — | 89 | ||||||
| Prepayments and accrued income | — | 1,135 | ||||||
Of which: Abbey | — | 1,134 | ||||||
| Other assets | 62 | 2,910 | ||||||
Of which: Urbis | — | 2,904 | ||||||
LIABILITIES: | ||||||||
| Other financial liabilities at fair value through profit or loss | — | (845 | ) | |||||
| Financial liabilities at amortized cost | (68 | ) | (4,355 | ) | ||||
Of which: Urbis | — | (2,707 | ) | |||||
| Liabilities under insurance contracts | (640 | ) | (34,355 | ) | ||||
Of which: Abbey Insurance | — | (34,355 | ) | |||||
Orígenes Seguro de Retiro | (640 | ) | ||||||
| Provisions | (55 | ) | (57 | ) | ||||
| Tax liabilities | — | (147 | ) | |||||
| Accrued expenses and deferred income | — | (16 | ) | |||||
| Other liabilities | (117 | ) | (6 | ) | ||||
Net asset value | 201 | 6,356 | ||||||
| Goodwill | 5 | 46 | ||||||
| Minority interests | (19 | ) | (464 | ) | ||||
Net amount | 187 | 5,938 | ||||||
| Profit from divestments | 831 | 1,307 | ||||||
Consideration received | 1,018 | 7,245 | ||||||
Of which: in cash | 1,018 | 7,245 | ||||||
| d) | Earnings per share relating to discontinued operations | ||
| The earnings per share relating to discontinued operations were as follows: |
| 2007 | 2006 | 2005 | ||||||||||
| Basic earnings per share (euros) | 0.1117 | 0.2030 | 0.0368 | |||||||||
| Diluted earnings per share (euros) | 0.1105 | 0.2019 | 0.0367 | |||||||||
F-113
Table of Contents
| 38. | Interest and similar income | |
| “Interest and similar income” in the consolidated income statement comprises the interest accruing in the year on all financial assets with an implicit or explicit return, calculated by applying the effective interest method, irrespective of measurement at fair value; and the rectifications of income as a result of hedge accounting. Interest is recognized gross, without deducting any tax withheld at source. | ||
| The breakdown of the main interest and similar income items earned in 2007, 2006 and 2005 is as follows: |
| Thousands of Euros | ||||||||||||
| 2007 | 2006 | 2005 | ||||||||||
| Balances with the Bank of Spain and other central banks | 633,417 | 616,125 | 404,506 | |||||||||
| Due from credit institutions | 2,881,240 | 2,363,762 | 2,396,787 | |||||||||
| Debt instruments | 4,049,941 | 4,567,889 | 4,332,376 | |||||||||
| Loans and advances to customers | 35,202,921 | 26,498,414 | 21,398,898 | |||||||||
| Insurance contracts linked to pensions (Note 25) | 102,604 | 103,821 | 106,617 | |||||||||
| Other interest | 2,933,231 | 2,682,812 | 4,449,463 | |||||||||
Total | 45,803,354 | 36,832,823 | 33,088,647 | |||||||||
| 39. | Interest expense and similar charges | |
| “Interest expense and similar charges” in the consolidated income statement includes the interest accruing in the year on all financial liabilities with an implicit or explicit return, including remuneration in kind, calculated by applying the effective interest method, irrespective of measurement at fair value; the rectifications of cost as a result of hedge accounting; and the interest cost attributable to pension funds. | ||
| The breakdown of the main items of interest expense and similar charges accrued in 2007, 2006 and 2005 is as follows: |
| Thousands of Euros | ||||||||||||
| 2007 | 2006 | 2005 | ||||||||||
| Deposits from the Bank of Spain and other central banks | 279,624 | 300,374 | 485,725 | |||||||||
| Deposits from credit institutions | 3,581,327 | 3,297,332 | 3,106,892 | |||||||||
| Customer deposits | 12,408,001 | 11,083,439 | 9,382,865 | |||||||||
| Marketable debt securities | 9,351,606 | 5,828,925 | 4,262,401 | |||||||||
| Subordinated liabilities (Note 23) | 2,053,389 | 1,693,737 | 1,568,471 | |||||||||
| Pension funds (Note 25) | 487,911 | 735,004 | 640,545 | |||||||||
| Equity having the substance of a financial liability | 47,290 | 85,229 | 118,389 | |||||||||
| Other interest | 2,712,322 | 1,732,987 | 3,199,558 | |||||||||
Total | 30,921,470 | 24,757,027 | 22,764,846 | |||||||||
| 40. | Income from equity instruments | |
| “Income from equity instruments” includes the dividends and payments on equity instruments out of profits generated by investees after the acquisition of the equity interest. | ||
| The breakdown of the balance of “Income from equity instruments” is as follows: |
| Thousands of Euros | ||||||||||||
| 2007 | 2006 | 2005 | ||||||||||
Equity instruments classified as: | ||||||||||||
| Financial assets held for trading | 201,186 | 258,126 | 175,543 | |||||||||
| Available-for-sale financial assets | 212,056 | 145,874 | 160,033 | |||||||||
Of which: relating to San Paolo IMI S.p.A. | 80,500 | 90,037 | 74,281 | |||||||||
| 413,242 | 404,000 | 335,576 | ||||||||||
F-114
Table of Contents
| 41. | Share of results of entities accounted for using the equity method - Associates | |
| “Share of results of entities accounted for using the equity method – Associates” comprises the amount of profit or loss attributable to the Group generated during the year by associates. | ||
| The breakdown of the balance of this item is as follows: |
| Thousands of Euros | ||||||||||||
| 2007 | 2006 | 2005 | ||||||||||
| Cepsa | 206,706 | 370,169 | 476,191 | |||||||||
| Attijariwafa | 25,700 | 24,230 | 16,707 | |||||||||
| Sovereign | 43,355 | 9,199 | — | |||||||||
| RFS Holdings B.V. | 141,348 | — | — | |||||||||
| Unión Fenosa | — | — | 78,597 | |||||||||
| Técnicas Reunidas, S.A. | — | — | 11,287 | |||||||||
| U.C.I., S.A. | — | — | 19,850 | |||||||||
| Other companies | 24,348 | 23,323 | 16,525 | |||||||||
| 441,457 | 426,921 | 619,157 | ||||||||||
| 42. | Fee and commission income | |
| “Fee and commission income” comprises the amount of all fees and commissions accruing in favor of the Group in the year, except those that form an integral part of the effective interest rate on financial instruments. | ||
| The breakdown of the balance of this item is as follows: |
| Thousands of Euros | ||||||||||||
| 2007 | 2006 | 2005 | ||||||||||
Collection and payment services: | ||||||||||||
| Bills | 240,976 | 247,129 | 233,503 | |||||||||
| Demand accounts | 571,394 | 554,882 | 544,629 | |||||||||
| Cards | 1,524,161 | 1,291,327 | 1,153,252 | |||||||||
| Cheques | 411,256 | 455,194 | 270,867 | |||||||||
| Orders | 252,052 | 213,982 | 214,184 | |||||||||
| 2,999,839 | 2,762,514 | 2,416,435 | ||||||||||
Marketing of non-banking financial products: | ||||||||||||
| Investment funds | 1,812,975 | 1,685,459 | 1,498,757 | |||||||||
| Pension funds | 171,935 | 155,059 | 141,524 | |||||||||
| Insurance | 1,476,202 | 1,207,905 | 924,121 | |||||||||
| 3,461,112 | 3,048,423 | 2,564,402 | ||||||||||
Securities services: | ||||||||||||
| Securities underwriting and placement | 262,645 | 113,712 | 71,562 | |||||||||
| Securities trading | 434,182 | 350,801 | 258,364 | |||||||||
| Administration and custody | 266,598 | 263,529 | 274,444 | |||||||||
| Asset management | 94,594 | 76,613 | 58,574 | |||||||||
| 1,058,019 | 804,655 | 662,944 | ||||||||||
Other: | ||||||||||||
| Foreign exchange | 65,502 | 70,680 | 59,968 | |||||||||
| Financial guarantees | 360,893 | 306,853 | 254,608 | |||||||||
| Commitment fees | 166,374 | 106,412 | 58,380 | |||||||||
| Other fees and commissions | 1,368,247 | 1,189,043 | 1,137,210 | |||||||||
| 1,961,016 | 1,672,988 | 1,510,166 | ||||||||||
| 9,479,986 | 8,288,580 | 7,153,947 | ||||||||||
F-115
Table of Contents
| 43. | Fee and commission expense | |
| “Fee and commission expense” shows the amount of all fees and commissions paid or payable by the Group in the year, except those that form an integral part of the effective interest rate on financial instruments. | ||
| The breakdown of the balance of this item is as follows: |
| Thousands of Euros | ||||||||||||
| 2007 | 2006 | 2005 | ||||||||||
| Fees and commissions assigned to third parties | 924,801 | 798,034 | 653,362 | |||||||||
Of which: Cards | 671,077 | 627,610 | 533,333 | |||||||||
| Brokerage fees on lending and deposit transactions | 21,882 | 55,105 | 66,047 | |||||||||
| Other fees and commissions | 493,128 | 411,246 | 373,342 | |||||||||
| 1,439,811 | 1,264,385 | 1,092,751 | ||||||||||
| 44. | Insurance activity income | |
| “Insurance activity income” includes the net amount of the contribution from consolidated insurance and reinsurance companies to the Group’s gross income. |
| Thousands of Euros | ||||||||||||||||||||||||||||||||||||
| 2007 | 2006 | 2005 | ||||||||||||||||||||||||||||||||||
| Life | Non-Life | Total | Life | Non-Life | Total | Life | Non-Life | Total | ||||||||||||||||||||||||||||
| Net premiums collected | 4,861,011 | 319,448 | 5,180,459 | 4,313,315 | 214,369 | 4,527,683 | 2,000,625 | 115,109 | 2,115,734 | |||||||||||||||||||||||||||
| Claims paid and other insurance-related expenses | (2,601,011 | ) | (261,775 | ) | (2,862,786 | ) | (1,919,737 | ) | (129,884 | ) | (2,049,620 | ) | (1,336,851 | ) | (71,510 | ) | (1,408,361 | ) | ||||||||||||||||||
| Reinsurance income | 58,853 | 93,185 | 152,038 | 44,302 | 56,927 | 101,229 | 52,712 | 35,740 | 88,452 | |||||||||||||||||||||||||||
| Net charges to liabilities under insurance contracts | (2,632,133 | ) | (106,568 | ) | (2,738,701 | ) | (2,884,231 | ) | (63,852 | ) | (2,948,083 | ) | (1,149,586 | ) | (49,526 | ) | (1,199,112 | ) | ||||||||||||||||||
| Finance income | 563,121 | 34,382 | 597,503 | 887,643 | (46,805 | ) | 840,838 | 724,697 | 11,133 | 735,830 | ||||||||||||||||||||||||||
| Finance charges | (7,178 | ) | (1,982 | ) | (9,160 | ) | (216,671 | ) | (2,292 | ) | (218,963 | ) | (130,509 | ) | (568 | ) | (131,077 | ) | ||||||||||||||||||
| 242,663 | 76,690 | 319,353 | 224,621 | 28,463 | 253,084 | 161,088 | 40,378 | 201,466 | ||||||||||||||||||||||||||||
F-116
Table of Contents
| 45. | Gains/losses on financial assets and liabilities | |
| “Gains/losses on financial assets and liabilities” includes the amount of the valuation adjustments of financial instruments, except those attributable to interest accrued as a result of application of the effective interest method and to allowances, and the gains or losses obtained from the sale and purchase thereof. |
| a) | Breakdown | ||
| The breakdown of the balance of this item, by type of instrument, is as follows: |
| Thousands of Euros | ||||||||||||
| 2007 | 2006 | 2005 | ||||||||||
| Fixed-income | (402,884 | ) | 77,724 | 793,527 | ||||||||
| Equities, financial derivatives and other | 2,724,508 | 1,974,815 | 664,320 | |||||||||
Of which: | ||||||||||||
Financial assets and liabilities held for trading and derivatives | 2,019,787 | 1,549,486 | 317,608 | |||||||||
Available-for-sale financial assets | 704,721 | 374,150 | 345,561 | |||||||||
Of which due to the sale of: | ||||||||||||
Bolsas y Mercados Españoles, Sociedad Holding de Mercados y Sistemas Financieros | 110,587 | 106,197 | — | |||||||||
BPI | 107,000 | — | — | |||||||||
Telefónica, S.A. | 138,410 | — | — | |||||||||
Shinsei | — | — | 49,332 | |||||||||
Commerzbank | — | — | 24,424 | |||||||||
| 2,321,624 | 2,052,539 | 1,457,847 | ||||||||||
Of which: | ||||||||||||
Financial assets and liabilities classified as at fair value through profit or loss on initial recognition | 1,411,705 | 1,635,757 | 854,892 | |||||||||
| b) | Financial assets and liabilities at fair value through profit or loss | ||
| The detail of the amount of the asset balances is as follows: |
| Million of Euros | ||||||||||||
| 2007 | 2006 | 2005 | ||||||||||
| Loans and advances to credit institutions | 19,160 | 14,813 | 12,708 | |||||||||
| Loans and advances to customers | 31,726 | 38,556 | 32,911 | |||||||||
| Debt instruments | 73,403 | 81,237 | 91,441 | |||||||||
| Other equity instruments | 12,615 | 16,203 | 38,381 | |||||||||
| Derivatives | 46,726 | 34,985 | 27,629 | |||||||||
| 183,630 | 185,794 | 203,070 | ||||||||||
F-117
Table of Contents
| Millions of Euros | ||||||||||||
| 2007 | 2006 | 2005 | ||||||||||
| Derivatives | (48,803 | ) | (38,738 | ) | (29,228 | ) | ||||||
| Other liabilities | (107,107 | ) | (97,670 | ) | (95,048 | ) | ||||||
| (155,910 | ) | (136,408 | ) | (124,276 | ) | |||||||
| 46. | Exchange differences | |
| “Exchange differences” shows basically the gains or losses on currency dealings, the differences that arise on translations of monetary items in foreign currencies to the functional currency, and those disclosed on non-monetary assets in foreign currency at the time of their disposal. |
| 47. | Sales and income from the provision of non-financial services and cost of sales | |
| These items in the consolidated income statements show, respectively, the amount of sales of goods and income from the provision of services that constitute the typical activity of the non-financial consolidated Group entities and the related cost of sales. The main lines of business of these entities are as follows: |
| Thousands of Euros | ||||||||||||||||||||||||
| 2007 | 2006 | 2005 | ||||||||||||||||||||||
| Sales/ | Cost of | Sales/ | Cost of | Sales/ | Cost of | |||||||||||||||||||
| Line of Business | Income | Sales | Income | Sales | Income | Sales | ||||||||||||||||||
| Property | 40,368 | (12,232 | ) | 45,875 | (17,531 | ) | 80,464 | (55,789 | ) | |||||||||||||||
| Rail transport | 251,545 | (188,514 | ) | 240,411 | (190,236 | ) | 285,207 | (233,085 | ) | |||||||||||||||
| Other | 479,114 | (418,209 | ) | 448,316 | (407,922 | ) | 199,854 | (120,473 | ) | |||||||||||||||
| 771,027 | (618,955 | ) | 734,602 | (615,689 | ) | 565,525 | (409,347 | ) | ||||||||||||||||
| 48. | Other operating income | |
| The breakdown of the balance of “Other operating income” is as follows: |
| Thousands of Euros | ||||||||||||
| 2007 | 2006 | 2005 | ||||||||||
| Exploitation of investment property and operating leases | 2,758 | 3,976 | 4,306 | |||||||||
| Commissions on financial instruments offsetting related direct costs | 195,272 | 176,536 | 154,187 | |||||||||
| Other | 153,067 | 143,388 | 97,630 | |||||||||
| 351,097 | 323,900 | 256,123 | ||||||||||
F-118
Table of Contents
| 49. | Personnel expenses |
| a) | Breakdown | ||
| The breakdown of “Personnel expenses” is as follows: |
| Thousands of Euros | ||||||||||||
| 2007 | 2006 | 2005 | ||||||||||
| Wages and salaries | 4,819,751 | 4,364,858 | 4,032,728 | |||||||||
| Social security costs | 729,496 | 673,338 | 638,674 | |||||||||
| Charges to defined benefit pension provisions (Note 25) | 209,193 | 222,257 | 245,112 | |||||||||
| Contributions to defined contribution pension funds | 47,485 | 36,653 | 20,126 | |||||||||
| Share-based payment costs | 48,546 | 19,167 | 19,167 | |||||||||
Of which: | ||||||||||||
Granted to the Bank’s directors | 1,424 | 641 | 641 | |||||||||
| Other personnel expenses | 696,730 | 651,600 | 655,501 | |||||||||
| 6,551,201 | 5,967,873 | 5,611,308 | ||||||||||
| b) | Headcount | ||
| The average number of employees in the Group, by professional category, was as follows: |
| Average Number of Employees (**) | ||||||||||||
| 2007 | 2006 | 2005 | ||||||||||
| The Bank: | ||||||||||||
| Senior executives (*) | 93 | 81 | 81 | |||||||||
| Other line personnel | 16,153 | 15,729 | 15,731 | |||||||||
| Clerical staff | 4,147 | 4,231 | 4,595 | |||||||||
| General services personnel | 42 | 45 | 49 | |||||||||
| 20,435 | 20,086 | 20,456 | ||||||||||
| Banesto | 10,524 | 10,188 | 10,560 | |||||||||
| Rest of Spain | 5,582 | 4,996 | 3,789 | |||||||||
| Abbey | 15,771 | 17,461 | 19,904 | |||||||||
| Other companies | 76,820 | 70,477 | 65,372 | |||||||||
| 129,132 | 123,208 | 120,081 | ||||||||||
| (*) | Categories of Deputy Assistant General Manager and above, including senior management. | |
| (**) | Excluding personnel assigned to discontinued operations. |
| Functional Breakdown by Gender | ||||||||||||||||||||||||
| Executives | Other Line Personnel | Clerical Staff | ||||||||||||||||||||||
| Men | Women | Men | Women | Men | Women | |||||||||||||||||||
| Continental Europe | 85 | % | 15 | % | 60 | % | 40 | % | 58 | % | 42 | % | ||||||||||||
| United Kingdom | 79 | % | 21 | % | 47 | % | 53 | % | 31 | % | 69 | % | ||||||||||||
| Latin America | 64 | % | 35 | % | 56 | % | 43 | % | 43 | % | 57 | % | ||||||||||||
Total | 76 | % | 24 | % | 58 | % | 42 | % | 44 | % | 56 | % | ||||||||||||
F-119
Table of Contents
| Functional Breakdown by Gender | ||||||||||||||||||||||||
| Executives | Other Line Personnel | Clerical Staff | ||||||||||||||||||||||
| Men | Women | Men | Women | Men | Women | |||||||||||||||||||
| Continental Europe | 85 | % | 15 | % | 61 | % | 39 | % | 62 | % | 38 | % | ||||||||||||
| United Kingdom | 80 | % | 20 | % | 44 | % | 56 | % | 24 | % | 76 | % | ||||||||||||
| Latin America | 72 | % | 28 | % | 60 | % | 40 | % | 44 | % | 56 | % | ||||||||||||
Total | 79 | % | 21 | % | 59 | % | 41 | % | 44 | % | 56 | % | ||||||||||||
| The labor relations between employees and the various Group companies are governed by the related collective labor agreements or similar regulations. | |||
| c) | Share-based payments |
| i. | The Bank |
| Euros | Date of | Date of | ||||||||||||||||||||||||||
| Number of | Exercise | Year | Employee | Number | Commencement | Expiry of | ||||||||||||||||||||||
| Shares | Price | Granted | Group | of Persons | of Exercise Period | Exercise Period | ||||||||||||||||||||||
Plans outstanding at 1 January 2005 | 21,126,750 | 9.94 | ||||||||||||||||||||||||||
| Options granted (Plan I06) | 99,900,000 | 9.09 | (**) | Managers | 2,601 | 15/01/2008 | 15/01/2009 | |||||||||||||||||||||
| Options exercised | (15,606,000 | ) | (9.83 | ) | ||||||||||||||||||||||||
Of which: | ||||||||||||||||||||||||||||
Plan Four | (228,000 | ) | 7.84 | |||||||||||||||||||||||||
Young Executives Plan | (329,000 | ) | 2.29 | |||||||||||||||||||||||||
Managers Plan 2000 | (12,389,000 | ) | 10.545 | |||||||||||||||||||||||||
European Branches Plan | (2,660,000 | ) | 7.60 | (*) | ||||||||||||||||||||||||
| Options cancelled or not exercised | (5,520,750 | ) | — | |||||||||||||||||||||||||
Plans outstanding at December 31, 2005 | 99,900,000 | 9.09 | ||||||||||||||||||||||||||
| Options exercised | — | — | ||||||||||||||||||||||||||
| Options cancelled, net (Plan I06) | (3,648,610 | ) | 9.09 | Managers | (44 | ) | 15/01/2008 | 15/01/2009 | ||||||||||||||||||||
Plans outstanding at December 31, 2006 | 96,251,390 | 9.09 | ||||||||||||||||||||||||||
| Options granted (Plan I09) | 10,448,480 | — | Managers | 5,476 | 23/06/2007 | 31/07/2009 | ||||||||||||||||||||||
| Options granted (Plan I10) | 15,690,283 | — | Managers | 5,506 | 23/06/2007 | 31/07/2010 | ||||||||||||||||||||||
| Options cancelled, net (Plan I06) | (1,195,371 | ) | 9.09 | Managers | (45 | ) | 15/01/2008 | 15/01/2009 | ||||||||||||||||||||
Plans outstanding at December 31, 2007 | 121,194,782 | — | ||||||||||||||||||||||||||
Of which: | ||||||||||||||||||||||||||||
Plan I06 | 95,056,019 | 9.09 | ||||||||||||||||||||||||||
Plan I09 | 10,448,480 | — | ||||||||||||||||||||||||||
Plan I10 | 15,690,283 | — | ||||||||||||||||||||||||||
| (*) | The average exercise price ranges from€5.65 to€10.15 per share. | |
| (**) | The exercise price of the options under Plan I06 is€9.09 per share, which is the weighted average of the daily average market price of the Bank shares on the continuous market in the first 15 trading days of January 2005. This was the criterion established in the resolution approving Plan I06 adopted at the Annual General Meeting held on June 18, 2005. The documentation on the aforementioned resolution stated correctly the method to be used to set the exercise price but, by mistake, an amount of€9.07 per share was mentioned rather than the correct amount of€9.09 per share. |
F-120
Table of Contents
| (i) | Performance Share Plan |
F-121
Table of Contents
| • | It was assumed that the beneficiaries will not leave the Group’s employ during the term of each plan. | ||
| • | The fair value of the 50% relating to the Bank’s relative TSR position was determined on the basis of the report of an independent expert whose assessment was based, inter alia, on the following variables: |
| • | Expected volatility: determined on the basis of the historical volatility over a two-year period for PI09 and a three-year period for PI10. In the case of the Bank, the average volatility used was 16.25% for PI09 and 15.67% for PI10. | ||
| • | Annual dividend yield: based on the data for the last two/three years before July 1, 2007. In the case of the Bank, this yield stood at 3.23% for PI09 and 3.24% for PI10. | ||
| • | Risk-free interest rate: return on Treasury Bonds (zero coupon) offered on July 1, 2007 for a period of two years for PI09 (4.473%) and three years for PI10 (4.497%) | ||
| • | Monte Carlo valuation model: performance of 10,000 simulations to determine the TSR of each of the companies in the Benchmark Group, taking into account the aforementioned variables. The results (each of which represents the delivery of a number of shares) are classified in decreasing order by calculating the weighted average and discounting the amount at the risk-free interest rate. Application of the simulation model results in percentage values of 42.7% for PI09 and 42.3% for PI10 (second cycle), which are applied to 50% of the value of the shares granted, in order to determine the cost per books of the TSR-based portion of the incentive. Since this valuation refers to a market condition, it cannot be adjusted after the grant date. |
| • | In view of the high correlation between TSR and EPS, it was considered feasible to extrapolate that, in a high percentage of cases, the TSR value is also valid for EPS. Therefore, it was determined that the fair value of the portion of the plans linked to the Bank’s relative EPS position, i.e. of the remaining 50% of the shares granted, was the same as that of the 50% corresponding to the TSR. Since this valuation refers to a non-market condition, it shall be reviewed and adjusted on a yearly basis. |
| (ii) | Matched Deferred Bonus Plan |
| (iii) | Restricted Shares Plan |
| (iv) | Minimum Investment Programme |
F-122
Table of Contents
| ii. | Abbey |
| Pounds | ||||||||||||||||||||||||||||
| Sterling (*) | Date of | Date of | ||||||||||||||||||||||||||
| Number of | Exercise | Year | Employee | Number | Commencement | Expiry of | ||||||||||||||||||||||
| Shares | Price (*) | Granted | Group | of Persons | of Exercise Period | Exercise Period | ||||||||||||||||||||||
Plans outstanding at January 1, 2005 | 17,675,567 | 3.58 | ||||||||||||||||||||||||||
| Options exercised | (1,769,216 | ) | 4.45 | |||||||||||||||||||||||||
Of which: | ||||||||||||||||||||||||||||
Executive Options | (89,305 | ) | 4.43 | |||||||||||||||||||||||||
Employee Options | (2,550 | ) | 5.90 | |||||||||||||||||||||||||
Sharesave | (1,677,361 | ) | 4.45 | |||||||||||||||||||||||||
| Options cancelled or not exercised | (1,783,670 | ) | — | |||||||||||||||||||||||||
| Plans outstanding at December 31, 2005 | 14,122,681 | 3.41 | ||||||||||||||||||||||||||
Of which: | ||||||||||||||||||||||||||||
Executive Options | 269,539 | 4.07 | ||||||||||||||||||||||||||
Employee Options | 54,000 | 5.90 | ||||||||||||||||||||||||||
Sharesave | 13,799,142 | 3.38 | ||||||||||||||||||||||||||
Plans outstanding at December 31, 2005 | 14,122,681 | 3.41 | ||||||||||||||||||||||||||
| Options granted (MTIP) | 2,825,123 | 7.50 | 2005 and 2006 | Managers | 174 | First half of 2008 | First half of 2008 | |||||||||||||||||||||
| Options exercised | (5,214,171 | ) | 3.41 | |||||||||||||||||||||||||
Of which: | ||||||||||||||||||||||||||||
Executive Options | (87,659 | ) | 4.07 | |||||||||||||||||||||||||
Employee Options | (33,000 | ) | 5.90 | |||||||||||||||||||||||||
Sharesave | (5,093,512 | ) | 3.38 | |||||||||||||||||||||||||
| Options cancelled or not exercised | (1,379,401 | ) | — | |||||||||||||||||||||||||
Plans outstanding at December 31, 2006 | 10,354,232 | 4.32 | ||||||||||||||||||||||||||
Of which: | ||||||||||||||||||||||||||||
Executive Options | 178,026 | 4.11 | 2003-2004 | Managers | 13 | 26/03/06 | 24/03/13 | |||||||||||||||||||||
Employee Options | — | — | — | — | — | — | — | |||||||||||||||||||||
Sharesave | 7,638,791 | 3.32 | 1998-2004 | Employees | 4,512 | (**) | 01/04/06 | 01/09/11 | ||||||||||||||||||||
MTIP | 2,537,415 | 9.39 | 2005 and 2006 | Managers | 170 | First half of 2008 | First half of 2008 | |||||||||||||||||||||
| Options granted (MTIP) | — | — | ||||||||||||||||||||||||||
| Options exercised | (1,535,325 | ) | 3.81 | |||||||||||||||||||||||||
Of which: | ||||||||||||||||||||||||||||
Executive Options | (33,904 | ) | 3.96 | |||||||||||||||||||||||||
Sharesave | (1,501,421 | ) | 3.81 | |||||||||||||||||||||||||
| Options cancelled (net) or not exercised | (770,595 | ) | — | |||||||||||||||||||||||||
Plans outstanding at December 31, 2007 | 8,048,312 | 5.32 | ||||||||||||||||||||||||||
Of which: | ||||||||||||||||||||||||||||
Executive Options | 144,122 | 4.15 | 2003-2004 | Managers | 4 | 26/03/06 | 24/03/13 | |||||||||||||||||||||
Sharesave | 5,684,340 | 3.18 | 1998-2004 | Employees | 2,239 | (**) | 01/04/06 | 01/09/11 | ||||||||||||||||||||
MTIP | 2,219,850 | 10.88 | 2005 and 2006 | Managers | 157 | First half of 2008 | First half of 2008 | |||||||||||||||||||||
| (*) | At December 31, 2007, 2006 and 2005, the euro/pound sterling exchange rate was€1.36360/GBP 1;€1.4892/GBP 1 and€1.4592/GBP 1, respectively. | |
| (**) | Number of accounts/contracts. A single employee may have more than one account/contract. |
F-123
Table of Contents
| iii. | Fair value |
| 2007 | 2006 | 2005 | ||||||||||
| Risk-free interest rate | 5.0%-5.8 | % | 4.5% to 5% | 4.5% to 4.6% | ||||||||
| Dividend increase, based solely on the average increase since 1989 | 10% | 10% | 10% | |||||||||
| Volatility of underlying shares based on historical volatility over 5 years | 19.80%-26.90 | % | 17.70% to 19.85% | 16.96% to 17.58% | ||||||||
| Expected life of options granted under: | ||||||||||||
| Employee Sharesave Plan (*) | 3, 5 and 7 years | 3, 5 and 7 years | 3, 5 and 7 years | |||||||||
| Executive Share Option Plan | 10 years | 10 years | 10 years | |||||||||
| Employee Share Option Plan | 10 years | 10 years | 10 years | |||||||||
| Medium-Term Incentive Plan | 3 years | 3 years | 3 years | |||||||||
F-124
Table of Contents
| 50. | Other general administrative expenses |
| a) | Breakdown |
| Thousands of Euros | ||||||||||||
| 2007 | 2006 | 2005 | ||||||||||
| Property, fixtures and supplies | 989,663 | 972,933 | 880,117 | |||||||||
| Other administrative expenses | 912,621 | 835,554 | 821,405 | |||||||||
| Technology and systems | 488,741 | 417,977 | 419,116 | |||||||||
| Advertising | 563,986 | 474,290 | 390,202 | |||||||||
| Communications | 417,587 | 346,854 | 390,668 | |||||||||
| Technical reports | 298,175 | 258,349 | 270,282 | |||||||||
| Per diems and travel expenses | 279,298 | 242,444 | 214,553 | |||||||||
| Taxes other than income tax | 279,093 | 227,835 | 179,889 | |||||||||
| Surveillance and cash courier services | 201,532 | 189,474 | 158,566 | |||||||||
| Insurance premiums | 36,432 | 35,588 | 28,302 | |||||||||
| 4,467,128 | 4,001,298 | 3,753,100 | ||||||||||
| b) | Other information |
| Millions of Euros | ||||||||||||
| 2007 | 2006 | 2005 | ||||||||||
| Audit of the annual financial statements of the companies audited by the Deloitte worldwide organization | 15.9 | 15.6 | 15.8 | |||||||||
Of which: | ||||||||||||
Abbey | 4.1 | 4.1 | 4.9 | |||||||||
Audit of the Bank’s individual and consolidated financial statements | 1.0 | 1.0 | 1.0 | |||||||||
| 1. | Due diligence review and other corporate transaction services (see Notes 2-b and 3):€3.7 million (2006:€3.3 million; 2005:€0.6 million). Additionally, the Group’s auditors provided other non-attest services to various Group companies for€5.3 million in 2007,€5.5 million in 2006 and€4.5 million in 2005. | ||
| The services commissioned from the Group’s auditors meet the independence requirements stipulated by Law 44/2002, of 22 November, on Financial System Reform Measures and by the Sarbanes-Oxley Act of 2002, and they did not involve the performance of any work that is incompatible with the audit function. | |||
| 2. | Services provided by audit firms other than Deloitte:€12.5 million (2006:€14.6 million; 2005:€21.4 million). |
F-125
Table of Contents
| 51. | Other operating expenses |
| Thousands of Euros | ||||||||||||
| 2007 | 2006 | 2005 | ||||||||||
| Contribution to Deposit Guarantee Fund | 168,617 | 179,209 | 171,153 | |||||||||
| Other | 301,119 | 263,316 | 173,676 | |||||||||
| 469,736 | 442,525 | 344,829 | ||||||||||
| 52. | Other gains and Other losses |
| Thousands of Euros | ||||||||||||
| Net Balance | 2007 | 2006 | 2005 | |||||||||
| On disposal of tangible assets | 1,804,108 | 88,894 | 80,619 | |||||||||
Of which, on sale of properties (Note 16-d) | 1,620,119 | — | — | |||||||||
| On disposal of investments | 16,388 | 271,961 | 1,298,935 | |||||||||
Of which: | ||||||||||||
Unión Fenosa (Note 3-c) | — | — | 1,156,648 | |||||||||
Sale of ADRs (Chile) (Note 3-c) | — | 269,768 | — | |||||||||
| Other | 322,753 | 1,044,865 | 1,133,844 | |||||||||
Of which: gains obtained on the disposal of: | ||||||||||||
Antena 3 | — | 294,287 | — | |||||||||
San Paolo | 566,086 | 704,936 | — | |||||||||
Royal Bank of Scotland Group, plc | — | — | 717,394 | |||||||||
Auna | — | — | 354,838 | |||||||||
Of which, extraordinary retirement plans (Note 25) | (316,942 | ) | — | — | ||||||||
Net gains | 2,143,249 | 1,405,720 | 2,513,398 | |||||||||
F-126
Table of Contents
| 53. | Other disclosures |
| a) | Residual maturity periods and Average interest rates |
| December 31, 2007 | ||||||||||||||||||||||||||||||||||||
| Millions of Euros | Average | |||||||||||||||||||||||||||||||||||
| Within 1 | 1 to 3 | 3 to 12 | 1 to 3 | 3 to 5 | After 5 | Interest | ||||||||||||||||||||||||||||||
| Demand | Month | Months | Months | Years | Years | Years | Total | Rate | ||||||||||||||||||||||||||||
Assets: | ||||||||||||||||||||||||||||||||||||
| Cash and balances with central banks | 14,102 | 10,278 | 5 | 10 | 1,265 | 4,295 | 1,108 | 31,063 | 5.93 | % | ||||||||||||||||||||||||||
| Available-for-sale financial assets- | ||||||||||||||||||||||||||||||||||||
| Debt instruments | 31 | 953 | 1,070 | 2,060 | 5,837 | 6,450 | 17,786 | 34,187 | 5.11 | % | ||||||||||||||||||||||||||
| Loans and receivables- | ||||||||||||||||||||||||||||||||||||
| Loans and advances to credit institutions | 4,865 | 9,785 | 6,333 | 4,113 | 884 | 759 | 5,021 | 31,760 | 4.53 | % | ||||||||||||||||||||||||||
| Loans and advances to customers | 9,848 | 29,446 | 28,607 | 65,696 | 58,124 | 62,048 | 279,982 | 533,751 | 6.75 | % | ||||||||||||||||||||||||||
| Debt instruments | 1 | 4 | — | 5 | 634 | 65 | 959 | 1,668 | 4.55 | % | ||||||||||||||||||||||||||
| Other financial assets | 7,165 | 2,393 | 99 | 282 | 372 | 766 | 1,274 | 12,351 | — | |||||||||||||||||||||||||||
| 36,012 | 52,859 | 36,114 | 72,166 | 67,116 | 74,383 | 306,130 | 644,780 | 6.51 | % | |||||||||||||||||||||||||||
Liabilities: | ||||||||||||||||||||||||||||||||||||
| Financial liabilities at amortized cost- | ||||||||||||||||||||||||||||||||||||
| Deposits from central banks | 3,534 | 21,322 | 3,691 | 201 | — | — | — | 28,748 | 4.45 | % | ||||||||||||||||||||||||||
| Deposits from credit institutions | 5,704 | 22,412 | 6,504 | 6,197 | 3,002 | 3,111 | 1,756 | 48,686 | 4.55 | % | ||||||||||||||||||||||||||
| Customer deposits | 178,538 | 55,381 | 27,839 | 28,959 | 13,141 | 11,145 | 2,040 | 317,043 | 4.12 | % | ||||||||||||||||||||||||||
| Marketable debt securities | 868 | 13,310 | 17,600 | 24,198 | 35,294 | 26,745 | 88,250 | 206,265 | 4.61 | % | ||||||||||||||||||||||||||
| Subordinated liabilities | 88 | 8 | 61 | 569 | 4,065 | 2,357 | 28,522 | 35,670 | 5.69 | % | ||||||||||||||||||||||||||
| Other financial liabilities | 11,251 | 931 | 1,343 | 1,034 | 79 | 1,780 | 123 | 16,540 | — | |||||||||||||||||||||||||||
| 199,983 | 113,364 | 57,038 | 61,158 | 55,581 | 45,138 | 120,691 | 652,952 | 4.41 | % | |||||||||||||||||||||||||||
Difference (assets less liabilities) | (163,970 | ) | (60,505 | ) | (20,924 | ) | 11,008 | 11,535 | 29,245 | 185,439 | (8,172 | ) | ||||||||||||||||||||||||
| December 31, 2006 | ||||||||||||||||||||||||||||||||
| Millions of Euros | Average | |||||||||||||||||||||||||||||||
| Within 1 | 1 to 3 | 3 to 12 | 1 to 5 | After 5 | Interest | |||||||||||||||||||||||||||
| Demand | Month | Months | Months | Years | Years | Total | Rate | |||||||||||||||||||||||||
Assets: | ||||||||||||||||||||||||||||||||
| Cash and balances with central banks | 9,725 | 3,281 | — | 1 | — | 828 | 13,835 | 3.99 | % | |||||||||||||||||||||||
| Available-for-sale financial assets- | ||||||||||||||||||||||||||||||||
| Debt instruments | 26 | 2,260 | 2,501 | 3,771 | 9,599 | 14,570 | 32,727 | 5.96 | % | |||||||||||||||||||||||
| Loans and receivables- | ||||||||||||||||||||||||||||||||
| Loans and advances to credit institutions | 5,668 | 20,073 | 6,459 | 6,118 | 4,002 | 3,041 | 45,361 | 3.85 | % | |||||||||||||||||||||||
| Loans and advances to customers | 10,291 | 19,607 | 30,625 | 56,311 | 112,644 | 255,312 | 484,790 | 5.86 | % | |||||||||||||||||||||||
| Debt instruments | 565 | — | — | — | — | 57 | 622 | 3.02 | % | |||||||||||||||||||||||
| Other financial assets | 7,330 | 2,356 | 184 | 693 | 1,411 | 1,101 | 13,075 | — | ||||||||||||||||||||||||
| 33,605 | 47,577 | 39,769 | 66,894 | 127,656 | 274,909 | 590,410 | 5.66 | % | ||||||||||||||||||||||||
Liabilities: | ||||||||||||||||||||||||||||||||
| Financial liabilities at amortized cost- | ||||||||||||||||||||||||||||||||
| Deposits from central banks | 2 | 14,366 | 1,657 | 503 | 2 | — | 16,530 | 5.25 | % | |||||||||||||||||||||||
| Deposits from credit institutions | 6,445 | 21,646 | 9,981 | 11,680 | 5,446 | 1,618 | 56,816 | 4.07 | % | |||||||||||||||||||||||
| Customer deposits | 198,606 | 54,331 | 24,976 | 22,199 | 12,594 | 1,671 | 314,377 | 3.90 | % | |||||||||||||||||||||||
| Marketable debt securities | 2,288 | 14,079 | 16,489 | 14,701 | 37,170 | 89,682 | 174,409 | 3.91 | % | |||||||||||||||||||||||
| Subordinated liabilities | 253 | — | 234 | 108 | 5,577 | 24,250 | 30,422 | 5.74 | % | |||||||||||||||||||||||
| Other financial liabilities | 6,797 | 1,653 | 1,161 | 2,378 | 266 | 494 | 12,749 | — | ||||||||||||||||||||||||
| 214,391 | 106,075 | 54,498 | 51,569 | 61,055 | 117,715 | 605,303 | 4.05 | % | ||||||||||||||||||||||||
Difference (assets less liabilities) | (180,786 | ) | (58,498 | ) | (14,729 | ) | 15,325 | 66,601 | 157,194 | (14,893 | ) | |||||||||||||||||||||
F-127
Table of Contents
| December 31, 2005 | ||||||||||||||||||||||||||||||||
| Millions of Euros | Average | |||||||||||||||||||||||||||||||
| Within 1 | 1 to 3 | 3 to 12 | 1 to 5 | After 5 | Interest | |||||||||||||||||||||||||||
| Demand | Month | Months | Months | Years | Years | Total | Rate | |||||||||||||||||||||||||
Assets: | ||||||||||||||||||||||||||||||||
| Cash and balances with central banks | 7,232 | 4,701 | 4,152 | 1 | — | — | 16,086 | 2.62 | % | |||||||||||||||||||||||
| Available-for-sale financial assets- | ||||||||||||||||||||||||||||||||
| Debt instruments | 77 | 1,769 | 4,239 | 4,553 | 41,930 | 15,486 | 68,054 | 3.58 | % | |||||||||||||||||||||||
| Loans and receivables- | ||||||||||||||||||||||||||||||||
| Loans and advances to credit institutions | 4,102 | 20,681 | 9,121 | 7,070 | 5,247 | 845 | 47,066 | 2.93 | % | |||||||||||||||||||||||
| Loans and advances to customers | 11,131 | 14,728 | 24,026 | 43,508 | 85,929 | 223,596 | 402,918 | 5.84 | % | |||||||||||||||||||||||
| Debt instruments | — | — | — | 17 | 46 | 108 | 171 | 2.49 | % | |||||||||||||||||||||||
| Other financial assets | 4,656 | 2,988 | 29 | 567 | 393 | 996 | 9,629 | — | ||||||||||||||||||||||||
| 27,198 | 44,867 | 41,567 | 55,716 | 133,545 | 241,031 | 543,924 | 5.10 | % | ||||||||||||||||||||||||
Liabilities: | ||||||||||||||||||||||||||||||||
| Financial liabilities at amortized cost- | ||||||||||||||||||||||||||||||||
| Deposits from central banks | 396 | 18,262 | 3,773 | — | — | — | 22,431 | 2.42 | % | |||||||||||||||||||||||
| Deposits from credit institutions | 3,709 | 50,254 | 20,781 | 11,593 | 6,195 | 1,696 | 94,228 | 2.91 | % | |||||||||||||||||||||||
| Customer deposits | 166,531 | 42,322 | 39,397 | 25,199 | 16,742 | 1,537 | 291,728 | 3.59 | % | |||||||||||||||||||||||
| Marketable debt securities | — | 7,128 | 13,613 | 9,124 | 46,826 | 40,518 | 117,209 | 3.91 | % | |||||||||||||||||||||||
| Subordinated liabilities | — | 48 | 175 | 1,437 | 4,240 | 22,863 | 28,763 | Note 23 | ||||||||||||||||||||||||
| Other financial liabilities | 7,815 | 971 | 396 | 1,184 | 893 | 34 | 11,293 | — | ||||||||||||||||||||||||
| 178,451 | 118,985 | 78,135 | 48,537 | 74,896 | 66,648 | 565,652 | 3.54 | % | ||||||||||||||||||||||||
Difference (assets less liabilities) | (151,253 | ) | (74,118 | ) | (36,568 | ) | 7,179 | 58,649 | 174,383 | (21,728 | ) | |||||||||||||||||||||
| b) | Equivalent euro value of assets and liabilities |
| Equivalent Value in Millions of Euros | ||||||||||||||||||||||||
| 2007 | 2006 | 2005 | ||||||||||||||||||||||
| Assets | Liabilities | Assets | Liabilities | Assets | Liabilities | |||||||||||||||||||
| Cash and balances with central banks | 16,155 | — | 10,042 | — | 11,749 | — | ||||||||||||||||||
| Financial assets and liabilities held for trading | 124,409 | 100,719 | 139,783 | 106,075 | 128,973 | 95,225 | ||||||||||||||||||
| Other financial instruments at fair value | 15,815 | 28,553 | 10,414 | 12,140 | 45,534 | 11,810 | ||||||||||||||||||
| Available-for-sale financial assets | 15,395 | — | 18,530 | — | 16,814 | — | ||||||||||||||||||
| Loans and receivables | 260,435 | — | 248,977 | — | 221,041 | — | ||||||||||||||||||
| Investments | 13,036 | — | 2,461 | — | 238 | — | ||||||||||||||||||
| Tangible assets | 4,665 | — | 4,696 | — | 4,745 | — | ||||||||||||||||||
| Intangible assets | 12,557 | — | 13,626 | — | 12,910 | — | ||||||||||||||||||
| Financial liabilities at amortized cost | — | 308,166 | — | 309,610 | — | 279,575 | ||||||||||||||||||
| Liabilities under insurance contracts | — | 2,139 | — | 2,157 | — | 38,247 | ||||||||||||||||||
| Other | 8,388 | 19,120 | 7,793 | 20,598 | 11,741 | 18,919 | ||||||||||||||||||
| 470,855 | 458,697 | 456,322 | 450,580 | 453,745 | 443,776 | |||||||||||||||||||
| c) | Fair value of financial assets and liabilities not measured at fair value |
F-128
Table of Contents
| i) | Financial assets measured at other than fair value |
| Millions of Euros | ||||||||||||||||||||||||
| 2007 | 2006 | 2005 | ||||||||||||||||||||||
| Carrying | Carrying | Carrying | ||||||||||||||||||||||
| Assets | Amount | Fair Value | Amount | Fair Value | Amount | Fair Value | ||||||||||||||||||
Loans and receivables: | ||||||||||||||||||||||||
| Loans and advances to credit institutions | 31,760 | 31,765 | 45,361 | 45,359 | 47,066 | 46,560 | ||||||||||||||||||
| Money market operations through counterparties | — | — | 200 | 200 | — | — | ||||||||||||||||||
| Loans and advances to customers (Note 10) | 533,751 | 535,513 | 484,790 | 487,533 | 402,918 | 404,950 | ||||||||||||||||||
| Debt instruments | 1,668 | 1,668 | 622 | 622 | 171 | 171 | ||||||||||||||||||
| Other financial assets | 12,351 | 12,340 | 13,076 | 13,076 | 9,629 | 9,629 | ||||||||||||||||||
| 579,530 | 581,286 | 544,049 | 546,790 | 459,784 | 461,310 | |||||||||||||||||||
| ii) | Financial liabilities measured at other than fair value |
| Millions of Euros | ||||||||||||||||||||||||
| 2007 | 2006 | 2005 | ||||||||||||||||||||||
| Carrying | Carrying | Carrying | ||||||||||||||||||||||
| Liabilities | Amount | Fair Value | Amount | Fair Value | Amount | Fair Value | ||||||||||||||||||
Financial liabilities at amortized cost: | ||||||||||||||||||||||||
| Deposits from central banks | 28,748 | 28,748 | 16,530 | 16,528 | 22,431 | 22,431 | ||||||||||||||||||
| Deposits from credit institutions | 48,686 | 48,727 | 56,816 | 56,826 | 94,228 | 94,221 | ||||||||||||||||||
| Money market operations through counterparties | — | — | — | — | — | — | ||||||||||||||||||
| Customer deposits (*) | 317,043 | 317,184 | 314,377 | 314,320 | 291,727 | 291,727 | ||||||||||||||||||
| Marketable debt securities | 206,265 | 206,480 | 174,409 | 174,878 | 117,209 | 117,117 | ||||||||||||||||||
| Subordinated liabilities | 35,670 | 36,286 | 30,423 | 31,822 | 28,763 | 29,278 | ||||||||||||||||||
| Other financial liabilities | 16,540 | 16,538 | 12,748 | 12,752 | 11,293 | 11,293 | ||||||||||||||||||
| 652,952 | 653,963 | 605,303 | 607,126 | 565,651 | 566,067 | |||||||||||||||||||
| (*) | For these purposes, the fair value of customer demand deposits is taken to be the same as their carrying amount. |
| 54. | Geographical and business segment reporting |
| a) | Geographical segments |
F-129
Table of Contents
F-130
Table of Contents
| Millions of Euros | ||||||||||||||||||||||||||||||||||||||||||||||||||||||||||||
| 2007 | 2006 | 2005 | ||||||||||||||||||||||||||||||||||||||||||||||||||||||||||
| Financial | Financial | Financial | ||||||||||||||||||||||||||||||||||||||||||||||||||||||||||
| Management | Management | Management | ||||||||||||||||||||||||||||||||||||||||||||||||||||||||||
| Continental | Latin | and Equity | Continental | Latin | and Equity | Continental | Latin | and Equity | ||||||||||||||||||||||||||||||||||||||||||||||||||||
| (Summarized) Balance Sheet | Europe | Abbey | America | Stakes | Total | Europe | Abbey | America | Stakes | Total | Europe | Abbey | America | Stakes | Total | |||||||||||||||||||||||||||||||||||||||||||||
| Loans and advances to customers | 310,618 | 184,086 | 68,854 | 1,919 | 565,477 | 271,687 | 190,512 | 60,172 | 975 | 523,346 | 210,299 | 171,796 | 52,919 | 815 | 435,829 | |||||||||||||||||||||||||||||||||||||||||||||
| Financial assets held for trading (excluding loans and advances) | 44,846 | 53,782 | 22,845 | 1,328 | 122,801 | 33,831 | 61,507 | 27,846 | 2,028 | 125,212 | 26,315 | 64,014 | 25,844 | 1,276 | 117,449 | |||||||||||||||||||||||||||||||||||||||||||||
| Available-for-sale financial assets | 10,149 | 44 | 12,628 | 21,528 | 44,349 | 13,126 | 23 | 17,943 | 7,606 | 38,698 | 12,604 | 18 | 16,308 | 45,015 | 73,945 | |||||||||||||||||||||||||||||||||||||||||||||
| Loans and advances to credit institutions | 53,205 | 19,810 | 11,146 | 25,429 | 109,590 | 67,061 | 18,185 | 20,311 | 22,956 | 128,513 | 69,621 | 13,070 | 24,436 | 15,718 | 122,845 | |||||||||||||||||||||||||||||||||||||||||||||
| Non-current assets | 5,373 | 4,685 | 1,805 | (202 | ) | 11,661 | 4,558 | 5,059 | 1,695 | 1,243 | 12,555 | 4,219 | 5,197 | 1,392 | 1,396 | 12,204 | ||||||||||||||||||||||||||||||||||||||||||||
| Other asset accounts | 25,876 | 9,458 | 24,707 | 170,154 | 230,195 | 18,583 | 8,691 | 16,842 | 126,028 | 170,144 | 15,709 | 47,420 | 17,194 | 94,342 | 174,665 | |||||||||||||||||||||||||||||||||||||||||||||
Total assets/liabilities | 450,067 | 271,865 | 141,985 | 220,156 | 1,084,073 | 408,846 | 283,977 | 144,809 | 160,836 | 998,468 | 338,767 | 301,515 | 138,093 | 158,562 | 936,937 | |||||||||||||||||||||||||||||||||||||||||||||
| Customer deposits | 149,167 | 122,514 | 82,054 | 1,969 | 355,704 | 140,231 | 115,194 | 75,301 | 497 | 331,223 | 127,355 | 110,776 | 65,707 | 1,927 | 305,765 | |||||||||||||||||||||||||||||||||||||||||||||
| Marketable debt securities | 70,344 | 76,055 | 5,039 | 82,196 | 233,634 | 47,633 | 72,858 | 5,258 | 78,320 | 204,069 | 27,011 | 62,462 | 6,213 | 53,154 | 148,840 | |||||||||||||||||||||||||||||||||||||||||||||
| Subordinated liabilities | 2,379 | 7,876 | 2,540 | 22,875 | 35,670 | 2,362 | 9,430 | 2,383 | 16,248 | 30,423 | 2,241 | 11,428 | 1,130 | 13,964 | 28,763 | |||||||||||||||||||||||||||||||||||||||||||||
| Liabilities under insurance contracts | 10,907 | 6 | 2,121 | — | 13,034 | 8,547 | 71 | 2,086 | — | 10,704 | 6,414 | 36,521 | 1,737 | — | 44,672 | |||||||||||||||||||||||||||||||||||||||||||||
| Deposits from credit institutions | 66,027 | 38,688 | 19,017 | 47,834 | 171,566 | 89,016 | 51,020 | 32,403 | 8,935 | 181,374 | 90,341 | 40,761 | 42,208 | 38,385 | 211,695 | |||||||||||||||||||||||||||||||||||||||||||||
| Other liability accounts | 130,970 | 23,549 | 22,626 | 18,326 | 195,471 | 103,090 | 32,076 | 19,530 | 21,137 | 175,833 | 70,527 | 37,259 | 13,033 | 18,907 | 139,726 | |||||||||||||||||||||||||||||||||||||||||||||
| Equity | 20,274 | 3,177 | 8,588 | 46,955 | 78,994 | 17,967 | 3,328 | 7,847 | 35,700 | 64,842 | 14,878 | 2,307 | 8,066 | 32,225 | 57,476 | |||||||||||||||||||||||||||||||||||||||||||||
| Off-balance-sheet customer funds | 92,761 | 10,225 | 47,991 | — | 150,977 | 102,465 | 8,307 | 56,352 | — | 167,124 | 97,141 | 6,000 | 49,705 | — | 152,846 | |||||||||||||||||||||||||||||||||||||||||||||
Total funds under management | 542,829 | 282,090 | 189,976 | 220,155 | 1,235,050 | 511,311 | 292,284 | 201,160 | 160,837 | 1,165,592 | 435,908 | 307,514 | 187,799 | 158,562 | 1,089,783 | |||||||||||||||||||||||||||||||||||||||||||||
| Millions of Euros | ||||||||||||||||||||||||||||||||||||||||||||||||||||||||||||
| 2007 | 2006 | 2005 | ||||||||||||||||||||||||||||||||||||||||||||||||||||||||||
| Financial | Financial | Financial | ||||||||||||||||||||||||||||||||||||||||||||||||||||||||||
| Management | Management | Management | ||||||||||||||||||||||||||||||||||||||||||||||||||||||||||
| Continental | Latin | and Equity | Continental | Latin | and Equity | Continental | Latin | and Equity | ||||||||||||||||||||||||||||||||||||||||||||||||||||
| (Summarized) Income Statement | Europe | Abbey | America | Stakes | Total | Europe | Abbey | America | Stakes | Total | Europe | Abbey | America | Stakes | Total | |||||||||||||||||||||||||||||||||||||||||||||
NET INTEREST INCOME | 7,894 | 2,335 | 6,654 | (1,588 | ) | 15,295 | 6,206 | 2,108 | 5,272 | (1,106 | ) | 12,480 | 5,366 | 2,083 | 3,950 | (740 | ) | 10,659 | ||||||||||||||||||||||||||||||||||||||||||
| Share of results of entities accounted for using the equity method | 9 | 2 | 4 | 427 | 442 | 6 | 3 | 7 | 411 | 427 | 26 | 2 | 7 | 584 | 619 | |||||||||||||||||||||||||||||||||||||||||||||
| Net fee and commission income | 4,137 | 1,007 | 2,866 | 30 | 8,040 | 3,653 | 1,025 | 2,357 | (11 | ) | 7,024 | 3,291 | 947 | 1,842 | (19 | ) | 6,061 | |||||||||||||||||||||||||||||||||||||||||||
| Insurance activity income | 148 | — | 171 | — | 319 | 137 | — | 120 | (4 | ) | 253 | 115 | — | 84 | 3 | 202 | ||||||||||||||||||||||||||||||||||||||||||||
| Gains/losses on financial assets and liabilities and Exchange differences | 732 | 436 | 691 | 1,113 | 2,972 | 708 | 424 | 604 | 413 | 2,149 | 505 | 345 | 733 | (48 | ) | 1,535 | ||||||||||||||||||||||||||||||||||||||||||||
GROSS INCOME | 12,920 | 3,780 | 10,386 | (18 | ) | 27,068 | 10,710 | 3,560 | 8,360 | (297 | ) | 22,333 | 9,303 | 3,377 | 6,616 | (220 | ) | 19,076 | ||||||||||||||||||||||||||||||||||||||||||
| Sales and income from the provision of non-financial services (net of expenses) and Other operating income/expense | 30 | 51 | (141 | ) | 15 | (45 | ) | 39 | 42 | (118 | ) | (33 | ) | (70 | ) | 55 | 36 | (89 | ) | (26 | ) | (24 | ) | |||||||||||||||||||||||||||||||||||||
| General administrative expenses: | ||||||||||||||||||||||||||||||||||||||||||||||||||||||||||||
| Personnel expenses | (3,014 | ) | (1,037 | ) | (2,222 | ) | (236 | ) | (6,509 | ) | (2,684 | ) | (1,062 | ) | (1,975 | ) | (204 | ) | (5,925 | ) | (2,510 | ) | (1,119 | ) | (1,742 | ) | (183 | ) | (5,554 | ) | ||||||||||||||||||||||||||||||
| Other administrative expenses | (1,513 | ) | (780 | ) | (1,867 | ) | (270 | ) | (4,430 | ) | (1,272 | ) | (815 | ) | (1,726 | ) | (160 | ) | (3,973 | ) | (1,154 | ) | (888 | ) | (1,507 | ) | (170 | ) | (3,719 | ) | ||||||||||||||||||||||||||||||
| Depreciation and amortization | (559 | ) | (102 | ) | (348 | ) | (259 | ) | (1,268 | ) | (523 | ) | (105 | ) | (305 | ) | (214 | ) | (1,147 | ) | (489 | ) | (117 | ) | (334 | ) | (74 | ) | (1,014 | ) | ||||||||||||||||||||||||||||||
NET OPERATING INCOME | 7,864 | 1,912 | 5,808 | (768 | ) | 14,816 | 6,270 | 1,620 | 4,236 | (908 | ) | 11,218 | 5,205 | 1,289 | 2,944 | (673 | ) | 8,765 | ||||||||||||||||||||||||||||||||||||||||||
| Net impairment losses | (1,580 | ) | (312 | ) | (1,660 | ) | (1,527 | ) | (5,079 | ) | (1,355 | ) | (387 | ) | (886 | ) | 77 | (2,551 | ) | (977 | ) | (318 | ) | (433 | ) | (74 | ) | (1,802 | ) | |||||||||||||||||||||||||||||||
| Other gains/losses | 39 | 22 | (368 | ) | 1,745 | 1,438 | (245 | ) | — | (230 | ) | 803 | 328 | (18 | ) | 76 | (213 | ) | 853 | 698 | ||||||||||||||||||||||||||||||||||||||||
PROFIT/(LOSS) BEFORE TAX | 6,323 | 1,622 | 3,780 | (550 | ) | 11,175 | 4,670 | 1,233 | 3,120 | (28 | ) | 8,995 | 4,210 | 1,047 | 2,298 | 106 | 7,661 | |||||||||||||||||||||||||||||||||||||||||||
PROFIT FROM CONTINUING OPERATIONS | 4,546 | 1,201 | 2,958 | 134 | 8,839 | 3,269 | 889 | 2,451 | 132 | 6,741 | 3,020 | 725 | 1,876 | 798 | 6,419 | |||||||||||||||||||||||||||||||||||||||||||||
| Profit from discontinued operations | — | — | 112 | 685 | 797 | 1,147 | 114 | 124 | 120 | 1,505 | 111 | 86 | 134 | — | 331 | |||||||||||||||||||||||||||||||||||||||||||||
CONSOLIDATED PROFIT FOR THE YEAR | 4,546 | 1,201 | 3,070 | 819 | 9,636 | 4,416 | 1,003 | 2,575 | 252 | 8,246 | 3,131 | 811 | 2,010 | 798 | 6,750 | |||||||||||||||||||||||||||||||||||||||||||||
PROFIT ATTRIBUTED TO THE GROUP | 4,439 | 1,201 | 2,666 | 754 | 9,060 | 4,144 | 1,003 | 2,287 | 162 | 7,596 | 2,980 | 811 | 1,779 | 650 | 6,220 | |||||||||||||||||||||||||||||||||||||||||||||
F-131
Table of Contents
| b) | Business segments |
F-132
Table of Contents
| Millions of Euros | ||||||||||||||||||||||||||||||||||||||||||||||||||||||||||||
| 2007 | 2006 | 2005 | ||||||||||||||||||||||||||||||||||||||||||||||||||||||||||
| Asset | Financial | Asset | Financial | Asset | Financial | |||||||||||||||||||||||||||||||||||||||||||||||||||||||
| Global | Management | Management | Global | Management | Management | Global | Management | Management | ||||||||||||||||||||||||||||||||||||||||||||||||||||
| Commercial | Wholesale | and | and Equity | Commercial | Wholesale | and | and Equity | Commercial | Wholesale | and | and Equity | |||||||||||||||||||||||||||||||||||||||||||||||||
| (Summarized) Income Statement | Banking | Banking | Insurance | Stakes | Total | Banking | Banking | Insurance | Stakes | Total | Banking | Banking | Insurance | Stakes | Total | |||||||||||||||||||||||||||||||||||||||||||||
NET INTEREST INCOME | 15,339 | 1,492 | 52 | (1,588 | ) | 15,295 | 12,310 | 1,241 | 35 | (1,106 | ) | 12,480 | 10,640 | 724 | 35 | (740 | ) | 10,659 | ||||||||||||||||||||||||||||||||||||||||||
| Share of results of entities accounted for using the equity method | 15 | — | — | 427 | 442 | 16 | — | — | 411 | 427 | 35 | — | — | 584 | 619 | |||||||||||||||||||||||||||||||||||||||||||||
| Net fee and commission income | 6,668 | 919 | 423 | 30 | 8,040 | 5,966 | 646 | 423 | (11 | ) | 7,024 | 5,196 | 488 | 396 | (19 | ) | 6,061 | |||||||||||||||||||||||||||||||||||||||||||
| Insurance activity income | — | — | 319 | — | 319 | — | — | 257 | (4 | ) | 253 | — | — | 199 | 3 | 202 | ||||||||||||||||||||||||||||||||||||||||||||
| Gains/losses on financial assets and liabilities and exchange differences | 1,349 | 491 | 19 | 1,113 | 2,972 | 1,042 | 690 | 4 | 413 | 2,149 | 927 | 654 | 2 | (48 | ) | 1,535 | ||||||||||||||||||||||||||||||||||||||||||||
GROSS INCOME | 23,371 | 2,902 | 813 | (18 | ) | 27,068 | 19,334 | 2,577 | 719 | (297 | ) | 22,333 | 16,798 | 1,866 | 632 | (220 | ) | 19,076 | ||||||||||||||||||||||||||||||||||||||||||
| Sales and income from the provision of non-financial services (net of expenses) and Other operating income/expense | (30 | ) | (29 | ) | (1 | ) | 15 | (45 | ) | (4 | ) | (33 | ) | — | (33 | ) | (70 | ) | 25 | (24 | ) | 1 | (26 | ) | (24 | ) | ||||||||||||||||||||||||||||||||||
| General administrative expenses: | ||||||||||||||||||||||||||||||||||||||||||||||||||||||||||||
| Personnel expenses | (5,603 | ) | (542 | ) | (128 | ) | (236 | ) | (6,509 | ) | (5,165 | ) | (447 | ) | (109 | ) | (204 | ) | (5,925 | ) | (4,907 | ) | (350 | ) | (114 | ) | (183 | ) | (5,554 | ) | ||||||||||||||||||||||||||||||
| Other administrative expenses | (3,737 | ) | (310 | ) | (113 | ) | (270 | ) | (4,430 | ) | (3,455 | ) | (252 | ) | (106 | ) | (160 | ) | (3,973 | ) | (3,219 | ) | (219 | ) | (111 | ) | (170 | ) | (3,719 | ) | ||||||||||||||||||||||||||||||
| Depreciation and amortization | (899 | ) | (91 | ) | (19 | ) | (259 | ) | (1,268 | ) | (848 | ) | (68 | ) | (17 | ) | (214 | ) | (1,147 | ) | (868 | ) | (59 | ) | (13 | ) | (74 | ) | (1,014 | ) | ||||||||||||||||||||||||||||||
NET OPERATING INCOME | 13,102 | 1,930 | 552 | (768 | ) | 14,816 | 9,862 | 1,777 | 487 | (908 | ) | 11,218 | 7,829 | 1,214 | 395 | (673 | ) | 8,765 | ||||||||||||||||||||||||||||||||||||||||||
| Net impairment losses | (3,488 | ) | (63 | ) | (1 | ) | (1,527 | ) | (5,079 | ) | (2,324 | ) | (304 | ) | — | 77 | (2,551 | ) | (1,659 | ) | (69 | ) | — | (74 | ) | (1,802 | ) | |||||||||||||||||||||||||||||||||
| Other gains/losses | (256 | ) | (35 | ) | (16 | ) | 1,745 | 1,438 | (412 | ) | (48 | ) | (15 | ) | 803 | 328 | (176 | ) | 12 | 9 | 853 | 698 | ||||||||||||||||||||||||||||||||||||||
PROFIT/(LOSS) BEFORE TAX | 9,358 | 1,832 | 535 | (550 | ) | 11,175 | 7,126 | 1,425 | 472 | (28 | ) | 8,995 | 5,994 | 1,157 | 404 | 106 | 7,661 | |||||||||||||||||||||||||||||||||||||||||||
Other aggregates: | ||||||||||||||||||||||||||||||||||||||||||||||||||||||||||||
| Total assets | 678,867 | 166,979 | 18,071 | 220,156 | 1,084,073 | 668,960 | 153,005 | 15,667 | 160,836 | 998,468 | 624,040 | 145,163 | 9,172 | 158,562 | 936,937 | |||||||||||||||||||||||||||||||||||||||||||||
| Loans and advances to customers | 510,561 | 52,975 | 22 | 1,919 | 565,477 | 474,253 | 47,948 | 171 | 974 | 523,346 | 404,656 | 30,163 | 194 | 816 | 435,829 | |||||||||||||||||||||||||||||||||||||||||||||
| Customer deposits | 308,652 | 45,082 | 1 | 1,969 | 355,704 | 288,533 | 42,194 | — | 496 | 331,223 | 268,225 | 35,592 | 21 | 1,927 | 305,765 | |||||||||||||||||||||||||||||||||||||||||||||
F-133
Table of Contents
| 55. | Related-party transactions |
F-134
Table of Contents
| Millions of Euros | ||||||||||||||||||||||||||||||||||||||||||||||||
| 2007 | 2006 | 2005 | ||||||||||||||||||||||||||||||||||||||||||||||
| Associates | Members | Associates | Members | Associates | Members | |||||||||||||||||||||||||||||||||||||||||||
| and Jointly | of the | Other | and Jointly | of the | Other | and Jointly | of the | Other | ||||||||||||||||||||||||||||||||||||||||
| Controlled | Board of | General | Related | Controlled | Board of | General | Related | Controlled | Board of | General | Related | |||||||||||||||||||||||||||||||||||||
| Entities | Directors | Managers | Parties | Entities | Directors | Managers | Parties | Entities | Directors | Managers | Parties | |||||||||||||||||||||||||||||||||||||
Assets: | ||||||||||||||||||||||||||||||||||||||||||||||||
| Loans and advances to credit institutions | 3,169 | — | — | 136 | 2,051 | — | — | 97 | 1,864 | — | — | 958 | ||||||||||||||||||||||||||||||||||||
| Loans and advances to customers | 262 | 1 | 14 | 2,040 | 246 | 1 | 10 | 3,198 | 215 | 2 | 8 | 100 | ||||||||||||||||||||||||||||||||||||
| Debt instruments | — | — | — | 293 | 103 | — | — | 51 | — | — | — | — | ||||||||||||||||||||||||||||||||||||
Liabilities: | ||||||||||||||||||||||||||||||||||||||||||||||||
| Deposits from credit institutions | (284 | ) | — | — | — | (115 | ) | — | — | (4 | ) | (64 | ) | — | — | (979 | ) | |||||||||||||||||||||||||||||||
| Customer deposits | (4 | ) | (7 | ) | (18 | ) | (265 | ) | (249 | ) | (63 | ) | (8 | ) | (133 | ) | (25 | ) | (98 | ) | (7 | ) | (68 | ) | ||||||||||||||||||||||||
| Marketable debt securities | — | — | — | — | (98 | ) | — | — | — | — | — | — | — | |||||||||||||||||||||||||||||||||||
Income statement: | ||||||||||||||||||||||||||||||||||||||||||||||||
| Interest and similar income | 110 | — | — | 117 | 80 | — | — | 35 | 19 | — | — | 29 | ||||||||||||||||||||||||||||||||||||
| Interest expense and similar charges | (11 | ) | — | — | (6 | ) | (25 | ) | (2 | ) | — | (3 | ) | (1 | ) | (3 | ) | — | (12 | ) | ||||||||||||||||||||||||||||
| Gains/losses on financial assets and liabilities | 6 | — | — | 21 | — | — | — | 22 | — | — | — | — | ||||||||||||||||||||||||||||||||||||
| Fee and commission income | 48 | — | — | 15 | 30 | 1 | — | 36 | 10 | 1 | — | 1 | ||||||||||||||||||||||||||||||||||||
| Fee and commission expense | (16 | ) | — | — | — | (12 | ) | — | — | — | (1 | ) | — | — | — | |||||||||||||||||||||||||||||||||
Others: | ||||||||||||||||||||||||||||||||||||||||||||||||
| Contingent liabilities | 365 | — | 2 | 968 | 40 | — | 2 | 1,333 | 96 | — | — | 45 | ||||||||||||||||||||||||||||||||||||
| Contingent commitments | 358 | 1 | 1 | 280 | 467 | — | 1 | 2 | 117 | — | — | 477 | ||||||||||||||||||||||||||||||||||||
| Derivative financial instruments | 7,823 | — | 4 | 831 | 6,121 | — | — | 245 | — | — | — | — | ||||||||||||||||||||||||||||||||||||
F-135
Table of Contents
| 56. | Risk management |
| • | Independence of the risk function with respect to the business. The head of the Group’s Risk Division, Mr. Matías Rodríguez Inciarte, as third deputy chairman and in his capacity as chairman of the Board’s Risk Committee, reports directly to the Executive Committee and the Board. | ||
| • | Commitment to supporting the business by contributing, without undermining the preceding principle, to the achievement of commercial objectives whilst maintaining risk quality. To this end, the organizational structure is adapted to the commercial structure so as to encourage cooperation between business and risk managers. | ||
| • | Collective decisions (even at branch level), which ensure that different opinions are taken into account and avoid situations in which decisions are taken individually. | ||
| • | Well-established tradition of using internal rating and scoring tools, return on risk-adjusted capital (RORAC), value-at-risk (VaR), economic capital, extreme scenario analyses, etc. | ||
| • | Global approach, achieved by addressing in full all the risk factors in all the business units and using the concept of economic capital as a consistent measure of the risk assumed and as the basis for assessing the management performed. | ||
| • | Desire to continue to target a medium-low risk profile, emphasizing its low volatility and its predictability, by: |
| • | seeking to achieve a high degree of risk diversification, thus limiting risk concentration on particular customers, groups, sectors, products or geographical locations. | ||
| • | maintaining a low level of complexity in Markets operations. | ||
| • | paying ongoing attention to risk monitoring in order to prevent potential portfolio impairment sufficiently in advance. |
| • | Establishment of risk policies that reflect Santander’s risk management principles; | ||
| • | Identification of risks, through the constant review and monitoring of exposures, the assessment of new products and businesses and the specific analysis of singular transactions; | ||
| • | Measurement of risks using extensively tested methods and models; | ||
| • | Definition of the Group’s risk appetite by setting overall and specific limits for the various types of risks, products, customers, groups, sectors and geographical locations; | ||
| • | Preparation and distribution of a complete set of reports that are reviewed daily by the heads at all levels of Santander management; | ||
| • | Implementation of a risk control system which checks, on a daily basis, the degree to which Santander’s risk profile matches the risk policies approved and the risk limits set. |
| • | Internal ratings and scorings, based on qualitative and quantitative weighting of risk, which, by assessing the various risk components by customer and transaction, make it possible to estimate, firstly, probability of default and, subsequently, expected loss, based on LGD estimates. | ||
| • | Economic capital, as a homogeneous measure of the risk assumed and a basis for the measurement of the management performed. |
F-136
Table of Contents
| • | RORAC, which is used both as a transaction pricing tool (bottom-up approach) and in the analysis of portfolios and units (top-down approach). | ||
| • | VaR, which is used for controlling market risk and setting the market risk limits for the various trading portfolios. | ||
| • | Extreme scenario analysis, used to supplement market and credit risk analyses in order to assess the impact of alternative scenarios, even on provisions and capital. |
| A. | CORPORATE GOVERNANCE OF THE RISK FUNCTION |
| • | To propose to the Board the Group’s risk policy, which will identify, in particular: |
| • | The various types of risk (financial, operational, technological, legal and reputational, inter alia) facing the Group; | ||
| • | The information and internal control systems to be used to control and manage these risks; | ||
| • | The level of risk deemed acceptable; | ||
| • | The measures envisaged to mitigate the impact of the identified risks in the event that they materialize. |
| • | To conduct systematic reviews of the Group’s exposure to its main customers, economic activity sectors, geographical areas and types of risk. | ||
| • | To authorize the management tools and risk models and ascertain the result of their internal validation. | ||
| • | To ensure that the Group’s actions are consistent with the level of risk tolerance previously defined. | ||
| • | To resolve transactions outside the powers delegated to lower-ranking bodies and the overall limits for pre-classified risk categories in favor of economic groups or in relation to exposure by type of risk. |
F-137
Table of Contents
| B. | CREDIT RISK |
| Santander Group — Gross Credit Risk Exposure | ||||||||||||||||||||||||||||||||||||||||
| Customer | Drawable | Sovereign | Private | Credit | Drawable | Derivatives | ||||||||||||||||||||||||||||||||||
| Draw | by | Fixed-Income | Fixed-Income | Institutions | by Credit | and | Change/ | |||||||||||||||||||||||||||||||||
| -downs | Customers | (Excl. Trad.) | (Excl. Trad.) | Drawdowns | Institutions | Repos (REC) | Total | % | Dec-06 | |||||||||||||||||||||||||||||||
Spain | 298,281 | 56,290 | 14,460 | 8,334 | 24,092 | 1,008 | 13,135 | 415,600 | 49.6 | % | 15.9 | % | ||||||||||||||||||||||||||||
| Parent bank | 179,476 | 38,604 | 10,895 | 3,613 | 18,142 | 670 | 9,545 | 260,945 | 31.1 | % | 20.6 | % | ||||||||||||||||||||||||||||
| Banesto | 83,648 | 11,100 | 3,002 | 2,302 | 2,903 | 137 | 3,422 | 106,514 | 12.7 | % | 6.4 | % | ||||||||||||||||||||||||||||
| Other | 35,157 | 6,586 | 563 | 2,419 | 3,047 | 201 | 168 | 48,141 | 5.8 | % | 14.4 | % | ||||||||||||||||||||||||||||
Other European countries (*) | 246,283 | 20,342 | 1,021 | 3,870 | 3,723 | 1 | 10,142 | 285,382 | 34.0 | % | 8.8 | % | ||||||||||||||||||||||||||||
| Germany | 17,196 | 2,181 | 100 | 60 | 388 | — | 5 | 19,931 | 2.4 | % | 13.6 | % | ||||||||||||||||||||||||||||
| Portugal | 23,016 | 6,431 | 794 | 290 | 1,046 | 1 | 1,845 | 33,423 | 4.0 | % | 1.9 | % | ||||||||||||||||||||||||||||
| UK | 165,159 | 6,961 | — | 3,227 | 975 | — | 8,199 | 184,521 | 22.0 | % | 2.2 | % | ||||||||||||||||||||||||||||
| Other | 40,911 | 4,769 | 127 | 293 | 1,314 | — | 93 | 47,507 | 5.6 | % | 50.6 | % | ||||||||||||||||||||||||||||
Latin America | 70,858 | 22,130 | 8,330 | 1,842 | 16,704 | 2,000 | 5,710 | 127,574 | 15.2 | % | 9.0 | % | ||||||||||||||||||||||||||||
| Brazil | 22,654 | 7,537 | 2,334 | 418 | 9,036 | — | 2,031 | 44,010 | 5.3 | % | 41.8 | % | ||||||||||||||||||||||||||||
| Chile | 18,291 | 3,448 | 704 | 550 | 936 | 1 | 2,027 | 25,959 | 3.1 | % | 12.2 | % | ||||||||||||||||||||||||||||
| Mexico | 14,133 | 7,384 | 4,165 | — | 3,123 | 1,999 | 1,440 | 32,244 | 3.8 | % | (17.1 | %) | ||||||||||||||||||||||||||||
| Other | 15,778 | 3,761 | 1,127 | 874 | 3,609 | — | 212 | 25,361 | 3.0 | % | 6.0 | % | ||||||||||||||||||||||||||||
Rest of the world | 4,967 | 445 | 327 | 1,412 | 2,954 | — | 46 | 10,151 | 1.2 | % | 30.2 | % | ||||||||||||||||||||||||||||
Total Group | 620,389 | 99,207 | 24,138 | 15,458 | 47,473 | 3,009 | 29,033 | 838,707 | 100 | % | 12.5 | % | ||||||||||||||||||||||||||||
%/Total | 74.0 | % | 11.8 | % | 2.9 | % | 1.8 | % | 5.7 | % | 0.3 | % | 3.5 | % | 100.0 | % | ||||||||||||||||||||||||
% Change/Dec-06 | 11.9 | % | 10.3 | % | (4.0 | %) | 61.0 | % | 49.9 | % | 75.8 | % | (13.1 | %) | 12.5 | % | ||||||||||||||||||||||||
| Data at 31/12/07, prepared on the basis of legal-entity criteria. | ||
| Derivatives, including repos, expressed in credit risk equivalent. | ||
Balances drawn down by customers exclude repos (€28,980 million). | ||
Balances with credit institutions (excluding repos and trading portfolio) include€27,770 million of deposits at central banks. | ||
| (*) | Includes the assets of Santander Consumer Finance, including Drive. |
| • | Individualized risks: individualized customers are defined as those to which, either explicitly or implicitly, the Group has assigned a Risk Analyst (belonging to a Business Analysis Unit or to Corporate Banking Risks or Exposure to Financial Institutions). This category includes the following segments: Corporate Banking, Financial Institutions, Sovereigns and certain enterprises belonging to Commercial Banking. | ||
| • | Standardized risks: standardized customers are those which have not been assigned a specific Risk Analyst and with respect to which the Group’s current or potential exposure does not exceed a pre-established amount. This category includes Individuals, Individual Entrepreneurs, and Commercial Banking enterprises not classified as individualized customers. |
F-138
Table of Contents
| B.1 | Rating tools |
| B.2. | Customer segmentation for credit risk management |
| Segmentation of Credit Risk Exposure | ||||||||||||||||||||
| Average | Average | |||||||||||||||||||
| EAD | % | PD | LGD | EL | ||||||||||||||||
| Sovereign | 56,827 | 7.6 | % | 0.03 | % | 25.3 | % | 0.01 | % | |||||||||||
| Counterparty | 69,887 | 9.4 | % | 0.19 | % | 41.2 | % | 0.08 | % | |||||||||||
| Public sector | 1,635 | 0.2 | % | 0.65 | % | 21.3 | % | 0.14 | % | |||||||||||
| Corporate | 101,383 | 13.6 | % | 0.67 | % | 40.4 | % | 0.27 | % | |||||||||||
| Businesses | 154,076 | 20.6 | % | 2.27 | % | 29.3 | % | 0.67 | % | |||||||||||
| Mortgages | 257,001 | 34.4 | % | 2.72 | % | 7.1 | % | 0.19 | % | |||||||||||
| Consumer loans | 89,072 | 11.9 | % | 6.10 | % | 45.1 | % | 2.75 | % | |||||||||||
| Cards | 13,553 | 1.8 | % | 8.30 | % | 62.1 | % | 5.15 | % | |||||||||||
| Other | 3,302 | 0.4 | % | 2.40 | % | 57.0 | % | 1.37 | % | |||||||||||
| Memorandum item — customers | 620,022 | 83.0 | % | 2.88 | % | 28.0 | % | 0.81 | % | |||||||||||
Total | 746,737 | 100.0 | % | 2.41 | % | 28.1 | % | 0.68 | % | |||||||||||
| Source: Economic Capital Model — December 2007 (millions of euros). |
| B.3 | Control and monitoring systems |
F-139
Table of Contents
| B.4 | Concentration risk |
| C. | MARKET RISK |
| C.1 | ACTIVITIES SUBJECT TO MARKET RISK |
| a) | Trading: this item includes financial services for customers, trading operations and positioning in fixed-income, equity and foreign currency products. | ||
| b) | Balance sheet management: interest rate risk and liquidity risk arising as a result of the maturity and repricing gaps of all assets and liabilities. This item also includes the active management of the credit risk inherent in the Group’s balance sheet. | ||
| c) | Structural risks: |
| • | Structural foreign currency risk/hedges of results: foreign currency risk arising from the currency in which investments in consolidable and non-consolidable companies are made (structural exchange rate). This item also includes the positions taken to hedge the foreign currency risk on future results generated in currencies other than the euro (hedges of results). | ||
| • | Structural equities risk: this item includes equity investments in non-consolidated financial and non-financial companies that give rise to equities risk. |
| C.2 | METHODOLOGIES |
F-140
Table of Contents
| 1. | Interest rate risk |
| a) | Interest rate gap of assets and liabilities |
| b) | Net interest margin (NIM) sensitivity |
F-141
Table of Contents
| c) | Market value of equity (MVE) sensitivity |
| d) | Value at Risk (VaR) |
| e) | Scenario analysis |
| 2. | Liquidity risk |
| a) | Liquidity gap |
| 1. | Contractual liquidity gap: all cash-flow generating on- and off-balance-sheet items are analyzed and placed at the point of contractual maturity. For assets and liabilities without contractual maturities, an internal analysis model is used based on a statistical study of the time series of the products, and the so-called stable or instable balance for liquidity purposes is determined. | ||
| 2. | Operational liquidity gap: this is a scenario for normal liquidity profile conditions, since the cash flows of the on-balance-sheet items are placed at the point of probable liquidity rather than at the point of contractual maturity. In this analysis, the definition of the behavior scenario (renewal of liabilities, discounts in portfolio disposals, renewal of assets, etc.) is the fundamental point. | ||
| b) | Liquidity ratios |
| c) | Scenario analysis/Contingency Plan |
F-142
Table of Contents
| C.3 | RISKS AND RESULTS IN 2007 |
| 1. | Interest rate risk | ||
| a) | Convertible currencies |
| b) | Latin America |
| 2. | Structural credit risk management |
F-143
Table of Contents
| 3. | Structural liquidity management |
| • | Ample structural liquidity position. Since Santander is basically a commercial bank, customer deposits constitute the main source of liquidity in its financing structure. These deposits, combined with capital and other similar instruments, enable the Group to cover most of its liquidity requirements and, as a result, reduce the need to seek financing in the wholesale markets. | ||
| • | Thus, in Latin America the excess of deposits over loans means that in practice the raising of financing in wholesale markets is residual, corresponding basically to the need to maintain a presence and to achieve diversification. As regards the rest of the Group (referred to as the “convertible currencies area”), deposits plus long-term on-balance-sheet funds (capital and similar liabilities) cover approximately three quarters of loans (excluding securitizations). | ||
| • | Broad access to wholesale liquidity markets based on high short- and long-term ratings. | ||
| • | Obtainment of liquidity through diversification in markets and instruments. The Group is actively present in a wide, diverse range of financing markets, thus limiting its dependence on specific markets and ensuring the availability of ample market funding. | ||
| • | This enables the Group to have an adequate structure of medium- and long-term issues, with reduced short-term wholesale financing (at 2007 year-end, commercial paper and notes represented only 7% of total wholesale financing). This structure is based on securitizations (accounting for around one third of the total) and a medium- and long-term issue portfolio (around 60% of the total) featuring high product diversification and an average maturity of 4.4 years. | ||
| • | High capacity to obtain on-balance-sheet liquidity. The Group has on its balance sheet, aligned with its positions, a diversified portfolio of liquid assets and assets convertible into cash in the short term. | ||
| • | Independent financing of subsidiaries within a centralized management structure. The main legal entities, with the exception of Santander Consumer Finance, must obtain financing in the wholesale markets based on their needs and establish their own liquidity and contingency plans, without resorting to credit facilities from the Parent to fund their activities. | ||
| • | The Group, as a holding, performs control and management functions, which involves planning its funding requirements, structuring the sources of financing to achieve optimum diversification in terms of maturities, instruments and markets, and defining contingency plans. |
| • | Each year, a liquidity plan is prepared on the basis of the financing needs arising from the budgets of each business. Based on these liquidity requirements and taking into account certain prudential limits on the obtainment of short-term market financing, the Group establishes an issue and securitization plan for the year. | ||
| • | Throughout the year the Group periodically monitors the actual changes in financing requirements and updates this plan accordingly. | ||
| • | Another task of fundamental importance is the control and analysis of liquidity risk. The primary objective is to guarantee that the Group has sufficient liquidity to meet its short- and long-term financing requirements in normal market situations. To this end, the Group employs certain balance-sheet control measures, such as the liquidity gap and liquidity ratios. | ||
| Simultaneously, various scenario (or stress-scenario) analyses are conducted which consider the additional requirements that could arise if certain extreme but plausible events occur. The aim pursued is to cover a broad spectrum of situations that are more or less likely to affect the Group, thus enabling it to prepare the related contingency plans. |
| The scenario analyses conducted in the last four months of 2007 evidenced how the Group, even in a scenario of scant demand for medium- and long-term issues, maintained ample liquidity conditions. |
F-144
Table of Contents
| • | Throughout the year, the Group’s units in the convertible currencies area obtained a total of€45,000 million through medium- and long-term issues in the wholesale markets, and securitized assets for a further€44,500 million. | ||
| • | The Group’s structural liquidity position (long-term on-balance-sheet deposits and funds cater for 75% of its needs in the convertible currencies area and for more than 100% in the Latin American banks) and the quantity and quality of its liquid assets continue to enable Santander to conduct its lending business as usual. |
| • | No exposure to sub-prime mortgages; | ||
| • | Non-material exposure subject to mark-to-model; | ||
| • | Limited exposure to hedge funds, asset-backed securities, monoliners, conduits, etc.; |
| • | whether there is an adequate valuation model to monitor the value of each exposure: mark-to-market, mark-to-model or mark-to-liquidity; | ||
| • | whether the inputs enabling application of the valuation model are available in the market. |
| • | the availability of adequate systems duly adapted for the calculation and daily monitoring of the results, positions and risks of the new transactions envisaged. | ||
| • | the degree of liquidity of the product or underlying, with a view to arranging the related hedge on a timely basis. |
F-145
Table of Contents
| D. | OPERATIONAL RISK |
| • | Review of the valuation models and, in general, of the values of the portfolios. | ||
| • | Processes for the capture and independent validation of prices. | ||
| • | Adequate confirmation of transactions with counterparties. | ||
| • | Review of transaction cancellations/modifications. | ||
| • | Review and monitoring of the effectiveness of guarantees, collateral and risk mitigators. |
F-146
Table of Contents
| E. | ECONOMIC CAPITAL |
| By business unit: | ||||
| Latin America | 25.5 | % | ||
| Financial Management and Investments | 31.6 | % | ||
| Abbey | 5.3 | % | ||
| Santander Network Spain | 8.1 | % | ||
| Banesto | 6.2 | % | ||
| Wholesale Banking Spain | 8.7 | % | ||
| Portugal | 3.3 | % | ||
| Santander Consumer | 5.7 | % | ||
| Other | 5.7 | % |
| By type of risk: | ||||
| Credit risk | 48.2 | % | ||
| Equities market risk | 21.4 | % | ||
| Other market risks | 9.1 | % | ||
| Structural interest rate risk | 5.9 | % | ||
| Business risk | 3.9 | % | ||
| Operational risk | 6.6 | % | ||
| Other risks | 5.0 | % |
F-147
Table of Contents
| F. | REPUTATIONAL RISK |
| • | Each product or service is sold by people who know how to sell it. | ||
| • | Customers know what they are investing in and are aware of the risk involved in the particular product or service, and this can be evidenced by supporting documentation. | ||
| • | The product or service fits the customer’s risk profile. | ||
| • | Each product or service is sold where its sale is possible, not only from a legal or tax standpoint (i.e. it complies with the legal or tax regime of the country in question), but also with regard to the local financial culture. | ||
| • | When a given product or service is approved, maximum placement limits are set for the amount that can be sold in each country. |
F-148
Table of Contents
F-149
Table of Contents
| 57. | Significant differences between the EU-IFRS required to be applied under Bank of Spain’s Circular 4/2004 and U.S. generally accepted accounting principles |
| Note 57.1. | U.S. GAAP Recent Pronouncements | |
| Note 57.2. | Significant valuation and income recognition principles under the EU-IFRS required to be applied under Bank of Spain’s Circular 4/2004 and U.S. GAAP | |
| Note 57.3. | Net Income and Stockholders’ Equity reconciliations between the EU-IFRS required to be applied under Bank of Spain’s Circular 4/2004 and U.S. GAAP | |
| Note 57.4. | Significant presentation differences between the EU-IFRS required to be applied under Bank of Spain’s Circular 4/2004 and U.S. GAAP | |
| Note 57.5. | Consolidated financial statements | |
| Note 57.6. | Preference Shares and Preferred Securities | |
| Note 57.7. | Business combinations: Goodwill and Other assets and liabilities | |
| Note 57.8. | Earnings per Share |
F-150
Table of Contents
| 1. | In September 2005, the American Institute of Certified Public Accountants (“AICPA”) issued Statement of Position (“SOP”) 05-1 “Accounting by Insurance Enterprises for Deferred Acquisition Costs in Connection With Modifications or Exchanges of Insurance Contracts”. SOP 05-1 provides guidance on accounting by insurance enterprises for deferred acquisition costs on internal replacements of insurance and investment contracts other than those specifically described in SFAS 97 “Accounting and Reporting by Insurance Enterprises for Certain Long-Duration Contracts and for Realized Gains and Losses from the Sale of Investments”. SOP 05-1 is effective for internal replacements occurring in fiscal years beginning after December 15, 2006. The adoption of SOP 05-1 did not have a material impact on the Group’s financial position or results of operations. |
| 2. | In March 2006, the Financial Accounting Standards Board (“FASB”) issued Statements of Financial Accounting Standards (“SFAS”) No. 156 “Accounting for Servicing of Financial Assets—an amendment of FASB Statement No. 140”. SFAS 156 amends SFAS 140, “Accounting for Transfers and Servicing of Financial Assets and Extinguishments of Liabilities”, with respect to the accounting for separately recognized servicing assets and servicing liabilities. SFAS 156 requires a company to recognize a servicing asset or servicing liability each time it undertakes an obligation to service a financial asset by entering into a servicing contract principally in a transfer of the servicer’s financial assets that either meets the requirements for sale accounting, or is to a qualifying special-purpose entity in a guaranteed mortgage securitization in which the transferor retains all of the resulting securities and classifies them as either available-for-sale securities or trading securities in accordance with SFAS 115, Accounting for Certain Investments in Debt and Equity Securities. SFAS 156 requires all separately recognized servicing assets and servicing liabilities to be initially measured at fair value, if practicable, and permits a company to choose to subsequently measure each class of separately recognized servicing assets and servicing liabilities using either a specified amortization method or a specified fair value measurement method. At its initial adoption, SFAS 156 permits a one-time reclassification of available-for-sale securities to trading securities by companies with recognized servicing rights, without calling into question the treatment of other available-for-sale securities under SFAS 115, provided that the available-for-sale securities are identified in some manner as offsetting the company’s exposure to changes in fair value of servicing assets or servicing liabilities that a servicer elects to subsequently measure at fair value. SFAS 156 is applicable to all transactions entered into in fiscal years that begin after September 15, 2006. The adoption of this statement did not have a material impact on the Group’s financial position, results of operations or cash-flows. |
| 3. | In April 2006, the FASB issued FASB Interpretation (“FIN”) 46(R)-6, “Determining the Variability to Be Considered in Applying FASB Interpretation No. 46(R)” (FSP FIN 46(R)-6). FSP FIN 46(R)-6 addresses the application of FIN 46(R), “Consolidation of Variable Interest Entities,” in determining whether certain contracts or arrangements with a variable interest entity (VIE) are variable interests by requiring companies to base such evaluations on an analysis of the VIE’s purpose and design, rather than its legal form or accounting classification. FSP FIN 46(R)-6 is required to be applied for all reporting periods beginning after June 15, 2006. The adoption of FSP FIN 46(R)-6 did not have a material impact on the Group’s financial position, results of operations or cash-flows. |
| 4. | In July 2006, the FASB issued a Staff Position, “Accounting for a Change or Projected Change in the Timing of Cash Flows Relating to Income Taxes Generated by a Leverage Lease Transaction” (FSP 13-2), which provides guidance regarding changes or projected changes in the timing of cash flows relating to income taxes generated by a leveraged lease transaction. Leveraged leases can provide significant tax benefits to the lessor. Since changes in the timing and/or amount of these tax benefits may have a material effect on the cash flows of a lease transaction, a lessor, in accordance with FSP 13-2, will be required to perform a recalculation of a leveraged lease when there is a change or projected change in the timing of the realization of tax benefits generated by that lease. FSP 13-2 is effective for fiscal years beginning after December 15, 2006 with early application permitted. The adoption of FSP 13-2 did not have a material impact on the Group’s financial position or results of operations. |
| 5. | On July 13, 2006, the FASB issued Interpretation No. 48 “Accounting for Uncertainty in Income Taxes — an Interpretation of FASB Statement No. 109” (FIN 48). This statement was issued to provide additional guidance and clarification on accounting for uncertainty in income tax positions. The interpretation prescribes a recognition threshold and measurement attribute for financial statement recognition and measurement of tax positions, as well as increased disclosure requirements with regards to uncertain tax positions. This interpretation of FASB Statement No. 109 uses a two-step approach wherein a tax benefit is recognized if a position is more likely than not to be sustained. The amount of the benefit is then measured to be the highest tax benefit which is greater than fifty percent likely to be realized. FIN 48 also sets out disclosure requirements to enhance transparency of an entity’s tax reserves. The adoption by the Group of FIN 48 had no material effect on the retained earnings as of January 1, 2007. |
F-151
Table of Contents
| 6. | In May 2007, the FASB issued a Staff Position “Definition of Settlement in FASB Interpretation No. 48” (FSP FIN 48-1). FSP FIN 48-1 clarifies that a tax position can be considered “effectively settled” upon completion of an examination by a taxing authority without being legally extinguished. Where tax positions are considered effectively settled, an entity recognizes the full amount of tax benefit, even if (1) the position is not considered more likely than not to be sustained solely on the basis of its technical merits and (2) the statute of limitations remains open. FSP FIN 48-1 is effective on adoption of FIN 48. The adoption of FSP FIN 48-1 did not have a material effect on the Group’s financial position or results of operations. |
| 1. | In September 2006, the FASB issued SFAS No. 157, “Fair Value Measurements” (SFAS No. 157). This Standard defines fair value, establishes a consistent framework for measuring fair value and expands disclosure requirements about fair value measurements. In addition, SFAS No. 157 disallows the use of block discounts and supersedes the guidance in EITF 02-3, which prohibited the recognition of day-1 gains on certain derivative trades when determining the fair value of instruments traded in an active market. With the adoption of this Standard, these changes will be reflected as a cumulative effect adjustment to the opening balance of retained earnings. The Standard also requires reflecting its own credit standing when measuring the fair value of debt it has issued, including derivatives, prospectively from the date of adoption. SFAS No. 157 is effective for fiscal years beginning after January 1, 2008, with earlier adoption permitted. The Group continues to evaluate the potential impact of adopting this Statement. |
| 2. | In February 2008, the FASB issued a Staff Position “Application of FASB Statement No. 157 to FASB Statement No. 13 and Other Accounting Pronouncements That Address Fair Value Measurements for Purposes of Lease Classification or Measurement Under Statement 13” (FSP FAS 157-1) which amends SFAS 157 “Fair value measurements”, where leases that fall under the scope of SFAS 13 “Accounting for leases” are excluded from the scope of SFAS 157. FSP FAS 157-1 is effective on the adoption of SFAS 157. The Group continues to evaluate the potencial impact of the adoption of FSP FAS 157-1. |
| 3. | In February 2008, the FASB issued a Staff Position “Effective Date of FASB Statement No. 157” (FSP FAS 157-2) which delays the effective date of SFAS 157 for non-recurring fair value measurements of non financial assets and liabilities until fiscal years beginning after November 15, 2008. Entities are encouraged to adopt SFAS 157 in its entirety. FSP FAS 157-2 is effective upon issuance. The Group continues to evaluate the potencial impact of the adoption of FSP FAS 157-2. |
| 4. | In February 2007, the FASB issued SFAS No. 159 ‘‘The Fair Value Option for Financial Assets and Financial Liabilities-Including an amendment of FASB Statement No. 115’’. The fair value option established by SFAS 159 permits all entities to choose to measure eligible items at fair value at specified election dates. Eligible items include a financial asset and financial liability, a firm commitment involving financial instruments that would not otherwise be recognized at fair value, a written loan commitment, certain rights and obligations under an insurance contract, and certain rights and obligations under a warranty. A business entity shall report unrealized gains and losses on items for which the fair value option has been elected in earnings at each subsequent reporting date. In accordance with SFAS 159, the fair value option (1) can be applied instrument by instrument, with a few exceptions, such as investments otherwise accounted for by the equity method, (2) is irrevocable (unless a new election date occurs), and (3) cannot be applied to portions of instruments. SFAS 159 is effective for fiscal years beginning after November 15, 2007 with early adoption permitted provided the entity also elects to apply the provisions of SFAS 157,‘‘Fair Value Measurements’’. The Group continues to evaluate the potential impact of adopting this Standard. |
| 5. | In April 2007, the FASB issued a Staff Position “Amendment of FASB Interpretation No. 39 “(FSP FIN 39-1). FSP FIN 39-1 specifies the conditions that have to be met to enable an entity to offset amounts recognized in the balance sheet and clarifies when it is appropriate to offset amounts recognized for forwards, interest rate swaps, currency swaps, options and other conditional or exchange contracts. Offsetting of derivative contract fair values is permitted when executed with the same counterparty under a master netting agreement. FSP FIN 39-1 should be applied retrospectively for fiscal years beginning after November 15, 2007 with early adoption permitted. The adoption of FSP FIN 39-1 is not expected to have a material effect on the Group’s financial position, results of operations or cash-flows. |
| 6. | In July 2007, the AICPA issued Statement of Position 07-1, “Clarification of the Scope of the Audit and Accounting Guide for Investment Companies and Accounting by Parent Companies and Equity Method Investors for Investments in Investment Companies” (SOP 07-1). SOP 07-1 clarifies which entities are in the scope of the AICPA Audit and Accounting Guide “Investment Companies”. In addition, SOP 07-1 establishes new criteria for a parent company or equity method investor to retain investment company accounting in their consolidated financial statements. Investment companies record all their investments at fair value with changes in value reflected in earnings. SOP 07-1 was effective for fiscal years beginning on or after December 15, 2007, however in February 2008 the FASB issued a Staff Position “Effective date of AICPA Statement of Position 07-1” (FSP SOP 07-1-1) which, in the majority of circumstances, indefinitely defers the adoption of SOP 07-1 for companies that had not adopted the statement by December 15, 2007. |
F-152
Table of Contents
| 7. | In November 2007, the SEC issued Staff Accounting Bulletin No. 109 (SAB 109), “Written Loan Commitments Recorded at Fair Value Through Earnings” which requires that the fair value of a written loan commitment that is marked to market through earnings should include the future cash flows related to the loan’s servicing rights. However, the fair value measurement of a written loan commitment still must exclude the expected net cash flows related to internally-developed intangible assets (such as customer relationship intangible assets). SAB 109 applies to two types of loan commitments: (1) written mortgage loan commitments for loans that will be held-for-sale when funded that are marked to market as derivatives under FAS 133 (derivative loan commitments); and (2) other written loan commitments that are accounted for at fair value through earnings under Statement 159’s fair-value election. SAB 109 supersedes SAB 105, which applied only to derivative loan commitments and allowed the expected future cash flows related to the associated servicing of the loan to be recognized only after the servicing asset had been contractually separated from the underlying loan by sale or securitization of the loan with servicing retained. The staff expects registrants to apply the views in Question 1 of SAB 109 on a prospective basis to derivative loan commitments issued or modified in fiscal quarters beginning after December 15, 2007. The Group is evaluating the impact, if any, that the adoption of SAB 109 may have on its consolidated financial statements and disclosures. |
| 8. | In December 2007, the FASB issued SFAS No. 141 (revised 2007) “Business Combinations” which is a revision of SFAS 141. SFAS 141(R) defines the acquirer in a business combination as the entity that obtains control of one or more businesses in the business combination and establishes the acquisition date as the date that the acquirer achieves control. The scope of SFAS 141 has also been extended to include all business combinations and not just those where control is obtained by transferring consideration. Assets acquired, liabilities assumed and any noncontrolling interest at the acquisition date must be recognized at their fair value, with limited exceptions, and contingencies are also recognized at fair value if it is more likely than not that they meet the definition of an asset or a liability. Contingent consideration should be measured initially and at each subsequent accounting period at fair value and all acquisition related costs should be expensed in the period in which the costs were incurred or the services received. SFAS 141(R) applies prospectively to business combinations where the acquisition date is on or after December 15, 2008. As SFAS 141(R) will be prospectively applied, its adoption will have no effect on the business combinations already recognized in the financial statements at the adoption date. |
| 9. | In December 2007, the FASB issued SFAS No. 160 “Noncontrolling Interests in Consolidated Financial Statements” an amendment of ARB No. 51 “Consolidated Financial Statements”. The Statement requires that minority interests are presented in equity and on the face of the income statement separately from equity and income attributable to the parent. Changes in ownership interests without a change in control are accounted for as equity transactions and no gain or loss recognized in the income statement. When a subsidiary is deconsolidated any remaining minority interest should be initially measured at fair value and any gain or loss based on that value. SFAS 160 should be applied prospectively for fiscal years and interim periods beginning on or after December 15, 2008 except for the presentation and disclosure requirements which should be applied retrospectively for all periods presented. As SFAS 160 will be prospectively applied, its adoption will have no effect on changes in ownership interests that have already been recognized in the financial statements at the adoption date. |
| 10. | In February 2008, the FASB released a Staff Position “Accounting for Transfers of Financial Assets and Repurchase Financing Transactions” (FSP FAS 140-3). FSP FAS 140-3 clarifies the accounting where a security is sold and is subsequently subject to a repurchase agreement which is linked to the initial sale. Where the sale and the repurchase agreement are linked, the transaction is either accounted for as a forward rate agreement or, if the transfer meets the SFAS 140 criteria, as a sale unless certain conditions are met. The FSP is effective for repurchase financing in which the initial transfer is entered into in fiscal years beginning after November 15, 2008. Early adoption or retrospective application is prohibited. The adoption of FSP FAS 140-3 is not expected to have a material impact on the Group’s financial position or results of operations. |
| 11. | In March 2008, the FASB released SFAS No. 161 “Disclosures About Derivative Instruments and Hedging Activities” (SFAS 161), an amendment of SFAS No. 133 “Accounting for Derivative Instruments and Hedging Activities” (SFAS 133). SFAS 161 applies to all entities with derivative instruments subject to SFAS 133 as well as hedged items, bifurcated derivatives and non-derivative instruments that are designated and qualify as hedging instruments. The statement requires an entity to make certain qualitative disclosures about the derivative instruments it holds including, how and why they are used and the volume of activity, distinguishing between instruments used for risk management and those used for other purposes. There is also a requirement to disclose quantitative information regarding derivative instruments, in a tabular format, in order to highlight the effect that the use of these instruments has on the income statement, the balance sheet and the entity’s cashflows. An entity can elect not to disclose gains and losses on derivatives classified as trading, though alternative disclosures must be made. The effect of credit-risk-contingent features is also required to be disclosed. The adoption of SFAS 161 is not expected to have a material impact on the Group’s financial position, results of operations or cash-flows. |
F-153
Table of Contents
| 12. | In April 2008, the FASB issued FSP FAS 142-3 “Determination of the Useful Life of Intangible Assets”. FSP FAS 142-3 amends the factors that should be considered in developing renewal or extension assumptions used to determine the useful life of a recognized intangible asset under SFAS No. 142 “Goodwill and Other Intangible Assets”. The objective of FSP FAS 142-3 is to improve the consistency between the useful life of a recognized intangible asset under SFAS No.142 and the period of expected cash flows to measure the fair value of an asset under SFAS No. 141R “Business Combinations”, and other U.S. generally accepted accounting principle. The FSP FAS 142-3 is effective on January 1, 2009 and early adoption is prohibited. The Group is currently evaluating the impact of adopting FSP FAS 142-3 on its consolidated financial condition, operating results and cash flows. |
| 13. | In May 2008, the FASB issued FASB Staff position No. APB 14-1 “Accounting for Convertible Debt Instruments That May Be Settled in Cash upon Conversion (Including Partial Cash Settlement)”. This FASB Staff Position (FSP) clarifies that convertible debt instruments that may be settled in cash upon conversion (including partial cash settlement) are not addressed by paragraph 12 of APB Opinion No. 14,“Accounting for Convertible Debt and Debt Issued with Stock Purchase Warrants”. Additionally, this FSP specifies that issuers of such instruments should separately account for the liability and equity components in a manner that will reflect the entity’s nonconvertible debt borrowing rate when interest cost is recognized in subsequent periods. This FSP nullifies EITF Issues No. 90-19 “Convertible Bonds with Issuer Option to Settle for Cash upon Conversion”, and No. 03-7 “Accounting for the Settlement of the Equity-Settled Portion of a Convertible Debt Instrument That Permits or Requires the Conversion Spread to Be Settled in Stock” (Instrument C of Issue No. 90-19). This FSP amends EITF Issues No. 98-5 “Accounting for Convertible Securities with Beneficial Conversion Features or Contingently Adjustable Conversion Ratios”, No. 99-1 “Accounting for Debt Convertible into the Stock of a Consolidated Subsidiary”, No. 00-27 “Application of Issue No. 98-5 to Certain Convertible Instruments”, No. 04-8 “The Effect of Contingently Convertible Instruments on Diluted Earnings per Share”, No. 05- 1 “Accounting for the Conversion of an Instrument That Becomes Convertible upon the Issuer’s Exercise of a Call Option”, and No. 06-7 “Issuer’s Accounting for a Previously Bifurcated Conversion Option in a Convertible Debt Instrument When the Conversion Option No Longer Meets the Bifurcation Criteria in FASB Statement No. 133”. This FSP is effective for financial statements issued for fiscal years beginning after December 15, 2008, and interim periods within those fiscal years. The adoption of FSP APB 14-1 is not expected to have a material effect on the Group’s financial position, results of operations or cash-flows. |
| 14. | In May 2008, the FASB issued SFAS No. 162 “The Hierarchy of Generally Accepted Accounting Principles”. This Statement identifies the sources of accounting principles and the framework for selecting the principles used in the preparation of financial statements of nongovernmental entities that are presented in conformity with generally accepted accounting principles (GAAP) in the United States (the GAAP hierarchy). This Statement applies to financial statements of nongovernmental entities that are presented in conformity with GAAP. This Statement shall be effective 60 days following the SEC’s approval of the Public Company Accounting Oversight Board (PCAOB) amendments to AU Section 411 “The Meaning of Present Fairly in Conformity With Generally Accepted Accounting Principles”. The Group will adopt this Statement, upon its effective date, for the preparation of its financial statements in future fiscal years. |
| 57.2 | Significant valuation and income recognition principles under the EU-IFRS required to be applied under Bank of Spain’s Circular 4/2004 and U.S. GAAP |
F-154
Table of Contents
| The EU-IFRS required to be applied under Bank of Spain’s | ||
| Circular 4/2004 | U.S. GAAP | |
Business combinations, goodwill and intangible assets | ||
(See Notes 2.b.v and 2.m) | ||
Business combinations performed on or after January 1, 2004 whereby the Group obtains control over an entity are recognized for accounting purposes as follows: • The Group measures the cost of the business combination, defined as the fair value of the assets given, the liabilities incurred and the equity instruments issued, if any, by the entity. • The fair values of the assets, liabilities and contingent liabilities of the acquiree, including any intangible assets which might have not been recognized by the acquiree, are estimated and recognized in the consolidated balance sheet. • Any positive difference between the net fair value of the assets, liabilities and contingent liabilities of the acquiree and the business combination cost is recognized in “Other Gains” in the consolidated income statement. Any excess of the cost of the investments in the consolidated entities and entities accounted for using the equity method over the corresponding underlying carrying amounts acquired, adjusted at the date of first time consolidation, is allocated to: • specific assets and liabilities of the companies acquired, • to specific intangible assets, by recognizing it explicitly in the consolidated balance sheet provided that their fair value at the date of acquisition can be measured reliably, and • the remaining amount is recognized as goodwill, which is allocated to one or more specific cash-generating units. The cash generating units represent the Group’s geographical and/or business segments. At the end of each reporting period goodwill is reviewed for impairment at a cash-generating-unit level and any impairment is written down with a charge to “Impairment Losses — Goodwill” in the consolidated income statement. An impairment loss recognized for goodwill is not reversed in a subsequent period. In the first adoption of the EU-IFRS required to be applied under Bank of Spain’s Circular 4/2004, we have used the goodwill existing at January 1, 2004, recalculated from euros to local currency as of the date it arose. | SFAS 141 requires that all business combinations are accounted for using the purchase method. Business combinations are recognized as follows: • The Group measures the cost of the business combination as the fair value of the net assets at the time of acquisition. • Any excess of the acquisition cost over the value of the net assets is recognized as goodwill. • Any excess of the value of the net assets acquired over the acquisition cost is initially allocated to certain non-financial assets with any remaining amount being recognized in the income statement. • Income earned from the acquired company is recognized from the acquisition date. Intangible assets acquired in a business combination must be identified and recognized separately from goodwill. SFAS 142, requires that goodwill and intangible assets with indefinite useful lives are subject to an impairment test at a reporting unit level at least annually. These assets should be written-off to the extent that their carrying amount is not recoverable. An impairment loss recognized cannot be reversed in a subsequent period. | |
Consolidation procedures | ||
(See Note 2.b) | ||
| i. Subsidiaries “Subsidiaries” are defined as entities over which the Bank has the capacity to exercise management control; this capacity is, in general but not exclusively, presumed to exist when the Parent owns directly or indirectly half or more of the voting power of the investee or, even if this percentage is lower or zero, when, as in the case of agreements with shareholders of the investee, the Bank is granted control. Control is the power to govern the financial and operating policies of an entity so as to obtain benefits from its activities. The financial statements of the subsidiaries are fully consolidated with those of the Bank. Accordingly, all balances and transactions between consolidated entities are eliminated on consolidation. ii. “Joint ventures” are deemed to be ventures that are not subsidiaries but which are jointly controlled by two or more unrelated entities. The financial statements of investees classified as joint ventures are proportionately consolidated with those of the Bank. iii. Associates “Associates” are entities over which the Bank is in a position to exercise significant influence, but not control or jointly control, usually because it holds 20% or more of the voting power of the investee. Investments in associates are accounted for using the equity method. In the case of transactions with an associate, the related profits or losses are eliminated to the extent of the Group’s interest in the associate. | Generally, consolidation is required for, and limited to, all investments of greater than 50% of the outstanding voting rights, except when control does not rest with the majority owner. To determine whether certain entities should be consolidated, FIN 46-R introduces the concept of a “Variable Interest Entity” (VIE). A VIE is an entity which fulfills one of the following criteria: (1) It has equity that is insufficient to permit the entity to finance its activities without additional subordinated financial support from other parties. (2) The equity investor cannot make significant decisions about the entity’s operations, or although it could, it doesn’t absorb the expected losses or receive the expected returns of the entity. (3) The equity investors have voting rights that are not proportionate to their economic interests and substantially all the activities of the entity involved are conducted on behalf of an investor with a disproportionately small voting interest. A VIE is consolidated by its primary beneficiary, which is the party involved with the VIE that has a majority of the expected losses or a majority of the expected residual returns or both. US GAAP requires full consolidation of companies controlled by the parent company, whether as a result of voting rights or another mechanism after eliminating all intercompany transactions and recognizing minority interest. Proportional consolidation for Joint Ventures is not permitted. Joint ventures are accounted for using the equity method. The equity method is used to account for certain equity investments when the investor has significant influence over the investee (generally an investment of between 20% and 50% in the outstanding voting rights) but does not control the investee. Using the equity method, an investor adjusts the carrying amount of an investment for its share of the earnings or losses of the investee subsequent to the date of investment and reports the recognized earnings or losses in income. Dividends received from an investee reduce the carrying amount of the investment. |
F-155
Table of Contents
| The EU-IFRS required to be applied under Bank of Spain’s | ||
| Circular 4/2004 | U.S. GAAP | |
Post-employment benefits | ||
(See Notes 2.v and 2.w) | ||
| The Group recognizes under “Provisions — Provisions for Pensions and Similar Obligations” the present value of its defined benefit pension obligations, net of the fair value of the plan assets and of the net unrecognized cumulative actuarial gains or losses disclosed in the valuation of these obligations, which are deferred using a corridor approach, and net of the past service cost, which is deferred over time. “Plan assets” are defined as those that will be directly used to settle obligations and that meet specific conditions. “Actuarial gains and losses” are deemed to be those arising from differences between previous actuarial assumptions and what has actually occurred in the plan and from changes in the actuarial assumptions used. The Group uses, on a plan-by-plan basis, the corridor method and recognizes in the consolidated income statement the amount resulting from dividing by five the net amount of the cumulative actuarial gains and/or losses not recognized at the beginning of each year which exceeds 10% of the present value of the obligations or 10% of the fair value of the plan assets at the beginning of the year, whichever amount is higher. The past service cost -which arises from changes to current post-employment benefits or from the introduction of new benefits- is recognized on a straight-line basis in the consolidated income statement over the period from the time the new commitments arise to the date on which the employee has an irrevocable right to receive the new benefits. “Other Long-Term Employee Benefits”, defined as commitments to early retirees -taken to be those who have ceased to render services at the entity but who, without being legally retired, continue to have economic rights vis-à-vis the entity until they acquire the legal status of retiree-, long-service bonuses, commitments for death of spouse or disability before retirement that depend on the employee’s length of service at the entity and other similar items, are treated for accounting purposes, where applicable, as established above for defined benefit post-employment plans, except that all past service costs and actuarial gains and losses are recognized immediately. | Under U.S. GAAP, the Group applies the provisions of SFAS No. 87, “Employers’ Accounting for Pensions”, SFAS No. 88, “Employers’ Accounting for Settlements and Curtailment of Defined Benefit Pension Plans and for Termination Benefits”, SFAS No. 106, “Employers Accounting for Postretirement Benefits Other Than Pensions” and SFAS No. 158 “Employers’ Accounting for Defined Benefit Pension and Other Postretirement Plans, an amendment of FASB Statements No. 87, 88, 106 and 132(R)”, as applicable. Furthermore, the Group provides the required disclosures in accordance to SFAS No. 132(R) “Employers’ Disclosures about Pensions and Other Postretirement Benefits an amendment of FASB Statements No. 87, 88 and 106”. These Standards do no significantly differ from the provisions followed and applied in our primary financial statements under IFRS, IAS 19 “Employee Benefits”. A liability and a loss in net income are recognized for early retirement plans when the employees accept the offer and the amount can be reasonably estimated. | |
Financial instruments | ||
(See Notes 2.c and 2.g) | ||
Financial assets are included for measurement purposes in one of the following categories: • Financial assets held for trading(at fair value through profit or loss): this category includes the financial assets acquired for the purpose of generating a profit in the near term from fluctuations in their prices and financial derivatives that are not designated as hedging instruments. • Other financial assets at fair value through profit or loss: this category includes hybrid financial assets not held for trading that are measured entirely at fair value and financial assets not held for trading that are managed jointly with “liabilities under insurance contracts” measured at fair value or with derivative financial instruments whose purpose and effect is to significantly reduce exposure to variations in fair value, or that are managed jointly with financial liabilities and derivatives for the purpose of significantly reducing overall exposure to interest rate risk. • Available-for-sale financial assets: this category includes debt instruments not classified as “held-to-maturity investments” or as “financial assets at fair value through profit or loss”, and equity instruments issued by entities other than subsidiaries, associates and jointly controlled entities, provided that such instruments have not been classified as “financial assets held for trading” or as “other financial assets at fair value through profit or loss”. | Investments in equity securities with readily determinable market values and all debt securities are classified as trading securities, available-for-sale securities, or held to maturity securities in accordance with SFAS 115. Trading assets are debt and equity securities that are held principally for the purpose of sale in the near term. They are initially and subsequently recognized at fair value, with movements reported in the statement of income. Debt and equity securities classified as available-for-sale represent securities not classified as either held to maturity or trading securities. They are initially recognized at fair value including direct and incremental transaction costs and are subsequently measured at fair value. Unrealized gains and losses on available-for-sale securities arising from changes in fair value are included in “Other comprehensive income” as a separate component of equity until sale when the cumulative gain or loss is transferred to the income statement. Foreign exchange differences on available-for-sale securities denominated in foreign currency are also excluded from earnings and recorded as part of the same separate component of equity. |
F-156
Table of Contents
| The EU-IFRS required to be applied under Bank of Spain’s | ||
| Circular 4/2004 | U.S. GAAP | |
• Loans and receivables: this category includes financing granted to third parties, based on their nature, irrespective of the type of borrower and the form of financing, including finance lease transactions in which the consolidated entities act as lessors. The consolidated entities generally intend to hold the loans and credits granted by them until their final maturity and, therefore, they are presented in the consolidated balance sheet at their amortized cost (which includes the required adjustments to reflect estimated impairment losses). • The statistical percentages obtained from historical trends as determined by the Bank of Spain guidance (Circular) are applied, being the amounts determined within the range of possible estimated losses calculated internally. • Held-to-maturity investments: this category includes debt instruments with fixed maturity and with fixed or determinable payments. As a general rule, the carrying amount of impaired financial instruments is adjusted with a charge to the consolidated income statement for the period in which the impairment becomes evident, and the reversal of previously recognized impairment losses, if any, is recognized in the consolidated income statement for the year in which the impairment ceases to exist or is reduced. | Securities classified as available-for-sale are required to be reviewed on an individual basis to identify whether their fair value has declined to a level below amortized cost and, if so, whether the decline is other-than-temporary. If it is probable that an investor will be unable to collect all amounts due according to the contractual terms of a debt security, an other-than-temporary impairment is considered to have occurred. An other-than-temporary impairment may be required as a result of a decline in a security’s value due to deterioration in the issuer’s creditworthiness, an increase in market interest rates or a change in foreign exchange rates since acquisition. Other circumstances in which a decline in the fair value of a debt security may be other-than-temporary include situations where the security will be disposed of before it matures or the investment is not realizable. Provision is reflected in earnings as a realized loss for any impairment that is considered to be other-than-temporary. The loan loss allowance should represent the best and most probable estimate of all possible scenarios, being the internally calculated amount determined within the range of possible estimated losses. If an other-than-temporary impairment is recognized, the cost basis of the individual security is written down to fair value as a new cost basis. The new cost basis is not increased for subsequent recoveries in fair value. Debt securities classified as held-to-maturity are securities that the group has the positive intent and ability to hold to maturity. These securities are stated at amortized cost. Under SFAS 155, financial assets and financial liabilities may be measured at fair value through the income statement where they contain substantive embedded derivatives that would otherwise require bifurcation under SFAS 133. |
F-157
Table of Contents
| The EU-IFRS required to be applied under Bank of Spain’s | ||
| Circular 4/2004 | U.S. GAAP | |
Preference Securities and Preference Shares | ||
(See Notes 57.5 and 57.6) | ||
| Following the EU-IFRS required to be applied under Bank of Spain’s Circular 4/2004 consolidation rules, special purpose entities used to issue preference shares are consolidated. Preference securities are classified as financial liabilities, and presented as “Subordinated Debt” or as “Equity Having The Substance of a Financial Liability” if they are shares. Preference securities and shares denominated in a foreign currency are retranslated at each balance sheet date. The dividends on preference securities and shares are recognized in the income statement as interest expense on an amortized cost basis using the effective interest method. | As a consequence of FIN 46-R certain special purpose entities which are used to issue preference shares are excluded from consolidation as the Group is no longer the primary beneficiary. These preference shares are recognized as subordinated deposits held by the Bank that act as a guarantee of the securities. All other preference shares are classified in equity if they are not mandatorily redeemable and do not have redemption features that are not solely within the control of the issuer. The dividends on preference securities and shares are accounted for as an appropriation of profit. | |
Securitized assets | ||
(See Notes 2.e, 57.3.g and 58.1) | ||
The accounting treatment of transfers of financial assets depends on the extent to which the risks and rewards associated with the transferred assets are transferred to third parties: 1. If the Group transfers substantially all the risks and rewards to third parties the transferred financial asset is derecognized and any right or obligation retained or created in the transfer is recognized simultaneously. 2. If the Group retains substantially all the rights and rewards associated with the transferred financial asset, the transferred financial asset is not derecognized and continues to be measured by the same criteria used before the transfer. However: a. An associated financial liability is recognized for an amount equal to the consideration received. b. The income from the transferred financial asset not derecognized and any expense incurred on the new financial liability are recognized in the consolidated income statement. 3. If the Group neither transfers nor retains substantially all the risks and rewards associated with the transferred financial asset, the following distinction must be made: a. If the transferor does not retain control, the transferred financial asset is derecognized and any right or obligation retained or created in the transfer is recognized. b. If the transferor retains control, it continues to recognize the transferred financial asset for an amount equal to its exposure to changes in value and recognizes a financial liability associated with the transferred financial asset. The net carrying amount of the transferred asset and the associated liability shall be the amortized cost of the rights and obligations retained, if the transferred asset is measured at amortized cost, or the fair value of the rights and obligations retained, if the transferred asset is measured at fair value. | U.S. GAAP SFAS 140, “Accounting for Transfers and Servicing of Financial Assets and Extinguishments of Liabilities”, requires that after a transfer of financial assets an entity recognizes the financial and servicing assets it controls and the liabilities it has incurred, derecognizes financial assets when control has been surrendered, and derecognizes liabilities when extinguished. The statement contains rules for distinguishing transfers of financial assets that are sales from transfers that are secured borrowings. SFAS 156, “Accounting for Servicing of Financial Assets — an amendment of FASB Statement No. 140” requires that a servicing asset or liability is recognized each time an entity undertakes an obligation to service a financial asset by entering into a servicing contract principally in a transfer of the servicer’s financial assets that either meets the requirements for sale accounting or is to a qualifying special-purpose entity in a guaranteed mortgage securitization. Certain mortgage securitization vehicles held by the Group were considered “qualifying special purpose entities” under U.S. GAAP and therefore were outside the scope of FIN 46(R). These securitizations were treated as sales and, where appropriate, a servicing asset and an interest-only security were recognized. Servicing assets are amortized over the periods in which the benefits are expected to be received and the interest-only security was accounted for as an available-for-sale security. Evaluation for impairment was conducted in accordance with EITF 99-20. If previously derecognized assets no longer meet the requirements of SFAS 140, the assets are deemed to have been repurchased by the transferor at fair value. The recognized assets are classified as loans and subsequently measured at amortized cost. On rerecognition of the transferred assets, any difference between fair value on transfer and the book value of the asset will be recognized in the income statement as part of the effective interest calculation in accordance with SFAS 91. Once an entity no longer meets the requirements for a qualifying special purpose entity it is no longer outside the scope of FIN 46(R) and will be subject to its provisions as described in the consolidation section above. See notes 57.3 g) and 58.1 for details. |
F-158
Table of Contents
| The EU-IFRS required to be applied under Bank of Spain’s | ||
| Circular 4/2004 | U.S. GAAP | |
Derivative instruments and hedging activities | ||
(See Notes 2.d.v and 57.3.f) | ||
All derivatives are recognized either as assets or liabilities on the balance sheet and measured at their fair value. The accounting for changes in the fair value of a derivative (that is, gains and losses) depends on the intended use of the derivative and the resulting designation as Trading or Hedging (of Cash Flow, of Fair Value or of a foreign currency investment exposure). • Effectiveness testing: the EU-IFRS required to be applied under Bank of Spain’s Circular 4/2004 allows prospective and retrospective effectiveness testing. • Macro hedging is permitted. • Dynamic portfolio hedging is permitted. | Accounting for derivatives under U.S. GAAP is similar to that of the EU-IFRS required to be applied under Bank of Spain’s Circular 4/2004. There are however differences in their detailed application. • Effectiveness testing: retrospective testing may not be required if the short cut and matched terms methods can be used • Macro hedging is not permitted • Non-dynamic portfolio hedging requires that the individual items respond in a “generally proportionate manner” to the overall change in fair value of the aggregate portfolio; and that all cash flows of the hedged items be included in the hedge relationship. | |
Sale — Leaseback transactions involving real estate | ||
(See Notes 2.l and 57.3.e) | ||
| According to IAS 17 a lease is classified as a finance lease if it transfers substantially all risks and rewards incidental to ownership of the leased asset to the lessee;otherwise it is classified as an operating lease. Under IAS 17, if a sale-leaseback transaction that involves real estate includes a genuine repurchase option (that is, an option whose exercise is not almost certain), that transaction should be accounted for as a sale and lease-back transaction. Any gain would be recognized based on the classification of the leaseback, as either operating (at the time of the sale-leaseback) or finance leases (over the lease term). | According to SFAS No. 13 leased properties are also classified as either operating or capital leases based on certain criteria, and any sale-leaseback properties involving real estate are dealt with in SFAS No. 66 and SFAS No. 98. A sale- leaseback transaction that does not qualify for sale-leaseback accounting because of any form of continuing involvement (e.g. repurchase option at fair value under SFAS No. 98) by the seller-lessee other than a normal leaseback shall be accounted for by the deposit or financing method, whichever is appropriate under SFAS No. 98. If a sale-leaseback transaction has to be reported as a financing method, the seller-lessee reports the sales proceeds as a liability, continues to report the real estate or the real estate and equipment as an asset, and continues to depreciate the property. Lease payments are considered interest payments, are accounted in the income statement and do not reduce the liability (sales proceeds). | |
Fair value option | ||
(See Note 2.c) | ||
| The Fair value option is permitted in accordance with IAS 39. | The Fair value option is not permitted as of December 31, 2007 unless SFAS 159 is early adopted. The Group has not early adopted SFAS No. 159. |
F-159
Table of Contents
| 57.3 | Net Income and Stockholders’ Equity reconciliations between the EU-IFRS required to be applied under Bank of Spain’s Circular 4/2004 and U.S. GAAP | |
| Following is a summary of the adjustments to consolidated net income and to consolidated Stockholders’ Equity which would be required if U.S. GAAP had been applied to the accompanying consolidated financial statements. | ||
| Our primary financial statements have been prepared in accordance with the EU-IFRS required to be applied under Bank of Spain’s Circular 4/2004. For this reason, reconciliation to U.S. GAAP starts from our EU-IFRS required to be applied under Bank of Spain’s Circular 4/2004 financial statements. These adjustments are explained in the following Notes a — j. | ||
| After the reconciliation, the Comprehensive Income reporting required by SFAS 130 is disclosed. More information about it can be found in Note j. |
| Thousands of Euros | ||||||||||||||||
| Increase (decrease) | ||||||||||||||||
| 2007 | 2006 | 2005 | ||||||||||||||
NET INCOME | ||||||||||||||||
| Net income in accordance with the EU-IFRS (*) | 9,636,150 | 8,245,753 | 6,749,770 | |||||||||||||
| Less: Net income attributable to minority interest under the EU-IFRS (*) (**) | (575,892 | ) | (649,806 | ) | (529,666 | ) | ||||||||||
Net income attributable to the Group in accordance with the EU-IFRS (*) | 9,060,258 | 7,595,947 | 6,220,104 | |||||||||||||
Of which: | ||||||||||||||||
Continuing operations | 8,351,941 | 6,327,643 | 5,990,404 | |||||||||||||
Discontinued operations | 708,317 | 1,268,304 | 229,700 | |||||||||||||
Adjustments to conform to U.S. GAAP: | ||||||||||||||||
• Allowances for credit losses | (a | ) | (347,155 | ) | (226,365 | ) | (302,033 | ) | ||||||||
• Investment securities | (b | ) | 15,215 | 161,268 | 82,052 | |||||||||||
• Goodwill and business combinations | (d | ) | (83,249 | ) | (170,325 | ) | 69,675 | |||||||||
• Intangible assets | (d | ) | — | — | (50,661 | ) | ||||||||||
• Premises and equipment | (e | ) | (1,636,780 | ) | 9,507 | 7,669 | ||||||||||
• Hedge accounting: derivative instruments | (f | ) | (711,599 | ) | (550,276 | ) | 342,382 | |||||||||
• Securitization | (g | ) | 293,869 | 174,237 | 72,961 | |||||||||||
• Pension liabilities and other post-employment benefits | (h | ) | (97,206 | ) | 412,085 | — | ||||||||||
• Income taxes | (i | ) | 803,464 | 8,493 | (123,689 | ) | ||||||||||
Total adjustments: | (1,763,441 | ) | (181,376 | ) | 98,356 | |||||||||||
Net income attributable to the Group in accordance with U.S. GAAP | 7,296,817 | 7,414,571 | 6,318,460 | |||||||||||||
Of which: | ||||||||||||||||
Continuing operations | 6,724,962 | 6,305,470 | 6,088,760 | |||||||||||||
Discontinued operations | 571,855 | 1,109,101 | 229,700 | |||||||||||||
| (*) | The EU-IFRS required to be applied under Bank of Spain’s Circular 4/2004. | |
| (**) | Under the EU-IFRS required to be applied under Bank of Spain’s Circular 4/2004 equity and net income includes the equity and net income corresponding to the shareholders of both the Parent and the minority interests. Under U.S. GAAP, shareholder’s equity and net income is made up only of the portion attributed to equity holders of the Parent. Therefore, an adjustment to reconcile to U.S. GAAP is recorded in order to exclude the Minority Interests portion of shareholder’s equity and net income. | |
| The accompanying Notes are an integral part of reconciliation of consolidated net income and stockholders’ equity to U.S. GAAP as of December 31, 2007, 2006 and 2005 and for the years then ended. |
F-160
Table of Contents
| Thousands of Euros | ||||||||||||||||
| Increase (decrease) | ||||||||||||||||
| 2007 | 2006 | 2005 | ||||||||||||||
STOCKHOLDERS’ EQUITY | ||||||||||||||||
Total Equity in accordance with the EU-IFRS (*) | 57,558,151 | 47,072,302 | 42,626,699 | |||||||||||||
| Less: Minority Interest under the EU-IFRS (*) (**) | (2,358,269 | ) | (2,220,743 | ) | (2,848,223 | ) | ||||||||||
Stockholders’ Equity in accordance with the EU-IFRS (*) | 55,199,882 | 44,851,559 | 39,778,476 | |||||||||||||
Adjustments to conform to U.S. GAAP: | ||||||||||||||||
• Allowances for credit losses | (a | ) | 281,230 | 628,385 | 854,750 | |||||||||||
• Loans granted to purchase parent company shares | (c | ) | (19,133 | ) | (25,875 | ) | (120,035 | ) | ||||||||
• Investment securities | (b | ) | — | — | — | |||||||||||
• Goodwill and business combinations | (d | ) | 3,115,032 | 3,113,896 | 2,972,556 | |||||||||||
• Intangible assets | (d | ) | — | — | — | |||||||||||
• Premises and equipment | (e | ) | (1,890,253 | ) | (253,473 | ) | (262,980 | ) | ||||||||
• Hedge accounting: derivative instruments | (f | ) | (899,347 | ) | (155,288 | ) | 395,350 | |||||||||
• Securitization | (g | ) | 906,462 | 640,357 | 494,674 | |||||||||||
• Pension liabilities and other post-employment benefits | (h | ) | 117,816 | 105,612 | — | |||||||||||
• Taxes | (i | ) | 581,908 | (201,633 | ) | (328,456 | ) | |||||||||
Total adjustments: | 2,193,715 | 3,851,981 | 4,005,859 | |||||||||||||
Stockholders’ Equity in accordance with U.S. GAAP | 57,393,597 | 48,703,540 | 43,784,335 | |||||||||||||
| (*) | The EU-IFRS required to be applied under Bank of Spain’s Circular 4/2004. | |
| (**) | Under the EU-IFRS required to be applied under Bank of Spain’s Circular 4/2004 equity and net income includes the equity and net income corresponding to the shareholders of both the Parent and the minority interests. Under U.S. GAAP, shareholder’s equity and net income is made up only of the portion attributed to equity holders of the Parent. Therefore, an adjustment to reconcile to U.S. GAAP is recorded in order to exclude the Minority Interests portion of shareholder’s equity and net income. | |
| The accompanying Notes are an integral part of reconciliation of consolidated net income and stockholders’ equity to U.S. GAAP as of December 31, 2007, 2006 and 2005 and for the year then ended. |
F-161
Table of Contents
| Considering the adjustments included in the reconciliation, the Other Comprehensive Income information required by SFAS 130 is summarized in the table below: |
| Thousands of Euros | ||||||||||||
| Increase (decrease) | ||||||||||||
| 2007 | 2006 | 2005 | ||||||||||
CHANGES IN EQUITY FROM NON-OWNER SOURCES | ||||||||||||
Accumulated Other Comprehensive Income, net of tax: | ||||||||||||
• Unrealized gains (losses) on securities | 1,275,349 | 2,163,558 | 1,954,932 | |||||||||
• Net gains (losses) on derivative instruments | (58,655 | ) | 49,252 | 70,406 | ||||||||
• Foreign currency translation adjustment | (7,884,100 | ) | (6,747,605 | ) | (6,245,939 | ) | ||||||
• Pension liabilities and other post-employment benefits | (137,944 | ) | (214,531 | ) | — | |||||||
Total Accumulated Other Comprehensive Income | (6,805,350 | ) | (4,749,326 | ) | (4,220,601 | ) | ||||||
COMPREHENSIVE INCOME | ||||||||||||
Net income attributable to the Group in accordance with U.S. GAAP | 7,296,817 | 7,414,571 | 6,318,460 | |||||||||
Other Comprehensive Income, net of tax: | ||||||||||||
• Unrealized gains (losses) on securities | (888,209 | ) | 208,626 | (82,458 | ) | |||||||
• Net gains (losses) on derivative instruments | (107,907 | ) | (21,154 | ) | (268,660 | ) | ||||||
• Foreign currency translation adjustment | (1,136,495 | ) | (501,666 | ) | 1,112,333 | |||||||
• Pension liabilities and other post-employment benefits | 76,587 | (214,531 | ) | — | ||||||||
Other Comprehensive Income (see Note 57.3.j) | (2,056,024 | ) | (528,725 | ) | 761,215 | |||||||
Comprehensive Income in accordance with U.S. GAAP | 5,240,793 | 6,885,846 | 7,070,675 | |||||||||
| The accompanying Notes are an integral part of reconciliation of consolidated net income and stockholders’ equity to U.S. GAAP as of December 31, 2007, 2006 and 2005 and for the years then ended. |
F-162
Table of Contents
F-163
Table of Contents
• Under the EU-IFRS required to be applied under Bank of Spain’s Circular 4/2004 we use “peer group” information as indicated in Note 2.g) in the calculation of allowances for inherent losses incurred but not yet identified, until the Bank’s internal risk models are reviewed and approved by the Bank of Spain. | |||
• Under U.S. GAAP, pursuant to SFAS 5, Accounting for Contingencies (SFAS 5) and paragraph 3 of Financial Accounting Standards Board (FASB) Interpretation No. 14 (FIN 14), Reasonable Estimation of the Amount of a Loss we calculate credit losses based on our internal risk models using the best estimates, after considering our experience, the information about debtors profiles and appraisal of the receivables in light of the current economic environment at the balance sheet date. | |||
• Under U.S. GAAP the methodology in developing our internal risk models is consistent with the guidance described in AICPA Accounting Guidance for Banking Industry for identified loans that are to be evaluated for collectibility. | |||
• Also considered are the view points included in EITF Topic D-80 Application of FASB Statement 5 and 114 to a loan portfolio which state in part: |
• | Arriving at an appropriate allowance involves a high degree of management judgment and results in a range of estimated losses. | ||
| • | Institutions should maintain prudent, conservative, but not excessive, loan loss allowances that fall within an acceptable range of estimated losses. Consistent with GAAP, an institution should record its best estimate within the estimated range of credit losses, including when the best estimate is at the high end of the range. | ||
| • | When determining the level for the allowance, management should always ensure that the overall allowance appropriately reflects a margin for the imprecision inherent in most estimates of inherent credit losses (footnote omitted). | ||
| • | Simply because a portion of the allowance is designated as “unallocated,” it is not thereby inconsistent with GAAP. The important consideration is whether the allowance reflects an estimate of probable losses, determined in accordance with GAAP, and is appropriately supported. | ||
| • | Allowance estimates should be based on a comprehensive, well-documented, and consistently applied analysis of the loan portfolio. |
| As described in the Note above our calculation under U.S. GAAP is based on the best estimate within the estimated range of credit losses. Moreover, paragraph 23 of SFAS 5 states the following: |
| Hence, the use of “peer group” statistical assumptions are not appropriate, even when the amount falls within an acceptable range of estimated losses, as the amount does not correspond with the best estimate of loan losses. Consequently, for U.S. GAAP purposes we have used our own appropriately adjusted experience in determining the allowance for loan losses. | ||
Accordingly, we have recorded an adjustment between U.S. GAAP and the EU-IFRS required to be applied under Bank of Spain’s Circular 4/2004 which caused a decrease of€347,155,€226,365 and€302,033 thousand to our income statement in 2007, 2006 and 2005, respectively. The effect in shareholders’ equity under U.S. GAAP is an increase of€281,230 thousand,€628,385 thousand,€854,750 thousand as of December 31, 2007, 2006 and 2005, respectively. |
F-164
Table of Contents
F-165
Table of Contents
F-166
Table of Contents
F-167
Table of Contents
F-168
Table of Contents
| Thousands of Euros | 2007 | 2006 | 2005 | |||||||||
Value of interest-only strip at inception(1) | 903,538 | 798,213 | 621,626 | |||||||||
| Increase/(decrease) in value of interest only strip (recorded in Other Comprehensive Income, see Note 57.3.j) | — | (157,856 | ) | (126,952 | ) | |||||||
| Impairment | (51,171 | ) | ||||||||||
| Reclassify as net loans and leases | (852,367 | ) | — | — | ||||||||
Value of interest-only strip at December 31(1) | — | 640,357 | 494,674 | |||||||||
| (1) | The valuation of the interest-only strip asset is based on a key assumption of a discount rate of 8.2% (9.4% in 2006 and 8.4% in 2005). Interest-only strip assets purchased in Abbey’s business combination are valued at purchase price. |
F-169
Table of Contents
| 2007 | 2006 | 2005 | ||||||||||
Defined Benefit Obligation (see Note 25) | 23,822 | 23,412 | 22,461 | |||||||||
| Commitments arising from employees retired early (Note 25.c) | (3,949 | ) | (4,481 | ) | (4,215 | ) | ||||||
| Other commitments | (312 | ) | (264 | ) | (330 | ) | ||||||
| Annuity contracts, total accrued commitments and other | (1,884 | ) | (1,973 | ) | (2,547 | ) | ||||||
Projected Benefit Obligation under U.S. GAAP | 17,677 | 16,694 | 15,369 | |||||||||
| Thousands of Euros | ||||
Liability under the EU-IFRS (*) | 11,819,748 | |||
| Funds from employees taking early retirement | (3,949,388 | ) | ||
| Annuity contracts | (606,859 | ) | ||
| Other commitments | (312,091 | ) | ||
| Assets pledged | 10,528,195 | |||
| Plan Assets | (14,310,443 | ) | ||
Liability under U.S. GAAP (before SFAS 158 adjustment) | 3,169,162 | |||
SFAS 158 effect | 197,063 | |||
Liability under U.S. GAAP (after SFAS 158 adjustment) | 3,366,225 | |||
| Minimum | ||||||||||||
| ABO | Plan Assets | Liability | ||||||||||
| Spanish entities | 5,155,288 | 3,815,248 | 1,340,040 | |||||||||
| Abbey | 5,772,142 | 4,911,707 | 860,435 | |||||||||
| Other foreign subsidiaries | 5,957,020 | 5,583,488 | 373,532 | |||||||||
TOTAL | 16,884,450 | 14,310,443 | 2,574,007 | |||||||||
| Liability (before FAS 158) in excess over Minimum Liability as per SFAS 87 | 595,155 | |||||||||||
| (*) | The EU-IFRS required to be applied under Bank of Spain’s Circular 4/2004 |
F-170
Table of Contents
| Other | Effect on | |||||||||||||||
| Profit and | Comprehensive | Stockholders’ | ||||||||||||||
| Thousands of Euros | Loss | Reserves | Income | Equity | ||||||||||||
| Effect of adopting SFAS 158- | ||||||||||||||||
| Actuarial losses & Prior service cost | — | — | (197,063 | ) | (197,063 | ) | ||||||||||
Total effect of adopting SFAS 158 | — | — | (197,063 | ) | (197,063 | ) | ||||||||||
| Effect of special termination benefits- | ||||||||||||||||
| Reversal of early retirement plans not individually accepted | (97,206 | ) | 412,085 | — | 314,879 | |||||||||||
Total effect of special termination benefits | (97,206 | ) | 412,085 | — | 314,879 | |||||||||||
TOTAL BEFORE TAXES | (97,206 | ) | 412,085 | (197,063 | ) | 117,816 | ||||||||||
| Taxes | 29,162 | (123,626 | ) | 59,119 | (35,345 | ) | ||||||||||
TOTAL AFTER TAXES | (68,044 | ) | 288,460 | (137,944 | ) | 82,471 | ||||||||||
F-171
Table of Contents
| Thousands of Euros | ||||||||||||||||||||||||
| 2007 | 2006 | 2005 | ||||||||||||||||||||||
| Deferred | Deferred | Deferred | Deferred | Deferred | Deferred | |||||||||||||||||||
| Tax | Tax | Tax | Tax | Tax | Tax | |||||||||||||||||||
| Assets | Liabilities | Assets | Liabilities | Assets | Liabilities | |||||||||||||||||||
Tax effect of EU-IFRS (*) to U.S. GAAP reconciliation adjustments: | ||||||||||||||||||||||||
| Premises and equipment | 616,265 | — | 74,735 | — | 77,346 | — | ||||||||||||||||||
| Effect of net unrealized gains on derivative instruments | 269,803 | — | 66,679 | — | — | 138,373 | ||||||||||||||||||
| Loan allowances | — | 84,369 | — | 219,935 | — | 299,162 | ||||||||||||||||||
| Pension Liabilities and other post-employment benefits | (35,345 | ) | — | (36,964 | ) | — | — | — | ||||||||||||||||
| Securitization | — | 114,360 | — | 55,079 | — | (17,743 | ) | |||||||||||||||||
| Other items | — | 71,604 | — | 32,467 | 13,990 | — | ||||||||||||||||||
| Effect on deferred taxes of change in tax rates | (12,985 | ) | (14,503 | ) | (25,488 | ) | (26,886 | ) | — | — | ||||||||||||||
Total | 837,738 | 255,830 | 78,962 | 280,595 | 91,336 | 419,792 | ||||||||||||||||||
| (*) | The EU-IFRS required to be applied under Bank of Spain’s Circular 4/2004 |
| Millions of euros | ||||
Total unrecognized tax benefits at January 1, 2007 | 1,326 | |||
| Net amount of increases for current year’s tax positions | 32 | |||
| Gross amount of increases for prior years’ tax positions | 78 | |||
| Gross amount of decreases for prior years’ tax positions | (6 | ) | ||
| Foreign exchange and acquisitions | 15 | |||
Total unrecognized tax benefits at December 31, 2007 | 1,445 | |||
| Jurisdiction | Tax year | |||
| Spain | 2001-2007 | |||
| United Kingdom | 2003-2007 | |||
| Brazil | 2003-2007 | |||
| Mexico | 2002-2007 | |||
| Chile | 2004-2007 |
F-172
Table of Contents
| Pension | ||||||||||||||||||||
| liabilities | ||||||||||||||||||||
| Net Gains | Unrealized | and other | ||||||||||||||||||
| Foreign | (Losses) on | Gains | post- | Other | ||||||||||||||||
| Currency | Derivative | (Losses) on | employment | Comprehensive | ||||||||||||||||
| Thousands of Euros | Items | Instruments | Securities | benefits | Income (Loss) | |||||||||||||||
Balance as of December 31, 2004 | (7,358,272 | ) | 339,066 | 2,037,390 | — | (4,981,816 | ) | |||||||||||||
| Changes in 2005 | 1,112,333 | (268,660 | ) | (82,458 | ) | — | 761,215 | |||||||||||||
Balance as of December 31, 2005 | (6,245,939 | ) | 70,406 | 1,954,932 | — | (4,220,601 | ) | |||||||||||||
| Changes in 2006 | (501,666 | ) | (21,154 | ) | 208,626 | (214,531 | ) | (528,725 | ) | |||||||||||
Balance as of December 31, 2006 | (6,747,605 | ) | 49,252 | 2,163,558 | (214,531 | ) | (4,749,326 | ) | ||||||||||||
| Changes in 2007 | (1,136,495 | ) | (107,907 | ) | (888,209 | ) | 76,587 | (2,056,024 | ) | |||||||||||
Balance as of December 31, 2007 | (7,884,100 | ) | (58,655 | ) | 1,275,349 | (137,944 | ) | (6,805,350 | ) | |||||||||||
| 2007 | 2006 | 2005 | ||||||||||||||||||||||||||||||||||
| Tax | Tax | Tax | ||||||||||||||||||||||||||||||||||
| Before Tax | expense or | Net of tax | Before Tax | expense or | Net of tax | Before Tax | expense or | Net of tax | ||||||||||||||||||||||||||||
| Thousands of Euros | amount | benefit | amount | amount | benefit | amount | amount | benefit | amount | |||||||||||||||||||||||||||
Foreign currency translation adjustments | (1,136,495 | ) | — | (1,136,495 | ) | (501,666 | ) | — | (501,666 | ) | 1,112,333 | — | 1,112,333 | |||||||||||||||||||||||
Net Gains on Derivatives | (170,539 | ) | 62,632 | (107,907 | ) | 9,087 | (30,241 | ) | (21,154 | ) | (427,569 | ) | 158,909 | (268,660 | ) | |||||||||||||||||||||
Pension liabilities and other post-employment benefits | 109,410 | (32,823 | ) | 76,587 | (306,473 | ) | 91,942 | (214,531 | ) | — | — | — | ||||||||||||||||||||||||
Unrealized gains on securities: | ||||||||||||||||||||||||||||||||||||
| Total holding gains arising during the period | 823,396 | (262,847 | ) | 560,549 | 1,632,809 | (487,179 | ) | 1,145,630 | 1,114,565 | (68,898 | ) | 1,045,667 | ||||||||||||||||||||||||
| Less: reclassification adjustment for gains included in net income | (1,609,127 | ) | 160,369 | (1,448,758 | ) | (1,338,576 | ) | 401,572 | (937,004 | ) | (1,173,555 | ) | 45,430 | (1,128,125 | ) | |||||||||||||||||||||
| Net unrealized gains(losses) | (785,731 | ) | (102,478 | ) | (888,209 | ) | 294,233 | (85,607 | ) | 208,626 | (58,990 | ) | (23,468 | ) | (82,458 | ) | ||||||||||||||||||||
Other Comprehensive Income (Loss) | (1,983,355 | ) | (72,669 | ) | (2,056,024 | ) | (504,819 | ) | (23,906 | ) | (528,725 | ) | 625,774 | 135,441 | 761,215 | |||||||||||||||||||||
F-173
Table of Contents
| 57.4 | Significant presentation differences between the EU-IFRS required to be applied under Bank of Spain’s Circular 4/2004 and U.S. GAAP | |
| In addition to the differences in valuation and income recognition principles disclosed in Note 57.2, other differences relating to the financial statements presentation exist between the EU-IFRS required to be applied under Bank of Spain’s Circular 4/2004 as applied by Spanish banks and U.S. GAAP presentation following the formatting guidelines in Regulation S-X of the Securities and Exchange Commission of the United States. Although these differences do not cause differences between the EU-IFRS required to be applied under Bank of Spain’s Circular 4/2004 and U.S. GAAP reported Net income and/or Stockholders’ Equity, it may be useful to understand them to better interpret the Group’s financial statements presented in accordance with U.S. GAAP. Following is a summary of the significant classification differences that pertain to the basic financial statements. | ||
| Balance Sheet- |
| a. | The captions “Loans and advances to credit institutions”, “Cash and balances with central banks”and “Loans and advances to customers” (see Notes 6 and 10) include securities purchased under agreements to resell to financial institutions and other customers, respectively. Under U.S. GAAP, securities purchased under agreements to resell are presented as a separate item. | ||
| b. | The assets classified under the main category of“Other financial assets at fair value through profit or loss”,are reclassified in the U.S. GAAP balance sheet to financial assets held for trading — Banks, Loans, Debt Securities or Equity Securities, according to their nature, as such designation doesn’t exist. | ||
| c. | The caption “Insurance contracts linked to pensions” is presented netted with pension liabilities in the “Pension Allowance” caption of the U.S. GAAP balance sheet. | ||
| d. | Assets acquired through foreclosure and waiting disposition, net of the related allowances, are included under “Non-current assets held for sale: Tangible assets” in the balance sheet (see Note 12). Under U.S. GAAP, such assets are presented under “Other assets”. | ||
| e. | The “Totalother assets”caption on the asset side of the U.S. GAAP balance sheet includes the followings captions of the EU-IFRS required to be applied under Bank of Spain’s Circular 4/2004 Balance Sheet: “Intangible assets”, “Other assets” and “Prepayments and accrued income”. | ||
| f. | Deposits from credit institutions (see Note 20) and from customers (see Note 21), both including securities sold under agreements to repurchase and other short-term borrowings, are presented as separate items in the balance sheet. Under U.S. GAAP, such funds are presented under “Deposits” classified by nature, except securities sold under agreements to repurchase and other short-term borrowings, which are presented under the caption “Short-term debt”. | ||
| g. | The liability captions “Debt securities” and “Subordinated debt” disclosed in the balance sheet (Notes 22 and 23 respectively) are presented under the caption “Long term debt” under U.S. GAAP, except the item “Promissory Notes” which is included under the “Short term debt” caption. | ||
| h. | The following captions on the liability side of the EU-IFRS required to be applied under Bank of Spain’s Circular 4/2004 balance sheet are presented under the caption “Other liabilities-Others” on the U.S. GAAP balance sheet: “Other liabilities”, “Accrued expenses and Deferred Income” and “Provisions”. | ||
| i. | The caption “Pension allowance” on the U.S. GAAP balance sheet is reported net of the amounts of pension commitments covered by contracts taken out with insurance companies; these amounts are presented on the EU-IFRS required to be applied under Bank of Spain’s Circular 4/2004 balance sheet under the caption “Insurance contracts linked to pensions”. |
| Statement of Income- |
| a. | The breakdown of interest income and interest expense under the EU-IFRS required to be applied under Bank of Spain’s Circular 4/2004 and U.S. GAAP is determined by the classification of the assets and liabilities that generate such income and expenses. However, net interest income in our statement of income includes the interest cost assigned to the pension plan, which are classified as a part of “Salaries and employee benefits” in the U.S. GAAP statement of income. | ||
| b. | Income and expenses of Insurance business in our statement of income is included under the “Insurance activity income” caption, while in the U.S. GAAP statements the revenue is classified under the “Interest Income” or “Non-Interest income” captions and the expenses under the “Interest expense”or “Non-interest Expense” captions. |
F-174
Table of Contents
| c. | Commissions and fees received and paid by the Group are presented as separate items in our statement of income. Under U.S. GAAP, such commissions and fees are presented net and detailed by activity (together with insurance activity, see Note b) above). | ||
| d. | “Gains/losses on financial assets and liabilities (net)” includes gains and losses from investment securities and from derivatives. Under U.S. GAAP, such gains and losses are disclosed separately under “Gains (losses) from investment securities” and “Gains (losses) from foreign exchange, derivatives and other, net”. | ||
| e. | Occupancy and maintenance expenses of premises and equipment are included under the caption “Other general administrative expenses”. Under U.S. GAAP, such expenses are included as a part of “Occupancy expenses of premises, depreciation and maintenance, net”. | ||
| f. | Amortization of intangible assets is included as a part of “Depreciation and amortization”. Under U.S. GAAP, such amortization is included under “Non-interest expense — Amortization of intangible assets”. | ||
| g. | “Impairment losses”and“Provisions (net)”are excluded from the subtotals “Other operating expenses” and “Net operating income”, according to the formats prescribed by the Bank of Spain Circular and the CNMV Circular. Under IFRS and U.S. GAAP, impairment losses and provision expenses are to be recorded as components of the subtotals “Net operating income” and “Other operating expenses”. |
| 57.5 | Consolidated financial statements | |
| Following are the consolidated balance sheets and consolidated statements of income of the Group under the EU-IFRS required to be applied under Bank of Spain’s Circular 4/2004 reformatted to conform to the presentation guidelines for bank holding companies set forth in Regulation S-X of the Securities and Exchange Commission of the United States of America. | ||
| The preparation of these financial statements requires management to make estimates and assumptions that affect the reported amounts and allocations of assets and liabilities and disclosure of contingent assets and liabilities and the reported amounts of revenues and expenses during the reported period. Actual results could differ from those estimates but any differences should not be material. |
F-175
Table of Contents
| Thousands of Euros | ||||||||||||
| 2007 | 2006 | 2005 | ||||||||||
Assets | ||||||||||||
| Cash and due from banks | 25,341,083 | 12,092,021 | 12,778,288 | |||||||||
| Interest earning deposits in other banks | 16,766,716 | 18,744,258 | 21,656,497 | |||||||||
| Securities purchased under agreements to resell | 26,147,541 | 29,553,485 | 30,118,812 | |||||||||
| Trading account assets | 183,629,876 | 185,793,404 | 203,070,126 | |||||||||
Banks | 19,159,632 | 14,813,223 | 12,707,521 | |||||||||
Loans | 31,726,104 | 38,555,526 | 32,911,193 | |||||||||
Derivatives | 46,726,118 | 34,984,291 | 27,629,194 | |||||||||
Debt securities | 73,403,234 | 81,237,212 | 91,441,181 | |||||||||
Equity securities | 12,614,788 | 16,203,152 | 38,381,037 | |||||||||
| Investment securities | 46,017,246 | 39,320,069 | 74,116,142 | |||||||||
Available-for-sale | 46,017,246 | 39,320,069 | 74,116,142 | |||||||||
| Net Loans and leases | 528,318,209 | 483,797,093 | 401,515,964 | |||||||||
Loans and leases, net of unearned income | 537,013,413 | 491,960,537 | 409,125,890 | |||||||||
Less-Allowance for loan losses | (8,695,204 | ) | (8,163,444 | ) | (7,609,926 | ) | ||||||
| Premises and equipment, net | 9,272,962 | 8,941,963 | 8,912,411 | |||||||||
| Investment in affiliated companies | 15,689,127 | 5,006,109 | 3,031,482 | |||||||||
| Other assets | 59,206,661 | 48,019,778 | 51,230,827 | |||||||||
Intangible Assets | 2,202,334 | 2,444,106 | 2,211,026 | |||||||||
Goodwill in consolidation | 13,830,708 | 14,512,735 | 14,018,245 | |||||||||
Accrual Accounts | 1,749,193 | 1,581,843 | 2,969,219 | |||||||||
Hedge derivatives | 3,063,169 | 2,987,964 | 4,126,104 | |||||||||
Others | 38,361,257 | 26,493,130 | 27,906,233 | |||||||||
Total assets | 910,389,421 | 831,268,180 | 806,430,549 | |||||||||
Liabilities | ||||||||||||
| Deposits | 371,573,338 | 353,855,908 | 329,944,371 | |||||||||
Non interest deposits | 4,507,057 | 4,256,369 | 9,159,404 | |||||||||
Interest bearing | 367,066,281 | 349,599,539 | 320,784,967 | |||||||||
Demand deposits | 91,576,243 | 91,633,288 | 82,603,507 | |||||||||
Savings deposits | 90,727,525 | 93,717,633 | 90,471,827 | |||||||||
Time deposits | 184,762,513 | 164,248,618 | 147,709,633 | |||||||||
Certificates of deposit | — | — | — | |||||||||
| Short-term debt | 131,774,426 | 127,819,292 | 151,359,866 | |||||||||
| Long-term debt | 237,120,341 | 199,775,014 | 153,754,673 | |||||||||
| Other liabilities | 112,363,165 | 102,745,664 | 128,744,940 | |||||||||
Taxes Payable | 6,156,365 | 4,539,051 | 3,867,795 | |||||||||
Accounts Payable | 7,656,262 | 6,405,232 | 5,202,654 | |||||||||
Accrual Accounts | 4,050,992 | 2,999,080 | 3,048,733 | |||||||||
Pension Allowance | 9,294,198 | 11,409,770 | 11,496,596 | |||||||||
Stock borrowing liabilities | — | — | — | |||||||||
Derivatives | 52,937,798 | 42,231,967 | 31,538,809 | |||||||||
Liabilities under insurance contracts | 13,033,617 | 10,704,258 | 44,672,300 | |||||||||
Other Provisions | 4,751,151 | 5,212,208 | 5,650,029 | |||||||||
Short securities positions | 5,613,234 | 11,473,062 | 17,415,800 | |||||||||
Others | 8,869,548 | 7,771,036 | 5,852,224 | |||||||||
Total liabilities | 852,831,270 | 784,195,878 | 763,803,850 | |||||||||
| Minority interest | 2,358,269 | 2,220,743 | 2,848,223 | |||||||||
Stockholders’ equity | ||||||||||||
| Capital stock | 3,127,148 | 3,127,148 | 3,127,148 | |||||||||
| Additional paid-in-capital | 20,370,128 | 20,370,128 | 20,370,128 | |||||||||
| Other additional capital | (1,537,999 | ) | (1,442,379 | ) | (1,797,267 | ) | ||||||
| Current year earnings | 9,060,258 | 7,595,947 | 6,220,104 | |||||||||
| Other reserves | 24,180,347 | 15,200,715 | 11,858,363 | |||||||||
| Total stockholders’ equity | 55,199,882 | 44,851,559 | 39,778,476 | |||||||||
Total liabilities and Stockholders’ equity | 910,389,421 | 831,268,180 | 806,430,549 | |||||||||
F-176
Table of Contents
| Thousands of Euros | ||||||||||||
| 2007 | 2006 | 2005 | ||||||||||
Interest income: | ||||||||||||
| Interest and fees on loans and leases | 36,236,456 | 27,368,822 | 26,160,234 | |||||||||
| Interest on deposits in other banks | 3,347,664 | 3,793,418 | 5,189,771 | |||||||||
| Interest on securities purchased under agreements to resell | 2,077,343 | 1,349,838 | 1,123,269 | |||||||||
| Interest on investment securities | 5,050,032 | 5,461,868 | 5,447,303 | |||||||||
| Dividends | 146,648 | 164,606 | 176,319 | |||||||||
Total interest income | 46,858,143 | 38,138,552 | 38,096,896 | |||||||||
Interest expenses: | ||||||||||||
| Interest on deposits | (14,589,567 | ) | (13,110,588 | ) | (13,648,652 | ) | ||||||
| Interest on short-term borrowings | (4,979,889 | ) | (4,483,245 | ) | (4,240,167 | ) | ||||||
| Interest on long-term debt | (10,864,835 | ) | (6,652,185 | ) | (4,389,043 | ) | ||||||
Total interest expense | (30,434,291 | ) | (24,246,018 | ) | (22,277,862 | ) | ||||||
Net interest income | 16,423,852 | 13,892,534 | 15,819,034 | |||||||||
| Provision for credit losses | (3,499,080 | ) | (2,467,297 | ) | (1,615,187 | ) | ||||||
Net interest income after provision for credit losses | 12,924,772 | 11,425,237 | 14,203,847 | |||||||||
Non-interest income: | ||||||||||||
| Commissions and fees from fiduciary activities | 1,984,910 | 1,879,163 | 1,687,764 | |||||||||
| Commissions and fees from securities activities, net | 980,392 | 777,687 | 640,137 | |||||||||
| Fees and commissions from insurance activities | 6,808,699 | 5,836,817 | 4,241,733 | |||||||||
| Other Fees and commissions, net | 3,598,671 | 3,159,440 | 2,808,780 | |||||||||
| Gains (losses) from: | ||||||||||||
| Affiliated companies’ securities | 311,197 | 534,276 | 1,741,850 | |||||||||
| Investment securities | 818,288 | 3,518,449 | 2,531,017 | |||||||||
| Foreign exchange, derivatives and other, net | 1,170,408 | (2,977,281 | ) | 114,565 | ||||||||
| Sale of premises | 1,804,108 | 88,894 | (85,914 | ) | ||||||||
| Other income | 2,547,144 | 3,978,476 | 1,785,422 | |||||||||
Total noninterest income | 20,023,817 | 16,795,921 | 15,465,354 | |||||||||
Non interest expense: | ||||||||||||
| Salaries and employee benefits | (7,379,582 | ) | (7,583,372 | ) | (6,934,961 | ) | ||||||
| Occupancy expense of premises, depreciation and maintenance, net | (1,490,461 | ) | (1,494,886 | ) | (1,413,183 | ) | ||||||
| General and administrative expenses | (3,597,938 | ) | (3,135,511 | ) | (2,950,999 | ) | ||||||
| Impairment of goodwill | (599,989 | ) | 200,006 | 197,822 | ||||||||
| Impairment / amortization of intangible assets | (646,609 | ) | (519,950 | ) | (391,244 | ) | ||||||
| Provisions for specific allowances | (586,437 | ) | (94,352 | ) | (1,029,147 | ) | ||||||
| Payments to Deposit Guarantee Fund | (168,617 | ) | (178,274 | ) | (173,696 | ) | ||||||
| Insurance claims | (5,601,487 | ) | (5,196,701 | ) | (7,785,434 | ) | ||||||
| Other expenses | (1,702,228 | ) | (1,222,732 | ) | (1,527,462 | ) | ||||||
Total non-interest expense | (21,773,348 | ) | (19,225,772 | ) | (22,008,304 | ) | ||||||
Income before income taxes | 11,175,241 | 8,995,386 | 7,660,897 | |||||||||
| Income tax expense | (2,335,686 | ) | (2,254,598 | ) | (1,241,830 | ) | ||||||
Net consolidated income for the year | 8,839,555 | 6,740,788 | 6,419,067 | |||||||||
| Net income attributed to minority interest | (487,614 | ) | (413,145 | ) | (428,663 | ) | ||||||
| Income from discontinued operation, net of taxes | 708,317 | 1,268,304 | 229,700 | |||||||||
NET INCOME ATTRIBUTED TO THE GROUP | 9,060,258 | 7,595,947 | 6,220,104 | |||||||||
F-177
Table of Contents
| Thousands of Euros | ||||||||||||
| 2007 | 2006 | 2005 | ||||||||||
Capital stock | ||||||||||||
| Balance at beginning of the year and year-end | 3,127,148 | 3,127,148 | 3,127,148 | |||||||||
Retained earnings and other reserves | ||||||||||||
| Balance at beginning of the year | 38,853,654 | 33,574,232 | 29,510,230 | |||||||||
| Net income attributable to the Group for the year | 9,060,258 | 7,595,947 | 6,220,104 | |||||||||
| Dividends | (3,456,732 | ) | (2,197,934 | ) | (2,270,810 | ) | ||||||
| Decrease/ (increase) in Treasury stock | 131,184 | (64,106 | ) | 99,853 | ||||||||
| Paid-in capital | — | — | — | |||||||||
| Other variations, net (*) | 6,762,334 | (54,485 | ) | 14,855 | ||||||||
| Balance at year-end | 51,350,698 | 38,853,654 | 33,574,232 | |||||||||
Valuation Adjustments | ||||||||||||
| Balance at beginning of the year | 2,870,757 | 3,077,096 | 1,777,564 | |||||||||
| Net Income Recognized Directly In Equity | (2,148,721 | ) | (206,339 | ) | 1,299,532 | |||||||
| Balance at year-end | 722,036 | 2,870,757 | 3,077,096 | |||||||||
Stockholders’ Equity balance at year-end | 55,199,882 | 44,851,559 | 39,778,476 | |||||||||
| (*) | In 2007, in order to partially finance the takeover bid launched on ABN AMRO, Santander Emisora 150, S.A.U. issued securities mandatorily convertible into newly-issued ordinary shares of the Bank (“Valores Santander") amounting to€7 billion. (See Note 34). |
F-178
Table of Contents
| 2007 | 2006 | 2005 | ||||||||||
| (Thousands of Euros) | ||||||||||||
Assets | ||||||||||||
| Cash and due from banks | 52,548,200 | 40,677,959 | 49,895,502 | |||||||||
| Trading account assets | 51,349,204 | 35,657,947 | 24,060,091 | |||||||||
| Investment securities | 17,074,175 | 10,149,175 | 49,942,815 | |||||||||
| Net Loans and leases | 163,903,007 | 141,139,269 | 107,596,398 | |||||||||
| Investment in affiliated companies | 59,256,377 | 39,339,174 | 34,682,610 | |||||||||
| Premises and equipment, net | 714,212 | 1,503,788 | 1,551,160 | |||||||||
| Other assets | 18,543,369 | 16,208,699 | 13,972,732 | |||||||||
Total assets | 363,388,544 | 284,676,011 | 281,701,308 | |||||||||
Liabilities | ||||||||||||
| Deposits | 173,660,916 | 153,757,709 | 128,071,996 | |||||||||
| Short-term debt | 35,077,018 | 16,823,769 | 54,544,358 | |||||||||
| Long-term debt | 57,005,977 | 43,272,302 | 36,974,185 | |||||||||
| Other liabilities | 59,762,058 | 40,452,656 | 33,089,300 | |||||||||
Total liabilities | 325,505,969 | 254,306,436 | 252,679,839 | |||||||||
Stockholders’ equity | ||||||||||||
| Capital stock | 3,127,148 | 3,127,148 | 3,127,148 | |||||||||
| Retained earnings and other reserves | 34,755,427 | 27,242,427 | 25,894,321 | |||||||||
Total stockholders’ equity | 37,882,575 | 30,369,575 | 29,021,469 | |||||||||
Total liabilities and Stockholders’ equity | 363,388,544 | 284,676,011 | 281,701,308 | |||||||||
| 2007 | 2006 | 2005 | ||||||||||
| (Thousands of Euros) | ||||||||||||
| Interest income | ||||||||||||
| Interest from earning assets | 11,766,647 | 8,380,873 | 8,181,987 | |||||||||
| Dividends from affiliated companies | 2,863,829 | 3,630,403 | 1,900,353 | |||||||||
| 14,630,476 | 12,011,276 | 10,082,340 | ||||||||||
| Interest expense | (10,028,500 | ) | (6,877,205 | ) | (6,852,627 | ) | ||||||
Net interest income | 4,601,976 | 5,134,071 | 3,229,713 | |||||||||
| Provision for credit losses | (288,386 | ) | (506,281 | ) | (126,450 | ) | ||||||
Net interest income after provision for credit losses | 4,313,590 | 4,627,790 | 3,103,263 | |||||||||
| Non-interest income: | 2,996,666 | 1,968,709 | 2,552,860 | |||||||||
| Non interest expense: | (3,231,707 | ) | (3,337,769 | ) | (3,050,492 | ) | ||||||
Income before income taxes | 4,078,549 | 3,258,730 | 2,605,631 | |||||||||
| Income tax expense | (8,302 | ) | (2,540 | ) | (622 | ) | ||||||
Net income | 4,070,247 | 3,256,190 | 2,605,009 | |||||||||
F-179
Table of Contents
| 2007 | 2006 | 2005 | ||||||||||
| (Thousands of Euros) | ||||||||||||
1. Cash flows from operating activities | ||||||||||||
| Consolidated profit | 4,070,247 | 3,256,190 | 2,605,009 | |||||||||
| Adjustments to profit | 173,216 | 1,355,483 | 329,776 | |||||||||
| Net increase/decrease in operating assets | 49,949,432 | 79,815 | 67,998,773 | |||||||||
| Net increase/decrease in operating liabilities | 56,657,110 | (4,701,176 | ) | 63,697,055 | ||||||||
Total net cash flows from operating activities (1) | 10,951,141 | (169,318 | ) | (1,366,933 | ) | |||||||
2. Cash flows from investing activities | ||||||||||||
| Investments (-) | (22,068,312 | ) | (5,334,303 | ) | (1,517,614 | ) | ||||||
| Divestments (+) | 3,438,201 | 743,157 | 1,595,409 | |||||||||
Total net cash flows from investment activities (2) | (18,630,111 | ) | (4,591,146 | ) | 77,795 | |||||||
3. Cash flows from financing activities | ||||||||||||
| Disposal of own equity instruments | 21,640 | — | — | |||||||||
| Acquisition of own equity instruments | — | (21,640 | ) | — | ||||||||
| Issuance of debt securities | 18,813,221 | 11,613,661 | 7,838,230 | |||||||||
| Redemption of debt securities | (5,180,727 | ) | (4,357,781 | ) | (3,230,710 | ) | ||||||
| Dividends paid | (3,456,731 | ) | (2,779,334 | ) | (2,208,517 | ) | ||||||
| Issuance/Redemption of equity instruments | 7,060,549 | 19,085 | (301,034 | ) | ||||||||
Total net cash flows from financing activities (3) | 17,257,952 | 4,473,991 | 2,097,969 | |||||||||
4. Effect of exchange rate changes on cash and cash equivalents (4) | 445,695 | (88,802 | ) | 75,827 | ||||||||
5. Net increase/decrease in cash and cash equivalents (1+2+3+4) | 10,024,677 | (375,277 | ) | 884,658 | ||||||||
| Cash and cash equivalents at beginning of period | 2,281,877 | 2,657,154 | 1,772,496 | |||||||||
| Cash and cash equivalents at end of period | 12,306,554 | 2,281,877 | 2,657,154 | |||||||||
F-180
Table of Contents
| 57.6 | Preference Shares and Preferred Securities |
| 2007 | 2006 | 2005 | ||||||||||
| (Thousands of Euros) | ||||||||||||
| Preference shares | 522,558 | 668,328 | 1,308,847 | |||||||||
| Preferred securities | 7,261,382 | 6,836,570 | 6,772,768 | |||||||||
Total at year-end | 7,783,940 | 7,504,898 | 8,081,615 | |||||||||
F-181
Table of Contents
| Outstanding at December 31, 2007 | ||||||||||||
| Amount in | ||||||||||||
| Preference Shares | currency | |||||||||||
| Issuer/Date of issue | Currency | (million) | Interest rate | Redemption Option (3) | ||||||||
Banesto Holding, Ltd, (1) December 1992 | US Dollar | 77.3 | 10.50 | % | June 30, 2012 | |||||||
Abbey National Plc (2), October 1995 | Pounds Sterling | 100 | 10,375 | % | No option | |||||||
Abbey National Plc (2), February 1996 | Pounds Sterling | 100 | 10,375 | % | No option | |||||||
Abbey National Plc (2), June 1997 | Pounds Sterling | 125 | 8,625 | % | No option | |||||||
| Outstanding at December 31, 2007 | ||||||||||
| Amount in | ||||||||||
| Preferred Securities | currency | |||||||||
| Issuer/Date of issue | Currency | (million) | Interest rate | Maturity date | ||||||
Banesto Group | ||||||||||
| Banesto Preferentes, S.A. (1) December 2003 | Euro | 131.14 | Euribor (3M) + 0.2% | Perpetuity | ||||||
| Banco Español de Credito (2), October 2004 | Euro | 125 | €CMS 10 + 0.125% | Perpetuity | ||||||
| Banco Español de Crédito (2), November 2004 | Euro | 200 | 5.5% | Perpetuity | ||||||
Santander Finance Capital, S.A. (Unipersonal) (1) | ||||||||||
| October 2003 | Euro | 450 | Euribor (3M) + 0.1% | Perpetuity | ||||||
| February 2004 | Euro | 400 | Euribor (3M) + 0.1% | Perpetuity | ||||||
| July 2004 | Euro | 750 | Euribor (3M) + 0.1% | Perpetuity | ||||||
| September 2004 | Euro | 680 | Euribor (3M) + 0.1% | Perpetuity | ||||||
| April 2005 | Euro | 1,000 | Euribor (3M) + 0.1% | Perpetuity | ||||||
Santander Finance Preferred, S.A. (Unipersonal) (1) | ||||||||||
| March 2004 | US Dollar | 190 | 6.41% | Perpetuity | ||||||
| September 2004 | Euro | 300 | €CMS 10 +0.05% | Perpetuity | ||||||
| subject to a | ||||||||||
| maximum | ||||||||||
| distribution of 8% | ||||||||||
| per annum | ||||||||||
| October 2004 | Euro | 200 | 5.75% | Perpetuity | ||||||
| November 2006 | Euro | 500 | 6.80% | Perpetuity | ||||||
| January 2007 | US Dollar | 600 | 6.50% | Perpetuity | ||||||
| March 2007 | US Dollar | 350 | US3M + 0.52% | Perpetuity | ||||||
| July 2007 | Pounds Sterling | 250 | 7.01% | Perpetuity | ||||||
Abbey Group | ||||||||||
| Abbey National Capital Trust I (1), February 2000 | US Dollar | 1,000 | Fixed to 8.963% | Perpetuity | ||||||
| until June 30, | ||||||||||
| 2030, and from this | ||||||||||
| date, 2.825% + | ||||||||||
| Libor USD (3M) | ||||||||||
| Abbey National Plc (1), February 2001(4) | Pounds Sterling | 300 | 7.037% | Perpetuity | ||||||
| Abbey National Plc (1), August 2002 | Pounds Sterling | 175 | Fixed to 6.984% | Perpetuity | ||||||
| until February 9, | ||||||||||
| 2018, and | ||||||||||
| thereafter, at a | ||||||||||
| rate reset | ||||||||||
| semi-annually of | ||||||||||
| 1.86% per annum + | ||||||||||
| Libor GBP (6M) | ||||||||||
Santander PR Capital Trust I | ||||||||||
| February 2006 | US Dollar | 125 | 6.750% | July 2036 | ||||||
| (1) | Under U.S. GAAP, these entities have been designated “Variable Interest Entities” (VIEs) and they are not consolidated. Therefore, their issues have been excluded from the consolidated financial statements of the Group. Since that time the Group recognized the subordinated deposits related to these issues and their interests. Refer to Note 57.2 and 57.3 for more information. | |
| (2) | See notes 57.2 and 57.3 for more information. | |
| (3) | From these date the issuer can redeem the shares, subject to prior authorization by the national supervisor. | |
| (4) | From February 14, 2026, this issue will bear interest at a rate, reset every five years, of 3.75% per annum above the gross redemption yield on a five-year specified United Kingdom government security. |
F-182
Table of Contents
| • | Santander Finance Preferred, S.A. (Unipersonal) is 100% owned finance subsidiary of Banco Santander, S.A. who fully and unconditionally guarantees the preferred securities (Series 1, 4, 5 and 6 are listed in the United States). No other subsidiary of the Bank guarantees such securities. | ||
| • | Santander Finance Capital, S.A. (Unipersonal) is 100% owned finance subsidiary of Banco Santander, S.A. that fully and unconditionally guarantees the preferred securities (not listed in United States). No other subsidiary of the Bank guarantees such securities. |
| Thousands of Euros | ||||||||||||
| 2007 | 2006 | 2005 | ||||||||||
Assets: | ||||||||||||
| Cash | 43,480 | 35,066 | 20,077 | |||||||||
| Loans, credits and other assets | 21,664 | 34,504 | 47,268 | |||||||||
| Deposits with Parent Bank | 3,214,769 | 3,214,769 | 3,214,769 | |||||||||
| Accrual accounts | 25,901 | 19,967 | 15,099 | |||||||||
Total Assets | 3,305,814 | 3,304,306 | 3,297,213 | |||||||||
Liabilities and stockholders’ equity: | ||||||||||||
| LIABILITIES: | ||||||||||||
| Public entities | 1,436 | 21 | 571 | |||||||||
| Accrual accounts | 24,037 | 23,965 | 13,205 | |||||||||
| Non-commercial debts | — | 34 | 3,237 | |||||||||
| Commercial debts | 37 | — | — | |||||||||
| Debts with Group companies | 30 | 64 | 5 | |||||||||
| Provisions for taxes | — | — | 12 | |||||||||
| Preferred securities | 3,280,000 | 3,280,000 | 3,280,000 | |||||||||
Total Liabilities | 3,305,540 | 3,304,084 | 3,297,030 | |||||||||
| STOCKHOLDERS’ EQUITY: | ||||||||||||
| Capital stock | 151 | 151 | 151 | |||||||||
| Retained earnings | 71 | 32 | (99 | ) | ||||||||
| Net income | 52 | 39 | 131 | |||||||||
Total Stockholders’ Equity | 274 | 222 | 183 | |||||||||
Total Liabilities and Stockholders’ Equity | 3,305,814 | 3,304,306 | 3,297,213 | |||||||||
F-183
Table of Contents
| Thousands of Euros | ||||||||||||
| 2007 | 2006 | 2005 | ||||||||||
| Interest income | 151,399 | 113,237 | 86,299 | |||||||||
| Interest expenses | (138,448 | ) | (100,320 | ) | (74,425 | ) | ||||||
| Operating expenses | (12,874 | ) | (12,857 | ) | (11,731 | ) | ||||||
| Corporate income tax | (25 | ) | (21 | ) | (12 | ) | ||||||
Net income / (loss) | 52 | 39 | 131 | |||||||||
| Total | ||||||||||||||||||||
| Capital stock | Retained | Stockholders’ | ||||||||||||||||||
| Changes in Stockholders’ | Common | Earnings | Net income | Equity | ||||||||||||||||
| Equity | Shares | Thousands of Euros | ||||||||||||||||||
| Balance at January 1, 2006 | 1,505 | 151 | (99 | ) | 131 | 183 | ||||||||||||||
| 2005 Income allocation | — | — | 131 | (131 | ) | — | ||||||||||||||
| Net income 2006 | — | — | — | 39 | 39 | |||||||||||||||
| Balance at December 31, 2006 | 1,505 | 151 | 32 | 39 | 222 | |||||||||||||||
| 2006 Income allocation | — | — | 39 | (39 | ) | — | ||||||||||||||
| Net income 2007 | — | — | 52 | 52 | ||||||||||||||||
| Balance at December 31, 2007 | 1,505 | 151 | 71 | 52 | 274 | |||||||||||||||
| Thousands of | ||||||||
| Issue Date | Euros | |||||||
| Serie I | 10/3/2003 | 450,000 | ||||||
| Serie II | 02/18/2004 | 400,000 | ||||||
| Serie III | 07/30/2004 | 750,000 | ||||||
| Serie IV | 09/30/2004 | 680,000 | ||||||
| Serie V | 04/12/2005 | 1,000,000 | ||||||
Total | 3,280,000 | |||||||
| • | On October 3, 2003, Santander Finance Capital, S.A. (Unipersonal) issued 18,000,000 preference securities, at€25 par value. | ||
| • | On February 18, 2004, Santander Finance Capital, S.A. (Unipersonal) issued 16,000,000 preference securities, at€25 par value. | ||
| • | On July 30, 2004, Santander Finance Capital, S.A. (Unipersonal) issued 30,000,000 preference securities, at€25 par value. | ||
| • | On September 30, 2004, Santander Finance Capital, S.A. (Unipersonal) issued 27,200,000 preference securities, at€25 par value. | ||
| • | On April 12, 2005, Santander Finance Capital, S.A. (Unipersonal) issued 40,000,000 preference securities, at€25 par value. | ||
| • | These issues are perpetual and can be redeemable at the option of the issuer, subject to the consent of the Bank of Spain, in whole or in part, at any time after five years from the issue date. | ||
| • | All the issues of Santander Finance Capital, S.A. (Unipersonal) are guaranteed by Banco Santander, S.A. |
F-184
Table of Contents
| Thousands of Euros | |||||||||||||||
| 2007 | 2006 | 2005 | |||||||||||||
Assets: | |||||||||||||||
| Cash | 11,416 | 6,399 | 3,761 | ||||||||||||
| Deposits with Parent Bank | 1,927,344 | 1,003,976 | 648,718 | ||||||||||||
| Other assets | 17,826 | 13,583 | 8,376 | ||||||||||||
| Accrual accounts | 27,865 | 9,681 | 6,123 | ||||||||||||
Total Assets | 1,984,451 | 1,033,639 | 666,978 | ||||||||||||
Liabilities and stockholders’ equity: | |||||||||||||||
| LIABILITIES: | |||||||||||||||
| Public entities | 186 | 57 | 65 | ||||||||||||
| Accrual accounts | 26,097 | 8,883 | 5,646 | ||||||||||||
| Commercial debts | 8 | — | — | ||||||||||||
| Non-commercial debts | 101 | 30 | 45 | ||||||||||||
| Deferred income | 2,877 | 580 | — | ||||||||||||
| Debts with group companies | 4 | 4 | — | ||||||||||||
| Provisions for taxes | — | — | 4 | ||||||||||||
| Preferred securities | 1,954,956 | 1,023,918 | 661,058 | ||||||||||||
Total Liabilities | 1,984,229 | 1,033,472 | 666,818 | ||||||||||||
| STOCKHOLDERS’ EQUITY: | |||||||||||||||
| Capital stock | 151 | 151 | 151 | ||||||||||||
| Retained earnings | 16 | 9 | 3 | ||||||||||||
| Net income | 55 | 7 | 6 | ||||||||||||
Total Stockholders’ Equity | 222 | 167 | 160 | ||||||||||||
Total Liabilities and Stockholders’ Equity | 1,984,451 | 1,033,639 | 666,978 | ||||||||||||
| Thousands of Euros | ||||||||||||
| 2007 | 2006 | 2005 | ||||||||||
| Interest income | 116,498 | 38,335 | 35,345 | |||||||||
| Interest expenses and similar expenses | (115,856 | ) | (38,231 | ) | (35,167 | ) | ||||||
| Operating expenses | (561 | ) | (93 | ) | (168 | ) | ||||||
| Corporate income tax | (26 | ) | (4 | ) | (4 | ) | ||||||
Net income / (loss) | 55 | 7 | 6 | |||||||||
F-185
Table of Contents
| Total | ||||||||||||||||||||
| Capital stock | Retained | Stockholders’ | ||||||||||||||||||
| Changes in Stockholders’ | Common | Earnings | Net income | Equity | ||||||||||||||||
| Equity | Shares | Thousands of Euros | ||||||||||||||||||
| Balance at January 1, 2006 | 1,505 | 151 | 3 | 6 | 160 | |||||||||||||||
| 2005 Income allocation | — | — | 6 | (6 | ) | — | ||||||||||||||
| Net income 2006 | — | — | — | 7 | 7 | |||||||||||||||
| Balance at December 31, 2006 | 1,505 | 151 | 9 | 7 | 167 | |||||||||||||||
| 2006 Income allocation | — | — | 7 | (7 | ) | — | ||||||||||||||
| Net income 2007 | — | — | — | 55 | 55 | |||||||||||||||
| Balance at December 31, 2007 | 1,505 | 151 | 16 | 55 | 222 | |||||||||||||||
| Thousands of | ||||||||
| Issue Date | Euros at 12/31/07 | |||||||
| Series 1- $190,000 | 03/11/2004 | 129,067 | ||||||
Series 2-€300,000 | 09/30/2004 | 300,000 | ||||||
Series 3-€200,000 | 10/08/2004 | 200,000 | ||||||
| Series 4- $500,000 | 11/21/2006 | 339,651 | ||||||
| Series 5- $600,000 | 31/01/2007 | 407,581 | ||||||
| Series 6- $350,000 | 05/03/2007 | 237,756 | ||||||
| Series 7- £250,000 | 10/07/2007 | 340,901 | ||||||
| 1,954,956 | ||||||||
| • | On March 11, 2004, Santander Finance Preferred, S.A. (Unipersonal) issued 7,600,000 preferred securities, at $25 par value. | ||
| • | On September 30, 2004, Santander Finance Preferred, S.A. (Unipersonal) issued 300,000 preferred securities, at€1,000 par value. | ||
| • | On October 8, 2004, Santander Finance Preferred, S.A. (Unipersonal) issued 200,000 preferred securities, at€1,000 par value. | ||
| • | On November 21, 2006 Santander Finance Preferred, S.A. (Unipersonal) issued 20,000,000 preferred securities, at€25,000 par value. | ||
| • | On January 31, 2007 Santander Finance Preferred, S.A. (Unipersonal) issued 24,000,000 preferred securities, at $25,000 par value. | ||
| • | On March 5, 2007 Santander Finance Preferred, S.A. (Unipersonal) issued 14,000,000 preferred securities, at $25,000 par value. | ||
| • | On July 10, 2007 Santander Finance Preferred, S.A. (Unipersonal) issued 5,000,000 preferred securities, at £50,000 par value. | ||
| • | These issues are perpetual and can be redeemable at the option of the issuer, subject to the consent of the Bank of Spain, in whole or in part, at any time after five years from the issue date. | ||
| • | All the issues of Santander Finance Preferred, S.A. (Unipersonal) are guaranteed by Banco Santander, S.A. |
F-186
Table of Contents
| 57.7 | Business combinations: Goodwill and Other assets and liabilities |
| U.S. GAAP | EU-IFRS (*) | Difference | ||||||||||
| Purchase/merger of/with Banco Central Hispano | 1,983,009 | — | 1,983,009 | |||||||||
| Acquisition of Banesto | 2,023,924 | 372,655 | 1,651,269 | |||||||||
| Purchase of Abbey | 7,311,949 | 8,167,868 | (855,919 | ) | ||||||||
| Others | 5,626,858 | 5,290,185 | 336,673 | |||||||||
Total | 16,945,740 | 13,830,708 | 3,115,032 | |||||||||
Of which: | ||||||||||||
Goodwill | 16,428,757 | 13,830,708 | 2,598,049 | |||||||||
Other assets and liabilities arisen in the business combinations reconciling adjustments to U.S. GAAP | 516,983 | — | 516,983 | |||||||||
| (*) | The EU-IFRS required to be applied under Bank of Spain’s Circular 4/2004 |
F-187
Table of Contents
| Thousands of Euros | U.S. GAAP | EU-IFRS (*) | Difference | |||||||||
2004 Year end balance | 15,973,862 | 15,090,541 | 883,321 | |||||||||
| Acquisitions & sales | 60,094 | 60,113 | (19 | ) | ||||||||
| Reclassifications | 218,109 | (1,856,227 | ) | 2,074,336 | ||||||||
| Exchange differences | 613,684 | 723,818 | (110,134 | ) | ||||||||
2005 Year end balance | 16,865,749 | 14,018,245 | 2,847,504 | |||||||||
| Acquisitions & sales | 392,186 | 574,166 | (181,981 | ) | ||||||||
| Exchange differences | (125,228 | ) | (66,865 | ) | (58,363 | ) | ||||||
| Impairment | (12,811 | ) | (12,811 | ) | — | |||||||
2006 Year end balance | 17,119,896 | 14,512,735 | 2,607,161 | |||||||||
| Acquisitions & sales | 133,779 | 195,857 | (62,078 | ) | ||||||||
| Exchange differences | (810,434 | ) | (863,400 | ) | 52,966 | |||||||
| Impairment | (14,484 | ) | (14,484 | ) | — | |||||||
2007 Year end balance | 16,428,757 | 13,830,708 | 2,598,049 | |||||||||
| (*) | The EU-IFRS required to be applied under Bank of Spain’s Circular 4/2004 |
| Additions & | Definitive | |||||||||||||||||||||||
| Sales, net | assessment | |||||||||||||||||||||||
| Estimated | December 31, | of exchange | of | Amortization | December 31, | |||||||||||||||||||
| Thousands of Euros | Useful Life | 2004 | differences | acquisitions | & Impairments | 2005 | ||||||||||||||||||
With indefinite useful life: | ||||||||||||||||||||||||
| Brand name (Abbey) | 566,000 | — | (106,320 | ) | — | 459,680 | ||||||||||||||||||
With finite useful life: | ||||||||||||||||||||||||
| Customer deposits (Abbey) | 10 years | 1,451,000 | — | (193,157 | ) | — | 1,257,843 | |||||||||||||||||
| Credit cards (Abbey) | 5 years | 33,000 | — | 2,021 | — | 35,021 | ||||||||||||||||||
| Distribution channels (Abbey) | 25,692 | — | (25,692 | ) | — | — | ||||||||||||||||||
| IT developments | 3 years | 815,949 | 391,657 | — | — | 1,207,606 | ||||||||||||||||||
| Other assets | 77,724 | (19,564 | ) | 105,039 | — | 163,199 | ||||||||||||||||||
| Accumulated amortization | (394,132 | ) | 88,639 | — | (398,852 | ) | (704,345 | ) | ||||||||||||||||
| Impairment losses | (67,921 | ) | (9,080 | ) | — | (130,977 | ) | (207,978 | ) | |||||||||||||||
Subtotal | 2,507,312 | 451,652 | (218,109 | ) | (529,829 | ) | 2,211,026 | |||||||||||||||||
| Present value of future profits (Abbey) | 642,308 | 18,511 | 569,520 | — | 1,230,339 | |||||||||||||||||||
Total | 3,149,620 | 470,163 | 351,411 | (529,829 | ) | 3,441,365 | ||||||||||||||||||
F-188
Table of Contents
| Additions & | ||||||||||||||||||||||||
| Sales, net of | ||||||||||||||||||||||||
| Estimated | December 31, | exchange | Amortization & | Impairments | December 31, | |||||||||||||||||||
| Thousands of Euros | Useful Life | 2005 | differences | Impairments | Applications | 2006 | ||||||||||||||||||
| �� | ||||||||||||||||||||||||
With indefinite useful life: | ||||||||||||||||||||||||
| Brand name (Abbey) | 459,680 | 9,419 | — | — | 469,099 | |||||||||||||||||||
| Other brand names | — | 18,078 | — | — | 18,078 | |||||||||||||||||||
With finite useful life: | ||||||||||||||||||||||||
| Customer deposits (Abbey) | 10 years | 1,257,843 | 25,850 | — | — | 1,283,693 | ||||||||||||||||||
| Credit cards (Abbey) | 5 years | 35,021 | 720 | — | — | 35,741 | ||||||||||||||||||
| IT developments | 3 years | 1,207,606 | 295,371 | — | (193,299 | ) | 1,309,678 | |||||||||||||||||
| Other assets | 163,199 | 159,827 | — | — | 323,026 | |||||||||||||||||||
| Accumulated amortization | (704,345 | ) | 243,768 | (519,953 | ) | — | (980,530 | ) | ||||||||||||||||
| Impairment losses | (207,978 | ) | — | — | 193,299 | (14,679 | ) | |||||||||||||||||
Subtotal | 2,211,026 | 753,033 | (519,953 | ) | — | 2,444,106 | ||||||||||||||||||
| Present value of future profits (Abbey) | 1,230,339 | (1,230,339 | ) | — | — | — | ||||||||||||||||||
Total | 3,441,365 | (477,306 | ) | (519,953 | ) | — | 2,444,106 | |||||||||||||||||
| Additions & | ||||||||||||||||||||||||
| Sales, net of | Impairments & | |||||||||||||||||||||||
| Estimated | December 31, | exchange | Amortization & | Amortization | December 31, | |||||||||||||||||||
| Thousands of Euros | Useful Life | 2006 | differences | Impairments | Applications | 2007 | ||||||||||||||||||
With indefinite useful life: | ||||||||||||||||||||||||
| Brand name (Abbey) | 469,099 | (39,563 | ) | — | — | 429,536 | ||||||||||||||||||
| Other brand names | 18,078 | (1,439 | ) | — | — | 16,639 | ||||||||||||||||||
With finite useful life: | ||||||||||||||||||||||||
| Customer deposits (Abbey) | 10 years | 1,283,693 | (108,265 | ) | — | — | 1,175,428 | |||||||||||||||||
| Credit cards (Abbey) | 5 years | 35,741 | (3,014 | ) | — | — | 32,727 | |||||||||||||||||
| IT developments | 3 years | 1,309,678 | 657,592 | — | (392,301 | ) | 1,574,969 | |||||||||||||||||
| Other assets | 323,026 | 465,913 | — | (555,587 | ) | 233,352 | ||||||||||||||||||
| Accumulated amortization | (980,530 | ) | — | (646,609 | ) | 392,301 | (1,234,838 | ) | ||||||||||||||||
| Impairment losses | (14,679 | ) | (3,504 | ) | (562,883 | ) | 555,587 | (25,479 | ) | |||||||||||||||
Total | 2,444,106 | 967,720 | (1,209,492 | ) | — | 2,202,334 | ||||||||||||||||||
| • | The acquisition price: The purchase was made through the exchange of shares. To accomplish it the Bank issued 1,485,893,636 new ordinary shares. Under previous Spanish GAAP the value of the each of the shares issued was€8.44 (the quotation on October 20, 2004), while under U.S. GAAP the value was€8.03 (the quotation in days around the announcement of the offer, mid July), the difference amounting€609,216 thousand. | ||
| • | Differences arising from EU-IFRS required to be applied under Bank of Spain’s Circular 4/2004 reconciliation to U.S. GAAP. |
F-189
Table of Contents
| Initial | Final | Estimated | ||||||||||||||
| (Thousands of Euros) | calculation (*) | Differences | calculation (*) | useful life | ||||||||||||
| Trademarks & trade names | 566,000 | (116,385 | ) | 449,615 | Indefinite | |||||||||||
| Core deposits | 1,451,000 | (220,626 | ) | 1,230,374 | 10 years | |||||||||||
| Credit card relationship | 33,000 | 1,256 | 34,256 | 5 years | ||||||||||||
| Distribution channels | 25,692 | (25,692 | ) | — | ||||||||||||
| Deferred tax liability | (717,500 | ) | 717,500 | — | ||||||||||||
Total Intangible assets: | 1,358,192 | 356,053 | 1,714,245 | |||||||||||||
| (*) | Amounts valued at acquisition exchange rate |
F-190
Table of Contents
| 57.8 | Earnings per Share |
| Millions of Euros, except per share data | ||||||||||||||||||||||||
| EU-IFRS (*) | U.S.GAAP | |||||||||||||||||||||||
| 2007 | 2006 | 2005 | 2007 | 2006 | 2005 | |||||||||||||||||||
NUMERATOR FOR BASIC AND DILUTED CALCULATION: | ||||||||||||||||||||||||
| Net income from continuing operations attributable to the Group | 8,352 | 6,328 | 5,990 | 6,725 | 6,305 | 6,089 | ||||||||||||||||||
| Net income from discontinued operations attributable to the Group | 708 | 1,268 | 230 | 572 | 1,109 | 230 | ||||||||||||||||||
Net income available to common stockholders for basic EPS | 9,060 | 7,596 | 6,220 | 7,297 | 7,415 | 6,318 | ||||||||||||||||||
| Effect of dilutive securities | — | — | — | — | — | — | ||||||||||||||||||
Net income available to common stockholders for diluted EPS | 9,060 | 7,596 | 6,220 | 7,297 | 7,415 | 6,318 | ||||||||||||||||||
DENOMINATOR FOR BASIC AND DILUTED CALCULATION: | ||||||||||||||||||||||||
Basic calculation weighted-average shares(**) | 6,342 | 6,248 | 6,241 | 6,342 | 6,248 | 6,241 | ||||||||||||||||||
| Effect of dilutive securities: | ||||||||||||||||||||||||
| Stock options plans | 66 | 34 | 23 | 66 | 34 | 23 | ||||||||||||||||||
Weighted-average shares for diluted calculation | 6,408 | 6,282 | 6,264 | 6,408 | 6,282 | 6,264 | ||||||||||||||||||
EARNINGS PER SHARE RATIOS: | ||||||||||||||||||||||||
Basic earnings per share | ||||||||||||||||||||||||
| Income from continuing operations | 1.317 | 1.013 | 0.960 | 1.060 | 1.009 | 0.976 | ||||||||||||||||||
| Income from discontinued operations | 0.112 | 0.203 | 0.037 | 0.090 | 0.178 | 0.037 | ||||||||||||||||||
Net income | 1.429 | 1.216 | 0.997 | 1.151 | 1.187 | 1.012 | ||||||||||||||||||
Diluted earnings per share | ||||||||||||||||||||||||
| Income from continuing operations | 1.303 | 1.007 | 0.956 | 1.049 | 1.004 | 0.972 | ||||||||||||||||||
| Income from discontinued operations | 0.111 | 0.202 | 0.037 | 0.089 | 0.177 | 0.037 | ||||||||||||||||||
Net income | 1.414 | 1.209 | 0.993 | 1.139 | 1.180 | 1.009 | ||||||||||||||||||
| (*) | The EU-IFRS required to be applied under Bank of Spain’s Circular 4/2004 | |
| (**) | Assumed conversion of convertible debt “Valores Santander” (see Note 34). |
F-191
Table of Contents
| 58. | Additional information required by U.S. GAAP |
| 58.1 | Securitization |
| EU-IFRS (*) | U.S. GAAP | |||||||||||||||||||||||
| Thousands of Euros | 2007 | 2006 | 2005 | 2007 | 2006 | 2005 | ||||||||||||||||||
Accounted for as a sale | 3,742,020 | 4,901,712 | 6,065,484 | 3,742,020 | 27,467,108 | 27,533,454 | ||||||||||||||||||
Mortgage loans | 2,478,869 | 2,980,911 | 2,897,250 | 2,478,869 | 25,546,307 | 24,365,220 | ||||||||||||||||||
Of which Abbey | — | — | — | — | 22,565,396 | 21,467,970 | ||||||||||||||||||
Other securitized assets | 1,263,151 | 1,920,801 | 3,168,234 | 1,263,151 | 1,920,801 | 3,168,234 | ||||||||||||||||||
Continued recognition of the assets | 92,022,693 | 59,425,910 | 46,523,076 | 92,022,693 | 36,860,514 | 25,055,106 | ||||||||||||||||||
Mortgage loans | 60,055,842 | 36,363,009 | 33,085,261 | 60,055,842 | 13,797,613 | 11,617,291 | ||||||||||||||||||
Of which Abbey | 40,216,503 | 22,565,396 | 21,467,970 | 40,216,503 | — | — | ||||||||||||||||||
Other securitized assets | 31,966,851 | 23,062,901 | 13,437,815 | 31,966,851 | 23,062,901 | 13,437,815 | ||||||||||||||||||
TOTAL | 95,764,713 | 64,327,622 | 52,588,560 | 95,764,713 | 64,327,622 | 52,588,560 | ||||||||||||||||||
| (*) | The EU-IFRS required to be applied under Bank of Spain’s Circular 4/2004 |
F-192
Table of Contents
F-193
Table of Contents
| Closing date of | Gross assets | Non- recourse | ||||||||||
| Securitization company | Securitization | securitized | finance | |||||||||
| Millions of Euros | ||||||||||||
| Holmes Financing (No.1) plc | July 26, 2000 | 375 | 375 | |||||||||
| Holmes Financing (No.6) plc | November 7, 2002 | 745 | 840 | |||||||||
| Holmes Financing (No.7) plc | March 26, 2003 | 897 | 897 | |||||||||
| Holmes Financing (No. 8) plc | April 1, 2004 | 2,731 | 2,731 | |||||||||
| Holmes Financing (No. 9) plc | December 8, 2005 | 3,789 | 3,789 | |||||||||
| Holmes Financing (No. 10) plc | August 8, 2006 | 4,364 | 4,364 | |||||||||
| Holmes Master Issuer plc - 2006/1 | November 28, 2006 | 3,570 | 3,570 | |||||||||
| Holmes Master Issuer plc - 2007/1 | March 28, 2007 | 5,865 | 7,734 | |||||||||
| Holmes Master Issuer plc - 2007/2 | June 20, 2007 | 7,984 | 7,984 | |||||||||
| Holmes Master Issuer plc - 2007/3 | December 21, 2007 | 9,898 | 9,898 | |||||||||
| Beneficial interest in Holmes Trustees Limited | 10,846 | — | ||||||||||
| 51,064 | 42,182 | |||||||||||
| • | Financial assets transferred to it that are passive in nature (loans) | ||
| • | Passive derivative financial instruments that pertain to beneficial interests (other than another derivative financial instrument) issued or sold to parties other than the transferor, its affiliates, or its agents. | ||
| • | Financial assets (for example, guarantees or rights to collateral) that would reimburse it if others were to fail to adequately service financial assets transferred to it or to timely pay obligations due to it and that it entered into when it was established, when assets were transferred to it, or when beneficial interests (other than derivative financial instruments) were issued by the SPE. All the guarantees relating to the transferred loans are transferred to the securitization funds. | ||
| • | Servicing rights related to financial assets that it holds. | ||
| • | Temporarily, non-financial assets obtained in connection with the collection of financial assets that it holds. | ||
| • | Cash collected from assets that it holds and investments purchased with that cash pending distribution to holders of beneficial interests that are appropriate for that purpose (that is, money-market or other relatively risk-free instruments without options and with maturities no later than the expected distribution date). |
F-194
Table of Contents
| 58.2 | Allowance For Credit Losses |
| Thousands of Euros | ||||||||||||
| 2007 | 2006 | 2005 | ||||||||||
| Impaired loans requiring no reserve | 1,260,497 | 766,255 | 974,418 | |||||||||
| Impaired loans requiring valuation allowance | 4,850,557 | 3,865,005 | 3,407,355 | |||||||||
| Total impaired loans | 6,111,054 | 4,631,260 | 4,381,773 | |||||||||
| Valuation allowance on impaired loans | 3,240,398 | 2,922,495 | 3,130,929 | |||||||||
| Year ended December 31, | ||||||||||||
| 2007 | 2006 | 2005 | ||||||||||
| (Thousands of Euros) | ||||||||||||
Interest owed on non-accruing assets | ||||||||||||
| Domestic | 80,133 | 49,537 | 38,751 | |||||||||
| International | 291,987 | 218,216 | 273,834 | |||||||||
| Total | 372,120 | 267,753 | 312,585 | |||||||||
Interest received on non-accruing assets | ||||||||||||
| Domestic | 81,233 | 86,370 | 79,183 | |||||||||
| International | 110,015 | 70,435 | 77,602 | |||||||||
| Total | 191,248 | 156,805 | 156,785 | |||||||||
F-195
Table of Contents
| 58.3 | Investment Securities | |
| The following table shows a disclosure of the amortized cost, gross unrealized gains and losses, and fair value of available-for-sale fixed maturity securities and equity securities for 2007, 2006 and 2005: | ||
INVESTMENT SECURITIES |
| December 31, 2007 | December 31, 2006 | December 31, 2005 | ||||||||||||||||||||||||||||||||||||||||||||||
| Gross | Gross | Gross | Gross | Gross | Gross | |||||||||||||||||||||||||||||||||||||||||||
| (U.S. GAAP presentation) | Amortized | unrealized | unrealized | Fair | Amortized | unrealized | unrealized | Fair | Amortized | unrealized | unrealized | Fair | ||||||||||||||||||||||||||||||||||||
| Thousands of Euros | cost | gains | losses (2) | Value (1) | cost | gains | losses (2) | Value (1) | cost | gains | losses (2) | Value (1) | ||||||||||||||||||||||||||||||||||||
Available-for-sale securities | ||||||||||||||||||||||||||||||||||||||||||||||||
Debt securities: | ||||||||||||||||||||||||||||||||||||||||||||||||
| United States- | ||||||||||||||||||||||||||||||||||||||||||||||||
| US Treasury and other US Government Agencies | 233,660 | 3,345 | 1,349 | 235,656 | 768,440 | 11 | 15,703 | 752,748 | 651,424 | — | 13,933 | 637,491 | ||||||||||||||||||||||||||||||||||||
| States and political subdivisions | 246,175 | 2,309 | 445 | 248,039 | 41,648 | — | 589 | 41,059 | 90,881 | — | 390 | 90,491 | ||||||||||||||||||||||||||||||||||||
| Mortgage-backed securities | 207,617 | — | 2,744 | 204,873 | 322,163 | — | 9,750 | 312,413 | 655,442 | — | 13,323 | 642,119 | ||||||||||||||||||||||||||||||||||||
| Corporate debt securities | 12,462 | — | 215 | 12,247 | — | — | — | — | — | — | — | — | ||||||||||||||||||||||||||||||||||||
| Other securities | 2,291,440 | 694 | 5,052 | 2,287,082 | 995,121 | — | 260 | 994,861 | 1,402,838 | — | 376 | 1,402,462 | ||||||||||||||||||||||||||||||||||||
| Spanish Government | 8,107,355 | 92,669 | 350 | 8,199,674 | 7,745,231 | 123,738 | 2,011 | 7,866,958 | 12,787,831 | 291,095 | 43,531 | 13,035,395 | ||||||||||||||||||||||||||||||||||||
| Other Spanish public authorities | 17,258 | 736 | — | 17,994 | 20,653 | 1,695 | — | 22,348 | 17,615 | — | — | 17,615 | ||||||||||||||||||||||||||||||||||||
| Securities of other foreign Governments | 9,890,336 | 343,936 | 97,846 | 10,136,426 | 8,268,849 | 695,215 | 9,269 | 8,954,795 | 43,254,927 | 391,236 | 26,469 | 43,619,694 | ||||||||||||||||||||||||||||||||||||
| Other Corporate debt securities | 1,311,054 | 115 | 10,543 | 1,300,626 | 490,852 | 1,087 | 527 | 491,412 | 1,367,372 | 78 | 856 | 1,366,594 | ||||||||||||||||||||||||||||||||||||
| Other Mortgage-backed securities | 1,653,775 | 5,434 | 7,105 | 1,652,104 | 1,665,206 | 29,127 | 357 | 1,693,976 | 2,465,580 | 1,895 | 30,142 | 2,437,333 | ||||||||||||||||||||||||||||||||||||
| Other debt securities | 11,654,363 | 52,913 | 146,582 | 11,560,694 | 12,159,113 | 62,103 | 2,562 | 12,218,654 | 4,939,894 | 36,487 | 351 | 4,976,030 | ||||||||||||||||||||||||||||||||||||
| 35,625,496 | 502,151 | 272,231 | 35,855,416 | 32,477,276 | 912,976 | 41,028 | 33,349,224 | 67,633,804 | 720,791 | 129,371 | 68,225,224 | |||||||||||||||||||||||||||||||||||||
Equity securities: | ||||||||||||||||||||||||||||||||||||||||||||||||
| Spanish securities | 3,941,669 | 369.877 | — | 4,311,546 | 1,877,175 | 208,599 | — | 2,085,774 | 1,548,863 | 804,337 | — | 2,353,200 | ||||||||||||||||||||||||||||||||||||
| International securities | 4,548,119 | 1.302.166 | — | 5,850,285 | 2,398,862 | 1,486,209 | — | 3,885,071 | 2,576,992 | 960,726 | — | 3,537,718 | ||||||||||||||||||||||||||||||||||||
of which: United States: | 196,416 | 46.467 | — | 242,883 | 144,956 | — | — | 144,956 | 57,476 | — | — | 57,476 | ||||||||||||||||||||||||||||||||||||
| 8,489,787 | 1.672.043 | — | 10,161,830 | 4,276,037 | 1,694,808 | — | 5,970,845 | 4,125,855 | 1,765,063 | — | 5,890,918 | |||||||||||||||||||||||||||||||||||||
| (1) | Fair values are determined based on year-end quoted market prices for listed securities and on management’s estimate for unlisted securities. | |
| (2) | Gross unrealized losses under the EU-IFRS required to be applied under Bank of Spain’s Circular 4/2004 are higher than those under U.S. GAAP, due to the “Other than Temporary Adjustment” included in reconciliation to U.S.GAAP (see Notes 57.2 and 57.3.b). Additionally, the gross unrealized losses have mainly arisen in a period shorter than one year. | |
| We review all the unrealized losses of our debt securities portfolio at least quarterly to evaluate if they should be considered other than temporary impaired. Under the EU-IFRS required to be applied under Bank of Spain’s Circular 4/2004, impairment losses are recorded in the income statement when the fair value of a debt security declines below its amortized cost and there is objective evidence of a reduction of the expected cash flows. Reversal of impairment losses is permitted if the impairment ceases or is reduced; however under U.S. GAAP, the reversal of impairment losses is not permitted (see Note 57.3.b). Additionally, for the remaining unrealized losses, we have evaluated their decline in fair value to determine whether it is other than temporary and we have not recognized any other than temporary impairment for these securities for the fiscal year ended December 31, 2007 as all of the unrealized losses have substantially arisen in a period shorter than one year. |
F-196
Table of Contents
Gross gains of€18,689,786,€40,031,628 and€14,694,950 thousand and gross losses of€17,871,498,€36,484,698 and€12,132,446 thousand have been realized during 2007, 2006 and 2005 on the sales of trading and available-for-sale investment securities, which are included, net, under “Gains (losses) from Investment Securities” in the consolidated statement of income (see Note 57.5). | ||
| The following table includes the detail of the available-for-sale portfolios excluding the allocation of the allowance for credit losses for 2007: | ||
AVAILABLE-FOR-SALE Classification by maturity |
| Thousands of Euros | ||||||||||||
| 2007 | ||||||||||||
| Fair | Amortized | |||||||||||
| Yield | Value | Value | ||||||||||
Debt securities: | ||||||||||||
| Due in one year or less | 6.63 | % | 4,509,093 | 4,427,677 | ||||||||
| Due after one year through five years | 5.95 | % | 12,244,459 | 12,174,509 | ||||||||
| Due after five years through ten years | 4.45 | % | 14,635,854 | 14,586,205 | ||||||||
| Due after ten years | 4.87 | % | 4,466,010 | 4,437,105 | ||||||||
| 35,855,416 | 35,625,496 | |||||||||||
| The details of the trading portfolio by type of security are set out below: | ||
TRADING PORTFOLIO |
| (U.S. GAAP presentation) | 2007 | 2006 | 2005 | |||||||||
| Thousands of Euros | Fair value | Fair value | Fair value | |||||||||
Trading Portfolio Debt Securities: | ||||||||||||
| United States: | ||||||||||||
| U.S. Treasury and other U.S. Government agencies | 1,634,497 | 320,498 | 237,079 | |||||||||
| States and Political subdivisions | 33,414 | 9,159 | 4,676 | |||||||||
| Mortgage-backed securities | 7 | 12,594 | — | |||||||||
| Corporate debt securities | 416,284 | 462,219 | 2,425,250 | |||||||||
| Other Securities | 6,705,377 | 3,925,028 | 862,072 | |||||||||
| Spanish Government | 6,271,502 | 4,730,026 | 6,559,938 | |||||||||
| Other Spanish Public authorities | 1,635,194 | 156,969 | 103,713 | |||||||||
| Securities of other foreign Governments | 9,329,427 | 12,082,006 | 29,373,007 | |||||||||
| Other Corporate debt securities | 1,490,988 | 1,691,454 | 14,569,752 | |||||||||
| Other Mortgage-backed securities | 100,008 | 557,402 | 78,179 | |||||||||
| Other debt securities | 45,786,536 | 57,289,857 | 37,227,515 | |||||||||
Total debt securities | 73,403,234 | 81,237,212 | 91,441,181 | |||||||||
Trading Equity Securities | ||||||||||||
| Spanish Securities | 3,971,653 | 5,226,339 | 5,291,082 | |||||||||
| International Securities | 8,643,135 | 10,976,813 | 33,089,955 | |||||||||
Of which United States | 1,386,872 | 459,966 | 190,235 | |||||||||
Total equity securities | 12,614,788 | 16,203,152 | 38,381,037 | |||||||||
| The following table includes the detail of the debt securities trading portfolios for 2007: | ||
TRADING PORTFOLIO Classification by maturity |
| Thousands of Euros | ||||||||||||
| 2007 | ||||||||||||
| Book | Fair | |||||||||||
| Yield | Value | Value | ||||||||||
Debt securities: | ||||||||||||
| Due in one year or less | 5.54 | % | 34,179,973 | 34,179,973 | ||||||||
| Due after one year through five years | 5.93 | % | 20,995,824 | 20,995,824 | ||||||||
| Due after five years through ten years | 4.99 | % | 8,957,564 | 8,957,564 | ||||||||
| Due after ten years | 5.01 | % | 9,269,873 | 9,269,873 | ||||||||
| 73,403,234 | 73,403,234 | |||||||||||
F-197
Table of Contents
| 58.4 | Derivative Financial Instruments | |
| We use derivatives for both trading and non-trading activities. | ||
| The Group uses derivatives to eliminate, reduce or modify risk in trading portfolios (interest rate, foreign exchange and equity prices), and to provide financial services to clients. Our principal counterparties for this activity are financial institutions. The principal types of derivatives used are: interest rate swaps, future rate agreements, interest rate options and futures, foreign exchange forwards, foreign exchange futures, foreign exchange options, foreign exchange swaps, cross currency swaps, equity index futures and equity options. | ||
| Derivatives are also used in non-trading activity in order to manage the interest rate risk and foreign exchange risk arising from asset and liability management activity. Interest rate and foreign exchange non-optional derivatives are used in non-trading activity. Some of these non-trading transactions could be accounted for as accounting hedges if they meet specific criteria. | ||
| The Group has established policies, procedures and limits in relation to market risk. These limits are defined as a structure which considers different levels from business segment or legal entity levels to portfolio or trader levels. Market risk is monitored by risk committees together with Assets and Liabilities Committees both at the local and global levels. | ||
| More detailed information about market risks and control over them can be found in Note 56. | ||
Accounting principles- | ||
| The Group enters into thousands of derivative transactions for trading purposes and to hedge asset and liability exposures. Only a limited amount of these hedging transactions receive hedge accounting treatment under the EU-IFRS required to be applied under Bank of Spain’s Circular 4/2004 due to the strict qualifying requirements. The general rule is that all derivatives are accounted for as trading operations, and only those derivatives that comply with the specific criteria required by the EU-IFRS required to be applied under Bank of Spain’s Circular 4/2004 are accounted for as hedging operations. A full description of the principles applied by the Group in accounting for derivative financial instruments is disclosed in Note 2.d.v. The EU-IFRS required to be applied under Bank of Spain’s Circular 4/2004 and U.S. GAAP differ, in certain respects, in the accounting treatment of these transactions. See Note 57.2 for a summary of the accounting criteria, and Note 57.3.f) for the impact on the reconciliation of net income and stockholders’ equity from the EU-IFRS required to be applied under Bank of Spain’s Circular 4/2004 to U.S. GAAP. | ||
| The Bank of Spain’s Circular 4/2004 consider as hedging transactions only those that meet the following criteria (summarized): |
| a. | The hedge relationship must be documented at inception. At that moment the objective and the hedge strategy must be assessed (all the documentation requirements are similar to those required by SFAS 133). |
| b. | The hedge relationship should be highly effective during the entire estimated term to compensate the changes in the value or in the cash flows attributable to the identified risk, and in accordance with the hedging strategy documented at inception. |
| c. | Forecasted transactions may be hedged only if it is highly probable that they will occur and when they are subject to any risk that could have an effect on cash flows that could affect the net income. |
| d. | To qualify as highly effective, the hedge relationship should meet, both at the inception and in any moment, the following requirements: |
| a) | Prospectively: it should be expected that the changes in the fair value or in the cash flows of the hedged financial instruments will almost be offset by the changes in the fair value or in the cash flows of the hedging instruments. |
| b) | Retrospectively: The offsetting effects should be within 80% and 125% of the changes in the hedged item. |
| c) | All the values should be reliably calculated. |
| d) | Effectiveness should be tested quarterly and at least, each time that the financial statements are prepared. |
| We have procedures in place that ensure that the requirements with respect to the designation as hedge or speculative, transaction documentation, identification of hedged items and hedging instrument, and the assessment and testing of hedge effectiveness are met. | ||
| As explained in Note 57.3 f) and in Note 57.2, the EU-IFRS required to be applied under Bank of Spain’s Circular 4/2004 and U.S. GAAP differ, in certain respects, in the requirements for hedge accounting of these transactions. Given that U.S. GAAP does not allow certain types of hedges, derivative transactions accounted for as hedges under U.S. GAAP are only a portion of the hedge transactions under the EU-IFRS required to be applied under Bank of Spain’s Circular 4/2004. | ||
| Besides, there are differences in designation requirements and hedge accounting between the EU-IFRS required to be applied under Bank of Spain’s Circular 4/2004 and U.S. GAAP, so many transactions accounted for as hedge under the EU-IFRS required to be applied under Bank of Spain’s Circular 4/2004 are reversed for U.S. GAAP purposes and designated as speculative transactions. |
F-198
Table of Contents
| For all the transactions that are considered as hedging both under the EU-IFRS required to be applied under Bank of Spain’s Circular 4/2004 and U.S. GAAP, additional information is collected to adapt to the accounting treatment required. The adjustments are made in function of the hedge designation under SFAS 133 (i.e. cash flow, fair value or net investment in foreign operation). Only those transactions which fully comply with SFAS 133 requirements are considered to be hedge transactions. | ||
| The vast majority of our hedges are simple hedges: the notional value of the hedging instruments is the same as the face value of the hedged item; the hedging instrument is tailored solely to the hedged risk (either benchmark rate of interest or foreign currency); the settlement methods are standard ones, with settlement periods similar to those for the item to be hedged; there are no pre-payable amounts on the item to be hedged, nor are there any options in the hedged items unless such options are completely offset with an opposite option in the hedging instruments. | ||
| Among these transactions that are designated hedges under both the EU-IFRS required to be applied under Bank of Spain’s Circular 4/2004 and U.S. GAAP, the Group includes derivatives that hedge the foreign currency exposure of a net investment in a foreign subsidiary. The currency of these hedging derivatives is that of the country in which the foreign subsidiary is located, and the amounts to be hedged are closely watched by our risk committees. | ||
| Our Group’s companies enter into intercompany derivative transactions for the purposes of managing their own risks. | ||
| Usually, in each country in which our Group operates, there is a subsidiary (an individual entity) that acts as the treasury services provider or center for the Group’s financial activities in that country. The remaining subsidiaries operating in that country usually hedge their own risks through transactions entered into with that treasury services provider. In addition, some of our subsidiaries may enter into intercompany derivative transactions with subsidiaries located in other countries. | ||
| For accounting purposes, these transactions are recorded as intercompany derivatives on the individual books and records of each company entering into such transactions, but are eliminated in the consolidation process. | ||
Fair value methods- | ||
| The methods and assumptions used by the Group in estimating its fair value disclosures for derivative financial instruments are disclosed in Note 2.d. | ||
| The following table shows a detail of our consolidated trading and hedging transactions broken down into notional amounts and their fair value in accordance with the EU-IFRS required to be applied under Bank of Spain’s Circular 4/2004 at the dates indicated: |
| December 31, | December 31, | December 31, | ||||||||||||||||||||||
| 2007 | 2006 | 2005 | ||||||||||||||||||||||
| Notional | Notional | Notional | ||||||||||||||||||||||
| Millions of Euros | Amount | Fair Value | Amount | Fair Value | Amount | Fair Value | ||||||||||||||||||
• Trading | 3,620,490.1 | (2,077.6 | ) | 2,748,721.0 | (3,753.7 | ) | 1,830,939.6 | (1,598.9 | ) | |||||||||||||||
• Hedging | 164,666.9 | (1,071.4 | ) | 157,363.1 | (505.9 | ) | 226,627.4 | 1,815.4 | ||||||||||||||||
Fair Value Hedges | 126,388.3 | (1,199.7 | ) | 131,214.4 | (474.3 | ) | 204,820.6 | 2,046.6 | ||||||||||||||||
Cash Flow Hedges | 10,695.5 | (136.7 | ) | 9,472.8 | (34.4 | ) | 9,777.2 | 23.9 | ||||||||||||||||
Hedges of the foreign currency of a net investment in a foreign subsidiary | 27,583.1 | 265.0 | 16,675.9 | 2.8 | 12,029.7 | (255.1 | ) | |||||||||||||||||
| 3,785,157.0 | (3,149.0 | ) | 2,906,084.1 | (4,259.6 | ) | 2,057,567.0 | 216.5 | |||||||||||||||||
| In our reconciliation to U.S.GAAP we made some adjustments that change the designation of some hedge relationships. We identify those hedges under the EU-IFRS required to be applied under Bank of Spain’s Circular 4/2004 that do not fully comply with FAS 133 requirements. Under U.S. GAAP accounting those transactions are considered to be speculative transactions and such derivatives are accounted for as trading derivatives. |
F-199
Table of Contents
| The following table shows a detail of our consolidated trading and hedging transactions broken down into notional amounts and their fair value in accordance with U.S. GAAP at the dates indicated: |
| December 31, | December 31, | December 31, | ||||||||||||||||||||||
| 2007 | 2006 | 2005 | ||||||||||||||||||||||
| Notional | Notional | Notional | ||||||||||||||||||||||
| Millions of Euros | Amount | Fair Value | Amount | Fair Value | Amount | Fair Value | ||||||||||||||||||
• Trading | 3,685,557.8 | (1,482.7 | ) | 2,820,182.0 | (3,525.9 | ) | 1,880,611.3 | (1,446.7 | ) | |||||||||||||||
• Hedging | 99,599.2 | (1,665.8 | ) | 85,902.1 | (733.7 | ) | 176,955.6 | 1,663.1 | ||||||||||||||||
Fair Value Hedges | 61,320.6 | (1,794.1 | ) | 59,753.4 | (702.1 | ) | 155,148.8 | 1,894.4 | ||||||||||||||||
Cash Flow Hedges | 10,695.5 | (136.7 | ) | 9,472.8 | (34.4 | ) | 9,777.2 | 23.9 | ||||||||||||||||
Hedges of the foreign currency of a net investment in a foreign subsidiary | 27,583.1 | 265 | 16,675.9 | 2.8 | 12,029.7 | (255.1 | ) | |||||||||||||||||
| 3,785,157.0 | (3,148.5 | ) | 2,906,084.1 | (4,259.6 | ) | 2,057,567.0 | 216.5 | |||||||||||||||||
| The notional amounts of hedging transactions under U.S. GAAP are less than those under the EU-IFRS required to be applied under Bank of Spain’s Circular 4/2004 due to the fact that the EU-IFRS required to be applied under Bank of Spain’s Circular 4/2004 allows certain hedge accounting that is not permitted under U.S. GAAP. |
| 58.5 | Short Term Borrowings | |
Following is an analysis of the components of the “Short-term borrowings” caption for 2007, 2006 and 2005: |
| 2007 | 2006 | 2005 | ||||||||||||||||||||||
| Average | Average | Average | ||||||||||||||||||||||
| Thousands of Euros | Amount | Rate | Amount | Rate | Amount | Rate | ||||||||||||||||||
Securities sold under agreements to repurchase: | ||||||||||||||||||||||||
| At December 31 | 99,067,534 | 3.66 | % | 92,433,767 | 4.39 | % | 126,201,890 | 3.55 | % | |||||||||||||||
| Average during year | 90,977,794 | 3.86 | % | 101,682,243 | 3.74 | % | 91,458,502 | 3.65 | % | |||||||||||||||
| Maximum month-end balance | 99,067,534 | 129,816,503 | 129,563,533 | |||||||||||||||||||||
Other short-term borrowings: | ||||||||||||||||||||||||
| At December 31 | 32,706,892 | 7.29 | % | 35,385,525 | 2.50 | % | 25,157,976 | 2.34 | % | |||||||||||||||
| Average during year | 27,071,238 | 5.42 | % | 25,501,630 | 2.66 | % | 21,249,880 | 4.23 | % | |||||||||||||||
| Maximum month-end balance | 44,052,354 | 35,385,525 | 26,688,044 | |||||||||||||||||||||
Total short-term borrowings at year-end | 131,774,426 | 4.56 | % | 127,819,292 | 3.87 | % | 151,359,866 | 3.35 | % | |||||||||||||||
| This short-term indebtedness is denominated in different currencies, mostly Euro, US$, GBP and Latin-American currencies. Interest rates of these currencies have not followed the same trend. | ||
| 58.6 | Guarantees | |
| The Group provides a variety of guarantees to its customers to improve their credit standing and allow them to compete. The following table summarizes at December 31, 2007, 2006 and 2005 all of the guarantees. | ||
As required, the “maximum potential amount of future payments” represents the notional amounts that could be lost if there were a total default by the guaranteed parties, without consideration of possible recoveries from collateral held or pledged, or recoveries under recourse provisions. There is no relationship between these amounts and probable losses on these guarantees. In fact,maximum potential amount of future paymentssignificantly exceeds inherent losses. |
F-200
Table of Contents
Guarantees disclosures |
| Maximum potential amount of future payments | ||||||||||||
| 2007 | 2006 | 2005 | ||||||||||
| (Thousands of Euros) | ||||||||||||
Contingent liabilities: | ||||||||||||
| Assets earmarked for third-party obligations | 3 | 4 | 24 | |||||||||
| Guarantees and other sureties | 70,513,358 | 53,175,928 | 44,432,649 | |||||||||
Guaranties promises | 13,332,972 | 8,258,151 | 100,898 | |||||||||
Performance guarantees | 34,657,158 | 29,857,748 | 25,428,337 | |||||||||
Financial standby letters of credit | 21,740,424 | 14,522,186 | 18,642,647 | |||||||||
Doubtful guarantees | 74,154 | 59,157 | 79,529 | |||||||||
Credit Default Swaps | 708,250 | 478,250 | 180,000 | |||||||||
Other | 400 | 436 | 1,238 | |||||||||
| Other contingent exposures | 6,411,474 | 5,593,377 | 4,020,902 | |||||||||
Documentary Credits | 5,803,088 | 5,029,484 | 3,767,022 | |||||||||
Other contingent liabilities | 608,274 | 563,731 | 252,541 | |||||||||
Doubtful contingent liabilities | 112 | 162 | 1,339 | |||||||||
Total Contingent Liabilities | 76,924,835 | 58,769,309 | 48,453,575 | |||||||||
Commitments | ||||||||||||
| Loan commitments drawable by third parties | 102,215,927 | 91,690,396 | 77,678,333 | |||||||||
| Other commitments | 12,460,636 | 11,559,034 | 18,584,929 | |||||||||
Securities placement commitments | 33,032 | 3,463 | 16,399 | |||||||||
Securities subscribed and pending payment | 107,244 | 83,368 | 195,610 | |||||||||
Compensation room delivered bills | 12,320,360 | 11,472,203 | 18,372,920 | |||||||||
Total Commitments | 114,676,563 | 103,249,430 | 96,263,262 | |||||||||
| Performance guarantees are issued to guarantee customers obligations such as to make contractually specified investments, to supply specified products, commodities, or maintenance or warranty services to a third party, completion of projects in accordance with contract terms, etc. Financial standby letters of credit include guarantees of payment of loans, credit facilities, promissory notes and trade acceptances. The Group always requires collateral to grant this kind of financial guarantees. In Documentary Credits, the Group acts as a payment mediator between trading companies located in different countries (import-export transactions). Under a documentary credit transaction, the parties involved deal with the documents rather than the commodities to which the documents may relate. Usually the traded commodities are used as collateral to the transaction and the Bank may provide some credit facilities. Loan commitments drawable by third parties include mostly credit card lines and commercial commitments. Credit card lines are unconditionally cancelable by the issuer. Commercial commitments are mostly 1 year facilities subject to information requirements to be provided by our customers. | ||
In the UK it is normal to issue check guarantee cards to current account customers holding checkbooks, as retailers do not generally accept cheques without such form of guarantee. Accordingly, Abbey issues guaranteed cheques that represent its commitment to guarantee the cheques of some of its customers up to a certain limit, typically £50-£100. Bank account facilities to which guaranteed cheques relate are regularly assessed based on customers’ behavior, and amended where necessary. Prior notice of changes is given to customers. The maximum potential amount of future payments is€7,955 million on December 2007 (€7,696 million in 2006 and€5,952 in 2005) and there is no stated maturity. | ||
Also, Abbey, as is normal in such activity, gives representations and warranties on the sale of subsidiaries. The maximum potential amount of any claims made against these is significantly higher than actual settlements. The maximum potential amount of future payments is€5,354 million on December 31, 2007 (€6,849 million in 2006 and€4,077 in 2005). | ||
| The risk criteria followed to issue all kinds of guarantees, financial standby letters of credit, documentary credits and any risks of signature are in general the same as those used for other products of credit risk, and therefore subject to the same admission and tracking standards. The guarantees granted on behalf of our customers are subject to the same credit quality review process as any other risk product. On a regular basis, at least once a year, the solvency of the mentioned customers is checked as well as the probability of those guarantees to be executed. In case that any doubt on the customer’s solvency may arise we create allowances with charge to net income, by the amount of the inherent losses even if there is no claim to us. | ||
As of December 31, 2007, the Group had allowances to cover inherent losses on guarantees of€636,316 thousands, (2006:€598,735 and 2005:€487,048). | ||
| According to FIN 45, a guarantee that is accounted for as a derivative instrument at fair value under Statement 133 is not subject to the initial recognition and initial measurement provisions of this Interpretation but is subject to its disclosure requirements, see Notes 9, 11 and 36. |
F-201
Table of Contents
| 58.7 | Additional disclosures about fair value | |
Disclosures about fair value of financial instruments (SFAS 107) | ||
| SFAS No. 107, “Disclosures about Fair Value of Financial Instruments” (“SFAS 107”) requires the disclosure of fair value information about financial instruments, whether or not recognized in the balance sheet, for which it is practicable to estimate that value. Find the disclosures required by SFAS 107 in Note 2.d for those financial instruments recognized at fair value and Note 53.c. for those financial instruments measured at other than fair value. | ||
Disclosures about fair value of equity investments (APB 18) | ||
| APB 18 “The Equity Method of Accounting for Investments in Common Stock”, requires for those investments in common stock for which a quoted market price is available the disclosure of the aggregate value of each identified investment based on the quoted market price (see also Note 13). | ||
| The following table shows the market value of our holdings accounted for by using the equity method that has listed quotations: |
| December 31, | ||||||||||||
| Thousands of Euros | 2007 | 2006 | 2005 | |||||||||
| RFS | 11,778,624 | — | — | |||||||||
| Cepsa | 5,896,826 | 4,766,317 | 3,337,438 | |||||||||
| Attijariwafa | 761,893 | 579,295 | 319,369 | |||||||||
| Sovereign | 875,406 | 2,267,762 | — | |||||||||
| 58.8 | Stock Option Plans | |
| SFAS No. 123 (Revised 2004), “Share-Based Payment” (SFAS 123-R) eliminated the option to apply the intrinsic value measurement provisions of APB No. 25 “Accounting for Stock Issued to Employees”, to stock compensation awards issued to employees. SFAS 123-R requires companies to measure the cost of employee services received in exchange for an award of equity instruments based on the grant-date fair value of the award. That cost will be recognized over the period during which an employee is required to provide services in exchange for the award the requisite service period (usually the vesting period). | ||
| The Company adopted SFAS 123-R on January 1, 2005 by using the modified prospective approach, which requires recognizing expense for options granted prior to the adoption date equal to the fair value at the grant date of the unvested amounts over their remaining vesting period. The reason for this early adoption is to reduce differences between the EU-IFRS required to be applied under Bank of Spain’s Circular 4/2004 and U.S. GAAP. | ||
| Currently, all the Group’s stock options are accounted for following IFRS 2 which is similar to FAS 123-R. Disclosures are included in Note 49.c. | ||
| 58.9 | Acquisition of Drive Consumer U.S.A. Inc. | |
In 2006, the Group acquired 90% of Drive in the U.S.A. for $637 million in cash (€494 million approximately). The operation generated goodwill of $544 million (€422 million, see Note 17). | ||
| Under the agreement, the price paid by Santander could increase by a maximum of $175 million, if the company achieves certain earning targets set for years 2007 and 2008. | ||
| Drive is one of the leading auto financing companies in “subprime” customer segment in the United States. Based in Dallas, Texas, it is present in 35 states, with approximately 50% of its activity concentrated in Texas, California, Florida and Georgia. Drive has around 600 employees and its products are distributed through more than 10,000 auto dealer partnerships. | ||
| Until our acquisition, 64.5% of Drive was owned by HBOS plc and 35.5% by its management team. Following the acquisition by Santander, the present Chairman and COO of Drive will act as Chief Executive Officer, maintaining ownership of 10% of the company, a percentage on which the parties have signed a series of options which could enable Grupo Santander to buy the additional 10% between 2009 and 2013 at prices linked to the company’s earnings performance. | ||
The goodwill and its allocation process was finalized during 2007, which reduced the initial goodwill of Drive by€49 million at year end. |
F-202
Table of Contents
| The following is a Balance Sheet at the first-time consolidation date: | ||
Drive Group Balance Sheet |
| Thousands of | ||||
| Euros | ||||
| 2006 | ||||
Assets | ||||
| Interest earning deposits in other banks | 129,736 | |||
| Loans and leases, net of unearned income | 2,230,256 | |||
| Less-Allowance for credit losses | (110,365 | ) | ||
| Net Loans and leases | 2,119,891 | |||
| Premises and equipment, net | 3,093 | |||
| Other assets | 19,491 | |||
Total assets | 2,272,211 | |||
Liabilities | ||||
| Deposits | ||||
| Interest bearing | ||||
| Time deposits | 272,188 | |||
| Total deposits | 272,188 | |||
| Long-term debt | 1,894,308 | |||
| Taxes Payable | 3,043 | |||
| Accounts Payable | 15,132 | |||
| Accrual Accounts | 8,631 | |||
| Others | 501 | |||
| Other liabilities | 27,307 | |||
Total liabilities | 2,193,803 | |||
| Minority interest | ||||
Stockholders’ equity | ||||
| Capital stock | 63,456 | |||
| Other reserves | 14,952 | |||
| Total stockholders’ equity | 78,408 | |||
Total liabilities and Stockholders’ equity | 2,272,211 | |||
| 58.10 | Significant Equity method investee: Sovereign Bancorp, Inc (“Sovereign”). | |
| As of December 31, 2007, due to the market evolution and, in particular, the decline in Sovereign shares quoted market price, the Group analyzed whether an other-than-temporary impairment existed in its investment in Sovereign. | ||
The analysis was performed by comparing the determined fair value of Sovereign with its cost as of December 31, 2007. As the fair value was less than its cost over a relevant period of time, we concluded that an other-than-temporary impairment existed and recorded an impairment loss in the income statement for the difference between the fair value and its cost as of December 31, 2007, totaling€1.053 million. | ||
| Additionally, under SEC Regulation S-X, Rule 4-08 (g), Sovereign, equity method investee, was significant to the Group in 2007 and thus we present below its summarized balance sheets as of December 31, 2007 and 2006 and income statements for the fiscal years ended December 31, 2007, 2006 and 2005. |
F-203
Table of Contents
CONSOLIDATED BALANCE SHEET — SOVEREIGN BANCORP, INC. |
| 2007 | 2006 | 2005 | ||||||||||
| (Thousands of euros) | ||||||||||||
Assets | ||||||||||||
| Cash and amounts due from depository institutions | 2,126,737 | 1,369,869 | 959,512 | |||||||||
| Investment securities available for sale | 9,470,720 | 10,535,025 | 6,152,752 | |||||||||
| Investment securities held to maturity | — | — | 3,939,669 | |||||||||
| Other investments | 815,532 | 761,588 | 552,089 | |||||||||
| Net loans held for investment | 38,395,880 | 41,386,215 | 36,511,545 | |||||||||
| Loans held for sale | 372,094 | 5,779,743 | 264,116 | |||||||||
| Premises and equipment | 381,993 | 459,914 | 349,256 | |||||||||
| Accrued interest receivable | 238,118 | 321,109 | 242,689 | |||||||||
| Goodwill | 2,327,455 | 3,800,444 | 2,302,980 | |||||||||
| Core deposits and other intangibles | 252,779 | 378,451 | 181,381 | |||||||||
| Bank owned life insurance | 1,218,734 | 1,309,964 | 863,037 | |||||||||
| Other assets | 1,968,326 | 1,962,863 | 1,659,719 | |||||||||
Total assets | 57,568,369 | 68,065,185 | 53,978,745 | |||||||||
Liabilities | ||||||||||||
| Deposits and other customer accounts | 33,907,958 | 39,775,667 | 32,192,681 | |||||||||
| Borrowings and other debt obligations | 17,747,491 | 20,387,029 | 15,869,202 | |||||||||
| Advance payments by borrowers for taxes and insurance | 56,444 | 74,443 | 41,801 | |||||||||
| Other liabilities | 1,007,108 | 1,145,598 | 775,156 | |||||||||
Total liabilities | 52,719,001 | 61,382.737 | 48,878,840 | |||||||||
| Minority interest-preferred securities of subsidiaries | 99,470 | 118,743 | 174,332 | |||||||||
Stockholders’ Equity | ||||||||||||
| Preferred stock | 132,766 | 148,402 | — | |||||||||
| Common stock | 4,276,593 | 4,694,974 | 3,100,401 | |||||||||
| Warrants and employee stock options issued | 236,645 | 260,737 | 285,959 | |||||||||
| Unallocated common stock held by Employee Stock Ownership Plan | — | (14,441 | ) | (18,137 | ) | |||||||
| Treasury stock | (13,486 | ) | (37,227 | ) | (405,810 | ) | ||||||
| Accumulated other comprehensive loss | (221,543 | ) | (18,790 | ) | (144,781 | ) | ||||||
| Retained earnings | 338,923 | 1,530,049 | 2,107,941 | |||||||||
Total Stockholders’ Equity | 4,749,898 | 6,563,705 | 4,925,573 | |||||||||
Total Liabilities and Stockholders’ Equity | 57,568,369 | 68,065,185 | 53,978,745 | |||||||||
| 2007 | 2006 | 2005 | ||||||||||
| (Thousands of euros) | ||||||||||||
| Interest income | 3,402,988 | 3,451,424 | 2,382,391 | |||||||||
| Interest expense | (2,040,682 | ) | 1,998,269 | 1,069,932 | ||||||||
| Provision for credit losses | (297,958 | ) | (386,483 | ) | (72,374 | ) | ||||||
Net interest income after provision for credit losses | 1,064,347 | 1,066,672 | 1,240,085 | |||||||||
| Fees and other income | 387,895 | 476,689 | 475,219 | |||||||||
| Net (loss)/gain on investment securities | (128,888 | ) | (248,870 | ) | (9,419 | ) | ||||||
Non-interest income | 259,008 | 227,819 | 484,638 | |||||||||
| General and administrative expenses | (983,595 | ) | (1,029,099 | ) | (875,893 | ) | ||||||
| Other expenses | (1,370,037 | ) | (250,130 | ) | (131,423 | ) | ||||||
Income before income taxes | (1,030,277 | ) | 15,262 | 717,406 | ||||||||
| Income tax benefit/(provision) | 44,179 | 93,960 | (173,666 | ) | ||||||||
Net income | (986,098 | ) | 109,222 | 543,740 | ||||||||
F-204
Table of Contents
| 58.11 | Additional relevant events | |
Sale and leaseback of real estate assets | ||
| On January 25, 2008, we announced that we had reached an agreement with a consortium led by the United Kingdom property investor Propinvest for the sale of Ciudad Grupo Santander (our corporate headquarters) and its simultaneous lease-back for a period of 40 years, with a right to repurchase this property at the end of such period. | ||
The price agreed for Ciudad Grupo Santander was€1.9 billion. The capital gains of approximately€605 million will be reversed under U.S. GAAP in the same way as described in Note 57.3.e) for a similar transaction. | ||
Agreement between Santander and General Electric (“GE”) | ||
On March 27, 2008, Banco Santander and GE, through its GE Money and Commercial Finance business units, reached a preliminary agreement on the acquisition of certain businesses from each other valued at€1 billion. | ||
| Under the terms of the preliminary agreement, Banco Santander will acquire GE Money’s units in Germany, Finland and Austria, and its card and auto businesses in the UK, while GE Commercial Finance will acquire Interbanca, the Italian commercial bank assigned to Santander as part of the distribution of assets following the acquisition, together with RBS and Fortis, of ABN Amro. | ||
Banco Santander expects to integrate the GE Money units acquired, with total assets of€9 billion, into Santander Consumer Finance and Santander Cards. Interbanca would become part of GE Commercial Finance, providing GE with an enhanced capability to service midmarket banking businesses in Italy. | ||
On June 2, 2008, we announced that we had reached a final agreement with GE and that the agreed base price for both transactions amounted to€1 billion each, subject to different adjustments. | ||
| These operations are expected to close during the fourth quarter of 2008. | ||
Agreement between Santander and RBS’s European consumer finance unit | ||
On April 4, 2008, Santander reached a preliminary agreement with RBS to acquire its continental European consumer finance business for€336 million. The package includes activities in Germany, the Netherlands, Belgium and Austria. The acquisition will be carried out by Santander Consumer Finance Germany GMBH. | ||
The RBS European consumer finance business (RBS ECF) has 861 employees serving 2.3 million customers in Germany, the Netherlands, Belgium and Austria. Assets in 2007 averaged€2.2 billion. RBS ECF makes installment loans both directly and via partners. It is strongly represented in the credit card business both in terms of private and corporate customers, and provides consumer finance via retail chains. | ||
| The acquisition is conditional upon a definitive agreement and the relevant approval from various national authorities. | ||
Acquisition of additional shares of Sovereign | ||
| In May 2008, Santander, to prevent dilution of its holding in Sovereign, invested $312 million to subscribe to a $1.25 billion common stock offering completed by the U.S. bank. | ||
Completion of the sale of Antonveneta to Banca Monte dei Paschi di Siena | ||
On May 30, 2008, Banca Monte dei Paschi di Siena and Banco Santander completed the sale of Antonveneta for€9 billion, executing the agreement announced on November 8, 2007. | ||
| Under U.S. GAAP, the Group’s Investment in Antonveneta is classified as an Equity method investee as of December 31, 2007. In addition, according to SFAS No. 144. Accounting for the Impairment or Disposal of Long-lived Assets, an Equity method investee cannot be classified as held for sale or discontinued operations. This classification difference with EU-IFRS required to be applied under Bank of Spain’s Circular 4/2004 does not create an effect in the U.S. GAAP reconciliation for Net Income and Stockholder’s Equity, while the cash flows presentation difference for reclassifying Antonveneta from Other financial assets to Subsidiaries, jointly controlled entities and associates within the cash flows from investing activities is immaterial for U.S. GAAP purposes. | ||
Drive Cosumer USA Inc. | ||
| In June 2008, Grupo Santander has bought an additional 1% stake in the company for $17 million. | ||
| Grupo Santander could buy the 9% stake still owned by the Chief Executive Officer of Drive between 2009 and 2013 at prices linked to the company’s earnings performance. | ||
Santander internal models | ||
| In June 2008, Bank of Spain authorized the use of internal models to determine the regulatory capital requirements of the Group’s main units covering over 70% of the Group credit risk exposure beginning as of June 30, 2008 (the other units’ internal models will be presented for approval during the roll out period agreed with Bank of Spain). As of such date, the Group’s eligible capital exceeds the minimum requirements established by the Bank of Spain’s Circular 3/2008, which introduces in the Spanish regulatory framework the EU Directives 2006/48/EC and 2006/49/EC in accordance with the New Basel Accord (“Basel II” or “BIS II”). |
F-205
Table of Contents
| Millions of Euros (a) | ||||||||||||||||||||||||||||
| % of Ownership Held | % of | Net Profit | Amount of | |||||||||||||||||||||||||
| by the Bank | Voting | Capital and | (Loss) for | Ownership | ||||||||||||||||||||||||
| Entity | Location | Direct | Indirect | Rights (k) | Line of Business | Reserves | the Year | Interest | ||||||||||||||||||||
| A N (123) plc | United Kingdom | — | 100.00 | % | 100.00 | % | HOLDING COMPANY | 1,153 | 11 | 1,161 | ||||||||||||||||||
| Abbey Business Services (India) Private Limited (d) | India | — | 100.00 | % | 100.00 | % | HOLDING COMPANY | — | — | — | ||||||||||||||||||
| Abbey Covered Bonds (Holdings) Limited | United Kingdom | — | (b) | — | FINANCE | — | — | — | ||||||||||||||||||||
| Abbey Covered Bonds (LM) Limited | United Kingdom | — | (b) | — | FINANCE | — | — | — | ||||||||||||||||||||
| Abbey Covered Bonds LLP | United Kingdom | — | (b) | — | FINANCE | 39 | 99 | — | ||||||||||||||||||||
| Abbey National (America) Holdings Inc. | United States | — | 100.00 | % | 100.00 | % | HOLDING COMPANY | 31 | — | 31 | ||||||||||||||||||
| Abbey National (America) Holdings Limited | United Kingdom | — | 100.00 | % | 100.00 | % | HOLDING COMPANY | 31 | — | 32 | ||||||||||||||||||
| Abbey National (Gibraltar) Limited | Gibraltar | — | 100.00 | % | 100.00 | % | BROKER-DEALER | 7 | — | 6 | ||||||||||||||||||
| Abbey National (Holdings) Limited | United Kingdom | — | 100.00 | % | 100.00 | % | HOLDING COMPANY | 26 | — | 22 | ||||||||||||||||||
| Abbey National Alpha Investments (d) | United Kingdom | — | 100.00 | % | 100.00 | % | FINANCE | 62 | — | 62 | ||||||||||||||||||
| Abbey National American Investments Limited | United Kingdom | — | 100.00 | % | 100.00 | % | FINANCE | 374 | 15 | 345 | ||||||||||||||||||
| Abbey National Baker Street Investments | United Kingdom | — | 100.00 | % | 100.00 | % | FINANCE | 168 | — | 168 | ||||||||||||||||||
| Abbey National Beta Investments Limited | United Kingdom | — | 100.00 | % | 100.00 | % | FINANCE | 145 | 6 | 116 | ||||||||||||||||||
| Abbey National Business Asset Leasing Limited | United Kingdom | — | 100.00 | % | 100.00 | % | LEASING | — | — | — | ||||||||||||||||||
| Abbey National Business Cashflow Finance Limited | United Kingdom | — | 100.00 | % | 100.00 | % | FACTORING | 5 | — | 5 | ||||||||||||||||||
| Abbey National Business Equipment Leasing Limited | United Kingdom | — | 100.00 | % | 100.00 | % | LEASING | — | — | 7 | ||||||||||||||||||
| Abbey National Business Office Equipment Leasing Limited | United Kingdom | — | 100.00 | % | 100.00 | % | LEASING | 6 | — | — | ||||||||||||||||||
| Abbey National Business Sales Aid Leasing Limited | United Kingdom | — | 100.00 | % | 100.00 | % | LEASING | 1 | — | — | ||||||||||||||||||
| Abbey National Business Vendor Plan Leasing Limited | United Kingdom | — | 100.00 | % | 100.00 | % | LEASING | — | — | — | ||||||||||||||||||
| Abbey National Capital LP I | United States | — | (b) | — | FINANCE | — | — | — | ||||||||||||||||||||
| Abbey National Capital LP II | United States | — | (b) | — | FINANCE | — | — | — | ||||||||||||||||||||
| Abbey National Charitable Trust Limited | United Kingdom | — | 100.00 | % | 100.00 | % | CHARITABLE SERVICES | — | — | — | ||||||||||||||||||
| Abbey National Employment Services Inc. | United States | — | 100.00 | % | 100.00 | % | EMPLOYMENT SERVICES | — | — | — | ||||||||||||||||||
| Abbey National Financial and Investment Services (Jersey) Limited | Jersey | — | 100.00 | % | 100.00 | % | HOLDING COMPANY | 3 | — | 3 | ||||||||||||||||||
| Abbey National Financial Investments 3 B.V. | Netherlands | — | 100.00 | % | 100.00 | % | FINANCE | 3 | 1 | 1 | ||||||||||||||||||
| Abbey National Financial Investments 4 B.V. | Netherlands | — | 100.00 | % | 100.00 | % | FINANCE | 341 | 16 | 341 | ||||||||||||||||||
| Abbey National Financial Investments No.2 Limited | Jersey | — | 100.00 | % | 100.00 | % | FINANCE | — | — | — | ||||||||||||||||||
| Abbey National Funded Unapproved Retirement Benefits Scheme Trustees Limited (d) | United Kingdom | — | 100.00 | % | 100.00 | % | ASSET MANAGEMENT COMPANY | — | — | — | ||||||||||||||||||
| Abbey National Funding plc | United Kingdom | — | 100.00 | % | 100.00 | % | FINANCE | — | — | — | ||||||||||||||||||
| Abbey National General Insurance Services Limited | United Kingdom | — | 100.00 | % | 100.00 | % | ADVISORY SERVICES | (52 | ) | — | — | |||||||||||||||||
| Abbey National Gibraltar (1986) Limited | United Kingdom | — | 100.00 | % | 100.00 | % | FINANCE | 8 | — | 7 | ||||||||||||||||||
| Abbey National Global Investments | United Kingdom | — | 100.00 | % | 100.00 | % | FINANCE | — | — | — | ||||||||||||||||||
| Abbey National GP (Jersey) Limited | Jersey | — | 100.00 | % | 100.00 | % | FINANCE | — | — | — | ||||||||||||||||||
| Abbey National Group Pension Schemes Trustees Limited (d) | United Kingdom | — | 100.00 | % | 100.00 | % | ASSET MANAGEMENT COMPANY | — | — | — | ||||||||||||||||||
| Abbey National Guarantee Company | United Kingdom | — | 100.00 | % | 100.00 | % | LEASING | 5 | — | 4 | ||||||||||||||||||
| Abbey National Homes Limited | United Kingdom | — | 100.00 | % | 100.00 | % | FINANCE | (49 | ) | — | — | |||||||||||||||||
| Abbey National International Limited | Jersey | — | 100.00 | % | 100.00 | % | BANKING | 277 | 42 | 204 | ||||||||||||||||||
| Abbey National Investments | United Kingdom | — | 100.00 | % | 100.00 | % | FINANCE | 161 | 7 | 145 | ||||||||||||||||||
| Abbey National Investments Holdings Limited | United Kingdom | — | 100.00 | % | 100.00 | % | HOLDING COMPANY | (10 | ) | (6 | ) | — | ||||||||||||||||
| Abbey National Jersey International Limited | Jersey | — | 100.00 | % | 100.00 | % | HOLDING COMPANY | 287 | 3 | 252 | ||||||||||||||||||
| Abbey National June Leasing (5) Limited | United Kingdom | 100.00 | % | — | 100.00 | % | LEASING | 276 | — | 273 | ||||||||||||||||||
| Abbey National March Leasing (4) Limited | United Kingdom | — | 100.00 | % | 100.00 | % | LEASING | (24 | ) | 2 | — | |||||||||||||||||
| Abbey National Mortgage Finance plc | United Kingdom | — | 100.00 | % | 100.00 | % | MORTGAGE LOAN COMPANY | — | — | — | ||||||||||||||||||
| Abbey National Nominees Limited | United Kingdom | — | 100.00 | % | 100.00 | % | BROKER-DEALER | — | — | — | ||||||||||||||||||
| Abbey National North America Corporation | United States | — | 100.00 | % | 100.00 | % | FINANCE | 1 | — | — | ||||||||||||||||||
| Abbey National North America Holdings Limited | United Kingdom | — | 100.00 | % | 100.00 | % | HOLDING COMPANY | — | — | — | ||||||||||||||||||
| Abbey National North America LLC | United States | — | 100.00 | % | 100.00 | % | FINANCE | — | — | — | ||||||||||||||||||
| Abbey National Offshore Holdings Limited | Jersey | — | 100.00 | % | 100.00 | % | HOLDING COMPANY | 253 | — | 264 | ||||||||||||||||||
| Abbey National PEP & ISA Managers Limited | United Kingdom | — | 100.00 | % | 100.00 | % | FUND AND PORTFOLIO MANAGEMENT | 53 | (1 | ) | 50 | |||||||||||||||||
| Abbey National Personal Pensions Trustee Limited | United Kingdom | — | 100.00 | % | 100.00 | % | ASSET MANAGEMENT COMPANY | — | — | — | ||||||||||||||||||
| Abbey National plc | United Kingdom | 100.00 | % | — | 100.00 | % | BANKING | 3,559 | 478 | 12,429 | ||||||||||||||||||
| Abbey National PLP (UK) Limited | United Kingdom | — | 100.00 | % | 100.00 | % | FINANCE | — | — | — | ||||||||||||||||||
| Abbey National Properties (2) Limited | United Kingdom | — | 100.00 | % | 100.00 | % | LEASING | (3 | ) | — | — | |||||||||||||||||
| Abbey National Property Investments | United Kingdom | — | 100.00 | % | 100.00 | % | FINANCE | 392 | 24 | 189 | ||||||||||||||||||
| Abbey National Property Services Limited | United Kingdom | — | 100.00 | % | 100.00 | % | PROPERTY | (18 | ) | — | — | |||||||||||||||||
| Abbey National Secretariat Services (Jersey) Limited | Jersey | — | 100.00 | % | 100.00 | % | SERVICES | — | — | — | ||||||||||||||||||
F-206
Table of Contents
| % of Ownership Held | ||||||||||||||||||||||||||||
| by the Bank | Millions of Euros (a) | |||||||||||||||||||||||||||
| % of | Net Profit | Amount of | ||||||||||||||||||||||||||
| Voting | Capital and | (Loss) for | Ownership | |||||||||||||||||||||||||
| Entity | Location | Direct | Indirect | Rights (k) | Line of Business | Reserves | the Year | Interest | ||||||||||||||||||||
| Abbey National Secretariat Services Limited | United Kingdom | — | 100.00 | % | 100.00 | % | FUND AND PORTFOLIO MANAGEMENT | — | — | — | ||||||||||||||||||
| Abbey National Securities Inc. | United States | — | 100.00 | % | 100.00 | % | BROKER-DEALER | 35 | 7 | 31 | ||||||||||||||||||
| Abbey National September Leasing (3) Limited (f) | United Kingdom | — | 100.00 | % | 100.00 | % | LEASING | (10 | ) | — | — | |||||||||||||||||
| Abbey National Shelf Co. (4) Limited | United Kingdom | — | 100.00 | % | 100.00 | % | INACTIVE | — | — | — | ||||||||||||||||||
| Abbey National Sterling Capital plc | United Kingdom | — | 100.00 | % | 100.00 | % | FINANCE | 4 | — | — | ||||||||||||||||||
| Abbey National Treasury International (IOM) Limited | Isle of Man | — | 100.00 | % | 100.00 | % | BANKING | 11 | 1 | 8 | ||||||||||||||||||
| Abbey National Treasury Investments | United Kingdom | — | 100.00 | % | 100.00 | % | FINANCE | 331 | 22 | 251 | ||||||||||||||||||
| Abbey National Treasury Services (Trains Holdings) Limited | United Kingdom | — | 100.00 | % | 100.00 | % | HOLDING COMPANY | 197 | (7 | ) | 205 | |||||||||||||||||
| Abbey National Treasury Services (Transport Holdings) Limited | United Kingdom | — | 100.00 | % | 100.00 | % | HOLDING COMPANY | — | — | — | ||||||||||||||||||
| Abbey National Treasury Services Investments Limited | United Kingdom | — | 100.00 | % | 100.00 | % | FINANCE | 1,083 | 39 | 1,023 | ||||||||||||||||||
| Abbey National Treasury Services Overseas Holdings | United Kingdom | — | 100.00 | % | 100.00 | % | HOLDING COMPANY | 1,418 | 73 | 1,389 | ||||||||||||||||||
| Abbey National Treasury Services plc | United Kingdom | — | 100.00 | % | 100.00 | % | BANKING | 3,561 | 145 | 3,885 | ||||||||||||||||||
| Abbey National UK Investments | United Kingdom | — | 100.00 | % | 100.00 | % | FINANCE | 1,038 | 45 | 827 | ||||||||||||||||||
| Abbey Stockbrokers (Nominees) Limited | United Kingdom | — | 100.00 | % | 100.00 | % | BROKER-DEALER | — | — | — | ||||||||||||||||||
| Abbey Stockbrokers Limited | United Kingdom | — | 100.00 | % | 100.00 | % | BROKER-DEALER | 7 | — | 9 | ||||||||||||||||||
| Administración de Bancos Latinoamericanos Santander, S.L. | Spain | 24.11 | % | 75.89 | % | 100.00 | % | HOLDING COMPANY | 329 | 194 | 156 | |||||||||||||||||
| AEH Purchasing, Ltd. | Ireland | — | (b) | — | SECURITISATION | — | — | — | ||||||||||||||||||||
| Afisa S.A. | Chile | — | 99.99 | % | 99.99 | % | FUND MANAGEMENT COMPANY | 7 | — | 3 | ||||||||||||||||||
| Agencia de Seguros Santander, Ltda. | Colombia | — | 100.00 | % | 100.00 | % | INSURANCE | — | — | — | ||||||||||||||||||
| Agrícola Tabaibal, S.A. | Spain | — | 66.16 | % | 100.00 | % | AGRICULTURE AND LIVESTOCK | 1 | (1 | ) | — | |||||||||||||||||
| Agropecuaria Tapirapé S.A. | Brazil | — | 97.16 | % | 99.07 | % | AGRICULTURE AND LIVESTOCK | 2 | — | 1 | ||||||||||||||||||
| AKB Marketing Services Sp. Z.o.o. | Poland | — | 100.00 | % | 100.00 | % | MARKETING | 4 | 3 | — | ||||||||||||||||||
| Alcaidesa Holding, S.A. (consolidated) | Spain | — | 44.60 | % | 50.01 | % | PROPERTY | 77 | — | 28 | ||||||||||||||||||
| Alce Tenedora, S.L. | Spain | 99.99 | % | 0.01 | % | 100.00 | % | SECURITIES INVESTMENT | — | (9 | ) | — | ||||||||||||||||
| Alhambra 2000, S.L. | Spain | — | 89.19 | % | 100.00 | % | VEHICLE CLEANING | 3 | — | 3 | ||||||||||||||||||
| Aljarafe Golf, S.A. | Spain | — | 79.75 | % | 89.41 | % | PROPERTY | 14 | — | 1 | ||||||||||||||||||
| Aljardi SGPS, Lda. | Portugal | — | 100.00 | % | 100.00 | % | HOLDING COMPANY | 1,660 | 1 | 1,148 | ||||||||||||||||||
| Almacenadora Serfin, S.A. De C.V. | Mexico | — | 73.89 | % | 98.58 | % | WAREHOUSING | 1 | — | 1 | ||||||||||||||||||
| Almacenadora Somex, S.A. De C.V. | Mexico | — | 72.88 | % | 97.24 | % | WAREHOUSING | 7 | — | 1 | ||||||||||||||||||
| Altair Finance, plc. | Ireland | — | (b) | — | SECURITISATION | 1 | (1 | ) | — | |||||||||||||||||||
| Altamira Funding LLC. | United States | — | (b) | — | SECURITISATION | — | — | — | ||||||||||||||||||||
| Altec Brasil S.A. | Brazil | — | 100.00 | % | 100.00 | % | SERVICES | 14 | 1 | 22 | ||||||||||||||||||
| Altec S.A. | Chile | — | 100.00 | % | 100.00 | % | IT SERVICES | 6 | 3 | 20 | ||||||||||||||||||
| América Latina Tecnología de México, S.A. De C.V. | Mexico | 100.00 | % | — | 100.00 | % | IT SERVICES | 72 | (8 | ) | 47 | |||||||||||||||||
| América Latina Tecnología S.A. | Argentina | 87.42 | % | 12.58 | % | 100.00 | % | HOLDING COMPANY | 2 | — | 2 | |||||||||||||||||
| AN Structured Issues Limited | Jersey | — | 100.00 | % | 100.00 | % | FINANCE | — | — | — | ||||||||||||||||||
| Andaluza de Inversiones, S.A. | Spain | — | 100.00 | % | 100.00 | % | HOLDING COMPANY | 28 | 13 | 27 | ||||||||||||||||||
| ANDSH Limited. | United Kingdom | — | 100.00 | % | 100.00 | % | FINANCE | 3 | — | 3 | ||||||||||||||||||
| ANFP (US) LLC | United States | — | 100.00 | % | 100.00 | % | FINANCE | — | — | — | ||||||||||||||||||
| ANITCO Limited | United Kingdom | — | 100.00 | % | 100.00 | % | HOLDING COMPANY | — | — | — | ||||||||||||||||||
| Aquanima Brasil Ltda. | Brazil | — | 88.40 | % | 100.00 | % | e-COMMERCE | — | 1 | — | ||||||||||||||||||
| Aquanima Chile S.A. | Chile | — | 88.40 | % | 100.00 | % | e-COMMERCE | 1 | — | — | ||||||||||||||||||
| Argenline, S.A. | Uruguay | — | 100.00 | % | 100.00 | % | FINANCE | — | — | — | ||||||||||||||||||
| Asesora de Titulización, S.A., S.G.F.T. | Spain | 70.00 | % | 29.58 | % | 100.00 | % | ADVISORY SERVICES | 2 | — | 2 | |||||||||||||||||
| Asesoría Estratega, S.C. | Mexico | — | 85.00 | % | 100.00 | % | SERVICES | — | — | — | ||||||||||||||||||
| Aurum, S.A. | Chile | 0.80 | % | 99.20 | % | 100.00 | % | HOLDING COMPANY | (1 | ) | 3 | 68 | ||||||||||||||||
| Ausant Holding Gesellschaft m.b.H. | Austria | — | 100.00 | % | 100.00 | % | HOLDING COMPANY | 9 | — | 9 | ||||||||||||||||||
| Ausant Merchant Participations GMBH | Austria | — | 100.00 | % | 100.00 | % | HOLDING COMPANY | — | 8 | — | ||||||||||||||||||
| Aviación Regional Cántabra, A.I.E. | Spain | 73.58 | % | — | 73.58 | % | LEASING | 27 | 5 | 22 | ||||||||||||||||||
| Bajondillo, S.A. | Spain | — | 89.19 | % | 100.00 | % | PROPERTY | — | — | — | ||||||||||||||||||
| Baker Street Risk and Insurance (Guernsey) Limited (e) | Guernsey | — | 100.00 | % | 100.00 | % | INSURANCE BROKERAGE | 11 | 4 | 3 | ||||||||||||||||||
| Banco Alicantino de Comercio, S.A. | Spain | — | 89.19 | % | 100.00 | % | BANKING | 9 | — | 8 | ||||||||||||||||||
| Banco Banif, S.A. | Spain | 100.00 | % | — | 100.00 | % | BANKING | 215 | 56 | 84 | ||||||||||||||||||
| Banco de Albacete, S.A. | Spain | 100.00 | % | — | 100.00 | % | BANKING | 12 | — | 9 | ||||||||||||||||||
| Banco de Asunción, S.A. | Paraguay | — | 99.33 | % | 99.33 | % | BANKING | 1 | — | 34 | ||||||||||||||||||
| Banco de Venezuela, S.A., Banco Universal (j) | Venezuela | 96.78 | % | 1.64 | % | 98.42 | % | BANKING | 385 | 221 | 119 | |||||||||||||||||
| Banco Español de Crédito, S.A. | Spain | 88.12 | % | 1.07 | % | 89.19 | % | BANKING | 4,145 | 660 | 1,340 | |||||||||||||||||
| Banco Madesant — Sociedade Unipessoal, S.A. | Portugal | — | 100.00 | % | 100.00 | % | BANKING | 1,383 | 63 | 1,159 | ||||||||||||||||||
F-207
Table of Contents
| % of Ownership Held | ||||||||||||||||||||||||||||
| by the Bank | Millions of Euros (a) | |||||||||||||||||||||||||||
| % of | Net Profit | Amount of | ||||||||||||||||||||||||||
| Voting | Capital and | (Loss) for | Ownership | |||||||||||||||||||||||||
| Entity | Location | Direct | Indirect | Rights (k) | Line of Business | Reserves | the Year | Interest | ||||||||||||||||||||
| Banco Santander (Panamá), S.A. | Panama | — | 100.00 | % | 100.00 | % | BANKING | 7 | 1 | 55 | ||||||||||||||||||
| Banco Santander (Suisse) SA | Switzerland | — | 100.00 | % | 100.00 | % | BANKING | 148 | 36 | 15 | ||||||||||||||||||
| Banco Santander Bahamas International Limited | Bahamas | — | 100.00 | % | 100.00 | % | BANKING | 1,125 | 30 | 785 | ||||||||||||||||||
| Banco Santander Chile | Chile | — | 76.73 | % | 76.91 | % | BANKING | 1,541 | 421 | 1,156 | ||||||||||||||||||
| Banco Santander Colombia, S.A. | Colombia | — | 97.64 | % | 97.64 | % | BANKING | 139 | 6 | 444 | ||||||||||||||||||
| Banco Santander Consumer Portugal S.A. | Portugal | — | 100.00 | % | 100.00 | % | BANKING | 106 | 16 | 277 | ||||||||||||||||||
| Banco Santander International | United States | 95.89 | % | 4.11 | % | 100.00 | % | BANKING | 163 | 24 | 73 | |||||||||||||||||
| Banco Santander Perú S.A. | Peru | 99.00 | % | 1.00 | % | 100.00 | % | BANKING | 22 | (1 | ) | 22 | ||||||||||||||||
| Banco Santander Puerto Rico | Puerto Rico | — | 90.59 | % | 100.00 | % | BANKING | 402 | 16 | 306 | ||||||||||||||||||
| Banco Santander Río S.A. | Argentina | 8.23 | % | 91.07 | % | 99.30 | % | BANKING | 280 | 71 | 1,647 | |||||||||||||||||
| Banco Santander S.A. | Brazil | — | 98.08 | % | 98.08 | % | BANKING | 3,078 | 505 | 3,771 | ||||||||||||||||||
| Banco Santander Totta, S.A. | Portugal | — | 99.72 | % | 99.86 | % | BANKING | 1,416 | 343 | 2,343 | ||||||||||||||||||
| Banco Santander, S.A. | Uruguay | 90.93 | % | 9.07 | % | 100.00 | % | BANKING | 43 | 12 | 48 | |||||||||||||||||
| Banco Santander, S.A., Institución de Banca Múltiple, Grupo Financiero Santander | Mexico | — | 74.95 | % | 99.99 | % | BANKING | 3,150 | 683 | 1,647 | ||||||||||||||||||
| Banco Totta de Angola, SARL | Angola | — | 99.70 | % | 99.99 | % | BANKING | 54 | 14 | 19 | ||||||||||||||||||
| Banesto B2B, S.L. | Spain | — | 100.00 | % | 100.00 | % | IT | 2 | — | 1 | ||||||||||||||||||
| Banesto Banca Privada Gestión, S.A. S.G.I.I.C. | Spain | — | 89.19 | % | 100.00 | % | FUND MANAGEMENT COMPANY | 2 | — | 2 | ||||||||||||||||||
| Banesto Banca Privada Global, SICAV, S.A. | Spain | — | 81.07 | % | 90.89 | % | OPEN-END INVESTMENT COMPANY | 15 | — | 2 | ||||||||||||||||||
| Banesto Banco de Emisiones, S.A. | Spain | — | 89.19 | % | 100.00 | % | BANKING | 99 | 1 | 87 | ||||||||||||||||||
| Banesto Bolsa, S.A., Sdad. Valores y Bolsa | Spain | — | 89.19 | % | 100.00 | % | BROKER-DEALER | 93 | 9 | 31 | ||||||||||||||||||
| Banesto Delaware Inc. | United States | — | 89.19 | % | 100.00 | % | FINANCE | — | — | — | ||||||||||||||||||
| Banesto Factoring, S.A. Establecimiento Financiero de Crédito | Spain | — | 89.19 | % | 100.00 | % | FACTORING | 111 | 5 | 105 | ||||||||||||||||||
| Banesto Financial Products, Plc. | Ireland | — | 89.19 | % | 100.00 | % | FINANCE | — | — | — | ||||||||||||||||||
| Banesto Issuances, Ltd. | Cayman Islands | — | 89.19 | % | 100.00 | % | FINANCE | 1 | — | — | ||||||||||||||||||
| Banesto Renting, S.A. | Spain | — | 89.19 | % | 100.00 | % | FINANCE | 10 | 2 | 2 | ||||||||||||||||||
| Banesto Securities, Inc. | United States | — | 89.19 | % | 100.00 | % | FINANCE | 1 | 1 | 2 | ||||||||||||||||||
| Banesto Servicios y Tecnología Aplicada, S.A. | Spain | — | 100.00 | % | 100.00 | % | SERVICES | 4 | — | 4 | ||||||||||||||||||
| Banesto, S.A. | Spain | — | 89.19 | % | 100.00 | % | FINANCE | — | — | — | ||||||||||||||||||
| Banif Gestión, S.A., S.G.I.I.C. | Spain | — | 97.84 | % | 100.00 | % | FUND MANAGEMENT COMPANY | 23 | 2 | 15 | ||||||||||||||||||
| Banif Inmobiliario, S.A., Sole-Shareholder Company | Spain | — | 100.00 | % | 100.00 | % | PROPERTY | 1 | 2 | — | ||||||||||||||||||
| Bansa Santander S. A. | Chile | — | 99.99 | % | 99.99 | % | PROPERTY | 2 | — | 23 | ||||||||||||||||||
| Bansalease, S.A., E.F.C. | Spain | 100.00 | % | — | 100.00 | % | LEASING | 84 | 4 | 57 | ||||||||||||||||||
| Bansamex, S.A. | Spain | 50.00 | % | — | 50.00 | % | CARDS | 3 | 1 | 1 | ||||||||||||||||||
| Bansander, S.A., Sole-Shareholder Company | Spain | 100.00 | % | — | 100.00 | % | SECURITIES INVESTMENT | — | — | — | ||||||||||||||||||
| Bel Canto SICAV Erodiade | Luxembourg | — | 100.00 | % | 100.00 | % | OPEN-END INVESTMENT COMPANY | 1 | — | 1 | ||||||||||||||||||
| Beta Cero, S.A. | Spain | — | 78.49 | % | 88.00 | % | FINANCE | — | — | — | ||||||||||||||||||
| Brazil Foreign Diversified Payment Rights Finance Company | Cayman Islands | — | (b) | — | SECURITISATION | — | — | — | ||||||||||||||||||||
| Brettwood Limited | Jersey | — | 100.00 | % | 100.00 | % | SERVICES | — | — | — | ||||||||||||||||||
| BRS Investment, S.A. | Argentina | — | 100.00 | % | 100.00 | % | HOLDING COMPANY | 19 | 1 | 237 | ||||||||||||||||||
| BSN — Banco Santander de Negocios Portugal, S.A. | Portugal | — | 99.86 | % | 100.00 | % | BANKING | 78 | 38 | 28 | ||||||||||||||||||
| BST International Bank, Inc. | Puerto Rico | — | 99.72 | % | 100.00 | % | BANKING | 232 | 17 | 3 | ||||||||||||||||||
| Buhal Leasing, Ltd. | United Kingdom | 100.00 | % | — | 100.00 | % | LEASING | 2 | — | 2 | ||||||||||||||||||
| CA Premier Banking Limited | United Kingdom | — | 100.00 | % | 100.00 | % | BANKING | 5 | — | 5 | ||||||||||||||||||
| Caetra Iberia, S.L., Sole-Shareholder Company | Spain | — | 100.00 | % | 100.00 | % | HOLDING COMPANY | 4 | — | 3 | ||||||||||||||||||
| Caja de Emisiones con Garantía de Anualidades Debidas por el Estado, S.A. | Spain | — | 56.08 | % | 62.87 | % | FINANCE | — | — | — | ||||||||||||||||||
| Cambios Sol, S.A. | Spain | — | 89.19 | % | 100.00 | % | CURRENCY TRADING | — | — | 4 | ||||||||||||||||||
| Cántabra de Inversiones, S.A. | Spain | 100.00 | % | — | 100.00 | % | HOLDING COMPANY | 204 | (78 | ) | 218 | |||||||||||||||||
| Cantabric Financing, Plc. | Ireland | — | (b) | — | SECURITISATION | — | — | — | ||||||||||||||||||||
| Cántabro Catalana de Inversiones, S.A. | Spain | 100.00 | % | — | 100.00 | % | HOLDING COMPANY | 169 | 15 | 140 | ||||||||||||||||||
| Capital Riesgo Global, SCR de Régimen Simplificado, S.A. | Spain | 87.09 | % | 12.91 | % | 100.00 | % | VENTURE CAPITAL COMPANY | 366 | 34 | 321 | |||||||||||||||||
| Capital Variable SICAV, S.A. | Spain | — | 95.83 | % | 97.95 | % | OPEN-END INVESTMENT COMPANY | 7 | — | 7 | ||||||||||||||||||
| Carfax (Guernsey) Limited | Guernsey | — | 100.00 | % | 100.00 | % | INSURANCE BROKERAGE | 81 | 5 | 27 | ||||||||||||||||||
| Carpe Diem Salud, S.L. | Spain | 100.00 | % | — | 100.00 | % | SECURITIES INVESTMENT | — | — | — | ||||||||||||||||||
| Cartera Mobiliaria, S.A., SICAV | Spain | — | 74.49 | % | 89.63 | % | SECURITIES INVESTMENT | 598 | 15 | 201 | ||||||||||||||||||
| Casa de Bolsa Santander, S.A. de C.V., Grupo Financiero Santander | Mexico | — | 74.93 | % | 99.97 | % | BROKER-DEALER | 24 | 15 | 28 | ||||||||||||||||||
| Cater Allen Holdings Limited | United Kingdom | — | 100.00 | % | 100.00 | % | HOLDING COMPANY | 142 | — | 117 | ||||||||||||||||||
F-208
Table of Contents
| % of Ownership Held | ||||||||||||||||||||||||||||
| by the Bank | Millions of Euros (a) | |||||||||||||||||||||||||||
| % of | Net Profit | Amount of | ||||||||||||||||||||||||||
| Voting | Capital and | (Loss) for | Ownership | |||||||||||||||||||||||||
| Entity | Location | Direct | Indirect | Rights (k) | Line of Business | Reserves | the Year | Interest | ||||||||||||||||||||
| Cater Allen International Limited | United Kingdom | — | 100.00 | % | 100.00 | % | BROKER-DEALER | 337 | 50 | 161 | ||||||||||||||||||
| Cater Allen Limited | United Kingdom | — | 100.00 | % | 100.00 | % | BANKING | 240 | 25 | 303 | ||||||||||||||||||
| Cater Allen Lloyd’s Holdings Limited | United Kingdom | — | 100.00 | % | 100.00 | % | HOLDING COMPANY | (12 | ) | — | — | |||||||||||||||||
| Cater Allen Nominees (Jersey) Limited | Jersey | — | 100.00 | % | 100.00 | % | HOLDING COMPANY | — | — | — | ||||||||||||||||||
| Cater Allen Pensions Limited | United Kingdom | — | 100.00 | % | 100.00 | % | PENSION FUND MANAGEMENT COMPANY | — | — | — | ||||||||||||||||||
| Cater Allen Registrars Limited | Jersey | — | 100.00 | % | 100.00 | % | HOLDING COMPANY | — | — | — | ||||||||||||||||||
| Cater Allen Syndicate Management Limited | United Kingdom | — | 100.00 | % | 100.00 | % | ADVISORY SERVICES | 2 | — | — | ||||||||||||||||||
| Cater Allen Trust Company (Jersey) Limited | Jersey | — | 100.00 | % | 100.00 | % | ASSET MANAGEMENT COMPANY | — | — | — | ||||||||||||||||||
| Cater Tyndall Limited | United Kingdom | — | 100.00 | % | 100.00 | % | HOLDING COMPANY | 31 | (5 | ) | 162 | |||||||||||||||||
| Catmoll, S.L. | Spain | 100.00 | % | — | 100.00 | % | CONCESSION HOLDER | 8 | — | 6 | ||||||||||||||||||
| CB Extrobank | Russia | — | 100.00 | % | 100.00 | % | BANKING | 37 | (3 | ) | 44 | |||||||||||||||||
| Central Inmobiliaria de Santiago, S.A. de C.V. | Mexico | 100.00 | % | — | 100.00 | % | PROPERTY MANAGEMENT | 68 | (1 | ) | 73 | |||||||||||||||||
| Centro de Equipamientos Zona Oeste, S.A. | Spain | 93.62 | % | 6.38 | % | 100.00 | % | PROPERTY | (21 | ) | (42 | ) | 43 | |||||||||||||||
| Certidesa, S.L. | Spain | — | 100.00 | % | 100.00 | % | LEASE OF AIRCRAFT | 6 | (13 | ) | — | |||||||||||||||||
| Clínica Sear, S.A. | Spain | — | 45.11 | % | 50.58 | % | HEALTHCARE | 6 | (1 | ) | 1 | |||||||||||||||||
| Club Zaudin Golf, S.A. | Spain | — | 75.84 | % | 95.11 | % | SERVICES | 15 | — | 13 | ||||||||||||||||||
| Comercializadora Al-fin, S.A. de C.V. | Mexico | — | 85.00 | % | 100.00 | % | RETAIL TRADE | — | — | — | ||||||||||||||||||
| Corpoban, S.A. | Spain | — | 89.19 | % | 100.00 | % | SECURITIES INVESTMENT | 71 | 2 | 61 | ||||||||||||||||||
| Costa Canaria de Veneguera, S.A. | Spain | — | 66.16 | % | 74.18 | % | PROPERTY | 14 | (1 | ) | 9 | |||||||||||||||||
| Crawfall S.A. | Uruguay | 100.00 | % | — | 100.00 | % | SERVICES | 19 | (21 | ) | — | |||||||||||||||||
| Credisol, S.A. | Uruguay | — | 100.00 | % | 100.00 | % | CARDS | — | — | 6 | ||||||||||||||||||
| Crefisa, Inc. | Puerto Rico | 100.00 | % | — | 100.00 | % | FINANCE | 24 | (2 | ) | 17 | |||||||||||||||||
| Darep Limited | Ireland | — | 100.00 | % | 100.00 | % | REINSURANCE | 4 | — | 4 | ||||||||||||||||||
| Debt Management and Recovery Services Limited | United Kingdom | — | 100.00 | % | 100.00 | % | DEBT COLLECTION AND PAYMENT SERVICES | — | — | — | ||||||||||||||||||
| Depósitos Portuarios, S.A. | Spain | — | 89.19 | % | 100.00 | % | SERVICES | — | — | — | ||||||||||||||||||
| Desarrollo Informático, S.A. | Spain | — | 89.19 | % | 100.00 | % | IT | 2 | — | 2 | ||||||||||||||||||
| Digital Procurement Holdings N.V. | Netherlands | — | 88.40 | % | 100.00 | % | HOLDING COMPANY | 3 | 2 | 1 | ||||||||||||||||||
| Diners Club Spain, S.A. | Spain | 90.00 | % | — | 90.00 | % | CARDS | 9 | 3 | 7 | ||||||||||||||||||
| Dirección Estratega, S.C. | Mexico | — | 85.00 | % | 100.00 | % | SERVICES | — | — | — | ||||||||||||||||||
| Diseño e Integración de Soluciones, S.A. | Spain | — | 89.19 | % | 100.00 | % | IT | 2 | — | 1 | ||||||||||||||||||
| Drive ABS GP LLC | United States | — | 90.00 | % | 100.00 | % | INACTIVE | — | — | — | ||||||||||||||||||
| Drive ABS LP | United States | — | 90.00 | % | 100.00 | % | INACTIVE | 32 | — | 7 | ||||||||||||||||||
| Drive Auto Receivables Trust 2004-1 | United States | — | (b) | — | SECURITISATION | — | — | — | ||||||||||||||||||||
| Drive Auto Receivables Trust 2005-1 | United States | — | (b) | — | SECURITISATION | — | — | — | ||||||||||||||||||||
| Drive Auto Receivables Trust 2005-2 | United States | — | (b) | — | SECURITISATION | — | — | — | ||||||||||||||||||||
| Drive Auto Receivables Trust 2005-3 | United States | — | (b) | — | SECURITISATION | — | — | — | ||||||||||||||||||||
| Drive Auto Receivables Trust 2006-1 | United States | — | (b) | — | SECURITISATION | — | — | — | ||||||||||||||||||||
| Drive Auto Receivables Trust 2006-2 | United States | — | (b) | — | SECURITISATION | — | — | — | ||||||||||||||||||||
| Drive Consumer GP LLC | United States | — | 90.00 | % | 100.00 | % | INACTIVE | — | — | — | ||||||||||||||||||
| Drive Consumer LP | United States | — | 90.00 | % | 100.00 | % | INACTIVE | 24 | — | 2 | ||||||||||||||||||
| Drive Health & Welfare Benefit Plan | United States | — | 90.00 | % | 100.00 | % | SERVICES | — | 1 | — | ||||||||||||||||||
| Drive One LLC | United States | — | 90.00 | % | 100.00 | % | INACTIVE | — | — | — | ||||||||||||||||||
| Drive Receivables Corp. 10 | United States | — | 90.00 | % | 100.00 | % | SECURITISATION | — | — | — | ||||||||||||||||||
| Drive Receivables Corp. 11 | United States | — | 90.00 | % | 100.00 | % | SECURITISATION | — | — | — | ||||||||||||||||||
| Drive Receivables Corp. 12 | United States | — | 90.00 | % | 100.00 | % | SECURITISATION | — | — | — | ||||||||||||||||||
| Drive Receivables Corp. 7 | United States | — | 90.00 | % | 100.00 | % | SECURITISATION | — | — | — | ||||||||||||||||||
| Drive Receivables Corp. 8 | United States | — | 90.00 | % | 100.00 | % | SECURITISATION | — | — | — | ||||||||||||||||||
| Drive Receivables Corp. 9 | United States | — | 90.00 | % | 100.00 | % | SECURITISATION | — | — | — | ||||||||||||||||||
| Drive Residual Holdings GP LLC | United States | — | 90.00 | % | 100.00 | % | HOLDING COMPANY | — | — | — | ||||||||||||||||||
| Drive Residual Holdings LP | United States | — | 90.00 | % | 100.00 | % | AUXILIARY | — | — | — | ||||||||||||||||||
| Drive Trademark Holdings LP | United States | — | 90.00 | % | 100.00 | % | AUXILIARY | — | — | — | ||||||||||||||||||
| Drive VFC GP LLC | United States | — | 90.00 | % | 100.00 | % | INACTIVE | 26 | (78 | ) | — | |||||||||||||||||
| Drive VFC LP | United States | — | 90.00 | % | 100.00 | % | INACTIVE | — | — | — | ||||||||||||||||||
| Drive Warehouse GP LLC | United States | — | 90.00 | % | 100.00 | % | HOLDING COMPANY | — | — | — | ||||||||||||||||||
| Drive Warehouse LP | United States | — | 90.00 | % | 100.00 | % | AUXILIARY | — | — | — | ||||||||||||||||||
| Duchess Parade Investments Limited | United Kingdom | — | 100.00 | % | 100.00 | % | LEASING | 2 | — | 1 | ||||||||||||||||||
| Dudebasa, S.A. | Spain | — | 89.19 | % | 100.00 | % | FINANCE | 44 | 1 | 22 | ||||||||||||||||||
F-209
Table of Contents
| % of Ownership Held | ||||||||||||||||||||||||||||
| by the Bank | Millions of Euros (a) | |||||||||||||||||||||||||||
| % of | Net Profit | Amount of | ||||||||||||||||||||||||||
| Voting | Capital and | (Loss) for | Ownership | |||||||||||||||||||||||||
| Entity | Location | Direct | Indirect | Rights (k) | Line of Business | Reserves | the Year | Interest | ||||||||||||||||||||
| Efearvi, S.A. | Spain | — | 89.19 | % | 100.00 | % | PROPERTY | — | — | — | ||||||||||||||||||
| Efectividad en Medios de Pago, S.A. de C.V. | Mexico | 98.61 | % | 1.39 | % | 100.00 | % | BROKER-DEALER | 23 | 1 | 10 | |||||||||||||||||
| Elerco, S.A. | Spain | — | 89.19 | % | 100.00 | % | LEASING | 270 | 13 | 124 | ||||||||||||||||||
| Fábricas Agrupadas de Muñecas de Onil, S.A. (consolidated) (g) | Spain | — | 74.86 | % | 74.86 | % | HOLDING COMPANY | 18 | (6 | ) | 16 | |||||||||||||||||
| FC Factor S.r.l. | Italy | — | 100.00 | % | 100.00 | % | FACTORING | 2 | (1 | ) | 1 | |||||||||||||||||
| FFB — Participaçoes e Serviços, Sociedade Unipessoal, S.A. | Portugal | — | 100.00 | % | 100.00 | % | HOLDING COMPANY | 3,586 | 147 | 1,020 | ||||||||||||||||||
| Fideicomiso 100740 SLPT | Mexico | — | 74.95 | % | 100.00 | % | FINANCE | 41 | 3 | 28 | ||||||||||||||||||
| Fideicomiso Financiero Río Personales I | Argentina | — | (b) | — | SECURITIES | 4 | 2 | — | ||||||||||||||||||||
| Fideicomiso GFSSLPT Banca Serfín, S.A. | Mexico | — | 74.95 | % | 100.00 | % | FINANCE | 41 | 1 | 25 | ||||||||||||||||||
| Fideicomiso Super Letras Hipotecarias Clase I | Argentina | — | (b) | — | SECURITIES | 1 | — | — | ||||||||||||||||||||
| Fideicomiso Super Letras Hipotecarias Clase II | Argentina | — | (b) | — | SECURITIES | 3 | — | — | ||||||||||||||||||||
| Financiación Banesto 1, F.T.A. | Spain | — | (b) | — | SECURITISATION | — | — | — | ||||||||||||||||||||
| FINANCE Alcanza, S.A. de C.V., Sociedad FINANCE de Objeto Múltiple, Entidad Regulada | Mexico | — | 85.00 | % | 100.00 | % | FINANCE | 6 | (2 | ) | 3 | |||||||||||||||||
| First National Motor Business Limited | United Kingdom | — | 100.00 | % | 100.00 | % | LEASING | — | — | — | ||||||||||||||||||
| First National Motor Contracts Limited | United Kingdom | — | 100.00 | % | 100.00 | % | LEASING | (1 | ) | — | — | |||||||||||||||||
| First National Motor Facilities Limited | United Kingdom | — | 100.00 | % | 100.00 | % | LEASING | — | — | — | ||||||||||||||||||
| First National Motor Finance Limited | United Kingdom | — | 100.00 | % | 100.00 | % | ADVISORY SERVICES | — | — | — | ||||||||||||||||||
| First National Motor Leasing Limited | United Kingdom | — | 100.00 | % | 100.00 | % | LEASING | — | — | — | ||||||||||||||||||
| First National Motor plc | United Kingdom | — | 100.00 | % | 100.00 | % | LEASING | (49 | ) | 32 | — | |||||||||||||||||
| Fomento e Inversiones, S.A. | Spain | 100.00 | % | — | 100.00 | % | HOLDING COMPANY | 18 | 24 | 17 | ||||||||||||||||||
| Fondo de Titulización de Activos Santander 1 | Spain | — | (b) | — | SECURITISATION | — | — | — | ||||||||||||||||||||
| Fondo de Titulización de Activos Santander Empresas 1 | Spain | — | (b) | — | SECURITISATION | — | — | — | ||||||||||||||||||||
| Fondo de Titulización de Activos Santander Empresas 2 | Spain | — | (b) | — | SECURITISATION | — | — | — | ||||||||||||||||||||
| Fondo de Titulización de Activos Santander Empresas 3 | Spain | — | (b) | — | SECURITISATION | — | — | — | ||||||||||||||||||||
| Fondo de Titulización de Activos Santander Empresas 4 | Spain | — | (b) | — | SECURITISATION | — | — | — | ||||||||||||||||||||
| Fondo de Titulización de Activos Santander Público 1 | Spain | — | (b) | — | SECURITISATION | — | — | — | ||||||||||||||||||||
| Fondo de Titulización Santander Financiación 1 | Spain | — | (b) | — | SECURITISATION | — | — | — | ||||||||||||||||||||
| Fondo de Titulización Santander Financiación 2 | Spain | — | (b) | — | SECURITISATION | — | — | — | ||||||||||||||||||||
| Fondos Santander, S.A. Administradora de Fondos de Inversión | Uruguay | — | 100.00 | % | 100.00 | % | FUND MANAGEMENT COMPANY | — | — | 1 | ||||||||||||||||||
| Formación Integral, S.A. | Spain | — | 89.19 | % | 100.00 | % | TRAINING | 1 | — | 1 | ||||||||||||||||||
| Fortensky Trading, Ltd. | Ireland | — | 100.00 | % | 100.00 | % | FINANCE | — | — | — | ||||||||||||||||||
| FTA Santander Consumer Spain Auto 06 | Spain | — | (b) | — | SECURITISATION | 4 | (3 | ) | — | |||||||||||||||||||
| FTPYME Banesto 2 Fondo de Titulización de Activos | Spain | — | (b) | — | SECURITISATION | — | — | — | ||||||||||||||||||||
| FTPYME Santander 2 Fondo de Titulización de Activos | Spain | — | (b) | — | SECURITISATION | — | — | — | ||||||||||||||||||||
| Gamo Tenedora, S.L. | Spain | — | 100.00 | % | 100.00 | % | SERVICES | — | — | — | ||||||||||||||||||
| Gedinver e Inmuebles, S.A. | Spain | — | 89.19 | % | 100.00 | % | FINANCE | 5 | 1 | 6 | ||||||||||||||||||
| Geoban UK Limited | United Kingdom | — | 100.00 | % | 100.00 | % | SERVICES | — | — | — | ||||||||||||||||||
| Geoban, S.A. | Spain | 99.99 | % | 0.01 | % | 100.00 | % | SERVICES | 9 | (2 | ) | 12 | ||||||||||||||||
| Gesban Servicios Administrativos Globales, S.L. | Spain | 99.99 | % | 0.01 | % | 100.00 | % | SERVICES | 1 | — | 1 | |||||||||||||||||
| Gescoban Soluciones, S.A. | Spain | — | 89.19 | % | 100.00 | % | FINANCE | 2 | 1 | 1 | ||||||||||||||||||
| Gestión de Actividades Tecnológicas, S.A. | Spain | 99.98 | % | 0.02 | % | 100.00 | % | SECURITIES INVESTMENT | (20 | ) | 1 | — | ||||||||||||||||
| Gestión de Instalaciones Fotovoltáicas, S.L., Sole-Shareholder Company | Spain | — | 100.00 | % | 100.00 | % | ELECTRICITY | — | — | — | ||||||||||||||||||
| Gestión Industrial Hispamer, S.A. | Spain | 100.00 | % | 0.01 | % | 100.00 | % | SECURITIES INVESTMENT | (37 | ) | — | — | ||||||||||||||||
| Gestión Santander, S.A. de C.V., Sociedad Operadora de Sociedades de Inversión, Grupo Financiero Santander | Mexico | — | 74.96 | % | 100.00 | % | FINANCE | 14 | 9 | 1 | ||||||||||||||||||
| Gire, S.A. | Argentina | — | 57.92 | % | 58.33 | % | COLLECTION AND PAYMENT SERVICES | 5 | 3 | 1 | ||||||||||||||||||
| Golden Bar (Securitisation) S.r.l. | Italy | — | (b) | — | SECURITISATION | — | — | — | ||||||||||||||||||||
| Grupo Alcanza, S.A. de C.V. | Mexico | — | 85.00 | % | 85.00 | % | HOLDING COMPANY | 25 | (2 | ) | 29 | |||||||||||||||||
| Grupo Empresarial Santander, S.L. | Spain | 99.11 | % | 0.89 | % | 100.00 | % | HOLDING COMPANY | 3,066 | 921 | 4,005 | |||||||||||||||||
| Grupo Eurociber, S.A. | Spain | — | 100.00 | % | 100.00 | % | SERVICES | — | — | — | ||||||||||||||||||
| Grupo Financiero Santander, S.A. de C.V. | Mexico | 74.75 | % | 0.21 | % | 74.96 | % | HOLDING COMPANY | 3,264 | 720 | 1,883 | |||||||||||||||||
| Grupo Inmobiliario La Corporación Banesto, S.A. | Spain | — | 89.19 | % | 100.00 | % | SECURITIES INVESTMENT | 11 | 1 | 22 | ||||||||||||||||||
| Grupo Santander Perú, S.A. | Peru | — | 100.00 | % | 100.00 | % | HOLDING COMPANY | 7 | (3 | ) | 328 | |||||||||||||||||
| Guaranty Car, S.A., Sole-Shareholder Company | Spain | — | 100.00 | % | 100.00 | % | AUTOMOTIVE | 2 | 1 | — | ||||||||||||||||||
| H.B.F. Aluguer e Comercio de Viaturas, S.A. | Portugal | — | 100.00 | % | 100.00 | % | FULL-SERVICE LEASE | — | — | — | ||||||||||||||||||
| H.B.F. Auto-Renting, S.A., Sole-Shareholder Company | Spain | — | 100.00 | % | 100.00 | % | HOLDING COMPANY | 10 | 1 | 2 | ||||||||||||||||||
| Hipotebansa EFC, S.A. | Spain | 100.00 | % | — | 100.00 | % | MORTGAGE LOAN COMPANY | 46 | 4 | 36 | ||||||||||||||||||
F-210
Table of Contents
| % of Ownership Held | ||||||||||||||||||||||||||||
| by the Bank | Millions of Euros (a) | |||||||||||||||||||||||||||
| % of | Net Profit | Amount of | ||||||||||||||||||||||||||
| Voting | Capital and | (Loss) for | Ownership | |||||||||||||||||||||||||
| Entity | Location | Direct | Indirect | Rights (k) | Line of Business | Reserves | the Year | Interest | ||||||||||||||||||||
| Hipototta No. 1 FTC | Portugal | — | (b) | — | SECURITISATION | 3 | (1 | ) | — | |||||||||||||||||||
| Hipototta No. 1 plc | Ireland | — | (b) | — | SECURITISATION | (3 | ) | — | — | |||||||||||||||||||
| Hipototta No. 2 FTC | Portugal | — | (b) | — | SECURITISATION | 1 | (1 | ) | — | |||||||||||||||||||
| Hipototta No. 2 plc | Ireland | — | (b) | — | SECURITISATION | (9 | ) | — | — | |||||||||||||||||||
| Hipototta No. 3 FTC | Portugal | — | (b) | — | SECURITISATION | 9 | (2 | ) | — | |||||||||||||||||||
| Hipototta No. 3 plc | Ireland | — | (b) | — | SECURITISATION | (14 | ) | — | — | |||||||||||||||||||
| Hipototta No. 4 FTC | Portugal | — | (b) | — | SECURITISATION | 7 | (3 | ) | — | |||||||||||||||||||
| Hipototta No. 4 plc | Ireland | — | (b) | — | SECURITISATION | (12 | ) | (2 | ) | — | ||||||||||||||||||
| Hipototta No. 5 FTC | Portugal | — | (b) | — | SECURITISATION | — | — | — | ||||||||||||||||||||
| Hipototta No. 5 plc | Ireland | — | (b) | — | SECURITISATION | — | — | — | ||||||||||||||||||||
| Hipototta No. 6 FTC | Portugal | — | (b) | — | SECURITISATION | — | — | — | ||||||||||||||||||||
| Hipototta No. 6 plc | Ireland | — | (b) | — | SECURITISATION | — | — | — | ||||||||||||||||||||
| Hispamer Renting, S.A. | Spain | — | 100.00 | % | 100.00 | % | FULL-SERVICE LEASE | 9 | 6 | 1 | ||||||||||||||||||
| Holbah II Limited | Bahamas | — | 100.00 | % | 100.00 | % | HOLDING COMPANY | 980 | (8 | ) | 1,115 | |||||||||||||||||
| Holbah Limited | Bahamas | — | 100.00 | % | 100.00 | % | HOLDING COMPANY | 204 | 195 | 261 | ||||||||||||||||||
| Holmes Financing (Nº1) plc | United Kingdom | — | (b) | — | FINANCE | 1 | — | — | ||||||||||||||||||||
| Holmes Financing (Nº10) plc | United Kingdom | — | (b) | — | FINANCE | (1 | ) | (23 | ) | — | ||||||||||||||||||
| Holmes Financing (Nº2) plc | United Kingdom | — | (b) | — | FINANCE | — | — | — | ||||||||||||||||||||
| Holmes Financing (Nº3) plc | United Kingdom | — | (b) | — | FINANCE | — | — | — | ||||||||||||||||||||
| Holmes Financing (Nº4) plc | United Kingdom | — | (b) | — | FINANCE | — | — | — | ||||||||||||||||||||
| Holmes Financing (Nº5) plc | United Kingdom | — | (b) | — | FINANCE | — | — | — | ||||||||||||||||||||
| Holmes Financing (Nº6) plc | United Kingdom | — | (b) | — | FINANCE | — | — | — | ||||||||||||||||||||
| Holmes Financing (Nº7) plc | United Kingdom | — | (b) | — | FINANCE | — | — | — | ||||||||||||||||||||
| Holmes Financing (Nº8) plc | United Kingdom | — | (b) | — | FINANCE | (1 | ) | 2 | — | |||||||||||||||||||
| Holmes Financing (Nº9) plc | United Kingdom | — | (b) | — | FINANCE | — | — | — | ||||||||||||||||||||
| Holmes Funding Limited | United Kingdom | — | (b) | — | FINANCE | 58 | 97 | — | ||||||||||||||||||||
| Holmes Holdings Limited | United Kingdom | — | (b) | — | HOLDING COMPANY | — | — | — | ||||||||||||||||||||
| Holmes Master Issuer plc | United Kingdom | — | (b) | — | FINANCE | — | (15 | ) | — | |||||||||||||||||||
| Holmes Trustees Limited | United Kingdom | — | (b) | — | FINANCE | — | — | — | ||||||||||||||||||||
| Holneth B.V. | Netherlands | — | 100.00 | % | 100.00 | % | HOLDING COMPANY | 196 | 147 | 9 | ||||||||||||||||||
| HSH Delaware L.P. (c) | United States | — | 69.25 | % | — | HOLDING COMPANY | 42 | — | 36 | |||||||||||||||||||
| Hualle, S.A. | Spain | — | 89.19 | % | 100.00 | % | SECURITIES INVESTMENT | 1 | 41 | 5 | ||||||||||||||||||
| Ibérica de Compras Corporativas, S.L. | Spain | 80.63 | % | 7.77 | % | 89.00 | % | e-COMMERCE | 3 | 2 | 4 | |||||||||||||||||
| IEM (Holland) Aircraft Lease B.V. | Netherlands | — | 100.00 | % | 100.00 | % | LEASING | — | — | — | ||||||||||||||||||
| IEM 757 Leasing I B.V. | Netherlands | — | 100.00 | % | 100.00 | % | LEASING | — | — | — | ||||||||||||||||||
| IEM Airfinance B.V. | Netherlands | — | 100.00 | % | 100.00 | % | LEASING | (1 | ) | — | — | |||||||||||||||||
| IEM Lease Aircraft B.V. | Netherlands | — | 100.00 | % | 100.00 | % | LEASING | — | — | — | ||||||||||||||||||
| Infraestructuras Americanas, S.L. | Spain | — | 100.00 | % | 100.00 | % | HOLDING COMPANY | — | — | — | ||||||||||||||||||
| Ingeniería de Software Bancario, S.L. | Spain | 100.00 | % | — | 100.00 | % | IT SERVICES | 83 | (21 | ) | 76 | |||||||||||||||||
| Inmobiliaria Lerma y Amazonas, S.A. De C.V. | Mexico | — | 74.93 | % | 100.00 | % | PROPERTY MANAGEMENT | 18 | 1 | 11 | ||||||||||||||||||
| Inmo Francia 2, S.A. | Spain | — | 100.00 | % | 100.00 | % | PROPERTY | 8 | — | 8 | ||||||||||||||||||
| Inmuebles B de V 1985 C.A. | Venezuela | — | 35.63 | % | 100.00 | % | PROPERTY MANAGEMENT | — | — | — | ||||||||||||||||||
| Instituto Santander Serfin, A.C. | Mexico | — | 74.95 | % | 100.00 | % | NOT-FOR-PROFIT INSTITUTE | 2 | — | — | ||||||||||||||||||
| Insurance Funding Solutions Limited | United Kingdom | — | 100.00 | % | 100.00 | % | FINANCE | (35 | ) | 19 | — | |||||||||||||||||
| Integrated Securities Services, S.A. | Spain | — | 100.00 | % | 100.00 | % | SERVICES | 1 | — | 1 | ||||||||||||||||||
| Integritas (Canada) Trustee Corporation Ltd. | Canada | 100.00 | % | — | 100.00 | % | ASSET MANAGEMENT COMPANY | — | — | — | ||||||||||||||||||
| Integritas New Zealand Ltd. | New Zealand | — | 100.00 | % | 100.00 | % | ASSET MANAGEMENT COMPANY | — | — | — | ||||||||||||||||||
| Integritas Trust SA | Switzerland | — | 100.00 | % | 100.00 | % | ASSET MANAGEMENT COMPANY | 1 | — | — | ||||||||||||||||||
| Internacional Compañía Seguros de Vida, S.A. | Argentina | — | 59.20 | % | 59.20 | % | INSURANCE | 18 | 19 | 10 | ||||||||||||||||||
| Inversiones Marítimas del Mediterráneo, S.A. | Spain | 100.00 | % | — | 100.00 | % | HOLDING COMPANY | 2 | 1 | 1 | ||||||||||||||||||
| Inversiones Tesoreras SICAV, S.A. | Spain | — | 76.32 | % | 76.32 | % | OPEN-END INVESTMENT COMPANY | 13 | — | 8 | ||||||||||||||||||
| Inversiones Turísticas, S.A. | Spain | — | 89.19 | % | 100.00 | % | HOSPITALITY | 34 | 1 | 32 | ||||||||||||||||||
| Isban DE GmbH | Germany | — | 100.00 | % | 100.00 | % | IT SERVICES | — | 9 | — | ||||||||||||||||||
| Isban U.K., Ltd. | United Kingdom | — | 100.00 | % | 100.00 | % | IT SERVICES | 2 | 2 | — | ||||||||||||||||||
| ISBAN PT — Engenheria e Software Bancário, S.A. | Portugal | — | 99.93 | % | 100.00 | % | IT SERVICES | 1 | — | — | ||||||||||||||||||
| Island Insurance Corporation | Puerto Rico | — | 90.59 | % | 100.00 | % | INSURANCE | 4 | — | 3 | ||||||||||||||||||
| IT Car — Aluguer e Comércio de Automóveis, S.A. | Portugal | — | 100.00 | % | 100.00 | % | LEASING | 3 | — | 2 | ||||||||||||||||||
F-211
Table of Contents
| % of Ownership Held | ||||||||||||||||||||||||||||
| by the Bank | Millions of Euros (a) | |||||||||||||||||||||||||||
| % of | Net Profit | Amount of | ||||||||||||||||||||||||||
| Voting | Capital and | (Loss) for | Ownership | |||||||||||||||||||||||||
| Entity | Location | Direct | Indirect | Rights (k) | Line of Business | Reserves | the Year | Interest | ||||||||||||||||||||
| Itasant Sociedade Gestora de Participaçoes Sociais Sociedade Unipessoal, Lda. | Portugal | — | 100.00 | % | 100.00 | % | HOLDING COMPANY | 302 | (20 | ) | 92 | |||||||||||||||||
| J.C. Flowers II-A L.P. (c) | Canada | — | 69.40 | % | — | HOLDING COMPANY | 16 | (2 | ) | 39 | ||||||||||||||||||
| James Hay Administration Company Limited | United Kingdom | — | 100.00 | % | 100.00 | % | FUND AND PORTFOLIO MANAGEMENT | 12 | 5 | 12 | ||||||||||||||||||
| James Hay Holdings Limited | United Kingdom | — | 100.00 | % | 100.00 | % | HOLDING COMPANY | (9 | ) | 1 | 252 | |||||||||||||||||
| James Hay Insurance Company Limited | Jersey | — | 100.00 | % | 100.00 | % | INSURANCE BROKERAGE | 17 | 1 | 16 | ||||||||||||||||||
| James Hay Pension Trustees Limited | United Kingdom | — | 100.00 | % | 100.00 | % | ASSET MANAGEMENT COMPANY | 3 | — | 3 | ||||||||||||||||||
| James Hay Wrap Managers Limited | United Kingdom | — | 100.00 | % | 100.00 | % | FUND AND PORTFOLIO MANAGEMENT | 4 | — | 4 | ||||||||||||||||||
| JCF II-A Special AIV K L.P. (m) | Canada | — | 69.53 | % | — | HOLDING COMPANY | — | — | — | |||||||||||||||||||
| La Unión Resinera Española, S.A. (consolidated) | Spain | 74.87 | % | 21.28 | % | 96.23 | % | CHEMICALS | 50 | — | 28 | |||||||||||||||||
| Laboratorios Indas, S.A. (e) | Spain | — | 73.41 | % | 100.00 | % | PHARMACEUTICALS | 147 | 10 | 27 | ||||||||||||||||||
| Laparanza, S.A. (c) | Spain | 61.59 | % | — | 61.59 | % | AGRICULTURE AND LIVESTOCK | 28 | 1 | 16 | ||||||||||||||||||
| Larix Chile Inversiones, Ltda. | Chile | — | 89.19 | % | 100.00 | % | PROPERTY | — | — | — | ||||||||||||||||||
| Larix Limited | Isle of Man | — | 89.19 | % | 100.00 | % | PROPERTY | 2 | — | 1 | ||||||||||||||||||
| Latinoenvíos, S.A. | Spain | 100.00 | % | — | 100.00 | % | IMMIGRANT REMITTANCES | 1 | — | 1 | ||||||||||||||||||
| LLC Amstoun | Russia | — | 100.00 | % | 100.00 | % | INACTIVE | 1 | — | 8 | ||||||||||||||||||
| LLC Finance Analize | Russia | — | 100.00 | % | 100.00 | % | INACTIVE | 6 | — | 8 | ||||||||||||||||||
| LLC Fincommerts | Russia | — | 100.00 | % | 100.00 | % | INACTIVE | 1 | — | 8 | ||||||||||||||||||
| LLC Firm Knommunlnz Stroi | Russia | — | 100.00 | % | 100.00 | % | INACTIVE | 3 | — | 16 | ||||||||||||||||||
| LLC Mark Strit | Russia | — | 100.00 | % | 100.00 | % | INACTIVE | 1 | — | 8 | ||||||||||||||||||
| Luresa Inmobiliaria, S.A. | Spain | — | 96.14 | % | 100.00 | % | PROPERTY | 19 | 1 | 9 | ||||||||||||||||||
| Luri 1, S.A. | Spain | — | 5.58 | % | 100.00 | % | PROPERTY | 101 | 2 | 6 | ||||||||||||||||||
| Luri 2, S.A. | Spain | — | 4.81 | % | 100.00 | % | PROPERTY | 101 | 1 | 5 | ||||||||||||||||||
| Luri Land, S.A. | Belgium | — | 5.15 | % | 100.00 | % | PROPERTY | 6 | — | — | ||||||||||||||||||
| MAC No. 1 Limited (i) | United Kingdom | — | (b) | — | MORTGAGE LOAN COMPANY | — | — | — | ||||||||||||||||||||
| Madeisisa — SGPS Sociedade Unipessoal, Lda. | Portugal | — | 99.72 | % | 100.00 | % | HOLDING COMPANY | 9 | — | 3 | ||||||||||||||||||
| Marylebone Road CBO 3 BV | Netherlands | — | (b) | — | FINANCE | — | — | — | ||||||||||||||||||||
| Mata Alta, S.L. | Spain | — | 61.59 | % | 100.00 | % | PROPERTY | — | — | — | ||||||||||||||||||
| Mercado de Dinero, S.A. | Spain | — | 89.19 | % | 100.00 | % | SECURITIES INVESTMENT | — | — | — | ||||||||||||||||||
| Merciver, S.L. | Spain | — | 89.19 | % | 100.00 | % | SHIPPING COMPANY | — | — | — | ||||||||||||||||||
| Moneda y Crédito, S.L. | Spain | 50.00 | % | — | 100.00 | % | ADVERTISING | — | — | — | ||||||||||||||||||
| Multifinance Corporation Limited (1) | Malta | — | 99.00 | % | 99.00 | % | HOLDING COMPANY | — | — | — | ||||||||||||||||||
| Multinegocios S.A. | Chile | — | (b) | — | ADVISORY SERVICES | — | — | — | ||||||||||||||||||||
| MultiRent — Aluguer e Comércio de Automóveis, S.A. | Portugal | — | 60.00 | % | 100.00 | % | FULL-SERVICE LEASE | (4 | ) | — | 17 | |||||||||||||||||
| Multiservicios de Negocios Limitada | Chile | — | (b) | — | FINANCIAL SERVICES | — | — | — | ||||||||||||||||||||
| N&P (B.E.S.) Loans Limited | United Kingdom | — | 100.00 | % | 100.00 | % | LEASING | 148 | 6 | 132 | ||||||||||||||||||
| Naviera Mirambel, S.L. | Spain | — | 100.00 | % | 100.00 | % | FINANCE | — | — | — | ||||||||||||||||||
| Naviera Trans Gas, A.I.E. | Spain | 99.99 | % | 0.01 | % | 100.00 | % | SHIPPING COMPANY | 35 | 6 | 35 | |||||||||||||||||
| NIB Special Investors IV-A LP (c) | Canada | — | 99.51 | % | — | HOLDING COMPANY | 43 | 12 | 49 | |||||||||||||||||||
| NIB Special Investors IV-B LP (c) | Canada | — | 96.00 | % | — | HOLDING COMPANY | 34 | 4 | 29 | |||||||||||||||||||
| Norbest A.S. | Norway | 7.94 | % | 92.06 | % | 100.00 | % | SECURITIES INVESTMENT | 506 | (133 | ) | 473 | ||||||||||||||||
| Nova Bostwick (Portugal) Fabrica de Portas Metalicas, Ltd. (c) | Portugal | — | 99.72 | % | 100.00 | % | DOOR MANUFACTURE | — | — | — | ||||||||||||||||||
| NW Services CO. | United States | — | 88.40 | % | 100.00 | % | e-COMMERCE | 1 | — | 1 | ||||||||||||||||||
| Oil-Dor, S.A. | Spain | — | 89.19 | % | 100.00 | % | FINANCE | 147 | 2 | 109 | ||||||||||||||||||
| Open Bank Santander Consumer, S.A. | Spain | — | 100.00 | % | 100.00 | % | BANKING | 44 | 23 | 47 | ||||||||||||||||||
| Operadora de Derivados Serfin, S.A. De C.V. | Mexico | — | 74.95 | % | 100.00 | % | FINANCE | — | — | — | ||||||||||||||||||
| OPQR s.r.o. | Slovakia | — | 100.00 | % | 100.00 | % | FINANCE | — | — | — | ||||||||||||||||||
| Optimal Alternative Investments, S.G.I.I.C., S.A. | Spain | — | 100.00 | % | 100.00 | % | FUND MANAGEMENT COMPANY | 2 | (1 | ) | 2 | |||||||||||||||||
| Optimal Investment Services SA | Switzerland | — | 99.99 | % | 99.99 | % | FUND MANAGEMENT COMPANY | 30 | 16 | 5 | ||||||||||||||||||
| Pan American Bank Limited | Bahamas | — | 100.00 | % | 100.00 | % | BANKING | 2 | — | 21 | ||||||||||||||||||
| Parasant SA | Switzerland | 100.00 | % | — | 100.00 | % | HOLDING COMPANY | 1,116 | (1 | ) | 1,089 | |||||||||||||||||
| Patagon Euro, S.L. | Spain | 100.00 | % | — | 100.00 | % | HOLDING COMPANY | 672 | 26 | 587 | ||||||||||||||||||
| PECOH Limited | United Kingdom | — | (b) | — | FINANCE | — | — | — | ||||||||||||||||||||
| Peninsular, S.A.R.L. | France | 99.99 | % | — | 99.99 | % | PROPERTY | 1 | — | 9 | ||||||||||||||||||
| Pereda Gestión, S.A. | Spain | 99.99 | % | 0.01 | % | 100.00 | % | HOLDING COMPANY | (23 | ) | 61 | 4 | ||||||||||||||||
| Pingham International, S.A. | Uruguay | — | 100.00 | % | 100.00 | % | SERVICES | — | — | — | ||||||||||||||||||
| Polskie Towarzystwo Finansowe S.A. | Poland | — | 100.00 | % | 100.00 | % | SERVICES | 3 | — | 35 | ||||||||||||||||||
| Polyfinances Holding Limited (1) | Malta | — | 100.00 | % | 100.00 | % | HOLDING COMPANY | — | — | — | ||||||||||||||||||
F-212
Table of Contents
| % of Ownership Held | ||||||||||||||||||||||||||||
| by the Bank | Millions of Euros (a) | |||||||||||||||||||||||||||
| % of | Net Profit | Amount of | ||||||||||||||||||||||||||
| Voting | Capital and | (Loss) for | Ownership | |||||||||||||||||||||||||
| Entity | Location | Direct | Indirect | Rights (k) | Line of Business | Reserves | the Year | Interest | ||||||||||||||||||||
| Polyfinances, S.A. | Luxembourg | — | 100.00 | % | 100.00 | % | HOLDING COMPANY | — | — | — | ||||||||||||||||||
| Portada, S.A. | Chile | — | 96.17 | % | 96.17 | % | FINANCE | 6 | — | 5 | ||||||||||||||||||
| Portal Universia Argentina, S.A. | Argentina | — | 94.50 | % | 94.50 | % | INTERNET | 1 | (1 | ) | — | |||||||||||||||||
| Portal Universia Portugal, Prestaçao de Serviços de Informática, S.A. | Portugal | — | 100.00 | % | 100.00 | % | INTERNET | 1 | — | — | ||||||||||||||||||
| Portal Universia, S.A. | Spain | — | 67.77 | % | 67.77 | % | INTERNET | 5 | (1 | ) | 4 | |||||||||||||||||
| Porterbrook Leasing Company Limited | United Kingdom | — | 100.00 | % | 100.00 | % | LEASING | 625 | 93 | 420 | ||||||||||||||||||
| Porterbrook Leasing Company MEBO Limited | United Kingdom | — | 100.00 | % | 100.00 | % | HOLDING COMPANY | 151 | (4 | ) | 678 | |||||||||||||||||
| Porterbrook Limited | United Kingdom | — | 100.00 | % | 100.00 | % | HOLDING COMPANY | 363 | (14 | ) | 407 | |||||||||||||||||
| Porterbrook Maintenance Limited | United Kingdom | — | 100.00 | % | 100.00 | % | MAINTENANCE SERVICES | 153 | 7 | — | ||||||||||||||||||
| Préstamos de Consumo, S.A. | Argentina | — | 100.00 | % | 100.00 | % | FINANCE | — | — | 7 | ||||||||||||||||||
| Procura Digital de Venezuela, S.A. | Venezuela | — | 88.40 | % | 100.00 | % | e-COMMERCE | 1 | — | 2 | ||||||||||||||||||
| Procuradigital S. de R.L. de C.V. | Mexico | — | 88.40 | % | 100.00 | % | e-COMMERCE | 1 | — | 1 | ||||||||||||||||||
| Produban Servicios Informáticos Generales, S.L. | Spain | 98.00 | % | 2.00 | % | 100.00 | % | SERVICES | (11 | ) | (2 | ) | — | |||||||||||||||
| Produban Serviços de Informática S.A. | Brazil | — | 98.08 | % | 100.00 | % | BROKER-DEALER | 4 | — | 5 | ||||||||||||||||||
| Programa Hogar Montigalá, S.A. | Spain | — | 89.19 | % | 100.00 | % | PROPERTY | 7 | — | 7 | ||||||||||||||||||
| Promoción de Servicios Integrales, S.A. De C.V. | Mexico | — | 100.00 | % | 100.00 | % | SERVICES | — | — | — | ||||||||||||||||||
| Promociones y Servicios Santiago, S.A. de C.V. | Mexico | — | 100.00 | % | 100.00 | % | SERVICES | — | — | — | ||||||||||||||||||
| Promotora AFR de Venezuela, S.A. | Venezuela | — | 98.40 | % | 99.98 | % | ADVISORY SERVICES | — | — | 4 | ||||||||||||||||||
| Promotora Herlosacantos, S.A. (c) | Spain | — | 50.00 | % | 50.00 | % | PROPERTY | — | — | — | ||||||||||||||||||
| Proyecto Europa, S.A. | Spain | — | 89.19 | % | 100.00 | % | ADVISORY SERVICES | — | — | — | ||||||||||||||||||
| Renting de Instalaciones Fotovoltáicas, S.A. | Spain | — | 89.19 | % | 100.00 | % | ELECTRICITY | — | — | — | ||||||||||||||||||
| Riobank International (Uruguay) SAIFE | Uruguay | — | 100.00 | % | 100.00 | % | BANKING | 18 | — | 15 | ||||||||||||||||||
| Rue Villot 26, S.L. | Spain | — | 80.00 | % | 80.00 | % | PROPERTY | 26 | — | 24 | ||||||||||||||||||
| S C Servicios y Cobranzas S.A. | Colombia | — | 97.76 | % | 100.00 | % | COLLECTION AND PAYMENT SERVICES | — | — | — | ||||||||||||||||||
| SAG International Finance Company Limited | Ireland | — | 60.00 | % | 100.00 | % | SECURITISATION | 3 | (1 | ) | 1 | |||||||||||||||||
| Sánchez Ramade Santander FINANCE, S.L. | Spain | — | 50.00 | % | 50.00 | % | FINANCIAL SERVICES | — | — | — | ||||||||||||||||||
| Sandywick Limited | Jersey | — | 100.00 | % | 100.00 | % | ASSET MANAGEMENT COMPANY | 2 | — | — | ||||||||||||||||||
| Saninv Gestao e Investimentos, S.A. | Portugal | — | 100.00 | % | 100.00 | % | HOLDING COMPANY | 114 | (63 | ) | 57 | |||||||||||||||||
| Santana Credit E.F.C., S.A. | Spain | — | 100.00 | % | 100.00 | % | FINANCE | 8 | — | 5 | ||||||||||||||||||
| Santander Administradora de Consórcios Ltda. | Brazil | — | 98.08 | % | 100.00 | % | FINANCE | 1 | — | 1 | ||||||||||||||||||
| Santander Airplus Corporate Payment Solutions, S.A. | Spain | 75.00 | % | — | 75.00 | % | PAYMENT SYSTEMS | — | — | — | ||||||||||||||||||
| Santander AM Holding, S.L. | Spain | 100.00 | % | — | 100.00 | % | HOLDING COMPANY | 100 | 13 | 6 | ||||||||||||||||||
| Santander Asset Management — Sociedade Gestora de Fundos de Investimento Mobiliário, S.A. | Portugal | — | 99.86 | % | 100.00 | % | FUND MANAGEMENT COMPANY | 27 | 9 | 7 | ||||||||||||||||||
| Santander Asset Management Chile S.A. | Chile | 0.01 | % | 99.83 | % | 100.00 | % | SECURITIES INVESTMENT | — | — | 9 | |||||||||||||||||
| Santander Asset Management Corporation | Puerto Rico | — | 90.59 | % | 100.00 | % | ASSET MANAGEMENT | (3 | ) | 6 | 2 | |||||||||||||||||
| Santander Asset Management Distribuidora de Títulos e Valores Mobiliários Ltda. | Brazil | — | 98.08 | % | 100.00 | % | ASSET MANAGEMENT | 22 | 6 | 22 | ||||||||||||||||||
| Santander Asset Management Ireland, Ltd. | Ireland | — | 100.00 | % | 100.00 | % | FUND MANAGEMENT COMPANY | 16 | 1 | — | ||||||||||||||||||
| Santander Asset Management Luxembourg, S.A. | Luxembourg | — | 97.84 | % | 100.00 | % | FUND MANAGEMENT COMPANY | 1 | 2 | — | ||||||||||||||||||
| Santander Asset Management S.A. Administradora General de Fondos | Chile | — | 76.74 | % | 100.00 | % | FUND MANAGEMENT COMPANY | 75 | 27 | 8 | ||||||||||||||||||
| Santander Asset Management UK Holdings Limited | United Kingdom | — | 100.00 | % | 100.00 | % | HOLDING COMPANY | 183 | — | 183 | ||||||||||||||||||
| Santander Asset Management UK Limited | United Kingdom | — | 100.00 | % | 100.00 | % | FUND AND PORTFOLIO MANAGEMENT | 13 | 1 | 11 | ||||||||||||||||||
| Santander Asset Management, S.A., S.G.I.I.C. | Spain | 28.30 | % | 69.54 | % | 100.00 | % | FUND MANAGEMENT COMPANY | 93 | 70 | 33 | |||||||||||||||||
| Santander BanCorp | Puerto Rico | — | 90.59 | % | 91.34 | % | HOLDING COMPANY | 476 | (20 | ) | 198 | |||||||||||||||||
| Santander Bank & Trust Ltd. | Bahamas | — | 100.00 | % | 100.00 | % | BANKING | 1,498 | 211 | 1,078 | ||||||||||||||||||
| Santander Benelux, S.A./N.V. | Belgium | 100.00 | % | — | 100.00 | % | BANKING | 940 | 43 | 925 | ||||||||||||||||||
| Santander Brasil Arrendamento Mercantil S.A. | Brazil | — | 98.08 | % | 100.00 | % | LEASING | 179 | 6 | 125 | ||||||||||||||||||
| Santander Brasil S.A. Corretora de Títulos e Valores Mobiliários | Brazil | — | 98.08 | % | 100.00 | % | BROKER-DEALER | 26 | 41 | 19 | ||||||||||||||||||
| Santander Brasil Seguros S.A. | Brazil | — | 99.38 | % | 100.00 | % | INSURANCE | 4 | 16 | 14 | ||||||||||||||||||
| Santander Capital Desarrollo, SGECR, S.A. | Spain | 100.00 | % | — | 100.00 | % | VENTURE CAPITAL COMPANY | 1 | 1 | — | ||||||||||||||||||
| Santander Capitalizaçao S.A. | Brazil | — | 99.38 | % | 100.00 | % | FINANCE | 2 | 21 | 6 | ||||||||||||||||||
| Santander Cards Limited | United Kingdom | 100.00 | % | — | 100.00 | % | FINANCIAL SERVICES | 132 | (50 | ) | 149 | |||||||||||||||||
| Santander Carteras, S.G.C., S.A. | Spain | — | 100.00 | % | 100.00 | % | FUND MANAGEMENT COMPANY | 18 | 3 | 8 | ||||||||||||||||||
| Santander Central Hispano Finance (Delaware) Inc. | United States | 100.00 | % | — | 100.00 | % | FINANCE | 2 | — | — | ||||||||||||||||||
| Santander Central Hispano Finance B.V. (1) | Netherlands | 100.00 | % | — | 100.00 | % | FINANCE | 1 | — | — | ||||||||||||||||||
| Santander Central Hispano Financial Services Limited | Cayman Islands | 100.00 | % | — | 100.00 | % | FINANCE | 1 | 1 | — | ||||||||||||||||||
| Santander Central Hispano International Limited | Cayman Islands | 100.00 | % | — | 100.00 | % | FINANCE | 3 | — | — | ||||||||||||||||||
F-213
Table of Contents
| % of Ownership Held | ||||||||||||||||||||||||||||
| by the Bank | Millions of Euros (a) | |||||||||||||||||||||||||||
| % of | Net Profit | Amount of | ||||||||||||||||||||||||||
| Voting | Capital and | (Loss) for | Ownership | |||||||||||||||||||||||||
| Entity | Location | Direct | Indirect | Rights (k) | Line of Business | Reserves | the Year | Interest | ||||||||||||||||||||
| Santander Central Hispano Issuances Limited | Cayman Islands | 100.00 | % | — | 100.00 | % | FINANCE | 2 | — | — | ||||||||||||||||||
| Santander Chile Holding, S.A. | Chile | 22.11 | % | 77.40 | % | 99.51 | % | HOLDING COMPANY | 562 | 155 | 279 | |||||||||||||||||
| Santander Commercial Paper, S.A., Sole-Shareholder Company | Spain | 100.00 | % | — | 100.00 | % | FINANCE | — | — | — | ||||||||||||||||||
| Santander Consumer (UK) plc | United Kingdom | — | 100.00 | % | 100.00 | % | ADVISORY SERVICES | 75 | (7 | ) | 89 | |||||||||||||||||
| Santander Consumer autoboerse.de AG | Germany | — | 100.00 | % | 100.00 | % | INTERNET | 1 | 1 | 1 | ||||||||||||||||||
| Santander Consumer Bank AS | Norway | — | 100.00 | % | 100.00 | % | FINANCE | 257 | 39 | 370 | ||||||||||||||||||
| Santander Consumer Bank AG | Germany | — | 100.00 | % | 100.00 | % | BANKING | 872 | 385 | 884 | ||||||||||||||||||
| Santander Consumer Bank S.p.A. | Italy | — | 100.00 | % | 100.00 | % | FINANCE | 205 | 21 | 262 | ||||||||||||||||||
| Santander Consumer Chile S.A. | Chile | — | 89.00 | % | 89.00 | % | FINANCE | 15 | — | 14 | ||||||||||||||||||
| Santander Consumer Debit GmbH | Germany | — | 100.00 | % | 100.00 | % | SERVICES | — | 14 | — | ||||||||||||||||||
| Santander Consumer Finance a.s. | Czech Republic | — | 100.00 | % | 100.00 | % | LEASING | 38 | 3 | 33 | ||||||||||||||||||
| Santander Consumer Finance B.V. | Netherlands | — | 100.00 | % | 100.00 | % | FINANCE | 34 | 3 | 32 | ||||||||||||||||||
| Santander Consumer Finance Correduría de Seguros, S.A. | Spain | — | 100.00 | % | 100.00 | % | INSURANCE BROKERAGE | 1 | 3 | — | ||||||||||||||||||
| Santander Consumer Finance Media S.r.l. | Italy | — | 65.00 | % | 65.00 | % | FINANCE | 7 | — | 5 | ||||||||||||||||||
| Santander Consumer Finance Oy | Finland | — | 100.00 | % | 100.00 | % | FINANCE | 6 | (2 | ) | 6 | |||||||||||||||||
| Santander Consumer Finance Zrt. | Hungary | — | 100.00 | % | 100.00 | % | FINANCE | 10 | (4 | ) | 4 | |||||||||||||||||
| Santander Consumer Finance, Germany GmbH | Germany | — | 100.00 | % | 100.00 | % | HOLDING COMPANY | 2,726 | — | 2,726 | ||||||||||||||||||
| Santander Consumer Finance, S.A. | Spain | 63.19 | % | 36.81 | % | 100.00 | % | BANKING | 3,919 | 693 | 2,538 | |||||||||||||||||
| Santander Consumer France | France | — | 70.00 | % | 70.00 | % | FINANCE | 20 | (2 | ) | 14 | |||||||||||||||||
| Santander Consumer Holding GmbH | Germany | — | 100.00 | % | 100.00 | % | HOLDING COMPANY | 1,096 | 196 | 1,891 | ||||||||||||||||||
| Santander Consumer Iber-Rent, S.L. | Spain | — | 60.00 | % | 60.00 | % | FULL-SERVICE LEASE | 56 | 5 | 18 | ||||||||||||||||||
| Santander Consumer Leasing Austria GmbH | Austria | — | 100.00 | % | 100.00 | % | LEASING | — | — | — | ||||||||||||||||||
| Santander Consumer Leasing GmbH | Germany | — | 100.00 | % | 100.00 | % | LEASING | 6 | 11 | 6 | ||||||||||||||||||
| Santander Consumer Multirent Spółka z ograniczoną odpowiedzialnością | Poland | — | 60.00 | % | 60.00 | % | LEASING | 8 | — | 5 | ||||||||||||||||||
| Santander Consumer Spain Auto 07-1 | Spain | — | (b) | — | SECURITISATION | 20 | (41 | ) | — | |||||||||||||||||||
| Santander Consumer Spain Auto 07-2 | Spain | — | (b) | — | SECURITISATION | (9 | ) | (20 | ) | — | ||||||||||||||||||
| Santander Consumer Spólka Akcyjna | Poland | — | 100.00 | % | 100.00 | % | BANKING | 138 | 29 | 121 | ||||||||||||||||||
| Santander Consumer USA Inc. | United States | 90.00 | % | — | 90.00 | % | FINANCE | 33 | 187 | 583 | ||||||||||||||||||
| Santander Consumer, EFC, S.A. | Spain | — | 100.00 | % | 100.00 | % | FINANCE | 242 | 139 | 168 | ||||||||||||||||||
| Santander Corredora de Seguros Limitada | Chile | — | 76.73 | % | 100.00 | % | INSURANCE BROKERAGE | 34 | 10 | 1 | ||||||||||||||||||
| Santander de Desarrollos Inmobiliarios, S.A. | Spain | 98.39 | % | 1.61 | % | 100.00 | % | PROPERTY | — | — | — | |||||||||||||||||
| Santander de Leasing, S.A., E.F.C. | Spain | 70.00 | % | 30.00 | % | 100.00 | % | LEASING | 41 | 7 | 35 | |||||||||||||||||
| Santander de Renting, S.A. | Spain | 99.99 | % | 0.01 | % | 100.00 | % | FULL-SERVICE LEASE | 22 | (1 | ) | 18 | ||||||||||||||||
| Santander de Titulización S.G.F.T., S.A. | Spain | 81.00 | % | 19.00 | % | 100.00 | % | FUND MANAGEMENT COMPANY | 1 | 4 | 1 | |||||||||||||||||
| Santander Drive Auto Receivables LLC | United States | — | 90.00 | % | 100.00 | % | AUXILIARY | — | — | — | ||||||||||||||||||
| Santander Drive Auto Receivables Trust 2007-1 | United States | — | (b) | — | SECURITISATION | — | — | — | ||||||||||||||||||||
| Santander Drive Auto Receivables Trust 2007-2 | United States | — | (b) | — | SECURITISATION | — | — | — | ||||||||||||||||||||
| Santander Drive Auto Receivables Trust 2007-3 | United States | — | (b) | — | SECURITISATION | — | — | — | ||||||||||||||||||||
| Santander Factoring y Confirming, S.A., E.F.C. | Spain | 100.00 | % | — | 100.00 | % | FACTORING | 99 | 23 | 76 | ||||||||||||||||||
| Santander Factoring, S.A. | Chile | — | 99.51 | % | 100.00 | % | FACTORING | 22 | 2 | 6 | ||||||||||||||||||
| Santander Financial Products, Ltd. | Ireland | — | 100.00 | % | 100.00 | % | FINANCE | 178 | 6 | 162 | ||||||||||||||||||
| Santander Financial Services, Inc. | Puerto Rico | — | 90.59 | % | 100.00 | % | LENDING COMPANY | 94 | (40 | ) | 84 | |||||||||||||||||
| Santander Gestâo de Activos, SGPS, S.A. | Portugal | — | 99.86 | % | 100.00 | % | HOLDING COMPANY | 15 | — | 7 | ||||||||||||||||||
| Santander Gestión de Recaudación y Cobranzas, Ltda. | Chile | — | 98.97 | % | 99.45 | % | FINANCIAL SERVICES | 3 | (3 | ) | 2 | |||||||||||||||||
| Santander Gestión Inmobiliaria, S.A. | Spain | 0.01 | % | 99.99 | % | 100.00 | % | PROPERTY | — | 1 | — | |||||||||||||||||
| Santander Global Facility, S.A. | Spain | 99.94 | % | 0.06 | % | 100.00 | % | SERVICES | 1 | 1 | 1 | |||||||||||||||||
| Santander Global Property, S.L. | Spain | 94.44 | % | 5.56 | % | 100.00 | % | SECURITIES INVESTMENT | 138 | — | 128 | |||||||||||||||||
| Santander Global Services, S.A. | Uruguay | — | 100.00 | % | 100.00 | % | SERVICES | 1 | — | — | ||||||||||||||||||
| Santander Global Sport, S.A. | Spain | 100.00 | % | — | 100.00 | % | SPORTS OPERATIONS | 3 | 4 | 3 | ||||||||||||||||||
| Santander Hipotecario 1 Fondo de Titulización de Activos | Spain | — | (b) | — | SECURITISATION | — | — | — | ||||||||||||||||||||
| Santander Hipotecario 2 Fondo de Titulización de Activos | Spain | — | (b) | — | SECURITISATION | — | — | — | ||||||||||||||||||||
| Santander Hipotecario 3 Fondo de Titulización de Activos | Spain | — | (b) | — | SECURITISATION | — | — | — | ||||||||||||||||||||
| Santander Hipotecario 4 Fondo de Titulización de Activos | Spain | — | (b) | — | SECURITISATION | — | — | — | ||||||||||||||||||||
| Santander Holanda B.V. | Netherlands | 100.00 | % | — | 100.00 | % | HOLDING COMPANY | 11 | — | — | ||||||||||||||||||
| Santander Holding Gestión, S.L. | Spain | — | 100.00 | % | 100.00 | % | HOLDING COMPANY | (79 | ) | — | — | |||||||||||||||||
| Santander Holding Internacional, S.A. | Spain | 99.95 | % | 0.05 | % | 100.00 | % | HOLDING COMPANY | 28 | — | — | |||||||||||||||||
| Santander Infrastructure Capital Limited | United Kingdom | — | 100.00 | % | 100.00 | % | LEASING | — | — | — | ||||||||||||||||||
| Santander Infrastructure Capital Management Limited | United Kingdom | — | 100.00 | % | 100.00 | % | LEASING | — | — | — | ||||||||||||||||||
F-214
Table of Contents
| % of Ownership Held | ||||||||||||||||||||||||||||
| by the Bank | Millions of Euros (a) | |||||||||||||||||||||||||||
| % of | Net Profit | Amount of | ||||||||||||||||||||||||||
| Voting | Capital and | (Loss) for | Ownership | |||||||||||||||||||||||||
| Entity | Location | Direct | Indirect | Rights (k) | Line of Business | Reserves | the Year | Interest | ||||||||||||||||||||
| Santander Insurance Agency, Inc. | Puerto Rico | — | 90.59 | % | 100.00 | % | INSURANCE BROKERAGE | 2 | 4 | 3 | ||||||||||||||||||
| Santander Insurance Holding, S.L. | Spain | 99.99 | % | 0.01 | % | 100.00 | % | HOLDING COMPANY | 382 | 1 | 357 | |||||||||||||||||
| Santander Insurance s.r.o. | Slovakia | — | 100.00 | % | 100.00 | % | PROPERTY | — | — | — | ||||||||||||||||||
| Santander Insurance Services UK Limited | United Kingdom | — | 100.00 | % | 100.00 | % | ASSET MANAGEMENT COMPANY | 20 | (5 | ) | 21 | |||||||||||||||||
| Santander International Bank of Puerto Rico, Inc. | Puerto Rico | — | 90.59 | % | 100.00 | % | BANKING | 97 | 2 | 63 | ||||||||||||||||||
| Santander International Debt, S.A., Sole-Shareholder Company | Spain | 100.00 | % | — | 100.00 | % | FINANCE | — | — | — | ||||||||||||||||||
| Santander Inversiones Limitada | Chile | — | 100.00 | % | 100.00 | % | HOLDING COMPANY | 688 | 47 | 599 | ||||||||||||||||||
| Santander Investimentos em Participações S.A. | Brazil | — | 98.08 | % | 100.00 | % | COLLECTION AND PAYMENT SERVICES | 56 | 60 | 100 | ||||||||||||||||||
| Santander Investment Bank Limited | Bahamas | — | 100.00 | % | 100.00 | % | BANKING | 88 | 1 | 171 | ||||||||||||||||||
| Santander Investment Bolsa, S.V., S.A. | Spain | — | 100.00 | % | 100.00 | % | BROKER-DEALER | 119 | 87 | 104 | ||||||||||||||||||
| Santander Investment Chile, Limitada | Chile | — | 100.00 | % | 100.00 | % | FINANCE | 170 | 8 | 126 | ||||||||||||||||||
| Santander Investment Colombia S.A. | Colombia | — | 100.00 | % | 100.00 | % | HOLDING COMPANY | 4 | 2 | 44 | ||||||||||||||||||
| Santander Investment I, S.A. | Spain | 100.00 | % | — | 100.00 | % | HOLDING COMPANY | (1,603 | ) | 100 | — | |||||||||||||||||
| Santander Investment Limited | Bahamas | — | 100.00 | % | 100.00 | % | BROKER-DEALER | (35 | ) | (17 | ) | — | ||||||||||||||||
| Santander Investment Securities Inc. | United States | — | 100.00 | % | 100.00 | % | BROKER-DEALER | 57 | (1 | ) | 295 | |||||||||||||||||
| Santander Investment Trust Colombia S.A., Sociedad Fiduciaria | Colombia | — | 100.00 | % | 100.00 | % | FUND MANAGEMENT COMPANY | 8 | 1 | 8 | ||||||||||||||||||
| Santander Investment Valores Colombia S.A., Comisionista de Bolsa Comercial | Colombia | — | 97.76 | % | 100.00 | % | BROKER-DEALER | 5 | 1 | 1 | ||||||||||||||||||
| Santander Investment, S.A. | Spain | 100.00 | % | — | 100.00 | % | BANKING | 203 | 310 | 14 | ||||||||||||||||||
| Santander Investment, S.A., Corredores de Bolsa | Chile | — | 88.13 | % | 100.00 | % | BROKER-DEALER | 46 | 5 | 28 | ||||||||||||||||||
| Santander IP UK Limited | United Kingdom | — | 100.00 | % | 100.00 | % | BROKER-DEALER | — | — | — | ||||||||||||||||||
| Santander Issuances, S.A., Sole-Shareholder Company | Spain | 100.00 | % | — | 100.00 | % | FINANCE | — | — | — | ||||||||||||||||||
| Santander Leasing S.A. | Chile | — | 76.85 | % | 100.00 | % | LEASING | 42 | 1 | 48 | ||||||||||||||||||
| Santander Mediación Operador de Banca-Seguros Vinculado, S.A. | Spain | 20.00 | % | 76.41 | % | 100.00 | % | ADVISORY SERVICES | 1 | — | 1 | |||||||||||||||||
| Santander Merchant Bank Limited | Bahamas | — | 100.00 | % | 100.00 | % | BANKING | 4 | — | 50 | ||||||||||||||||||
| Santander Merchant, S.A. | Argentina | — | 100.00 | % | 100.00 | % | HOLDING COMPANY | 2 | — | 19 | ||||||||||||||||||
| Santander Mortgage Corp. | Puerto Rico | — | 90.59 | % | 100.00 | % | MORTGAGE LOAN COMPANY | 19 | — | 15 | ||||||||||||||||||
| Santander Multimedios, S.A. | Chile | — | 100.00 | % | 100.00 | % | INTERNET | 1 | — | 1 | ||||||||||||||||||
| Santander Overseas Bank, Inc. (h) | Puerto Rico | — | 100.00 | % | 100.00 | % | BANKING | 343 | 25 | 187 | ||||||||||||||||||
| Santander PB UK (Holdings) Limited | United Kingdom | 100.00 | % | — | 100.00 | % | FINANCE | 277 | — | 282 | ||||||||||||||||||
| Santander Pensiones, S.A., E.G.F.P. | Spain | 21.20 | % | 76.64 | % | 100.00 | % | PENSION FUND MANAGEMENT COMPANY | 77 | 13 | 50 | |||||||||||||||||
| Santander Pensôes — Sociedade Gestora de Fundos de Pensôes, S.A. | Portugal | — | 99.86 | % | 100.00 | % | PENSION FUND MANAGEMENT COMPANY | 5 | 2 | 1 | ||||||||||||||||||
| Santander Perpetual, S.A., Sole-Shareholder Company | Spain | 100.00 | % | — | 100.00 | % | FINANCE | — | — | — | ||||||||||||||||||
| Santander Portfolio Management UK Limited | United Kingdom | — | 100.00 | % | 100.00 | % | FINANCE | 40 | — | 31 | ||||||||||||||||||
| Santander PR Capital Trust I | Puerto Rico | — | 90.59 | % | 100.00 | % | FINANCE | (3 | ) | 6 | 2 | |||||||||||||||||
| Santander Private Advisors, Ltd. | United States | 100.00 | % | — | 100.00 | % | HOLDING COMPANY | — | — | — | ||||||||||||||||||
| Santander Private Banking s.p.a. | Italy | — | 100.00 | % | 100.00 | % | BANKING | 29 | (7 | ) | 43 | |||||||||||||||||
| Santander Private Banking UK Limited | United Kingdom | — | 100.00 | % | 100.00 | % | PROPERTY | 565 | — | 565 | ||||||||||||||||||
| Santander Private Equity, S.A., S.G.E.C.R. | Spain | 90.00 | % | 9.97 | % | 100.00 | % | VENTURE CAPITAL MANAGEMENT | 4 | — | 4 | |||||||||||||||||
| Santander Professional Services, S.A. | Spain | — | 100.00 | % | 100.00 | % | SPORTS OPERATIONS | — | — | — | ||||||||||||||||||
| Santander Real Estate, S.G.I.I.C., S.A. | Spain | — | 99.14 | % | 100.00 | % | FUND MANAGEMENT COMPANY | 49 | 28 | 6 | ||||||||||||||||||
| Santander Río Asset Management Gerente de Fondos Comunes de Inversión S.A. | Argentina | — | 100.00 | % | 100.00 | % | FUND MANAGEMENT COMPANY | 4 | 2 | 1 | ||||||||||||||||||
| Santander Río Seguros S.A. | Argentina | — | 100.00 | % | 100.00 | % | INSURANCE | 6 | 5 | 6 | ||||||||||||||||||
| Santander Río Servicios S.A. | Argentina | — | 99.97 | % | 100.00 | % | ADVISORY SERVICES | — | — | — | ||||||||||||||||||
| Santander Río Sociedad de Bolsa S.A. | Argentina | — | 99.34 | % | 100.00 | % | BROKER-DEALER | 4 | 1 | 3 | ||||||||||||||||||
| Santander Río Trust S.A. | Argentina | — | 99.97 | % | 100.00 | % | FINANCIAL SERVICES | — | — | — | ||||||||||||||||||
| Santander S.A. — Corretora de Câmbio e Títulos | Brazil | — | 98.08 | % | 100.00 | % | BROKER-DEALER | 15 | 37 | 10 | ||||||||||||||||||
| Santander S.A. — Serviços Técnicos, Administrativos e de Corretagem de Seguros | Brazil | — | 98.08 | % | 100.00 | % | INSURANCE BROKERAGE | 5 | 13 | 36 | ||||||||||||||||||
| Santander S.A. Agente de Valores | Chile | — | 76.95 | % | 100.00 | % | BROKER-DEALER | 183 | 10 | 20 | ||||||||||||||||||
| Santander S.A. Sociedad Securitizadora | Chile | — | 76.82 | % | 100.00 | % | FUND MANAGEMENT COMPANY | 2 | — | — | ||||||||||||||||||
| Santander Securities Corporation | Puerto Rico | — | 90.59 | % | 100.00 | % | BROKER-DEALER | 24 | 7 | 15 | ||||||||||||||||||
| Santander Seguros de Vida, S.A. | Chile | — | 100.00 | % | 100.00 | % | INSURANCE | 63 | 34 | 9 | ||||||||||||||||||
| Santander Seguros Generales S.A. | Chile | 99.50 | % | 0.50 | % | 100.00 | % | INSURANCE | 12 | 1 | 12 | |||||||||||||||||
| Santander Seguros S.A. | Brazil | — | 99.38 | % | 99.38 | % | INSURANCE | 125 | 48 | 100 | ||||||||||||||||||
| Santander Seguros y Reaseguros, Compañía Aseguradora, S.A. | Spain | — | 95.78 | % | 100.00 | % | INSURANCE | 287 | 81 | 215 | ||||||||||||||||||
| Santander Seguros, S.A. | Uruguay | — | 100.00 | % | 100.00 | % | INSURANCE | 2 | (1 | ) | 1 | |||||||||||||||||
F-215
Table of Contents
| % of Ownership Held | ||||||||||||||||||||||||||||
| by the Bank | Millions of Euros (a) | |||||||||||||||||||||||||||
| % of | Net Profit | Amount of | ||||||||||||||||||||||||||
| Voting | Capital and | (Loss) for | Ownership | |||||||||||||||||||||||||
| Entity | Location | Direct | Indirect | Rights (k) | Line of Business | Reserves | the Year | Interest | ||||||||||||||||||||
| Santander Service GmbH | Germany | — | 100.00 | % | 100.00 | % | LEASING | — | — | — | ||||||||||||||||||
| Santander Servicios de Recaudación y Pagos Limitada | Chile | — | 76.73 | % | 100.00 | % | SERVICES | 5 | — | 4 | ||||||||||||||||||
| Santander Totta Seguros, Companhia de Seguros de Vida, S.A. | Portugal | — | 99.86 | % | 100.00 | % | INSURANCE | 45 | 46 | 22 | ||||||||||||||||||
| Santander Totta, SGPS, S.A. | Portugal | — | 99.86 | % | 99.86 | % | HOLDING COMPANY | 2,597 | 269 | 3,321 | ||||||||||||||||||
| Santander Trade Services, Ltd. | Hong-Kong | — | 100.00 | % | 100.00 | % | SERVICES | 12 | 2 | 30 | ||||||||||||||||||
| Santander Unit Trust Managers UK Limited | United Kingdom | — | 100.00 | % | 100.00 | % | FUND AND PORTFOLIO MANAGEMENT | 22 | 2 | 20 | ||||||||||||||||||
| Santander US Debt, S.A., Sole-Shareholder Company | Spain | 100.00 | % | — | 100.00 | % | FINANCE | — | — | — | ||||||||||||||||||
| Santander Venezuela Sociedad Administradora de Entidades de Inversión Colectiva, C.A. | Venezuela | — | 90.00 | % | 100.00 | % | FUND MANAGEMENT COMPANY | — | — | — | ||||||||||||||||||
| Santusa Holding, S.L. | Spain | 69.64 | % | 30.36 | % | 100.00 | % | HOLDING COMPANY | 10,518 | 790 | 9,158 | |||||||||||||||||
| Sarum Trustees Limited | United Kingdom | — | 100.00 | % | 100.00 | % | ASSET MANAGEMENT COMPANY | — | — | — | ||||||||||||||||||
| Saturn Japan V C.V. (m) | Netherlands | — | 100.00 | % | — | HOLDING COMPANY | — | — | — | |||||||||||||||||||
| Scottish Mutual Pensions Limited | United Kingdom | — | 100.00 | % | 100.00 | % | INSURANCE | 6 | — | 98 | ||||||||||||||||||
| Seguros Santander, S.A., Grupo Financiero Santander | Mexico | — | 74.96 | % | 100.00 | % | INSURANCE | 34 | 19 | 25 | ||||||||||||||||||
| Sercoban, Administración de Empresas, S.L. | Spain | — | 100.00 | % | 100.00 | % | FINANCIAL SERVICES | — | — | — | ||||||||||||||||||
| Sercoban, Gestión Administrativa de Empresas, S.A. | Spain | 100.00 | % | — | 100.00 | % | SERVICES | 18 | (1 | ) | 16 | |||||||||||||||||
| Serfin International Bank and Trust, Limited | Cayman Islands | — | 99.72 | % | 100.00 | % | BANKING | 27 | 1 | 22 | ||||||||||||||||||
| Servicio de Alarmas Controladas por Ordenador, S.A. | Spain | 99.99 | % | 0.01 | % | 100.00 | % | SECURITY | 1 | — | 1 | |||||||||||||||||
| Servicios Administrativos y Financieros, Ltda. | Chile | — | (b) | — | SERVICES | — | — | — | ||||||||||||||||||||
| Servicios Corporativos Seguros Serfin, S.A. De C.V. | Mexico | — | 75.46 | % | 100.00 | % | SERVICES | — | — | — | ||||||||||||||||||
| Servicios de Cobranza, Recuperación y Seguimiento, S.A. De C.V. | Mexico | — | 100.00 | % | 100.00 | % | SERVICES | 8 | 1 | 8 | ||||||||||||||||||
| Servicios de Cobranzas Fiscalex Ltda. | Chile | — | (b) | — | SERVICES | — | — | — | ||||||||||||||||||||
| Servicios Universia Venezuela S.U.V., S.A. | Venezuela | — | 75.00 | % | 75.00 | % | INTERNET | 1 | — | 1 | ||||||||||||||||||
| Sheppards Moneybrokers Limited | United Kingdom | — | 100.00 | % | 100.00 | % | ADVISORY SERVICES | 21 | — | 18 | ||||||||||||||||||
| Sinvest Inversiones y Asesorías Limitada | Chile | — | 100.00 | % | 100.00 | % | FINANCE | 58 | 2 | 2 | ||||||||||||||||||
| Sistema 4B, S.A. | Spain | 52.17 | % | 13.11 | % | 66.87 | % | CARDS | 13 | 7 | 10 | |||||||||||||||||
| Sociedad Integral de Valoraciones Automatizadas, S.A. | Spain | — | 100.00 | % | 100.00 | % | APPRAISALS | 1 | 1 | 1 | ||||||||||||||||||
| Sodepro, S.A. | Spain | — | 89.19 | % | 100.00 | % | FINANCE | 15 | — | 12 | ||||||||||||||||||
| Solarlaser Limited | United Kingdom | — | 100.00 | % | 100.00 | % | PROPERTY | 60 | 3 | 54 | ||||||||||||||||||
| Suleyado 2003, S.L. | Spain | — | 100.00 | % | 100.00 | % | SECURITIES INVESTMENT | 7 | — | 7 | ||||||||||||||||||
| Suzuki Servicios Financieros, S.L. | Spain | — | 51.00 | % | 51.00 | % | INTERMEDIATION | — | — | — | ||||||||||||||||||
| Swesant Merchant SA, en liquidation (l) | Switzerland | — | 100.00 | % | 100.00 | % | HOLDING COMPANY | 1 | 364 | 2 | ||||||||||||||||||
| Swesant SA | Switzerland | — | 100.00 | % | 100.00 | % | HOLDING COMPANY | 216 | 100 | — | ||||||||||||||||||
| Task Moraza, S.L. (e) | Spain | — | 73.41 | % | 73.41 | % | HOLDING COMPANY | 37 | (1 | ) | 27 | |||||||||||||||||
| Taxagest Sociedade Gestora de Participaçoes Sociais, S.A. | Portugal | — | 99.86 | % | 100.00 | % | HOLDING COMPANY | 50 | 8 | — | ||||||||||||||||||
| Teatinos Siglo XXI Inversiones Limitada | Chile | 50.00 | % | 50.00 | % | 100.00 | % | HOLDING COMPANY | 446 | 170 | 397 | |||||||||||||||||
| Teylada, S.A. | Spain | 11.11 | % | 88.89 | % | 100.00 | % | SECURITIES INVESTMENT | — | — | — | |||||||||||||||||
| The HSH AIV 4 Trust (c) | United States | — | 69.25 | % | — | HOLDING COMPANY | 42 | — | 36 | |||||||||||||||||||
| The National & Provincial Building Society Pension Fund Trustees Limited | United Kingdom | — | (b) | — | ASSET MANAGEMENT COMPANY | — | — | — | ||||||||||||||||||||
| The WF Company Limited | United Kingdom | — | 100.00 | % | 100.00 | % | ADVISORY SERVICES | 1 | — | — | ||||||||||||||||||
| Títulos de Renta Fija, S.A. | Spain | 100.00 | % | — | 100.00 | % | SECURITIES INVESTMENT | — | — | — | ||||||||||||||||||
| Tornquist Asesores de Seguros, S.A. (1) | Argentina | — | 99.99 | % | 99.99 | % | ADVISORY SERVICES | — | — | — | ||||||||||||||||||
| Totta & Açores Inc. Newark | United States | — | 99.72 | % | 100.00 | % | BANKING | 1 | — | — | ||||||||||||||||||
| Totta (Ireland), PLC (h) | Ireland | — | 99.72 | % | 100.00 | % | FINANCE | 342 | 89 | 341 | ||||||||||||||||||
| Totta Crédito Especializado, Instituiçao Financeira de Crédito, S.A. (IFIC) | Portugal | — | 99.83 | % | 100.00 | % | LEASING | 102 | 23 | 42 | ||||||||||||||||||
| Totta Urbe — Empresa de Administraçâo e Construçôes, S.A. | Portugal | — | 99.72 | % | 100.00 | % | PROPERTY | 104 | �� | 4 | 148 | |||||||||||||||||
| UNIFIN S.p.A. | Italy | — | 70.00 | % | 70.00 | % | FINANCE | 14 | 5 | 44 | ||||||||||||||||||
| Universia Brasil S.A. | Brazil | — | 100.00 | % | 100.00 | % | INTERNET | 2 | (2 | ) | — | |||||||||||||||||
| Universia Chile S.A. | Chile | — | 93.74 | % | 93.74 | % | INTERNET | 2 | (2 | ) | — | |||||||||||||||||
| Universia Colombia, S.A. | Colombia | — | 99.89 | % | 99.89 | % | INTERNET | 1 | (1 | ) | — | |||||||||||||||||
| Universia Holding, S.L. | Spain | 99.91 | % | 0.09 | % | 100.00 | % | HOLDING COMPANY | 24 | (17 | ) | 11 | ||||||||||||||||
| Universia México, S.A. De C.V. | Mexico | — | 100.00 | % | 100.00 | % | INTERNET | 1 | (1 | ) | — | |||||||||||||||||
| Universia Perú, S.A. | Peru | — | 97.00 | % | 97.00 | % | INTERNET | 1 | (1 | ) | — | |||||||||||||||||
| Universia Puerto Rico, Inc. | Puerto Rico | — | 100.00 | % | 100.00 | % | INTERNET | 1 | — | — | ||||||||||||||||||
| Valores Santander Casa de Bolsa, C.A. | Venezuela | — | 90.00 | % | 90.00 | % | BROKER-DEALER | 10 | 6 | 7 | ||||||||||||||||||
| Virtual Payments, S.L. | Spain | — | 100.00 | % | 100.00 | % | TECHNOLOGY | — | — | — | ||||||||||||||||||
F-216
Table of Contents
| % of Ownership Held | ||||||||||||||||||||||||||||
| by the Bank | Millions of Euros (a) | |||||||||||||||||||||||||||
| % of | Net Profit | Amount of | ||||||||||||||||||||||||||
| Voting | Capital and | (Loss) for | Ownership | |||||||||||||||||||||||||
| Entity | Location | Direct | Indirect | Rights (k) | Line of Business | Reserves | the Year | Interest | ||||||||||||||||||||
| Vista Capital de Expansión, S.A. SGECR | Spain | — | 50.00 | % | 50.00 | % | VENTURE CAPITAL MANAGEMENT | 1 | 1 | — | ||||||||||||||||||
| Vista Desarrollo, S.A. SCR | Spain | 100.00 | % | — | 100.00 | % | VENTURE CAPITAL COMPANY | 246 | 15 | 133 | ||||||||||||||||||
| W.N.P.H. Gestao e Investimentos Sociedade Unipessoal, S.A. | Portugal | — | 100.00 | % | 100.00 | % | SECURITIES INVESTMENT | 33 | 1 | — | ||||||||||||||||||
| Wallcesa, S.A. | Spain | 100.00 | % | — | 100.00 | % | SECURITIES INVESTMENT | 25 | (47 | ) | — | |||||||||||||||||
| Wex Point España, S.L. | Spain | — | 89.19 | % | 100.00 | % | SERVICES | 2 | — | 1 | ||||||||||||||||||
| Whitewick Limited | Jersey | — | 100.00 | % | 100.00 | % | HOLDING COMPANY | — | — | — | ||||||||||||||||||
| WIM Servicios Corporativos, S.A. de C.V. | Mexico | — | 100.00 | % | 100.00 | % | ADVISORY SERVICES | — | — | — | ||||||||||||||||||
| (a) | Amount per books of each company at December 31, 2007, disregarding, where appropriate, any interim dividends paid in the year. The amount of the ownership interest (net of allowances) is the figure per the books of each holding company multiplied by the Group’s percentage of ownership, disregarding impairment of goodwill on consolidation. The data on foreign companies were translated to euros at the year-end exchange rates. | |
| (b) | Companies over which effective control is exercised. | |
| (c) | Data from the latest approved financial statements at December 31, 2006. | |
| (d) | Data from the latest approved financial statements at March 31, 2007. | |
| (e) | Data from the latest approved financial statements at June 30, 2007. | |
| (f) | Data from the latest approved financial statements at September 30, 2007. | |
| (g) | Data from the latest approved financial statements at April 30, 2007. | |
| (h) | Data from the latest approved financial statements at November 30, 2007. | |
| (i) | Data from the latest approved financial statements at August 31, 2007. | |
| (j) | Data uniform with 2007 calendar year. | |
| (k) | Pursuant to Article 3 of Royal Decree 1815/1991, of December 20, approving the rules for the preparation of consolidated financial statements, in order to determine voting rights, the voting rights relating to subsidiaries or to other parties acting in their own name but on behalf of Group companies were added to the voting rights directly held by the Parent. Accordingly, the number of votes corresponding to the Parent in relation to companies over which it exercises indirect control is the number corresponding to each subsidiary holding a direct ownership interest in such companies. | |
| (l) | Company in liquidation at December 31, 2007. | |
| (m) | Company newly incorporated in 2007 for which no approved financial statements are available. | |
| (1) | The preference share and security issuer companies are detailed in Exhibit III, together with other relevant information. |
F-217
Table of Contents
| % of Ownership Held | ||||||||||||||||||||||||||||
| by the Bank | Millions of Euros (a) | |||||||||||||||||||||||||||
| % of | Net Profit | |||||||||||||||||||||||||||
| Voting | Capital and | (Loss) for | ||||||||||||||||||||||||||
| Entity | Location | Direct | Indirect | Rights (f) | Line of Business | Assets | Reserves | the Year | ||||||||||||||||||||
| ABSLine Multimedia, S.L. | Spain | — | 47.50 | % | 47.50 | % | MARKETING | 1 | 1 | — | ||||||||||||||||||
| Accordfin España, E.F.C., S.A. | Spain | — | 49.00 | % | 49.00 | % | FINANCE | 437 | 21 | 5 | ||||||||||||||||||
| Administrador Financiero de Transantiago S.A. | Chile | — | 15.35 | % | 20.00 | % | COLLECTION AND PAYMENT SERVICES | 235 | 23 | (17 | ) | |||||||||||||||||
| Affirmative Insurance Holdings Inc. (b) | United States | — | 5.61 | % | — | INSURANCE | 379 | 134 | 7 | |||||||||||||||||||
| Agres, Agrupación Restauradores, S.L. | Spain | — | 38.36 | % | 43.01 | % | RESTAURANTS | 4 | 2 | — | ||||||||||||||||||
| Aguas de Fuensanta, S.A. | Spain | — | 37.65 | % | 42.21 | % | FOOD | 29 | 9 | — | ||||||||||||||||||
| Alcaidesa Golf, S.L. | Spain | — | 44.60 | % | 44.60 | % | SPORTS OPERATIONS | 7 | 6 | (1 | ) | |||||||||||||||||
| Alcaidesa Inmobiliaria, S.A. | Spain | — | 44.60 | % | 44.60 | % | PROPERTY | 106 | 68 | (1 | ) | |||||||||||||||||
| Alcaidesa Servicios, S.A. | Spain | — | 44.60 | % | 44.60 | % | SERVICES | 1 | 1 | — | ||||||||||||||||||
| Allfunds Bank, S.A. | Spain | — | 50.00 | % | 50.00 | % | BANKING | 134 | 55 | 23 | ||||||||||||||||||
| Allfunds International S.A. | Luxembourg | — | 50.00 | % | 50.00 | % | FINANCIAL SERVICES | — | — | — | ||||||||||||||||||
| Americredit Corp. (consolidated) (k) | United States | — | 4.38 | % | 4.38 | % | FINANCE | 12,099 | 1,165 | 245 | ||||||||||||||||||
| Anekis, S.A. | Spain | 24.75 | % | 24.75 | % | 49.50 | % | ADVERTISING | 4 | 2 | — | |||||||||||||||||
| Arena Communications Network, S.L. (b) | Spain | 20.00 | % | — | 20.00 | % | ADVERTISING | 26 | 1 | — | ||||||||||||||||||
| Asajanet Servicios Agropecuarios, S.L. (b) | Spain | 30.00 | % | — | 30.00 | % | MARKETING | 1 | 1 | — | ||||||||||||||||||
| Asia Bridge Fund I LLC (i) | Mauricio Island | — | 25.00 | % | 25.00 | % | HOLDING COMPANY | — | — | — | ||||||||||||||||||
| Attijari Factoring Maroc, S.A. (b) | Morocco | — | 25.00 | % | 25.00 | % | FACTORING | 33 | 5 | 1 | ||||||||||||||||||
| Attijari International Bank Société Anonymé (b) | Morocco | 50.00 | % | — | 50.00 | % | BANKING | 315 | 4 | 1 | ||||||||||||||||||
| Attijariwafa Bank Société Anonyme (consolidated) (b) | Morocco | — | 14.55 | % | 14.55 | % | BANKING | 12,574 | 1,019 | 170 | ||||||||||||||||||
| Autopistas del Sol, S.A. (b) | Argentina | — | 14.17 | % | 14.17 | % | MOTORWAY CONCESSIONS | 332 | 77 | (6 | ) | |||||||||||||||||
| Banco Internacional da Guiné-Bissau, S.A. (d) | Guinea Bissau | — | 48.86 | % | 49.00 | % | BANKING | 12 | (30 | ) | (1 | ) | ||||||||||||||||
| Base Central — Rede Serviços Imobiliarios, S.A. | Portugal | — | 49.80 | % | 49.80 | % | PROPERTY SERVICES | 1 | 2 | (1 | ) | |||||||||||||||||
| Benim — Sociedade Imobiliária, S.A. (b) | Portugal | — | 24.93 | % | 25.00 | % | PROPERTY | 12 | 8 | — | ||||||||||||||||||
| Bolsas y Mercados Españoles, Sociedad Holding de Mercados y Sistemas Financieros, S.A. (consolidated) (b) | Spain | 1.22 | % | 6.69 | % | 8.07 | % | FINANCIAL SERVICES | 4,385 | 347 | 131 | |||||||||||||||||
| Bovespa Holding S.A. | Brazil | — | 3.82 | % | 3.89 | % | HOLDING COMPANY | 626 | 528 | 66 | ||||||||||||||||||
| Cantabria Capital, SGECR, S.A. | Spain | 50.00 | % | — | 50.00 | % | VENTURE CAPITAL MANAGEMENT COMPANY | — | — | — | ||||||||||||||||||
| Carnes Estellés, S.A. | Spain | — | 19.10 | % | 21.41 | % | FOOD | 37 | 9 | — | ||||||||||||||||||
| Cartera del Norte, S.A. | Spain | — | 32.20 | % | 36.10 | % | FINANCE | 1 | 1 | — | ||||||||||||||||||
| Centradia Group, Ltd. (b) | United Kingdom | 30.45 | % | — | 30.45 | % | ADVISORY SERVICES | 1 | 1 | — | ||||||||||||||||||
| Centro de Compensación Automatizado, S.A. | Chile | — | 25.58 | % | 33.33 | % | COLLECTION AND PAYMENT SERVICES | 2 | 1 | — | ||||||||||||||||||
| Centro para el Desarrollo, Investigación y Aplicación de Nuevas Tecnologías, S.A. | Spain | — | 43.70 | % | 49.00 | % | TECHNOLOGY | 1 | 1 | — | ||||||||||||||||||
| Companhia Energética de São Paulo | Brazil | — | 7.42 | % | 7.57 | % | ENERGY | 7,567 | 3,908 | 69 | ||||||||||||||||||
| Compañía Concesionaria del Túnel de Soller, S.A. | Spain | — | 29.17 | % | 32.70 | % | CONSTRUCTION | 67 | 17 | 1 | ||||||||||||||||||
| Compañía Española de Petróleos, S.A. (consolidated) (b) | Spain | 28.71 | % | 2.93 | % | 31.64 | % | OIL REFINING | 8,724 | 4,159 | 826 | |||||||||||||||||
| Compañía Española de Seguros de Crédito a la Exportación, S.A., Compañía de Seguros y Reaseguros (b) | Spain | 13.95 | % | 6.41 | % | 21.08 | % | CREDIT INSURANCE | 999 | 165 | 15 | |||||||||||||||||
| Comprarcasa Servicios Inmobiliarios, S.A. | Spain | — | 47.50 | % | 47.50 | % | PROPERTY SERVICES | 1 | 1 | — | ||||||||||||||||||
| Consorcio Credicard, C.A. | Venezuela | — | 32.80 | % | 33.33 | % | CARDS | 84 | 11 | 10 | ||||||||||||||||||
| Corporación Suiche 7B, C.A. | Venezuela | — | 31.75 | % | 32.26 | % | SERVICES | 5 | 4 | 1 | ||||||||||||||||||
| Ensafeca Holding Empresarial, S.L. | Spain | — | 31.82 | % | 31.82 | % | SECURITIES INVESTMENT | 24 | 23 | 1 | ||||||||||||||||||
| Espais Promocat, S.L. | Spain | — | 44.60 | % | 50.00 | % | PROPERTY | 28 | 2 | — | ||||||||||||||||||
| FC2Egestión, S.L. | Spain | — | 50.00 | % | 50.00 | % | ENVIROMENTAL MANAGEMENT | 1 | — | 1 | ||||||||||||||||||
| Fidelización de Consumidores, S.A. | Spain | — | 39.60 | % | 39.60 | % | HOLDING COMPANY | — | — | — | ||||||||||||||||||
| Fondo de Titulización de Activos UCI 11 | Spain | — | (h) | — | SECURITISATION | — | — | — | ||||||||||||||||||||
| Fondo de Titulización de Activos UCI 14 | Spain | — | (h) | — | SECURITISATION | — | — | — | ||||||||||||||||||||
| Fondo de Titulización de Activos UCI 15 | Spain | — | (h) | — | SECURITISATION | — | — | — | ||||||||||||||||||||
| Fondo de Titulización Hipotecaria UCI 10 | Spain | — | (h) | — | SECURITISATION | — | — | — | ||||||||||||||||||||
| Fondo de Titulización Hipotecaria UCI 12 | Spain | — | (h) | — | SECURITISATION | — | — | — | ||||||||||||||||||||
| Fondo de Titulización Hipotecaria UCI 16 | Spain | — | (h) | — | SECURITISATION | — | — | — | ||||||||||||||||||||
| Fondo de Titulización Hipotecaria UCI 17 | Spain | — | (h) | — | SECURITISATION | — | — | — | ||||||||||||||||||||
| Friedrichstrasse, S.L. | Spain | — | 45.00 | % | 45.00 | % | PROPERTY | 44 | 44 | — | ||||||||||||||||||
F-218
Table of Contents
| % of Ownership Held | ||||||||||||||||||||||||||||
| by the Bank | Millions of Euros (a) | |||||||||||||||||||||||||||
| % of | Net Profit | |||||||||||||||||||||||||||
| Voting | Capital and | (Loss) for | ||||||||||||||||||||||||||
| Entity | Location | Direct | Indirect | Rights (f) | Line of Business | Assets | Reserves | the Year | ||||||||||||||||||||
| Granoller’s Broker, S.L. | Spain | — | 12.50 | % | 25.00 | % | FINANCE | 3 | 2 | — | ||||||||||||||||||
| Grupo Alimentario de Exclusivas, S.A. | Spain | — | 36.09 | % | 40.46 | % | FOOD | 6 | — | — | ||||||||||||||||||
| Grupo Financiero Galicia, S.A. (consolidated) (b) | Argentina | — | 6.67 | % | 3.50 | % | BANKING | 5,063 | 349 | (4 | ) | |||||||||||||||||
| Grupo Konecta Maroc S.A.R.L. à associé unique | Morocco | — | 44.25 | % | 44.25 | % | TELEMARKETING | — | — | — | ||||||||||||||||||
| Grupo Konecta Net, S.L. | Spain | — | 44.25 | % | 44.25 | % | HOLDING COMPANY | 16 | 2 | 3 | ||||||||||||||||||
| Habitat Elpi, S.L. | Spain | — | 44.60 | % | 50.00 | % | PROPERTY | 31 | 4 | — | ||||||||||||||||||
| Hipoteca Internet, S.L. | Spain | — | 50.00 | % | 50.00 | % | SERVICES | — | — | — | ||||||||||||||||||
| HLC — Centrais de Cogeraçao, S.A. (c) | Portugal | — | 24.45 | % | 24.49 | % | ELECTRICITY | 2 | (2 | ) | (2 | ) | ||||||||||||||||
| HSH Coinvest Luxembourg S.à.r.l. (b) | Luxembourg | — | 24.20 | % | — | HOLDING COMPANY | 79 | 79 | (2 | ) | ||||||||||||||||||
| Iberdrola, S.A. (consolidated) (b) | Spain | 0.70 | % | 2.58 | % | 3.29 | % | ELECTRICITY | 33,061 | 8,907 | 1,660 | |||||||||||||||||
| Imperial Holding S.C.A. (j) | Luxembourg | — | 36.67 | % | 36.67 | % | SECURITIES INVESTMENT | 184 | 38 | — | ||||||||||||||||||
| Inmobiliaria Sitio de Baldeazores, S.A. | Spain | — | 44.60 | % | 50.00 | % | PROPERTY | 13 | 2 | — | ||||||||||||||||||
| Kapitalia Credit House Global, S.L. | Spain | — | 22.13 | % | 22.13 | % | SERVICES | — | — | — | ||||||||||||||||||
| Kassadesign 2005, S.L. | Spain | — | 44.60 | % | 50.00 | % | PROPERTY | 41 | 12 | 1 | ||||||||||||||||||
| Kepler Weber S.A. (b) | Brazil | — | 5.57 | % | 5.68 | % | STORAGE SYSTEMS | 59 | 28 | (96 | ) | |||||||||||||||||
| Konecta Activos Inmobiliarios, S.L. | Spain | — | 45.62 | % | 45.62 | % | PROPERTY | — | — | — | ||||||||||||||||||
| Konecta Broker, S.L. | Spain | — | 44.25 | % | 44.25 | % | SERVICES | — | — | — | ||||||||||||||||||
| Konecta Bto, S.L. | Spain | — | 44.25 | % | 44.25 | % | TELECOMMUNICATIONS | 20 | 19 | 1 | ||||||||||||||||||
| Konecta Canarias, S.A. | Spain | — | 44.25 | % | 44.25 | % | MARKETING | 8 | 5 | 3 | ||||||||||||||||||
| Konecta Centro Especial de Empleo Madrid, S.L. | Spain | — | 44.25 | % | 44.25 | % | TELEMARKETING | — | — | — | ||||||||||||||||||
| Konecta Centro Especial de Empleo, S.A. | Spain | — | 44.25 | % | 44.25 | % | TELEMARKETING | 5 | 3 | 2 | ||||||||||||||||||
| Konecta Colombia Grupo Konecta Colombia Ltda | Colombia | — | 44.25 | % | 44.25 | % | TELEMARKETING | — | — | — | ||||||||||||||||||
| Konecta Chile, S.A. | Chile | — | 32.75 | % | 32.75 | % | SERVICES | 1 | — | 1 | ||||||||||||||||||
| Konecta Field Marketing, S.A. | Spain | — | 44.25 | % | 44.25 | % | MARKETING | — | — | — | ||||||||||||||||||
| Konecta Portugal, Lda. | Portugal | — | 44.25 | % | 44.25 | % | MARKETING | 1 | — | — | ||||||||||||||||||
| Konecta Servicios Administrativos y Tecnológicos, S.L. | Spain | — | 44.25 | % | 44.25 | % | SERVICES | 1 | — | — | ||||||||||||||||||
| Konecta Servicios de Empleo ETT, S.A. | Spain | — | 35.40 | % | 35.40 | % | TEMPORARY EMPLOYMENT AGENCY | 1 | (1 | ) | 1 | |||||||||||||||||
| Konecta Servicios Integrales de Consultoría, S.L. | Spain | — | 33.62 | % | 33.62 | % | ADVERTISING | — | — | — | ||||||||||||||||||
| Konecta Servicios Integrales de Marketing, S.L. | Spain | — | 44.25 | % | 44.25 | % | SERVICES | — | — | — | ||||||||||||||||||
| Konectanet Andalucía, S.L. | Spain | — | 44.25 | % | 44.25 | % | SERVICES | — | — | — | ||||||||||||||||||
| Konectanet Comercialización, S.L. | Spain | — | 44.22 | % | 44.22 | % | MARKETING | 1 | — | 1 | ||||||||||||||||||
| Kontacta Comunicaciones, S.A. | Spain | — | 33.19 | % | 33.19 | % | SERVICES | 1 | — | 1 | ||||||||||||||||||
| Kontacta Top Ten, S.L. | Spain | — | 33.18 | % | 33.18 | % | TELEMARKETING | — | — | — | ||||||||||||||||||
| Maxamcorp Holding, S.L. (e) | Spain | — | 22.62 | % | 22.62 | % | HOLDING COMPANY | 171 | 131 | 19 | ||||||||||||||||||
| Medimobiliario Ediçoes Period. e Multimedia, S.A | Portugal | — | 29.38 | % | 29.38 | % | PROPERTY SERVICES | — | — | — | ||||||||||||||||||
| Norchem Holdings e Negocios S.A. | Brazil | — | 21.33 | % | 21.75 | % | HOLDING COMPANY | 85 | 29 | 5 | ||||||||||||||||||
| Norchem Participaçoes e Consultoria S.A. | Brazil | — | 49.04 | % | 50.00 | % | BROKER-DEALER | 23 | 16 | 3 | ||||||||||||||||||
| Omega Financial Services GmbH | Germany | — | 50.00 | % | 50.00 | % | SERVICES | 1 | — | 2 | ||||||||||||||||||
| Operadora de Activos Alfa, S.A. De C.V. | Mexico | — | 49.98 | % | 49.98 | % | FINANCE | 2 | 2 | — | ||||||||||||||||||
| Operadora de Activos Beta, S.A. de C.V. | Mexico | — | 49.99 | % | 49.99 | % | FINANCE | 2 | 3 | — | ||||||||||||||||||
| Oportunity Center, S.L. | Spain | — | 44.25 | % | 44.25 | % | SERVICES | 1 | — | 1 | ||||||||||||||||||
| Petroquímica União S.A. (consolidated) (b) | Brazil | — | 9.89 | % | 10.08 | % | CHEMICALS | 680 | 248 | 57 | ||||||||||||||||||
| Prodesur Mediterráneo, S.L. | Spain | — | 44.60 | % | 50.00 | % | PROPERTY | 78 | 22 | (2 | ) | |||||||||||||||||
| Programa Multi Sponsor PMS, S.A. (b) | Spain | 24.75 | % | 24.75 | % | 49.50 | % | ADVERTISING | 23 | 4 | — | |||||||||||||||||
| Proinsur Mediterráneo, S.L. | Spain | — | 44.60 | % | 50.00 | % | PROPERTY | 82 | 28 | (1 | ) | |||||||||||||||||
| PSA Finance PLC | United Kingdom | — | 50.00 | % | 50.00 | % | LEASING | 11 | 6 | 4 | ||||||||||||||||||
| Puntoform, S.L. | Spain | — | 44.22 | % | 44.22 | % | TRAINING | — | — | — | ||||||||||||||||||
| Quiero Televisión, S.A., Sole-Shareholder Company | Spain | — | 31.82 | % | 31.82 | % | TELECOMMUNICATIONS | 7 | 6 | — | ||||||||||||||||||
| Real Estate Investment Society España, S.A. | Spain | 31.80 | % | — | 31.80 | % | PROPERTY | 100 | 100 | — | ||||||||||||||||||
| Redbanc, S.A. | Chile | — | 25.65 | % | 33.43 | % | SERVICES | 11 | 5 | 1 | ||||||||||||||||||
| Reintegra, S.A. | Spain | — | 45.00 | % | 45.00 | % | COLLECTION AND PAYMENT SERVICES | 4 | 3 | 1 | ||||||||||||||||||
| RFS Holdings B.V. | Netherlands | 27.91 | % | — | 27.91 | % | HOLDING COMPANY | 69,826 | 69,814 | 5 | ||||||||||||||||||
| Servicio Pan Americano de Protección, S.A. de C.V. | Mexico | — | 15.78 | % | 21.05 | % | SECURITY | 145 | 84 | (5 | ) | |||||||||||||||||
| Servicios Financieros Enlace S.A. de C.V. (b) | El Salvador | 21.48 | % | — | 21.48 | % | NOT-FOR-PROFIT COMPANY | 2 | 1 | — | ||||||||||||||||||
| Shinsei Bank, Ltd. (consolidated) (e) | Japan | — | 4.23 | % | 4.23 | % | BANKING | 65,711 | 6,028 | (369 | ) | |||||||||||||||||
| Sociedad Interbancaria de Depósitos de Valores, S.A. | Chile | — | 22.48 | % | 29.29 | % | SECURITIES DEPOSITORY INSTITUTION | 2 | 1 | — | ||||||||||||||||||
F-219
Table of Contents
| % of Ownership Held | ||||||||||||||||||||||||||||
| by the Bank | Millions of Euros (a) | |||||||||||||||||||||||||||
| % of | Net Profit | |||||||||||||||||||||||||||
| Voting | Capital and | (Loss) for | ||||||||||||||||||||||||||
| Entity | Location | Direct | Indirect | Rights (f) | Line of Business | Assets | Reserves | the Year | ||||||||||||||||||||
| Sociedad Operadora de la Cámara de Compensación de Pagos de Alto Valor, S.A. | Chile | — | 13.94 | % | 18.16 | % | SERVICES | 5 | 4 | 1 | ||||||||||||||||||
| Sos Cuétara, S.A. (consolidated) (b) | Spain | 2.18 | % | 2.61 | % | 5.09 | % | PASTRY MANUFACTURER | 1,744 | 590 | 13 | |||||||||||||||||
| Sovereign Bancorp, Inc. (consolidated) (b) | United States | 24.43 | % | — | 24.43 | % | BANKING | 60,894 | 5,779 | 93 | ||||||||||||||||||
| The HSH Coinvest (Cayman) Trust-B (b) | Cayman Islands | — | 24.20 | % | — | HOLDING COMPANY | 79 | 79 | (2 | ) | ||||||||||||||||||
| Tramitación Externa, S.A. | Spain | — | 25.00 | % | 25.00 | % | SERVICES | — | 1 | — | ||||||||||||||||||
| Transbank, S.A. | Chile | — | 25.10 | % | 32.71 | % | CARDS | 180 | 7 | 1 | ||||||||||||||||||
| Transolver Finance EFC, S.A. | Spain | — | 50.00 | % | 50.00 | % | LEASING | 224 | 29 | 1 | ||||||||||||||||||
| Turyocio Viajes y Fidelización, S.A. | Spain | — | 32.21 | % | 32.21 | % | TRAVEL | 1 | — | — | ||||||||||||||||||
| U.C.I., S.A. | Spain | 50.00 | % | — | 50.00 | % | HOLDING COMPANY | 116 | 112 | 27 | ||||||||||||||||||
| UCI Servicios Inmobiliarios y Profesionales, S.L. | Spain | — | 50.00 | % | 50.00 | % | SERVICES | — | — | — | ||||||||||||||||||
| UFI Servizi S.r.l. (b) | Italy | — | 16.22 | % | 23.17 | % | SERVICES | — | — | — | ||||||||||||||||||
| Unión de Créditos Inmobiliarios, S.A., EFC | Spain | — | 50.00 | % | 50.00 | % | MORTGAGE LOAN COMPANY | 3,020 | 161 | 48 | ||||||||||||||||||
| Vector Software Factory, S.L. | Spain | — | 21.60 | % | 21.60 | % | IT | 7 | 1 | — | ||||||||||||||||||
| Viking Consortium Holdings Limited (consolidated) | United Kingdom | — | 24.99 | % | 24.99 | % | HOLDING COMPANY | 873 | 354 | (37 | ) | |||||||||||||||||
| (a) | Amounts per the books of each company generally at December 31, 2007, unless otherwise stated, because the financial statements have not yet been authorized for issue. The data on foreign companies were translated to euros at the year-end exchange rates. | |
| (b) | Data from the latest approved financial statements at December 31, 2006. | |
| (c) | Data from the latest approved financial statements at December 31, 2003. | |
| (d) | Data from the latest approved financial statements at April 30, 2002. | |
| (e) | Data at March 31, 2007, the closing date of this entity. | |
| (f) | Pursuant to Article 3 of Royal Decree 1815/1991, of December 20, approving the rules for the preparation of consolidated financial statements, in order to determine voting rights, the voting rights relating to subsidiaries or to other parties acting in their own name but on behalf of Group companies were added to the voting rights directly held by the Parent. Accordingly, the number of votes corresponding to the Parent in relation to companies over which it exercises indirect control is the number corresponding to each subsidiary holding a direct ownership interest in such companies. | |
| (g) | Excluding the Group companies listed in Exhibit I. | |
| (h) | Companies over which effective control is exercised. | |
| (i) | Company newly incorporated in 2007 for which no approved financial statements are available. | |
| (j) | Data from the latest approved financial statements at July 31, 2007. | |
| (k) | Data from the latest approved financial statements at June 30, 2007. |
F-220
Table of Contents
| % of Ownership | ||||||||||||||||||||||||||||
| Held by the Bank | Millions of Euros (a) | |||||||||||||||||||||||||||
| Net Profit | ||||||||||||||||||||||||||||
| (Loss) | ||||||||||||||||||||||||||||
| for the | Preference | |||||||||||||||||||||||||||
| Entity | Location | Direct | Indirect | Line of Business | Capital | Reserves | Year | Dividends | ||||||||||||||||||||
| Abbey National Capital Trust I | United States | — | (b | ) | FINANCE | — | — | — | — | |||||||||||||||||||
| Abbey National Capital Trust II | United States | — | (b | ) | FINANCE | — | — | — | — | |||||||||||||||||||
| Banesto Holdings, Ltd. | Guernsey | — | 89.19 | % | SECURITIES INVESTMENT | — | 45 | 6 | 6 | |||||||||||||||||||
| Banesto Preferentes, S.A. | Spain | — | 88.98 | % | FINANCE | — | — | 6 | 6 | |||||||||||||||||||
| Pinto Totta International Finance, Limited | Cayman Islands | — | 49.86 | % | FINANCE | — | — | 13 | 13 | |||||||||||||||||||
| Santander Emisora 150, S.A., Sole-Shareholder Company | Spain | 100.00 | % | — | FINANCE | — | — | — | — | |||||||||||||||||||
| Santander Finance Capital, S.A., Sole-Shareholder Company | Spain | 100.00 | % | — | FINANCE | — | — | 138 | 138 | |||||||||||||||||||
| Santander Finance Preferred, S.A., Sole-Shareholder Company | Spain | 100.00 | % | — | FINANCE | — | — | 109 | 109 | |||||||||||||||||||
| Totta & Açores Financing, Limited | Cayman Islands | — | 99.72 | % | FINANCE | — | — | 12 | 12 | |||||||||||||||||||
| (a) | Amounts per the books of each company at December 31, 2007, translated to euros (in the case of foreign companies) at the year-end exchange rates. | |
| (b) | Companies over which effective control is exercised. |
F-221
Table of Contents
F-222
Table of Contents
| 1. | Banco Santander S.A. (formerly Banco Santander Banespa S.A.) |
| a) | Number of equity instruments held by the Group | ||
| The Santander Group holds 70,532,121,965 ordinary shares and 59,683,197,827 preference shares through its subsidiaries Grupo Empresarial Santander, S.L. and Santander Seguros, S.A. The shares composing the share capital of Banespa have no par value. | |||
| The preference shares have no voting rights and are not convertible into ordinary shares. However, they have the following advantages: |
| 1. | Their dividends are 10% higher than those on ordinary shares. | ||
| 2. | Priority in the distribution of dividends. | ||
| 3. | Participation, on the same terms as ordinary shares, in capital increases resulting from the capitalization of reserves and profits and in the distribution of bonus shares arising from the capitalization of retained earnings, reserves or any other funds. | ||
| 4. | Priority in the reimbursement of capital in the event of the dissolution of the company. |
| There is no unpaid capital. | |||
| b) | Capital increases in progress | ||
| No approved capital increases are in progress. | |||
| c) | Capital authorized by the shareholders at the Annual General Meeting | ||
| The company is authorized to increase share capital, subject to approval by the Board of Directors but without the need to amend the bylaws, up to a limit of 250,000,000,000 shares (125,000,000,000 ordinary shares and 125,000,000,000 preference shares). At present the share capital consists of 132,768,478,951 shares (71,035,922,637 ordinary shares and 61,732,556,314 preference shares). | |||
| d) | Rights on founder’s shares, “rights” bonds, convertible debentures and similar securities or rights | ||
| There are no rights on founder’s shares, “rights” bonds, convertible debentures and similar securities or rights. | |||
| e) | Specific circumstances that restrict the availability of reserves | ||
| The only restriction on the availability of Banco Santander, S.A.’s reserves relates to the legal reserve (restricted reserves), which can only be used to offset losses or to increase capital. | |||
| f) | Non-Group entities which hold, directly or through subsidiaries, 10% or more of equity | ||
| Not applicable. |
| g) | Listed equity instruments | ||
| All the shares are listed on the São Paulo Stock Exchange (Bovespa). |
F-223
Table of Contents
| 2. | Banco Español de Crédito, S.A. (Banesto) |
| a) | Number of equity instruments held by the Group | ||
At December 31, 2007, the Parent and its subsidiaries held 613,696,098 fully subscribed and paid ordinary shares of€0.79 par value each, all of which carry the same voting and dividend rights. | |||
The Annual General Meeting of Banco Español de Crédito S.A. held at first call on February 26, 2008 resolved to reduce the entity’s share capital by€5,485,207 through the retirement of 6,943,300 treasury shares, previously acquired under authorization of the Annual General Meeting, within the limits envisaged in Articles 75 et seq. | |||
| b) | Capital increases in progress | ||
| No approved capital increases are in progress. | |||
| c) | Capital authorized by the shareholders at the Annual General Meeting | ||
| The Annual General Meeting of Banco Español de Crédito S.A. held at first call on February 26, 2008 authorized the Board of Directors to increase capital at one or several times, within five years from the date of the Annual General Meeting, by an amount (par value) of up to half the share capital of the Bank at the date of the Meeting, through the issuance of new shares, with or without share premium and with or without voting rights; the consideration for the new shares to be issued will be monetary contributions, and the Board may set the terms and conditions of the capital increase. Also, the Board was empowered to disapply preemptive subscription rights, fully or partially, in accordance with Article 159.2 of the Spanish Companies Law. | |||
| d) | Rights on founder’s shares, “rights” bonds, convertible debentures and similar securities or rights | ||
| At December 31, 2007, no shares with these characteristics had been issued. | |||
| e) | Specific circumstances that restrict the availability of reserves | ||
| The legal reserve can be used to increase capital provided that the remaining reserve balance does not fall below 10% of the increased share capital amount (10% of any net profit reported each year must be transferred to the legal reserve until the balance of this reserve reaches 20% of the share capital). Pursuant to the Spanish Companies Law, a restricted reserve has been recorded for an amount equal to the carrying amount of the Banesto shares owned by subsidiaries. | |||
| The revaluation reserve recorded pursuant to Royal Decree-Law 7/1996, of June 7, can be used to increase capital. | |||
| f) | Non-Group entities which hold, directly or through subsidiaries, 10% or more of equity | ||
| Not applicable. | |||
| g) | Listed equity instruments | ||
| All the shares are listed on the Spanish Stock Exchanges. |
| 3. | Banco Santander Totta, S.A. (Totta) |
| a) | Number of equity instruments held by the Group | ||
The Group holds 574,356,881 ordinary shares through Santander Totta, SGPS and 14,593,315 ordinary shares through Taxagest Sociedade Gestora de Participaçoes Sociais, S.A., all of which have a par value of€1 each, are fully subscribed and paid and carry the same voting and dividend rights. | |||
| b) | Capital increases in progress | ||
| No approved capital increases are in progress. |
F-224
Table of Contents
| c) | Capital authorized by the shareholders at the Annual General Meeting | ||
| Not applicable. | |||
| d) | Rights on founder’s shares, “rights” bonds, convertible debentures and similar securities or rights | ||
| At December 31, 2007, no shares with these characteristics had been issued. | |||
| e) | Specific circumstances that restrict the availability of reserves | ||
| Under Article 296 of the Companies’ Code, the legal and merger reserves can only be used to offset losses or to increase capital. | |||
| Non-current asset revaluation reserves are regulated by Decree-Law 31/1998, under which losses can be offset or capital increased by the amounts for which the underlying asset is depreciated, amortized or sold. | |||
| f) | Non-Group entities which hold, directly or through subsidiaries, 10% or more of equity | ||
| Not applicable. | |||
| g) | Listed equity instruments | ||
| Totta’s shares are not listed. |
| 4. | Banco Santander Chile |
| a) | Number of equity instruments held by the Group | ||
| The Group holds 66,822,519,695 ordinary shares through Santander Chile Holding, S.A., 78,108,391,607 ordinary shares through Teatinos Siglo XXI Inversiones Limitada and 16,577 ordinary shares through Santander Inversiones Limitada (Chile), all of which have no par value, are fully subscribed and paid and carry the same voting and dividend rights. | |||
| b) | Capital increases in progress | ||
| No approved capital increases are in progress. | |||
| c) | Capital authorized by the shareholders at the Annual General Meeting | ||
| Due to the effect of the monetary adjustment, share capital amounted to CLP 818,535,110,378 at December 31, 2007. However, each year the Annual General Meeting must approve the balance sheet at December 31, of the previous year and, therefore, approve the share capital amount. | |||
| d) | Rights on founder’s shares, “rights” bonds, convertible debentures and similar securities or rights | ||
| At December 31, 2007, no shares with these characteristics had been issued. | |||
| e) | Specific circumstances that restrict the availability of reserves | ||
| Remittances to foreign investors in relation to investments made under the Statute of Foreign Investment (Decree-Law 600/1974) and the amendments thereto require the prior authorization of the Foreign Investment Committee. |
F-225
Table of Contents
| f) | Non-Group entities which hold, directly or through subsidiaries, 10% or more of equity | ||
| Not applicable. | |||
| g) | Listed equity instruments | ||
| All the shares are listed on the Chilean Stock Exchanges and, through American Depositary Receipts (ADRs), on the New York Stock Exchange. |
| 5. | Banco Santander, S.A., Institución de Banca Múltiple, Grupo Financiero Santander. |
| a) | Number of equity instruments held by the Group | ||
| The Santander Group holds 62,308,710,973 ordinary shares of Grupo Financiero Santander, S.A. de C.V. | |||
| b) | Capital increases in progress | ||
| No approved capital increases are in progress. | |||
| c) | Capital authorized by the shareholders at the Annual General Meeting | ||
| The shareholders at the Extraordinary and Annual General Meeting held on 3 December 2007 resolved to set the authorized share capital of Banco Santander, S.A., Institución de Banca Múltiple, Grupo Financiero Santander at MXN 14,619,490,617, represented by a total of 146,194,906,170 shares. Of this share capital, MXN 7,309,748,223 have been fully subscribed and paid, represented by a total of 73,097,482,230 shares. | |||
| d) | Rights on founder’s shares, “rights” bonds, convertible debentures and similar securities or rights | ||
| At December 31, 2007, the entity had issued MXN 300 million of unsecured preferred subordinated debentures, subscribed by Bank of America and the Bank. These debentures have not been registered in the National Securities Register and, therefore, they cannot be included in a public offering. | |||
| e) | Specific circumstances that restrict the availability of reserves | ||
| The institution is subject to a legal requirement that at least 10% of net profit for the year be transferred to a capital reserve fund until the balance of the fund reaches the paid-in share capital amount. The capital reserve fund can only be distributed to shareholders as dividends in the form of shares. | |||
| f) | Non-Group entities which hold, directly or through subsidiaries, 10% or more of equity | ||
| Not applicable. | |||
| g) | Listed equity instruments | ||
| The company does not have any equity instruments listed on a stock exchange. |
F-226
Table of Contents
| 6. | Abbey |
| a) | Number of equity instruments held by the Group | ||
| The Group holds 1,485,893,636 fully subscribed and paid ordinary shares of GBP 0.10 par value each, all of which carry the same voting and dividend rights. |
| b) | Capital increases in progress | ||
| No approved capital increases are in progress. | |||
| c) | Capital authorized by the shareholders at the Annual General Meeting | ||
The company is authorized to increase share capital, subject to approval by the Board of Directors, by up to GBP 175,000,000 (1,750,000,000 ordinary shares), GBP 1,000,000,000 of sterling preference shares (1,000,000,000 shares), USD 10,080,000 of US dollar preference shares (1,008,000,000 shares) and€10,000,000 of euro preference shares (1,000,000,000 shares). | |||
| d) | Rights on founder’s shares, “rights” bonds, convertible debentures and similar securities or rights | ||
| Abbey has issued GBP 200 million of debentures (10.0625% subordinated debentures convertible into equity) exchangeable for sterling preference shares with a par value of GBP 1 each, at Abbey’s discretion. The exchange can be made at any time, provided the holders are given between 30 and 60 days’ notice. | |||
| e) | Specific circumstances that restrict the availability of reserves | ||
| Not applicable. | |||
| f) | Non-Group entities which hold, directly or through subsidiaries, 10% or more of equity | ||
| Not applicable. |
F-227
Table of Contents
| Euro thousand | Outstanding amount in million | Annual | ||||||||||||||||||||||||||||
| Issuer | 2007 | 2006 | 2005 | Currency | 2007 | 2006 | 2005 | Interest rate | Maturity Date | |||||||||||||||||||||
Banco Santander, S.A.- | ||||||||||||||||||||||||||||||
| Debentures — October 1993 | 117.798 | 117,798 | 117,798 | Euro | — | — | — | 8.75% | October 2008 | |||||||||||||||||||||
| Debentures — November 1993 | 173.973 | 173,973 | 180,304 | Euro | — | — | — | 8.25% | December 2008 | |||||||||||||||||||||
| Debentures — March 1994 | 47.091 | 47,091 | 60,251 | Euro | — | — | — | 7.63% | September 2009 | |||||||||||||||||||||
| Territorial Bonds — July 2003 | 1.992.320 | 1,992,320 | 2,000,000 | Euro | — | — | — | 4.00% | July 2013 | |||||||||||||||||||||
| Territorial Bonds — February 2004 | — | — | 1,500,000 | Euro | — | — | — | Floating | February 2006 | |||||||||||||||||||||
| Territorial Bonds — March 2004 | 1.000.000 | 1,000,000 | 1,000,000 | Euro | — | — | — | Floating | March 2009 | |||||||||||||||||||||
| Territorial Bonds — April 2004 | — | 999,760 | 1,000,000 | Euro | — | — | — | Floating | April 2007 | |||||||||||||||||||||
| Mortgage backed securities — October 2002 | — | 2,964,750 | 3,000,000 | Euro | — | — | — | 4.00% | October 2007 | |||||||||||||||||||||
| Mortgage backed securities — March 2003 | — | — | 1,500,000 | Euro | — | — | — | 2.75% | March 2006 | |||||||||||||||||||||
| Mortgage backed securities — September 2003 | 1.976.300 | 1,976,300 | 2,000,000 | Euro | — | — | — | 4.00% | September 2010 | |||||||||||||||||||||
| Mortgage backed securities — December 2003 | 1.497.600 | 1,497,600 | 1,500,000 | Euro | — | — | — | 4.00% | December 2008 | |||||||||||||||||||||
| Mortgage backed securities — March 2004 | 498.140 | 498,140 | 500,000 | Euro | — | — | — | 3.00% | March 2009 | |||||||||||||||||||||
| Mortgage backed securities — July 2004 | 1.484.235 | 1,484,235 | 1,500,000 | Euro | — | — | — | 5.00% | July 2016 | |||||||||||||||||||||
| Mortgage backed securities — February 2005 | 1,978,018 | 1,978,028 | 2,000,000 | Euro | — | — | — | 3.00% | February 2012 | |||||||||||||||||||||
| Mortgage backed securities — April 2005 | 987.860 | 987,860 | 1,000,000 | Euro | — | — | — | 4.00% | May 2020 | |||||||||||||||||||||
| Mortgage backed securities — September 2005 | 1.480.800 | 1,480,800 | 1,500,000 | Euro | — | — | — | 3.00% | January 2011 | |||||||||||||||||||||
| Mortgage backed securities — September 2005 | 2.467.825 | 2,467,825 | 2,500,000 | Euro | — | — | — | 3.00% | September 2015 | |||||||||||||||||||||
| Mortgage backed securities — February 2006 | 2.990.940 | 2,990,940 | — | Euro | — | — | — | 4.00% | February 2014 | |||||||||||||||||||||
| Mortgage backed securities — February 2006 | 1.485.045 | 1,485,045 | — | Euro | — | — | — | 4.00% | February 2026 | |||||||||||||||||||||
| Mortgage backed securities — September 2006 | 1.492.830 | 1,492,830 | — | Euro | — | — | — | 4.00% | September 2011 | |||||||||||||||||||||
| Mortgage backed securities — September 2006 | 1.492.453 | 1,498,170 | — | Euro | — | — | — | 4.00% | January 2017 | |||||||||||||||||||||
| Mortgage backed securities -2007 | 4.473.687 | — | — | Euro | — | — | — | From 4.00% to 5.00% | From May 2012 to May 2027 | |||||||||||||||||||||
| Securitization bonds — 2004 | 2.165.744 | 3,260,484 | 1,568,566 | Euro | — | — | — | Floating | From 2037 to 2042 | |||||||||||||||||||||
| Securitization bonds — 2005 | 1.185.072 | 1,280,577 | 1,104,277 | Euro | — | — | — | Floating | November 2038 | |||||||||||||||||||||
| Securitization bonds — 2006 | 4.581.640 | 4,373,740 | — | Euro | — | — | — | From 3.87% to 8.75% | From 2035 to 2050 | |||||||||||||||||||||
| Securitization bonds — 2007 | 771.332 | — | — | Euro | — | — | — | From 4.90% to 4.95% | From January to October 2050 | |||||||||||||||||||||
| Securitization bonds — 2007 | 4.316.403 | — | — | Euro | — | — | — | Floating | From December 2014 to October 2050 | |||||||||||||||||||||
| Own securities held and paid — in surplus | (6.277 | ) | (96,841 | ) | (395,815 | ) | Euro | — | — | — | — | September 2015 | ||||||||||||||||||
Santander Central Hispano International, Ltd. | ||||||||||||||||||||||||||||||
| Issued December 1998 | 206.582 | 206,583 | 206,584 | Euro | — | — | — | Floating | April 2008 | |||||||||||||||||||||
| Issued in June 1998 | 18.076 | 18,076 | 18,076 | Euro | — | — | — | Floating | March 2013 | |||||||||||||||||||||
| Issued in April 1998 | — | 153,388 | 153,388 | Euro | — | — | — | Floating | February 2007 | |||||||||||||||||||||
| Issued in December 1998 | 255.646 | 255,646 | 255,646 | Euro | — | — | — | 5.40% | February 2008 | |||||||||||||||||||||
| Issued in February 1998 | 181.512 | 181,512 | 181,512 | Euro | — | — | — | 5.38% | February 2008 | |||||||||||||||||||||
| From December 1997 to March 1998 | 45.735 | 396,368 | 701,266 | Euro | — | — | — | Floating | February 2009 | |||||||||||||||||||||
| Issued February 1998 | 304.898 | 304,898 | — | Euro | — | — | — | 5.38% | February 2008 | |||||||||||||||||||||
| Issued in February 2002 | — | 31,700 | 31,700 | Euro | — | — | — | Floating | January 2007 | |||||||||||||||||||||
F-228
Table of Contents
| Euro thousand | Outstanding amount in million | Annual | ||||||||||||||||||||||||||||
| Issuer | 2007 | 2006 | 2005 | Currency | 2007 | 2006 | 2005 | Interest rate | Maturity Date | |||||||||||||||||||||
| Issued from April 1998 to May 1998 | 30.218 | 31,116 | 32,152 | Swiss Francs | 50 | 50 | From 3.51% to 3.54% | From April 2008 to May 2008 | ||||||||||||||||||||||
| March 1994 | — | — | 335,611 | Pounds Sterling | — | 230 | 7.90% | March 2019 | ||||||||||||||||||||||
Banesto Group | ||||||||||||||||||||||||||||||
| Euro | — | 14,000 | 25,000 | Euro | — | — | — | 4.55% | August 2007 | |||||||||||||||||||||
| Euro | 3.308.814 | 4,284,535 | 163,100 | Euro | — | — | — | Floating | From January 2008 to June 2036 | |||||||||||||||||||||
| Euro | — | 260,593 | 104,000 | Euro | — | — | — | From 4.00% to 6.00% | From February 2007 to August 2011 | |||||||||||||||||||||
| Euro | — | — | — | Euro | — | — | — | Floating | October 2005 | |||||||||||||||||||||
| Euro | 1.000.000 | 1,000,000 | 1,000,000 | Euro | — | — | — | Floating | June 2010 | |||||||||||||||||||||
| Euro | — | — | 2,000,000 | Euro | — | — | — | Floating | October 2006 | |||||||||||||||||||||
| Euro | 1.000.000 | 1,041,100 | 1,000,000 | Euro | — | — | — | Floating | June 2009 | |||||||||||||||||||||
| Euro | — | 1,250,000 | 1,250,000 | Euro | — | — | — | 2.20% | October 2007 | |||||||||||||||||||||
| Euro | 1.500.000 | 1,500,000 | 1,500,000 | Euro | — | — | — | 2.25% | October 2008 | |||||||||||||||||||||
| Euro issued 2007 | 1.533.558 | — | — | Euro | — | — | — | Floating | From February 2008 to November 2037 | |||||||||||||||||||||
| Issued 2007 | 49.442 | — | — | Yens | 8,100 | — | — | Floating | From April 2012 to December 2017 | |||||||||||||||||||||
| Issued 2006 | 35.070 | 39,826 | — | Yens | 6,250 | — | Floating | November 2008 | ||||||||||||||||||||||
| Issued 2006 | 17.674 | 18,669 | — | Swiss Francs | 25 | 30 | — | Floating | From May 2009 to September 2016 | |||||||||||||||||||||
| Issued 2007 | 6.030 | — | — | Swiss Francs | 10 | — | — | Floating | July 2014 | |||||||||||||||||||||
| Issued 2006 | 72.971 | 74,460 | — | Sterling Pounds | 50 | 50 | — | Floating | February 2009 | |||||||||||||||||||||
| Issued 2007 | 96.770 | — | — | Sterling Pounds | 76.8 | — | — | Floating | From March 2010 to December 2013 | |||||||||||||||||||||
| Issued 2006 | 27.660 | 105,847 | — | U.S. Dollar | 35.4 | 139.4 | — | Floating | From May 2010 to December 2016 | |||||||||||||||||||||
| Issued 2006 | — | 7,593 | — | U.S. Dollar | 10 | — | 6.00% | June 2011 | ||||||||||||||||||||||
| Issued 2007 | 2.286.204 | — | — | U.S. Dollar | 3,364.7 | — | — | Floating | From March 2010 to December 2022 | |||||||||||||||||||||
| Issued 2007 | 23.174 | — | — | Czech Crown | 660 | — | — | Floating | June 2017 | |||||||||||||||||||||
| Mortgage backed securities 2002 | 1,000,000 | 1,000,000 | 1,000,000 | Euro | — | — | — | 5.75% | March 2017 | |||||||||||||||||||||
| Mortgage backed securities 2003 | 1,500,000 | 1,500,000 | 1,500,000 | Euro | — | — | — | 4.00% | May 2010 | |||||||||||||||||||||
| Mortgage backed securities 2004 | 2,000,000 | 2,000,000 | 2,000,000 | Euro | — | — | — | 3.75% | February 2011 | |||||||||||||||||||||
| Mortgage backed securities 2004 | 1,750,000 | 1,750,000 | 1,750,000 | Euro | — | — | — | 4.25% | September 2014 | |||||||||||||||||||||
| Mortgage backed securities 2005 | 4,000,000 | 4,000,000 | 4,000,000 | Euro | — | — | — | From 2.75% to 3.50% | From September 2012 to January 2015 | |||||||||||||||||||||
| Mortgage backed securities 2006 | 3,000,000 | 3,000,000 | — | Euro | — | — | — | From 2.50% to 4.25% | From July 2013 to January 2016 | |||||||||||||||||||||
| Mortgage backed securities 2007 | 1.807.326 | — | — | Euro | — | — | — | 4.25% | February 2014 | |||||||||||||||||||||
| Securitisation bonds 2006 | 1.298.597 | 951,321 | — | Euro | — | — | — | Floating | December 2025 | |||||||||||||||||||||
| Securitization bonds 2007 | 367.057 | — | — | Euro | — | — | — | 3.80% | December 2031 | |||||||||||||||||||||
Banco Santander Chile | ||||||||||||||||||||||||||||||
| Bonds | 108.306 | 127,134 | 176,228 | Chilean Pesos | 89,672 | 143,511 | From 7.52% to 7.92% | From October 2019 to July 2021 | ||||||||||||||||||||||
| Bonds | — | ��� | — | Chilean Pesos | — | 616,423 | 6.35% | Various maturities | ||||||||||||||||||||||
| Mortgage backed securities | 572.475 | 732,207 | 1,018,767 | Chilean Pesos | 536,249 | 734,688 | From 6.02 to 6.26% | From May 2013 to July 2016 | ||||||||||||||||||||||
| Bonds September 2004 | — | 13,245 | — | Chilean Pesos | — | 9,309 | — | From 6.34% to 6.36% | Various maturities | |||||||||||||||||||||
| Bonds December 2004 | 270.953 | 305,251 | 317,758 | Chilean Pesos | 213,772 | 232,019 | Floating | December 2009 | ||||||||||||||||||||||
| Bonds November 2005 | 208.214 | 204,787 | 182,803 | Chilean Pesos | 146,691 | 107,354 | 3.00% | March 2010 | ||||||||||||||||||||||
| Bonds May / August 2006 | 164.508 | 145,349 | — | Chilean Pesos | 102,317 | — | From 3.75% to 4.57% | From March 2016 to June 2012 | ||||||||||||||||||||||
| Bonds 2007 | 898.775 | — | — | Chilean Pesos | — | — | From 2.97% to 4.15% | From February 2011 to February 2037 | ||||||||||||||||||||||
Banco Santander Puerto Rico- | ||||||||||||||||||||||||||||||
| Debentures- February 2004 | 3.271 | 22,779 | 26,096 | U.S. Dollar | 4.8 | 30 | 31 | 3% | January 2010 | |||||||||||||||||||||
| Debentures- May 2004 | 4.755 | — | 5,934 | U.S. Dollar | 7 | — | 7 | 2.5% | May 2011 | |||||||||||||||||||||
| Debentures- May 2005 | 7.012 | 7,594 | 8,476 | U.S. Dollar | 10 | 10 | 10 | From 4.00% to 4.20% | From January 2008 to May 2012 | |||||||||||||||||||||
F-229
Table of Contents
| Euro thousand | Outstanding amount in million | Annual | ||||||||||||||||||||||||||||
| Issuer | 2007 | 2006 | 2005 | Currency | 2007 | 2006 | 2005 | Interest rate | Maturity Date | |||||||||||||||||||||
| Debentures- Dec 2006 | — | 5,776 | — | U.S. Dollar | — | 7 | — | 2.5% | January 2007 | |||||||||||||||||||||
Banco Río de la Plata S.A.- | ||||||||||||||||||||||||||||||
| Debentures -2003 | 39.654 | 68,236 | 104,393 | U.S. Dollar | 131.8 | 142 | 131 | From 4.00% to 6.00% | December 2009 | |||||||||||||||||||||
| Pesos 2007 | 86.707 | — | — | Argentinean Pesos | 450 | — | — | 11.38% | May 2010 | |||||||||||||||||||||
| Banco Rio Float | ||||||||||||||||||||||||||||||
Fideicomiso Super Letras Hipotecarias clase I | 6.003 | — | — | Argentinean Pesos | 70.8 | — | — | Floating | August 2010 | |||||||||||||||||||||
Fideicomiso Super Letras Hipotecarias clase I | 127 | — | — | Argentinean Pesos | 6 | — | — | 11.77% | August 2012 | |||||||||||||||||||||
Fideicomiso Super Letras Hipotecarias clase II | 15.077 | — | — | Argentinean Pesos | 93.5 | — | — | Floating | December 2013 | |||||||||||||||||||||
Fideicomiso Financiero Río Personales I | 14.885 | — | — | Argentinean Pesos | 16,477 | — | — | Floating | September 2009 | |||||||||||||||||||||
Banco Santander Totta, S.A. | ||||||||||||||||||||||||||||||
| Debentures- from June 1998 to October 1998 | 6.584 | 6,584 | 6,562 | Euro | — | — | — | 4.22% | July 2008 | |||||||||||||||||||||
| Debentures 1999 | 3.171 | 3,219 | 3,261 | Euro | — | — | — | Floating | February 2009 | |||||||||||||||||||||
| Debentures 2002 | — | — | 21,665 | Euro | — | — | — | Floating | January 2006 | |||||||||||||||||||||
| Debentures 2003 | 254.043 | 404,698 | 574,880 | Euro | — | — | — | Floating | From November 2008 to December 2008 | |||||||||||||||||||||
| Debentures 2004 | 216.440 | 389,395 | 477,258 | Euro | — | — | — | Floating | From June 2008 to September 2012 | |||||||||||||||||||||
| Debentures 2004 | 19.893 | 34,054 | 9,649 | Euro | — | — | — | 0.70% | June 2008 | |||||||||||||||||||||
| Debentures 2005 | 534.920 | 727,847 | 735,846 | Euro | — | — | — | Floating | From June 2010 to January 2013 | |||||||||||||||||||||
| Debentures 2006 | 1.599.499 | 2,639,051 | — | Euro | — | — | — | Floating | From January 2009 to June 2012 | |||||||||||||||||||||
| Debentures 2006 | 20.768 | 29,981 | — | Euro | — | — | — | 2.50% | December 2011 | |||||||||||||||||||||
| Debentures 2006 | — | 1,138,952 | — | U.S. Dollar | — | 1,500 | — | 5.35% | July 2011 | |||||||||||||||||||||
| Debentures 2007 | 2.615.444 | — | — | Euro | — | — | — | Floating | From November 2008 to May 2012 | |||||||||||||||||||||
Totta Crédito Especializado, Instituiçao Financeira de Crédito, S.A. (IFIC) | ||||||||||||||||||||||||||||||
| Bonds 2007 | 1.188.778 | — | — | U.S. Dollar | — | — | — | Floating | March 2012 | |||||||||||||||||||||
Totta Crédito Especializado, Instituiçao Financeira de Crédito, S.A. (IFIC) | ||||||||||||||||||||||||||||||
| Debentures 1997 and 1998 | — | — | — | Euro | — | — | — | Floating | From July 2004 to October 2005 | |||||||||||||||||||||
Banco Santander Banespa, S.A. | ||||||||||||||||||||||||||||||
| Eurobonds 2005 | 166.094 | 167,696 | 166,051 | U.S. Dollar | 410 | 456 | 456 | Floating | From April 2008 to May 2009 | |||||||||||||||||||||
| Eurobonds 2005 | 42.891 | 41,588 | 44,817 | U.S. Dollar | 75 | 55 | 53 | 5.00% | July 2008 | |||||||||||||||||||||
| Eurobonds 2006 | — | 8,744 | — | U.S. Dollar | — | 12 | — | 10.00% | June 2007 | |||||||||||||||||||||
| Eurobonds 2006 | — | 119,547 | — | U.S. Dollar | — | 157 | — | Floating | From May 2009 to August 2024 | |||||||||||||||||||||
| Eurobonds 2007 | 30.877 | — | — | U.S. Dollar | 5 | — | — | 6.00% | February 2008 | |||||||||||||||||||||
| Debentures 2004 | — | — | 85,285 | U.S. Dollar | — | — | 101 | 4.05% | July 2006 | |||||||||||||||||||||
| Debentures 2005 | — | — | 57,780 | U.S. Dollar | — | — | 67 | 1.02% | From January to February 2006 | |||||||||||||||||||||
| Bonds 2006 | 143.355 | 125,344 | — | U.S. Dollar | 349 | 165 | — | Floating | From May 2009 to August 2024 | |||||||||||||||||||||
| Bonds 2007 | 11.946 | — | — | U.S. Dollar | 30 | — | — | Floating | May 2017 | |||||||||||||||||||||
| Mortgage backed securities 2006 | 9.193 | 51,733 | — | Brazilian Real | 24 | 145 | — | Floating | From March to May 2008 | |||||||||||||||||||||
| Mortgage backed securities 2007 | 149.437 | — | — | Brazilian Real | 388 | — | — | Floating | From January to December 2008 | |||||||||||||||||||||
| Bonds 2007 | 230.256 | — | — | Brazilian Real | 1,224 | — | — | Floating | From January 2008 to February 2009 | |||||||||||||||||||||
| Bonds 2007 | 44.796 | — | — | Brazilian Real | 116 | — | — | From 10.00% to 11.00% | From April 2008 to January 2014 | |||||||||||||||||||||
Banco Santander Colombia S.A. | ||||||||||||||||||||||||||||||
| Debentures 2005 | 38.290 | 38,496 | 42,419 | Colombian Pesos | 104 | 104 | 114 | Floating | February 2012 | |||||||||||||||||||||
F-230
Table of Contents
| Euro thousand | Outstanding amount in million | Annual | ||||||||||||||||||||||||||||
| Issuer | 2007 | 2006 | 2005 | Currency | 2007 | 2006 | 2005 | Interest rate | Maturity Date | |||||||||||||||||||||
Santander Consumer Bank S.p.A. | ||||||||||||||||||||||||||||||
| Debentures | — | — | 172,500 | Euro | — | — | — | Floating | January to July 2006 | |||||||||||||||||||||
| Debentures | — | — | 6,000 | Euro | — | — | — | 10.10% | April 2006 | |||||||||||||||||||||
| Securitisation Bonds (Golden Bar Program) | 1.815.853 | 1,184,114 | 813,553 | Euro | — | — | — | Floating | From October 2020 to November 2022 | |||||||||||||||||||||
Santander BanCorp | ||||||||||||||||||||||||||||||
| Debentures June 2004 | — | — | 63,575 | U.S. Dollar | — | 75 | 63 | 6.30% | June 2032 | |||||||||||||||||||||
| Debentures October 2005 | — | — | 42,384 | U.S. Dollar | — | 50 | — | 6.10% | June 2032 | |||||||||||||||||||||
Santander Consumer Bank Aktiengesellschaft | ||||||||||||||||||||||||||||||
| Bonds | — | — | 6,109 | Euro | — | — | — | From 3.00% to 4.00% | From March to September 2006 | |||||||||||||||||||||
| Securitization bonds | 736.894 | 1,002,114 | 1,667,978 | Euro | — | — | — | Floating | From June 2010 to July 2013 | |||||||||||||||||||||
| Issued 2006 | 1.632.362 | 1,768,788 | — | Euro | — | — | — | Floating | From July 2013 to March 2014 | |||||||||||||||||||||
| Issued 2007 | 2.505.798 | — | — | Euro | — | — | — | Floating | From February to March 2012 | |||||||||||||||||||||
Santander International Debt, S.A. | ||||||||||||||||||||||||||||||
| Senior Debt 2004 | — | 1,500,000 | 3,500,000 | Euro | — | — | — | Floating | December 2007 | |||||||||||||||||||||
| Senior Debt 2004 | — | — | 42,384 | U.S. Dollar | — | 50 | Floating | December 2006 | ||||||||||||||||||||||
| Senior Debt 2004 | — | 372,301 | 364,804 | Pounds Sterling | 250 | 250 | Floating | December 2007 | ||||||||||||||||||||||
| Senior Debt 2005 | 8.096.113 | 8,052,305 | 8,995,000 | Euro | — | — | Floating | From February 2008 to September 2035 | ||||||||||||||||||||||
| Senior Debt 2005 | 819.385 | 893,521 | 955,786 | Pounds Sterling | 600 | 655 | Floating | From April 2008 to October 2010 | ||||||||||||||||||||||
| Senior Debt 2005 | — | 196,322 | 218,579 | Canadian Dollar | 300 | 300 | Floating | September 2010 | ||||||||||||||||||||||
| Senior Debt 2006 | 9.019.000 | 9,919,000 | — | Euro | — | — | Floating | From July 2008 to October 2029 | ||||||||||||||||||||||
| Senior Debt 2006 | 1.022.704 | 1,162,404 | — | Pounds Sterling | 750 | — | Floating | From February 2009 to July 2011 | ||||||||||||||||||||||
| Senior Debt 2006 | — | 68,864 | — | Mexican Pesos | 1,000 | — | Floating | January 2007 | ||||||||||||||||||||||
| Senior Debt 2006 | 108.689 | 121,489 | — | U.S. Dollar | 160 | — | Floating | From October 2009 to August 2011 | ||||||||||||||||||||||
| Senior Debt 2006 | 26.288 | 25,468 | — | Czech Crown | 700 | — | Floating | February 2010 | ||||||||||||||||||||||
| Senior Debt 2006 | 84.885 | 89,212 | — | Yens | 14,000 | — | Floating | From February 2008 to December 2016 | ||||||||||||||||||||||
| Senior Debt 2006 | 61.609 | 60,694 | — | Norwegian Kroners | 500 | — | Floating | July 2016 | ||||||||||||||||||||||
| Senior Debt 2006 | 276.836 | 261,763 | — | Canadian Dollar | 400 | — | Floating | November 2009 | ||||||||||||||||||||||
| Senior Debt 2007 | 68.433 | — | — | Mexican Pesos | 1,100 | — | — | Floating | July 2022 | |||||||||||||||||||||
| Senior Debt 2007 | 67.930 | — | — | U.S. Dollar | 100 | — | — | 5.28% | February 2008 | |||||||||||||||||||||
| Senior Debt 2007 | 810.000 | — | — | Euro | 1,100 | — | — | From 4.13% to 4.74% | From December 2008 to April 2011 | |||||||||||||||||||||
| Senior Debt 2007 | 8.304.998 | — | — | Euro | — | — | — | Floating | From September 2008 to May 2022 | |||||||||||||||||||||
| Senior Debt 2007 | 346.045 | — | — | Canadian Dollar | 500 | — | — | Floating | February 2010 | |||||||||||||||||||||
| Senior Debt 2007 | 443.172 | — | — | Pounds Sterling | 325 | — | — | Floating | From July 2009 to March 2012 | |||||||||||||||||||||
| Senior Debt 2007 | 18.190 | — | — | Yens | 3,000 | — | — | Floating | December 2016 | |||||||||||||||||||||
Brasil Foreign Diversified Payment Right Finance Company | ||||||||||||||||||||||||||||||
| Medium Term Notes | 244.700 | 303,721 | 341,138 | U.S. Dollar | 400 | 400 | 402 | 6.00% | September 2011 | |||||||||||||||||||||
Santander US Debt, S.A.U. | º | |||||||||||||||||||||||||||||
| Senior Debt 2005 | 2.139.800 | 4,542,458 | 5,086,039 | U.S. Dollar | 3,150 | 5,500 | 6,000 | Floating | From September to October 2008 | |||||||||||||||||||||
| Senior Debt 2006 | 4.137.229 | 3,785,383 | — | U.S. Dollar | 6,100 | 5,000 | — | Floating | November 2009 | |||||||||||||||||||||
| Senior Debt 2007 | 2.037.905 | — | — | U.S. Dollar | 3,000 | — | — | Floating | July 2010 | |||||||||||||||||||||
F-231
Table of Contents
| Euro thousand | Outstanding amount in million | Annual | ||||||||||||||||||||||||||||
| Issuer | 2007 | 2006 | 2005 | Currency | 2007 | 2006 | 2005 | Interest rate | Maturity Date | |||||||||||||||||||||
Santander Consumer Finance, S.A. | ||||||||||||||||||||||||||||||
| Mortgage backed securities | 1.189.985 | 1,193,952 | — | Euro | — | — | — | 2.54% | March 2016 | |||||||||||||||||||||
Abbey National plc | ||||||||||||||||||||||||||||||
Securitization Bonds (Holmes Funding) | ||||||||||||||||||||||||||||||
| Swiss Francs | — | — | 699,300 | Swiss Francs | — | — | 1,150 | From 4.92% to 4.82% | October 2009 | |||||||||||||||||||||
| Issued 2007 | 2.886.271 | — | — | Pounds Sterling | 2,117 | — | Floating | From July 2020 to July 2040 | ||||||||||||||||||||||
| Issued 2006 | 2.132.680 | 2,329,114 | — | Pounds Sterling | 1,564 | 1,564 | — | Floating | July 2040 | |||||||||||||||||||||
| Issued 2005 | 1.363.606 | 1,489,203 | 1,459,215 | Pounds Sterling | 1,000 | 1,000 | 1,000 | Floating | From January 2016 to January 2021 | |||||||||||||||||||||
| 2000-2004 | 340.901 | 372,301 | 364,804 | Pounds Sterling | 250 | 250 | 250 | 5.41% | July 2013 | |||||||||||||||||||||
| 2000-2004 | 2.493.899 | 3,392,435 | 5,533,197 | Pounds Sterling | 1,804 | 2,293 | 3,917 | Floating | From July 2010 to July 2040 | |||||||||||||||||||||
| Issued 2007 | 8.130.208 | — | — | U.S. Dollar | 11,952 | — | — | Floating | From March 2008 to July 2040 | |||||||||||||||||||||
| Issued 2006 | 3.738.002 | 6,717,724 | — | U.S. Dollar | 3,305 | 8,439 | — | Floating | From January 2021 to July 2040 | |||||||||||||||||||||
| 2000-2005 | 1.893.831 | 5,155,086 | 8,330,586 | U.S. Dollar | 5,774 | 5,922 | 9,412 | Floating | From July 2013 to July 2040 | |||||||||||||||||||||
| Issued 2007 | 416.202 | — | — | Canadian Dollar | 600 | — | — | Floating | July 2020 | |||||||||||||||||||||
| Issued 2007 | 4.491.476 | — | — | Euro | — | — | — | Floating | From July 2021 to July 2040 | |||||||||||||||||||||
| Issued 2006 | 1.930.568 | 1,957,659 | — | Euro | — | — | — | Floating | From July 2021 to July 2040 | |||||||||||||||||||||
| Issued 2005 | 740.986 | 754,326 | 739,136 | Euro | — | — | 740 | Floating | January 2021 | |||||||||||||||||||||
| Issued 2000 to 2004 | — | — | 1,262,221 | Euro | — | — | 1,400 | From 4.82% to 4.87% | From July 2008 to October 2008 | |||||||||||||||||||||
| Issued 2000 to 2004 | 1.680.737 | 3,532,849 | 4,434,450 | Euro | — | — | 4,753 | Floating | From October 2008 to July 2040 | |||||||||||||||||||||
Securitization Bonds (Hipototta) | ||||||||||||||||||||||||||||||
| Hipototta Nº1 plc | 141.078 | 224,694 | — | Euro | — | — | — | Floating | From November 2034 to September 2048 | |||||||||||||||||||||
| Hipototta Nº4 plc | 1.634.991 | 2,345,112 | — | Euro | — | — | — | Floating | September 2048 | |||||||||||||||||||||
| Hipototta Nº5 plc | 1.734.441 | — | — | Euro | — | — | — | Floating | February 2060 | |||||||||||||||||||||
Securitization Bonds (Marylebond) | ||||||||||||||||||||||||||||||
| Sythetic Collateralised Debt Obligation | 86.046 | 101,875 | — | Euro | — | — | — | 4.69% | November 2011 | |||||||||||||||||||||
Bonds | ||||||||||||||||||||||||||||||
| Issued 2006 | 17.926 | 17,970 | — | Australian Dollar | 30 | — | — | 7.29% | December 2008 | |||||||||||||||||||||
| Issued 2004 | 29.876 | 29,950 | — | Australian Dollar | 50 | — | Floating | January 2009 | ||||||||||||||||||||||
| Issued 2007 | 34.683 | — | — | Canadian Dollar | 50,120 | — | — | 4.767% | June 2010 | |||||||||||||||||||||
| Issued 2006 | 208.101 | 196,218 | — | Canadian Dollar | 300 | — | Floating | January 2008 | ||||||||||||||||||||||
| Issued 2004-2005 | — | 376,084 | 768,029 | Canadian Dollar | 575 | 1,050 | Floating | From June 2007 to August 2007 | ||||||||||||||||||||||
| Issued 2004 | 9.018 | 8,503 | 9,826 | Canadian Dollar | 13 | 13 | 4.00% | January 2009 | ||||||||||||||||||||||
| 2000-2004 | — | — | 13,545 | Swiss Francs | — | 21 | Floating | November 2007 | ||||||||||||||||||||||
| 2005 | — | — | 52,068 | Swiss Francs | — | 80 | Floating | February 2007 | ||||||||||||||||||||||
| Issued 2007 | 225.032 | — | — | Hong Kong Dollar | 2,583 | — | — | From 3.73% to 4.75% | From March 2008 to January 20017 | |||||||||||||||||||||
| Issued 2007 | 17.444 | — | — | Hong Kong Dollar | 200 | — | — | Floating | July 2009 | |||||||||||||||||||||
| Issued 2006 | 4.710 | 18,915 | — | Hong Kong Dollar | 194 | — | Floating | October 2008 | ||||||||||||||||||||||
| Issued 2006 | 374.676 | 430,177 | — | Hong Kong Dollar | 4,412 | — | From 4.13% to 5.33% | From April 2008 to August 2016 | ||||||||||||||||||||||
| Issued 2005 | 193.459 | 351,494 | 395,881 | Hong Kong Dollar | 3,605 | 860 | From 0.10% to 5.04% | From August 2008 to December 2014 | ||||||||||||||||||||||
| Issued 2005 | 47.099 | 56,551 | 94,630 | Hong Kong Dollar | 580 | 3,593 | Floating | From March 2008 to May 2010 | ||||||||||||||||||||||
| Issued 1998-2004 | — | 40,951 | 128,916 | Hong Kong Dollar | 420 | 1,170 | Floating | From January 2008 to October 2011 | ||||||||||||||||||||||
F-232
Table of Contents
| Euro thousand | Outstanding amount in million | Annual | ||||||||||||||||||||||||||||
| Issuer | 2007 | 2006 | 2005 | Currency | 2007 | 2006 | 2005 | Interest rate | Maturity Date | |||||||||||||||||||||
| Issued 1998-2004 | 116.617 | 196,661 | 263,592 | Hong Kong Dollar | 2,017 | 2,358 | From 0.10% to 6.64% | From January 2008 to May 2012 | ||||||||||||||||||||||
| Issued 2002 | 125.678 | 121.275 | 127,780 | Norwegian Kroners | 1,000 | 1,000 | 1,000 | 6.52% | September 2012 | |||||||||||||||||||||
| Issued 1999 | 47.345 | 49,427 | 51,558 | Singapore Dollar | 100 | 100 | 100 | 5.00% | October 2009 | |||||||||||||||||||||
| Issued 2007 | 94.691 | — | — | Singapore Dollar | 1,087 | — | — | 2.56% | January 2009 | |||||||||||||||||||||
| Issued 2005 | — | 53,374 | 58,123 | New Zealand Dollar | 100 | 100 | Floating | November 2007 | ||||||||||||||||||||||
| Issued 2004 | — | — | 31,449 | Argentinean Pesos | — | 50 | Floating | January 2009 | ||||||||||||||||||||||
| 2007 | 4.057 | — | — | Mexican Pesos | 46 | — | — | 8.00% | July 2008 | |||||||||||||||||||||
| 2007 | 166.287 | — | — | Chilean Pesos | 122,270 | — | — | 5.86% | July 2010 | |||||||||||||||||||||
| 1995-2001 | — | — | 91,303 | Yens | — | 12,593 | From 0.01% to 3.79% | From April 2007 to September 2013 | ||||||||||||||||||||||
| 1995-2001 | 63.480 | 97,210 | 125,060 | Yens | 16,250 | 17,133 | Floating | From July 2008 to December 2031 | ||||||||||||||||||||||
| 2002 | — | — | 140,595 | Yens | — | 19,000 | 0.20% | December 2006 | ||||||||||||||||||||||
| 2002 | 24.296 | 33,148 | 30,521 | Yens | 5,200 | 4,140 | Floating | From September 2015 to September 2032 | ||||||||||||||||||||||
| 2003 | 31.586 | 36,332 | 58,054 | Yens | 5,200 | 7,976 | Floating | From April 2013 to September 2033 | ||||||||||||||||||||||
| 2004 | — | 3,186 | 3,621 | Yens | — | 502 | Floating | July 2034 | ||||||||||||||||||||||
| 2005 | 4.860 | 5,100 | 5,768 | Yens | 800 | 800 | 0.01% | April 2008 | ||||||||||||||||||||||
| 2006 | 124.533 | 147,253 | — | Yens | 23,100 | — | Floating | From January to May 2008 | ||||||||||||||||||||||
| 2006 | 129.392 | 135,779 | — | Yens | 21,300 | — | From 0.64% to 2.15% | From November 2009 to August 2016 | ||||||||||||||||||||||
| 2007 | 547.158 | — | — | Yens | 90,290 | — | — | From 1.00% to 6.36% | From October 2008 to May 2013 | |||||||||||||||||||||
| Issued from 1995 to 2001 | — | — | 346,525 | U.S. Dollar | — | 408 | Floating | December 2007 | ||||||||||||||||||||||
| Issued from 1995 to 2001 | 16.006 | 69,053 | 34,260 | U.S. Dollar | 91 | 40 | 4.97% | March 2011 | ||||||||||||||||||||||
| 2002 | — | 11,372 | 12,372 | U.S. Dollar | 15 | 14 | Floating | May 2012 | ||||||||||||||||||||||
| 2002 | — | — | 20,927 | U.S. Dollar | — | 24 | From 0.00% to 2.00% | June 2007 | ||||||||||||||||||||||
| 2003 | 59.050 | 178,361 | 207,959 | U.S. Dollar | 235 | 244 | Floating | From March 2008 to November 2013 | ||||||||||||||||||||||
| 2003 | 20.671 | 62,256 | 223,091 | U.S. Dollar | 82 | 263 | From 2.57% to 5.34% | From June to September 2008 | ||||||||||||||||||||||
| 2004 | 73.012 | 705,499 | 2,442,807 | U.S. Dollar | 181 | 2,860 | Floating | From July 2008 to November 2014 | ||||||||||||||||||||||
| 2004 | — | 11,372 | 224,050 | U.S. Dollar | 15 | 263 | 3.250% | October 2007 | ||||||||||||||||||||||
| 2005 | 200.487 | 1,898,965 | 2,233,209 | U.S. Dollar | 2,505 | 2,601 | Floating | From January 2008 to June 2015 | ||||||||||||||||||||||
| 2005 | 50.204 | 122,063 | 666,627 | U.S. Dollar | 161 | 784 | From 4.16% to 4.96% | From April 2008 to February 2015 | ||||||||||||||||||||||
| 2006 | 795.217 | 2,610,002 | — | U.S. Dollar | 3,283 | — | Floating | From February 2008 to December 2016 | ||||||||||||||||||||||
| 2006 | — | 483,368 | — | U.S. Dollar | 638 | — | From 1.00 % to 5.5% | From February 2008 to August 2017 | ||||||||||||||||||||||
| 2007 | 7.697.258 | — | — | U.S. Dollar | — | — | Floating | From January 2008 to November 2017 | ||||||||||||||||||||||
| 2007 | 15.646 | — | — | U.S. Dollar | — | — | 4.96% | From August 2012 to August 2017 | ||||||||||||||||||||||
| 1993-2001 | 742.682 | 1,400,611 | 1,191,871 | Pounds Sterling | 169 | 862 | From 5.37% to 6.36% | From April 2008 to June 2038 | ||||||||||||||||||||||
| 1993-2001 | — | 19,360 | 61,970 | Pounds Sterling | 13 | 42 | Floating | From July 2007 to December 2007 | ||||||||||||||||||||||
| 2002 | 34.090 | 192,450 | 107,573 | Pounds Sterling | 300 | 74 | From 5.10% to 5.67% | June 2012 | ||||||||||||||||||||||
| 2002 | — | 40,119 | 48,417 | Pounds Sterling | 27 | 33 | Floating | From February 2007 to June 2007 | ||||||||||||||||||||||
| 2003 | — | — | 174,329 | Pounds Sterling | — | 119 | Floating | From July 2006 to December 2009 | ||||||||||||||||||||||
| 2003 | 100.768 | 134,981 | 1,122,027 | Pounds Sterling | 91 | 769 | From 5.72% to 6.36% | From May 2008 to December 2009 | ||||||||||||||||||||||
| 2004 | 84.942 | 541,626 | 563,679 | Pounds Sterling | 64 | 386 | From 5.65% to 6.36% | From July 2009 to November 2010 | ||||||||||||||||||||||
| 2004 | — | — | 240,749 | Pounds Sterling | — | 165 | Floating | From January 2006 to November 2010 | ||||||||||||||||||||||
| 2005 | — | 258,302 | 4,766,767 | Pounds Sterling | 173 | 3,267 | From 4.41% to 4.75% | From June 2007 to November 2007 | ||||||||||||||||||||||
| 2005 | 1.289.144 | 1,936,550 | 1,942,491 | Pounds Sterling | 700 | 1,331 | Floating | From September 2010 to November 2015 | ||||||||||||||||||||||
| 2006 | 861.064 | 4,986,821 | — | Pounds Sterling | 3,349 | — | From 0.10% to 5.53% | From February 2008 to April 2011 | ||||||||||||||||||||||
| 2006 | 1.456.919 | 1,620,897 | — | Pounds Sterling | 688 | — | Floating | From January 2008 to September 2011 | ||||||||||||||||||||||
| 2007 | 7.120.744 | — | — | Pounds Sterling | 5,222,013 | — | — | From 4.25% to 6.61% | From January 2008 to June 2010 | |||||||||||||||||||||
F-233
Table of Contents
| Euro thousand | Outstanding amount in million | Annual | ||||||||||||||||||||||||||||
| Issuer | 2007 | 2006 | 2005 | Currency | 2007 | 2006 | 2005 | Interest rate | Maturity Date | |||||||||||||||||||||
| 1996-2001 | 703.514 | 817,766 | 1,624,070 | Euro | — | — | — | From 0.81% to 9.88% | From February 2008 to November 2041 | |||||||||||||||||||||
| 1995-2001 | 457.956 | 499,622 | 1,203,053 | Euro | — | — | — | Floating | From February 2009 to March 2009 | |||||||||||||||||||||
| 2002 | 55.846 | 166,353 | 127,759 | Euro | — | — | — | Floating | June 2012 | |||||||||||||||||||||
| 2002 | — | 121,275 | 81,128 | Euro | — | — | — | From 0.01% to 6.52% | From March 2006 to September 2012 | |||||||||||||||||||||
| 2003 | 1.028.368 | 1,026,734 | 1,764,313 | Euro | — | — | — | Floating | From May 2008 to March 2013 | |||||||||||||||||||||
| 2003 | — | — | 96,198 | Euro | — | — | — | From 0.01% to 2.45% | From January 2006 to March 2013 | |||||||||||||||||||||
| 2004 | — | — | 29,944 | Euro | — | — | — | From 0.01% to 2.00% | From March 2005 to June 2007 | |||||||||||||||||||||
| 2004 | 1.001.332 | 1,012,805 | 1,836,746 | Euro | — | — | — | Floating | May 2009 | |||||||||||||||||||||
| 2005 | 2.009.875 | 2,049,248 | 2,102,464 | Euro | — | — | — | From 2.15% to 5.40% | From February 2012 to June 2015 | |||||||||||||||||||||
| 2005 | 11.575 | 320,117 | 328,598 | Euro | — | — | — | Floating | From April 2012 to June 2015 | |||||||||||||||||||||
| 2006 | 1.695.756 | 1,594,806 | — | Euro | — | — | — | From 3.74% to 3.89% | From February 2008 to April 2021 | |||||||||||||||||||||
| 2006 | 1.386.845 | 1,649,242 | — | Euro | — | — | — | Floating | From January 2008 to September 2014 | |||||||||||||||||||||
| 2007 | 23.631 | — | — | Euro | — | — | — | Floating | August 2010 | |||||||||||||||||||||
| 2007 | 2.072.013 | — | — | Euro | — | — | — | From 3.75% to 4.78% | From January 2008 to April 2016 | |||||||||||||||||||||
AN Structured Issues Limited | ||||||||||||||||||||||||||||||
| Issued 2002 | — | 10,000 | — | Euro | — | — | — | Floating | July 2007 | |||||||||||||||||||||
| Issued 2001-2004 | 9.111 | 12,744 | — | Yens | 1,500 | 2,000 | — | Floating | From July 2031 to July 2034 | |||||||||||||||||||||
Abbey National Funding plc | ||||||||||||||||||||||||||||||
| Issued 2002 | 1.663 | 1,816 | — | Pounds Sterling | 1 | 1 | — | 5.115% | August 2008 | |||||||||||||||||||||
ANDSH Limited | ||||||||||||||||||||||||||||||
| Issued 1989 | 2.014 | 2,414 | — | Pounds Sterling | 2 | 2 | — | Floating | December 2008 | |||||||||||||||||||||
Securitization Bonds | ||||||||||||||||||||||||||||||
F.T.H. UCI 10 | 131.636 | 168,099 | — | Euro | — | — | — | Floating | December 2014 | |||||||||||||||||||||
F.T.H. UCI 11 | 186.006 | 234,708 | — | Euro | — | — | — | 3.00% | February 2015 | |||||||||||||||||||||
F.T.H. UCI 12 | 229.549 | 292,890 | — | Euro | — | — | — | Floating | December 2017 | |||||||||||||||||||||
F.T.H. UCI 14 | 364.097 | 553,836 | — | Euro | — | — | — | 3.70% | March 2019 | |||||||||||||||||||||
F.T.H. UCI 15 | 494.740 | 584,494 | — | Euro | — | — | — | 3.68% | March 2020 | |||||||||||||||||||||
F.T.H. UCI 16 | 731.599 | 863,242 | — | Euro | — | — | — | 3.70% | June 2016 | |||||||||||||||||||||
F.T.H. UCI 17 | 269.730 | — | — | Euro | — | — | — | Floating | October 2019 | |||||||||||||||||||||
F.T.A. Santander Consumer Spain Auto 06 | 1.276.029 | 1,350,000 | — | Euro | — | — | — | Floating | October 2016 | |||||||||||||||||||||
Altair Finance p.l.c. | 13,124 | — | Euro | — | — | — | Floating | August 2014 | ||||||||||||||||||||||
Grupo Drive | ||||||||||||||||||||||||||||||
| 2005/2006 | 998.121 | 1,894,777 | — | U.S. Dollar | 3,000 | 2,495 | — | From 4.01% to 5.52% | From January 2012 to April 2014 | |||||||||||||||||||||
| 2007 | 1.328.185 | — | — | U.S. Dollar | 2,300 | — | — | From 5.00% to 5.59% | From August 2014 to October 2014 | |||||||||||||||||||||
Total Valuation Adjustments | 224.016 | 88,739 | 1,777,945 | |||||||||||||||||||||||||||
TOTAL | 200,905,082 | 168,661,356 | 123,566,864 | |||||||||||||||||||||||||||
F-234
Table of Contents
| Outstanding | ||||||||||||||||||||||
| Amount in | ||||||||||||||||||||||
| Euro thousand | Currency | |||||||||||||||||||||
| Issuer | 2007 | 2006 | 2005 | Currency | (Million) | Annual Interest Rate | Maturity Date | |||||||||||||||
Banco Santander, S.A.: | ||||||||||||||||||||||
| May 1991 | 288,440 | 298,890 | 298,890 | Euro | — | Floating (1) | May 2011 | |||||||||||||||
| April 1995 | — | — | — | Euro | — | Floating | April 2005 | |||||||||||||||
| June 1995 | 60,101 | 60,101 | 60,101 | Euro | — | 12.70% | December 2010 | |||||||||||||||
| December 1995 | 73,516 | 75,286 | 75,286 | Euro | — | 10.75% | December 2010 | |||||||||||||||
| March 1997 | 60,101 | 60,101 | 60,101 | Euro | — | 7.38% | December 2012 | |||||||||||||||
| June 1997 | 59,295 | 60,101 | 60,101 | Euro | — | 7.65% | December 2015 | |||||||||||||||
Santander Central Hispano Issuances, Ltd. : | ||||||||||||||||||||||
| April 1994 | 28,121 | 28,121 | 28,121 | Euro | — | Floating | April 2009 | |||||||||||||||
| June 1998 | 151,162 | 151,162 | 153,388 | Euro | — | 5.00% | June 2008 | |||||||||||||||
| July 1999 | 490,510 | 490,510 | 500,000 | Euro | — | 5.00% | July 2009 | |||||||||||||||
| March 2000 | 434,840 | 439,840 | 500,000 | Euro | — | 6.00% | July 2010 | |||||||||||||||
| March 2001 | 500,000 | 500,000 | 500,000 | Euro | — | Floating | March 2011 | |||||||||||||||
| March 2001 | 453,542 | 453,542 | 500,000 | Euro | — | 6.00% | March 2011 | |||||||||||||||
| September 2001 | From fixed to floating | |||||||||||||||||||||
| — | — | 500,000 | Euro | — | (3) & (25) | September 2011 | ||||||||||||||||
| April 2002 | — | 350,000 | 350,000 | Euro | — | Floating (33) | April 2012 | |||||||||||||||
| April 2002 | — | 643,750 | 650,000 | Euro | — | From fixed to floating (4) & (33) | April 2012 | |||||||||||||||
| April 1990 | — | — | — | U.S. Dollars | — | Floating (2) | Perpetual | |||||||||||||||
| July 1990 | — | — | — | U.S. Dollars | — | Floating (2) | Perpetual | |||||||||||||||
| October 1990 | — | — | — | U.S. Dollars | — | Floating (2) | Perpetual | |||||||||||||||
| April 1995 | — | — | — | U.S. Dollars | — | 7.088% | April 2005 | |||||||||||||||
| May 1995 | — | — | — | U.S. Dollars | — | 7.75% | May 2005 | |||||||||||||||
| June 1995 | — | — | — | U.S. Dollars | — | 7.50% | June 2005 | |||||||||||||||
| July 1995 | — | — | — | U.S. Dollars | — | 6.80% | July 2005 | |||||||||||||||
| August 1995 | — | — | — | U.S. Dollars | — | Floating | August 2005 | |||||||||||||||
| November 1995 | 135,860 | 151,860 | 169,535 | U.S. Dollars | 200 | 7.00% | November 2015 | |||||||||||||||
| February 1996 | — | — | 169,535 | U.S. Dollars | — | 6.50% | February 2006 | |||||||||||||||
| February 1996 | 203,791 | 227,790 | 254,302 | U.S. Dollars | 300 | 6.00% | February 2011 | |||||||||||||||
| April 1996 | — | — | 211,918 | U.S. Dollars | — | 7.00% | April 2006 | |||||||||||||||
| May 1996 | — | — | 169,535 | U.S. Dollars | — | 7,25% | May 2006 | |||||||||||||||
| July 1996 | — | — | 190,726 | U.S. Dollars | — | 7,70% | July 2006 | |||||||||||||||
| October 1996 | — | — | 127,151 | U.S. Dollars | — | Floating | October 2006 | |||||||||||||||
| February 1997 | — | 113,895 | 127,151 | U.S. Dollars | — | Floating | February 2007 | |||||||||||||||
| November 1999 | 424,564 | 474,563 | 529,796 | U.S. Dollars | 625 | 8.00% | March 2009 | |||||||||||||||
| September 2000 | 679,302 | 759,301 | 847,673 | U.S. Dollars | 1,000 | 7.00% | September 2010 | |||||||||||||||
| May 2002 | — | 37,965 | 42,384 | U.S. Dollars | — | Floating (34) | May 2012 | |||||||||||||||
| May 2002 | — | 37,965 | 42,384 | U.S. Dollars | — | Floating (34) | May 2012 | |||||||||||||||
| June 2000 | 70,883 | 74,250 | 76,421 | Singapore Dollars | 150 | 5.00% | June 2010 | |||||||||||||||
| November 2000 | 272,721 | 297,841 | 291,836 | Pounds Sterling | 200 | 6.00% | November 2010 | |||||||||||||||
Santander Consumer Bank Aktiengelsellschaft | ||||||||||||||||||||||
| Sundry issues | 54,577 | 78,875 | 86,989 | Euro | — | From 5.84% to 8.25% | From August 2006 to January 2016 | |||||||||||||||
Banco Santander Chile: (merged with Banco Santiago) | ||||||||||||||||||||||
| October 1996 | — | — | 51,706 | Chilean Pesos | — | Floating | October 2016 | |||||||||||||||
| January 1992 - October 1999 | 40,162 | 44,136 | 5,379 | Chilean Pesos | 30,908 | 7.63% - 7.75% | October 2016 | |||||||||||||||
| May 1996 | 23,520 | 25,248 | 31,073 | Chilean Pesos | 17,682 | 7.12% | December 2015 | |||||||||||||||
| September 1996 | 18,536 | 19,571 | 23,761 | Chilean Pesos | 13,706 | 6.88% | March 2016 | |||||||||||||||
| September 1996 | 23,358 | 24,556 | 29,466 | Chilean Pesos | 17,196 | 6.93% | March 2011 | |||||||||||||||
| August 2006 | 133,846 | 130,979 | — | Chilean Pesos | 91,726 | 4.40%-4.50% | September 2026 | |||||||||||||||
| November 1998 | — | — | — | U.S. Dollars | — | 6.50% | November 2005 | |||||||||||||||
| July 1997 | — | 59,255 | 66,353 | U.S. Dollars | — | 8.47% | July 2007 | |||||||||||||||
F-235
Table of Contents
| Outstanding | ||||||||||||||||||||||
| Amount in | ||||||||||||||||||||||
| Euro thousand | Currency | |||||||||||||||||||||
| Issuer | 2007 | 2006 | 2005 | Currency | (Million) | Annual Interest Rate | Maturity Date | |||||||||||||||
| January 2003 | 150,727 | 168,535 | 189,217 | U.S. Dollars | 222 | 8.64% | July 2012 | |||||||||||||||
| December 2004 | 203,721 | 227,790 | 255,076 | U.S. Dollars | 300 | 5.67% | December 2014 | |||||||||||||||
| November 2007 | 53,802 | — | — | Chilean Pesos | 2,000 | 4.40% | November 2032 | |||||||||||||||
| December 2007 | 19,669 | — | — | Chilean Pesos | 2,000 | 4.40% | December 2032 | |||||||||||||||
Totta-Credito Especializado, IFIC, S.A. (formerly McLeasing Sdad. Loc.Fin): | ||||||||||||||||||||||
| June 1997 | — | 4,988 | 4,988 | Euro | — | Floating | June 2007 | |||||||||||||||
Banco Santander Banespa, S.A.: | ||||||||||||||||||||||
| September 2005 | 341,114 | 380,184 | 419,603 | U.S. Dollars | 500 | 9.00% | Perpetual | |||||||||||||||
| 2006 | 1,077,092 | 994,560 | — | Brazilian Real | 2,797 | Floating | From July 2016 to September 2016 | |||||||||||||||
Banco Santander Totta, S.A.: | ||||||||||||||||||||||
| February 2001 | — | — | 19,924 | Euro | — | Floating (31) | Perpetual | |||||||||||||||
| May 1995 | — | — | — | Euro | — | Floating | May 2005 | |||||||||||||||
| July 1996 | — | — | 74,820 | Euro | — | Floating | July 2006 | |||||||||||||||
| September 1987 | — | — | — | Euro | — | Floating (5) | September 2007 | |||||||||||||||
| April 2001 | — | — | 16,337 | Euro | — | 5.00% (26) | April 2009 | |||||||||||||||
| December 2000 | — | — | 13,868 | Euro | — | Floating (31) | Perpetual | |||||||||||||||
| November 1997 | 27,353 | 27,764 | 28,881 | Euro | — | Floating | Perpetual | |||||||||||||||
| December 1997 | 8,886 | 9,497 | 13,321 | Euro | — | Floating | Perpetual | |||||||||||||||
| December 1998 | — | — | — | Euro | — | Floating (6) | December 2008 | |||||||||||||||
| December 1999 | — | — | — | Euro | — | Floating (7) | November 2009 | |||||||||||||||
| February 2001 | — | — | 9,961 | Euro | — | Floating | Perpetual | |||||||||||||||
| April 2001 | — | — | 19,402 | Euro | — | 5.00% (26) | April 2009 | |||||||||||||||
| May 2001 | — | 9,466 | 9,484 | Euro | — | Floating | May 2007 | |||||||||||||||
| December 2002 | 15,050 | 15,050 | 15,025 | Euro | — | Floating | December 2008 | |||||||||||||||
| December 2005 | 300,000 | 300,000 | 300,000 | Euro | — | 5.20% | December 2015 | |||||||||||||||
Banesto Group: | ||||||||||||||||||||||
| October 1990 | — | — | — | U.S. Dollars | — | Floating (8) | Perpetual | |||||||||||||||
| March 1997 | — | 113,895 | 127,151 | U.S. Dollars | — | 7.50% | March 2007 | |||||||||||||||
| September 2003 | 500,000 | 500,000 | 500,000 | Euro | — | Floating | September 2013 | |||||||||||||||
| March 2004 | 500,000 | 500,000 | 500,000 | Euro | — | From fixed to floating (9) | March 2016 | |||||||||||||||
Santander Central Hispano Financial Services, Ltd.: | ||||||||||||||||||||||
| February 1990 | — | — | — | U.S. Dollars | — | Floating (10) | Perpetual | |||||||||||||||
| June 2001 | 272,721 | 297,841 | 291,836 | Pounds Sterling | 200 | From fixed to floating (11) | Perpetual | |||||||||||||||
Santander Issuances, S.A. | ||||||||||||||||||||||
| September 2004 | 500,000 | 500,000 | 500,000 | Euro | — | From fixed to floating (12) | September 2019 | |||||||||||||||
| September 2004 | 500,000 | 500,000 | 500,000 | Euro | — | Floating (13) | September 2014 | |||||||||||||||
| March 2006 - July 2006 | 1,550,000 | 1,550,000 | — | Euro | — | Floating | March 2016 - July 2017 | |||||||||||||||
| May 2006 | 500,000 | 500,000 | — | Euro | — | 4.25% (27) | May 2018 | |||||||||||||||
| May 2006 | 272,721 | 297,841 | — | Pounds Sterling | 200 | 5.38% (28) | May 2016 | |||||||||||||||
| July 2006 | 409,082 | 446,761 | — | Pounds Sterling | 300 | 5.38% (29) | July 2017 | |||||||||||||||
| June 2006 | 543,442 | 607,441 | — | U.S. Dollars | 800 | 5.80% - 5..90% | June 2016 | |||||||||||||||
| June 2006 | 339,651 | 379,651 | — | U.S. Dollars | 500 | Floating | June 2016 | |||||||||||||||
| January 2007 | 409,082 | — | — | Pounds Sterling | 300 | Floating | January 2018 | |||||||||||||||
| February 2007 | 200,000 | — | — | Euro | — | Floating | February 2019 | |||||||||||||||
| March 2007 | 235,000 | — | — | Euro | — | Floating | February 2019 | |||||||||||||||
| March 2007 | 1,500,000 | — | — | Euro | — | Floating | February 2017 | |||||||||||||||
| May 2007 | 650,000 | — | — | Euro | — | Floating | From February 2019 to May 2019 | |||||||||||||||
| July 2007 | 139,000 | — | — | Euro | — | Floating | July 2022 | |||||||||||||||
| July 2007 | 102,000 | — | — | Euro | — | Floating | July 2028 | |||||||||||||||
| October 2007 | 1,489,708 | — | — | Euro | — | Floating | October 2017 | |||||||||||||||
| October 2007 | 1,090,884 | — | — | Pounds Sterling | 800 | Floating | October 2017 | |||||||||||||||
| October 2007 | 290,967 | — | — | New Mexican Pesos | 4,677 | Floating | October 2017 | |||||||||||||||
F-236
Table of Contents
| Outstanding | ||||||||||||||||||||||
| Amount in | ||||||||||||||||||||||
| Euro thousand | Currency | |||||||||||||||||||||
| Issuer | 2007 | 2006 | 2005 | Currency | (Million) | Annual Interest Rate | Maturity Date | |||||||||||||||
Banco Santander, S.A., Institución de Banca Múltiple, Grupo Financiero Santander | ||||||||||||||||||||||
| November 2004 | 25,443 | 28,777 | 21,199 | U.S. Dollars | 150 | Floating (15) | From January 2014 to November 2018 | |||||||||||||||
| February 2005 | 25,399 | 28,659 | 42,068 | U.S. Dollars | 150 | Floating | March 2015 | |||||||||||||||
Santander Perpetual, S.A. Unipersonal | ||||||||||||||||||||||
| December 2004 | 750,000 | 750,000 | 750,000 | Euro | — | From fixed to floating (14) | Perpetual | |||||||||||||||
| October 2007 | 1,018,953 | — | — | U.S. Dollars | 1,500 | 6.67% | Perpetual | |||||||||||||||
Abbey Group | ||||||||||||||||||||||
| December 1991 | 202,308 | 223,380 | 218,882 | Pounds Sterling | 150 | 11.50% | April 2017 | |||||||||||||||
| June 1992 | — | — | 145,921 | Pounds Sterling | — | 10.75% | December 2006 | |||||||||||||||
| February 1993 | 204,541 | 223,380 | 218,882 | Pounds Sterling | 150 | 10.13% | April 2023 | |||||||||||||||
| October 1999 | 204,541 | 223,380 | 218,882 | Pounds Sterling | 150 | 6.50% | October 2030 | |||||||||||||||
| September 2000 | 443,172 | 483,991 | 474,245 | Pounds Sterling | 325 | 7.50% | Perpetual | |||||||||||||||
| September 2000 | 579,532 | 632,911 | 620,166 | Pounds Sterling | 425 | 7.50% | Perpetual | |||||||||||||||
| September 2000 | 238,631 | 260,611 | 255,363 | Pounds Sterling | 175 | 7.38% | Perpetual | |||||||||||||||
| September 2000 | 374,991 | 409,531 | 401,284 | Pounds Sterling | 275 | 7.13% | Perpetual | |||||||||||||||
| October 1995 | 272,721 | 297,841 | 291,843 | Pounds Sterling | 200 | 10.06% | Perpetual | |||||||||||||||
| April 2005 | 272,721 | 297,841 | 291,843 | Pounds Sterling | 200 | From fixed to floating (22) | April 2015 | |||||||||||||||
| July 2001 (20) | — | — | 291,843 | Pounds Sterling | — | 7.25% | Perpetual | |||||||||||||||
| May 1997 (20) | — | — | 182,397 | Pounds Sterling | — | 8.75% | Perpetual | |||||||||||||||
| September 1994 | 91,122 | 95,584 | 108,142 | Yens | 15,000 | 5.56% | Perpetual | |||||||||||||||
| February 1995 | 30,374 | 31,861 | 36,047 | Yens | 5,000 | 5.50% | Perpetual | |||||||||||||||
| December 1996 | 30,374 | 31,861 | 36,047 | Yens | 5,000 | From fixed to floating (17) | Perpetual | |||||||||||||||
| October 1995 | — | — | — | U.S. Dollars | — | 6.69% | October 2005 | |||||||||||||||
| October 1996 | — | — | 423,882 | U.S. Dollars | — | 7.35% (30) | Perpetual | |||||||||||||||
| June 1998 | 340,128 | 379,651 | 423,882 | U.S. Dollars | 500 | 6.70% | Perpetual | |||||||||||||||
| October 1999 | 680,255 | 759,301 | 847,765 | U.S. Dollars | 1,000 | 7.95% | October 2029 | |||||||||||||||
| August 2001 | — | — | 339,106 | U.S. Dollars | — | 7.25% (30) | Perpetual | |||||||||||||||
| May 2002 | — | 37,965 | 42,388 | U.S. Dollars | — | Floating (34) | May 2012 | |||||||||||||||
| May 2002 | — | 37,965 | 42,388 | U.S. Dollars | — | Floating (34) | May 2012 | |||||||||||||||
| April 2005 | 458,501 | 500,000 | 501,014 | Euro | — | Floating (21) | April 2015 | |||||||||||||||
| December 1998 | 511,973 | 511,292 | 512,328 | Euro | — | 5.00% | January 2009 | |||||||||||||||
| February 1999 | 500,666 | 500,000 | 501,014 | Euro | — | 4.63% | February 2011 | |||||||||||||||
| April 1999 (18) | — | — | — | Euro | — | 5.75% | Perpetual | |||||||||||||||
| June 2002 | — | 500,000 | 501,014 | Euro | — | Floating (35) | June 2012 | |||||||||||||||
| September 2000 | 400,533 | 400,000 | 400,811 | Euro | — | From fixed to floating (19) | Perpetual | |||||||||||||||
Santander Consumer Finance, S.A. | ||||||||||||||||||||||
| September 2006 | 499,540 | 499,540 | — | Euro | — | Floating | September 2016 | |||||||||||||||
Santander Factoring y Confirming, S.A., E.F.C. | ||||||||||||||||||||||
| June 1999 - December 2005 | 50,040 | 50,040 | — | Euro | — | Floating (32) | From June 2011 to December 2015 | |||||||||||||||
Santander BanCorp | ||||||||||||||||||||||
| October 2004 - October 2005 | 84,913 | 94,913 | — | U.S. Dollars | 254 | From 5.00% to 6.00% | June 2032 | |||||||||||||||
BS Venezuela | ||||||||||||||||||||||
| January 2007 | 15,963 | — | — | Bolivar | 700 | Floating | February 2008 | |||||||||||||||
Total Valuation adjustments | 1,229,042 | 795,258 | 1,260,086 | |||||||||||||||||||
Subtotal subordinated debt | 28,408,797 | 23,586,251 | 21,990,688 | |||||||||||||||||||
F-237
Table of Contents
| Outstanding | ||||||||||||||||||||||
| Amount in | ||||||||||||||||||||||
| Euro thousand | Currency | |||||||||||||||||||||
| Issuer | 2007 | 2006 | 2005 | Currency | (Million) | Annual Interest Rate | Maturity Date | |||||||||||||||
PREFERRED SECURITIES | ||||||||||||||||||||||
Banesto Group | ||||||||||||||||||||||
| Banesto Preferentes S,A, December 2003 | 131,144 | 131,144 | 131,144 | Euro | — | Floating | Perpetual | |||||||||||||||
| Banesto S,A, November 2004 | 200,000 | 200,000 | 200,000 | Euro | — | 5.50% | Perpetual | |||||||||||||||
| Banesto S,A, October 2004 | 125,000 | 125,000 | 125,000 | Euro | — | From fixed to floating (23) | Perpetual | |||||||||||||||
Santander Finance Capital, S.A. | ||||||||||||||||||||||
| October 2003 | 450,000 | 450,000 | 450,000 | Euro | — | Floating | Perpetual | |||||||||||||||
| February 2004 | 400,000 | 400,000 | 400,000 | Euro | — | Floating | Perpetual | |||||||||||||||
| July 2004 | 750,000 | 750,000 | 750,000 | Euro | — | Floating | Perpetual | |||||||||||||||
| September 2004 | 680,000 | 680,000 | 680,000 | Euro | — | Floating | Perpetual | |||||||||||||||
| April 2005 | 1,000,000 | 1,000,000 | 952,744 | Euro | — | From fixed to floating (24) | Perpetual | |||||||||||||||
Santander Finance Preferred, S.A. Unipersonal | ||||||||||||||||||||||
| March 2004 | 129,067 | 144,267 | 161,058 | U.S. Dollars | — | 6.40% | Perpetual | |||||||||||||||
| November 2006 | 339,651 | 379,651 | — | U.S. Dollars | 500 | 6.80% | Perpetual | |||||||||||||||
| September 2004 | 300,000 | 300,000 | 300,000 | Euro | — | Floating | Perpetual | |||||||||||||||
| October 2004 | 200,000 | 200,000 | 200,000 | Euro | — | 5.70% | Perpetual | |||||||||||||||
| January 2007 | 407,581 | — | — | U.S. Dollars | 600 | 6.70% | Perpetual | |||||||||||||||
| March 2007 | 237,756 | — | — | U.S. Dollars | 350 | 5.60% | Perpetual | |||||||||||||||
| July 2007 | 340,901 | — | — | Pounds Sterling | 250 | 7.00% | Perpetual | |||||||||||||||
Abbey Group | ||||||||||||||||||||||
| February 2000 | 679,302 | 759,302 | 847,673 | U.S. Dollars | 1,000 | 9.00% | Perpetual | |||||||||||||||
| August 2002 | — | 379,651 | 423,837 | U.S. Dollars | 500 | 7.38% (36) | Perpetual | |||||||||||||||
| February 2001 | 409,082 | 446,760 | 437,764 | Pounds Sterling | 300 | 7.04% | Perpetual | |||||||||||||||
| August 2002 | 238,631 | 260,038 | 255,363 | Pounds Sterling | 175 | 6.98% | Perpetual | |||||||||||||||
Santander PR Capital Trust I | ||||||||||||||||||||||
| February 2006 | 84,913 | 94,913 | — | Euro | — | 6.75% | July 2036 | |||||||||||||||
Total valuation adjustments | 158,354 | 135,844 | 458,185 | — | — | — | — | |||||||||||||||
Subtotal preferred securities | 7,261,382 | 6,836,570 | 6,772,768 | |||||||||||||||||||
TOTAL SUBORDINATED DEBT | 35,670,179 | 30,422,821 | 28,763,456 | |||||||||||||||||||
| (1) | Interest on the May 1991 issue of the Bank is revised annually, being tied to MIBOR less two percentage points, with a maximum of 14% per annum and a minimum of 10%. These securities are redeemable at par in 2011, but the holders can redeem them early at 6, 12 and 18 years from the issue date. | |
| (2) | The 1990 issues of SCH Issuances, Ltd, have been redeemed during March and April 2005 at the Bank’s option, after obtaining authorization from the Bank of Spain. | |
| (3) | This issuance has a fixed interest rate for the first 5 years of 5.250% and from September 2006 it is Euribor 3M plus 1.22%. | |
| (4) | This issuance has a fixed interest rate for the first 5 years of 5.750% and from April 2007 it is Euribor 3M plus 1.24%. | |
| (5) | This issuance has been cancelled in June 2005. | |
| (6) | This issuance has been cancelled in October 2005. | |
| (7) | This issuance has been cancelled in June 2005. | |
| (8) | The perpetual issuance of Banesto Group has been redeemed in February 2005. |
F-238
Table of Contents
| (9) | This issue has a fixed interest rate of 4% for the first seven years, and from March 2011, the interest rate is Euribor 3M plus 0.95%. | |
| (10) | The February 1990 issue of SCH Financial Services, Ltd, has been redeemed in February 2005 at the Bank’s option, after obtaining authorization from the Bank of Spain. | |
| (11) | This issuance has a fixed interest rate of 7.25% until December 2011, and from this date the interest is Libor 3M plus 285 b.p. | |
| (12) | This issue has a fixed rate of 4.5% until September 2014, and from this date, the interest is Euribor 3M plus 0.86%. | |
| (13) | This issue has a floating rate of Euribor 3M plus 0.25% for the first five years, and from this date, the interest is Euribor 3M plus 0.75%. | |
| (14) | This issue has a fixed rate of 4.375% for the first ten years, and from December 2014, the interest is Euribor 3M plus 1.6%. | |
| (15) | This issue has a floating rate of Libor 6M plus 1.1% for the first five years, and from this date, the interest is Libor 6M plus 2.2%. | |
| (16) | This issue can be exchangeable, at the option of Abbey, for fully paid 103/4 per cent non-cumulative sterling preference shares of 1 sterling pound nominal value each of Abbey National, at the rate of one new sterling preference share for every 1 sterling pound principal amount of the issue. | |
| (17) | This issue has a fixed rate of 4% until December 2016, and from this date, it is Libor 3M plus 1.5%. | |
| (18) | This issuance has been cancelled in April 2005. | |
| (19) | This issue has a fixed rate of 7.125% until September 2010, and from this date, the interest is Euribor 3M plus 2.3%. | |
| (20) | These issuances have been included as a consequence of the application of the EU-IFRS required to be applied under Bank of Spain’s Circular 4/2004, since they have been issued by Abbey’s Group insurance companies. | |
| (21) | The rate of this issue is Libor 3M plus 0.25% until April 2010 (call date). From that date, it is Libor 3M plus 0.75%. | |
| (22) | This issue has a fixed rate of 5.25% until the call date (April 2010). Then it is Euribor 3M plus 0.75%. | |
| (23) | This issuance had a fixed rate of 6% until October 2005. Now it is Euribor CMS 10 plus 0.125%. | |
| (24) | This issue has a fixed rate of 3% until April 2006. From this date, the rate is Euribor 3M plus 0.10%. | |
| (25) | This issuance has been cancelled in September 2006. | |
| (26) | This issuance has been cancelled in April 2006. | |
| (27) | This issue has a fixed rate of 4.25% until May 2013. From this date, the rate is Euribor 3M plus 0,82%. | |
| (28) | This issue has a fixed rate of 5.375% until May 2011. From this date, the rate is Euribor 3M plus 0,69%. | |
| (29) | This issue has a fixed rate of 5.375% for the first five years, and from June 2011, the interest rate is Libor 3M Euribor 3M plus 0,86%. | |
| (30) | This issuance has been cancelled in October 2006. | |
| (31) | These issuances have been purchased by Santander’s Group. | |
| (32) | In previous years, issuances between Santander Factoring & Confirming and Santander’s Group were net, so the result of them was zero. | |
| (33) | These issuances have been cancelled in April 2007. | |
| (34) | These issuances have been cancelled in May 2007. | |
| (35) | This issuance has been cancelled in June 2007. | |
| (36) | This issuance has been cancelled in September 2007. |
F-239
Table of Contents
| Year end December 31, | ||||||||||||||||||||||||
| 2007 | 2006 | 2005 | ||||||||||||||||||||||
| Including | Excluding | Including | Excluding | Including | Excluding | |||||||||||||||||||
| interest on | interest on | interest on | interest on | interest on | interest on | |||||||||||||||||||
| deposits | deposits | deposits | deposits | deposits | deposits | |||||||||||||||||||
FIXED CHARGES: | ||||||||||||||||||||||||
| Fixed charges | 30,421,947 | 15,832,380 | 24,021,396 | 10,910,808 | 22,111,675 | 8,463,023 | ||||||||||||||||||
EARNINGS: | ||||||||||||||||||||||||
| Income from continuing operations before taxes, minority interest and extraordinary items | 10,687,627 | 10,687,627 | 8,582,241 | 8,582,241 | 7,232,234 | 7,232,234 | ||||||||||||||||||
| Distributed earnings from associated companies | (294,809 | ) | (294,809 | ) | (262,315 | ) | (262,315 | ) | (437,978 | ) | (437,978 | ) | ||||||||||||
| Fixed charges | 30,421,947 | 15,832,380 | 24,021,396 | 10,910,808 | 22,111,675 | 8,463,023 | ||||||||||||||||||
| Total earnings for ratio calculation | 40,814,765 | 26,225,198 | 32,341,322 | 19,230,734 | 28,905,931 | 15,257,279 | ||||||||||||||||||
| Ratio of earnings to fixed charges | 1.34 | 1.66 | 1.35 | 1.76 | 1.31 | 1.80 | ||||||||||||||||||
| Year end December 31, | ||||||||||||||||||||||||||||||||||||||||
| 2007 | 2006 | 2005 | 2004 | 2003 | ||||||||||||||||||||||||||||||||||||
| Including | Excluding | Including | Excluding | Including | Excluding | Including | Excluding | Including | Excluding | |||||||||||||||||||||||||||||||
| interest on | interest on | interest on | interest on | interest on | interest on | interest on | interest on | interest on | interest on | |||||||||||||||||||||||||||||||
| deposits | deposits | deposits | deposits | deposits | deposits | deposits | deposits | deposits | deposits | |||||||||||||||||||||||||||||||
FIXED CHARGES: | ||||||||||||||||||||||||||||||||||||||||
| Fixed charges | 30,362,088 | 15,772,521 | 23,931,889 | 10,821,301 | 22,037,564 | 8,388,912 | 9,472,947 | 3,920,904 | 9,136,028 | 3,505,885 | ||||||||||||||||||||||||||||||
| Preferred dividends | 59,859 | 59,859 | 89,507 | 89,507 | 74,111 | 74,111 | 151,952 | 151,952 | 311,317 | 311,317 | ||||||||||||||||||||||||||||||
| Total fixed charges + preferred dividends | 30,421,947 | 15,832,380 | 24,021,396 | 10,910,808 | 22,111,675 | 8,463,023 | 9,624,899 | 4,072,856 | 9,447,345 | 3,817,202 | ||||||||||||||||||||||||||||||
EARNINGS: | ||||||||||||||||||||||||||||||||||||||||
| Income from continuing operations before taxes, minority interest and extraordinary items | 7,681,764 | 7,681,764 | 7,442,474 | 7,442,474 | 7,224,611 | 7,224,611 | 3,944,897 | 3,944,897 | 3,140,200 | 3,140,200 | ||||||||||||||||||||||||||||||
| Distributed earnings from associated companies | (294,809 | ) | (294,809 | ) | (262,315 | ) | (262,315 | ) | (437,978 | ) | (437,978 | ) | (271,816 | ) | (271,816 | ) | (380,922 | ) | (380,922 | ) | ||||||||||||||||||||
| Fixed charges | 30,362,088 | 15,772,521 | 23,931,889 | 10,821,301 | 22,037,564 | 8,388,912 | 9,472,947 | 3,920,904 | 9,136,028 | 3,505,885 | ||||||||||||||||||||||||||||||
| Total earnings for ratio calculation | 37,749,043 | 23,159,476 | 31,112,048 | 18,001,460 | 28,824,197 | 15,175,545 | 13,146,028 | 7,593,985 | 11,895,306 | 6,265,163 | ||||||||||||||||||||||||||||||
| Ratio of earnings to fixed charges | 1.24 | 1.47 | 1.30 | 1.66 | 1.31 | 1.81 | 1.39 | 1.94 | 1.30 | 1.79 | ||||||||||||||||||||||||||||||
| Ratio of earnings to combined fixed charges and preferred stock dividends | 1.24 | 1.46 | 1.30 | 1.65 | 1.30 | 1.79 | 1.37 | 1.86 | 1.26 | 1.64 | ||||||||||||||||||||||||||||||
| (*) | The EU-IFRS required to be applied under Bank of Spain’s Circular 4/2004 |
F-240
Table of Contents
Table of Contents
| Exhibit | ||
| Number | Description | |
| 1.1 | By-laws (Estatutos) of Banco Santander, S.A., as amended. | |
| 1.2 * | By-laws (Estatutos) of Banco Santander, S.A., as amended. | |
| 1.3 | By-laws (Estatutos) of Banco Santander, S.A., as amended (English translation of By-laws set forth in Exhibit 1.1 hereto). | |
| 1.4 | By-laws (Estatutos) of Banco Santander, S.A., as amended (English translation of the By-laws set forth in Exhibit 1.2 hereto). | |
| 4.1 ** | Consortium and Shareholders’ Agreement dated May 28, 2007, among the Royal Bank of Scotland Group plc, Banco Santander Central Hispano, S.A., Fortis SA/N.V. and RFS Holdings B.V. (incorporated by reference to Exhibit 4.1 to our Annual Report on Form 20-F for the year ended December 31, 2006, filed with the Securities and Exchange Commission on July 2, 2007). | |
| 8.1 | List of Subsidiaries (incorporated by reference as Exhibits I, II and III of our Financial Statements filed with this Form 20-F). | |
| 12.1 | Section 302 Certification by the Chief Executive Officer | |
| 12.2 | Section 302 Certification by the Chief Financial Officer | |
| 12.3 | Section 302 Certification by the Chief Accounting Officer | |
| 13.1 | Section 906 Certification by the Chief Executive Officer, the Chief Financial Officer and the Chief Acounting Officer | |
| 15.1 | Consent of Deloitte, S.L. | |
| 15.2 | Report submitted by the Board of Directors to the General Shareholders’ Meeting describing the By-laws amendments |
| * | These By-laws will go into effect (and replace the By-laws set forth in Exhibit 1.1) upon the granting of the necessary authorization by the Spanish Minister of Economy and Finance and their subsequent filing with the office of the Mercantile Registry in Santander. | |
| ** | Pursuant to a request for confidential treatment filed with the Securities and Exchange Commission, the confidential portions of this exhibit have been omitted and filed separately with the Securities and Exchange Commission. |