As filed with the Securities and Exchange Commission on January 9, 2019
UNITED STATES
SECURITIES AND EXCHANGE COMMISSION
Washington, D.C. 20549
FORM N-CSR
CERTIFIED SHAREHOLDER REPORT OF REGISTERED
MANAGEMENT INVESTMENT COMPANIES
Investment Company Act file number (811-07168)
Hennessy Funds Trust
(Exact name of registrant as specified in charter)
7250 Redwood Blvd., Suite 200
Novato, CA 94945
(Address of principal executive offices) (Zip code)
Neil J. Hennessy
7250 Redwood Blvd., Suite 200
Novato, CA 94945
(Name and address of agent for service)
800-966-4354
Registrant’s telephone number, including area code
Date of fiscal year end: October 31, 2018
Date of reporting period: October 31, 2018
Item 1. Reports to Stockholders.
ANNUAL REPORT
OCTOBER 31, 2018
HENNESSY CORNERSTONE
GROWTH FUND
Investor Class HFCGX
Institutional Class HICGX
hennessyfunds.com | 1-800-966-4354
(This Page Intentionally Left Blank.)
Contents
| Letter to Shareholders | 2 |
| Performance Overview | 4 |
| Financial Statements | |
| Schedule of Investments | 7 |
| Statement of Assets and Liabilities | 12 |
| Statement of Operations | 13 |
| Statements of Changes in Net Assets | 15 |
| Financial Highlights | 16 |
| Notes to the Financial Statements | 20 |
| Report of Independent Registered Public Accounting Firm | 28 |
| Trustees and Officers of the Fund | 29 |
| Expense Example | 32 |
| Proxy Voting Policy and Proxy Voting Records | 34 |
| Quarterly Schedule of Investments | 34 |
| Important Notice Regarding Delivery of Shareholder Documents | 34 |
| Privacy Policy | 35 |
| HENNESSY FUNDS | 1-800-966-4354 | |
December 2018
Dear Hennessy Funds Shareholder:
Over the past year, we have witnessed the return of market volatility. U.S. stocks still registered healthy gains, bolstered by the impact on corporate profits of the successful passage of the tax reform bill in December 2017. However, concerns over potential trade disruptions, especially between the U.S. and China, and worries over higher short-term interest rates, which many believe could possibly trigger a recession down the road, put downward pressure on equity valuations.
The U.S. economy performed well over the period, and actually achieved an acceleration in GDP growth to over 3% on an annualized basis in the second and third quarters of calendar year 2018. During the past year, companies continued to hire workers, adding over 200,000 jobs per month on average, sending the unemployment rate down to 3.7% in October, which is the lowest it has been since 1969. Consumer confidence is high and still rising, and corporate profits reached record levels in the third quarter of calendar year 2018, posting a year-over-year increase of 26% for the companies in the S&P 500 Index.
The Federal Reserve, confident about the strength of the economy and mindful of a tight labor market, raised short-term interest rates four times over the last year, by a quarter point each time. Long-term bond yields also rose, driven higher primarily by evidence of faster wage growth, pushing the U.S. 10-year Treasury bond over 3% for the first time since 2013.
As I write this, we are experiencing the market’s 20th downturn since 2010. I have been saying that every bull market experiences volatility and pullbacks. Many financial commentators think this bull market is “long in the tooth.” I do not agree with them. I believe stock valuations are still very reasonable. The prospective price to earnings multiple for the Dow Jones Industrial Average has come down from almost 20x at the end of 2017 to 16x, just above its 10-year average of 15x. The prospective PE multiple for the S&P 500 Index has also come down, from 20x to 17x, and compares favorably to its 10-year average of 16x.
Cash, meanwhile, continues to build up on corporate balance sheets. The companies in the S&P 500 Index reported a total of over $5.4 trillion in cash and marketable securities in their latest filings. Companies have been spending some of their cash, increasing their investment spending and laying the groundwork for future earnings growth. However, they have also been returning capital to shareholders. S&P 500 Index companies announced $433.6 billion in share repurchases during the second quarter of calendar year 2018, nearly doubling the previous record of $242.1 billion set in the first quarter. Companies are also raising their dividends.
In addition, I believe the Federal Reserve will take care not to raise interest rates too high or too fast and endanger the economic expansion. While wage growth has risen to over 3% in October, other measures of inflationary pressure, such as the Consumer Price Index and the Producer Price Index, still show prices increasing at a more moderate pace, closer to 2%. Given continued evidence of modest rates of inflation, I believe the Fed will be able to maintain its gradual pace of interest rate hikes.
Finally and importantly, I still see no signs of euphoria in this market. In my opinion, the enthusiasm present earlier in the year, which followed the significant reduction in corporate income tax rates, has largely evaporated, and it has been replaced with anxiety
over higher interest rates and their potential impact on growth. In the past, I have likened the current bull market to that of 1982-2000, and I still believe this comparison holds true. I am confident in the strength of the market today and believe the economy will continue to grow in the coming year, albeit at a more moderate pace.
Thank you for your continued confidence and investment in the Hennessy Funds. If you have any questions or would like to speak with us directly, please don’t hesitate to call us at (800) 966-4354.
Best regards,
Neil J. Hennessy
President and Chief Investment Officer
Past performance does not guarantee future results.
Mutual fund investing involves risk. Principal loss is possible.
Opinions expressed are those of Neil Hennessy and are subject to change, are not guaranteed, and should not be considered investment advice.
The Dow Jones Industrial Average and S&P 500 Index are commonly used to measure the performance of U.S. stocks. One cannot invest directly in an index.
PE, or price to earnings, is a valuation measure and is calculated by dividing a company’s market price per share by its earnings per share. Earnings growth is not a measure of a fund’s future performance.
| HENNESSY FUNDS | 1-800-966-4354 | |
Performance Overview (Unaudited)
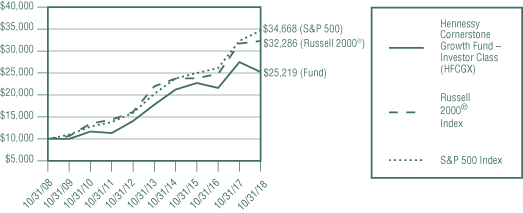
CHANGE IN VALUE OF $10,000 INVESTMENT
This graph illustrates the performance of an initial investment of $10,000 made in the Fund ten years ago and assumes the reinvestment of dividends.
AVERAGE ANNUAL TOTAL RETURN FOR PERIODS ENDED OCTOBER 31, 2018
| | One | Five | Ten |
| | Year | Years | Years |
| Hennessy Cornerstone Growth Fund – | | | |
| Investor Class (HFCGX) | -8.24% | 7.24% | 9.69% |
| Hennessy Cornerstone Growth Fund – | | | |
| Institutional Class (HICGX) | -7.93% | 7.55% | 10.03% |
| Russell 2000® Index | 1.85% | 8.01% | 12.44% |
| S&P 500 Index | 7.35% | 11.34% | 13.24% |
Expense ratios: 1.30% (Investor Class); 0.97% (Institutional Class)
Performance data quoted represents past performance; past performance does not guarantee future results. The investment return and principal value of an investment will fluctuate so that an investor’s shares, when redeemed, may be worth more or less than their original cost. The performance table does not reflect the deduction of taxes that a shareholder would pay on Fund distributions or the redemption of Fund shares. Current performance of the Fund may be lower or higher than the performance quoted. Performance data current to the most recent month end may be obtained by visiting www.hennessyfunds.com.
The Russell 2000® Index is commonly used to measure the performance of U.S. small-capitalization stocks. The S&P 500 Index is commonly used to measure the performance of U.S. stocks. One cannot invest directly in an index.
Frank Russell Company (“Russell”) is the source and owner of the trademarks, service marks, and copyrights related to the Russell Indexes. Russell® is a trademark of Frank Russell Company. Neither Russell nor its licensors accept any liability for any errors or omissions in the Russell Indexes or Russell ratings or underlying data and no party may rely on any Russell Indexes or Russell ratings or underlying data contained in this communication. No further distribution of Russell data is permitted without Russell’s express written consent. Russell does not promote, sponsor, or endorse the content of this communication.
The expense ratios presented are from the most recent prospectus. The expense ratios for the current reporting period are available in the Financial Highlights section of this report.
PERFORMANCE NARRATIVE
Portfolio Managers Neil J. Hennessy and Ryan C. Kelley
Performance:
For the 12-month period ended October 31, 2018, the Investor Class of the Hennessy Cornerstone Growth Fund returned -8.24%, underperforming the Russell 2000® Index (the Fund’s primary benchmark) and the S&P 500 Index, which returned 1.85% and 7.35%, respectively, for the same period.
The Fund’s underperformance relative to its primary benchmark can be attributed predominantly to stock selection, particularly in the Consumer Discretionary and Information Technology sectors. Scientific Games Corp., Vipshop Holdings, Ltd., and Tailored Brands, Inc. were among the holdings that detracted most from relative performance in the Consumer Discretionary sector. In the Information Technology sector, two electronic component manufacturers, KEMET Corp. and Smart Global Holdings, Inc., and technology hardware and service provider Insight Enterprises, Inc. performed poorly, detracting from relative performance. Paper manufacturer Verso Corp., logistics provider XPO Logistics, Inc., and business service provider Insperity, Inc. were strong performers over the period and contributed positively to the Fund’s return.
The Fund no longer holds any of the companies mentioned with the exception of Verso Corp., XPO Logistics, Inc., and Insperity, Inc.
Portfolio Strategy:
The Fund utilizes a quantitative approach in building a portfolio of attractively valued, growing companies whose stock prices are exhibiting strong price momentum. In essence, the strategy seeks to combine elements of both value and momentum investing by selecting 50 stocks that have relatively low price-to-sales ratios, have generated increased earnings over the past year, and have positive stock price appreciation over the past three- and six-month periods.
Investment Commentary:
We continue to believe that the outlook for small-cap and mid-cap stocks is positive. The U.S. economy is growing at a healthy rate, unemployment is low, and growth in both consumption and capital spending has accelerated over the last 12 months. Corporate earnings have risen significantly over the first nine months of 2018, helped, in part, by lower taxes. We expect earnings growth to be slower next year yet remain positive, driven primarily by continued steady economic growth.
There are three primary industry groups where the Fund currently maintains overweight positions: Materials, Retailing, and Consumer Durables & Apparel. Many consumer and retailing companies have been benefiting from strong employment growth and continued increases in consumer spending and, therefore, have seen their earnings and stock prices rise over the last year. As a result, the Fund owns stock in some of these companies, including Burlington Stores, Inc., Kohl’s Corp., and Callaway Golf Co. Materials companies have also been benefiting from strong economic growth and an upturn in capital spending in the United States. As a result, Verso Corp. and other holdings from the Materials industry group have been reporting solid growth in earnings and have seen their stock prices perform well.
_______________
Opinions expressed are those of the Portfolio Managers as of the date written and are subject to change, are not guaranteed, and should not be considered investment advice or an indication of trading intent.
| HENNESSY FUNDS | 1-800-966-4354 | |
The Fund invests in small-capitalization and medium-capitalization companies, which may have limited liquidity and greater price volatility than large-capitalization companies. Investments in foreign securities may involve political, economic, and currency risks, greater volatility, and differences in accounting methods. The Fund’s formula-based strategy may cause the Fund to buy or sell securities at times when it may not be advantageous. Please see the Fund’s prospectus for a more complete discussion of these and other risks.
References to specific securities should not be considered a recommendation to buy or sell any security. Fund holdings and sector allocations are subject to change. Please refer to the Schedule of Investments included in this report for additional portfolio information.
Earnings growth is not a measure of the Fund’s future performance.
Price-to-sales ratio is a valuation measure calculated by dividing a company’s market price per share by its revenue per share.
| PERFORMANCE OVERVIEW/SCHEDULE OF INVESTMENTS |
Financial Statements
Schedule of Investments as of October 31, 2018 |
HENNESSY CORNERSTONE GROWTH FUND
(% of Net Assets)
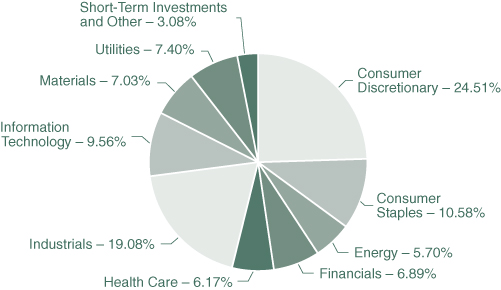
| TOP TEN HOLDINGS (EXCLUDING MONEY MARKET FUNDS) | % NET ASSETS |
| CVR Energy, Inc. | 3.96% |
| Insperity, Inc. | 3.13% |
| Verso Corp. | 2.98% |
| Crocs, Inc. | 2.84% |
| Boot Barn Holdings, Inc. | 2.70% |
| Burlington Stores, Inc. | 2.63% |
| Callaway Golf Co. | 2.54% |
| Centene Corp. | 2.42% |
| CBIZ, Inc. | 2.29% |
| Progressive Corp. | 2.26% |
Note: For presentation purposes, the Fund has grouped some of the industry categories. For purposes of categorizing securities for compliance with Section 8(b)(1) of the Investment Company Act of 1940, as amended, the Fund uses more specific industry classifications.
The Global Industry Classification Standard (GICS®) was developed by and is the exclusive property and a service mark of MSCI, Inc. and Standard & Poor Financial Services LLC. It has been licensed for use by the Hennessy Funds.
| HENNESSY FUNDS | 1-800-966-4354 | |
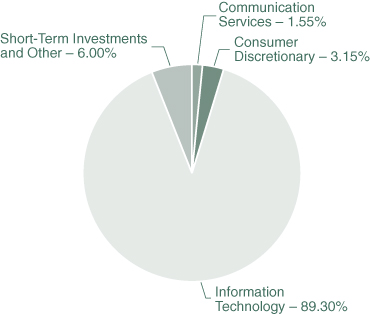
| COMMON STOCKS – 95.23% | | Number | | | | | | % of | |
| | | of Shares | | | Value | | | Net Assets | |
| Communication Services – 2.05% | | | | | | | | | |
| Live Nation Entertainment, Inc. (a) | | | 70,400 | | | $ | 3,681,920 | | | | 2.05 | % |
| | | | | | | | | | | | | |
| Consumer Discretionary – 27.07% | | | | | | | | | | | | |
| Best Buy Co., Inc. | | | 47,100 | | | | 3,304,536 | | | | 1.84 | % |
| BJ’s Restaurants, Inc. | | | 49,000 | | | | 2,997,820 | | | | 1.67 | % |
| Boot Barn Holdings, Inc. (a) | | | 196,300 | | | | 4,844,684 | | | | 2.70 | % |
| Burlington Stores, Inc. (a) | | | 27,500 | | | | 4,715,975 | | | | 2.63 | % |
| Callaway Golf Co. | | | 213,400 | | | | 4,566,760 | | | | 2.54 | % |
| Crocs, Inc. (a) | | | 247,800 | | | | 5,089,812 | | | | 2.84 | % |
| KB Home | | | 109,000 | | | | 2,176,730 | | | | 1.21 | % |
| Kohl’s Corp. | | | 52,500 | | | | 3,975,825 | | | | 2.21 | % |
| Lear Corp. | | | 17,400 | | | | 2,312,460 | | | | 1.29 | % |
| Noodles & Co. (a) | | | 281,200 | | | | 2,651,716 | | | | 1.48 | % |
| Penn National Gaming, Inc. (a) | | | 122,700 | | | | 2,979,156 | | | | 1.66 | % |
| Regis Corp. (a) | | | 202,700 | | | | 3,413,468 | | | | 1.90 | % |
| Restoration Hardware Holdings, Inc. (a) | | | 24,300 | | | | 2,811,753 | | | | 1.57 | % |
| Turtle Beach Corp. (a) | | | 154,800 | | | | 2,747,700 | | | | 1.53 | % |
| | | | | | | | 48,588,395 | | | | 27.07 | % |
| | | | | | | | | | | | | |
| Consumer Staples – 7.23% | | | | | | | | | | | | |
| Nomad Foods Ltd. (a) (b) | | | 197,700 | | | | 3,776,070 | | | | 2.10 | % |
| Pyxus International, Inc. (a) | | | 86,500 | | | | 2,053,510 | | | | 1.15 | % |
| Sprouts Farmers Market, Inc. (a) | | | 127,600 | | | | 3,431,164 | | | | 1.91 | % |
| The Chefs’ Warehouse, Inc. (a) | | | 110,400 | | | | 3,712,752 | | | | 2.07 | % |
| | | | | | | | 12,973,496 | | | | 7.23 | % |
| | | | | | | | | | | | | |
| Energy – 9.46% | | | | | | | | | | | | |
| CVR Energy, Inc. | | | 165,226 | | | | 7,104,718 | | | | 3.96 | % |
| HollyFrontier Corp. | | | 54,900 | | | | 3,702,456 | | | | 2.06 | % |
| Legacy Reserves, Inc. (a) | | | 580,600 | | | | 2,444,326 | | | | 1.36 | % |
| Renewable Energy Group, Inc. (a) | | | 119,800 | | | | 3,723,384 | | | | 2.08 | % |
| | | | | | | | 16,974,884 | | | | 9.46 | % |
| | | | | | | | | | | | | |
| Financials – 8.62% | | | | | | | | | | | | |
| EZCORP, Inc., Class A (a) | | | 252,500 | | | | 2,509,850 | | | | 1.40 | % |
| LPL Financial Holdings, Inc. | | | 52,700 | | | | 3,246,320 | | | | 1.81 | % |
| PennyMac Financial Services, Inc., Class A | | | 136,000 | | | | 2,718,640 | | | | 1.51 | % |
| Progressive Corp. | | | 58,300 | | | | 4,063,510 | | | | 2.26 | % |
| The Carlyle Group LP | | | 144,900 | | | | 2,937,123 | | | | 1.64 | % |
| | | | | | | | 15,475,443 | | | | 8.62 | % |
The accompanying notes are an integral part of these financial statements.
| COMMON STOCKS | | Number | | | | | | % of | |
| | | of Shares | | | Value | | | Net Assets | |
| Health Care – 12.21% | | | | | | | | | |
| AMN Healthcare Services, Inc. (a) | | | 58,600 | | | $ | 2,966,332 | | | | 1.65 | % |
| Anthem, Inc. | | | 14,400 | | | | 3,968,208 | | | | 2.21 | % |
| Centene Corp. (a) | | | 33,300 | | | | 4,339,656 | | | | 2.42 | % |
| Endo International PLC (a)(b) | | | 195,000 | | | | 3,303,300 | | | | 1.84 | % |
| Providence Service Corp. (a) | | | 52,400 | | | | 3,463,116 | | | | 1.93 | % |
| UnitedHealth Group, Inc. | | | 14,800 | | | | 3,867,980 | | | | 2.16 | % |
| | | | | | | | 21,908,592 | | | | 12.21 | % |
| | | | | | | | | | | | | |
| Industrials – 14.03% | | | | | | | | | | | | |
| ArcBest Corp. | | | 70,200 | | | | 2,605,824 | | | | 1.45 | % |
| BlueLinx Holdings, Inc. (a) | | | 82,900 | | | | 1,952,295 | | | | 1.09 | % |
| CBIZ, Inc. (a) | | | 185,700 | | | | 4,118,826 | | | | 2.29 | % |
| CNH Industrial N.V. (b) | | | 236,200 | | | | 2,454,118 | | | | 1.37 | % |
| Insperity, Inc. | | | 51,100 | | | | 5,613,335 | | | | 3.13 | % |
| MasTec, Inc. (a) | | | 65,800 | | | | 2,862,958 | | | | 1.59 | % |
| SPX FLOW, Inc. (a) | | | 70,300 | | | | 2,406,369 | | | | 1.34 | % |
| XPO Logistics, Inc. (a) | | | 35,500 | | | | 3,172,990 | | | | 1.77 | % |
| | | | | | | | 25,186,715 | | | | 14.03 | % |
| | | | | | | | | | | | | |
| Information Technology – 5.96% | | | | | | | | | | | | |
| Comtech Telecommunications Corp. | | | 142,500 | | | | 3,978,600 | | | | 2.21 | % |
| Mantech International Corp., Class A | | | 62,200 | | | | 3,562,816 | | | | 1.99 | % |
| Unisys Corp. (a) | | | 172,000 | | | | 3,166,520 | | | | 1.76 | % |
| | | | | | | | 10,707,936 | | | | 5.96 | % |
| | | | | | | | | | | | | |
| Materials – 8.60% | | | | | | | | | | | | |
| Boise Cascade Co. | | | 76,700 | | | | 2,361,593 | | | | 1.31 | % |
| Constellium N.V., Class A (a)(b) | | | 273,200 | | | | 2,475,192 | | | | 1.38 | % |
| Huntsman Corp. | | | 99,200 | | | | 2,170,496 | | | | 1.21 | % |
| Verso Corp. (a) | | | 190,100 | | | | 5,343,711 | | | | 2.98 | % |
| Warrior Met Coal, Inc. | | | 110,100 | | | | 3,082,800 | | | | 1.72 | % |
| | | | | | | | 15,433,792 | | | | 8.60 | % |
| Total Common Stocks | | | | | | | | | | | | |
| (Cost $168,247,369) | | | | | | | 170,931,173 | | | | 95.23 | % |
The accompanying notes are an integral part of these financial statements.
| HENNESSY FUNDS | 1-800-966-4354 | |
| SHORT-TERM INVESTMENTS – 4.96% | | Number | | | | | | % of | |
| | | of Shares | | | Value | | | Net Assets | |
| Money Market Funds – 4.96% | | | | | | | | | |
| Fidelity Government Portfolio, Institutional Class, 2.06% (c) | | | 8,908,236 | | | $ | 8,908,236 | | | | 4.96 | % |
| | | | | | | | | | | | | |
| Total Short-Term Investments | | | | | | | | | | | | |
| (Cost $8,908,236) | | | | | | | 8,908,236 | | | | 4.96 | % |
| | | | | | | | | | | | | |
| Total Investments | | | | | | | | | | | | |
| (Cost $177,155,605) – 100.19% | | | | | | | 179,839,409 | | | | 100.19 | % |
| Liabilities in Excess of Other Assets – (0.19)% | | | | | | | (344,117 | ) | | | (0.19 | )% |
| | | | | | | | | | | | | |
TOTAL NET ASSETS – 100.00% | | | | | | $ | 179,495,292 | | | | 100.00 | % |
Percentages are stated as a percent of net assets.
| (a) | Non-income producing security. |
| (b) | U.S.-traded security of a foreign corporation |
| (c) | The rate listed is the fund’s seven-day yield as of October 31, 2018. |
Summary of Fair Value Exposure at October 31, 2018
The following is a summary of the inputs used to value the Fund’s net assets as of October 31, 2018 (See Note 3 in the accompanying notes to the financial statements):
| Common Stocks | | Level 1 | | | Level 2 | | | Level 3 | | | Total | |
| Communication Services | | $ | 3,681,920 | | | $ | — | | | $ | — | | | $ | 3,681,920 | |
| Consumer Discretionary | | | 48,588,395 | | | | — | | | | — | | | | 48,588,395 | |
| Consumer Staples | | | 12,973,496 | | | | — | | | | — | | | | 12,973,496 | |
| Energy | | | 16,974,884 | | | | — | | | | — | | | | 16,974,884 | |
| Financials | | | 15,475,443 | | | | — | | | | — | | | | 15,475,443 | |
| Health Care | | | 21,908,592 | | | | — | | | | — | | | | 21,908,592 | |
| Industrials | | | 25,186,715 | | | | — | | | | — | | | | 25,186,715 | |
| Information Technology | | | 10,707,936 | | | | — | | | | — | | | | 10,707,936 | |
| Materials | | | 15,433,792 | | | | — | | | | — | | | | 15,433,792 | |
| Total Common Stocks | | $ | 170,931,173 | | | $ | — | | | $ | — | | | $ | 170,931,173 | |
| Short-Term Investments | | | | | | | | | | | | | | | | |
| Money Market Funds | | $ | 8,908,236 | | | $ | — | | | $ | — | | | $ | 8,908,236 | |
| Total Short-Term Investments | | $ | 8,908,236 | | | $ | — | | | $ | — | | | $ | 8,908,236 | |
| Total Investments | | $ | 179,839,409 | | | $ | — | | | $ | — | | | $ | 179,839,409 | |
The accompanying notes are an integral part of these financial statements.
Level 3 Reconciliation Disclosure
Following is a reconciliation of Level 3 assets for which significant unobservable inputs were used to determine fair value during the period.
| | | Rights | |
| Balance as of October 31, 2017 | | $ | 55 | |
| Accrued discounts/premiums | | | — | |
| Realized gain (loss) | | | — | |
| Change in unrealized appreciation (depreciation)* | | | (55 | ) |
| Purchases | | | — | |
| Transfer in and/or out of Level 3 | | | — | |
| Balance as of October 31, 2018 | | $ | — | |
| Change in unrealized appreciation/depreciation during the period for | | | | |
| Level 3 investments held at October 31, 2018 | | $ | — | |
| * | The rights were acquired in a past merger. The fair value of the rights was determined under procedures established by the Board of Trustees. The rights expired during the period and were removed from the Fund’s holdings on July 25, 2018. |
The accompanying notes are an integral part of these financial statements.
| HENNESSY FUNDS | 1-800-966-4354 | |
Financial Statements
Statement of Assets and Liabilities as of October 31, 2018 |
| ASSETS: | | | |
| Investments in securities, at value (cost $177,155,605) | | $ | 179,839,409 | |
| Dividends and interest receivable | | | 23,616 | |
| Receivable for fund shares sold | | | 7,122 | |
| Prepaid expenses and other assets | | | 21,078 | |
| Total Assets | | | 179,891,225 | |
| | | | | |
| LIABILITIES: | | | | |
| Payable for fund shares redeemed | | | 48,591 | |
| Payable to advisor | | | 118,204 | |
| Payable to administrator | | | 16,998 | |
| Payable to auditor | | | 21,900 | |
| Accrued distribution fees | | | 135,180 | |
| Accrued service fees | | | 14,136 | |
| Accrued trustees fees | | | 5,964 | |
| Accrued expenses and other payables | | | 34,960 | |
| Total Liabilities | | | 395,933 | |
| NET ASSETS | | $ | 179,495,292 | |
| | | | | |
| NET ASSETS CONSIST OF: | | | | |
| Capital stock | | $ | 163,609,128 | |
| Total distributable earnings | | | 15,886,164 | |
| Total Net Assets | | $ | 179,495,292 | |
| | | | | |
| NET ASSETS | | | | |
| Investor Class: | | | | |
| Shares authorized (no par value) | | Unlimited | |
| Net assets applicable to outstanding Investor Class shares | | $ | 158,977,658 | |
| Shares issued and outstanding | | | 7,170,178 | |
| Net asset value, offering price and redemption price per share | | $ | 22.17 | |
| | | | | |
| Institutional Class: | | | | |
| Shares authorized (no par value) | | Unlimited | |
| Net assets applicable to outstanding Institutional Class shares | | $ | 20,517,634 | |
| Shares issued and outstanding | | | 896,632 | |
| Net asset value, offering price and redemption price per share | | $ | 22.88 | |
The accompanying notes are an integral part of these financial statements.
| STATEMENT OF ASSETS AND LIABILITIES/STATEMENT OF OPERATIONS |
Financial Statements
Statement of Operations for the year ended October 31, 2018 |
| INVESTMENT INCOME: | | | |
| Dividend income | | $ | 1,461,646 | |
| Interest income | | | 81,106 | |
| Total investment income | | | 1,542,752 | |
| | | | | |
| EXPENSES: | | | | |
| Investment advisory fees (See Note 5) | | | 1,542,181 | |
| Sub-transfer agent expenses – Investor Class (See Note 5) | | | 270,596 | |
| Sub-transfer agent expenses – Institutional Class (See Note 5) | | | 12,969 | |
| Distribution fees – Investor Class (See Note 5) | | | 275,181 | |
| Administration, fund accounting, custody and transfer agent fees (See Note 5) | | | 199,081 | |
| Service fees – Investor Class (See Note 5) | | | 183,454 | |
| Federal and state registration fees | | | 41,019 | |
| Compliance expense (See Note 5) | | | 29,500 | |
| Audit fees | | | 23,148 | |
| Reports to shareholders | | | 23,203 | |
| Trustees’ fees and expenses | | | 17,128 | |
| Legal fees | | | 705 | |
| Interest expense (See Note 7) | | | 355 | |
| Other expenses | | | 14,570 | |
| Total expenses before recoupment from advisor | | | 2,633,090 | |
| Expense recoupment by advisor – Institutional Class | | | 1,024 | |
| Net expenses | | | 2,634,114 | |
| NET INVESTMENT LOSS | | $ | (1,091,362 | ) |
| | | | | |
| REALIZED AND UNREALIZED GAINS (LOSSES): | | | | |
| Net realized gain on investments | | $ | 15,676,800 | |
| Net change in unrealized appreciation/depreciation on investments | | | (30,685,707 | ) |
| Net loss on investments | | | (15,008,907 | ) |
| NET DECREASE IN NET ASSETS RESULTING FROM OPERATIONS | | $ | (16,100,269 | ) |
The accompanying notes are an integral part of these financial statements.
| HENNESSY FUNDS | 1-800-966-4354 | |
(This Page Intentionally Left Blank.)
| STATEMENTS OF CHANGES IN NET ASSETS |
Financial Statements
| Statements of Changes in Net Assets |
| | | Year Ended | | | Year Ended | |
| | | October 31, 2018 | | | October 31, 2017 | |
| OPERATIONS: | | | | | | |
| Net investment loss | | $ | (1,091,362 | ) | | $ | (615,891 | ) |
| Net realized gain on investments | | | 15,676,800 | | | | 25,408,962 | |
| Net change in unrealized | | | | | | | | |
| appreciation/depreciation on investments | | | (30,685,707 | ) | | | 26,412,588 | |
| Net increase (decrease) in net | | | | | | | | |
| assets resulting from operations | | | (16,100,269 | ) | | | 51,205,659 | |
| | | | | | | | | |
| CAPITAL SHARE TRANSACTIONS: | | | | | | | | |
| Proceeds from shares subscribed – Investor Class | | | 2,945,262 | | | | 5,154,765 | |
| Proceeds from shares subscribed – Institutional Class | | | 1,645,129 | | | | 6,572,602 | |
| Cost of shares redeemed – Investor Class | | | (26,887,338 | ) | | | (37,414,723 | ) |
| Cost of shares redeemed – Institutional Class | | | (10,968,680 | ) | | | (7,012,794 | ) |
| Net decrease in net assets derived | | | | | | | | |
| from capital share transactions | | | (33,265,627 | ) | | | (32,700,150 | ) |
| TOTAL INCREASE (DECREASE) IN NET ASSETS | | | (49,365,896 | ) | | | 18,505,509 | |
| | | | | | | | | |
| NET ASSETS: | | | | | | | | |
| Beginning of year | | | 228,861,188 | | | | 210,355,679 | |
| End of year | | $ | 179,495,292 | | | $ | 228,861,188 | (1) |
| | | | | | | | | |
| CHANGES IN SHARES OUTSTANDING: | | | | | | | | |
| Shares sold – Investor Class | | | 122,514 | | | | 233,860 | |
| Shares sold – Institutional Class | | | 65,421 | | | | 279,691 | |
| Shares redeemed – Investor Class | | | (1,116,060 | ) | | | (1,795,884 | ) |
| Shares redeemed – Institutional Class | | | (442,363 | ) | | | (328,917 | ) |
| Net decrease in shares outstanding | | | (1,370,488 | ) | | | (1,611,250 | ) |
(1) | Includes accumulated net investment loss of $(796,849). |
The accompanying notes are an integral part of these financial statements.
| HENNESSY FUNDS | 1-800-966-4354 | |
Financial Statements
For an Investor Class share outstanding throughout each year
PER SHARE DATA:
Net asset value, beginning of year
Income from investment operations:
Net investment income (loss)
Net realized and unrealized gains (losses) on investments
Total from investment operations
Less distributions:
Dividends from net investment income
Total distributions
Net asset value, end of year
TOTAL RETURN
SUPPLEMENTAL DATA AND RATIOS:
Net assets, end of year (millions)
Ratio of expenses to average net assets
Ratio of net investment income (loss) to average net assets
Portfolio turnover rate(1)
(1) | Portfolio turnover is calculated on the basis of the Fund as a whole. |
The accompanying notes are an integral part of these financial statements.
| FINANCIAL HIGHLIGHTS — INVESTOR CLASS |
| Year Ended October 31, | |
| 2018 | | | 2017 | | | 2016 | | | 2015 | | | 2014 | |
| | | | | | | | | | | | | | |
| $ | 24.16 | | | $ | 18.98 | | | $ | 20.00 | | | $ | 18.68 | | | $ | 15.65 | |
| | | | | | | | | | | | | | | | | | | |
| | | | | | | | | | | | | | | | | | | |
| | (0.17 | ) | | | (0.09 | ) | | | (0.02 | ) | | | 0.06 | | | | (0.04 | ) |
| | (1.82 | ) | | | 5.27 | | | | (0.98 | ) | | | 1.26 | | | | 3.07 | |
| | (1.99 | ) | | | 5.18 | | | | (1.00 | ) | | | 1.32 | | | | 3.03 | |
| | | | | | | | | | | | | | | | | | | |
| | | | | | | | | | | | | | | | | | | |
| | — | | | | — | | | | (0.02 | ) | | | — | | | | — | |
| | — | | | | — | | | | (0.02 | ) | | | — | | | | — | |
| $ | 22.17 | | | $ | 24.16 | | | $ | 18.98 | | | $ | 20.00 | | | $ | 18.68 | |
| | | | | | | | | | | | | | | | | | | |
| | (8.24 | )% | | | 27.29 | % | | | (5.00 | )% | | | 7.07 | % | | | 19.36 | % |
| | | | | | | | | | | | | | | | | | | |
| | | | | | | | | | | | | | | | | | | |
| $ | 158.98 | | | $ | 197.22 | | | $ | 184.61 | | | $ | 248.74 | | | $ | 227.68 | |
| | 1.30 | % | | | 1.30 | % | | | 1.32 | % | | | 1.15 | % | | | 1.23 | % |
| | (0.56 | )% | | | (0.33 | )% | | | (0.18 | )% | | | 0.30 | % | | | (0.17 | )% |
| | 133 | % | | | 98 | % | | | 97 | % | | | 102 | % | | | 84 | % |
The accompanying notes are an integral part of these financial statements.
| HENNESSY FUNDS | 1-800-966-4354 | |
Financial Statements
For an Institutional Class share outstanding throughout each year
PER SHARE DATA:
Net asset value, beginning of year
Income from investment operations:
Net investment income
Net realized and unrealized gains (losses) on investments
Total from investment operations
Less distributions:
Dividends from net investment income
Total distributions
Net asset value, end of year
TOTAL RETURN
SUPPLEMENTAL DATA AND RATIOS:
Net assets, end of year (millions)
Ratio of expenses to average net assets:
Before expense reimbursement/recoupment
After expense reimbursement/recoupment
Ratio of net investment income to average net assets:
Before expense reimbursement/recoupment
After expense reimbursement/recoupment
Portfolio turnover rate(1)
(1) | Portfolio turnover is calculated on the basis of the Fund as a whole. |
The accompanying notes are an integral part of these financial statements.
| FINANCIAL HIGHLIGHTS — INSTITUTIONAL CLASS |
| Year Ended October 31, | |
| 2018 | | | 2017 | | | 2016 | | | 2015 | | | 2014 | |
| | | | | | | | | | | | | | |
| $ | 24.85 | | | $ | 19.46 | | �� | $ | 20.47 | | | $ | 19.08 | | | $ | 15.94 | |
| | | | | | | | | | | | | | | | | | | |
| | | | | | | | | | | | | | | | | | | |
| | 0.11 | | | | 0.01 | | | | 0.17 | | | | 0.03 | | | | 0.06 | |
| | (2.08 | ) | | | 5.38 | | | | (1.13 | ) | | | 1.36 | | | | 3.08 | |
| | (1.97 | ) | | | 5.39 | | | | (0.96 | ) | | | 1.39 | | | | 3.14 | |
| | | | | | | | | | | | | | | | | | | |
| | | | | | | | | | | | | | | | | | | |
| | — | | | | — | | | | (0.05 | ) | | | — | | | | — | |
| | — | | | | — | | | | (0.05 | ) | | | — | | | | — | |
| $ | 22.88 | | | $ | 24.85 | | | $ | 19.46 | | | $ | 20.47 | | | $ | 19.08 | |
| | | | | | | | | | | | | | | | | | | |
| | (7.93 | )% | | | 27.70 | % | | | (4.69 | )% | | | 7.29 | % | | | 19.70 | % |
| | | | | | | | | | | | | | | | | | | |
| | | | | | | | | | | | | | | | | | | |
| $ | 20.52 | | | $ | 31.65 | | | $ | 25.74 | | | $ | 38.96 | | | $ | 25.54 | |
| | | | | | | | | | | | | | | | | | | |
| | 0.96 | % | | | 0.97 | % | | | 0.98 | % | | | 0.99 | % | | | 1.03 | % |
| | 0.96 | % | | | 0.97 | % | | | 0.98 | % | | | 0.99 | % | | | 0.98 | % |
| | | | | | | | | | | | | | | | | | | |
| | (0.23 | )% | | | (0.00 | )% | | | 0.14 | % | | | 0.51 | % | | | 0.03 | % |
| | (0.23 | )% | | | (0.00 | )% | | | 0.14 | % | | | 0.51 | % | | | 0.08 | % |
| | 133 | % | | | 98 | % | | | 97 | % | | | 102 | % | | | 84 | % |
The accompanying notes are an integral part of these financial statements.
| HENNESSY FUNDS | 1-800-966-4354 | |
Financial Statements
Notes to the Financial Statements October 31, 2018 |
1). ORGANIZATION
The Hennessy Cornerstone Growth Fund (the “Fund”) is a series of Hennessy Funds Trust (the “Trust”), which was organized as a Delaware statutory trust on September 17, 1992. The Fund is an open-end management investment company registered under the Investment Company Act of 1940, as amended. The investment objective of the Fund is long-term growth of capital. The Fund is a diversified fund.
The Fund offers Investor Class and Institutional Class shares. Each class of shares differs principally in its respective 12b-1 distribution and service, shareholder servicing, and sub-transfer agent expenses. There are no sales charges. Each class has identical rights to earnings, assets, and voting privileges, except for class-specific expenses and exclusive rights to vote on matters affecting only an individual class.
As an investment company, the Fund follows the investment company accounting and reporting guidance of the Financial Accounting Standards Board (“FASB”) Accounting Standard Codification Topic 946 “Financial Services—Investment Companies.”
2). SIGNIFICANT ACCOUNTING POLICIES
The following is a summary of significant accounting policies consistently followed by the Fund in the preparation of the financial statements. These policies conform to U.S. generally accepted accounting principles (“GAAP”).
| a). | Securities Valuation – All investments in securities are recorded at their estimated fair value, as described in Note 3. |
| | |
| b). | Federal Income Taxes – No provision for federal income taxes or excise taxes has been made because the Fund has elected to be taxed as a regulated investment company and intends to distribute substantially all of its taxable income to its shareholders and otherwise comply with the provisions of the Internal Revenue Code of 1986, as amended, applicable to regulated investment companies. Net investment income/loss and realized gains/losses for federal income tax purposes may differ from those reported in the financial statements because of temporary book and tax basis differences. Temporary differences are primarily the result of the treatment of partnership income and wash sales for tax reporting purposes. The Fund recognizes interest and penalties related to income tax benefits, if any, in the Statement of Operations as an income tax expense. Distributions from net realized gains for book purposes may include short-term capital gains, which are included as ordinary income to shareholders for tax purposes. The Fund may utilize equalization accounting for tax purposes and designate earnings and profits, including net realized gains distributed to shareholders on redemption of shares, as part of the dividends paid deduction for income tax purposes. |
| | |
| | Due to inherent differences in the recognition of income, expenses, and realized gains/losses under GAAP and federal income tax regulations, permanent differences between book and tax basis for reporting for fiscal year 2018 have been identified and appropriately reclassified in the Statement of Assets and Liabilities. The adjustments are as follows: |
| Total | |
| Distributable | |
Earnings | Capital Stock |
| $(584,133) | $584,133 |
| NOTES TO THE FINANCIAL STATEMENTS |
| c). | Accounting for Uncertainty in Income Taxes – The Fund has accounting policies regarding recognition and measurement of tax positions taken or expected to be taken on a tax return. The tax returns of the Fund for the prior three fiscal years are open for examination. The Fund has reviewed all open tax years in major jurisdictions and concluded that there is no impact on the Fund’s net assets and no tax liability resulting from unrecognized tax benefits relating to uncertain income tax positions taken or expected to be taken on a tax return. The Fund’s major tax jurisdictions are U.S. federal and Delaware. |
| | |
| d). | Income and Expenses – Dividend income is recognized on the ex-dividend date or as soon as information is available to the Fund. Interest income, which includes the amortization of premium and accretion of discount, is recognized on an accrual basis. Other non-cash dividends are recognized as investment income at the fair value of the property received. The Fund is charged for those expenses that are directly attributable to its portfolio, such as advisory, administration, and certain shareholder service fees. Income, expenses (other than expenses attributable to a specific class), and realized and unrealized gains/losses on investments are allocated to each class of shares based on such class’s net assets. |
| | |
| e). | Distributions to Shareholders – Dividends from net investment income for the Fund, if any, are declared and paid annually, usually in December. Distributions of net realized capital gains, if any, are declared and paid annually, usually in December. |
| | |
| f). | Security Transactions – Investment and shareholder transactions are recorded on the trade date. The Fund determines the realized gain/loss from an investment transaction by comparing the original cost of the security lot sold with the net sale proceeds. Discounts and premiums on securities purchased are accreted or amortized, respectively, over the life of each such security. |
| | |
| g). | Use of Estimates – The preparation of financial statements in conformity with GAAP requires management to make estimates and assumptions that affect the reported amounts of assets and liabilities and disclosure of contingent assets and liabilities at the date of the financial statements and the reported change in net assets during the reporting period. Actual results could differ from those estimates. |
| | |
| h). | Share Valuation – The net asset value (“NAV”) per share of the Fund is calculated by dividing (i) the total value of the securities held by the Fund, plus cash and other assets, minus all liabilities (including estimated accrued expenses) by (ii) the total number of shares outstanding for the Fund, rounded to the nearest cent. The Fund’s shares will not be priced on days the New York Stock Exchange is closed for trading. The offering and redemption price per share for the Fund is equal to the Fund’s NAV per share. |
| | |
| i). | New Accounting Pronouncements – In August 2018, the FASB issued Accounting Standards Update No. 2018-13 “Disclosure Framework—Changes to the Disclosure Requirements for Fair Value Measurement” (“ASU 2018-13”). ASU 2018-13 eliminates the requirement to disclose the amount of and reasons for transfers between Level 1 and Level 2 of the fair value hierarchy, the timing of transfers between levels of the fair value hierarchy, and the valuation processes for Level 3 fair value measurements. ASU 2018-13 does not eliminate the requirement to disclose the range and weighted average used to develop significant unobservable inputs for Level 3 fair value measurements, and the changes in unrealized gains and losses for recurring Level 3 fair value measurements. ASU 2018-13 requires that information is provided about the measurement uncertainty of Level 3 fair value measurements as of the reporting date. The guidance is effective for fiscal years beginning after December 15, 2019, and interim periods within those fiscal years. Management has |
| HENNESSY FUNDS | 1-800-966-4354 | |
| | evaluated the impact of this change in guidance, and due to the permissibility of early adoption, modified the Fund’s fair value disclosures for the current reporting period. |
| | |
| j). | New Rule Issuances – In August 2018, the Securities and Exchange Commission issued Final Rule Release No. 33 10532, Disclosure Update and Simplification, which in part amends certain financial statement disclosure requirements of Regulation S-X that have become redundant, duplicative, overlapping, outdated, or superseded, in light of other Commission disclosure requirements, GAAP, or changes in the information environment. The amendments are intended to facilitate the disclosure of information to investors and simplify compliance without significantly altering the total mix of information provided to investors. The amendments to Rule 6-04.17 of Regulation S-X (balance sheet) were amended to require presentation of the total, rather than the components of net assets, of distributable earnings on the balance sheet. Consistent with GAAP, funds will be required to disclose total distributable earnings. The amendments to Rule 6-09 of Regulation S-X (statement of changes in net assets) omit the requirement to separately state the sources of distributions paid as well as omit the requirement to parenthetically state the book basis amount of undistributed net investment income. Instead, consistent with GAAP, funds will be required to disclose the total amount of distributions paid, except that any tax return of capital must be separately disclosed. The requirements of the Final Rule Release are effective November 5, 2018 and the Fund’s Statement of Assets and Liabilities and the Statement of Changes in Net Assets for the current and prior reporting period have been modified accordingly. |
3). SECURITIES VALUATION
The Fund follows fair valuation accounting standards that establish an authoritative definition of fair value and set out a hierarchy for measuring fair value. These standards require additional disclosures about the various inputs and valuation techniques used to develop the measurements of fair value and a discussion of changes in valuation techniques and related inputs during the period. These inputs are summarized in the three broad levels listed below:
| | Level 1 – | Unadjusted, quoted prices in active markets for identical instruments that the Fund has the ability to access at the date of measurement. |
| | | |
| | Level 2 – | Other significant observable inputs (including, but not limited to, quoted prices in active markets for similar instruments, quoted prices in markets that are not active for identical or similar instruments, and model-derived valuations in which all significant inputs and significant value drivers are observable in active markets, such as interest rates, prepayment speeds, credit risk curves, default rates, and similar data). |
| | | |
| | Level 3 – | Significant unobservable inputs (including the Fund’s own assumptions about what market participants would use to price the asset or liability based on the best available information) when observable inputs are unavailable. |
Following is a description of the valuation techniques applied to the Fund’s major categories of assets and liabilities measured at fair value on a recurring basis.
| | Equity Securities – Equity securities, including common stocks, preferred stocks, foreign-issued common stocks, exchange-traded funds, closed-end mutual funds, partnerships, rights, and real estate investment trusts, that are traded on a securities exchange for which a last-quoted sales price is readily available will generally be valued at the last sales price as reported by the primary exchange on which the securities are listed. Securities listed on The NASDAQ Stock Market (“NASDAQ”) will generally be valued at the NASDAQ Official Closing Price, which may differ from |
| NOTES TO THE FINANCIAL STATEMENTS |
| | the last sales price reported. Securities traded on a securities exchange for which a last-quoted sales price is not readily available will generally be valued at the mean between the bid and ask prices. To the extent these securities are actively traded and valuation adjustments are not applied, they are classified in Level 1 of the fair value hierarchy. Securities traded on foreign exchanges generally are not valued at the same time the Fund calculates its NAV because most foreign markets close well before such time. The earlier close of most foreign markets gives rise to the possibility that significant events, including broad market moves, may have occurred in the interim. In certain circumstances, it may be determined that a foreign security needs to be fair valued because it appears that the value of the security might have been materially affected by events occurring after the close of the market in which the security is principally traded, but before the time the Fund calculates its NAV, such as by a development that affects an entire market or region (e.g., a weather-related event) or a potentially global development (e.g., a terrorist attack that may be expected to have an effect on investor expectations worldwide). |
| | |
| | Registered Investment Companies – Investments in open-end registered investment companies, commonly referred to as mutual funds, are generally priced at the ending NAV provided by the applicable mutual fund’s service agent and will be classified in Level 1 of the fair value hierarchy. |
| | |
| | Debt Securities – Debt securities, including corporate bonds, asset-backed securities, mortgage-backed securities, municipal bonds, U.S. Treasuries, and U.S. government agency issues, are generally valued at market on the basis of valuations furnished by an independent pricing service that utilizes both dealer-supplied valuations and formula-based techniques. The pricing service may consider recently executed transactions in securities of the issuer or comparable issuers, market price quotations (where observable), bond spreads, and fundamental data relating to the issuer. In addition, the model may incorporate observable market data, such as reported sales of similar securities, broker quotes, yields, bids, offers, and reference data. Certain securities are valued primarily using dealer quotations. These securities are generally classified in Level 2 of the fair value hierarchy. |
| | |
| | Short-Term Securities – Short-term equity investments, including money market funds, are valued in the manner specified above. Short-term debt investments with an original term to maturity of 60 days or less are valued at amortized cost, which approximates fair market value. If the original term to maturity of a short-term debt investment exceeded 60 days, then the values as of the 61st day prior to maturity are amortized. Amortized cost is not used if its use would be inappropriate due to credit or other impairments of the issuer, in which case the security’s fair value would be determined, as described below. Short-term securities are generally classified in Level 1 or Level 2 of the fair market hierarchy depending on the inputs used and market activity levels for specific securities. |
The Board of Trustees of the Fund (the “Board”) has adopted fair value pricing procedures that are followed when a price for a security is not readily available or if a significant event has occurred that indicates the closing price of a security no longer represents the true value of that security. Fair value pricing determinations are made in good faith in accordance with these procedures. There are numerous criteria that will be given consideration in determining a fair value of a security, such as the trading volume of a security and markets, the values of other similar securities, and news events with direct bearing on a security or markets. Fair value pricing results in an estimated price for a security that reflects the amount the Fund might reasonably expect to receive in a current
| HENNESSY FUNDS | 1-800-966-4354 | |
sale. Depending on the relative significance of the valuation inputs, these securities may be classified in either Level 2 or Level 3 of the fair value hierarchy.
The fair valuation of foreign securities may be determined with the assistance of a pricing service using correlations between the movement of prices of such securities and indices of domestic securities and other appropriate indicators, such as closing market prices of relevant American Depositary Receipts or futures contracts. The effect of using fair value pricing is that the Fund’s NAV will reflect the affected portfolio securities’ values as determined by the Board or its designee, pursuant to the fair value pricing procedures adopted by the Board, instead of being determined by the market. Using a fair value pricing methodology to price a foreign security may result in a value that is different from such foreign security’s most recent closing price and from the value used by other investment companies to calculate their NAVs. Such securities are generally classified in Level 2 of the fair valuation hierarchy. Because the Fund may invest in foreign securities, the value of the Fund’s portfolio securities may change on days when you will not be able to purchase or redeem your shares.
The Board has delegated day-to-day valuation matters to a Valuation Committee comprised of one or more representatives from Hennessy Advisors, Inc., the Fund’s investment advisor (the “Advisor”). The function of the Valuation Committee is to value securities where current and reliable market quotations are not readily available. All actions taken by the Valuation Committee are reviewed by the Board.
The Fund has performed an analysis of all existing investments to determine the significance and character of all inputs to their fair value determinations. Various inputs are used to determine the value of the Fund’s investments. The inputs or methodology used for valuing securities are not necessarily an indication of the risk associated with investing in those securities. Details related to the fair valuation hierarchy of the Fund’s securities as of October 31, 2018, are included in the Schedule of Investments.
4). INVESTMENT TRANSACTIONS
Purchases and sales of investment securities (excluding government and short-term investments) for the Fund during fiscal year 2018 were $269,523,806 and $304,025,169, respectively.
There were no purchases or sales/maturities of long-term U.S. government securities for the Fund during fiscal year 2018.
The Fund is permitted to purchase or sell securities from or to another fund in the Hennessy Funds family of funds (the “Hennessy Funds”) under specified conditions outlined in procedures adopted by the Board. The procedures have been designed to ensure that any purchase or sale of securities by the Fund from or to another Hennessy Fund complies with Rule 17a-7 of the Investment Company Act of 1940, as amended. During fiscal year 2018, the Fund did not engage in purchases or sales of securities pursuant to Rule 17a-7 of the Investment Company Act of 1940, as amended.
5). INVESTMENT ADVISORY FEE AND OTHER TRANSACTIONS WITH AFFILIATES
The Advisor provides the Fund with investment advisory services under an Investment Advisory Agreement. The Advisor furnishes all investment advice, office space, and facilities, as well as most of the personnel needed by the Fund. As compensation for its services, the Advisor is entitled to a monthly fee from the Fund. The fee is based upon the average daily net assets of the Fund at an annual rate of 0.74%. The net investment advisory fees expensed by the Fund during fiscal year 2018 are included in the Statement of Operations.
In the past, the Advisor had contractually agreed to waive its fees and absorb expenses to the extent that total annual operating expenses exceeded 0.98% of the Fund’s
| NOTES TO THE FINANCIAL STATEMENTS |
net assets for Institutional Class shares of the Fund (excluding all federal, state and local taxes, interest, brokerage commissions, acquired fund fees and expenses and other costs incurred in connection with the purchase and sale of securities, and extraordinary items). The expense limitation agreement was terminated by the Board as of February 28, 2015. For a period of three years after the year in which the Advisor waived or reimbursed expenses, the Advisor may seek reimbursement from the Fund to the extent that total annual fund operating expenses are less than the expense limitation that was in effect at the time the Advisor waived or reimbursed expenses. The Advisor recouped $1,024 from the Fund during fiscal year 2018. There are no further recoverable amounts.
The Board has approved a Shareholder Servicing Agreement for Investor Class shares of the Fund, which was instituted to compensate the Advisor for the non-investment advisory services it provides to the Fund. The Shareholder Servicing Agreement provides for a monthly fee paid to the Advisor at an annual rate of 0.10% of the average daily net assets of the Fund attributable to Investor Class shares. The shareholder service fees expensed by the Fund during fiscal year 2018 are included in the Statement of Operations.
The Fund has adopted a plan pursuant to Rule 12b-1 under the Investment Company Act of 1940, as amended, that authorizes payments in connection with the distribution of the Fund’s shares at an annual rate of up to 0.25% of the Fund’s average daily net assets attributable to Investor Class shares. Even though the authorized rate is up to 0.25%, the Fund is currently only using up to 0.15% of its average daily net assets attributable to Investor Class shares for such purpose. Amounts paid under the plan may be spent on any activities or expenses primarily intended to result in the sale of shares, including, but not limited to, advertising, shareholder account servicing, printing and mailing of prospectuses to other than current shareholders, printing and mailing of sales literature, and compensation for sales and marketing activities or to financial institutions and others, such as dealers and distributors. The distribution fees expensed by the Fund during fiscal year 2018 are included in the Statement of Operations.
The Fund has entered into agreements with various brokers, dealers, and financial intermediaries in connection with the sale of shares of the Fund. The agreements provide for periodic payments by the Fund to the brokers, dealers, and financial intermediaries for providing certain shareholder maintenance services (sub-transfer agent expenses). These shareholder services include the pre-processing and quality control of new accounts, shareholder correspondence, answering customer inquiries regarding account status, and facilitating shareholder telephone transactions. The sub-transfer agent fees expensed by the Fund during fiscal year 2018 are included in the Statement of Operations.
U.S. Bancorp Fund Services, LLC, d/b/a U.S. Bank Global Fund Services (“Fund Services”) provides the Fund with administrative, fund accounting, and transfer agent services. As administrator, Fund Services is responsible for activities such as (i) preparing various federal and state regulatory filings, reports, and returns for the Fund, (ii) preparing reports and materials to be supplied to the Board, (iii) monitoring the activities of the Fund’s custodian, transfer agent, and accountants, and (iv) coordinating the preparation and payment of the Fund’s expenses and reviewing the Fund’s expense accruals. U.S. Bank N.A., an affiliate of Fund Services, serves as the Fund’s custodian. The servicing agreements between the Trust and Fund Services and U.S. Bank N.A. contain a fee schedule that is inclusive of administrative, fund accounting, custody, and transfer agent fees. The administrative, fund accounting, custody, and transfer agent fees expensed by the Fund during fiscal year 2018 are included in the Statement of Operations.
Quasar Distributors, LLC acts as the Fund’s principal underwriter in a continuous public offering of the Fund’s shares. Quasar Distributors, LLC is an affiliate of Fund Services and U.S. Bank N.A.
| HENNESSY FUNDS | 1-800-966-4354 | |
The officers of the Fund are affiliated with the Advisor. Such officers, with the exception of the Chief Compliance Officer and the Senior Compliance Officer, receive no compensation from the Fund for serving in their respective roles. The Fund, along with the other Hennessy Funds, makes reimbursement payments, on an equal basis, to the Advisor for a portion of the salary and benefits associated with the office of the Chief Compliance Officer and for all of the salary and benefits associated with the office of the Senior Compliance Officer. The compliance fees expensed by the Fund during fiscal year 2018 are included in the Statement of Operations.
6). GUARANTEES AND INDEMNIFICATIONS
Under the Hennessy Funds’ organizational documents, their officers and trustees are indemnified by the Hennessy Funds against certain liabilities arising out of the performance of their duties to the Hennessy Funds. Additionally, in the normal course of business, the Hennessy Funds enter into contracts with service providers that contain general indemnification clauses. The Fund’s maximum exposure under these arrangements is unknown as this would involve future claims that may be made against the Fund that have not yet occurred. Currently, the Fund expects the risk of loss to be remote.
7). LINE OF CREDIT
The Fund has an uncommitted line of credit with the other Hennessy Funds in the amount of the lesser of (i) $100,000,000 or (ii) 33.33% of each Hennessy Fund’s net assets, or 30% for the Hennessy Gas Utility Fund and 10% for the Hennessy Balanced Fund, intended to provide short-term financing, if necessary, subject to certain restrictions, in connection with shareholder redemptions. The credit facility is with the Hennessy Funds’ custodian bank, U.S. Bank N.A. Borrowings under this arrangement bear interest at the bank’s prime rate and are secured by all of the Fund’s assets (as to its own borrowings only). During fiscal year 2018, the Fund had an outstanding average daily balance and a weighted average interest rate of $7,781 and 4.50%, respectively. The interest expensed by the Fund during fiscal year 2018 is included in the Statement of Operations. The maximum amount outstanding for the Fund during fiscal year 2018 was $838,000. As of October 31, 2018, the Fund did not have any borrowings outstanding under the line of credit.
8). FEDERAL TAX INFORMATION
As of October 31, 2018, the components of accumulated earnings (losses) for income tax purposes were as follows:
| | | Investments | |
| Cost of investments for tax purposes | | $ | 177,241,031 | |
| Gross tax unrealized appreciation | | $ | 19,606,515 | |
| Gross tax unrealized depreciation | | | (17,008,137 | ) |
| Net tax unrealized appreciation/(depreciation) | | $ | 2,598,378 | |
| Undistributed ordinary income | | $ | — | |
| Undistributed long-term capital gains | | | 14,373,091 | |
| Total distributable earnings | | $ | 14,373,091 | |
| Other accumulated gain/(loss) | | $ | (1,085,305 | ) |
| Total accumulated gain/(loss) | | $ | 15,886,164 | |
The difference between book-basis unrealized appreciation/depreciation (as shown in the Statement of Assets and Liabilities) and tax-basis unrealized appreciation/depreciation (as shown above) is attributable primarily to partnership adjustments and wash sales.
As of October 31, 2018, the Fund had no tax basis capital losses to offset future capital gains.
| NOTES TO THE FINANCIAL STATEMENTS |
As of October 31, 2018, the Fund deferred, on a tax basis, a late-year ordinary loss of $1,085,305. Late-year ordinary losses are net ordinary losses incurred after December 31, 2017, but within the taxable year, that are deemed to arise on the first day of the Fund’s next taxable year.
During fiscal year 2018 and fiscal year 2017, the Fund did not pay any distributions.
9). EVENTS SUBSEQUENT TO YEAR END
Management has evaluated the Fund’s related events and transactions that occurred subsequent to October 31, 2018, through the date of issuance of the Fund’s financial statements. Other than as disclosed below, management has determined that there were no subsequent events requiring recognition or disclosure in the financial statements.
On December 7, 2018, capital gains were declared and paid to shareholders of record on December 6, 2018, as follows:
| | Long-term |
| Investor Class | $1.81640 |
| Institutional Class | $1.87674 |
| HENNESSY FUNDS | 1-800-966-4354 | |
Report of Independent Registered Public
Accounting Firm
To the Board of Trustees of Hennessy Funds Trust
and the shareholders of Hennessy Cornerstone Growth Fund
Novato, CA
Opinion on the Financial Statements
We have audited the accompanying statement of assets and liabilities of Hennessy Cornerstone Growth Fund (the “Fund”), a series of Hennessy Funds Trust, including the schedule of investments, as of October 31, 2018, the related statement of operations for the year then ended, the statements of changes in net assets and the financial highlights for each of the two years in the period then ended, and the related notes (collectively referred to as the “financial statements”). In our opinion, the financial statements present fairly, in all material respects, the financial position of the Fund as of October 31, 2018, the results of its operations for the year then ended, and the changes in its net assets and the financial highlights for each of the two years in the period then ended in conformity with accounting principles generally accepted in the United States of America.
The financial highlights for each of the three years in the period ended October 31, 2016 have been audited by other auditors, whose report dated December 22, 2016 expressed unqualified opinions on such financial highlights.
Basis for Opinion
These financial statements are the responsibility of the Fund’s management. Our responsibility is to express an opinion on the Fund’s financial statements based on our audits. We are a public accounting firm registered with the Public Company Accounting Oversight Board (United States) (“PCAOB”) and are required to be independent with respect to the Fund in accordance with the U.S. federal securities laws and the applicable rules and regulations of the Securities and Exchange Commission and the PCAOB. We have served as the auditor of one or more of the funds in the Trust since 2002.
We conducted our audits in accordance with the standards of the PCAOB. Those standards require that we plan and perform the audit to obtain reasonable assurance about whether the financial statements are free of material misstatement, whether due to error or fraud. The Fund is not required to have, nor were we engaged to perform, an audit of its internal control over financial reporting. As part of our audits we are required to obtain an understanding of internal control over financial reporting, but not for the purpose of expressing an opinion on the effectiveness of the Fund’s internal control over financial reporting. Accordingly, we express no such opinion.
Our audits included performing procedures to assess the risks of material misstatement of the financial statements, whether due to error or fraud, and performing procedures that respond to those risks. Such procedures included examining, on a test basis, evidence regarding the amounts and disclosures in the financial statements. Our audits also included evaluating the accounting principles used and significant estimates made by management, as well as evaluating the overall presentation of the financial statements. Our procedures included confirmation of securities owned as of October 31, 2018 by correspondence with the custodian. We believe that our audits provide a reasonable basis for our opinion.
TAIT, WELLER & BAKER LLP
Philadelphia, Pennsylvania
December 27, 2018
| REPORT OF INDEPENDENT REGISTERED PUBLIC ACCOUNTING FIRM/TRUSTEES AND OFFICERS |
Trustees and Officers of the Fund (Unaudited)
The business and affairs of the Funds are managed under the direction of the Board of Trustees of the Trust, and the Board of Trustees elects the Officers of the Trust. Beginning in March 2015, the Board of Trustees has from time to time appointed advisers to the Board of Trustees (“Advisers”) with the intention of having qualified individuals serve in an advisory capacity in order to garner experience in the mutual fund and asset management industry and be considered as potential Trustees in the future. There are currently three Advisers: Brian Alexander, Doug Franklin, and Claire Knoles. As Advisers, Mr. Alexander, Mr. Franklin, and Ms. Knoles attend meetings of the Board of Trustees and act as non-voting participants. Information pertaining to the Trustees, Advisers, and the Officers of the Trust is set forth below. The Trustees and Officers serve until their successors are duly elected and qualified or until their earlier death, resignation, or removal. Each Trustee oversees the 16 Hennessy Funds. Unless otherwise indicated, the address of all persons listed below is 7250 Redwood Boulevard, Suite 200, Novato, CA 94945. The Fund’s Statement of Additional Information includes more information about the persons listed below and is available, without charge, upon request by calling 1-800-966-4354.
| | | | Other |
| | | | Directorships |
| | | | Held Outside |
| Name, (Year of Birth), | | | of Fund |
| and Position Held | Start Date | Principal Occupation(s) | Complex During |
with the Trust | of Service | During Past Five Years | Past Five Years(1) |
| | | | |
| Disinterested Trustees and Advisers | |
| | | | |
| J. Dennis DeSousa | January 1996 | Mr. DeSousa is a real estate investor. | None. |
| (1936) | | | |
| Trustee | | | |
| | | | |
| Robert T. Doyle | January 1996 | Mr. Doyle has been the Sheriff of | None. |
| (1947) | | Marin County, California since 1996. | |
| Trustee | | | |
| | | | |
| Gerald P. Richardson | May 2004 | Mr. Richardson is an independent | None. |
| (1945) | | consultant in the securities industry. | |
| Trustee | | | |
| | | | |
| Brian Alexander | March 2015 | Mr. Alexander has worked for the | None. |
| (1981) | | Sutter Health organization since | |
| Adviser to the Board | | 2011 in various positions. He has | |
| | | served as the Chief Executive Officer | |
| | | of the Sutter Roseville Medical | |
| | | Center since 2018. From 2016 through | |
| | | 2018, he served as the Vice President | |
| | | of Strategy for the Sutter Health Valley | |
| | | Area, which includes 11 hospitals, | |
| | | 13 ambulatory surgery centers, | |
| | | 16,000 employees, and 1,900 physicians. | |
| | | From 2013 through 2016, Mr. Alexander | |
| | | served as Sutter Novato Community | |
| | | Hospital’s Chief Administrative Officer, | |
| | | and from 2011 through 2012, he | |
| | | served as a Director of Strategy | |
| | | within Sutter’s West Bay Region. | |
| HENNESSY FUNDS | 1-800-966-4354 | |
| | | | Other |
| | | | Directorships |
| | | | Held Outside |
| Name, (Year of Birth), | | | of Fund |
| and Position Held | Start Date | Principal Occupation(s) | Complex During |
with the Trust | of Service | During Past Five Years | Past Five Years(1) |
| | | | |
| Doug Franklin | March 2016 | Mr. Franklin is a retired insurance | None. |
| (1964) | | industry executive. From 1987 | |
| Adviser to the Board | | through 2015, he was employed | |
| | | by the Allianz-Fireman’s Fund | |
| | | Insurance Company in various | |
| | | positions, including as its Chief | |
| | | Actuary and Chief Risk Officer. | |
| | | | |
| Claire Knoles | December 2015 | Ms. Knoles is a founder of Kiosk and | None. |
| (1974) | | has served as its Chief Operating | |
| Adviser to the Board | | Officer since 2004. Kiosk is a full | |
| | | service marketing agency with | |
| | | offices in the San Francisco Bay | |
| | | Area, Toronto, and Liverpool, UK. | |
| | | | |
Interested Trustee(2) | | | |
| | | | |
| Neil J. Hennessy | January 1996 as | Mr. Neil Hennessy has been employed | Hennessy |
| (1956) | a Trustee and | by Hennessy Advisors, Inc. since | Advisors, Inc. |
| Trustee, Chairman of | June 2008 as | 1989 and currently serves as its | |
| the Board, Chief | an Officer | Chairman and Chief Executive Officer. | |
| Investment Officer, | | | |
| Portfolio Manager, | | | |
| and President | | | |
| Name, (Year of Birth), | | |
| and Position Held | Start Date | Principal Occupation(s) |
with the Trust | of Service | During Past Five Years |
| | | |
| Officers | | |
| | | |
| Teresa M. Nilsen | January 1996 | Ms. Nilsen has been employed by Hennessy Advisors, Inc. |
| (1966) | | since 1989 and currently serves as its President, Chief Operating |
| Executive Vice President | | Officer, and Secretary. |
| and Treasurer | | |
| | | |
| Daniel B. Steadman | March 2000 | Mr. Steadman has been employed by Hennessy Advisors, Inc. |
| (1956) | | since 2000 and currently serves as its Executive Vice President. |
| Executive Vice President | | |
| and Secretary | | |
| | | |
| Brian Carlson | December 2013 | Mr. Carlson has been employed by Hennessy Advisors, Inc. |
| (1972) | | since December 2013 and currently serves as its Chief |
| Senior Vice President | | Compliance Officer and Senior Vice President. |
| and Head of Distribution | | |
| | | |
| Jennifer Cheskiewicz | June 2013 | Ms. Cheskiewicz has been employed by Hennessy Advisors, Inc. |
(1977)(3) | | as its General Counsel since June 2013. |
| Senior Vice President and | | |
| Chief Compliance Officer | | |
| TRUSTEES AND OFFICERS OF THE FUND |
| Name, (Year of Birth), | | |
| and Position Held | Start Date | Principal Occupation(s) |
with the Trust | of Service | During Past Five Years |
| | | |
| David Ellison | October 2012 | Mr. Ellison has been employed by Hennessy Advisors, Inc. since |
(1958)(4) | | October 2012. He has served as a Portfolio Manager of the |
| Senior Vice President | | Hennessy Large Cap Financial Fund and the Hennessy Small |
| and Portfolio Manager | | Cap Financial Fund since inception. Mr. Ellison also served as a |
| | | Portfolio Manager of the Hennessy Technology Fund from its |
| | | inception until February 2017. Mr. Ellison served as Director, |
| | | CIO and President of FBR Fund Advisers, Inc. from December |
| | | 1999 to October 2012. |
| | | |
| Ryan C. Kelley | March 2013 | Mr. Kelley has been employed by Hennessy Advisors, Inc. since |
(1972)(5) | | October 2012. He has served as a Portfolio Manager of the |
| Senior Vice President | | Hennessy Gas Utility Fund, the Hennessy Large Cap Financial |
| and Portfolio Manager | | Fund, and the Hennessy Small Cap Financial Fund since |
| | | October 2014. He served as Co-Portfolio Manager of the same |
| | | funds from March 2013 through September 2014, and as a |
| | | Portfolio Analyst for the Hennessy Funds from October 2012 |
| | | through February 2013. Mr. Kelley has also served as a Portfolio |
| | | Manager of the Hennessy Cornerstone Growth Fund, the |
| | | Hennessy Cornerstone Mid Cap 30 Fund, the Hennessy |
| | | Cornerstone Large Growth Fund, and the Hennessy |
| | | Cornerstone Value Fund since February 2017, as a Co-Portfolio |
| | | Manager of the Hennessy Technology Fund since February |
| | | 2017, and as a Portfolio Manager of the Hennessy Total Return |
| | | Fund and the Hennessy Balanced Fund since May 2018. |
| | | Mr. Kelley served as Portfolio Manager of FBR Fund Advisers, |
| | | Inc. from January 2008 to October 2012. |
| | | |
| Tania Kelley | October 2003 | Ms. Kelley has been employed by Hennessy Advisors, Inc. |
| (1965) | | since October 2003. |
| Senior Vice President | | |
| and Head of Marketing | | |
| | | |
| Daniel P. Hennessy | December 2016 | Mr. Daniel Hennessy has been employed by Hennessy Advisors, |
| (1990) | | Inc. since 2015. He has served as an Associate Analyst or |
| Vice President | | Analyst of the Hennessy Technology Fund since February 2017. |
| and Analyst | | Mr. Daniel Hennessy previously served as a Mutual Fund |
| | | Specialist at U.S. Bancorp Fund Services, LLC (now doing |
| | | business as U.S. Bank Global Fund Services) from November |
| | | 2014 to July 2015. Prior to that, he attended the University of |
| | | San Diego, where he earned a degree in Political Science. |
_______________
(1) | Messrs. DeSousa, Doyle, N. Hennessy, and Richardson previously served on the Board of Directors of Hennessy Mutual Funds, Inc. (“HMFI”), The Hennessy Funds, Inc. (“HFI”), and Hennessy SPARX Funds Trust (“HSFT”). Pursuant to an internal reorganization effective as of February 28, 2014, the series of HFMI, HFI, and HSFT were reorganized into corresponding series of the Trust that mirrored them. Subsequent to the reorganization, HFMI, HFI, and HSFT were dissolved. |
(2) | Mr. N. Hennessy is considered an “interested person,” as defined in the Investment Company Act of 1940, as amended, because he is an officer of the Hennessy Funds. |
(3) | The address of this officer is 4800 Bee Caves Road, Suite 100, Austin, TX 78746. |
(4) | The address of this officer is 101 Federal Street, Suite 1900, Boston, MA 02110. |
(5) | The address of this officer is 1340 Environ Way, Suite 332, Chapel Hill, NC 27517. |
| HENNESSY FUNDS | 1-800-966-4354 | |
Expense Example (Unaudited)
October 31, 2018
As a shareholder of the Fund, you incur ongoing costs, including management fees, service fees, and other Fund expenses. This Example is intended to help you understand your ongoing costs (in dollars) of investing in the Fund and to compare these costs with the ongoing costs of investing in other mutual funds. The Example is based on an investment of $1,000 invested at the beginning of the period and held for the entire period from May 1, 2018, through October 31, 2018.
Actual Expenses
The first line of the table below under the “Investor Class” and “Institutional Class” headings provides information about actual account values and actual expenses. Although the Fund charges no sales loads or transaction fees, you will be assessed fees for outgoing wire transfers, returned checks and stop payment orders at prevailing rates charged by U.S. Bank Global Fund Services, the Fund’s transfer agent. If you request that a redemption be made by wire transfer, currently a $15 fee is charged by the Fund’s transfer agent. IRA accounts will be charged a $15 annual maintenance fee. The example below includes, but is not limited to, management fees, shareholder servicing fees, fund accounting, custody, and transfer agent fees. However, the example below does not include portfolio trading commissions and related expenses, and other extraordinary expenses as determined under generally accepted accounting principles. You may use the information in this line, together with the amount you invested, to estimate the expenses that you paid over the period. Simply divide your account value by $1,000 (for example, an $8,600 account value divided by $1,000 = 8.6), then multiply the result by the number in the first line of the table under the “Investor Class” or “Institutional Class” headings in the column entitled “Expenses Paid During Period” to estimate the expenses you paid on your account during this period.
Hypothetical Example for Comparison Purposes
The second line of the table below under the “Investor Class” and “Institutional Class” headings provides information about hypothetical account values and hypothetical expenses based on the Fund’s actual expense ratios and an assumed rate of return of 5% per year before expenses, which is not the Fund’s actual return. The hypothetical account values and expenses may not be used to estimate the actual ending account balance or expenses you paid for the period. You may use this information to compare the ongoing costs of investing in the Fund and other funds. To do so, compare this 5% hypothetical example with the 5% hypothetical examples that appear in the shareholder reports of the other funds. Please note that the expenses shown in the table are meant to highlight your ongoing costs only. Therefore, the second line of the table under the “Investor Class” and “Institutional Class” headings is useful in comparing ongoing costs only, and will not help you determine the relative total costs of owning different funds.
| | | | Expenses Paid |
| | Beginning | Ending | During Period(1) |
| | Account Value | Account Value | May 1, 2018 – |
| | May 1, 2018 | October 31, 2018 | October 31, 2018 |
| Investor Class | | | |
| Actual | $1,000.00 | $ 943.40 | $6.40 |
| Hypothetical (5% return before expenses) | $1,000.00 | $1,018.62 | $6.64 |
| | | | |
| Institutional Class | | | |
| Actual | $1,000.00 | $ 945.10 | $4.71 |
| Hypothetical (5% return before expenses) | $1,000.00 | $1,020.37 | $4.89 |
(1) | Expenses are equal to the Fund’s annualized expense ratio of 1.31% for Investor Class shares or 0.96% for Institutional Class shares, as applicable, multiplied by the average account value over the period, multiplied by 184/365 days (to reflect one-half year period). |
| HENNESSY FUNDS | 1-800-966-4354 | |
How to Obtain a Copy of the Fund’s
Proxy Voting Policy and Proxy Voting Records
A description of the policies and procedures the Fund uses to determine how to vote proxies relating to portfolio securities is available without charge: (1) by calling 1-800-966-4354; (2) on the Hennessy Funds’ website at www.hennessyfunds.com/proxy-voting/voting-policy; or (3) on the U.S. Securities and Exchange Commission’s (the “SEC”) website at www.sec.gov. The Fund’s proxy voting record is available without charge on both the Hennessy Funds’ website at www.hennessyfunds.com/proxy-voting/voting-record and the SEC’s website at www.sec.gov no later than August 31 for the prior 12 months ending June 30.
Quarterly Filings on Form N-Q
The Fund files a complete schedule of portfolio holdings with the SEC for the first and third quarters of each fiscal year on Form N-Q. The Fund’s Forms N-Q are available on the SEC’s website at www.sec.gov. Information included in the Fund’s Forms N-Q will also be available upon request by calling 1-800-966-4354.
Important Notice Regarding Delivery
of Shareholder Documents
To help keep the Fund’s costs as low as possible, we generally deliver a single copy of shareholder reports, proxy statements, and prospectuses to shareholders who share an address and have the same last name. This process does not apply to account statements. You may request an individual copy of a shareholder document at any time. If you would like to receive separate mailings of shareholder documents, please call U.S. Bank Global Fund Services at 1-800-261-6950 or 1-414-765-4124, and individual delivery will begin within 30 days of your request. If your account is held through a financial institution or other intermediary, please contact such intermediary directly to request individual delivery.
| PROXY VOTING — PRIVACY POLICY |
Privacy Policy
We collect the following non-public personal information about you:
| | • | information we receive from you on or in applications or other forms, correspondence, or conversations, including, but not limited to, your name, address, phone number, social security number, assets, income, and date of birth; and |
| | | |
| | • | information about your transactions with us, our affiliates, or others, including, but not limited to, your account number and balance, payment history, parties to transactions, cost basis information, and other financial information. |
We do not disclose any non-public personal information about our current or former shareholders to non-affiliated third parties, except as permitted by law. For example, we are permitted by law to disclose all of the information we collect, as described above, to our Transfer Agent to process your transactions. Furthermore, we restrict access to your non-public personal information to those persons who require such information to provide products or services to you. We maintain physical, electronic, and procedural safeguards that comply with federal standards to guard your non-public personal information.
In the event that you hold shares of the Fund through a financial intermediary, including, but not limited to, a broker-dealer, bank, or trust company, the privacy policy of your financial intermediary would govern how your non-public personal information will be shared with non-affiliated third parties.
| HENNESSY FUNDS | 1-800-966-4354 | |
(This Page Intentionally Left Blank.)
For information, questions or assistance, please call
The Hennessy Funds
1-800-966-4354 or 1-415-899-1555
INVESTMENT ADVISOR
Hennessy Advisors, Inc.
7250 Redwood Boulevard, Suite 200
Novato, California 94945
ADMINISTRATOR,
TRANSFER AGENT,
DIVIDEND PAYING AGENT, &
SHAREHOLDER SERVICING AGENT
U.S. Bancorp Fund Services, LLC
d/b/a U.S. Bank Global Fund Services
P.O. Box 701
Milwaukee, Wisconsin 53201-0701
CUSTODIAN
U.S. Bank N.A.
Custody Operations
1555 North River Center Drive, Suite 302
Milwaukee, Wisconsin 53212
TRUSTEES
Neil J. Hennessy
Robert T. Doyle
J. Dennis DeSousa
Gerald P. Richardson
COUNSEL
Foley & Lardner LLP
777 East Wisconsin Avenue
Milwaukee, Wisconsin 53202-5306
INDEPENDENT REGISTERED
PUBLIC ACCOUNTING FIRM
Tait, Weller & Baker LLP
Two Liberty Place
50 South 16th Street, Suite 2900
Philadelphia, Pennsylvania 19102-2529
DISTRIBUTOR
Quasar Distributors, LLC
777 East Wisconsin Avenue
Milwaukee, Wisconsin 53202
hennessyfunds.com | 1-800-966-4354
This report has been prepared for shareholders and may be distributed to
others only if preceded or accompanied by a current prospectus.
ANNUAL REPORT
OCTOBER 31, 2018
HENNESSY FOCUS FUND
Investor Class HFCSX
Institutional Class HFCIX
hennessyfunds.com | 1-800-966-4354
(This Page Intentionally Left Blank.)
Contents
| Letter to Shareholders | 2 |
| Performance Overview | 4 |
| Financial Statements | |
| Schedule of Investments | 8 |
| Statement of Assets and Liabilities | 12 |
| Statement of Operations | 13 |
| Statements of Changes in Net Assets | 15 |
| Financial Highlights | 16 |
| Notes to the Financial Statements | 20 |
| Report of Independent Registered Public Accounting Firm | 28 |
| Trustees and Officers of the Fund | 29 |
| Expense Example | 32 |
| Proxy Voting Policy and Proxy Voting Records | 34 |
| Quarterly Schedule of Investments | 34 |
| Federal Tax Distribution Information | 34 |
| Important Notice Regarding Delivery of Shareholder Documents | 34 |
| Privacy Policy | 35 |
| HENNESSY FUNDS | 1-800-966-4354 | |
December 2018
Dear Hennessy Funds Shareholder:
Over the past year, we have witnessed the return of market volatility. U.S. stocks still registered healthy gains, bolstered by the impact on corporate profits of the successful passage of the tax reform bill in December 2017. However, concerns over potential trade disruptions, especially between the U.S. and China, and worries over higher short-term interest rates, which many believe could possibly trigger a recession down the road, put downward pressure on equity valuations.
The U.S. economy performed well over the period, and actually achieved an acceleration in GDP growth to over 3% on an annualized basis in the second and third quarters of calendar year 2018. During the past year, companies continued to hire workers, adding over 200,000 jobs per month on average, sending the unemployment rate down to 3.7% in October, which is the lowest it has been since 1969. Consumer confidence is high and still rising, and corporate profits reached record levels in the third quarter of calendar year 2018, posting a year-over-year increase of 26% for the companies in the S&P 500 Index.
The Federal Reserve, confident about the strength of the economy and mindful of a tight labor market, raised short-term interest rates four times over the last year, by a quarter point each time. Long-term bond yields also rose, driven higher primarily by evidence of faster wage growth, pushing the U.S. 10-year Treasury bond over 3% for the first time since 2013.
As I write this, we are experiencing the market’s 20th downturn since 2010. I have been saying that every bull market experiences volatility and pullbacks. Many financial commentators think this bull market is “long in the tooth.” I do not agree with them. I believe stock valuations are still very reasonable. The prospective price to earnings multiple for the Dow Jones Industrial Average has come down from almost 20x at the end of 2017 to 16x, just above its 10-year average of 15x. The prospective PE multiple for the S&P 500 Index has also come down, from 20x to 17x, and compares favorably to its 10-year average of 16x.
Cash, meanwhile, continues to build up on corporate balance sheets. The companies in the S&P 500 Index reported a total of over $5.4 trillion in cash and marketable securities in their latest filings. Companies have been spending some of their cash, increasing their investment spending and laying the groundwork for future earnings growth. However, they have also been returning capital to shareholders. S&P 500 Index companies announced $433.6 billion in share repurchases during the second quarter of calendar year 2018, nearly doubling the previous record of $242.1 billion set in the first quarter. Companies are also raising their dividends.
In addition, I believe the Federal Reserve will take care not to raise interest rates too high or too fast and endanger the economic expansion. While wage growth has risen to over 3% in October, other measures of inflationary pressure, such as the Consumer Price Index and the Producer Price Index, still show prices increasing at a more moderate pace, closer to 2%. Given continued evidence of modest rates of inflation, I believe the Fed will be able to maintain its gradual pace of interest rate hikes.
Finally and importantly, I still see no signs of euphoria in this market. In my opinion, the enthusiasm present earlier in the year, which followed the significant reduction in corporate income tax rates, has largely evaporated, and it has been replaced with anxiety
over higher interest rates and their potential impact on growth. In the past, I have likened the current bull market to that of 1982-2000, and I still believe this comparison holds true. I am confident in the strength of the market today and believe the economy will continue to grow in the coming year, albeit at a more moderate pace.
Thank you for your continued confidence and investment in the Hennessy Funds. If you have any questions or would like to speak with us directly, please don’t hesitate to call us at (800) 966-4354.
Best regards,
Neil J. Hennessy
President and Chief Investment Officer
Past performance does not guarantee future results.
Mutual fund investing involves risk. Principal loss is possible.
Opinions expressed are those of Neil Hennessy and are subject to change, are not guaranteed, and should not be considered investment advice.
The Dow Jones Industrial Average and S&P 500 Index are commonly used to measure the performance of U.S. stocks. One cannot invest directly in an index.
PE, or price to earnings, is a valuation measure and is calculated by dividing a company’s market price per share by its earnings per share. Earnings growth is not a measure of a fund’s future performance.
| HENNESSY FUNDS | 1-800-966-4354 | |
Performance Overview (Unaudited)
CHANGE IN VALUE OF $10,000 INVESTMENT
This graph illustrates the performance of an initial investment of $10,000 made in the Fund ten years ago and assumes the reinvestment of dividends.
AVERAGE ANNUAL TOTAL RETURN FOR PERIODS ENDED OCTOBER 31, 2018
| | One | Five | Ten |
| | Year | Years | Years |
| Hennessy Focus Fund – | | | |
| Investor Class (HFCSX) | -2.02% | 7.55% | 13.69% |
| Hennessy Focus Fund – | | | |
| Institutional Class (HFCIX) | -1.65% | 7.94% | 14.08% |
Russell 3000® Index | 6.60% | 10.81% | 13.35% |
Russell Midcap® Growth Index | 6.14% | 10.10% | 15.10% |
Expense ratios: 1.50% (Investor Class); 1.12% (Institutional Class)
Performance data quoted represents past performance; past performance does not guarantee future results. The investment return and principal value of an investment will fluctuate so that an investor’s shares, when redeemed, may be worth more or less than their original cost. The performance table does not reflect the deduction of taxes that a shareholder would pay on Fund distributions or the redemption of Fund shares. Current performance of the Fund may be lower or higher than the performance quoted. Performance data current to the most recent month end may be obtained by visiting www.hennessyfunds.com. Performance for periods on or prior to October 26, 2012, is that of the FBR Focus Fund.
The Russell 3000® Index is commonly used to measure the performance of U.S. stocks. The Russell Midcap® Growth Index is commonly used to measure the performance of U.S. medium-capitalization growth stocks. One cannot invest directly in an index.
Frank Russell Company (“Russell”) is the source and owner of the trademarks, service marks, and copyrights related to the Russell Indexes. Russell® is a trademark of Frank Russell Company. Neither Russell nor its licensors accept any liability for any errors or omissions in the Russell Indexes or Russell ratings or underlying data and no party may rely on any Russell Indexes or Russell ratings or underlying data contained in this communication. No further distribution of Russell data is permitted without Russell’s express written consent. Russell does not promote, sponsor, or endorse the content of this communication.
The expense ratios presented are from the most recent prospectus. The expense ratios for the current reporting period are available in the Financial Highlights section of this report.
PERFORMANCE NARRATIVE
Portfolio Managers Brian E. Macauley, CFA, David S. Rainey, CFA, and Ira M. Rothberg, CFA Broad Run Investment Management, LLC (sub-advisor)
Performance:
For the 12-month period ended October 31, 2018, the Investor Class of the Hennessy Focus Fund returned -2.02%, underperforming both the Russell 3000® Index (the Fund’s primary index) and the Russell Midcap® Growth Index, which returned 6.60% and 6.14%, respectively, for the same period.
Leading contributors to the Fund’s performance were O’Reilly Automotive, Inc., Twenty-First Century Fox, Inc., and American Tower Corp. O’Reilly Automotive, Inc. and American Tower Corp. produced attractive financial results over the 12-month period, which helped drive appreciation in their stock prices. Twenty-First Century Fox, Inc. shares appreciated during the period as The Walt Disney Company ultimately raised its bid for the company’s cable entertainment networks and film and television studios.
Leading detractors from the Fund’s performance were American Woodmark Corporation, NVR, Inc., and Encore Capital Group, Inc. The share prices of American Woodmark Corporation, a cabinet manufacturer, and NVR, Inc., a homebuilder, came under pressure as mortgage rates increased and rising home prices reduced housing affordability. Industry demand has slowed, but remains positive. We believe that the deceleration in housing starts is a temporary pause in the longer trend of housing recovery. U.S. single-family housing starts are 0.8-0.9 million versus a 1.2 million average over the last 50 years, implying 30 to 50% additional growth just to get back to a normal level. We used the price weakness in American Woodmark Corporation and NVR, Inc. to add to our positions. In early May, Encore Capital Group, Inc., a buyer of defaulted consumer receivables, announced an agreement to purchase the remaining economic interest in Cabot Credit Management that it did not already own. Cabot Credit Management is one of the largest credit management services providers in Europe and the market leader in the United Kingdom and Ireland. While the market initially reacted favorably to the announcement, shares subsequently traded lower as the valuations of comparable European companies declined.
The Fund continues to hold shares of all the companies mentioned except Twenty-First Century Fox, Inc.
Importantly, despite the 12-month relative underperformance, we are pleased with how the businesses in the portfolio are performing, with almost all growing owner earnings per share, excluding the benefit of the tax cut, at a sustained mid-teens clip, and we expect their stock prices to follow fundamentals over time. Portfolio valuation on a next 12-month price-to-owner earnings basis remains at a discount to the Fund’s primary benchmark. We take comfort in having a portfolio grounded in attractive near-term earnings multiples and in a market that appears long on enthusiasm and short on skepticism.
We invest with a long-term time horizon and encourage shareholders to do the same. Despite the discussion of 12-month results referenced above, we encourage fellow shareholders to also evaluate the Fund’s performance over five- and ten-year periods, since shorter periods can be influenced by many transitory issues unrelated to the growth in the intrinsic value of the Fund’s holdings.
| HENNESSY FUNDS | 1-800-966-4354 | |
Portfolio Strategy and Investment Commentary:
In the Fund, we target “compounders” – businesses trading at reasonable valuations that have the competitive position, management, and growth to potentially create outsized value for an extended period of time. We believe that our criteria-driven, fundamental research, applied with a long-term investment horizon, allows us to identify these opportunities. We continue to have a positive outlook for the Fund because we believe its holdings are predominately a collection of “compounders” that we believe should grow their earnings at attractive rates for a long time to come.
Charles Schwab & Co. was the Fund’s fourth-largest holding at the end of the period. We have a long history with the company and believe that it measures up very well against the investment criteria that guide our search for “compounders” and that it serves as a good illustration of our investing strategy.
Schwab began its corporate journey as an investment newsletter and repositioned itself as a discount broker after brokerage commissions were deregulated in May 1975. Today, Schwab has evolved beyond solely trading services to offer a mutual fund marketplace, custody, and other services to independent investment advisors, equity index funds, an ETF marketplace, a robo-advisor, and target-date ETFs. As a discount broker, Schwab was able to undercut traditional full-service brokers on price, providing tremendous savings to customers. Through the years, Schwab continually reinvested in technology to maintain its low-cost position, passing along savings to attract more customers, building its scale, and enabling further reinvestment. Four decades after its founding, Schwab remains a systematic market share gainer using essentially the same low-cost, low-price business model it began with. Adding to the appeal of the business model, client assets, particularly RIA assets, are very sticky and make Schwab a powerful asset-gathering machine.
Today, Schwab has approximately $3.6 trillion in client assets under custody, growing at about 10% per annum, which we believe should translate into low-teens earnings per share growth. With only 8% market share of a $45 trillion opportunity (inclusive of retail bank deposits), we believe this growth can continue for decades. The shares are trading at 16x next 12 month earnings per share, essentially in line with the market, for a world-class business with excellent opportunity for growth ahead. Finally, Mr. Schwab still owns 10% of the company and is the chairman of the board of directors. He shepherds the company with a long-term mindset and deep belief in perpetuating its low-cost, low-price business model.
_______________
Opinions expressed are those of the Portfolio Managers as of the date written and are subject to change, are not guaranteed, and should not be considered investment advice or an indication of trading intent.
Earnings growth is not representative of the Fund’s future performance.
The Fund is non-diversified, meaning it may concentrate its assets in fewer individual holdings than a diversified fund, making it more exposed to individual stock volatility than a diversified fund. The Fund invests in small-capitalization and medium-capitalization companies, which involves additional risks such as limited liquidity and greater volatility. Investments in foreign securities involve greater volatility and political, economic, and currency risk and differences in accounting methods. Please see the Fund’s prospectus for a more complete discussion of these and other risks.
References to specific securities should not be considered a recommendation to buy or sell any security. Fund holdings and sector allocations are subject to change. Please refer to the Schedule of Investments included in this report for additional portfolio information.
Owner earnings is a valuation method created by Warren Buffet defined as (a) reported earnings plus (b) depreciation, depletion, amortization, and certain other non-cash charges minus (c) the average annual amount of capital expenditures for plant and equipment that the business requires to fully maintain its long-term competitive position and its unit volume.
| HENNESSY FUNDS | 1-800-966-4354 | |
Financial Statements
Schedule of Investments as of October 31, 2018 |
HENNESSY FOCUS FUND
(% of Net Assets)
| TOP TEN HOLDINGS (EXCLUDING MONEY MARKET FUNDS) | % NET ASSETS |
| American Tower Corp., Class A | | | 11.98 | % | |
| O’Reilly Automotive, Inc. | | | 10.14 | % | |
| CarMax, Inc. | | | 9.35 | % | |
| The Charles Schwab Corp. | | | 8.66 | % | |
| Markel Corp. | | | 8.66 | % | |
| Brookfield Asset Management, Inc. | | | 8.60 | % | |
| Aon PLC | | | 8.56 | % | |
| Hexcel Corp. | | | 7.01 | % | |
| NVR, Inc. | | | 4.94 | % | |
| American Woodmark Corp. | | | 4.15 | % | |
Note: For presentation purposes, the Fund has grouped some of the industry categories. For purposes of categorizing securities for compliance with section 8(b)(1) of the Investment Company Act of 1940, as amended, the Fund uses more specific industry classifications.
The Global Industry Classification Standard (GICS®) was developed by and is the exclusive property and a service mark of MSCI, Inc. and Standard & Poor Financial Services LLC. It has been licensed for use by the Hennessy Funds.
| COMMON STOCKS – 75.31% | | Number | | | | | | % of | |
| | | of Shares | | | Value | | | Net Assets | |
| Consumer Discretionary – 26.40% | | | | | | | | | |
| Camping World Holdings, Inc. (d) | | | 2,471,506 | | | $ | 42,386,328 | | | | 1.97 | % |
| CarMax, Inc. (a) | | | 2,962,712 | | | | 201,197,772 | | | | 9.35 | % |
| NVR, Inc. (a) | | | 47,487 | | | | 106,324,818 | | | | 4.94 | % |
| O’Reilly Automotive, Inc. (a) | | | 679,856 | | | | 218,063,812 | | | | 10.14 | % |
| | | | | | | | 567,972,730 | | | | 26.40 | % |
| | | | | | | | | | | | | |
| Financials – 32.03% | | | | | | | | | | | | |
| Aon PLC (b) | | | 1,179,036 | | | | 184,141,842 | | | | 8.56 | % |
| Encore Capital Group, Inc. (a)(d) | | | 3,082,416 | | | | 78,324,191 | | | | 3.64 | % |
| Markel Corp. (a) | | | 170,380 | | | | 186,266,231 | | | | 8.66 | % |
| Marlin Business Services Corp. (d) | | | 1,010,273 | | | | 26,853,056 | | | | 1.25 | % |
| Metro Bank PLC (a) (b) | | | 956,183 | | | | 27,181,581 | | | | 1.26 | % |
| The Charles Schwab Corp. | | | 4,029,065 | | | | 186,303,966 | | | | 8.66 | % |
| | | | | | | | 689,070,867 | | | | 32.03 | % |
| | | | | | | | | | | | | |
| Industrials – 16.88% | | | | | | | | | | | | |
| American Woodmark Corp. (a)(d) | | | 1,475,202 | | | | 89,161,209 | | | | 4.15 | % |
| Ametek, Inc. | | | 459,822 | | | | 30,844,860 | | | | 1.43 | % |
| Ashtead Group PLC (b) | | | 2,941,861 | | | | 72,780,367 | | | | 3.38 | % |
| Hexcel Corp. | | | 2,577,037 | | | | 150,808,205 | | | | 7.01 | % |
| Mistras Group, Inc. (a) | | | 979,716 | | | | 19,496,348 | | | | 0.91 | % |
| | | | | | | | 363,090,989 | | | | 16.88 | % |
| Total Common Stocks | | | | | | | | | | | | |
| (Cost $945,213,544) | | | | | | | 1,620,134,586 | | | | 75.31 | % |
| | | | | | | | | | | | | |
| REITS – 20.58% | | | | | | | | | | | | |
| | | | | | | | | | | | | |
| Financials – 20.58% | | | | | | | | | | | | |
| American Tower Corp., Class A | | | 1,653,694 | | | | 257,662,062 | | | | 11.98 | % |
| Brookfield Asset Management, Inc. (b) | | | 4,543,328 | | | | 185,140,616 | | | | 8.60 | % |
| | | | | | | | 442,802,678 | | | | 20.58 | % |
| Total REITS | | | | | | | | | | | | |
| (Cost $207,870,109) | | | | | | | 442,802,678 | | | | 20.58 | % |
The accompanying notes are an integral part of these financial statements.
| HENNESSY FUNDS | 1-800-966-4354 | |
| SHORT-TERM INVESTMENTS – 4.21% | | Number | | | | | | % of | |
| | | of Shares | | | Value | | | Net Assets | |
| Money Market Funds – 4.21% | | | | | | | | | |
| Fidelity Government Portfolio, Institutional Class, 2.06% (c) | | | 90,654,933 | | | $ | 90,654,933 | | | | 4.21 | % |
| | | | | | | | | | | | | |
| Total Short-Term Investments | | | | | | | | | | | | |
| (Cost $90,654,933) | | | | | | | 90,654,933 | | | | 4.21 | % |
| | | | | | | | | | | | | |
| Total Investments | | | | | | | | | | | | |
| (Cost $1,243,738,586) – 100.10% | | | | | | | 2,153,592,197 | | | | 100.10 | % |
| Liabilities in Excess of Other Assets – (0.10)% | | | | | | | (2,183,491 | ) | | | (0.10 | )% |
| | | | | | | | | | | | | |
TOTAL NET ASSETS – 100.00% | | | | | | $ | 2,151,408,706 | | | | 100.00 | % |
Percentages are stated as a percent of net assets.
PLC – Public Limited Company
REIT – Real Estate Investment Trust
| (a) | | Non-income producing security. |
| (b) | | U.S.-traded security of a foreign corporation. |
| (c) | | The rate listed is the fund’s seven-day yield as of October 31, 2018. |
| (d) | | Investment represents five percent or more of the outstanding voting securities of the issuer, and is or was an affiliate of the Hennessy Focus Fund, as defined in the Investment Company Act of 1940, as amended, at or during the year ended October 31, 2018. Details of transactions with these affiliated companies for the year ended October 31, 2018, are as follows: |
| | | | American | | | Camping World | | | Encore Capital | | | Marlin Business | |
| | Issuer | | Woodmark Corp. | | | Holdings, Inc. | | | Group, Inc. | | | Services Corp. | |
| | Beginning Cost | | $ | 54,953,784 | | | $ | — | | | $ | 73,525,403 | | | $ | 15,865,289 | |
| | Purchase Cost | | $ | 20,369,449 | | | $ | 52,261,467 | | | $ | 31,327,664 | | | $ | — | |
| | Sales Cost | | $ | — | | | $ | — | | | $ | — | | | $ | — | |
| | Ending Cost | | $ | 75,323,233 | | | $ | 52,261,467 | | | $ | 104,853,067 | | | $ | 15,865,289 | |
| | Dividend Income | | $ | — | | | $ | — | | | $ | — | | | $ | 565,753 | |
| | Net change in unrealized | | | | | | | | | | | | | | | | |
| | appreciation/ (depreciation) | | $ | (51,799,912 | ) | | $ | (9,875,139 | ) | | $ | (57,923,990 | ) | | $ | 4,728,077 | |
| | Realized Gain/Loss | | $ | — | | | $ | — | | | $ | — | | | $ | — | |
| | Shares | | | 1,475,202 | | | | 2,471,506 | | | | 3,082,416 | | | | 1,010,273 | |
| | Market Value | | $ | 89,161,209 | | | $ | 42,386,328 | | | $ | 78,324,191 | | | $ | 26,853,056 | |
The accompanying notes are an integral part of these financial statements.
Summary of Fair Value Exposure at October 31, 2018
The following is a summary of the inputs used to value the Fund’s net assets as of October 31, 2018 (See Note 3 in the accompanying notes to the financial statements):
| Common Stocks | | Level 1 | | | Level 2 | | | Level 3 | | | Total | |
| Consumer Discretionary | | $ | 567,972,730 | | | $ | — | | | $ | — | | | $ | 567,972,730 | |
| Financials | | | 689,070,867 | | | | — | | | | — | | | | 689,070,867 | |
| Industrials | | | 363,090,989 | | | | — | | | | — | | | | 363,090,989 | |
| Total Common Stocks | | $ | 1,620,134,586 | | | $ | — | | | $ | — | | | $ | 1,620,134,586 | |
| REITS | | | | | | | | | | | | | | | | |
| Financials | | $ | 442,802,678 | | | $ | — | | | $ | — | | | $ | 442,802,678 | |
| Total REITS | | $ | 442,802,678 | | | $ | — | | | $ | — | | | $ | 442,802,678 | |
| Short-Term Investments | | | | | | | | | | | | | | | | |
| Money Market Funds | | $ | 90,654,933 | | | $ | — | | | $ | — | | | $ | 90,654,933 | |
| Total Short-Term Investments | | $ | 90,654,933 | | | $ | — | | | $ | — | | | $ | 90,654,933 | |
| Total Investments | | $ | 2,153,592,197 | | | $ | — | | | $ | — | | | $ | 2,153,592,197 | |
The accompanying notes are an integral part of these financial statements.
| HENNESSY FUNDS | 1-800-966-4354 | |
Financial Statements
Statement of Assets and Liabilities as of October 31, 2018 |
| ASSETS: | | | |
| Investments in unaffiliated securities, at value (cost $995,435,530) | | $ | 1,916,867,413 | |
| Investments in affiliated securities, at value (cost $248,303,056) | | | 236,724,784 | |
| Total investments in securities, at value (cost $1,243,738,586) | | | 2,153,592,197 | |
| Dividends and interest receivable | | | 676,086 | |
| Receivable for fund shares sold | | | 1,522,394 | |
| Prepaid expenses and other assets | | | 93,172 | |
| Total Assets | | | 2,155,883,849 | |
| | | | | |
| LIABILITIES: | | | | |
| Payable for fund shares redeemed | | | 1,721,980 | |
| Payable to advisor | | | 1,723,545 | |
| Payable to administrator | | | 203,686 | |
| Payable to auditor | | | 21,900 | |
| Accrued distribution fees | | | 288,372 | |
| Accrued service fees | | | 119,145 | |
| Accrued trustees fees | | | 5,964 | |
| Accrued expenses and other payables | | | 390,551 | |
| Total Liabilities | | | 4,475,143 | |
| NET ASSETS | | $ | 2,151,408,706 | |
| | | | | |
| NET ASSETS CONSIST OF: | | | | |
| Capital stock | | $ | 903,414,014 | |
| Total distributable earnings | | | 1,247,994,692 | |
| Total Net Assets | | $ | 2,151,408,706 | |
| | | | | |
| NET ASSETS | | | | |
| Investor Class: | | | | |
| Shares authorized (no par value) | | Unlimited | |
| Net assets applicable to outstanding Investor Class shares | | $ | 1,339,447,913 | |
| Shares issued and outstanding | | | 16,098,413 | |
| Net asset value, offering price and redemption price per share | | $ | 83.20 | |
| | | | | |
| Institutional Class: | | | | |
| Shares authorized (no par value) | | Unlimited | |
| Net assets applicable to outstanding Institutional Class shares | | $ | 811,960,793 | |
| Shares issued and outstanding | | | 9,478,426 | |
| Net asset value, offering price and redemption price per share | | $ | 85.66 | |
The accompanying notes are an integral part of these financial statements.
| STATEMENT OF ASSETS AND LIABILITIES/STATEMENT OF OPERATIONS |
Financial Statements
Statement of Operations for the year ended October 31, 2018 |
| INVESTMENT INCOME: | | | |
Dividend income from unaffiliated securities(1) | | $ | 17,833,607 | |
| Dividend income from affiliated securities | | | 565,753 | |
| Interest income | | | 1,265,221 | |
| Total investment income | | | 19,664,581 | |
| | | | | |
| EXPENSES: | | | | |
| Investment advisory fees (See Note 5) | | | 23,437,190 | |
| Sub-transfer agent expenses – Investor Class (See Note 5) | | | 3,273,425 | |
| Sub-transfer agent expenses – Institutional Class (See Note 5) | | | 773,046 | |
| Administration, fund accounting, custody and transfer agent fees (See Note 5) | | | 2,499,733 | |
| Distribution fees – Investor Class (See Note 5) | | | 2,397,805 | |
| Service fees – Investor Class (See Note 5) | | | 1,598,536 | |
| Reports to shareholders | | | 151,493 | |
| Federal and state registration fees | | | 73,899 | |
| Compliance expense (See Note 5) | | | 29,495 | |
| Legal fees | | | 28,256 | |
| Trustees’ fees and expenses | | | 25,707 | |
| Audit fees | | | 22,502 | |
| Interest expense (See Note 7) | | | 643 | |
| Other expenses | | | 181,038 | |
| Total expenses | | | 34,492,768 | |
| NET INVESTMENT LOSS | | $ | (14,828,187 | ) |
| | | | | |
| REALIZED AND UNREALIZED GAINS (LOSSES): | | | | |
| Net realized gain on: | | | | |
| Unaffiliated investments | | $ | 373,659,739 | |
| Affiliated investments | | | — | |
| Net change in unrealized appreciation/depreciation on: | | | | |
| Unaffiliated investments | | | (258,976,278 | ) |
| Affiliated investments | | | (114,870,964 | ) |
| Net loss on investments | | | (187,503 | ) |
| NET DECREASE IN NET ASSETS RESULTING FROM OPERATIONS | | $ | (15,015,690 | ) |
(1) | Net of foreign taxes withheld of $402,085. |
The accompanying notes are an integral part of these financial statements.
| HENNESSY FUNDS | 1-800-966-4354 | |
(This Page Intentionally Left Blank.)
| STATEMENTS OF CHANGES IN NET ASSETS |
Financial Statements
| Statements of Changes in Net Assets |
| | | Year Ended | | | Year Ended | |
| | | October 31, 2018 | | | October 31, 2017 | |
| OPERATIONS: | | | | | | |
| Net investment loss | | $ | (14,828,187 | ) | | $ | (9,635,486 | ) |
| Net realized gain on investments | | | 373,659,739 | | | | 6,262,037 | |
| Net change in unrealized | | | | | | | | |
| appreciation/depreciation on investments | | | (373,847,242 | ) | | | 477,904,990 | |
| Net increase (decrease) in net | | | | | | | | |
| assets resulting from operations | | | (15,015,690 | ) | | | 474,531,541 | |
| | | | | | | | | |
| DISTRIBUTIONS TO SHAREHOLDERS FROM: | | | | | | | | |
| Distributable earnings – Investor Class | | | (103,968 | ) | | | — | |
| Distributable earnings – Institutional Class | | | (67,148 | ) | | | — | |
| Total distributions | | | (171,116 | ) | | | — | |
| | | | | | | | | |
| CAPITAL SHARE TRANSACTIONS: | | | | | | | | |
| Proceeds from shares subscribed – Investor Class | | | 110,725,649 | | | | 192,418,104 | |
| Proceeds from shares subscribed – Institutional Class | | | 198,457,882 | | | | 329,777,433 | |
| Dividends reinvested – Investor Class | | | 102,585 | | | | — | |
| Dividends reinvested – Institutional Class | | | 57,674 | | | | — | |
| Cost of shares redeemed – Investor Class | | | (432,891,744 | ) | | | (448,768,404 | ) |
| Cost of shares redeemed – Institutional Class | | | (442,177,824 | ) | | | (208,168,872 | ) |
| Net decrease in net assets derived | | | | | | | | |
| from capital share transactions | | | (565,725,778 | ) | | | (134,741,739 | ) |
| TOTAL INCREASE (DECREASE) IN NET ASSETS | | | (580,912,584 | ) | | | 339,789,802 | |
| | | | | | | | | |
| NET ASSETS: | | | | | | | | |
| Beginning of year | | | 2,732,321,290 | | | | 2,392,531,488 | |
| End of year | | $ | 2,151,408,706 | | | $ | 2,732,321,290 | (1) |
| | | | | | | | | |
| CHANGES IN SHARES OUTSTANDING: | | | | | | | | |
| Shares sold – Investor Class | | | 1,252,599 | | | | 2,500,539 | |
| Shares sold – Institutional Class | | | 2,178,048 | | | | 4,162,013 | |
| Shares issued to holders as reinvestment | | | | | | | | |
| of dividends – Investor Class | | | 1,169 | | | | — | |
| Shares issued to holders as reinvestment | | | | | | | | |
| of dividends – Institutional Class | | | 641 | | | | — | |
| Shares redeemed – Investor Class | | | (4,879,914 | ) | | | (5,805,953 | ) |
| Shares redeemed – Institutional Class | | | (4,839,525 | ) | | | (2,633,695 | ) |
| Net decrease in shares outstanding | | | (6,286,982 | ) | | | (1,777,096 | ) |
(1) | Includes accumulated net investment loss of $(10,054,323). |
The accompanying notes are an integral part of these financial statements.
| HENNESSY FUNDS | 1-800-966-4354 | |
Financial Statements
For an Investor Class share outstanding throughout each year
PER SHARE DATA:
Net asset value, beginning of year
Income from investment operations:
Net investment income (loss)
Net realized and unrealized gains (losses) on investments
Total from investment operations
Less distributions:
Dividends from net investment income
Dividends from net realized gains
Total distributions
Paid-in capital from redemption fees
Net asset value, end of year
TOTAL RETURN
SUPPLEMENTAL DATA AND RATIOS:
Net assets, end of year (millions)
Ratio of expenses to average net assets
Ratio of net investment income (loss) to average net assets
Portfolio turnover rate(2)
(1) | Amount is less than $0.01. |
(2) | Portfolio turnover is calculated on the basis of the Fund as a whole. |
The accompanying notes are an integral part of these financial statements.
| FINANCIAL HIGHLIGHTS — INVESTOR CLASS |
| Year Ended October 31, | |
| 2018 | | | 2017 | | | 2016 | | | 2015 | | | 2014 | |
| | | | | | | | | | | | | | |
| $ | 84.92 | | | $ | 70.63 | | | $ | 71.94 | | | $ | 69.46 | | | $ | 63.58 | |
| | | | | | | | | | | | | | | | | | | |
| | | | | | | | | | | | | | | | | | | |
| | (0.86 | ) | | | (0.51 | ) | | | (0.45 | ) | | | (0.33 | ) | | | 0.27 | |
| | (0.85 | ) | | | 14.80 | | | | (0.72 | ) | | | 8.07 | | | | 6.68 | |
| | (1.71 | ) | | | 14.29 | | | | (1.17 | ) | | | 7.74 | | | | 6.95 | |
| | | | | | | | | | | | | | | | | | | |
| | | | | | | | | | | | | | | | | | | |
| | — | | | | — | | | | — | | | | (0.02 | ) | | | — | |
| | (0.01 | ) | | | — | | | | (0.14 | ) | | | (5.24 | ) | | | (1.07 | ) |
| | (0.01 | ) | | | — | | | | (0.14 | ) | | | (5.26 | ) | | | (1.07 | ) |
| | — | | | | — | | | | — | | | | — | | | | 0.00 | (1) |
| $ | 83.20 | | | $ | 84.92 | | | $ | 70.63 | | | $ | 71.94 | | | $ | 69.46 | |
| | | | | | | | | | | | | | | | | | | |
| | (2.02 | )% | | | 20.23 | % | | | (1.63 | )% | | | 11.83 | % | | | 11.05 | % |
| | | | | | | | | | | | | | | | | | | |
| | | | | | | | | | | | | | | | | | | |
| $ | 1,339.45 | | | $ | 1,675.00 | | | $ | 1,626.71 | | | $ | 1,615.36 | | | $ | 1,213.03 | |
| | 1.47 | % | | | 1.48 | % | | | 1.47 | % | | | 1.46 | % | | | 1.41 | % |
| | (0.72 | )% | | | (0.51 | )% | | | (0.65 | )% | | | (0.55 | )% | | | 0.41 | % |
| | 13 | % | | | 5 | % | | | 2 | % | | | 4 | % | | | 18 | % |
The accompanying notes are an integral part of these financial statements.
| HENNESSY FUNDS | 1-800-966-4354 | |
Financial Statements
For an Institutional Class share outstanding throughout each year
PER SHARE DATA:
Net asset value, beginning of year
Income from investment operations:
Net investment income (loss)
Net realized and unrealized gains (losses) on investments
Total from investment operations
Less distributions:
Dividends from net investment income
Dividends from net realized gains
Total distributions
Net asset value, end of year
TOTAL RETURN
SUPPLEMENTAL DATA AND RATIOS:
Net assets, end of year (millions)
Ratio of expenses to average net assets
Ratio of net investment income (loss) to average net assets
Portfolio turnover rate(1)
(1) | Portfolio turnover is calculated on the basis of the Fund as a whole. |
The accompanying notes are an integral part of these financial statements.
| FINANCIAL HIGHLIGHTS — INSTITUTIONAL CLASS |
| Year Ended October 31, | |
| 2018 | | | 2017 | | | 2016 | | | 2015 | | | 2014 | |
| | | | | | | | | | | | | | |
| $ | 87.10 | | | $ | 72.17 | | | $ | 73.24 | | | $ | 70.50 | | | $ | 64.32 | |
| | | | | | | | | | | | | | | | | | | |
| | | | | | | | | | | | | | | | | | | |
| | (0.28 | ) | | | (0.11 | ) | | | (0.14 | ) | | | (0.08 | ) | | | 0.35 | |
| | (1.15 | ) | | | 15.04 | | | | (0.79 | ) | | | 8.19 | | | | 6.90 | |
| | (1.43 | ) | | | 14.93 | | | | (0.93 | ) | | | 8.11 | | | | 7.25 | |
| | | | | | | | | | | | | | | | | | | |
| | | | | | | | | | | | | | | | | | | |
| | — | | | | — | | | | — | | | | (0.05 | ) | | | — | |
| | (0.01 | ) | | | — | | | | (0.14 | ) | | | (5.32 | ) | | | (1.07 | ) |
| | (0.01 | ) | | | — | | | | (0.14 | ) | | | (5.37 | ) | | | (1.07 | ) |
| $ | 85.66 | | | $ | 87.10 | | | $ | 72.17 | | | $ | 73.24 | | | $ | 70.50 | |
| | | | | | | | | | | | | | | | | | | |
| | (1.65 | )% | | | 20.69 | % | | | (1.27 | )% | | | 12.23 | % | | | 11.40 | % |
| | | | | | | | | | | | | | | | | | | |
| | | | | | | | | | | | | | | | | | | |
| $ | 811.96 | | | $ | 1,057.32 | | | $ | 765.82 | | | $ | 520.06 | | | $ | 283.31 | |
| | 1.09 | % | | | 1.10 | % | | | 1.10 | % | | | 1.11 | % | | | 1.10 | % |
| | (0.34 | )% | | | (0.13 | )% | | | (0.28 | )% | | | (0.19 | )% | | | 0.59 | % |
| | 13 | % | | | 5 | % | | | 2 | % | | | 4 | % | | | 18 | % |
The accompanying notes are an integral part of these financial statements.
| HENNESSY FUNDS | 1-800-966-4354 | |
Financial Statements
Notes to the Financial Statements October 31, 2018 |
1). ORGANIZATION
The Hennessy Focus Fund (the “Fund”) is a series of Hennessy Funds Trust (the “Trust”), which was organized as a Delaware statutory trust on September 17, 1992. The Fund is an open-end management investment company registered under the Investment Company Act of 1940, as amended. The investment objective of the Fund is capital appreciation. The Fund is a non-diversified fund.
The Fund offers Investor Class and Institutional Class shares. Each class of shares differs principally in its respective 12b-1 distribution and service, shareholder servicing, and sub-transfer agent expenses. There are no sales charges. Each class has identical rights to earnings, assets, and voting privileges, except for class-specific expenses and exclusive rights to vote on matters affecting only an individual class.
As an investment company, the Fund follows the investment company accounting and reporting guidance of the Financial Accounting Standards Board (“FASB”) Accounting Standard Codification Topic 946 “Financial Services—Investment Companies.”
2). SIGNIFICANT ACCOUNTING POLICIES
The following is a summary of significant accounting policies consistently followed by the Fund in the preparation of the financial statements. These policies conform to U.S. generally accepted accounting principles (“GAAP”).
| a). | Securities Valuation – All investments in securities are recorded at their estimated fair value, as described in Note 3. |
| | |
| b). | Federal Income Taxes – No provision for federal income taxes or excise taxes has been made because the Fund has elected to be taxed as a regulated investment company and intends to distribute substantially all of its taxable income to its shareholders and otherwise comply with the provisions of the Internal Revenue Code of 1986, as amended, applicable to regulated investment companies. Net investment income/loss and realized gains/losses for federal income tax purposes may differ from those reported in the financial statements because of temporary book and tax basis differences. Temporary differences are primarily the result of the treatment of wash sales for tax reporting purposes. The Fund recognizes interest and penalties related to income tax benefits, if any, in the Statement of Operations as an income tax expense. Distributions from net realized gains for book purposes may include short-term capital gains, which are included as ordinary income to shareholders for tax purposes. The Fund may utilize equalization accounting for tax purposes and designate earnings and profits, including net realized gains distributed to shareholders on redemption of shares, as part of the dividends paid deduction for income tax purposes. |
| | |
| | Due to inherent differences in the recognition of income, expenses, and realized gains/losses under GAAP and federal income tax regulations, permanent differences between book and tax basis for reporting for fiscal year 2018 have been identified and appropriately reclassified in the Statement of Assets and Liabilities. The adjustments are as follows: |
| Total | |
| Distributable | |
Earnings | Capital Stock |
| $(10,636,072) | $10,636,072 |
| NOTES TO THE FINANCIAL STATEMENTS |
| c). | Accounting for Uncertainty in Income Taxes – The Fund has accounting policies regarding recognition and measurement of tax positions taken or expected to be taken on a tax return. The tax returns of the Fund for the prior three fiscal years are open for examination. The Fund has reviewed all open tax years in major jurisdictions and concluded that there is no impact on the Fund’s net assets and no tax liability resulting from unrecognized tax benefits relating to uncertain income tax positions taken or expected to be taken on a tax return. The Fund’s major tax jurisdictions are U.S. federal and Delaware. |
| | |
| d). | Income and Expenses – Dividend income is recognized on the ex-dividend date or as soon as information is available to the Fund. Interest income, which includes the amortization of premium and accretion of discount, is recognized on an accrual basis. Other non-cash dividends are recognized as investment income at the fair value of the property received. The Fund is charged for those expenses that are directly attributable to its portfolio, such as advisory, administration, and certain shareholder service fees. Income, expenses (other than expenses attributable to a specific class), and realized and unrealized gains/losses on investments are allocated to each class of shares based on such class’s net assets. |
| | |
| e). | Distributions to Shareholders – Dividends from net investment income for the Fund, if any, are declared and paid annually, usually in December. Distributions of net realized capital gains, if any, are declared and paid annually, usually in December. |
| | |
| f). | Security Transactions – Investment and shareholder transactions are recorded on the trade date. The Fund determines the realized gain/loss from an investment transaction by comparing the original cost of the security lot sold with the net sale proceeds. Discounts and premiums on securities purchased are accreted or amortized, respectively, over the life of each such security. |
| | |
| g). | Use of Estimates – The preparation of financial statements in conformity with GAAP requires management to make estimates and assumptions that affect the reported amounts of assets and liabilities and disclosure of contingent assets and liabilities at the date of the financial statements and the reported change in net assets during the reporting period. Actual results could differ from those estimates. |
| | |
| h). | Share Valuation – The net asset value (“NAV”) per share of the Fund is calculated by dividing (i) the total value of the securities held by the Fund, plus cash and other assets, minus all liabilities (including estimated accrued expenses) by (ii) the total number of shares outstanding for the Fund, rounded to the nearest cent. The Fund’s shares will not be priced on days the New York Stock Exchange is closed for trading. The offering and redemption price per share for the Fund is equal to the Fund’s NAV per share. |
| | |
| i). | New Accounting Pronouncements – In August 2018, the FASB issued Accounting Standards Update No. 2018-13 “Disclosure Framework—Changes to the Disclosure Requirements for Fair Value Measurement” (“ASU 2018-13”). ASU 2018-13 eliminates the requirement to disclose the amount of and reasons for transfers between Level 1 and Level 2 of the fair value hierarchy, the timing of transfers between levels of the fair value hierarchy, and the valuation processes for Level 3 fair value measurements. ASU 2018-13 does not eliminate the requirement to disclose the range and weighted average used to develop significant unobservable inputs for Level 3 fair value measurements, and the changes in unrealized gains and losses for recurring Level 3 fair value measurements. ASU 2018-13 requires that information is provided about the measurement uncertainty of Level 3 fair value measurements as of the reporting date. The guidance is effective for fiscal years beginning after December 15, 2019, and interim periods within those fiscal years. Management has |
| HENNESSY FUNDS | 1-800-966-4354 | |
| | evaluated the impact of this change in guidance, and due to the permissibility of early adoption, modified the Fund’s fair value disclosures for the current reporting period. |
| | |
| j). | New Rule Issuances – In August 2018, the Securities and Exchange Commission issued Final Rule Release No. 33 10532, Disclosure Update and Simplification, which in part amends certain financial statement disclosure requirements of Regulation S-X that have become redundant, duplicative, overlapping, outdated, or superseded, in light of other Commission disclosure requirements, GAAP, or changes in the information environment. The amendments are intended to facilitate the disclosure of information to investors and simplify compliance without significantly altering the total mix of information provided to investors. The amendments to Rule 6-04.17 of Regulation S-X (balance sheet) were amended to require presentation of the total, rather than the components of net assets, of distributable earnings on the balance sheet. Consistent with GAAP, funds will be required to disclose total distributable earnings. The amendments to Rule 6-09 of Regulation S-X (statement of changes in net assets) omit the requirement to separately state the sources of distributions paid as well as omit the requirement to parenthetically state the book basis amount of undistributed net investment income. Instead, consistent with GAAP, funds will be required to disclose the total amount of distributions paid, except that any tax return of capital must be separately disclosed. The requirements of the Final Rule Release are effective November 5, 2018 and the Fund’s Statement of Assets and Liabilities and the Statement of Changes in Net Assets for the current and prior reporting period have been modified accordingly. |
3). SECURITIES VALUATION
The Fund follows fair valuation accounting standards that establish an authoritative definition of fair value and set out a hierarchy for measuring fair value. These standards require additional disclosures about the various inputs and valuation techniques used to develop the measurements of fair value and a discussion of changes in valuation techniques and related inputs during the period. These inputs are summarized in the three broad levels listed below:
| | Level 1 – | Unadjusted, quoted prices in active markets for identical instruments that the Fund has the ability to access at the date of measurement. |
| | | |
| | Level 2 – | Other significant observable inputs (including, but not limited to, quoted prices in active markets for similar instruments, quoted prices in markets that are not active for identical or similar instruments, and model-derived valuations in which all significant inputs and significant value drivers are observable in active markets, such as interest rates, prepayment speeds, credit risk curves, default rates, and similar data). |
| | | |
| | Level 3 – | Significant unobservable inputs (including the Fund’s own assumptions about what market participants would use to price the asset or liability based on the best available information) when observable inputs are unavailable. |
Following is a description of the valuation techniques applied to the Fund’s major categories of assets and liabilities measured at fair value on a recurring basis.
Equity Securities – Equity securities, including common stocks, preferred stocks, foreign-issued common stocks, exchange-traded funds, closed-end mutual funds, partnerships, rights, and real estate investment trusts, that are traded on a securities exchange for which a last-quoted sales price is readily available will generally be valued at the last sales price as reported by the primary exchange on which the securities are listed. Securities listed on The NASDAQ Stock Market (“NASDAQ”)
| NOTES TO THE FINANCIAL STATEMENTS |
| | will generally be valued at the NASDAQ Official Closing Price, which may differ from the last sales price reported. Securities traded on a securities exchange for which a last-quoted sales price is not readily available will generally be valued at the mean between the bid and ask prices. To the extent these securities are actively traded and valuation adjustments are not applied, they are classified in Level 1 of the fair value hierarchy. Securities traded on foreign exchanges generally are not valued at the same time the Fund calculates its NAV because most foreign markets close well before such time. The earlier close of most foreign markets gives rise to the possibility that significant events, including broad market moves, may have occurred in the interim. In certain circumstances, it may be determined that a foreign security needs to be fair valued because it appears that the value of the security might have been materially affected by events occurring after the close of the market in which the security is principally traded, but before the time the Fund calculates its NAV, such as by a development that affects an entire market or region (e.g., a weather-related event) or a potentially global development (e.g., a terrorist attack that may be expected to have an effect on investor expectations worldwide). |
| | |
| | Registered Investment Companies – Investments in open-end registered investment companies, commonly referred to as mutual funds, are generally priced at the ending NAV provided by the applicable mutual fund’s service agent and will be classified in Level 1 of the fair value hierarchy. |
| | |
| | Debt Securities – Debt securities, including corporate bonds, asset-backed securities, mortgage-backed securities, municipal bonds, U.S. Treasuries, and U.S. government agency issues, are generally valued at market on the basis of valuations furnished by an independent pricing service that utilizes both dealer-supplied valuations and formula-based techniques. The pricing service may consider recently executed transactions in securities of the issuer or comparable issuers, market price quotations (where observable), bond spreads, and fundamental data relating to the issuer. In addition, the model may incorporate observable market data, such as reported sales of similar securities, broker quotes, yields, bids, offers, and reference data. Certain securities are valued primarily using dealer quotations. These securities are generally classified in Level 2 of the fair value hierarchy. |
| | |
| | Short-Term Securities – Short-term equity investments, including money market funds, are valued in the manner specified above. Short-term debt investments with an original term to maturity of 60 days or less are valued at amortized cost, which approximates fair market value. If the original term to maturity of a short-term debt investment exceeded 60 days, then the values as of the 61st day prior to maturity are amortized. Amortized cost is not used if its use would be inappropriate due to credit or other impairments of the issuer, in which case the security’s fair value would be determined, as described below. Short-term securities are generally classified in Level 1 or Level 2 of the fair market hierarchy depending on the inputs used and market activity levels for specific securities. |
The Board of Trustees of the Fund (the “Board”) has adopted fair value pricing procedures that are followed when a price for a security is not readily available or if a significant event has occurred that indicates the closing price of a security no longer represents the true value of that security. Fair value pricing determinations are made in good faith in accordance with these procedures. There are numerous criteria that will be given consideration in determining a fair value of a security, such as the trading volume of a security and markets, the values of other similar securities, and news events with direct bearing on a security or markets. Fair value pricing results in an estimated price for a
| HENNESSY FUNDS | 1-800-966-4354 | |
security that reflects the amount the Fund might reasonably expect to receive in a current sale. Depending on the relative significance of the valuation inputs, these securities may be classified in either Level 2 or Level 3 of the fair value hierarchy.
The fair valuation of foreign securities may be determined with the assistance of a pricing service using correlations between the movement of prices of such securities and indices of domestic securities and other appropriate indicators, such as closing market prices of relevant American Depositary Receipts or futures contracts. The effect of using fair value pricing is that the Fund’s NAV will reflect the affected portfolio securities’ values as determined by the Board or its designee, pursuant to the fair value pricing procedures adopted by the Board, instead of being determined by the market. Using a fair value pricing methodology to price a foreign security may result in a value that is different from such foreign security’s most recent closing price and from the value used by other investment companies to calculate their NAVs. Such securities are generally classified in Level 2 of the fair valuation hierarchy. Because the Fund may invest in foreign securities, the value of the Fund’s portfolio securities may change on days when you will not be able to purchase or redeem your shares.
The Board has delegated day-to-day valuation matters to a Valuation Committee comprised of one or more representatives from Hennessy Advisors, Inc., the Fund’s investment advisor (the “Advisor”). The function of the Valuation Committee is to value securities where current and reliable market quotations are not readily available. All actions taken by the Valuation Committee are reviewed by the Board.
The Fund has performed an analysis of all existing investments to determine the significance and character of all inputs to their fair value determinations. Various inputs are used to determine the value of the Fund’s investments. The inputs or methodology used for valuing securities are not necessarily an indication of the risk associated with investing in those securities. Details related to the fair valuation hierarchy of the Fund’s securities as of October 31, 2018, are included in the Schedule of Investments.
4). INVESTMENT TRANSACTIONS
Purchases and sales of investment securities (excluding government and short-term investments) for the Fund during fiscal year 2018 were $318,736,284 and $811,569,966, respectively.
There were no purchases or sales/maturities of long-term U.S. government securities for the Fund during fiscal year 2018.
The Fund is permitted to purchase or sell securities from or to another fund in the Hennessy Funds family of funds (the “Hennessy Funds”) under specified conditions outlined in procedures adopted by the Board. The procedures have been designed to ensure that any purchase or sale of securities by the Fund from or to another Hennessy Fund complies with Rule 17a-7 of the Investment Company Act of 1940, as amended. During fiscal year 2018, the Fund did not engage in purchases or sales of securities pursuant to Rule 17a-7 of the Investment Company Act of 1940, as amended.
5). INVESTMENT ADVISORY FEE AND OTHER TRANSACTIONS WITH AFFILIATES
The Advisor provides the Fund with investment advisory services under an Investment Advisory Agreement. The Advisor oversees the provision of investment advice and furnishes office space and facilities, as well as most of the personnel needed by the Fund. As compensation for its services, the Advisor is entitled to a monthly fee from the Fund. The fee is based upon the average daily net assets of the Fund at an annual rate of 0.90%. The net investment advisory fees expensed by the Fund during fiscal year 2018 are included in the Statement of Operations.
| NOTES TO THE FINANCIAL STATEMENTS |
The Advisor has delegated the day-to-day management of the Fund to a sub-advisor, Broad Run Investment Management, LLC. The Advisor pays the sub-advisory fees from its own assets, and these fees are not an additional expense of the Fund. For the most recent fiscal year, the Advisor (not the Fund) paid a sub-advisory fee, based upon the daily net assets of the Fund, at a rate of 0.29%.
The Board has approved a Shareholder Servicing Agreement for Investor Class shares of the Fund, which was instituted to compensate the Advisor for the non-investment advisory services it provides to the Fund. The Shareholder Servicing Agreement provides for a monthly fee paid to the Advisor at an annual rate of 0.10% of the average daily net assets of the Fund attributable to Investor Class shares. The shareholder service fees expensed by the Fund during fiscal year 2018 are included in the Statement of Operations.
The Fund has adopted a plan pursuant to Rule 12b-1 under the Investment Company Act of 1940, as amended, that authorizes payments in connection with the distribution of the Fund’s shares at an annual rate of up to 0.25% of the Fund’s average daily net assets attributable to Investor Class shares. Even though the authorized rate is up to 0.25%, the Fund is currently only using up to 0.15% of its average daily net assets attributable to Investor Class shares for such purpose. Amounts paid under the plan may be spent on any activities or expenses primarily intended to result in the sale of shares, including, but not limited to, advertising, shareholder account servicing, printing and mailing of prospectuses to other than current shareholders, printing and mailing of sales literature, and compensation for sales and marketing activities or to financial institutions and others, such as dealers and distributors. The distribution fees expensed by the Fund during fiscal year 2018 are included in the Statement of Operations.
The Fund has entered into agreements with various brokers, dealers, and financial intermediaries in connection with the sale of shares of the Fund. The agreements provide for periodic payments by the Fund to the brokers, dealers, and financial intermediaries for providing certain shareholder maintenance services (sub-transfer agent expenses). These shareholder services include the pre-processing and quality control of new accounts, shareholder correspondence, answering customer inquiries regarding account status, and facilitating shareholder telephone transactions. The sub-transfer agent fees expensed by the Fund during fiscal year 2018 are included in the Statement of Operations.
U.S. Bancorp Fund Services, LLC, d/b/a U.S. Bank Global Fund Services (“Fund Services”) provides the Fund with administrative, fund accounting, and transfer agent services. As administrator, Fund Services is responsible for activities such as (i) preparing various federal and state regulatory filings, reports, and returns for the Fund, (ii) preparing reports and materials to be supplied to the Board, (iii) monitoring the activities of the Fund’s custodian, transfer agent, and accountants, and (iv) coordinating the preparation and payment of the Fund’s expenses and reviewing the Fund’s expense accruals. U.S. Bank N.A., an affiliate of Fund Services, serves as the Fund’s custodian. The servicing agreements between the Trust and Fund Services and U.S. Bank N.A. contain a fee schedule that is inclusive of administrative, fund accounting, custody, and transfer agent fees. The administrative, fund accounting, custody, and transfer agent fees expensed by the Fund during fiscal year 2018 are included in the Statement of Operations.
Quasar Distributors, LLC acts as the Fund’s principal underwriter in a continuous public offering of the Fund’s shares. Quasar Distributors, LLC is an affiliate of Fund Services and U.S. Bank N.A.
The officers of the Fund are affiliated with the Advisor. Such officers, with the exception of the Chief Compliance Officer and the Senior Compliance Officer, receive no compensation from the Fund for serving in their respective roles. The Fund, along with
| HENNESSY FUNDS | 1-800-966-4354 | |
the other Hennessy Funds, makes reimbursement payments, on an equal basis, to the Advisor for a portion of the salary and benefits associated with the office of the Chief Compliance Officer and for all of the salary and benefits associated with the office of the Senior Compliance Officer. The compliance fees expensed by the Fund during fiscal year 2018 are included in the Statement of Operations.
6). GUARANTEES AND INDEMNIFICATIONS
Under the Hennessy Funds’ organizational documents, their officers and trustees are indemnified by the Hennessy Funds against certain liabilities arising out of the performance of their duties to the Hennessy Funds. Additionally, in the normal course of business, the Hennessy Funds enter into contracts with service providers that contain general indemnification clauses. The Fund’s maximum exposure under these arrangements is unknown as this would involve future claims that may be made against the Fund that have not yet occurred. Currently, the Fund expects the risk of loss to be remote.
7). LINE OF CREDIT
The Fund has an uncommitted line of credit with the other Hennessy Funds in the amount of the lesser of (i) $100,000,000 or (ii) 33.33% of each Hennessy Fund’s net assets, or 30% for the Hennessy Gas Utility Fund and 10% for the Hennessy Balanced Fund, intended to provide short-term financing, if necessary, subject to certain restrictions, in connection with shareholder redemptions. The credit facility is with the Hennessy Funds’ custodian bank, U.S. Bank N.A. Borrowings under this arrangement bear interest at the bank’s prime rate and are secured by all of the Fund’s assets (as to its own borrowings only). During fiscal year 2018 the Fund had an outstanding average daily balance and a weighted average interest rate of $12,688 and 5.00%, respectively. The interest expensed by the Fund during fiscal year 2018 is included in the Statement of Operations. The maximum amount outstanding for the Fund during fiscal year 2018 was $4,631,000. As of October 31, 2018, the Fund did not have any borrowings outstanding under the line of credit.
8). FEDERAL TAX INFORMATION
As of October 31, 2018, the components of accumulated earnings (losses) for income tax purposes were as follows:
| | | | Investments | |
| | Cost of investments for tax purposes | | $ | 1,243,738,586 | |
| | Gross tax unrealized appreciation | | $ | 998,259,530 | |
| | Gross tax unrealized depreciation | | | (88,405,919 | ) |
| | Net tax unrealized appreciation/(depreciation) | | $ | 909,853,611 | |
| | Undistributed ordinary income | | $ | — | |
| | Undistributed long-term capital gains | | | 351,447,441 | |
| | Total distributable earnings | | $ | 351,447,441 | |
| | Other accumulated gain/(loss) | | $ | (13,306,360 | ) |
| | Total accumulated gain/(loss) | | $ | 1,247,994,692 | |
As of October 31, 2018, the Fund had no tax basis capital losses to offset future capital gains.
As of October 31, 2018, the Fund deferred, on a tax basis, a late-year ordinary loss of $13,306,360. Late-year ordinary losses are net ordinary losses incurred after December 31, 2017, but within the taxable year, that are deemed to arise on the first day of the Fund’s next taxable year.
| NOTES TO THE FINANCIAL STATEMENTS |
During fiscal year 2018 and fiscal year 2017, the tax character of distributions paid by the Fund was as follows:
| | | | Year Ended | | | Year Ended | |
| | | | October 31, 2018 | | | October 31, 2017 | |
| | Ordinary income | | $ | — | | | $ | — | |
| | Long-term capital gain | | | 171,116 | | | | — | |
| | | | $ | 171,116 | | | $ | — | |
9). EVENTS SUBSEQUENT TO YEAR END
Management has evaluated the Fund’s related events and transactions that occurred subsequent to October 31, 2018, through the date of issuance of the Fund’s financial statements. Other than as disclosed below, management has determined that there were no subsequent events requiring recognition or disclosure in the financial statements.
On December 7, 2018, capital gains were declared and paid to shareholders of record on December 6, 2018, as follows:
| | | Long-term |
| | Investor Class | $14.47031 |
| | Institutional Class | $14.98779 |
| HENNESSY FUNDS | 1-800-966-4354 | |
Report of Independent Registered Public
Accounting Firm
To the Board of Trustees of Hennessy Funds Trust
and the shareholders of Hennessy Focus Fund
Novato, CA
Opinion on the Financial Statements
We have audited the accompanying statement of assets and liabilities of Hennessy Focus Fund (the “Fund”), a series of Hennessy Funds Trust, including the schedule of investments, as of October 31, 2018, the related statement of operations for the year then ended, the statements of changes in net assets for each of the two years in the period then ended, financial highlights for each of the five years in the period then ended, and the related notes (collectively referred to as the “financial statements”). In our opinion, the financial statements present fairly, in all material respects, the financial position of the Fund as of October 31, 2018, the results of its operations for the year then ended, the changes in its net assets for each of the two years in the period then ended, and the financial highlights for each of the five years in the period then ended, in conformity with accounting principles generally accepted in the United States of America.
Basis for Opinion
These financial statements are the responsibility of the Fund’s management. Our responsibility is to express an opinion on the Fund’s financial statements based on our audits. We are a public accounting firm registered with the Public Company Accounting Oversight Board (United States) (“PCAOB”) and are required to be independent with respect to the Fund in accordance with the U.S. federal securities laws and the applicable rules and regulations of the Securities and Exchange Commission and the PCAOB. We have served as the auditor of one or more of the funds in the Trust since 2002.
We conducted our audits in accordance with the standards of the PCAOB. Those standards require that we plan and perform the audit to obtain reasonable assurance about whether the financial statements are free of material misstatement, whether due to error or fraud. The Fund is not required to have, nor were we engaged to perform, an audit of its internal control over financial reporting. As part of our audits we are required to obtain an understanding of internal control over financial reporting, but not for the purpose of expressing an opinion on the effectiveness of the Fund’s internal control over financial reporting. Accordingly, we express no such opinion.
Our audits included performing procedures to assess the risks of material misstatement of the financial statements, whether due to error or fraud, and performing procedures that respond to those risks. Such procedures included examining, on a test basis, evidence regarding the amounts and disclosures in the financial statements. Our audits also included evaluating the accounting principles used and significant estimates made by management, as well as evaluating the overall presentation of the financial statements. Our procedures included confirmation of securities owned as of October 31, 2018 by correspondence with the custodian. We believe that our audits provide a reasonable basis for our opinion.
TAIT, WELLER & BAKER LLP
Philadelphia, Pennsylvania
December 27, 2018
| REPORT OF INDEPENDENT REGISTERED PUBLIC ACCOUNTING FIRM/TRUSTEES AND OFFICERS |
Trustees and Officers of the Fund (Unaudited)
The business and affairs of the Funds are managed under the direction of the Board of Trustees of the Trust, and the Board of Trustees elects the Officers of the Trust. Beginning in March 2015, the Board of Trustees has from time to time appointed advisers to the Board of Trustees (“Advisers”) with the intention of having qualified individuals serve in an advisory capacity in order to garner experience in the mutual fund and asset management industry and be considered as potential Trustees in the future. There are currently three Advisers: Brian Alexander, Doug Franklin, and Claire Knoles. As Advisers, Mr. Alexander, Mr. Franklin, and Ms. Knoles attend meetings of the Board of Trustees and act as non-voting participants. Information pertaining to the Trustees, Advisers, and the Officers of the Trust is set forth below. The Trustees and Officers serve until their successors are duly elected and qualified or until their earlier death, resignation, or removal. Each Trustee oversees the 16 Hennessy Funds. Unless otherwise indicated, the address of all persons listed below is 7250 Redwood Boulevard, Suite 200, Novato, CA 94945. The Fund’s Statement of Additional Information includes more information about the persons listed below and is available, without charge, upon request by calling 1-800-966-4354.
| | | | Other |
| | | | Directorships |
| | | | Held Outside |
| Name, (Year of Birth), | | | of Fund |
| and Position Held | Start Date | Principal Occupation(s) | Complex During |
with the Trust | of Service | During Past Five Years | Past Five Years(1) |
| | |
| Disinterested Trustees and Advisers | |
| | | | |
| J. Dennis DeSousa | January 1996 | Mr. DeSousa is a real estate investor. | None. |
| (1936) | | | |
| Trustee | | | |
| | | | |
| Robert T. Doyle | January 1996 | Mr. Doyle has been the Sheriff of | None. |
| (1947) | | Marin County, California since 1996. | |
| Trustee | | | |
| | | | |
| Gerald P. Richardson | May 2004 | Mr. Richardson is an independent | None. |
| (1945) | | consultant in the securities industry. | |
| Trustee | | | |
| | | | |
| Brian Alexander | March 2015 | Mr. Alexander has worked for the | None. |
| (1981) | | Sutter Health organization since | |
| Adviser to the Board | | 2011 in various positions. He has | |
| | | served as the Chief Executive Officer | |
| | | of the Sutter Roseville Medical | |
| | | Center since 2018. From 2016 through | |
| | | 2018, he served as the Vice President | |
| | | of Strategy for the Sutter Health Valley | |
| | | Area, which includes 11 hospitals, | |
| | | 13 ambulatory surgery centers, | |
| | | 16,000 employees, and 1,900 physicians. | |
| | | From 2013 through 2016, Mr. Alexander | |
| | | served as Sutter Novato Community | |
| | | Hospital’s Chief Administrative Officer, | |
| | | and from 2011 through 2012, he | |
| | | served as a Director of Strategy | |
| | | within Sutter’s West Bay Region. | |
| HENNESSY FUNDS | 1-800-966-4354 | |
| | | | Other |
| | | | Directorships |
| | | | Held Outside |
| Name, (Year of Birth), | | | of Fund |
| and Position Held | Start Date | Principal Occupation(s) | Complex During |
with the Trust | of Service | During Past Five Years | Past Five Years(1) |
| | | | |
| Doug Franklin | March 2016 | Mr. Franklin is a retired insurance | None. |
| (1964) | | industry executive. From 1987 | |
| Adviser to the Board | | through 2015, he was employed | |
| | | by the Allianz-Fireman’s Fund | |
| | | Insurance Company in various | |
| | | positions, including as its Chief | |
| | | Actuary and Chief Risk Officer. | |
| | | | |
| Claire Knoles | December 2015 | Ms. Knoles is a founder of Kiosk and | None. |
| (1974) | | has served as its Chief Operating | |
| Adviser to the Board | | Officer since 2004. Kiosk is a full | |
| | | service marketing agency with | |
| | | offices in the San Francisco Bay | |
| | | Area, Toronto, and Liverpool, UK. | |
| | | | |
Interested Trustee(2) | | | |
| | | | |
| Neil J. Hennessy | January 1996 as | Mr. Neil Hennessy has been employed | Hennessy |
| (1956) | a Trustee and | by Hennessy Advisors, Inc. since | Advisors, Inc. |
| Trustee, Chairman of | June 2008 as | 1989 and currently serves as its | |
| the Board, Chief | an Officer | Chairman and Chief Executive Officer. | |
| Investment Officer, | | | |
| Portfolio Manager, | | | |
| and President | | | |
| Name, (Year of Birth), | | |
| and Position Held | Start Date | Principal Occupation(s) |
with the Trust | of Service | During Past Five Years |
| Officers | | |
| | | |
| Teresa M. Nilsen | January 1996 | Ms. Nilsen has been employed by Hennessy Advisors, Inc. |
| (1966) | | since 1989 and currently serves as its President, Chief Operating |
| Executive Vice President | | Officer, and Secretary. |
| and Treasurer | | |
| | | |
| Daniel B. Steadman | March 2000 | Mr. Steadman has been employed by Hennessy Advisors, Inc. |
| (1956) | | since 2000 and currently serves as its Executive Vice President. |
| Executive Vice President | | |
| and Secretary | | |
| | | |
| Brian Carlson | December 2013 | Mr. Carlson has been employed by Hennessy Advisors, Inc. |
| (1972) | | since December 2013 and currently serves as its Chief |
| Senior Vice President | | Compliance Officer and Senior Vice President. |
| and Head of Distribution | | |
| | | |
| Jennifer Cheskiewicz | June 2013 | Ms. Cheskiewicz has been employed by Hennessy Advisors, Inc. |
(1977)(3) | | as its General Counsel since June 2013. |
| Senior Vice President and | | |
| Chief Compliance Officer | | |
| TRUSTEES AND OFFICERS OF THE FUND |
| Name, (Year of Birth), | | |
| and Position Held | Start Date | Principal Occupation(s) |
with the Trust | of Service | During Past Five Years |
| David Ellison | October 2012 | Mr. Ellison has been employed by Hennessy Advisors, Inc. since |
(1958)(4) | | October 2012. He has served as a Portfolio Manager of the |
| Senior Vice President | | Hennessy Large Cap Financial Fund and the Hennessy Small |
| and Portfolio Manager | | Cap Financial Fund since inception. Mr. Ellison also served as a |
| | | Portfolio Manager of the Hennessy Technology Fund from its |
| | | inception until February 2017. Mr. Ellison served as Director, |
| | | CIO and President of FBR Fund Advisers, Inc. from December |
| | | 1999 to October 2012. |
| | | |
| Ryan C. Kelley | March 2013 | Mr. Kelley has been employed by Hennessy Advisors, Inc. since |
(1972)(5) | | October 2012. He has served as a Portfolio Manager of the |
| Senior Vice President | | Hennessy Gas Utility Fund, the Hennessy Large Cap Financial |
| and Portfolio Manager | | Fund, and the Hennessy Small Cap Financial Fund since |
| | | October 2014. He served as Co-Portfolio Manager of the same |
| | | funds from March 2013 through September 2014, and as a |
| | | Portfolio Analyst for the Hennessy Funds from October 2012 |
| | | through February 2013. Mr. Kelley has also served as a Portfolio |
| | | Manager of the Hennessy Cornerstone Growth Fund, the |
| | | Hennessy Cornerstone Mid Cap 30 Fund, the Hennessy |
| | | Cornerstone Large Growth Fund, and the Hennessy |
| | | Cornerstone Value Fund since February 2017, as a Co-Portfolio |
| | | Manager of the Hennessy Technology Fund since February |
| | | 2017, and as a Portfolio Manager of the Hennessy Total Return |
| | | Fund and the Hennessy Balanced Fund since May 2018. |
| | | Mr. Kelley served as Portfolio Manager of FBR Fund Advisers, |
| | | Inc. from January 2008 to October 2012. |
| | | |
| Tania Kelley | October 2003 | Ms. Kelley has been employed by Hennessy Advisors, Inc. |
| (1965) | | since October 2003. |
| Senior Vice President | | |
| and Head of Marketing | | |
| Daniel P. Hennessy | December 2016 | Mr. Daniel Hennessy has been employed by Hennessy Advisors, |
| (1990) | | Inc. since 2015. He has served as an Associate Analyst or |
| Vice President | | Analyst of the Hennessy Technology Fund since February 2017. |
| and Analyst | | Mr. Daniel Hennessy previously served as a Mutual Fund |
| | | Specialist at U.S. Bancorp Fund Services, LLC (now doing |
| | | business as U.S. Bank Global Fund Services) from November |
| | | 2014 to July 2015. Prior to that, he attended the University of |
| | | San Diego, where he earned a degree in Political Science. |
______________
(1) | Messrs. DeSousa, Doyle, N. Hennessy, and Richardson previously served on the Board of Directors of Hennessy Mutual Funds, Inc. (“HMFI”), The Hennessy Funds, Inc. (“HFI”), and Hennessy SPARX Funds Trust (“HSFT”). Pursuant to an internal reorganization effective as of February 28, 2014, the series of HFMI, HFI, and HSFT were reorganized into corresponding series of the Trust that mirrored them. Subsequent to the reorganization, HFMI, HFI, and HSFT were dissolved. |
(2) | Mr. N. Hennessy is considered an “interested person,” as defined in the Investment Company Act of 1940, as amended, because he is an officer of the Hennessy Funds. |
(3) | The address of this officer is 4800 Bee Caves Road, Suite 100, Austin, TX 78746. |
(4) | The address of this officer is 101 Federal Street, Suite 1900, Boston, MA 02110. |
(5) | The address of this officer is 1340 Environ Way, Suite 332, Chapel Hill, NC 27517. |
| HENNESSY FUNDS | 1-800-966-4354 | |
Expense Example (Unaudited)
October 31, 2018
As a shareholder of the Fund, you incur ongoing costs, including management fees, service fees, and other Fund expenses. This Example is intended to help you understand your ongoing costs (in dollars) of investing in the Fund and to compare these costs with the ongoing costs of investing in other mutual funds. The Example is based on an investment of $1,000 invested at the beginning of the period and held for the entire period from May 1, 2018, through October 31, 2018.
Actual Expenses
The first line of the table below under the “Investor Class” and “Institutional Class” headings provides information about actual account values and actual expenses. Although the Fund charges no sales loads or transaction fees, you will be assessed fees for outgoing wire transfers, returned checks and stop payment orders at prevailing rates charged by U.S. Bank Global Fund Services, the Fund’s transfer agent. If you request that a redemption be made by wire transfer, currently a $15 fee is charged by the Fund’s transfer agent. IRA accounts will be charged a $15 annual maintenance fee. The example below includes, but is not limited to, management fees, shareholder servicing fees, fund accounting, custody, and transfer agent fees. However, the example below does not include portfolio trading commissions and related expenses, and other extraordinary expenses as determined under generally accepted accounting principles. You may use the information in this line, together with the amount you invested, to estimate the expenses that you paid over the period. Simply divide your account value by $1,000 (for example, an $8,600 account value divided by $1,000 = 8.6), then multiply the result by the number in the first line of the table under the “Investor Class” or “Institutional Class” headings in the column entitled “Expenses Paid During Period” to estimate the expenses you paid on your account during this period.
Hypothetical Example for Comparison Purposes
The second line of the table below under the “Investor Class” and “Institutional Class” headings provides information about hypothetical account values and hypothetical expenses based on the Fund’s actual expense ratios and an assumed rate of return of 5% per year before expenses, which is not the Fund’s actual return. The hypothetical account values and expenses may not be used to estimate the actual ending account balance or expenses you paid for the period. You may use this information to compare the ongoing costs of investing in the Fund and other funds. To do so, compare this 5% hypothetical example with the 5% hypothetical examples that appear in the shareholder reports of the other funds. Please note that the expenses shown in the table are meant to highlight your ongoing costs only. Therefore, the second line of the table under the “Investor Class” and “Institutional Class” headings is useful in comparing ongoing costs only, and will not help you determine the relative total costs of owning different funds.
| | | | Expenses Paid |
| | Beginning | Ending | During Period(1) |
| | Account Value | Account Value | May 1, 2018 – |
| | May 1, 2018 | October 31, 2018 | October 31, 2018 |
| Investor Class | | | |
| Actual | $1,000.00 | $ 966.20 | $7.29 |
| Hypothetical (5% return before expenses) | $1,000.00 | $1,017.80 | $7.48 |
| | | | |
| Institutional Class | | | |
| Actual | $1,000.00 | $ 968.10 | $5.41 |
| Hypothetical (5% return before expenses) | $1,000.00 | $1,019.71 | $5.55 |
(1) | Expenses are equal to the Fund’s annualized expense ratio of 1.47% for Investor Class shares or 1.09% for Institutional Class shares, as applicable, multiplied by the average account value over the period, multiplied by 184/365 days (to reflect one-half year period). |
| HENNESSY FUNDS | 1-800-966-4354 | |
How to Obtain a Copy of the Fund’s
Proxy Voting Policy and Proxy Voting Records
A description of the policies and procedures the Fund uses to determine how to vote proxies relating to portfolio securities is available without charge: (1) by calling 1-800-966-4354; (2) on the Hennessy Funds’ website at www.hennessyfunds.com/proxy-voting/voting-policy; or (3) on the U.S. Securities and Exchange Commission’s (the “SEC”) website at www.sec.gov. The Fund’s proxy voting record is available without charge on both the Hennessy Funds’ website at www.hennessyfunds.com/proxy-voting/voting-record and the SEC’s website at www.sec.gov no later than August 31 for the prior 12 months ending June 30.
Quarterly Filings on Form N-Q
The Fund files a complete schedule of portfolio holdings with the SEC for the first and third quarters of each fiscal year on Form N-Q. The Fund’s Forms N-Q are available on the SEC’s website at www.sec.gov. Information included in the Fund’s Forms N-Q will also be available upon request by calling 1-800-966-4354.
Federal Tax Distribution Information
(Unaudited)
For fiscal year 2018, certain dividends paid by the Fund may be subject to a maximum tax rate of 23.8%, as provided for by the Jobs and Growth Tax Relief Reconciliation Act of 2003. The percentage of dividends declared from ordinary income designated as qualified dividend income was 0.00%.
For corporate shareholders, the percent of ordinary income distributions that qualified for the corporate dividends received deduction for fiscal year 2018 was 0.00%.
The percentage of taxable ordinary income distributions that were designated as short-term capital gain distributions under Section 871(k)(2)(C) of the Internal Revenue Code of 1986, as amended, for the Fund was 0.00%.
Important Notice Regarding Delivery
of Shareholder Documents
To help keep the Fund’s costs as low as possible, we generally deliver a single copy of shareholder reports, proxy statements, and prospectuses to shareholders who share an address and have the same last name. This process does not apply to account statements. You may request an individual copy of a shareholder document at any time. If you would like to receive separate mailings of shareholder documents, please call U.S. Bank Global Fund Services at 1-800-261-6950 or 1-414-765-4124, and individual delivery will begin within 30 days of your request. If your account is held through a financial institution or other intermediary, please contact such intermediary directly to request individual delivery.
| PROXY VOTING — PRIVACY POLICY |
Privacy Policy
We collect the following non-public personal information about you:
| | • | information we receive from you on or in applications or other forms, correspondence, or conversations, including, but not limited to, your name, address, phone number, social security number, assets, income, and date of birth; and |
| | | |
| | • | information about your transactions with us, our affiliates, or others, including, but not limited to, your account number and balance, payment history, parties to transactions, cost basis information, and other financial information. |
We do not disclose any non-public personal information about our current or former shareholders to non-affiliated third parties, except as permitted by law. For example, we are permitted by law to disclose all of the information we collect, as described above, to our Transfer Agent to process your transactions. Furthermore, we restrict access to your non-public personal information to those persons who require such information to provide products or services to you. We maintain physical, electronic, and procedural safeguards that comply with federal standards to guard your non-public personal information.
In the event that you hold shares of the Fund through a financial intermediary, including, but not limited to, a broker-dealer, bank, or trust company, the privacy policy of your financial intermediary would govern how your non-public personal information will be shared with non-affiliated third parties.
| HENNESSY FUNDS | 1-800-966-4354 | |
(This Page Intentionally Left Blank.)
For information, questions or assistance, please call
The Hennessy Funds
1-800-966-4354 or 1-415-899-1555
INVESTMENT ADVISOR
Hennessy Advisors, Inc.
7250 Redwood Boulevard, Suite 200
Novato, California 94945
ADMINISTRATOR,
TRANSFER AGENT,
DIVIDEND PAYING AGENT, &
SHAREHOLDER SERVICING AGENT
U.S. Bancorp Fund Services, LLC
d/b/a U.S. Bank Global Fund Services
P.O. Box 701
Milwaukee, Wisconsin 53201-0701
CUSTODIAN
U.S. Bank N.A.
Custody Operations
1555 North River Center Drive, Suite 302
Milwaukee, Wisconsin 53212
TRUSTEES
Neil J. Hennessy
Robert T. Doyle
J. Dennis DeSousa
Gerald P. Richardson
COUNSEL
Foley & Lardner LLP
777 East Wisconsin Avenue
Milwaukee, Wisconsin 53202-5306
INDEPENDENT REGISTERED
PUBLIC ACCOUNTING FIRM
Tait, Weller & Baker LLP
Two Liberty Place
50 South 16th Street, Suite 2900
Philadelphia, Pennsylvania 19102-2529
DISTRIBUTOR
Quasar Distributors, LLC
777 East Wisconsin Avenue
Milwaukee, Wisconsin 53202
hennessyfunds.com | 1-800-966-4354
This report has been prepared for shareholders and may be distributed to
others only if preceded or accompanied by a current prospectus.
ANNUAL REPORT
OCTOBER 31, 2018
HENNESSY CORNERSTONE
MID CAP 30 FUND
Investor Class HFMDX
Institutional Class HIMDX
hennessyfunds.com | 1-800-966-4354
(This Page Intentionally Left Blank.)
Contents
| Letter to Shareholders | 2 |
| Performance Overview | 4 |
| Financial Statements | |
| Schedule of Investments | 7 |
| Statement of Assets and Liabilities | 11 |
| Statement of Operations | 12 |
| Statements of Changes in Net Assets | 13 |
| Financial Highlights | 14 |
| Notes to the Financial Statements | 18 |
| Report of Independent Registered Public Accounting Firm | 27 |
| Trustees and Officers of the Fund | 28 |
| Expense Example | 32 |
| Proxy Voting Policy and Proxy Voting Records | 34 |
| Quarterly Schedule of Investments | 34 |
| Federal Tax Distribution Information | 34 |
| Important Notice Regarding Delivery of Shareholder Documents | 34 |
| Privacy Policy | 35 |
| HENNESSY FUNDS | 1-800-966-4354 | |
December 2018
Dear Hennessy Funds Shareholder:
Over the past year, we have witnessed the return of market volatility. U.S. stocks still registered healthy gains, bolstered by the impact on corporate profits of the successful passage of the tax reform bill in December 2017. However, concerns over potential trade disruptions, especially between the U.S. and China, and worries over higher short-term interest rates, which many believe could possibly trigger a recession down the road, put downward pressure on equity valuations.
The U.S. economy performed well over the period, and actually achieved an acceleration in GDP growth to over 3% on an annualized basis in the second and third quarters of calendar year 2018. During the past year, companies continued to hire workers, adding over 200,000 jobs per month on average, sending the unemployment rate down to 3.7% in October, which is the lowest it has been since 1969. Consumer confidence is high and still rising, and corporate profits reached record levels in the third quarter of calendar year 2018, posting a year-over-year increase of 26% for the companies in the S&P 500 Index.
The Federal Reserve, confident about the strength of the economy and mindful of a tight labor market, raised short-term interest rates four times over the last year, by a quarter point each time. Long-term bond yields also rose, driven higher primarily by evidence of faster wage growth, pushing the U.S. 10-year Treasury bond over 3% for the first time since 2013.
As I write this, we are experiencing the market’s 20th downturn since 2010. I have been saying that every bull market experiences volatility and pullbacks. Many financial commentators think this bull market is “long in the tooth.” I do not agree with them. I believe stock valuations are still very reasonable. The prospective price to earnings multiple for the Dow Jones Industrial Average has come down from almost 20x at the end of 2017 to 16x, just above its 10-year average of 15x. The prospective PE multiple for the S&P 500 Index has also come down, from 20x to 17x, and compares favorably to its 10-year average of 16x.
Cash, meanwhile, continues to build up on corporate balance sheets. The companies in the S&P 500 Index reported a total of over $5.4 trillion in cash and marketable securities in their latest filings. Companies have been spending some of their cash, increasing their investment spending and laying the groundwork for future earnings growth. However, they have also been returning capital to shareholders. S&P 500 Index companies announced $433.6 billion in share repurchases during the second quarter of calendar year 2018, nearly doubling the previous record of $242.1 billion set in the first quarter. Companies are also raising their dividends.
In addition, I believe the Federal Reserve will take care not to raise interest rates too high or too fast and endanger the economic expansion. While wage growth has risen to over 3% in October, other measures of inflationary pressure, such as the Consumer Price Index and the Producer Price Index, still show prices increasing at a more moderate pace, closer to 2%. Given continued evidence of modest rates of inflation, I believe the Fed will be able to maintain its gradual pace of interest rate hikes.
Finally and importantly, I still see no signs of euphoria in this market. In my opinion, the enthusiasm present earlier in the year, which followed the significant reduction in corporate income tax rates, has largely evaporated, and it has been replaced with anxiety
over higher interest rates and their potential impact on growth. In the past, I have likened the current bull market to that of 1982-2000, and I still believe this comparison holds true. I am confident in the strength of the market today and believe the economy will continue to grow in the coming year, albeit at a more moderate pace.
Thank you for your continued confidence and investment in the Hennessy Funds. If you have any questions or would like to speak with us directly, please don’t hesitate to call us at (800) 966-4354.
Best regards,
Neil J. Hennessy
President and Chief Investment Officer
Past performance does not guarantee future results.
Mutual fund investing involves risk. Principal loss is possible.
Opinions expressed are those of Neil Hennessy and are subject to change, are not guaranteed, and should not be considered investment advice.
The Dow Jones Industrial Average and S&P 500 Index are commonly used to measure the performance of U.S. stocks. One cannot invest directly in an index.
PE, or price to earnings, is a valuation measure and is calculated by dividing a company’s market price per share by its earnings per share. Earnings growth is not a measure of a fund’s future performance.
| HENNESSY FUNDS | 1-800-966-4354 | |
Performance Overview (Unaudited)
CHANGE IN VALUE OF $10,000 INVESTMENT
This graph illustrates the performance of an initial investment of $10,000 made in the Fund ten years ago and assumes the reinvestment of dividends.
AVERAGE ANNUAL TOTAL RETURN FOR PERIODS ENDED OCTOBER 31, 2018
| | One | Five | Ten |
| | Year | Years | Years |
| Hennessy Cornerstone Mid Cap 30 Fund – | | | |
| Investor Class (HFMDX) | -10.54% | 6.13% | 11.41% |
| Hennessy Cornerstone Mid Cap 30 Fund – | | | |
| Institutional Class (HIMDX) | -10.22% | 6.48% | 11.79% |
Russell Midcap® Index | 2.79% | 8.97% | 14.19% |
| S&P 500 Index | 7.35% | 11.34% | 13.24% |
Expense ratios: 1.34% (Investor Class); 0.97% (Institutional Class)
Performance data quoted represents past performance; past performance does not guarantee future results. The investment return and principal value of an investment will fluctuate so that an investor’s shares, when redeemed, may be worth more or less than their original cost. The performance table does not reflect the deduction of taxes that a shareholder would pay on Fund distributions or the redemption of Fund shares. Current performance of the Fund may be lower or higher than the performance quoted. Performance data current to the most recent month end may be obtained by visiting www.hennessyfunds.com.
The Russell Midcap® Index is commonly used to measure the performance of U.S. medium-capitalization stocks. The S&P 500 Index is commonly used to measure the performance of U.S. stocks. One cannot invest directly in an index.
Frank Russell Company (“Russell”) is the source and owner of the trademarks, service marks, and copyrights related to the Russell Indexes. Russell® is a trademark of Frank Russell Company. Neither Russell nor its licensors accept any liability for any errors or omissions in the Russell Indexes or Russell ratings or underlying data and no party may rely on any Russell Indexes or Russell ratings or underlying data contained in this communication. No further distribution of Russell data is permitted without Russell’s express written consent. Russell does not promote, sponsor, or endorse the content of this communication.
The expense ratios presented are from the most recent prospectus. The expense ratios for the current reporting period are available in the Financial Highlights section of this report.
PERFORMANCE NARRATIVE
Portfolio Managers Neil J. Hennessy and Ryan C. Kelley
Performance:
For the 12-month period ended October 31, 2018, the Investor Class of the Hennessy Cornerstone Mid Cap 30 Fund returned -10.54%, underperforming both the Russell Midcap® Index (the Fund’s primary benchmark) and the S&P 500 Index, which returned 2.79% and 7.35%, respectively, for the same period.
The Fund’s underperformance relative to its primary benchmark can be attributed primarily to stock selection, particularly in the Consumer Discretionary and Industrials sectors. Recreational vehicle producers Thor Industries, Inc. and Winnebago Industries, Inc. and homebuilders KB Home and LGI Homes, Inc. were among the holdings that detracted most from relative performance in the Consumer Discretionary sector. Gaming related stocks, such as Scientific Games Corp. and Penn National Gaming, Inc., also performed poorly. In the Industrials sector, another homebuilding-related stock, Builders FirstSource, Inc. contributed negatively to the Fund’s performance. The Fund’s underperformance relative to its benchmark was offset to some degree by strong performance from positions in HollyFrontier Corp., CVR Energy, Inc., NRG Energy, Inc., and Kemper Corp.
The Fund no longer holds any of the companies mentioned with the exception of Penn National Gaming, Inc.
Portfolio Strategy:
The Fund utilizes a quantitative approach in building a concentrated portfolio of attractively valued, mid-cap growing companies whose stock prices are exhibiting strong price momentum. In essence, the strategy seeks to combine elements of both value and momentum investing by selecting 30 stocks that have relatively low price-to-sales ratios, have generated increased earnings over the past year, and have positive stock price appreciation over the past three- and six-month periods.
Investment Commentary:
We continue to believe that the outlook for mid-cap stocks is positive. The U.S. economy is growing at a healthy rate, unemployment is low, and growth in both consumption and capital spending has accelerated over the last 12 months. Corporate earnings have risen significantly over the first nine months of 2018, helped, in part, by lower taxes. We expect earnings growth to be slower next year yet remain positive, driven primarily by continued steady economic growth.
There are four primary industry groups where the Fund currently maintains significant overweight positions: Retailing, Food & Staples Retailing, Commercial & Professional Services, and Transportation. Many retailing companies have been benefiting from strong employment growth and continued increases in consumer spending and, therefore, have seen their earnings and stock prices rise over the last year. As a result, the Fund owns stocks of some of these companies, including American Eagle Outfitters, Inc., Murphy USA, Inc., and Sprouts Farmers Market, Inc. Commercial Service and Transportation companies have also been benefiting from strong economic growth and an upturn in capital spending in the United States. As a result, Insperity, Inc., Landstar System, Inc., and other holdings in the Fund from these more cyclical groups have been reporting solid growth in earnings and have seen their stock prices perform well.
| HENNESSY FUNDS | 1-800-966-4354 | |
_______________
Opinions expressed are those of the Portfolio Managers as of the date written and are subject to change, are not guaranteed, and should not be considered investment advice or an indication of trading intent.
The Fund invests in small-capitalization and medium-capitalization companies, which may have limited liquidity and greater price volatility than large-capitalization companies. The Fund’s formula-based strategy may cause the Fund to buy or sell securities at times when it may not be advantageous. Please see the Fund’s prospectus for a more complete discussion of these and other risks.
References to specific securities should not be considered a recommendation to buy or sell any security. Fund holdings and sector allocations are subject to change. Please refer to the Schedule of Investments included in this report for additional portfolio information.
Earnings growth is not a measure of the Fund’s future performance.
Price-to-sales ratio is a valuation measure calculated by dividing a company’s market price per share by its revenue per share.
| PERFORMANCE OVERVIEW/SCHEDULE OF INVESTMENTS |
Financial Statements
Schedule of Investments as of October 31, 2018 |
HENNESSY CORNERSTONE MID CAP 30 FUND
(% of Net Assets)
| TOP TEN HOLDINGS (EXCLUDING MONEY MARKET FUNDS) | % NET ASSETS |
| AES Corp. | 3.93% |
| Cleveland-Cliffs, Inc. | 3.90% |
| Casey’s General Stores, Inc. | 3.88% |
| Spirit Airlines, Inc. | 3.85% |
| Old Republic International Corp. | 3.52% |
| Crocs, Inc. | 3.51% |
| Clean Harbors, Inc. | 3.49% |
| UGI Corp. | 3.47% |
| Sprouts Farmers Market, Inc. | 3.47% |
| Booz Allen Hamilton Holding Corp. | 3.41% |
Note: For presentation purposes, the Fund has grouped some of the industry categories. For purposes of categorizing securities for compliance with Section 8(b)(1) of the Investment Company Act of 1940, as amended, the Fund uses more specific industry classifications.
The Global Industry Classification Standard (GICS®) was developed by and is the exclusive property and a service mark of MSCI, Inc. and Standard & Poor Financial Services LLC. It has been licensed for use by the Hennessy Funds.
| HENNESSY FUNDS | 1-800-966-4354 | |
| COMMON STOCKS – 96.92% | | Number | | | | | | % of | |
| | | of Shares | | | Value | | | Net Assets | |
| Consumer Discretionary – 24.51% | | | | | | | | | |
| Aaron’s, Inc. | | | 465,900 | | | $ | 21,957,867 | | | | 3.29 | % |
| American Axle & Manufacturing Holdings, Inc. (a) | | | 1,367,400 | | | | 20,743,458 | | | | 3.11 | % |
| American Eagle Outfitters, Inc. | | | 892,161 | | | | 20,573,233 | | | | 3.08 | % |
| BJ’s Restaurants, Inc. | | | 313,700 | | | | 19,192,166 | | | | 2.88 | % |
| Crocs, Inc. (a) | | | 1,139,600 | | | | 23,407,384 | | | | 3.51 | % |
| Murphy USA, Inc. (a) | | | 280,200 | | | | 22,592,526 | | | | 3.38 | % |
| Penn National Gaming, Inc. (a) | | | 701,758 | | | | 17,038,684 | | | | 2.55 | % |
| Restoration Hardware Holdings, Inc. (a) | | | 156,500 | | | | 18,108,615 | | | | 2.71 | % |
| | | | | | | | 163,613,933 | | | | 24.51 | % |
| | | | | | | | | | | | | |
| Consumer Staples – 10.58% | | | | | | | | | | | | |
| Casey’s General Stores, Inc. | | | 205,400 | | | | 25,902,994 | | | | 3.88 | % |
| Post Holdings, Inc. (a) | | | 243,442 | | | | 21,525,141 | | | | 3.23 | % |
| Sprouts Farmers Market, Inc. (a) | | | 861,700 | | | | 23,171,113 | | | | 3.47 | % |
| | | | | | | | 70,599,248 | | | | 10.58 | % |
| | | | | | | | | | | | | |
| Energy – 5.70% | | | | | | | | | | | | |
| EnLink Midstream Partners LP | | | 1,289,900 | | | | 19,554,884 | | | | 2.93 | % |
| PBF Energy, Inc. | | | 442,900 | | | | 18,535,365 | | | | 2.77 | % |
| | | | | | | | 38,090,249 | | | | 5.70 | % |
| | | | | | | | | | | | | |
| Financials – 6.89% | | | | | | | | | | | | |
| Assurant, Inc. | | | 231,700 | | | | 22,523,557 | | | | 3.37 | % |
| Old Republic International Corp. | | | 1,065,700 | | | | 23,498,685 | | | | 3.52 | % |
| | | | | | | | 46,022,242 | | | | 6.89 | % |
| | | | | | | | | | | | | |
| Health Care – 6.17% | | | | | | | | | | | | |
| Allscripts Healthcare Solutions, Inc. (a) | | | 1,626,800 | | | | 19,375,188 | | | | 2.90 | % |
| Molina Healthcare, Inc. (a) | | | 171,900 | | | | 21,791,763 | | | | 3.27 | % |
| | | | | | | | 41,166,951 | | | | 6.17 | % |
| | | | | | | | | | | | | |
| Industrials – 19.08% | | | | | | | | | | | | |
| Clean Harbors, Inc. (a) | | | 342,600 | | | | 23,310,504 | | | | 3.49 | % |
| Insperity, Inc. | | | 195,900 | | | | 21,519,615 | | | | 3.22 | % |
| Landstar System, Inc. | | | 200,400 | | | | 20,058,036 | | | | 3.00 | % |
| NOW, Inc. (a) | | | 1,403,900 | | | | 18,026,076 | | | | 2.70 | % |
| Spirit Airlines, Inc. (a) | | | 494,700 | | | | 25,674,930 | | | | 3.85 | % |
| Trinity Industries, Inc. | | | 659,000 | | | | 18,814,450 | | | | 2.82 | % |
| | | | | | | | 127,403,611 | | | | 19.08 | % |
The accompanying notes are an integral part of these financial statements.
| COMMON STOCKS | | Number | | | | | | % of | |
| | | of Shares | | | Value | | | Net Assets | |
| Information Technology – 9.56% | | | | | | | | | |
| Booz Allen Hamilton Holding Corp. | | | 460,100 | | | $ | 22,793,354 | | | | 3.41 | % |
| CACI International, Inc., Class A (a) | | | 120,300 | | | | 21,468,738 | | | | 3.22 | % |
| Conduent, Inc. (a) | | | 1,024,700 | | | | 19,571,770 | | | | 2.93 | % |
| | | | | | | | 63,833,862 | | | | 9.56 | % |
| | | | | | | | | | | | | |
| Materials – 7.03% | | | | | | | | | | | | |
| Ashland Global Holdings, Inc. | | | 282,400 | | | | 20,891,952 | | | | 3.13 | % |
| Cleveland-Cliffs, Inc. (a) | | | 2,422,700 | | | | 26,068,252 | | | | 3.90 | % |
| | | | | | | | 46,960,204 | | | | 7.03 | % |
| | | | | | | | | | | | | |
| Utilities – 7.40% | | | | | | | | | | | | |
| AES Corp. | | | 1,800,000 | | | | 26,244,000 | | | | 3.93 | % |
| UGI Corp. | | | 437,000 | | | | 23,187,220 | | | | 3.47 | % |
| | | | | | | | 49,431,220 | | | | 7.40 | % |
| Total Common Stocks | | | | | | | | | | | | |
| (Cost $708,444,037) | | | | | | | 647,121,520 | | | | 96.92 | % |
| | | | | | | | | | | | | |
| SHORT-TERM INVESTMENTS – 3.60% | | | | | | | | | | | | |
| | | | | | | | | | | | | |
| Money Market Funds – 3.60% | | | | | | | | | | | | |
| Fidelity Government Portfolio, Institutional Class, 2.06% (b) | | | 24,064,354 | | | | 24,064,354 | | | | 3.60 | % |
| | | | | | | | | | | | | |
| Total Short-Term Investments | | | | | | | | | | | | |
| (Cost $24,064,354) | | | | | | | 24,064,354 | | | | 3.60 | % |
| | | | | | | | | | | | | |
| Total Investments | | | | | | | | | | | | |
| (Cost $732,508,391) – 100.52% | | | | | | | 671,185,874 | | | | 100.52 | % |
| Liabilities in Excess of Other Assets – (0.52)% | | | | | | | (3,498,646 | ) | | | (0.52 | )% |
| | | | | | | | | | | | | |
TOTAL NET ASSETS – 100.00% | | | | | | $ | 667,687,228 | | | | 100.00 | % |
Percentages are stated as a percent of net assets.
| (a) | Non-income producing security. |
| (b) | The rate listed is the fund’s seven-day yield as of October 31, 2018. |
The accompanying notes are an integral part of these financial statements.
| HENNESSY FUNDS | 1-800-966-4354 | |
Summary of Fair Value Exposure at October 31, 2018
The following is a summary of the inputs used to value the Fund’s net assets as of October 31, 2018 (See Note 3 in the accompanying notes to the financial statements):
| Common Stocks | | Level 1 | | | Level 2 | | | Level 3 | | | Total | |
| Consumer Discretionary | | $ | 163,613,933 | | | $ | — | | | $ | — | | | $ | 163,613,933 | |
| Consumer Staples | | | 70,599,248 | | | | — | | | | — | | | | 70,599,248 | |
| Energy | | | 38,090,249 | | | | — | | | | — | | | | 38,090,249 | |
| Financials | | | 46,022,242 | | | | — | | | | — | | | | 46,022,242 | |
| Health Care | | | 41,166,951 | | | | — | | | | — | | | | 41,166,951 | |
| Industrials | | | 127,403,611 | | | | — | | | | — | | | | 127,403,611 | |
| Information Technology | | | 63,833,862 | | | | — | | | | — | | | | 63,833,862 | |
| Materials | | | 46,960,204 | | | | — | | | | — | | | | 46,960,204 | |
| Utilities | | | 49,431,220 | | | | — | | | | — | | | | 49,431,220 | |
| Total Common Stocks | | $ | 647,121,520 | | | $ | — | | | $ | — | | | $ | 647,121,520 | |
| Short-Term Investments | | | | | | | | | | | | | | | | |
| Money Market Funds | | $ | 24,064,354 | | | $ | — | | | $ | — | | | $ | 24,064,354 | |
| Total Short-Term Investments | | $ | 24,064,354 | | | $ | — | | | $ | — | | | $ | 24,064,354 | |
| Total Investments | | $ | 671,185,874 | | | $ | — | | | $ | — | | | $ | 671,185,874 | |
The accompanying notes are an integral part of these financial statements.
| SCHEDULE OF INVESTMENTS/STATEMENT OF ASSETS AND LIABILITIES |
Financial Statements
Statement of Assets and Liabilities as of October 31, 2018 |
| ASSETS: | | | |
| Investments in securities, at value (cost $732,508,391) | | $ | 671,185,874 | |
| Dividends and interest receivable | | | 332,885 | |
| Receivable for fund shares sold | | | 108,579 | |
| Return of capital receivable | | | 503,061 | |
| Prepaid expenses and other assets | | | 43,059 | |
| Total Assets | | | 672,173,458 | |
| | | | | |
| LIABILITIES: | | | | |
| Payable for fund shares redeemed | | | 3,683,772 | |
| Payable to advisor | | | 464,484 | |
| Payable to administrator | | | 68,418 | |
| Payable to auditor | | | 21,900 | |
| Accrued distribution fees | | | 74,050 | |
| Accrued service fees | | | 30,659 | |
| Accrued interest payable | | | 2,600 | |
| Accrued trustees fees | | | 5,962 | |
| Accrued expenses and other payables | | | 134,385 | |
| Total Liabilities | | | 4,486,230 | |
| NET ASSETS | | $ | 667,687,228 | |
| | | | | |
| NET ASSETS CONSIST OF: | | | | |
| Capital stock | | $ | 573,353,708 | |
| Total distributable earnings | | | 94,333,520 | |
| Total Net Assets | | $ | 667,687,228 | |
| | | | | |
| NET ASSETS | | | | |
| Investor Class: | | | | |
| Shares authorized (no par value) | | Unlimited | |
| Net assets applicable to outstanding Investor Class shares | | $ | 338,386,287 | |
| Shares issued and outstanding | | | 20,058,687 | |
| Net asset value, offering price and redemption price per share | | $ | 16.87 | |
| | | | | |
| Institutional Class: | | | | |
| Shares authorized (no par value) | | Unlimited | |
| Net assets applicable to outstanding Institutional Class shares | | $ | 329,300,941 | |
| Shares issued and outstanding | | | 18,950,436 | |
| Net asset value, offering price and redemption price per share | | $ | 17.38 | |
The accompanying notes are an integral part of these financial statements.
| HENNESSY FUNDS | 1-800-966-4354 | |
Financial Statements
Statement of Operations for the year ended October 31, 2018 |
| INVESTMENT INCOME: | | | |
| Dividend income | | $ | 8,063,454 | |
| Interest income | | | 335,638 | |
| Total investment income | | | 8,399,092 | |
| | | | | |
| EXPENSES: | | | | |
| Investment advisory fees (See Note 5) | | | 7,413,487 | |
| Sub-transfer agent expenses – Investor Class (See Note 5) | | | 900,533 | |
| Sub-transfer agent expenses – Institutional Class (See Note 5) | | | 504,826 | |
| Administration, fund accounting, custody and transfer agent fees (See Note 5) | | | 951,554 | |
| Distribution fees – Investor Class (See Note 5) | | | 661,878 | |
| Service fees – Investor Class (See Note 5) | | | 441,252 | |
| Reports to shareholders | | | 70,608 | |
| Federal and state registration fees | | | 44,516 | |
| Compliance expense (See Note 5) | | | 29,499 | |
| Audit fees | | | 23,146 | |
| Trustees’ fees and expenses | | | 20,188 | |
| Interest expense (See Note 7) | | | 10,317 | |
| Legal fees | | | 8,669 | |
| Other expenses | | | 56,523 | |
| Total expenses | | | 11,136,996 | |
| NET INVESTMENT LOSS | | $ | (2,737,904 | ) |
| | | | | |
| REALIZED AND UNREALIZED GAINS (LOSSES): | | | | |
| Net realized gain on investments | | $ | 263,670,396 | |
| Net change in unrealized appreciation/depreciation on investments | | | (355,690,732 | ) |
| Net loss on investments | | | (92,020,336 | ) |
| NET DECREASE IN NET ASSETS RESULTING FROM OPERATIONS | | $ | (94,758,240 | ) |
The accompanying notes are an integral part of these financial statements.
| STATEMENT OF OPERATIONS/STATEMENTS OF CHANGES IN NET ASSETS |
Financial Statements
| Statements of Changes in Net Assets |
| | | Year Ended | | | Year Ended | |
| | | October 31, 2018 | | | October 31, 2017 | |
| OPERATIONS: | | | | | | |
| Net investment loss | | $ | (2,737,904 | ) | | $ | (1,057,646 | ) |
| Net realized gain on investments | | | 263,670,396 | | | | 245,505,242 | |
| Net change in unrealized | | | | | | | | |
| appreciation/depreciation on investments | | | (355,690,732 | ) | | | (15,162,353 | ) |
| Net increase (decrease) in net assets resulting from operations | | | (94,758,240 | ) | | | 229,285,243 | |
| | | | | | | | | |
| DISTRIBUTIONS TO SHAREHOLDERS FROM: | | | | | | | | |
| Distributable earnings – Investor Class | | | (59,254,277 | ) | | | (3,088,473 | ) |
| Distributable earnings – Institutional Class | | | (103,063,607 | ) | | | (4,766,317 | ) |
| Total distributions | | | (162,317,884 | ) | | | (7,854,790 | )(1) |
| | | | | | | | | |
| CAPITAL SHARE TRANSACTIONS: | | | | | | | | |
| Proceeds from shares issued in the Reorganization – | | | | | | | | |
| Investor Class (see Note 9) | | | 216,366,669 | | | | — | |
| Proceeds from shares issued in the Reorganization – | | | | | | | | |
| Institutional Class (see Note 9) | | | 105,537,409 | | | | — | |
| Proceeds from shares subscribed – Investor Class | | | 20,976,077 | | | | 37,287,639 | |
| Proceeds from shares subscribed – Institutional Class | | | 53,065,851 | | | | 90,659,855 | |
| Dividends reinvested – Investor Class | | | 58,251,271 | | | | 3,040,512 | |
| Dividends reinvested – Institutional Class | | | 99,300,713 | | | | 4,572,946 | |
| Cost of shares redeemed – Investor Class | | | (196,042,061 | ) | | | (257,782,079 | ) |
| Cost of shares redeemed – Institutional Class | | | (404,237,132 | ) | | | (367,781,422 | ) |
| Net decrease in net assets derived | | | | | | | | |
| from capital share transactions | | | (46,781,203 | ) | | | (490,002,549 | ) |
| TOTAL DECREASE IN NET ASSETS | | | (303,857,327 | ) | | | (268,572,096 | ) |
| | | | | | | | | |
| NET ASSETS: | | | | | | | | |
| Beginning of year | | | 971,544,555 | | | | 1,240,116,651 | |
| End of year | | $ | 667,687,228 | | | $ | 971,544,555 | (2) |
| | | | | | | | | |
| CHANGES IN SHARES OUTSTANDING: | | | | | | | | |
| Shares issued in the Reorganization – Investor Class | | | 10,499,531 | | | | — | |
| Shares issued in the Reorganization – Institutional Class | | | 4,794,539 | | | | — | |
| Shares sold – Investor Class | | | 1,074,535 | | | | 1,844,085 | |
| Shares sold – Institutional Class | | | 2,546,896 | | | | 4,348,038 | |
| Shares issued to holders as reinvestment | | | | | | | | |
| of dividends – Investor Class | | | 3,038,668 | | | | 149,705 | |
| Shares issued to holders as reinvestment | | | | | | | | |
| of dividends – Institutional Class | | | 5,045,768 | | | | 220,065 | |
| Shares redeemed – Investor Class | | | (10,187,380 | ) | | | (12,769,278 | ) |
| Shares redeemed – Institutional Class | | | (20,331,396 | ) | | | (17,841,055 | ) |
| Net decrease in shares outstanding | | | (3,518,839 | ) | | | (24,048,440 | ) |
(1) | All distributions were from net realized gain. |
(2) | Includes accumulated net investment loss of $(1,118,367). |
The accompanying notes are an integral part of these financial statements.
| HENNESSY FUNDS | 1-800-966-4354 | |
Financial Statements
For an Investor Class share outstanding throughout each year
PER SHARE DATA:
Net asset value, beginning of year
Income from investment operations:
Net investment income (loss)
Net realized and unrealized gains (losses) on investments
Total from investment operations
Less distributions:
Dividends from net investment income
Dividends from net realized gains
Total distributions
Net asset value, end of year
TOTAL RETURN
SUPPLEMENTAL DATA AND RATIOS:
Net assets, end of year (millions)
Ratio of expenses to average net assets
Ratio of net investment income (loss) to average net assets
Portfolio turnover rate(1)
(1) | Portfolio turnover is calculated on the basis of the Fund as a whole. |
The accompanying notes are an integral part of these financial statements.
| FINANCIAL HIGHLIGHTS — INVESTOR CLASS |
| Year Ended October 31, | |
| 2018 | | | 2017 | | | 2016 | | | 2015 | | | 2014 | |
| | | | | | | | | | | | | | |
| $ | 22.46 | | | $ | 18.37 | | | $ | 20.12 | | | $ | 19.00 | | | $ | 17.32 | |
| | | | | | | | | | | | | | | | | | | |
| | | | | | | | | | | | | | | | | | | |
| | (0.06 | ) | | | (0.15 | ) | | | (0.07 | ) | | | 0.10 | | | | (0.05 | ) |
| | (1.87 | ) | | | 4.36 | | | | (1.51 | ) | | | 2.16 | | | | 3.04 | |
| | (1.93 | ) | | | 4.21 | | | | (1.58 | ) | | | 2.26 | | | | 2.99 | |
| | | | | | | | | | | | | | | | | | | |
| | | | | | | | | | | | | | | | | | | |
| | — | | | | — | | | | (0.03 | ) | | | — | | | | (0.05 | ) |
| | (3.66 | ) | | | (0.12 | ) | | | (0.14 | ) | | | (1.14 | ) | | | (1.26 | ) |
| | (3.66 | ) | | | (0.12 | ) | | | (0.17 | ) | | | (1.14 | ) | | | (1.31 | ) |
| $ | 16.87 | | | $ | 22.46 | | | $ | 18.37 | | | $ | 20.12 | | | $ | 19.00 | |
| | | | | | | | | | | | | | | | | | | |
| | (10.54 | )% | | | 23.02 | % | | | (7.89 | )% | | | 12.35 | % | | | 18.25 | % |
| | | | | | | | | | | | | | | | | | | |
| | | | | | | | | | | | | | | | | | | |
| $ | 338.39 | | | $ | 351.16 | | | $ | 485.15 | | | $ | 765.90 | | | $ | 258.17 | |
| | 1.31 | % | | | 1.34 | % | | | 1.35 | % | | | 1.17 | % | | | 1.25 | % |
| | (0.47 | )% | | | (0.33 | )% | | | (0.24 | )% | | | 0.27 | % | | | (0.47 | )% |
| | 181 | % | | | 106 | % | | | 108 | % | | | 5 | % | | | 132 | % |
The accompanying notes are an integral part of these financial statements.
| HENNESSY FUNDS | 1-800-966-4354 | |
Financial Statements
For an Institutional Class share outstanding throughout each year
PER SHARE DATA:
Net asset value, beginning of year
Income from investment operations:
Net investment income (loss)
Net realized and unrealized gains (losses) on investments
Total from investment operations
Less distributions:
Dividends from net investment income
Dividends from net realized gains
Total distributions
Net asset value, end of year
TOTAL RETURN
SUPPLEMENTAL DATA AND RATIOS:
Net assets, end of year (millions)
Ratio of expenses to average net assets:
Before reimbursement
After reimbursement
Ratio of net investment income (loss) to average net assets:
Before reimbursement
After reimbursement
Portfolio turnover rate(2)
(1) | Amount is less than $(0.01) or $0.01. |
(2) | Portfolio turnover is calculated on the basis of the Fund as a whole. |
The accompanying notes are an integral part of these financial statements.
| FINANCIAL HIGHLIGHTS — INSTITUTIONAL CLASS |
| Year Ended October 31, | |
| 2018 | | | 2017 | | | 2016 | | | 2015 | | | 2014 | |
| | | | | | | | | | | | | | |
| $ | 23.07 | | | $ | 18.80 | | | $ | 20.55 | | | $ | 19.36 | | | $ | 17.62 | |
| | | | | | | | | | | | | | | | | | | |
| | | | | | | | | | | | | | | | | | | |
| | (0.00 | )(1) | | | 0.02 | | | | 0.00 | (1) | | | (0.03 | ) | | | (0.08 | ) |
| | (1.92 | ) | | | 4.38 | | | | (1.54 | ) | | | 2.38 | | | | 3.17 | |
| | (1.92 | ) | | | 4.40 | | | | (1.54 | ) | | | 2.35 | | | | 3.09 | |
| | | | | | | | | | | | | | | | | | | |
| | | | | | | | | | | | | | | | | | | |
| | — | | | | — | | | | (0.06 | ) | | | — | | | | (0.09 | ) |
| | (3.77 | ) | | | (0.13 | ) | | | (0.15 | ) | | | (1.16 | ) | | | (1.26 | ) |
| | (3.77 | ) | | | (0.13 | ) | | | (0.21 | ) | | | (1.16 | ) | | | (1.35 | ) |
| $ | 17.38 | | | $ | 23.07 | | | $ | 18.80 | | | $ | 20.55 | | | $ | 19.36 | |
| | | | | | | | | | | | | | | | | | | |
| | (10.22 | )% | | | 23.47 | % | | | (7.53 | )% | | | 12.62 | % | | | 18.57 | % |
| | | | | | | | | | | | | | | | | | | |
| | | | | | | | | | | | | | | | | | | |
| $ | 329.30 | | | $ | 620.38 | | | $ | 754.97 | | | $ | 306.04 | | | $ | 75.53 | |
| | | | | | | | | | | | | | | | | | | |
| | 0.95 | % | | | 0.97 | % | | | 0.97 | % | | | 0.96 | % | | | 1.07 | % |
| | 0.95 | % | | | 0.97 | % | | | 0.97 | % | | | 0.96 | % | | | 0.98 | % |
| | | | | | | | | | | | | | | | | | | |
| | (0.12 | )% | | | 0.04 | % | | | 0.07 | % | | | 0.41 | % | | | (0.29 | )% |
| | (0.12 | )% | | | 0.04 | % | | | 0.07 | % | | | 0.41 | % | | | (0.20 | )% |
| | 181 | % | | | 106 | % | | | 108 | % | | | 5 | % | | | 132 | % |
The accompanying notes are an integral part of these financial statements.
| HENNESSY FUNDS | 1-800-966-4354 | |
Financial Statements
Notes to the Financial Statements October 31, 2018 |
1). ORGANIZATION
The Hennessy Cornerstone Mid Cap 30 Fund (the “Fund”) is a series of Hennessy Funds Trust (the “Trust”), which was organized as a Delaware statutory trust on September 17, 1992. The Fund is an open-end management investment company registered under the Investment Company Act of 1940, as amended. The investment objective of the Fund is long-term growth of capital. The Fund is a diversified fund.
The Fund offers Investor Class and Institutional Class shares. Each class of shares differs principally in its respective 12b-1 distribution and service, shareholder servicing, and sub-transfer agent expenses. There are no sales charges. Each class has identical rights to earnings, assets, and voting privileges, except for class-specific expenses and exclusive rights to vote on matters affecting only an individual class.
As an investment company, the Fund follows the investment company accounting and reporting guidance of the Financial Accounting Standards Board (“FASB”) Accounting Standard Codification Topic 946 “Financial Services—Investment Companies.”
2). SIGNIFICANT ACCOUNTING POLICIES
The following is a summary of significant accounting policies consistently followed by the Fund in the preparation of the financial statements. These policies conform to U.S. generally accepted accounting principles (“GAAP”).
| a). | Securities Valuation – All investments in securities are recorded at their estimated fair value, as described in Note 3. |
| | |
| b). | Federal Income Taxes – No provision for federal income taxes or excise taxes has been made because the Fund has elected to be taxed as a regulated investment company and intends to distribute substantially all of its taxable income to its shareholders and otherwise comply with the provisions of the Internal Revenue Code of 1986, as amended, applicable to regulated investment companies. Net investment income/loss and realized gains/losses for federal income tax purposes may differ from those reported in the financial statements because of temporary book and tax basis differences. Temporary differences are primarily the result of the treatment of wash sales for tax reporting purposes. The Fund recognizes interest and penalties related to income tax benefits, if any, in the Statement of Operations as an income tax expense. Distributions from net realized gains for book purposes may include short-term capital gains, which are included as ordinary income to shareholders for tax purposes. The Fund may utilize equalization accounting for tax purposes and designate earnings and profits, including net realized gains distributed to shareholders on redemption of shares, as part of the dividends paid deduction for income tax purposes. |
| | |
| | Due to inherent differences in the recognition of income, expenses, and realized gains/losses under GAAP and federal income tax regulations, permanent differences between book and tax basis for reporting for fiscal year 2018 have been identified and appropriately reclassified in the Statement of Assets and Liabilities. The adjustments are as follows: |
| Total | |
| Distributable | |
Earnings | Capital Stock |
| $(101,348,648) | $101,348,648 |
| NOTES TO THE FINANCIAL STATEMENTS |
| c). | Accounting for Uncertainty in Income Taxes – The Fund has accounting policies regarding recognition and measurement of tax positions taken or expected to be taken on a tax return. The tax returns of the Fund for the prior three fiscal years are open for examination. The Fund has reviewed all open tax years in major jurisdictions and concluded that there is no impact on the Fund’s net assets and no tax liability resulting from unrecognized tax benefits relating to uncertain income tax positions taken or expected to be taken on a tax return. The Fund’s major tax jurisdictions are U.S. federal and Delaware. |
| | |
| d). | Income and Expenses – Dividend income is recognized on the ex-dividend date or as soon as information is available to the Fund. Interest income, which includes the amortization of premium and accretion of discount, is recognized on an accrual basis. Other non-cash dividends are recognized as investment income at the fair value of the property received. The Fund is charged for those expenses that are directly attributable to its portfolio, such as advisory, administration, and certain shareholder service fees. Income, expenses (other than expenses attributable to a specific class), and realized and unrealized gains/losses on investments are allocated to each class of shares based on such class’s net assets. |
| | |
| e). | Distributions to Shareholders – Dividends from net investment income for the Fund, if any, are declared and paid annually, usually in December. Distributions of net realized capital gains, if any, are declared and paid annually, usually in December. |
| | |
| f). | Security Transactions – Investment and shareholder transactions are recorded on the trade date. The Fund determines the realized gain/loss from an investment transaction by comparing the original cost of the security lot sold with the net sale proceeds. Discounts and premiums on securities purchased are accreted or amortized, respectively, over the life of each such security. |
| | |
| g). | Use of Estimates – The preparation of financial statements in conformity with GAAP requires management to make estimates and assumptions that affect the reported amounts of assets and liabilities and disclosure of contingent assets and liabilities at the date of the financial statements and the reported change in net assets during the reporting period. Actual results could differ from those estimates. |
| | |
| h). | Share Valuation – The net asset value (“NAV”) per share of the Fund is calculated by dividing (i) the total value of the securities held by the Fund, plus cash and other assets, minus all liabilities (including estimated accrued expenses) by (ii) the total number of shares outstanding for the Fund, rounded to the nearest cent. The Fund’s shares will not be priced on days the New York Stock Exchange is closed for trading. The offering and redemption price per share for the Fund is equal to the Fund’s NAV per share. |
| | |
| i). | New Accounting Pronouncements – In August 2018, the FASB issued Accounting Standards Update No. 2018-13 “Disclosure Framework—Changes to the Disclosure Requirements for Fair Value Measurement” (“ASU 2018-13”). ASU 2018-13 eliminates the requirement to disclose the amount of and reasons for transfers between Level 1 and Level 2 of the fair value hierarchy, the timing of transfers between levels of the fair value hierarchy, and the valuation processes for Level 3 fair value measurements. ASU 2018-13 does not eliminate the requirement to disclose the range and weighted average used to develop significant unobservable inputs for Level 3 fair value measurements, and the changes in unrealized gains and losses for recurring Level 3 fair value measurements. ASU 2018-13 requires that information is provided about the measurement uncertainty of Level 3 fair value measurements as of the reporting date. The guidance is effective for fiscal years beginning after December 15, 2019, and interim periods within those fiscal years. Management has |
| HENNESSY FUNDS | 1-800-966-4354 | |
| | evaluated the impact of this change in guidance, and due to the permissibility of early adoption, modified the Fund’s fair value disclosures for the current reporting period. |
| | |
| j). | New Rule Issuances – In August 2018, the Securities and Exchange Commission issued Final Rule Release No. 33 10532, Disclosure Update and Simplification, which in part amends certain financial statement disclosure requirements of Regulation S-X that have become redundant, duplicative, overlapping, outdated, or superseded, in light of other Commission disclosure requirements, GAAP, or changes in the information environment. The amendments are intended to facilitate the disclosure of information to investors and simplify compliance without significantly altering the total mix of information provided to investors. The amendments to Rule 6-04.17 of Regulation S-X (balance sheet) were amended to require presentation of the total, rather than the components of net assets, of distributable earnings on the balance sheet. Consistent with GAAP, funds will be required to disclose total distributable earnings. The amendments to Rule 6-09 of Regulation S-X (statement of changes in net assets) omit the requirement to separately state the sources of distributions paid as well as omit the requirement to parenthetically state the book basis amount of undistributed net investment income. Instead, consistent with GAAP, funds will be required to disclose the total amount of distributions paid, except that any tax return of capital must be separately disclosed. The requirements of the Final Rule Release are effective November 5, 2018 and the Fund’s Statement of Assets and Liabilities and the Statement of Changes in Net Assets for the current and prior reporting period have been modified accordingly. |
3). SECURITIES VALUATION
The Fund follows fair valuation accounting standards that establish an authoritative definition of fair value and set out a hierarchy for measuring fair value. These standards require additional disclosures about the various inputs and valuation techniques used to develop the measurements of fair value and a discussion of changes in valuation techniques and related inputs during the period. These inputs are summarized in the three broad levels listed below:
| | Level 1 – | Unadjusted, quoted prices in active markets for identical instruments that the Fund has the ability to access at the date of measurement. |
| | | |
| | Level 2 – | Other significant observable inputs (including, but not limited to, quoted prices in active markets for similar instruments, quoted prices in markets that are not active for identical or similar instruments, and model-derived valuations in which all significant inputs and significant value drivers are observable in active markets, such as interest rates, prepayment speeds, credit risk curves, default rates, and similar data). |
| | | |
| | Level 3 – | Significant unobservable inputs (including the Fund’s own assumptions about what market participants would use to price the asset or liability based on the best available information) when observable inputs are unavailable. |
Following is a description of the valuation techniques applied to the Fund’s major categories of assets and liabilities measured at fair value on a recurring basis.
| | Equity Securities – Equity securities, including common stocks, preferred stocks, exchange-traded funds, closed-end mutual funds, partnerships, rights, and real estate investment trusts, that are traded on a securities exchange for which a last-quoted sales price is readily available will generally be valued at the last sales price as reported by the primary exchange on which the securities are listed. Securities listed on The NASDAQ Stock Market (“NASDAQ”) will generally be valued at the NASDAQ Official Closing Price, which may differ from the last sales price reported. Securities traded on |
| NOTES TO THE FINANCIAL STATEMENTS |
| | a securities exchange for which a last-quoted sales price is not readily available will generally be valued at the mean between the bid and ask prices. To the extent these securities are actively traded and valuation adjustments are not applied, they are classified in Level 1 of the fair value hierarchy. Securities traded on foreign exchanges generally are not valued at the same time the Fund calculates its NAV because most foreign markets close well before such time. The earlier close of most foreign markets gives rise to the possibility that significant events, including broad market moves, may have occurred in the interim. In certain circumstances, it may be determined that a foreign security needs to be fair valued because it appears that the value of the security might have been materially affected by events occurring after the close of the market in which the security is principally traded, but before the time the Fund calculates its NAV, such as by a development that affects an entire market or region (e.g., a weather-related event) or a potentially global development (e.g., a terrorist attack that may be expected to have an effect on investor expectations worldwide). |
| | |
| | Registered Investment Companies – Investments in open-end registered investment companies, commonly referred to as mutual funds, are generally priced at the ending NAV provided by the applicable mutual fund’s service agent and will be classified in Level 1 of the fair value hierarchy. |
| | |
| | Debt Securities – Debt securities, including corporate bonds, asset-backed securities, mortgage-backed securities, municipal bonds, U.S. Treasuries, and U.S. government agency issues, are generally valued at market on the basis of valuations furnished by an independent pricing service that utilizes both dealer-supplied valuations and formula-based techniques. The pricing service may consider recently executed transactions in securities of the issuer or comparable issuers, market price quotations (where observable), bond spreads, and fundamental data relating to the issuer. In addition, the model may incorporate observable market data, such as reported sales of similar securities, broker quotes, yields, bids, offers, and reference data. Certain securities are valued primarily using dealer quotations. These securities are generally classified in Level 2 of the fair value hierarchy. |
| | |
| | Short-Term Securities – Short-term equity investments, including money market funds, are valued in the manner specified above. Short-term debt investments with an original term to maturity of 60 days or less are valued at amortized cost, which approximates fair market value. If the original term to maturity of a short-term debt investment exceeded 60 days, then the values as of the 61st day prior to maturity are amortized. Amortized cost is not used if its use would be inappropriate due to credit or other impairments of the issuer, in which case the security’s fair value would be determined, as described below. Short-term securities are generally classified in Level 1 or Level 2 of the fair market hierarchy depending on the inputs used and market activity levels for specific securities. |
The Board of Trustees of the Fund (the “Board”) has adopted fair value pricing procedures that are followed when a price for a security is not readily available or if a significant event has occurred that indicates the closing price of a security no longer represents the true value of that security. Fair value pricing determinations are made in good faith in accordance with these procedures. There are numerous criteria that will be given consideration in determining a fair value of a security, such as the trading volume of a security and markets, the values of other similar securities, and news events with direct bearing on a security or markets. Fair value pricing results in an estimated price for a security that reflects the amount the Fund might reasonably expect to receive in a current sale. Depending on the relative significance of the valuation inputs, these securities may be classified in either Level 2 or Level 3 of the fair value hierarchy.
| HENNESSY FUNDS | 1-800-966-4354 | |
The fair valuation of foreign securities may be determined with the assistance of a pricing service using correlations between the movement of prices of such securities and indices of domestic securities and other appropriate indicators, such as closing market prices of relevant American Depositary Receipts or futures contracts. The effect of using fair value pricing is that the Fund’s NAV will reflect the affected portfolio securities’ values as determined by the Board or its designee, pursuant to the fair value pricing procedures adopted by the Board, instead of being determined by the market. Using a fair value pricing methodology to price a foreign security may result in a value that is different from such foreign security’s most recent closing price and from the value used by other investment companies to calculate their NAVs. Such securities are generally classified in Level 2 of the fair valuation hierarchy. Because the Fund may invest in foreign securities, the value of the Fund’s portfolio securities may change on days when you will not be able to purchase or redeem your shares.
The Board has delegated day-to-day valuation matters to a Valuation Committee comprised of one or more representatives from Hennessy Advisors, Inc., the Fund’s investment advisor (the “Advisor”). The function of the Valuation Committee is to value securities where current and reliable market quotations are not readily available. All actions taken by the Valuation Committee are reviewed by the Board.
The Fund has performed an analysis of all existing investments to determine the significance and character of all inputs to their fair value determinations. Various inputs are used to determine the value of the Fund’s investments. The inputs or methodology used for valuing securities are not necessarily an indication of the risk associated with investing in those securities. Details related to the fair valuation hierarchy of the Fund’s securities as of October 31, 2018, are included in the Schedule of Investments.
4). INVESTMENT TRANSACTIONS
Purchases and sales of investment securities (excluding government and short-term investments) for the Fund during fiscal year 2018 were $1,741,081,425 and $2,272,356,313, respectively.
There were no purchases or sales/maturities of long-term U.S. government securities for the Fund during fiscal year 2018.
The Fund is permitted to purchase or sell securities from or to another fund in the Hennessy Funds family of funds (the “Hennessy Funds”) under specified conditions outlined in procedures adopted by the Board. The procedures have been designed to ensure that any purchase or sale of securities by the Fund from or to another Hennessy Fund complies with Rule 17a-7 of the Investment Company Act of 1940, as amended. During fiscal year 2018, the Fund did not engage in purchases or sales of securities pursuant to Rule 17a-7 of the Investment Company Act of 1940, as amended.
5). INVESTMENT ADVISORY FEE AND OTHER TRANSACTIONS WITH AFFILIATES
The Advisor provides the Fund with investment advisory services under an Investment Advisory Agreement. The Advisor furnishes all investment advice, office space, and facilities, as well as most of the personnel needed by the Fund. As compensation for its services, the Advisor is entitled to a monthly fee from the Fund. The fee is based upon the average daily net assets of the Fund at an annual rate of 0.74%. The net investment advisory fees expensed by the Fund during fiscal year 2018 are included in the Statement of Operations.
The Advisor has agreed to limit total annual operating expenses to 1.39% of the Fund’s net assets for Investor Class shares and 1.07% of the Fund’s net assets for Institutional Class shares (in each case, excluding all federal, state, and local taxes,
| NOTES TO THE FINANCIAL STATEMENTS |
interest, brokerage commissions, acquired fund fees and expenses and other costs incurred in connection with the purchase and sale of securities, and extraordinary items) through January 12, 2020, pursuant to the written direction of the Board. For a period of three years after the year in which the Advisor waives or reimburses expenses, the Advisor may seek reimbursement from the Fund to the extent that total annual fund operating expenses are less than the expense limitation that was in effect at the time the Advisor waived or reimbursed expenses.
The Board has approved a Shareholder Servicing Agreement for Investor Class shares of the Fund, which was instituted to compensate the Advisor for the non-investment advisory services it provides to the Fund. The Shareholder Servicing Agreement provides for a monthly fee paid to the Advisor at an annual rate of 0.10% of the average daily net assets of the Fund attributable to Investor Class shares. The shareholder service fees expensed by the Fund during fiscal year 2018 are included in the Statement of Operations.
The Fund has adopted a plan pursuant to Rule 12b-1 under the Investment Company Act of 1940, as amended, that authorizes payments in connection with the distribution of the Fund’s shares at an annual rate of up to 0.25% of the Fund’s average daily net assets attributable to Investor Class shares. Even though the authorized rate is up to 0.25%, the Fund is currently only using up to 0.15% of its average daily net assets attributable to Investor Class shares for such purpose. Amounts paid under the plan may be spent on any activities or expenses primarily intended to result in the sale of shares, including, but not limited to, advertising, shareholder account servicing, printing and mailing of prospectuses to other than current shareholders, printing and mailing of sales literature, and compensation for sales and marketing activities or to financial institutions and others, such as dealers and distributors. The distribution fees expensed by the Fund during fiscal year 2018 are included in the Statement of Operations.
The Fund has entered into agreements with various brokers, dealers, and financial intermediaries in connection with the sale of shares of the Fund. The agreements provide for periodic payments by the Fund to the brokers, dealers, and financial intermediaries for providing certain shareholder maintenance services (sub-transfer agent expenses). These shareholder services include the pre-processing and quality control of new accounts, shareholder correspondence, answering customer inquiries regarding account status, and facilitating shareholder telephone transactions. The sub-transfer agent fees expensed by the Fund during fiscal year 2018 are included in the Statement of Operations.
U.S. Bancorp Fund Services, LLC, d/b/a U.S. Bank Global Fund Services (“Fund Services”) provides the Fund with administrative, fund accounting, and transfer agent services. As administrator, Fund Services is responsible for activities such as (i) preparing various federal and state regulatory filings, reports, and returns for the Fund, (ii) preparing reports and materials to be supplied to the Board, (iii) monitoring the activities of the Fund’s custodian, transfer agent, and accountants, and (iv) coordinating the preparation and payment of the Fund’s expenses and reviewing the Fund’s expense accruals. U.S. Bank N.A., an affiliate of Fund Services, serves as the Fund’s custodian. The servicing agreements between the Trust and Fund Services and U.S. Bank N.A. contain a fee schedule that is inclusive of administrative, fund accounting, custody, and transfer agent fees. The administrative, fund accounting, custody, and transfer agent fees expensed by the Fund during fiscal year 2018 are included in the Statement of Operations.
Quasar Distributors, LLC acts as the Fund’s principal underwriter in a continuous public offering of the Fund’s shares. Quasar Distributors, LLC is an affiliate of Fund Services and U.S. Bank N.A.
| HENNESSY FUNDS | 1-800-966-4354 | |
The officers of the Fund are affiliated with the Advisor. Such officers, with the exception of the Chief Compliance Officer and the Senior Compliance Officer, receive no compensation from the Fund for serving in their respective roles. The Fund, along with the other Hennessy Funds, makes reimbursement payments, on an equal basis, to the Advisor for a portion of the salary and benefits associated with the office of the Chief Compliance Officer and for all of the salary and benefits associated with the office of the Senior Compliance Officer. The compliance fees expensed by the Fund during fiscal year 2018 are included in the Statement of Operations.
6). GUARANTEES AND INDEMNIFICATIONS
Under the Hennessy Funds’ organizational documents, their officers and trustees are indemnified by the Hennessy Funds against certain liabilities arising out of the performance of their duties to the Hennessy Funds. Additionally, in the normal course of business, the Hennessy Funds enter into contracts with service providers that contain general indemnification clauses. The Fund’s maximum exposure under these arrangements is unknown as this would involve future claims that may be made against the Fund that have not yet occurred. Currently, the Fund expects the risk of loss to be remote.
7). LINE OF CREDIT
The Fund has an uncommitted line of credit with the other Hennessy Funds in the amount of the lesser of (i) $100,000,000 or (ii) 33.33% of each Hennessy Fund’s net assets, or 30% for the Hennessy Gas Utility Fund and 10% for the Hennessy Balanced Fund, intended to provide short-term financing, if necessary, subject to certain restrictions, in connection with shareholder redemptions. The credit facility is with the Hennessy Funds’ custodian bank, U.S. Bank N.A. Borrowings under this arrangement bear interest at the bank’s prime rate and are secured by all of the Fund’s assets (as to its own borrowings only). During fiscal year 2018, the Fund had an outstanding average daily balance and a weighted average interest rate of $227,690 and 4.47%, respectively. The interest expensed by the Fund during fiscal year 2018 is included in the Statement of Operations. The maximum amount outstanding for the Fund during fiscal year 2018 was $17,829,000. As of October 31, 2018, the Fund did not have any borrowings outstanding under the line of credit.
8). FEDERAL TAX INFORMATION
As of October 31, 2018, the components of accumulated earnings (losses) for income tax purposes were as follows:
| | | Investments | |
| Cost of investments for tax purposes | | $ | 739,706,681 | |
| Gross tax unrealized appreciation | | $ | 4,822,523 | |
| Gross tax unrealized depreciation | | | (73,343,330 | ) |
| Net tax unrealized appreciation/(depreciation) | | $ | (68,520,807 | ) |
| Undistributed ordinary income | | $ | 5,436,050 | |
| Undistributed long-term capital gains | | | 157,418,277 | |
| Total distributable earnings | | $ | 162,854,327 | |
| Other accumulated gain/(loss) | | $ | — | |
| Total accumulated gain/(loss) | | $ | 94,333,520 | |
The difference between book-basis unrealized appreciation/depreciation (as shown in the Statement of Assets and Liabilities) and tax-basis unrealized appreciation/depreciation (as shown above) is attributable primarily to wash sales.
As of October 31, 2018, the Fund had no tax basis capital losses to offset future capital gains.
| NOTES TO THE FINANCIAL STATEMENTS |
As of October 31, 2018, the Fund did not defer, on a tax basis, any late-year ordinary losses. Late-year ordinary losses are net ordinary losses incurred after December 31, 2017, but within the taxable year, that are deemed to arise on the first day of the Fund’s next taxable year.
During fiscal year 2018 and fiscal year 2017, the tax character of distributions paid by the Fund was as follows:
| | | Year Ended | | | Year Ended | |
| | | October 31, 2018 | | | October 31, 2017 | |
| Ordinary income | | $ | — | | | $ | — | |
| Long-term capital gain | | | 162,317,884 | | | | 7,854,790 | |
| | | $ | 162,317,884 | | | $ | 7,854,790 | |
9). AGREEMENT AND PLAN OF REORGANIZATION
On November 16, 2017, and December 26, 2017, shareholders of each of the Rainier Mid Cap Equity Fund and the Rainier Small/Mid Cap Equity Fund, respectively, approved an Agreement and Plan of Reorganization between the Trust, on behalf of the Fund, and Rainier Investment Management Mutual Funds, a Delaware statutory trust, on behalf of the Rainier Mid Cap Equity Fund and the Rainier Small/Mid Cap Equity Fund, respectively. The Agreements and Plans of Reorganization provided for the transfer of all of the assets of the Rainier Mid Cap Equity Fund and the Rainier Small/Mid Cap Equity Fund to the Fund and the assumption of the liabilities (other than any excluded liabilities) of the Rainier Mid Cap Equity Fund and the Rainier Small/Mid Cap Equity Fund by the Fund. The Rainier Mid Cap Equity Fund, the Rainier Small/Mid Cap Equity Fund, and the Fund have substantially similar investment objectives. The following tables illustrate the specifics of the reorganization of the Rainier Mid Cap Equity Fund and the Rainier Small/Mid Cap Equity Fund into the Fund:
| | Shares Issued | Hennessy Mid Cap 30 Fund Net Assets | |
| Rainier Mid | to Shareholders | | Combined | |
| Cap Equity Fund | of Rainier Mid | | (Post Merger) | Tax Status |
Net Assets | Cap Equity Fund | Pre Merger | Net Assets | of Transfer |
$69,217,067(1) | 2,967,419 | $968,703,016 | $1,037,920,083 | Non-taxable |
(1) Includes unrealized appreciation in the amount of $21,463,644.
| | Shares Issued | Hennessy Mid Cap 30 Fund Net Assets | |
| Rainier Small/Mid | to Shareholders of | | Combined | |
| Cap Equity Fund | Rainier Small/Mid | | (Post Merger) | Tax Status |
Net Assets | Cap Equity Fund | Pre Merger | Net Assets | of Transfer |
$252,687,011(2) | 12,326,651 | $1,016,365,858 | $1,269,052,869 | Non-taxable |
(2) Includes unrealized appreciation in the amount of $93,637,548.
Assuming the reorganization had been completed on November 1, 2017, the beginning of the annual reporting period of the Fund, the pro forma results of operation (unaudited) for fiscal year 2018 would have been as follows:
| Net investment loss | | $ | (3,175,732 | ) |
| Net realized gain on investments | | $ | 270,696,978 | |
| Net change in unrealized appreciation/depreciation on investments | | $ | (345,824,579 | ) |
| Net decrease in net assets resulting from operations | | $ | (78,303,333 | ) |
| HENNESSY FUNDS | 1-800-966-4354 | |
Because the Fund has been managed as a single integrated portfolio since the reorganization was completed, it is not practicable to separate the amounts of revenue and earnings of the Rainier Mid Cap Equity Fund and the Rainier Small/Mid Cap Equity Fund that have been included in the Fund’s Statement of Operations since December 1, 2017, and January 12, 2018, the dates the reorganizations were completed, respectively.
10). EVENTS SUBSEQUENT TO YEAR END
Management has evaluated the Fund’s related events and transactions that occurred subsequent to October 31, 2018, through the date of issuance of the Fund’s financial statements. Other than as disclosed below, management has determined that there were no subsequent events requiring recognition or disclosure in the financial statements.
On December 7, 2018, capital gains were declared and paid to shareholders of record on December 6, 2018, as follows:
| | | Long-term | Short-term |
| | Investor Class | $4.34596 | $0.15008 |
| | Institutional Class | $4.44097 | $0.15336 |
| NOTES/REPORT OF INDEPENDENT REGISTERED PUBLIC ACCOUNTING FIRM |
Report of Independent Registered Public
Accounting Firm
To the Board of Trustees of Hennessy Funds Trust
and the shareholders of Hennessy Cornerstone Mid Cap 30 Fund
Novato, CA
Opinion on the Financial Statements
We have audited the accompanying statement of assets and liabilities of Hennessy Cornerstone Mid Cap 30 Fund (the “Fund”), a series of Hennessy Funds Trust, including the schedule of investments, as of October 31, 2018, the related statement of operations for the year then ended, the statements of changes in net assets and the financial highlights for each of the two years in the period then ended, and the related notes (collectively referred to as the “financial statements”). In our opinion, the financial statements present fairly, in all material respects, the financial position of the Fund as of October 31, 2018, the results of its operations for the year then ended, and the changes in its net assets and the financial highlights for each of the two years in the period then ended in conformity with accounting principles generally accepted in the United States of America.
The financial highlights for each of the three years in the period ended October 31, 2016 have been audited by other auditors, whose report dated December 22, 2016 expressed unqualified opinions on such financial highlights.
Basis for Opinion
These financial statements are the responsibility of the Fund’s management. Our responsibility is to express an opinion on the Fund’s financial statements based on our audits. We are a public accounting firm registered with the Public Company Accounting Oversight Board (United States) (“PCAOB”) and are required to be independent with respect to the Fund in accordance with the U.S. federal securities laws and the applicable rules and regulations of the Securities and Exchange Commission and the PCAOB. We have served as the auditor of one or more of the funds in the Trust since 2002.
We conducted our audits in accordance with the standards of the PCAOB. Those standards require that we plan and perform the audit to obtain reasonable assurance about whether the financial statements are free of material misstatement, whether due to error or fraud. The Fund is not required to have, nor were we engaged to perform, an audit of its internal control over financial reporting. As part of our audits we are required to obtain an understanding of internal control over financial reporting, but not for the purpose of expressing an opinion on the effectiveness of the Fund’s internal control over financial reporting. Accordingly, we express no such opinion.
Our audits included performing procedures to assess the risks of material misstatement of the financial statements, whether due to error or fraud, and performing procedures that respond to those risks. Such procedures included examining, on a test basis, evidence regarding the amounts and disclosures in the financial statements. Our audits also included evaluating the accounting principles used and significant estimates made by management, as well as evaluating the overall presentation of the financial statements. Our procedures included confirmation of securities owned as of October 31, 2018 by correspondence with the custodian. We believe that our audits provide a reasonable basis for our opinion.
TAIT, WELLER & BAKER LLP
Philadelphia, Pennsylvania
December 27, 2018
| HENNESSY FUNDS | 1-800-966-4354 | |
Trustees and Officers of the Fund (Unaudited)
The business and affairs of the Funds are managed under the direction of the Board of Trustees of the Trust, and the Board of Trustees elects the Officers of the Trust. Beginning in March 2015, the Board of Trustees has from time to time appointed advisers to the Board of Trustees (“Advisers”) with the intention of having qualified individuals serve in an advisory capacity in order to garner experience in the mutual fund and asset management industry and be considered as potential Trustees in the future. There are currently three Advisers: Brian Alexander, Doug Franklin, and Claire Knoles. As Advisers, Mr. Alexander, Mr. Franklin, and Ms. Knoles attend meetings of the Board of Trustees and act as non-voting participants. Information pertaining to the Trustees, Advisers, and the Officers of the Trust is set forth below. The Trustees and Officers serve until their successors are duly elected and qualified or until their earlier death, resignation, or removal. Each Trustee oversees the 16 Hennessy Funds. Unless otherwise indicated, the address of all persons listed below is 7250 Redwood Boulevard, Suite 200, Novato, CA 94945. The Fund’s Statement of Additional Information includes more information about the persons listed below and is available, without charge, upon request by calling 1-800-966-4354.
| | | | Other |
| | | | Directorships |
| | | | Held Outside |
| Name, (Year of Birth), | | | of Fund |
| and Position Held | Start Date | Principal Occupation(s) | Complex During |
with the Trust | of Service | During Past Five Years | Past Five Years(1) |
| | |
| Disinterested Trustees and Advisers | |
| | | | |
| J. Dennis DeSousa | January 1996 | Mr. DeSousa is a real estate investor. | None. |
| (1936) | | | |
| Trustee | | | |
| | | | |
| Robert T. Doyle | January 1996 | Mr. Doyle has been the Sheriff of | None. |
| (1947) | | Marin County, California since 1996. | |
| Trustee | | | |
| | | | |
| Gerald P. Richardson | May 2004 | Mr. Richardson is an independent | None. |
| (1945) | | consultant in the securities industry. | |
| Trustee | | | |
| | | | |
| Brian Alexander | March 2015 | Mr. Alexander has worked for the | None. |
| (1981) | | Sutter Health organization since | |
| Adviser to the Board | | 2011 in various positions. He has | |
| | | served as the Chief Executive Officer | |
| | | of the Sutter Roseville Medical | |
| | | Center since 2018. From 2016 through | |
| | | 2018, he served as the Vice President | |
| | | of Strategy for the Sutter Health Valley | |
| | | Area, which includes 11 hospitals, | |
| | | 13 ambulatory surgery centers, | |
| | | 16,000 employees, and 1,900 physicians. | |
| | | From 2013 through 2016, Mr. Alexander | |
| | | served as Sutter Novato Community | |
| | | Hospital’s Chief Administrative Officer, | |
| | | and from 2011 through 2012, he | |
| | | served as a Director of Strategy | |
| | | within Sutter’s West Bay Region. | |
| TRUSTEES AND OFFICERS OF THE FUND |
| | | | Other |
| | | | Directorships |
| | | | Held Outside |
| Name, (Year of Birth), | | | of Fund |
| and Position Held | Start Date | Principal Occupation(s) | Complex During |
with the Trust | of Service | During Past Five Years | Past Five Years(1) |
| | | | |
| Doug Franklin | March 2016 | Mr. Franklin is a retired insurance | None. |
| (1964) | | industry executive. From 1987 | |
| Adviser to the Board | | through 2015, he was employed | |
| | | by the Allianz-Fireman’s Fund | |
| | | Insurance Company in various | |
| | | positions, including as its Chief | |
| | | Actuary and Chief Risk Officer. | |
| | | | |
| Claire Knoles | December 2015 | Ms. Knoles is a founder of Kiosk and | None. |
| (1974) | | has served as its Chief Operating | |
| Adviser to the Board | | Officer since 2004. Kiosk is a full | |
| | | service marketing agency with | |
| | | offices in the San Francisco Bay | |
| | | Area, Toronto, and Liverpool, UK. | |
| | | | |
Interested Trustee(2) | | | |
| | | | |
| Neil J. Hennessy | January 1996 as | Mr. Neil Hennessy has been employed | Hennessy |
| (1956) | a Trustee and | by Hennessy Advisors, Inc. since | Advisors, Inc. |
| Trustee, Chairman of | June 2008 as | 1989 and currently serves as its | |
| the Board, Chief | an Officer | Chairman and Chief Executive Officer. | |
| Investment Officer, | | | |
| Portfolio Manager, | | | |
| and President | | | |
| Name, (Year of Birth), | | |
| and Position Held | Start Date | Principal Occupation(s) |
with the Trust | of Service | During Past Five Years |
| | | |
| Officers | | |
| | | |
| Teresa M. Nilsen | January 1996 | Ms. Nilsen has been employed by Hennessy Advisors, Inc. |
| (1966) | | since 1989 and currently serves as its President, Chief Operating |
| Executive Vice President | | Officer, and Secretary. |
| and Treasurer | | |
| | | |
| Daniel B. Steadman | March 2000 | Mr. Steadman has been employed by Hennessy Advisors, Inc. |
| (1956) | | since 2000 and currently serves as its Executive Vice President. |
| Executive Vice President | | |
| and Secretary | | |
| | | |
| Brian Carlson | December 2013 | Mr. Carlson has been employed by Hennessy Advisors, Inc. |
| (1972) | | since December 2013 and currently serves as its Chief |
| Senior Vice President | | Compliance Officer and Senior Vice President. |
| and Head of Distribution | | |
| | | |
| Jennifer Cheskiewicz | June 2013 | Ms. Cheskiewicz has been employed by Hennessy Advisors, Inc. |
(1977)(3) | | as its General Counsel since June 2013. |
| Senior Vice President and | | |
| Chief Compliance Officer | | |
| HENNESSY FUNDS | 1-800-966-4354 | |
| Name, (Year of Birth), | | |
| and Position Held | Start Date | Principal Occupation(s) |
with the Trust | of Service | During Past Five Years |
| | | |
| David Ellison | October 2012 | Mr. Ellison has been employed by Hennessy Advisors, Inc. since |
(1958)(4) | | October 2012. He has served as a Portfolio Manager of the |
| Senior Vice President | | Hennessy Large Cap Financial Fund and the Hennessy Small |
| and Portfolio Manager | | Cap Financial Fund since inception. Mr. Ellison also served as a |
| | | Portfolio Manager of the Hennessy Technology Fund from its |
| | | inception until February 2017. Mr. Ellison served as Director, |
| | | CIO and President of FBR Fund Advisers, Inc. from December |
| | | 1999 to October 2012. |
| | | |
| Ryan C. Kelley | March 2013 | Mr. Kelley has been employed by Hennessy Advisors, Inc. since |
(1972)(5) | | October 2012. He has served as a Portfolio Manager of the |
| Senior Vice President | | Hennessy Gas Utility Fund, the Hennessy Large Cap Financial |
| and Portfolio Manager | | Fund, and the Hennessy Small Cap Financial Fund since |
| | | October 2014. He served as Co-Portfolio Manager of the same |
| | | funds from March 2013 through September 2014, and as a |
| | | Portfolio Analyst for the Hennessy Funds from October 2012 |
| | | through February 2013. Mr. Kelley has also served as a Portfolio |
| | | Manager of the Hennessy Cornerstone Growth Fund, the |
| | | Hennessy Cornerstone Mid Cap 30 Fund, the Hennessy |
| | | Cornerstone Large Growth Fund, and the Hennessy |
| | | Cornerstone Value Fund since February 2017, as a Co-Portfolio |
| | | Manager of the Hennessy Technology Fund since February |
| | | 2017, and as a Portfolio Manager of the Hennessy Total Return |
| | | Fund and the Hennessy Balanced Fund since May 2018. |
| | | Mr. Kelley served as Portfolio Manager of FBR Fund Advisers, |
| | | Inc. from January 2008 to October 2012. |
| | | |
| Tania Kelley | October 2003 | Ms. Kelley has been employed by Hennessy Advisors, Inc. |
| (1965) | | since October 2003. |
| Senior Vice President | | |
| and Head of Marketing | | |
| | | |
| Daniel P. Hennessy | December 2016 | Mr. Daniel Hennessy has been employed by Hennessy Advisors, |
| (1990) | | Inc. since 2015. He has served as an Associate Analyst or |
| Vice President | | Analyst of the Hennessy Technology Fund since February 2017. |
| and Analyst | | Mr. Daniel Hennessy previously served as a Mutual Fund |
| | | Specialist at U.S. Bancorp Fund Services, LLC (now doing |
| | | business as U.S. Bank Global Fund Services) from November |
| | | 2014 to July 2015. Prior to that, he attended the University of |
| | | San Diego, where he earned a degree in Political Science. |
_______________
(1) | Messrs. DeSousa, Doyle, N. Hennessy, and Richardson previously served on the Board of Directors of Hennessy Mutual Funds, Inc. (“HMFI”), The Hennessy Funds, Inc. (“HFI”), and Hennessy SPARX Funds Trust (“HSFT”). Pursuant to an internal reorganization effective as of February 28, 2014, the series of HFMI, HFI, and HSFT were reorganized into corresponding series of the Trust that mirrored them. Subsequent to the reorganization, HFMI, HFI, and HSFT were dissolved. |
(2) | Mr. N. Hennessy is considered an “interested person,” as defined in the Investment Company Act of 1940, as amended, because he is an officer of the Hennessy Funds. |
(3) | The address of this officer is 4800 Bee Caves Road, Suite 100, Austin, TX 78746. |
(4) | The address of this officer is 101 Federal Street, Suite 1900, Boston, MA 02110. |
(5) | The address of this officer is 1340 Environ Way, Suite 332, Chapel Hill, NC 27517. |
| TRUSTEES AND OFFICERS OF THE FUND |
(This Page Intentionally Left Blank.)
| HENNESSY FUNDS | 1-800-966-4354 | |
Expense Example (Unaudited)
October 31, 2018
As a shareholder of the Fund, you incur ongoing costs, including management fees, service fees, and other Fund expenses. This Example is intended to help you understand your ongoing costs (in dollars) of investing in the Fund and to compare these costs with the ongoing costs of investing in other mutual funds. The Example is based on an investment of $1,000 invested at the beginning of the period and held for the entire period from May 1, 2018, through October 31, 2018.
Actual Expenses
The first line of the table below under the “Investor Class” and “Institutional Class” headings provides information about actual account values and actual expenses. Although the Fund charges no sales loads or transaction fees, you will be assessed fees for outgoing wire transfers, returned checks and stop payment orders at prevailing rates charged by U.S. Bank Global Fund Services, the Fund’s transfer agent. If you request that a redemption be made by wire transfer, currently a $15 fee is charged by the Fund’s transfer agent. IRA accounts will be charged a $15 annual maintenance fee. The example below includes, but is not limited to, management fees, shareholder servicing fees, fund accounting, custody, and transfer agent fees. However, the example below does not include portfolio trading commissions and related expenses, and other extraordinary expenses as determined under generally accepted accounting principles. You may use the information in this line, together with the amount you invested, to estimate the expenses that you paid over the period. Simply divide your account value by $1,000 (for example, an $8,600 account value divided by $1,000 = 8.6), then multiply the result by the number in the first line of the table under the “Investor Class” or “Institutional Class” headings in the column entitled “Expenses Paid During Period” to estimate the expenses you paid on your account during this period.
Hypothetical Example for Comparison Purposes
The second line of the table below under the “Investor Class” and “Institutional Class” headings provides information about hypothetical account values and hypothetical expenses based on the Fund’s actual expense ratios and an assumed rate of return of 5% per year before expenses, which is not the Fund’s actual return. The hypothetical account values and expenses may not be used to estimate the actual ending account balance or expenses you paid for the period. You may use this information to compare the ongoing costs of investing in the Fund and other funds. To do so, compare this 5% hypothetical example with the 5% hypothetical examples that appear in the shareholder reports of the other funds. Please note that the expenses shown in the table are meant to highlight your ongoing costs only. Therefore, the second line of the table under the “Investor Class” and “Institutional Class” headings is useful in comparing ongoing costs only, and will not help you determine the relative total costs of owning different funds.
| | | | Expenses Paid |
| | Beginning | Ending | During Period(1) |
| | Account Value | Account Value | May 1, 2018 – |
| | May 1, 2018 | October 31, 2018 | October 31, 2018 |
| Investor Class | | | |
| Actual | $1,000.00 | $ 895.40 | $6.31 |
| Hypothetical (5% return before expenses) | $1,000.00 | $1,018.55 | $6.72 |
| | | | |
| Institutional Class | | | |
| Actual | $1,000.00 | $ 897.30 | $4.54 |
| Hypothetical (5% return before expenses) | $1,000.00 | $1,020.42 | $4.84 |
(1) | Expenses are equal to the Fund’s annualized expense ratio of 1.32% for Investor Class shares or 0.95% for Institutional Class shares, as applicable, multiplied by the average account value over the period, multiplied by 184/365 days (to reflect one-half year period). |
| HENNESSY FUNDS | 1-800-966-4354 | |
How to Obtain a Copy of the Fund’s
Proxy Voting Policy and Proxy Voting Records
A description of the policies and procedures the Fund uses to determine how to vote proxies relating to portfolio securities is available without charge: (1) by calling 1-800-966-4354; (2) on the Hennessy Funds’ website at www.hennessyfunds.com/proxy-voting/voting-policy; or (3) on the U.S. Securities and Exchange Commission’s (the “SEC”) website at www.sec.gov. The Fund’s proxy voting record is available without charge on both the Hennessy Funds’ website at www.hennessyfunds.com/proxy-voting/voting-record and the SEC’s website at www.sec.gov no later than August 31 for the prior 12 months ending June 30.
Quarterly Filings on Form N-Q
The Fund files a complete schedule of portfolio holdings with the SEC for the first and third quarters of each fiscal year on Form N-Q. The Fund’s Forms N-Q are available on the SEC’s website at www.sec.gov. Information included in the Fund’s Forms N-Q will also be available upon request by calling 1-800-966-4354.
Federal Tax Distribution Information
(Unaudited)
For fiscal year 2018, certain dividends paid by the Fund may be subject to a maximum tax rate of 23.8%, as provided for by the Jobs and Growth Tax Relief Reconciliation Act of 2003. The percentage of dividends declared from ordinary income designated as qualified dividend income was 0.00%.
For corporate shareholders, the percent of ordinary income distributions that qualified for the corporate dividends received deduction for fiscal year 2018 was 0.00%.
The percentage of taxable ordinary income distributions that were designated as short-term capital gain distributions under Section 871(k)(2)(C) of the Internal Revenue Code of 1986, as amended, for the Fund was 0.00%.
Important Notice Regarding Delivery
of Shareholder Documents
To help keep the Fund’s costs as low as possible, we generally deliver a single copy of shareholder reports, proxy statements, and prospectuses to shareholders who share an address and have the same last name. This process does not apply to account statements. You may request an individual copy of a shareholder document at any time. If you would like to receive separate mailings of shareholder documents, please call U.S. Bank Global Fund Services at 1-800-261-6950 or 1-414-765-4124, and individual delivery will begin within 30 days of your request. If your account is held through a financial institution or other intermediary, please contact such intermediary directly to request individual delivery.
| PROXY VOTING — PRIVACY POLICY |
Privacy Policy
We collect the following non-public personal information about you:
| | • | information we receive from you on or in applications or other forms, correspondence, or conversations, including, but not limited to, your name, address, phone number, social security number, assets, income, and date of birth; and |
| | | |
| | • | information about your transactions with us, our affiliates, or others, including, but not limited to, your account number and balance, payment history, parties to transactions, cost basis information, and other financial information. |
We do not disclose any non-public personal information about our current or former shareholders to non-affiliated third parties, except as permitted by law. For example, we are permitted by law to disclose all of the information we collect, as described above, to our Transfer Agent to process your transactions. Furthermore, we restrict access to your non-public personal information to those persons who require such information to provide products or services to you. We maintain physical, electronic, and procedural safeguards that comply with federal standards to guard your non-public personal information.
In the event that you hold shares of the Fund through a financial intermediary, including, but not limited to, a broker-dealer, bank, or trust company, the privacy policy of your financial intermediary would govern how your non-public personal information will be shared with non-affiliated third parties.
| HENNESSY FUNDS | 1-800-966-4354 | |
(This Page Intentionally Left Blank.)
For information, questions or assistance, please call
The Hennessy Funds
1-800-966-4354 or 1-415-899-1555
INVESTMENT ADVISOR
Hennessy Advisors, Inc.
7250 Redwood Boulevard, Suite 200
Novato, California 94945
ADMINISTRATOR,
TRANSFER AGENT,
DIVIDEND PAYING AGENT, &
SHAREHOLDER SERVICING AGENT
U.S. Bancorp Fund Services, LLC
d/b/a U.S. Bank Global Fund Services
P.O. Box 701
Milwaukee, Wisconsin 53201-0701
CUSTODIAN
U.S. Bank N.A.
Custody Operations
1555 North River Center Drive, Suite 302
Milwaukee, Wisconsin 53212
TRUSTEES
Neil J. Hennessy
Robert T. Doyle
J. Dennis DeSousa
Gerald P. Richardson
COUNSEL
Foley & Lardner LLP
777 East Wisconsin Avenue
Milwaukee, Wisconsin 53202-5306
INDEPENDENT REGISTERED
PUBLIC ACCOUNTING FIRM
Tait, Weller & Baker LLP
Two Liberty Place
50 South 16th Street, Suite 2900
Philadelphia, Pennsylvania 19102-2529
DISTRIBUTOR
Quasar Distributors, LLC
777 East Wisconsin Avenue
Milwaukee, Wisconsin 53202
hennessyfunds.com | 1-800-966-4354
This report has been prepared for shareholders and may be distributed to
others only if preceded or accompanied by a current prospectus.
ANNUAL REPORT
OCTOBER 31, 2018
HENNESSY CORNERSTONE
LARGE GROWTH FUND
Investor Class HFLGX
Institutional Class HILGX
hennessyfunds.com | 1-800-966-4354
(This Page Intentionally Left Blank.)
Contents
| Letter to Shareholders | 2 |
| Performance Overview | 4 |
| Financial Statements | |
| Schedule of Investments | 7 |
| Statement of Assets and Liabilities | 11 |
| Statement of Operations | 12 |
| Statements of Changes in Net Assets | 14 |
| Financial Highlights | 16 |
| Notes to the Financial Statements | 20 |
| Report of Independent Registered Public Accounting Firm | 28 |
| Trustees and Officers of the Fund | 29 |
| Expense Example | 32 |
| Proxy Voting Policy and Proxy Voting Records | 34 |
| Quarterly Schedule of Investments | 34 |
| Federal Tax Distribution Information | 34 |
| Important Notice Regarding Delivery of Shareholder Documents | 34 |
| Privacy Policy | 35 |
| HENNESSY FUNDS | 1-800-966-4354 | |
December 2018
Dear Hennessy Funds Shareholder:
Over the past year, we have witnessed the return of market volatility. U.S. stocks still registered healthy gains, bolstered by the impact on corporate profits of the successful passage of the tax reform bill in December 2017. However, concerns over potential trade disruptions, especially between the U.S. and China, and worries over higher short-term interest rates, which many believe could possibly trigger a recession down the road, put downward pressure on equity valuations.
The U.S. economy performed well over the period, and actually achieved an acceleration in GDP growth to over 3% on an annualized basis in the second and third quarters of calendar year 2018. During the past year, companies continued to hire workers, adding over 200,000 jobs per month on average, sending the unemployment rate down to 3.7% in October, which is the lowest it has been since 1969. Consumer confidence is high and still rising, and corporate profits reached record levels in the third quarter of calendar year 2018, posting a year-over-year increase of 26% for the companies in the S&P 500 Index.
The Federal Reserve, confident about the strength of the economy and mindful of a tight labor market, raised short-term interest rates four times over the last year, by a quarter point each time. Long-term bond yields also rose, driven higher primarily by evidence of faster wage growth, pushing the U.S. 10-year Treasury bond over 3% for the first time since 2013.
As I write this, we are experiencing the market’s 20th downturn since 2010. I have been saying that every bull market experiences volatility and pullbacks. Many financial commentators think this bull market is “long in the tooth.” I do not agree with them. I believe stock valuations are still very reasonable. The prospective price to earnings multiple for the Dow Jones Industrial Average has come down from almost 20x at the end of 2017 to 16x, just above its 10-year average of 15x. The prospective PE multiple for the S&P 500 Index has also come down, from 20x to 17x, and compares favorably to its 10-year average of 16x.
Cash, meanwhile, continues to build up on corporate balance sheets. The companies in the S&P 500 Index reported a total of over $5.4 trillion in cash and marketable securities in their latest filings. Companies have been spending some of their cash, increasing their investment spending and laying the groundwork for future earnings growth. However, they have also been returning capital to shareholders. S&P 500 Index companies announced $433.6 billion in share repurchases during the second quarter of calendar year 2018, nearly doubling the previous record of $242.1 billion set in the first quarter. Companies are also raising their dividends.
In addition, I believe the Federal Reserve will take care not to raise interest rates too high or too fast and endanger the economic expansion. While wage growth has risen to over 3% in October, other measures of inflationary pressure, such as the Consumer Price Index and the Producer Price Index, still show prices increasing at a more moderate pace, closer to 2%. Given continued evidence of modest rates of inflation, I believe the Fed will be able to maintain its gradual pace of interest rate hikes.
Finally and importantly, I still see no signs of euphoria in this market. In my opinion, the enthusiasm present earlier in the year, which followed the significant reduction in corporate income tax rates, has largely evaporated, and it has been replaced with anxiety
over higher interest rates and their potential impact on growth. In the past, I have likened the current bull market to that of 1982-2000, and I still believe this comparison holds true. I am confident in the strength of the market today and believe the economy will continue to grow in the coming year, albeit at a more moderate pace.
Thank you for your continued confidence and investment in the Hennessy Funds. If you have any questions or would like to speak with us directly, please don’t hesitate to call us at (800) 966-4354.
Best regards,
Neil J. Hennessy
President and Chief Investment Officer
Past performance does not guarantee future results.
Mutual fund investing involves risk. Principal loss is possible.
Opinions expressed are those of Neil Hennessy and are subject to change, are not guaranteed, and should not be considered investment advice.
The Dow Jones Industrial Average and S&P 500 Index are commonly used to measure the performance of U.S. stocks. One cannot invest directly in an index.
PE, or price to earnings, is a valuation measure and is calculated by dividing a company’s market price per share by its earnings per share. Earnings growth is not a measure of a fund’s future performance.
| HENNESSY FUNDS | 1-800-966-4354 | |
Performance Overview (Unaudited)
CHANGE IN VALUE OF $10,000 INVESTMENT
This graph illustrates the performance of an initial investment of $10,000 made in the Fund on its inception date and assumes the reinvestment of dividends.
AVERAGE ANNUAL TOTAL RETURN FOR PERIODS ENDED OCTOBER 31, 2018
| | | | Since |
| | One | Five | Inception |
| | Year | Years | (3/20/09) |
| Hennessy Cornerstone Large Growth Fund – | | | |
| Investor Class (HFLGX) | 8.53% | 9.12% | 15.53% |
| Hennessy Cornerstone Large Growth Fund – | | | |
| Institutional Class (HILGX) | 8.82% | 9.36% | 15.82% |
Russell 1000® Index | 6.98% | 11.05% | 16.53% |
| S&P 500 Index | 7.35% | 11.34% | 16.42% |
Expense ratios: 1.26% (Investor Class); Gross 1.01%, Net 0.99%(1) (Institutional Class)
(1) | The Fund’s investment advisor has contractually agreed to limit expenses until November 30, 2019. |
Performance data quoted represents past performance; past performance does not guarantee future results. The investment return and principal value of an investment will fluctuate so that an investor’s shares, when redeemed, may be worth more or less than their original cost. The performance table does not reflect the deduction of taxes that a shareholder would pay on Fund distributions or the redemption of Fund shares. Current performance of the Fund may be lower or higher than the performance quoted. Performance data current to the most recent month end may be obtained by visiting www.hennessyfunds.com.
The Russell 1000® Index is commonly used to measure the performance of U.S. large-capitalization stocks. The S&P 500 Index is commonly used to measure the performance of U.S. stocks. One cannot invest directly in an index.
Frank Russell Company (“Russell”) is the source and owner of the trademarks, service marks, and copyrights related to the Russell Indexes. Russell® is a trademark of Frank Russell Company. Neither Russell nor its licensors accept any liability for any errors or omissions in the Russell Indexes or Russell ratings or underlying data and no party may rely on any Russell Indexes or Russell ratings or underlying data contained in this communication. No further distribution of Russell data is permitted without Russell’s express written consent. Russell does not promote, sponsor, or endorse the content of this communication.
The expense ratios presented are from the most recent prospectus. The expense ratios for the current reporting period are available in the Financial Highlights section of this report.
PERFORMANCE NARRATIVE
Portfolio Managers Neil J. Hennessy and Ryan C. Kelley
Performance:
For the 12-month period ended October 31, 2018, the Investor Class of the Hennessy Cornerstone Large Growth Fund returned 8.53%, outperforming both the Russell 1000® Index (the Fund’s primary benchmark) and the S&P 500 Index, which returned 6.98% and 7.35%, respectively, for the same period.
The Fund’s outperformance relative to its primary benchmark can be attributed predominantly to stock selection, particularly in the Health Care and Industrials sectors. Hospital operator HCA Healthcare, Inc., pharmaceutical companies AbbVie, Inc. and AmerisourceBergen Corp., and medical distributor Express Scripts Holding Co. were among the holdings that contributed most to relative performance in the Health Care sector. In the Industrials sector, airline operators United Continental Holdings, Inc. and Delta Air Lines, Inc. and railroads CSX Corp. and Union Pacific Corp. were strong performers over the period and contributed positively to the Fund’s relative return. Many holdings in the Consumer Discretionary sector also performed well over the period, including Target Corp., Kohl’s Corp., and Darden Restaurants, Inc. This positive performance was partially offset by the weak performances of several stocks in the Information Technology sector, including Applied Materials, Inc. and Micron Technology, Inc.
The Fund continues to hold all of the companies mentioned with the exception of AbbVie, Inc. and AmerisourceBergen Corp.
Portfolio Strategy:
The Fund utilizes a quantitative approach to build a portfolio of attractively valued, highly profitable, larger-cap companies. In essence, the strategy seeks high-quality, high-return companies that are possibly being overlooked by investors by selecting 50 larger-cap stocks that have relatively low price-to-cash-flow ratios and have generated high returns on capital over the past year.
Investment Commentary:
We continue to believe that the outlook for large-cap stocks is positive. The U.S. economy is growing at a healthy rate, unemployment is low, and growth in both consumption and capital spending has accelerated over the last 12 months. Corporate earnings have risen significantly over the first nine months of 2018, helped, in part, by lower taxes. We expect earnings growth to be slower next year yet remain positive, driven primarily by continued steady economic growth.
There are three primary industry groups where the Fund currently maintains overweight positions: Transportation, Retailing, and Food, Beverage & Tobacco. Many transportation and retailing companies have been benefiting from strong economic growth and, therefore, have seen profitability and returns on capital rise. As a result, the Fund owns certain stocks from these groups, including United Continental Holdings, Inc., Delta Air Lines, Inc., Target Corp., and Kohl’s Corp. Food, Beverage, & Tobacco industry stocks have lagged the general market, and we believe many now look undervalued. Despite this underperformance, many of the Fund’s holdings in this industry group have maintained strong levels of profitability and have continued to generate high returns on total capital and steady earnings growth.
| HENNESSY FUNDS | 1-800-966-4354 | |
_______________
Opinions expressed are those of the Portfolio Managers as of the date written and are subject to change, are not guaranteed, and should not be considered investment advice or an indication of trading intent.
The Fund may invest in medium-capitalization companies, which may have more limited liquidity and greater price volatility than large-capitalization companies. The Fund’s formula-based strategy may cause the Fund to buy or sell securities at times when it may not be advantageous. Please see the Fund’s prospectus for a more complete discussion of these and other risks.
References to specific securities should not be considered a recommendation to buy or sell any security. Fund holdings and sector allocations are subject to change. Please refer to the Schedule of Investments included in this report for additional portfolio information.
Earnings growth is not a measure of the Fund’s future performance. Price-to-cash-flow ratio is a valuation measure calculated by dividing a company’s market price per share by its cash flow per share. Return on capital measures a company’s profitability and is calculated by expressing net profits minus dividends as a percentage of total capital.
| PERFORMANCE OVERVIEW/SCHEDULE OF INVESTMENTS |
Financial Statements
Schedule of Investments as of October 31, 2018 |
HENNESSY CORNERSTONE LARGE GROWTH FUND
(% of Net Assets)
| TOP TEN HOLDINGS (EXCLUDING MONEY MARKET FUNDS) | % NET ASSETS |
| HCA Healthcare, Inc. | 2.63% |
| Apple, Inc. | 2.61% |
| United Continental Holdings, Inc. | 2.58% |
| Express Scripts Holding Co. | 2.58% |
| CSX Corp. | 2.51% |
| Centene Corp. | 2.45% |
| Kohl’s Corp. | 2.40% |
| HP, Inc. | 2.29% |
| Walgreens Boots Alliance, Inc. | 2.26% |
| Target Corp. | 2.25% |
Note: For presentation purposes, the Fund has grouped some of the industry categories. For purposes of categorizing securities for compliance with Section 8(b)(1) of the Investment Company Act of 1940, as amended, the Fund uses more specific industry classifications.
The Global Industry Classification Standard (GICS®) was developed by and is the exclusive property and a service mark of MSCI, Inc. and Standard & Poor Financial Services LLC. It has been licensed for use by the Hennessy Funds.
| HENNESSY FUNDS | 1-800-966-4354 | |
| COMMON STOCKS – 96.01% | | Number | | | | | | % of | |
| | | of Shares | | | Value | | | Net Assets | |
| Communication Services – 8.28% | | | | | | | | | |
| CBS Corp., Class B | | | 52,900 | | | $ | 3,033,815 | | | | 2.09 | % |
| Omnicom Group, Inc. | | | 35,700 | | | | 2,653,224 | | | | 1.83 | % |
| The Walt Disney Co. | | | 27,200 | | | | 3,123,376 | | | | 2.15 | % |
| Verizon Communications, Inc. | | | 56,100 | | | | 3,202,749 | | | | 2.21 | % |
| | | | | | | | 12,013,164 | | | | 8.28 | % |
| | | | | | | | | | | | | |
| Consumer Discretionary – 18.86% | | | | | | | | | | | | |
| AutoZone, Inc. (a) | | | 3,900 | | | | 2,860,533 | | | | 1.97 | % |
| Best Buy Co., Inc. | | | 40,000 | | | | 2,806,400 | | | | 1.93 | % |
| Darden Restaurants, Inc. | | | 29,900 | | | | 3,185,845 | | | | 2.20 | % |
| General Motors Co. | | | 67,000 | | | | 2,451,530 | | | | 1.69 | % |
| Kohl’s Corp. | | | 46,000 | | | | 3,483,580 | | | | 2.40 | % |
| L Brands, Inc. | | | 57,800 | | | | 1,873,876 | | | | 1.29 | % |
| Starbucks Corp. | | | 50,770 | | | | 2,958,368 | | | | 2.04 | % |
| Target Corp. | | | 39,100 | | | | 3,269,933 | | | | 2.25 | % |
| The Gap, Inc. | | | 89,500 | | | | 2,443,350 | | | | 1.68 | % |
| Wyndham Hotels & Resorts, Inc. | | | 23,900 | | | | 1,178,031 | | | | 0.81 | % |
| Wyndham Worldwide Corp. | | | 24,200 | | | | 868,296 | | | | 0.60 | % |
| | | | | | | | 27,379,742 | | | | 18.86 | % |
| | | | | | | | | | | | | |
| Consumer Staples – 18.64% | | | | | | | | | | | | |
| Altria Group, Inc. | | | 43,000 | | | | 2,796,720 | | | | 1.93 | % |
| Campbell Soup Co. | | | 60,700 | | | | 2,270,787 | | | | 1.56 | % |
| Conagra Brands, Inc. | | | 78,800 | | | | 2,805,280 | | | | 1.93 | % |
| CVS Health Corp. | | | 40,300 | | | | 2,917,317 | | | | 2.01 | % |
| General Mills, Inc. | | | 51,200 | | | | 2,242,560 | | | | 1.54 | % |
| Kimberly-Clark Corp. | | | 24,700 | | | | 2,576,210 | | | | 1.77 | % |
| The Kroger Co. | | | 103,400 | | | | 3,077,184 | | | | 2.12 | % |
| Tyson Foods, Inc., Class A | | | 37,700 | | | | 2,258,984 | | | | 1.56 | % |
| Walgreens Boots Alliance, Inc. | | | 41,100 | | | | 3,278,547 | | | | 2.26 | % |
| Walmart, Inc. | | | 28,300 | | | | 2,837,924 | | | | 1.96 | % |
| | | | | | | | 27,061,513 | | | | 18.64 | % |
| | | | | | | | | | | | | |
| Financials – 3.62% | | | | | | | | | | | | |
| Allstate Corp. | | | 31,000 | | | | 2,967,320 | | | | 2.04 | % |
| Ameriprise Financial, Inc. | | | 18,000 | | | | 2,290,320 | | | | 1.58 | % |
| | | | | | | | 5,257,640 | | | | 3.62 | % |
The accompanying notes are an integral part of these financial statements.
| COMMON STOCKS | | Number | | | | | | % of | |
| | | of Shares | | | Value | | | Net Assets | |
| Health Care – 7.66% | | | | | | | | | |
| Centene Corp. (a) | | | 27,300 | | | $ | 3,557,736 | | | | 2.45 | % |
| Express Scripts Holding Co. (a) | | | 38,600 | | | | 3,743,042 | | | | 2.58 | % |
| HCA Healthcare, Inc. | | | 28,600 | | | | 3,818,958 | | | | 2.63 | % |
| | | | | | | | 11,119,736 | | | | 7.66 | % |
| | | | | | | | | | | | | |
| Industrials – 19.57% | | | | | | | | | | | | |
| American Airlines Group, Inc. | | | 56,200 | | | | 1,971,496 | | | | 1.36 | % |
| CSX Corp. | | | 52,900 | | | | 3,642,694 | | | | 2.51 | % |
| Deere & Co. | | | 17,700 | | | | 2,397,288 | | | | 1.65 | % |
| Delta Air Lines, Inc. | | | 54,000 | | | | 2,955,420 | | | | 2.04 | % |
| FedEx Corp. | | | 11,700 | | | | 2,577,978 | | | | 1.78 | % |
| PACCAR, Inc. | | | 41,200 | | | | 2,357,052 | | | | 1.62 | % |
| Southwest Airlines Co. | | | 49,500 | | | | 2,430,450 | | | | 1.67 | % |
| Union Pacific Corp. | | | 21,898 | | | | 3,201,925 | | | | 2.21 | % |
| United Continental Holdings, Inc. (a) | | | 43,900 | | | | 3,753,889 | | | | 2.58 | % |
| Waste Management, Inc. | | | 34,900 | | | | 3,122,503 | | | | 2.15 | % |
| | | | | | | | 28,410,695 | | | | 19.57 | % |
| | | | | | | | | | | | | |
| Information Technology – 13.02% | | | | | | | | | | | | |
| Apple, Inc. | | | 17,330 | | | | 3,792,844 | | | | 2.61 | % |
| Applied Materials, Inc. | | | 56,800 | | | | 1,867,584 | | | | 1.29 | % |
| HP, Inc. | | | 137,800 | | | | 3,326,492 | | | | 2.29 | % |
| Intel Corp. | | | 62,750 | | | | 2,941,720 | | | | 2.03 | % |
| International Business Machines Corp. | | | 18,600 | | | | 2,146,998 | | | | 1.48 | % |
| Lam Research Corp. | | | 16,300 | | | | 2,310,199 | | | | 1.59 | % |
| Micron Technology, Inc. (a) | | | 66,700 | | | | 2,515,924 | | | | 1.73 | % |
| | | | | | | | 18,901,761 | | | | 13.02 | % |
| | | | | | | | | | | | | |
| Materials – 6.36% | | | | | | | | | | | | |
| Eastman Chemical Co. | | | 28,800 | | | | 2,256,480 | | | | 1.55 | % |
| Freeport-McMoRan, Inc. | | | 160,100 | | | | 1,865,165 | | | | 1.29 | % |
| Nucor Corp. | | | 44,300 | | | | 2,619,016 | | | | 1.80 | % |
| Steel Dynamics, Inc. | | | 62,900 | | | | 2,490,840 | | | | 1.72 | % |
| | | | | | | | 9,231,501 | | | | 6.36 | % |
| Total Common Stocks | | | | | | | | | | | | |
| (Cost $131,231,207) | | | | | | | 139,375,752 | | | | 96.01 | % |
The accompanying notes are an integral part of these financial statements.
| HENNESSY FUNDS | 1-800-966-4354 | |
| SHORT-TERM INVESTMENTS – 4.12% | | Number | | | | | | % of | |
| | | of Shares | | | Value | | | Net Assets | |
| Money Market Funds – 4.12% | | | | | | | | | |
| Fidelity Government Portfolio, Institutional Class, 2.06% (b) | | | 5,979,305 | | | $ | 5,979,305 | | | | 4.12 | % |
| | | | | | | | | | | | | |
| Total Short-Term Investments | | | | | | | | | | | | |
| (Cost $5,979,305) | | | | | | | 5,979,305 | | | | 4.12 | % |
| | | | | | | | | | | | | |
| Total Investments | | | | | | | | | | | | |
| (Cost $137,210,512) – 100.13% | | | | | | | 145,355,057 | | | | 100.13 | % |
| Liabilities in Excess of Other Assets – (0.13)% | | | | | | | (193,434 | ) | | | (0.13 | )% |
| | | | | | | | | | | | | |
TOTAL NET ASSETS – 100.00% | | | | | | $ | 145,161,623 | | | | 100.00 | % |
Percentages are stated as a percent of net assets.
| (a) | Non-income producing security. |
| (b) | The rate listed is the fund’s seven-day yield as of October 31, 2018. |
Summary of Fair Value Exposure at October 31, 2018
The following is a summary of the inputs used to value the Fund’s net assets as of October 31, 2018 (See Note 3 in the accompanying notes to the financial statements):
| Common Stocks | | Level 1 | | | Level 2 | | | Level 3 | | | Total | |
| Communication Services | | $ | 12,013,164 | | | $ | — | | | $ | — | | | $ | 12,013,164 | |
| Consumer Discretionary | | | 27,379,742 | | | | — | | | | — | | | | 27,379,742 | |
| Consumer Staples | | | 27,061,513 | | | | — | | | | — | | | | 27,061,513 | |
| Financials | | | 5,257,640 | | | | — | | | | — | | | | 5,257,640 | |
| Health Care | | | 11,119,736 | | | | — | | | | — | | | | 11,119,736 | |
| Industrials | | | 28,410,695 | | | | — | | | | — | | | | 28,410,695 | |
| Information Technology | | | 18,901,761 | | | | — | | | | — | | | | 18,901,761 | |
| Materials | | | 9,231,501 | | | | — | | | | — | | | | 9,231,501 | |
| Total Common Stocks | | $ | 139,375,752 | | | $ | — | | | $ | — | | | $ | 139,375,752 | |
| Short-Term Investments | | | | | | | | | | | | | | | | |
| Money Market Funds | | $ | 5,979,305 | | | $ | — | | | $ | — | | | $ | 5,979,305 | |
| Total Short-Term Investments | | $ | 5,979,305 | | | $ | — | | | $ | — | | | $ | 5,979,305 | |
| Total Investments | | $ | 145,355,057 | | | $ | — | | | $ | — | | | $ | 145,355,057 | |
The accompanying notes are an integral part of these financial statements.
| SCHEDULE OF INVESTMENTS/STATEMENT OF ASSETS AND LIABILITIES |
Financial Statements
Statement of Assets and Liabilities as of October 31, 2018 |
| ASSETS: | | | |
| Investments in securities, at value (cost $137,210,512) | | $ | 145,355,057 | |
| Dividends and interest receivable | | | 166,239 | |
| Receivable for fund shares sold | | | 4,894 | |
| Prepaid expenses and other assets | | | 16,777 | |
| Total Assets | | | 145,542,967 | |
| | | | | |
| LIABILITIES: | | | | |
| Payable for fund shares redeemed | | | 5,056 | |
| Payable to advisor | | | 92,600 | |
| Payable to administrator | | | 13,178 | |
| Payable to auditor | | | 21,900 | |
| Accrued distribution fees | | | 226,211 | |
| Accrued service fees | | | 10,857 | |
| Accrued trustees fees | | | 5,963 | |
| Accrued expenses and other payables | | | 5,579 | |
| Total Liabilities | | | 381,344 | |
| NET ASSETS | | $ | 145,161,623 | |
| | | | | |
| NET ASSETS CONSIST OF: | | | | |
| Capital stock | | $ | 108,975,614 | |
| Total distributable earnings | | | 36,186,009 | |
| Total Net Assets | | $ | 145,161,623 | |
| | | | | |
| NET ASSETS | | | | |
| Investor Class: | | | | |
| Shares authorized (no par value) | | Unlimited | |
| Net assets applicable to outstanding Investor Class shares | | $ | 125,908,520 | |
| Shares issued and outstanding | | | 10,284,365 | |
| Net asset value, offering price and redemption price per share | | $ | 12.24 | |
| | | | | |
| Institutional Class: | | | | |
| Shares authorized (no par value) | | Unlimited | |
| Net assets applicable to outstanding Institutional Class shares | | $ | 19,253,103 | |
| Shares issued and outstanding | | | 1,555,060 | |
| Net asset value, offering price and redemption price per share | | $ | 12.38 | |
The accompanying notes are an integral part of these financial statements.
| HENNESSY FUNDS | 1-800-966-4354 | |
Financial Statements
Statement of Operations for the year ended October 31, 2018 |
| INVESTMENT INCOME: | | | |
| Dividend income | | $ | 3,062,722 | |
| Interest income | | | 62,738 | |
| Total investment income | | | 3,125,460 | |
| | | | | |
| EXPENSES: | | | | |
| Investment advisory fees (See Note 5) | | | 1,127,992 | |
| Distribution fees – Investor Class (See Note 5) | | | 197,920 | |
| Administration, fund accounting, custody and transfer agent fees (See Note 5) | | | 146,207 | |
| Service fees – Investor Class (See Note 5) | | | 131,947 | |
| Sub-transfer agent expenses – Investor Class (See Note 5) | | | 97,529 | |
| Sub-transfer agent expenses – Institutional Class (See Note 5) | | | 7,888 | |
| Federal and state registration fees | | | 30,371 | |
| Compliance expense (See Note 5) | | | 29,509 | |
| Audit fees | | | 23,134 | |
| Trustees’ fees and expenses | | | 17,151 | |
| Reports to shareholders | | | 15,705 | |
| Legal fees | | | 834 | |
| Other expenses | | | 9,259 | |
| Total expenses before recoupment from advisor | | | 1,835,446 | |
| Expense recoupment by advisor – Institutional Class | | | 238 | |
| Net expenses | | | 1,835,684 | |
| NET INVESTMENT INCOME | | $ | 1,289,776 | |
| | | | | |
| REALIZED AND UNREALIZED GAINS (LOSSES): | | | | |
| Net realized gain on investments | | $ | 29,755,376 | |
| Net change in unrealized appreciation/depreciation on investments | | | (20,362,172 | ) |
| Net gain on investments | | | 9,393,204 | |
| NET INCREASE IN NET ASSETS RESULTING FROM OPERATIONS | | $ | 10,682,980 | |
The accompanying notes are an integral part of these financial statements.
(This Page Intentionally Left Blank.)
| HENNESSY FUNDS | 1-800-966-4354 | |
Financial Statements
| Statements of Changes in Net Assets |
| | | Year Ended | | | Year Ended | |
| | | October 31, 2018 | | | October 31, 2017 | |
| OPERATIONS: | | | | | | |
| Net investment income | | $ | 1,289,776 | | | $ | 1,052,238 | |
| Net realized gain on investments | | | 29,755,376 | | | | 10,781,271 | |
| Net change in unrealized | | | | | | | | |
| appreciation/depreciation on investments | | | (20,362,172 | ) | | | 3,606,256 | |
| Net increase in net assets resulting from operations | | | 10,682,980 | | | | 15,439,765 | |
| | | | | | | | | |
| DISTRIBUTIONS TO SHAREHOLDERS FROM: | | | | | | | | |
| Distributable earnings – Investor Class | | | (5,633,818 | ) | | | (1,086,070 | ) |
| Distributable earnings – Institutional Class | | | (941,276 | ) | | | (172,457 | ) |
| Total distributions | | | (6,575,094 | ) | | | (1,258,527 | )(1) |
| | | | | | | | | |
| CAPITAL SHARE TRANSACTIONS: | | | | | | | | |
| Proceeds from shares issued in | | | | | | | | |
| the Reorganization – Investor Class (See Note 9) | | | 42,940,857 | | | | — | |
| Proceeds from shares issued in | | | | | | | | |
| the Reorganization – Institutional Class (See Note 9) | | | 9,672,906 | | | | — | |
| Proceeds from shares subscribed – Investor Class | | | 2,864,547 | | | | 6,295,964 | |
| Proceeds from shares subscribed – Institutional Class | | | 995,312 | | | | 772,639 | |
| Dividends reinvested – Investor Class | | | 5,350,903 | | | | 1,010,431 | |
| Dividends reinvested – Institutional Class | | | 911,739 | | | | 169,405 | |
| Cost of shares redeemed – Investor Class | | | (20,588,670 | ) | | | (15,757,878 | ) |
| Cost of shares redeemed – Institutional Class | | | (5,008,275 | ) | | | (2,723,788 | ) |
| Net increase (decrease) in net assets | | | | | | | | |
| derived from capital share transactions | | | 37,139,319 | | | | (10,233,227 | ) |
| TOTAL INCREASE IN NET ASSETS | | | 41,247,205 | | | | 3,948,011 | |
| | | | | | | | | |
| NET ASSETS: | | | | | | | | |
| Beginning of year | | | 103,914,418 | | | | 99,966,407 | |
| End of year | | $ | 145,161,623 | | | $ | 103,914,418 | (2) |
(1) | All distributions were from net investment income. |
(2) | Includes accumulated net investment income of $1,052,238. |
The accompanying notes are an integral part of these financial statements.
| STATEMENTS OF CHANGES IN NET ASSETS |
Financial Statements
| Statements of Changes in Net Assets |
| | | Year Ended | | | Year Ended | |
| | | October 31, 2018 | | | October 31, 2017 | |
| CHANGES IN SHARES OUTSTANDING: | | | | | | |
| Shares issued in the Reorganization – Investor Class | | | 3,458,944 | | | | — | |
| Shares issued in the Reorganization – Institutional Class | | | 771,378 | | | | — | |
| Shares sold – Investor Class | | | 230,354 | | | | 565,507 | |
| Shares sold – Institutional Class | | | 78,488 | | | | 68,027 | |
| Shares issued to holders as reinvestment | | | | | | | | |
| of dividends – Investor Class | | | 442,489 | | | | 92,025 | |
| Shares issued to holders as reinvestment | | | | | | | | |
| of dividends – Institutional Class | | | 74,617 | | | | 15,303 | |
| Shares redeemed – Investor Class | | | (1,653,034 | ) | | | (1,394,127 | ) |
| Shares redeemed – Institutional Class | | | (395,137 | ) | | | (238,017 | ) |
| Net increase (decrease) in shares outstanding | | | 3,008,099 | | | | (891,282 | ) |
The accompanying notes are an integral part of these financial statements.
| HENNESSY FUNDS | 1-800-966-4354 | |
Financial Statements
For an Investor Class share outstanding throughout each year
PER SHARE DATA:
Net asset value, beginning of year
Income from investment operations:
Net investment income
Net realized and unrealized gains on investments
Total from investment operations
Less distributions:
Dividends from net investment income
Dividends from net realized gains
Total distributions
Net asset value, end of year
TOTAL RETURN
SUPPLEMENTAL DATA AND RATIOS:
Net assets, end of year (millions)
Ratio of expenses to average net assets
Ratio of net investment income to average net assets
Portfolio turnover rate(1)
(1) | Portfolio turnover is calculated on the basis of the Fund as a whole. |
The accompanying notes are an integral part of these financial statements.
| FINANCIAL HIGHLIGHTS — INVESTOR CLASS |
| Year Ended October 31, | |
| 2018 | | | 2017 | | | 2016 | | | 2015 | | | 2014 | |
| | | | | | | | | | | | | | |
| $ | 11.75 | | | $ | 10.27 | | | $ | 12.99 | | | $ | 15.16 | | | $ | 13.56 | |
| | | | | | | | | | | | | | | | | | | |
| | | | | | | | | | | | | | | | | | | |
| | 0.06 | | | | 0.11 | | | | 0.09 | | | | 0.17 | | | | 0.15 | |
| | 0.94 | | | | 1.49 | | | | 0.08 | | | | 0.04 | | | | 2.28 | |
| | 1.00 | | | | 1.60 | | | | 0.17 | | | | 0.21 | | | | 2.43 | |
| | | | | | | | | | | | | | | | | | | |
| | | | | | | | | | | | | | | | | | | |
| | (0.08 | ) | | | (0.12 | ) | | | (0.16 | ) | | | (0.14 | ) | | | (0.15 | ) |
| | (0.43 | ) | | | — | | | | (2.73 | ) | | | (2.24 | ) | | | (0.68 | ) |
| | (0.51 | ) | | | (0.12 | ) | | | (2.89 | ) | | | (2.38 | ) | | | (0.83 | ) |
| $ | 12.24 | | | $ | 11.75 | | | $ | 10.27 | | | $ | 12.99 | | | $ | 15.16 | |
| | | | | | | | | | | | | | | | | | | |
| | 8.53 | % | | | 15.70 | % | | | 2.63 | % | | | 1.11 | % | | | 18.73 | % |
| | | | | | | | | | | | | | | | | | | |
| | | | | | | | | | | | | | | | | | | |
| $ | 125.91 | | | $ | 91.74 | | | $ | 87.73 | | | $ | 98.64 | | | $ | 105.51 | |
| | 1.24 | % | | | 1.25 | % | | | 1.25 | % | | | 1.09 | % | | | 1.15 | % |
| | 0.81 | % | | | 0.95 | % | | | 1.22 | % | | | 1.37 | % | | | 1.12 | % |
| | 70 | % | | | 65 | % | | | 53 | % | | | 79 | % | | | 57 | % |
The accompanying notes are an integral part of these financial statements.
| HENNESSY FUNDS | 1-800-966-4354 | |
Financial Statements
For an Institutional Class share outstanding throughout each year
PER SHARE DATA:
Net asset value, beginning of year
Income from investment operations:
Net investment income
Net realized and unrealized gains on investments
Total from investment operations
Less distributions:
Dividends from net investment income
Dividends from net realized gains
Total distributions
Net asset value, end of year
TOTAL RETURN
SUPPLEMENTAL DATA AND RATIOS:
Net assets, end of year (millions)
Ratio of expenses to average net assets:
Before expense reimbursement/recoupment
After expense reimbursement/recoupment
Ratio of net investment income to average net assets:
Before expense reimbursement/recoupment
After expense reimbursement/recoupment
Portfolio turnover rate(1)
(1) | Portfolio turnover is calculated on the basis of the Fund as a whole. |
The accompanying notes are an integral part of these financial statements.
| FINANCIAL HIGHLIGHTS — INSTITUTIONAL CLASS |
| Year Ended October 31, | |
| 2018 | | | 2017 | | | 2016 | | | 2015 | | | 2014 | |
| | | | | | | | | | | | | | |
| $ | 11.87 | | | $ | 10.37 | | | $ | 13.10 | | | $ | 15.30 | | | $ | 13.68 | |
| | | | | | | | | | | | | | | | | | | |
| | | | | | | | | | | | | | | | | | | |
| | 0.14 | | | | 0.13 | | | | 0.13 | | | | 0.20 | | | | 0.17 | |
| | 0.90 | | | | 1.52 | | | | 0.07 | | | | 0.02 | | | | 2.30 | |
| | 1.04 | | | | 1.65 | | | | 0.20 | | | | 0.22 | | | | 2.47 | |
| | | | | | | | | | | | | | | | | | | |
| | | | | | | | | | | | | | | | | | | |
| | (0.10 | ) | | | (0.15 | ) | | | (0.17 | ) | | | (0.16 | ) | | | (0.17 | ) |
| | (0.43 | ) | | | — | | | | (2.76 | ) | | | (2.26 | ) | | | (0.68 | ) |
| | (0.53 | ) | | | (0.15 | ) | | | (2.93 | ) | | | (2.42 | ) | | | (0.85 | ) |
| $ | 12.38 | | | $ | 11.87 | | | $ | 10.37 | | | $ | 13.10 | | | $ | 15.30 | |
| | | | | | | | | | | | | | | | | | | |
| | 8.82 | % | | | 16.00 | % | | | 2.92 | % | | | 1.19 | % | | | 18.96 | % |
| | | | | | | | | | | | | | | | | | | |
| | | | | | | | | | | | | | | | | | | |
| $ | 19.25 | | | $ | 12.17 | | | $ | 12.24 | | | $ | 13.82 | | | $ | 14.88 | |
| | | | | | | | | | | | | | | | | | | |
| | 0.96 | % | | | 1.00 | % | | | 1.01 | % | | | 0.99 | % | | | 1.06 | % |
| | 0.96 | % | | | 1.00 | % | | | 1.01 | % | | | 0.99 | % | | | 0.98 | % |
| | | | | | | | | | | | | | | | | | | |
| | 1.08 | % | | | 1.20 | % | | | 1.47 | % | | | 1.47 | % | | | 1.21 | % |
| | 1.08 | % | | | 1.20 | % | | | 1.47 | % | | | 1.47 | % | | | 1.30 | % |
| | 70 | % | | | 65 | % | | | 53 | % | | | 79 | % | | | 57 | % |
The accompanying notes are an integral part of these financial statements.
| HENNESSY FUNDS | 1-800-966-4354 | |
Financial Statements
Notes to the Financial Statements October 31, 2018 |
1). ORGANIZATION
The Hennessy Cornerstone Large Growth Fund (the “Fund”) is a series of Hennessy Funds Trust (the “Trust”), which was organized as a Delaware statutory trust on September 17, 1992. The Fund is an open-end management investment company registered under the Investment Company Act of 1940, as amended. The investment objective of the Fund is long-term growth of capital. The Fund is a diversified fund.
The Fund offers Investor Class and Institutional Class shares. Each class of shares differs principally in its respective 12b-1 distribution and service, shareholder servicing, and sub-transfer agent expenses. There are no sales charges. Each class has identical rights to earnings, assets, and voting privileges, except for class-specific expenses and exclusive rights to vote on matters affecting only an individual class.
As an investment company, the Fund follows the investment company accounting and reporting guidance of the Financial Accounting Standards Board (“FASB”) Accounting Standard Codification Topic 946 “Financial Services—Investment Companies.”
2). SIGNIFICANT ACCOUNTING POLICIES
The following is a summary of significant accounting policies consistently followed by the Fund in the preparation of the financial statements. These policies conform to U.S. generally accepted accounting principles (“GAAP”).
| a). | Securities Valuation – All investments in securities are recorded at their estimated fair value, as described in Note 3. |
| | |
| b). | Federal Income Taxes – No provision for federal income taxes or excise taxes has been made because the Fund has elected to be taxed as a regulated investment company and intends to distribute substantially all of its taxable income to its shareholders and otherwise comply with the provisions of the Internal Revenue Code of 1986, as amended, applicable to regulated investment companies. Net investment income/loss and realized gains/losses for federal income tax purposes may differ from those reported in the financial statements because of temporary book and tax basis differences. Temporary differences are primarily the result of the treatment of wash sales for tax reporting purposes. The Fund recognizes interest and penalties related to income tax benefits, if any, in the Statement of Operations as an income tax expense. Distributions from net realized gains for book purposes may include short-term capital gains, which are included as ordinary income to shareholders for tax purposes. The Fund may utilize equalization accounting for tax purposes and designate earnings and profits, including net realized gains distributed to shareholders on redemption of shares, as part of the dividends paid deduction for income tax purposes. |
| | |
| | Due to inherent differences in the recognition of income, expenses, and realized gains/losses under GAAP and federal income tax regulations, permanent differences between book and tax basis for reporting for fiscal year 2018 have been identified and appropriately reclassified in the Statement of Assets and Liabilities. The adjustments are as follows: |
| Total | |
| Distributable | |
Earnings | Capital Stock |
| $(3,003,589) | $3,003,589 |
| NOTES TO THE FINANCIAL STATEMENTS |
| c). | Accounting for Uncertainty in Income Taxes – The Fund has accounting policies regarding recognition and measurement of tax positions taken or expected to be taken on a tax return. The tax returns of the Fund for the prior three fiscal years are open for examination. The Fund has reviewed all open tax years in major jurisdictions and concluded that there is no impact on the Fund’s net assets and no tax liability resulting from unrecognized tax benefits relating to uncertain income tax positions taken or expected to be taken on a tax return. The Fund’s major tax jurisdictions are U.S. federal and Delaware. |
| | |
| d). | Income and Expenses – Dividend income is recognized on the ex-dividend date or as soon as information is available to the Fund. Interest income, which includes the amortization of premium and accretion of discount, is recognized on an accrual basis. Other non-cash dividends are recognized as investment income at the fair value of the property received. The Fund is charged for those expenses that are directly attributable to its portfolio, such as advisory, administration, and certain shareholder service fees. Income, expenses (other than expenses attributable to a specific class), and realized and unrealized gains/losses on investments are allocated to each class of shares based on such class’s net assets. |
| | |
| e). | Distributions to Shareholders – Dividends from net investment income for the Fund, if any, are declared and paid annually, usually in December. Distributions of net realized capital gains, if any, are declared and paid annually, usually in December. |
| | |
| f). | Security Transactions – Investment and shareholder transactions are recorded on the trade date. The Fund determines the realized gain/loss from an investment transaction by comparing the original cost of the security lot sold with the net sale proceeds. Discounts and premiums on securities purchased are accreted or amortized, respectively, over the life of each such security. |
| | |
| g). | Use of Estimates – The preparation of financial statements in conformity with GAAP requires management to make estimates and assumptions that affect the reported amounts of assets and liabilities and disclosure of contingent assets and liabilities at the date of the financial statements and the reported change in net assets during the reporting period. Actual results could differ from those estimates. |
| | |
| h). | Share Valuation – The net asset value (“NAV”) per share of the Fund is calculated by dividing (i) the total value of the securities held by the Fund, plus cash and other assets, minus all liabilities (including estimated accrued expenses) by (ii) the total number of shares outstanding for the Fund, rounded to the nearest cent. The Fund’s shares will not be priced on days the New York Stock Exchange is closed for trading. The offering and redemption price per share for the Fund is equal to the Fund’s NAV per share. |
| | |
| i). | New Accounting Pronouncements – In August 2018, the FASB issued Accounting Standards Update No. 2018-13 “Disclosure Framework—Changes to the Disclosure Requirements for Fair Value Measurement” (“ASU 2018-13”). ASU 2018-13 eliminates the requirement to disclose the amount of and reasons for transfers between Level 1 and Level 2 of the fair value hierarchy, the timing of transfers between levels of the fair value hierarchy, and the valuation processes for Level 3 fair value measurements. ASU 2018-13 does not eliminate the requirement to disclose the range and weighted average used to develop significant unobservable inputs for Level 3 fair value measurements, and the changes in unrealized gains and losses for recurring Level 3 fair value measurements. ASU 2018-13 requires that information is provided about the measurement uncertainty of Level 3 fair value measurements as of the reporting date. The guidance is effective for fiscal years beginning after December 15, 2019, and interim periods within those fiscal years. Management has |
| HENNESSY FUNDS | 1-800-966-4354 | |
| | evaluated the impact of this change in guidance, and due to the permissibility of early adoption, modified the Fund’s fair value disclosures for the current reporting period. |
| | |
| j). | New Rule Issuances – In August 2018, the Securities and Exchange Commission issued Final Rule Release No. 33 10532, Disclosure Update and Simplification, which in part amends certain financial statement disclosure requirements of Regulation S-X that have become redundant, duplicative, overlapping, outdated, or superseded, in light of other Commission disclosure requirements, GAAP, or changes in the information environment. The amendments are intended to facilitate the disclosure of information to investors and simplify compliance without significantly altering the total mix of information provided to investors. The amendments to Rule 6-04.17 of Regulation S-X (balance sheet) were amended to require presentation of the total, rather than the components of net assets, of distributable earnings on the balance sheet. Consistent with GAAP, funds will be required to disclose total distributable earnings. The amendments to Rule 6-09 of Regulation S-X (statement of changes in net assets) omit the requirement to separately state the sources of distributions paid as well as omit the requirement to parenthetically state the book basis amount of undistributed net investment income. Instead, consistent with GAAP, funds will be required to disclose the total amount of distributions paid, except that any tax return of capital must be separately disclosed. The requirements of the Final Rule Release are effective November 5, 2018 and the Fund’s Statement of Assets and Liabilities and the Statement of Changes in Net Assets for the current and prior reporting period have been modified accordingly. |
3). SECURITIES VALUATION
The Fund follows fair valuation accounting standards that establish an authoritative definition of fair value and set out a hierarchy for measuring fair value. These standards require additional disclosures about the various inputs and valuation techniques used to develop the measurements of fair value and a discussion of changes in valuation techniques and related inputs during the period. These inputs are summarized in the three broad levels listed below:
| | Level 1 – | Unadjusted, quoted prices in active markets for identical instruments that the Fund has the ability to access at the date of measurement. |
| | | |
| | Level 2 – | Other significant observable inputs (including, but not limited to, quoted prices in active markets for similar instruments, quoted prices in markets that are not active for identical or similar instruments, and model-derived valuations in which all significant inputs and significant value drivers are observable in active markets, such as interest rates, prepayment speeds, credit risk curves, default rates, and similar data). |
| | | |
| | Level 3 – | Significant unobservable inputs (including the Fund’s own assumptions about what market participants would use to price the asset or liability based on the best available information) when observable inputs are unavailable. |
Following is a description of the valuation techniques applied to the Fund’s major categories of assets and liabilities measured at fair value on a recurring basis.
| | Equity Securities – Equity securities, including common stocks, preferred stocks, exchange-traded funds, closed-end mutual funds, partnerships, rights, and real estate investment trusts, that are traded on a securities exchange for which a last-quoted sales price is readily available will generally be valued at the last sales price as reported by the primary exchange on which the securities are listed. Securities listed on The NASDAQ Stock Market (“NASDAQ”) will generally be valued at the NASDAQ Official Closing Price, which may differ from the last sales price reported. |
| NOTES TO THE FINANCIAL STATEMENTS |
| | Securities traded on a securities exchange for which a last-quoted sales price is not readily available will generally be valued at the mean between the bid and ask prices. To the extent these securities are actively traded and valuation adjustments are not applied, they are classified in Level 1 of the fair value hierarchy. |
| | |
| | Registered Investment Companies – Investments in open-end registered investment companies, commonly referred to as mutual funds, are generally priced at the ending NAV provided by the applicable mutual fund’s service agent and will be classified in Level 1 of the fair value hierarchy. |
| | |
| | Debt Securities – Debt securities, including corporate bonds, asset-backed securities, mortgage-backed securities, municipal bonds, U.S. Treasuries, and U.S. government agency issues, are generally valued at market on the basis of valuations furnished by an independent pricing service that utilizes both dealer-supplied valuations and formula-based techniques. The pricing service may consider recently executed transactions in securities of the issuer or comparable issuers, market price quotations (where observable), bond spreads, and fundamental data relating to the issuer. In addition, the model may incorporate observable market data, such as reported sales of similar securities, broker quotes, yields, bids, offers, and reference data. Certain securities are valued primarily using dealer quotations. These securities are generally classified in Level 2 of the fair value hierarchy. |
| | |
| | Short-Term Securities – Short-term equity investments, including money market funds, are valued in the manner specified above. Short-term debt investments with an original term to maturity of 60 days or less are valued at amortized cost, which approximates fair market value. If the original term to maturity of a short-term debt investment exceeded 60 days, then the values as of the 61st day prior to maturity are amortized. Amortized cost is not used if its use would be inappropriate due to credit or other impairments of the issuer, in which case the security’s fair value would be determined, as described below. Short-term securities are generally classified in Level 1 or Level 2 of the fair market hierarchy depending on the inputs used and market activity levels for specific securities. |
The Board of Trustees of the Fund (the “Board”) has adopted fair value pricing procedures that are followed when a price for a security is not readily available or if a significant event has occurred that indicates the closing price of a security no longer represents the true value of that security. Fair value pricing determinations are made in good faith in accordance with these procedures. There are numerous criteria that will be given consideration in determining a fair value of a security, such as the trading volume of a security and markets, the values of other similar securities, and news events with direct bearing on a security or markets. Fair value pricing results in an estimated price for a security that reflects the amount the Fund might reasonably expect to receive in a current sale. Depending on the relative significance of the valuation inputs, these securities may be classified in either Level 2 or Level 3 of the fair value hierarchy.
The Board has delegated day-to-day valuation matters to a Valuation Committee comprised of one or more representatives from Hennessy Advisors, Inc., the Fund’s investment advisor (the “Advisor”). The function of the Valuation Committee is to value securities where current and reliable market quotations are not readily available. All actions taken by the Valuation Committee are reviewed by the Board.
The Fund has performed an analysis of all existing investments to determine the significance and character of all inputs to their fair value determinations. Various inputs are used to determine the value of the Fund’s investments. The inputs or methodology used for valuing securities are not necessarily an indication of the risk associated with
| HENNESSY FUNDS | 1-800-966-4354 | |
investing in those securities. Details related to the fair valuation hierarchy of the Fund’s securities as of October 31, 2018, are included in the Schedule of Investments.
4). INVESTMENT TRANSACTIONS
Purchases and sales of investment securities (excluding government and short-term investments) for the Fund during fiscal year 2018 were $101,540,954 and $121,513,975, respectively.
There were no purchases or sales/maturities of long-term U.S. government securities for the Fund during fiscal year 2018.
The Fund is permitted to purchase or sell securities from or to another fund in the Hennessy Funds family of funds (the “Hennessy Funds”) under specified conditions outlined in procedures adopted by the Board. The procedures have been designed to ensure that any purchase or sale of securities by the Fund from or to another Hennessy Fund complies with Rule 17a-7 of the Investment Company Act of 1940, as amended. During fiscal year 2018, the Fund did not engage in purchases or sales of securities pursuant to Rule 17a-7 of the Investment Company Act of 1940, as amended.
5). INVESTMENT ADVISORY FEE AND OTHER TRANSACTIONS WITH AFFILIATES
The Advisor provides the Fund with investment advisory services under an Investment Advisory Agreement. The Advisor furnishes all investment advice, office space, and facilities, as well as most of the personnel needed by the Fund. As compensation for its services, the Advisor is entitled to a monthly fee from the Fund. The fee is based upon the average daily net assets of the Fund at an annual rate of 0.74%. The net investment advisory fees expensed by the Fund during fiscal year 2018 are included in the Statement of Operations.
The Advisor has contractually agreed to limit total annual operating expenses to 1.29% of the Fund’s net assets for Investor Class shares and 0.98% of the Fund’s net assets for Institutional Class shares (in each case, excluding all federal, state and local taxes, interest, brokerage commissions, acquired fund fees and expenses and other costs incurred in connection with the purchase and sale of securities, and extraordinary items) through November 30, 2019. In addition, in the past, the Advisor had contractually agreed to waive its fees and absorb expenses to the extent that total annual operating expenses exceeded 0.98% of the Fund’s net assets for Institutional Class shares of the Fund (excluding all federal, state and local taxes, interest, brokerage commissions, acquired fund fees and expenses and other costs incurred in connection with the purchase and sale of securities, and extraordinary items). This prior expense limitation agreement was terminated by the Board as of February 28, 2015.
For a period of three years after the year in which the Advisor waives or reimburses expenses, the Advisor may seek reimbursement from the Fund to the extent that total annual fund operating expenses are less than the expense limitation that was in effect at the time the Advisor waived or reimbursed expenses. The Advisor recouped $238 from the Fund during fiscal year 2018. There are no further recoverable amounts.
The Board has approved a Shareholder Servicing Agreement for Investor Class shares of the Fund, which was instituted to compensate the Advisor for the non-investment advisory services it provides to the Fund. The Shareholder Servicing Agreement provides for a monthly fee paid to the Advisor at an annual rate of 0.10% of the average daily net assets of the Fund attributable to Investor Class shares. The shareholder service fees expensed by the Fund during fiscal year 2018 are included in the Statement of Operations.
The Fund has adopted a plan pursuant to Rule 12b-1 under the Investment Company Act of 1940, as amended, that authorizes payments in connection with the
| NOTES TO THE FINANCIAL STATEMENTS |
distribution of the Fund’s shares at an annual rate of up to 0.25% of the Fund’s average daily net assets attributable to Investor Class shares. Even though the authorized rate is up to 0.25%, the Fund is currently only using up to 0.15% of its average daily net assets attributable to Investor Class shares for such purpose. Amounts paid under the plan may be spent on any activities or expenses primarily intended to result in the sale of shares, including, but not limited to, advertising, shareholder account servicing, printing and mailing of prospectuses to other than current shareholders, printing and mailing of sales literature, and compensation for sales and marketing activities or to financial institutions and others, such as dealers and distributors. The distribution fees expensed by the Fund during fiscal year 2018 are included in the Statement of Operations.
The Fund has entered into agreements with various brokers, dealers, and financial intermediaries in connection with the sale of shares of the Fund. The agreements provide for periodic payments by the Fund to the brokers, dealers, and financial intermediaries for providing certain shareholder maintenance services (sub-transfer agent expenses). These shareholder services include the pre-processing and quality control of new accounts, shareholder correspondence, answering customer inquiries regarding account status, and facilitating shareholder telephone transactions. The sub-transfer agent fees expensed by the Fund during fiscal year 2018 are included in the Statement of Operations.
U.S. Bancorp Fund Services, LLC, d/b/a U.S. Bank Global Fund Services (“Fund Services”) provides the Fund with administrative, fund accounting, and transfer agent services. As administrator, Fund Services is responsible for activities such as (i) preparing various federal and state regulatory filings, reports, and returns for the Fund, (ii) preparing reports and materials to be supplied to the Board, (iii) monitoring the activities of the Fund’s custodian, transfer agent, and accountants, and (iv) coordinating the preparation and payment of the Fund’s expenses and reviewing the Fund’s expense accruals. U.S. Bank N.A., an affiliate of Fund Services, serves as the Fund’s custodian. The servicing agreements between the Trust and Fund Services and U.S. Bank N.A. contain a fee schedule that is inclusive of administrative, fund accounting, custody, and transfer agent fees. The administrative, fund accounting, custody, and transfer agent fees expensed by the Fund during fiscal year 2018 are included in the Statement of Operations.
Quasar Distributors, LLC acts as the Fund’s principal underwriter in a continuous public offering of the Fund’s shares. Quasar Distributors, LLC is an affiliate of Fund Services and U.S. Bank N.A.
The officers of the Fund are affiliated with the Advisor. Such officers, with the exception of the Chief Compliance Officer and the Senior Compliance Officer, receive no compensation from the Fund for serving in their respective roles. The Fund, along with the other Hennessy Funds, makes reimbursement payments, on an equal basis, to the Advisor for a portion of the salary and benefits associated with the office of the Chief Compliance Officer and for all of the salary and benefits associated with the office of the Senior Compliance Officer. The compliance fees expensed by the Fund during fiscal year 2018 are included in the Statement of Operations.
6). GUARANTEES AND INDEMNIFICATIONS
Under the Hennessy Funds’ organizational documents, their officers and trustees are indemnified by the Hennessy Funds against certain liabilities arising out of the performance of their duties to the Hennessy Funds. Additionally, in the normal course of business, the Hennessy Funds enter into contracts with service providers that contain general indemnification clauses. The Fund’s maximum exposure under these arrangements is unknown as this would involve future claims that may be made against the Fund that have not yet occurred. Currently, the Fund expects the risk of loss to be remote.
| HENNESSY FUNDS | 1-800-966-4354 | |
7). LINE OF CREDIT
The Fund has an uncommitted line of credit with the other Hennessy Funds in the amount of the lesser of (i) $100,000,000 or (ii) 33.33% of each Hennessy Fund’s net assets, or 30% for the Hennessy Gas Utility Fund and 10% for the Hennessy Balanced Fund, intended to provide short-term financing, if necessary, subject to certain restrictions, in connection with shareholder redemptions. The credit facility is with the Hennessy Funds’ custodian bank, U.S. Bank N.A. Borrowings under this arrangement bear interest at the bank’s prime rate and are secured by all of the Fund’s assets (as to its own borrowings only). During fiscal year 2018, the Fund did not have any borrowings outstanding under the line of credit.
8). FEDERAL TAX INFORMATION
As of October 31, 2018, the components of accumulated earnings (losses) for income tax purposes were as follows:
| | | Investments | |
| Cost of investments for tax purposes | | $ | 137,238,677 | |
| Gross tax unrealized appreciation | | $ | 20,050,417 | |
| Gross tax unrealized depreciation | | | (11,934,063 | ) |
| Net tax unrealized appreciation/(depreciation) | | $ | 8,116,354 | |
| Undistributed ordinary income | | $ | 1,289,774 | |
| Undistributed long-term capital gains | | | 26,779,881 | |
| Total distributable earnings | | $ | 28,069,655 | |
| Other accumulated gain/(loss) | | $ | — | |
| Total accumulated gain/(loss) | | $ | 36,186,009 | |
As of October 31, 2018, the Fund had no tax basis capital losses to offset future capital gains.
As of October 31, 2018, the Fund did not defer, on a tax basis, any late-year ordinary losses. Late-year ordinary losses are net ordinary losses incurred after December 31, 2017, but within the taxable year, that are deemed to arise on the first day of the Fund’s next taxable year.
During fiscal year 2018 and fiscal year 2017, the tax character of distributions paid by the Fund was as follows:
| | | Year Ended | | | Year Ended | |
| | | October 31, 2018 | | | October 31, 2017 | |
Ordinary income(1) | | $ | 1,275,498 | | | $ | 1,258,527 | |
| Long-term capital gain | | | 5,299,596 | | | | — | |
| | | $ | 6,575,094 | | | $ | 1,258,527 | |
(1) Ordinary income includes short-term capital gains.
9). AGREEMENT AND PLAN OF REORGANIZATION
On November 16, 2017, shareholders of the Rainier Large Cap Equity Fund approved an Agreement and Plan of Reorganization between the Trust, on behalf of the Fund, and Rainier Investment Management Mutual Funds, a Delaware statutory trust, on behalf of the Rainier Large Cap Equity Fund. The Agreement and Plan of Reorganization provided for the transfer of all of the assets of the Rainier Large Cap Equity Fund to the Fund and the assumption of the liabilities (other than any excluded liabilities) of the Rainier Large
| NOTES TO THE FINANCIAL STATEMENTS |
Cap Equity Fund by the Fund. The Rainier Large Cap Equity Fund and the Fund have substantially similar investment objectives. The reorganization was effective as of the close of business on December 1, 2017. The following tables illustrate the specifics of the reorganization of the Rainier Large Cap Equity Fund into the Fund:
| | Shares Issued | Hennessy Large Growth Fund Net Assets | |
| Rainier Large | to Shareholders | | Combined | |
| Cap Equity Fund | of Rainier Large | | (Post Merger) | Tax Status |
Net Assets | Cap Equity Fund | Pre Merger | Net Assets | of Transfer |
$52,613,763(1) | 4,230,322 | $109,172,141 | $161,785,904 | Non-taxable |
(1) Includes unrealized appreciation in the amount of $17,759,641.
Assuming the reorganization had been completed on November 1, 2017, the beginning of the annual reporting period of the Fund, the pro forma results of operation (unaudited) for fiscal year 2018, would have been as follows:
| Net investment income | | $ | 1,324,395 | |
| Net realized gain on investments | | $ | 30,907,365 | |
| Net change in unrealized appreciation on investments | | $ | (20,226,635 | ) |
| Net increase in net assets resulting from operations | | $ | 12,005,125 | |
Because the Fund has been managed as a single integrated portfolio since the reorganization was completed, it is not practicable to separate the amounts of revenue and earnings of the Rainier Large Cap Equity Fund that have been included in the Fund’s Statement of Operations since December 1, 2017.
10). EVENTS SUBSEQUENT TO YEAR END
Management has evaluated the Fund’s related events and transactions that occurred subsequent to October 31, 2018, through the date of issuance of the Fund’s financial statements. Other than as disclosed below, management has determined that there were no subsequent events requiring recognition or disclosure in the financial statements.
On December 7, 2018, capital gains were declared and paid to shareholders of record on December 6, 2018, as follows:
| | | Long-term |
| | Investor Class | $2.29850 |
| | Institutional Class | $2.32790 |
On December 27, 2018, income distributions were declared and paid to shareholders of record on December 26, 2018, as follows:
| | Investor Class | $0.08724196 |
| | Institutional Class | $0.11795880 |
| HENNESSY FUNDS | 1-800-966-4354 | |
Report of Independent Registered Public
Accounting Firm
To the Board of Trustees of Hennessy Funds Trust
and the shareholders of Hennessy Cornerstone Large Growth Fund
Novato, CA
Opinion on the Financial Statements
We have audited the accompanying statement of assets and liabilities of Hennessy Cornerstone Large Growth Fund (the “Fund”), a series of Hennessy Funds Trust, including the schedule of investments, as of October 31, 2018, the related statement of operations for the year then ended, the statements of changes in net assets and the financial highlights for each of the two years in the period then ended, and the related notes (collectively referred to as the “financial statements”). In our opinion, the financial statements present fairly, in all material respects, the financial position of the Fund as of October 31, 2018, the results of its operations for the year then ended, and the changes in its net assets and the financial highlights for each of the two years in the period then ended in conformity with accounting principles generally accepted in the United States of America.
The financial highlights for each of the three years in the period ended October 31, 2016 have been audited by other auditors, whose report dated December 22, 2016 expressed unqualified opinions on such financial highlights.
Basis for Opinion
These financial statements are the responsibility of the Fund’s management. Our responsibility is to express an opinion on the Fund’s financial statements based on our audits. We are a public accounting firm registered with the Public Company Accounting Oversight Board (United States) (“PCAOB”) and are required to be independent with respect to the Fund in accordance with the U.S. federal securities laws and the applicable rules and regulations of the Securities and Exchange Commission and the PCAOB. We have served as the auditor of one or more of the funds in the Trust since 2002.
We conducted our audits in accordance with the standards of the PCAOB. Those standards require that we plan and perform the audit to obtain reasonable assurance about whether the financial statements are free of material misstatement, whether due to error or fraud. The Fund is not required to have, nor were we engaged to perform, an audit of its internal control over financial reporting. As part of our audits we are required to obtain an understanding of internal control over financial reporting, but not for the purpose of expressing an opinion on the effectiveness of the Fund’s internal control over financial reporting. Accordingly, we express no such opinion.
Our audits included performing procedures to assess the risks of material misstatement of the financial statements, whether due to error or fraud, and performing procedures that respond to those risks. Such procedures included examining, on a test basis, evidence regarding the amounts and disclosures in the financial statements. Our audits also included evaluating the accounting principles used and significant estimates made by management, as well as evaluating the overall presentation of the financial statements. Our procedures included confirmation of securities owned as of October 31, 2018 by correspondence with the custodian. We believe that our audits provide a reasonable basis for our opinion.
TAIT, WELLER & BAKER LLP
Philadelphia, Pennsylvania
December 27, 2018
| REPORT OF INDEPENDENT REGISTERED PUBLIC ACCOUNTING FIRM/TRUSTEES AND OFFICERS |
Trustees and Officers of the Fund (Unaudited)
The business and affairs of the Funds are managed under the direction of the Board of Trustees of the Trust, and the Board of Trustees elects the Officers of the Trust. Beginning in March 2015, the Board of Trustees has from time to time appointed advisers to the Board of Trustees (“Advisers”) with the intention of having qualified individuals serve in an advisory capacity in order to garner experience in the mutual fund and asset management industry and be considered as potential Trustees in the future. There are currently three Advisers: Brian Alexander, Doug Franklin, and Claire Knoles. As Advisers, Mr. Alexander, Mr. Franklin, and Ms. Knoles attend meetings of the Board of Trustees and act as non-voting participants. Information pertaining to the Trustees, Advisers, and the Officers of the Trust is set forth below. The Trustees and Officers serve until their successors are duly elected and qualified or until their earlier death, resignation, or removal. Each Trustee oversees the 16 Hennessy Funds. Unless otherwise indicated, the address of all persons listed below is 7250 Redwood Boulevard, Suite 200, Novato, CA 94945. The Fund’s Statement of Additional Information includes more information about the persons listed below and is available, without charge, upon request by calling 1-800-966-4354.
| | | | Other |
| | | | Directorships |
| | | | Held Outside |
| Name, (Year of Birth), | | | of Fund |
| and Position Held | Start Date | Principal Occupation(s) | Complex During |
with the Trust | of Service | During Past Five Years | Past Five Years(1) |
| | |
| Disinterested Trustees and Advisers | |
| | | | |
| J. Dennis DeSousa | January 1996 | Mr. DeSousa is a real estate investor. | None. |
| (1936) | | | |
| Trustee | | | |
| | | | |
| Robert T. Doyle | January 1996 | Mr. Doyle has been the Sheriff of | None. |
| (1947) | | Marin County, California since 1996. | |
| Trustee | | | |
| | | | |
| Gerald P. Richardson | May 2004 | Mr. Richardson is an independent | None. |
| (1945) | | consultant in the securities industry. | |
| Trustee | | | |
| | | | |
| Brian Alexander | March 2015 | Mr. Alexander has worked for the | None. |
| (1981) | | Sutter Health organization since | |
| Adviser to the Board | | 2011 in various positions. He has | |
| | | served as the Chief Executive Officer | |
| | | of the Sutter Roseville Medical | |
| | | Center since 2018. From 2016 through | |
| | | 2018, he served as the Vice President | |
| | | of Strategy for the Sutter Health Valley | |
| | | Area, which includes 11 hospitals, | |
| | | 13 ambulatory surgery centers, | |
| | | 16,000 employees, and 1,900 physicians. | |
| | | From 2013 through 2016, Mr. Alexander | |
| | | served as Sutter Novato Community | |
| | | Hospital’s Chief Administrative Officer, | |
| | | and from 2011 through 2012, he | |
| | | served as a Director of Strategy | |
| | | within Sutter’s West Bay Region. | |
| HENNESSY FUNDS | 1-800-966-4354 | |
| | | | Other |
| | | | Directorships |
| | | | Held Outside |
| Name, (Year of Birth), | | | of Fund |
| and Position Held | Start Date | Principal Occupation(s) | Complex During |
with the Trust | of Service | During Past Five Years | Past Five Years(1) |
| | | | |
| Doug Franklin | March 2016 | Mr. Franklin is a retired insurance | None. |
| (1964) | | industry executive. From 1987 | |
| Adviser to the Board | | through 2015, he was employed | |
| | | by the Allianz-Fireman’s Fund | |
| | | Insurance Company in various | |
| | | positions, including as its Chief | |
| | | Actuary and Chief Risk Officer. | |
| | | | |
| Claire Knoles | December 2015 | Ms. Knoles is a founder of Kiosk and | None. |
| (1974) | | has served as its Chief Operating | |
| Adviser to the Board | | Officer since 2004. Kiosk is a full | |
| | | service marketing agency with | |
| | | offices in the San Francisco Bay | |
| | | Area, Toronto, and Liverpool, UK. | |
| | | | |
Interested Trustee(2) | | | |
| | | | |
| Neil J. Hennessy | January 1996 as | Mr. Neil Hennessy has been employed | Hennessy |
| (1956) | a Trustee and | by Hennessy Advisors, Inc. since | Advisors, Inc. |
| Trustee, Chairman of | June 2008 as | 1989 and currently serves as its | |
| the Board, Chief | an Officer | Chairman and Chief Executive Officer. | |
| Investment Officer, | | | |
| Portfolio Manager, | | | |
| and President | | | |
| Name, (Year of Birth), | | |
| and Position Held | Start Date | Principal Occupation(s) |
with the Trust | of Service | During Past Five Years |
| | | |
| Officers | | |
| | | |
| Teresa M. Nilsen | January 1996 | Ms. Nilsen has been employed by Hennessy Advisors, Inc. |
| (1966) | | since 1989 and currently serves as its President, Chief Operating |
| Executive Vice President | | Officer, and Secretary. |
| and Treasurer | | |
| | | |
| Daniel B. Steadman | March 2000 | Mr. Steadman has been employed by Hennessy Advisors, Inc. |
| (1956) | | since 2000 and currently serves as its Executive Vice President. |
| Executive Vice President | | |
| and Secretary | | |
| | | |
| Brian Carlson | December 2013 | Mr. Carlson has been employed by Hennessy Advisors, Inc. |
| (1972) | | since December 2013 and currently serves as its Chief |
| Senior Vice President | | Compliance Officer and Senior Vice President. |
| and Head of Distribution | | |
| | | |
| Jennifer Cheskiewicz | June 2013 | Ms. Cheskiewicz has been employed by Hennessy Advisors, Inc. |
(1977)(3) | | as its General Counsel since June 2013. |
| Senior Vice President and | | |
| Chief Compliance Officer | | |
| TRUSTEES AND OFFICERS OF THE FUND |
| Name, (Year of Birth), | | |
| and Position Held | Start Date | Principal Occupation(s) |
with the Trust | of Service | During Past Five Years |
| | | |
| David Ellison | October 2012 | Mr. Ellison has been employed by Hennessy Advisors, Inc. since |
(1958)(4) | | October 2012. He has served as a Portfolio Manager of the |
| Senior Vice President | | Hennessy Large Cap Financial Fund and the Hennessy Small |
| and Portfolio Manager | | Cap Financial Fund since inception. Mr. Ellison also served as a |
| | | Portfolio Manager of the Hennessy Technology Fund from its |
| | | inception until February 2017. Mr. Ellison served as Director, |
| | | CIO and President of FBR Fund Advisers, Inc. from December |
| | | 1999 to October 2012. |
| | | |
| Ryan C. Kelley | March 2013 | Mr. Kelley has been employed by Hennessy Advisors, Inc. since |
(1972)(5) | | October 2012. He has served as a Portfolio Manager of the |
| Senior Vice President | | Hennessy Gas Utility Fund, the Hennessy Large Cap Financial |
| and Portfolio Manager | | Fund, and the Hennessy Small Cap Financial Fund since |
| | | October 2014. He served as Co-Portfolio Manager of the same |
| | | funds from March 2013 through September 2014, and as a |
| | | Portfolio Analyst for the Hennessy Funds from October 2012 |
| | | through February 2013. Mr. Kelley has also served as a Portfolio |
| | | Manager of the Hennessy Cornerstone Growth Fund, the |
| | | Hennessy Cornerstone Mid Cap 30 Fund, the Hennessy |
| | | Cornerstone Large Growth Fund, and the Hennessy |
| | | Cornerstone Value Fund since February 2017, as a Co-Portfolio |
| | | Manager of the Hennessy Technology Fund since February |
| | | 2017, and as a Portfolio Manager of the Hennessy Total Return |
| | | Fund and the Hennessy Balanced Fund since May 2018. |
| | | Mr. Kelley served as Portfolio Manager of FBR Fund Advisers, |
| | | Inc. from January 2008 to October 2012. |
| | | |
| Tania Kelley | October 2003 | Ms. Kelley has been employed by Hennessy Advisors, Inc. |
| (1965) | | since October 2003. |
| Senior Vice President | | |
| and Head of Marketing | | |
| | | |
| Daniel P. Hennessy | December 2016 | Mr. Daniel Hennessy has been employed by Hennessy Advisors, |
| (1990) | | Inc. since 2015. He has served as an Associate Analyst or |
| Vice President | | Analyst of the Hennessy Technology Fund since February 2017. |
| and Analyst | | Mr. Daniel Hennessy previously served as a Mutual Fund |
| | | Specialist at U.S. Bancorp Fund Services, LLC (now doing |
| | | business as U.S. Bank Global Fund Services) from November |
| | | 2014 to July 2015. Prior to that, he attended the University of |
| | | San Diego, where he earned a degree in Political Science. |
_______________
(1) | Messrs. DeSousa, Doyle, N. Hennessy, and Richardson previously served on the Board of Directors of Hennessy Mutual Funds, Inc. (“HMFI”), The Hennessy Funds, Inc. (“HFI”), and Hennessy SPARX Funds Trust (“HSFT”). Pursuant to an internal reorganization effective as of February 28, 2014, the series of HFMI, HFI, and HSFT were reorganized into corresponding series of the Trust that mirrored them. Subsequent to the reorganization, HFMI, HFI, and HSFT were dissolved. |
(2) | Mr. N. Hennessy is considered an “interested person,” as defined in the Investment Company Act of 1940, as amended, because he is an officer of the Hennessy Funds. |
(3) | The address of this officer is 4800 Bee Caves Road, Suite 100, Austin, TX 78746. |
(4) | The address of this officer is 101 Federal Street, Suite 1900, Boston, MA 02110. |
(5) | The address of this officer is 1340 Environ Way, Suite 332, Chapel Hill, NC 27517. |
| HENNESSY FUNDS | 1-800-966-4354 | |
Expense Example (Unaudited)
October 31, 2018
As a shareholder of the Fund, you incur ongoing costs, including management fees, service fees, and other Fund expenses. This Example is intended to help you understand your ongoing costs (in dollars) of investing in the Fund and to compare these costs with the ongoing costs of investing in other mutual funds. The Example is based on an investment of $1,000 invested at the beginning of the period and held for the entire period from May 1, 2018, through October 31, 2018.
Actual Expenses
The first line of the table below under the “Investor Class” and “Institutional Class” headings provides information about actual account values and actual expenses. Although the Fund charges no sales loads or transaction fees, you will be assessed fees for outgoing wire transfers, returned checks and stop payment orders at prevailing rates charged by U.S. Bank Global Fund Services, the Fund’s transfer agent. If you request that a redemption be made by wire transfer, currently a $15 fee is charged by the Fund’s transfer agent. IRA accounts will be charged a $15 annual maintenance fee. The example below includes, but is not limited to, management fees, shareholder servicing fees, fund accounting, custody, and transfer agent fees. However, the example below does not include portfolio trading commissions and related expenses, and other extraordinary expenses as determined under generally accepted accounting principles. You may use the information in this line, together with the amount you invested, to estimate the expenses that you paid over the period. Simply divide your account value by $1,000 (for example, an $8,600 account value divided by $1,000 = 8.6), then multiply the result by the number in the first line of the table under the “Investor Class” or “Institutional Class” headings in the column entitled “Expenses Paid During Period” to estimate the expenses you paid on your account during this period.
Hypothetical Example for Comparison Purposes
The second line of the table below under the “Investor Class” and “Institutional Class” headings provides information about hypothetical account values and hypothetical expenses based on the Fund’s actual expense ratios and an assumed rate of return of 5% per year before expenses, which is not the Fund’s actual return. The hypothetical account values and expenses may not be used to estimate the actual ending account balance or expenses you paid for the period. You may use this information to compare the ongoing costs of investing in the Fund and other funds. To do so, compare this 5% hypothetical example with the 5% hypothetical examples that appear in the shareholder reports of the other funds. Please note that the expenses shown in the table are meant to highlight your ongoing costs only. Therefore, the second line of the table under the “Investor Class” and “Institutional Class” headings is useful in comparing ongoing costs only, and will not help you determine the relative total costs of owning different funds.
| | | | Expenses Paid |
| | Beginning | Ending | During Period(1) |
| | Account Value | Account Value | May 1, 2018 – |
| | May 1, 2018 | October 31, 2018 | October 31, 2018 |
| Investor Class | | | |
| Actual | $1,000.00 | $1,025.10 | $6.38 |
| Hypothetical (5% return before expenses) | $1,000.00 | $1,018.90 | $6.36 |
| | | | |
| Institutional Class | | | |
| Actual | $1,000.00 | $1,027.40 | $4.91 |
| Hypothetical (5% return before expenses) | $1,000.00 | $1,020.37 | $4.89 |
(1) | Expenses are equal to the Fund’s annualized expense ratio of 1.25% for Investor Class shares or 0.96% for Institutional Class shares, as applicable, multiplied by the average account value over the period, multiplied by 184/365 days (to reflect one-half year period). |
| HENNESSY FUNDS | 1-800-966-4354 | |
How to Obtain a Copy of the Fund’s
Proxy Voting Policy and Proxy Voting Records
A description of the policies and procedures the Fund uses to determine how to vote proxies relating to portfolio securities is available without charge: (1) by calling 1-800-966-4354; (2) on the Hennessy Funds’ website at www.hennessyfunds.com/proxy-voting/voting-policy; or (3) on the U.S. Securities and Exchange Commission’s (the “SEC”) website at www.sec.gov. The Fund’s proxy voting record is available without charge on both the Hennessy Funds’ website at www.hennessyfunds.com/proxy-voting/voting-record and the SEC’s website at www.sec.gov no later than August 31 for the prior 12 months ending June 30.
Quarterly Filings on Form N-Q
The Fund files a complete schedule of portfolio holdings with the SEC for the first and third quarters of each fiscal year on Form N-Q. The Fund’s Forms N-Q are available on the SEC’s website at www.sec.gov. Information included in the Fund’s Forms N-Q will also be available upon request by calling 1-800-966-4354.
Federal Tax Distribution Information
(Unaudited)
For fiscal year 2018, certain dividends paid by the Fund may be subject to a maximum tax rate of 23.8%, as provided for by the Jobs and Growth Tax Relief Reconciliation Act of 2003. The percentage of dividends declared from ordinary income designated as qualified dividend income was 100.00%.
For corporate shareholders, the percent of ordinary income distributions that qualified for the corporate dividends received deduction for fiscal year 2018 was 100.00%.
The percentage of taxable ordinary income distributions that were designated as short-term capital gain distributions under Section 871(k)(2)(C) of the Internal Revenue Code of 1986, as amended, for the Fund was 17.50%.
Important Notice Regarding Delivery
of Shareholder Documents
To help keep the Fund’s costs as low as possible, we generally deliver a single copy of shareholder reports, proxy statements, and prospectuses to shareholders who share an address and have the same last name. This process does not apply to account statements. You may request an individual copy of a shareholder document at any time. If you would like to receive separate mailings of shareholder documents, please call U.S. Bank Global Fund Services at 1-800-261-6950 or 1-414-765-4124, and individual delivery will begin within 30 days of your request. If your account is held through a financial institution or other intermediary, please contact such intermediary directly to request individual delivery.
| PROXY VOTING — PRIVACY POLICY |
Privacy Policy
We collect the following non-public personal information about you:
| | • | information we receive from you on or in applications or other forms, correspondence, or conversations, including, but not limited to, your name, address, phone number, social security number, assets, income, and date of birth; and |
| | | |
| | • | information about your transactions with us, our affiliates, or others, including, but not limited to, your account number and balance, payment history, parties to transactions, cost basis information, and other financial information. |
We do not disclose any non-public personal information about our current or former shareholders to non-affiliated third parties, except as permitted by law. For example, we are permitted by law to disclose all of the information we collect, as described above, to our Transfer Agent to process your transactions. Furthermore, we restrict access to your non-public personal information to those persons who require such information to provide products or services to you. We maintain physical, electronic, and procedural safeguards that comply with federal standards to guard your non-public personal information.
In the event that you hold shares of the Fund through a financial intermediary, including, but not limited to, a broker-dealer, bank, or trust company, the privacy policy of your financial intermediary would govern how your non-public personal information will be shared with non-affiliated third parties.
| HENNESSY FUNDS | 1-800-966-4354 | |
(This Page Intentionally Left Blank.)
For information, questions or assistance, please call
The Hennessy Funds
1-800-966-4354 or 1-415-899-1555
INVESTMENT ADVISOR
Hennessy Advisors, Inc.
7250 Redwood Boulevard, Suite 200
Novato, California 94945
ADMINISTRATOR,
TRANSFER AGENT,
DIVIDEND PAYING AGENT, &
SHAREHOLDER SERVICING AGENT
U.S. Bancorp Fund Services, LLC
d/b/a U.S. Bank Global Fund Services
P.O. Box 701
Milwaukee, Wisconsin 53201-0701
CUSTODIAN
U.S. Bank N.A.
Custody Operations
1555 North River Center Drive, Suite 302
Milwaukee, Wisconsin 53212
TRUSTEES
Neil J. Hennessy
Robert T. Doyle
J. Dennis DeSousa
Gerald P. Richardson
COUNSEL
Foley & Lardner LLP
777 East Wisconsin Avenue
Milwaukee, Wisconsin 53202-5306
INDEPENDENT REGISTERED
PUBLIC ACCOUNTING FIRM
Tait, Weller & Baker LLP
Two Liberty Place
50 South 16th Street, Suite 2900
Philadelphia, Pennsylvania 19102-2529
DISTRIBUTOR
Quasar Distributors, LLC
777 East Wisconsin Avenue
Milwaukee, Wisconsin 53202
hennessyfunds.com | 1-800-966-4354
This report has been prepared for shareholders and may be distributed to
others only if preceded or accompanied by a current prospectus.
ANNUAL REPORT
OCTOBER 31, 2018
HENNESSY CORNERSTONE
VALUE FUND
Investor Class HFCVX
Institutional Class HICVX
hennessyfunds.com | 1-800-966-4354
(This Page Intentionally Left Blank.)
Contents
| Letter to Shareholders | | 2 |
| Performance Overview | | 4 |
| Financial Statements | | |
| Schedule of Investments | | 7 |
| Statement of Assets and Liabilities | | 11 |
| Statement of Operations | | 12 |
| Statements of Changes in Net Assets | | 14 |
| Financial Highlights | | 16 |
| Notes to the Financial Statements | | 20 |
| Report of Independent Registered Public Accounting Firm | | 28 |
| Trustees and Officers of the Fund | | 29 |
| Expense Example | | 32 |
| Proxy Voting Policy and Proxy Voting Records | | 34 |
| Quarterly Schedule of Investments | | 34 |
| Federal Tax Distribution Information | | 34 |
| Important Notice Regarding Delivery of Shareholder Documents | | 34 |
| Privacy Policy | | 35 |
| HENNESSY FUNDS | 1-800-966-4354 | |
December 2018
Dear Hennessy Funds Shareholder:
Over the past year, we have witnessed the return of market volatility. U.S. stocks still registered healthy gains, bolstered by the impact on corporate profits of the successful passage of the tax reform bill in December 2017. However, concerns over potential trade disruptions, especially between the U.S. and China, and worries over higher short-term interest rates, which many believe could possibly trigger a recession down the road, put downward pressure on equity valuations.
The U.S. economy performed well over the period, and actually achieved an acceleration in GDP growth to over 3% on an annualized basis in the second and third quarters of calendar year 2018. During the past year, companies continued to hire workers, adding over 200,000 jobs per month on average, sending the unemployment rate down to 3.7% in October, which is the lowest it has been since 1969. Consumer confidence is high and still rising, and corporate profits reached record levels in the third quarter of calendar year 2018, posting a year-over-year increase of 26% for the companies in the S&P 500 Index.
The Federal Reserve, confident about the strength of the economy and mindful of a tight labor market, raised short-term interest rates four times over the last year, by a quarter point each time. Long-term bond yields also rose, driven higher primarily by evidence of faster wage growth, pushing the U.S. 10-year Treasury bond over 3% for the first time since 2013.
As I write this, we are experiencing the market’s 20th downturn since 2010. I have been saying that every bull market experiences volatility and pullbacks. Many financial commentators think this bull market is “long in the tooth.” I do not agree with them. I believe stock valuations are still very reasonable. The prospective price to earnings multiple for the Dow Jones Industrial Average has come down from almost 20x at the end of 2017 to 16x, just above its 10-year average of 15x. The prospective PE multiple for the S&P 500 Index has also come down, from 20x to 17x, and compares favorably to its 10-year average of 16x.
Cash, meanwhile, continues to build up on corporate balance sheets. The companies in the S&P 500 Index reported a total of over $5.4 trillion in cash and marketable securities in their latest filings. Companies have been spending some of their cash, increasing their investment spending and laying the groundwork for future earnings growth. However, they have also been returning capital to shareholders. S&P 500 Index companies announced $433.6 billion in share repurchases during the second quarter of calendar year 2018, nearly doubling the previous record of $242.1 billion set in the first quarter. Companies are also raising their dividends.
In addition, I believe the Federal Reserve will take care not to raise interest rates too high or too fast and endanger the economic expansion. While wage growth has risen to over 3% in October, other measures of inflationary pressure, such as the Consumer Price Index and the Producer Price Index, still show prices increasing at a more moderate pace, closer to 2%. Given continued evidence of modest rates of inflation, I believe the Fed will be able to maintain its gradual pace of interest rate hikes.
Finally and importantly, I still see no signs of euphoria in this market. In my opinion, the enthusiasm present earlier in the year, which followed the significant reduction in corporate income tax rates, has largely evaporated, and it has been replaced with anxiety
over higher interest rates and their potential impact on growth. In the past, I have likened the current bull market to that of 1982-2000, and I still believe this comparison holds true. I am confident in the strength of the market today and believe the economy will continue to grow in the coming year, albeit at a more moderate pace.
Thank you for your continued confidence and investment in the Hennessy Funds. If you have any questions or would like to speak with us directly, please don’t hesitate to call us at (800) 966-4354.
Best regards,
Neil J. Hennessy
President and Chief Investment Officer
Past performance does not guarantee future results.
Mutual fund investing involves risk. Principal loss is possible.
Opinions expressed are those of Neil Hennessy and are subject to change, are not guaranteed, and should not be considered investment advice.
The Dow Jones Industrial Average and S&P 500 Index are commonly used to measure the performance of U.S. stocks. One cannot invest directly in an index.
PE, or price to earnings, is a valuation measure and is calculated by dividing a company’s market price per share by its earnings per share. Earnings growth is not a measure of a fund’s future performance.
| HENNESSY FUNDS | 1-800-966-4354 | |
Performance Overview (Unaudited)
CHANGE IN VALUE OF $10,000 INVESTMENT
This graph illustrates the performance of an initial investment of $10,000 made in the Fund ten years ago and assumes the reinvestment of dividends.
AVERAGE ANNUAL TOTAL RETURN FOR PERIODS ENDED OCTOBER 31, 2018
| | One | Five | Ten |
| | Year | Years | Years |
| Hennessy Cornerstone Value Fund – | | | |
| Investor Class (HFCVX) | 3.64% | 7.68% | 12.39% |
| Hennessy Cornerstone Value Fund – | | | |
| Institutional Class (HICVX) | 3.88% | 7.88% | 12.66% |
Russell 1000® Value Index | 3.03% | 8.61% | 11.30% |
| S&P 500 Index | 7.35% | 11.34% | 13.24% |
Expense ratios: 1.23% (Investor Class); 0.98% (Institutional Class)
Performance data quoted represents past performance; past performance does not guarantee future results. The investment return and principal value of an investment will fluctuate so that an investor’s shares, when redeemed, may be worth more or less than their original cost. The performance table does not reflect the deduction of taxes that a shareholder would pay on Fund distributions or the redemption of Fund shares. Current performance of the Fund may be lower or higher than the performance quoted. Performance data current to the most recent month end may be obtained by visiting www.hennessyfunds.com.
The Russell 1000® Value Index is commonly used to measure the performance of U.S. large-capitalization value stocks. The S&P 500 Index is commonly used to measure the performance of U.S. stocks. One cannot invest directly in an index.
Frank Russell Company (“Russell”) is the source and owner of the trademarks, service marks, and copyrights related to the Russell Indexes. Russell® is a trademark of Frank Russell Company. Neither Russell nor its licensors accept any liability for any errors or omissions in the Russell Indexes or Russell ratings or underlying data and no party may rely on any Russell Indexes or Russell ratings or underlying data contained in this communication. No further distribution of Russell data is permitted without Russell’s express written consent. Russell does not promote, sponsor, or endorse the content of this communication.
The expense ratios presented are from the most recent prospectus. The expense ratios for the current reporting period are available in the Financial Highlights section of this report.
PERFORMANCE NARRATIVE
Portfolio Managers Neil J. Hennessy and Ryan C. Kelley
Performance:
For the 12-month period ended October 31, 2018, the Investor Class of the Hennessy Cornerstone Value Fund returned 3.64%, outperforming the Russell 1000® Value Index (the Fund’s primary benchmark), which returned 3.03% for same period, but underperforming the S&P 500 Index, which returned 7.35% for the same period.
The Fund’s outperformance relative to its primary benchmark can be attributed to both stock selection and sector allocation. The Fund’s overweight position in Health Care and underweight position in Financials contributed positively to the Fund’s performance. Within the Health Care sector, pharmaceutical companies AbbVie, Inc., Eli Lilly & Co., and Johnson & Johnson performed particularly well. In the Industrials sector, aircraft maker The Boeing Co. and electrical and electronic equipment manufacturer Emerson Electric Co. were among the holdings that contributed most to relative performance. Many holdings in the Information Technology sector also performed well over the period, including QUALCOMM, Inc. and Cisco Systems, Inc. This positive performance was partially offset by weakness in several stocks in the Financials sector, including life insurance companies MetLife, Inc. and Manulife Financial Corp., and the Fund’s holdings in foreign telecommunications companies including Vodafone Group PLC and BCE, Inc.
The Fund continues to hold Eli Lilly & Co., Johnson & Johnson, Emerson Electric Co., Cisco Systems, Inc., and Manulife Financial Corp.
Portfolio Strategy:
The Fund utilizes a quantitative approach to build a portfolio of potentially undervalued, profitable, large-cap companies with high dividend yields. In essence, the strategy seeks 50 established companies that are generating sufficient cash flows to pay generous dividends but that are possibly being overlooked by investors.
Investment Commentary:
We continue to believe that the outlook for large-cap stocks is positive. The U.S. economy is growing at a healthy rate, unemployment is low, and growth in both consumption and capital spending has accelerated over the last 12 months. Corporate earnings have risen significantly over the first nine months of 2018, helped, in part, by lower taxes. We expect earnings growth to be slower next year yet remain positive, driven primarily by continued steady economic growth.
There are three primary industry groups where the Fund currently maintains overweight positions: Energy, Pharmaceuticals, and Food, Beverage & Tobacco. Many pharmaceutical and food & beverage companies have strong competitive positions protected by patents and consumer branding and, therefore, may generate excess cash flows and pay higher dividends. As a result, the Fund owns stocks from these groups, including Merck & Co. Inc., Pfizer Inc., The Coca-Cola Co., and PepsiCo, Inc. Energy stocks overall have lagged the general market, despite the recovery in the price of crude oil, and we believe many now look undervalued. Despite this general underperformance, the Fund’s holdings in this industry group, including TOTAL SA, Marathon Petroleum Corp., and Phillips 66, have maintained strong levels of profitability and have continued to generate positive cash flow and pay dividends.
_______________
Opinions expressed are those of the Portfolio Managers as of the date written and are subject to change, are not guaranteed, and should not be considered investment advice or an indication of trading intent.
| HENNESSY FUNDS | 1-800-966-4354 | |
The Fund may invest in medium-capitalization companies, which may have more limited liquidity and greater price volatility than large-capitalization companies. Investments in foreign securities may involve political, economic, and currency risks, greater volatility, and differences in accounting methods. The Fund’s formula-based strategy may cause the Fund to buy or sell securities at times when it may not be advantageous. Please see the Fund’s prospectus for a more complete discussion of these and other risks.
References to specific securities should not be considered a recommendation to buy or sell any security. Fund holdings and sector allocations are subject to change. Please refer to the Schedule of Investments included in this report for additional portfolio information.
Cash flow refers to the net amount of cash and cash equivalents being transferred into and out of a company.
Dividend yield is calculated by dividing a company’s dividends per share by its market price per share.
| PERFORMANCE OVERVIEW/SCHEDULE OF INVESTMENTS |
Financial Statements
Schedule of Investments as of October 31, 2018 |
HENNESSY CORNERSTONE VALUE FUND
(% of Net Assets)
| TOP TEN HOLDINGS (EXCLUDING MONEY MARKET FUNDS) | % NET ASSETS |
| Eli Lilly & Co. | 2.78% |
| Merck & Co., Inc. | 2.59% |
| Pfizer, Inc. | 2.43% |
| Target Corp. | 2.32% |
| Cisco Systems, Inc. | 2.30% |
| Equinor ASA - ADR | 2.29% |
| Thomson Reuters Corp. | 2.25% |
| Verizon Communications, Inc. | 2.21% |
| GlaxoSmithKline PLC - ADR | 2.18% |
| Amgen, Inc. | 2.17% |
Note: For presentation purposes, the Fund has grouped some of the industry categories. For purposes of categorizing securities for compliance with Section 8(b)(1) of the Investment Company Act of 1940, as amended, the Fund uses more specific industry classifications.
The Global Industry Classification Standard (GICS®) was developed by and is the exclusive property and a service mark of MSCI, Inc. and Standard & Poor Financial Services LLC. It has been licensed for use by the Hennessy Funds.
| HENNESSY FUNDS | 1-800-966-4354 | |
COMMON STOCKS – 96.08%
| | | Number | | | | | | % of | |
| | | of Shares | | | Value | | | Net Assets | |
| Communication Services – 3.92% | |
| AT&T, Inc. | | | 152,860 | | | $ | 4,689,745 | | | | 1.71 | % |
| Verizon Communications, Inc. | | | 105,900 | | | | 6,045,831 | | | | 2.21 | % |
| | | | | | | | 10,735,576 | | | | 3.92 | % |
| | | | | | | | | | | | | |
| Consumer Discretionary – 8.95% | |
| Carnival Corp. (a) | | | 79,900 | | | | 4,477,596 | | | | 1.63 | % |
| Ford Motor Co. | | | 521,845 | | | | 4,983,620 | | | | 1.82 | % |
| General Motors Co. | | | 135,000 | | | | 4,939,650 | | | | 1.80 | % |
| Las Vegas Sands Corp. | | | 73,800 | | | | 3,766,014 | | | | 1.38 | % |
| Target Corp. | | | 76,100 | | | | 6,364,243 | | | | 2.32 | % |
| | | | | | | | 24,531,123 | | | | 8.95 | % |
| | | | | | | | | | | | | |
| Consumer Staples – 16.76% | |
| Altria Group, Inc. | | | 81,400 | | | | 5,294,256 | | | | 1.93 | % |
| CVS Health Corp. | | | 72,700 | | | | 5,262,753 | | | | 1.92 | % |
| General Mills, Inc. | | | 97,900 | | | | 4,288,020 | | | | 1.57 | % |
| PepsiCo, Inc. | | | 47,600 | | | | 5,349,288 | | | | 1.95 | % |
| Philip Morris International, Inc. | | | 53,400 | | | | 4,702,938 | | | | 1.72 | % |
| The Coca-Cola Co. | | | 120,300 | | | | 5,759,964 | | | | 2.10 | % |
| The Kraft Heinz Co. | | | 73,000 | | | | 4,012,810 | | | | 1.46 | % |
| The Procter & Gamble Co. | | | 66,300 | | | | 5,879,484 | | | | 2.15 | % |
| Unilever PLC – ADR (a) | | | 101,400 | | | | 5,372,172 | | | | 1.96 | % |
| | | | | | | | 45,921,685 | | | | 16.76 | % |
| | | | | | | | | | | | | |
| Energy – 23.34% | |
| BP PLC – ADR (a) | | | 133,800 | | | | 5,802,906 | | | | 2.12 | % |
| Canadian Natural Resources Ltd. (a) | | | 167,600 | | | | 4,578,832 | | | | 1.67 | % |
| Chevron Corp. | | | 45,675 | | | | 5,099,614 | | | | 1.86 | % |
| Equinor ASA – ADR (a) | | | 244,200 | | | | 6,275,940 | | | | 2.29 | % |
| Exxon Mobil Corp. | | | 65,610 | | | | 5,227,805 | | | | 1.91 | % |
| Marathon Petroleum Corp. | | | 82,600 | | | | 5,819,170 | | | | 2.12 | % |
| Occidental Petroleum Corp. | | | 76,360 | | | | 5,121,465 | | | | 1.87 | % |
| Phillips 66 | | | 55,900 | | | | 5,747,638 | | | | 2.10 | % |
| Royal Dutch Shell PLC – ADR (a) | | | 79,600 | | | | 5,230,516 | | | | 1.91 | % |
| Schlumberger Ltd. (a) | | | 77,800 | | | | 3,991,918 | | | | 1.46 | % |
| Suncor Energy, Inc. (a) | | | 157,900 | | | | 5,259,649 | | | | 1.92 | % |
| Total S.A. – ADR (a) | | | 98,600 | | | | 5,777,960 | | | | 2.11 | % |
| | | | | | | | 63,933,413 | | | | 23.34 | % |
The accompanying notes are an integral part of these financial statements.
COMMON STOCKS
| | | Number | | | | | | % of | |
| | | of Shares | | | Value | | | Net Assets | |
| Financials – 10.76% | |
| Bank of Nova Scotia (a) | | | 86,100 | | | $ | 4,624,431 | | | | 1.69 | % |
| HSBC Holdings PLC – ADR (a) | | | 106,200 | | | | 4,363,758 | | | | 1.59 | % |
| Manulife Financial Corp. (a) | | | 269,600 | | | | 4,238,112 | | | | 1.55 | % |
| Royal Bank of Canada (a) | | | 66,800 | | | | 4,865,712 | | | | 1.78 | % |
| Thomson Reuters Corp. (a) | | | 132,200 | | | | 6,160,520 | | | | 2.25 | % |
| Toronto-Dominion Bank (a) | | | 94,100 | | | | 5,218,786 | | | | 1.90 | % |
| | | | | | | | 29,471,319 | | | | 10.76 | % |
| | |
| Health Care – 17.65% | |
| Amgen, Inc. | | | 30,800 | | | | 5,937,932 | | | | 2.17 | % |
| Bristol-Myers Squibb Co. | | | 91,400 | | | | 4,619,356 | | | | 1.69 | % |
| Eli Lilly & Co. | | | 70,300 | | | | 7,623,332 | | | | 2.78 | % |
| Gilead Sciences, Inc. | | | 68,300 | | | | 4,656,694 | | | | 1.70 | % |
| GlaxoSmithKline PLC – ADR (a) | | | 152,600 | | | | 5,960,556 | | | | 2.18 | % |
| Johnson & Johnson | | | 41,400 | | | | 5,795,586 | | | | 2.11 | % |
| Merck & Co., Inc. | | | 96,600 | | | | 7,110,726 | | | | 2.59 | % |
| Pfizer, Inc. | | | 154,500 | | | | 6,652,770 | | | | 2.43 | % |
| | | | | | | | 48,356,952 | | | | 17.65 | % |
| | |
| Industrials – 6.73% | |
| Emerson Electric Co. | | | 79,300 | | | | 5,382,884 | | | | 1.96 | % |
| General Electric Co. | | | 354,034 | | | | 3,575,743 | | | | 1.31 | % |
| Johnson Controls International PLC (a) | | | 146,300 | | | | 4,677,211 | | | | 1.71 | % |
| United Parcel Service, Inc., Class B | | | 45,000 | | | | 4,794,300 | | | | 1.75 | % |
| | | | | | | | 18,430,138 | | | | 6.73 | % |
| | |
| Information Technology – 7.97% | |
| Cisco Systems, Inc. | | | 137,810 | | | | 6,304,807 | | | | 2.30 | % |
| HP, Inc. | | | 245,500 | | | | 5,926,370 | | | | 2.16 | % |
| Intel Corp. | | | 118,900 | | | | 5,574,032 | | | | 2.03 | % |
| International Business Machines Corp. | | | 35,000 | | | | 4,040,050 | | | | 1.48 | % |
| | | | | | | | 21,845,259 | | | | 7.97 | % |
| | | | | | | | | | | | | |
| Total Common Stocks | | | | | | | | | | | | |
| (Cost $253,844,570) | | | | | | | 263,225,465 | | | | 96.08 | % |
The accompanying notes are an integral part of these financial statements.
| HENNESSY FUNDS | 1-800-966-4354 | |
SHORT-TERM INVESTMENTS – 4.02%
| | | Number | | | | | | % of | |
| | | of Shares | | | Value | | | Net Assets | |
| Money Market Funds – 4.02% | | | | | | | | | |
| Fidelity Government Portfolio, Institutional Class, 2.06% (b) | | | 11,019,735 | | | $ | 11,019,735 | | | | 4.02 | % |
| | | | | | | | | | | | | |
| Total Short-Term Investments | | | | | | | | | | | | |
| (Cost $11,019,735) | | | | | | | 11,019,735 | | | | 4.02 | % |
| | | | | | | | | | | | | |
| Total Investments | | | | | | | | | | | | |
| (Cost $264,864,305) – 100.10% | | | | | | | 274,245,200 | | | | 100.10 | % |
| Liabilities in Excess of Other Assets – (0.10)% | | | | | | | (272,243 | ) | | | (0.10 | )% |
| | | | | | | | | | | | | |
TOTAL NET ASSETS – 100.00% | | | | | | $ | 273,972,957 | | | | 100.00 | % |
Percentages are stated as a percent of net assets.
ADR – American Depositary Receipt
PLC – Public Limited Company
| (a) | U.S.-traded security of a foreign corporation. |
| (b) | The rate listed is the fund’s seven-day yield as of October 31, 2018. |
Summary of Fair Value Exposure at October 31, 2018
The following is a summary of the inputs used to value the Fund’s net assets as of October 31, 2018 (See Note 3 in the accompanying notes to the financial statements):
| Common Stocks | | Level 1 | | | Level 2 | | | Level 3 | | | Total | |
| Communication Services | | $ | 10,735,576 | | | $ | — | | | $ | — | | | $ | 10,735,576 | |
| Consumer Discretionary | | | 24,531,123 | | | | — | | | | — | | | | 24,531,123 | |
| Consumer Staples | | | 45,921,685 | | | | — | | | | — | | | | 45,921,685 | |
| Energy | | | 63,933,413 | | | | — | | | | — | | | | 63,933,413 | |
| Financials | | | 29,471,319 | | | | — | | | | — | | | | 29,471,319 | |
| Health Care | | | 48,356,952 | | | | — | | | | — | | | | 48,356,952 | |
| Industrials | | | 18,430,138 | | | | — | | | | — | | | | 18,430,138 | |
| Information Technology | | | 21,845,259 | | | | — | | | | — | | | | 21,845,259 | |
| Total Common Stocks | | $ | 263,225,465 | | | $ | — | | | $ | — | | | $ | 263,225,465 | |
| Short-Term Investments | | | | | | | | | | | | | | | | |
| Money Market Funds | | $ | 11,019,735 | | | $ | — | | | $ | — | | | $ | 11,019,735 | |
| Total Short-Term Investments | | $ | 11,019,735 | | | $ | — | | | $ | — | | | $ | 11,019,735 | |
| Total Investments | | $ | 274,245,200 | | | $ | — | | | $ | — | | | $ | 274,245,200 | |
The accompanying notes are an integral part of these financial statements.
| SCHEDULE OF INVESTMENTS/STATEMENT OF ASSETS AND LIABILITIES |
Financial Statements
Statement of Assets and Liabilities as of October 31, 2018 |
| ASSETS: | | | |
| Investments in securities, at value (cost $264,864,305) | | $ | 274,245,200 | |
| Dividends and interest receivable | | | 556,916 | |
| Receivable for fund shares sold | | | 43,969 | |
| Prepaid expenses and other assets | | | 25,280 | |
| Total Assets | | | 274,871,365 | |
| | | | | |
| LIABILITIES: | | | | |
| Payable for fund shares redeemed | | | 6,216 | |
| Payable to advisor | | | 177,379 | |
| Payable to administrator | | | 24,951 | |
| Payable to auditor | | | 21,901 | |
| Accrued distribution fees | | | 603,034 | |
| Accrued service fees | | | 23,335 | |
| Accrued trustees fees | | | 5,963 | |
| Accrued expenses and other payables | | | 35,629 | |
| Total Liabilities | | | 898,408 | |
| NET ASSETS | | $ | 273,972,957 | |
| | | | | |
| NET ASSETS CONSIST OF: | | | | |
| Capital stock | | $ | 228,405,343 | |
| Total distributable earnings | | | 45,567,614 | |
| Total Net Assets | | $ | 273,972,957 | |
| | | | | |
| NET ASSETS | | | | |
| Investor Class: | | | | |
| Shares authorized (no par value) | | Unlimited | |
| Net assets applicable to outstanding Investor Class shares | | $ | 266,756,238 | |
| Shares issued and outstanding | | | 13,828,075 | |
| Net asset value, offering price and redemption price per share | | $ | 19.29 | |
| | | | | |
| Institutional Class: | | | | |
| Shares authorized (no par value) | | Unlimited | |
| Net assets applicable to outstanding Institutional Class shares | | $ | 7,216,719 | |
| Shares issued and outstanding | | | 373,364 | |
| Net asset value, offering price and redemption price per share | | $ | 19.33 | |
The accompanying notes are an integral part of these financial statements.
| HENNESSY FUNDS | 1-800-966-4354 | |
Financial Statements
Statement of Operations for the year ended October 31, 2018 |
| INVESTMENT INCOME: | | | |
Dividend income(1) | | $ | 9,752,505 | |
| Interest income | | | 150,939 | |
| Total investment income | | | 9,903,444 | |
| | | | | |
| EXPENSES: | | | | |
| Investment advisory fees (See Note 5) | | | 2,145,562 | |
| Distribution fees – Investor Class (See Note 5) | | | 423,872 | |
| Service fees – Investor Class (See Note 5) | | | 282,581 | |
| Administration, fund accounting, custody and transfer agent fees (See Note 5) | | | 277,676 | |
| Sub-transfer agent expenses – Investor Class (See Note 5) | | | 197,807 | |
| Sub-transfer agent expenses – Institutional Class (See Note 5) | | | 7,113 | |
| Federal and state registration fees | | | 34,005 | |
| Compliance expense (See Note 5) | | | 29,499 | |
| Reports to shareholders | | | 23,864 | |
| Audit fees | | | 23,135 | |
| Trustees’ fees and expenses | | | 17,597 | |
| Legal fees | | | 2,570 | |
| Other expenses | | | 19,748 | |
| Total expenses | | | 3,485,029 | |
| NET INVESTMENT INCOME | | $ | 6,418,415 | |
| | | | | |
| REALIZED AND UNREALIZED GAINS (LOSSES): | | | | |
| Net realized gain on investments | | $ | 33,529,159 | |
| Net change in unrealized appreciation/depreciation on investments | | | (29,037,130 | ) |
| Net gain on investments | | | 4,492,029 | |
| NET INCREASE IN NET ASSETS RESULTING FROM OPERATIONS | | $ | 10,910,444 | |
(1) | Net of foreign taxes withheld and issuance fees of $337,593. |
The accompanying notes are an integral part of these financial statements.
(This Page Intentionally Left Blank.)
| HENNESSY FUNDS | 1-800-966-4354 | |
Financial Statements
| Statements of Changes in Net Assets |
| | | Year Ended | | | Year Ended | |
| | | October 31, 2018 | | | October 31, 2017 | |
| OPERATIONS: | | | | | | |
| Net investment income | | $ | 6,418,415 | | | $ | 5,498,468 | |
| Net realized gain on investments | | | 33,529,159 | | | | 40,317,512 | |
| Net change in unrealized | | | | | | | | |
| appreciation/depreciation on investments | | | (29,037,130 | ) | | | (11,111,810 | ) |
| Net increase in net assets resulting from operations | | | 10,910,444 | | | | 34,704,170 | |
| | | | | | | | | |
| DISTRIBUTIONS TO SHAREHOLDERS FROM: | | | | | | | | |
| Distributable earnings – Investor Class | | | (38,837,104 | ) | | | (2,916,316 | ) |
| Distributable earnings – Institutional Class | | | (1,032,863 | ) | | | (52,044 | ) |
| Total distributions | | | (39,869,967 | ) | | | (2,968,360 | )(1) |
| | | | | | | | | |
| CAPITAL SHARE TRANSACTIONS: | | | | | | | | |
| Proceeds from shares issued in the Reorganization – | | | | | | | | |
| Investor Class (see Note 9) | | | — | | | | 141,680,285 | |
| Proceeds from shares issued in the Reorganization – | | | | | | | | |
| Institutional Class (see Note 9) | | | — | | | | 3,258,094 | |
| Proceeds from shares subscribed – Investor Class | | | 2,033,069 | | | | 2,341,233 | |
| Proceeds from shares subscribed – Institutional Class | | | 1,207,915 | | | | 2,547,752 | |
| Dividends reinvested – Investor Class | | | 36,758,791 | | | | 2,640,562 | |
| Dividends reinvested – Institutional Class | | | 906,473 | | | | 33,704 | |
| Cost of shares redeemed – Investor Class | | | (24,897,883 | ) | | | (23,154,846 | ) |
| Cost of shares redeemed – Institutional Class | | | (1,542,637 | ) | | | (1,029,188 | ) |
| Net increase in net assets derived | | | | | | | | |
| from capital share transactions | | | 14,465,728 | | | | 128,317,596 | |
| TOTAL INCREASE (DECREASE) IN NET ASSETS | | | (14,493,795 | ) | | | 160,053,406 | |
| | | | | | | | | |
| NET ASSETS: | | | | | | | | |
| Beginning of year | | | 288,466,752 | | | | 128,413,346 | |
| End of year | | $ | 273,972,957 | | | $ | 288,466,752 | (2) |
(1) | All distributions were from net investment income. |
(2) | Includes accumulated net investment income of $4,980,270. |
The accompanying notes are an integral part of these financial statements.
| STATEMENTS OF CHANGES IN NET ASSETS |
Financial Statements
| Statements of Changes in Net Assets |
| | | Year Ended | | | Year Ended | |
| | | October 31, 2018 | | | October 31, 2017 | |
| CHANGES IN SHARES OUTSTANDING: | | | | | | |
| Shares issued in the Reorganization – Investor Class | | | — | | | | 7,092,199 | |
| Shares issued in the Reorganization – Institutional Class | | | — | | | | 163,058 | |
| Shares sold – Investor Class | | | 101,307 | | | | 118,558 | |
| Shares sold – Institutional Class | | | 60,882 | | | | 127,648 | |
| Shares issued to holders as reinvestment | | | | | | | | |
| of dividends – Investor Class | | | 1,887,491 | | | | 138,105 | |
| Shares issued to holders as reinvestment | | | | | | | | |
| of dividends – Institutional Class | | | 46,455 | | | | 1,763 | |
| Shares redeemed – Investor Class | | | (1,247,375 | ) | | | (1,154,302 | ) |
| Shares redeemed – Institutional Class | | | (77,746 | ) | | | (50,925 | ) |
| Net increase in shares outstanding | | | 771,014 | | | | 6,436,104 | |
The accompanying notes are an integral part of these financial statements.
| HENNESSY FUNDS | 1-800-966-4354 | |
Financial Statements
For an Investor Class share outstanding throughout each year
| PER SHARE DATA: |
| Net asset value, beginning of year |
| |
| Income from investment operations: |
| Net investment income |
| Net realized and unrealized gains (losses) on investments |
| Total from investment operations |
| |
| Less distributions: |
| Dividends from net investment income |
| Dividends from net realized gains |
| Total distributions |
| Net asset value, end of year |
| |
| TOTAL RETURN |
| |
| SUPPLEMENTAL DATA AND RATIOS: |
| Net assets, end of year (millions) |
| Ratio of expenses to average net assets |
| Ratio of net investment income to average net assets |
Portfolio turnover rate(1) |
(1) | Portfolio turnover is calculated on the basis of the Fund as a whole. |
The accompanying notes are an integral part of these financial statements.
| FINANCIAL HIGHLIGHTS — INVESTOR CLASS |
| Year Ended October 31, | |
| 2018 | | | 2017 | | | 2016 | | | 2015 | | | 2014 | |
| | | | | | | | | | | | | | |
| $ | 21.48 | | | $ | 18.36 | | | $ | 17.69 | | | $ | 18.41 | | | $ | 16.90 | |
| | | | | | | | | | | | | | | | | | | |
| | | | | | | | | | | | | | | | | | | |
| | 0.41 | | | | 0.45 | | | | 0.43 | | | | 0.44 | | | | 0.39 | |
| | 0.35 | | | | 3.10 | | | | 0.67 | | | | (0.75 | ) | | | 1.55 | |
| | 0.76 | | | | 3.55 | | | | 1.10 | | | | (0.31 | ) | | | 1.94 | |
| | | | | | | | | | | | | | | | | | | |
| | | | | | | | | | | | | | | | | | | |
| | (0.42 | ) | | | (0.43 | ) | | | (0.43 | ) | | | (0.41 | ) | | | (0.43 | ) |
| | (2.53 | ) | | | — | | | | — | | | | — | | | | — | |
| | (2.95 | ) | | | (0.43 | ) | | | (0.43 | ) | | | (0.41 | ) | | | (0.43 | ) |
| $ | 19.29 | | | $ | 21.48 | | | $ | 18.36 | | | $ | 17.69 | | | $ | 18.41 | |
| | | | | | | | | | | | | | | | | | | |
| | 3.64 | % | | | 19.63 | % | | | 6.41 | % | | | (1.77 | )% | | | 11.69 | % |
| | | | | | | | | | | | | | | | | | | |
| | | | | | | | | | | | | | | | | | | |
| $ | 266.76 | | | $ | 281.07 | | | $ | 126.53 | | | $ | 129.86 | | | $ | 145.04 | |
| | 1.21 | % | | | 1.22 | % | | | 1.25 | % | | | 1.10 | % | | | 1.17 | % |
| | 2.21 | % | | | 2.36 | % | | | 2.33 | % | | | 2.32 | % | | | 2.18 | % |
| | 41 | % | | | 72 | % | | | 36 | % | | | 46 | % | | | 34 | % |
The accompanying notes are an integral part of these financial statements.
| HENNESSY FUNDS | 1-800-966-4354 | |
Financial Statements
For an Institutional Class share outstanding throughout each year
| PER SHARE DATA: |
| Net asset value, beginning of year |
| |
| Income from investment operations: |
| Net investment income |
| Net realized and unrealized gains (losses) on investments |
| Total from investment operations |
| |
| Less distributions: |
| Dividends from net investment income |
| Dividends from net realized gains |
| Total distributions |
| Net asset value, end of year |
| |
| TOTAL RETURN |
| |
| SUPPLEMENTAL DATA AND RATIOS: |
| Net assets, end of year (millions) |
| Ratio of expenses to average net assets: |
| Before expense reimbursement |
| After expense reimbursement |
| Ratio of net investment income to average net assets: |
| Before expense reimbursement |
| After expense reimbursement |
Portfolio turnover rate(1) |
(1) | Portfolio turnover is calculated on the basis of the Fund as a whole. |
The accompanying notes are an integral part of these financial statements.
| FINANCIAL HIGHLIGHTS — INSTITUTIONAL CLASS |
| Year Ended October 31, | |
| 2018 | | | 2017 | | | 2016 | | | 2015 | | | 2014 | |
| | | | | | | | | | | | | | |
| $ | 21.52 | | | $ | 18.40 | | | $ | 17.67 | | | $ | 18.41 | | | $ | 16.92 | |
| | | | | | | | | | | | | | | | | | | |
| | | | | | | | | | | | | | | | | | | |
| | 0.45 | | | | 0.43 | | | | 0.48 | | | | 0.53 | | | | 0.59 | |
| | 0.35 | | | | 3.18 | | | | 0.67 | | | | (0.83 | ) | | | 1.37 | |
| | 0.80 | | | | 3.61 | | | | 1.15 | | | | (0.30 | ) | | | 1.96 | |
| | | | | | | | | | | | | | | | | | | |
| | | | | | | | | | | | | | | | | | | |
| | (0.46 | ) | | | (0.49 | ) | | | (0.42 | ) | | | (0.44 | ) | | | (0.47 | ) |
| | (2.53 | ) | | | — | | | | — | | | | — | | | | — | |
| | (2.99 | ) | | | (0.49 | ) | | | (0.42 | ) | | | (0.44 | ) | | | (0.47 | ) |
| $ | 19.33 | | | $ | 21.52 | | | $ | 18.40 | | | $ | 17.67 | | | $ | 18.41 | |
| | | | | | | | | | | | | | | | | | | |
| | 3.88 | % | | | 19.95 | % | | | 6.72 | % | | | (1.72 | )% | | | 11.82 | % |
| | | | | | | | | | | | | | | | | | | |
| | | | | | | | | | | | | | | | | | | |
| $ | 7.22 | | | $ | 7.40 | | | $ | 1.88 | | | $ | 1.75 | | | $ | 10.65 | |
| | | | | | | | | | | | | | | | | | | |
| | 0.98 | % | | | 0.97 | % | | | 0.95 | % | | | 1.00 | % | | | 1.03 | % |
| | 0.98 | % | | | 0.97 | % | | | 0.95 | % | | | 1.00 | % | | | 0.98 | % |
| | | | | | | | | | | | | | | | | | | |
| | 2.43 | % | | | 2.60 | % | | | 2.63 | % | | | 2.43 | % | | | 2.30 | % |
| | 2.43 | % | | | 2.60 | % | | | 2.63 | % | | | 2.43 | % | | | 2.35 | % |
| | 41 | % | | | 72 | % | | | 36 | % | | | 46 | % | | | 34 | % |
The accompanying notes are an integral part of these financial statements.
| HENNESSY FUNDS | 1-800-966-4354 | |
Financial Statements
Notes to the Financial Statements October 31, 2018 |
1). ORGANIZATION
The Hennessy Cornerstone Value Fund (the “Fund”) is a series of Hennessy Funds Trust (the “Trust”), which was organized as a Delaware statutory trust on September 17, 1992. The Fund is an open-end management investment company registered under the Investment Company Act of 1940, as amended. The investment objective of the Fund is total return, consisting of capital appreciation and current income. The Fund is a diversified fund.
The Fund offers Investor Class and Institutional Class shares. Each class of shares differs principally in its respective 12b-1 distribution and service, shareholder servicing, and sub-transfer agent expenses. There are no sales charges. Each class has identical rights to earnings, assets, and voting privileges, except for class-specific expenses and exclusive rights to vote on matters affecting only an individual class.
As an investment company, the Fund follows the investment company accounting and reporting guidance of the Financial Accounting Standards Board (“FASB”) Accounting Standard Codification Topic 946 “Financial Services—Investment Companies.”
2). SIGNIFICANT ACCOUNTING POLICIES
The following is a summary of significant accounting policies consistently followed by the Fund in the preparation of the financial statements. These policies conform to U.S. generally accepted accounting principles (“GAAP”).
| a). | Securities Valuation – All investments in securities are recorded at their estimated fair value, as described in Note 3. |
| | |
| b). | Federal Income Taxes – No provision for federal income taxes or excise taxes has been made because the Fund has elected to be taxed as a regulated investment company and intends to distribute substantially all of its taxable income to its shareholders and otherwise comply with the provisions of the Internal Revenue Code of 1986, as amended, applicable to regulated investment companies. Net investment income/loss and realized gains/losses for federal income tax purposes may differ from those reported in the financial statements because of temporary book and tax basis differences. Temporary differences are primarily the result of the treatment of wash sales for tax reporting purposes. The Fund recognizes interest and penalties related to income tax benefits, if any, in the Statement of Operations as an income tax expense. Distributions from net realized gains for book purposes may include short-term capital gains, which are included as ordinary income to shareholders for tax purposes. The Fund may utilize equalization accounting for tax purposes and designate earnings and profits, including net realized gains distributed to shareholders on redemption of shares, as part of the dividends paid deduction for income tax purposes. |
| | |
| | Due to inherent differences in the recognition of income, expenses, and realized gains/losses under GAAP and federal income tax regulations, permanent differences between book and tax basis for reporting for fiscal year 2018 have been identified and appropriately reclassified in the Statement of Assets and Liabilities. The adjustments are as follows: |
| Total | |
| Distributable | |
Earnings | Capital Stock |
| $(2,168,104) | $2,168,104 |
| NOTES TO THE FINANCIAL STATEMENTS |
| c). | Accounting for Uncertainty in Income Taxes – The Fund has accounting policies regarding recognition and measurement of tax positions taken or expected to be taken on a tax return. The tax returns of the Fund for the prior three fiscal years are open for examination. The Fund has reviewed all open tax years in major jurisdictions and concluded that there is no impact on the Fund’s net assets and no tax liability resulting from unrecognized tax benefits relating to uncertain income tax positions taken or expected to be taken on a tax return. The Fund’s major tax jurisdictions are U.S. federal and Delaware. |
| | |
| d). | Income and Expenses – Dividend income is recognized on the ex-dividend date or as soon as information is available to the Fund. Interest income, which includes the amortization of premium and accretion of discount, is recognized on an accrual basis. Other non-cash dividends are recognized as investment income at the fair value of the property received. The Fund is charged for those expenses that are directly attributable to its portfolio, such as advisory, administration, and certain shareholder service fees. Income, expenses (other than expenses attributable to a specific class), and realized and unrealized gains/losses on investments are allocated to each class of shares based on such class’s net assets. |
| | |
| e). | Distributions to Shareholders – Dividends from net investment income for the Fund, if any, are declared and paid annually, usually in December. Distributions of net realized capital gains, if any, are declared and paid annually, usually in December. |
| | |
| f). | Security Transactions – Investment and shareholder transactions are recorded on the trade date. The Fund determines the realized gain/loss from an investment transaction by comparing the original cost of the security lot sold with the net sale proceeds. Discounts and premiums on securities purchased are accreted or amortized, respectively, over the life of each such security. |
| | |
| g). | Use of Estimates – The preparation of financial statements in conformity with GAAP requires management to make estimates and assumptions that affect the reported amounts of assets and liabilities and disclosure of contingent assets and liabilities at the date of the financial statements and the reported change in net assets during the reporting period. Actual results could differ from those estimates. |
| | |
| h). | Share Valuation – The net asset value (“NAV”) per share of the Fund is calculated by dividing (i) the total value of the securities held by the Fund, plus cash and other assets, minus all liabilities (including estimated accrued expenses) by (ii) the total number of shares outstanding for the Fund, rounded to the nearest cent. The Fund’s shares will not be priced on days the New York Stock Exchange is closed for trading. The offering and redemption price per share for the Fund is equal to the Fund’s NAV per share. |
| | |
| i). | New Accounting Pronouncements – In August 2018, the FASB issued Accounting Standards Update No. 2018-13 “Disclosure Framework—Changes to the Disclosure Requirements for Fair Value Measurement” (“ASU 2018-13”). ASU 2018-13 eliminates the requirement to disclose the amount of and reasons for transfers between Level 1 and Level 2 of the fair value hierarchy, the timing of transfers between levels of the fair value hierarchy, and the valuation processes for Level 3 fair value measurements. ASU 2018-13 does not eliminate the requirement to disclose the range and weighted average used to develop significant unobservable inputs for Level 3 fair value measurements, and the changes in unrealized gains and losses for recurring Level 3 fair value measurements. ASU 2018-13 requires that information is provided about the measurement uncertainty of Level 3 fair value measurements as of the reporting date. The guidance is effective for fiscal years beginning after December 15, 2019, and interim periods within those fiscal years. Management has |
| HENNESSY FUNDS | 1-800-966-4354 | |
| | evaluated the impact of this change in guidance, and due to the permissibility of early adoption, modified the Fund’s fair value disclosures for the current reporting period. |
| | |
| j). | New Rule Issuances – In August 2018, the Securities and Exchange Commission issued Final Rule Release No. 33 10532, Disclosure Update and Simplification, which in part amends certain financial statement disclosure requirements of Regulation S-X that have become redundant, duplicative, overlapping, outdated, or superseded, in light of other Commission disclosure requirements, GAAP, or changes in the information environment. The amendments are intended to facilitate the disclosure of information to investors and simplify compliance without significantly altering the total mix of information provided to investors. The amendments to Rule 6-04.17 of Regulation S-X (balance sheet) were amended to require presentation of the total, rather than the components of net assets, of distributable earnings on the balance sheet. Consistent with GAAP, funds will be required to disclose total distributable earnings. The amendments to Rule 6-09 of Regulation S-X (statement of changes in net assets) omit the requirement to separately state the sources of distributions paid as well as omit the requirement to parenthetically state the book basis amount of undistributed net investment income. Instead, consistent with GAAP, funds will be required to disclose the total amount of distributions paid, except that any tax return of capital must be separately disclosed. The requirements of the Final Rule Release are effective November 5, 2018 and the Fund’s Statement of Assets and Liabilities and the Statement of Changes in Net Assets for the current and prior reporting period have been modified accordingly. |
3). SECURITIES VALUATION
The Fund follows fair valuation accounting standards that establish an authoritative definition of fair value and set out a hierarchy for measuring fair value. These standards require additional disclosures about the various inputs and valuation techniques used to develop the measurements of fair value and a discussion of changes in valuation techniques and related inputs during the period. These inputs are summarized in the three broad levels listed below:
| | Level 1 – | Unadjusted, quoted prices in active markets for identical instruments that the Fund has the ability to access at the date of measurement. |
| | | |
| | Level 2 – | Other significant observable inputs (including, but not limited to, quoted prices in active markets for similar instruments, quoted prices in markets that are not active for identical or similar instruments, and model-derived valuations in which all significant inputs and significant value drivers are observable in active markets, such as interest rates, prepayment speeds, credit risk curves, default rates, and similar data). |
| | | |
| | Level 3 – | Significant unobservable inputs (including the Fund’s own assumptions about what market participants would use to price the asset or liability based on the best available information) when observable inputs are unavailable. |
Following is a description of the valuation techniques applied to the Fund’s major categories of assets and liabilities measured at fair value on a recurring basis.
Equity Securities – Equity securities, including common stocks, preferred stocks, foreign-issued common stocks, exchange-traded funds, closed-end mutual funds, partnerships, rights, and real estate investment trusts, that are traded on a securities exchange for which a last-quoted sales price is readily available will generally be valued at the last sales price as reported by the primary exchange on which the securities are listed. Securities listed on The NASDAQ Stock Market (“NASDAQ”)
| NOTES TO THE FINANCIAL STATEMENTS |
will generally be valued at the NASDAQ Official Closing Price, which may differ from the last sales price reported. Securities traded on a securities exchange for which a last-quoted sales price is not readily available will generally be valued at the mean between the bid and ask prices. To the extent these securities are actively traded and valuation adjustments are not applied, they are classified in Level 1 of the fair value hierarchy. Securities traded on foreign exchanges generally are not valued at the same time the Fund calculates its NAV because most foreign markets close well before such time. The earlier close of most foreign markets gives rise to the possibility that significant events, including broad market moves, may have occurred in the interim. In certain circumstances, it may be determined that a foreign security needs to be fair valued because it appears that the value of the security might have been materially affected by events occurring after the close of the market in which the security is principally traded, but before the time the Fund calculates its NAV, such as by a development that affects an entire market or region (e.g., a weather-related event) or a potentially global development (e.g., a terrorist attack that may be expected to have an effect on investor expectations worldwide).
Registered Investment Companies – Investments in open-end registered investment companies, commonly referred to as mutual funds, are generally priced at the ending NAV provided by the applicable mutual fund’s service agent and will be classified in Level 1 of the fair value hierarchy.
Debt Securities – Debt securities, including corporate bonds, asset-backed securities, mortgage-backed securities, municipal bonds, U.S. Treasuries, and U.S. government agency issues, are generally valued at market on the basis of valuations furnished by an independent pricing service that utilizes both dealer-supplied valuations and formula-based techniques. The pricing service may consider recently executed transactions in securities of the issuer or comparable issuers, market price quotations (where observable), bond spreads, and fundamental data relating to the issuer. In addition, the model may incorporate observable market data, such as reported sales of similar securities, broker quotes, yields, bids, offers, and reference data. Certain securities are valued primarily using dealer quotations. These securities are generally classified in Level 2 of the fair value hierarchy.
Short-Term Securities – Short-term equity investments, including money market funds, are valued in the manner specified above. Short-term debt investments with an original term to maturity of 60 days or less are valued at amortized cost, which approximates fair market value. If the original term to maturity of a short-term debt investment exceeded 60 days, then the values as of the 61st day prior to maturity are amortized. Amortized cost is not used if its use would be inappropriate due to credit or other impairments of the issuer, in which case the security’s fair value would be determined, as described below. Short-term securities are generally classified in Level 1 or Level 2 of the fair market hierarchy depending on the inputs used and market activity levels for specific securities.
The Board of Trustees of the Fund (the “Board”) has adopted fair value pricing procedures that are followed when a price for a security is not readily available or if a significant event has occurred that indicates the closing price of a security no longer represents the true value of that security. Fair value pricing determinations are made in good faith in accordance with these procedures. There are numerous criteria that will be given consideration in determining a fair value of a security, such as the trading volume of a security and markets, the values of other similar securities, and news events with direct bearing on a security or markets. Fair value pricing results in an estimated price for a
| HENNESSY FUNDS | 1-800-966-4354 | |
security that reflects the amount the Fund might reasonably expect to receive in a current sale. Depending on the relative significance of the valuation inputs, these securities may be classified in either Level 2 or Level 3 of the fair value hierarchy.
The fair valuation of foreign securities may be determined with the assistance of a pricing service using correlations between the movement of prices of such securities and indices of domestic securities and other appropriate indicators, such as closing market prices of relevant American Depositary Receipts or futures contracts. The effect of using fair value pricing is that the Fund’s NAV will reflect the affected portfolio securities’ values as determined by the Board or its designee, pursuant to the fair value pricing procedures adopted by the Board, instead of being determined by the market. Using a fair value pricing methodology to price a foreign security may result in a value that is different from such foreign security’s most recent closing price and from the value used by other investment companies to calculate their NAVs. Such securities are generally classified in Level 2 of the fair valuation hierarchy. Because the Fund may invest in foreign securities, the value of the Fund’s portfolio securities may change on days when you will not be able to purchase or redeem your shares.
The Board has delegated day-to-day valuation matters to a Valuation Committee comprised of one or more representatives from Hennessy Advisors, Inc., the Fund’s investment advisor (the “Advisor”). The function of the Valuation Committee is to value securities where current and reliable market quotations are not readily available. All actions taken by the Valuation Committee are reviewed by the Board.
The Fund has performed an analysis of all existing investments to determine the significance and character of all inputs to their fair value determinations. Various inputs are used to determine the value of the Fund’s investments. The inputs or methodology used for valuing securities are not necessarily an indication of the risk associated with investing in those securities. Details related to the fair valuation hierarchy of the Fund’s securities as of October 31, 2018, are included in the Schedule of Investments.
4). INVESTMENT TRANSACTIONS
Purchases and sales of investment securities (excluding government and short-term investments) for the Fund during fiscal year 2018 were $115,959,770 and $138,013,783, respectively.
There were no purchases or sales/maturities of long-term U.S. government securities for the Fund during fiscal year 2018.
The Fund is permitted to purchase or sell securities from or to another fund in the Hennessy Funds family of funds (the “Hennessy Funds”) under specified conditions outlined in procedures adopted by the Board. The procedures have been designed to ensure that any purchase or sale of securities by the Fund from or to another Hennessy Fund complies with Rule 17a-7 of the Investment Company Act of 1940, as amended. During fiscal year 2018, the Fund did not engage in purchases or sales of securities pursuant to Rule 17a-7 of the Investment Company Act of 1940, as amended.
5). INVESTMENT ADVISORY FEE AND OTHER TRANSACTIONS WITH AFFILIATES
The Advisor provides the Fund with investment advisory services under an Investment Advisory Agreement. The Advisor furnishes all investment advice, office space, and facilities, as well as most of the personnel needed by the Fund. As compensation for its services, the Advisor is entitled to a monthly fee from the Fund. The fee is based upon the average daily net assets of the Fund at an annual rate of 0.74%. The net investment advisory fees expensed by the Fund during fiscal year 2018 are included in the Statement of Operations.
| NOTES TO THE FINANCIAL STATEMENTS |
The Board has approved a Shareholder Servicing Agreement for Investor Class shares of the Fund, which was instituted to compensate the Advisor for the non-investment advisory services it provides to the Fund. The Shareholder Servicing Agreement provides for a monthly fee paid to the Advisor at an annual rate of 0.10% of the average daily net assets of the Fund attributable to Investor Class shares. The shareholder service fees expensed by the Fund during fiscal year 2018 are included in the Statement of Operations.
The Fund has adopted a plan pursuant to Rule 12b-1 under the Investment Company Act of 1940, as amended, that authorizes payments in connection with the distribution of the Fund’s shares at an annual rate of up to 0.25% of the Fund’s average daily net assets attributable to Investor Class shares. Even though the authorized rate is up to 0.25%, the Fund is currently only using up to 0.15% of its average daily net assets attributable to Investor Class shares for such purpose. Amounts paid under the plan may be spent on any activities or expenses primarily intended to result in the sale of shares, including, but not limited to, advertising, shareholder account servicing, printing and mailing of prospectuses to other than current shareholders, printing and mailing of sales literature, and compensation for sales and marketing activities or to financial institutions and others, such as dealers and distributors. The distribution fees expensed by the Fund during fiscal year 2018 are included in the Statement of Operations.
The Fund has entered into agreements with various brokers, dealers, and financial intermediaries in connection with the sale of shares of the Fund. The agreements provide for periodic payments by the Fund to the brokers, dealers, and financial intermediaries for providing certain shareholder maintenance services (sub-transfer agent expenses). These shareholder services include the pre-processing and quality control of new accounts, shareholder correspondence, answering customer inquiries regarding account status, and facilitating shareholder telephone transactions. The sub-transfer agent fees expensed by the Fund during fiscal year 2018 are included in the Statement of Operations.
U.S. Bancorp Fund Services, LLC, d/b/a U.S. Bank Global Fund Services (“Fund Services”) provides the Fund with administrative, fund accounting, and transfer agent services. As administrator, Fund Services is responsible for activities such as (i) preparing various federal and state regulatory filings, reports, and returns for the Fund, (ii) preparing reports and materials to be supplied to the Board, (iii) monitoring the activities of the Fund’s custodian, transfer agent, and accountants, and (iv) coordinating the preparation and payment of the Fund’s expenses and reviewing the Fund’s expense accruals. U.S. Bank N.A., an affiliate of Fund Services, serves as the Fund’s custodian. The servicing agreements between the Trust and Fund Services and U.S. Bank N.A. contain a fee schedule that is inclusive of administrative, fund accounting, custody, and transfer agent fees. The administrative, fund accounting, custody, and transfer agent fees expensed by the Fund during fiscal year 2018 are included in the Statement of Operations.
Quasar Distributors, LLC acts as the Fund’s principal underwriter in a continuous public offering of the Fund’s shares. Quasar Distributors, LLC is an affiliate of Fund Services and U.S. Bank N.A.
The officers of the Fund are affiliated with the Advisor. Such officers, with the exception of the Chief Compliance Officer and the Senior Compliance Officer, receive no compensation from the Fund for serving in their respective roles. The Fund, along with the other Hennessy Funds, makes reimbursement payments, on an equal basis, to the Advisor for a portion of the salary and benefits associated with the office of the Chief Compliance Officer and for all of the salary and benefits associated with the office of the Senior Compliance Officer. The compliance fees expensed by the Fund during fiscal year 2018 are included in the Statement of Operations.
| HENNESSY FUNDS | 1-800-966-4354 | |
6). GUARANTEES AND INDEMNIFICATIONS
Under the Hennessy Funds’ organizational documents, their officers and trustees are indemnified by the Hennessy Funds against certain liabilities arising out of the performance of their duties to the Hennessy Funds. Additionally, in the normal course of business, the Hennessy Funds enter into contracts with service providers that contain general indemnification clauses. The Fund’s maximum exposure under these arrangements is unknown as this would involve future claims that may be made against the Fund that have not yet occurred. Currently, the Fund expects the risk of loss to be remote.
7). LINE OF CREDIT
The Fund has an uncommitted line of credit with the other Hennessy Funds in the amount of the lesser of (i) $100,000,000 or (ii) 33.33% of each Hennessy Fund’s net assets, or 30% for the Hennessy Gas Utility Fund and 10% for the Hennessy Balanced Fund, intended to provide short-term financing, if necessary, subject to certain restrictions, in connection with shareholder redemptions. The credit facility is with the Hennessy Funds’ custodian bank, U.S. Bank N.A. Borrowings under this arrangement bear interest at the bank’s prime rate and are secured by all of the Fund’s assets (as to its own borrowings only). During fiscal year 2018, the Fund did not have any borrowings outstanding under the line of credit.
8). FEDERAL TAX INFORMATION
As of October 31, 2018, the components of accumulated earnings (losses) for income tax purposes were as follows:
| | | Investments | |
| Cost of investments for tax purposes | | $ | 265,224,797 | |
| Gross tax unrealized appreciation | | $ | 31,214,430 | |
| Gross tax unrealized depreciation | | | (22,194,269 | ) |
| Net tax unrealized appreciation/(depreciation) | | $ | 9,020,161 | |
| Undistributed ordinary income | | $ | 20,685,079 | |
| Undistributed long-term capital gains | | | 15,862,374 | |
| Total distributable earnings | | $ | 36,547,453 | |
| Other accumulated gain/(loss) | | $ | — | |
| Total accumulated gain/(loss) | | $ | 45,567,614 | |
The difference between book-basis unrealized appreciation/depreciation (as shown in the Statement of Assets and Liabilities) and tax-basis unrealized appreciation/depreciation (as shown above) is attributable primarily to wash sales.
As of October 31, 2018, the Fund had no tax basis capital losses to offset future capital gains.
As of October 31, 2018, the Fund did not defer, on a tax basis, any late-year ordinary losses. Late-year ordinary losses are net ordinary losses incurred after December 31, 2017, but within the taxable year, that are deemed to arise on the first day of the Fund’s next taxable year.
During fiscal year 2018 and fiscal year 2017, the tax character of distributions paid by the Fund was as follows:
| | | Year Ended | | | Year Ended | |
| | | October 31, 2018 | | | October 31, 2017 | |
Ordinary income(1) | | $ | 8,809,992 | | | $ | 2,968,360 | |
| Long-term capital gain | | | 31,059,975 | | | | — | |
| | | $ | 39,869,967 | | | $ | 2,968,360 | |
| | | | | | | | | |
(1) Ordinary income includes short-term capital gains. | | | | | | | | |
| NOTES TO THE FINANCIAL STATEMENTS |
9). AGREEMENT AND PLAN OF REORGANIZATION
On December 27, 2016, the Board of the Trust approved and declared advisable the reorganization of the Hennessy Large Value Fund (the “Large Value Fund”) into the Fund pursuant to an Agreement and Plan of Reorganization. The purpose of the reorganization was to combine two funds within the Trust with similar investment objectives and strategies. The reorganization provided for the transfer of assets of the Large Value Fund to the Fund and the assumption of the liabilities of the Large Value Fund by the Fund. Following the reorganization, the Fund held the assets of the Large Value Fund until the Fund rebalanced its portfolio in the winter, pursuant to its customary procedures. The reorganization was effective as of the close of business on February 27, 2017. The following tables illustrate the specifics of the reorganization of the Large Value Fund into the Fund:
| | Shares Issued | | | |
| | to Shareholders | Cornerstone | | |
| Large Value Fund | of Large Value | Value Fund | Combined | Tax Status |
Net Assets | Fund | Net Assets | Net Assets | of Transfer |
$144,938,380(1) | 7,255,257 | $138,339,221 | $283,277,601 | Non-taxable |
(1) | Includes accumulated realized losses and unrealized appreciation in the amounts of $(1,561,193) and $34,112,735, respectively. |
Assuming the reorganization had been completed on November 1, 2016, the beginning of the annual reporting period of the Fund for fiscal year 2017, the pro forma results of operation (unaudited) for fiscal year 2017 would have been as follows:
| Net investment income | | $ | 6,090,397 | |
| Net realized gain on investments | | $ | 41,027,748 | |
| Net change in unrealized appreciation on investments | | $ | 5,413,160 | |
| Net increase in net assets resulting from operations | | $ | 52,531,305 | |
Because the Fund has been managed as a single integrated portfolio since the reorganization was completed, it is not practicable to separate the amounts of revenue and earnings of the Large Value Fund that have been included in the Fund’s Statement of Operations since February 27, 2017.
10). EVENTS SUBSEQUENT TO YEAR END
Management has evaluated the Fund’s related events and transactions that occurred subsequent to October 31, 2018, through the date of issuance of the Fund’s financial statements. Other than as disclosed below, management has determined that there were no subsequent events requiring recognition or disclosure in the financial statements.
On December 7, 2018, capital gains were declared and paid to shareholders of record on December 6, 2018, as follows:
| | | Long-term | | | Short-term | |
| Investor Class | | $ | 1.12340 | | | $ | 1.09611 | |
| Institutional Class | | $ | 1.12535 | | | $ | 1.09801 | |
On December 27, 2018, income distributions were declared and paid to shareholders of record on December 26, 2018, as follows:
| Investor Class | | $ | 0.41092028 | | | | | |
| Institutional Class | | $ | 0.44958484 | | | | | |
| HENNESSY FUNDS | 1-800-966-4354 | |
Report of Independent Registered Public
Accounting Firm
To the Board of Trustees of Hennessy Funds Trust
and the shareholders of Hennessy Cornerstone Value Fund
Novato, CA
Opinion on the Financial Statements
We have audited the accompanying statement of assets and liabilities of Hennessy Cornerstone Value Fund (the “Fund”), a series of Hennessy Funds Trust, including the schedule of investments, as of October 31, 2018, the related statement of operations for the year then ended, the statements of changes in net assets and the financial highlights for each of the two years in the period then ended, and the related notes (collectively referred to as the “financial statements”). In our opinion, the financial statements present fairly, in all material respects, the financial position of the Fund as of October 31, 2018, the results of its operations for the year then ended, and the changes in its net assets and the financial highlights for each of the two years in the period then ended in conformity with accounting principles generally accepted in the United States of America.
The financial highlights for each of the three years in the period ended October 31, 2016 have been audited by other auditors, whose report dated December 22, 2016 expressed unqualified opinions on such financial highlights.
Basis for Opinion
These financial statements are the responsibility of the Fund’s management. Our responsibility is to express an opinion on the Fund’s financial statements based on our audits. We are a public accounting firm registered with the Public Company Accounting Oversight Board (United States) (“PCAOB”) and are required to be independent with respect to the Fund in accordance with the U.S. federal securities laws and the applicable rules and regulations of the Securities and Exchange Commission and the PCAOB. We have served as the auditor of one or more of the funds in the Trust since 2002.
We conducted our audits in accordance with the standards of the PCAOB. Those standards require that we plan and perform the audit to obtain reasonable assurance about whether the financial statements are free of material misstatement, whether due to error or fraud. The Fund is not required to have, nor were we engaged to perform, an audit of its internal control over financial reporting. As part of our audits we are required to obtain an understanding of internal control over financial reporting, but not for the purpose of expressing an opinion on the effectiveness of the Fund’s internal control over financial reporting. Accordingly, we express no such opinion.
Our audits included performing procedures to assess the risks of material misstatement of the financial statements, whether due to error or fraud, and performing procedures that respond to those risks. Such procedures included examining, on a test basis, evidence regarding the amounts and disclosures in the financial statements. Our audits also included evaluating the accounting principles used and significant estimates made by management, as well as evaluating the overall presentation of the financial statements. Our procedures included confirmation of securities owned as of October 31, 2018 by correspondence with the custodian. We believe that our audits provide a reasonable basis for our opinion.
TAIT, WELLER & BAKER LLP
Philadelphia, Pennsylvania
December 27, 2018
| REPORT OF INDEPENDENT REGISTERED PUBLIC ACCOUNTING FIRM/TRUSTEES AND OFFICERS |
Trustees and Officers of the Fund (Unaudited)
The business and affairs of the Funds are managed under the direction of the Board of Trustees of the Trust, and the Board of Trustees elects the Officers of the Trust. Beginning in March 2015, the Board of Trustees has from time to time appointed advisers to the Board of Trustees (“Advisers”) with the intention of having qualified individuals serve in an advisory capacity in order to garner experience in the mutual fund and asset management industry and be considered as potential Trustees in the future. There are currently three Advisers: Brian Alexander, Doug Franklin, and Claire Knoles. As Advisers, Mr. Alexander, Mr. Franklin, and Ms. Knoles attend meetings of the Board of Trustees and act as non-voting participants. Information pertaining to the Trustees, Advisers, and the Officers of the Trust is set forth below. The Trustees and Officers serve until their successors are duly elected and qualified or until their earlier death, resignation, or removal. Each Trustee oversees the 16 Hennessy Funds. Unless otherwise indicated, the address of all persons listed below is 7250 Redwood Boulevard, Suite 200, Novato, CA 94945. The Fund’s Statement of Additional Information includes more information about the persons listed below and is available, without charge, upon request by calling 1-800-966-4354.
| | | | Other |
| | | | Directorships |
| | | | Held Outside |
| Name, (Year of Birth), | | | of Fund |
| and Position Held | Start Date | Principal Occupation(s) | Complex During |
with the Trust | of Service | During Past Five Years | Past Five Years(1) |
| | |
| Disinterested Trustees and Advisers | |
| | | | |
| J. Dennis DeSousa | January 1996 | Mr. DeSousa is a real estate investor. | None. |
| (1936) | | | |
| Trustee | | | |
| | | | |
| Robert T. Doyle | January 1996 | Mr. Doyle has been the Sheriff of | None. |
| (1947) | | Marin County, California since 1996. | |
| Trustee | | | |
| | | | |
| Gerald P. Richardson | May 2004 | Mr. Richardson is an independent | None. |
| (1945) | | consultant in the securities industry. | |
| Trustee | | | |
| | | | |
| Brian Alexander | March 2015 | Mr. Alexander has worked for the | None. |
| (1981) | | Sutter Health organization since | |
| Adviser to the Board | | 2011 in various positions. He has | |
| | | served as the Chief Executive Officer | |
| | | of the Sutter Roseville Medical | |
| | | Center since 2018. From 2016 through | |
| | | 2018, he served as the Vice President | |
| | | of Strategy for the Sutter Health Valley | |
| | | Area, which includes 11 hospitals, | |
| | | 13 ambulatory surgery centers, | |
| | | 16,000 employees, and 1,900 physicians. | |
| | | From 2013 through 2016, Mr. Alexander | |
| | | served as Sutter Novato Community | |
| | | Hospital’s Chief Administrative Officer, | |
| | | and from 2011 through 2012, he | |
| | | served as a Director of Strategy | |
| | | within Sutter’s West Bay Region. | |
| HENNESSY FUNDS | 1-800-966-4354 | |
| | | | Other |
| | | | Directorships |
| | | | Held Outside |
| Name, (Year of Birth), | | | of Fund |
| and Position Held | Start Date | Principal Occupation(s) | Complex During |
with the Trust | of Service | During Past Five Years | Past Five Years(1) |
| | | | |
| Doug Franklin | March 2016 | Mr. Franklin is a retired insurance | None. |
| (1964) | | industry executive. From 1987 | |
| Adviser to the Board | | through 2015, he was employed | |
| | | by the Allianz-Fireman’s Fund | |
| | | Insurance Company in various | |
| | | positions, including as its Chief | |
| | | Actuary and Chief Risk Officer. | |
| | | | |
| Claire Knoles | December 2015 | Ms. Knoles is a founder of Kiosk and | None. |
| (1974) | | has served as its Chief Operating | |
| Adviser to the Board | | Officer since 2004. Kiosk is a full | |
| | | service marketing agency with | |
| | | offices in the San Francisco Bay | |
| | | Area, Toronto, and Liverpool, UK. | |
| | | | |
Interested Trustee(2) | | | |
| | | | |
| Neil J. Hennessy | January 1996 as | Mr. Neil Hennessy has been employed | Hennessy |
| (1956) | a Trustee and | by Hennessy Advisors, Inc. since | Advisors, Inc. |
| Trustee, Chairman of | June 2008 as | 1989 and currently serves as its | |
| the Board, Chief | an Officer | Chairman and Chief Executive Officer. | |
| Investment Officer, | | | |
| Portfolio Manager, | | | |
| and President | | | |
| Name, (Year of Birth), | | |
| and Position Held | Start Date | Principal Occupation(s) |
with the Trust | of Service | During Past Five Years |
| | | |
| Officers | | |
| | | |
| Teresa M. Nilsen | January 1996 | Ms. Nilsen has been employed by Hennessy Advisors, Inc. |
| (1966) | | since 1989 and currently serves as its President, Chief Operating |
| Executive Vice President | | Officer, and Secretary. |
| and Treasurer | | |
| | | |
| Daniel B. Steadman | March 2000 | Mr. Steadman has been employed by Hennessy Advisors, Inc. |
| (1956) | | since 2000 and currently serves as its Executive Vice President. |
| Executive Vice President | | |
| and Secretary | | |
| | | |
| Brian Carlson | December 2013 | Mr. Carlson has been employed by Hennessy Advisors, Inc. |
| (1972) | | since December 2013 and currently serves as its Chief |
| Senior Vice President | | Compliance Officer and Senior Vice President. |
| and Head of Distribution | | |
| | | |
| Jennifer Cheskiewicz | June 2013 | Ms. Cheskiewicz has been employed by Hennessy Advisors, Inc. |
(1977)(3) | | as its General Counsel since June 2013. |
| Senior Vice President and | | |
| Chief Compliance Officer | | |
| TRUSTEES AND OFFICERS OF THE FUND |
| Name, (Year of Birth), | | |
| and Position Held | Start Date | Principal Occupation(s) |
with the Trust | of Service | During Past Five Years |
| | | |
| David Ellison | October 2012 | Mr. Ellison has been employed by Hennessy Advisors, Inc. since |
(1958)(4) | | October 2012. He has served as a Portfolio Manager of the |
| Senior Vice President | | Hennessy Large Cap Financial Fund and the Hennessy Small |
| and Portfolio Manager | | Cap Financial Fund since inception. Mr. Ellison also served as a |
| | | Portfolio Manager of the Hennessy Technology Fund from its |
| | | inception until February 2017. Mr. Ellison served as Director, |
| | | CIO and President of FBR Fund Advisers, Inc. from December |
| | | 1999 to October 2012. |
| | | |
| Ryan C. Kelley | March 2013 | Mr. Kelley has been employed by Hennessy Advisors, Inc. since |
(1972)(5) | | October 2012. He has served as a Portfolio Manager of the |
| Senior Vice President | | Hennessy Gas Utility Fund, the Hennessy Large Cap Financial |
| and Portfolio Manager | | Fund, and the Hennessy Small Cap Financial Fund since |
| | | October 2014. He served as Co-Portfolio Manager of the same |
| | | funds from March 2013 through September 2014, and as a |
| | | Portfolio Analyst for the Hennessy Funds from October 2012 |
| | | through February 2013. Mr. Kelley has also served as a Portfolio |
| | | Manager of the Hennessy Cornerstone Growth Fund, the |
| | | Hennessy Cornerstone Mid Cap 30 Fund, the Hennessy |
| | | Cornerstone Large Growth Fund, and the Hennessy |
| | | Cornerstone Value Fund since February 2017, as a Co-Portfolio |
| | | Manager of the Hennessy Technology Fund since February |
| | | 2017, and as a Portfolio Manager of the Hennessy Total Return |
| | | Fund and the Hennessy Balanced Fund since May 2018. |
| | | Mr. Kelley served as Portfolio Manager of FBR Fund Advisers, |
| | | Inc. from January 2008 to October 2012. |
| | | |
| Tania Kelley | October 2003 | Ms. Kelley has been employed by Hennessy Advisors, Inc. |
| (1965) | | since October 2003. |
| Senior Vice President | | |
| and Head of Marketing | | |
| Daniel P. Hennessy | December 2016 | Mr. Daniel Hennessy has been employed by Hennessy Advisors, |
| (1990) | | Inc. since 2015. He has served as an Associate Analyst or |
| Vice President | | Analyst of the Hennessy Technology Fund since February 2017. |
| and Analyst | | Mr. Daniel Hennessy previously served as a Mutual Fund |
| | | Specialist at U.S. Bancorp Fund Services, LLC (now doing |
| | | business as U.S. Bank Global Fund Services) from November |
| | | 2014 to July 2015. Prior to that, he attended the University of |
| | | San Diego, where he earned a degree in Political Science. |
_______________
(1) | Messrs. DeSousa, Doyle, N. Hennessy, and Richardson previously served on the Board of Directors of Hennessy Mutual Funds, Inc. (“HMFI”), The Hennessy Funds, Inc. (“HFI”), and Hennessy SPARX Funds Trust (“HSFT”). Pursuant to an internal reorganization effective as of February 28, 2014, the series of HFMI, HFI, and HSFT were reorganized into corresponding series of the Trust that mirrored them. Subsequent to the reorganization, HFMI, HFI, and HSFT were dissolved. |
(2) | Mr. N. Hennessy is considered an “interested person,” as defined in the Investment Company Act of 1940, as amended, because he is an officer of the Hennessy Funds. |
(3) | The address of this officer is 4800 Bee Caves Road, Suite 100, Austin, TX 78746. |
(4) | The address of this officer is 101 Federal Street, Suite 1900, Boston, MA 02110. |
(5) | The address of this officer is 1340 Environ Way, Suite 332, Chapel Hill, NC 27517. |
| HENNESSY FUNDS | 1-800-966-4354 | |
Expense Example (Unaudited)
October 31, 2018
As a shareholder of the Fund, you incur ongoing costs, including management fees, service fees, and other Fund expenses. This Example is intended to help you understand your ongoing costs (in dollars) of investing in the Fund and to compare these costs with the ongoing costs of investing in other mutual funds. The Example is based on an investment of $1,000 invested at the beginning of the period and held for the entire period from May 1, 2018, through October 31, 2018.
Actual Expenses
The first line of the table below under the “Investor Class” and “Institutional Class” headings provides information about actual account values and actual expenses. Although the Fund charges no sales loads or transaction fees, you will be assessed fees for outgoing wire transfers, returned checks and stop payment orders at prevailing rates charged by U.S. Bank Global Fund Services, the Fund’s transfer agent. If you request that a redemption be made by wire transfer, currently a $15 fee is charged by the Fund’s transfer agent. IRA accounts will be charged a $15 annual maintenance fee. The example below includes, but is not limited to, management fees, shareholder servicing fees, fund accounting, custody, and transfer agent fees. However, the example below does not include portfolio trading commissions and related expenses, and other extraordinary expenses as determined under generally accepted accounting principles. You may use the information in this line, together with the amount you invested, to estimate the expenses that you paid over the period. Simply divide your account value by $1,000 (for example, an $8,600 account value divided by $1,000 = 8.6), then multiply the result by the number in the first line of the table under the “Investor Class” or “Institutional Class” headings in the column entitled “Expenses Paid During Period” to estimate the expenses you paid on your account during this period.
Hypothetical Example for Comparison Purposes
The second line of the table below under the “Investor Class” and “Institutional Class” headings provides information about hypothetical account values and hypothetical expenses based on the Fund’s actual expense ratios and an assumed rate of return of 5% per year before expenses, which is not the Fund’s actual return. The hypothetical account values and expenses may not be used to estimate the actual ending account balance or expenses you paid for the period. You may use this information to compare the ongoing costs of investing in the Fund and other funds. To do so, compare this 5% hypothetical example with the 5% hypothetical examples that appear in the shareholder reports of the other funds. Please note that the expenses shown in the table are meant to highlight your ongoing costs only. Therefore, the second line of the table under the “Investor Class” and “Institutional Class” headings is useful in comparing ongoing costs only, and will not help you determine the relative total costs of owning different funds.
| | | | Expenses Paid |
| | Beginning | Ending | During Period(1) |
| | Account Value | Account Value | May 1, 2018 – |
| | May 1, 2018 | October 31, 2018 | October 31, 2018 |
| Investor Class | | | |
| Actual | $1,000.00 | $ 992.30 | $6.08 |
| Hypothetical (5% return before expenses) | $1,000.00 | $1,019.11 | $6.16 |
| | | | |
| Institutional Class | | | |
| Actual | $1,000.00 | $ 993.80 | $4.92 |
| Hypothetical (5% return before expenses) | $1,000.00 | $1,020.27 | $4.99 |
(1) | Expenses are equal to the Fund’s annualized expense ratio of 1.21% for Investor Class shares or 0.98% for Institutional Class shares, as applicable, multiplied by the average account value over the period, multiplied by 184/365 days (to reflect one-half year period). |
| HENNESSY FUNDS | 1-800-966-4354 | |
How to Obtain a Copy of the Fund’s
Proxy Voting Policy and Proxy Voting Records
A description of the policies and procedures the Fund uses to determine how to vote proxies relating to portfolio securities is available without charge: (1) by calling 1-800-966-4354; (2) on the Hennessy Funds’ website at www.hennessyfunds.com/proxy-voting/voting-policy; or (3) on the U.S. Securities and Exchange Commission’s (the “SEC”) website at www.sec.gov. The Fund’s proxy voting record is available without charge on both the Hennessy Funds’ website at www.hennessyfunds.com/proxy-voting/voting-record and the SEC’s website at www.sec.gov no later than August 31 for the prior 12 months ending June 30.
Quarterly Filings on Form N-Q
The Fund files a complete schedule of portfolio holdings with the SEC for the first and third quarters of each fiscal year on Form N-Q. The Fund’s Forms N-Q are available on the SEC’s website at www.sec.gov. Information included in the Fund’s Forms N-Q will also be available upon request by calling 1-800-966-4354.
Federal Tax Distribution Information
(Unaudited)
For fiscal year 2018, certain dividends paid by the Fund may be subject to a maximum tax rate of 23.8%, as provided for by the Jobs and Growth Tax Relief Reconciliation Act of 2003. The percentage of dividends declared from ordinary income designated as qualified dividend income was 92.71%.
For corporate shareholders, the percent of ordinary income distributions that qualified for the corporate dividends received deduction for fiscal year 2018 was 63.20%.
The percentage of taxable ordinary income distributions that were designated as short-term capital gain distributions under Section 871(k)(2)(C) of the Internal Revenue Code of 1986, as amended, for the Fund was 29.97%.
Important Notice Regarding Delivery
of Shareholder Documents
To help keep the Fund’s costs as low as possible, we generally deliver a single copy of shareholder reports, proxy statements, and prospectuses to shareholders who share an address and have the same last name. This process does not apply to account statements. You may request an individual copy of a shareholder document at any time. If you would like to receive separate mailings of shareholder documents, please call U.S. Bank Global Fund Services at 1-800-261-6950 or 1-414-765-4124, and individual delivery will begin within 30 days of your request. If your account is held through a financial institution or other intermediary, please contact such intermediary directly to request individual delivery.
| PROXY VOTING — PRIVACY POLICY |
Privacy Policy
We collect the following non-public personal information about you:
| | • | information we receive from you on or in applications or other forms, correspondence, or conversations, including, but not limited to, your name, address, phone number, social security number, assets, income, and date of birth; and |
| | | |
| | • | information about your transactions with us, our affiliates, or others, including, but not limited to, your account number and balance, payment history, parties to transactions, cost basis information, and other financial information. |
We do not disclose any non-public personal information about our current or former shareholders to non-affiliated third parties, except as permitted by law. For example, we are permitted by law to disclose all of the information we collect, as described above, to our Transfer Agent to process your transactions. Furthermore, we restrict access to your non-public personal information to those persons who require such information to provide products or services to you. We maintain physical, electronic, and procedural safeguards that comply with federal standards to guard your non-public personal information.
In the event that you hold shares of the Fund through a financial intermediary, including, but not limited to, a broker-dealer, bank, or trust company, the privacy policy of your financial intermediary would govern how your non-public personal information will be shared with non-affiliated third parties.
| HENNESSY FUNDS | 1-800-966-4354 | |
(This Page Intentionally Left Blank.)
For information, questions or assistance, please call
The Hennessy Funds
1-800-966-4354 or 1-415-899-1555
INVESTMENT ADVISOR
Hennessy Advisors, Inc.
7250 Redwood Boulevard, Suite 200
Novato, California 94945
ADMINISTRATOR,
TRANSFER AGENT,
DIVIDEND PAYING AGENT, &
SHAREHOLDER SERVICING AGENT
U.S. Bancorp Fund Services, LLC
d/b/a U.S. Bank Global Fund Services
P.O. Box 701
Milwaukee, Wisconsin 53201-0701
CUSTODIAN
U.S. Bank N.A.
Custody Operations
1555 North River Center Drive, Suite 302
Milwaukee, Wisconsin 53212
TRUSTEES
Neil J. Hennessy
Robert T. Doyle
J. Dennis DeSousa
Gerald P. Richardson
COUNSEL
Foley & Lardner LLP
777 East Wisconsin Avenue
Milwaukee, Wisconsin 53202-5306
INDEPENDENT REGISTERED
PUBLIC ACCOUNTING FIRM
Tait, Weller & Baker LLP
Two Liberty Place
50 South 16th Street, Suite 2900
Philadelphia, Pennsylvania 19102-2529
DISTRIBUTOR
Quasar Distributors, LLC
777 East Wisconsin Avenue
Milwaukee, Wisconsin 53202
hennessyfunds.com | 1-800-966-4354
This report has been prepared for shareholders and may be distributed to
others only if preceded or accompanied by a current prospectus.
ANNUAL REPORT
OCTOBER 31, 2018
HENNESSY TOTAL RETURN FUND
Investor Class HDOGX
hennessyfunds.com | 1-800-966-4354
(This Page Intentionally Left Blank.)
Contents
| Letter to Shareholders | 2 |
| Performance Overview | 4 |
| Financial Statements | |
| Schedule of Investments | 6 |
| Statement of Assets and Liabilities | 10 |
| Statement of Operations | 11 |
| Statements of Changes in Net Assets | 12 |
| Statement of Cash Flows | 13 |
| Financial Highlights | 14 |
| Notes to the Financial Statements | 16 |
| Report of Independent Registered Public Accounting Firm | 25 |
| Trustees and Officers of the Fund | 26 |
| Expense Example | 30 |
| Proxy Voting Policy and Proxy Voting Records | 32 |
| Quarterly Schedule of Investments | 32 |
| Federal Tax Distribution Information | 32 |
| Important Notice Regarding Delivery of Shareholder Documents | 32 |
| Privacy Policy | 33 |
| HENNESSY FUNDS | 1-800-966-4354 | |
December 2018
Dear Hennessy Funds Shareholder:
Over the past year, we have witnessed the return of market volatility. U.S. stocks still registered healthy gains, bolstered by the impact on corporate profits of the successful passage of the tax reform bill in December 2017. However, concerns over potential trade disruptions, especially between the U.S. and China, and worries over higher short-term interest rates, which many believe could possibly trigger a recession down the road, put downward pressure on equity valuations.
The U.S. economy performed well over the period, and actually achieved an acceleration in GDP growth to over 3% on an annualized basis in the second and third quarters of calendar year 2018. During the past year, companies continued to hire workers, adding over 200,000 jobs per month on average, sending the unemployment rate down to 3.7% in October, which is the lowest it has been since 1969. Consumer confidence is high and still rising, and corporate profits reached record levels in the third quarter of calendar year 2018, posting a year-over-year increase of 26% for the companies in the S&P 500 Index.
The Federal Reserve, confident about the strength of the economy and mindful of a tight labor market, raised short-term interest rates four times over the last year, by a quarter point each time. Long-term bond yields also rose, driven higher primarily by evidence of faster wage growth, pushing the U.S. 10-year Treasury bond over 3% for the first time since 2013.
As I write this, we are experiencing the market’s 20th downturn since 2010. I have been saying that every bull market experiences volatility and pullbacks. Many financial commentators think this bull market is “long in the tooth.” I do not agree with them. I believe stock valuations are still very reasonable. The prospective price to earnings multiple for the Dow Jones Industrial Average has come down from almost 20x at the end of 2017 to 16x, just above its 10-year average of 15x. The prospective PE multiple for the S&P 500 Index has also come down, from 20x to 17x, and compares favorably to its 10-year average of 16x.
Cash, meanwhile, continues to build up on corporate balance sheets. The companies in the S&P 500 Index reported a total of over $5.4 trillion in cash and marketable securities in their latest filings. Companies have been spending some of their cash, increasing their investment spending and laying the groundwork for future earnings growth. However, they have also been returning capital to shareholders. S&P 500 Index companies announced $433.6 billion in share repurchases during the second quarter of calendar year 2018, nearly doubling the previous record of $242.1 billion set in the first quarter. Companies are also raising their dividends.
In addition, I believe the Federal Reserve will take care not to raise interest rates too high or too fast and endanger the economic expansion. While wage growth has risen to over 3% in October, other measures of inflationary pressure, such as the Consumer Price Index and the Producer Price Index, still show prices increasing at a more moderate pace, closer to 2%. Given continued evidence of modest rates of inflation, I believe the Fed will be able to maintain its gradual pace of interest rate hikes.
Finally and importantly, I still see no signs of euphoria in this market. In my opinion, the enthusiasm present earlier in the year, which followed the significant reduction in corporate income tax rates, has largely evaporated, and it has been replaced with anxiety
over higher interest rates and their potential impact on growth. In the past, I have likened the current bull market to that of 1982-2000, and I still believe this comparison holds true. I am confident in the strength of the market today and believe the economy will continue to grow in the coming year, albeit at a more moderate pace.
Thank you for your continued confidence and investment in the Hennessy Funds. If you have any questions or would like to speak with us directly, please don’t hesitate to call us at (800) 966-4354.
Best regards,
Neil J. Hennessy
President and Chief Investment Officer
Past performance does not guarantee future results.
Mutual fund investing involves risk. Principal loss is possible.
Opinions expressed are those of Neil Hennessy and are subject to change, are not guaranteed, and should not be considered investment advice.
The Dow Jones Industrial Average and S&P 500 Index are commonly used to measure the performance of U.S. stocks. One cannot invest directly in an index.
PE, or price to earnings, is a valuation measure and is calculated by dividing a company’s market price per share by its earnings per share. Earnings growth is not a measure of a fund’s future performance.
| HENNESSY FUNDS | 1-800-966-4354 | |
Performance Overview (Unaudited)
CHANGE IN VALUE OF $10,000 INVESTMENT
This graph illustrates the performance of an initial investment of $10,000 made in the Fund ten years ago and assumes the reinvestment of dividends.
AVERAGE ANNUAL TOTAL RETURN FOR PERIODS ENDED OCTOBER 31, 2018
| | One | Five | Ten |
| | Year | Years | Years |
| Hennessy Total Return Fund (HDOGX) | 4.92% | 6.94% | 8.90% |
| 75/25 Blended DJIA/Treasury Index | 7.90% | 9.70% | 10.12% |
| Dow Jones Industrial Average | 9.87% | 12.76% | 13.33% |
Expense ratio: 1.58%
Performance data quoted represents past performance; past performance does not guarantee future results. The investment return and principal value of an investment will fluctuate so that an investor’s shares, when redeemed, may be worth more or less than their original cost. The performance table does not reflect the deduction of taxes that a shareholder would pay on Fund distributions or the redemption of Fund shares. Current performance of the Fund may be lower or higher than the performance quoted. Performance data current to the most recent month end may be obtained by visiting www.hennessyfunds.com.
The 75/25 Blended DJIA/Treasury Index consists of 75% common stocks represented by the Dow Jones Industrial Average and 25% short-duration Treasury securities represented by the ICE BofAML U.S. 3-Month Treasury Bill Index. The Dow Jones Industrial Average is commonly used to measure the performance of U.S. stocks. The ICE BofAML U.S. 3-Month Treasury Bill Index is comprised of Treasury securities maturing in 90 days. One cannot invest directly in an index.
The expense ratio presented is from the most recent prospectus. The expense ratio for the current reporting period is available in the Financial Highlights section of this report.
PERFORMANCE NARRATIVE
Portfolio Managers Neil J. Hennessy and Ryan C. Kelley
Performance:
For the 12-month period ended October 31, 2018, the Hennessy Total Return Fund returned 4.92%, underperforming both the 75/25 Blended DJIA/Treasury Index (the
Fund’s primary benchmark) and the Dow Jones Industrial Average, which returned 7.90% and 9.87%, respectively, for the same period.
The Fund underperformed its primary benchmark predominantly as a result of stock selection, particularly in the Industrials sector, where the Fund’s holding in General Electric Co. hurt performance. In the Information Technology sector, the Fund did not own Apple, Inc., which detracted from relative performance, as did the Fund’s overweight position in International Business Machines Corp. The Fund’s overweight position in the Health Care sector contributed positively to relative performance, with pharmaceutical companies Pfizer, Inc. and Merck & Co., Inc. performing well.
The Fund continues to hold all the companies mentioned with the exception of Apple, Inc.
Portfolio Strategy:
The Fund invests approximately 75% of its assets in the “Dogs of the Dow,” the 10 highest dividend-yielding Dow stocks, and 25% of its assets in U.S. Treasuries. As a result of this “blended” strategy, the Fund may be expected to underperform equities in periods when equity markets rise and outperform in periods when equity markets fall. The Fund is designed to allow investors to gain exposure to the equity market while maintaining a percentage of their investment in fixed income securities. We believe the Fund is well positioned for the more conservative investor, as the equity portion of the portfolio is invested in what we would deem to be high-quality companies, each with a historically high dividend yield and the balance of the Fund is invested in lower-risk, short-duration U.S. Treasuries.
Investment Commentary:
We continue to believe that the outlook for U.S. stocks is positive. The U.S. economy is growing at a healthy rate, unemployment is low, and growth in both consumption and capital spending has accelerated over the last 12 months. Corporate earnings have risen significantly over the first nine months of 2018, helped, in part, by lower taxes. We expect earnings growth to be slower next year yet remain positive, driven primarily by continued steady economic growth.
Should the market experience a correction, we would expect our more defensive holdings to perform well relative to the market. The relatively short duration of the 25% weighting of U.S. Treasuries in the portfolio (all less than one year) may allow us the ability to roll into higher-yielding Treasuries in the event yields continue to rise.
_______________
Opinions expressed are those of the Portfolio Managers as of the date written and are subject to change, are not guaranteed, and should not be considered investment advice or an indication of trading intent.
The Fund is non-diversified, meaning it may concentrate its assets in fewer individual holdings than a diversified fund, making it more exposed to individual stock volatility than a diversified fund. The Fund’s formula-based strategy may cause the Fund to buy or sell securities at times when it may not be advantageous. Please see the Fund’s prospectus for a more complete discussion of these and other risks.
References to specific securities should not be considered a recommendation to buy or sell any security. Fund holdings and sector allocations are subject to change. Please refer to the Schedule of Investments included in this report for additional portfolio information.
Dividend yield is calculated by dividing a company’s dividends per share by its market price per share. Earnings growth is not representative of the Fund’s future performance.
| HENNESSY FUNDS | 1-800-966-4354 | |
Financial Statements
Schedule of Investments as of October 31, 2018 |
HENNESSY TOTAL RETURN FUND
(% of Net Assets)
| TOP TEN HOLDINGS (EXCLUDING MONEY MARKET FUNDS) | % NET ASSETS |
| U.S. Treasury Bill, 2.155%, 11/15/2018 | 25.12% |
| U.S. Treasury Bill, 2.125%, 12/20/2018 | 22.97% |
| U.S. Treasury Bill, 2.270%, 01/17/2019 | 20.85% |
| Cisco Systems, Inc. | 7.98% |
| Pfizer, Inc. | 7.80% |
| Verizon Communications, Inc. | 7.51% |
| Merck & Co., Inc. | 7.21% |
| The Coca-Cola Co. | 7.13% |
| The Procter & Gamble Co. | 7.05% |
| Exxon Mobil Corp. | 6.53% |
Note: For presentation purposes, the Fund has grouped some of the industry categories. For purposes of categorizing securities for compliance with Section 8(b)(1) of the Investment Company Act of 1940, as amended, the Fund uses more specific industry classifications.
The Global Industry Classification Standard (GICS®) was developed by and is the exclusive property and a service mark of MSCI, Inc. and Standard & Poor Financial Services LLC. It has been licensed for use by the Hennessy Funds.
| COMMON STOCKS – 67.50% | | Number | | | | | | % of | |
| | | of Shares | | | Value | | | Net Assets | |
| Communication Services – 7.51% | | | | | | | | | |
| Verizon Communications, Inc. | | | 94,200 | | | $ | 5,377,878 | | | | 7.51 | % |
| | | | | | | | | | | | | |
| Consumer Staples – 14.18% | | | | | | | | | | | | |
| The Coca-Cola Co. | | | 106,600 | | | | 5,104,008 | | | | 7.13 | % |
| The Procter & Gamble Co. | | | 56,900 | | | | 5,045,892 | | | | 7.05 | % |
| | | | | | | | 10,149,900 | | | | 14.18 | % |
| | | | | | | | | | | | | |
| Energy – 12.97% | | | | | | | | | | | | |
| Chevron Corp. | | | 41,300 | | | | 4,611,145 | | | | 6.44 | % |
| Exxon Mobil Corp. | | | 58,700 | | | | 4,677,216 | | | | 6.53 | % |
| | | | | | | | 9,288,361 | | | | 12.97 | % |
| | | | | | | | | | | | | |
| Health Care – 15.01% | | | | | | | | | | | | |
| Merck & Co., Inc. | | | 70,100 | | | | 5,160,061 | | | | 7.21 | % |
| Pfizer, Inc. | | | 129,800 | | | | 5,589,188 | | | | 7.80 | % |
| | | | | | | | 10,749,249 | | | | 15.01 | % |
| | | | | | | | | | | | | |
| Industrials – 2.33% | | | | | | | | | | | | |
| General Electric Co. | | | 165,000 | | | | 1,666,500 | | | | 2.33 | % |
| | | | | | | | | | | | | |
| Information Technology – 15.50% | | | | | | | | | | | | |
| Cisco Systems, Inc. | | | 124,900 | | | | 5,714,175 | | | | 7.98 | % |
| Intel Corp. | | | 37,600 | | | | 1,762,688 | | | | 2.46 | % |
| International Business Machines Corp. | | | 31,400 | | | | 3,624,502 | | | | 5.06 | % |
| | | | | | | | 11,101,365 | | | | 15.50 | % |
| Total Common Stocks | | | | | | | | | | | | |
| (Cost $43,886,864) | | | | | | | 48,333,253 | | | | 67.50 | % |
The accompanying notes are an integral part of these financial statements.
| HENNESSY FUNDS | 1-800-966-4354 | |
| SHORT-TERM INVESTMENTS – 74.15% | | Number of Shares/ | | | | | | % of | |
| | | Par Amount | | | Value | | | Net Assets | |
| Money Market Funds – 5.21% | | | | | | | | | |
| Fidelity Government Portfolio, Institutional Class, 2.06% (a) | | | 3,416,000 | | | $ | 3,416,000 | | | | 4.77 | % |
| The Government & Agency Portfolio, Institutional Class, 2.08% (a) | | | 313,295 | | | | 313,295 | | | | 0.44 | % |
| | | | | | | | 3,729,295 | | | | 5.21 | % |
| | | | | | | | | | | | | |
| U.S. Treasury Bills (c) – 68.94% | | | | | | | | | | | | |
| 2.155%, 11/15/2018 (b) | | | 18,000,000 | | | | 17,985,895 | | | | 25.12 | % |
| 2.125%, 12/20/2018 (b) | | | 16,500,000 | | | | 16,452,388 | | | | 22.97 | % |
| 2.270%, 01/17/2019 (b) | | | 15,000,000 | | | | 14,928,254 | | | | 20.85 | % |
| | | | | | | | 49,366,537 | | | | 68.94 | % |
| Total Short-Term Investments | | | | | | | | | | | | |
| (Cost $53,095,391) | | | | | | | 53,095,832 | | | | 74.15 | % |
| | | | | | | | | | | | | |
| Total Investments | | | | | | | | | | | | |
| (Cost $96,982,255) – 141.65% | | | | | | | 101,429,085 | | | | 141.65 | % |
| Liabilities in Excess of Other Assets – (41.65)% | | | | | | | (29,825,736 | ) | | | (41.65 | )% |
| | | | | | | | | | | | | |
TOTAL NET ASSETS – 100.00% | | | | | | $ | 71,603,349 | | | | 100.00 | % |
Percentages are stated as a percent of net assets.
| (a) | The rate listed is the fund’s seven-day yield as of October 31, 2018. |
| (b) | The rate listed is discount rate at issue. |
| (c) | Collateral or partial collateral for securities sold subject to repurchase. |
The accompanying notes are an integral part of these financial statements.
Summary of Fair Value Exposure at October 31, 2018
The following is a summary of the inputs used to value the Fund’s net assets as of October 31, 2018 (See Note 3 in the accompanying notes to the financial statements):
| Common Stocks | | Level 1 | | | Level 2 | | | Level 3 | | | Total | |
| Communication Services | | $ | 5,377,878 | | | $ | — | | | $ | — | | | $ | 5,377,878 | |
| Consumer Staples | | | 10,149,900 | | | | — | | | | — | | | | 10,149,900 | |
| Energy | | | 9,288,361 | | | | — | | | | — | | | | 9,288,361 | |
| Health Care | | | 10,749,249 | | | | — | | | | — | | | | 10,749,249 | |
| Industrials | | | 1,666,500 | | | | — | | | | — | | | | 1,666,500 | |
| Information Technology | | | 11,101,365 | | | | — | | | | — | | | | 11,101,365 | |
| Total Common Stocks | | $ | 48,333,253 | | | $ | — | | | $ | — | | | $ | 48,333,253 | |
| Short-Term Investments | | | | | | | | | | | | | | | | |
| Money Market Funds | | $ | 3,729,295 | | | $ | — | | | $ | — | | | $ | 3,729,295 | |
| U.S. Treasury Bills | | | — | | | | 49,366,537 | | | | — | | | | 49,366,537 | |
| Total Short-Term Investments | | $ | 3,729,295 | | | $ | 49,366,537 | | | $ | — | | | $ | 53,095,832 | |
| Total Investments | | $ | 52,062,548 | | | $ | 49,366,537 | | | $ | — | | | $ | 101,429,085 | |
Schedule of Reverse Repurchase Agreements
| | | | | | | | Principal | | Maturity | | Maturity | |
| | Face Value | | Counterparty | | Rate | | Trade Date | | Date | | Amount | |
| | $ | 10,794,000 | | Jefferies LLC | | 2.25% | | 8/16/18 | | 11/15/18 | | $ | 10,854,716 | |
| | | 9,894,500 | | Jefferies LLC | | 2.40% | | 9/20/18 | | 12/20/18 | | | 9,953,867 | |
| | | 8,995,000 | | Jefferies LLC | | 2.40% | | 10/18/18 | | 1/17/19 | | | 9,048,970 | |
| | $ | 29,683,500 | | | | | | | | | | $ | 29,857,553 | |
As of October 31, 2018, the fair value of securities held as collateral for reverse repurchase agreements was $32,911,016, as noted on the Schedule of Investments.
Reverse repurchase agreements are carried at face value; hence, they are not included in the fair valuation hierarchy. The face value of the reverse repurchase agreements at October 31, 2018, was $29,683,500. Due to the short-term nature of the reverse repurchase agreements, face value approximates fair value. The face value plus interest due at maturity is equal to $29,857,553.
The accompanying notes are an integral part of these financial statements.
| HENNESSY FUNDS | 1-800-966-4354 | |
Financial Statements
Statement of Assets and Liabilities as of October 31, 2018 |
| ASSETS: | | | |
| Investments in securities, at value (cost $96,982,255) | | $ | 101,429,085 | |
| Dividends and interest receivable | | | 102,263 | |
| Receivable for fund shares sold | | | 31,118 | |
| Prepaid expenses and other assets | | | 12,102 | |
| Total Assets | | | 101,574,568 | |
| | | | | |
| LIABILITIES: | | | | |
| Payable for fund shares redeemed | | | 37,149 | |
| Payable to advisor | | | 36,298 | |
| Payable to administrator | | | 6,279 | |
| Payable to auditor | | | 21,900 | |
| Accrued distribution fees | | | 70,854 | |
| Accrued service fees | | | 6,050 | |
| Reverse repurchase agreements | | | 29,683,500 | |
| Accrued interest payable | | | 86,112 | |
| Accrued trustees fees | | | 5,962 | |
| Accrued expenses and other payables | | | 17,115 | |
| Total Liabilities | | | 29,971,219 | |
| NET ASSETS | | $ | 71,603,349 | |
| | | | | |
| NET ASSETS CONSIST OF: | | | | |
| Capital stock | | $ | 65,081,638 | |
| Total distributable earnings | | | 6,521,711 | |
| Total Net Assets | | $ | 71,603,349 | |
| | | | | |
| NET ASSETS | | | | |
| Investor Class: | | | | |
| Shares authorized (no par value) | | Unlimited | |
| Net assets applicable to outstanding Investor Class shares | | $ | 71,603,349 | |
| Shares issued and outstanding | | | 5,274,843 | |
| Net asset value, offering price and redemption price per share | | $ | 13.57 | |
The accompanying notes are an integral part of these financial statements.
| STATEMENT OF ASSETS AND LIABILITIES/STATEMENT OF OPERATIONS |
Financial Statements
Statement of Operations for the year ended October 31, 2018 |
| INVESTMENT INCOME: | | | |
| Dividend income | | $ | 1,817,785 | |
| Interest income | | | 832,360 | |
| Total investment income | | | 2,650,145 | |
| | | | | |
| EXPENSES: | | | | |
| Interest expense (See Notes 7 and 9) | | | 555,805 | |
| Investment advisory fees (See Note 5) | | | 438,837 | |
| Distribution fees – Investor Class (See Note 5) | | | 109,709 | |
| Service fees – Investor Class (See Note 5) | | | 73,139 | |
| Administration, fund accounting, custody and transfer agent fees (See Note 5) | | | 69,602 | |
| Sub-transfer agent expenses – Investor Class (See Note 5) | | | 68,130 | |
| Compliance expense (See Note 5) | | | 29,499 | |
| Federal and state registration fees | | | 24,571 | |
| Audit fees | | | 23,145 | |
| Trustees’ fees and expenses | | | 16,865 | |
| Reports to shareholders | | | 11,956 | |
| Legal fees | | | 83 | |
| Other expenses | | | 6,834 | |
| Total expenses | | | 1,428,175 | |
| NET INVESTMENT INCOME | | $ | 1,221,970 | |
| | | | | |
| REALIZED AND UNREALIZED GAINS (LOSSES): | | | | |
| Net realized gain on investments | | $ | 2,578,436 | |
| Net change in unrealized appreciation/depreciation on investments | | | (298,004 | ) |
| Net gain on investments | | | 2,280,432 | |
| NET INCREASE IN NET ASSETS RESULTING FROM OPERATIONS | | $ | 3,502,402 | |
The accompanying notes are an integral part of these financial statements.
| HENNESSY FUNDS | 1-800-966-4354 | |
Financial Statements
| Statements of Changes in Net Assets |
| | | Year Ended | | | Year Ended | |
| | | October 31, 2018 | | | October 31, 2017 | |
| OPERATIONS: | | | | | | |
| Net investment income | | $ | 1,221,970 | | | $ | 1,187,349 | |
| Net realized gain on investments | | | 2,578,436 | | | | 8,689,833 | |
| Net change in unrealized | | | | | | | | |
| appreciation/depreciation on investments | | | (298,004 | ) | | | 49,360 | |
| Net increase in net assets resulting from operations | | | 3,502,402 | | | | 9,926,542 | |
| | | | | | | | | |
| DISTRIBUTIONS TO SHAREHOLDERS FROM: | | | | | | | | |
| Distributable earnings – Investor Class | | | (9,194,795 | ) | | | (5,600,022 | ) |
| Total distributions | | | (9,194,795 | ) | | | (5,600,022 | )(1) |
| | | | | | | | | |
| CAPITAL SHARE TRANSACTIONS: | | | | | | | | |
| Proceeds from shares subscribed – Investor Class | | | 4,184,396 | | | | 17,437,144 | |
| Dividends reinvested – Investor Class | | | 8,730,660 | | | | 5,335,208 | |
| Cost of shares redeemed – Investor Class | | | (13,372,214 | ) | | | (33,215,945 | ) |
| Net decrease in net assets derived | | | | | | | | |
| from capital share transactions | | | (457,158 | ) | | | (10,443,593 | ) |
| TOTAL DECREASE IN NET ASSETS | | | (6,149,551 | ) | | | (6,117,073 | ) |
| | | | | | | | | |
| NET ASSETS: | | | | | | | | |
| Beginning of year | | | 77,752,900 | | | | 83,869,973 | |
| End of year | | $ | 71,603,349 | | | $ | 77,752,900 | (2) |
| | | | | | | | | |
| CHANGES IN SHARES OUTSTANDING: | | | | | | | | |
| Shares sold – Investor Class | | | 306,057 | | | | 1,237,906 | |
| Shares issued to holders as reinvestment | | | | | | | | |
| of dividends – Investor Class | | | 654,267 | | | | 387,386 | |
| Shares redeemed – Investor Class | | | (989,853 | ) | | | (2,382,169 | ) |
| Net decrease in shares outstanding | | | (29,529 | ) | | | (756,877 | ) |
(1) | Includes net investment income distributions of $1,171,215 and net realized gain distributions of $4,428,807 for the Investor Class. |
(2) | Includes accumulated net investment income of $112,796. |
The accompanying notes are an integral part of these financial statements.
| STATEMENTS OF CHANGES IN NET ASSETS/STATEMENT OF CASH FLOWS |
Financial Statements
Statement of Cash Flows for the year ended October 31, 2018 |
| Cash flows from operating activities: | | | |
| Net increase in net assets from operations | | $ | 3,502,402 | |
| Adjustments to reconcile net increase in net assets from | | | | |
| operations to net cash provided by operating activities: | | | | |
| Payments to purchase securities | | | (5,249,464 | ) |
| Proceeds from sale of securities | | | 12,566,221 | |
| Proceeds from securities litigation | | | 9,577 | |
| Sale of short term investments, net | | | 4,602,726 | |
| Realized gain on investments in securities | | | (2,578,436 | ) |
| Net accretion of discount on securities | | | (799,743 | ) |
| Change in unrealized appreciation on investments in securities | | | 298,004 | |
| (Increases) decreases in operating assets: | | | | |
| Decrease in dividends and interest receivable | | | 16,831 | |
| Decrease in prepaid expenses and other assets | | | 873 | |
| Increases (decreases) in operating liabilities: | | | | |
| Decrease in payable to advisor | | | (3,934 | ) |
| Decrease in payable to administrator | | | (6,850 | ) |
| Increase in accrued distribution fees | | | 8,318 | |
| Decrease in accrued service fees | | | (655 | ) |
| Increase in accrued interest payable | | | 47,250 | |
| Increase in accrued audit fees | | | 595 | |
| Increase in accrued trustee fees | | | 390 | |
| Increase in other accrued expenses and payables | | | 3,768 | |
| Net cash provided by operating activities | | | 12,417,873 | |
| | | | | |
| Cash flows from financing activities: | | | | |
| Decrease in reverse repurchase agreements | | | (2,698,500 | ) |
| Proceeds from shares sold | | | 4,159,008 | |
| Payment on shares redeemed | | | (13,414,246 | ) |
| Distributions paid in cash, net of reinvestments | | | (464,135 | ) |
| Net cash used in financing activities | | | (12,417,873 | ) |
| Net increase in cash | | | — | |
| | | | | |
| Cash: | | | | |
| Beginning balance | | | — | |
| Ending balance | | $ | — | |
| | | | | |
| Supplemental information: | | | | |
| Non-cash financing activities not included herein consists | | | | |
| of dividend reinvestment of dividends and distributions | | $ | 8,730,660 | |
| | | | | |
| Cash paid for interest | | $ | 508,555 | |
The accompanying notes are an integral part of these financial statements.
| HENNESSY FUNDS | 1-800-966-4354 | |
Financial Statements
For an Investor Class share outstanding throughout each year
PER SHARE DATA:
Net asset value, beginning of year
Income from investment operations:
Net investment income
Net realized and unrealized gains (losses) on investments
Total from investment operations
Less distributions:
Dividends from net investment income
Dividends from net realized gains
Total distributions
Net asset value, end of year
TOTAL RETURN
SUPPLEMENTAL DATA AND RATIOS:
Net assets, end of year (millions)
Gross ratio of expenses, including interest expense, to average net assets
Ratio of net investment income to average net assets
Portfolio turnover rate
The accompanying notes are an integral part of these financial statements.
| FINANCIAL HIGHLIGHTS — INVESTOR CLASS |
| Year Ended October 31, | |
| 2018 | | | 2017 | | | 2016 | | | 2015 | | | 2014 | |
| | | | | | | | | | | | | | |
| $ | 14.66 | | | $ | 13.84 | | | $ | 14.19 | | | $ | 15.27 | | | $ | 14.30 | |
| | | | | | | | | | | | | | | | | | | |
| | | | | | | | | | | | | | | | | | | |
| | 0.23 | | | | 0.20 | | | | 0.16 | | | | 0.20 | | | | 0.20 | |
| | 0.43 | | | | 1.48 | | | | 0.88 | | | | (0.02 | ) | | | 0.96 | |
| | 0.66 | | | | 1.68 | | | | 1.04 | | | | 0.18 | | | | 1.16 | |
| | | | | | | | | | | | | | | | | | | |
| | | | | | | | | | | | | | | | | | | |
| | (0.23 | ) | | | (0.20 | ) | | | (0.16 | ) | | | (0.20 | ) | | | (0.19 | ) |
| | (1.52 | ) | | | (0.66 | ) | | | (1.23 | ) | | | (1.06 | ) | | | — | |
| | (1.75 | ) | | | (0.86 | ) | | | (1.39 | ) | | | (1.26 | ) | | | (0.19 | ) |
| $ | 13.57 | | | $ | 14.66 | | | $ | 13.84 | | | $ | 14.19 | | | $ | 15.27 | |
| | | | | | | | | | | | | | | | | | | |
| | 4.92 | % | | | 12.56 | % | | | 8.20 | % | | | 1.22 | % | | | 8.15 | % |
| | | | | | | | | | | | | | | | | | | |
| | | | | | | | | | | | | | | | | | | |
| $ | 71.60 | | | $ | 77.75 | | | $ | 83.87 | | | $ | 69.42 | | | $ | 83.89 | |
| | 1.95 | % | | | 1.57 | % | | | 1.44 | % | | | 1.28 | % | | | 1.34 | % |
| | 1.67 | % | | | 1.38 | % | | | 1.22 | % | | | 1.40 | % | | | 1.31 | % |
| | 10 | % | | | 36 | % | | | 44 | % | | | 27 | % | | | 23 | % |
The accompanying notes are an integral part of these financial statements.
| HENNESSY FUNDS | 1-800-966-4354 | |
Financial Statements
Notes to the Financial Statements October 31, 2018 |
1). ORGANIZATION
The Hennessy Total Return Fund (the “Fund”) is a series of Hennessy Funds Trust (the “Trust”), which was organized as a Delaware statutory trust on September 17, 1992. The Fund is an open-end management investment company registered under the Investment Company Act of 1940, as amended. The investment objective of the Fund is total return, consisting of capital appreciation and current income. The Fund is a non-diversified fund and offers Investor Class shares.
As an investment company, the Fund follows the investment company accounting and reporting guidance of the Financial Accounting Standards Board (“FASB”) Accounting Standard Codification Topic 946 “Financial Services—Investment Companies.”
2). SIGNIFICANT ACCOUNTING POLICIES
The following is a summary of significant accounting policies consistently followed by the Fund in the preparation of the financial statements. These policies conform to U.S. generally accepted accounting principles (“GAAP”).
| a). | Securities Valuation – All investments in securities are recorded at their estimated fair value, as described in Note 3. |
| | |
| b). | Federal Income Taxes – No provision for federal income taxes or excise taxes has been made because the Fund has elected to be taxed as a regulated investment company and intends to distribute substantially all of its taxable income to its shareholders and otherwise comply with the provisions of the Internal Revenue Code of 1986, as amended, applicable to regulated investment companies. Net investment income/loss and realized gains/losses for federal income tax purposes may differ from those reported in the financial statements because of temporary book and tax basis differences. Temporary differences are primarily the result of the treatment of wash sales for tax reporting purposes. The Fund recognizes interest and penalties related to income tax benefits, if any, in the Statement of Operations as an income tax expense. Distributions from net realized gains for book purposes may include short-term capital gains, which are included as ordinary income to shareholders for tax purposes. The Fund may utilize equalization accounting for tax purposes and designate earnings and profits, including net realized gains distributed to shareholders on redemption of shares, as part of the dividends paid deduction for income tax purposes. |
| | |
| | Due to inherent differences in the recognition of income, expenses, and realized gains/losses under GAAP and federal income tax regulations, permanent differences between book and tax basis for reporting for fiscal year 2018 have been identified and appropriately reclassified in the Statement of Assets and Liabilities. The adjustments are as follows: |
| Total | |
| Distributable | |
Earnings | Capital Stock |
| $(459,287) | $459,287 |
| c). | Accounting for Uncertainty in Income Taxes – The Fund has accounting policies regarding recognition and measurement of tax positions taken or expected to be taken on a tax return. The tax returns of the Fund for the prior three fiscal years are |
| NOTES TO THE FINANCIAL STATEMENTS |
| | open for examination. The Fund has reviewed all open tax years in major jurisdictions and concluded that there is no impact on the Fund’s net assets and no tax liability resulting from unrecognized tax benefits relating to uncertain income tax positions taken or expected to be taken on a tax return. The Fund’s major tax jurisdictions are U.S. federal and Delaware. |
| | |
| d). | Income and Expenses – Dividend income is recognized on the ex-dividend date or as soon as information is available to the Fund. Interest income, which includes the amortization of premium and accretion of discount, is recognized on an accrual basis. Other non-cash dividends are recognized as investment income at the fair value of the property received. The Fund is charged for those expenses that are directly attributable to its portfolio, such as advisory, administration, and certain shareholder service fees. |
| | |
| e). | Distributions to Shareholders – Dividends from net investment income for the Fund, if any, are declared and paid at the end of each calendar quarter. Distributions of net realized capital gains, if any, are declared and paid annually, usually in December. |
| | |
| f). | Security Transactions – Investment and shareholder transactions are recorded on the trade date. The Fund determines the realized gain/loss from an investment transaction by comparing the original cost of the security lot sold with the net sale proceeds. Discounts and premiums on securities purchased are accreted or amortized, respectively, over the life of each such security. |
| | |
| g). | Use of Estimates – The preparation of financial statements in conformity with GAAP requires management to make estimates and assumptions that affect the reported amounts of assets and liabilities and disclosure of contingent assets and liabilities at the date of the financial statements and the reported change in net assets during the reporting period. Actual results could differ from those estimates. |
| | |
| h). | Share Valuation – The net asset value (“NAV”) per share of the Fund is calculated by dividing (i) the total value of the securities held by the Fund, plus cash and other assets, minus all liabilities (including estimated accrued expenses) by (ii) the total number of shares outstanding for the Fund, rounded to the nearest cent. The Fund’s shares will not be priced on days the New York Stock Exchange is closed for trading. The offering and redemption price per share for the Fund is equal to the Fund’s NAV per share. |
| | |
| i). | Derivatives – The Fund may invest in, or enter into, derivatives, such as options, futures contracts, options on futures contracts, and swaps, for a variety of reasons, including to hedge certain risks, provide a substitute for purchasing or selling particular securities, or increase potential income gain. Derivatives are financial contracts based on an underlying or notional amount, require no initial investment or an initial net investment that is smaller than would normally be required to have a similar response to changes in market factors, and require or permit net settlement. Derivatives may allow the Fund to increase or decrease its level of risk more quickly and efficiently than transactions in other types of instruments. The main reason for utilizing derivative instruments is for hedging purposes. |
| | |
| | The Fund follows the financial accounting reporting rules as required by the Derivatives and Hedging Topic of the FASB Accounting Standards Codification. Under such rules, the Fund is required to include enhanced disclosure that enables investors to understand how and why an entity uses derivatives, how derivatives are accounted for, and how derivatives instruments affect an entity’s results of operations and financial position. During fiscal year 2018, the Fund did not hold any derivative instruments. |
| HENNESSY FUNDS | 1-800-966-4354 | |
| j). | Repurchase and Reverse Repurchase Agreements – The Fund may enter into repurchase agreements and reverse repurchase agreements with member banks or security dealers of the Federal Reserve Board whom the investment advisor deems creditworthy. Transactions involving repurchase agreements and reverse repurchase agreements are treated as collateralized financing transactions and are recorded at their contracted resell or repurchase amounts, which approximates fair value. Interest on repurchase agreements and reverse repurchase agreements is included in interest receivable and interest payable, respectively. |
| | |
| | In connection with repurchase agreements, securities pledged as collateral are held by the custodian bank until the respective agreements mature. Provisions of the repurchase agreements ensure that the market value of the collateral, including accrued interest thereon, is sufficient to cover the repurchase amount in the event of default of the counterparty. If the counterparty defaults and the fair value of the collateral declines, or if the counterparty enters an insolvency proceeding, realization of the collateral by the Fund may be delayed or limited. |
| | |
| | At October 31, 2018, securities with a fair value of $32,911,016, which are included in investments in securities in the Statement of Assets and Liabilities, were pledged to collateralize reverse repurchase agreements. |
| | |
| k). | Offsetting Assets and Liabilities – The Fund follows the financial reporting rules regarding offsetting assets and liabilities and related netting arrangements to enable users of its financial statements to understand the effect of those arrangements on its financial position. Reverse repurchase transactions are entered into by the Fund under Master Repurchase Agreements (“MRAs”) that permit the Fund, under certain circumstances, including an event of default (such as bankruptcy or insolvency), to offset payables under the MRA with collateral held with the counterparty and create one single net payment from the Fund. Upon a bankruptcy or insolvency of the MRA counterparty, the Fund is considered an unsecured creditor with respect to excess collateral and, as such, the return of excess collateral may be delayed. In the event the buyer of securities under an MRA files for bankruptcy or becomes insolvent, the Fund’s use of the proceeds of the MRA may be restricted while the other party, or its trustee or receiver, determines whether or not to enforce the Fund’s obligation to repurchase the securities. For additional information regarding the offsetting of assets and liabilities at October 31, 2018, please refer to the table in Note 9. |
| | |
| l). | New Accounting Pronouncements – In August 2018, the FASB issued Accounting Standards Update No. 2018-13 “Disclosure Framework—Changes to the Disclosure Requirements for Fair Value Measurement” (“ASU 2018-13”). ASU 2018-13 eliminates the requirement to disclose the amount of and reasons for transfers between Level 1 and Level 2 of the fair value hierarchy, the timing of transfers between levels of the fair value hierarchy, and the valuation processes for Level 3 fair value measurements. ASU 2018-13 does not eliminate the requirement to disclose the range and weighted average used to develop significant unobservable inputs for Level 3 fair value measurements, and the changes in unrealized gains and losses for recurring Level 3 fair value measurements. ASU 2018-13 requires that information is provided about the measurement uncertainty of Level 3 fair value measurements as of the reporting date. The guidance is effective for fiscal years beginning after December 15, 2019, and interim periods within those fiscal years. Management has evaluated the impact of this change in guidance, and due to the permissibility of early adoption, modified the Fund’s fair value disclosures for the current reporting period. |
| | |
| m). | New Rule Issuances – In August 2018, the Securities and Exchange Commission issued Final Rule Release No. 33 10532, Disclosure Update and Simplification, which |
| NOTES TO THE FINANCIAL STATEMENTS |
| | in part amends certain financial statement disclosure requirements of Regulation S-X that have become redundant, duplicative, overlapping, outdated, or superseded, in light of other Commission disclosure requirements, GAAP, or changes in the information environment. The amendments are intended to facilitate the disclosure of information to investors and simplify compliance without significantly altering the total mix of information provided to investors. The amendments to Rule 6-04.17 of Regulation S-X (balance sheet) were amended to require presentation of the total, rather than the components of net assets, of distributable earnings on the balance sheet. Consistent with GAAP, funds will be required to disclose total distributable earnings. The amendments to Rule 6-09 of Regulation S-X (statement of changes in net assets) omit the requirement to separately state the sources of distributions paid as well as omit the requirement to parenthetically state the book basis amount of undistributed net investment income. Instead, consistent with GAAP, funds will be required to disclose the total amount of distributions paid, except that any tax return of capital must be separately disclosed. The requirements of the Final Rule Release are effective November 5, 2018 and the Fund’s Statement of Assets and Liabilities and the Statement of Changes in Net Assets for the current and prior reporting period have been modified accordingly. |
3). SECURITIES VALUATION
The Fund follows fair valuation accounting standards that establish an authoritative definition of fair value and set out a hierarchy for measuring fair value. These standards require additional disclosures about the various inputs and valuation techniques used to develop the measurements of fair value and a discussion of changes in valuation techniques and related inputs during the period. These inputs are summarized in the three broad levels listed below:
| | Level 1 – | Unadjusted, quoted prices in active markets for identical instruments that the Fund has the ability to access at the date of measurement. |
| | | |
| | Level 2 – | Other significant observable inputs (including, but not limited to, quoted prices in active markets for similar instruments, quoted prices in markets that are not active for identical or similar instruments, and model-derived valuations in which all significant inputs and significant value drivers are observable in active markets, such as interest rates, prepayment speeds, credit risk curves, default rates, and similar data). |
| | | |
| | Level 3 – | Significant unobservable inputs (including the Fund’s own assumptions about what market participants would use to price the asset or liability based on the best available information) when observable inputs are unavailable. |
Following is a description of the valuation techniques applied to the Fund’s major categories of assets and liabilities measured at fair value on a recurring basis.
Equity Securities – Equity securities, including common stocks, preferred stocks, exchange-traded funds, closed-end mutual funds, partnerships, rights, and real estate investment trusts, that are traded on a securities exchange for which a last-quoted sales price is readily available will generally be valued at the last sales price as reported by the primary exchange on which the securities are listed. Securities listed on The NASDAQ Stock Market (“NASDAQ”) will generally be valued at the NASDAQ Official Closing Price, which may differ from the last sales price reported. Securities traded on a securities exchange for which a last-quoted sales price is not readily available will generally be valued at the mean between the bid and ask prices. To the extent these securities are actively traded and valuation adjustments are not applied, they are classified in Level 1 of the fair value hierarchy.
| HENNESSY FUNDS | 1-800-966-4354 | |
| | Registered Investment Companies – Investments in open-end registered investment companies, commonly referred to as mutual funds, are generally priced at the ending NAV provided by the applicable mutual fund’s service agent and will be classified in Level 1 of the fair value hierarchy. |
| | |
| | Debt Securities – Debt securities, including corporate bonds, asset-backed securities, mortgage-backed securities, municipal bonds, U.S. Treasuries, and U.S. government agency issues, are generally valued at market on the basis of valuations furnished by an independent pricing service that utilizes both dealer-supplied valuations and formula-based techniques. The pricing service may consider recently executed transactions in securities of the issuer or comparable issuers, market price quotations (where observable), bond spreads, and fundamental data relating to the issuer. In addition, the model may incorporate observable market data, such as reported sales of similar securities, broker quotes, yields, bids, offers, and reference data. Certain securities are valued primarily using dealer quotations. These securities are generally classified in Level 2 of the fair value hierarchy. |
| | |
| | Short-Term Securities – Short-term equity investments, including money market funds, are valued in the manner specified above. Short-term debt investments with an original term to maturity of 60 days or less are valued at amortized cost, which approximates fair market value. If the original term to maturity of a short-term debt investment exceeded 60 days, then the values as of the 61st day prior to maturity are amortized. Amortized cost is not used if its use would be inappropriate due to credit or other impairments of the issuer, in which case the security’s fair value would be determined, as described below. Short-term securities are generally classified in Level 1 or Level 2 of the fair market hierarchy depending on the inputs used and market activity levels for specific securities. |
The Board of Trustees of the Fund (the “Board”) has adopted fair value pricing procedures that are followed when a price for a security is not readily available or if a significant event has occurred that indicates the closing price of a security no longer represents the true value of that security. Fair value pricing determinations are made in good faith in accordance with these procedures. There are numerous criteria that will be given consideration in determining a fair value of a security, such as the trading volume of a security and markets, the values of other similar securities, and news events with direct bearing on a security or markets. Fair value pricing results in an estimated price for a security that reflects the amount the Fund might reasonably expect to receive in a current sale. Depending on the relative significance of the valuation inputs, these securities may be classified in either Level 2 or Level 3 of the fair value hierarchy.
The Board has delegated day-to-day valuation matters to a Valuation Committee comprised of one or more representatives from Hennessy Advisors, Inc., the Fund’s investment advisor (the “Advisor”). The function of the Valuation Committee is to value securities where current and reliable market quotations are not readily available. All actions taken by the Valuation Committee are reviewed by the Board.
The Fund has performed an analysis of all existing investments to determine the significance and character of all inputs to their fair value determinations. Various inputs are used to determine the value of the Fund’s investments. The inputs or methodology used for valuing securities are not necessarily an indication of the risk associated with investing in those securities. Details related to the fair valuation hierarchy of the Fund’s securities as of October 31, 2018, are included in the Schedule of Investments.
| NOTES TO THE FINANCIAL STATEMENTS |
4). INVESTMENT TRANSACTIONS
Purchases and sales of investment securities (excluding government and short-term investments) for the Fund during fiscal year 2018 were $5,249,464 and $12,566,221, respectively.
There were no purchases or sales/maturities of long-term U.S. government securities for the Fund during fiscal year 2018.
The Fund is permitted to purchase or sell securities from or to another fund in the Hennessy Funds family of funds (the “Hennessy Funds”) under specified conditions outlined in procedures adopted by the Board. The procedures have been designed to ensure that any purchase or sale of securities by the Fund from or to another Hennessy Fund complies with Rule 17a-7 of the Investment Company Act of 1940, as amended. During fiscal year 2018, the Fund did not engage in purchases or sales of securities pursuant to Rule 17a-7 of the Investment Company Act of 1940, as amended.
5). INVESTMENT ADVISORY FEE AND OTHER TRANSACTIONS WITH AFFILIATES
The Advisor provides the Fund with investment advisory services under an Investment Advisory Agreement. The Advisor furnishes all investment advice, office space, and facilities, as well as most of the personnel needed by the Fund. As compensation for its services, the Advisor is entitled to a monthly fee from the Fund. The fee is based upon the average daily net assets of the Fund at an annual rate of 0.60%. The net investment advisory fees expensed by the Fund during fiscal year 2018 are included in the Statement of Operations.
The Board has approved a Shareholder Servicing Agreement for the Fund, which was instituted to compensate the Advisor for the non-investment advisory services it provides to the Fund. The Shareholder Servicing Agreement provides for a monthly fee paid to the Advisor at an annual rate of 0.10% of the average daily net assets of the Fund. The shareholder service fees expensed by the Fund during fiscal year 2018 are included in the Statement of Operations.
The Fund has adopted a plan pursuant to Rule 12b-1 under the Investment Company Act of 1940, as amended, that authorizes payments in connection with the distribution of the Fund’s shares at an annual rate of up to 0.25% of the Fund’s average daily net assets. Even though the authorized rate is up to 0.25%, the Fund is currently only using up to 0.15% of its average daily net assets for such purpose. Amounts paid under the plan may be spent on any activities or expenses primarily intended to result in the sale of shares, including, but not limited to, advertising, shareholder account servicing, printing and mailing of prospectuses to other than current shareholders, printing and mailing of sales literature, and compensation for sales and marketing activities or to financial institutions and others, such as dealers and distributors. The distribution fees expensed by the Fund during fiscal year 2018 are included in the Statement of Operations.
The Fund has entered into agreements with various brokers, dealers, and financial intermediaries in connection with the sale of shares of the Fund. The agreements provide for periodic payments by the Fund to the brokers, dealers, and financial intermediaries for providing certain shareholder maintenance services (sub-transfer agent expenses). These shareholder services include the pre-processing and quality control of new accounts, shareholder correspondence, answering customer inquiries regarding account status, and facilitating shareholder telephone transactions. The sub-transfer agent fees expensed by the Fund during fiscal year 2018 are included in the Statement of Operations.
| HENNESSY FUNDS | 1-800-966-4354 | |
U.S. Bancorp Fund Services, LLC, d/b/a U.S. Bank Global Fund Services (“Fund Services”) provides the Fund with administrative, fund accounting, and transfer agent services. As administrator, Fund Services is responsible for activities such as (i) preparing various federal and state regulatory filings, reports, and returns for the Fund, (ii) preparing reports and materials to be supplied to the Board, (iii) monitoring the activities of the Fund’s custodian, transfer agent, and accountants, and (iv) coordinating the preparation and payment of the Fund’s expenses and reviewing the Fund’s expense accruals. U.S. Bank N.A., an affiliate of Fund Services, serves as the Fund’s custodian. The servicing agreements between the Trust and Fund Services and U.S. Bank N.A. contain a fee schedule that is inclusive of administrative, fund accounting, custody, and transfer agent fees. The administrative, fund accounting, custody, and transfer agent fees expensed by the Fund during fiscal year 2018 are included in the Statement of Operations.
Quasar Distributors, LLC acts as the Fund’s principal underwriter in a continuous public offering of the Fund’s shares. Quasar Distributors, LLC is an affiliate of Fund Services and U.S. Bank N.A.
The officers of the Fund are affiliated with the Advisor. Such officers, with the exception of the Chief Compliance Officer and the Senior Compliance Officer, receive no compensation from the Fund for serving in their respective roles. The Fund, along with the other Hennessy Funds, makes reimbursement payments, on an equal basis, to the Advisor for a portion of the salary and benefits associated with the office of the Chief Compliance Officer and for all of the salary and benefits associated with the office of the Senior Compliance Officer. The compliance fees expensed by the Fund during fiscal year 2018 are included in the Statement of Operations.
6). GUARANTEES AND INDEMNIFICATIONS
Under the Hennessy Funds’ organizational documents, their officers and trustees are indemnified by the Hennessy Funds against certain liabilities arising out of the performance of their duties to the Hennessy Funds. Additionally, in the normal course of business, the Hennessy Funds enter into contracts with service providers that contain general indemnification clauses. The Fund’s maximum exposure under these arrangements is unknown as this would involve future claims that may be made against the Fund that have not yet occurred. Currently, the Fund expects the risk of loss to be remote.
7). LINE OF CREDIT
The Fund has an uncommitted line of credit with the other Hennessy Funds in the amount of the lesser of (i) $100,000,000 or (ii) 33.33% of each Hennessy Fund’s net assets, or 30% for the Hennessy Gas Utility Fund and 10% for the Hennessy Balanced Fund, intended to provide short-term financing, if necessary, subject to certain restrictions, in connection with shareholder redemptions. The credit facility is with the Hennessy Funds’ custodian bank, U.S. Bank N.A. Borrowings under this arrangement bear interest at the bank’s prime rate and are secured by all of the Fund’s assets (as to its own borrowings only). During fiscal year 2018, the Fund did not have any borrowings outstanding under the line of credit.
| NOTES TO THE FINANCIAL STATEMENTS |
8). FEDERAL TAX INFORMATION
As of October 31, 2018, the components of accumulated earnings (losses) for income tax purposes were as follows:
| | | Investments | |
| Cost of investments for tax purposes | | $ | 97,111,504 | |
| Gross tax unrealized appreciation | | $ | 7,948,884 | |
| Gross tax unrealized depreciation | | | (3,631,303 | ) |
| Net tax unrealized appreciation/(depreciation) | | $ | 4,317,581 | |
| Undistributed ordinary income | | $ | 87,850 | |
| Undistributed long-term capital gains | | | 2,116,280 | |
| Total distributable earnings | | $ | 2,204,130 | |
| Other accumulated gain/(loss) | | $ | — | |
| Total accumulated gain/(loss) | | $ | 6,521,711 | |
The difference between book-basis unrealized appreciation/depreciation (as shown in the Statement of Assets and Liabilities) and tax-basis unrealized appreciation/depreciation (as shown above) is attributable primarily to wash sales.
As of October 31, 2018, the Fund had no tax basis capital losses to offset future capital gains.
As of October 31, 2018, the Fund did not defer, on a tax basis, any late-year ordinary losses. Late-year ordinary losses are net ordinary losses incurred after December 31, 2017, but within the taxable year, that are deemed to arise on the first day of the Fund’s next taxable year.
During fiscal year 2018 and fiscal year 2017, the tax character of distributions paid by the Fund was as follows:
| | | Year Ended | | | Year Ended | |
| | | October 31, 2018 | | | October 31, 2017 | |
Ordinary income(1) | | $ | 1,939,475 | | | $ | 1,216,622 | |
| Long-term capital gain | | | 7,255,320 | | | | 4,383,400 | |
| | | $ | 9,194,795 | | | $ | 5,600,022 | |
(1) Ordinary income includes short-term capital gains.
9). REVERSE REPURCHASE AGREEMENTS
The Fund may enter into reverse repurchase agreements with the same parties with whom it may enter into repurchase agreements. Under a reverse repurchase agreement, the Fund sells securities and agrees to repurchase them at a mutually agreed-upon date and price. Reverse repurchase agreements are regarded as a form of secured borrowing by the Fund. Securities sold under reverse repurchase agreements are reflected as a liability in the Statement of Assets and Liabilities. Interest payments made under reverse repurchase agreements were $555,805, and are recorded as a component of interest expense in the Statement of Operations.
During fiscal year 2018, the average daily balance and average interest rate in effect for reverse repurchase agreements were $29,865,864 and 1.821%, respectively. Below is information about the scheduled maturity date, amount, and interest rate for outstanding reverse repurchase agreements as of October 31, 2018:
| | Maturity Date | | Amount | | Interest Rate | |
| | November 15, 2018 | | $10,794,000 | | 2.25% | |
| | December 20, 2018 | | $ 9,894,500 | | 2.40% | |
| | January 17, 2019 | | $ 8,995,000 | | 2.40% | |
| HENNESSY FUNDS | 1-800-966-4354 | |
Outstanding reverse repurchase agreements at October 31, 2018, were equal to 41.46% of the Fund’s net assets.
Below is information about instruments and transactions eligible for offset in the Statement of Assets and Liabilities, on both a gross and net basis, as well as instruments and transactions subject to an agreement similar to a master netting arrangement:
| | | | Gross | Net | | | |
| | | | Amounts | Amounts | | | |
| | | | Offset | Presented | Gross Amounts Not | |
| | | | in the | in the | Offset in the Statement | |
| | | Gross | Statement | Statement | of Assets and Liabilities | |
| | | Amounts of | of | of | | Collateral | |
| | | Recognized | Assets and | Assets and | Financial | Pledged | Net |
Description | Liabilities | Liabilities | Liabilities | Instruments | (Received) | Amount |
| Reverse | | | | | | |
| Repurchase | | | | | | |
| Agreements | $29,683,500 | $ — | $29,683,500 | $29,683,500 | $ — | $ — |
| | | $29,683,500 | $ — | $29,683,500 | $29,683,500 | $ — | $ — |
For additional information, please refer to the “Offsetting Assets and Liabilities” section in Note 2.
10). EVENTS SUBSEQUENT TO YEAR END
Management has evaluated the Fund’s related events and transactions that occurred subsequent to October 31, 2018, through the date of issuance of the Fund’s financial statements. Other than as disclosed below, management has determined that there were no subsequent events requiring recognition or disclosure in the financial statements.
On December 7, 2018, capital gains were declared and paid to shareholders of record on December 6, 2018, as follows:
| | | Long-term |
| | Investor Class | $0.39762 |
On December 27, 2018, income distributions were declared and paid to shareholders of record on December 26, 2018, as follows:
| | Investor Class | $0.03291752 |
| NOTES/REPORT OF INDEPENDENT REGISTERED PUBLIC ACCOUNTING FIRM |
Report of Independent Registered Public
Accounting Firm
To the Board of Trustees of Hennessy Funds Trust
and the shareholders of Hennessy Total Return Fund
Novato, CA
Opinion on the Financial Statements
We have audited the accompanying statement of assets and liabilities of Hennessy Total Return Fund (the “Fund”), a series of Hennessy Funds Trust, including the schedule of investments, as of October 31, 2018, the related statement of operations for the year then ended, the statements of changes in net assets and the financial highlights for each of the two years in the period then ended, and the related notes (collectively referred to as the “financial statements”). In our opinion, the financial statements present fairly, in all material respects, the financial position of the Fund as of October 31, 2018, the results of its operations for the year then ended, and the changes in its net assets and the financial highlights for each of the two years in the period then ended in conformity with accounting principles generally accepted in the United States of America.
The financial highlights for each of the three years in the period ended October 31, 2016 have been audited by other auditors, whose report dated December 22, 2016 expressed unqualified opinions on such financial highlights.
Basis for Opinion
These financial statements are the responsibility of the Fund’s management. Our responsibility is to express an opinion on the Fund’s financial statements based on our audits. We are a public accounting firm registered with the Public Company Accounting Oversight Board (United States) (“PCAOB”) and are required to be independent with respect to the Fund in accordance with the U.S. federal securities laws and the applicable rules and regulations of the Securities and Exchange Commission and the PCAOB. We have served as the auditor of one or more of the funds in the Trust since 2002.
We conducted our audits in accordance with the standards of the PCAOB. Those standards require that we plan and perform the audit to obtain reasonable assurance about whether the financial statements are free of material misstatement, whether due to error or fraud. The Fund is not required to have, nor were we engaged to perform, an audit of its internal control over financial reporting. As part of our audits we are required to obtain an understanding of internal control over financial reporting, but not for the purpose of expressing an opinion on the effectiveness of the Fund’s internal control over financial reporting. Accordingly, we express no such opinion.
Our audits included performing procedures to assess the risks of material misstatement of the financial statements, whether due to error or fraud, and performing procedures that respond to those risks. Such procedures included examining, on a test basis, evidence regarding the amounts and disclosures in the financial statements. Our audits also included evaluating the accounting principles used and significant estimates made by management, as well as evaluating the overall presentation of the financial statements. Our procedures included confirmation of securities owned as of October 31, 2018 by correspondence with the custodian. We believe that our audits provide a reasonable basis for our opinion.
TAIT, WELLER & BAKER LLP
Philadelphia, Pennsylvania
December 27, 2018
| HENNESSY FUNDS | 1-800-966-4354 | |
Trustees and Officers of the Fund (Unaudited)
The business and affairs of the Funds are managed under the direction of the Board of Trustees of the Trust, and the Board of Trustees elects the Officers of the Trust. Beginning in March 2015, the Board of Trustees has from time to time appointed advisers to the Board of Trustees (“Advisers”) with the intention of having qualified individuals serve in an advisory capacity in order to garner experience in the mutual fund and asset management industry and be considered as potential Trustees in the future. There are currently three Advisers: Brian Alexander, Doug Franklin, and Claire Knoles. As Advisers, Mr. Alexander, Mr. Franklin, and Ms. Knoles attend meetings of the Board of Trustees and act as non-voting participants. Information pertaining to the Trustees, Advisers, and the Officers of the Trust is set forth below. The Trustees and Officers serve until their successors are duly elected and qualified or until their earlier death, resignation, or removal. Each Trustee oversees the 16 Hennessy Funds. Unless otherwise indicated, the address of all persons listed below is 7250 Redwood Boulevard, Suite 200, Novato, CA 94945. The Fund’s Statement of Additional Information includes more information about the persons listed below and is available, without charge, upon request by calling 1-800-966-4354.
| | | | Other |
| | | | Directorships |
| | | | Held Outside |
| Name, (Year of Birth), | | | of Fund |
| and Position Held | Start Date | Principal Occupation(s) | Complex During |
with the Trust | of Service | During Past Five Years | Past Five Years(1) |
| | |
| Disinterested Trustees and Advisers | |
| | | | |
| J. Dennis DeSousa | January 1996 | Mr. DeSousa is a real estate investor. | None. |
| (1936) | | | |
| Trustee | | | |
| | | | |
| Robert T. Doyle | January 1996 | Mr. Doyle has been the Sheriff of | None. |
| (1947) | | Marin County, California since 1996. | |
| Trustee | | | |
| | | | |
| Gerald P. Richardson | May 2004 | Mr. Richardson is an independent | None. |
| (1945) | | consultant in the securities industry. | |
| Trustee | | | |
| | | | |
| Brian Alexander | March 2015 | Mr. Alexander has worked for the | None. |
| (1981) | | Sutter Health organization since | |
| Adviser to the Board | | 2011 in various positions. He has | |
| | | served as the Chief Executive Officer | |
| | | of the Sutter Roseville Medical | |
| | | Center since 2018. From 2016 through | |
| | | 2018, he served as the Vice President | |
| | | of Strategy for the Sutter Health Valley | |
| | | Area, which includes 11 hospitals, | |
| | | 13 ambulatory surgery centers, | |
| | | 16,000 employees, and 1,900 physicians. | |
| | | From 2013 through 2016, Mr. Alexander | |
| | | served as Sutter Novato Community | |
| | | Hospital’s Chief Administrative Officer, | |
| | | and from 2011 through 2012, he | |
| | | served as a Director of Strategy | |
| | | within Sutter’s West Bay Region. | |
| TRUSTEES AND OFFICERS OF THE FUND |
| | | | Other |
| | | | Directorships |
| | | | Held Outside |
| Name, (Year of Birth), | | | of Fund |
| and Position Held | Start Date | Principal Occupation(s) | Complex During |
with the Trust | of Service | During Past Five Years | Past Five Years(1) |
| | | | |
| Doug Franklin | March 2016 | Mr. Franklin is a retired insurance | None. |
| (1964) | | industry executive. From 1987 | |
| Adviser to the Board | | through 2015, he was employed | |
| | | by the Allianz-Fireman’s Fund | |
| | | Insurance Company in various | |
| | | positions, including as its Chief | |
| | | Actuary and Chief Risk Officer. | |
| | | | |
| Claire Knoles | December 2015 | Ms. Knoles is a founder of Kiosk and | None. |
| (1974) | | has served as its Chief Operating | |
| Adviser to the Board | | Officer since 2004. Kiosk is a full | |
| | | service marketing agency with | |
| | | offices in the San Francisco Bay | |
| | | Area, Toronto, and Liverpool, UK. | |
| | | | |
Interested Trustee(2) | | | |
| | | | |
| Neil J. Hennessy | January 1996 as | Mr. Neil Hennessy has been employed | Hennessy |
| (1956) | a Trustee and | by Hennessy Advisors, Inc. since | Advisors, Inc. |
| Trustee, Chairman of | June 2008 as | 1989 and currently serves as its | |
| the Board, Chief | an Officer | Chairman and Chief Executive Officer. | |
| Investment Officer, | | | |
| Portfolio Manager, | | | |
| and President | | | |
| Name, (Year of Birth), | | |
| and Position Held | Start Date | Principal Occupation(s) |
with the Trust | of Service | During Past Five Years |
| | | |
| Officers | | |
| | | |
| Teresa M. Nilsen | January 1996 | Ms. Nilsen has been employed by Hennessy Advisors, Inc. |
| (1966) | | since 1989 and currently serves as its President, Chief Operating |
| Executive Vice President | | Officer, and Secretary. |
| and Treasurer | | |
| | | |
| Daniel B. Steadman | March 2000 | Mr. Steadman has been employed by Hennessy Advisors, Inc. |
| (1956) | | since 2000 and currently serves as its Executive Vice President. |
| Executive Vice President | | |
| and Secretary | | |
| | | |
| Brian Carlson | December 2013 | Mr. Carlson has been employed by Hennessy Advisors, Inc. |
| (1972) | | since December 2013 and currently serves as its Chief |
| Senior Vice President | | Compliance Officer and Senior Vice President. |
| and Head of Distribution | | |
| | | |
| Jennifer Cheskiewicz | June 2013 | Ms. Cheskiewicz has been employed by Hennessy Advisors, Inc. |
(1977)(3) | | as its General Counsel since June 2013. |
| Senior Vice President and | | |
| Chief Compliance Officer | | |
| HENNESSY FUNDS | 1-800-966-4354 | |
| Name, (Year of Birth), | | |
| and Position Held | Start Date | Principal Occupation(s) |
with the Trust | of Service | During Past Five Years |
| | | |
| David Ellison | October 2012 | Mr. Ellison has been employed by Hennessy Advisors, Inc. since |
(1958)(4) | | October 2012. He has served as a Portfolio Manager of the |
| Senior Vice President | | Hennessy Large Cap Financial Fund and the Hennessy Small |
| and Portfolio Manager | | Cap Financial Fund since inception. Mr. Ellison also served as a |
| | | Portfolio Manager of the Hennessy Technology Fund from its |
| | | inception until February 2017. Mr. Ellison served as Director, |
| | | CIO and President of FBR Fund Advisers, Inc. from December |
| | | 1999 to October 2012. |
| | | |
| Ryan C. Kelley | March 2013 | Mr. Kelley has been employed by Hennessy Advisors, Inc. since |
(1972)(5) | | October 2012. He has served as a Portfolio Manager of the |
| Senior Vice President | | Hennessy Gas Utility Fund, the Hennessy Large Cap Financial |
| and Portfolio Manager | | Fund, and the Hennessy Small Cap Financial Fund since |
| | | October 2014. He served as Co-Portfolio Manager of the same |
| | | funds from March 2013 through September 2014, and as a |
| | | Portfolio Analyst for the Hennessy Funds from October 2012 |
| | | through February 2013. Mr. Kelley has also served as a Portfolio |
| | | Manager of the Hennessy Cornerstone Growth Fund, the |
| | | Hennessy Cornerstone Mid Cap 30 Fund, the Hennessy |
| | | Cornerstone Large Growth Fund, and the Hennessy |
| | | Cornerstone Value Fund since February 2017, as a Co-Portfolio |
| | | Manager of the Hennessy Technology Fund since February |
| | | 2017, and as a Portfolio Manager of the Hennessy Total Return |
| | | Fund and the Hennessy Balanced Fund since May 2018. |
| | | Mr. Kelley served as Portfolio Manager of FBR Fund Advisers, |
| | | Inc. from January 2008 to October 2012. |
| | | |
| Tania Kelley | October 2003 | Ms. Kelley has been employed by Hennessy Advisors, Inc. |
| (1965) | | since October 2003. |
| Senior Vice President | | |
| and Head of Marketing | | |
| | | |
| Daniel P. Hennessy | December 2016 | Mr. Daniel Hennessy has been employed by Hennessy Advisors, |
| (1990) | | Inc. since 2015. He has served as an Associate Analyst or |
| Vice President | | Analyst of the Hennessy Technology Fund since February 2017. |
| and Analyst | | Mr. Daniel Hennessy previously served as a Mutual Fund |
| | | Specialist at U.S. Bancorp Fund Services, LLC (now doing |
| | | business as U.S. Bank Global Fund Services) from November |
| | | 2014 to July 2015. Prior to that, he attended the University of |
| | | San Diego, where he earned a degree in Political Science. |
_______________
(1) | Messrs. DeSousa, Doyle, N. Hennessy, and Richardson previously served on the Board of Directors of Hennessy Mutual Funds, Inc. (“HMFI”), The Hennessy Funds, Inc. (“HFI”), and Hennessy SPARX Funds Trust (“HSFT”). Pursuant to an internal reorganization effective as of February 28, 2014, the series of HFMI, HFI, and HSFT were reorganized into corresponding series of the Trust that mirrored them. Subsequent to the reorganization, HFMI, HFI, and HSFT were dissolved. |
(2) | Mr. N. Hennessy is considered an “interested person,” as defined in the Investment Company Act of 1940, as amended, because he is an officer of the Hennessy Funds. |
(3) | The address of this officer is 4800 Bee Caves Road, Suite 100, Austin, TX 78746. |
(4) | The address of this officer is 101 Federal Street, Suite 1900, Boston, MA 02110. |
(5) | The address of this officer is 1340 Environ Way, Suite 332, Chapel Hill, NC 27517. |
| TRUSTEES AND OFFICERS OF THE FUND |
(This Page Intentionally Left Blank.)
| HENNESSY FUNDS | 1-800-966-4354 | |
Expense Example (Unaudited)
October 31, 2018
As a shareholder of the Fund, you incur ongoing costs, including management fees, service fees, and other Fund expenses. This Example is intended to help you understand your ongoing costs (in dollars) of investing in the Fund and to compare these costs with the ongoing costs of investing in other mutual funds. The Example is based on an investment of $1,000 invested at the beginning of the period and held for the entire period from May 1, 2018, through October 31, 2018.
Actual Expenses
The first line of the table below provides information about actual account values and actual expenses. Although the Fund charges no sales loads or transaction fees, you will be assessed fees for outgoing wire transfers, returned checks and stop payment orders at prevailing rates charged by U.S. Bank Global Fund Services, the Fund’s transfer agent. If you request that a redemption be made by wire transfer, currently a $15 fee is charged by the Fund’s transfer agent. IRA accounts will be charged a $15 annual maintenance fee. The example below includes, but is not limited to, management fees, shareholder servicing fees, fund accounting, custody, and transfer agent fees. However, the example below does not include portfolio trading commissions and related expenses, and other extraordinary expenses as determined under generally accepted accounting principles. You may use the information in this line, together with the amount you invested, to estimate the expenses that you paid over the period. Simply divide your account value by $1,000 (for example, an $8,600 account value divided by $1,000 = 8.6), then multiply the result by the number in the first line of the table under the heading entitled “Expenses Paid During Period” to estimate the expenses you paid on your account during this period.
Hypothetical Example for Comparison Purposes
The second line of the table below provides information about hypothetical account values and hypothetical expenses based on the Fund’s actual expense ratio and an assumed rate of return of 5% per year before expenses, which is not the Fund’s actual return. The hypothetical account values and expenses may not be used to estimate the actual ending account balance or expenses you paid for the period. You may use this information to compare the ongoing costs of investing in the Fund and other funds. To do so, compare this 5% hypothetical example with the 5% hypothetical examples that appear in the shareholder reports of the other funds. Please note that the expenses shown in the table are meant to highlight your ongoing costs only. Therefore, the second line of the table is useful in comparing ongoing costs only, and will not help you determine the relative total costs of owning different funds.
| | | | Expenses Paid |
| | Beginning | Ending | During Period(1) |
| | Account Value | Account Value | May 1, 2018 – |
| | May 1, 2018 | October 31, 2018 | October 31, 2018 |
| Investor Class | | | |
| Actual | $1,000.00 | $1,036.00 | $10.73 |
| Hypothetical (5% return before expenses) | $1,000.00 | $1,014.67 | $10.61 |
(1) | Expenses are equal to the Fund’s annualized expense ratio of 2.09%, multiplied by the average account value over the period, multiplied by 184/365 days (to reflect one-half year period). |
| HENNESSY FUNDS | 1-800-966-4354 | |
How to Obtain a Copy of the Fund’s
Proxy Voting Policy and Proxy Voting Records
A description of the policies and procedures the Fund uses to determine how to vote proxies relating to portfolio securities is available without charge: (1) by calling 1-800-966-4354; (2) on the Hennessy Funds’ website at www.hennessyfunds.com/proxy-voting/voting-policy; or (3) on the U.S. Securities and Exchange Commission’s (the “SEC”) website at www.sec.gov. The Fund’s proxy voting record is available without charge on both the Hennessy Funds’ website at www.hennessyfunds.com/proxy-voting/voting-record and the SEC’s website at www.sec.gov no later than August 31 for the prior 12 months ending June 30.
Quarterly Filings on Form N-Q
The Fund files a complete schedule of portfolio holdings with the SEC for the first and third quarters of each fiscal year on Form N-Q. The Fund’s Forms N-Q are available on the SEC’s website at www.sec.gov. Information included in the Fund’s Forms N-Q will also be available upon request by calling 1-800-966-4354.
Federal Tax Distribution Information
(Unaudited)
For fiscal year 2018, certain dividends paid by the Fund may be subject to a maximum tax rate of 23.8%, as provided for by the Jobs and Growth Tax Relief Reconciliation Act of 2003. The percentage of dividends declared from ordinary income designated as qualified dividend income was 100.00%.
For corporate shareholders, the percent of ordinary income distributions that qualified for the corporate dividends received deduction for fiscal year 2018 was 100.00%.
The percentage of taxable ordinary income distributions that were designated as short-term capital gain distributions under Section 871(k)(2)(C) of the Internal Revenue Code of 1986, as amended, for the Fund was 35.71%.
Important Notice Regarding Delivery
of Shareholder Documents
To help keep the Fund’s costs as low as possible, we generally deliver a single copy of shareholder reports, proxy statements, and prospectuses to shareholders who share an address and have the same last name. This process does not apply to account statements. You may request an individual copy of a shareholder document at any time. If you would like to receive separate mailings of shareholder documents, please call U.S. Bank Global Fund Services at 1-800-261-6950 or 1-414-765-4124, and individual delivery will begin within 30 days of your request. If your account is held through a financial institution or other intermediary, please contact such intermediary directly to request individual delivery.
| PROXY VOTING — PRIVACY POLICY |
Privacy Policy
We collect the following non-public personal information about you:
| | • | information we receive from you on or in applications or other forms, correspondence, or conversations, including, but not limited to, your name, address, phone number, social security number, assets, income, and date of birth; and |
| | | |
| | • | information about your transactions with us, our affiliates, or others, including, but not limited to, your account number and balance, payment history, parties to transactions, cost basis information, and other financial information. |
We do not disclose any non-public personal information about our current or former shareholders to non-affiliated third parties, except as permitted by law. For example, we are permitted by law to disclose all of the information we collect, as described above, to our Transfer Agent to process your transactions. Furthermore, we restrict access to your non-public personal information to those persons who require such information to provide products or services to you. We maintain physical, electronic, and procedural safeguards that comply with federal standards to guard your non-public personal information.
In the event that you hold shares of the Fund through a financial intermediary, including, but not limited to, a broker-dealer, bank, or trust company, the privacy policy of your financial intermediary would govern how your non-public personal information will be shared with non-affiliated third parties.
| HENNESSY FUNDS | 1-800-966-4354 | |
For information, questions or assistance, please call
The Hennessy Funds
1-800-966-4354 or 1-415-899-1555
INVESTMENT ADVISOR
Hennessy Advisors, Inc.
7250 Redwood Boulevard, Suite 200
Novato, California 94945
ADMINISTRATOR,
TRANSFER AGENT,
DIVIDEND PAYING AGENT, &
SHAREHOLDER SERVICING AGENT
U.S. Bancorp Fund Services, LLC
d/b/a U.S. Bank Global Fund Services
P.O. Box 701
Milwaukee, Wisconsin 53201-0701
CUSTODIAN
U.S. Bank N.A.
Custody Operations
1555 North River Center Drive, Suite 302
Milwaukee, Wisconsin 53212
TRUSTEES
Neil J. Hennessy
Robert T. Doyle
J. Dennis DeSousa
Gerald P. Richardson
COUNSEL
Foley & Lardner LLP
777 East Wisconsin Avenue
Milwaukee, Wisconsin 53202-5306
INDEPENDENT REGISTERED
PUBLIC ACCOUNTING FIRM
Tait, Weller & Baker LLP
Two Liberty Place
50 South 16th Street, Suite 2900
Philadelphia, Pennsylvania 19102-2529
DISTRIBUTOR
Quasar Distributors, LLC
777 East Wisconsin Avenue
Milwaukee, Wisconsin 53202
hennessyfunds.com | 1-800-966-4354
This report has been prepared for shareholders and may be distributed to
others only if preceded or accompanied by a current prospectus.
ANNUAL REPORT
OCTOBER 31, 2018
HENNESSY EQUITY AND
INCOME FUND
Investor Class HEIFX
Institutional Class HEIIX
hennessyfunds.com | 1-800-966-4354
(This Page Intentionally Left Blank.)
Contents
| Letter to Shareholders | 2 |
| Performance Overview | 4 |
| Financial Statements | |
| Schedule of Investments | 8 |
| Statement of Assets and Liabilities | 19 |
| Statement of Operations | 20 |
| Statements of Changes in Net Assets | 21 |
| Financial Highlights | 22 |
| Notes to the Financial Statements | 26 |
| Report of Independent Registered Public Accounting Firm | 34 |
| Trustees and Officers of the Fund | 35 |
| Expense Example | 38 |
| Proxy Voting Policy and Proxy Voting Records | 40 |
| Quarterly Schedule of Investments | 40 |
| Federal Tax Distribution Information | 40 |
| Important Notice Regarding Delivery of Shareholder Documents | 40 |
| Privacy Policy | 41 |
| HENNESSY FUNDS | 1-800-966-4354 | |
December 2018
Dear Hennessy Funds Shareholder:
Over the past year, we have witnessed the return of market volatility. U.S. stocks still registered healthy gains, bolstered by the impact on corporate profits of the successful passage of the tax reform bill in December 2017. However, concerns over potential trade disruptions, especially between the U.S. and China, and worries over higher short-term interest rates, which many believe could possibly trigger a recession down the road, put downward pressure on equity valuations.
The U.S. economy performed well over the period, and actually achieved an acceleration in GDP growth to over 3% on an annualized basis in the second and third quarters of calendar year 2018. During the past year, companies continued to hire workers, adding over 200,000 jobs per month on average, sending the unemployment rate down to 3.7% in October, which is the lowest it has been since 1969. Consumer confidence is high and still rising, and corporate profits reached record levels in the third quarter of calendar year 2018, posting a year-over-year increase of 26% for the companies in the S&P 500 Index.
The Federal Reserve, confident about the strength of the economy and mindful of a tight labor market, raised short-term interest rates four times over the last year, by a quarter point each time. Long-term bond yields also rose, driven higher primarily by evidence of faster wage growth, pushing the U.S. 10-year Treasury bond over 3% for the first time since 2013.
As I write this, we are experiencing the market’s 20th downturn since 2010. I have been saying that every bull market experiences volatility and pullbacks. Many financial commentators think this bull market is “long in the tooth.” I do not agree with them. I believe stock valuations are still very reasonable. The prospective price to earnings multiple for the Dow Jones Industrial Average has come down from almost 20x at the end of 2017 to 16x, just above its 10-year average of 15x. The prospective PE multiple for the S&P 500 Index has also come down, from 20x to 17x, and compares favorably to its 10-year average of 16x.
Cash, meanwhile, continues to build up on corporate balance sheets. The companies in the S&P 500 Index reported a total of over $5.4 trillion in cash and marketable securities in their latest filings. Companies have been spending some of their cash, increasing their investment spending and laying the groundwork for future earnings growth. However, they have also been returning capital to shareholders. S&P 500 Index companies announced $433.6 billion in share repurchases during the second quarter of calendar year 2018, nearly doubling the previous record of $242.1 billion set in the first quarter. Companies are also raising their dividends.
In addition, I believe the Federal Reserve will take care not to raise interest rates too high or too fast and endanger the economic expansion. While wage growth has risen to over 3% in October, other measures of inflationary pressure, such as the Consumer Price Index and the Producer Price Index, still show prices increasing at a more moderate pace, closer to 2%. Given continued evidence of modest rates of inflation, I believe the Fed will be able to maintain its gradual pace of interest rate hikes.
Finally and importantly, I still see no signs of euphoria in this market. In my opinion, the enthusiasm present earlier in the year, which followed the significant reduction in corporate income tax rates, has largely evaporated, and it has been replaced with anxiety
over higher interest rates and their potential impact on growth. In the past, I have likened the current bull market to that of 1982-2000, and I still believe this comparison holds true. I am confident in the strength of the market today and believe the economy will continue to grow in the coming year, albeit at a more moderate pace.
Thank you for your continued confidence and investment in the Hennessy Funds. If you have any questions or would like to speak with us directly, please don’t hesitate to call us at (800) 966-4354.
Best regards,
Neil J. Hennessy
President and Chief Investment Officer
Past performance does not guarantee future results.
Mutual fund investing involves risk. Principal loss is possible.
Opinions expressed are those of Neil Hennessy and are subject to change, are not guaranteed, and should not be considered investment advice.
The Dow Jones Industrial Average and S&P 500 Index are commonly used to measure the performance of U.S. stocks. One cannot invest directly in an index.
PE, or price to earnings, is a valuation measure and is calculated by dividing a company’s market price per share by its earnings per share. Earnings growth is not a measure of a fund’s future performance.
| HENNESSY FUNDS | 1-800-966-4354 | |
Performance Overview (Unaudited)
CHANGE IN VALUE OF $10,000 INVESTMENT
This graph illustrates the performance of an initial investment of $10,000 made in the Fund ten years ago and assumes the reinvestment of dividends.
AVERAGE ANNUAL TOTAL RETURN FOR PERIODS ENDED OCTOBER 31, 2018
| | One | Five | Ten |
| | Year | Years | Years |
| Hennessy Equity and Income Fund – | | | |
| Investor Class (HEIFX) | 3.44% | 5.70% | 8.76% |
| Hennessy Equity and Income Fund – | | | |
| Institutional Class (HEIIX) | 3.86% | 6.08% | 9.09% |
| Blended Balanced Index | 4.07% | 7.39% | 9.43% |
| S&P 500 Index | 7.35% | 11.34% | 13.24% |
Expense ratios: 1.48% (Investor Class); 1.10% (Institutional Class)
Performance data quoted represents past performance; past performance does not guarantee future results. The investment return and principal value of an investment will fluctuate so that an investor’s shares, when redeemed, may be worth more or less than their original cost. The performance table does not reflect the deduction of taxes that a shareholder would pay on Fund distributions or the redemption of Fund shares. Current performance of the Fund may be lower or higher than the performance quoted. Performance data current to the most recent month end may be obtained by visiting www.hennessyfunds.com. Performance for the period from March 13, 2010, to October 26, 2012, is that of the FBR Balanced Fund, and performance for the periods on or prior to March 12, 2010, is that of the AFBA 5 Star Balanced Fund.
The Blended Balanced Index consists of 60% common stocks represented by the S&P 500 Index and 40% bonds represented by the Bloomberg Barclays Capital Intermediate U.S. Government/Credit Index. The S&P 500 Index is commonly used to measure the performance of U.S. stocks. The Bloomberg Barclays Capital Intermediate U.S. Government/Credit Index is commonly used to measure the performance of U.S. bonds. One cannot invest directly in an index.
The expense ratios presented are from the most recent prospectus. The expense ratios for the current reporting period are available in the Financial Highlights section of this report.
PERFORMANCE NARRATIVE
Portfolio Managers for Equity Allocation: Stephen M. Goddard, CFA (Lead Portfolio Manager), Jonathan T. Moody, CFA, J. Brian Campbell, CFA, and Mark E. DeVaul, CFA, CPA
The London Company of Virginia, LLC (sub-advisor)
Portfolio Managers for Fixed Income Allocation: Gary B. Cloud, CFA, and Peter G. Greig, CFA
Financial Counselors, Inc. (sub-advisor)
Performance:
For the 12-month period ended October 31, 2018, the Investor Class of the Hennessy Equity and Income Fund returned 3.44%, underperforming both the Blended Balanced Index (the Fund’s primary benchmark) and the S&P 500 Index, which returned 4.07% and 7.35%, respectively, for the same period.
Equities: Stock selection was the primary factor that contributed to solid performance of the equity allocation of the portfolio, especially in the Financials and Information Technology sectors, where insurance company Progressive Corp. and credit card network company Visa, Inc. performed well. Other holdings that contributed positively to performance included O’Reilly Automotive, Inc., Nike, Inc., and Norfolk Southern Corp. Top detractors from performance included Carnival Corp., CarMax, Inc., General Dynamics Corp., BlackRock, Inc., and Dollar Tree, Inc. The Fund continues to hold all of the stocks mentioned with the exception of Nike, Inc.
Sector allocation had a slightly negative impact on the Fund’s relative performance. The Fund’s overweight position in Financials and underweight position in Information Technology hurt performance, while the Fund’s overweight position in Consumer Discretionary and underweight position in Consumer Staples contributed positively to performance.
Fixed Income: The overweight position in investment grade corporate credit and yield curve positioning was the largest positive contributor to performance of the fixed income allocation of the portfolio over the 12-month period. The income and aging from these higher-yielding investment grade securities exceeded the amount represented in the benchmark. Additionally, the Fund’s overweight position in shorter-term securities compared to the index helped cushion the price decline from longer-dated securities. The Fund’s slight exposure to preferred stocks and high-yield credit securities, or “junk bonds,” was another positive factor aiding performance. Effective duration and industry sector positioning was the largest relative detractor from overall performance compared to the benchmark.
Portfolio Strategy:
The Fund seeks a balanced portfolio of approximately 60% equities and 40% fixed income, with the goal of maintaining broad market exposure with lower volatility. Our bottom-up equity selection strategy seeks companies with strong returns on capital and the flexibility to enhance shareholder value by using their balance sheets. The fixed income allocation of the portfolio focuses on high-quality domestic corporate, agency, and government bonds.
Investment Commentary:
Equities: The U.S. economy continues to expand, with annualized real GDP growth averaging over 3% over the last two quarters, while the inflation rate remains relatively low. Looking ahead, we remain optimistic about the economy and believe there are a number of positives that should support consumer spending in the future, including a strong labor market and rising wages.
| HENNESSY FUNDS | 1-800-966-4354 | |
In terms of monetary policy, we believe the Federal Reserve will continue to increase the fed funds rate with a 25 basis point hike expected in December and roughly three additional increases in 2019. We also believe that the timing and magnitude of rate increases next year are likely to be determined by the rate of growth of the economy overall and conditions in the labor market. Long bond rates have risen recently as a result of firming inflation expectations, higher growth expectations, and balance sheet normalization from the Federal Reserve.
Discussion of higher import tariffs continued throughout the year. The main dispute appears to be between the United States and China, where a number of tariffs have already been announced and enacted. So far, we believe these tariffs have failed to meaningfully impact trade or negatively affect the outlook for most companies, but the impact could be greater in the years ahead.
Looking forward, the combination of solid economic growth, low inflation (core inflation in the 2% range), and relatively low-but-rising interest rates usually creates a positive environment for stocks. We believe this positive outlook holds true today, but we have a more balanced view longer term. Potential risks include relatively high valuations for stocks using traditional metrics, rising inflation, the impact of increasing tariffs, and a more aggressive tightening policy from the Federal Reserve. While we believe the risks and rewards are somewhat balanced as they relate to stocks overall, we always remain cautious and focus on limiting downside in each holding. Fortunately, we are still finding new, high-conviction potential investment ideas for the Fund.
Finally, we believe the Fund is well positioned based on the strength of the companies owned and the overall valuation of the portfolio. In our opinion, the market valuation overall is not very attractive on a PE basis, and we could certainly see a pullback or greater volatility in the near future. In an environment of lower expected returns and greater volatility, we believe the Fund offers a defensive option for equity investors.
Fixed Income: We believe the Federal Reserve is likely to raise the federal funds rate in December based on an implied probability analysis. What will happen in 2019 and 2020 on the interest rate front is very uncertain, as the Federal Reserve has indicated three or four quarter-point rate hikes are likely over that time horizon, and the marketplace has only priced in about two. Core Consumer Price Index and Personal Consumption Expenditure, both measures of inflationary pressure, have finally reached the Federal Reserve’s targets, after undershooting them over the last five years. We believe the cyclical pressures on the inflation front are close to peaking and may level off around 2.0% for the next few years.
One major change over the last 12 months has been the shape of the U.S. yield curve. The 10-year Treasury bond yield minus the 2-year Treasury bond yield has continued to flatten this year to around 0.27%, after starting the period at .67%. A narrow spread between short-term and long-term rates is a warning sign from the marketplace that monetary policy is becoming too restrictive. At this point, the economy can probably withstand a higher base interest rate than markets and investors are comfortable with. Therefore, a slight moderation in the overall level of economic activity could open a pathway for the Federal Reserve to be more reserved with future rate hikes and allow the economy to press along.
As we look forward, it is our belief that the federal funds rate is approaching a neutral level. We expect another rate increase in December and that 10-year Treasury bond yields may move modestly higher. However, we believe short-term rates already reflect at least three future rate increases and might not change significantly from current rates. We expect corporate bonds to continue to perform relatively well as there are no
material signs that economic growth is slowing. With inflation targeted at 2%, we believe the U.S. bond market now offers an attractive real return in addition to the portfolio diversification and risk mitigation benefits it provides.
_______________
Opinions expressed are those of the Portfolio Managers as of the date written and are subject to change, are not guaranteed, and should not be considered investment advice or an indication of trading intent.
Investments in debt securities typically decrease in value when interest rates rise. The risk is greater for longer-term debt securities. Investments by the Fund in lower-rated and non-rated securities presents a greater risk of loss to principal and interest than higher-rated securities. Investments in asset-backed and mortgage-backed securities include additional risks that investors should be aware of including credit risk, prepayment risk, possible illiquidity, and default, as well as increased susceptibility to adverse economic developments. Investments in foreign securities may involve political, economic, and currency risks, greater volatility, and differences in accounting methods. The Fund may experience higher fees due to investments in pooled investment vehicles (including exchange-traded funds). Please see the Fund’s prospectus for a more complete discussion of these and other risks.
References to specific securities should not be considered a recommendation to buy or sell any security. Fund holdings and sector allocations are subject to change. Please refer to the Schedule of Investments included in this report for additional portfolio information.
Basis point refers to a common unit of measure for interest rates and other percentages in finance and is equal to 1/100th of 1%. Duration is a measure of the sensitivity of the price (the value of the principal) of a fixed-income investment to a change in interest rates and is expressed as a number of years. Yield curve is a line that plots the interest rates, at a set point in time, of bonds having equal credit quality, but differing maturity dates. Investment grade is a rating that indicates that a municipal or corporate bond has a relatively low risk of default. PE, or price-to-earnings ratio, is a valuation measure calculated by dividing a company’s market price per share by its earnings per share. Diversification does not assure a profit nor protect against loss in a declining market.
| HENNESSY FUNDS | 1-800-966-4354 | |
Financial Statements
Schedule of Investments as of October 31, 2018 |
HENNESSY EQUITY AND INCOME FUND
(% of Net Assets)
| TOP TEN HOLDINGS (EXCLUDING MONEY MARKET FUNDS) | % NET ASSETS |
| Berkshire Hathaway, Inc., Class B | 4.35% |
| Apple, Inc. | 3.86% |
| The Progressive Corp. | 3.49% |
| Visa, Inc., Class A | 3.00% |
| Alphabet, Inc., Class C | 2.97% |
| Norfolk Southern Corp. | 2.61% |
| Dollar Tree, Inc. | 2.34% |
| CarMax, Inc. | 2.28% |
| Carnival Corp. | 2.27% |
| BlackRock, Inc. | 1.97% |
Note: For presentation purposes, the Fund has grouped some of the industry categories. For purposes of categorizing securities for compliance with section 8(b)(1) of the Investment Company Act of 1940, as amended, the Fund uses more specific industry classifications.
The Global Industry Classification Standard (GICS®) was developed by and is the exclusive property and a service mark of MSCI, Inc. and Standard & Poor Financial Services LLC. It has been licensed for use by the Hennessy Funds.
| COMMON STOCKS – 58.38% | | Number | | | | | | % of | |
| | | of Shares | | | Value | | | Net Assets | |
| Communication Services – 3.98% | | | | | | | | | |
| Alphabet, Inc., Class C (a) | | | 6,039 | | | $ | 6,502,614 | | | | 2.97 | % |
| Verizon Communications, Inc. | | | 38,815 | | | | 2,215,948 | | | | 1.01 | % |
| | | | | | | | 8,718,562 | | | | 3.98 | % |
| | | | | | | | | | | | | |
| Consumer Discretionary – 11.23% | | | | | | | | | | | | |
| CarMax, Inc. (a) | | | 73,485 | | | | 4,990,366 | | | | 2.28 | % |
| Carnival Corp. (b) | | | 88,995 | | | | 4,987,280 | | | | 2.27 | % |
| Dollar Tree, Inc. (a) | | | 60,811 | | | | 5,126,367 | | | | 2.34 | % |
| Home Depot, Inc. | | | 22,055 | | | | 3,879,033 | | | | 1.77 | % |
| Lowe’s Companies, Inc. | | | 19,114 | | | | 1,820,035 | | | | 0.83 | % |
| O’Reilly Automotive, Inc. (a) | | | 11,890 | | | | 3,813,718 | | | | 1.74 | % |
| | | | | | | | 24,616,799 | | | | 11.23 | % |
| | | | | | | | | | | | | |
| Consumer Staples – 4.92% | | | | | | | | | | | | |
| Altria Group, Inc. | | | 63,901 | | | | 4,156,121 | | | | 1.90 | % |
| Nestle S.A. (b) | | | 49,942 | | | | 4,209,112 | | | | 1.92 | % |
| The Coca-Cola Co. | | | 50,606 | | | | 2,423,015 | | | | 1.10 | % |
| | | | | | | | 10,788,248 | | | | 4.92 | % |
| | | | | | | | | | | | | |
| Energy – 1.21% | | | | | | | | | | | | |
| Chevron Corp. | | | 23,672 | | | | 2,642,979 | | | | 1.21 | % |
| | | | | | | | | | | | | |
| Financials – 14.45% | | | | | | | | | | | | |
| Alleghany Corp. | | | 6,684 | | | | 4,014,945 | | | | 1.83 | % |
| Bank of America Corp. | | | 75,498 | | | | 2,076,195 | | | | 0.95 | % |
| Berkshire Hathaway, Inc., Class B (a) | | | 46,499 | | | | 9,545,315 | | | | 4.35 | % |
| BlackRock, Inc. | | | 10,472 | | | | 4,308,390 | | | | 1.97 | % |
| The Progressive Corp. | | | 109,777 | | | | 7,651,457 | | | | 3.49 | % |
| Wells Fargo & Co. | | | 76,569 | | | | 4,075,768 | | | | 1.86 | % |
| | | | | | | | 31,672,070 | | | | 14.45 | % |
| | | | | | | | | | | | | |
| Health Care – 1.03% | | | | | | | | | | | | |
| Bristol-Myers Squibb Co. | | | 44,831 | | | | 2,265,759 | | | | 1.03 | % |
| | | | | | | | | | | | | |
| Industrials – 7.99% | | | | | | | | | | | | |
| Deere & Co. | | | 11,890 | | | | 1,610,381 | | | | 0.73 | % |
| FedEx Corp. | | | 15,691 | | | | 3,457,355 | | | | 1.58 | % |
| General Dynamics Corp. | | | 19,229 | | | | 3,318,541 | | | | 1.51 | % |
| Norfolk Southern Corp. | | | 34,049 | | | | 5,714,444 | | | | 2.61 | % |
| Southwest Airlines Co. | | | 69,421 | | | | 3,408,571 | | | | 1.56 | % |
| | | | | | | | 17,509,292 | | | | 7.99 | % |
The accompanying notes are an integral part of these financial statements.
| HENNESSY FUNDS | 1-800-966-4354 | |
| COMMON STOCKS | | Number | | | | | | % of | |
| | | of Shares | | | Value | | | Net Assets | |
| Information Technology – 8.69% | | | | | | | | | |
| Apple, Inc. | | | 38,656 | | | $ | 8,460,252 | | | | 3.86 | % |
| Cisco Systems, Inc. | | | 87,497 | | | | 4,002,988 | | | | 1.83 | % |
| Visa, Inc., Class A | | | 47,683 | | | | 6,573,102 | | | | 3.00 | % |
| | | | | | | | 19,036,342 | | | | 8.69 | % |
| | | | | | | | | | | | | |
| Materials – 4.88% | | | | | | | | | | | | |
| Albemarle Corp. | | | 39,212 | | | | 3,890,615 | | | | 1.78 | % |
| Martin Marietta Materials, Inc. | | | 19,380 | | | | 3,319,406 | | | | 1.51 | % |
| NewMarket Corp. | | | 9,054 | | | | 3,494,482 | | | | 1.59 | % |
| | | | | | | | 10,704,503 | | | | 4.88 | % |
| Total Common Stocks | | | | | | | | | | | | |
| (Cost $99,644,037) | | | | | | | 127,954,554 | | | | 58.38 | % |
| | | | | | | | | | | | | |
| PREFERRED STOCKS – 1.86% | | | | | | | | | | | | |
| | | | | | | | | | | | | |
| Communication Services – 0.05% | | | | | | | | | | | | |
| AT&T, Inc., 5.350%, 11/01/2066 | | | 4,530 | | | | 106,772 | | | | 0.05 | % |
| | | | | | | | | | | | | |
| Consumer Staples – 0.08% | | | | | | | | | | | | |
| CHS, Inc., Series 4, 7.500%, Perpetual | | | 7,005 | | | | 185,843 | | | | 0.08 | % |
| | | | | | | | | | | | | |
| Energy – 0.05% | | | | | | | | | | | | |
| Enbridge, Inc., Series B, 6.375% to 04/15/2023, | | | | | | | | | | | | |
| 3.593% to 04/15/2028, 3.843% to 04/15/2043, then | | | | | | | | | | | | |
| 3 Month LIBOR USD + 4.593%, 04/15/2078 (b)(f) | | | 4,410 | | | | 108,839 | | | | 0.05 | % |
| | | | | | | | | | | | | |
| Financials – 1.61% | | | | | | | | | | | | |
| Aegon N.V., 6.375%, Perpetual (b) | | | 3,845 | | | | 97,278 | | | | 0.05 | % |
| Arch Capital Group Ltd., Series F, 5.450%, Perpetual (b) | | | 4,575 | | | | 103,120 | | | | 0.05 | % |
| Axis Capital Holdings Ltd, Series E, 5.500%, Perpetual (b) | | | 2,470 | | | | 57,057 | | | | 0.03 | % |
| Banc of California, Inc., Series E, 7.000%, Perpetual | | | 3,805 | | | | 97,408 | | | | 0.05 | % |
| Bank of America Corp. | | | | | | | | | | | | |
| Series GG, 6.000%, Perpetual | | | 3,455 | | | | 86,824 | | | | 0.04 | % |
| Series CC, 6.200%, Perpetual | | | 2,360 | | | | 61,053 | | | | 0.03 | % |
| BB&T Corp. | | | | | | | | | | | | |
| 5.625%, Perpetual | | | 4,230 | | | | 105,962 | | | | 0.05 | % |
| Series F, 5.200%, Perpetual | | | 4,400 | | | | 105,512 | | | | 0.05 | % |
| Capital One Financial Corp. | | | | | | | | | | | | |
| Series F, 6.200%, Perpetual | | | 4,330 | | | | 110,458 | | | | 0.05 | % |
| Series H, 6.000%, Perpetual | | | 4,365 | | | | 111,526 | | | | 0.05 | % |
| Citigroup, Inc., Series S, 6.300%, Perpetual | | | 3,605 | | | | 93,874 | | | | 0.04 | % |
The accompanying notes are an integral part of these financial statements.
| PREFERRED STOCKS | | Number | | | | | | % of | |
| | | of Shares | | | Value | | | Net Assets | |
| Financials (Continued) | | | | | | | | | |
| Fannie Mae Preferred, Series S, 8.250%, Perpetual (a) | | | 7,000 | | | $ | 41,860 | | | | 0.02 | % |
| First Republic Bank | | | | | | | | | | | | |
| Series F, 5.700%, Perpetual | | | 3,120 | | | | 76,534 | | | | 0.04 | % |
| Series G, 5.500%, Perpetual | | | 3,170 | | | | 75,192 | | | | 0.03 | % |
| Hartford Financial Services Group, Inc., Series G, 6.000%, Perpetual (a) | | | 4,400 | | | | 110,352 | | | | 0.05 | % |
| Huntington Bancshares, Inc., Series D, 6.250%, Perpetual | | | 5,930 | | | | 152,164 | | | | 0.07 | % |
| IBERIABANK Corp., Series B, 6.625% to 08/01/2025 then | | | | | | | | | | | | |
| 3 Month LIBOR USD + 4.262%, Perpetual (f) | | | 1,920 | | | | 50,400 | | | | 0.02 | % |
| ING Groep N.V., 6.125%, Perpetual (b) | | | 2,055 | | | | 51,909 | | | | 0.02 | % |
| JPMorgan Chase & Co., Series BB, 6.150%, Perpetual | | | 8,595 | | | | 217,539 | | | | 0.10 | % |
| KeyCorp | | | | | | | | | | | | |
| Series E, 6.125% to 12/15/2026 then | | | | | | | | | | | | |
| 3 Month LIBOR USD + 3.892%, Pepetual (f) | | | 4,075 | | | | 107,172 | | | | 0.05 | % |
| Series F, 5.650%, Pepetual (a) | | | 2,065 | | | | 50,035 | | | | 0.02 | % |
| Legg Mason, Inc. | | | | | | | | | | | | |
| 5.450%, 09/15/2056 | | | 2,085 | | | | 48,956 | | | | 0.02 | % |
| 6.375%, 03/15/2056 | | | 1,946 | | | | 49,545 | | | | 0.03 | % |
| MetLife, Inc., Series E, 5.625%, Pepetual | | | 4,400 | | | | 108,944 | | | | 0.05 | % |
| Morgan Stanley, Series I, 6.375% to 10/15/2024 then | | | | | | | | | | | | |
| 3 Month LIBOR USD + 3.708%, Perpetual (f) | | | 7,000 | | | | 183,260 | | | | 0.08 | % |
| National General Holdings Corp., Series C, 7.500%, Perpetual | | | 2,450 | | | | 58,653 | | | | 0.03 | % |
| Regions Financial Corp., Series B, 6.375% to 09/15/2024 then | | | | | | | | | | | | |
| 3 Month LIBOR USD + 3.536%, Perpetual (f) | | | 4,145 | | | | 110,423 | | | | 0.05 | % |
| State Street Corp. | | | | | | | | | | | | |
| Series D, 5.900% to 03/15/2024 then | | | | | | | | | | | | |
| 3 Month LIBOR USD + 3.108%, Perpetual (f) | | | 4,150 | | | | 108,066 | | | | 0.05 | % |
| Series E, 6.000%, Perpetual | | | 1,950 | | | | 49,569 | | | | 0.02 | % |
| TCF Financial Corp., Series C, 5.700%, Perpetual | | | 2,090 | | | | 50,244 | | | | 0.02 | % |
| The Allstate Corp., Series G, 5.625%, Perpetual | | | 4,745 | | | | 116,110 | | | | 0.05 | % |
| The Charles Schwab Corp. | | | | | | | | | | | | |
| Series C, 6.000%, Perpetual | | | 4,315 | | | | 110,982 | | | | 0.05 | % |
| Series D, 5.950%, Perpetual | | | 4,375 | | | | 113,094 | | | | 0.05 | % |
| The Goldman Sachs Group, Inc. | | | | | | | | | | | | |
| Series K, 6.375% to 05/10/2024 then | | | | | | | | | | | | |
| 3 Month LIBOR USD + 3.550%, Perpetual (f) | | | 2,560 | | | | 67,226 | | | | 0.03 | % |
| Series N, 6.300%, Perpetual | | | 2,620 | | | | 66,941 | | | | 0.03 | % |
| U.S. Bancorp, Series F, 6.500% to 01/15/2022 then | | | | | | | | | | | | |
| 3 Month LIBOR USD + 4.447%, Perpetual (d)(f) | | | 2,755 | | | | 74,413 | | | | 0.03 | % |
| Webster Financial Corp., Series F, 5.250%, Perpetual | | | 1,075 | | | | 24,005 | | | | 0.01 | % |
The accompanying notes are an integral part of these financial statements.
| HENNESSY FUNDS | 1-800-966-4354 | |
| PREFERRED STOCKS | | Number | | | | | | % of | |
| | | of Shares | | | Value | | | Net Assets | |
| Financials (Continued) | | | | | | | | | |
| Wells Fargo & Co. | | | | | | | | | |
| Series V, 6.000%, Perpetual | | | 4,325 | | | $ | 110,677 | | | | 0.05 | % |
| Series X, 5.500%, Perpetual | | | 4,475 | | | | 109,727 | | | | 0.05 | % |
| | | | | | | | 3,524,064 | | | | 1.61 | % |
| | | | | | | | | | | | | |
| Utilities – 0.07% | | | | | | | | | | | | |
| DTE Energy Co., Series F, 6.000%, 12/15/2076 | | | 2,320 | | | | 60,181 | | | | 0.03 | % |
| The Southern Co., 6.250%, 10/15/2075 | | | 3,840 | | | | 98,265 | | | | 0.04 | % |
| | | | | | | | 158,446 | | | | 0.07 | % |
| Total Preferred Stocks | | | | | | | | | | | | |
| (Cost $4,293,450) | | | | | | | 4,083,964 | | | | 1.86 | % |
| | | | | | | | | | | | | |
| REITS – 0.68% | | | | | | | | | | | | |
| | | | | | | | | | | | | |
| Financials – 0.68% | | | | | | | | | | | | |
| Annaly Capital Management, Inc., Series F, 6.950% to 09/30/2022 then | | | | | | | | | | | | |
| 3 Month LIBOR USD + 4.993%, Perpetual (f) | | | 4,370 | | | | 109,818 | | | | 0.05 | % |
| Apollo Commercial Real Estate Finance, Inc. | | | 9,010 | | | | 168,577 | | | | 0.08 | % |
| Chimera Investment Corp. | | | 9,270 | | | | 172,422 | | | | 0.08 | % |
| Chimera Investment Corp. | | | | | | | | | | | | |
| Series A, 8.000%, Perpetual | | | 4,620 | | | | 117,440 | | | | 0.05 | % |
| Series B, 8.000% to 03/30/2024 then | | | | | | | | | | | | |
| 3 Month LIBOR USD + 5.791%, Perpetual (f) | | | 2,350 | | | | 60,795 | | | | 0.03 | % |
| Invesco Mortgage Capital, Inc., Series C, 7.500% to 09/27/2027 then | | | | | | | | | | | | |
| 3 Month LIBOR USD + 5.289%, Perpetual (f) | | | 4,510 | | | | 112,028 | | | | 0.05 | % |
| Monmouth Real Estate Investment Corp., Series C, 6.125%, Perpetual | | | 4,180 | | | | 100,320 | | | | 0.05 | % |
| Public Storage, Series B, 5.400%, Perpetual | | | 3,015 | | | | 71,486 | | | | 0.03 | % |
| Starwood Property Trust, Inc. | | | 7,765 | | | | 168,656 | | | | 0.08 | % |
| Two Harbors Investment Corp. | | | 10,655 | | | | 156,522 | | | | 0.07 | % |
| Two Harbors Investment Corp., Series B, 7.625% to 07/27/2027 then | | | | | | | | | | | | |
| 3 Month LIBOR USD + 5.352%, Perpetual (f) | | | 6,880 | | | | 169,798 | | | | 0.08 | % |
| Vornado Realty Trust, Series M, 5.250%, Perpetual | | | 3,310 | | | | 72,555 | | | | 0.03 | % |
| | | | | | | | 1,480,417 | | | | 0.68 | % |
| Total REITS | | | | | | | | | | | | |
| (Cost $1,461,792) | | | | | | | 1,480,417 | | | | 0.68 | % |
The accompanying notes are an integral part of these financial statements.
| CORPORATE BONDS – 25.28% | | Par | | | | | | % of | |
| | | Amount | | | Value | | | Net Assets | |
| Communication Services – 1.99% | | | | | | | | | |
| AT&T, Inc. | | | | | | | | | |
| 3.000%, 02/15/2022 | | | 500,000 | | | $ | 488,546 | | | | 0.22 | % |
| 4.250%, 03/01/2027 | | | 980,000 | | | | 952,013 | | | | 0.44 | % |
| 5.350%, 09/01/2040 | | | 200,000 | | | | 191,314 | | | | 0.09 | % |
| 5.800%, 02/15/2019 | | | 400,000 | | | | 403,234 | | | | 0.18 | % |
| Deutsche Telekom AG, 6.000%, 07/08/2019 (b) | | | 1,160,000 | | | | 1,182,457 | | | | 0.54 | % |
| Verizon Communications, Inc., 2.450%, 11/01/2022 | | | 1,200,000 | | | | 1,147,866 | | | | 0.52 | % |
| | | | | | | | 4,365,430 | | | | 1.99 | % |
| | | | | | | | | | | | | |
| Consumer Discretionary – 0.93% | | | | | | | | | | | | |
| Alibaba Group Holding Ltd, 3.600%, 11/28/2024 (b) | | | 1,000,000 | | | | 973,733 | | | | 0.45 | % |
| Ford Motor Co., 7.450%, 07/16/2031 | | | 1,000,000 | | | | 1,054,612 | | | | 0.48 | % |
| | | | | | | | 2,028,345 | | | | 0.93 | % |
| | | | | | | | | | | | | |
| Consumer Staples – 0.61% | | | | | | | | | | | | |
| CVS Health Corp., 4.125%, 05/15/2021 | | | 1,000,000 | | | | 1,012,632 | | | | 0.46 | % |
| Wal-Mart Stores, Inc., 5.000%, 10/25/2040 | | | 300,000 | | | | 325,020 | | | | 0.15 | % |
| | | | | | | | 1,337,652 | | | | 0.61 | % |
| | | | | | | | | | | | | |
| Energy – 2.55% | | | | | | | | | | | | |
| Boardwalk Pipelines LP, 4.450%, 07/15/2027 | | | 1,200,000 | | | | 1,129,091 | | | | 0.52 | % |
| Canadian Natural Resources Ltd., 3.900%, 02/01/2025 (b) | | | 1,000,000 | | | | 972,520 | | | | 0.44 | % |
| Encana Corp., 3.900%, 11/15/2021 (b) | | | 1,600,000 | | | | 1,599,429 | | | | 0.73 | % |
| Husky Energy, Inc., 4.000%, 04/15/2024 (b) | | | 750,000 | | | | 741,111 | | | | 0.34 | % |
| National Oilwell Varco, Inc., 2.600%, 12/01/2022 | | | 1,200,000 | | | | 1,137,768 | | | | 0.52 | % |
| | | | | | | | 5,579,919 | | | | 2.55 | % |
| | | | | | | | | | | | | |
| Financials – 12.48% | | | | | | | | | | | | |
| American International Group, Inc. | | | | | | | | | | | | |
| 4.125%, 02/15/2024 | | | 1,000,000 | | | | 997,203 | | | | 0.45 | % |
| 4.875%, 06/01/2022 | | | 1,000,000 | | | | 1,029,262 | | | | 0.47 | % |
| Boston Properties, Inc., 5.875%, 10/15/2019 | | | 700,000 | | | | 713,841 | | | | 0.33 | % |
| Capital One Financial Corp., 4.750%, 07/15/2021 | | | 1,500,000 | | | | 1,544,533 | | | | 0.70 | % |
| Capital One NA, 2.250%, 09/13/2021 | | | 500,000 | | | | 479,996 | | | | 0.22 | % |
| Comerica, Inc., 2.125%, 05/23/2019 | | | 500,000 | | | | 497,721 | | | | 0.23 | % |
| Diamond 1 Finance Corp. / Diamond 2 | | | | | | | | | | | | |
| Finance Corp., 5.450%, 06/15/2023 (e) | | | 1,220,000 | | | | 1,265,727 | | | | 0.58 | % |
| Discover Financial Services, 5.200%, 04/27/2022 | | | 900,000 | | | | 930,200 | | | | 0.42 | % |
| Fifth Third Bancorp, 2.375%, 04/25/2019 | | | 1,675,000 | | | | 1,670,583 | | | | 0.76 | % |
| First Niagara Financial Group, Inc., 6.750%, 03/19/2020 | | | 590,000 | | | | 615,538 | | | | 0.28 | % |
| General Electric Capital Corp., 6.000%, 08/07/2019 | | | 610,000 | | | | 622,231 | | | | 0.28 | % |
The accompanying notes are an integral part of these financial statements.
| HENNESSY FUNDS | 1-800-966-4354 | |
| CORPORATE BONDS | | Par | | | | | | % of | |
| | | Amount | | | Value | | | Net Assets | |
| Financials (Continued) | | | | | | | | | |
| Huntington Bancshares Inc/OH, 4.000%, 05/15/2025 | | | 765,000 | | | $ | 759,780 | | | | 0.35 | % |
| JPMorgan Chase & Co., 2.700%, 05/18/2023 | | | 1,000,000 | | | | 956,257 | | | | 0.43 | % |
| KeyCorp, 5.100%, 03/24/2021 | | | 950,000 | | | | 983,833 | | | | 0.45 | % |
| Lincoln National Corp., 6.250%, 02/15/2020 | | | 780,000 | | | | 807,281 | | | | 0.37 | % |
| Morgan Stanley, 5.500%, 07/28/2021 | | | 2,333,000 | | | | 2,445,238 | | | | 1.12 | % |
| Prudential Financial, Inc., 3.878%, 03/27/2028 | | | 400,000 | | | | 393,830 | | | | 0.18 | % |
| Qwest Capital Funding, Inc., 6.500%, 11/15/2018 | | | 700,000 | | | | 700,437 | | | | 0.32 | % |
| Raymond James Financial, Inc. | | | | | | | | | | | | |
| 3.625%, 09/15/2026 | | | 1,500,000 | | | | 1,413,916 | | | | 0.65 | % |
| 5.625%, 04/01/2024 | | | 700,000 | | | | 747,580 | | | | 0.34 | % |
| Synchrony Financial, 3.750%, 08/15/2021 | | | 1,200,000 | | | | 1,184,152 | | | | 0.54 | % |
| Synovus Financial Corp., 3.125%, 11/01/2022 | | | 1,300,000 | | | | 1,238,250 | | | | 0.56 | % |
| The Goldman Sachs Group, Inc. | | | | | | | | | | | | |
| 5.375%, 03/15/2020 | | | 1,100,000 | | | | 1,129,638 | | | | 0.52 | % |
| 6.000%, 06/15/2020 | | | 1,500,000 | | | | 1,560,413 | | | | 0.71 | % |
| The Toronto-Dominion Bank, 2.125%, 07/02/2019 (b) | | | 1,500,000 | | | | 1,492,572 | | | | 0.68 | % |
| Westpac Banking Corp., 4.875%, 11/19/2019 (b) | | | 450,000 | | | | 458,107 | | | | 0.21 | % |
| Willis North America, Inc., 3.600%, 05/15/2024 | | | 750,000 | | | | 722,458 | | | | 0.33 | % |
| | | | | | | | 27,360,577 | | | | 12.48 | % |
| | | | | | | | | | | | | |
| Health Care – 3.12% | | | | | | | | | | | | |
| Agilent Technologies, Inc., 5.000%, 07/15/2020 | | | 650,000 | | | | 667,098 | | | | 0.30 | % |
| Amgen, Inc. | | | | | | | | | | | | |
| 3.450%, 10/01/2020 | | | 1,000,000 | | | | 1,002,700 | | | | 0.46 | % |
| 3.625%, 05/22/2024 | | | 1,500,000 | | | | 1,479,520 | | | | 0.68 | % |
| Celgene Corp., 3.625%, 05/15/2024 | | | 1,600,000 | | | | 1,555,749 | | | | 0.71 | % |
| Edwards Lifesciences Corp., 4.300%, 06/15/2028 | | | 1,450,000 | | | | 1,440,936 | | | | 0.66 | % |
| Express Scripts Holding Co., 3.500%, 06/15/2024 | | | 700,000 | | | | 680,554 | | | | 0.31 | % |
| | | | | | | | 6,826,557 | | | | 3.12 | % |
| | | | | | | | | | | | | |
| Industrials – 0.45% | | | | | | | | | | | | |
| Rio Tinto Finance USA Ltd., 3.750%, 06/15/2025 (b) | | | 1,000,000 | | | | 992,273 | | | | 0.45 | % |
| | | | | | | | | | | | | |
| Information Technology – 0.97% | | | | | | | | | | | | |
| Apple, Inc., 4.500%, 02/23/2036 | | | 250,000 | | | | 260,438 | | | | 0.12 | % |
| Corning, Inc. | | | | | | | | | | | | |
| 6.625%, 05/15/2019 | | | 695,000 | | | | 707,906 | | | | 0.32 | % |
| 6.850%, 03/01/2029 | | | 275,000 | | | | 319,813 | | | | 0.15 | % |
| Juniper Networks, Inc., 4.600%, 03/15/2021 | | | 600,000 | | | | 611,989 | | | | 0.28 | % |
| Oracle Corp., 2.650%, 07/15/2026 | | | 250,000 | | | | 228,865 | | | | 0.10 | % |
| | | | | | | | 2,129,011 | | | | 0.97 | % |
The accompanying notes are an integral part of these financial statements.
| CORPORATE BONDS | | Par | | | | | | % of | |
| | | Amount | | | Value | | | Net Assets | |
| Materials – 1.71% | | | | | | | | | |
| AngloGold Ashanti Holdings PLC, 5.125%, 08/01/2022 (b) | | | 1,000,000 | | | $ | 1,010,000 | | | | 0.46 | % |
| Goldcorp, Inc., 3.625%, 06/09/2021 (b) | | | 750,000 | | | | 746,032 | | | | 0.34 | % |
| Newmont Mining Corp., 3.500%, 03/15/2022 | | | 1,000,000 | | | | 988,095 | | | | 0.45 | % |
| The Dow Chemical Co., 4.250%, 11/15/2020 | | | 1,000,000 | | | | 1,013,328 | | | | 0.46 | % |
| | | | | | | | 3,757,455 | | | | 1.71 | % |
| | | | | | | | | | | | | |
| Retail Trade – 0.47% | | | | | | | | | | | | |
| Macy’s Retail Holdings, Inc. | | | | | | | | | | | | |
| 4.375%, 09/01/2023 | | | 900,000 | | | | 893,188 | | | | 0.41 | % |
| 4.500%, 12/15/2034 | | | 175,000 | | | | 139,786 | | | | 0.06 | % |
| | | | | | | | 1,032,974 | | | | 0.47 | % |
| Total Corporate Bonds | | | | | | | | | | | | |
| (Cost $56,404,646) | | | | | | | 55,410,193 | | | | 25.28 | % |
| | | | | | | | | | | | | |
| MORTGAGE BACKED SECURITIES – 4.66% | | | | | | | | | | | | |
| | | | | | | | | | | | | |
| Fannie Mae Pool | | | | | | | | | | | | |
| 3.000%, 10/01/2043 | | | 2,484,505 | | | | 2,371,276 | | | | 1.08 | % |
| 3.500%, 01/01/2042 | | | 500,088 | | | | 491,377 | | | | 0.22 | % |
| 4.000%, 10/01/2041 | | | 560,442 | | | | 564,965 | | | | 0.26 | % |
| 4.000%, 12/01/2041 | | | 506,195 | | | | 510,271 | | | | 0.23 | % |
| 4.500%, 08/01/2020 | | | 17,662 | | | | 17,991 | | | | 0.01 | % |
| 6.000%, 10/01/2037 | | | 128,731 | | | | 140,423 | | | | 0.06 | % |
| Fannie Mae REMICS | | | | | | | | | | | | |
| Series 13-52, 1.250%, 06/25/2043 | | | 157,830 | | | | 138,552 | | | | 0.06 | % |
| Series 12-22, 2.000%, 11/25/2040 | | | 136,397 | | | | 130,301 | | | | 0.06 | % |
| Series 12-16, 2.000%, 11/25/2041 | | | 119,407 | | | | 111,833 | | | | 0.05 | % |
| Series, 10-134, 2.250%, 03/25/2039 | | | 104,508 | | | | 101,897 | | | | 0.05 | % |
| Freddie Mac Gold Pool | | | | | | | | | | | | |
| 3.000%, 05/01/2042 | | | 923,283 | | | | 882,181 | | | | 0.40 | % |
| 3.000%, 09/01/2042 | | | 1,772,138 | | | | 1,693,273 | | | | 0.77 | % |
| 3.500%, 01/01/2048 | | | 1,698,356 | | | | 1,654,836 | | | | 0.76 | % |
| 5.000%, 05/01/2020 | | | 14,371 | | | | 14,448 | | | | 0.01 | % |
| 5.500%, 04/01/2037 | | | 74,191 | | | | 80,518 | | | | 0.04 | % |
| Freddie Mac REMICS | | | | | | | | | | | | |
| Series 4146, 1.500%, 10/15/2042 | | | 95,896 | | | | 92,041 | | | | 0.04 | % |
| Series 4309, 2.000%, 10/15/2043 | | | 96,721 | | | | 91,029 | | | | 0.04 | % |
| Series 3928, 2.500%, 08/15/2040 | | | 256,956 | | | | 253,138 | | | | 0.12 | % |
| Series 3870, 2.750%, 01/15/2041 | | | 74,142 | | | | 71,558 | | | | 0.03 | % |
| Series 4016, 3.000%, 09/15/2039 | | | 299,221 | | | | 293,234 | | | | 0.13 | % |
| Series 4322, 3.000%, 05/15/2043 | | | 293,613 | | | | 288,532 | | | | 0.13 | % |
| Government National Mortgage Association, 1.750%, 02/16/2043 | | | 252,301 | | | | 229,956 | | | | 0.11 | % |
| | | | | | | | | | | | | |
| Total Mortgage Backed Securities | | | | | | | | | | | | |
| (Cost $10,649,436) | | | | | | | 10,223,630 | | | | 4.66 | % |
The accompanying notes are an integral part of these financial statements.
| HENNESSY FUNDS | 1-800-966-4354 | |
| U.S. TREASURY OBLIGATIONS – 4.27% | | Par | | | | | | % of | |
| | | Amount | | | Value | | | Net Assets | |
| U.S. Treasury Bonds – 0.43% | | | | | | | | | |
| U.S. Treasury Bonds, 3.625%, 02/15/2044 | | | 900,000 | | | $ | 934,400 | | | | 0.43 | % |
| | | | | | | | | | | | | |
| U.S. Treasury Notes – 3.84% | | | | | | | | | | | | |
| U.S. Treasury Notes | | | | | | | | | | | | |
| 2.625%, 11/15/2020 | | | 2,200,000 | | | | 2,188,742 | | | | 1.00 | % |
| 2.750%, 02/15/2024 | | | 3,000,000 | | | | 2,962,969 | | | | 1.35 | % |
| 3.625%, 08/15/2019 | | | 3,250,000 | | | | 3,273,867 | | | | 1.49 | % |
| | | | | | | | 8,425,578 | | | | 3.84 | % |
| Total U.S. Treasury Obligations | | | | | | | | | | | | |
| (Cost $9,501,752) | | | | | | | 9,359,978 | | | | 4.27 | % |
| | | | | | | | | | | | | |
| U.S. GOVERNMENT AGENCY ISSUES – 2.83% | | | | | | | | | | | | |
| | | | | | | | | | | | | |
| Fannie Mae | | | | | | | | | | | | |
| 1.500%, 08/10/2021 | | | 1,000,000 | | | | 956,038 | | | | 0.44 | % |
| 1.500%, 04/18/2028 (g) | | | 1,000,000 | | | | 993,267 | | | | 0.45 | % |
| 2.500%, 03/30/2026 (g) | | | 1,200,000 | | | | 1,193,130 | | | | 0.55 | % |
| Federal Home Loan Banks | | | | | | | | | | | | |
| 1.250%, 10/17/2031 (g) | | | 1,250,000 | | | | 1,181,805 | | | | 0.54 | % |
| 2.750%, 07/11/2031 | | | 800,000 | | | | 710,473 | | | | 0.32 | % |
| Freddie Mac | | | | | | | | | | | | |
| 2.000%, 10/27/2023 (g) | | | 1,200,000 | | | | 1,173,619 | | | | 0.53 | % |
| | | | | | | | | | | | | |
| Total U.S. Government Agency Issues | | | | | | | | | | | | |
| (Cost $6,398,673) | | | | | | | 6,208,332 | | | | 2.83 | % |
| | | | | | | | | | | | | |
| INVESTMENT COMPANIES (EXCLUDING | | | | | | | | | | | | |
| MONEY MARKET FUNDS) – 1.20% | | | | | | | | | | | | |
| | | | | | | | | | | | | |
| Apollo Investment Corp. | | | 30,270 | | | | 156,496 | | | | 0.07 | % |
| Ares Capital Corp. | | | 10,130 | | | | 173,831 | | | | 0.08 | % |
| BlackRock TCP Capital Corp. | | | 11,000 | | | | 154,000 | | | | 0.07 | % |
| FS Investment Corp. | | | 21,350 | | | | 134,291 | | | | 0.06 | % |
| Guggenheim Credit Allocation Fund | | | 34,000 | | | | 697,680 | | | | 0.32 | % |
| Hercules Capital, Inc. | | | 13,115 | | | | 164,331 | | | | 0.08 | % |
| Monroe Capital Corp. | | | 12,670 | | | | 161,036 | | | | 0.07 | % |
| New Mountain Finance Corp. | | | 12,065 | | | | 160,585 | | | | 0.07 | % |
| SPDR Barclays Capital High Yield Bond | | | 1,000 | | | | 35,160 | | | | 0.02 | % |
| SPDR Barclays Short Term High Yield | | | 4,000 | | | | 108,240 | | | | 0.05 | % |
| TPG Specialty Lending, Inc. | | | 8,965 | | | | 180,017 | | | | 0.08 | % |
| Vanguard High-Yield Corporate Fund | | | 89,820 | | | | 507,484 | | | | 0.23 | % |
| | | | | | | | | | | | | |
| Total Investment Companies (Excluding | | | | | | | | | | | | |
| Money Market Funds) | | | | | | | | | | | | |
| (Cost $2,805,706) | | | | | | | 2,633,151 | | | | 1.20 | % |
The accompanying notes are an integral part of these financial statements.
| SHORT-TERM INVESTMENTS – 0.78% | | Number | | | | | | % of | |
| | | of Shares | | | Value | | | Net Assets | |
| Money Market Funds – 0.78% | | | | | | | | | |
| Fidelity Government Portfolio, Institutional Class, 2.06% (c) | | | 1,702,921 | | | $ | 1,702,921 | | | | 0.78 | % |
| | | | | | | | | | | | | |
| Total Short-Term Investments | | | | | | | | | | | | |
| (Cost $1,702,921) | | | | | | | 1,702,921 | | | | 0.78 | % |
| | | | | | | | | | | | | |
| Total Investments | | | | | | | | | | | | |
| (Cost $192,862,413) – 99.94% | | | | | | | 219,057,140 | | | | 99.94 | % |
| Other Assets in Excess of Liabilities – 0.06% | | | | | | | 126,312 | | | | 0.06 | % |
| | | | | | | | | | | | | |
TOTAL NET ASSETS – 100.00% | | | | | | $ | 219,183,452 | | | | 100.00 | % |
Percentages are stated as a percent of net assets.
PLC – Public Limited Company
REIT – Real Estate Investment Trust
| (a) | | Non-income producing security. |
| (b) | | U.S.-traded security of a foreign corporation. |
| (c) | | The rate listed is the fund’s seven-day yield as of October 31, 2018. |
| (d) | | Investment in affiliated security. Quasar Distributors, LLC, which serves as the Fund’s distributor, is a subsidiary of U.S. Bancorp. Details of transactions with this affiliated company for the year ended October 31, 2018, are as follows: |
| | Issuer | | U.S. Bancorp | | |
| | Beginning Cost | | $ | 93,213 | | |
| | Purchase Cost | | $ | — | | |
| | Sales Cost | | $ | (13,953 | ) | |
| | Ending Cost | | $ | 79,260 | | |
| | Dividend Income | | $ | 5,068 | | |
| | Net Change in | | | | | |
| | Unrealized Appreciation | | $ | (4,882 | ) | |
| | Realized Gain/Loss | | $ | (431 | ) | |
| | Shares | | | 2,755 | | |
| | Market Value | | $ | 74,413 | | |
| (e) | | Rule 144A security. Security is exempt from registration pursuant to Rule 144A under the Securities Act of 1933, as amended. Rule 144A securities may be resold in transactions exempt from registration to qualified institutional investors. As of October 31, 2018, the market value of this security totaled $1,265,727, which represents 0.58% of net assets. |
| (f) | | Variable rate security; rate disclosed is the current rate as of October 31, 2018. |
| (g) | | Step-up bond; rate disclosed is the current rate as of October 31, 2018. |
The accompanying notes are an integral part of these financial statements.
| HENNESSY FUNDS | 1-800-966-4354 | |
Summary of Fair Value Exposure at October 31, 2018
The following is a summary of the inputs used to value the Fund’s net assets as of October 31, 2018 (See Note 3 in the accompanying notes to the financial statements):
| Common Stocks | | Level 1 | | | Level 2 | | | Level 3 | | | Total | |
| Communication Services | | $ | 8,718,562 | | | $ | — | | | $ | — | | | $ | 8,718,562 | |
| Consumer Discretionary | | | 24,616,799 | | | | — | | | | — | | | | 24,616,799 | |
| Consumer Staples | | | 10,788,248 | | | | — | | | | — | | | | 10,788,248 | |
| Energy | | | 2,642,979 | | | | — | | | | — | | | | 2,642,979 | |
| Financials | | | 31,672,070 | | | | — | | | | — | | | | 31,672,070 | |
| Health Care | | | 2,265,759 | | | | — | | | | — | | | | 2,265,759 | |
| Industrials | | | 17,509,292 | | | | — | | | | — | | | | 17,509,292 | |
| Information Technology | | | 19,036,342 | | | | — | | | | — | | | | 19,036,342 | |
| Materials | | | 10,704,503 | | | | — | | | | — | | | | 10,704,503 | |
| Total Common Stocks | | $ | 127,954,554 | | | $ | — | | | $ | — | | | $ | 127,954,554 | |
| Preferred Stocks | | | | | | | | | | | | | | | | |
| Communication Services | | $ | 106,772 | | | $ | — | | | $ | — | | | $ | 106,772 | |
| Consumer Staples | | | 185,843 | | | | — | | | | — | | | | 185,843 | |
| Energy | | | 108,839 | | | | — | | | | — | | | | 108,839 | |
| Financials | | | 3,524,064 | | | | — | | | | — | | | | 3,524,064 | |
| Utilities | | | 158,446 | | | | — | | | | — | | | | 158,446 | |
| Total Preferred Stocks | | $ | 4,083,964 | | | $ | — | | | $ | — | | | $ | 4,083,964 | |
| REITS | | | | | | | | | | | | | | | | |
| Financials | | $ | 1,480,417 | | | $ | — | | | $ | — | | | $ | 1,480,417 | |
| Total REITS | | $ | 1,480,417 | | | $ | — | | | $ | — | | | $ | 1,480,417 | |
| Corporate Bonds | | | | | | | | | | | | | | | | |
| Communication Services | | $ | — | | | $ | 4,365,430 | | | $ | — | | | $ | 4,365,430 | |
| Consumer Discretionary | | | — | | | | 2,028,345 | | | | — | | | | 2,028,345 | |
| Consumer Staples | | | — | | | | 1,337,652 | | | | — | | | | 1,337,652 | |
| Energy | | | — | | | | 5,579,919 | | | | — | | | | 5,579,919 | |
| Financials | | | — | | | | 27,360,577 | | | | — | | | | 27,360,577 | |
| Health Care | | | — | | | | 6,826,557 | | | | — | | | | 6,826,557 | |
| Industrials | | | — | | | | 992,273 | | | | — | | | | 992,273 | |
| Information Technology | | | — | | | | 2,129,011 | | | | — | | | | 2,129,011 | |
| Materials | | | — | | | | 3,757,455 | | | | — | | | | 3,757,455 | |
| Retail Trade | | | — | | | | 1,032,974 | | | | — | | | | 1,032,974 | |
| Total Corporate Bonds | | $ | — | | | $ | 55,410,193 | | | $ | — | | | $ | 55,410,193 | |
| Mortgage Backed Securities | | $ | — | | | $ | 10,223,630 | | | $ | — | | | $ | 10,223,630 | |
| U.S. Treasury Obligations | | | | | | | | | | | | | | | | |
| U.S. Treasury Bonds | | $ | — | | | $ | 934,400 | | | $ | — | | | $ | 934,400 | |
| U.S. Treasury Notes | | | — | | | | 8,425,578 | | | | — | | | | 8,425,578 | |
| Total U.S. Treasury Obligations | | $ | — | | | $ | 9,359,978 | | | $ | — | | | $ | 9,359,978 | |
| U.S. Government Agency Issues | | $ | — | | | $ | 6,208,332 | | | $ | — | | | $ | 6,208,332 | |
| Investment Companies (Excluding | | | | | | | | | | | | | | | | |
| Money Market Funds) | | $ | 2,633,151 | | | $ | — | | | $ | — | | | $ | 2,633,151 | |
| Short-Term Investments | | | | | | | | | | | | | | | | |
| Money Market Funds | | $ | 1,702,921 | | | $ | — | | | $ | — | | | $ | 1,702,921 | |
| Total Short-Term Investments | | $ | 1,702,921 | | | $ | — | | | $ | — | | | $ | 1,702,921 | |
| Total Investments | | $ | 137,855,007 | | | $ | 81,202,133 | | | $ | — | | | $ | 219,057,140 | |
The accompanying notes are an integral part of these financial statements.
| SCHEDULE OF INVESTMENTS/ STATEMENT OF ASSETS AND LIABILITIES |
Financial Statements
Statement of Assets and Liabilities as of October 31, 2018 |
| ASSETS: | | | |
| Investments in unaffiliated securities, at value (cost $192,783,153) | | $ | 218,982,727 | |
| Investments in affiliated securities, at value (cost $79,260) | | | 74,413 | |
| Total investments in securities, at value (cost $192,862,413) | | | 219,057,140 | |
| Dividends and interest receivable | | | 895,595 | |
| Receivable for fund shares sold | | | 171,398 | |
| Prepaid expenses and other assets | | | 25,819 | |
| Total Assets | | | 220,149,952 | |
| | | | | |
| LIABILITIES: | | | | |
| Payable for securities purchased | | | 109,956 | |
| Payable for fund shares redeemed | | | 573,489 | |
| Payable to advisor | | | 152,521 | |
| Payable to administrator | | | 20,033 | |
| Payable to auditor | | | 21,900 | |
| Accrued distribution fees | | | 23,447 | |
| Accrued service fees | | | 10,584 | |
| Accrued trustees fees | | | 5,962 | |
| Accrued expenses and other payables | | | 48,608 | |
| Total Liabilities | | | 966,500 | |
| NET ASSETS | | $ | 219,183,452 | |
| | | | | |
| NET ASSETS CONSIST OF: | | | | |
| Capital stock | | $ | 177,515,510 | |
| Total distributable earnings | | | 41,667,942 | |
| Total Net Assets | | $ | 219,183,452 | |
| | | | | |
| NET ASSETS | | | | |
| Investor Class: | | | | |
| Shares authorized (no par value) | | Unlimited | |
| Net assets applicable to outstanding Investor Class shares | | $ | 121,321,192 | |
| Shares issued and outstanding | | | 7,668,265 | |
| Net asset value, offering price and redemption price per share | | $ | 15.82 | |
| | | | | |
| Institutional Class: | | | | |
| Shares authorized (no par value) | | Unlimited | |
| Net assets applicable to outstanding Institutional Class shares | | $ | 97,862,260 | |
| Shares issued and outstanding | | | 6,555,993 | |
| Net asset value, offering price and redemption price per share | | $ | 14.93 | |
The accompanying notes are an integral part of these financial statements.
| HENNESSY FUNDS | 1-800-966-4354 | |
Financial Statements
Statement of Operations for the year ended October 31, 2018 |
| INVESTMENT INCOME: | | | |
| Dividend income from unaffiliated securities | | $ | 3,011,363 | |
| Dividend income from affiliated securities | | | 5,068 | |
| Interest income | | | 2,668,571 | |
| Total investment income | | | 5,685,002 | |
| | | | | |
| EXPENSES: | | | | |
| Investment advisory fees (See Note 5) | | | 1,969,709 | |
| Sub-transfer agent expenses – Investor Class (See Note 5) | | | 303,602 | |
| Sub-transfer agent expenses – Institutional Class (See Note 5) | | | 73,424 | |
| Administration, fund accounting, custody and transfer agent fees (See Note 5) | | | 232,757 | |
| Distribution fees – Investor Class (See Note 5) | | | 209,274 | |
| Service fees – Investor Class (See Note 5) | | | 139,516 | |
| Federal and state registration fees | | | 38,950 | |
| Compliance expense (See Note 5) | | | 29,501 | |
| Audit fees | | | 22,503 | |
| Reports to shareholders | | | 20,158 | |
| Trustees’ fees and expenses | | | 17,460 | |
| Legal fees | | | 454 | |
| Interest expense (See Note 7) | | | 40 | |
| Other expenses | | | 18,473 | |
| Total expenses | | | 3,075,821 | |
| NET INVESTMENT INCOME | | $ | 2,609,181 | |
| | | | | |
| REALIZED AND UNREALIZED GAINS (LOSSES): | | | | |
| Net realized gain (loss) on: | | | | |
| Unaffiliated investments | | $ | 17,839,361 | |
| Affiliated investments | | | (431 | ) |
| Net change in unrealized appreciation/depreciation on: | | | | |
| Unaffiliated investments | | | (10,478,946 | ) |
| Affiliated investments | | | (4,882 | ) |
| Net gain on investments | | | 7,355,102 | |
| NET INCREASE IN NET ASSETS RESULTING FROM OPERATIONS | | $ | 9,964,283 | |
The accompanying notes are an integral part of these financial statements.
| STATEMENT OF OPERATIONS/STATEMENTS OF CHANGES IN NET ASSETS |
Financial Statements
| Statements of Changes in Net Assets |
| | | Year Ended | | | Year Ended | |
| | | October 31, 2018 | | | October 31, 2017 | |
| OPERATIONS: | | | | | | |
| Net investment income | | $ | 2,609,181 | | | $ | 2,708,905 | |
| Net realized gain on investments | | | 17,838,930 | | | | 18,193,893 | |
| Net change in unrealized | | | | | | | | |
| appreciation/depreciation on investments | | | (10,483,828 | ) | | | 19,387,071 | |
| Net increase in net assets resulting from operations | | | 9,964,283 | | | | 40,289,869 | |
| | | | | | | | | |
| DISTRIBUTIONS TO SHAREHOLDERS FROM: | | | | | | | | |
| Distributable earnings – Investor Class | | | (8,985,666 | ) | | | (17,440,506 | ) |
| Distributable earnings – Institutional Class | | | (7,053,813 | ) | | | (11,893,937 | ) |
| Total distributions | | | (16,039,479 | ) | | | (29,334,443 | )(1) |
| | | | | | | | | |
| CAPITAL SHARE TRANSACTIONS: | | | | | | | | |
| Proceeds from shares subscribed – Investor Class | | | 7,048,624 | | | | 8,054,934 | |
| Proceeds from shares subscribed – Institutional Class | | | 13,307,380 | | | | 20,836,993 | |
| Dividends reinvested – Investor Class | | | 8,738,463 | | | | 17,017,145 | |
| Dividends reinvested – Institutional Class | | | 5,575,964 | | | | 9,255,346 | |
| Cost of shares redeemed – Investor Class | | | (46,331,304 | ) | | | (78,489,456 | ) |
| Cost of shares redeemed – Institutional Class | | | (29,143,836 | ) | | | (53,524,682 | ) |
| Net decrease in net assets derived | | | | | | | | |
| from capital share transactions | | | (40,804,709 | ) | | | (76,849,720 | ) |
| TOTAL DECREASE IN NET ASSETS | | | (46,879,905 | ) | | | (65,894,294 | ) |
| | | | | | | | | |
| NET ASSETS: | | | | | | | | |
| Beginning of year | | | 266,063,357 | | | | 331,957,651 | |
| End of year | | $ | 219,183,452 | | | $ | 266,063,357 | (2) |
| | | | | | | | | |
| CHANGES IN SHARES OUTSTANDING: | | | | | | | | |
| Shares sold – Investor Class | | | 438,224 | | | | 516,776 | |
| Shares sold – Institutional Class | | | 882,622 | | | | 1,415,138 | |
| Shares issued to holders as reinvestment | | | | | | | | |
| of dividends – Investor Class | | | 550,174 | | | | 1,128,293 | |
| Shares issued to holders as reinvestment | | | | | | | | |
| of dividends – Institutional Class | | | 371,576 | | | | 648,210 | |
| Shares redeemed – Investor Class | | | (2,885,470 | ) | | | (5,022,332 | ) |
| Shares redeemed – Institutional Class | | | (1,918,909 | ) | | | (3,644,868 | ) |
| Net decrease in shares outstanding | | | (2,561,783 | ) | | | (4,958,783 | ) |
(1) | Includes net investment income distributions of $1,353,800 and $1,431,025 and net realized gain distributions of $16,086,706 and $10,462,912 for Investor Class and Institutional Class, respectively. |
(2) | Includes accumulated net investment income of $103,437. |
The accompanying notes are an integral part of these financial statements.
| HENNESSY FUNDS | 1-800-966-4354 | |
Financial Statements
For an Investor Class share outstanding throughout each year
PER SHARE DATA:
Net asset value, beginning of year
Income from investment operations:
Net investment income
Net realized and unrealized gains (losses) on investments
Total from investment operations
Less distributions:
Dividends from net investment income
Dividends from net realized gains
Total distributions
Net asset value, end of year
TOTAL RETURN
SUPPLEMENTAL DATA AND RATIOS:
Net assets, end of period (millions)
Ratio of expenses to average net assets
Ratio of net investment income to average net assets
Portfolio turnover rate(1)
(1) | Portfolio turnover is calculated on the basis of the Fund as a whole. |
The accompanying notes are an integral part of these financial statements.
| FINANCIAL HIGHLIGHTS — INVESTOR CLASS |
| Year Ended October 31, | |
| 2018 | | | 2017 | | | 2016 | | | 2015 | | | 2014 | |
| | | | | | | | | | | | | | |
| $ | 16.24 | | | $ | 15.61 | | | $ | 16.15 | | | $ | 16.68 | | | $ | 15.77 | |
| | | | | | | | | | | | | | | | | | | |
| | | | | | | | | | | | | | | | | | | |
| | 0.16 | | | | 0.14 | | | | 0.14 | | | | 0.13 | | | | 0.16 | |
| | 0.40 | | | | 1.95 | | | | (0.16 | ) | | | 0.11 | | | | 1.41 | |
| | 0.56 | | | | 2.09 | | | | (0.02 | ) | | | 0.24 | | | | 1.57 | |
| | | | | | | | | | | | | | | | | | | |
| | | | | | | | | | | | | | | | | | | |
| | (0.14 | ) | | | (0.12 | ) | | | (0.13 | ) | | | (0.13 | ) | | | (0.16 | ) |
| | (0.84 | ) | | | (1.34 | ) | | | (0.39 | ) | | | (0.64 | ) | | | (0.50 | ) |
| | (0.98 | ) | | | (1.46 | ) | | | (0.52 | ) | | | (0.77 | ) | | | (0.66 | ) |
| $ | 15.82 | | | $ | 16.24 | | | $ | 15.61 | | | $ | 16.15 | | | $ | 16.68 | |
| | | | | | | | | | | | | | | | | | | |
| | 3.44 | % | | | 14.16 | % | | | (0.12 | )% | | | 1.43 | % | | | 10.28 | % |
| | | | | | | | | | | | | | | | | | | |
| | | | | | | | | | | | | | | | | | | |
| $ | 121.32 | | | $ | 155.33 | | | $ | 202.04 | | | $ | 292.84 | | | $ | 284.45 | |
| | 1.42 | % | | | 1.43 | % | | | 1.43 | % | | | 1.38 | % | | | 1.33 | % |
| | 0.89 | % | | | 0.78 | % | | | 0.84 | % | | | 0.83 | % | | | 1.01 | % |
| | 18 | % | | | 15 | % | | | 24 | % | | | 39 | % | | | 28 | % |
The accompanying notes are an integral part of these financial statements.
| HENNESSY FUNDS | 1-800-966-4354 | |
Financial Statements
For an Institutional Class share outstanding throughout each year
PER SHARE DATA:
Net asset value, beginning of year
Income from investment operations:
Net investment income
Net realized and unrealized gains (losses) on investments
Total from investment operations
Less distributions:
Dividends from net investment income
Dividends from net realized gains
Total distributions
Net asset value, end of year
TOTAL RETURN
SUPPLEMENTAL DATA AND RATIOS:
Net assets, end of year (millions)
Ratio of expenses to average net assets
Ratio of net investment income to average net assets
Portfolio turnover rate(1)
(1) | Portfolio turnover is calculated on the basis of the Fund as a whole. |
The accompanying notes are an integral part of these financial statements.
| FINANCIAL HIGHLIGHTS — INSTITUTIONAL CLASS |
| Year Ended October 31, | |
| 2018 | | | 2017 | | | 2016 | | | 2015 | | | 2014 | |
| | | | | | | | | | | | | | |
| $ | 15.34 | | | $ | 14.76 | | | $ | 15.28 | | | $ | 15.80 | | | $ | 14.97 | |
| | | | | | | | | | | | | | | | | | | |
| | | | | | | | | | | | | | | | | | | |
| | 0.19 | | | | 0.16 | | | | 0.18 | | | | 0.19 | | | | 0.20 | |
| | 0.39 | | | | 1.87 | | | | (0.13 | ) | | | 0.09 | | | | 1.33 | |
| | 0.58 | | | | 2.03 | | | | 0.05 | | | | 0.28 | | | | 1.53 | |
| | | | | | | | | | | | | | | | | | | |
| | | | | | | | | | | | | | | | | | | |
| | (0.20 | ) | | | (0.18 | ) | | | (0.20 | ) | | | (0.19 | ) | | | (0.20 | ) |
| | (0.79 | ) | | | (1.27 | ) | | | (0.37 | ) | | | (0.61 | ) | | | (0.50 | ) |
| | (0.99 | ) | | | (1.45 | ) | | | (0.57 | ) | | | (0.80 | ) | | | (0.70 | ) |
| $ | 14.93 | | | $ | 15.34 | | | $ | 14.76 | | | $ | 15.28 | | | $ | 15.80 | |
| | | | | | | | | | | | | | | | | | | |
| | 3.86 | % | | | 14.60 | % | | | 0.30 | % | | | 1.75 | % | | | 10.60 | % |
| | | | | | | | | | | | | | | | | | | |
| | | | | | | | | | | | | | | | | | | |
| $ | 97.86 | | | $ | 110.74 | | | $ | 129.91 | | | $ | 168.84 | | | $ | 102.10 | |
| | 1.02 | % | | | 1.05 | % | | | 1.03 | % | | | 1.04 | % | | | 1.05 | % |
| | 1.28 | % | | | 1.16 | % | | | 1.23 | % | | | 1.18 | % | | | 1.29 | % |
| | 18 | % | | | 15 | % | | | 24 | % | | | 39 | % | | | 28 | % |
The accompanying notes are an integral part of these financial statements.
| HENNESSY FUNDS | 1-800-966-4354 | |
Financial Statements
Notes to the Financial Statements October 31, 2018 |
1). ORGANIZATION
The Hennessy Equity and Income Fund (the “Fund”) is a series of Hennessy Funds Trust (the “Trust”), which was organized as a Delaware statutory trust on September 17, 1992. The Fund is an open-end management investment company registered under the Investment Company Act of 1940, as amended. The investment objective of the Fund is long-term capital growth and current income. The Fund is a diversified fund.
The Fund offers Investor Class and Institutional Class shares. Each class of shares differs principally in its respective 12b-1 distribution and service, shareholder servicing, and sub-transfer agent expenses. There are no sales charges. Each class has identical rights to earnings, assets, and voting privileges, except for class-specific expenses and exclusive rights to vote on matters affecting only an individual class.
As an investment company, the Fund follows the investment company accounting and reporting guidance of the Financial Accounting Standards Board (“FASB”) Accounting Standard Codification Topic 946 “Financial Services—Investment Companies.”
2). SIGNIFICANT ACCOUNTING POLICIES
The following is a summary of significant accounting policies consistently followed by the Fund in the preparation of the financial statements. These policies conform to U.S. generally accepted accounting principles (“GAAP”).
| a). | Securities Valuation – All investments in securities are recorded at their estimated fair value, as described in Note 3. |
| | |
| b). | Federal Income Taxes – No provision for federal income taxes or excise taxes has been made because the Fund has elected to be taxed as a regulated investment company and intends to distribute substantially all of its taxable income to its shareholders and otherwise comply with the provisions of the Internal Revenue Code of 1986, as amended, applicable to regulated investment companies. Net investment income/loss and realized gains/losses for federal income tax purposes may differ from those reported in the financial statements because of temporary book and tax basis differences. Temporary differences are primarily the result of the treatment of wash sales for tax reporting purposes. The Fund recognizes interest and penalties related to income tax benefits, if any, in the Statement of Operations as an income tax expense. Distributions from net realized gains for book purposes may include short-term capital gains, which are included as ordinary income to shareholders for tax purposes. The Fund may utilize equalization accounting for tax purposes and designate earnings and profits, including net realized gains distributed to shareholders on redemption of shares, as part of the dividends paid deduction for income tax purposes. |
| | |
| | Due to inherent differences in the recognition of income, expenses, and realized gains/losses under GAAP and federal income tax regulations, permanent differences between book and tax basis for reporting for fiscal year 2018 have been identified and appropriately reclassified in the Statement of Assets and Liabilities. The adjustments are as follows: |
| Total | |
| Distributable | |
Earnings | Capital Stock |
| $(2,443,808) | $2,443,808 |
| NOTES TO THE FINANCIAL STATEMENTS |
| c). | Accounting for Uncertainty in Income Taxes – The Fund has accounting policies regarding recognition and measurement of tax positions taken or expected to be taken on a tax return. The tax returns of the Fund for the prior three fiscal years are open for examination. The Fund has reviewed all open tax years in major jurisdictions and concluded that there is no impact on the Fund’s net assets and no tax liability resulting from unrecognized tax benefits relating to uncertain income tax positions taken or expected to be taken on a tax return. The Fund’s major tax jurisdictions are U.S. federal and Delaware. |
| | |
| d). | Income and Expenses – Dividend income is recognized on the ex-dividend date or as soon as information is available to the Fund. Interest income, which includes the amortization of premium and accretion of discount, is recognized on an accrual basis. Other non-cash dividends are recognized as investment income at the fair value of the property received. The Fund is charged for those expenses that are directly attributable to its portfolio, such as advisory, administration, and certain shareholder service fees. Income, expenses (other than expenses attributable to a specific class), and realized and unrealized gains/losses on investments are allocated to each class of shares based on such class’s net assets. |
| | |
| e). | Distributions to Shareholders – Dividends from net investment income for the Fund, if any, are declared and paid at the end of each calendar quarter. Distributions of net realized capital gains, if any, are declared and paid annually, usually in December. |
| | |
| f). | Security Transactions – Investment and shareholder transactions are recorded on the trade date. The Fund determines the realized gain/loss from an investment transaction by comparing the original cost of the security lot sold with the net sale proceeds. Discounts and premiums on securities purchased are accreted or amortized, respectively, over the life of each such security. |
| | |
| g). | Use of Estimates – The preparation of financial statements in conformity with GAAP requires management to make estimates and assumptions that affect the reported amounts of assets and liabilities and disclosure of contingent assets and liabilities at the date of the financial statements and the reported change in net assets during the reporting period. Actual results could differ from those estimates. |
| | |
| h). | Share Valuation – The net asset value (“NAV”) per share of the Fund is calculated by dividing (i) the total value of the securities held by the Fund, plus cash and other assets, minus all liabilities (including estimated accrued expenses) by (ii) the total number of shares outstanding for the Fund, rounded to the nearest cent. The Fund’s shares will not be priced on days the New York Stock Exchange is closed for trading. The offering and redemption price per share for the Fund is equal to the Fund’s NAV per share. |
| | |
| i). | New Accounting Pronouncements – In August 2018, the FASB issued Accounting Standards Update No. 2018-13 “Disclosure Framework—Changes to the Disclosure Requirements for Fair Value Measurement” (“ASU 2018-13”). ASU 2018-13 eliminates the requirement to disclose the amount of and reasons for transfers between Level 1 and Level 2 of the fair value hierarchy, the timing of transfers between levels of the fair value hierarchy, and the valuation processes for Level 3 fair value measurements. ASU 2018-13 does not eliminate the requirement to disclose the range and weighted average used to develop significant unobservable inputs for Level 3 fair value measurements, and the changes in unrealized gains and losses for recurring Level 3 fair value measurements. ASU 2018-13 requires that information is provided about the measurement uncertainty of Level 3 fair value measurements as of the reporting date. The guidance is effective for fiscal years beginning after December 15, 2019, and interim periods within those fiscal years. Management has |
| HENNESSY FUNDS | 1-800-966-4354 | |
| | evaluated the impact of this change in guidance, and due to the permissibility of early adoption, modified the Fund’s fair value disclosures for the current reporting period. |
| | |
| j). | New Rule Issuances – In August 2018, the Securities and Exchange Commission issued Final Rule Release No. 33 10532, Disclosure Update and Simplification, which in part amends certain financial statement disclosure requirements of Regulation S-X that have become redundant, duplicative, overlapping, outdated, or superseded, in light of other Commission disclosure requirements, GAAP, or changes in the information environment. The amendments are intended to facilitate the disclosure of information to investors and simplify compliance without significantly altering the total mix of information provided to investors. The amendments to Rule 6-04.17 of Regulation S-X (balance sheet) were amended to require presentation of the total, rather than the components of net assets, of distributable earnings on the balance sheet. Consistent with GAAP, funds will be required to disclose total distributable earnings. The amendments to Rule 6-09 of Regulation S-X (statement of changes in net assets) omit the requirement to separately state the sources of distributions paid as well as omit the requirement to parenthetically state the book basis amount of undistributed net investment income. Instead, consistent with GAAP, funds will be required to disclose the total amount of distributions paid, except that any tax return of capital must be separately disclosed. The requirements of the Final Rule Release are effective November 5, 2018 and the Fund’s Statement of Assets and Liabilities and the Statement of Changes in Net Assets for the current and prior reporting period have been modified accordingly. |
3). SECURITIES VALUATION
The Fund follows fair valuation accounting standards that establish an authoritative definition of fair value and set out a hierarchy for measuring fair value. These standards require additional disclosures about the various inputs and valuation techniques used to develop the measurements of fair value and a discussion of changes in valuation techniques and related inputs during the period. These inputs are summarized in the three broad levels listed below:
| | Level 1 – | Unadjusted, quoted prices in active markets for identical instruments that the Fund has the ability to access at the date of measurement. |
| | | |
| | Level 2 – | Other significant observable inputs (including, but not limited to, quoted prices in active markets for similar instruments, quoted prices in markets that are not active for identical or similar instruments, and model-derived valuations in which all significant inputs and significant value drivers are observable in active markets, such as interest rates, prepayment speeds, credit risk curves, default rates, and similar data). |
| | | |
| | Level 3 – | Significant unobservable inputs (including the Fund’s own assumptions about what market participants would use to price the asset or liability based on the best available information) when observable inputs are unavailable. |
Following is a description of the valuation techniques applied to the Fund’s major categories of assets and liabilities measured at fair value on a recurring basis.
| | Equity Securities – Equity securities, including common stocks, preferred stocks, foreign-issued common stocks, exchange-traded funds, closed-end mutual funds, partnerships, rights, and real estate investment trusts, that are traded on a securities exchange for which a last-quoted sales price is readily available will generally be valued at the last sales price as reported by the primary exchange on which the securities are listed. Securities listed on The NASDAQ Stock Market (“NASDAQ”) |
| NOTES TO THE FINANCIAL STATEMENTS |
| | will generally be valued at the NASDAQ Official Closing Price, which may differ from the last sales price reported. Securities traded on a securities exchange for which a last-quoted sales price is not readily available will generally be valued at the mean between the bid and ask prices. To the extent these securities are actively traded and valuation adjustments are not applied, they are classified in Level 1 of the fair value hierarchy. Securities traded on foreign exchanges generally are not valued at the same time the Fund calculates its NAV because most foreign markets close well before such time. The earlier close of most foreign markets gives rise to the possibility that significant events, including broad market moves, may have occurred in the interim. In certain circumstances, it may be determined that a foreign security needs to be fair valued because it appears that the value of the security might have been materially affected by events occurring after the close of the market in which the security is principally traded, but before the time the Fund calculates its NAV, such as by a development that affects an entire market or region (e.g., a weather-related event) or a potentially global development (e.g., a terrorist attack that may be expected to have an effect on investor expectations worldwide). |
| | |
| | Registered Investment Companies – Investments in open-end registered investment companies, commonly referred to as mutual funds, are generally priced at the ending NAV provided by the applicable mutual fund’s service agent and will be classified in Level 1 of the fair value hierarchy. |
| | |
| | Debt Securities – Debt securities, including corporate bonds, asset-backed securities, mortgage-backed securities, municipal bonds, U.S. Treasuries, and U.S. government agency issues, are generally valued at market on the basis of valuations furnished by an independent pricing service that utilizes both dealer-supplied valuations and formula-based techniques. The pricing service may consider recently executed transactions in securities of the issuer or comparable issuers, market price quotations (where observable), bond spreads, and fundamental data relating to the issuer. In addition, the model may incorporate observable market data, such as reported sales of similar securities, broker quotes, yields, bids, offers, and reference data. Certain securities are valued primarily using dealer quotations. These securities are generally classified in Level 2 of the fair value hierarchy. |
| | |
| | Short-Term Securities – Short-term equity investments, including money market funds, are valued in the manner specified above. Short-term debt investments with an original term to maturity of 60 days or less are valued at amortized cost, which approximates fair market value. If the original term to maturity of a short-term debt investment exceeded 60 days, then the values as of the 61st day prior to maturity are amortized. Amortized cost is not used if its use would be inappropriate due to credit or other impairments of the issuer, in which case the security’s fair value would be determined, as described below. Short-term securities are generally classified in Level 1 or Level 2 of the fair market hierarchy depending on the inputs used and market activity levels for specific securities. |
The Board of Trustees of the Fund (the “Board”) has adopted fair value pricing procedures that are followed when a price for a security is not readily available or if a significant event has occurred that indicates the closing price of a security no longer represents the true value of that security. Fair value pricing determinations are made in good faith in accordance with these procedures. There are numerous criteria that will be given consideration in determining a fair value of a security, such as the trading volume of a security and markets, the values of other similar securities, and news events with direct bearing on a security or markets. Fair value pricing results in an estimated price for a
| HENNESSY FUNDS | 1-800-966-4354 | |
security that reflects the amount the Fund might reasonably expect to receive in a current sale. Depending on the relative significance of the valuation inputs, these securities may be classified in either Level 2 or Level 3 of the fair value hierarchy.
The fair valuation of foreign securities may be determined with the assistance of a pricing service using correlations between the movement of prices of such securities and indices of domestic securities and other appropriate indicators, such as closing market prices of relevant American Depositary Receipts or futures contracts. The effect of using fair value pricing is that the Fund’s NAV will reflect the affected portfolio securities’ values as determined by the Board or its designee, pursuant to the fair value pricing procedures adopted by the Board, instead of being determined by the market. Using a fair value pricing methodology to price a foreign security may result in a value that is different from such foreign security’s most recent closing price and from the value used by other investment companies to calculate their NAVs. Such securities are generally classified in Level 2 of the fair valuation hierarchy. Because the Fund may invest in foreign securities, the value of the Fund’s portfolio securities may change on days when you will not be able to purchase or redeem your shares.
The Board has delegated day-to-day valuation matters to a Valuation Committee comprised of one or more representatives from Hennessy Advisors, Inc., the Fund’s investment advisor (the “Advisor”). The function of the Valuation Committee is to value securities where current and reliable market quotations are not readily available. All actions taken by the Valuation Committee are reviewed by the Board.
The Fund has performed an analysis of all existing investments to determine the significance and character of all inputs to their fair value determinations. Various inputs are used to determine the value of the Fund’s investments. The inputs or methodology used for valuing securities are not necessarily an indication of the risk associated with investing in those securities. Details related to the fair valuation hierarchy of the Fund’s securities as of October 31, 2018, are included in the Schedule of Investments.
4). INVESTMENT TRANSACTIONS
Purchases and sales of investment securities (excluding government and short-term investments) for the Fund during fiscal year 2018 were $32,659,272 and $87,242,972, respectively.
Purchases and sales/maturities of long-term U.S. government securities for the Fund during fiscal year 2018 were $11,940,605 and $9,903,857, respectively.
The Fund is permitted to purchase or sell securities from or to another fund in the Hennessy Funds family of funds (the “Hennessy Funds”) under specified conditions outlined in procedures adopted by the Board. The procedures have been designed to ensure that any purchase or sale of securities by the Fund from or to another Hennessy Fund complies with Rule 17a-7 of the Investment Company Act of 1940, as amended. During fiscal year 2018, the Fund did not engage in purchases or sales of securities pursuant to Rule 17a-7 of the Investment Company Act of 1940, as amended.
5). INVESTMENT ADVISORY FEE AND OTHER TRANSACTIONS WITH AFFILIATES
The Advisor provides the Fund with investment advisory services under an Investment Advisory Agreement. The Advisor oversees the provision of investment advice and furnishes office space and facilities, as well as most of the personnel needed by the Fund. As compensation for its services, the Advisor is entitled to a monthly fee from the Fund. The fee is based upon the average daily net assets of the Fund at an annual rate of 0.80%. The net investment advisory fees expensed by the Fund during fiscal year 2018 are included in the Statement of Operations.
| NOTES TO THE FINANCIAL STATEMENTS |
The Advisor has delegated the day-to-day management of the equity allocation of the Fund to The London Company of Virginia, LLC and has delegated the day-to-day management of the fixed income allocation of the Fund to Financial Counselors, Inc. The Advisor pays the sub-advisory fees from its own assets, and these fees are not an additional expense of the Fund. For the most recent fiscal year, the Advisor (not the Fund) paid a sub-advisory fee, based upon the daily net assets of the Fund, at the rate of 0.33% for the equity allocation and 0.27% for the fixed income allocation.
The Board has approved a Shareholder Servicing Agreement for Investor Class shares of the Fund, which was instituted to compensate the Advisor for the non-investment advisory services it provides to the Fund. The Shareholder Servicing Agreement provides for a monthly fee paid to the Advisor at an annual rate of 0.10% of the average daily net assets of the Fund attributable to Investor Class shares. The shareholder service fees expensed by the Fund during fiscal year 2018 are included in the Statement of Operations.
The Fund has adopted a plan pursuant to Rule 12b-1 under the Investment Company Act of 1940, as amended, that authorizes payments in connection with the distribution of the Fund’s shares at an annual rate of up to 0.25% of the Fund’s average daily net assets attributable to Investor Class shares. Even though the authorized rate is up to 0.25%, the Fund is currently only using up to 0.15% of its average daily net assets attributable to Investor Class shares for such purpose. Amounts paid under the plan may be spent on any activities or expenses primarily intended to result in the sale of shares, including, but not limited to, advertising, shareholder account servicing, printing and mailing of prospectuses to other than current shareholders, printing and mailing of sales literature, and compensation for sales and marketing activities or to financial institutions and others, such as dealers and distributors. The distribution fees expensed by the Fund during fiscal year 2018 are included in the Statement of Operations.
The Fund has entered into agreements with various brokers, dealers, and financial intermediaries in connection with the sale of shares of the Fund. The agreements provide for periodic payments by the Fund to the brokers, dealers, and financial intermediaries for providing certain shareholder maintenance services (sub-transfer agent expenses). These shareholder services include the pre-processing and quality control of new accounts, shareholder correspondence, answering customer inquiries regarding account status, and facilitating shareholder telephone transactions. The sub-transfer agent fees expensed by the Fund during fiscal year 2018 are included in the Statement of Operations.
U.S. Bancorp Fund Services, LLC, d/b/a U.S. Bank Global Fund Services (“Fund Services”) provides the Fund with administrative, fund accounting, and transfer agent services. As administrator, Fund Services is responsible for activities such as (i) preparing various federal and state regulatory filings, reports, and returns for the Fund, (ii) preparing reports and materials to be supplied to the Board, (iii) monitoring the activities of the Fund’s custodian, transfer agent, and accountants, and (iv) coordinating the preparation and payment of the Fund’s expenses and reviewing the Fund’s expense accruals. U.S. Bank N.A., an affiliate of Fund Services, serves as the Fund’s custodian. The servicing agreements between the Trust and Fund Services and U.S. Bank N.A. contain a fee schedule that is inclusive of administrative, fund accounting, custody, and transfer agent fees. The administrative, fund accounting, custody, and transfer agent fees expensed by the Fund during fiscal year 2018 are included in the Statement of Operations.
Quasar Distributors, LLC acts as the Fund’s principal underwriter in a continuous public offering of the Fund’s shares. Quasar Distributors, LLC is an affiliate of Fund Services and U.S. Bank N.A.
| HENNESSY FUNDS | 1-800-966-4354 | |
The officers of the Fund are affiliated with the Advisor. Such officers, with the exception of the Chief Compliance Officer and the Senior Compliance Officer, receive no compensation from the Fund for serving in their respective roles. The Fund, along with the other Hennessy Funds, makes reimbursement payments, on an equal basis, to the Advisor for a portion of the salary and benefits associated with the office of the Chief Compliance Officer and for all of the salary and benefits associated with the office of the Senior Compliance Officer. The compliance fees expensed by the Fund during fiscal year 2018 are included in the Statement of Operations.
6). GUARANTEES AND INDEMNIFICATIONS
Under the Hennessy Funds’ organizational documents, their officers and trustees are indemnified by the Hennessy Funds against certain liabilities arising out of the performance of their duties to the Hennessy Funds. Additionally, in the normal course of business, the Hennessy Funds enter into contracts with service providers that contain general indemnification clauses. The Fund’s maximum exposure under these arrangements is unknown as this would involve future claims that may be made against the Fund that have not yet occurred. Currently, the Fund expects the risk of loss to be remote.
7). LINE OF CREDIT
The Fund has an uncommitted line of credit with the other Hennessy Funds in the amount of the lesser of (i) $100,000,000 or (ii) 33.33% of each Hennessy Fund’s net assets, or 30% for the Hennessy Gas Utility Fund and 10% for the Hennessy Balanced Fund, intended to provide short-term financing, if necessary, subject to certain restrictions, in connection with shareholder redemptions. The credit facility is with the Hennessy Funds’ custodian bank, U.S. Bank N.A. Borrowings under this arrangement bear interest at the bank’s prime rate and are secured by all of the Fund’s assets (as to its own borrowings only). During fiscal year 2018, the Fund had an outstanding average daily balance and a weighted average interest rate of $937 and 4.25%, respectively. The interest expensed by the Fund during fiscal year 2018 is included in the Statement of Operations. The maximum amount outstanding for the Fund during fiscal year 2018 was $342,000. As of October 31, 2018, the Fund did not have any borrowings outstanding under the line of credit.
8). FEDERAL TAX INFORMATION
As of October 31, 2018, the components of accumulated earnings (losses) for income tax purposes were as follows:
| | | | Investments | |
| | Cost of investments for tax purposes | | $ | 192,870,478 | |
| | Gross tax unrealized appreciation | | $ | 30,737,666 | |
| | Gross tax unrealized depreciation | | | (4,551,004 | ) |
| | Net tax unrealized appreciation/(depreciation) | | $ | 26,186,662 | |
| | Undistributed ordinary income | | $ | 240,336 | |
| | Undistributed long-term capital gains | | | 15,240,944 | |
| | Total distributable earnings | | $ | 15,481,280 | |
| | Other accumulated gain/(loss) | | $ | — | |
| | Total accumulated gain/(loss) | | $ | 41,667,942 | |
The difference between book-basis unrealized appreciation/depreciation (as shown in the Statement of Assets and Liabilities) and tax-basis unrealized appreciation/depreciation (as shown above) is attributable primarily to wash sales.
As of October 31, 2018, the Fund had no tax basis capital losses to offset future capital gains.
| NOTES TO THE FINANCIAL STATEMENTS |
As of October 31, 2018, the Fund did not defer, on a tax basis, any late-year ordinary losses. Late-year ordinary losses are net ordinary losses incurred after December 31, 2017, but within the taxable year, that are deemed to arise on the first day of the Fund’s next taxable year.
During fiscal year 2018 and fiscal year 2017, the tax character of distributions paid by the Fund was as follows:
| | | Year Ended | | | Year Ended | |
| | | October 31, 2018 | | | October 31, 2017 | |
Ordinary income(1) | | $ | 2,623,910 | | | $ | 2,761,400 | |
| Long-term capital gain | | | 13,415,569 | | | | 26,573,043 | |
| | | $ | 16,039,479 | | | $ | 29,334,443 | |
(1) Ordinary income includes short-term capital gains.
9). EVENTS SUBSEQUENT TO YEAR END
Management has evaluated the Fund’s related events and transactions that occurred subsequent to October 31, 2018, through the date of issuance of the Fund’s financial statements. Other than as disclosed below, management has determined that there were no subsequent events requiring recognition or disclosure in the financial statements.
On December 7, 2018, capital gains were declared and paid to shareholders of record on December 6, 2018, as follows:
| | Long-term | Short-term |
| Investor Class | $1.12438 | $0.00988 |
| Institutional Class | $1.06068 | $0.00932 |
On December 27, 2018, income distributions were declared and paid to shareholders of record on December 26, 2018, as follows:
| Investor Class | $0.03033943 | |
| Institutional Class | $0.05691292 | |
| HENNESSY FUNDS | 1-800-966-4354 | |
Report of Independent Registered Public
Accounting Firm
To the Board of Trustees of Hennessy Funds Trust
and the shareholders of Hennessy Equity and Income Fund
Novato, CA
Opinion on the Financial Statements
We have audited the accompanying statement of assets and liabilities of Hennessy Equity and Income Fund (the “Fund”), a series of Hennessy Funds Trust, including the schedule of investments, as of October 31, 2018, the related statement of operations for the year then ended, the statements of changes in net assets for each of the two years in the period then ended, financial highlights for each of the five years in the period then ended, and the related notes (collectively referred to as the “financial statements”). In our opinion, the financial statements present fairly, in all material respects, the financial position of the Fund as of October 31, 2018, the results of its operations for the year then ended, the changes in its net assets for each of the two years in the period then ended, and the financial highlights for each of the five years in the period then ended, in conformity with accounting principles generally accepted in the United States of America.
Basis for Opinion
These financial statements are the responsibility of the Fund’s management. Our responsibility is to express an opinion on the Fund’s financial statements based on our audits. We are a public accounting firm registered with the Public Company Accounting Oversight Board (United States) (“PCAOB”) and are required to be independent with respect to the Fund in accordance with the U.S. federal securities laws and the applicable rules and regulations of the Securities and Exchange Commission and the PCAOB. We have served as the auditor of one or more of the funds in the Trust since 2002.
We conducted our audits in accordance with the standards of the PCAOB. Those standards require that we plan and perform the audit to obtain reasonable assurance about whether the financial statements are free of material misstatement, whether due to error or fraud. The Fund is not required to have, nor were we engaged to perform, an audit of its internal control over financial reporting. As part of our audits we are required to obtain an understanding of internal control over financial reporting, but not for the purpose of expressing an opinion on the effectiveness of the Fund’s internal control over financial reporting. Accordingly, we express no such opinion.
Our audits included performing procedures to assess the risks of material misstatement of the financial statements, whether due to error or fraud, and performing procedures that respond to those risks. Such procedures included examining, on a test basis, evidence regarding the amounts and disclosures in the financial statements. Our audits also included evaluating the accounting principles used and significant estimates made by management, as well as evaluating the overall presentation of the financial statements. Our procedures included confirmation of securities owned as of October 31, 2018 by correspondence with the custodian and brokers; when replies were not received from brokers, we performed other auditing procedures. We believe that our audits provide a reasonable basis for our opinion.
TAIT, WELLER & BAKER LLP
Philadelphia, Pennsylvania
December 27, 2018
| REPORT OF INDEPENDENT REGISTERED PUBLIC ACCOUNTING FIRM/TRUSTEES AND OFFICERS |
Trustees and Officers of the Fund (Unaudited)
The business and affairs of the Funds are managed under the direction of the Board of Trustees of the Trust, and the Board of Trustees elects the Officers of the Trust. Beginning in March 2015, the Board of Trustees has from time to time appointed advisers to the Board of Trustees (“Advisers”) with the intention of having qualified individuals serve in an advisory capacity in order to garner experience in the mutual fund and asset management industry and be considered as potential Trustees in the future. There are currently three Advisers: Brian Alexander, Doug Franklin, and Claire Knoles. As Advisers, Mr. Alexander, Mr. Franklin, and Ms. Knoles attend meetings of the Board of Trustees and act as non-voting participants. Information pertaining to the Trustees, Advisers, and the Officers of the Trust is set forth below. The Trustees and Officers serve until their successors are duly elected and qualified or until their earlier death, resignation, or removal. Each Trustee oversees the 16 Hennessy Funds. Unless otherwise indicated, the address of all persons listed below is 7250 Redwood Boulevard, Suite 200, Novato, CA 94945. The Fund’s Statement of Additional Information includes more information about the persons listed below and is available, without charge, upon request by calling 1-800-966-4354.
| | | | Other |
| | | | Directorships |
| | | | Held Outside |
| Name, (Year of Birth), | | | of Fund |
| and Position Held | Start Date | Principal Occupation(s) | Complex During |
with the Trust | of Service | During Past Five Years | Past Five Years(1) |
| | |
| Disinterested Trustees and Advisers | |
| | | | |
| J. Dennis DeSousa | January 1996 | Mr. DeSousa is a real estate investor. | None. |
| (1936) | | | |
| Trustee | | | |
| | | | |
| Robert T. Doyle | January 1996 | Mr. Doyle has been the Sheriff of | None. |
| (1947) | | Marin County, California since 1996. | |
| Trustee | | | |
| | | | |
| Gerald P. Richardson | May 2004 | Mr. Richardson is an independent | None. |
| (1945) | | consultant in the securities industry. | |
| Trustee | | | |
| | | | |
| Brian Alexander | March 2015 | Mr. Alexander has worked for the | None. |
| (1981) | | Sutter Health organization since | |
| Adviser to the Board | | 2011 in various positions. He has | |
| | | served as the Chief Executive Officer | |
| | | of the Sutter Roseville Medical | |
| | | Center since 2018. From 2016 through | |
| | | 2018, he served as the Vice President | |
| | | of Strategy for the Sutter Health Valley | |
| | | Area, which includes 11 hospitals, | |
| | | 13 ambulatory surgery centers, | |
| | | 16,000 employees, and 1,900 physicians. | |
| | | From 2013 through 2016, Mr. Alexander | |
| | | served as Sutter Novato Community | |
| | | Hospital’s Chief Administrative Officer, | |
| | | and from 2011 through 2012, he | |
| | | served as a Director of Strategy | |
| | | within Sutter’s West Bay Region. | |
| HENNESSY FUNDS | 1-800-966-4354 | |
| | | | Other |
| | | | Directorships |
| | | | Held Outside |
| Name, (Year of Birth), | | | of Fund |
| and Position Held | Start Date | Principal Occupation(s) | Complex During |
with the Trust | of Service | During Past Five Years | Past Five Years(1) |
| | | | |
| Doug Franklin | March 2016 | Mr. Franklin is a retired insurance | None. |
| (1964) | | industry executive. From 1987 | |
| Adviser to the Board | | through 2015, he was employed | |
| | | by the Allianz-Fireman’s Fund | |
| | | Insurance Company in various | |
| | | positions, including as its Chief | |
| | | Actuary and Chief Risk Officer. | |
| | | | |
| Claire Knoles | December 2015 | Ms. Knoles is a founder of Kiosk and | None. |
| (1974) | | has served as its Chief Operating | |
| Adviser to the Board | | Officer since 2004. Kiosk is a full | |
| | | service marketing agency with | |
| | | offices in the San Francisco Bay | |
| | | Area, Toronto, and Liverpool, UK. | |
| | | | |
Interested Trustee(2) | | | |
| | | | |
| Neil J. Hennessy | January 1996 as | Mr. Neil Hennessy has been employed | Hennessy |
| (1956) | a Trustee and | by Hennessy Advisors, Inc. since | Advisors, Inc. |
| Trustee, Chairman of | June 2008 as | 1989 and currently serves as its | |
| the Board, Chief | an Officer | Chairman and Chief Executive Officer. | |
| Investment Officer, | | | |
| Portfolio Manager, | | | |
| and President | | | |
| Name, (Year of Birth), | | |
| and Position Held | Start Date | Principal Occupation(s) |
with the Trust | of Service | During Past Five Years |
| | | |
| Officers | | |
| | | |
| Teresa M. Nilsen | January 1996 | Ms. Nilsen has been employed by Hennessy Advisors, Inc. |
| (1966) | | since 1989 and currently serves as its President, Chief Operating |
| Executive Vice President | | Officer, and Secretary. |
| and Treasurer | | |
| | | |
| Daniel B. Steadman | March 2000 | Mr. Steadman has been employed by Hennessy Advisors, Inc. |
| (1956) | | since 2000 and currently serves as its Executive Vice President. |
| Executive Vice President | | |
| and Secretary | | |
| | | |
| Brian Carlson | December 2013 | Mr. Carlson has been employed by Hennessy Advisors, Inc. |
| (1972) | | since December 2013 and currently serves as its Chief |
| Senior Vice President | | Compliance Officer and Senior Vice President. |
| and Head of Distribution | | |
| | | |
| Jennifer Cheskiewicz | June 2013 | Ms. Cheskiewicz has been employed by Hennessy Advisors, Inc. |
(1977)(3) | | as its General Counsel since June 2013. |
| Senior Vice President and | | |
| Chief Compliance Officer | | |
| TRUSTEES AND OFFICERS OF THE FUND |
| Name, (Year of Birth), | | |
| and Position Held | Start Date | Principal Occupation(s) |
with the Trust | of Service | During Past Five Years |
| | | |
| David Ellison | October 2012 | Mr. Ellison has been employed by Hennessy Advisors, Inc. since |
(1958)(4) | | October 2012. He has served as a Portfolio Manager of the |
| Senior Vice President | | Hennessy Large Cap Financial Fund and the Hennessy Small |
| and Portfolio Manager | | Cap Financial Fund since inception. Mr. Ellison also served as a |
| | | Portfolio Manager of the Hennessy Technology Fund from its |
| | | inception until February 2017. Mr. Ellison served as Director, |
| | | CIO and President of FBR Fund Advisers, Inc. from December |
| | | 1999 to October 2012. |
| | | |
| Ryan C. Kelley | March 2013 | Mr. Kelley has been employed by Hennessy Advisors, Inc. since |
(1972)(5) | | October 2012. He has served as a Portfolio Manager of the |
| Senior Vice President | | Hennessy Gas Utility Fund, the Hennessy Large Cap Financial |
| and Portfolio Manager | | Fund, and the Hennessy Small Cap Financial Fund since |
| | | October 2014. He served as Co-Portfolio Manager of the same |
| | | funds from March 2013 through September 2014, and as a |
| | | Portfolio Analyst for the Hennessy Funds from October 2012 |
| | | through February 2013. Mr. Kelley has also served as a Portfolio |
| | | Manager of the Hennessy Cornerstone Growth Fund, the |
| | | Hennessy Cornerstone Mid Cap 30 Fund, the Hennessy |
| | | Cornerstone Large Growth Fund, and the Hennessy |
| | | Cornerstone Value Fund since February 2017, as a Co-Portfolio |
| | | Manager of the Hennessy Technology Fund since February |
| | | 2017, and as a Portfolio Manager of the Hennessy Total Return |
| | | Fund and the Hennessy Balanced Fund since May 2018. |
| | | Mr. Kelley served as Portfolio Manager of FBR Fund Advisers, |
| | | Inc. from January 2008 to October 2012. |
| | | |
| Tania Kelley | October 2003 | Ms. Kelley has been employed by Hennessy Advisors, Inc. |
| (1965) | | since October 2003. |
| Senior Vice President | | |
| and Head of Marketing | | |
| Daniel P. Hennessy | December 2016 | Mr. Daniel Hennessy has been employed by Hennessy Advisors, |
| (1990) | | Inc. since 2015. He has served as an Associate Analyst or |
| Vice President | | Analyst of the Hennessy Technology Fund since February 2017. |
| and Analyst | | Mr. Daniel Hennessy previously served as a Mutual Fund |
| | | Specialist at U.S. Bancorp Fund Services, LLC (now doing |
| | | business as U.S. Bank Global Fund Services) from November |
| | | 2014 to July 2015. Prior to that, he attended the University of |
| | | San Diego, where he earned a degree in Political Science. |
_______________
(1) | Messrs. DeSousa, Doyle, N. Hennessy, and Richardson previously served on the Board of Directors of Hennessy Mutual Funds, Inc. (“HMFI”), The Hennessy Funds, Inc. (“HFI”), and Hennessy SPARX Funds Trust (“HSFT”). Pursuant to an internal reorganization effective as of February 28, 2014, the series of HFMI, HFI, and HSFT were reorganized into corresponding series of the Trust that mirrored them. Subsequent to the reorganization, HFMI, HFI, and HSFT were dissolved. |
(2) | Mr. N. Hennessy is considered an “interested person,” as defined in the Investment Company Act of 1940, as amended, because he is an officer of the Hennessy Funds. |
(3) | The address of this officer is 4800 Bee Caves Road, Suite 100, Austin, TX 78746. |
(4) | The address of this officer is 101 Federal Street, Suite 1900, Boston, MA 02110. |
(5) | The address of this officer is 1340 Environ Way, Suite 332, Chapel Hill, NC 27517. |
| HENNESSY FUNDS | 1-800-966-4354 | |
Expense Example (Unaudited)
October 31, 2018
As a shareholder of the Fund, you incur ongoing costs, including management fees, service fees, and other Fund expenses. This Example is intended to help you understand your ongoing costs (in dollars) of investing in the Fund and to compare these costs with the ongoing costs of investing in other mutual funds. The Example is based on an investment of $1,000 invested at the beginning of the period and held for the entire period from May 1, 2018, through October 31, 2018.
Actual Expenses
The first line of the table below under the “Investor Class” and “Institutional Class” headings provides information about actual account values and actual expenses. Although the Fund charges no sales loads or transaction fees, you will be assessed fees for outgoing wire transfers, returned checks and stop payment orders at prevailing rates charged by U.S. Bank Global Fund Services, the Fund’s transfer agent. If you request that a redemption be made by wire transfer, currently a $15 fee is charged by the Fund’s transfer agent. IRA accounts will be charged a $15 annual maintenance fee. The example below includes, but is not limited to, management fees, shareholder servicing fees, fund accounting, custody, and transfer agent fees. However, the example below does not include portfolio trading commissions and related expenses, and other extraordinary expenses as determined under generally accepted accounting principles. You may use the information in this line, together with the amount you invested, to estimate the expenses that you paid over the period. Simply divide your account value by $1,000 (for example, an $8,600 account value divided by $1,000 = 8.6), then multiply the result by the number in the first line of the table under the “Investor Class” or “Institutional Class” headings in the column entitled “Expenses Paid During Period” to estimate the expenses you paid on your account during this period.
Hypothetical Example for Comparison Purposes
The second line of the table below under the “Investor Class” and “Institutional Class” headings provides information about hypothetical account values and hypothetical expenses based on the Fund’s actual expense ratios and an assumed rate of return of 5% per year before expenses, which is not the Fund’s actual return. The hypothetical account values and expenses may not be used to estimate the actual ending account balance or expenses you paid for the period. You may use this information to compare the ongoing costs of investing in the Fund and other funds. To do so, compare this 5% hypothetical example with the 5% hypothetical examples that appear in the shareholder reports of the other funds. Please note that the expenses shown in the table are meant to highlight your ongoing costs only. Therefore, the second line of the table under the “Investor Class” and “Institutional Class” headings is useful in comparing ongoing costs only, and will not help you determine the relative total costs of owning different funds.
| | | | Expenses Paid |
| | Beginning | Ending | During Period(1) |
| | Account Value | Account Value | May 1, 2018 – |
| | May 1, 2018 | October 31, 2018 | October 31, 2018 |
| Investor Class | | | |
| Actual | $1,000.00 | $1,021.50 | $7.18 |
| Hypothetical (5% return before expenses) | $1,000.00 | $1,018.10 | $7.17 |
| | | | |
| Institutional Class | | | |
| Actual | $1,000.00 | $1,023.70 | $5.15 |
| Hypothetical (5% return before expenses) | $1,000.00 | $1,020.11 | $5.14 |
(1) | Expenses are equal to the Fund’s annualized expense ratio of 1.41% for Investor Class shares or 1.01% for Institutional Class shares, as applicable, multiplied by the average account value over the period, multiplied by 184/365 days (to reflect one-half year period). |
| HENNESSY FUNDS | 1-800-966-4354 | |
How to Obtain a Copy of the Fund’s
Proxy Voting Policy and Proxy Voting Records
A description of the policies and procedures the Fund uses to determine how to vote proxies relating to portfolio securities is available without charge: (1) by calling 1-800-966-4354; (2) on the Hennessy Funds’ website at www.hennessyfunds.com/proxy-voting/voting-policy; or (3) on the U.S. Securities and Exchange Commission’s (the “SEC”) website at www.sec.gov. The Fund’s proxy voting record is available without charge on both the Hennessy Funds’ website at www.hennessyfunds.com/proxy-voting/voting-record and the SEC’s website at www.sec.gov no later than August 31 for the prior 12 months ending June 30.
Quarterly Filings on Form N-Q
The Fund files a complete schedule of portfolio holdings with the SEC for the first and third quarters of each fiscal year on Form N-Q. The Fund’s Forms N-Q are available on the SEC’s website at www.sec.gov. Information included in the Fund’s Forms N-Q will also be available upon request by calling 1-800-966-4354.
Federal Tax Distribution Information
(Unaudited)
For fiscal year 2018, certain dividends paid by the Fund may be subject to a maximum tax rate of 23.8%, as provided for by the Jobs and Growth Tax Relief Reconciliation Act of 2003. The percentage of dividends declared from ordinary income designated as qualified dividend income was 100.00%.
For corporate shareholders, the percent of ordinary income distributions that qualified for the corporate dividends received deduction for fiscal year 2018 was 100.00%.
The percentage of taxable ordinary income distributions that were designated as short-term capital gain distributions under Section 871(k)(2)(C) of the Internal Revenue Code of 1986, as amended, for the Fund was 0.00%.
Important Notice Regarding Delivery
of Shareholder Documents
To help keep the Fund’s costs as low as possible, we generally deliver a single copy of shareholder reports, proxy statements, and prospectuses to shareholders who share an address and have the same last name. This process does not apply to account statements. You may request an individual copy of a shareholder document at any time. If you would like to receive separate mailings of shareholder documents, please call U.S. Bank Global Fund Services at 1-800-261-6950 or 1-414-765-4124, and individual delivery will begin within 30 days of your request. If your account is held through a financial institution or other intermediary, please contact such intermediary directly to request individual delivery.
| PROXY VOTING — PRIVACY POLICY |
Privacy Policy
We collect the following non-public personal information about you:
| | • | information we receive from you on or in applications or other forms, correspondence, or conversations, including, but not limited to, your name, address, phone number, social security number, assets, income, and date of birth; and |
| | | |
| | • | information about your transactions with us, our affiliates, or others, including, but not limited to, your account number and balance, payment history, parties to transactions, cost basis information, and other financial information. |
We do not disclose any non-public personal information about our current or former shareholders to non-affiliated third parties, except as permitted by law. For example, we are permitted by law to disclose all of the information we collect, as described above, to our Transfer Agent to process your transactions. Furthermore, we restrict access to your non-public personal information to those persons who require such information to provide products or services to you. We maintain physical, electronic, and procedural safeguards that comply with federal standards to guard your non-public personal information.
In the event that you hold shares of the Fund through a financial intermediary, including, but not limited to, a broker-dealer, bank, or trust company, the privacy policy of your financial intermediary would govern how your non-public personal information will be shared with non-affiliated third parties.
| HENNESSY FUNDS | 1-800-966-4354 | |
For information, questions or assistance, please call
The Hennessy Funds
1-800-966-4354 or 1-415-899-1555
INVESTMENT ADVISOR
Hennessy Advisors, Inc.
7250 Redwood Boulevard, Suite 200
Novato, California 94945
ADMINISTRATOR,
TRANSFER AGENT,
DIVIDEND PAYING AGENT, &
SHAREHOLDER SERVICING AGENT
U.S. Bancorp Fund Services, LLC
d/b/a U.S. Bank Global Fund Services
P.O. Box 701
Milwaukee, Wisconsin 53201-0701
CUSTODIAN
U.S. Bank N.A.
Custody Operations
1555 North River Center Drive, Suite 302
Milwaukee, Wisconsin 53212
TRUSTEES
Neil J. Hennessy
Robert T. Doyle
J. Dennis DeSousa
Gerald P. Richardson
COUNSEL
Foley & Lardner LLP
777 East Wisconsin Avenue
Milwaukee, Wisconsin 53202-5306
INDEPENDENT REGISTERED
PUBLIC ACCOUNTING FIRM
Tait, Weller & Baker LLP
Two Liberty Place
50 South 16th Street, Suite 2900
Philadelphia, Pennsylvania 19102-2529
DISTRIBUTOR
Quasar Distributors, LLC
777 East Wisconsin Avenue
Milwaukee, Wisconsin 53202
hennessyfunds.com | 1-800-966-4354
This report has been prepared for shareholders and may be distributed to
others only if preceded or accompanied by a current prospectus.
ANNUAL REPORT
OCTOBER 31, 2018
HENNESSY BALANCED
FUND
Investor Class HBFBX
hennessyfunds.com | 1-800-966-4354
(This Page Intentionally Left Blank.)
Contents
| Letter to Shareholders | 2 |
| Performance Overview | 4 |
| Financial Statements | |
| Schedule of Investments | 6 |
| Statement of Assets and Liabilities | 9 |
| Statement of Operations | 10 |
| Statements of Changes in Net Assets | 11 |
| Financial Highlights | 12 |
| Notes to the Financial Statements | 14 |
| Report of Independent Registered Public Accounting Firm | 21 |
| Trustees and Officers of the Fund | 22 |
| Expense Example | 26 |
| Proxy Voting Policy and Proxy Voting Records | 28 |
| Quarterly Schedule of Investments | 28 |
| Federal Tax Distribution Information | 28 |
| Important Notice Regarding Delivery of Shareholder Documents | 28 |
| Privacy Policy | 29 |
| HENNESSY FUNDS | 1-800-966-4354 | |
December 2018
Dear Hennessy Funds Shareholder:
Over the past year, we have witnessed the return of market volatility. U.S. stocks still registered healthy gains, bolstered by the impact on corporate profits of the successful passage of the tax reform bill in December 2017. However, concerns over potential trade disruptions, especially between the U.S. and China, and worries over higher short-term interest rates, which many believe could possibly trigger a recession down the road, put downward pressure on equity valuations.
The U.S. economy performed well over the period, and actually achieved an acceleration in GDP growth to over 3% on an annualized basis in the second and third quarters of calendar year 2018. During the past year, companies continued to hire workers, adding over 200,000 jobs per month on average, sending the unemployment rate down to 3.7% in October, which is the lowest it has been since 1969. Consumer confidence is high and still rising, and corporate profits reached record levels in the third quarter of calendar year 2018, posting a year-over-year increase of 26% for the companies in the S&P 500 Index.
The Federal Reserve, confident about the strength of the economy and mindful of a tight labor market, raised short-term interest rates four times over the last year, by a quarter point each time. Long-term bond yields also rose, driven higher primarily by evidence of faster wage growth, pushing the U.S. 10-year Treasury bond over 3% for the first time since 2013.
As I write this, we are experiencing the market’s 20th downturn since 2010. I have been saying that every bull market experiences volatility and pullbacks. Many financial commentators think this bull market is “long in the tooth.” I do not agree with them. I believe stock valuations are still very reasonable. The prospective price to earnings multiple for the Dow Jones Industrial Average has come down from almost 20x at the end of 2017 to 16x, just above its 10-year average of 15x. The prospective PE multiple for the S&P 500 Index has also come down, from 20x to 17x, and compares favorably to its 10-year average of 16x.
Cash, meanwhile, continues to build up on corporate balance sheets. The companies in the S&P 500 Index reported a total of over $5.4 trillion in cash and marketable securities in their latest filings. Companies have been spending some of their cash, increasing their investment spending and laying the groundwork for future earnings growth. However, they have also been returning capital to shareholders. S&P 500 Index companies announced $433.6 billion in share repurchases during the second quarter of calendar year 2018, nearly doubling the previous record of $242.1 billion set in the first quarter. Companies are also raising their dividends.
In addition, I believe the Federal Reserve will take care not to raise interest rates too high or too fast and endanger the economic expansion. While wage growth has risen to over 3% in October, other measures of inflationary pressure, such as the Consumer Price Index and the Producer Price Index, still show prices increasing at a more moderate pace, closer to 2%. Given continued evidence of modest rates of inflation, I believe the Fed will be able to maintain its gradual pace of interest rate hikes.
Finally and importantly, I still see no signs of euphoria in this market. In my opinion, the enthusiasm present earlier in the year, which followed the significant reduction in corporate income tax rates, has largely evaporated, and it has been replaced with anxiety
over higher interest rates and their potential impact on growth. In the past, I have likened the current bull market to that of 1982-2000, and I still believe this comparison holds true. I am confident in the strength of the market today and believe the economy will continue to grow in the coming year, albeit at a more moderate pace.
Thank you for your continued confidence and investment in the Hennessy Funds. If you have any questions or would like to speak with us directly, please don’t hesitate to call us at (800) 966-4354.
Best regards,
Neil J. Hennessy
President and Chief Investment Officer
Past performance does not guarantee future results.
Mutual fund investing involves risk. Principal loss is possible.
Opinions expressed are those of Neil Hennessy and are subject to change, are not guaranteed, and should not be considered investment advice.
The Dow Jones Industrial Average and S&P 500 Index are commonly used to measure the performance of U.S. stocks. One cannot invest directly in an index.
PE, or price to earnings, is a valuation measure and is calculated by dividing a company’s market price per share by its earnings per share. Earnings growth is not a measure of a fund’s future performance.
| HENNESSY FUNDS | 1-800-966-4354 | |
Performance Overview (Unaudited)
CHANGE IN VALUE OF $10,000 INVESTMENT
This graph illustrates the performance of an initial investment of $10,000 made in the Fund ten years ago and assumes the reinvestment of dividends.
AVERAGE ANNUAL TOTAL RETURN FOR PERIODS ENDED OCTOBER 31, 2018
| | One | Five | Ten |
| | Year | Years | Years |
| Hennessy Balanced Fund (HBFBX) | 3.46% | 4.47% | 6.12% |
| 50/50 Blended DJIA/Treasury Index | 5.66% | 6.66% | 7.05% |
| Dow Jones Industrial Average | 9.87% | 12.76% | 13.33% |
Expense ratio: 1.83%
Performance data quoted represents past performance; past performance does not guarantee future results. The investment return and principal value of an investment will fluctuate so that an investor’s shares, when redeemed, may be worth more or less than their original cost. The performance table does not reflect the deduction of taxes that a shareholder would pay on Fund distributions or the redemption of Fund shares. Current performance of the Fund may be lower or higher than the performance quoted. Performance data current to the most recent month end may be obtained by visiting www.hennessyfunds.com.
The 50/50 Blended DJIA/Treasury Index consists of 50% common stocks represented by the Dow Jones Industrial Average and 50% short-duration Treasury securities represented by the ICE BofAML 1-Year U.S. Treasury Note Index. The Dow Jones Industrial Average is commonly used to measure the performance of U.S. stocks. The ICE BofAML 1-Year U.S. Treasury Note Index is comprised of Treasury securities maturing in approximately one year. One cannot invest directly in an index.
The expense ratio presented is from the most recent prospectus. The expense ratio for the current reporting period is available in the Financial Highlights section of this report.
PERFORMANCE NARRATIVE
Portfolio Managers Neil J. Hennessy and Ryan C. Kelley
Performance:
For the 12-month period ended October 31, 2018, the Hennessy Balanced Fund returned 3.46%, underperforming both the 50/50 Blended DJIA/Treasury Index (the Fund’s primary
benchmark) and the Dow Jones Industrial Average, which returned 5.66% and 9.87%, respectively, for the same period.
The Fund underperformed its primary benchmark predominantly as a result of stock selection, particularly in the Industrials sector, where the Fund’s holding in General Electric Co. hurt performance. In the Information Technology sector, the Fund did not own Apple, Inc., which detracted from relative performance, as did the Fund’s overweight position in International Business Machines Corp. The Fund’s overweight position in the Health Care sector contributed positively to relative performance, with pharmaceutical companies Pfizer, Inc. and Merck & Co., Inc. performing well.
The Fund continues to hold all the companies mentioned with the exception of Apple, Inc.
Portfolio Strategy:
The Fund invests approximately 50% of its assets in the “Dogs of the Dow,” the 10 highest dividend-yielding Dow stocks, and 50% of its assets in U.S. Treasuries. As a result of this “balanced” strategy, the Fund may be expected to underperform equities in periods when equity markets rise and outperform in periods when equity markets fall. The Fund is designed to allow investors to gain some exposure to the equity market while maintaining a significant share of their investment in fixed income securities. We believe the Fund is well positioned for the more conservative investor, as the equity portion of the portfolio is invested in what we believe to be high-quality companies, each with a historically high dividend yield, while the balance of the Fund is invested in lower-risk, short-duration U.S. Treasuries.
Investment Commentary:
We continue to believe that the outlook for U.S. stocks is positive. The U.S. economy is growing at a healthy rate, unemployment is low, and growth in both consumption and capital spending has accelerated over the last 12 months. Corporate earnings have risen significantly over the first nine months of 2018, helped, in part, by lower taxes. We expect earnings growth to be slower next year yet remain positive, driven primarily by continued steady economic growth.
Should the market experience a correction, we would expect our more defensive holdings to perform well relative to the market. The relatively short duration of the 50% weighting of U.S. Treasuries in the portfolio (all less than one year) may allow us the ability to roll into higher-yielding Treasuries in the event yields continue to rise.
_______________
Opinions expressed are those of the Portfolio Managers as of the date written and are subject to change, are not guaranteed, and should not be considered investment advice or an indication of trading intent.
The Fund is non-diversified, meaning it may concentrate its assets in fewer individual holdings than a diversified fund, making it more exposed to individual stock volatility than a diversified fund. The Fund’s formula-based strategy may cause the Fund to buy or sell securities at times when it may not be advantageous. Please see the Fund’s prospectus for a more complete discussion of these and other risks.
References to specific securities should not be considered a recommendation to buy or sell any security. Fund holdings and sector allocations are subject to change. Please refer to the Schedule of Investments included in this report for additional portfolio information.
Dividend yield is calculated by dividing a company’s dividends per share by its market price per share.
Earnings growth is not representative of the Fund’s future performance.
| HENNESSY FUNDS | 1-800-966-4354 | |
Financial Statements
Schedule of Investments as of October 31, 2018 |
HENNESSY BALANCED FUND
(% of Net Assets)
| TOP TEN HOLDINGS (EXCLUDING MONEY MARKET FUNDS) | % NET ASSETS |
| U.S. Treasury Bill, 2.305%, 01/31/2019 | 17.11% |
| U.S. Treasury Bill, 2.200%, 12/06/2018 | 8.59% |
| U.S. Treasury Bill, 2.275%, 05/23/2019 | 8.49% |
| U.S. Treasury Bill, 2.275%, 06/20/2019 | 6.78% |
| Cisco Systems, Inc. | 5.55% |
| Pfizer, Inc. | 5.28% |
| The Procter & Gamble Co. | 5.23% |
| Merck & Co., Inc. | 5.13% |
| The Coca-Cola Co. | 5.13% |
| Verizon Communications, Inc. | 4.92% |
Note: For presentation purposes, the Fund has grouped some of the industry categories. For purposes of categorizing securities for compliance with Section 8(b)(1) of the Investment Company Act of 1940, as amended, the Fund uses more specific industry classifications.
The Global Industry Classification Standard (GICS®) was developed by and is the exclusive property and a service mark of MSCI, Inc. and Standard & Poor Financial Services LLC. It has been licensed for use by the Hennessy Funds.
| COMMON STOCKS – 48.32% | | Number | | | | | | % of | |
| | | of Shares | | | Value | | | Net Assets | |
| Communication Services – 4.92% | | | | | | | | | |
| Verizon Communications, Inc. | | | 10,008 | | | $ | 571,357 | | | | 4.92 | % |
| | | | | | | | | | | | | |
| Consumer Staples – 10.36% | | | | | | | | | | | | |
| The Coca-Cola Co. | | | 12,450 | | | | 596,106 | | | | 5.13 | % |
| The Procter & Gamble Co. | | | 6,850 | | | | 607,458 | | | | 5.23 | % |
| | | | | | | | 1,203,564 | | | | 10.36 | % |
| | | | | | | | | | | | | |
| Energy – 9.01% | | | | | | | | | | | | |
| Chevron Corp. | | | 4,630 | | | | 516,940 | | | | 4.45 | % |
| Exxon Mobil Corp. | | | 6,650 | | | | 529,872 | | | | 4.56 | % |
| | | | | | | | 1,046,812 | | | | 9.01 | % |
| | | | | | | | | | | | | |
| Health Care – 10.41% | | | | | | | | | | | | |
| Merck & Co., Inc. | | | 8,100 | | | | 596,241 | | | | 5.13 | % |
| Pfizer, Inc. | | | 14,252 | | | | 613,691 | | | | 5.28 | % |
| | | | | | | | 1,209,932 | | | | 10.41 | % |
| | | | | | | | | | | | | |
| Industrials – 1.45% | | | | | | | | | | | | |
| General Electric Co. | | | 16,702 | | | | 168,690 | | | | 1.45 | % |
| | | | | | | | | | | | | |
| Information Technology – 12.17% | | | | | | | | | | | | |
| Cisco Systems, Inc. | | | 14,088 | | | | 644,526 | | | | 5.55 | % |
| Intel Corp. | | | 6,950 | | | | 325,816 | | | | 2.80 | % |
| International Business Machines Corp. | | | 3,846 | | | | 443,944 | | | | 3.82 | % |
| | | | | | | | 1,414,286 | | | | 12.17 | % |
| | | | | | | | | | | | | |
| Total Common Stocks | | | | | | | | | | | | |
| (Cost $5,095,269) | | | | | | | 5,614,641 | | | | 48.32 | % |
The accompanying notes are an integral part of these financial statements.
| HENNESSY FUNDS | 1-800-966-4354 | |
| SHORT-TERM INVESTMENTS – 52.34% | | Number of Shares/ | | | | | | % of | |
| | | Par Amount | | | Value | | | Net Assets | |
| Money Market Funds – 3.69% | | | | | | | | | |
| Fidelity Government Portfolio, Institutional Class, 2.06% (a) | | | 429,571 | | | $ | 429,571 | | | | 3.69 | % |
| | | | | | | | | | | | | |
| U.S. Treasury Bills – 48.65% | | | | | | | | | | | | |
| 2.135%, 11/08/2018 (b) | | | 500,000 | | | | 499,843 | | | | 4.30 | % |
| 2.200%, 12/06/2018 (b) | | | 1,000,000 | | | | 998,342 | | | | 8.59 | % |
| 2.305%, 01/31/2019 (b) | | | 2,000,000 | | | | 1,988,461 | | | | 17.11 | % |
| 2.275%, 05/23/2019 (b) | | | 1,000,000 | | | | 986,227 | | | | 8.49 | % |
| 2.275%, 06/20/2019 (b) | | | 800,000 | | | | 787,385 | | | | 6.78 | % |
| 2.335%, 07/18/2019 (b) | | | 400,000 | | | | 392,827 | | | | 3.38 | % |
| | | | | | | | 5,653,085 | | | | 48.65 | % |
| Total Short-Term Investments | | | | | | | | | | | | |
| (Cost $6,087,923) | | | | | | | 6,082,656 | | | | 52.34 | % |
| | | | | | | | | | | | | |
| Total Investments | | | | | | | | | | | | |
| (Cost $11,183,192) – 100.66% | | | | | | | 11,697,297 | | | | 100.66 | % |
| Liabilities in Excess of Other Assets – (0.66)% | | | | | | | (76,726 | ) | | | (0.66 | )% |
| | | | | | | | | | | | | |
TOTAL NET ASSETS – 100.00% | | | | | | $ | 11,620,571 | | | | 100.00 | % |
Percentages are stated as a percent of net assets.
| (a) | The rate listed is the fund’s seven-day yield as of October 31, 2018. |
| (b) | The rate listed is discount rate at issue. |
Summary of Fair Value Exposure at October 31, 2018
The following is a summary of the inputs used to value the Fund’s net assets as of October 31, 2018 (See Note 3 in the accompanying notes to the financial statements):
| Common Stocks | | Level 1 | | | Level 2 | | | Level 3 | | | Total | |
| Communication Services | | $ | 571,357 | | | $ | — | | | $ | — | | | $ | 571,357 | |
| Consumer Staples | | | 1,203,564 | | | | — | | | | — | | | | 1,203,564 | |
| Energy | | | 1,046,812 | | | | — | | | | — | | | | 1,046,812 | |
| Health Care | | | 1,209,932 | | | | — | | | | — | | | | 1,209,932 | |
| Industrials | | | 168,690 | | | | — | | | | — | | | | 168,690 | |
| Information Technology | | | 1,414,286 | | | | — | | | | — | | | | 1,414,286 | |
| Total Common Stocks | | $ | 5,614,641 | | | $ | — | | | $ | — | | | $ | 5,614,641 | |
| Short-Term Investments | | | | | | | | | | | | | | | | |
| Money Market Funds | | $ | 429,571 | | | $ | — | | | $ | — | | | $ | 429,571 | |
| U.S. Treasury Bills | | | — | | | | 5,653,085 | | | | — | | | | 5,653,085 | |
| Total Short-Term Investments | | $ | 429,571 | | | $ | 5,653,085 | | | $ | — | | | $ | 6,082,656 | |
| Total Investments | | $ | 6,044,212 | | | $ | 5,653,085 | | | $ | — | | | $ | 11,697,297 | |
The accompanying notes are an integral part of these financial statements.
| SCHEDULE OF INVESTMENTS/STATEMENT OF ASSETS AND LIABILITIES |
Financial Statements
Statement of Assets and Liabilities as of October 31, 2018 |
| ASSETS: | | | |
| Investments in securities, at value (cost $11,183,192) | | $ | 11,697,297 | |
| Dividends and interest receivable | | | 11,695 | |
| Prepaid expenses and other assets | | | 8,074 | |
| Total Assets | | | 11,717,066 | |
| | | | | |
| LIABILITIES: | | | | |
| Payable for fund shares redeemed | | | 815 | |
| Payable to advisor | | | 5,968 | |
| Payable to administrator | | | 1,033 | |
| Payable to auditor | | | 21,900 | |
| Accrued distribution fees | | | 49,955 | |
| Accrued service fees | | | 995 | |
| Accrued trustees fees | | | 5,962 | |
| Accrued expenses and other payables | | | 9,867 | |
| Total Liabilities | | | 96,495 | |
| NET ASSETS | | $ | 11,620,571 | |
| | | | | |
| NET ASSETS CONSIST OF: | | | | |
| Capital stock | | $ | 10,561,571 | |
| Total distributable earnings | | | 1,059,000 | |
| Total Net Assets | | $ | 11,620,571 | |
| | | | | |
| NET ASSETS | | | | |
| Investor Class: | | | | |
| Shares authorized (no par value) | | Unlimited | |
| Net assets applicable to outstanding Investor Class shares | | $ | 11,620,571 | |
| Shares issued and outstanding | | | 941,712 | |
| Net asset value, offering price and redemption price per share | | $ | 12.34 | |
The accompanying notes are an integral part of these financial statements.
| HENNESSY FUNDS | 1-800-966-4354 | |
Financial Statements
Statement of Operations for the year ended October 31, 2018 |
| INVESTMENT INCOME: | | | |
| Dividend income | | $ | 204,566 | |
| Interest income | | | 98,172 | |
| Total investment income | | | 302,738 | |
| | | | | |
| EXPENSES: | | | | |
| Investment advisory fees (See Note 5) | | | 71,737 | |
| Compliance expense (See Note 5) | | | 29,499 | |
| Audit fees | | | 23,182 | |
| Federal and state registration fees | | | 20,669 | |
| Trustees’ fees and expenses | | | 17,396 | |
| Distribution fees – Investor Class (See Note 5) | | | 17,934 | |
| Service fees – Investor Class (See Note 5) | | | 11,956 | |
| Administration, fund accounting, custody and transfer agent fees (See Note 5) | | | 11,571 | |
| Sub-transfer agent expenses – Investor Class (See Note 5) | | | 6,831 | |
| Reports to shareholders | | | 5,734 | |
| Other expenses | | | 2,897 | |
| Total expenses | | | 219,406 | |
| NET INVESTMENT INCOME | | $ | 83,332 | |
| | | | | |
| REALIZED AND UNREALIZED GAINS (LOSSES): | | | | |
| Net realized gain on investments | | $ | 591,543 | |
| Net change in unrealized appreciation/depreciation on investments | | | (256,449 | ) |
| Net gain on investments | | | 335,094 | |
| NET INCREASE IN NET ASSETS RESULTING FROM OPERATIONS | | $ | 418,426 | |
The accompanying notes are an integral part of these financial statements.
| STATEMENT OF OPERATIONS/STATEMENTS OF CHANGES IN NET ASSETS |
Financial Statements
| Statements of Changes in Net Assets |
| | | Year Ended | | | Year Ended | |
| | | October 31, 2018 | | | October 31, 2017 | |
| OPERATIONS: | | | | | | |
| Net investment income | | $ | 83,332 | | | $ | 54,758 | |
| Net realized gain on investments | | | 591,543 | | | | 900,400 | |
| Net change in unrealized | | | | | | | | |
| appreciation/depreciation on investments | | | (256,449 | ) | | | 149,079 | |
| Net increase in net assets resulting from operations | | | 418,426 | | | | 1,104,237 | |
| | | | | | | | | |
| DISTRIBUTIONS TO SHAREHOLDERS FROM: | | | | | | | | |
| Distributable earnings – Investor Class | | | (931,750 | ) | | | (893,436 | ) |
| Total distributions | | | (931,750 | ) | | | (893,436 | )(1) |
| | | | | | | | | |
| CAPITAL SHARE TRANSACTIONS: | | | | | | | | |
| Proceeds from shares subscribed – Investor Class | | | 501,087 | | | | 991,429 | |
| Dividends reinvested – Investor Class | | | 914,566 | | | | 877,425 | |
| Cost of shares redeemed – Investor Class | | | (1,520,707 | ) | | | (1,920,997 | ) |
| Net decrease in net assets derived | | | | | | | | |
| from capital share transactions | | | (105,054 | ) | | | (52,143 | ) |
| TOTAL INCREASE (DECREASE) IN NET ASSETS | | | (618,378 | ) | | | 158,658 | |
| | | | | | | | | |
| NET ASSETS: | | | | | | | | |
| Beginning of year | | | 12,238,949 | | | | 12,080,291 | |
| End of year | | $ | 11,620,571 | | | $ | 12,238,949 | (2) |
| | | | | | | | | |
| CHANGES IN SHARES OUTSTANDING: | | | | | | | | |
| Shares sold – Investor Class | | | 39,254 | | | | 79,582 | |
| Shares issued to holders as reinvestment | | | | | | | | |
| of dividends – Investor Class | | | 75,304 | | | | 72,055 | |
| Shares redeemed – Investor Class | | | (123,009 | ) | | | (154,177 | ) |
| Net decrease in shares outstanding | | | (8,451 | ) | | | (2,540 | ) |
(1) | Includes net investment income distributions of $48,189 and net realized gain distributions of $845,247. |
(2) | Includes accumulated undistributed net investment income of $6,569. |
The accompanying notes are an integral part of these financial statements.
| HENNESSY FUNDS | 1-800-966-4354 | |
Financial Statements
For an Investor Class share outstanding throughout each year
PER SHARE DATA:
Net asset value, beginning of year
Income from investment operations:
Net investment income
Net realized and unrealized gains (losses) on investments
Total from investment operations
Less distributions:
Dividends from net investment income
Dividends from net realized gains
Total distributions
Net asset value, end of year
TOTAL RETURN
SUPPLEMENTAL DATA AND RATIOS:
Net assets, end of year (millions)
Ratio of expenses to average net assets
Ratio of net investment income to average net assets
Portfolio turnover rate
The accompanying notes are an integral part of these financial statements.
| FINANCIAL HIGHLIGHTS — INVESTOR CLASS |
| Year Ended October 31, | |
| 2018 | | | 2017 | | | 2016 | | | 2015 | | | 2014 | |
| | | | | | | | | | | | | | |
| $ | 12.88 | | | $ | 12.68 | | | $ | 12.37 | | | $ | 12.98 | | | $ | 12.90 | |
| | | | | | | | | | | | | | | | | | | |
| | | | | | | | | | | | | | | | | | | |
| | 0.09 | | | | 0.06 | | | | 0.04 | | | | 0.03 | | | | 0.02 | |
| | 0.33 | | | | 1.09 | | | | 0.58 | | | | (0.01 | ) | | | 0.51 | |
| | 0.42 | | | | 1.15 | | | | 0.62 | | | | 0.02 | | | | 0.53 | |
| | | | | | | | | | | | | | | | | | | |
| | | | | | | | | | | | | | | | | | | |
| | (0.08 | ) | | | (0.05 | ) | | | (0.04 | ) | | | (0.03 | ) | | | (0.01 | ) |
| | (0.88 | ) | | | (0.90 | ) | | | (0.27 | ) | | | (0.60 | ) | | | (0.44 | ) |
| | (0.96 | ) | | | (0.95 | ) | | | (0.31 | ) | | | (0.63 | ) | | | (0.45 | ) |
| $ | 12.34 | | | $ | 12.88 | | | $ | 12.68 | | | $ | 12.37 | | | $ | 12.98 | |
| | | | | | | | | | | | | | | | | | | |
| | 3.46 | % | | | 9.56 | % | | | 5.20 | % | | | 0.11 | % | | | 4.26 | % |
| | | | | | | | | | | | | | | | | | | |
| | | | | | | | | | | | | | | | | | | |
| $ | 11.62 | | | $ | 12.24 | | | $ | 12.08 | | | $ | 11.63 | | | $ | 12.54 | |
| | 1.84 | % | | | 1.82 | % | | | 1.68 | % | | | 1.68 | % | | | 1.75 | % |
| | 0.70 | % | | | 0.45 | % | | | 0.33 | % | | | 0.20 | % | | | 0.17 | % |
| | 21 | % | | | 31 | % | | | 51 | % | | | 34 | % | | | 23 | % |
The accompanying notes are an integral part of these financial statements.
| HENNESSY FUNDS | 1-800-966-4354 | |
Financial Statements
Notes to the Financial Statements October 31, 2018 |
1). ORGANIZATION
The Hennessy Balanced Fund (the “Fund”) is a series of Hennessy Funds Trust (the “Trust”), which was organized as a Delaware statutory trust on September 17, 1992. The Fund is an open-end management investment company registered under the Investment Company Act of 1940, as amended. The investment objective of the Fund is a combination of capital appreciation and current income. The Fund is a non-diversified fund and offers Investor Class shares.
As an investment company, the Fund follows the investment company accounting and reporting guidance of the Financial Accounting Standards Board (“FASB”) Accounting Standard Codification Topic 946 “Financial Services—Investment Companies.”
2). SIGNIFICANT ACCOUNTING POLICIES
The following is a summary of significant accounting policies consistently followed by the Fund in the preparation of the financial statements. These policies conform to U.S. generally accepted accounting principles (“GAAP”).
| a). | Securities Valuation – All investments in securities are recorded at their estimated fair value, as described in Note 3. |
| | |
| b). | Federal Income Taxes – No provision for federal income taxes or excise taxes has been made because the Fund has elected to be taxed as a regulated investment company and intends to distribute substantially all of its taxable income to its shareholders and otherwise comply with the provisions of the Internal Revenue Code of 1986, as amended, applicable to regulated investment companies. Net investment income/loss and realized gains/losses for federal income tax purposes may differ from those reported in the financial statements because of temporary book and tax basis differences. Temporary differences are primarily the result of the treatment of wash sales for tax reporting purposes. The Fund recognizes interest and penalties related to income tax benefits, if any, in the Statement of Operations as an income tax expense. Distributions from net realized gains for book purposes may include short-term capital gains, which are included as ordinary income to shareholders for tax purposes. The Fund may utilize equalization accounting for tax purposes and designate earnings and profits, including net realized gains distributed to shareholders on redemption of shares, as part of the dividends paid deduction for income tax purposes. |
| | |
| | Due to inherent differences in the recognition of income, expenses, and realized gains/losses under GAAP and federal income tax regulations, permanent differences between book and tax basis for reporting for fiscal year 2018 have been identified and appropriately reclassified in the Statement of Assets and Liabilities. The adjustments are as follows: |
| Total | |
| Distributable | |
Earnings | Capital Stock |
| $(38,228) | $38,228 |
| c). | Accounting for Uncertainty in Income Taxes – The Fund has accounting policies regarding recognition and measurement of tax positions taken or expected to be taken on a tax return. The tax returns of the Fund for the prior three fiscal years are |
| NOTES TO THE FINANCIAL STATEMENTS |
| | open for examination. The Fund has reviewed all open tax years in major jurisdictions and concluded that there is no impact on the Fund’s net assets and no tax liability resulting from unrecognized tax benefits relating to uncertain income tax positions taken or expected to be taken on a tax return. The Fund’s major tax jurisdictions are U.S. federal and Delaware. |
| | |
| d). | Income and Expenses – Dividend income is recognized on the ex-dividend date or as soon as information is available to the Fund. Interest income, which includes the amortization of premium and accretion of discount, is recognized on an accrual basis. Other non-cash dividends are recognized as investment income at the fair value of the property received. The Fund is charged for those expenses that are directly attributable to its portfolio, such as advisory, administration, and certain shareholder service fees. |
| | |
| e). | Distributions to Shareholders – Dividends from net investment income for the Fund, if any, are declared and paid at the end of each calendar quarter. Distributions of net realized capital gains, if any, are declared and paid annually, usually in December. |
| | |
| f). | Security Transactions – Investment and shareholder transactions are recorded on the trade date. The Fund determines the realized gain/loss from an investment transaction by comparing the original cost of the security lot sold with the net sale proceeds. Discounts and premiums on securities purchased are accreted or amortized, respectively, over the life of each such security. |
| | |
| g). | Use of Estimates – The preparation of financial statements in conformity with GAAP requires management to make estimates and assumptions that affect the reported amounts of assets and liabilities and disclosure of contingent assets and liabilities at the date of the financial statements and the reported change in net assets during the reporting period. Actual results could differ from those estimates. |
| | |
| h). | Share Valuation – The net asset value (“NAV”) per share of the Fund is calculated by dividing (i) the total value of the securities held by the Fund, plus cash and other assets, minus all liabilities (including estimated accrued expenses) by (ii) the total number of shares outstanding for the Fund, rounded to the nearest cent. The Fund’s shares will not be priced on days the New York Stock Exchange is closed for trading. The offering and redemption price per share for the Fund is equal to the Fund’s NAV per share. |
| | |
| i). | New Accounting Pronouncements – In August 2018, the FASB issued Accounting Standards Update No. 2018-13 “Disclosure Framework—Changes to the Disclosure Requirements for Fair Value Measurement” (“ASU 2018-13”). ASU 2018-13 eliminates the requirement to disclose the amount of and reasons for transfers between Level 1 and Level 2 of the fair value hierarchy, the timing of transfers between levels of the fair value hierarchy, and the valuation processes for Level 3 fair value measurements. ASU 2018-13 does not eliminate the requirement to disclose the range and weighted average used to develop significant unobservable inputs for Level 3 fair value measurements, and the changes in unrealized gains and losses for recurring Level 3 fair value measurements. ASU 2018-13 requires that information is provided about the measurement uncertainty of Level 3 fair value measurements as of the reporting date. The guidance is effective for fiscal years beginning after December 15, 2019, and interim periods within those fiscal years. Management has evaluated the impact of this change in guidance, and due to the permissibility of early adoption, modified the Fund’s fair value disclosures for the current reporting period. |
| | |
| j). | New Rule Issuances – In August 2018, the Securities and Exchange Commission issued Final Rule Release No. 33 10532, Disclosure Update and Simplification, which in part amends certain financial statement disclosure requirements of Regulation S-X that have become redundant, duplicative, overlapping, outdated, or superseded, in |
| HENNESSY FUNDS | 1-800-966-4354 | |
| | light of other Commission disclosure requirements, GAAP, or changes in the information environment. The amendments are intended to facilitate the disclosure of information to investors and simplify compliance without significantly altering the total mix of information provided to investors. The amendments to Rule 6-04.17 of Regulation S-X (balance sheet) were amended to require presentation of the total, rather than the components of net assets, of distributable earnings on the balance sheet. Consistent with GAAP, funds will be required to disclose total distributable earnings. The amendments to Rule 6-09 of Regulation S-X (statement of changes in net assets) omit the requirement to separately state the sources of distributions paid as well as omit the requirement to parenthetically state the book basis amount of undistributed net investment income. Instead, consistent with GAAP, funds will be required to disclose the total amount of distributions paid, except that any tax return of capital must be separately disclosed. The requirements of the Final Rule Release are effective November 5, 2018 and the Fund’s Statement of Assets and Liabilities and the Statement of Changes in Net Assets for the current and prior reporting period have been modified accordingly. |
3). SECURITIES VALUATION
The Fund follows fair valuation accounting standards that establish an authoritative definition of fair value and set out a hierarchy for measuring fair value. These standards require additional disclosures about the various inputs and valuation techniques used to develop the measurements of fair value and a discussion of changes in valuation techniques and related inputs during the period. These inputs are summarized in the three broad levels listed below:
| | Level 1 – | Unadjusted, quoted prices in active markets for identical instruments that the Fund has the ability to access at the date of measurement. |
| | | |
| | Level 2 – | Other significant observable inputs (including, but not limited to, quoted prices in active markets for similar instruments, quoted prices in markets that are not active for identical or similar instruments, and model-derived valuations in which all significant inputs and significant value drivers are observable in active markets, such as interest rates, prepayment speeds, credit risk curves, default rates, and similar data). |
| | | |
| | Level 3 – | Significant unobservable inputs (including the Fund’s own assumptions about what market participants would use to price the asset or liability based on the best available information) when observable inputs are unavailable. |
Following is a description of the valuation techniques applied to the Fund’s major categories of assets and liabilities measured at fair value on a recurring basis.
| | Equity Securities – Equity securities, including common stocks, preferred stocks, exchange-traded funds, closed-end mutual funds, partnerships, rights, and real estate investment trusts, that are traded on a securities exchange for which a last-quoted sales price is readily available will generally be valued at the last sales price as reported by the primary exchange on which the securities are listed. Securities listed on The NASDAQ Stock Market (“NASDAQ”) will generally be valued at the NASDAQ Official Closing Price, which may differ from the last sales price reported. Securities traded on a securities exchange for which a last-quoted sales price is not readily available will generally be valued at the mean between the bid and ask prices. To the extent these securities are actively traded and valuation adjustments are not applied, they are classified in Level 1 of the fair value hierarchy. |
| NOTES TO THE FINANCIAL STATEMENTS |
| | Registered Investment Companies – Investments in open-end registered investment companies, commonly referred to as mutual funds, are generally priced at the ending NAV provided by the applicable mutual fund’s service agent and will be classified in Level 1 of the fair value hierarchy. |
| | |
| | Debt Securities – Debt securities, including corporate bonds, asset-backed securities, mortgage-backed securities, municipal bonds, U.S. Treasuries, and U.S. government agency issues, are generally valued at market on the basis of valuations furnished by an independent pricing service that utilizes both dealer-supplied valuations and formula-based techniques. The pricing service may consider recently executed transactions in securities of the issuer or comparable issuers, market price quotations (where observable), bond spreads, and fundamental data relating to the issuer. In addition, the model may incorporate observable market data, such as reported sales of similar securities, broker quotes, yields, bids, offers, and reference data. Certain securities are valued primarily using dealer quotations. These securities are generally classified in Level 2 of the fair value hierarchy. |
| | |
| | Short-Term Securities – Short-term equity investments, including money market funds, are valued in the manner specified above. Short-term debt investments with an original term to maturity of 60 days or less are valued at amortized cost, which approximates fair market value. If the original term to maturity of a short-term debt investment exceeded 60 days, then the values as of the 61st day prior to maturity are amortized. Amortized cost is not used if its use would be inappropriate due to credit or other impairments of the issuer, in which case the security’s fair value would be determined, as described below. Short-term securities are generally classified in Level 1 or Level 2 of the fair market hierarchy depending on the inputs used and market activity levels for specific securities. |
The Board of Trustees of the Fund (the “Board”) has adopted fair value pricing procedures that are followed when a price for a security is not readily available or if a significant event has occurred that indicates the closing price of a security no longer represents the true value of that security. Fair value pricing determinations are made in good faith in accordance with these procedures. There are numerous criteria that will be given consideration in determining a fair value of a security, such as the trading volume of a security and markets, the values of other similar securities, and news events with direct bearing on a security or markets. Fair value pricing results in an estimated price for a security that reflects the amount the Fund might reasonably expect to receive in a current sale. Depending on the relative significance of the valuation inputs, these securities may be classified in either Level 2 or Level 3 of the fair value hierarchy.
The Board has delegated day-to-day valuation matters to a Valuation Committee comprised of one or more representatives from Hennessy Advisors, Inc., the Fund’s investment advisor (the “Advisor”). The function of the Valuation Committee is to value securities where current and reliable market quotations are not readily available. All actions taken by the Valuation Committee are reviewed by the Board.
The Fund has performed an analysis of all existing investments to determine the significance and character of all inputs to their fair value determinations. Various inputs are used to determine the value of the Fund’s investments. The inputs or methodology used for valuing securities are not necessarily an indication of the risk associated with investing in those securities. Details related to the fair valuation hierarchy of the Fund’s securities as of October 31, 2018, are included in the Schedule of Investments.
| HENNESSY FUNDS | 1-800-966-4354 | |
4). INVESTMENT TRANSACTIONS
Purchases and sales of investment securities (excluding government and short-term investments) for the Fund during fiscal year 2018 were $1,207,341 and $2,254,091, respectively.
There were no purchases or sales/maturities of long-term U.S. government securities for the Fund during fiscal year 2018.
The Fund is permitted to purchase or sell securities from or to another fund in the Hennessy Funds family of funds (the “Hennessy Funds”) under specified conditions outlined in procedures adopted by the Board. The procedures have been designed to ensure that any purchase or sale of securities by the Fund from or to another Hennessy Fund complies with Rule 17a-7 of the Investment Company Act of 1940, as amended. During fiscal year 2018, the Fund did not engage in purchases or sales of securities pursuant to Rule 17a-7 of the Investment Company Act of 1940, as amended.
5). INVESTMENT ADVISORY FEE AND OTHER TRANSACTIONS WITH AFFILIATES
The Advisor provides the Fund with investment advisory services under an Investment Advisory Agreement. The Advisor furnishes all investment advice, office space, and facilities, as well as most of the personnel needed by the Fund. As compensation for its services, the Advisor is entitled to a monthly fee from the Fund. The fee is based upon the average daily net assets of the Fund at an annual rate of 0.60%. The net investment advisory fees expensed by the Fund during fiscal year 2018 are included in the Statement of Operations.
The Board has approved a Shareholder Servicing Agreement for the Fund, which was instituted to compensate the Advisor for the non-investment advisory services it provides to the Fund. The Shareholder Servicing Agreement provides for a monthly fee paid to the Advisor at an annual rate of 0.10% of the average daily net assets of the Fund. The shareholder service fees expensed by the Fund during fiscal year 2018 are included in the Statement of Operations.
The Fund has adopted a plan pursuant to Rule 12b-1 under the Investment Company Act of 1940, as amended, that authorizes payments in connection with the distribution of the Fund’s shares at an annual rate of up to 0.25% of the Fund’s average daily net assets. Even though the authorized rate is up to 0.25%, the Fund is currently only using up to 0.15% of its average daily net assets for such purpose. Amounts paid under the plan may be spent on any activities or expenses primarily intended to result in the sale of shares, including, but not limited to, advertising, shareholder account servicing, printing and mailing of prospectuses to other than current shareholders, printing and mailing of sales literature, and compensation for sales and marketing activities or to financial institutions and others, such as dealers and distributors. The distribution fees expensed by the Fund during fiscal year 2018 are included in the Statement of Operations.
The Fund has entered into agreements with various brokers, dealers, and financial intermediaries in connection with the sale of shares of the Fund. The agreements provide for periodic payments by the Fund to the brokers, dealers, and financial intermediaries for providing certain shareholder maintenance services (sub-transfer agent expenses). These shareholder services include the pre-processing and quality control of new accounts, shareholder correspondence, answering customer inquiries regarding account status, and facilitating shareholder telephone transactions. The sub-transfer agent fees expensed by the Fund during fiscal year 2018 are included in the Statement of Operations.
| NOTES TO THE FINANCIAL STATEMENTS |
U.S. Bancorp Fund Services, LLC, d/b/a U.S. Bank Global Fund Services (“Fund Services”) provides the Fund with administrative, fund accounting, and transfer agent services. As administrator, Fund Services is responsible for activities such as (i) preparing various federal and state regulatory filings, reports, and returns for the Fund, (ii) preparing reports and materials to be supplied to the Board, (iii) monitoring the activities of the Fund’s custodian, transfer agent, and accountants, and (iv) coordinating the preparation and payment of the Fund’s expenses and reviewing the Fund’s expense accruals. U.S. Bank N.A., an affiliate of Fund Services, serves as the Fund’s custodian. The servicing agreements between the Trust and Fund Services and U.S. Bank N.A. contain a fee schedule that is inclusive of administrative, fund accounting, custody, and transfer agent fees. The administrative, fund accounting, custody, and transfer agent fees expensed by the Fund during fiscal year 2018 are included in the Statement of Operations.
Quasar Distributors, LLC acts as the Fund’s principal underwriter in a continuous public offering of the Fund’s shares. Quasar Distributors, LLC is an affiliate of Fund Services and U.S. Bank N.A.
The officers of the Fund are affiliated with the Advisor. Such officers, with the exception of the Chief Compliance Officer and the Senior Compliance Officer, receive no compensation from the Fund for serving in their respective roles. The Fund, along with the other Hennessy Funds, makes reimbursement payments, on an equal basis, to the Advisor for a portion of the salary and benefits associated with the office of the Chief Compliance Officer and for all of the salary and benefits associated with the office of the Senior Compliance Officer. The compliance fees expensed by the Fund during fiscal year 2018 are included in the Statement of Operations.
6). GUARANTEES AND INDEMNIFICATIONS
Under the Hennessy Funds’ organizational documents, their officers and trustees are indemnified by the Hennessy Funds against certain liabilities arising out of the performance of their duties to the Hennessy Funds. Additionally, in the normal course of business, the Hennessy Funds enter into contracts with service providers that contain general indemnification clauses. The Fund’s maximum exposure under these arrangements is unknown as this would involve future claims that may be made against the Fund that have not yet occurred. Currently, the Fund expects the risk of loss to be remote.
7). LINE OF CREDIT
The Fund has an uncommitted line of credit with the other Hennessy Funds in the amount of the lesser of (i) $100,000,000 or (ii) 33.33% of each Hennessy Fund’s net assets, or 30% for the Hennessy Gas Utility Fund and 10% for the Fund, intended to provide short-term financing, if necessary, subject to certain restrictions, in connection with shareholder redemptions. The credit facility is with the Hennessy Funds’ custodian bank, U.S. Bank N.A. Borrowings under this arrangement bear interest at the bank’s prime rate and are secured by all of the Fund’s assets (as to its own borrowings only). During fiscal year 2018, the Fund did not have any borrowings outstanding under the line of credit.
| HENNESSY FUNDS | 1-800-966-4354 | |
8). FEDERAL TAX INFORMATION
As of October 31, 2018, the components of accumulated earnings (losses) for income tax purposes were as follows:
| | | Investments | |
| Cost of investments for tax purposes | | $ | 11,194,398 | |
| Gross tax unrealized appreciation | | $ | 888,065 | |
| Gross tax unrealized depreciation | | | (385,166 | ) |
| Net tax unrealized appreciation/(depreciation) | | $ | 502,899 | |
| Undistributed ordinary income | | $ | 7,891 | |
| Undistributed long-term capital gains | | | 548,210 | |
| Total distributable earnings | | $ | 556,101 | |
| Other accumulated gain/(loss) | | $ | — | |
| Total accumulated gain/(loss) | | $ | 1,059,000 | |
The difference between book-basis unrealized appreciation/depreciation (as shown in the Statement of Assets and Liabilities) and tax-basis unrealized appreciation/depreciation (as shown above) is attributable primarily to wash sales.
As of October 31, 2018, the Fund had no tax basis capital losses to offset future capital gains.
As of October 31, 2018, the Fund did not defer, on a tax basis, any late-year ordinary losses. Late-year ordinary losses are net ordinary losses incurred after December 31, 2017, but within the taxable year, that are deemed to arise on the first day of the Fund’s next taxable year.
During fiscal year 2018 and fiscal year 2017, the tax character of distributions paid by the Fund was as follows:
| | | Year Ended | | | Year Ended | |
| | | October 31, 2018 | | | October 31, 2017 | |
Ordinary income(1) | | $ | 144,183 | | | $ | 91,227 | |
| Long-term capital gain | | | 787,567 | | | | 802,209 | |
| | | $ | 931,750 | | | $ | 893,436 | |
(1) Ordinary income includes short-term capital gains.
9). EVENTS SUBSEQUENT TO YEAR END
Management has evaluated the Fund’s related events and transactions that occurred subsequent to October 31, 2018, through the date of issuance of the Fund’s financial statements. Other than as disclosed below, management has determined that there were no subsequent events requiring recognition or disclosure in the financial statements.
On December 7, 2018, capital gains were declared and paid to shareholders of record on December 6, 2018, as follows:
| | Long-term |
| Investor Class | $0.54675 |
On December 27, 2018, income distributions were declared and paid to shareholders of record on December 26, 2018, as follows:
| Investor Class | $0.02951113 |
| NOTES/REPORT OF INDEPENDENT REGISTERED PUBLIC ACCOUNTING FIRM |
Report of Independent Registered Public
Accounting Firm
To the Board of Trustees of Hennessy Funds Trust
and the shareholders of Hennessy Balanced Fund
Novato, CA
Opinion on the Financial Statements
We have audited the accompanying statement of assets and liabilities of Hennessy Balanced Fund (the “Fund”), a series of Hennessy Funds Trust, including the schedule of investments, as of October 31, 2018, the related statement of operations for the year then ended, the statements of changes in net assets and the financial highlights for each of the two years in the period then ended, and the related notes (collectively referred to as the “financial statements”). In our opinion, the financial statements present fairly, in all material respects, the financial position of the Fund as of October 31, 2018, the results of its operations for the year then ended, and the changes in its net assets and the financial highlights for each of the two years in the period then ended in conformity with accounting principles generally accepted in the United States of America.
The financial highlights for each of the three years in the period ended October 31, 2016 have been audited by other auditors, whose report dated December 22, 2016 expressed unqualified opinions on such financial highlights.
Basis for Opinion
These financial statements are the responsibility of the Fund’s management. Our responsibility is to express an opinion on the Fund’s financial statements based on our audits. We are a public accounting firm registered with the Public Company Accounting Oversight Board (United States) (“PCAOB”) and are required to be independent with respect to the Fund in accordance with the U.S. federal securities laws and the applicable rules and regulations of the Securities and Exchange Commission and the PCAOB. We have served as the auditor of one or more of the funds in the Trust since 2002.
We conducted our audits in accordance with the standards of the PCAOB. Those standards require that we plan and perform the audit to obtain reasonable assurance about whether the financial statements are free of material misstatement, whether due to error or fraud. The Fund is not required to have, nor were we engaged to perform, an audit of its internal control over financial reporting. As part of our audits we are required to obtain an understanding of internal control over financial reporting, but not for the purpose of expressing an opinion on the effectiveness of the Fund’s internal control over financial reporting. Accordingly, we express no such opinion.
Our audits included performing procedures to assess the risks of material misstatement of the financial statements, whether due to error or fraud, and performing procedures that respond to those risks. Such procedures included examining, on a test basis, evidence regarding the amounts and disclosures in the financial statements. Our audits also included evaluating the accounting principles used and significant estimates made by management, as well as evaluating the overall presentation of the financial statements. Our procedures included confirmation of securities owned as of October 31, 2018 by correspondence with the custodian. We believe that our audits provide a reasonable basis for our opinion.
TAIT, WELLER & BAKER LLP
Philadelphia, Pennsylvania
December 27, 2018
| HENNESSY FUNDS | 1-800-966-4354 | |
Trustees and Officers of the Fund (Unaudited)
The business and affairs of the Funds are managed under the direction of the Board of Trustees of the Trust, and the Board of Trustees elects the Officers of the Trust. Beginning in March 2015, the Board of Trustees has from time to time appointed advisers to the Board of Trustees (“Advisers”) with the intention of having qualified individuals serve in an advisory capacity in order to garner experience in the mutual fund and asset management industry and be considered as potential Trustees in the future. There are currently three Advisers: Brian Alexander, Doug Franklin, and Claire Knoles. As Advisers, Mr. Alexander, Mr. Franklin, and Ms. Knoles attend meetings of the Board of Trustees and act as non-voting participants. Information pertaining to the Trustees, Advisers, and the Officers of the Trust is set forth below. The Trustees and Officers serve until their successors are duly elected and qualified or until their earlier death, resignation, or removal. Each Trustee oversees the 16 Hennessy Funds. Unless otherwise indicated, the address of all persons listed below is 7250 Redwood Boulevard, Suite 200, Novato, CA 94945. The Fund’s Statement of Additional Information includes more information about the persons listed below and is available, without charge, upon request by calling 1-800-966-4354.
| | | | Other |
| | | | Directorships |
| | | | Held Outside |
| Name, (Year of Birth), | | | of Fund |
| and Position Held | Start Date | Principal Occupation(s) | Complex During |
with the Trust | of Service | During Past Five Years | Past Five Years(1) |
| | |
| Disinterested Trustees and Advisers | |
| | | | |
| J. Dennis DeSousa | January 1996 | Mr. DeSousa is a real estate investor. | None. |
| (1936) | | | |
| Trustee | | | |
| | | | |
| Robert T. Doyle | January 1996 | Mr. Doyle has been the Sheriff of | None. |
| (1947) | | Marin County, California since 1996. | |
| Trustee | | | |
| | | | |
| Gerald P. Richardson | May 2004 | Mr. Richardson is an independent | None. |
| (1945) | | consultant in the securities industry. | |
| Trustee | | | |
| | | | |
| Brian Alexander | March 2015 | Mr. Alexander has worked for the | None. |
| (1981) | | Sutter Health organization since | |
| Adviser to the Board | | 2011 in various positions. He has | |
| | | served as the Chief Executive Officer | |
| | | of the Sutter Roseville Medical | |
| | | Center since 2018. From 2016 through | |
| | | 2018, he served as the Vice President | |
| | | of Strategy for the Sutter Health Valley | |
| | | Area, which includes 11 hospitals, | |
| | | 13 ambulatory surgery centers, | |
| | | 16,000 employees, and 1,900 physicians. | |
| | | From 2013 through 2016, Mr. Alexander | |
| | | served as Sutter Novato Community | |
| | | Hospital’s Chief Administrative Officer, | |
| | | and from 2011 through 2012, he | |
| | | served as a Director of Strategy | |
| | | within Sutter’s West Bay Region. | |
| TRUSTEES AND OFFICERS OF THE FUND |
| | | | Other |
| | | | Directorships |
| | | | Held Outside |
| Name, (Year of Birth), | | | of Fund |
| and Position Held | Start Date | Principal Occupation(s) | Complex During |
with the Trust | of Service | During Past Five Years | Past Five Years(1) |
| | | | |
| Doug Franklin | March 2016 | Mr. Franklin is a retired insurance | None. |
| (1964) | | industry executive. From 1987 | |
| Adviser to the Board | | through 2015, he was employed | |
| | | by the Allianz-Fireman’s Fund | |
| | | Insurance Company in various | |
| | | positions, including as its Chief | |
| | | Actuary and Chief Risk Officer. | |
| | | | |
| Claire Knoles | December 2015 | Ms. Knoles is a founder of Kiosk and | None. |
| (1974) | | has served as its Chief Operating | |
| Adviser to the Board | | Officer since 2004. Kiosk is a full | |
| | | service marketing agency with | |
| | | offices in the San Francisco Bay | |
| | | Area, Toronto, and Liverpool, UK. | |
| | | | |
Interested Trustee(2) | | | |
| | | | |
| Neil J. Hennessy | January 1996 as | Mr. Neil Hennessy has been employed | Hennessy |
| (1956) | a Trustee and | by Hennessy Advisors, Inc. since | Advisors, Inc. |
| Trustee, Chairman of | June 2008 as | 1989 and currently serves as its | |
| the Board, Chief | an Officer | Chairman and Chief Executive Officer. | |
| Investment Officer, | | | |
| Portfolio Manager, | | | |
| and President | | | |
| Name, (Year of Birth), | | |
| and Position Held | Start Date | Principal Occupation(s) |
with the Trust | of Service | During Past Five Years |
| | | |
| Officers | | |
| | | |
| Teresa M. Nilsen | January 1996 | Ms. Nilsen has been employed by Hennessy Advisors, Inc. |
| (1966) | | since 1989 and currently serves as its President, Chief Operating |
| Executive Vice President | | Officer, and Secretary. |
| and Treasurer | | |
| | | |
| Daniel B. Steadman | March 2000 | Mr. Steadman has been employed by Hennessy Advisors, Inc. |
| (1956) | | since 2000 and currently serves as its Executive Vice President. |
| Executive Vice President | | |
| and Secretary | | |
| | | |
| Brian Carlson | December 2013 | Mr. Carlson has been employed by Hennessy Advisors, Inc. |
| (1972) | | since December 2013 and currently serves as its Chief |
| Senior Vice President | | Compliance Officer and Senior Vice President. |
| and Head of Distribution | | |
| | | |
| Jennifer Cheskiewicz | June 2013 | Ms. Cheskiewicz has been employed by Hennessy Advisors, Inc. |
(1977)(3) | | as its General Counsel since June 2013. |
| Senior Vice President and | | |
| Chief Compliance Officer | | |
| HENNESSY FUNDS | 1-800-966-4354 | |
| Name, (Year of Birth), | | |
| and Position Held | Start Date | Principal Occupation(s) |
with the Trust | of Service | During Past Five Years |
| | | |
| David Ellison | October 2012 | Mr. Ellison has been employed by Hennessy Advisors, Inc. since |
(1958)(4) | | October 2012. He has served as a Portfolio Manager of the |
| Senior Vice President | | Hennessy Large Cap Financial Fund and the Hennessy Small |
| and Portfolio Manager | | Cap Financial Fund since inception. Mr. Ellison also served as a |
| | | Portfolio Manager of the Hennessy Technology Fund from its |
| | | inception until February 2017. Mr. Ellison served as Director, |
| | | CIO and President of FBR Fund Advisers, Inc. from December |
| | | 1999 to October 2012. |
| | | |
| Ryan C. Kelley | March 2013 | Mr. Kelley has been employed by Hennessy Advisors, Inc. since |
(1972)(5) | | October 2012. He has served as a Portfolio Manager of the |
| Senior Vice President | | Hennessy Gas Utility Fund, the Hennessy Large Cap Financial |
| and Portfolio Manager | | Fund, and the Hennessy Small Cap Financial Fund since |
| | | October 2014. He served as Co-Portfolio Manager of the same |
| | | funds from March 2013 through September 2014, and as a |
| | | Portfolio Analyst for the Hennessy Funds from October 2012 |
| | | through February 2013. Mr. Kelley has also served as a Portfolio |
| | | Manager of the Hennessy Cornerstone Growth Fund, the |
| | | Hennessy Cornerstone Mid Cap 30 Fund, the Hennessy |
| | | Cornerstone Large Growth Fund, and the Hennessy |
| | | Cornerstone Value Fund since February 2017, as a Co-Portfolio |
| | | Manager of the Hennessy Technology Fund since February |
| | | 2017, and as a Portfolio Manager of the Hennessy Total Return |
| | | Fund and the Hennessy Balanced Fund since May 2018. |
| | | Mr. Kelley served as Portfolio Manager of FBR Fund Advisers, |
| | | Inc. from January 2008 to October 2012. |
| | | |
| Tania Kelley | October 2003 | Ms. Kelley has been employed by Hennessy Advisors, Inc. |
| (1965) | | since October 2003. |
| Senior Vice President | | |
| and Head of Marketing | | |
| Daniel P. Hennessy | December 2016 | Mr. Daniel Hennessy has been employed by Hennessy Advisors, |
| (1990) | | Inc. since 2015. He has served as an Associate Analyst or |
| Vice President | | Analyst of the Hennessy Technology Fund since February 2017. |
| and Analyst | | Mr. Daniel Hennessy previously served as a Mutual Fund |
| | | Specialist at U.S. Bancorp Fund Services, LLC (now doing |
| | | business as U.S. Bank Global Fund Services) from November |
| | | 2014 to July 2015. Prior to that, he attended the University of |
| | | San Diego, where he earned a degree in Political Science. |
_______________
(1) | Messrs. DeSousa, Doyle, N. Hennessy, and Richardson previously served on the Board of Directors of Hennessy Mutual Funds, Inc. (“HMFI”), The Hennessy Funds, Inc. (“HFI”), and Hennessy SPARX Funds Trust (“HSFT”). Pursuant to an internal reorganization effective as of February 28, 2014, the series of HFMI, HFI, and HSFT were reorganized into corresponding series of the Trust that mirrored them. Subsequent to the reorganization, HFMI, HFI, and HSFT were dissolved. |
(2) | Mr. N. Hennessy is considered an “interested person,” as defined in the Investment Company Act of 1940, as amended, because he is an officer of the Hennessy Funds. |
(3) | The address of this officer is 4800 Bee Caves Road, Suite 100, Austin, TX 78746. |
(4) | The address of this officer is 101 Federal Street, Suite 1900, Boston, MA 02110. |
(5) | The address of this officer is 1340 Environ Way, Suite 332, Chapel Hill, NC 27517. |
| TRUSTEES AND OFFICERS OF THE FUND |
(This Page Intentionally Left Blank.)
| HENNESSY FUNDS | 1-800-966-4354 | |
Expense Example (Unaudited)
October 31, 2018
As a shareholder of the Fund, you incur ongoing costs, including management fees, service fees, and other Fund expenses. This Example is intended to help you understand your ongoing costs (in dollars) of investing in the Fund and to compare these costs with the ongoing costs of investing in other mutual funds. The Example is based on an investment of $1,000 invested at the beginning of the period and held for the entire period from May 1, 2018, through October 31, 2018.
Actual Expenses
The first line of the table below provides information about actual account values and actual expenses. Although the Fund charges no sales loads or transaction fees, you will be assessed fees for outgoing wire transfers, returned checks and stop payment orders at prevailing rates charged by U.S. Bank Global Fund Services, the Fund’s transfer agent. If you request that a redemption be made by wire transfer, currently a $15 fee is charged by the Fund’s transfer agent. IRA accounts will be charged a $15 annual maintenance fee. The example below includes, but is not limited to, management fees, shareholder servicing fees, fund accounting, custody, and transfer agent fees. However, the example below does not include portfolio trading commissions and related expenses, and other extraordinary expenses as determined under generally accepted accounting principles. You may use the information in this line, together with the amount you invested, to estimate the expenses that you paid over the period. Simply divide your account value by $1,000 (for example, an $8,600 account value divided by $1,000 = 8.6), then multiply the result by the number in the first line of the table under the heading entitled “Expenses Paid During Period” to estimate the expenses you paid on your account during this period.
Hypothetical Example for Comparison Purposes
The second line of the table below provides information about hypothetical account values and hypothetical expenses based on the Fund’s actual expense ratio and an assumed rate of return of 5% per year before expenses, which is not the Fund’s actual return. The hypothetical account values and expenses may not be used to estimate the actual ending account balance or expenses you paid for the period. You may use this information to compare the ongoing costs of investing in the Fund and other funds. To do so, compare this 5% hypothetical example with the 5% hypothetical examples that appear in the shareholder reports of the other funds. Please note that the expenses shown in the table are meant to highlight your ongoing costs only. Therefore, the second line of the table is useful in comparing ongoing costs only, and will not help you determine the relative total costs of owning different funds.
| | | | Expenses Paid |
| | Beginning | Ending | During Period(1) |
| | Account Value | Account Value | May 1, 2018 – |
| | May 1, 2018 | October 31, 2018 | October 31, 2018 |
| Investor Class | | | |
| Actual | $1,000.00 | $1,018.10 | $9.31 |
| Hypothetical (5% return before expenses) | $1,000.00 | $1,015.98 | $9.30 |
(1) | Expenses are equal to the Fund’s annualized expense ratio of 1.83% multiplied by the average account value over the period, multiplied by 184/365 days (to reflect one-half year period). |
| HENNESSY FUNDS | 1-800-966-4354 | |
How to Obtain a Copy of the Fund’s
Proxy Voting Policy and Proxy Voting Records
A description of the policies and procedures the Fund uses to determine how to vote proxies relating to portfolio securities is available without charge: (1) by calling 1-800-966-4354; (2) on the Hennessy Funds’ website at www.hennessyfunds.com/proxy-voting/voting-policy; or (3) on the U.S. Securities and Exchange Commission’s (the “SEC”) website at www.sec.gov. The Fund’s proxy voting record is available without charge on both the Hennessy Funds’ website at www.hennessyfunds.com/proxy-voting/voting-record and the SEC’s website at www.sec.gov no later than August 31 for the prior 12 months ending June 30.
Quarterly Filings on Form N-Q
The Fund files a complete schedule of portfolio holdings with the SEC for the first and third quarters of each fiscal year on Form N-Q. The Fund’s Forms N-Q are available on the SEC’s website at www.sec.gov. Information included in the Fund’s Forms N-Q will also be available upon request by calling 1-800-966-4354.
Federal Tax Distribution Information
(Unaudited)
For fiscal year 2018, certain dividends paid by the Fund may be subject to a maximum tax rate of 23.8%, as provided for by the Jobs and Growth Tax Relief Reconciliation Act of 2003. The percentage of dividends declared from ordinary income designated as qualified dividend income was 100.00%.
For corporate shareholders, the percent of ordinary income distributions that qualified for the corporate dividends received deduction for fiscal year 2018 was 100.00%.
The percentage of taxable ordinary income distributions that were designated as short-term capital gain distributions under Section 871(k)(2)(C) of the Internal Revenue Code of 1986, as amended, for the Fund was 43.12%.
Important Notice Regarding Delivery
of Shareholder Documents
To help keep the Fund’s costs as low as possible, we generally deliver a single copy of shareholder reports, proxy statements, and prospectuses to shareholders who share an address and have the same last name. This process does not apply to account statements. You may request an individual copy of a shareholder document at any time. If you would like to receive separate mailings of shareholder documents, please call U.S. Bank Global Fund Services at 1-800-261-6950 or 1-414-765-4124, and individual delivery will begin within 30 days of your request. If your account is held through a financial institution or other intermediary, please contact such intermediary directly to request individual delivery.
| PROXY VOTING — PRIVACY POLICY |
Privacy Policy
We collect the following non-public personal information about you:
| | • | information we receive from you on or in applications or other forms, correspondence, or conversations, including, but not limited to, your name, address, phone number, social security number, assets, income, and date of birth; and |
| | | |
| | • | information about your transactions with us, our affiliates, or others, including, but not limited to, your account number and balance, payment history, parties to transactions, cost basis information, and other financial information. |
We do not disclose any non-public personal information about our current or former shareholders to non-affiliated third parties, except as permitted by law. For example, we are permitted by law to disclose all of the information we collect, as described above, to our Transfer Agent to process your transactions. Furthermore, we restrict access to your non-public personal information to those persons who require such information to provide products or services to you. We maintain physical, electronic, and procedural safeguards that comply with federal standards to guard your non-public personal information.
In the event that you hold shares of the Fund through a financial intermediary, including, but not limited to, a broker-dealer, bank, or trust company, the privacy policy of your financial intermediary would govern how your non-public personal information will be shared with non-affiliated third parties.
| HENNESSY FUNDS | 1-800-966-4354 | |
For information, questions or assistance, please call
The Hennessy Funds
1-800-966-4354 or 1-415-899-1555
INVESTMENT ADVISOR
Hennessy Advisors, Inc.
7250 Redwood Boulevard, Suite 200
Novato, California 94945
ADMINISTRATOR,
TRANSFER AGENT,
DIVIDEND PAYING AGENT, &
SHAREHOLDER SERVICING AGENT
U.S. Bancorp Fund Services, LLC
d/b/a U.S. Bank Global Fund Services
P.O. Box 701
Milwaukee, Wisconsin 53201-0701
CUSTODIAN
U.S. Bank N.A.
Custody Operations
1555 North River Center Drive, Suite 302
Milwaukee, Wisconsin 53212
TRUSTEES
Neil J. Hennessy
Robert T. Doyle
J. Dennis DeSousa
Gerald P. Richardson
COUNSEL
Foley & Lardner LLP
777 East Wisconsin Avenue
Milwaukee, Wisconsin 53202-5306
INDEPENDENT REGISTERED
PUBLIC ACCOUNTING FIRM
Tait, Weller & Baker LLP
Two Liberty Place
50 South 16th Street, Suite 2900
Philadelphia, Pennsylvania 19102-2529
DISTRIBUTOR
Quasar Distributors, LLC
777 East Wisconsin Avenue
Milwaukee, Wisconsin 53202
hennessyfunds.com | 1-800-966-4354
This report has been prepared for shareholders and may be distributed to
others only if preceded or accompanied by a current prospectus.
ANNUAL REPORT
OCTOBER 31, 2018
HENNESSY BP ENERGY FUND
Investor Class HNRGX
Institutional Class HNRIX
hennessyfunds.com | 1-800-966-4354
(This Page Intentionally Left Blank.)
Contents
| Letter to Shareholders | 2 |
| Performance Overview | 4 |
| Financial Statements | |
| Schedule of Investments | 7 |
| Statement of Assets and Liabilities | 11 |
| Statements of Operations | 12 |
| Statements of Changes in Net Assets | 14 |
| Financial Highlights | 16 |
| Notes to the Financial Statements | 20 |
| Report of Independent Registered Public Accounting Firm | 31 |
| Trustees and Officers of the Fund | 32 |
| Expense Example | 36 |
| Proxy Voting Policy and Proxy Voting Records | 38 |
| Quarterly Schedule of Investments | 38 |
| Important Notice Regarding Delivery of Shareholder Documents | 38 |
| Board Approval of Investment Advisory Agreements | 39 |
| Privacy Policy | 44 |
| HENNESSY FUNDS | 1-800-966-4354 | |
December 2018
Dear Hennessy Funds Shareholder:
Over the past year, we have witnessed the return of market volatility. U.S. stocks still registered healthy gains, bolstered by the impact on corporate profits of the successful passage of the tax reform bill in December 2017. However, concerns over potential trade disruptions, especially between the U.S. and China, and worries over higher short-term interest rates, which many believe could possibly trigger a recession down the road, put downward pressure on equity valuations.
The U.S. economy performed well over the period, and actually achieved an acceleration in GDP growth to over 3% on an annualized basis in the second and third quarters of calendar year 2018. During the past year, companies continued to hire workers, adding over 200,000 jobs per month on average, sending the unemployment rate down to 3.7% in October, which is the lowest it has been since 1969. Consumer confidence is high and still rising, and corporate profits reached record levels in the third quarter of calendar year 2018, posting a year-over-year increase of 26% for the companies in the S&P 500 Index.
The Federal Reserve, confident about the strength of the economy and mindful of a tight labor market, raised short-term interest rates four times over the last year, by a quarter point each time. Long-term bond yields also rose, driven higher primarily by evidence of faster wage growth, pushing the U.S. 10-year Treasury bond over 3% for the first time since 2013.
As I write this, we are experiencing the market’s 20th downturn since 2010. I have been saying that every bull market experiences volatility and pullbacks. Many financial commentators think this bull market is “long in the tooth.” I do not agree with them. I believe stock valuations are still very reasonable. The prospective price to earnings multiple for the Dow Jones Industrial Average has come down from almost 20x at the end of 2017 to 16x, just above its 10-year average of 15x. The prospective PE multiple for the S&P 500 Index has also come down, from 20x to 17x, and compares favorably to its 10-year average of 16x.
Cash, meanwhile, continues to build up on corporate balance sheets. The companies in the S&P 500 Index reported a total of over $5.4 trillion in cash and marketable securities in their latest filings. Companies have been spending some of their cash, increasing their investment spending and laying the groundwork for future earnings growth. However, they have also been returning capital to shareholders. S&P 500 Index companies announced $433.6 billion in share repurchases during the second quarter of calendar year 2018, nearly doubling the previous record of $242.1 billion set in the first quarter. Companies are also raising their dividends.
In addition, I believe the Federal Reserve will take care not to raise interest rates too high or too fast and endanger the economic expansion. While wage growth has risen to over 3% in October, other measures of inflationary pressure, such as the Consumer Price Index and the Producer Price Index, still show prices increasing at a more moderate pace, closer to 2%. Given continued evidence of modest rates of inflation, I believe the Fed will be able to maintain its gradual pace of interest rate hikes.
Finally and importantly, I still see no signs of euphoria in this market. In my opinion, the enthusiasm present earlier in the year, which followed the significant reduction in corporate income tax rates, has largely evaporated, and it has been replaced with anxiety
over higher interest rates and their potential impact on growth. In the past, I have likened the current bull market to that of 1982-2000, and I still believe this comparison holds true. I am confident in the strength of the market today and believe the economy will continue to grow in the coming year, albeit at a more moderate pace.
Thank you for your continued confidence and investment in the Hennessy Funds. If you have any questions or would like to speak with us directly, please don’t hesitate to call us at (800) 966-4354.
Best regards,
Neil J. Hennessy
President and Chief Investment Officer
Past performance does not guarantee future results.
Mutual fund investing involves risk. Principal loss is possible.
Opinions expressed are those of Neil Hennessy and are subject to change, are not guaranteed, and should not be considered investment advice.
The Dow Jones Industrial Average and S&P 500 Index are commonly used to measure the performance of U.S. stocks. One cannot invest directly in an index.
PE, or price to earnings, is a valuation measure and is calculated by dividing a company’s market price per share by its earnings per share. Earnings growth is not a measure of a fund’s future performance.
| HENNESSY FUNDS | 1-800-966-4354 | |
Performance Overview (Unaudited)
CHANGE IN VALUE OF $10,000 INVESTMENT
This graph illustrates the performance of an initial investment of $10,000 made in the Fund on its inception date and assumes the reinvestment of dividends.
AVERAGE TOTAL RETURN FOR PERIODS ENDED OCTOBER 31, 2018
| | | One | Since Inception |
| | 11 Months(1) | Year | (12/31/13) |
| Hennessy BP Energy Fund – | | | |
| Investor Class (HNRGX) | -5.91% | -3.58% | -1.25% |
| Hennessy BP Energy Fund – | | | |
| Institutional Class (HNRIX) | -5.66% | -3.29% | -1.02% |
| S&P 500 Energy Index | 0.01% | 1.78% | -2.74% |
| S&P North American Natural | | | |
| Resources Sector Index | -4.07% | -2.56% | -3.98% |
| S&P 500 Index | 4.15% | 7.35% | 10.49% |
Expense ratios: 1.87% (Investor Class); 1.57% (Institutional Class)
(1) | The period ended October 31, 2018, consists of 11 months because the Fund changed its fiscal year end from November 30 to October 31, effective October 26, 2018. |
Performance data quoted represents past performance; past performance does not guarantee future results. The investment return and principal value of an investment will fluctuate so that an investor’s shares, when redeemed, may be worth more or less than their original cost. The performance table does not reflect the deduction of taxes that a shareholder would pay on Fund distributions or the redemption of Fund shares. Current performance of the Fund may be lower or higher than the performance quoted. Performance data current to the most recent month end may be obtained by visiting www.hennessyfunds.com. Performance for periods on or prior to October 26, 2018, is that of the BP Capital TwinLine Energy Fund.
The S&P 500 Energy Index is commonly used to measure the performance of U.S. energy stocks. The S&P North American Natural Resources Sector Index is commonly used to measure the performance of U.S. stocks in the energy and materials sectors. The S&P 500 Index is commonly used to measure the performance of U.S. stocks. One cannot invest directly in an index.
The expense ratios presented are from the most recent prospectus. The expense ratios for the current reporting period are available in the Financial Highlights section of this report.
PERFORMANCE NARRATIVE
Portfolio Managers Toby Loftin, Trip Rodgers, CFA, and Tim Dumois
BP Capital Fund Advisors, LLC (sub-advisor)
Performance:
For the 11-month period ended October 31, 2018, the Investor Class of the Hennessy BP Energy Fund returned -5.91%, underperforming the S&P 500 Energy Index (the Fund’s primary benchmark), the S&P North American Natural Resources Sector Index, and the S&P 500 Index, which returned 0.01%, -4.07%, and 4.15%, respectively, for the same period.
The Fund’s underperformance relative to its primary benchmark was due in part to its overweight position in oilfield service equities, as well as high exposure to small and midsize oil producers that performed poorly, particularly late in the period as oil prices retreated. The Fund’s holdings in energy end-user groups also detracted from relative performance, as a result of weak performance from stocks in the Materials and Industrials sectors.
Portfolio Strategy:
The Fund seeks to invest in companies across the energy value chain. This includes crude oil and natural gas exploration and production companies, oilfield service providers, midstream companies, refiners, and energy end users. In particular, we believe the inclusion of energy end users, such as materials, industrials, and transportation companies, differentiates the Fund from traditional energy funds. Including such companies in the investment universe enables the Fund to invest in a broader range of energy-related themes and provides greater flexibility to adjust subsector weightings based on our investment outlook. The Fund typically owns 25-40 securities and historically has had little overlap with the top holdings of commonly-used energy and commodity equity benchmarks.
Investment Commentary:
A continuation of global inventory drawdowns was the primary driver of higher oil prices in the 11-month period ended October 31, 2018. Global demand for crude oil and refined products stayed relatively strong, while a decline in exports from two large oil-producing countries, Venezuela and Iran, as a result of geopolitical issues constrained supply.
Late in the period, oil prices retreated as investors worried that a stronger U.S. dollar and slower growth outside the United States could lead to a softening in demand for crude oil. Investors also feared that a substantial boost in exports from Saudi Arabia, robust production growth in the United States, and the discussion of temporary waivers to be given to select countries relating to Iranian oil import restrictions could boost supply. Despite this price correction, we believe Saudi Arabia’s continued dependence on higher oil prices to fund its fiscal budget will lead OPEC to take measures to support prices, as it did with production cuts at the beginning of 2017. Additionally, we believe demographic factors will continue to support crude oil demand growth from emerging markets.
Since its inception, the Fund has maintained a preference for oil and gas production through horizontal fracking of shale deposits. This has resulted in an overweight positioning of the Fund in U.S.-focused producers. Many of these companies have significantly lowered their operating costs and greatly expanded their production and reserves in recent years. We also see attractive investment opportunities in companies servicing these shale producers, as well as in midstream companies that enable the critical flow of crude oil and natural gas from production centers to end-user markets, both in the United States and abroad.
| HENNESSY FUNDS | 1-800-966-4354 | |
We remain optimistic regarding companies in the Energy sector, particularly exploration and production companies, many of which have recently adopted more shareholder-friendly strategies. We believe management teams are more focused today on spending only as much as they generate from operating cash flows and on returning free cash flow to shareholders through dividends and share repurchases. Finally, we expect consolidation to remain a major sector theme in upcoming years, as U.S. companies seek to amass the most efficient and productive acreage positions in key areas like the Permian Basin and to eliminate corporate overhead.
_______________
Opinions expressed are those of the Portfolio Managers as of the date written and are subject to change, are not guaranteed, and should not be considered investment advice or an indication of trading intent.
The Fund invests in small-capitalization and medium-capitalization companies, which involves additional risks such as limited liquidity and greater volatility. Funds that concentrate in a single sector may be subject to a higher degree of risk. Energy-related companies are subject to specific risks, including fluctuations in commodity prices and consumer demand, substantial government regulation, and depletion of reserves. Investments in lower-rated and non-rated securities present a greater risk of loss to principal and interest than higher-rated securities. Use of derivatives can increase the volatility of the Fund.
MLPs and MLP investments have unique characteristics. The Fund does not receive the same tax benefits as a direct investment in an MLP.
The prices of MLP units may fluctuate abruptly and trading volume may be low, making it difficult for the Fund to sell its units at a favorable price. MLP general partners have the power to take actions that adversely affect the interests of unit holders. Most MLPs do not pay U.S. federal income tax at the partnership level, but an adverse change in tax laws could result in MLPs being treated as corporations for federal income tax purposes, which could reduce or eliminate distributions paid by MLPs to the Fund. If the Fund’s MLP investments exceed 25% of its assets, the Fund may not qualify for treatment as a regulated investment company under the Internal Revenue Code. The Fund would be taxed as an ordinary corporation, which could substantially reduce the Fund’s net assets and its distributions to shareholders. Please see the Fund’s prospectus for a more complete discussion of these and other risks.
References to specific securities should not be considered a recommendation to buy or sell any security. Fund holdings and sector allocations are subject to change. Please refer to the Schedule of Investments included in this report for additional portfolio information.
Cash flow refers to the net amount of cash and cash equivalents being transferred into and out of a company.
| PERFORMANCE OVERVIEW/SCHEDULE OF INVESTMENTS |
Financial Statements
Schedule of Investments as of October 31, 2018 |
HENNESSY BP ENERGY FUND
(% of Total Assets)
| TOP TEN HOLDINGS (EXCLUDING MONEY MARKET FUNDS) | % TOTAL ASSETS |
| Diamondback Energy, Inc. | 3.87% |
| WPX Energy, Inc. | 3.75% |
| Nutrien Ltd. | 3.70% |
| ProPetro Holding Corp. | 3.54% |
| Quanta Services, Inc. | 3.52% |
| Patterson-UTI Energy, Inc. | 3.52% |
| Parsley Energy, Inc., Class A | 3.52% |
| Targa Resources Corp. | 3.36% |
| Pioneer Natural Resources Co. | 3.32% |
| Knight-Swift Transportation Holdings, Inc. | 3.32% |
Note: The Fund concentrates its investments in the Energy industry. For presentation purposes, the Fund uses custom categories.
| HENNESSY FUNDS | 1-800-966-4354 | |
| COMMON STOCKS – 89.05% | | Number | | | | | | % of | |
| | | of Shares | | | Value | | | Net Assets | |
| Agricultural Products – 3.72% | | | | | | | | | |
| Nutrien Ltd. (b) | | | 68,139 | | | $ | 3,606,597 | | | | 3.72 | % |
| | | | | | | | | | | | | |
| Building Materials – 1.86% | | | | | | | | | | | | |
| Summit Materials, Inc., Class A (a) | | | 133,715 | | | | 1,805,153 | | | | 1.86 | % |
| | | | | | | | | | | | | |
| Chemicals – 3.04% | | | | | | | | | | | | |
| Huntsman Corp. | | | 134,575 | | | | 2,944,501 | | | | 3.04 | % |
| | | | | | | | | | | | | |
| Downstream – 5.22% | | | | | | | | | | | | |
| Delek U.S. Holdings, Inc. | | | 74,491 | | | | 2,735,309 | | | | 2.82 | % |
| Marathon Petroleum Corp. | | | 32,975 | | | | 2,323,089 | | | | 2.40 | % |
| | | | | | | | 5,058,398 | | | | 5.22 | % |
| | | | | | | | | | | | | |
| Exploration & Production – 39.21% | | | | | | | | | | | | |
| Anadarko Petroleum Corp. | | | 51,949 | | | | 2,763,687 | | | | 2.85 | % |
| Antero Resources Corp. (a) | | | 193,917 | | | | 3,081,341 | | | | 3.18 | % |
| Callon Petroleum Co. (a) | | | 223,219 | | | | 2,225,493 | | | | 2.29 | % |
| Continental Resources, Inc. (a) | | | 44,784 | | | | 2,359,221 | | | | 2.43 | % |
| Diamondback Energy, Inc. | | | 33,612 | | | | 3,776,644 | | | | 3.89 | % |
| Encana Corp. (b) | | | 181,515 | | | | 1,858,714 | | | | 1.92 | % |
| EOG Resources, Inc. | | | 8,273 | | | | 871,478 | | | | 0.90 | % |
| HighPoint Resources Corp. (a) | | | 307,794 | | | | 1,144,994 | | | | 1.18 | % |
| Marathon Oil Corp. | | | 139,367 | | | | 2,646,579 | | | | 2.73 | % |
| Newfield Exploration Co. (a) | | | 99,874 | | | | 2,017,455 | | | | 2.08 | % |
| Oasis Petroleum, Inc. (a) | | | 181,859 | | | | 1,829,501 | | | | 1.89 | % |
| Occidental Petroleum Corp. | | | 46,470 | | | | 3,116,743 | | | | 3.21 | % |
| Parsley Energy, Inc., Class A (a) | | | 146,464 | | | | 3,430,187 | | | | 3.54 | % |
| Pioneer Natural Resources Co. | | | 21,980 | | | | 3,236,995 | | | | 3.34 | % |
| WPX Energy, Inc. (a) | | | 228,441 | | | | 3,664,194 | | | | 3.78 | % |
| | | | | | | | 38,023,226 | | | | 39.21 | % |
| | | | | | | | | | | | | |
| Metals & Mining – 6.10% | | | | | | | | | | | | |
| Alcoa Corp. (a) | | | 77,332 | | | | 2,705,847 | | | | 2.79 | % |
| The Timken Co. | | | 81,264 | | | | 3,213,991 | | | | 3.31 | % |
| | | | | | | | 5,919,838 | | | | 6.10 | % |
| | | | | | | | | | | | | |
| Midstream – 5.76% | | | | | | | | | | | | |
| Targa Resources Corp. | | | 63,449 | | | | 3,278,410 | | | | 3.38 | % |
| The Williams Companies, Inc. | | | 94,713 | | | | 2,304,367 | | | | 2.38 | % |
| | | | | | | | 5,582,777 | | | | 5.76 | % |
The accompanying notes are an integral part of these financial statements.
| COMMON STOCKS | | Number | | | | | | % of | |
| | | of Shares | | | Value | | | Net Assets | |
| Oil Services – 20.80% | | | | | | | | | |
| Forum Energy Technologies, Inc. (a) | | | 235,215 | | | $ | 2,107,526 | | | | 2.17 | % |
| Halliburton Co. | | | 83,453 | | | | 2,894,150 | | | | 2.98 | % |
| MRC Global, Inc. (a) | | | 135,723 | | | | 2,148,495 | | | | 2.22 | % |
| Patterson-UTI Energy, Inc. | | | 206,198 | | | | 3,431,135 | | | | 3.54 | % |
| ProPetro Holding Corp. (a) | | | 195,888 | | | | 3,457,423 | | | | 3.57 | % |
| Quanta Services, Inc. (a) | | | 110,159 | | | | 3,436,961 | | | | 3.54 | % |
| Solaris Oilfield Infrastructure, Inc., Class A (a) | | | 204,190 | | | | 2,695,308 | | | | 2.78 | % |
| | | | | | | | 20,170,998 | | | | 20.80 | % |
| | | | | | | | | | | | | |
| Transportation – 3.34% | | | | | | | | | | | | |
| Knight-Swift Transportation Holdings, Inc. | | | 101,128 | | | | 3,236,096 | | | | 3.34 | % |
| | | | | | | | | | | | | |
| Total Common Stocks | | | | | | | | | | | | |
| (Cost $93,627,859) | | | | | | | 86,347,584 | | | | 89.05 | % |
| | | | | | | | | | | | | |
| PARTNERSHIPS & TRUSTS – 10.07% | | | | | | | | | | | | |
| | | | | | | | | | | | | |
| Midstream – 10.07% | | | | | | | | | | | | |
| Energy Transfer LP | | | 169,046 | | | | 2,626,971 | | | | 2.71 | % |
| Enterprise Products Partners LP | | | 108,236 | | | | 2,902,890 | | | | 3.00 | % |
| MPLX LP | | | 61,836 | | | | 2,078,308 | | | | 2.14 | % |
| Plains All American Pipeline LP | | | 98,929 | | | | 2,153,684 | | | | 2.22 | % |
| | | | | | | | 9,761,853 | | | | 10.07 | % |
| Total Partnerships & Trusts | | | | | | | | | | | | |
| (Cost $10,043,233) | | | | | | | 9,761,853 | | | | 10.07 | % |
The accompanying notes are an integral part of these financial statements.
| HENNESSY FUNDS | 1-800-966-4354 | |
| SHORT-TERM INVESTMENTS – 1.20% | | Number | | | | | | % of | |
| | | of Shares | | | Value | | | Net Assets | |
| Money Market Funds – 1.20% | | | | | | | | | |
| Morgan Stanley Institutional Liquidity Funds, | | | | | | | | | |
| Government Portfolio, 2.05% (c) | | | 1,163,922 | | | $ | 1,163,922 | | | | 1.20 | % |
| | | | | | | | | | | | | |
| Total Short-Term Investments | | | | | | | | | | | | |
| (Cost $1,163,922) | | | | | | | 1,163,922 | | | | 1.20 | % |
| | | | | | | | | | | | | |
| Total Investments | | | | | | | | | | | | |
| (Cost $104,835,014) – 100.32% | | | | | | | 97,273,359 | | | | 100.32 | % |
| Liabilities in Excess of Other Assets – (0.32)% | | | | | | | (311,345 | ) | | | (0.32 | )% |
| | | | | | | | | | | | | |
TOTAL NET ASSETS – 100.00% | | | | | | $ | 96,962,014 | | | | 100.00 | % |
Percentages are stated as a percent of net assets.
| (a) | Non-income producing security. |
| (b) | U.S.-traded security of a foreign corporation |
| (c) | The rate listed is the fund’s seven-day yield as of October 31, 2018. |
Summary of Fair Value Exposure at October 31, 2018
The following is a summary of the inputs used to value the Fund’s net assets as of October 31, 2018 (See Note 3 in the accompanying notes to the financial statements):
| Common Stocks | | Level 1 | | | Level 2 | | | Level 3 | | | Total | |
| Agricultural Products | | $ | 3,606,597 | | | $ | — | | | $ | — | | | $ | 3,606,597 | |
| Building Materials | | | 1,805,153 | | | | — | | | | — | | | | 1,805,153 | |
| Chemicals | | | 2,944,501 | | | | — | | | | — | | | | 2,944,501 | |
| Downstream | | | 5,058,398 | | | | — | | | | — | | | | 5,058,398 | |
| Exploration & Production | | | 38,023,226 | | | | — | | | | — | | | | 38,023,226 | |
| Metals & Mining | | | 5,919,838 | | | | — | | | | — | | | | 5,919,838 | |
| Midstream | | | 5,582,777 | | | | — | | | | — | | | | 5,582,777 | |
| Oil Services | | | 20,170,998 | | | | — | | | | — | | | | 20,170,998 | |
| Transportation | | | 3,236,096 | | | | — | | | | — | | | | 3,236,096 | |
| Total Common Stocks | | $ | 86,347,584 | | | $ | — | | | $ | — | | | $ | 86,347,584 | |
| Partnerships & Trusts | | | | | | | | | | | | | | | | |
| Midstream | | $ | 9,761,853 | | | $ | — | | | $ | — | | | $ | 9,761,853 | |
| Total Partnerships & Trusts | | $ | 9,761,853 | | | $ | — | | | $ | — | | | $ | 9,761,853 | |
| Short-Term Investments | | | | | | | | | | | | | | | | |
| Money Market Funds | | $ | 1,163,922 | | | $ | — | | | $ | — | | | $ | 1,163,922 | |
| Total Short-Term Investments | | $ | 1,163,922 | | | $ | — | | | $ | — | | | $ | 1,163,922 | |
| Total Investments | | $ | 97,273,359 | | | $ | — | | | $ | — | | | $ | 97,273,359 | |
The accompanying notes are an integral part of these financial statements.
| SCHEDULE OF INVESTMENTS/STATEMENT OF ASSETS AND LIABILITIES |
Financial Statements
Statement of Assets and Liabilities as of October 31, 2018 |
| ASSETS: | | | |
| Investments in securities, at value (cost $104,835,014) | | $ | 97,273,359 | |
| Cash | | | 1,820 | |
| Dividends and interest receivable | | | 950 | |
| Return of capital receivable | | | 134,229 | |
| Receivable for fund shares sold | | | 163,732 | |
| Prepaid expenses and other assets | | | 11,873 | |
| Total Assets | | | 97,585,963 | |
| | | | | |
| LIABILITIES: | | | | |
| Payable for securities purchased | | | 295,311 | |
| Payable for fund shares redeemed | | | 123,258 | |
| Payable to advisor | | | 112,147 | |
| Payable to administrator | | | 19,668 | |
| Payable to auditor | | | 25,100 | |
| Accrued distribution fees | | | 4,212 | |
| Accrued service fees | | | 249 | |
| Accrued trustees fees | | | 3,450 | |
| Accrued expenses and other payables | | | 40,554 | |
| Total Liabilities | | | 623,949 | |
| NET ASSETS | | $ | 96,962,014 | |
| | | | | |
| NET ASSETS CONSIST OF: | | | | |
| Capital stock | | $ | 106,022,804 | |
| Total distributable earnings | | | (9,060,790 | ) |
| Total Net Assets | | $ | 96,962,014 | |
| | | | | |
| NET ASSETS | | | | |
| Investor Class: | | | | |
| Shares authorized (no par value) | | Unlimited | |
| Net assets applicable to outstanding Investor Class shares | | $ | 18,155,294 | |
| Shares issued and outstanding | | | 990,785 | |
| Net asset value, offering price and redemption price per share | | $ | 18.32 | |
| | | | | |
| Institutional Class: | | | | |
| Shares authorized (no par value) | | Unlimited | |
| Net assets applicable to outstanding Institutional Class shares | | $ | 78,806,720 | |
| Shares issued and outstanding | | | 4,260,643 | |
| Net asset value, offering price and redemption price per share | | $ | 18.50 | |
The accompanying notes are an integral part of these financial statements.
| HENNESSY FUNDS | 1-800-966-4354 | |
Financial Statements
| | | 11 Months Ended | | | Year Ended | |
| | | October 31, 2018(1) | | | November 30, 2017 | |
| INVESTMENT INCOME: | | | | | | |
| Distributions received from master limited partnerships | | $ | 1,230,991 | | | $ | 2,132,699 | |
| Less: return of capital on distributions received | | | (1,138,853 | ) | | | (2,082,043 | ) |
Dividend income from common stock(2) | | | 804,121 | | | | 831,100 | |
| Interest income | | | 45,114 | | | | 39,985 | |
| Other income | | | 976 | | | | — | |
| Total investment income | | | 942,349 | | | | 921,741 | |
| | | | | | | | | |
| EXPENSES: | | | | | | | | |
| Investment advisory fees (See Note 5) | | | 1,517,058 | | | | 1,786,981 | |
| Administration, fund accounting, custody | | | | | | | | |
| and transfer agent fees (See Note 5) | | | 170,107 | | | | 219,246 | |
| Sub-transfer agent expenses – | | | | | | | | |
| Investor Class (See Note 5) | | | 12,208 | | | | 36,685 | (3) |
| Sub-transfer agent expenses – | | | | | | | | |
| Institutional Class (See Note 5) | | | 58,982 | | | | 116,336 | |
| Distribution fees – Investor Class (See Note 5) | | | 51,574 | | | | 102,684 | (3) |
| Federal and state registration fees | | | 43,988 | | | | 62,625 | |
| Audit fees | | | 25,100 | | | | 25,013 | |
| Trustees’ fees and expenses | | | 17,848 | | | | 13,924 | |
| Reports to shareholders | | | 17,670 | | | | 15,910 | |
| Compliance expense (See Note 5) | | | 10,649 | | | | 12,211 | |
| Legal fees | | | 4,946 | | | | 10,382 | |
| Service fees – Investor Class (See Note 5) | | | 249 | | | | — | |
| Interest expense (See Note 7) | | | 197 | | | | 93 | |
| Other expenses | | | 28,507 | | | | 24,275 | |
| Total expenses | | | 1,959,083 | | | | 2,426,365 | |
| NET INVESTMENT LOSS | | $ | (1,016,734 | ) | | $ | (1,504,624 | ) |
| | | | | | | | | |
| REALIZED AND UNREALIZED GAINS (LOSSES): | | | | | | | | |
| Net realized gain on: | | | | | | | | |
| Investments | | $ | 12,791,029 | | | $ | 14,678,919 | |
| Written options | | | — | | | | 31,308 | |
| Net change in unrealized | | | | | | | | |
| appreciation/depreciation on investments | | | (15,177,094 | ) | | | (20,430,679 | ) |
| Net loss on investments | | | (2,386,065 | ) | | | (5,720,452 | ) |
| NET DECREASE IN NET ASSETS | | | | | | | | |
| RESULTING FROM OPERATIONS | | $ | (3,402,799 | ) | | $ | (7,225,076 | ) |
(1) | The period ended October 31, 2018, consists of 11 months due to the Fund’s fiscal year end change from November 30 to October 31, effective October 26, 2018. |
(2) | Net of foreign taxes withheld of $20,578 and $9,465, respectively. |
(3) | Effective November 28, 2017, Class C shares converted into Class A shares (redesignated as Investor Class shares). The amounts presented are inclusive of Class C sub-transfer agent expenses of $19,264 and Class C distribution fees of $59,132. |
The accompanying notes are an integral part of these financial statements.
(This Page Intentionally Left Blank.)
| HENNESSY FUNDS | 1-800-966-4354 | |
Financial Statements
| Statements of Changes in Net Assets |
OPERATIONS:
Net investment loss
Net realized gain (loss) on investments
Net change in unrealized appreciation/depreciation on investments
Net increase/(decrease) in net assets resulting from operations
DISTRIBUTIONS TO SHAREHOLDERS FROM:
Distributable earnings – Institutional Class
Total distributable earnings
CAPITAL SHARE TRANSACTIONS:
Proceeds from shares subscribed – Investor Class
Proceeds from shares subscribed – Class C(2)
Proceeds from shares subscribed – Institutional Class
Proceeds from shares sold in connection with the conversion of Class C shares into Investor Class shares(2)
Dividends reinvested – Institutional Class
Cost of shares redeemed – Investor Class
Cost of shares redeemed – Class C(2)
Cost of shares redeemed – Institutional Class
Cost of shares redeemed in connection with the conversion of Class C shares into Investor Class shares(2)
Net increase (decrease) in net assets derived from capital share transactions
TOTAL INCREASE (DECREASE) IN NET ASSETS
NET ASSETS:
Beginning of period
End of period
CHANGES IN SHARES OUTSTANDING:
Shares sold – Investor Class
Shares sold – Class C(2)
Shares sold – Institutional Class
Shares sold in connection with the conversion of Class C shares into Investor Class shares(2)
Shares redeemed in connection with the conversion of Class C shares into Investor Class shares(2)
Shares issued to holders as reinvestment of dividends – Institutional Class
Shares redeemed – Investor Class
Shares redeemed – Class C(2)
Shares redeemed – Institutional Class
Net decrease in shares outstanding
(1) | The period ended October 31, 2018, consists of 11 months due to the Fund’s fiscal year end change from November 30 to October 31, effective October 26, 2018. |
(2) | Effective November 28, 2017, Class C shares converted into Class A shares (redesignated as Investor Class shares). |
(3) | All distributions were from net investment income. |
(4) | Includes accumulated net investment loss of $(3,269,605). |
(5) | Includes accumulated net investment loss of $(1,725,723). |
The accompanying notes are an integral part of these financial statements.
| STATEMENTS OF CHANGES IN NET ASSETS |
| 11 Months Ended | | | Year Ended | | | Year Ended | |
October 31, 2018(1) | | | November 30, 2017 | | | November 30, 2016 | |
| | | | | | | | |
| $ | (1,016,734 | ) | | $ | (1,504,624 | ) | | $ | (918,255 | ) |
| | 12,791,029 | | | | 14,710,227 | | | | (12,251,964 | ) |
| | (15,177,094 | ) | | | (20,430,679 | ) | | | 43,189,916 | |
| | (3,402,799 | ) | | | (7,225,076 | ) | | | 30,019,697 | |
| | | | | | | | | | | |
| | — | | | | — | | | | (202,924 | ) |
| | — | | | | — | | | | (202,924 | )(3) |
| | | | | | | | | | | |
| | 4,580,057 | | | | 4,800,150 | | | | 4,780,718 | |
| | — | | | | 1,716,520 | | | | 3,187,859 | |
| | 27,159,764 | | | | 38,623,311 | | | | 31,506,175 | |
| | — | | | | 7,420,979 | | | | — | |
| | — | | | | — | | | | 201,492 | |
| | (8,125,374 | ) | | | (8,176,184 | ) | | | (7,562,686 | ) |
| | — | | | | (4,155,967 | ) | | | (1,811,437 | ) |
| | (68,363,869 | ) | | | (37,713,776 | ) | | | (28,748,825 | ) |
| | — | | | | (7,420,979 | ) | | | — | |
| | (44,749,422 | ) | | | (4,905,946 | ) | | | 1,553,296 | |
| | (48,152,221 | ) | | | (12,131,022 | ) | | | 31,370,069 | |
| | | | | | | | | | | |
| | 145,114,235 | | | | 157,245,257 | | | | 125,875,188 | |
| $ | 96,962,014 | | | $ | 145,114,235 | (4) | | $ | 157,245,257 | (5) |
| | | | | | | | | | | |
| | 216,063 | | | | 244,584 | | | | 288,406 | |
| | — | | | | 88,930 | | | | 200,589 | |
| | 1,279,785 | | | | 2,010,365 | | | | 1,951,347 | |
| | — | | | | 389,181 | | | | — | |
| | — | | | | (394,345 | ) | | | — | |
| | — | | | | — | | | | 10,549 | |
| | (389,081 | ) | | | (425,815 | ) | | | (473,366 | ) |
| | — | | | | (219,288 | ) | | | (110,064 | ) |
| | (3,263,694 | ) | | | (1,916,043 | ) | | | (1,889,870 | ) |
| | (2,156,927 | ) | | | (222,431 | ) | | | (22,409 | ) |
The accompanying notes are an integral part of these financial statements.
| HENNESSY FUNDS | 1-800-966-4354 | |
Financial Statements
For an Investor Class share outstanding throughout each period
PER SHARE DATA:
Net asset value, beginning of period
Income from investment operations:
Net investment loss(2)
Net realized and unrealized gains (losses) on investments
Total from investment operations
Less distributions:
Dividends from net realized gains
Total distributions
Net asset value, end of period
TOTAL RETURN
SUPPLEMENTAL DATA AND RATIOS:
Net assets, end of period (millions)
Ratio of expenses to average net assets
Ratio of net investment loss to average net assets
Portfolio turnover rate(6)
(1) | Fund commenced operations on December 31, 2013. |
(2) | Calculated using the average shares outstanding method. |
(3) | Not annualized. |
(4) | Annualized. |
(5) | The period ended October 31, 2018, consists of 11 months due to the Fund’s fiscal year end change from November 30, to October 31, effective October 26, 2018. |
(6) | Portfolio turnover is calculated on the basis of the Fund as a whole. |
The accompanying notes are an integral part of these financial statements.
| FINANCIAL HIGHLIGHTS — INVESTOR CLASS |
| Period Ended | | | Year Ended November 30, | | | Period Ended | |
| October 31, | | | | | November 30, | |
2018(5) | | | 2017 | | | 2016 | | | 2015 | | | 2014(1) | |
| | | | | | | | | | | | | | |
| $ | 19.47 | | | $ | 20.54 | | | $ | 16.41 | | | $ | 20.45 | | | $ | 20.00 | |
| | | | | | | | | | | | | | | | | | | |
| | | | | | | | | | | | | | | | | | | |
| | (0.20 | ) | | | (0.23 | ) | | | (0.15 | ) | | | (0.10 | ) | | | (0.11 | ) |
| | (0.95 | ) | | | (0.84 | ) | | | 4.28 | | | | (3.46 | ) | | | 0.56 | |
| | (1.15 | ) | | | (1.07 | ) | | | 4.13 | | | | (3.56 | ) | | | 0.45 | |
| | | | | | | | | | | | | | | | | | | |
| | | | | | | | | | | | | | | | | | | |
| | — | | | | — | | | | — | | | | (0.48 | ) | | | — | |
| | — | | | | — | | | | — | | | | (0.48 | ) | | | — | |
| $ | 18.32 | | | $ | 19.47 | | | $ | 20.54 | | | $ | 16.41 | | | $ | 20.45 | |
| | | | | | | | | | | | | | | | | | | |
| | (5.91 | )%(3) | | | (5.21 | )% | | | 25.17 | % | | | (17.57 | )% | | | 2.25 | %(3) |
| | | | | | | | | | | | | | | | | | | |
| | | | | | | | | | | | | | | | | | | |
| $ | 18.16 | | | $ | 22.66 | | | $ | 19.64 | | | $ | 18.72 | | | $ | 15.14 | |
| | 1.82 | %(4) | | | 1.87 | % | | | 1.89 | % | | | 1.87 | % | | | 1.98 | %(4) |
| | (1.05 | )%(4) | | | (1.21 | )% | | | (0.92 | )% | | | (0.51 | )% | | | (0.53 | )%(4) |
| | 72 | %(3) | | | 84 | % | | | 83 | % | | | 79 | % | | | 72 | %(3) |
The accompanying notes are an integral part of these financial statements.
| HENNESSY FUNDS | 1-800-966-4354 | |
Financial Statements
For an Institutional Class share outstanding throughout each period
PER SHARE DATA:
Net asset value, beginning of period
Income from investment operations:
Net investment loss(2)
Net realized and unrealized gains (losses) on investments
Total from investment operations
Less distributions:
Dividends from net investment income
Dividends from net realized gains
Total distributions
Net asset value, end of period
TOTAL RETURN
SUPPLEMENTAL DATA AND RATIOS:
Net assets, end of period (millions)
Ratio of expenses to average net assets
Ratio of net investment loss to average net assets
Portfolio turnover rate(6)
(1) | Fund commenced operations on December 31, 2013. |
(2) | Calculated using the average shares outstanding method. |
(3) | Not annualized. |
(4) | Annualized. |
(5) | The period ended October 31, 2018, consists of 11 months due to the Fund’s fiscal year end change from November 30 to October 31, effective October 26, 2018. |
(6) | Portfolio turnover is calculated on the basis of the Fund as a whole. |
The accompanying notes are an integral part of these financial statements.
| FINANCIAL HIGHLIGHTS — INSTITUTIONAL CLASS |
| Period Ended | | | Year Ended November 30, | | | Period Ended | |
| October 31, | | | | | November 30, | |
2018(5) | | | 2017 | | | 2016 | | | 2015 | | | 2014(1) | |
| | | | | | | | | | | | | | |
| $ | 19.61 | | | $ | 20.64 | | | $ | 16.46 | | | $ | 20.45 | | | $ | 20.00 | |
| | | | | | | | | | | | | | | | | | | |
| | | | | | | | | | | | | | | | | | | |
| | (0.15 | ) | | | (0.19 | ) | | | (0.11 | ) | | | (0.04 | ) | | | (0.06 | ) |
| | (0.96 | ) | | | (0.84 | ) | | | 4.32 | | | | (3.47 | ) | | | 0.51 | |
| | (1.11 | ) | | | (1.03 | ) | | | 4.21 | | | | (3.51 | ) | | | 0.45 | |
| | | | | | | | | | | | | | | | | | | |
| | | | | | | | | | | | | | | | | | | |
| | — | | | | — | | | | (0.03 | ) | | | — | | | | — | |
| | — | | | | — | | | | — | | | | (0.48 | ) | | | — | |
| | — | | | | — | | | | (0.03 | ) | | | (0.48 | ) | | | — | |
| $ | 18.50 | | | $ | 19.61 | | | $ | 20.64 | | | $ | 16.46 | | | $ | 20.45 | |
| | | | | | | | | | | | | | | | | | | |
| | (5.66 | )%(3) | | | (4.99 | )% | | | 25.61 | % | | | (17.32 | )% | | | 2.25 | %(3) |
| | | | | | | | | | | | | | | | | | | |
| | | | | | | | | | | | | | | | | | | |
| $ | 78.81 | | | $ | 122.45 | | | $ | 126.92 | | | $ | 100.05 | | | $ | 68.31 | |
| | 1.57 | %(4) | | | 1.62 | % | | | 1.60 | % | | | 1.54 | % | | | 1.73 | %(4) |
| | (0.79 | )%(4) | | | (0.98 | )% | | | (0.65 | )% | | | (0.20 | )% | | | (0.28 | )%(4) |
| | 72 | %(3) | | | 84 | % | | | 83 | % | | | 79 | % | | | 72 | %(3) |
The accompanying notes are an integral part of these financial statements.
| HENNESSY FUNDS | 1-800-966-4354 | |
Financial Statements
Notes to the Financial Statements October 31, 2018 |
1). ORGANIZATION
The Hennessy BP Energy Fund (the “Fund”) is a series of Hennessy Funds Trust (the “Trust”), which was organized as a Delaware statutory trust on September 17, 1992. The Fund is an open-end management investment company registered under the Investment Company Act of 1940, as amended. The Fund is a successor to the BP Capital TwinLine Energy Fund (the “Predecessor Fund”) pursuant to a reorganization that took place after the close of business on October 26, 2018. Prior to October 26, 2018, the Fund had no investment operations. As a result of the reorganization, holders of Class A shares of the Predecessor Fund received Investor Class shares of the Fund, and holders of Class I shares of the Predecessor Fund received Institutional Class shares of the Fund. The Fund is the accounting and performance information successor of the Predecessor Fund. The investment objective of the Fund is to seek total return. The Fund is a diversified fund. Effective October 26, 2018, the Fund changed its fiscal year end from November 30 to October 31.
The Fund offers Investor Class and Institutional Class shares. Each class of shares differs principally in its respective 12b-1 distribution and service, shareholder servicing, and sub-transfer agent expenses. There are no sales charges. Each class has identical rights to earnings, assets, and voting privileges, except for class-specific expenses and exclusive rights to vote on matters affecting only an individual class.
As an investment company, the Fund follows the investment company accounting and reporting guidance of the Financial Accounting Standards Board (“FASB”) Accounting Standard Codification Topic 946 “Financial Services—Investment Companies.”
2). SIGNIFICANT ACCOUNTING POLICIES
The following is a summary of significant accounting policies consistently followed by the Fund in the preparation of the financial statements. These policies conform to U.S. generally accepted accounting principles (“GAAP”).
| a). | Securities Valuation – All investments in securities are recorded at their estimated fair value, as described in Note 3. |
| | |
| b). | Federal Income Taxes – No provision for federal income taxes or excise taxes has been made because the Fund has elected to be taxed as a regulated investment company and intends to distribute substantially all of its taxable income to its shareholders and otherwise comply with the provisions of the Internal Revenue Code of 1986, as amended, applicable to regulated investment companies. Net investment income/loss and realized gains/losses for federal income tax purposes may differ from those reported in the financial statements because of temporary book and tax basis differences. Temporary differences are primarily the result of the treatment of wash sales for tax reporting purposes and investments in companies organized as partnerships for tax purposes. The Fund recognizes interest and penalties related to income tax benefits, if any, in the Statement of Operations as an income tax expense. Distributions from net realized gains for book purposes may include short-term capital gains, which are included as ordinary income to shareholders for tax purposes. The Fund may utilize equalization accounting for tax purposes and designate earnings and profits, including net realized gains distributed to shareholders on redemption of shares, as part of the dividends paid deduction for income tax purposes. |
| NOTES TO THE FINANCIAL STATEMENTS |
| | Due to inherent differences in the recognition of income, expenses, and realized gains/losses under GAAP and federal income tax regulations, permanent differences between book and tax basis for reporting for the 11-month period ended October 31, 2018, have been identified and appropriately reclassified in the Statement of Assets and Liabilities. The adjustments are as follows: |
| Total | |
| Distributable | |
Earnings | Capital Stock |
| $1,552,995 | $(1,552,995) |
| c). | Accounting for Uncertainty in Income Taxes – The Fund has accounting policies regarding recognition and measurement of tax positions taken or expected to be taken on a tax return. The tax returns of the Fund for the prior three fiscal years are open for examination. The Fund has reviewed all open tax years in major jurisdictions and concluded that there is no impact on the Fund’s net assets and no tax liability resulting from unrecognized tax benefits relating to uncertain income tax positions taken or expected to be taken on a tax return. The Fund’s major tax jurisdictions are U.S. federal and Delaware. |
| | |
| d). | Income and Expenses – Dividend income is recognized on the ex-dividend date or as soon as information is available to the Fund. Interest income, which includes the amortization of premium and accretion of discount, is recognized on an accrual basis. Other non-cash dividends are recognized as investment income at the fair value of the property received. The Fund is charged for those expenses that are directly attributable to its portfolio, such as advisory, administration, and certain shareholder service fees. Income, expenses (other than expenses attributable to a specific class), and realized and unrealized gains/losses on investments are allocated to each class of shares based on such class’s net assets. |
| | |
| e). | Distributions to Shareholders – Dividends from net investment income for the Fund, if any, are declared and paid annually, usually in December. Distributions of net realized capital gains, if any, are declared and paid annually, usually in December. |
| | |
| f). | Security Transactions – Investment and shareholder transactions are recorded on the trade date. The Fund determines the realized gain/loss from an investment transaction by comparing the original cost of the security lot sold with the net sale proceeds. Discounts and premiums on securities purchased are accreted or amortized, respectively, over the life of each such security. |
| | |
| g). | Use of Estimates – The preparation of financial statements in conformity with GAAP requires management to make estimates and assumptions that affect the reported amounts of assets and liabilities and disclosure of contingent assets and liabilities at the date of the financial statements and the reported change in net assets during the reporting period. Actual results could differ from those estimates. |
| | |
| h). | Share Valuation – The net asset value (“NAV”) per share of the Fund is calculated by dividing (i) the total value of the securities held by the Fund, plus cash and other assets, minus all liabilities (including estimated accrued expenses) by (ii) the total number of shares outstanding for the Fund, rounded to the nearest cent. The Fund’s shares will not be priced on days the New York Stock Exchange is closed for trading. The offering and redemption price per share for the Fund is equal to the Fund’s NAV per share. |
| | |
| i). | Derivatives – The Fund may invest in, or enter into, derivatives, such as options, futures contracts, options on futures contracts, and swaps, for a variety of reasons, including to hedge certain risks, provide a substitute for purchasing or selling particular securities, or increase potential income gain. Derivatives are financial |
| HENNESSY FUNDS | 1-800-966-4354 | |
| | contracts based on an underlying or notional amount, require no initial investment or an initial net investment that is smaller than would normally be required to have a similar response to changes in market factors, and require or permit net settlement. Derivatives may allow the Fund to increase or decrease its level of risk more quickly and efficiently than transactions in other types of instruments. The main reason for utilizing derivative instruments is for hedging purposes. |
| | |
| | The Fund follows the financial accounting reporting rules as required by the Derivatives and Hedging Topic of the FASB Accounting Standards Codification. Under such rules, the Fund is required to include enhanced disclosure that enables investors to understand how and why an entity uses derivatives, how derivatives are accounted for, and how derivatives instruments affect an entity’s results of operations and financial position. During the 11-month period ended October 31, 2018, the Fund did not hold any derivative instruments. The effect of derivative instruments on the Statement of Operations for the year ended November 30, 2017, was as follows: |
| | | | | Change in Unrealized |
| | | | | Appreciation/ |
| | | | Realized Gain (Loss) | Depreciation |
| | | Location of Gain (Loss) on | on Derivatives | on Derivatives |
| | Instruments | Derivatives Recognized in Income | Recognized in Income | Recognized in Income |
| | Equity Contracts: | Net realized gain (loss) on | $31,308 | $ — |
| | Call Option Written | transactions from written options | | |
| | The average absolute notional value of options held during the year ended November 30, 2017, was $14,144. |
| | |
| j). | Partnership Accounting Policy – The Fund records its pro rata share of income/loss and capital gains/losses to the extent of distributions it has received, allocated from the underlying partnerships and accordingly adjusts the cost basis of the underlying partnerships for return of capital. |
| | |
| k). | New Accounting Pronouncements – In August 2018, the FASB issued Accounting Standards Update No. 2018-13 “Disclosure Framework—Changes to the Disclosure Requirements for Fair Value Measurement” (“ASU 2018-13”). ASU 2018-13 eliminates the requirement to disclose the amount of and reasons for transfers between Level 1 and Level 2 of the fair value hierarchy, the timing of transfers between levels of the fair value hierarchy, and the valuation processes for Level 3 fair value measurements. ASU 2018-13 does not eliminate the requirement to disclose the range and weighted average used to develop significant unobservable inputs for Level 3 fair value measurements, and the changes in unrealized gains and losses for recurring Level 3 fair value measurements. ASU 2018-13 requires that information is provided about the measurement uncertainty of Level 3 fair value measurements as of the reporting date. The guidance is effective for fiscal years beginning after December 15, 2019, and interim periods within those fiscal years. Management has evaluated the impact of this change in guidance, and due to the permissibility of early adoption, modified the Fund’s fair value disclosures for the current reporting period. |
| | |
| l). | New Rule Issuances – In August 2018, the Securities and Exchange Commission issued Final Rule Release No. 33 10532, Disclosure Update and Simplification, which in part amends certain financial statement disclosure requirements of Regulation S-X that have become redundant, duplicative, overlapping, outdated, or superseded, in light of other Commission disclosure requirements, GAAP, or changes in the information environment. The amendments are intended to facilitate the disclosure of information to investors and simplify compliance without significantly altering the |
| NOTES TO THE FINANCIAL STATEMENTS |
| | total mix of information provided to investors. The amendments to Rule 6-04.17 of Regulation S-X (balance sheet) were amended to require presentation of the total, rather than the components of net assets, of distributable earnings on the balance sheet. Consistent with GAAP, funds will be required to disclose total distributable earnings. The amendments to Rule 6-09 of Regulation S-X (statement of changes in net assets) omit the requirement to separately state the sources of distributions paid as well as omit the requirement to parenthetically state the book basis amount of undistributed net investment income. Instead, consistent with GAAP, funds will be required to disclose the total amount of distributions paid, except that any tax return of capital must be separately disclosed. The requirements of the Final Rule Release are effective November 5, 2018 and the Fund’s Statement of Assets and Liabilities and the Statement of Changes in Net Assets for the current and prior reporting period have been modified accordingly. |
3). SECURITIES VALUATION
The Fund follows fair valuation accounting standards that establish an authoritative definition of fair value and set out a hierarchy for measuring fair value. These standards require additional disclosures about the various inputs and valuation techniques used to develop the measurements of fair value and a discussion of changes in valuation techniques and related inputs during the period. These inputs are summarized in the three broad levels listed below:
| | Level 1 – | Unadjusted, quoted prices in active markets for identical instruments that the Fund has the ability to access at the date of measurement. |
| | | |
| | Level 2 – | Other significant observable inputs (including, but not limited to, quoted prices in active markets for similar instruments, quoted prices in markets that are not active for identical or similar instruments, and model-derived valuations in which all significant inputs and significant value drivers are observable in active markets, such as interest rates, prepayment speeds, credit risk curves, default rates, and similar data). |
| | | |
| | Level 3 – | Significant unobservable inputs (including the Fund’s own assumptions about what market participants would use to price the asset or liability based on the best available information) when observable inputs are unavailable. |
Following is a description of the valuation techniques applied to the Fund’s major categories of assets and liabilities measured at fair value on a recurring basis.
Equity Securities – Equity securities, including common stocks, preferred stocks, foreign-issued common stocks, exchange-traded funds, closed-end mutual funds, partnerships, rights, MLPs, and real estate investment trusts, that are traded on a securities exchange for which a last-quoted sales price is readily available will generally be valued at the last sales price as reported by the primary exchange on which the securities are listed. Securities listed on The NASDAQ Stock Market (“NASDAQ”) will generally be valued at the NASDAQ Official Closing Price, which may differ from the last sales price reported. Securities traded on a securities exchange for which a last-quoted sales price is not readily available will generally be valued at the mean between the bid and ask prices. To the extent these securities are actively traded and valuation adjustments are not applied, they are classified in Level 1 of the fair value hierarchy. Securities traded on foreign exchanges generally are not valued at the same time the Fund calculates its NAV because most foreign markets close well before such time. The earlier close of most foreign markets gives rise to the possibility that significant events, including broad market moves, may have occurred in the interim. In certain circumstances, it may be determined that a
| HENNESSY FUNDS | 1-800-966-4354 | |
| | foreign security needs to be fair valued because it appears that the value of the security might have been materially affected by events occurring after the close of the market in which the security is principally traded, but before the time the Fund calculates its NAV, such as by a development that affects an entire market or region (e.g., a weather-related event) or a potentially global development (e.g., a terrorist attack that may be expected to have an effect on investor expectations worldwide). |
| | |
| | Registered Investment Companies – Investments in open-end registered investment companies, commonly referred to as mutual funds, are generally priced at the ending NAV provided by the applicable mutual fund’s service agent and will be classified in Level 1 of the fair value hierarchy. |
| | |
| | Debt Securities – Debt securities, including corporate bonds, asset-backed securities, mortgage-backed securities, municipal bonds, U.S. Treasuries, and U.S. government agency issues, are generally valued at market on the basis of valuations furnished by an independent pricing service that utilizes both dealer-supplied valuations and formula-based techniques. The pricing service may consider recently executed transactions in securities of the issuer or comparable issuers, market price quotations (where observable), bond spreads, and fundamental data relating to the issuer. In addition, the model may incorporate observable market data, such as reported sales of similar securities, broker quotes, yields, bids, offers, and reference data. Certain securities are valued primarily using dealer quotations. These securities are generally classified in Level 2 of the fair value hierarchy. |
| | |
| | Short-Term Securities – Short-term equity investments, including money market funds, are valued in the manner specified above. Short-term debt investments with an original term to maturity of 60 days or less are valued at amortized cost, which approximates fair market value. If the original term to maturity of a short-term debt investment exceeded 60 days, then the values as of the 61st day prior to maturity are amortized. Amortized cost is not used if its use would be inappropriate due to credit or other impairments of the issuer, in which case the security’s fair value would be determined, as described below. Short-term securities are generally classified in Level 1 or Level 2 of the fair market hierarchy depending on the inputs used and market activity levels for specific securities. |
The Board of Trustees of the Fund (the “Board”) has adopted fair value pricing procedures that are followed when a price for a security is not readily available or if a significant event has occurred that indicates the closing price of a security no longer represents the true value of that security. Fair value pricing determinations are made in good faith in accordance with these procedures. There are numerous criteria that will be given consideration in determining a fair value of a security, such as the trading volume of a security and markets, the values of other similar securities, and news events with direct bearing on a security or markets. Fair value pricing results in an estimated price for a security that reflects the amount the Fund might reasonably expect to receive in a current sale. Depending on the relative significance of the valuation inputs, these securities may be classified in either Level 2 or Level 3 of the fair value hierarchy.
The fair valuation of foreign securities may be determined with the assistance of a pricing service using correlations between the movement of prices of such securities and indices of domestic securities and other appropriate indicators, such as closing market prices of relevant American Depositary Receipts or futures contracts. The effect of using fair value pricing is that the Fund’s NAV will reflect the affected portfolio securities’ values as determined by the Board or its designee, pursuant to the fair value pricing procedures adopted by the Board, instead of being determined by the market. Using a fair value pricing methodology to price a foreign security may result in a value that is different from
| NOTES TO THE FINANCIAL STATEMENTS |
such foreign security’s most recent closing price and from the value used by other investment companies to calculate their NAVs. Such securities are generally classified in Level 2 of the fair valuation hierarchy. Because the Fund may invest in foreign securities, the value of the Fund’s portfolio securities may change on days when you will not be able to purchase or redeem your shares.
The Board has delegated day-to-day valuation matters to a Valuation Committee comprised of one or more representatives from Hennessy Advisors, Inc., the Fund’s investment advisor (the “Advisor”). The function of the Valuation Committee is to value securities where current and reliable market quotations are not readily available. All actions taken by the Valuation Committee are reviewed by the Board.
The Fund has performed an analysis of all existing investments to determine the significance and character of all inputs to their fair value determinations. Various inputs are used to determine the value of the Fund’s investments. The inputs or methodology used for valuing securities are not necessarily an indication of the risk associated with investing in those securities. Details related to the fair valuation hierarchy of the Fund’s securities as of October 31, 2018, are included in the Schedule of Investments.
4). INVESTMENT TRANSACTIONS
Purchases and sales of investment securities (excluding government and short-term investments) for the Fund during the 11-month period ended October 31, 2018, were $91,608,447 and $129,781,856, respectively. For the year ended November 30, 2017, the purchases and sales of investment securities (excluding government and short-term investments) for the Fund were $112,921,597 and $117,993,398, respectively.
There were no purchases or sales/maturities of long-term U.S. government securities for the Fund during the 11-month period ended October 31, 2018, or the year ended November 30, 2017.
The Fund is permitted to purchase or sell securities from or to another fund in the Hennessy Funds family of funds (the “Hennessy Funds”) under specified conditions outlined in procedures adopted by the Board. The procedures have been designed to ensure that any purchase or sale of securities by the Fund from or to another Hennessy Fund complies with Rule 17a-7 of the Investment Company Act of 1940, as amended. During the period of October 26, 2018 (reorganization date), through October 31, 2018, the Fund did not engage in purchases or sales of securities pursuant to Rule 17a-7 of the Investment Company Act of 1940, as amended.
5). INVESTMENT ADVISORY FEE AND OTHER TRANSACTIONS WITH AFFILIATES
Prior to the close of business on October 26, 2018, BP Capital Fund Advisors, LLC (“BPCFA”) acted as the investment advisor to the Predecessor Fund. BPCFA furnished all investment advice, office space, and facilities, as well as most of the personnel needed by the Fund. As compensation for its services, BPCFA was entitled to a monthly fee from the Predecessor Fund. The fee was based upon the average daily net assets of the Predecessor Fund at an annual rate of 1.25%. The net investment advisory fees expensed by the fund during the period from December 1, 2017, to October 26, 2018, and the year ended November 30, 2017, were $1,500,624 and $1,786,981, respectively.
Effective following the close of business on October 26, 2018, the Advisor (Hennessy Advisors, Inc.) began providing the Fund with investment advisory services under an Investment Advisory Agreement. The Advisor oversees the provision of investment advice and furnishes office space and facilities, as well as most of the personnel needed by the Fund. As compensation for its services, the Advisor is entitled to a monthly fee from the Fund. The fee is based upon the average daily net assets of the Fund at an annual rate
| HENNESSY FUNDS | 1-800-966-4354 | |
of 1.25%. The net investment advisory fees expensed by the Fund during the period from October 27, 2018, to October 31, 2018, were $16,434.
Following the close of business on October 26, 2018, the Advisor delegated the day-to-day management of the Fund to a sub-advisor, BPCFA, and began paying a sub-advisory fee, based upon the daily net assets of the Fund, at the rate of 0.40%. The Advisor pays the sub-advisory fees from its own assets, and these fees are not an additional expense of the Fund.
The Advisor has contractually agreed to limit total annual operating expenses to 2.00% of the Fund’s net assets for Investor Class shares and 1.75% of the Fund’s net assets for Institutional Class shares (in each case, excluding all federal, state, and local taxes, interest, brokerage commissions, dividend and interest expenses on short sales, extraordinary items, and acquired fund fees and expenses and other costs incurred in connection with the purchase and sale of securities) through October 25, 2020.
For a period of three years after the year in which the Advisor waives or reimburses expenses, the Advisor may seek reimbursement from the Fund to the extent that total annual fund operating expenses are less than the expense limitation that was in effect at the time the Advisor waived or reimbursed expenses.
During the period from December 1, 2017, to the close of business on October 26, 2018, and the year ended November 30, 2017, BPCFA had contractually agreed to limit total annual operating expenses and to maintain the expense limitation for the Predecessor Fund on the same terms as described above.
During the period from December 1, 2017, to the close of business on October 26, 2018, and the year ended November 30, 2017, the Predecessor Fund had a Shareholder Servicing Plan in place on behalf of each share class. Under the Shareholder Servicing Plan, Investor Class and Institutional Class shares were authorized to pay an annual shareholder servicing fee of up to 0.10% of each class’s average daily net assets. This fee was used to finance certain activities related to servicing and maintaining shareholder accounts and is included in sub-transfer agent expenses in the Statement of Operations.
Effective following the close of business on October 26, 2018, the Board approved a Shareholder Servicing Agreement for Investor Class shares of the Fund, which was instituted to compensate the Advisor for the non-investment advisory services it provides to the Fund. The Shareholder Servicing Agreement provides for a monthly fee paid to the Advisor at an annual rate of 0.10% of the average daily net assets of the Fund attributable to Investor Class shares. The shareholder servicing fees expensed by the Fund during the period from October 27, 2018, to October 31, 2018, were $249.
During the period from December 1, 2017, to the close of business on October 26, 2018, and the year ended November 30, 2017, the Predecessor Fund had a distribution plan in place pursuant to Rule 12b-1 under the 1940 Act. The distribution plan required the payment of a monthly service fee to Foreside Fund Services, LLC at an annual rate of 0.25% of the average daily net assets attributed to Investor Class shares. Effective following the close of business on October 26, 2018, the Fund adopted a plan pursuant to Rule 12b-1 under the Investment Company Act of 1940, as amended, that authorizes payments in connection with the distribution of the Fund’s shares at an annual rate of up to 0.25% of the Fund’s average daily net assets attributable to Investor Class shares. Even though the authorized rate is up to 0.25%, the Fund is currently only using up to 0.15% of its average daily net assets attributable to Investor Class shares for such purpose. Amounts paid under the plan may be spent on any activities or expenses primarily intended to result in the sale of shares, including, but not limited to, advertising, shareholder account servicing, printing and mailing of prospectuses to other than current shareholders, printing and mailing of
| NOTES TO THE FINANCIAL STATEMENTS |
sales literature, and compensation for sales and marketing activities or to financial institutions and others, such as dealers and distributors. The distribution fees expensed by the Fund during the 11-month period ended October 31, 2018, and the year ended November 30, 2017, are included in the Statement of Operations.
The Fund has entered into agreements with various brokers, dealers, and financial intermediaries in connection with the sale of shares of the Fund. The agreements provide for periodic payments by the Fund to the brokers, dealers, and financial intermediaries for providing certain shareholder maintenance services (sub-transfer agent expenses). These shareholder services include the pre-processing and quality control of new accounts, shareholder correspondence, answering customer inquiries regarding account status, and facilitating shareholder telephone transactions. The sub-transfer agent fees (inclusive of the fees under the Shareholder Servicing Plan for the Predecessor Fund described above) expensed by the Fund during the 11-month period ended October 31, 2018, and the year ended November 30, 2017, are included in the Statement of Operations.
U.S. Bancorp Fund Services, LLC, d/b/a U.S. Bank Global Fund Services (“Fund Services”) provides the Fund with administrative, fund accounting, and transfer agent services. As administrator, Fund Services is responsible for activities such as (i) preparing various federal and state regulatory filings, reports, and returns for the Fund, (ii) preparing reports and materials to be supplied to the Board, (iii) monitoring the activities of the Fund’s custodian, transfer agent, and accountants, and (iv) coordinating the preparation and payment of the Fund’s expenses and reviewing the Fund’s expense accruals. U.S. Bank N.A., an affiliate of Fund Services, serves as the Fund’s custodian. The servicing agreements between the Trust and Fund Services and U.S. Bank N.A. contain a fee schedule that is inclusive of administrative, fund accounting, custody, and transfer agent fees. The administrative, fund accounting, custody, and transfer agent fees expensed by the Fund during the 11-month period ended October 31, 2018, and the year ended November 30, 2017, are included in the Statement of Operations.
Quasar Distributors, LLC acts as the Fund’s principal underwriter in a continuous public offering of the Fund’s shares. Quasar Distributors, LLC is an affiliate of Fund Services and U.S. Bank N.A.
During the period from December 1, 2017, to the close of business on October 26, 2018, and the year ended November 30, 2017, the officers and Chief Compliance Officer of the Predecessor Fund were employees of Fund Services. Chief Compliance Officer Fees paid by the Predecessor Fund to Fund Services during the period from December 1, 2017, to October 26, 2018 and the year ended November 30, 2017, were $10,649 and $12,211, respectively. Effective following the close of business on October 26, 2018, the officers of the Fund are affiliated with the Advisor. Such officers, with the exception of the Chief Compliance Officer and the Senior Compliance Officer, receive no compensation from the Fund for serving in their respective roles. The Fund, along with the other Hennessy Funds, makes reimbursement payments, on an equal basis, to the Advisor for a portion of the salary and benefits associated with the office of the Chief Compliance Officer and for all of the salary and benefits associated with the office of the Senior Compliance Officer. The Fund did not incur any compliance expense during the period from October 27, 2018, to October 31, 2018.
6). GUARANTEES AND INDEMNIFICATIONS
Under the Hennessy Funds’ organizational documents, their officers and trustees are indemnified by the Hennessy Funds against certain liabilities arising out of the performance of their duties to the Hennessy Funds. Additionally, in the normal course of business, the Hennessy Funds enter into contracts with service providers that contain general
| HENNESSY FUNDS | 1-800-966-4354 | |
indemnification clauses. The Fund’s maximum exposure under these arrangements is unknown as this would involve future claims that may be made against the Fund that have not yet occurred. Currently, the Fund expects the risk of loss to be remote.
7). LINE OF CREDIT
During the year ended November 30, 2017, the Predecessor Fund had a $10,000,000 line of credit with U.S. Bank N.A. for temporary or extraordinary purposes. During such period, the Predecessor Fund had an outstanding average daily balance and a weighted average interest rate of $2,455 and 3.75%, respectively. The interest expensed by the Predecessor Fund during such period is included in the statement of Operations. The maximum amount outstanding for the Predecessor Fund during such period was $896,000.
During the period from December 1, 2017, through October 26, 2018, the Predecessor Fund had an outstanding average daily balance and a weighted average interest rate of $2,376 and 4.75%, respectively. The interest expensed by the Predecessor Fund during such period is included in the Statement of Operations. The maximum amount outstanding for the Predecessor Fund during such period was $784,000. As of October 26, 2018, the Predecessor Fund did not have any borrowings outstanding under the line of credit.
After the close of business on October 26, 2018, the Fund had an uncommitted line of credit with the other Hennessy Funds in the amount of the lesser of (i) $100,000,000 or (ii) 33.33% of each Hennessy Fund’s net assets, or 30% for the Hennessy Gas Utility Fund and 10% for the Hennessy Balanced Fund, intended to provide short-term financing, if necessary, subject to certain restrictions, in connection with shareholder redemptions. The credit facility is with the Hennessy Funds’ custodian bank, U.S. Bank N.A. Borrowings under this arrangement bear interest at the bank’s prime rate and are secured by all of the Fund’s assets (as to its own borrowings only). From October 29, 2018, through October 31, 2018, the Fund did not have any borrowings outstanding under the line of credit.
8). FEDERAL TAX INFORMATION
As of October 31, 2018, the components of accumulated earnings (losses) for income tax purposes were as follows:
| | | Investments | |
| Cost of investments for tax purposes | | $ | 105,533,525 | |
| Gross tax unrealized appreciation | | $ | 6,621,959 | |
| Gross tax unrealized depreciation | | | (14,882,125 | ) |
| Net tax unrealized appreciation/(depreciation) | | $ | (8,260,166 | ) |
| Undistributed ordinary income | | $ | — | |
| Undistributed long-term capital gains | | | — | |
| Total distributable earnings | | $ | — | |
| Other accumulated gain/(loss) | | $ | (800,624 | ) |
| Total accumulated gain/(loss) | | $ | (9,060,790 | ) |
The difference between book-basis unrealized appreciation/depreciation (as shown in the Statement of Assets and Liabilities) and tax-basis unrealized appreciation/depreciation (as shown above) is attributable primarily to wash sales and partnership adjustments.
As of October 31, 2018, the Fund had short-term unlimited capital losses of $321,596 to offset future capital gains. During the period ended October 31, 2018, the capital losses utilized for the Fund were $12,205,155.
| NOTES TO THE FINANCIAL STATEMENTS |
Capital losses sustained in fiscal year 2012 and in future taxable years will not expire and may be carried over by the Fund without limitation; however, they will retain the character of the original loss. Furthermore, any loss incurred during those taxable years will be required to be utilized prior to the losses incurred in taxable years prior to 2012. As a result of this ordering rule, pre-enactment capital loss carryforwards may be more likely to expire unused. Under pre-enactment law, capital losses could be carried forward for eight years, and carried forward as short-term capital losses, irrespective of the character of the original loss.
As of October 31, 2018, the Fund deferred, on a tax basis, a late-year ordinary loss of $479,028. Late-year ordinary losses are net ordinary losses incurred after December 31, 2017, but within the taxable year, that are deemed to arise on the first day of the Fund’s next taxable year.
During the 11-month period ended October 31, 2018, and the years ended November 30, 2017 and 2016, the tax character of distributions paid by the Fund was as follows:
| | | 11-Month Period Ended | | | Year Ended | | | Year Ended | |
| | | October 31, 2018 | | | November 30, 2017 | | | November 30, 2016 | |
Ordinary income(1) | | $ | — | | | $ | — | | | $ | 202,924 | |
| Long-term capital gain | | | — | | | | — | | | | — | |
| | | $ | — | | | $ | — | | | $ | 202,924 | |
(1) Ordinary income includes short-term capital gains.
9). AGREEMENT AND PLAN OF REORGANIZATION
On October 22, 2018, shareholders of the Predecessor Fund approved an Agreement and Plan of Reorganization between the Trust, on behalf of the Fund, and Professionally Managed Portfolios, a Massachusetts business Trust, on behalf of the Predecessor Fund. The Agreement and Plan of Reorganization provided for the transfer of all of the assets of the Predecessor Fund to the Fund and the assumption of the liabilities (other than any excluded liabilities) of the Predecessor Fund by the Fund. The Fund was created to carry out the reorganization and has a substantially similar investment objective and substantially similar principal investment strategies as the Predecessor Fund. The following table illustrates the specifics of the reorganization of the Predecessor Fund into the Fund:
| | Shares Issued | | | |
| Predecessor Fund | to Shareholders of | Fund | Combined | Tax Status |
Net Assets | Predecessor Fund | Net Assets | Net Assets | of Transfer |
$96,818,691(1) | 5,275,159 | $0 | $96,818,691 | Non-taxable |
| | (1) | Includes accumulated net investment loss, accumulated realized gains and unrealized depreciation in the amounts of $(4,224,600), $821,745 and $(8,461,891), respectively. |
| HENNESSY FUNDS | 1-800-966-4354 | |
10). MATTERS SUBMITTED TO A SHAREHOLDER VOTE (Unaudited)
A special meeting of shareholders of the Predecessor Fund was held on October 22, 2018, and the following matter was approved:
Proposal to approve an Agreement and Plan of Reorganization pursuant to which all of the assets of the BP Capital TwinLine Energy Fund will be transferred to the Hennessy BP Energy Fund, a newly formed series of Hennessy Funds Trust, in exchange for Investor Class and Institutional Class shares of the Hennessy BP Energy Fund, distributed pro rata by the BP Capital TwinLine Energy Fund to its Class A and Class I shareholders, and the Hennessy BP Energy Fund’s assumption of BP Capital TwinLine Energy Fund’s stated liabilities.
For: 1,887,897
Against: 5,798
Abstain: 14,026
Nonvotes: 833,517
11). EVENTS SUBSEQUENT TO PERIOD END
Management has evaluated the Fund’s related events and transactions that occurred subsequent to October 31, 2018, through the date of issuance of the Fund’s financial statements. Management has determined that there were no subsequent events requiring recognition or disclosure in the financial statements.
| NOTES/REPORT OF INDEPENDENT REGISTERED PUBLIC ACCOUNTING FIRM |
Report of Independent Registered Public
Accounting Firm
To the Board of Trustees of Hennessy Funds Trust
and the shareholders of the Hennessy BP Energy Fund
Novato, CA
Opinion on the Financial Statements
We have audited the accompanying statement of assets and liabilities of the Hennessy BP Energy Fund (the “Fund”), a series of Hennessy Funds Trust, including the schedule of investments, as of October 31, 2018, the related statements of operations for the eleven months ended October 31, 2018 and the year ended November 30, 2017, the statements of changes in net assets for the eleven months ended October 31, 2018 and each of the two years ended November 30, 2017, financial highlights for the eleven months ended October 31, 2018 and each of the three years ended November 30, 2017, and for the period from December 31, 2013 (commencement of operations) to November 30, 2014, and the related notes (collectively referred to as the “financial statements”). In our opinion, the financial statements present fairly, in all material respects, the financial position of the Fund as of October 31, 2018, the results of its operations for the year then ended, the changes in its net assets for the year then ended each of the two years in the period ended November 30, 2017, and the financial highlights for each of periods noted above, in conformity with accounting principles generally accepted in the United States of America.
Basis for Opinion
These financial statements are the responsibility of the Fund’s management. Our responsibility is to express an opinion on the Fund’s financial statements based on our audits. We are a public accounting firm registered with the Public Company Accounting Oversight Board (United States) (“PCAOB”) and are required to be independent with respect to the Fund in accordance with the U.S. federal securities laws and the applicable rules and regulations of the Securities and Exchange Commission and the PCAOB. We have served as the auditor of one or more of the funds in the Trust since 2002.
We conducted our audits in accordance with the standards of the PCAOB. Those standards require that we plan and perform the audit to obtain reasonable assurance about whether the financial statements are free of material misstatement, whether due to error or fraud. The Fund is not required to have, nor were we engaged to perform, an audit of its internal control over financial reporting. As part of our audits we are required to obtain an understanding of internal control over financial reporting, but not for the purpose of expressing an opinion on the effectiveness of the Fund’s internal control over financial reporting. Accordingly, we express no such opinion.
Our audits included performing procedures to assess the risks of material misstatement of the financial statements, whether due to error or fraud, and performing procedures that respond to those risks. Such procedures included examining, on a test basis, evidence regarding the amounts and disclosures in the financial statements. Our audits also included evaluating the accounting principles used and significant estimates made by management, as well as evaluating the overall presentation of the financial statements. Our procedures included confirmation of securities owned as of October 31, 2018 by correspondence with the custodian and brokers. We believe that our audits provide a reasonable basis for our opinion.
TAIT, WELLER & BAKER LLP
Philadelphia, Pennsylvania
December 27, 2018
| HENNESSY FUNDS | 1-800-966-4354 | |
Trustees and Officers of the Fund (Unaudited)
The business and affairs of the Funds are managed under the direction of the Board of Trustees of the Trust, and the Board of Trustees elects the Officers of the Trust. Beginning in March 2015, the Board of Trustees has from time to time appointed advisers to the Board of Trustees (“Advisers”) with the intention of having qualified individuals serve in an advisory capacity in order to garner experience in the mutual fund and asset management industry and be considered as potential Trustees in the future. There are currently three Advisers: Brian Alexander, Doug Franklin, and Claire Knoles. As Advisers, Mr. Alexander, Mr. Franklin, and Ms. Knoles attend meetings of the Board of Trustees and act as non-voting participants. Information pertaining to the Trustees, Advisers, and the Officers of the Trust is set forth below. The Trustees and Officers serve until their successors are duly elected and qualified or until their earlier death, resignation, or removal. Each Trustee oversees the 16 Hennessy Funds. Unless otherwise indicated, the address of all persons listed below is 7250 Redwood Boulevard, Suite 200, Novato, CA 94945. The Fund’s Statement of Additional Information includes more information about the persons listed below and is available, without charge, upon request by calling 1-800-966-4354.
| | | | Other |
| | | | Directorships |
| | | | Held Outside |
| Name, (Year of Birth), | | | of Fund |
| and Position Held | Start Date | Principal Occupation(s) | Complex During |
with the Trust | of Service | During Past Five Years | Past Five Years(1) |
| | |
| Disinterested Trustees and Advisers | |
| | | | |
| J. Dennis DeSousa | January 1996 | Mr. DeSousa is a real estate investor. | None. |
| (1936) | | | |
| Trustee | | | |
| | | | |
| Robert T. Doyle | January 1996 | Mr. Doyle has been the Sheriff of | None. |
| (1947) | | Marin County, California since 1996. | |
| Trustee | | | |
| | | | |
| Gerald P. Richardson | May 2004 | Mr. Richardson is an independent | None. |
| (1945) | | consultant in the securities industry. | |
| Trustee | | | |
| | | | |
| Brian Alexander | March 2015 | Mr. Alexander has worked for the | None. |
| (1981) | | Sutter Health organization since | |
| Adviser to the Board | | 2011 in various positions. He has | |
| | | served as the Chief Executive Officer | |
| | | of the Sutter Roseville Medical | |
| | | Center since 2018. From 2016 through | |
| | | 2018, he served as the Vice President | |
| | | of Strategy for the Sutter Health Valley | |
| | | Area, which includes 11 hospitals, | |
| | | 13 ambulatory surgery centers, | |
| | | 16,000 employees, and 1,900 physicians. | |
| | | From 2013 through 2016, Mr. Alexander | |
| | | served as Sutter Novato Community | |
| | | Hospital’s Chief Administrative Officer, | |
| | | and from 2011 through 2012, he | |
| | | served as a Director of Strategy | |
| | | within Sutter’s West Bay Region. | |
| TRUSTEES AND OFFICERS OF THE FUND |
| | | | Other |
| | | | Directorships |
| | | | Held Outside |
| Name, (Year of Birth), | | | of Fund |
| and Position Held | Start Date | Principal Occupation(s) | Complex During |
with the Trust | of Service | During Past Five Years | Past Five Years(1) |
| | | | |
| Doug Franklin | March 2016 | Mr. Franklin is a retired insurance | None. |
| (1964) | | industry executive. From 1987 | |
| Adviser to the Board | | through 2015, he was employed | |
| | | by the Allianz-Fireman’s Fund | |
| | | Insurance Company in various | |
| | | positions, including as its Chief | |
| | | Actuary and Chief Risk Officer. | |
| | | | |
| Claire Knoles | December 2015 | Ms. Knoles is a founder of Kiosk and | None. |
| (1974) | | has served as its Chief Operating | |
| Adviser to the Board | | Officer since 2004. Kiosk is a full | |
| | | service marketing agency with | |
| | | offices in the San Francisco Bay | |
| | | Area, Toronto, and Liverpool, UK. | |
| | | | |
Interested Trustee(2) | | | |
| | | | |
| Neil J. Hennessy | January 1996 as | Mr. Neil Hennessy has been employed | Hennessy |
| (1956) | a Trustee and | by Hennessy Advisors, Inc. since | Advisors, Inc. |
| Trustee, Chairman of | June 2008 as | 1989 and currently serves as its | |
| the Board, Chief | an Officer | Chairman and Chief Executive Officer. | |
| Investment Officer, | | | |
| Portfolio Manager, | | | |
| and President | | | |
| | | | |
| | | | |
| Name, (Year of Birth), | | | |
| and Position Held | Start Date | Principal Occupation(s) | |
with the Trust | of Service | During Past Five Years | |
| | | | |
| Officers | | | |
| | | | |
| Teresa M. Nilsen | January 1996 | Ms. Nilsen has been employed by Hennessy Advisors, Inc. | |
| (1966) | | since 1989 and currently serves as its President, Chief Operating | |
| Executive Vice President | | Officer, and Secretary. | |
| and Treasurer | | | |
| | | | |
| Daniel B. Steadman | March 2000 | Mr. Steadman has been employed by Hennessy Advisors, Inc. | |
| (1956) | | since 2000 and currently serves as its Executive Vice President. | |
| Executive Vice President | | | |
| and Secretary | | | |
| | | | |
| Brian Carlson | December 2013 | Mr. Carlson has been employed by Hennessy Advisors, Inc. | |
| (1972) | | since December 2013 and currently serves as its Chief | |
| Senior Vice President | | Compliance Officer and Senior Vice President. | |
| and Head of Distribution | | | |
| | | | |
| Jennifer Cheskiewicz | June 2013 | Ms. Cheskiewicz has been employed by Hennessy Advisors, Inc. | |
(1977)(3) | | as its General Counsel since June 2013. | |
| Senior Vice President and | | | |
| Chief Compliance Officer | | | |
| HENNESSY FUNDS | 1-800-966-4354 | |
| Name, (Year of Birth), | | |
| and Position Held | Start Date | Principal Occupation(s) |
with the Trust | of Service | During Past Five Years |
| | | |
| David Ellison | October 2012 | Mr. Ellison has been employed by Hennessy Advisors, Inc. since |
(1958)(4) | | October 2012. He has served as a Portfolio Manager of the |
| Senior Vice President | | Hennessy Large Cap Financial Fund and the Hennessy Small |
| and Portfolio Manager | | Cap Financial Fund since inception. Mr. Ellison also served as a |
| | | Portfolio Manager of the Hennessy Technology Fund from its |
| | | inception until February 2017. Mr. Ellison served as Director, |
| | | CIO and President of FBR Fund Advisers, Inc. from December |
| | | 1999 to October 2012. |
| | | |
| Ryan C. Kelley | March 2013 | Mr. Kelley has been employed by Hennessy Advisors, Inc. since |
(1972)(5) | | October 2012. He has served as a Portfolio Manager of the |
| Senior Vice President | | Hennessy Gas Utility Fund, the Hennessy Large Cap Financial |
| and Portfolio Manager | | Fund, and the Hennessy Small Cap Financial Fund since |
| | | October 2014. He served as Co-Portfolio Manager of the same |
| | | funds from March 2013 through September 2014, and as a |
| | | Portfolio Analyst for the Hennessy Funds from October 2012 |
| | | through February 2013. Mr. Kelley has also served as a Portfolio |
| | | Manager of the Hennessy Cornerstone Growth Fund, the |
| | | Hennessy Cornerstone Mid Cap 30 Fund, the Hennessy |
| | | Cornerstone Large Growth Fund, and the Hennessy |
| | | Cornerstone Value Fund since February 2017, as a Co-Portfolio |
| | | Manager of the Hennessy Technology Fund since February |
| | | 2017, and as a Portfolio Manager of the Hennessy Total Return |
| | | Fund and the Hennessy Balanced Fund since May 2018. |
| | | Mr. Kelley served as Portfolio Manager of FBR Fund Advisers, |
| | | Inc. from January 2008 to October 2012. |
| | | |
| Tania Kelley | October 2003 | Ms. Kelley has been employed by Hennessy Advisors, Inc. |
| (1965) | | since October 2003. |
| Senior Vice President | | |
| and Head of Marketing | | |
| | | |
| Daniel P. Hennessy | December 2016 | Mr. Daniel Hennessy has been employed by Hennessy Advisors, |
| (1990) | | Inc. since 2015. He has served as an Associate Analyst or |
| Vice President | | Analyst of the Hennessy Technology Fund since February 2017. |
| and Analyst | | Mr. Daniel Hennessy previously served as a Mutual Fund |
| | | Specialist at U.S. Bancorp Fund Services, LLC (now doing |
| | | business as U.S. Bank Global Fund Services) from November |
| | | 2014 to July 2015. Prior to that, he attended the University of |
| | | San Diego, where he earned a degree in Political Science. |
_______________
(1) | Messrs. DeSousa, Doyle, N. Hennessy, and Richardson previously served on the Board of Directors of Hennessy Mutual Funds, Inc. (“HMFI”), The Hennessy Funds, Inc. (“HFI”), and Hennessy SPARX Funds Trust (“HSFT”). Pursuant to an internal reorganization effective as of February 28, 2014, the series of HFMI, HFI, and HSFT were reorganized into corresponding series of the Trust that mirrored them. Subsequent to the reorganization, HFMI, HFI, and HSFT were dissolved. |
(2) | Mr. N. Hennessy is considered an “interested person,” as defined in the Investment Company Act of 1940, as amended, because he is an officer of the Hennessy Funds. |
(3) | The address of this officer is 4800 Bee Caves Road, Suite 100, Austin, TX 78746. |
(4) | The address of this officer is 101 Federal Street, Suite 1900, Boston, MA 02110. |
(5) | The address of this officer is 1340 Environ Way, Suite 332, Chapel Hill, NC 27517. |
| TRUSTEES AND OFFICERS OF THE FUND |
(This Page Intentionally Left Blank.)
Expense Example (Unaudited)
October 31, 2018
As a shareholder of the Fund, you incur ongoing costs, including management fees, service fees, and other Fund expenses. This Example is intended to help you understand your ongoing costs (in dollars) of investing in the Fund and to compare these costs with the ongoing costs of investing in other mutual funds. The Example is based on an investment of $1,000 invested at the beginning of the period and held for the entire period from May 1, 2018, through October 31, 2018.
Actual Expenses
The first line of the table below under the “Investor Class” and “Institutional Class” headings provides information about actual account values and actual expenses. Although the Fund charges no sales loads or transaction fees, you will be assessed fees for outgoing wire transfers, returned checks and stop payment orders at prevailing rates charged by U.S. Bank Global Fund Services, the Fund’s transfer agent. If you request that a redemption be made by wire transfer, currently a $15 fee is charged by the Fund’s transfer agent. IRA accounts will be charged a $15 annual maintenance fee. The example below includes, but is not limited to, management fees, shareholder servicing fees, fund accounting, custody, and transfer agent fees. However, the example below does not include portfolio trading commissions and related expenses, and other extraordinary expenses as determined under generally accepted accounting principles. You may use the information in this line, together with the amount you invested, to estimate the expenses that you paid over the period. Simply divide your account value by $1,000 (for example, an $8,600 account value divided by $1,000 = 8.6), then multiply the result by the number in the first line of the table under the “Investor Class” or “Institutional Class” headings in the column entitled “Expenses Paid During Period” to estimate the expenses you paid on your account during this period.
Hypothetical Example for Comparison Purposes
The second line of the table below under the “Investor Class” and “Institutional Class” headings provides information about hypothetical account values and hypothetical expenses based on the Fund’s actual expense ratios and an assumed rate of return of 5% per year before expenses, which is not the Fund’s actual return. The hypothetical account values and expenses may not be used to estimate the actual ending account balance or expenses you paid for the period. You may use this information to compare the ongoing costs of investing in the Fund and other funds. To do so, compare this 5% hypothetical example with the 5% hypothetical examples that appear in the shareholder reports of the other funds. Please note that the expenses shown in the table are meant to highlight your ongoing costs only. Therefore, the second line of the table under the “Investor Class” and “Institutional Class” headings is useful in comparing ongoing costs only, and will not help you determine the relative total costs of owning different funds.
| | | | Expenses Paid |
| | Beginning | Ending | During Period(1) |
| | Account Value | Account Value | May 1, 2018 – |
| | May 1, 2018 | October 31, 2018 | October 31, 2018 |
| Investor Class | | | |
| Actual | $1,000.00 | $ 858.90 | $8.39 |
| Hypothetical (5% return before expenses) | $1,000.00 | $1,016.18 | $9.10 |
| | | | |
| Institutional Class | | | |
| Actual | $1,000.00 | $ 860.50 | $7.17 |
| Hypothetical (5% return before expenses) | $1,000.00 | $1,017.49 | $7.78 |
(1) | Expenses are equal to the Fund’s annualized expense ratio of 1.79% for Investor Class shares or 1.53% for Institutional Class shares, as applicable, multiplied by the average account value over the period, multiplied by 184/365 days (to reflect one-half year period). |
| HENNESSY FUNDS | 1-800-966-4354 | |
How to Obtain a Copy of the Fund’s
Proxy Voting Policy and Proxy Voting Records
A description of the policies and procedures the Fund uses to determine how to vote proxies relating to portfolio securities is available without charge: (1) by calling 1-800-966-4354; (2) on the Hennessy Funds’ website at www.hennessyfunds.com/proxy-voting/voting-policy; or (3) on the U.S. Securities and Exchange Commission’s (the “SEC”) website at www.sec.gov. The Fund’s proxy voting record is available without charge on both the Hennessy Funds’ website at www.hennessyfunds.com/proxy-voting/voting-record and the SEC’s website at www.sec.gov no later than August 31 for the prior 12 months ending June 30.
Quarterly Filings on Form N-Q
The Fund files a complete schedule of portfolio holdings with the SEC for the first and third quarters of each fiscal year on Form N-Q. The Fund’s Forms N-Q are available on the SEC’s website at www.sec.gov. Information included in the Fund’s Forms N-Q will also be available upon request by calling 1-800-966-4354.
Important Notice Regarding Delivery
of Shareholder Documents
To help keep the Fund’s costs as low as possible, we generally deliver a single copy of shareholder reports, proxy statements, and prospectuses to shareholders who share an address and have the same last name. This process does not apply to account statements. You may request an individual copy of a shareholder document at any time. If you would like to receive separate mailings of shareholder documents, please call U.S. Bank Global Fund Services at 1-800-261-6950 or 1-414-765-4124, and individual delivery will begin within 30 days of your request. If your account is held through a financial institution or other intermediary, please contact such intermediary directly to request individual delivery.
| PROXY VOTING — BOARD APPROVAL OF INVESTMENT ADVISORY AGREEMENTS |
Board Approval of Investment Advisory
Agreements (Unaudited)
At its meeting on October 7, 2018, the Board of Trustees of the Fund (the “Board,” and the members thereof, the “Trustees”) unanimously approved the new investment advisory agreement of the Fund with Hennessy Advisors, Inc. (the “Advisor”) and the new sub-advisory agreement of the Fund between the Advisor and BP Capital Fund Advisors, LLC (the “Sub-Advisor”). The Fund was established in connection with an agreement and plan of reorganization between the Trust, with respect to the Fund, and Professionally Managed Portfolios, with respect to BP Capital TwinLine Energy Fund (the “predecessor Fund”), pursuant to which the predecessor Fund was reorganized into the Fund.
As part of the process of approving the advisory and sub-advisory agreements, the Trustees reviewed their fiduciary duties with respect to approving the advisory and sub-advisory agreements and the relevant factors for them to consider. In addition, the Trustees who are not deemed “interested persons” (as defined by the Investment Company Act of 1940, as amended) of the Fund (the “Independent Trustees”) met in executive session to discuss the approval of the advisory and sub-advisory agreements.
In advance of the meeting, the Advisor sent detailed information to the Trustees to assist them in their evaluation of the advisory and sub-advisory agreements. This information included, but was not limited to, the following:
| | (1) | A memorandum from outside legal counsel that described the fiduciary duties of the Board with respect to approving the advisory and sub-advisory agreements and the relevant factors for consideration; |
| | | |
| | (2) | A memorandum from the Advisor that listed the factors relevant to the Board’s approval of the advisory and sub-advisory agreements and also referenced the documents that had been provided to help the Board assess each such factor; |
| | | |
| | (3) | An inventory of the range of services to be provided by the Advisor and the Sub-Advisor to the Fund, and the distinction between the services to be provided by the Advisor as compared to the services to be provided by the Sub-Advisor; |
| | | |
| | (4) | A written discussion of economies of scale; |
| | | |
| | (5) | The forms of advisory and sub-advisory agreements; |
| | | |
| | (6) | A recent fact sheet of the predecessor Fund, which included, among other things, performance information over various periods during which the Sub-Advisor was the investment advisor to the predecessor Fund; |
| | | |
| | (7) | A peer expense comparison for the anticipated net expense ratio and the investment advisory fee of the Fund; |
| | | |
| | (8) | The Advisor’s financial statements from its most recent Form 10-K and Form 10-Q; |
| | | |
| | (9) | Information about the Fund’s compliance program; |
| | | |
| | (10) | The Advisor’s current Form ADV Part 1A (noting that the Advisor is not required to prepare and maintain Form ADV Part 2A or 2B); |
| | | |
| | (11) | A completed questionnaire from the Sub-Advisor; |
| | | |
| | (12) | The Sub-Advisor’s Code of Ethics; |
| | | |
| | (13) | The Sub-Advisor’s Form ADV Parts 1A, 2A, and 2B; and |
| | | |
| | (14) | Financial information of the Sub-Advisor. |
| HENNESSY FUNDS | 1-800-966-4354 | |
All of the factors discussed were considered as a whole by the Trustees, as well as by the Independent Trustees meeting in executive session. The Trustees viewed the factors in their totality, with no single factor being the principal or determinative factor in the Trustees’ determination of whether to approve the advisory and sub-advisory agreements.
Prior to approving the advisory and sub-advisory agreements, the Trustees, including the Independent Trustees in executive session, considered, among other items:
| | (1) | The nature and quality of the advisory services to be provided by the Advisor and the Sub-Advisor; |
| | | |
| | (2) | A comparison of the anticipated fees and expenses of the Fund to other similar funds; |
| | | |
| | (3) | Whether economies of scale would be recognized by the Fund; |
| | | |
| | (4) | The costs and profitability of the Fund to the Advisor and the Sub-Advisor; |
| | | |
| | (5) | The performance of the predecessor Fund; and |
| | | |
| | (6) | Any benefits to the Advisor and the Sub-Advisor from serving as an investment advisor to the Fund (other than the advisory fee and sub-advisory fee). |
The material considerations and determinations of the Trustees, including the Independent Trustees, were as follows:
| | (1) | The Trustees considered the services identified below that are, or will be, provided by the Advisor. Based on this review, the Trustees concluded that the Advisor will provide high-quality services to the Fund, and they noted that their overall confidence in the Advisor is high. The Trustees also concluded that they were satisfied with the nature, extent, and quality of the advisory services provided to the other Hennessy Funds by the Advisor and that the nature and extent of the services to be provided by the Advisor are appropriate to assure that the Fund’s operations are conducted in compliance with applicable laws, rules, and regulations. |
| | | (a) | The Advisor will oversee the Sub-Advisor for the Fund, and the Sub-Advisor will act as the portfolio manager for the Fund. |
| | | | |
| | | (b) | The Advisor will perform a daily reconciliation of portfolio positions and cash for the Fund. |
| | | | |
| | | (c) | The Advisor will monitor the Fund’s compliance with its investment objectives and restrictions. |
| | | | |
| | | (d) | The Advisor will monitor compliance with federal securities laws and will perform or continue to perform activities such as maintaining a compliance program, conducting ongoing reviews of the compliance programs of the Sub-Advisor (including its Code of Ethics) and the Fund’s other service providers, monitoring incidents of abusive trading practices, reviewing Fund expense accruals, payments, and fixed expense ratios, evaluating insurance providers for fidelity bond, D&O/E&O, and cybersecurity insurance coverage, conducting employee compliance training, reviewing reports provided by service providers, maintaining books and records, and preparing an annual compliance report for the Board. |
| | | | |
| | | (e) | The Advisor will oversee the selection and continued employment of the Sub-Advisor, review the Fund’s investment performance, and monitor the Sub-Advisor’s adherence to the Fund’s investment objectives, policies, and restrictions. |
| BOARD APPROVAL OF INVESTMENT ADVISORY AGREEMENTS |
| | | (f) | The Advisor will review the investment performance of the Fund on a regular basis, including a written summary prepared by the Fund’s portfolio managers of the Fund’s performance for the most recent 12-month period for each annual report of the Fund (or, for the 2018 annual report, the Fund’s most recent 11-month period). |
| | | | |
| | | (g) | The Advisor oversees service providers that will provide accounting, administration, distribution, transfer agency, custodial, sales, marketing, public relations, audit, information technology, and legal services to the Fund. |
| | | | |
| | | (h) | The Advisor maintains in-house marketing and distribution departments that will provide marketing and distribution services on behalf of the Fund. |
| | | | |
| | | (i) | The Advisor will be actively involved with preparing regulatory filings for the Fund, including writing and annually updating the Fund’s prospectus and related documents. |
| | | | |
| | | (j) | The Advisor will oversee distribution of the Fund through third-party broker/dealers and independent financial institutions such as Charles Schwab, Inc., Fidelity, TD Waterhouse, and Pershing. The Advisor participates in “no transaction fee” (“NTF”) programs with these companies on behalf of the Hennessy Funds, which allows customers to purchase the Fund through third-party distribution channels without paying a transaction fee. The Advisor compensates, in part, a number of these third-party providers of NTF programs out of its own revenues. |
| | | | |
| | | (k) | The Advisor pays the incentive compensation of the Trust’s compliance officers and employs other staff, such as legal, marketing, national accounts, distribution, sales, administrative, and trading oversight personnel, as well as management executives, all of whom will provide services to the Fund. |
| | | | |
| | | (l) | The Advisor provides a quarterly compliance certification to the Board. |
| | | | |
| | | (m) | The Advisor prepares or reviews Board materials, frequently presents to the Board or leads Board discussions, prepares or reviews meeting minutes, and arranges for Board training and education. |
| | (2) | The Trustees considered the services identified below that will be provided by the Sub-Advisor. Based on this review, the Trustees concluded that the Sub-Advisor will provide high-quality services to the Fund. The Trustees also concluded that they were satisfied with the portfolio management services that the Sub-Advisor provided to the Predecessor Fund. |
| | | (a) | The Sub-Advisor will act as the portfolio manager for the Fund. In this capacity, the Sub-Advisor will do the following: |
| | | | (i) | manage the composition of the Fund’s portfolio, including the purchase, retention, and disposition of portfolio securities in accordance with the Fund’s investment objectives, policies, and restrictions; |
| | | | (ii) | seek best execution for the Fund’s portfolio; |
| | | | (iii) | manage the use of soft dollars for the Fund; and |
| | | | (iv) | manage proxy voting for the Fund. |
| | | (b) | The Sub-Advisor will ensure that its compliance program includes policies and procedures relevant to the Fund and the Sub-Advisor’s duties as a portfolio manager to the Fund. |
| HENNESSY FUNDS | 1-800-966-4354 | |
| | | (c) | The Sub-Advisor will prepare a written summary of the Fund’s performance for the most recent 12-month period for each annual report of the Fund (or, for the 2018 annual report, the Fund’s most recent 11-month period). |
| | | | |
| | | (d) | The Sub-Advisor will provide a quarterly compliance certification to the Board regarding trading and allocation practices, supervisory matters, its compliance program (including its code of ethics), compliance with the Fund’s policies, and general firm updates. |
| | (3) | The Trustees considered the distinction between the services to be performed by the Advisor and the Sub-Advisor. The Trustees noted that the management of the Fund, including the oversight of the Sub-Advisor, would involve more comprehensive and substantive duties than the duties of the Sub-Advisor. Specifically, the Trustees considered the lists of services identified above and concluded that the services to be performed by the Advisor for the Fund would require a higher level of service and oversight than the services to be performed by the Sub-Advisor. Based on this determination, the Trustees concluded that the differential in advisory fees between the Advisor and the Sub-Advisor is reasonable. |
| | | |
| | (4) | The Trustees compared the performance of the predecessor Fund to benchmark indices over various periods and noted that the investment objectives and investment strategies of the Fund would be substantially similar to those of the predecessor Fund. Based on all such information, the Trustees believe that the Sub-Advisor had managed the predecessor Fund, and the Advisor and the Sub-Advisor will manage the Fund, in a manner that is materially consistent with its stated investment objective and style. The Trustees concluded that the approval of the advisory and sub-advisory agreements was warranted. |
| | | |
| | (5) | The Trustees reviewed the advisory fees and anticipated overall expense ratios of the Fund compared to other funds similar in asset size and investment objective using data from Morningstar. As part of the discussion with management, the Trustees ensured that they understood and were comfortable with the criteria used to determine the mutual funds included in the Morningstar categories for purposes of the materials considered at the meeting. The Trustees determined that the advisory fee and anticipated overall expense ratio of the Fund falls within the range of the advisory fees and overall expense ratios of other comparable funds and concluded that they are reasonable and warranted approval of the advisory and sub-advisory agreements. |
| | | |
| | (6) | The Trustees also considered whether the Advisor was likely to realize economies of scale that it should share with the Fund’s shareholders. The Trustees noted that many of the expenses that the Advisor will incur to manage the Fund are asset-based fees, so the Advisor would not realize material economies of scale as the assets of the Fund increase. For example, mutual fund platform fees would increase as the Fund’s assets grow. The Trustees also considered the Advisor’s agreement to waive fees for the Fund for two years. The Board noted that at current asset levels it did not appear likely that the Advisor would realize economies of scale and concluded that it would continue to monitor economies of scale in the future as circumstances changed. |
| | | |
| | (7) | The Trustees considered the profitability of the Advisor and the Sub-Advisor, including the impact of mutual fund platform fees on the Advisor’s profitability, and also considered the resources and revenues that the Advisor has put into managing |
| BOARD APPROVAL OF INVESTMENT ADVISORY AGREEMENTS |
| | | and distributing the Fund. The Trustees then concluded that the anticipated profits of the Advisor and the Sub-Advisor are reasonable and not excessive when compared to profitability guidelines set forth in relevant court cases. |
| | | |
| | (8) | The Trustees considered the high level of professionalism and knowledge of the Advisor’s employees, along with a very low level of turnover, and concluded that this was beneficial to the Fund and its shareholders. The Trustees also considered the business backgrounds and key employees of the Sub-Advisor and determined that they believe these employees have the necessary expertise to manage the portfolio of the Fund for the benefit of the Fund and its shareholders. |
| | | |
| | (9) | The Trustees considered any anticipated benefits to the Advisor and the Sub-Advisor from serving as advisors to the Fund other than the advisory fee or sub-advisory fee. The Trustees noted that the Advisor and the Sub-Advisor in the future may derive ancillary benefits from, by way of example, their association with the Fund in the form of proprietary and third-party research products and services received from broker-dealers that execute portfolio trades for the Fund. The Trustees determined that they expected any such products and services to be used for legitimate purposes relating to the Fund by providing assistance in the investment decision-making process. The Trustees concluded that any additional benefits expected to be realized by the Advisor and the Sub-Advisor from their relationships with the Fund were reasonable. |
After reviewing the materials provided at the meeting and management’s presentation, as well as other factors that the Trustees deemed relevant, the Trustees, including the Independent Trustees, approved the new advisory and sub-advisory agreements.
| HENNESSY FUNDS | 1-800-966-4354 | |
Privacy Policy
We collect the following non-public personal information about you:
| | • | information we receive from you on or in applications or other forms, correspondence, or conversations, including, but not limited to, your name, address, phone number, social security number, assets, income, and date of birth; and |
| | | |
| | • | information about your transactions with us, our affiliates, or others, including, but not limited to, your account number and balance, payment history, parties to transactions, cost basis information, and other financial information. |
We do not disclose any non-public personal information about our current or former shareholders to non-affiliated third parties, except as permitted by law. For example, we are permitted by law to disclose all of the information we collect, as described above, to our Transfer Agent to process your transactions. Furthermore, we restrict access to your non-public personal information to those persons who require such information to provide products or services to you. We maintain physical, electronic, and procedural safeguards that comply with federal standards to guard your non-public personal information.
In the event that you hold shares of the Fund through a financial intermediary, including, but not limited to, a broker-dealer, bank, or trust company, the privacy policy of your financial intermediary would govern how your non-public personal information will be shared with non-affiliated third parties.
(This Page Intentionally Left Blank.)
For information, questions or assistance, please call
The Hennessy Funds
1-800-966-4354 or 1-415-899-1555
INVESTMENT ADVISOR
Hennessy Advisors, Inc.
7250 Redwood Boulevard, Suite 200
Novato, California 94945
ADMINISTRATOR,
TRANSFER AGENT,
DIVIDEND PAYING AGENT, &
SHAREHOLDER SERVICING AGENT
U.S. Bancorp Fund Services, LLC
d/b/a U.S. Bank Global Fund Services
P.O. Box 701
Milwaukee, Wisconsin 53201-0701
CUSTODIAN
U.S. Bank N.A.
Custody Operations
1555 North River Center Drive, Suite 302
Milwaukee, Wisconsin 53212
TRUSTEES
Neil J. Hennessy
Robert T. Doyle
J. Dennis DeSousa
Gerald P. Richardson
COUNSEL
Foley & Lardner LLP
777 East Wisconsin Avenue
Milwaukee, Wisconsin 53202-5306
INDEPENDENT REGISTERED
PUBLIC ACCOUNTING FIRM
Tait, Weller & Baker LLP
Two Liberty Place
50 South 16th Street, Suite 2900
Philadelphia, Pennsylvania 19102-2529
DISTRIBUTOR
Quasar Distributors, LLC
777 East Wisconsin Avenue
Milwaukee, Wisconsin 53202
hennessyfunds.com | 1-800-966-4354
This report has been prepared for shareholders and may be distributed to
others only if preceded or accompanied by a current prospectus.
ANNUAL REPORT
OCTOBER 31, 2018
HENNESSY BP MIDSTREAM FUND
Investor Class HMSFX
Institutional Class HMSIX
hennessyfunds.com | 1-800-966-4354
(This Page Intentionally Left Blank.)
Contents
| Letter to Shareholders | 2 |
| Performance Overview | 4 |
| Financial Statements | |
| Schedule of Investments | 7 |
| Statement of Assets and Liabilities | 10 |
| Statements of Operations | 11 |
| Statements of Changes in Net Assets | 12 |
| Financial Highlights | 14 |
| Notes to the Financial Statements | 18 |
| Report of Independent Registered Public Accounting Firm | 30 |
| Trustees and Officers of the Fund | 31 |
| Expense Example | 34 |
| Proxy Voting Policy and Proxy Voting Records | 36 |
| Quarterly Schedule of Investments | 36 |
| Federal Tax Distribution Information | 36 |
| Important Notice Regarding Delivery of Shareholder Documents | 36 |
| Board Approval of Investment Advisory Agreements | 37 |
| Privacy Policy | 42 |
| HENNESSY FUNDS | 1-800-966-4354 | |
December 2018
Dear Hennessy Funds Shareholder:
Over the past year, we have witnessed the return of market volatility. U.S. stocks still registered healthy gains, bolstered by the impact on corporate profits of the successful passage of the tax reform bill in December 2017. However, concerns over potential trade disruptions, especially between the U.S. and China, and worries over higher short-term interest rates, which many believe could possibly trigger a recession down the road, put downward pressure on equity valuations.
The U.S. economy performed well over the period, and actually achieved an acceleration in GDP growth to over 3% on an annualized basis in the second and third quarters of calendar year 2018. During the past year, companies continued to hire workers, adding over 200,000 jobs per month on average, sending the unemployment rate down to 3.7% in October, which is the lowest it has been since 1969. Consumer confidence is high and still rising, and corporate profits reached record levels in the third quarter of calendar year 2018, posting a year-over-year increase of 26% for the companies in the S&P 500 Index.
The Federal Reserve, confident about the strength of the economy and mindful of a tight labor market, raised short-term interest rates four times over the last year, by a quarter point each time. Long-term bond yields also rose, driven higher primarily by evidence of faster wage growth, pushing the U.S. 10-year Treasury bond over 3% for the first time since 2013.
As I write this, we are experiencing the market’s 20th downturn since 2010. I have been saying that every bull market experiences volatility and pullbacks. Many financial commentators think this bull market is “long in the tooth.” I do not agree with them. I believe stock valuations are still very reasonable. The prospective price to earnings multiple for the Dow Jones Industrial Average has come down from almost 20x at the end of 2017 to 16x, just above its 10-year average of 15x. The prospective PE multiple for the S&P 500 Index has also come down, from 20x to 17x, and compares favorably to its 10-year average of 16x.
Cash, meanwhile, continues to build up on corporate balance sheets. The companies in the S&P 500 Index reported a total of over $5.4 trillion in cash and marketable securities in their latest filings. Companies have been spending some of their cash, increasing their investment spending and laying the groundwork for future earnings growth. However, they have also been returning capital to shareholders. S&P 500 Index companies announced $433.6 billion in share repurchases during the second quarter of calendar year 2018, nearly doubling the previous record of $242.1 billion set in the first quarter. Companies are also raising their dividends.
In addition, I believe the Federal Reserve will take care not to raise interest rates too high or too fast and endanger the economic expansion. While wage growth has risen to over 3% in October, other measures of inflationary pressure, such as the Consumer Price Index and the Producer Price Index, still show prices increasing at a more moderate pace, closer to 2%. Given continued evidence of modest rates of inflation, I believe the Fed will be able to maintain its gradual pace of interest rate hikes.
Finally and importantly, I still see no signs of euphoria in this market. In my opinion, the enthusiasm present earlier in the year, which followed the significant reduction in corporate income tax rates, has largely evaporated, and it has been replaced with anxiety
over higher interest rates and their potential impact on growth. In the past, I have likened the current bull market to that of 1982-2000, and I still believe this comparison holds true. I am confident in the strength of the market today and believe the economy will continue to grow in the coming year, albeit at a more moderate pace.
Thank you for your continued confidence and investment in the Hennessy Funds. If you have any questions or would like to speak with us directly, please don’t hesitate to call us at (800) 966-4354.
Best regards,
Neil J. Hennessy
President and Chief Investment Officer
Past performance does not guarantee future results.
Mutual fund investing involves risk. Principal loss is possible.
Opinions expressed are those of Neil Hennessy and are subject to change, are not guaranteed, and should not be considered investment advice.
The Dow Jones Industrial Average and S&P 500 Index are commonly used to measure the performance of U.S. stocks. One cannot invest directly in an index.
PE, or price to earnings, is a valuation measure and is calculated by dividing a company’s market price per share by its earnings per share. Earnings growth is not a measure of a fund’s future performance.
| HENNESSY FUNDS | 1-800-966-4354 | |
Performance Overview (Unaudited)
CHANGE IN VALUE OF $10,000 INVESTMENT
This graph illustrates the performance of an initial investment of $10,000 made in the Fund on its inception date and assumes the reinvestment of dividends.
AVERAGE TOTAL RETURN FOR PERIODS ENDED OCTOBER 31, 2018
| | | One | Since Inception |
| | 11 Months(1) | Year | (12/31/13) |
| Hennessy BP Midstream Fund – | | | |
| Investor Class (HMSFX) | -6.15% | -7.17% | -3.74% |
| Hennessy BP Midstream Fund – | | | |
| Institutional Class (HMSIX) | -5.94% | -6.96% | -3.50% |
| Alerian MLP Index | 2.06% | 0.68% | -5.49% |
| S&P 500 Index | 4.15% | 7.35% | 10.49% |
Expense ratios: 1.78% (Investor Class); 1.49% (Institutional Class)
(1) | The period ended October 31, 2018, consists of 11 months because the Fund changed its fiscal year end from November 30 to October 31, effective October 26, 2018. |
Performance data quoted represents past performance; past performance does not guarantee future results. The investment return and principal value of an investment will fluctuate so that an investor’s shares, when redeemed, may be worth more or less than their original cost. The performance table does not reflect the deduction of taxes that a shareholder would pay on Fund distributions or the redemption of Fund shares. Current performance of the Fund may be lower or higher than the performance quoted. Performance data current to the most recent month end may be obtained by visiting www.hennessyfunds.com. Performance for periods on or prior to October 26, 2018, is that of the BP Capital TwinLine MLP Fund.
The Alerian MLP Index is float-adjusted, capitalization-weighted index commonly used to measure the performance of energy master limited partnerships. The S&P 500 Index is commonly used to measure the performance of U.S. stocks. One cannot invest directly in an index.
The expense ratios presented are from the most recent prospectus. The expense ratios for the current reporting period are available in the Financial Highlights section of this report.
PERFORMANCE NARRATIVE
Portfolio Managers Toby Loftin and Ben Cook
BP Capital Fund Advisors, LLC (sub-advisor)
Performance:
For the 11-month period ended October 31, 2018, the Investor Class of the Hennessy BP Midstream Fund returned -6.15%, underperforming both the Alerian MLP Index (the Fund’s primary benchmark) and the S&P 500 Index, which returned 2.06% and 4.15%, respectively, for the same period.
The Fund underperformed its primary benchmark index primarily as a result of overweight positions in Master Limited Partnerships (MLPs) that were heavily affected by an adverse Federal Energy Regulatory Commission ruling. The ruling, which passed in March 2018, effectively led to a reduction in cash flow and distribution forecasts for certain regulated businesses. The Fund was overweight MLP companies with large regulated businesses, such as pipeline operators, which experienced sharp reductions in their expected profitability and so performed poorly. The Fund was underweight large-cap, more diversified MLPs with less exposure to regulated businesses that experienced much smaller reductions in their expected profitability and so performed relatively well. The Fund also underperformed the broader domestic equity market, as represented by the S&P 500 Index, as a result of investor rotation out of energy-related companies and into consumer-oriented industry groups such as retailers and healthcare service companies. Large-cap, diversified midstream companies, unaffected by the aforementioned ruling, contributed most to relative performance. On an individual company basis, major contributors to the Fund’s relative performance included Targa Resources, Inc., Kinder Morgan, Inc., and Hess Midstream Partners LP, while major detractors included Energy Transfer Partners LP, TC Pipeline Partners LP, and Enbridge Energy Partners LP.
The Fund continues to own all the companies mentioned.
Portfolio Strategy:
The Fund seeks to build a portfolio of midstream energy companies with the following characteristics: cash flows linked to non-price factors such as volumes consumed; long-term agreements with customers such as utilities or power consumers; and strong balance sheets. Our intensive, fundamental, “boots-on-the-ground” research process, coupled with proprietary financial modeling, differentiates us from our competitors and allows us to uncover potential equity mispricings that can meaningfully drive performance.
Investment Commentary:
Despite the underperformance versus the broader equity market this year, we believe the outlook for midstream energy companies remains bright. We believe midstream companies can benefit from the current robust rate of growth in the production of crude oil, natural gas, and natural gas liquids in the U.S. They can also benefit from U.S. exports of crude oil, natural gas, and natural gas liquids that have also been growing rapidly. Midstream companies can also benefit from higher energy commodity prices.
| HENNESSY FUNDS | 1-800-966-4354 | |
Three holdings were added to the Fund this year, including Cheniere Energy Partners LP, CNX Midstream Partners LP, and Noble Midstream Partners LP. Eleven companies are no longer in the Fund, including Buckeye Partners LP, Dominion Midstream Partners LP, Enbridge Energy Partner, LP, Kinder Morgan, Inc. preferred shares, PBFX Partners LP, Rice Midstream Partners LP, Tallgrass Energy Partner, LP, TC Pipelines LP, Valero Partners LP, and Dominion Energy, Inc.
_______________
Opinions expressed are those of the Portfolio Manager as of the date written and are subject to change, are not guaranteed, and should not be considered investment advice or an indication of trading intent.
The Fund is non-diversified, meaning it may concentrate its assets in fewer individual holdings than a diversified fund, making it more exposed to individual stock volatility than a diversified fund. The Fund invests in small-capitalization and medium-capitalization companies, which involves additional risks such as limited liquidity and greater volatility. Funds that concentrate in a single sector may be subject to a higher degree of risk. Energy-related companies are subject to specific risks, including fluctuations in commodity prices and consumer demand, substantial government regulation, and depletion of reserves. Investments in lower-rated and non-rated securities present a greater risk of loss to principal and interest than higher-rated securities. Use of derivatives can increase the volatility of the Fund.
MLPs and MLP investments have unique characteristics. The Fund does not receive the same tax benefits as a direct investment in an MLP.
The prices of MLP units may fluctuate abruptly and trading volume may be low, making it difficult for the Fund to sell its units at a favorable price. MLP general partners have the power to take actions that adversely affect the interests of unit holders. Most MLPs do not pay U.S. federal income tax at the partnership level, but an adverse change in tax laws could result in MLPs being treated as corporations for federal income tax purposes, which could reduce or eliminate distributions paid by MLPs to the Fund. The Fund is treated as a regular corporation, or “C” corporation, for U.S. federal income tax purposes, and therefore, is subject to U.S. federal income tax on its taxable income at the graduated rates applicable to corporations (currently a maximum rate of 21%), as well as state and local income taxes. The Fund will not benefit from current favorable federal income tax rates on long-term capital gains, and Fund income and losses will not be passed on to shareholders. The Fund accrues deferred income taxes for future tax liabilities associated with the portion of MLP distributions considered to be a tax-deferred return of capital and for any net operating gains as well as capital appreciation of its investments. This deferred tax liability is reflected in the daily net asset value of the Fund and as a result the Fund’s after-tax performance could differ significantly from the underlying assets even if the pre-tax performance is closely tracked. Please see the Fund’s prospectus for a more complete discussion of these and other risks.
References to specific securities should not be considered a recommendation to buy or sell any security. Fund holdings and sector allocations are subject to change. Please refer to the Schedule of Investments included in this report for additional portfolio information.
Cash flow refers to the net amount of cash and cash equivalents being transferred into and out of a company.
| PERFORMANCE OVERVIEW/SCHEDULE OF INVESTMENTS |
Financial Statements
Schedule of Investments as of October 31, 2018 |
HENNESSY BP MIDSTREAM FUND
(% of Total Assets)
| TOP TEN HOLDINGS (EXCLUDING MONEY MARKET FUNDS) | % TOTAL ASSETS |
| Energy Transfer Equity LP | 14.45% |
| The Williams Companies, Inc. | 9.44% |
| Enterprise Products Partners LP | 9.09% |
| Targa Resources Corp. | 7.35% |
| Kinder Morgan, Inc. | 5.80% |
| MPLX LP | 5.11% |
| Shell Midstream Partners LP | 5.11% |
| CNX Midstream Partners LP | 5.02% |
| Magellan Midstream Partners LP | 4.85% |
| Plains All American Pipeline LP | 4.79% |
Note: The Fund concentrates its investments in the Energy industry. For presentation purposes, the Fund uses custom categories.
| HENNESSY FUNDS | 1-800-966-4354 | |
| COMMON STOCKS – 27.13% | | Number | | | | | | % of | |
| | | of Shares | | | Value | | | Net Assets | |
| Gathering & Processing – 8.83% | | | | | | | | | |
| Targa Resources Corp. | | | 140,093 | | | $ | 7,238,605 | | | | 8.83 | % |
| | | | | | | | | | | | | |
| Natural Gas/NGL Transportation – 18.30% | | | | | | | | | | | | |
| Kinder Morgan, Inc. | | | 335,438 | | | | 5,709,155 | | | | 6.96 | % |
| The Williams Companies, Inc. | | | 382,053 | | | | 9,295,349 | | | | 11.34 | % |
| | | | | | | | 15,004,504 | | | | 18.30 | % |
| Total Common Stocks | | | | | | | | | | | | |
| (Cost $24,288,755) | | | | | | | 22,243,109 | | | | 27.13 | % |
| | | | | | | | | | | | | |
| PARTNERSHIPS & TRUSTS – 91.95% | | | | | | | | | | | | |
| | | | | | | | | | | | | |
| Crude Oil & Refined Products – 46.32% | | | | | | | | | | | | |
| Andeavor Logistics LP | | | 59,713 | | | | 2,392,103 | | | | 2.92 | % |
| BP Midstream Partners LP | | | 126,629 | | | | 2,310,979 | | | | 2.82 | % |
| Enterprise Products Partners LP | | | 333,755 | | | | 8,951,309 | | | | 10.92 | % |
| Hess Midstream Partners LP | | | 126,693 | | | | 2,848,059 | | | | 3.47 | % |
| Holly Energy Partners LP | | | 86,539 | | | | 2,520,016 | | | | 3.07 | % |
| Magellan Midstream Partners LP | | | 77,462 | | | | 4,777,856 | | | | 5.83 | % |
| Phillips 66 Partners LP | | | 90,718 | | | | 4,437,017 | | | | 5.41 | % |
| Plains All American Pipeline LP | | | 216,636 | | | | 4,716,166 | | | | 5.75 | % |
| Shell Midstream Partners LP | | | 246,015 | | | | 5,028,546 | | | | 6.13 | % |
| | | | | | | | 37,982,051 | | | | 46.32 | % |
| | | | | | | | | | | | | |
| Gathering & Processing – 21.56% | | | | | | | | | | | | |
| Antero Midstream GP LP | | | 141,570 | | | | 2,280,693 | | | | 2.78 | % |
| Antero Midstream Partners LP | | | 28,800 | | | | 868,320 | | | | 1.06 | % |
| CNX Midstream Partners LP | | | 270,611 | | | | 4,938,651 | | | | 6.02 | % |
| MPLX LP | | | 149,649 | | | | 5,029,703 | | | | 6.14 | % |
| Noble Midstream Partners LP | | | 40,697 | | | | 1,389,395 | | | | 1.70 | % |
| Western Gas Partners LP | | | 80,080 | | | | 3,167,965 | | | | 3.86 | % |
| | | | | | | | 17,674,727 | | | | 21.56 | % |
| | | | | | | | | | | | | |
| Natural Gas/NGL Transportation – 24.07% | | | | | | | | | | | | |
| Cheniere Energy Partners LP | | | 41,245 | | | | 1,388,719 | | | | 1.69 | % |
| Energy Transfer Equity LP | | | 915,275 | | | | 14,223,370 | | | | 17.35 | % |
| EQM Midstream Partners LP | | | 89,892 | | | | 4,126,942 | | | | 5.03 | % |
| | | | | | | | 19,739,031 | | | | 24.07 | % |
| Total Partnerships & Trusts | | | | | | | | | | | | |
| (Cost $78,851,763) | | | | | | | 75,395,809 | | | | 91.95 | % |
The accompanying notes are an integral part of these financial statements.
| SHORT-TERM INVESTMENTS – 0.00% (b) | | Number | | | | | | % of | |
| | | of Shares | | | Value | | | Net Assets | |
| Money Market Funds – 0.00% (b) | | | | | | | | | |
| Morgan Stanley Institutional Liquidity Funds – Government Portfolio, | | | | | | | | | |
| Institutional Class 2.05% (a) | | | 142 | | | $ | 142 | | | | 0.00 | % |
| | | | | | | | | | | | | |
| Total Short-Term Investments | | | | | | | | | | | | |
| (Cost $142) | | | | | | | 142 | | | | 0.00 | % |
| | | | | | | | | | | | | |
| Total Investments | | | | | | | | | | | | |
| (Cost $103,140,660) – 119.08% | | | | | | | 97,639,060 | | | | 119.08 | % |
| Liabilities in Excess of Other Assets – (19.08)% | | | | | | | (15,641,730 | ) | | | (19.08 | )% |
| | | | | | | | | | | | | |
TOTAL NET ASSETS – 100.00% | | | | | | $ | 81,997,330 | | | | 100.00 | % |
Percentages are stated as a percent of net assets.
| (a) | The rate listed is the fund’s seven-day yield at October 31, 2018. |
| (b) | Amount calculated is less than 0.005%. |
Summary of Fair Value Exposure at October 31, 2018
The following is a summary of the inputs used to value the Fund’s net assets as of October 31, 2018 (See Note 3 in the accompanying notes to the financial statements):
| Common Stocks | | Level 1 | | | Level 2 | | | Level 3 | | | Total | |
| Gathering & Processing | | $ | 7,238,605 | | | $ | — | | | $ | — | | | $ | 7,238,605 | |
| Natural Gas/NGL Transportation | | | 15,004,504 | | | | — | | | | — | | | | 15,004,504 | |
| Total Common Stocks | | $ | 22,243,109 | | | $ | — | | | $ | — | | | $ | 22,243,109 | |
| Partnerships & Trusts | | | | | | | | | | | | | | | | |
| Crude Oil & Refined Products | | $ | 37,982,051 | | | $ | — | | | $ | — | | | $ | 37,982,051 | |
| Gathering & Processing | | | 17,674,727 | | | | — | | | | — | | | | 17,674,727 | |
| Natural Gas/NGL Transportation | | | 19,739,031 | | | | — | | | | — | | | | 19,739,031 | |
| Total Partnerships & Trusts | | $ | 75,395,809 | | | $ | — | | | $ | — | | | $ | 75,395,809 | |
| Short-Term Investments | | | | | | | | | | | | | | | | |
| Money Market Funds | | $ | 142 | | | $ | — | | | $ | — | | | $ | 142 | |
| Total Short-Term Investments | | $ | 142 | | | $ | — | | | $ | — | | | $ | 142 | |
| Total Investments | | $ | 97,639,060 | | | $ | — | | | $ | — | | | $ | 97,639,060 | |
The accompanying notes are an integral part of these financial statements.
| HENNESSY FUNDS | 1-800-966-4354 | |
Financial Statements
Statement of Assets and Liabilities as of October 31, 2018 |
| ASSETS: | | | |
| Investments in securities, at value (cost $103,140,660) | | $ | 97,639,060 | |
| Dividends and interest receivable | | | 648,813 | |
| Receivable for securities sold | | | 150,560 | |
| Receivable for fund shares sold | | | 1,527 | |
| Prepaid expenses and other assets | | | 15,939 | |
| Total Assets | | | 98,455,899 | |
| | | | | |
| LIABILITIES: | | | | |
| Loans payable | | | 127,000 | |
| Payable for fund shares redeemed | | | 16,099,440 | |
| Payable to advisor | | | 84,790 | |
| Payable to administrator | | | 29,368 | |
| Payable to auditor | | | 56,981 | |
| Accrued distribution fees | | | 4,304 | |
| Accrued service fees | | | 273 | |
| Accrued franchise tax | | | 19,899 | |
| Accrued trustees fees | | | 3,450 | |
| Accrued expenses and other payables | | | 33,064 | |
| Total Liabilities | | | 16,458,569 | |
| NET ASSETS | | $ | 81,997,330 | |
| | | | | |
| NET ASSETS CONSIST OF: | | | | |
| Capital stock | | $ | 105,270,507 | |
| Total distributable earnings | | | (23,273,177 | ) |
| Total Net Assets | | $ | 81,997,330 | |
| | | | | |
| NET ASSETS | | | | |
| Investor Class: | | | | |
| Shares authorized (no par value) | | Unlimited | |
| Net assets applicable to outstanding Investor Class shares | | $ | 20,072,836 | |
| Shares issued and outstanding | | | 1,585,162 | |
| Net asset value, offering price and redemption price per share | | $ | 12.66 | |
| | | | | |
| Institutional Class: | | | | |
| Shares authorized (no par value) | | Unlimited | |
| Net assets applicable to outstanding Institutional Class shares | | $ | 61,924,494 | |
| Shares issued and outstanding | | | 4,825,100 | |
| Net asset value, offering price and redemption price per share | | $ | 12.83 | |
The accompanying notes are an integral part of these financial statements.
| STATEMENT OF ASSETS AND LIABILITIES/STATEMENTS OF OPERATIONS |
Financial Statements
| | | 11 Months Ended | | | Year Ended | |
| | | October 31, 2018(1) | | | November 30, 2017 | |
| INVESTMENT INCOME: | | | | | | |
| Distributions received from master limited partnerships | | $ | 5,760,323 | | | $ | 4,921,818 | |
| Less: return of capital on distributions received | | | (5,740,549 | ) | | | (4,921,818 | ) |
| Dividend income | | | 388,201 | | | | 288,824 | |
| Interest income | | | 15,391 | | | | 29,818 | |
| Other income | | | 930 | | | | — | |
| Total investment income | | | 424,296 | | | | 318,642 | |
| | | | | | | | | |
| EXPENSES: | | | | | | | | |
| Investment advisory fees (See Note 5) | | | 1,104,181 | | | | 901,198 | |
| Sub-transfer agent expenses – Investor Class (See Note 5) | | | 14,172 | | | | 17,002 | (2) |
| Sub-transfer agent expenses – Institutional Class (See Note 5) | | | 72,141 | | | | 65,503 | |
| Administration, fund accounting, custody | | | | | | | | |
| and transfer agent fees (See Note 5) | | | 173,370 | | | | 157,030 | |
| Distribution fees – Investor Class (See Note 5) | | | 39,396 | | | | 50,502 | (2) |
| Service fees – Investor Class (See Note 5) | | | 273 | | | | — | |
| Federal and state registration fees | | | 49,221 | | | | 72,493 | |
| Reports to shareholders | | | 23,377 | | | | 20,121 | |
| Compliance expense (See Note 5) | | | 10,271 | | | | 10,807 | |
| Audit fees | | | 46,411 | | | | 27,411 | |
| Trustees’ fees and expenses | | | 17,661 | | | | 13,555 | |
| Legal fees | | | 4,946 | | | | 10,381 | |
| Interest expense (See Note 7) | | | 5,338 | | | | — | |
| Franchise tax expense | | | 20,651 | | | | 5,826 | |
| Other expenses | | | 24,488 | | | | 41,564 | |
| Total expenses before reimbursement by advisor | | | 1,605,897 | | | | 1,393,393 | |
| Expense reimbursement by advisor – Investor Class | | | (11,873 | ) | | | (22,557 | ) |
| Expense reimbursement by advisor – Institutional Class | | | (53,808 | ) | | | (91,065 | ) |
| Total expenses before state franchise and income taxes | | | 1,540,216 | | | | 1,279,771 | |
| State franchise and income tax expense | | | 272 | | | | 17,880 | |
| Total expenses | | | 1,540,488 | | | | 1,297,651 | |
| NET INVESTMENT LOSS | | $ | (1,116,192 | ) | | $ | (979,009 | ) |
| | | | | | | | | |
| REALIZED AND UNREALIZED LOSSES: | | | | | | | | |
| Net realized gain (loss) on investments | | $ | (4,616,225 | ) | | $ | 2,579,686 | |
| Net change in unrealized | | | | | | | | |
| appreciation/depreciation on investments | | | (2,268,476 | ) | | | (7,705,161 | ) |
| Net loss on investments | | | (6,884,701 | ) | | | (5,125,475 | ) |
| NET DECREASE IN NET ASSETS | | | | | | | | |
| RESULTING FROM OPERATIONS | | $ | (8,000,893 | ) | | $ | (6,104,484 | ) |
(1) | The period ended October 31, 2018, consists of 11 months due to the Fund’s fiscal year end change from November 30 to October 31, effective October 26, 2018. |
(2) | Effective November 28, 2017, Class C shares converted into Class A shares (redesignated as Investor Class shares). The amounts presented are inclusive of Class C sub-transfer agent expenses of $3,099 and Class C distribution fees of $15,743. |
The accompanying notes are an integral part of these financial statements.
| HENNESSY FUNDS | 1-800-966-4354 | |
Financial Statements
| Statements of Changes in Net Assets |
OPERATIONS:
Net investment loss
Net realized gain (loss) on investments
Net change in unrealized appreciation/depreciation on investments
Net increase (decrease) in net assets resulting from operations
DISTRIBUTIONS TO SHAREHOLDERS FROM:
Return of capital – Investor Class
Return of capital – Class C(2)
Return of capital – Institutional Class
Total distributions
CAPITAL SHARE TRANSACTIONS:
Proceeds from shares subscribed – Investor Class
Proceeds from shares subscribed – Class C(2)
Proceeds from shares subscribed – Institutional Class
Proceeds from shares sold in connection with the conversion of Class C shares into Investor Class shares(2)
Dividends reinvested – Investor Class
Dividends reinvested – Class C(2)
Dividends reinvested – Institutional Class
Cost of shares redeemed – Investor Class
Cost of shares redeemed – Class C(2)
Cost of shares redeemed – Institutional Class
Cost of shares redeemed in connection with the conversion of Class C shares into Investor Class shares(2)
Net increase (decrease) in net assets derived from capital share transactions
TOTAL INCREASE (DECREASE) IN NET ASSETS
NET ASSETS:
Beginning of year
End of year
CHANGES IN SHARES OUTSTANDING:
Shares sold – Investor Class
Shares sold – Class C(2)
Shares sold – Institutional Class
Shares sold in connection with the conversion of Class C shares into Investor Class shares(2)
Shares issued to holders as reinvestment of dividends – Investor Class
Shares issued to holders as reinvestment of dividends – Class C(2)
Shares issued to holders as reinvestment of dividends – Institutional Class
Shares redeemed – Investor Class
Shares redeemed – Class C(2)
Shares redeemed – Institutional Class
Shares redeemed in connection with the conversion of Class C shares into Investor Class shares(2)
Net increase/(decrease) in shares outstanding
(1) | The period ended October 31, 2018, consists of 11 months due to the Fund’s fiscal year end change from November 30 to October 31, effective October 26, 2018. |
(2) | Effective November 28, 2017, Class C shares converted into Class A shares (redesignated as Investor Class shares). |
(3) | Includes accumulated net investment loss of $(1,594,345). |
(4) | Includes accumulated net investment loss of $(615,336). |
The accompanying notes are an integral part of these financial statements.
| STATEMENTS OF CHANGES IN NET ASSETS |
| 11 Months Ended | | | Year Ended | | | Year Ended | |
October 31, 2018(1) | | | November 30, 2017 | | | November 30, 2016 | |
| | | | | | | | |
| $ | (1,116,192 | ) | | $ | (979,009 | ) | | $ | (359,288 | ) |
| | (4,616,225 | ) | | | 2,579,686 | | | | (2,131,928 | ) |
| | (2,268,476 | ) | | | (7,705,161 | ) | | | 8,783,980 | |
| | (8,000,893 | ) | | | (6,104,484 | ) | | | 6,292,764 | |
| | | | | | | | | | | |
| | (1,237,326 | ) | | | (878,781 | ) | | | (594,838 | ) |
| | — | | | | (159,349 | ) | | | (133,706 | ) |
| | (6,588,759 | ) | | | (3,683,962 | ) | | | (1,690,839 | ) |
| | (7,826,085 | ) | | | (4,722,092 | ) | | | (2,419,383 | ) |
| | | | | | | | | | | |
| | 12,908,692 | | | | 9,320,726 | | | | 8,205,734 | |
| | — | | | | 881,860 | | | | 781,503 | |
| | 61,536,519 | | | | 65,450,965 | | | | 23,087,389 | |
| | — | | | | 2,418,423 | | | | — | |
| | 1,178,239 | | | | 824,902 | | | | 582,056 | |
| | — | | | | 134,926 | | | | 112,132 | |
| | 5,538,251 | | | | 2,907,358 | | | | 1,586,986 | |
| | (8,575,706 | ) | | | (7,382,602 | ) | | | (4,491,015 | ) |
| | — | | | | (395,943 | ) | | | (643,867 | ) |
| | (74,214,680 | ) | | | (10,344,313 | ) | | | (10,511,018 | ) |
| | — | | | | (2,418,423 | ) | | | — | |
| | (1,628,685 | ) | | | 61,397,879 | | | | 18,709,900 | |
| | (17,455,663 | ) | | | 50,571,303 | | | | 22,583,281 | |
| | | | | | | | | | | |
| | 99,452,993 | | | | 48,881,690 | | | | 26,298,409 | |
| $ | 81,997,330 | | | $ | 99,452,993 | (3) | | $ | 48,881,690 | (4) |
| | | | | | | | | | | |
| | 943,640 | | | | 172,119 | | | | 549,681 | |
| | — | | | | 54,624 | | | | 53,955 | |
| | 4,254,660 | | | | 4,105,091 | | | | 1,632,576 | |
| | — | | | | 582,014 | | | | — | |
| | 84,132 | | | | 51,651 | | | | 38,802 | |
| | — | | | | 8,532 | | | | 7,570 | |
| | 391,738 | | | | 180,611 | | | | 106,199 | |
| | (605,087 | ) | | | (455,427 | ) | | | (343,289 | ) |
| | — | | | | (25,294 | ) | | | (43,305 | ) |
| | (5,454,423 | ) | | | (646,034 | ) | | | (757,714 | ) |
| | — | | | | (174,005 | ) | | | — | |
| | (385,340 | ) | | | 3,853,882 | | | | 1,244,475 | |
The accompanying notes are an integral part of these financial statements.
| HENNESSY FUNDS | 1-800-966-4354 | |
Financial Statements
For an Investor Class share outstanding throughout each period
PER SHARE DATA:
Net asset value, beginning of period
Income from investment operations:
Net investment loss(2)(6)
Net realized and unrealized gains (losses) on investments
Total from investment operations
Less distributions:
Dividends from return of capital
Total distributions
Net asset value, end of period
TOTAL RETURN
SUPPLEMENTAL DATA AND RATIOS:
Net assets, end of period (millions)
Ratio of expenses to average net assets:
Before expense reimbursement
After expense reimbursement
State and federal income tax expense
Deferred tax expense
Total expense
Ratio of net investment loss to average net assets:
Before expense reimbursement(6)
After expense reimbursement(6)
Portfolio turnover rate(8)
(1) | Fund commenced operations on December 31, 2013. |
(2) | Calculated using the average shares outstanding method. |
(3) | Not annualized. |
(4) | Annualized. |
(5) | Deferred tax expense estimate is derived from net investment loss and realized and unrealized gain/loss. |
(6) | Includes state income tax expense and deferred tax expense from net investment loss only. |
(7) | The period ended October 31, 2018, consists of 11 months due to the Fund’s fiscal year end change from November 30 to October 31, effective October 26, 2018. |
(8) | Portfolio turnover is calculated on the basis of the Fund as a whole. |
The accompanying notes are an integral part of these financial statements.
| FINANCIAL HIGHLIGHTS — INVESTOR CLASS |
| Period Ended | | | Year Ended November 30, | | | Period Ended | |
| October 31, | | | | | November 30, | |
2018(7) | | | 2017 | | | 2016 | | | 2015 | | | 2014(1) | |
| | | | | | | | | | | | | | |
| $ | 14.51 | | | $ | 16.54 | | | $ | 15.45 | | | $ | 22.25 | | | $ | 20.00 | |
| | | | | | | | | | | | | | | | | | | |
| | | | | | | | | | | | | | | | | | | |
| | (0.16 | ) | | | (0.22 | ) | | | (0.17 | ) | | | (0.20 | ) | | | (0.20 | ) |
| | (0.66 | ) | | | (0.78 | ) | | | 2.29 | | | | (5.60 | ) | | | 2.87 | |
| | (0.82 | ) | | | (1.00 | ) | | | 2.12 | | | | (5.80 | ) | | | 2.67 | |
| | | | | | | | | | | | | | | | | | | |
| | | | | | | | | | | | | | | | | | | |
| | (1.03 | ) | | | (1.03 | ) | | | (1.03 | ) | | | (1.00 | ) | | | (0.42 | ) |
| | (1.03 | ) | | | (1.03 | ) | | | (1.03 | ) | | | (1.00 | ) | | | (0.42 | ) |
| $ | 12.66 | | | $ | 14.51 | | | $ | 16.54 | | | $ | 15.45 | | | $ | 22.25 | |
| | | | | | | | | | | | | | | | | | | |
| | (6.15 | )%(3) | | | (6.49 | )% | | | 14.78 | % | | | (27.17 | )% | | | 13.37 | %(3) |
| | | | | | | | | | | | | | | | | | | |
| | | | | | | | | | | | | | | | | | | |
| $ | 20.07 | | | $ | 16.86 | | | $ | 13.43 | | | $ | 8.76 | | | $ | 7.17 | |
| | | | | | | | | | | | | | | | | | | |
| | 1.83 | %(4) | | | 1.89 | % | | | 2.21 | % | | | 2.70 | % | | | 4.04 | %(4) |
| | 1.75 | %(4) | | | 1.75 | % | | | 1.74 | % | | | 1.74 | % | | | 1.75 | %(4) |
| | 0.03 | % | | | 0.02 | % | | | — | | | | — | | | | — | |
| | — | | | | — | | | | — | | | | (1.32 | )%(5) | | | 3.98 | %(4)(5) |
| | 1.78 | %(4) | | | 1.77 | % | | | 1.74 | % | | | 0.42 | % | | | 5.73 | %(4) |
| | | | | | | | | | | | | | | | | | | |
| | (1.34 | )%(4) | | | (1.50 | )% | | | (1.60 | )% | | | (1.97 | )% | | | (3.28 | )%(4) |
| | (1.26 | )%(4) | | | (1.36 | )% | | | (1.13 | )% | | | (1.01 | )% | | | (0.99 | )%(4) |
| | 64 | %(3) | | | 63 | % | | | 139 | % | | | 96 | % | | | 70 | %(3) |
The accompanying notes are an integral part of these financial statements.
| HENNESSY FUNDS | 1-800-966-4354 | |
Financial Statements
For an Institutional Class share outstanding throughout each period
PER SHARE DATA:
Net asset value, beginning of period
Income from investment operations:
Net investment loss(2)(6)
Net realized and unrealized gains (losses) on investments
Total from investment operations
Less distributions:
Dividends from return of capital
Total distributions
Net asset value, end of period
TOTAL RETURN
SUPPLEMENTAL DATA AND RATIOS:
Net assets, end of period (millions)
Ratio of expenses to average net assets:
Before expense reimbursement
After expense reimbursement
State and federal income tax expense
Deferred tax expense
Total expense
Ratio of net investment loss to average net assets:
Before expense reimbursement(6)
After expense reimbursement(6)
Portfolio turnover rate(8)
(1) | Fund commenced operations on December 31, 2013. |
(2) | Calculated using the average shares outstanding method. |
(3) | Not annualized. |
(4) | Annualized. |
(5) | Deferred tax expense estimate is derived from the net investment loss and realized and unrealized gain/loss. |
(6) | Includes state income tax expense and deferred tax expense from net investment loss only. |
(7) | The period ended October 31, 2018, consists of 11 months due to the Fund’s fiscal year end change from November 30 to October 31, effective October 26, 2018. |
(8) | Portfolio turnover is calculated on the basis of the Fund as a whole. |
The accompanying notes are an integral part of these financial statements.
| FINANCIAL HIGHLIGHTS — INSTITUTIONAL CLASS |
| Period Ended | | | Year Ended November 30, | | | Period Ended | |
| October 31, | | | | | November 30, | |
2018(7) | | | 2017 | | | 2016 | | | 2015 | | | 2014(1) | |
| | | | | | | | | | | | | | |
| $ | 14.66 | | | $ | 16.66 | | | $ | 15.53 | | | $ | 22.28 | | | $ | 20.00 | |
| | | | | | | | | | | | | | | | | | | |
| | | | | | | | | | | | | | | | | | | |
| | (0.14 | ) | | | (0.18 | ) | | | (0.12 | ) | | | (0.14 | ) | | | (0.15 | ) |
| | (0.66 | ) | | | (0.79 | ) | | | 2.28 | | | | (5.61 | ) | | | 2.87 | |
| | (0.80 | ) | | | (0.97 | ) | | | 2.16 | | | | (5.75 | ) | | | 2.72 | |
| | | | | | | | | | | | | | | | | | | |
| | | | | | | | | | | | | | | | | | | |
| | (1.03 | ) | | | (1.03 | ) | | | (1.03 | ) | | | (1.00 | ) | | | (0.44 | ) |
| | (1.03 | ) | | | (1.03 | ) | | | (1.03 | ) | | | (1.00 | ) | | | (0.44 | ) |
| $ | 12.83 | | | $ | 14.66 | | | $ | 16.66 | | | $ | 15.53 | | | $ | 22.28 | |
| | | | | | | | | | | | | | | | | | | |
| | (5.94 | )%(3) | | | (6.25 | )% | | | 14.97 | % | | | (26.90 | )% | | | 13.60 | %(3) |
| | | | | | | | | | | | | | | | | | | |
| | | | | | | | | | | | | | | | | | | |
| $ | 61.92 | | | $ | 82.59 | | | $ | 33.22 | | | $ | 15.72 | | | $ | 7.79 | |
| | | | | | | | | | | | | | | | | | | |
| | 1.56 | %(4) | | | 1.64 | % | | | 1.95 | % | | | 2.34 | % | | | 3.79 | %(4) |
| | 1.50 | %(4) | | | 1.50 | % | | | 1.48 | % | | | 1.42 | % | | | 1.50 | %(4) |
| | 0.02 | % | | | 0.02 | % | | | — | | | | — | | | | — | |
| | — | | | | — | | | | — | | | | (1.24 | )%(5) | | | 3.98 | %(4)(5) |
| | 1.52 | %(4) | | | 1.52 | % | | | 1.48 | % | | | 0.18 | % | | | 5.48 | %(4) |
| | | | | | | | | | | | | | | | | | | |
| | (1.15 | )%(4) | | | (1.28 | )% | | | (1.28 | )% | | | (1.63 | )% | | | (3.03 | )%(4) |
| | (1.09 | )%(4) | | | (1.14 | )% | | | (0.81 | )% | | | (0.71 | )% | | | (0.74 | )%(4) |
| | 64 | %(3) | | | 63 | % | | | 139 | % | | | 96 | % | | | 70 | %(3) |
The accompanying notes are an integral part of these financial statements.
| HENNESSY FUNDS | 1-800-966-4354 | |
Financial Statements
Notes to the Financial Statements October 31, 2018 |
1). ORGANIZATION
The Hennessy BP Midstream Fund (the “Fund”) is a series of Hennessy Funds Trust (the “Trust”), which was organized as a Delaware statutory trust on September 17, 1992. The Fund is an open-end management investment company registered under the Investment Company Act of 1940, as amended. The Fund is a successor to the BP Capital TwinLine MLP Fund (the “Predecessor Fund”) pursuant to a reorganization that took place after the close of business on October 26, 2018. Prior to October 26, 2018, the Fund had no investment operations. As a result of the reorganization, holders of Class A shares of the Predecessor Fund received Investor Class shares of the Fund, and holders of Class I shares of the Predecessor Fund received Institutional Class shares of the Fund. The Fund is the accounting and performance information successor of the Predecessor Fund. The investment objective of the Fund is to seek capital appreciation through distribution growth along with current income. The Fund is treated as a regular corporation, or “C” corporation, for U.S. federal income tax purposes. Because the Fund is treated as a “C” corporation, it will not be taxed as a regulated investment company under Subchapter M of the Code, and therefore is not required to comply with the diversification requirements applicable to regulated investment companies. The Fund is a non-diversified fund. Effective October 26, 2018, the Fund changed its fiscal year end from November 30 to October 31.
The Fund offers Investor Class and Institutional Class shares. Each class of shares differs principally in its respective 12b-1 distribution and service, shareholder servicing, and sub-transfer agent expenses. There are no sales charges. Each class has identical rights to earnings, assets, and voting privileges, except for class-specific expenses and exclusive rights to vote on matters affecting only an individual class.
As an investment company, the Fund follows the investment company accounting and reporting guidance of the Financial Accounting Standards Board (“FASB”) Accounting Standard Codification Topic 946 “Financial Services—Investment Companies.”
2). SIGNIFICANT ACCOUNTING POLICIES
The following is a summary of significant accounting policies consistently followed by the Fund in the preparation of the financial statements. These policies conform to U.S. generally accepted accounting principles (“GAAP”).
| a). | Securities Valuation – All investments in securities are recorded at their estimated fair value, as described in Note 3. |
| | |
| b). | Federal Income Taxes – The Fund, taxed as a corporation, is obligated to pay U.S. federal and state income tax on its taxable income. Currently, the maximum marginal regular federal income tax rate for a corporation is 21%. The Fund invests its assets primarily in midstream energy infrastructure investments, which may include, but are not limited to, master limited partnerships (“MLPs”) and entities with economic characteristics similar to MLPs. MLPs are treated as partnerships for federal income tax purposes. As a limited partner in MLPs, the Fund reports its allocable share of each MLP’s taxable income in computing its own taxable income. |
| | |
| | In calculating the Fund’s daily net asset value, the Fund will account for its deferred tax asset and liability balances. In accordance with U.S. GAAP, the Fund will accrue a deferred income tax liability balance for its future tax liability associated |
| NOTES TO THE FINANCIAL STATEMENTS |
| | with the capital appreciation of its investments and the distributions received by the Fund on equity securities of MLPs considered to be return of capital and for any net operating gains. This accrual will be based on the current effective U.S. federal income tax rate plus an estimated state income tax rate. |
| | |
| | Deferred income taxes reflect the net tax effect of temporary differences between the carrying amount of assets and liabilities for financial reporting and tax purposes. A valuation allowance is recognized if, based on the weight of available evidence, it is more likely than not that at least some portion of a deferred income tax asset will not be realized. From time to time, as new information becomes available, the Fund will modify its estimates or assumption regarding the deferred tax liabilities or assets. As of October 31, 2018, the Fund did not record a deferred tax asset or liability. |
| | |
| | The Tax Cuts and Jobs Act of 2017 was signed on December 22, 2017, reducing the federal corporate income tax rate from 35% to 21% and repealing the corporate alternate minimum tax. As a result, the Fund’s net deferred tax asset balance of $2,767,593 on December 22, 2017, was reduced to $1,781,088, which continued to be offset by a full valuation allowance. Due to the full valuation allowance, the reduction in the federal corporate income tax rate had no impact on the Fund’s net asset value per share. If the Fund’s deferred tax asset were to change to a deferred tax liability, the liability would be reflected at the newly enacted corporate tax rate of 21% plus an estimated state and local income tax rate. |
| Deferred Tax Assets: | | Total | |
| Net operating loss carryforwards | | $ | 567,057 | |
| State net operating loss carryforwards | | | 22,339 | |
| Capital loss carryforwards (tax basis) | | | 2,739,024 | |
| Unrealized losses | | | 376,281 | |
| Alternative minimum tax credit | | | — | |
| Total Deferred Tax Assets (Before Valuation Allowance) | | | 3,704,701 | |
| Valuation Allowance | | | (3,688,806 | ) |
| Total Net Deferred Tax Asset / Liability | | $ | 15,895 | |
| c). | Accounting for Uncertainty in Income Taxes – The Fund has accounting policies regarding recognition and measurement of tax positions taken or expected to be taken on a tax return. The tax returns of the Fund for the prior three fiscal years are open for examination. The Fund has reviewed all open tax years in major jurisdictions and concluded that there is no impact on the Fund’s net assets and no tax liability resulting from unrecognized tax benefits relating to uncertain income tax positions taken or expected to be taken on a tax return. The Fund’s major tax jurisdictions are U.S. federal and Delaware. |
| | |
| d). | Income and Expenses – Dividend income is recognized on the ex-dividend date or as soon as information is available to the Fund. Interest income, which includes the amortization of premium and accretion of discount, is recognized on an accrual basis. Other non-cash dividends are recognized as investment income at the fair value of the property received. The Fund is charged for those expenses that are directly attributable to its portfolio, such as advisory, administration, and certain shareholder service fees. Income, expenses (other than expenses attributable to a specific class), and realized and unrealized gains/losses on investments are allocated to each class of shares based on such class’s net assets. Distributions received from the Fund’s investments in MLPs generally are comprised of ordinary income, capital gains and return of capital from the energy trusts of MLPs. The Fund records investment income on the ex-date of the distributions. For financial statement purposes, the |
| HENNESSY FUNDS | 1-800-966-4354 | |
| | Fund uses return of capital and income estimates to allocate the dividend income received. Such estimates are based on historical information available from each energy trust or MLP and other industry sources. These estimates may subsequently be revised based on information received from energy trusts and MLPs after their tax reporting periods are concluded, as the actual character of these distributions is not known until after the fiscal year end of the Fund. |
| | |
| e). | Distributions to Shareholders – The Fund intends to make quarterly cash distributions to its shareholders. Due to the tax treatment of the Fund’s allocations and distributions from MLPs, a significant portion of the Fund’s distributions to shareholders will likely be treated as return of capital to shareholders for U.S. federal income tax purposes (i.e., as distributions in excess of the Fund’s current and accumulated earnings and profits as described below). However, no assurance can be given in this regard; just as the Fund’s corporate income tax liability can fluctuate materially from year to year, the extent to which the Fund is able to make return-of-capital distributions also can vary materially from year to year depending on a number of different factors, including the composition of the Fund’s portfolio, the level of allocations of net income and other tax items for the Fund from its underlying MLP investments during a particular taxable year, the length of time the Fund has owned the MLP equity securities in its portfolio, and the extent to which the Fund disposes of MLP equity securities during a particular year, including, if necessary, to meet Fund shareholder redemption requests. |
| | |
| | In general, a distribution will constitute a return of capital to a shareholder, rather than a dividend, to the extent such distribution exceeds the Fund’s current and accumulated earnings and profits. The portion of any distribution treated as a return of capital will constitute a tax-free return of capital to the extent of the shareholder’s basis in its Fund shares and thereafter generally will be taxable to the shareholder as a capital gain. Any such distribution, in turn, will result in a reduction in a shareholder’s basis in the Fund’s shares (but not below zero) to the extent of the return of capital and in the shareholder’s recognizing more gain or less loss (that is, will result in an increase of a shareholder’s tax liability) when the shareholder later sells shares of the Fund. To permit the Fund to maintain a more stable distribution rate, the Fund may distribute less or more than the entire amount of cash it receives from its investments in a particular period. Any undistributed cash would be available to supplement future distributions, and until distributed would add to the Fund’s net asset value. Correspondingly, such amounts, once distributed, will be deducted from the Fund’s net asset value. In addition, the Fund may determine not to make distributions in quarters in which the Fund believes that a distribution could cause adverse tax consequences to shareholders, including when the Fund believes that a distribution may not constitute a tax-free return of capital as described above. |
| | |
| f). | Security Transactions – Investment and shareholder transactions are recorded on the trade date. The Fund determines the realized gain/loss from an investment transaction by comparing the original cost of the security lot sold with the net sale proceeds. Discounts and premiums on securities purchased are accreted or amortized, respectively, over the life of each such security. |
| | |
| g). | Use of Estimates – The preparation of financial statements in conformity with GAAP requires management to make estimates and assumptions that affect the reported amounts of assets and liabilities and disclosure of contingent assets and liabilities at the date of the financial statements and the reported change in net assets during the reporting period. Actual results could differ from those estimates. |
| NOTES TO THE FINANCIAL STATEMENTS |
| h). | Share Valuation – The net asset value (“NAV”) per share of the Fund is calculated by dividing (i) the total value of the securities held by the Fund, plus cash and other assets, minus all liabilities (including estimated accrued expenses) by (ii) the total number of shares outstanding for the Fund, rounded to the nearest cent. The Fund’s shares will not be priced on days the New York Stock Exchange is closed for trading. The offering and redemption price per share for the Fund is equal to the Fund’s NAV per share. |
| | |
| i). | Derivatives – The Fund may invest in, or enter into, derivatives, such as options, futures contracts, options on futures contracts, and swaps, for a variety of reasons, including to hedge certain risks, provide a substitute for purchasing or selling particular securities, or increase potential income gain. Derivatives are financial contracts based on an underlying or notional amount, require no initial investment or an initial net investment that is smaller than would normally be required to have a similar response to changes in market factors, and require or permit net settlement. Derivatives may allow the Fund to increase or decrease its level of risk more quickly and efficiently than transactions in other types of instruments. The main reason for utilizing derivative instruments is for hedging purposes. |
| | |
| | The Fund follows the financial accounting reporting rules as required by the Derivatives and Hedging Topic of the FASB Accounting Standards Codification. Under such rules, the Fund is required to include enhanced disclosure that enables investors to understand how and why an entity uses derivatives, how derivatives are accounted for, and how derivatives instruments affect an entity’s results of operations and financial position. During the 11-month period ended October 31, 2018, and the year ended November 30, 2017, the Fund did not hold any derivative instruments. |
| | |
| j). | Partnership Accounting Policy – The Fund records its pro rata share of income/loss and capital gains/losses to the extent of distributions it has received, allocated from the underlying partnerships and accordingly adjusts the cost basis of the underlying partnerships for return of capital. |
| | |
| k). | New Accounting Pronouncements – In August 2018, the FASB issued Accounting Standards Update No. 2018-13 “Disclosure Framework—Changes to the Disclosure Requirements for Fair Value Measurement” (“ASU 2018-13”). ASU 2018-13 eliminates the requirement to disclose the amount of and reasons for transfers between Level 1 and Level 2 of the fair value hierarchy, the timing of transfers between levels of the fair value hierarchy, and the valuation processes for Level 3 fair value measurements. ASU 2018-13 does not eliminate the requirement to disclose the range and weighted average used to develop significant unobservable inputs for Level 3 fair value measurements, and the changes in unrealized gains and losses for recurring Level 3 fair value measurements. ASU 2018-13 requires that information is provided about the measurement uncertainty of Level 3 fair value measurements as of the reporting date. The guidance is effective for fiscal years beginning after December 15, 2019, and interim periods within those fiscal years. Management has evaluated the impact of this change in guidance, and due to the permissibility of early adoption, modified the Fund’s fair value disclosures for the current reporting period. |
| | |
| l). | New Rule Issuances – In August 2018, the Securities and Exchange Commission issued Final Rule Release No. 33 10532, Disclosure Update and Simplification, which in part amends certain financial statement disclosure requirements of Regulation S-X that have become redundant, duplicative, overlapping, outdated, or superseded, in light of other Commission disclosure requirements, GAAP, or changes in the information environment. The amendments are intended to facilitate the disclosure |
| HENNESSY FUNDS | 1-800-966-4354 | |
| | of information to investors and simplify compliance without significantly altering the total mix of information provided to investors. The amendments to Rule 6-04.17 of Regulation S-X (balance sheet) were amended to require presentation of the total, rather than the components of net assets, of distributable earnings on the balance sheet. Consistent with GAAP, funds will be required to disclose total distributable earnings. The amendments to Rule 6-09 of Regulation S-X (statement of changes in net assets) omit the requirement to separately state the sources of distributions paid as well as omit the requirement to parenthetically state the book basis amount of undistributed net investment income. Instead, consistent with GAAP, funds will be required to disclose the total amount of distributions paid, except that any tax return of capital must be separately disclosed. The requirements of the Final Rule Release are effective November 5, 2018 and the Fund’s Statement of Assets and Liabilities and the Statement of Changes in Net Assets for the current and prior reporting period have been modified accordingly. |
3). SECURITIES VALUATION
The Fund follows fair valuation accounting standards that establish an authoritative definition of fair value and set out a hierarchy for measuring fair value. These standards require additional disclosures about the various inputs and valuation techniques used to develop the measurements of fair value and a discussion of changes in valuation techniques and related inputs during the period. These inputs are summarized in the three broad levels listed below:
| | Level 1 – | Unadjusted, quoted prices in active markets for identical instruments that the Fund has the ability to access at the date of measurement. |
| | | |
| | Level 2 – | Other significant observable inputs (including, but not limited to, quoted prices in active markets for similar instruments, quoted prices in markets that are not active for identical or similar instruments, and model-derived valuations in which all significant inputs and significant value drivers are observable in active markets, such as interest rates, prepayment speeds, credit risk curves, default rates, and similar data). |
| | | |
| | Level 3 – | Significant unobservable inputs (including the Fund’s own assumptions about what market participants would use to price the asset or liability based on the best available information) when observable inputs are unavailable. |
Following is a description of the valuation techniques applied to the Fund’s major categories of assets and liabilities measured at fair value on a recurring basis.
Equity Securities – Equity securities, including common stocks, preferred stocks, foreign-issued common stocks, exchange-traded funds, closed-end mutual funds, partnerships, rights, MLPs, and real estate investment trusts, that are traded on a securities exchange for which a last-quoted sales price is readily available will generally be valued at the last sales price as reported by the primary exchange on which the securities are listed. Securities listed on The NASDAQ Stock Market (“NASDAQ”) will generally be valued at the NASDAQ Official Closing Price, which may differ from the last sales price reported. Securities traded on a securities exchange for which a last-quoted sales price is not readily available will generally be valued at the mean between the bid and ask prices. To the extent these securities are actively traded and valuation adjustments are not applied, they are classified in Level 1 of the fair value hierarchy. Securities traded on foreign exchanges generally are not valued at the same time the Fund calculates its NAV because most foreign markets close well before such time. The earlier close of most foreign markets gives rise to the possibility that significant events, including broad market moves, may
| NOTES TO THE FINANCIAL STATEMENTS |
| | have occurred in the interim. In certain circumstances, it may be determined that a foreign security needs to be fair valued because it appears that the value of the security might have been materially affected by events occurring after the close of the market in which the security is principally traded, but before the time the Fund calculates its NAV, such as by a development that affects an entire market or region (e.g., a weather-related event) or a potentially global development (e.g., a terrorist attack that may be expected to have an effect on investor expectations worldwide). |
| | |
| | Registered Investment Companies – Investments in open-end registered investment companies, commonly referred to as mutual funds, are generally priced at the ending NAV provided by the applicable mutual fund’s service agent and will be classified in Level 1 of the fair value hierarchy. |
| | |
| | Debt Securities – Debt securities, including corporate bonds, asset-backed securities, mortgage-backed securities, municipal bonds, U.S. Treasuries, and U.S. government agency issues, are generally valued at market on the basis of valuations furnished by an independent pricing service that utilizes both dealer-supplied valuations and formula-based techniques. The pricing service may consider recently executed transactions in securities of the issuer or comparable issuers, market price quotations (where observable), bond spreads, and fundamental data relating to the issuer. In addition, the model may incorporate observable market data, such as reported sales of similar securities, broker quotes, yields, bids, offers, and reference data. Certain securities are valued primarily using dealer quotations. These securities are generally classified in Level 2 of the fair value hierarchy. |
| | |
| | Short-Term Securities – Short-term equity investments, including money market funds, are valued in the manner specified above. Short-term debt investments with an original term to maturity of 60 days or less are valued at amortized cost, which approximates fair market value. If the original term to maturity of a short-term debt investment exceeded 60 days, then the values as of the 61st day prior to maturity are amortized. Amortized cost is not used if its use would be inappropriate due to credit or other impairments of the issuer, in which case the security’s fair value would be determined, as described below. Short-term securities are generally classified in Level 1 or Level 2 of the fair market hierarchy depending on the inputs used and market activity levels for specific securities. |
The Board of Trustees of the Fund (the “Board”) has adopted fair value pricing procedures that are followed when a price for a security is not readily available or if a significant event has occurred that indicates the closing price of a security no longer represents the true value of that security. Fair value pricing determinations are made in good faith in accordance with these procedures. There are numerous criteria that will be given consideration in determining a fair value of a security, such as the trading volume of a security and markets, the values of other similar securities, and news events with direct bearing on a security or markets. Fair value pricing results in an estimated price for a security that reflects the amount the Fund might reasonably expect to receive in a current sale. Depending on the relative significance of the valuation inputs, these securities may be classified in either Level 2 or Level 3 of the fair value hierarchy.
The fair valuation of foreign securities may be determined with the assistance of a pricing service using correlations between the movement of prices of such securities and indices of domestic securities and other appropriate indicators, such as closing market prices of relevant American Depositary Receipts or futures contracts. The effect of using fair value pricing is that the Fund’s NAV will reflect the affected portfolio securities’ values as determined by the Board or its designee, pursuant to the fair value pricing procedures adopted by the Board, instead of being determined by the market. Using a fair value
| HENNESSY FUNDS | 1-800-966-4354 | |
pricing methodology to price a foreign security may result in a value that is different from such foreign security’s most recent closing price and from the value used by other investment companies to calculate their NAVs. Such securities are generally classified in Level 2 of the fair valuation hierarchy. Because the Fund may invest in foreign securities, the value of the Fund’s portfolio securities may change on days when you will not be able to purchase or redeem your shares.
The Board has delegated day-to-day valuation matters to a Valuation Committee comprised of one or more representatives from Hennessy Advisors, Inc., the Fund’s investment advisor (the “Advisor”). The function of the Valuation Committee is to value securities where current and reliable market quotations are not readily available. All actions taken by the Valuation Committee are reviewed by the Board.
The Fund has performed an analysis of all existing investments to determine the significance and character of all inputs to their fair value determinations. Various inputs are used to determine the value of the Fund’s investments. The inputs or methodology used for valuing securities are not necessarily an indication of the risk associated with investing in those securities. Details related to the fair valuation hierarchy of the Fund’s securities as of October 31, 2018, are included in the Schedule of Investments.
4). INVESTMENT TRANSACTIONS
Purchases and sales of investment securities (excluding government and short-term investments) for the Fund during the 11-month period ended October 31, 2018, were $82,692,307 and $68,209,113, respectively. For the year ended November 30, 2017, the purchases and sales of investment securities (excluding government and short-term investments) for the Fund were $107,519,630 and $48,698,827, respectively.
There were no purchases or sales/maturities of long-term U.S. government securities for the Fund during the 11-month period ended October 31, 2018, or the year ended November 30, 2017.
The Fund is permitted to purchase or sell securities from or to another fund in the Hennessy Funds family of funds (the “Hennessy Funds”) under specified conditions outlined in procedures adopted by the Board. The procedures have been designed to ensure that any purchase or sale of securities by the Fund from or to another Hennessy Fund complies with Rule 17a-7 of the Investment Company Act of 1940, as amended. During the period of October 26, 2018 (reorganization date), through October 31, 2018, the Fund did not engage in purchases or sales of securities pursuant to Rule 17a-7 of the Investment Company Act of 1940, as amended.
5). INVESTMENT ADVISORY FEE AND OTHER TRANSACTIONS WITH AFFILIATES
Prior to the close of business on October 26, 2018, BP Capital Fund Advisors, LLC (“BPCFA”) acted as the investment advisor to the Predecessor Fund. BPCFA furnished all investment advice, office space, and facilities, as well as most of the personnel needed by the Fund. As compensation for its services, BPCFA was entitled to a monthly fee from the Predecessor Fund. The fee was based upon the average daily net assets of the Predecessor Fund at an annual rate of 1.10%. The net investment advisory fees expensed by the Fund during the period from December 1, 2017, to October 26, 2018, and the year ended November 30, 2017, were $1,089,471 and $901,198, respectively.
Effective following the close of business on October 26, 2018, the Advisor (Hennessy Advisors, Inc.) began providing the Fund with investment advisory services under an Investment Advisory Agreement. The Advisor oversees the provision of investment advice and furnishes office space and facilities, as well as most of the personnel needed by the Fund. As compensation for its services, the Advisor is entitled to a monthly fee from
| NOTES TO THE FINANCIAL STATEMENTS |
the Fund. The fee is based upon the average daily net assets of the Fund at an annual rate of 1.10%. The net investment advisory fees expensed by the Fund during the period from October 27, 2018, to October 31, 2018, were $14,710.
Following the close of business on October 26, 2018, the Advisor delegated the day-to-day management of the Fund to a sub-advisor, BPCFA, and began paying a sub-advisory fee, based upon the daily net assets of the Fund, at the rate of 0.40%. The Advisor pays the sub-advisory fees from its own assets, and these fees are not an additional expense of the Fund.
The Advisor has contractually agreed to limit total annual operating expenses to 1.75% of the Fund’s net assets for Investor Class shares and 1.50% of the Fund’s net assets for Institutional Class shares (in each case, excluding all federal, state, and local taxes, interest, brokerage commissions, dividend and interest expenses on short sales, extraordinary items, and acquired fund fees and expenses and other costs incurred in connection with the purchase and sale of securities) through October 25, 2020. During the period October 26, 2018, through October 31, 2018, the Advisor waived expenses of $2,918.
For a period of three years after the year in which the Advisor waives or reimburses expenses, the Advisor may seek reimbursement from the Fund to the extent that total annual fund operating expenses are less than the expense limitation that was in effect at the time the Advisor waived or reimbursed expenses. During the period October 26, 2018, through October 31, 2018, cumulative expenses subject to potential recovery under the aforementioned conditions and year of expiration were as follows:
| | | October 31, 2021 | |
| Investor Class | | $ | 597 | |
| Institutional Class | | $ | 2,321 | |
During the year ended November 30, 2017, and for the period from December 1, 2017, to the close of business on October 26, 2018, BPCFA had contractually agreed to limit total annual operating expenses and to maintain the expense limitation for the Predecessor Fund on the same terms as described above. During the year ended November 30, 2017, BPCFA waived expenses of $113,622. During the period from December 1, 2017, to the close of business on October 26, 2018, BPCFA waived expenses of $62,763. All previously fees waived by BPCFA are no longer subject to reimbursement from the Fund.
During the period from December 1, 2017, to the close of business on October 26, 2018, and for the year ended November 30, 2017, the Predecessor Fund had a Shareholder Servicing Plan in place on behalf of each share class. Under the Shareholder Servicing Plan, Investor Class and Institutional Class shares were authorized to pay an annual shareholder servicing fee of up to 0.10% of each class’s average daily net assets. This fee was used to finance certain activities related to servicing and maintaining shareholder accounts and is included in sub-transfer agent expenses in the Statement of Operations.
Effective following the close of business on October 26, 2018, the Board approved a Shareholder Servicing Agreement for Investor Class shares of the Fund, which was instituted to compensate the Advisor for the non-investment advisory services it provides to the Fund. The Shareholder Servicing Agreement provides for a monthly fee paid to the Advisor at an annual rate of 0.10% of the average daily net assets of the Fund attributable to Investor Class shares. The shareholder servicing fees expensed by the Fund during the period from October 27, 2018, to October 31, 2018, were $273.
During the period from December 1, 2017, to the close of business on October 26, 2018, and for the year ended November 30, 2017, the Predecessor Fund had a distribution plan in place pursuant to Rule 12b-1 under the 1940 Act. The distribution plan required the
| HENNESSY FUNDS | 1-800-966-4354 | |
payment of a monthly service fee to Foreside Fund Services, LLC at an annual rate of 0.25% of the average daily net assets attributed to Investor Class shares. Effective following the close of business on October 26, 2018, the Fund adopted a plan pursuant to Rule 12b-1 under the Investment Company Act of 1940, as amended, that authorizes payments in connection with the distribution of the Fund’s shares at an annual rate of up to 0.25% of the Fund’s average daily net assets attributable to Investor Class shares. Even though the authorized rate is up to 0.25%, the Fund is currently only using up to 0.15% of its average daily net assets attributable to Investor Class shares for such purpose. Amounts paid under the plan may be spent on any activities or expenses primarily intended to result in the sale of shares, including, but not limited to, advertising, shareholder account servicing, printing and mailing of prospectuses to other than current shareholders, printing and mailing of sales literature, and compensation for sales and marketing activities or to financial institutions and others, such as dealers and distributors. The distribution fees expensed by the Fund during the 11-month period ended October 31, 2018, and the year ended November 30, 2017, are included in the Statement of Operations.
The Fund has entered into agreements with various brokers, dealers, and financial intermediaries in connection with the sale of shares of the Fund. The agreements provide for periodic payments by the Fund to the brokers, dealers, and financial intermediaries for providing certain shareholder maintenance services (sub-transfer agent expenses). These shareholder services include the pre-processing and quality control of new accounts, shareholder correspondence, answering customer inquiries regarding account status, and facilitating shareholder telephone transactions. The sub-transfer agent fees (inclusive of the fees under the shareholder servicing plan for the Predecessor Fund described above) expensed by the Fund during the 11-month period ended October 31, 2018, and the year ended November 30, 2017, are included in the Statement of Operations.
U.S. Bancorp Fund Services, LLC, d/b/a U.S. Bank Global Fund Services (“Fund Services”) provides the Fund with administrative, fund accounting, and transfer agent services. As administrator, Fund Services is responsible for activities such as (i) preparing various federal and state regulatory filings, reports, and returns for the Fund, (ii) preparing reports and materials to be supplied to the Board, (iii) monitoring the activities of the Fund’s custodian, transfer agent, and accountants, and (iv) coordinating the preparation and payment of the Fund’s expenses and reviewing the Fund’s expense accruals. U.S. Bank N.A., an affiliate of Fund Services, serves as the Fund’s custodian. The servicing agreements between the Trust and Fund Services and U.S. Bank N.A. contain a fee schedule that is inclusive of administrative, fund accounting, custody, and transfer agent fees. The administrative, fund accounting, custody, and transfer agent fees expensed by the Fund during the 11-month period ended October 31, 2018, and the year ended November 30, 2017, are included in the Statement of Operations.
Quasar Distributors, LLC acts as the Fund’s principal underwriter in a continuous public offering of the Fund’s shares. Quasar Distributors, LLC is an affiliate of Fund Services and U.S. Bank N.A.
During the period from December 1, 2017, to the close of business on October 26, 2018, and the year ended November 30, 2017, the officers and Chief Compliance Officer of the Predecessor Fund were employees of Fund Services. Chief Compliance Officer Fees paid by the Predecessor Fund to Fund Services during the period from December 1, 2017, to October 26, 2018 and the year ended November 30, 2017, were $10,271 and $10,807, respectively. Effective following the close of business on October 26, 2018, the officers of the Fund are affiliated with the Advisor. Such officers, with the exception of the Chief Compliance Officer and the Senior Compliance Officer, receive no compensation from the Fund for serving in their respective roles. The Fund, along with the other
| NOTES TO THE FINANCIAL STATEMENTS |
Hennessy Funds, makes reimbursement payments, on an equal basis, to the Advisor for a portion of the salary and benefits associated with the office of the Chief Compliance Officer and for all of the salary and benefits associated with the office of the Senior Compliance Officer. The Fund did not incur any compliance expense during the period from October 27, 2018, to October 31, 2018.
6). GUARANTEES AND INDEMNIFICATIONS
Under the Hennessy Funds’ organizational documents, their officers and trustees are indemnified by the Hennessy Funds against certain liabilities arising out of the performance of their duties to the Hennessy Funds. Additionally, in the normal course of business, the Hennessy Funds enter into contracts with service providers that contain general indemnification clauses. The Fund’s maximum exposure under these arrangements is unknown as this would involve future claims that may be made against the Fund that have not yet occurred. Currently, the Fund expects the risk of loss to be remote.
7). LINE OF CREDIT
During the year ended November 30, 2017, the Predecessor Fund had a $10,000,000 line of credit with U.S. Bank N.A. for temporary or extraordinary purposes. During such period, the Predecessor Fund did not have any borrowings on the line of credit. During the period from December 1, 2017, through October 26, 2018, the Predecessor Fund had an outstanding average daily balance and a weighted average interest rate of $109,400 and 4.76%, respectively. The interest expensed by the Predecessor Fund during such period is included in the Statement of Operations. The maximum amount outstanding for the Predecessor Fund during such period was $2,560,000. As of October 26, 2018, the Predecessor Fund did not have any borrowings outstanding under the line of credit.
After the close of business on October 26, 2018, the Fund had an uncommitted line of credit with the other Hennessy Funds in the amount of the lesser of (i) $100,000,000 or (ii) 33.33% of each Hennessy Fund’s net assets, or 30% for the Hennessy Gas Utility Fund and 10% for the Hennessy Balanced Fund, intended to provide short-term financing, if necessary, subject to certain restrictions, in connection with shareholder redemptions. The credit facility is with the Hennessy Funds’ custodian bank, U.S. Bank N.A. Borrowings under this arrangement bear interest at the bank’s prime rate and are secured by all of the Fund’s assets (as to its own borrowings only). From October 29, 2018, through October 31, 2018, the Fund had an outstanding average daily balance and a weighted average interest rate of $86,600 and 5.25%, respectively. The interest expensed by the Fund during such period is included in the Statement of Operations. The maximum amount outstanding for the Fund during such period was $269,000. As of October 31, 2018, the Fund had a loan payable of $127,000.
8). FEDERAL TAX INFORMATION
As of October 31, 2018, the components of accumulated earnings (losses) for income tax purposes were as follows:
| | | Investments | |
| Cost of investments for tax purposes | | $ | 100,000,804 | |
| Gross tax unrealized appreciation | | $ | 4,967,160 | |
| Gross tax unrealized depreciation | | | (7,328,904 | ) |
| Net tax unrealized appreciation | | $ | (2,361,744 | ) |
To the extent the Fund has a net capital loss in any tax year, the net capital loss generally can be carried back three years and forward five years to offset any capital gains realized during those other years. To the extent the Fund has a net operating loss in any
| HENNESSY FUNDS | 1-800-966-4354 | |
tax year the net operating loss generally can be carried back two years or forward twenty years to reduce the Fund’s net income realized during those other years. In the event a capital loss carryover or net operating loss carryover cannot be utilized in the carryover periods, the Fund’s U.S. federal income tax liability may be higher than expected, which will result in less cash available to distribute to shareholders. As of October 31, 2018, the Fund had capital loss carryforwards that expire as follows:
| | Amount | | Expiration | |
| | $ | 1,511,860 | | 10/31/2020 | |
| | | 2,137,300 | | 10/31/2021 | |
| | | 7,987,383 | | 10/31/2023 | |
As of October 31, 2018, the Fund had net operating loss carryforwards that expire as follows:
| | Amount | | Expiration | |
| | $ | 1,937,148 | | 10/31/2037 | |
| | | 539,645 | | Indefinite | |
Total income taxes have been computed by applying the federal statutory income tax rate of 35% plus a blended state income tax rate. The Fund applied this effective rate to net investment income, realized and unrealized gains on investments before taxes in computing its total income taxes.
| Total Tax Expense (Benefit) | | Total | |
| Tax expense (benefit) at statutory rates | | $ | (1,680,187 | ) |
| State income tax expense, net of federal benefit | | | (200,745 | ) |
Tax expense (benefit) on permanent items(1) | | | (42,681 | ) |
| Tax expense (benefit) due to change in effective state rates | | | — | |
| Total current tax expense (benefit) | | | — | |
| Change in Federal/State rate due to tax reform | | | 986,505 | |
| Change in valuation allowance | | | 921,213 | |
| Total tax expense | | $ | (15,895 | ) |
(1) Permanent items are made up of dividends received deductions.
The Fund recognizes the tax benefits of uncertain tax positions only where the position is “more likely than not” to be sustained assuming examination by tax authorities. Management has analyzed the Fund’s tax positions and has concluded that no liability for unrecognized tax benefits should be recorded related to uncertain tax positions taken on U.S. federal tax returns and state tax returns filed or expected to be filed since inception of the Fund. No income tax returns are currently under examination. Generally, tax authorities can examine all tax returns filed for the last three years. Due to the nature of the Fund’s investments, the Fund may be required to file income tax returns in several states. The Fund is not aware of any tax positions for which it is reasonably possible that the total amounts of unrecognized tax benefits will change materially.
| NOTES TO THE FINANCIAL STATEMENTS |
During the 11-month period ended October 31, 2018 (estimated), and the years ended November 30, 2017 and 2016, the tax character of distributions paid by the Fund was as follows:
| | | 11-Month Period Ended | | | Year Ended | | | Year Ended | |
| | | October 31, 2018 | | | November 30, 2017 | | | November 30, 2016 | |
Ordinary income(1) | | $ | — | | | $ | 637,466 | | | $ | — | |
| Long-term capital gain | | | — | | | | — | | | | — | |
| Return of capital | | | 7,826,085 | | | | 4,084,626 | | | | 2,419,383 | |
| | | $ | 7,826,085 | | | $ | 4,722,092 | | | $ | 2,419,383 | |
| | (1) Ordinary income includes short-term capital gains. |
9). AGREEMENT AND PLAN OF REORGANIZATION
On October 22, 2018, shareholders of the Predecessor Fund approved an Agreement and Plan of Reorganization between the Trust, on behalf of the Fund, and Professionally Managed Portfolios, a Massachusetts business Trust, on behalf of the Predecessor Fund. The Agreement and Plan of Reorganization provided for the transfer of all of the assets of the Predecessor Fund to the Fund and the assumption of the liabilities (other than any excluded liabilities) of the Predecessor Fund by the Fund. The Fund was created to carry out the reorganization and has a substantially similar investment objective and substantially similar principal investment strategies as the Predecessor Fund. The reorganization was effective as of the close of business on October 26, 2018. The following table illustrates the specifics of the reorganization of the Predecessor Fund into the Fund:
| | | Shares Issued | | | |
| | Predecessor Fund | to Shareholders of | Fund | Combined | Tax Status |
| | Net Assets | Predecessor Fund | Net Assets | Net Assets | of Transfer |
| | $98,129,391(1) | 7,698,159 | $0 | $98,129,391 | Non-taxable |
| | (1) | Includes accumulated net investment loss, accumulated realized gains and unrealized appreciation in the amounts of $(15,348,815), $(7,211,324) and $(5,832,377), respectively. |
10). MATTERS SUBMITTED TO A SHAREHOLDER VOTE (Unaudited)
A special meeting of shareholders of the Predecessor Fund was held on October 22, 2018, and the following matter was approved:
Proposal to approve an Agreement and Plan of Reorganization pursuant to which all of the assets of the BP Capital TwinLine MLP Fund will be transferred to the Hennessy BP Midstream Fund, a newly formed series of Hennessy Funds Trust, in exchange for Investor Class and Institutional Class shares of the Hennessy BP Midstream Fund, distributed pro rata by the BP Capital TwinLine MLP Fund to its Class A and Class I shareholders, and the Hennessy BP Midstream Fund’s assumption of BP Capital TwinLine MLP Fund’s stated liabilities.
For: 4,802,637
Against: 28,256
Abstain: 22,075
Nonvotes: 0
11). EVENTS SUBSEQUENT TO PERIOD END
Management has evaluated the Fund’s related events and transactions that occurred subsequent to October 31, 2018, through the date of issuance of the Fund’s financial statements. Management has determined that there were no subsequent events requiring recognition or disclosure in the financial statements.
| HENNESSY FUNDS | 1-800-966-4354 | |
Report of Independent Registered Public
Accounting Firm
To the Board of Trustees of Hennessy Funds Trust
and the shareholders of Hennessy BP Midstream Fund
Novato, CA
Opinion on the Financial Statements
We have audited the accompanying statement of assets and liabilities of Hennessy BP Midstream Fund (the “Fund”), a series of Hennessy Funds Trust, including the schedule of investments, as of October 31, 2018, the related statements of operations for the eleven months ended October 31, 2018 and the year ended November 30, 2017, the statements of changes in net assets for the eleven months ended October 31, 2018 and each of the two years ended November 30, 2017, financial highlights for the eleven months ended October 31, 2018 and each of the three years ended November 30, 2017, and for the period from December 31, 2013 (commencement of operations) to November 30, 2014, and the related notes (collectively referred to as the “financial statements”). In our opinion, the financial statements present fairly, in all material respects, the financial position of the Fund as of October 31, 2018, the results of its operations, the changes in its net assets and the financial highlights for each of periods noted above, in conformity with accounting principles generally accepted in the United States of America.
Basis for Opinion
These financial statements are the responsibility of the Fund’s management. Our responsibility is to express an opinion on the Fund’s financial statements based on our audits. We are a public accounting firm registered with the Public Company Accounting Oversight Board (United States) (“PCAOB”) and are required to be independent with respect to the Fund in accordance with the U.S. federal securities laws and the applicable rules and regulations of the Securities and Exchange Commission and the PCAOB. We have served as the auditor of one or more of the funds in the Trust since 2002.
We conducted our audits in accordance with the standards of the PCAOB. Those standards require that we plan and perform the audit to obtain reasonable assurance about whether the financial statements are free of material misstatement, whether due to error or fraud. The Fund is not required to have, nor were we engaged to perform, an audit of its internal control over financial reporting. As part of our audits we are required to obtain an understanding of internal control over financial reporting, but not for the purpose of expressing an opinion on the effectiveness of the Fund’s internal control over financial reporting. Accordingly, we express no such opinion.
Our audits included performing procedures to assess the risks of material misstatement of the financial statements, whether due to error or fraud, and performing procedures that respond to those risks. Such procedures included examining, on a test basis, evidence regarding the amounts and disclosures in the financial statements. Our audits also included evaluating the accounting principles used and significant estimates made by management, as well as evaluating the overall presentation of the financial statements. Our procedures included confirmation of securities owned as of October 31, 2018 by correspondence with the custodian. We believe that our audits provide a reasonable basis for our opinion.
TAIT, WELLER & BAKER LLP
Philadelphia, Pennsylvania
December 27, 2018
| REPORT OF INDEPENDENT REGISTERED PUBLIC ACCOUNTING FIRM/TRUSTEES AND OFFICERS |
Trustees and Officers of the Fund (Unaudited)
The business and affairs of the Funds are managed under the direction of the Board of Trustees of the Trust, and the Board of Trustees elects the Officers of the Trust. Beginning in March 2015, the Board of Trustees has from time to time appointed advisers to the Board of Trustees (“Advisers”) with the intention of having qualified individuals serve in an advisory capacity in order to garner experience in the mutual fund and asset management industry and be considered as potential Trustees in the future. There are currently three Advisers: Brian Alexander, Doug Franklin, and Claire Knoles. As Advisers, Mr. Alexander, Mr. Franklin, and Ms. Knoles attend meetings of the Board of Trustees and act as non-voting participants. Information pertaining to the Trustees, Advisers, and the Officers of the Trust is set forth below. The Trustees and Officers serve until their successors are duly elected and qualified or until their earlier death, resignation, or removal. Each Trustee oversees the 16 Hennessy Funds. Unless otherwise indicated, the address of all persons listed below is 7250 Redwood Boulevard, Suite 200, Novato, CA 94945. The Fund’s Statement of Additional Information includes more information about the persons listed below and is available, without charge, upon request by calling 1-800-966-4354.
| | | | Other |
| | | | Directorships |
| | | | Held Outside |
| Name, (Year of Birth), | | | of Fund |
| and Position Held | Start Date | Principal Occupation(s) | Complex During |
with the Trust | of Service | During Past Five Years | Past Five Years(1) |
| | |
| Disinterested Trustees and Advisers | |
| | | | |
| J. Dennis DeSousa | January 1996 | Mr. DeSousa is a real estate investor. | None. |
| (1936) | | | |
| Trustee | | | |
| | | | |
| Robert T. Doyle | January 1996 | Mr. Doyle has been the Sheriff of | None. |
| (1947) | | Marin County, California since 1996. | |
| Trustee | | | |
| | | | |
| Gerald P. Richardson | May 2004 | Mr. Richardson is an independent | None. |
| (1945) | | consultant in the securities industry. | |
| Trustee | | | |
| | | | |
| Brian Alexander | March 2015 | Mr. Alexander has worked for the | None. |
| (1981) | | Sutter Health organization since | |
| Adviser to the Board | | 2011 in various positions. He has | |
| | | served as the Chief Executive Officer | |
| | | of the Sutter Roseville Medical | |
| | | Center since 2018. From 2016 through | |
| | | 2018, he served as the Vice President | |
| | | of Strategy for the Sutter Health Valley | |
| | | Area, which includes 11 hospitals, | |
| | | 13 ambulatory surgery centers, | |
| | | 16,000 employees, and 1,900 physicians. | |
| | | From 2013 through 2016, Mr. Alexander | |
| | | served as Sutter Novato Community | |
| | | Hospital’s Chief Administrative Officer, | |
| | | and from 2011 through 2012, he | |
| | | served as a Director of Strategy | |
| | | within Sutter’s West Bay Region. | |
| HENNESSY FUNDS | 1-800-966-4354 | |
| | | | Other |
| | | | Directorships |
| | | | Held Outside |
| Name, (Year of Birth), | | | of Fund |
| and Position Held | Start Date | Principal Occupation(s) | Complex During |
with the Trust | of Service | During Past Five Years | Past Five Years(1) |
| | | | |
| Doug Franklin | March 2016 | Mr. Franklin is a retired insurance | None. |
| (1964) | | industry executive. From 1987 | |
| Adviser to the Board | | through 2015, he was employed | |
| | | by the Allianz-Fireman’s Fund | |
| | | Insurance Company in various | |
| | | positions, including as its Chief | |
| | | Actuary and Chief Risk Officer. | |
| | | | |
| Claire Knoles | December 2015 | Ms. Knoles is a founder of Kiosk and | None. |
| (1974) | | has served as its Chief Operating | |
| Adviser to the Board | | Officer since 2004. Kiosk is a full | |
| | | service marketing agency with | |
| | | offices in the San Francisco Bay | |
| | | Area, Toronto, and Liverpool, UK. | |
| | | | |
Interested Trustee(2) | | | |
| | | | |
| Neil J. Hennessy | January 1996 as | Mr. Neil Hennessy has been employed | Hennessy |
| (1956) | a Trustee and | by Hennessy Advisors, Inc. since | Advisors, Inc. |
| Trustee, Chairman of | June 2008 as | 1989 and currently serves as its | |
| the Board, Chief | an Officer | Chairman and Chief Executive Officer. | |
| Investment Officer, | | | |
| Portfolio Manager, | | | |
| and President | | | |
| | | | |
| | | | |
| Name, (Year of Birth), | | | |
| and Position Held | Start Date | Principal Occupation(s) | |
with the Trust | of Service | During Past Five Years | |
| | | | |
| Officers | | | |
| | | | |
| Teresa M. Nilsen | January 1996 | Ms. Nilsen has been employed by Hennessy Advisors, Inc. | |
| (1966) | | since 1989 and currently serves as its President, Chief Operating | |
| Executive Vice President | | Officer, and Secretary. | |
| and Treasurer | | | |
| | | | |
| Daniel B. Steadman | March 2000 | Mr. Steadman has been employed by Hennessy Advisors, Inc. | |
| (1956) | | since 2000 and currently serves as its Executive Vice President. | |
| Executive Vice President | | | |
| and Secretary | | | |
| | | | |
| Brian Carlson | December 2013 | Mr. Carlson has been employed by Hennessy Advisors, Inc. | |
| (1972) | | since December 2013 and currently serves as its Chief | |
| Senior Vice President | | Compliance Officer and Senior Vice President. | |
| and Head of Distribution | | | |
| | | | |
| Jennifer Cheskiewicz | June 2013 | Ms. Cheskiewicz has been employed by Hennessy Advisors, Inc. | |
(1977)(3) | | as its General Counsel since June 2013. | |
| Senior Vice President and | | | |
| Chief Compliance Officer | | | |
| TRUSTEES AND OFFICERS OF THE FUND |
| Name, (Year of Birth), | | |
| and Position Held | Start Date | Principal Occupation(s) |
with the Trust | of Service | During Past Five Years |
| | | |
| David Ellison | October 2012 | Mr. Ellison has been employed by Hennessy Advisors, Inc. since |
(1958)(4) | | October 2012. He has served as a Portfolio Manager of the |
| Senior Vice President | | Hennessy Large Cap Financial Fund and the Hennessy Small |
| and Portfolio Manager | | Cap Financial Fund since inception. Mr. Ellison also served as a |
| | | Portfolio Manager of the Hennessy Technology Fund from its |
| | | inception until February 2017. Mr. Ellison served as Director, |
| | | CIO and President of FBR Fund Advisers, Inc. from December |
| | | 1999 to October 2012. |
| | | |
| Ryan C. Kelley | March 2013 | Mr. Kelley has been employed by Hennessy Advisors, Inc. since |
(1972)(5) | | October 2012. He has served as a Portfolio Manager of the |
| Senior Vice President | | Hennessy Gas Utility Fund, the Hennessy Large Cap Financial |
| and Portfolio Manager | | Fund, and the Hennessy Small Cap Financial Fund since |
| | | October 2014. He served as Co-Portfolio Manager of the same |
| | | funds from March 2013 through September 2014, and as a |
| | | Portfolio Analyst for the Hennessy Funds from October 2012 |
| | | through February 2013. Mr. Kelley has also served as a Portfolio |
| | | Manager of the Hennessy Cornerstone Growth Fund, the |
| | | Hennessy Cornerstone Mid Cap 30 Fund, the Hennessy |
| | | Cornerstone Large Growth Fund, and the Hennessy |
| | | Cornerstone Value Fund since February 2017, as a Co-Portfolio |
| | | Manager of the Hennessy Technology Fund since February |
| | | 2017, and as a Portfolio Manager of the Hennessy Total Return |
| | | Fund and the Hennessy Balanced Fund since May 2018. |
| | | Mr. Kelley served as Portfolio Manager of FBR Fund Advisers, |
| | | Inc. from January 2008 to October 2012. |
| | | |
| Tania Kelley | October 2003 | Ms. Kelley has been employed by Hennessy Advisors, Inc. |
| (1965) | | since October 2003. |
| Senior Vice President | | |
| and Head of Marketing | | |
| | | |
| Daniel P. Hennessy | December 2016 | Mr. Daniel Hennessy has been employed by Hennessy Advisors, |
| (1990) | | Inc. since 2015. He has served as an Associate Analyst or |
| Vice President | | Analyst of the Hennessy Technology Fund since February 2017. |
| and Analyst | | Mr. Daniel Hennessy previously served as a Mutual Fund |
| | | Specialist at U.S. Bancorp Fund Services, LLC (now doing |
| | | business as U.S. Bank Global Fund Services) from November |
| | | 2014 to July 2015. Prior to that, he attended the University of |
| | | San Diego, where he earned a degree in Political Science. |
_______________
(1) | Messrs. DeSousa, Doyle, N. Hennessy, and Richardson previously served on the Board of Directors of Hennessy Mutual Funds, Inc. (“HMFI”), The Hennessy Funds, Inc. (“HFI”), and Hennessy SPARX Funds Trust (“HSFT”). Pursuant to an internal reorganization effective as of February 28, 2014, the series of HFMI, HFI, and HSFT were reorganized into corresponding series of the Trust that mirrored them. Subsequent to the reorganization, HFMI, HFI, and HSFT were dissolved. |
(2) | Mr. N. Hennessy is considered an “interested person,” as defined in the Investment Company Act of 1940, as amended, because he is an officer of the Hennessy Funds. |
(3) | The address of this officer is 4800 Bee Caves Road, Suite 100, Austin, TX 78746. |
(4) | The address of this officer is 101 Federal Street, Suite 1900, Boston, MA 02110. |
(5) | The address of this officer is 1340 Environ Way, Suite 332, Chapel Hill, NC 27517. |
| HENNESSY FUNDS | 1-800-966-4354 | |
Expense Example (Unaudited)
October 31, 2018
As a shareholder of the Fund, you incur ongoing costs, including management fees, service fees, and other Fund expenses. This Example is intended to help you understand your ongoing costs (in dollars) of investing in the Fund and to compare these costs with the ongoing costs of investing in other mutual funds. The Example is based on an investment of $1,000 invested at the beginning of the period and held for the entire period from May 1, 2018, through October 31, 2018.
Actual Expenses
The first line of the table below under the “Investor Class” and “Institutional Class” headings provides information about actual account values and actual expenses. Although the Fund charges no sales loads or transaction fees, you will be assessed fees for outgoing wire transfers, returned checks and stop payment orders at prevailing rates charged by U.S. Bank Global Fund Services, the Fund’s transfer agent. If you request that a redemption be made by wire transfer, currently a $15 fee is charged by the Fund’s transfer agent. IRA accounts will be charged a $15 annual maintenance fee. The example below includes, but is not limited to, management fees, shareholder servicing fees, fund accounting, custody, and transfer agent fees. However, the example below does not include portfolio trading commissions and related expenses, and other extraordinary expenses as determined under generally accepted accounting principles. You may use the information in this line, together with the amount you invested, to estimate the expenses that you paid over the period. Simply divide your account value by $1,000 (for example, an $8,600 account value divided by $1,000 = 8.6), then multiply the result by the number in the first line of the table under the “Investor Class” or “Institutional Class” headings in the column entitled “Expenses Paid During Period” to estimate the expenses you paid on your account during this period.
Hypothetical Example for Comparison Purposes
The second line of the table below under the “Investor Class” and “Institutional Class” headings provides information about hypothetical account values and hypothetical expenses based on the Fund’s actual expense ratios and an assumed rate of return of 5% per year before expenses, which is not the Fund’s actual return. The hypothetical account values and expenses may not be used to estimate the actual ending account balance or expenses you paid for the period. You may use this information to compare the ongoing costs of investing in the Fund and other funds. To do so, compare this 5% hypothetical example with the 5% hypothetical examples that appear in the shareholder reports of the other funds. Please note that the expenses shown in the table are meant to highlight your ongoing costs only. Therefore, the second line of the table under the “Investor Class” and “Institutional Class” headings is useful in comparing ongoing costs only, and will not help you determine the relative total costs of owning different funds.
| | | | Expenses Paid |
| | Beginning | Ending | During Period(1) |
| | Account Value | Account Value | May 1, 2018 – |
| | May 1, 2018 | October 31, 2018 | October 31, 2018 |
| Investor Class | | | |
| Actual | $1,000.00 | $ 981.00 | $8.69 |
| Hypothetical (5% return before expenses) | $1,000.00 | $1,016.43 | $8.84 |
| | | | |
| Institutional Class | | | |
| Actual | $1,000.00 | $ 982.70 | $7.45 |
| Hypothetical (5% return before expenses) | $1,000.00 | $1,017.69 | $7.58 |
(1) | Expenses are equal to the Fund’s annualized expense ratio of 1.74% for Investor Class shares or 1.49% for Institutional Class shares, as applicable, multiplied by the average account value over the period, multiplied by 184/365 days (to reflect one-half year period). |
| HENNESSY FUNDS | 1-800-966-4354 | |
How to Obtain a Copy of the Fund’s
Proxy Voting Policy and Proxy Voting Records
A description of the policies and procedures the Fund uses to determine how to vote proxies relating to portfolio securities is available without charge: (1) by calling 1-800-966-4354; (2) on the Hennessy Funds’ website at www.hennessyfunds.com/proxy-voting/voting-policy; or (3) on the U.S. Securities and Exchange Commission’s (the “SEC”) website at www.sec.gov. The Fund’s proxy voting record is available without charge on both the Hennessy Funds’ website at www.hennessyfunds.com/proxy-voting/voting-record and the SEC’s website at www.sec.gov no later than August 31 for the prior 12 months ending June 30.
Quarterly Filings on Form N-Q
The Fund files a complete schedule of portfolio holdings with the SEC for the first and third quarters of each fiscal year on Form N-Q. The Fund’s Forms N-Q are available on the SEC’s website at www.sec.gov. Information included in the Fund’s Forms N-Q will also be available upon request by calling 1-800-966-4354.
Federal Tax Distribution Information
(Unaudited)
For fiscal year 2018, certain dividends paid by the Fund may be subject to a maximum tax rate of 23.8%, as provided for by the Jobs and Growth Tax Relief Reconciliation Act of 2003. The percentage of dividends declared from ordinary income designated as qualified dividend income was 0.00%.
For corporate shareholders, the percent of ordinary income distributions that qualified for the corporate dividends received deduction for fiscal year 2018 was 0.00%.
The percentage of taxable ordinary income distributions that were designated as short-term capital gain distributions under Section 871(k)(2)(C) of the Internal Revenue Code of 1986, as amended, for the Fund was 0.00%.
Important Notice Regarding Delivery
of Shareholder Documents
To help keep the Fund’s costs as low as possible, we generally deliver a single copy of shareholder reports, proxy statements, and prospectuses to shareholders who share an address and have the same last name. This process does not apply to account statements. You may request an individual copy of a shareholder document at any time. If you would like to receive separate mailings of shareholder documents, please call U.S. Bank Global Fund Services at 1-800-261-6950 or 1-414-765-4124, and individual delivery will begin within 30 days of your request. If your account is held through a financial institution or other intermediary, please contact such intermediary directly to request individual delivery.
| PROXY VOTING — BOARD APPROVAL OF INVESTMENT ADVISORY AGREEMENTS |
Board Approval of Investment Advisory
Agreements (Unaudited)
At its meeting on October 7, 2018, the Board of Trustees of the Fund (the “Board,” and the members thereof, the “Trustees”) unanimously approved the new investment advisory agreement of the Fund with Hennessy Advisors, Inc. (the “Advisor”) and the new sub-advisory agreement of the Fund between the Advisor and BP Capital Fund Advisors, LLC (the “Sub-Advisor”). The Fund was established in connection with an agreement and plan of reorganization between the Trust, with respect to the Fund, and Professionally Managed Portfolios, with respect to BP Capital TwinLine MLP Fund (the “predecessor Fund”), pursuant to which the predecessor Fund was reorganized into the Fund.
As part of the process of approving the advisory and sub-advisory agreements, the Trustees reviewed their fiduciary duties with respect to approving the advisory and sub-advisory agreements and the relevant factors for them to consider. In addition, the Trustees who are not deemed “interested persons” (as defined by the Investment Company Act of 1940, as amended) of the Fund (the “Independent Trustees”) met in executive session to discuss the approval of the advisory and sub-advisory agreements.
In advance of the meeting, the Advisor sent detailed information to the Trustees to assist them in their evaluation of the advisory and sub-advisory agreements. This information included, but was not limited to, the following:
| | (1) | A memorandum from outside legal counsel that described the fiduciary duties of the Board with respect to approving the advisory and sub-advisory agreements and the relevant factors for consideration; |
| | | |
| | (2) | A memorandum from the Advisor that listed the factors relevant to the Board’s approval of the advisory and sub-advisory agreements and also referenced the documents that had been provided to help the Board assess each such factor; |
| | | |
| | (3) | An inventory of the range of services to be provided by the Advisor and the Sub-Advisor to the Fund, and the distinction between the services to be provided by the Advisor as compared to the services to be provided by the Sub-Advisor; |
| | | |
| | (4) | A written discussion of economies of scale; |
| | | |
| | (5) | The forms of advisory and sub-advisory agreements; |
| | | |
| | (6) | A recent fact sheet of the predecessor Fund, which included, among other things, performance information over various periods during which the Sub-Advisor was the investment advisor to the predecessor Fund; |
| | | |
| | (7) | A peer expense comparison for the anticipated net expense ratio and the investment advisory fee of the Fund; |
| | | |
| | (8) | The Advisor’s financial statements from its most recent Form 10-K and Form 10-Q; |
| | | |
| | (9) | Information about the Fund’s compliance program; |
| | | |
| | (10) | The Advisor’s current Form ADV Part 1A (noting that the Advisor is not required to prepare and maintain Form ADV Part 2A or 2B); |
| | | |
| | (11) | A completed questionnaire from the Sub-Advisor; |
| | | |
| | (12) | The Sub-Advisor’s Code of Ethics; |
| | | |
| | (13) | The Sub-Advisor’s Form ADV Parts 1A, 2A, and 2B; and |
| | | |
| | (14) | Financial information of the Sub-Advisor. |
| HENNESSY FUNDS | 1-800-966-4354 | |
All of the factors discussed were considered as a whole by the Trustees, as well as by the Independent Trustees meeting in executive session. The Trustees viewed the factors in their totality, with no single factor being the principal or determinative factor in the Trustees’ determination of whether to approve the advisory and sub-advisory agreements.
Prior to approving the advisory and sub-advisory agreements, the Trustees, including the Independent Trustees in executive session, considered, among other items:
| | (1) | The nature and quality of the advisory services to be provided by the Advisor and the Sub-Advisor; |
| | | |
| | (2) | A comparison of the anticipated fees and expenses of the Fund to other similar funds; |
| | | |
| | (3) | Whether economies of scale would be recognized by the Fund; |
| | | |
| | (4) | The costs and profitability of the Fund to the Advisor and the Sub-Advisor; |
| | | |
| | (5) | The performance of the predecessor Fund; and |
| | | |
| | (6) | Any benefits to the Advisor and the Sub-Advisor from serving as an investment advisor to the Fund (other than the advisory fee and sub-advisory fee). |
The material considerations and determinations of the Trustees, including the Independent Trustees, were as follows:
| | (1) | The Trustees considered the services identified below that are, or will be, provided by the Advisor. Based on this review, the Trustees concluded that the Advisor will provide high-quality services to the Fund, and they noted that their overall confidence in the Advisor is high. The Trustees also concluded that they were satisfied with the nature, extent, and quality of the advisory services provided to the other Hennessy Funds by the Advisor and that the nature and extent of the services to be provided by the Advisor are appropriate to assure that the Fund’s operations are conducted in compliance with applicable laws, rules, and regulations. |
| | | (a) | The Advisor will oversee the Sub-Advisor for the Fund, and the Sub-Advisor will act as the portfolio manager for the Fund. |
| | | | |
| | | (b) | The Advisor will perform a daily reconciliation of portfolio positions and cash for the Fund. |
| | | | |
| | | (c) | The Advisor will monitor the Fund’s compliance with its investment objectives and restrictions. |
| | | | |
| | | (d) | The Advisor will monitor compliance with federal securities laws and will perform or continue to perform activities such as maintaining a compliance program, conducting ongoing reviews of the compliance programs of the Sub-Advisor (including its Code of Ethics) and the Fund’s other service providers, monitoring incidents of abusive trading practices, reviewing Fund expense accruals, payments, and fixed expense ratios, evaluating insurance providers for fidelity bond, D&O/E&O, and cybersecurity insurance coverage, conducting employee compliance training, reviewing reports provided by service providers, maintaining books and records, and preparing an annual compliance report for the Board. |
| | | | |
| | | (e) | The Advisor will oversee the selection and continued employment of the Sub-Advisor, review the Fund’s investment performance, and monitor the Sub-Advisor’s adherence to the Fund’s investment objectives, policies, and restrictions. |
| BOARD APPROVAL OF INVESTMENT ADVISORY AGREEMENTS |
| | | (f) | The Advisor will review the investment performance of the Fund on a regular basis, including a written summary prepared by the Fund’s portfolio managers of the Fund’s performance for the most recent 12-month period for each annual report of the Fund (or, for the 2018 annual report, the Fund’s most recent 11-month period). |
| | | | |
| | | (g) | The Advisor oversees service providers that will provide accounting, administration, distribution, transfer agency, custodial, sales, marketing, public relations, audit, information technology, and legal services to the Fund. |
| | | | |
| | | (h) | The Advisor maintains in-house marketing and distribution departments that will provide marketing and distribution services on behalf of the Fund. |
| | | | |
| | | (i) | The Advisor will be actively involved with preparing regulatory filings for the Fund, including writing and annually updating the Fund’s prospectus and related documents. |
| | | | |
| | | (j) | The Advisor will oversee distribution of the Fund through third-party broker/dealers and independent financial institutions such as Charles Schwab, Inc., Fidelity, TD Waterhouse, and Pershing. The Advisor participates in “no transaction fee” (“NTF”) programs with these companies on behalf of the Hennessy Funds, which allows customers to purchase the Fund through third-party distribution channels without paying a transaction fee. The Advisor compensates, in part, a number of these third-party providers of NTF programs out of its own revenues. |
| | | | |
| | | (k) | The Advisor pays the incentive compensation of the Trust’s compliance officers and employs other staff, such as legal, marketing, national accounts, distribution, sales, administrative, and trading oversight personnel, as well as management executives, all of whom will provide services to the Fund. |
| | | | |
| | | (l) | The Advisor provides a quarterly compliance certification to the Board. |
| | | | |
| | | (m) | The Advisor prepares or reviews Board materials, frequently presents to the Board or leads Board discussions, prepares or reviews meeting minutes, and arranges for Board training and education. |
| | (2) | The Trustees considered the services identified below that will be provided by the Sub-Advisor. Based on this review, the Trustees concluded that the Sub-Advisor will provide high-quality services to the Fund. The Trustees also concluded that they were satisfied with the portfolio management services that the Sub-Advisor provided to the Predecessor Fund. |
| | | (a) | The Sub-Advisor will act as the portfolio manager for the Fund. In this capacity, the Sub-Advisor will do the following: |
| | | | (i) | manage the composition of the Fund’s portfolio, including the purchase, retention, and disposition of portfolio securities in accordance with the Fund’s investment objectives, policies, and restrictions; |
| | | | | |
| | | | (ii) | seek best execution for the Fund’s portfolio; |
| | | | | |
| | | | (iii) | manage the use of soft dollars for the Fund; and |
| | | | | |
| | | | (iv) | manage proxy voting for the Fund. |
| | | (b) | The Sub-Advisor will ensure that its compliance program includes policies and procedures relevant to the Fund and the Sub-Advisor’s duties as a portfolio manager to the Fund. |
| HENNESSY FUNDS | 1-800-966-4354 | |
| | | (c) | The Sub-Advisor will prepare a written summary of the Fund’s performance for the most recent 12-month period for each annual report of the Fund (or, for the 2018 annual report, the Fund’s most recent 11-month period). |
| | | | |
| | | (d) | The Sub-Advisor will provide a quarterly compliance certification to the Board regarding trading and allocation practices, supervisory matters, its compliance program (including its code of ethics), compliance with the Fund’s policies, and general firm updates. |
| | (3) | The Trustees considered the distinction between the services to be performed by the Advisor and the Sub-Advisor. The Trustees noted that the management of the Fund, including the oversight of the Sub-Advisor, would involve more comprehensive and substantive duties than the duties of the Sub-Advisor. Specifically, the Trustees considered the lists of services identified above and concluded that the services to be performed by the Advisor for the Fund would require a higher level of service and oversight than the services to be performed by the Sub-Advisor. Based on this determination, the Trustees concluded that the differential in advisory fees between the Advisor and the Sub-Advisor is reasonable. |
| | | |
| | (4) | The Trustees compared the performance of the predecessor Fund to benchmark indices over various periods and noted that the investment objectives and investment strategies of the Fund would be substantially similar to those of the predecessor Fund. Based on all such information, the Trustees believe that the Sub-Advisor had managed the predecessor Fund, and the Advisor and the Sub-Advisor will manage the Fund, in a manner that is materially consistent with its stated investment objective and style. The Trustees concluded that the approval of the advisory and sub-advisory agreements was warranted. |
| | | |
| | (5) | The Trustees reviewed the advisory fees and anticipated overall expense ratios of the Fund compared to other funds similar in asset size and investment objective using data from Morningstar. As part of the discussion with management, the Trustees ensured that they understood and were comfortable with the criteria used to determine the mutual funds included in the Morningstar categories for purposes of the materials considered at the meeting. The Trustees determined that the advisory fee and anticipated overall expense ratio of the Fund falls within the range of the advisory fees and overall expense ratios of other comparable funds and concluded that they are reasonable and warranted approval of the advisory and sub-advisory agreements. |
| | | |
| | (6) | The Trustees also considered whether the Advisor was likely to realize economies of scale that it should share with the Fund’s shareholders. The Trustees noted that many of the expenses that the Advisor will incur to manage the Fund are asset-based fees, so the Advisor would not realize material economies of scale as the assets of the Fund increase. For example, mutual fund platform fees would increase as the Fund’s assets grow. The Trustees also considered the Advisor’s agreement to waive fees for the Fund for two years. The Board noted that at current asset levels it did not appear likely that the Advisor would realize economies of scale and concluded that it would continue to monitor economies of scale in the future as circumstances changed. |
| | | |
| | (7) | The Trustees considered the profitability of the Advisor and the Sub-Advisor, including the impact of mutual fund platform fees on the Advisor’s profitability, and also considered the resources and revenues that the Advisor has put into managing |
| BOARD APPROVAL OF INVESTMENT ADVISORY AGREEMENTS |
| | | and distributing the Fund. The Trustees then concluded that the anticipated profits of the Advisor and the Sub-Advisor are reasonable and not excessive when compared to profitability guidelines set forth in relevant court cases. |
| | | |
| | (8) | The Trustees considered the high level of professionalism and knowledge of the Advisor’s employees, along with a very low level of turnover, and concluded that this was beneficial to the Fund and its shareholders. The Trustees also considered the business backgrounds and key employees of the Sub-Advisor and determined that they believe these employees have the necessary expertise to manage the portfolio of the Fund for the benefit of the Fund and its shareholders. |
| | | |
| | (9) | The Trustees considered any anticipated benefits to the Advisor and the Sub-Advisor from serving as advisors to the Fund other than the advisory fee or sub-advisory fee. The Trustees noted that the Advisor and the Sub-Advisor in the future may derive ancillary benefits from, by way of example, their association with the Fund in the form of proprietary and third-party research products and services received from broker-dealers that execute portfolio trades for the Fund. The Trustees determined that they expected any such products and services to be used for legitimate purposes relating to the Fund by providing assistance in the investment decision-making process. The Trustees concluded that any additional benefits expected to be realized by the Advisor and the Sub-Advisor from their relationships with the Fund were reasonable. |
After reviewing the materials provided at the meeting and management’s presentation, as well as other factors that the Trustees deemed relevant, the Trustees, including the Independent Trustees, approved the new advisory and sub-advisory agreements.
| HENNESSY FUNDS | 1-800-966-4354 | |
Privacy Policy
We collect the following non-public personal information about you:
| | • | information we receive from you on or in applications or other forms, correspondence, or conversations, including, but not limited to, your name, address, phone number, social security number, assets, income, and date of birth; and |
| | | |
| | • | information about your transactions with us, our affiliates, or others, including, but not limited to, your account number and balance, payment history, parties to transactions, cost basis information, and other financial information. |
We do not disclose any non-public personal information about our current or former shareholders to non-affiliated third parties, except as permitted by law. For example, we are permitted by law to disclose all of the information we collect, as described above, to our Transfer Agent to process your transactions. Furthermore, we restrict access to your non-public personal information to those persons who require such information to provide products or services to you. We maintain physical, electronic, and procedural safeguards that comply with federal standards to guard your non-public personal information.
In the event that you hold shares of the Fund through a financial intermediary, including, but not limited to, a broker-dealer, bank, or trust company, the privacy policy of your financial intermediary would govern how your non-public personal information will be shared with non-affiliated third parties.
(This Page Intentionally Left Blank.)
For information, questions or assistance, please call
The Hennessy Funds
1-800-966-4354 or 1-415-899-1555
INVESTMENT ADVISOR
Hennessy Advisors, Inc.
7250 Redwood Boulevard, Suite 200
Novato, California 94945
ADMINISTRATOR,
TRANSFER AGENT,
DIVIDEND PAYING AGENT, &
SHAREHOLDER SERVICING AGENT
U.S. Bancorp Fund Services, LLC
d/b/a U.S. Bank Global Fund Services
P.O. Box 701
Milwaukee, Wisconsin 53201-0701
CUSTODIAN
U.S. Bank N.A.
Custody Operations
1555 North River Center Drive, Suite 302
Milwaukee, Wisconsin 53212
TRUSTEES
Neil J. Hennessy
Robert T. Doyle
J. Dennis DeSousa
Gerald P. Richardson
COUNSEL
Foley & Lardner LLP
777 East Wisconsin Avenue
Milwaukee, Wisconsin 53202-5306
INDEPENDENT REGISTERED
PUBLIC ACCOUNTING FIRM
Tait, Weller & Baker LLP
Two Liberty Place
50 South 16th Street, Suite 2900
Philadelphia, Pennsylvania 19102-2529
DISTRIBUTOR
Quasar Distributors, LLC
777 East Wisconsin Avenue
Milwaukee, Wisconsin 53202
hennessyfunds.com | 1-800-966-4354
This report has been prepared for shareholders and may be distributed to
others only if preceded or accompanied by a current prospectus.
ANNUAL REPORT
OCTOBER 31, 2018
HENNESSY GAS UTILITY FUND
Investor Class GASFX
Institutional Class HGASX
hennessyfunds.com | 1-800-966-4354
(This Page Intentionally Left Blank.)
Contents
| Letter to Shareholders | 2 |
| Performance Overview | 4 |
| Financial Statements | |
| Schedule of Investments | 7 |
| Statement of Assets and Liabilities | 11 |
| Statement of Operations | 12 |
| Statements of Changes in Net Assets | 13 |
| Financial Highlights | 14 |
| Notes to the Financial Statements | 17 |
| Report of Independent Registered Public Accounting Firm | 25 |
| Trustees and Officers of the Fund | 26 |
| Expense Example | 30 |
| Proxy Voting Policy and Proxy Voting Records | 32 |
| Quarterly Schedule of Investments | 32 |
| Federal Tax Distribution Information | 32 |
| Important Notice Regarding Delivery of Shareholder Documents | 32 |
| Privacy Policy | 33 |
| HENNESSY FUNDS | 1-800-966-4354 | |
December 2018
Dear Hennessy Funds Shareholder:
Over the past year, we have witnessed the return of market volatility. U.S. stocks still registered healthy gains, bolstered by the impact on corporate profits of the successful passage of the tax reform bill in December 2017. However, concerns over potential trade disruptions, especially between the U.S. and China, and worries over higher short-term interest rates, which many believe could possibly trigger a recession down the road, put downward pressure on equity valuations.
The U.S. economy performed well over the period, and actually achieved an acceleration in GDP growth to over 3% on an annualized basis in the second and third quarters of calendar year 2018. During the past year, companies continued to hire workers, adding over 200,000 jobs per month on average, sending the unemployment rate down to 3.7% in October, which is the lowest it has been since 1969. Consumer confidence is high and still rising, and corporate profits reached record levels in the third quarter of calendar year 2018, posting a year-over-year increase of 26% for the companies in the S&P 500 Index.
The Federal Reserve, confident about the strength of the economy and mindful of a tight labor market, raised short-term interest rates four times over the last year, by a quarter point each time. Long-term bond yields also rose, driven higher primarily by evidence of faster wage growth, pushing the U.S. 10-year Treasury bond over 3% for the first time since 2013.
As I write this, we are experiencing the market’s 20th downturn since 2010. I have been saying that every bull market experiences volatility and pullbacks. Many financial commentators think this bull market is “long in the tooth.” I do not agree with them. I believe stock valuations are still very reasonable. The prospective price to earnings multiple for the Dow Jones Industrial Average has come down from almost 20x at the end of 2017 to 16x, just above its 10-year average of 15x. The prospective PE multiple for the S&P 500 Index has also come down, from 20x to 17x, and compares favorably to its 10-year average of 16x.
Cash, meanwhile, continues to build up on corporate balance sheets. The companies in the S&P 500 Index reported a total of over $5.4 trillion in cash and marketable securities in their latest filings. Companies have been spending some of their cash, increasing their investment spending and laying the groundwork for future earnings growth. However, they have also been returning capital to shareholders. S&P 500 Index companies announced $433.6 billion in share repurchases during the second quarter of calendar year 2018, nearly doubling the previous record of $242.1 billion set in the first quarter. Companies are also raising their dividends.
In addition, I believe the Federal Reserve will take care not to raise interest rates too high or too fast and endanger the economic expansion. While wage growth has risen to over 3% in October, other measures of inflationary pressure, such as the Consumer Price Index and the Producer Price Index, still show prices increasing at a more moderate pace, closer to 2%. Given continued evidence of modest rates of inflation, I believe the Fed will be able to maintain its gradual pace of interest rate hikes.
Finally and importantly, I still see no signs of euphoria in this market. In my opinion, the enthusiasm present earlier in the year, which followed the significant reduction in corporate income tax rates, has largely evaporated, and it has been replaced with anxiety
over higher interest rates and their potential impact on growth. In the past, I have likened the current bull market to that of 1982-2000, and I still believe this comparison holds true. I am confident in the strength of the market today and believe the economy will continue to grow in the coming year, albeit at a more moderate pace.
Thank you for your continued confidence and investment in the Hennessy Funds. If you have any questions or would like to speak with us directly, please don’t hesitate to call us at (800) 966-4354.
Best regards,
Neil J. Hennessy
President and Chief Investment Officer
Past performance does not guarantee future results.
Mutual fund investing involves risk. Principal loss is possible.
Opinions expressed are those of Neil Hennessy and are subject to change, are not guaranteed, and should not be considered investment advice.
The Dow Jones Industrial Average and S&P 500 Index are commonly used to measure the performance of U.S. stocks. One cannot invest directly in an index.
PE, or price to earnings, is a valuation measure and is calculated by dividing a company’s market price per share by its earnings per share. Earnings growth is not a measure of a fund’s future performance.
| HENNESSY FUNDS | 1-800-966-4354 | |
Performance Overview (Unaudited)
CHANGE IN VALUE OF $10,000 INVESTMENT
This graph illustrates the performance of an initial investment of $10,000 made in the Fund ten years ago and assumes the reinvestment of dividends.
AVERAGE ANNUAL TOTAL RETURN FOR PERIODS ENDED OCTOBER 31, 2018
| | One | Five | Ten |
| | Year | Years | Years |
| Hennessy Gas Utility Fund – | | | |
| Investor Class (GASFX) | -2.86% | 5.89% | 11.52% |
| Hennessy Gas Utility Fund – | | | |
Institutional Class (HGASX)(1) | -2.51% | 6.02% | 11.59% |
| AGA Stock Index | -1.58% | 7.06% | 12.45% |
| S&P 500 Index | 7.35% | 11.34% | 13.24% |
Expense ratios: 1.01% (Investor Class); 0.64% (Institutional Class)
(1) | The inception date of Institutional Class shares is March 1, 2017. Performance shown prior to the inception of Institutional Class shares reflects the performance of Investor Class shares and includes expenses that are not applicable to, and are higher than, those of Institutional Class shares. |
Performance data quoted represents past performance; past performance does not guarantee future results. The investment return and principal value of an investment will fluctuate so that an investor’s shares, when redeemed, may be worth more or less than their original cost. The performance table does not reflect the deduction of taxes that a shareholder would pay on Fund distributions or the redemption of Fund shares. Current performance of the Fund may be lower or higher than the performance quoted. Performance data current to the most recent month end may be obtained by visiting www.hennessyfunds.com. Performance for periods on or prior to October 26, 2012, is that of the FBR Gas Utility Index Fund.
The AGA Stock Index is a market capitalization-weighted index, adjusted monthly, consisting of member companies of the American Gas Association. The S&P 500 Index is commonly used to measure the performance of U.S. stocks. One cannot invest directly in an index.
The expense ratios presented are from the most recent prospectus. The expense ratios for the current reporting period are available in the Financial Highlights section of this report.
PERFORMANCE NARRATIVE
Portfolio Manager Ryan C. Kelley
Performance:
For the 12-month period ended October 31, 2018, the Investor Class of the Hennessy Gas Utility Fund returned -2.86%, underperforming both the AGA Stock Index (the Fund’s primary benchmark) and the S&P 500 Index, which returned -1.58% and 7.35%, respectively, for the same period.
The Fund slightly underperformed its primary benchmark due to Fund expenses, the timing of cash flows, trading costs, and the impact of holding cash. The Fund also underperformed the broader domestic equity market, as represented by the S&P 500 Index, as a result of investor rotation out of utilities and into consumer-oriented industry groups such as retailers and healthcare service companies. Liquid natural gas producer Cheniere Energy, Inc., natural gas distributor Atmos Energy Corp., and utility company Public Service Enterprises Group, Inc. were among the holdings that contributed positively to relative performance. Pipeline company TransCanada Corp., utility company PG&E Corp., and pipeline and midstream distributor Enbridge, Inc. performed poorly and were among the holdings that detracted most from relative performance over the period.
The Fund continues to hold all of the companies mentioned.
Portfolio Strategy:
The Fund’s objective is to maintain a high correlation with the AGA Stock Index. The Fund seeks to achieve this goal by owning all of the companies in the AGA Stock Index in substantially the same proportion as the AGA Stock Index. The investment thesis of the Fund is that competitive and stable pricing, abundant domestic supply, and new sources and uses of natural gas should lead to long-term, steady growth in demand and drive growth in natural gas distribution. This should, in turn, drive long-term growth in earnings of the companies in the Fund. In addition, we believe that natural gas’s position as the cleanest of the fossil fuels should lead to additional increased demand, particularly from the electricity generation industry.
Investment Commentary:
Despite the underperformance versus the broader equity market this year, we believe the thesis of the Fund remains firmly in place. The production of natural gas in the United States, in particular from shale producers, continues to grow steadily. Demand for natural gas from domestic sources, especially the power industry, also continues to grow. In addition, exports of natural gas via pipelines to Mexico and in the form of liquid natural gas to the rest of the world are increasing steadily. The Fund continues to seek total return by investing in natural gas distribution companies with the potential for both income and long-term capital appreciation.
_______________
Opinions expressed are those of the Portfolio Manager as of the date written and are subject to change, are not guaranteed, and should not be considered investment advice or an indication of trading intent.
Investments in foreign securities may involve political, economic, and currency risks, greater volatility, and differences in accounting methods. Investments are focused in the natural gas distribution and transmission industry; sector funds may be subject to a higher degree of market risk. Please see the Fund’s prospectus for a more complete discussion of these and other risks.
| HENNESSY FUNDS | 1-800-966-4354 | |
References to specific securities should not be considered a recommendation to buy or sell any security. Fund holdings and sector allocations are subject to change. Please refer to the Schedule of Investments included in this report for additional portfolio information.
Cash flow refers to the net amount of cash and cash equivalents being transferred into and out of a company. Correlation measures the relationship between the changes of two or more financial variables over time.
| PERFORMANCE OVERVIEW/SCHEDULE OF INVESTMENTS |
Financial Statements
Schedule of Investments as of October 31, 2018 |
HENNESSY GAS UTILITY FUND
(% of Net Assets)
| TOP TEN HOLDINGS (EXCLUDING MONEY MARKET FUNDS) | % NET ASSETS |
| Kinder Morgan, Inc. | 5.04% |
| The Southern Co. | 5.02% |
| Cheniere Energy, Inc. | 5.01% |
| Enbridge, Inc. | 5.01% |
| Atmos Energy Corp. | 4.98% |
| Dominion Resources, Inc. | 4.94% |
| TransCanada Corp. | 4.90% |
| Sempra Energy | 4.83% |
| National Grid PLC - ADR | 4.69% |
| WEC Energy Group, Inc. | 3.94% |
Note: For presentation purposes, the Fund has grouped some of the industry categories. For purposes of categorizing securities for compliance with section 8(b)(1) of the Investment Company Act of 1940, as amended, the Fund uses more specific industry classifications.
The Global Industry Classification Standard (GICS®) was developed by and is the exclusive property and a service mark of MSCI, Inc. and Standard & Poor Financial Services LLC. It has been licensed for use by the Hennessy Funds.
| HENNESSY FUNDS | 1-800-966-4354 | |
| COMMON STOCKS – 97.82% | | Number | | | | | | % of | |
| | | of Shares | | | Value | | | Net Assets | |
| Energy – 21.27% | | | | | | | | | |
| Cheniere Energy, Inc. (a) | | | 773,917 | | | $ | 46,752,326 | | | | 5.01 | % |
| Enbridge, Inc. (b) | | | 1,500,765 | | | | 46,688,799 | | | | 5.01 | % |
| EQT Corp. | | | 132,682 | | | | 4,507,208 | | | | 0.48 | % |
| Kinder Morgan, Inc. | | | 2,764,101 | | | | 47,044,999 | | | | 5.04 | % |
| Tellurian, Inc. (a) | | | 965,690 | | | | 7,725,520 | | | | 0.83 | % |
| TransCanada Corp. (b) | | | 1,212,853 | | | | 45,748,815 | | | | 4.90 | % |
| | | | | | | | 198,467,667 | | | | 21.27 | % |
| | | | | | | | | | | | | |
| Financials – 0.56% | | | | | | | | | | | | |
| Berkshire Hathaway, Inc., Class A (a) | | | 17 | | | | 5,230,985 | | | | 0.56 | % |
| | | | | | | | | | | | | |
| Utilities – 75.99% | | | | | | | | | | | | |
| Algonquin Power & Utilities Corp. (b) | | | 293,664 | | | | 2,930,767 | | | | 0.31 | % |
| ALLETE, Inc. | | | 1,475 | | | | 109,150 | | | | 0.01 | % |
| Ameren Corp. | | | 113,240 | | | | 7,313,039 | | | | 0.78 | % |
| Atmos Energy Corp. | | | 499,086 | | | | 46,454,925 | | | | 4.98 | % |
| Avangrid, Inc. | | | 19,200 | | | | 902,592 | | | | 0.10 | % |
| Avista Corp. | | | 64,572 | | | | 3,320,292 | | | | 0.36 | % |
| Black Hills Corp. | | | 139,547 | | | | 8,303,046 | | | | 0.89 | % |
| Centerpoint Energy, Inc. | | | 678,828 | | | | 18,335,144 | | | | 1.97 | % |
| Chesapeake Utilities Corp. | | | 63,658 | | | | 5,057,628 | | | | 0.54 | % |
| CMS Energy Corp. | | | 456,998 | | | | 22,630,541 | | | | 2.43 | % |
| Consolidated Edison, Inc. | | | 309,936 | | | | 23,555,136 | | | | 2.53 | % |
| Corning Natural Gas Holding Corp. | | | 14,599 | | | | 283,520 | | | | 0.03 | % |
| Dominion Resources, Inc. | | | 645,296 | | | | 46,087,040 | | | | 4.94 | % |
| DTE Energy Co. | | | 211,804 | | | | 23,806,770 | | | | 2.55 | % |
| Duke Energy Corp. | | | 303,787 | | | | 25,101,920 | | | | 2.69 | % |
| Entergy Corp. | | | 8,260 | | | | 693,427 | | | | 0.07 | % |
| Eversource Energy | | | 162,075 | | | | 10,252,865 | | | | 1.10 | % |
| Exelon Corp. | | | 264,631 | | | | 11,593,484 | | | | 1.24 | % |
| Fortis, Inc. (b) | | | 357,776 | | | | 11,817,341 | | | | 1.27 | % |
| MDU Resources Group, Inc. | | | 450,407 | | | | 11,242,159 | | | | 1.21 | % |
| MGE Energy, Inc. | | | 33,229 | | | | 2,076,148 | | | | 0.22 | % |
| National Fuel Gas Co. | | | 289,924 | | | | 15,739,974 | | | | 1.69 | % |
| National Grid PLC – ADR (b) | | | 817,844 | | | | 43,754,654 | | | | 4.69 | % |
| New Jersey Resources Corp. | | | 296,634 | | | | 13,378,193 | | | | 1.43 | % |
The accompanying notes are an integral part of these financial statements.
| COMMON STOCKS | | Number | | | | | | % of | |
| | | of Shares | | | Value | | | Net Assets | |
| Utilities (Continued) | | | | | | | | | |
| NiSource, Inc. | | | 1,128,781 | | | $ | 28,625,886 | | | | 3.07 | % |
| Northwest Natural Holding Co. | | | 149,803 | | | | 9,705,736 | | | | 1.04 | % |
| NorthWestern Corp. | | | 52,398 | | | | 3,078,906 | | | | 0.33 | % |
| ONE Gas, Inc. | | | 273,675 | | | | 21,595,694 | | | | 2.32 | % |
| PG&E Corp. (a) | | | 677,449 | | | | 31,711,388 | | | | 3.40 | % |
| PPL Corp. | | | 317,419 | | | | 9,649,538 | | | | 1.03 | % |
| Public Service Enterprise Group, Inc. | | | 449,490 | | | | 24,016,251 | | | | 2.57 | % |
| RGC Resources, Inc. | | | 44,091 | | | | 1,251,303 | | | | 0.13 | % |
| SCANA Corp. | | | 127,966 | | | | 5,125,038 | | | | 0.55 | % |
| Sempra Energy | | | 408,840 | | | | 45,021,461 | | | | 4.83 | % |
| South Jersey Industries, Inc. | | | 353,671 | | | | 10,447,441 | | | | 1.12 | % |
| Southwest Gas Holdings, Inc. | | | 223,317 | | | | 17,255,705 | | | | 1.85 | % |
| Spire, Inc. | | | 221,491 | | | | 16,075,817 | | | | 1.72 | % |
| The Southern Co. | | | 1,040,200 | | | | 46,840,206 | | | | 5.02 | % |
| UGI Corp. | | | 236,752 | | | | 12,562,061 | | | | 1.35 | % |
| Unitil Corp. | | | 45,298 | | | | 2,152,108 | | | | 0.23 | % |
| Vectren Corp. | | | 237,628 | | | | 16,997,531 | | | | 1.82 | % |
| WEC Energy Group, Inc. | | | 537,740 | | | | 36,781,416 | | | | 3.94 | % |
| Xcel Energy, Inc. | | | 311,399 | | | | 15,261,665 | | | | 1.64 | % |
| | | | | | | | 708,894,906 | | | | 75.99 | % |
| Total Common Stocks | | | | | | | | | | | | |
| (Cost $554,235,399) | | | | | | | 912,593,558 | | | | 97.82 | % |
| | | | | | | | | | | | | |
| PARTNERSHIPS – 1.06% | | | | | | | | | | | | |
| | | | | | | | | | | | | |
| Energy – 1.06% | | | | | | | | | | | | |
| Plains GP Holdings L.P., Class A | | | 464,255 | | | | 9,921,130 | | | | 1.06 | % |
| | | | | | | | | | | | | |
| Total Partnerships | | | | | | | | | | | | |
| (Cost $10,782,802) | | | | | | | 9,921,130 | | | | 1.06 | % |
The accompanying notes are an integral part of these financial statements.
| HENNESSY FUNDS | 1-800-966-4354 | |
| SHORT-TERM INVESTMENTS – 1.20% | | Number | | | | | | % of | |
| | | of Shares | | | Value | | | Net Assets | |
| Money Market Funds – 1.20% | | | | | | | | | |
| Fidelity Government Portfolio, Institutional Class, 2.06% (c) | | | 11,158,332 | | | $ | 11,158,332 | | | | 1.20 | % |
| | | | | | | | | | | | | |
| Total Short-Term Investments | | | | | | | | | | | | |
| (Cost $11,158,332) | | | | | | | 11,158,332 | | | | 1.20 | % |
| | | | | | | | | | | | | |
| Total Investments | | | | | | | | | | | | |
| (Cost $576,176,533) – 100.08% | | | | | | | 933,673,020 | | | | 100.08 | % |
| Liabilities in Excess of Other Assets – (0.08)% | | | | | | | (737,909 | ) | | | (0.08 | )% |
| | | | | | | | | | | | | |
TOTAL NET ASSETS – 100.00% | | | | | | $ | 932,935,111 | | | | 100.00 | % |
Percentages are stated as a percent of net assets.
PLC – Public Limited Company
ADR – American Depositary Receipt
| (a) | Non-income producing security. |
| (b) | U.S.-traded security of a foreign corporation. |
| (c) | The rate listed is the fund’s seven-day yield as of October 31, 2018. |
Summary of Fair Value Exposure at October 31, 2018
The following is a summary of the inputs used to value the Fund’s net assets as of October 31, 2018 (See Note 3 in the accompanying notes to the financial statements):
| Common Stocks | | Level 1 | | | Level 2 | | | Level 3 | | | Total | |
| Energy | | $ | 198,467,667 | | | $ | — | | | $ | — | | | $ | 198,467,667 | |
| Financials | | | 5,230,985 | | | | — | | | | — | | | | 5,230,985 | |
| Utilities | | | 708,894,906 | | | | — | | | | — | | | | 708,894,906 | |
| Total Common Stocks | | $ | 912,593,558 | | | $ | — | | | $ | — | | | $ | 912,593,558 | |
| Partnerships | | | | | | | | | | | | | | | | |
| Energy | | $ | 9,921,130 | | | $ | — | | | $ | — | | | $ | 9,921,130 | |
| Total Partnerships | | $ | 9,921,130 | | | $ | — | | | $ | — | | | $ | 9,921,130 | |
| Short-Term Investments | | | | | | | | | | | | | | | | |
| Money Market Funds | | $ | 11,158,332 | | | $ | — | | | $ | — | | | $ | 11,158,332 | |
| Total Short-Term Investments | | $ | 11,158,332 | | | $ | — | | | $ | — | | | $ | 11,158,332 | |
| Total Investments | | $ | 933,673,020 | | | $ | — | | | $ | — | | | $ | 933,673,020 | |
The accompanying notes are an integral part of these financial statements.
| SCHEDULE OF INVESTMENTS/STATEMENT OF ASSETS AND LIABILITIES |
Financial Statements
Statement of Assets and Liabilities as of October 31, 2018 |
| ASSETS: | | | |
| Investments in securities, at value (cost $576,176,533) | | $ | 933,673,020 | |
| Dividends and interest receivable | | | 872,542 | |
| Receivable for fund shares sold | | | 696,053 | |
| Return of capital receivable | | | 139,277 | |
| Prepaid expenses and other assets | | | 52,126 | |
| Total Assets | | | 935,433,018 | |
| | | | | |
| LIABILITIES: | | | | |
| Payable for fund shares redeemed | | | 1,537,514 | |
| Payable to advisor | | | 326,856 | |
| Payable to administrator | | | 87,301 | |
| Payable to auditor | | | 21,900 | |
| Accrued distribution fees | | | 188,645 | |
| Accrued service fees | | | 72,297 | |
| Accrued trustees fees | | | 5,962 | |
| Accrued expenses and other payables | | | 257,432 | |
| Total Liabilities | | | 2,497,907 | |
| NET ASSETS | | $ | 932,935,111 | |
| | | | | |
| NET ASSETS CONSIST OF: | | | | |
| Capital stock | | $ | 565,784,442 | |
| Total distributable earnings | | | 367,150,669 | |
| Total Net Assets | | $ | 932,935,111 | |
| | | | | |
| NET ASSETS | | | | |
| Investor Class: | | | | |
| Shares authorized (no par value) | | Unlimited | |
| Net assets applicable to outstanding Investor Class shares | | $ | 825,183,820 | |
| Shares issued and outstanding | | | 28,772,409 | |
| Net asset value, offering price and redemption price per share | | $ | 28.68 | |
| | | | | |
| Institutional Class: | | | | |
| Shares authorized (no par value) | | Unlimited | |
| Net assets applicable to outstanding Institutional Class shares | | $ | 107,751,291 | |
| Shares issued and outstanding | | | 3,760,837 | |
| Net asset value, offering price and redemption price per share | | $ | 28.65 | |
The accompanying notes are an integral part of these financial statements.
| HENNESSY FUNDS | 1-800-966-4354 | |
Financial Statements
Statement of Operations for the year ended October 31, 2018 |
| INVESTMENT INCOME: | | | |
Dividend income(1) | | $ | 35,171,514 | |
| Interest income | | | 111,961 | |
| Total investment income | | | 35,283,475 | |
| | | | | |
| EXPENSES: | | | | |
| Investment advisory fees (See Note 5) | | | 4,424,651 | |
| Sub-transfer agent expenses – Investor Class (See Note 5) | | | 2,003,070 | |
| Sub-transfer agent expenses – Institutional Class (See Note 5) | | | 84,711 | |
| Distribution fees – Investor Class (See Note 5) | | | 1,510,841 | |
| Administration, fund accounting, custody and transfer agent fees (See Note 5) | | | 1,057,661 | |
| Service fees – Investor Class (See Note 5) | | | 1,007,227 | |
| Reports to shareholders | | | 98,956 | |
| Federal and state registration fees | | | 44,497 | |
| Compliance expense (See Note 5) | | | 29,499 | |
| Audit fees | | | 22,503 | |
| Trustees’ fees and expenses | | | 20,415 | |
| Interest expense (See Note 7) | | | 10,290 | |
| Legal fees | | | 3,031 | |
| Other expenses | | | 519,152 | |
| Total expenses | | | 10,836,504 | |
| NET INVESTMENT INCOME | | $ | 24,446,971 | |
| | | | | |
| REALIZED AND UNREALIZED GAINS (LOSSES): | | | | |
| Net realized gain on investments | | $ | 108,812,839 | |
| Net change in unrealized appreciation/depreciation on investments | | | (180,455,187 | ) |
| Net loss on investments | | | (71,642,348 | ) |
| NET DECREASE IN NET ASSETS RESULTING FROM OPERATIONS | | $ | (47,195,377 | ) |
(1) Net of foreign taxes withheld and issuance fees of $1,032,685.
The accompanying notes are an integral part of these financial statements.
| STATEMENT OF OPERATIONS/STATEMENTS OF CHANGES IN NET ASSETS |
Financial Statements
| Statements of Changes in Net Assets |
| | | Year Ended | | | Year Ended | |
| | | October 31, 2018 | | | October 31, 2017 | |
| OPERATIONS: | | | | | | |
| Net investment income | | $ | 24,446,971 | | | $ | 33,553,345 | |
| Net realized gain on investments | | | 108,812,839 | | | | 11,936,515 | |
| Net change in unrealized | | | | | | | | |
| appreciation/depreciation on investments | | | (180,455,187 | ) | | | 96,396,614 | |
| Net increase (decrease) in net | | | | | | | | |
| assets resulting from operations | | | (47,195,377 | ) | | | 141,886,474 | |
| | | | | | | | | |
| DISTRIBUTIONS TO SHAREHOLDERS FROM: | | | | | | | | |
| Distributable earnings – Investor Class | | | (28,287,790 | ) | | | (54,176,348 | ) |
| Distributable earnings – Institutional Class | | | (3,147,794 | ) | | | (376,747 | ) |
| Total distributions | | | (31,435,584 | ) | | | (54,553,095 | )(1) |
| | | | | | | | | |
| CAPITAL SHARE TRANSACTIONS: | | | | | | | | |
| Proceeds from shares subscribed – Investor Class | | | 47,357,112 | | | | 119,194,987 | |
| Proceeds from shares subscribed – Institutional Class | | | 91,140,382 | | | | 86,926,934 | |
| Dividends reinvested – Investor Class | | | 27,211,310 | | | | 51,110,167 | |
| Dividends reinvested – Institutional Class | | | 2,284,927 | | | | 280,823 | |
| Cost of shares redeemed – Investor Class | | | (483,654,388 | ) | | | (405,814,851 | ) |
| Cost of shares redeemed – Institutional Class | | | (64,094,803 | ) | | | (2,635,338 | ) |
| Net decrease in net assets derived | | | | | | | | |
| from capital share transactions | | | (379,755,460 | ) | | | (150,937,278 | ) |
| TOTAL DECREASE IN NET ASSETS | | | (458,386,421 | ) | | | (63,603,899 | ) |
| | | | | | | | | |
| NET ASSETS: | | | | | | | | |
| Beginning of year | | | 1,391,321,532 | | | | 1,454,925,431 | |
| End of year | | $ | 932,935,111 | | | $ | 1,391,321,532 | |
| | | | | | | | | |
| CHANGES IN SHARES OUTSTANDING: | | | | | | | | |
| Shares sold – Investor Class | | | 1,647,747 | | | | 4,053,758 | |
| Shares sold – Institutional Class | | | 3,149,149 | | | | 2,868,864 | |
| Shares issued to holders as reinvestment | | | | | | | | |
| of dividends – Investor Class | | | 938,546 | | | | 1,768,098 | |
| Shares issued to holders as reinvestment | | | | | | | | |
| of dividends – Institutional Class | | | 79,037 | | | | 9,411 | |
| Shares redeemed – Investor Class | | | (16,873,463 | ) | | | (13,691,570 | ) |
| Shares redeemed – Institutional Class | | | (2,258,650 | ) | | | (86,974 | ) |
| Net decrease in shares outstanding | | | (13,317,634 | ) | | | (5,078,413 | ) |
(1) | Includes net investment income distributions of $34,370,968 and $376,747 and net realized gain distributions of $19,805,380 and $0 for Investor Class and Institutional Class, respectively. |
The accompanying notes are an integral part of these financial statements.
| HENNESSY FUNDS | 1-800-966-4354 | |
Financial Statements
For an Investor Class share outstanding throughout each year
PER SHARE DATA:
Net asset value, beginning of year
Income from investment operations:
Net investment income
Net realized and unrealized gains (losses) on investments
Total from investment operations
Less distributions:
Dividends from net investment income
Dividends from net realized gains
Total distributions
Paid-in capital from redemption fees
Net asset value, end of year
TOTAL RETURN
SUPPLEMENTAL DATA AND RATIOS:
Net assets, end of year (millions)
Ratio of expenses to average net assets
Ratio of net investment income to average net assets
Portfolio turnover rate(2)
(1) | Amount is less than $0.01. |
(2) | Portfolio turnover is calculated on the basis of the Fund as a whole. |
The accompanying notes are an integral part of these financial statements.
| FINANCIAL HIGHLIGHTS — INVESTOR CLASS |
| Year Ended October 31, | |
| 2018 | | | 2017 | | | 2016 | | | 2015 | | | 2014 | |
| | | | | | | | | | | | | | |
| $ | 30.35 | | | $ | 28.57 | | | $ | 27.69 | | | $ | 31.30 | | | $ | 26.69 | |
| | | | | | | | | | | | | | | | | | | |
| | | | | | | | | | | | | | | | | | | |
| | 0.65 | | | | 0.70 | | | | 0.62 | | | | 0.69 | | | | 0.62 | |
| | (1.52 | ) | | | 2.20 | | | | 1.58 | | | | (2.69 | ) | | | 5.18 | |
| | (0.87 | ) | | | 2.90 | | | | 2.20 | | | | (2.00 | ) | | | 5.80 | |
| | | | | | | | | | | | | | | | | | | |
| | | | | | | | | | | | | | | | | | | |
| | (0.64 | ) | | | (0.72 | ) | | | (0.69 | ) | | | (0.70 | ) | | | (0.59 | ) |
| | (0.16 | ) | | | (0.40 | ) | | | (0.63 | ) | | | (0.91 | ) | | | (0.60 | ) |
| | (0.80 | ) | | | (1.12 | ) | | | (1.32 | ) | | | (1.61 | ) | | | (1.19 | ) |
| | — | | | | — | | | | — | | | | — | | | | 0.00 | (1) |
| $ | 28.68 | | | $ | 30.35 | | | $ | 28.57 | | | $ | 27.69 | | | $ | 31.30 | |
| | | | | | | | | | | | | | | | | | | |
| | (2.86 | )% | | | 10.39 | % | | | 8.52 | % | | | (6.59 | )% | | | 22.49 | % |
| | | | | | | | | | | | | | | | | | | |
| | | | | | | | | | | | | | | | | | | |
| $ | 825.18 | | | $ | 1,306.70 | | | $ | 1,454.93 | | | $ | 1,649.21 | | | $ | 2,254.98 | |
| | 1.01 | % | | | 1.01 | % | | | 1.01 | % | | | 0.93 | % | | | 0.77 | % |
| | 2.18 | % | | | 2.34 | % | | | 2.25 | % | | | 2.33 | % | | | 2.26 | % |
| | 14 | % | | | 18 | % | | | 38 | % | | | 37 | % | | | 20 | % |
The accompanying notes are an integral part of these financial statements.
| HENNESSY FUNDS | 1-800-966-4354 | |
Financial Statements
For an Institutional Class share outstanding throughout each period
| | | Year Ended | | | Period Ended | |
| | | October 31, 2018 | | | October 31, 2017(1) | |
| PER SHARE DATA: | | | | | | |
| Net asset value, beginning of period | | $ | 30.32 | | | $ | 29.68 | |
| | | | | | | | | |
| Income from investment operations: | | | | | | | | |
| Net investment income | | | 0.71 | | | | 0.62 | |
| Net realized and unrealized gains (losses) on investments | | | (1.47 | ) | | | 0.72 | |
| Total from investment operations | | | (0.76 | ) | | | 1.34 | |
| | | | | | | | | |
| Less distributions: | | | | | | | | |
| Dividends from net investment income | | | (0.75 | ) | | | (0.70 | ) |
| Dividends from net realized gains | | | (0.16 | ) | | | — | |
| Total distributions | | | (0.91 | ) | | | (0.70 | ) |
| Net asset value, end of period | | $ | 28.65 | | | $ | 30.32 | |
| | | | | | | | | |
| TOTAL RETURN | | | (2.51 | )% | | | 4.56 | %(2)(3) |
| | | | | | | | | |
| SUPPLEMENTAL DATA AND RATIOS: | | | | | | | | |
| Net assets, end of period (millions) | | $ | 107.75 | | | $ | 84.62 | |
| Ratio of expenses to average net assets | | | 0.65 | % | | | 0.64 | %(4) |
| Ratio of net investment income to average net assets | | | 2.47 | % | | | 1.23 | %(4) |
Portfolio turnover rate(5) | | | 14 | % | | | 18 | %(2) |
(1) | Institutional Class shares commenced operations on March 1, 2017. |
(2) | Not annualized. |
(3) | Actual return from inception date of March 1, 2017, to the year end of October 31, 2017. |
(4) | Annualized. |
(5) | Portfolio turnover is calculated on the basis of the Fund as a whole. |
The accompanying notes are an integral part of these financial statements.
| FINANCIAL HIGHLIGHTS — INSTITUTIONAL CLASS/NOTES TO THE FINANCIAL STATEMENTS |
Financial Statements
Notes to the Financial Statements October 31, 2018 |
1). ORGANIZATION
The Hennessy Gas Utility Fund (the “Fund”) is a series of Hennessy Funds Trust (the “Trust”), which was organized as a Delaware statutory trust on September 17, 1992. The Fund is an open-end management investment company registered under the Investment Company Act of 1940, as amended. The Fund did not have Institutional Class shares until March 1, 2017. The investment objective of the Fund is income and capital appreciation. The Fund is a diversified fund.
The Fund offers Investor Class and Institutional Class shares. Each class of shares differs principally in its respective 12b-1 distribution and service, shareholder servicing, and sub-transfer agent expenses. There are no sales charges. Each class has identical rights to earnings, assets, and voting privileges, except for class-specific expenses and exclusive rights to vote on matters affecting only an individual class.
As an investment company, the Fund follows the investment company accounting and reporting guidance of the Financial Accounting Standards Board (“FASB”) Accounting Standard Codification Topic 946 “Financial Services—Investment Companies.”
2). SIGNIFICANT ACCOUNTING POLICIES
The following is a summary of significant accounting policies consistently followed by the Fund in the preparation of the financial statements. These policies conform to U.S. generally accepted accounting principles (“GAAP”).
| a). | Securities Valuation – All investments in securities are recorded at their estimated fair value, as described in Note 3. |
| | |
| b). | Federal Income Taxes – No provision for federal income taxes or excise taxes has been made because the Fund has elected to be taxed as a regulated investment company and intends to distribute substantially all of its taxable income to its shareholders and otherwise comply with the provisions of the Internal Revenue Code of 1986, as amended, applicable to regulated investment companies. Net investment income/loss and realized gains/losses for federal income tax purposes may differ from those reported in the financial statements because of temporary book and tax basis differences. Temporary differences are primarily the result of the treatment of wash sales for tax reporting purposes. The Fund recognizes interest and penalties related to income tax benefits, if any, in the Statement of Operations as an income tax expense. Distributions from net realized gains for book purposes may include short-term capital gains, which are included as ordinary income to shareholders for tax purposes. The Fund may utilize equalization accounting for tax purposes and designate earnings and profits, including net realized gains distributed to shareholders on redemption of shares, as part of the dividends paid deduction for income tax purposes. |
| HENNESSY FUNDS | 1-800-966-4354 | |
| | Due to inherent differences in the recognition of income, expenses, and realized gains/losses under GAAP and federal income tax regulations, permanent differences between book and tax basis for reporting for fiscal year 2018 have been identified and appropriately reclassified in the Statement of Assets and Liabilities. The adjustments are as follows: |
| Total | |
| Distributable | |
Earnings | Capital Stock |
| $(14,068,317) | $14,068,317 |
| c). | Accounting for Uncertainty in Income Taxes – The Fund has accounting policies regarding recognition and measurement of tax positions taken or expected to be taken on a tax return. The tax returns of the Fund for the prior three fiscal years are open for examination. The Fund has reviewed all open tax years in major jurisdictions and concluded that there is no impact on the Fund’s net assets and no tax liability resulting from unrecognized tax benefits relating to uncertain income tax positions taken or expected to be taken on a tax return. The Fund’s major tax jurisdictions are U.S. federal and Delaware. |
| | |
| d). | Income and Expenses – Dividend income is recognized on the ex-dividend date or as soon as information is available to the Fund. Interest income, which includes the amortization of premium and accretion of discount, is recognized on an accrual basis. Other non-cash dividends are recognized as investment income at the fair value of the property received. The Fund is charged for those expenses that are directly attributable to its portfolio, such as advisory, administration, and certain shareholder service fees. Income, expenses (other than expenses attributable to a specific class), and realized and unrealized gains/losses on investments are allocated to each class of shares based on such class’s net assets. |
| | |
| e). | Distributions to Shareholders – Dividends from net investment income for the Fund, if any, are declared and paid at the end of each calendar quarter. Distributions of net realized capital gains, if any, are declared and paid annually, usually in December. |
| | |
| f). | Security Transactions – Investment and shareholder transactions are recorded on the trade date. The Fund determines the realized gain/loss from an investment transaction by comparing the original cost of the security lot sold with the net sale proceeds. Discounts and premiums on securities purchased are accreted or amortized, respectively, over the life of each such security. |
| | |
| g). | Use of Estimates – The preparation of financial statements in conformity with GAAP requires management to make estimates and assumptions that affect the reported amounts of assets and liabilities and disclosure of contingent assets and liabilities at the date of the financial statements and the reported change in net assets during the reporting period. Actual results could differ from those estimates. |
| | |
| h). | Share Valuation – The net asset value (“NAV”) per share of the Fund is calculated by dividing (i) the total value of the securities held by the Fund, plus cash and other assets, minus all liabilities (including estimated accrued expenses) by (ii) the total number of shares outstanding for the Fund, rounded to the nearest cent. The Fund’s shares will not be priced on days the New York Stock Exchange is closed for trading. The offering and redemption price per share for the Fund is equal to the Fund’s NAV per share. |
| | |
| i). | New Accounting Pronouncements – In August 2018, the FASB issued Accounting Standards Update No. 2018-13 “Disclosure Framework—Changes to the Disclosure Requirements for Fair Value Measurement” (“ASU 2018-13”). ASU 2018-13 eliminates the requirement to disclose the amount of and reasons for transfers |
| NOTES TO THE FINANCIAL STATEMENTS |
| | between Level 1 and Level 2 of the fair value hierarchy, the timing of transfers between levels of the fair value hierarchy, and the valuation processes for Level 3 fair value measurements. ASU 2018-13 does not eliminate the requirement to disclose the range and weighted average used to develop significant unobservable inputs for Level 3 fair value measurements, and the changes in unrealized gains and losses for recurring Level 3 fair value measurements. ASU 2018-13 requires that information is provided about the measurement uncertainty of Level 3 fair value measurements as of the reporting date. The guidance is effective for fiscal years beginning after December 15, 2019, and interim periods within those fiscal years. Management has evaluated the impact of this change in guidance, and due to the permissibility of early adoption, modified the Fund’s fair value disclosures for the current reporting period. |
| | |
| j). | New Rule Issuances – In August 2018, the Securities and Exchange Commission issued Final Rule Release No. 33 10532, Disclosure Update and Simplification, which in part amends certain financial statement disclosure requirements of Regulation S-X that have become redundant, duplicative, overlapping, outdated, or superseded, in light of other Commission disclosure requirements, GAAP, or changes in the information environment. The amendments are intended to facilitate the disclosure of information to investors and simplify compliance without significantly altering the total mix of information provided to investors. The amendments to Rule 6-04.17 of Regulation S-X (balance sheet) were amended to require presentation of the total, rather than the components of net assets, of distributable earnings on the balance sheet. Consistent with GAAP, funds will be required to disclose total distributable earnings. The amendments to Rule 6-09 of Regulation S-X (statement of changes in net assets) omit the requirement to separately state the sources of distributions paid as well as omit the requirement to parenthetically state the book basis amount of undistributed net investment income. Instead, consistent with GAAP, funds will be required to disclose the total amount of distributions paid, except that any tax return of capital must be separately disclosed. The requirements of the Final Rule Release are effective November 5, 2018 and the Fund’s Statement of Assets and Liabilities and the Statement of Changes in Net Assets for the current and prior reporting period have been modified accordingly. |
3). SECURITIES VALUATION
The Fund follows fair valuation accounting standards that establish an authoritative definition of fair value and set out a hierarchy for measuring fair value. These standards require additional disclosures about the various inputs and valuation techniques used to develop the measurements of fair value and a discussion of changes in valuation techniques and related inputs during the period. These inputs are summarized in the three broad levels listed below:
| | Level 1 – | Unadjusted, quoted prices in active markets for identical instruments that the Fund has the ability to access at the date of measurement. |
| | | |
| | Level 2 – | Other significant observable inputs (including, but not limited to, quoted prices in active markets for similar instruments, quoted prices in markets that are not active for identical or similar instruments, and model-derived valuations in which all significant inputs and significant value drivers are observable in active markets, such as interest rates, prepayment speeds, credit risk curves, default rates, and similar data). |
| | | |
| | Level 3 – | Significant unobservable inputs (including the Fund’s own assumptions about what market participants would use to price the asset or liability based on the best available information) when observable inputs are unavailable. |
| HENNESSY FUNDS | 1-800-966-4354 | |
Following is a description of the valuation techniques applied to the Fund’s major categories of assets and liabilities measured at fair value on a recurring basis.
| | Equity Securities – Equity securities, including common stocks, preferred stocks, foreign-issued common stocks, exchange-traded funds, closed-end mutual funds, partnerships, rights, and real estate investment trusts, that are traded on a securities exchange for which a last-quoted sales price is readily available will generally be valued at the last sales price as reported by the primary exchange on which the securities are listed. Securities listed on The NASDAQ Stock Market (“NASDAQ”) will generally be valued at the NASDAQ Official Closing Price, which may differ from the last sales price reported. Securities traded on a securities exchange for which a last-quoted sales price is not readily available will generally be valued at the mean between the bid and ask prices. To the extent these securities are actively traded and valuation adjustments are not applied, they are classified in Level 1 of the fair value hierarchy. Securities traded on foreign exchanges generally are not valued at the same time the Fund calculates its NAV because most foreign markets close well before such time. The earlier close of most foreign markets gives rise to the possibility that significant events, including broad market moves, may have occurred in the interim. In certain circumstances, it may be determined that a foreign security needs to be fair valued because it appears that the value of the security might have been materially affected by events occurring after the close of the market in which the security is principally traded, but before the time the Fund calculates its NAV, such as by a development that affects an entire market or region (e.g., a weather-related event) or a potentially global development (e.g., a terrorist attack that may be expected to have an effect on investor expectations worldwide). |
| | |
| | Registered Investment Companies – Investments in open-end registered investment companies, commonly referred to as mutual funds, are generally priced at the ending NAV provided by the applicable mutual fund’s service agent and will be classified in Level 1 of the fair value hierarchy. |
| | |
| | Debt Securities – Debt securities, including corporate bonds, asset-backed securities, mortgage-backed securities, municipal bonds, U.S. Treasuries, and U.S. government agency issues, are generally valued at market on the basis of valuations furnished by an independent pricing service that utilizes both dealer-supplied valuations and formula-based techniques. The pricing service may consider recently executed transactions in securities of the issuer or comparable issuers, market price quotations (where observable), bond spreads, and fundamental data relating to the issuer. In addition, the model may incorporate observable market data, such as reported sales of similar securities, broker quotes, yields, bids, offers, and reference data. Certain securities are valued primarily using dealer quotations. These securities are generally classified in Level 2 of the fair value hierarchy. |
| | |
| | Short-Term Securities – Short-term equity investments, including money market funds, are valued in the manner specified above. Short-term debt investments with an original term to maturity of 60 days or less are valued at amortized cost, which approximates fair market value. If the original term to maturity of a short-term debt investment exceeded 60 days, then the values as of the 61st day prior to maturity are amortized. Amortized cost is not used if its use would be inappropriate due to credit or other impairments of the issuer, in which case the security’s fair value would be determined, as described below. Short-term securities are generally classified in Level 1 or Level 2 of the fair market hierarchy depending on the inputs used and market activity levels for specific securities. |
| NOTES TO THE FINANCIAL STATEMENTS |
The Board of Trustees of the Fund (the “Board”) has adopted fair value pricing procedures that are followed when a price for a security is not readily available or if a significant event has occurred that indicates the closing price of a security no longer represents the true value of that security. Fair value pricing determinations are made in good faith in accordance with these procedures. There are numerous criteria that will be given consideration in determining a fair value of a security, such as the trading volume of a security and markets, the values of other similar securities, and news events with direct bearing on a security or markets. Fair value pricing results in an estimated price for a security that reflects the amount the Fund might reasonably expect to receive in a current sale. Depending on the relative significance of the valuation inputs, these securities may be classified in either Level 2 or Level 3 of the fair value hierarchy.
The fair valuation of foreign securities may be determined with the assistance of a pricing service using correlations between the movement of prices of such securities and indices of domestic securities and other appropriate indicators, such as closing market prices of relevant American Depositary Receipts or futures contracts. The effect of using fair value pricing is that the Fund’s NAV will reflect the affected portfolio securities’ values as determined by the Board or its designee, pursuant to the fair value pricing procedures adopted by the Board, instead of being determined by the market. Using a fair value pricing methodology to price a foreign security may result in a value that is different from such foreign security’s most recent closing price and from the value used by other investment companies to calculate their NAVs. Such securities are generally classified in Level 2 of the fair valuation hierarchy. Because the Fund may invest in foreign securities, the value of the Fund’s portfolio securities may change on days when you will not be able to purchase or redeem your shares.
The Board has delegated day-to-day valuation matters to a Valuation Committee comprised of one or more representatives from Hennessy Advisors, Inc., the Fund’s investment advisor (the “Advisor”). The function of the Valuation Committee is to value securities where current and reliable market quotations are not readily available. All actions taken by the Valuation Committee are reviewed by the Board.
The Fund has performed an analysis of all existing investments to determine the significance and character of all inputs to their fair value determinations. Various inputs are used to determine the value of the Fund’s investments. The inputs or methodology used for valuing securities are not necessarily an indication of the risk associated with investing in those securities. Details related to the fair valuation hierarchy of the Fund’s securities as of October 31, 2018, are included in the Schedule of Investments.
4). INVESTMENT TRANSACTIONS
Purchases and sales of investment securities (excluding government and short-term investments) for the Fund during fiscal year 2018 were $153,746,575 and $540,819,962, respectively.
There were no purchases or sales/maturities of long-term U.S. government securities for the Fund during fiscal year 2018.
The Fund is permitted to purchase or sell securities from or to another fund in the Hennessy Funds family of funds (the “Hennessy Funds”) under specified conditions outlined in procedures adopted by the Board. The procedures have been designed to ensure that any purchase or sale of securities by the Fund from or to another Hennessy Fund complies with Rule 17a-7 of the Investment Company Act of 1940, as amended. During fiscal year 2018, the Fund did not engage in purchases or sales of securities pursuant to Rule 17a-7 of the Investment Company Act of 1940, as amended.
| HENNESSY FUNDS | 1-800-966-4354 | |
5). INVESTMENT ADVISORY FEE AND OTHER TRANSACTIONS WITH AFFILIATES
The Advisor provides the Fund with investment advisory services under an Investment Advisory Agreement. The Advisor furnishes all investment advice, office space, and facilities, as well as most of the personnel needed by the Fund. As compensation for its services, the Advisor is entitled to a monthly fee from the Fund. The fee is based upon the average daily net assets of the Fund at an annual rate of 0.40%. The net investment advisory fees expensed by the Fund during fiscal year 2018 are included in the Statement of Operations.
The Board has approved a Shareholder Servicing Agreement for Investor Class shares of the Fund, which was instituted to compensate the Advisor for the non-investment advisory services it provides to the Fund. The Shareholder Servicing Agreement provides for a monthly fee paid to the Advisor at an annual rate of 0.10% of the average daily net assets of the Fund attributable to Investor Class shares. The shareholder service fees expensed by the Fund during fiscal year 2018 are included in the Statement of Operations.
The Fund has adopted a plan pursuant to Rule 12b-1 under the Investment Company Act of 1940, as amended, that authorizes payments in connection with the distribution of the Fund’s shares at an annual rate of up to 0.25% of the Fund’s average daily net assets attributable to Investor Class shares. Even though the authorized rate is up to 0.25%, the Fund is currently only using up to 0.15% of its average daily net assets attributable to Investor Class shares for such purpose. Amounts paid under the plan may be spent on any activities or expenses primarily intended to result in the sale of shares, including, but not limited to, advertising, shareholder account servicing, printing and mailing of prospectuses to other than current shareholders, printing and mailing of sales literature, and compensation for sales and marketing activities or to financial institutions and others, such as dealers and distributors. The distribution fees expensed by the Fund during fiscal year 2018 are included in the Statement of Operations.
The Fund has entered into agreements with various brokers, dealers, and financial intermediaries in connection with the sale of shares of the Fund. The agreements provide for periodic payments by the Fund to the brokers, dealers, and financial intermediaries for providing certain shareholder maintenance services (sub-transfer agent expenses). These shareholder services include the pre-processing and quality control of new accounts, shareholder correspondence, answering customer inquiries regarding account status, and facilitating shareholder telephone transactions. The sub-transfer agent fees expensed by the Fund during fiscal year 2018 are included in the Statement of Operations.
The Fund has entered into an Administrative Services Agreement among the Fund, the Advisor, and the American Gas Association (“AGA”), pursuant to which the AGA provides administrative services to the Fund, including overseeing the calculation of the AGA Stock Index. ScottMadden, Inc. performs the actual computations required to produce the AGA Stock Index and receives a fee for such calculations pursuant to a contractual arrangement with AGA. AGA does not furnish other securities advice to the Fund or the Advisor or make recommendations regarding the purchase or sale of securities by the Fund. Under the terms of the Administrative Services Agreement, which has been approved by the Board, AGA provides the Fund with current information regarding the common stock composition of the AGA Stock Index at least monthly. In addition, upon request, AGA provides the Fund and the Advisor with information on the natural gas industry. The Fund pays AGA a fee at an annual rate of 0.04% of the average daily net assets of the Fund.
U.S. Bancorp Fund Services, LLC, d/b/a U.S. Bank Global Fund Services (“Fund Services”) provides the Fund with administrative, fund accounting, and transfer agent
| NOTES TO THE FINANCIAL STATEMENTS |
services. As administrator, Fund Services is responsible for activities such as (i) preparing various federal and state regulatory filings, reports, and returns for the Fund, (ii) preparing reports and materials to be supplied to the Board, (iii) monitoring the activities of the Fund’s custodian, transfer agent, and accountants, and (iv) coordinating the preparation and payment of the Fund’s expenses and reviewing the Fund’s expense accruals. U.S. Bank N.A., an affiliate of Fund Services, serves as the Fund’s custodian. The servicing agreements between the Trust and Fund Services and U.S. Bank N.A. contain a fee schedule that is inclusive of administrative, fund accounting, custody, and transfer agent fees. The administrative, fund accounting, custody, and transfer agent fees expensed by the Fund during fiscal year 2018 are included in the Statement of Operations.
Quasar Distributors, LLC acts as the Fund’s principal underwriter in a continuous public offering of the Fund’s shares. Quasar Distributors, LLC is an affiliate of Fund Services and U.S. Bank N.A.
The officers of the Fund are affiliated with the Advisor. Such officers, with the exception of the Chief Compliance Officer and the Senior Compliance Officer, receive no compensation from the Fund for serving in their respective roles. The Fund, along with the other Hennessy Funds, makes reimbursement payments, on an equal basis, to the Advisor for a portion of the salary and benefits associated with the office of the Chief Compliance Officer and for all of the salary and benefits associated with the office of the Senior Compliance Officer. The compliance fees expensed by the Fund during fiscal year 2018 are included in the Statement of Operations.
6). GUARANTEES AND INDEMNIFICATIONS
Under the Hennessy Funds’ organizational documents, their officers and trustees are indemnified by the Hennessy Funds against certain liabilities arising out of the performance of their duties to the Hennessy Funds. Additionally, in the normal course of business, the Hennessy Funds enter into contracts with service providers that contain general indemnification clauses. The Fund’s maximum exposure under these arrangements is unknown as this would involve future claims that may be made against the Fund that have not yet occurred. Currently, the Fund expects the risk of loss to be remote.
7). LINE OF CREDIT
The Fund has an uncommitted line of credit with the other Hennessy Funds in the amount of the lesser of (i) $100,000,000 or (ii) 33.33% of each Hennessy Fund’s net assets, or 30% for the Fund and 10% for the Hennessy Balanced Fund, intended to provide short-term financing, if necessary, subject to certain restrictions, in connection with shareholder redemptions. The credit facility is with the Hennessy Funds’ custodian bank, U.S. Bank N.A. Borrowings under this arrangement bear interest at the bank’s prime rate and are secured by all of the Fund’s assets (as to its own borrowings only). During fiscal year 2018 the Fund had an outstanding average daily balance and a weighted average interest rate of $228,233 and 4.45%, respectively. The interest expensed by the Fund during fiscal year 2018 is included in the Statement of Operations. The maximum amount outstanding for the Fund during fiscal year 2018 was $15,120,000. As of October 31, 2018, the Fund did not have any borrowings outstanding under the line of credit.
| HENNESSY FUNDS | 1-800-966-4354 | |
8). FEDERAL TAX INFORMATION
As of October 31, 2018, the components of accumulated earnings (losses) for income tax purposes were as follows:
| | | Investments | |
| Cost of investments for tax purposes | | $ | 644,588,436 | |
| Gross tax unrealized appreciation | | $ | 372,505,808 | |
| Gross tax unrealized depreciation | | | (83,421,224 | ) |
| Net tax unrealized appreciation/(depreciation) | | $ | 289,084,584 | |
| Undistributed ordinary income | | $ | 84,398 | |
| Undistributed long-term capital gains | | | 77,979,918 | |
| Total distributable earnings | | $ | 78,064,316 | |
| Other accumulated gain/(loss) | | $ | 1,769 | |
| Total accumulated gain/(loss) | | $ | 367,150,669 | |
The difference between book-basis unrealized appreciation/depreciation (as shown in the Statement of Assets and Liabilities) and tax-basis unrealized appreciation/depreciation (as shown above) is attributable primarily to wash sales.
As of October 31, 2018, the Fund had no tax basis capital losses to offset future capital gains.
As of October 31, 2018, the Fund did not defer, on a tax basis, any late-year ordinary losses. Late-year ordinary losses are net ordinary losses incurred after December 31, 2017, but within the taxable year, that are deemed to arise on the first day of the Fund’s next taxable year.
During fiscal year 2018 and fiscal year 2017, the tax character of distributions paid by the Fund was as follows:
| | | Year Ended | | | Year Ended | |
| | | October 31, 2018 | | | October 31, 2017 | |
Ordinary income(1) | | $ | 27,292,416 | | | $ | 34,747,715 | |
| Long-term capital gain | | | 4,143,168 | | | | 19,805,380 | |
| | | $ | 31,435,584 | | | $ | 54,553,095 | |
(1) Ordinary income includes short-term capital gains.
9). EVENTS SUBSEQUENT TO YEAR END
Management has evaluated the Fund’s related events and transactions that occurred subsequent to October 31, 2018, through the date of issuance of the Fund’s financial statements. Other than as disclosed below, management has determined that there were no subsequent events requiring recognition or disclosure in the financial statements.
On December 7, 2018, capital gains were declared and paid to shareholders of record on December 6, 2018, as follows:
| | Long-term |
| Investor Class | $2.48261 |
| Institutional Class | $2.50030 |
On December 27, 2018, income distributions were declared and paid to shareholders of record on December 26, 2018, as follows:
| Investor Class | $0.12129264 |
| Institutional Class | $0.16312707 |
| NOTES/REPORT OF INDEPENDENT REGISTERED PUBLIC ACCOUNTING FIRM |
Report of Independent Registered Public
Accounting Firm
To the Board of Trustees of Hennessy Funds Trust
and the shareholders of the Hennessy Gas Utility Fund
Novato, CA
Opinion on the Financial Statements
We have audited the accompanying statement of assets and liabilities of the Hennessy Gas Utility Fund (the “Fund”), a series of Hennessy Funds Trust, including the schedule of investments, as of October 31, 2018, the related statement of operations for the year then ended, the statements of changes in net assets for each of the two years in the period then ended, and the financial highlights for each of the five years in the period then ended, and the related notes (collectively referred to as the “financial statements”). In our opinion, the financial statements present fairly, in all material respects, the financial position of the Fund as of October 31, 2018, the results of its operations for the year then ended, and the changes in its net assets for each of the two year and the Financial Highlights for each of the five years in the period then ended in conformity with accounting principles generally accepted in the United States of America.
Basis for Opinion
These financial statements are the responsibility of the Fund’s management. Our responsibility is to express an opinion on the Fund’s financial statements based on our audits. We are a public accounting firm registered with the Public Company Accounting Oversight Board (United States) (“PCAOB”) and are required to be independent with respect to the Fund in accordance with the U.S. federal securities laws and the applicable rules and regulations of the Securities and Exchange Commission and the PCAOB. We have served as the auditor of one or more of the funds in the Trust since 2002.
We conducted our audits in accordance with the standards of the PCAOB. Those standards require that we plan and perform the audit to obtain reasonable assurance about whether the financial statements are free of material misstatement, whether due to error or fraud. The Fund is not required to have, nor were we engaged to perform, an audit of its internal control over financial reporting. As part of our audits we are required to obtain an understanding of internal control over financial reporting, but not for the purpose of expressing an opinion on the effectiveness of the Fund’s internal control over financial reporting. Accordingly, we express no such opinion.
Our audits included performing procedures to assess the risks of material misstatement of the financial statements, whether due to error or fraud, and performing procedures that respond to those risks. Such procedures included examining, on a test basis, evidence regarding the amounts and disclosures in the financial statements. Our audits also included evaluating the accounting principles used and significant estimates made by management, as well as evaluating the overall presentation of the financial statements. Our procedures included confirmation of securities owned as of October 31, 2018 by correspondence with the custodian. We believe that our audits provide a reasonable basis for our opinion.
TAIT, WELLER & BAKER LLP
Philadelphia, Pennsylvania
December 27, 2018
| HENNESSY FUNDS | 1-800-966-4354 | |
Trustees and Officers of the Fund (Unaudited)
The business and affairs of the Funds are managed under the direction of the Board of Trustees of the Trust, and the Board of Trustees elects the Officers of the Trust. Beginning in March 2015, the Board of Trustees has from time to time appointed advisers to the Board of Trustees (“Advisers”) with the intention of having qualified individuals serve in an advisory capacity in order to garner experience in the mutual fund and asset management industry and be considered as potential Trustees in the future. There are currently three Advisers: Brian Alexander, Doug Franklin, and Claire Knoles. As Advisers, Mr. Alexander, Mr. Franklin, and Ms. Knoles attend meetings of the Board of Trustees and act as non-voting participants. Information pertaining to the Trustees, Advisers, and the Officers of the Trust is set forth below. The Trustees and Officers serve until their successors are duly elected and qualified or until their earlier death, resignation, or removal. Each Trustee oversees the 16 Hennessy Funds. Unless otherwise indicated, the address of all persons listed below is 7250 Redwood Boulevard, Suite 200, Novato, CA 94945. The Fund’s Statement of Additional Information includes more information about the persons listed below and is available, without charge, upon request by calling 1-800-966-4354.
| | | | Other |
| | | | Directorships |
| | | | Held Outside |
| Name, (Year of Birth), | | | of Fund |
| and Position Held | Start Date | Principal Occupation(s) | Complex During |
with the Trust | of Service | During Past Five Years | Past Five Years(1) |
| | |
| Disinterested Trustees and Advisers | |
| | | | |
| J. Dennis DeSousa | January 1996 | Mr. DeSousa is a real estate investor. | None. |
| (1936) | | | |
| Trustee | | | |
| | | | |
| Robert T. Doyle | January 1996 | Mr. Doyle has been the Sheriff of | None. |
| (1947) | | Marin County, California since 1996. | |
| Trustee | | | |
| | | | |
| Gerald P. Richardson | May 2004 | Mr. Richardson is an independent | None. |
| (1945) | | consultant in the securities industry. | |
| Trustee | | | |
| | | | |
| Brian Alexander | March 2015 | Mr. Alexander has worked for the | None. |
| (1981) | | Sutter Health organization since | |
| Adviser to the Board | | 2011 in various positions. He has | |
| | | served as the Chief Executive Officer | |
| | | of the Sutter Roseville Medical | |
| | | Center since 2018. From 2016 through | |
| | | 2018, he served as the Vice President | |
| | | of Strategy for the Sutter Health Valley | |
| | | Area, which includes 11 hospitals, | |
| | | 13 ambulatory surgery centers, | |
| | | 16,000 employees, and 1,900 physicians. | |
| | | From 2013 through 2016, Mr. Alexander | |
| | | served as Sutter Novato Community | |
| | | Hospital’s Chief Administrative Officer, | |
| | | and from 2011 through 2012, he | |
| | | served as a Director of Strategy | |
| | | within Sutter’s West Bay Region. | |
| TRUSTEES AND OFFICERS OF THE FUND |
| | | | Other |
| | | | Directorships |
| | | | Held Outside |
| Name, (Year of Birth), | | | of Fund |
| and Position Held | Start Date | Principal Occupation(s) | Complex During |
with the Trust | of Service | During Past Five Years | Past Five Years(1) |
| | | | |
| Doug Franklin | March 2016 | Mr. Franklin is a retired insurance | None. |
| (1964) | | industry executive. From 1987 | |
| Adviser to the Board | | through 2015, he was employed | |
| | | by the Allianz-Fireman’s Fund | |
| | | Insurance Company in various | |
| | | positions, including as its Chief | |
| | | Actuary and Chief Risk Officer. | |
| | | | |
| Claire Knoles | December 2015 | Ms. Knoles is a founder of Kiosk and | None. |
| (1974) | | has served as its Chief Operating | |
| Adviser to the Board | | Officer since 2004. Kiosk is a full | |
| | | service marketing agency with | |
| | | offices in the San Francisco Bay | |
| | | Area, Toronto, and Liverpool, UK. | |
| | | | |
Interested Trustee(2) | | | |
| | | | |
| Neil J. Hennessy | January 1996 as | Mr. Neil Hennessy has been employed | Hennessy |
| (1956) | a Trustee and | by Hennessy Advisors, Inc. since | Advisors, Inc. |
| Trustee, Chairman of | June 2008 as | 1989 and currently serves as its | |
| the Board, Chief | an Officer | Chairman and Chief Executive Officer. | |
| Investment Officer, | | | |
| Portfolio Manager, | | | |
| and President | | | |
| | | | |
| Name, (Year of Birth), | | | |
| and Position Held | Start Date | Principal Occupation(s) | |
with the Trust | of Service | During Past Five Years | |
| | | | |
| Officers | | | |
| | | | |
| Teresa M. Nilsen | January 1996 | Ms. Nilsen has been employed by Hennessy Advisors, Inc. | |
| (1966) | | since 1989 and currently serves as its President, Chief Operating | |
| Executive Vice President | | Officer, and Secretary. | |
| and Treasurer | | | |
| | | | |
| Daniel B. Steadman | March 2000 | Mr. Steadman has been employed by Hennessy Advisors, Inc. | |
| (1956) | | since 2000 and currently serves as its Executive Vice President. | |
| Executive Vice President | | | |
| and Secretary | | | |
| | | | |
| Brian Carlson | December 2013 | Mr. Carlson has been employed by Hennessy Advisors, Inc. | |
| (1972) | | since December 2013 and currently serves as its Chief | |
| Senior Vice President | | Compliance Officer and Senior Vice President. | |
| and Head of Distribution | | | |
| | | | |
| Jennifer Cheskiewicz | June 2013 | Ms. Cheskiewicz has been employed by Hennessy Advisors, Inc. | |
(1977)(3) | | as its General Counsel since June 2013. | |
| Senior Vice President and | | | |
| Chief Compliance Officer | | | |
| HENNESSY FUNDS | 1-800-966-4354 | |
| Name, (Year of Birth), | | |
| and Position Held | Start Date | Principal Occupation(s) |
with the Trust | of Service | During Past Five Years |
| | | |
| David Ellison | October 2012 | Mr. Ellison has been employed by Hennessy Advisors, Inc. since |
(1958)(4) | | October 2012. He has served as a Portfolio Manager of the |
| Senior Vice President | | Hennessy Large Cap Financial Fund and the Hennessy Small |
| and Portfolio Manager | | Cap Financial Fund since inception. Mr. Ellison also served as a |
| | | Portfolio Manager of the Hennessy Technology Fund from its |
| | | inception until February 2017. Mr. Ellison served as Director, |
| | | CIO and President of FBR Fund Advisers, Inc. from December |
| | | 1999 to October 2012. |
| | | |
| Ryan C. Kelley | March 2013 | Mr. Kelley has been employed by Hennessy Advisors, Inc. since |
(1972)(5) | | October 2012. He has served as a Portfolio Manager of the |
| Senior Vice President | | Hennessy Gas Utility Fund, the Hennessy Large Cap Financial |
| and Portfolio Manager | | Fund, and the Hennessy Small Cap Financial Fund since |
| | | October 2014. He served as Co-Portfolio Manager of the same |
| | | funds from March 2013 through September 2014, and as a |
| | | Portfolio Analyst for the Hennessy Funds from October 2012 |
| | | through February 2013. Mr. Kelley has also served as a Portfolio |
| | | Manager of the Hennessy Cornerstone Growth Fund, the |
| | | Hennessy Cornerstone Mid Cap 30 Fund, the Hennessy |
| | | Cornerstone Large Growth Fund, and the Hennessy |
| | | Cornerstone Value Fund since February 2017, as a Co-Portfolio |
| | | Manager of the Hennessy Technology Fund since February |
| | | 2017, and as a Portfolio Manager of the Hennessy Total Return |
| | | Fund and the Hennessy Balanced Fund since May 2018. |
| | | Mr. Kelley served as Portfolio Manager of FBR Fund Advisers, |
| | | Inc. from January 2008 to October 2012. |
| | | |
| Tania Kelley | October 2003 | Ms. Kelley has been employed by Hennessy Advisors, Inc. |
| (1965) | | since October 2003. |
| Senior Vice President | | |
| and Head of Marketing | | |
| | | |
| Daniel P. Hennessy | December 2016 | Mr. Daniel Hennessy has been employed by Hennessy Advisors, |
| (1990) | | Inc. since 2015. He has served as an Associate Analyst or |
| Vice President | | Analyst of the Hennessy Technology Fund since February 2017. |
| and Analyst | | Mr. Daniel Hennessy previously served as a Mutual Fund |
| | | Specialist at U.S. Bancorp Fund Services, LLC (now doing |
| | | business as U.S. Bank Global Fund Services) from November |
| | | 2014 to July 2015. Prior to that, he attended the University of |
| | | San Diego, where he earned a degree in Political Science. |
_______________
(1) | Messrs. DeSousa, Doyle, N. Hennessy, and Richardson previously served on the Board of Directors of Hennessy Mutual Funds, Inc. (“HMFI”), The Hennessy Funds, Inc. (“HFI”), and Hennessy SPARX Funds Trust (“HSFT”). Pursuant to an internal reorganization effective as of February 28, 2014, the series of HFMI, HFI, and HSFT were reorganized into corresponding series of the Trust that mirrored them. Subsequent to the reorganization, HFMI, HFI, and HSFT were dissolved. |
(2) | Mr. N. Hennessy is considered an “interested person,” as defined in the Investment Company Act of 1940, as amended, because he is an officer of the Hennessy Funds. |
(3) | The address of this officer is 4800 Bee Caves Road, Suite 100, Austin, TX 78746. |
(4) | The address of this officer is 101 Federal Street, Suite 1900, Boston, MA 02110. |
(5) | The address of this officer is 1340 Environ Way, Suite 332, Chapel Hill, NC 27517. |
| TRUSTEES AND OFFICERS OF THE FUND |
(This Page Intentionally Left Blank.)
| HENNESSY FUNDS | 1-800-966-4354 | |
Expense Example (Unaudited)
October 31, 2018
As a shareholder of the Fund, you incur ongoing costs, including management fees, service fees, and other Fund expenses. This Example is intended to help you understand your ongoing costs (in dollars) of investing in the Fund and to compare these costs with the ongoing costs of investing in other mutual funds. The Example is based on an investment of $1,000 invested at the beginning of the period and held for the entire period from May 1, 2018, through October 31, 2018.
Actual Expenses
The first line of the table below under the “Investor Class” and “Institutional Class” headings provides information about actual account values and actual expenses. Although the Fund charges no sales loads or transaction fees, you will be assessed fees for outgoing wire transfers, returned checks and stop payment orders at prevailing rates charged by U.S. Bank Global Fund Services, the Fund’s transfer agent. If you request that a redemption be made by wire transfer, currently a $15 fee is charged by the Fund’s transfer agent. IRA accounts will be charged a $15 annual maintenance fee. The example below includes, but is not limited to, management fees, shareholder servicing fees, fund accounting, custody, and transfer agent fees. However, the example below does not include portfolio trading commissions and related expenses, and other extraordinary expenses as determined under generally accepted accounting principles. You may use the information in this line, together with the amount you invested, to estimate the expenses that you paid over the period. Simply divide your account value by $1,000 (for example, an $8,600 account value divided by $1,000 = 8.6), then multiply the result by the number in the first line of the table under the “Investor Class” or “Institutional Class” headings in the column entitled “Expenses Paid During Period” to estimate the expenses you paid on your account during this period.
Hypothetical Example for Comparison Purposes
The second line of the table below under the “Investor Class” and “Institutional Class” headings provides information about hypothetical account values and hypothetical expenses based on the Fund’s actual expense ratios and an assumed rate of return of 5% per year before expenses, which is not the Fund’s actual return. The hypothetical account values and expenses may not be used to estimate the actual ending account balance or expenses you paid for the period. You may use this information to compare the ongoing costs of investing in the Fund and other funds. To do so, compare this 5% hypothetical example with the 5% hypothetical examples that appear in the shareholder reports of the other funds. Please note that the expenses shown in the table are meant to highlight your ongoing costs only. Therefore, the second line of the table under the “Investor Class” and “Institutional Class” headings is useful in comparing ongoing costs only, and will not help you determine the relative total costs of owning different funds.
| | | | Expenses Paid |
| | Beginning | Ending | During Period(1) |
| | Account Value | Account Value | May 1, 2018 – |
| | May 1, 2018 | October 31, 2018 | October 31, 2018 |
| Investor Class | | | |
| Actual | $1,000.00 | $1,031.50 | $5.07 |
| Hypothetical (5% return before expenses) | $1,000.00 | $1,020.21 | $5.04 |
| | | | |
| Institutional Class | | | |
| Actual | $1,000.00 | $1,033.20 | $3.28 |
| Hypothetical (5% return before expenses) | $1,000.00 | $1,021.98 | $3.26 |
(1) | Expenses are equal to the Fund’s annualized expense ratio of 0.99% for Investor Class shares or 0.64% for Institutional Class shares, as applicable, multiplied by the average account value over the period, multiplied by 184/365 days (to reflect one-half year period). |
| HENNESSY FUNDS | 1-800-966-4354 | |
How to Obtain a Copy of the Fund’s
Proxy Voting Policy and Proxy Voting Records
A description of the policies and procedures the Fund uses to determine how to vote proxies relating to portfolio securities is available without charge: (1) by calling 1-800-966-4354; (2) on the Hennessy Funds’ website at www.hennessyfunds.com/proxy-voting/voting-policy; or (3) on the U.S. Securities and Exchange Commission’s (the “SEC”) website at www.sec.gov. The Fund’s proxy voting record is available without charge on both the Hennessy Funds’ website at www.hennessyfunds.com/proxy-voting/voting-record and the SEC’s website at www.sec.gov no later than August 31 for the prior 12 months ending June 30.
Quarterly Filings on Form N-Q
The Fund files a complete schedule of portfolio holdings with the SEC for the first and third quarters of each fiscal year on Form N-Q. The Fund’s Forms N-Q are available on the SEC’s website at www.sec.gov. Information included in the Fund’s Forms N-Q will also be available upon request by calling 1-800-966-4354.
Federal Tax Distribution Information
(Unaudited)
For fiscal year 2018, certain dividends paid by the Fund may be subject to a maximum tax rate of 23.8%, as provided for by the Jobs and Growth Tax Relief Reconciliation Act of 2003. The percentage of dividends declared from ordinary income designated as qualified dividend income was 100.00%.
For corporate shareholders, the percent of ordinary income distributions that qualified for the corporate dividends received deduction for fiscal year 2018 was 100.00%.
The percentage of taxable ordinary income distributions that were designated as short-term capital gain distributions under Section 871(k)(2)(C) of the Internal Revenue Code of 1986, as amended, for the Fund was 10.76%.
Important Notice Regarding Delivery
of Shareholder Documents
To help keep the Fund’s costs as low as possible, we generally deliver a single copy of shareholder reports, proxy statements, and prospectuses to shareholders who share an address and have the same last name. This process does not apply to account statements. You may request an individual copy of a shareholder document at any time. If you would like to receive separate mailings of shareholder documents, please call U.S. Bank Global Fund Services at 1-800-261-6950 or 1-414-765-4124, and individual delivery will begin within 30 days of your request. If your account is held through a financial institution or other intermediary, please contact such intermediary directly to request individual delivery.
| PROXY VOTING — PRIVACY POLICY |
Privacy Policy
We collect the following non-public personal information about you:
| | • | information we receive from you on or in applications or other forms, correspondence, or conversations, including, but not limited to, your name, address, phone number, social security number, assets, income, and date of birth; and |
| | | |
| | • | information about your transactions with us, our affiliates, or others, including, but not limited to, your account number and balance, payment history, parties to transactions, cost basis information, and other financial information. |
We do not disclose any non-public personal information about our current or former shareholders to non-affiliated third parties, except as permitted by law. For example, we are permitted by law to disclose all of the information we collect, as described above, to our Transfer Agent to process your transactions. Furthermore, we restrict access to your non-public personal information to those persons who require such information to provide products or services to you. We maintain physical, electronic, and procedural safeguards that comply with federal standards to guard your non-public personal information.
In the event that you hold shares of the Fund through a financial intermediary, including, but not limited to, a broker-dealer, bank, or trust company, the privacy policy of your financial intermediary would govern how your non-public personal information will be shared with non-affiliated third parties.
| HENNESSY FUNDS | 1-800-966-4354 | |
For information, questions or assistance, please call
The Hennessy Funds
1-800-966-4354 or 1-415-899-1555
INVESTMENT ADVISOR
Hennessy Advisors, Inc.
7250 Redwood Boulevard, Suite 200
Novato, California 94945
ADMINISTRATOR,
TRANSFER AGENT,
DIVIDEND PAYING AGENT, &
SHAREHOLDER SERVICING AGENT
U.S. Bancorp Fund Services, LLC
d/b/a U.S. Bank Global Fund Services
P.O. Box 701
Milwaukee, Wisconsin 53201-0701
CUSTODIAN
U.S. Bank N.A.
Custody Operations
1555 North River Center Drive, Suite 302
Milwaukee, Wisconsin 53212
TRUSTEES
Neil J. Hennessy
Robert T. Doyle
J. Dennis DeSousa
Gerald P. Richardson
COUNSEL
Foley & Lardner LLP
777 East Wisconsin Avenue
Milwaukee, Wisconsin 53202-5306
INDEPENDENT REGISTERED
PUBLIC ACCOUNTING FIRM
Tait, Weller & Baker LLP
Two Liberty Place
50 South 16th Street, Suite 2900
Philadelphia, Pennsylvania 19102-2529
DISTRIBUTOR
Quasar Distributors, LLC
777 East Wisconsin Avenue
Milwaukee, Wisconsin 53202
hennessyfunds.com | 1-800-966-4354
This report has been prepared for shareholders and may be distributed to
others only if preceded or accompanied by a current prospectus.
ANNUAL REPORT
OCTOBER 31, 2018
HENNESSY JAPAN FUND
Investor Class HJPNX
Institutional Class HJPIX
hennessyfunds.com | 1-800-966-4354
(This Page Intentionally Left Blank.)
Contents
| Letter to Shareholders | 2 |
| Performance Overview | 4 |
| Financial Statements | |
| Schedule of Investments | 7 |
| Statement of Assets and Liabilities | 10 |
| Statement of Operations | 11 |
| Statements of Changes in Net Assets | 13 |
| Financial Highlights | 14 |
| Notes to the Financial Statements | 18 |
| Report of Independent Registered Public Accounting Firm | 27 |
| Trustees and Officers of the Fund | 28 |
| Expense Example | 32 |
| Proxy Voting Policy and Proxy Voting Records | 34 |
| Quarterly Schedule of Investments | 34 |
| Federal Tax Distribution Information | 34 |
| Important Notice Regarding Delivery of Shareholder Documents | 34 |
| Privacy Policy | 35 |
| HENNESSY FUNDS | 1-800-966-4354 | |
December 2018
Dear Hennessy Funds Shareholder:
Over the past year, the Japanese stock market lost ground, declining by -4.12% in U.S. dollar terms as measured by the Tokyo Stock Price Index (TOPIX) over the 12-months ended October 31, 2018. Japanese stocks rose through the last two months of 2017, but were subject to some volatility and downward pressure during 2018. Domestically, Japan made economic progress during the year. The Japanese economy continued to exhibit relatively strong growth, the inflation rate stayed positive, Shinzo Abe was reelected as leader of the Liberal Democratic Party, and corporate profits grew at a healthy rate. However, developments abroad had negative repercussions on Japanese markets. In particular, investors were dismayed by the imposition of trade tariffs by the U.S., which set off fears of an international trade war. In addition, investors worried about the steady rise in U.S. short-term interest rates, capital outflows from emerging markets as a result of these rate increases, the overvaluation of global technology stocks and fears of a further slowdown in the Chinese economy.
The Japanese economy continued to perform well this year, with GDP growth averaging 1.3% year-over-year over the last five quarters. Investors have also seen a welcome acceleration in the inflation rate, from roughly 0.5% in 2017 to 1.0% in 2018. There is little doubt that reaching the Bank of Japan’s target inflation rate of 2% will be hard in the short term. However, we believe keeping the consumer price index rising at a rate of about 1% will do much to help change inflation expectations for the better.
We believe the structural reform program in Japan is progressing well. Over the last few years, the Liberal Democratic Party’s administration has implemented scores of structural reforms affecting the tax code, the labor market, and corporate governance regulations. In June 2018, the government passed the much-anticipated labor market bill that introduced key reforms including “equal pay for equal work” for non-regular workers, and merit-based pay for highly-skilled employees. We believe these reforms represent an important step for Japan, and will help raise labor productivity, which today is lower than in many other developed countries. New revisions to the corporate governance code are also being discussed. Under the new guidelines, companies would have to publish a management succession plan, meet diversity criteria in their boardrooms, and justify non-strategic, crossholdings between companies.
Following the recent decline in stock prices, we believe stock valuations are very attractive. The prospective price to earnings multiple for the Tokyo Stock Price Index, or TOPIX, has come down from over 16x in January 2018 to 13x, well below its 7-year average of 15x. Moreover, we believe Japan has many high-quality, globally-oriented companies run by able management, and whose businesses are protected by high barriers to entry. Many of these companies operate in fast-growing, global industries, such as factory automation, Internet services, and robotics. As a result, we believe Japanese equities offer investors the opportunity to gain exposure to growth around the world, including developing countries, but with better transparency, better corporate governance, good liquidity, and reasonable valuations.
We remain optimistic about the long-term prospects for Japan and its stock market. Thank you for your continued confidence and investment in the Hennessy Funds.
Sincerely,
 |  |
| Tadahiro Fujimura | Masakazu Takeda |
| Portfolio Manager, | Portfolio Manager, |
| Hennessy Japan Small Cap Fund; | Hennessy Japan Fund; |
| Chief Investment Officer | Fund Manager |
| SPARX Asset Management Co., Ltd. | SPARX Asset Management Co., Ltd. |
SPARX Asset Management Co., Ltd., located in Tokyo, Japan, is the sub-advisor to the Hennessy Japan Fund and the Hennessy Japan Small Cap Fund.
Past performance does not guarantee future results.
Mutual fund investing involves risk. Principal loss is possible.
Opinions expressed are those of Tadahiro Fujimura and Masakazu Takeda and are subject to change, are not guaranteed, and should not be considered investment advice.
The Tokyo Stock Price Index (TOPIX) is an unmanaged index commonly used to measure the performance of Japanese stocks. One cannot invest directly in an index.
PE, or price to earnings, is a valuation measure and is calculated by dividing a company’s market price per share by its earnings per share.
| HENNESSY FUNDS | 1-800-966-4354 | |
Performance Overview (Unaudited)
CHANGE IN VALUE OF $10,000 INVESTMENT
This graph illustrates the performance of an initial investment of $10,000 made in the Fund ten years ago and assumes the reinvestment of dividends.
AVERAGE ANNUAL TOTAL RETURN FOR PERIODS ENDED OCTOBER 31, 2018
| | One | Five | Ten |
| | Year | Years | Years |
| Hennessy Japan Fund – | | | |
| Investor Class (HJPNX) | 2.70% | 11.32% | 13.27% |
| Hennessy Japan Fund – | | | |
| Institutional Class (HJPIX) | 3.14% | 11.67% | 13.57% |
Russell/Nomura Total MarketTM Index | -4.88% | 5.96% | 7.32% |
| Tokyo Price Index (TOPIX) | -4.12% | 5.85% | 7.38% |
Expense ratios: 1.47% (Investor Class); 1.06% (Institutional Class)
Performance data quoted represents past performance; past performance does not guarantee future results. The investment return and principal value of an investment will fluctuate so that an investor’s shares, when redeemed, may be worth more or less than their original cost. The performance table does not reflect the deduction of taxes that a shareholder would pay on Fund distributions or the redemption of Fund shares. Current performance of the Fund may be lower or higher than the performance quoted. Performance data current to the most recent month end may be obtained by visiting www.hennessyfunds.com.
The Russell/Nomura Total Market™ Index contains the top 98% of all stocks listed on Japan’s stock exchanges and registered on Japan’s OTC market in terms of market capitalization. The Tokyo Price Index (TOPIX) is a market capitalization-weighted index of all companies listed on the First Section of the Tokyo Stock Exchange. One cannot invest directly in an index.
Frank Russell Company (“Russell”) is the source and owner of the trademarks, service marks, and copyrights related to the Russell Indexes. Russell® is a trademark of Frank Russell Company. Neither Russell nor its licensors accept any liability for any errors or omissions in the Russell Indexes or Russell ratings or underlying data and no party may rely on any Russell Indexes or Russell ratings or underlying data contained in this communication. No further distribution of Russell data is permitted without Russell’s express written consent. Russell does not promote, sponsor, or endorse the content of this communication.
The expense ratios presented are from the most recent prospectus. The expense ratios for the current reporting period are available in the Financial Highlights section of this report.
PERFORMANCE NARRATIVE
Portfolio Managers Masakazu Takeda, CFA and CMA*, and Yu Shimizu, CMA*
SPARX Asset Management Co., Ltd. (sub-advisor)
Performance:
For the 12-month period ended October 31, 2018, the Investor Class of the Hennessy Japan Fund returned 2.70%, outperforming both the Russell/Nomura Total Market™ Index (the Fund’s primary benchmark) and the Tokyo Stock Price Index (TOPIX), which returned -4.88% and -4.12%, respectively, for the same period, in U.S. dollar terms.
The largest positive contributors to the Fund’s performance relative to its primary benchmark among the 33 TOPIX sub-industries were Retail Trade, Pharmaceutical, and Chemicals. The largest sub-industry detractors to the Fund’s performance were Foods, Banks, and Electric Appliances.
Among the best performing stocks in the Fund during the period were Fast Retailing Co. Ltd., the operator of “UNIQLO” brand casual wear stores, Rohto Pharmaceutical Co. Ltd., a leading skincare cosmetics and OTC ophthalmic medicines producer, and Terumo Corp., Japan’s largest medical device manufacturer. Shares of Fast Retailing Co. Ltd. performed well due to continued business expansion across Asia. Shares of Rohto Pharmaceutical Co. Ltd. rose as earnings results showed improvements across all geographies and all segments after lackluster performance in the previous fiscal year. Lastly, shares of Terumo Corp. advanced as the company’s overseas cardiovascular systems business maintained strong revenue growth, while the general hospital and the blood management systems segments also posted solid profit growth. The Fund continues to hold all of the companies mentioned.
The main detractors to the Fund’s performance were Misumi Group, Inc., a maker and distributor of metal mold components and precision machinery parts, Kubota Corp., a leading manufacturer of farming equipment, and Japan Tobacco, Inc., one of the largest global tobacco manufacturers. Misumi Group, Inc.’s share price declined as the company lowered prices and increased promotional spending in order to improve its competitive position. Kubota Corp.’s share price slipped on weak sales in China. Japan Tobacco, Inc. performed poorly as a result of lower reported profits and a forecast of no growth in earnings for fiscal year 2019. The Fund continues to hold all of the companies mentioned.
Portfolio Strategy:
The Fund seeks long-term capital appreciation by investing in Japanese companies regardless of market cap. The Fund seeks companies that have strong businesses and management and are trading at attractive valuations. The portfolio is limited to our best ideas and maintains a concentrated number of holdings.
Investment Commentary:
We remain confident in the outlook for the Fund’s investments, notwithstanding the decline in the Japanese equity market over the last year. When negative short-term factors are influencing the economy and the market, we believe it is important to keep a longer-term perspective.
All the companies in the portfolio have demonstrated above-average growth over most historical time periods, and we anticipate that this growth should continue in the years to come. Over the last two decades, global markets have experienced tumultuous
| HENNESSY FUNDS | 1-800-966-4354 | |
times: the Asian financial crisis (1998), the Dot-com bubble collapse (2001), Japan’s banking system crisis (2003), the Global Financial Crisis (2008), the Euro debt crisis (2010), and the Great Eastern Japan earthquake (2011), among others. On an individual company level, Nidec Corporation experienced a sharp decline in demand for its then best-selling product, HDD motors, which resulted in a share price drop of almost 50% between 2010 and 2012. Likewise, Kao Corporation was impacted by a large-scale product recall due to a serious product defect, which temporarily tarnished its brand image. Dire as these events may have seemed, the companies in question survived them and have prospered subsequently, in large part due to their inherent competitive edge and management prowess. The Fund continues to hold both companies.
We believe all the companies in the Fund possess durable competitive advantages and could see their revenues continue to grow over the next five to ten years. We also believe that current valuations of the holdings in the Fund are reasonable.
In uncertain times like these, many stock market participants pay attention to macro developments. We prefer to focus on individual businesses when making investment decisions. We believe that long-term appreciation of share prices can only be achieved by continuous expansion of the intrinsic value of the business.
_______________
* Chartered Member of the Security Analysts Association of Japan
Opinions expressed are those of the Portfolio Manager as of the date written and are subject to change, are not guaranteed, and should not be considered investment advice or an indication of trading intent.
The Fund invests in small-capitalization and medium-capitalization companies, which may have more limited liquidity and greater price volatility than large-capitalization companies. The Fund invests in the stocks of companies operating in Japan; single-country funds may be subject to a higher degree of risk. The Fund may experience higher fees due to investments in pooled investment vehicles (including ETFs). Please see the Fund’s prospectus for a more complete discussion of these and other risks.
References to specific securities should not be considered a recommendation to buy or sell any security. Fund holdings and sector allocations are subject to change. Please refer to the Schedule of Investments included in this report for additional portfolio information.
Earnings growth is not a measure of the Fund’s future performance.
| PERFORMANCE OVERVIEW/SCHEDULE OF INVESTMENTS |
Financial Statements
Schedule of Investments as of October 31, 2018 |
HENNESSY JAPAN FUND
(% of Net Assets)
| TOP TEN HOLDINGS (EXCLUDING MONEY MARKET FUNDS) | % NET ASSETS |
| Fast Retailing Co., Ltd. | 5.48% |
| Nidec Corp. | 5.29% |
| Mitsubishi UFJ Financial Group, Inc. | 5.08% |
| Rohto Pharmaceutical Co., Ltd. | 5.07% |
| Recruit Holdings Co., Ltd. | 5.07% |
| Softbank Group Co. | 5.04% |
| Daikin Industries | 4.98% |
| Terumo Corp. | 4.97% |
| Shimano, Inc. | 4.94% |
| Unicharm Corp. | 4.94% |
Note: For presentation purposes, the Fund has grouped some of the industry categories. For purposes of categorizing securities for compliance with Section 8(b)(1) of the Investment Company Act of 1940, as amended, the Fund uses more specific industry classifications.
The Global Industry Classification Standard (GICS®) was developed by and is the exclusive property and a service mark of MSCI, Inc. and Standard & Poor Financial Services LLC. It has been licensed for use by the Hennessy Funds.
| HENNESSY FUNDS | 1-800-966-4354 | |
| COMMON STOCKS – 93.04% | | Number | | | | | | % of | |
| | | of Shares | | | Value | | | Net Assets | |
| Communication Services – 5.04% | | | | | | | | | |
| Softbank Group Co. | | | 320,600 | | | $ | 25,371,905 | | | | 5.04 | % |
| | | | | | | | | | | | | |
| Consumer Discretionary – 19.37% | | | | | | | | | | | | |
| Asics Corp. | | | 930,000 | | | | 13,460,384 | | | | 2.68 | % |
| Fast Retailing Co., Ltd. | | | 54,800 | | | | 27,592,095 | | | | 5.48 | % |
| Isuzu Motors, Ltd. | | | 438,900 | | | | 5,754,220 | | | | 1.14 | % |
| Ryohin Keikaku Co., Ltd. | | | 29,600 | | | | 7,824,166 | | | | 1.56 | % |
| Shimano, Inc. | | | 182,000 | | | | 24,856,690 | | | | 4.94 | % |
| Toyota Motor Corp. | | | 306,900 | | | | 17,978,500 | | | | 3.57 | % |
| | | | | | | | 97,466,055 | | | | 19.37 | % |
| | | | | | | | | | | | | |
| Consumer Staples – 14.95% | | | | | | | | | | | | |
| Japan Tobacco, Inc. | | | 870,600 | | | | 22,370,352 | | | | 4.45 | % |
| Kao Corp. | | | 372,500 | | | | 24,779,530 | | | | 4.93 | % |
| Pigeon Corp. | | | 75,400 | | | | 3,188,836 | | | | 0.63 | % |
| Unicharm Corp. | | | 915,800 | | | | 24,844,495 | | | | 4.94 | % |
| | | | | | | | 75,183,213 | | | | 14.95 | % |
| | | | | | | | | | | | | |
| Financials – 8.38% | | | | | | | | | | | | |
| Mitsubishi UFJ Financial Group, Inc. | | | 4,225,900 | | | | 25,577,229 | | | | 5.08 | % |
| Sumitomo Mitsui Financial Group, Inc. | | | 425,800 | | | | 16,578,565 | | | | 3.30 | % |
| | | | | | | | 42,155,794 | | | | 8.38 | % |
| | | | | | | | | | | | | |
| Health Care – 10.04% | | | | | | | | | | | | |
| Rohto Pharmaceutical Co., Ltd. | | | 805,900 | | | | 25,524,875 | | | | 5.07 | % |
| Terumo Corp. | | | 463,000 | | | | 24,993,636 | | | | 4.97 | % |
| | | | | | | | 50,518,511 | | | | 10.04 | % |
| | | | | | | | | | | | | |
| Industrials – 29.57% | | | | | | | | | | | | |
| Daikin Industries | | | 216,400 | | | | 25,083,341 | | | | 4.98 | % |
| Kubota Corp. | | | 1,570,700 | | | | 24,796,320 | | | | 4.93 | % |
| Misumi Group, Inc. | | | 1,106,600 | | | | 22,177,145 | | | | 4.41 | % |
| Mitsubishi Corp. | | | 873,900 | | | | 24,596,188 | | | | 4.89 | % |
| Nidec Corp. | | | 207,100 | | | | 26,600,934 | | | | 5.29 | % |
| Recruit Holdings Co., Ltd. | | | 949,700 | | | | 25,489,561 | | | | 5.07 | % |
| | | | | | | | 148,743,489 | | | | 29.57 | % |
| | | | | | | | | | | | | |
| Information Technology – 4.29% | | | | | | | | | | | | |
| Keyence Corp. | | | 44,200 | | | | 21,592,576 | | | | 4.29 | % |
The accompanying notes are an integral part of these financial statements.
| COMMON STOCKS | | Number | | | | | | % of | |
| | | of Shares | | | Value | | | Net Assets | |
| Materials – 1.40% | | | | | | | | | |
| Fuji Seal International, Inc. | | | 232,200 | | | $ | 7,043,638 | | | | 1.40 | % |
| | | | | | | | | | | | | |
| Total Common Stocks | | | | | | | | | | | | |
| (Cost $398,170,188) | | | | | | | 468,075,181 | | | | 93.04 | % |
| | | | | | | | | | | | | |
| SHORT-TERM INVESTMENTS – 7.56% | | | | | | | | | | | | |
| | | | | | | | | | | | | |
| Money Market Funds – 7.56% | | | | | | | | | | | | |
| Fidelity Government Portfolio, Institutional Class, 2.06% (a) | | | 24,528,000 | | | | 24,528,000 | | | | 4.88 | % |
| The Government & Agency Portfolio, Institutional Class, 2.08% (a) | | | 13,483,614 | | | | 13,483,614 | | | | 2.68 | % |
| | | | | | | | | | | | | |
| Total Short-Term Investments | | | | | | | | | | | | |
| (Cost $38,011,614) | | | | | | | 38,011,614 | | | | 7.56 | % |
| | | | | | | | | | | | | |
| Total Investments | | | | | | | | | | | | |
| (Cost $436,181,802) – 100.60% | | | | | | | 506,086,795 | | | | 100.60 | % |
| Liabilities in Excess of Other Assets – (0.60)% | | | | | | | (3,001,246 | ) | | | (0.60 | )% |
| | | | | | | | | | | | | |
TOTAL NET ASSETS – 100.00% | | | | | | $ | 503,085,549 | | | | 100.00 | % |
Percentages are stated as a percent of net assets.
| (a) | The rate listed is the fund’s seven-day yield as of October 31, 2018. |
Summary of Fair Value Exposure at October 31, 2018
The following is a summary of the inputs used to value the Fund’s net assets as of October 31, 2018 (See Note 3 in the accompanying notes to the financial statements):
| Common Stocks | | Level 1 | | | Level 2 | | | Level 3 | | | Total | |
| Communication Services | | $ | — | | | $ | 25,371,905 | | | $ | — | | | $ | 25,371,905 | |
| Consumer Discretionary | | | — | | | | 97,466,055 | | | | — | | | | 97,466,055 | |
| Consumer Staples | | | — | | | | 75,183,213 | | | | — | | | | 75,183,213 | |
| Financials | | | — | | | | 42,155,794 | | | | — | | | | 42,155,794 | |
| Health Care | | | — | | | | 50,518,511 | | | | — | | | | 50,518,511 | |
| Industrials | | | — | | | | 148,743,489 | | | | — | | | | 148,743,489 | |
| Information Technology | | | — | | | | 21,592,576 | | | | — | | | | 21,592,576 | |
| Materials | | | — | | | | 7,043,638 | | | | — | | | | 7,043,638 | |
| Total Common Stocks | | $ | — | | | $ | 468,075,181 | | | $ | — | | | $ | 468,075,181 | |
| Short-Term Investments | | | | | | | | | | | | | | | | |
| Money Market Funds | | $ | 38,011,614 | | | $ | — | | | $ | — | | | $ | 38,011,614 | |
| Total Short-Term Investments | | $ | 38,011,614 | | | $ | — | | | $ | — | | | $ | 38,011,614 | |
| Total Investments | | $ | 38,011,614 | | | $ | 468,075,181 | | | $ | — | | | $ | 506,086,795 | |
The accompanying notes are an integral part of these financial statements.
| HENNESSY FUNDS | 1-800-966-4354 | |
Financial Statements
Statement of Assets and Liabilities as of October 31, 2018 |
| ASSETS: | | | |
| Investments in securities, at value (cost $436,181,802) | | $ | 506,086,795 | |
| Dividends and interest receivable | | | 2,130,012 | |
| Receivable for fund shares sold | | | 2,844,651 | |
| Prepaid expenses and other assets | | | 51,238 | |
| Total Assets | | | 511,112,696 | |
| | | | | |
| LIABILITIES: | | | | |
| Payable for securities purchased | | | 6,022,535 | |
| Payable for fund shares redeemed | | | 1,506,792 | |
| Payable to advisor | | | 350,908 | |
| Payable to administrator | | | 44,323 | |
| Payable to auditor | | | 21,901 | |
| Accrued distribution fees | | | 19,282 | |
| Accrued service fees | | | 9,468 | |
| Accrued trustees fees | | | 5,963 | |
| Accrued expenses and other payables | | | 45,975 | |
| Total Liabilities | | | 8,027,147 | |
| NET ASSETS | | $ | 503,085,549 | |
| | | | | |
| NET ASSETS CONSIST OF: | | | | |
| Capital stock | | $ | 432,732,094 | |
| Total distributable earnings | | | 70,353,455 | |
| Total Net Assets | | $ | 503,085,549 | |
| | | | | |
| NET ASSETS | | | | |
| Investor Class: | | | | |
| Shares authorized (no par value) | | Unlimited | |
| Net assets applicable to outstanding Investor Class shares | | $ | 103,330,179 | |
| Shares issued and outstanding | | | 3,072,953 | |
| Net asset value, offering price and redemption price per share | | $ | 33.63 | |
| | | | | |
| Institutional Class: | | | | |
| Shares authorized (no par value) | | Unlimited | |
| Net assets applicable to outstanding Institutional Class shares | | $ | 399,755,370 | |
| Shares issued and outstanding | | | 11,529,940 | |
| Net asset value, offering price and redemption price per share | | $ | 34.67 | |
The accompanying notes are an integral part of these financial statements.
| STATEMENT OF ASSETS AND LIABILITIES/STATEMENT OF OPERATIONS |
Financial Statements
Statement of Operations for the year ended October 31, 2018 |
| INVESTMENT INCOME: | | | |
Dividend income(1) | | $ | 5,917,052 | |
| Interest income | | | 455,265 | |
| Total investment income | | | 6,372,317 | |
| | | | | |
| EXPENSES: | | | | |
| Investment advisory fees (See Note 5) | | | 3,455,857 | |
| Sub-transfer agent expenses – Investor Class (See Note 5) | | | 262,634 | |
| Sub-transfer agent expenses – Institutional Class (See Note 5) | | | 193,589 | |
| Administration, fund accounting, custody and transfer agent fees (See Note 5) | | | 415,000 | |
| Distribution fees – Investor Class (See Note 5) | | | 164,320 | |
| Service fees – Investor Class (See Note 5) | | | 109,547 | |
| Federal and state registration fees | | | 59,892 | |
| Reports to shareholders | | | 44,939 | |
| Compliance expense (See Note 5) | | | 29,499 | |
| Audit fees | | | 23,146 | |
| Trustees’ fees and expenses | | | 18,598 | |
| Legal fees | | | 4,319 | |
| Other expenses | | | 28,739 | |
| Total expenses | | | 4,810,079 | |
| NET INVESTMENT INCOME | | $ | 1,562,238 | |
| | | | | |
| REALIZED AND UNREALIZED GAINS (LOSSES): | | | | |
| Net realized loss on investments | | $ | (652,030 | ) |
| Net change in unrealized appreciation/depreciation on investments | | | (3,199,977 | ) |
| Net loss on investments | | | (3,852,007 | ) |
| NET DECREASE IN NET ASSETS RESULTING FROM OPERATIONS | | $ | (2,289,769 | ) |
(1) | Net of foreign taxes withheld of $655,907. |
The accompanying notes are an integral part of these financial statements.
| HENNESSY FUNDS | 1-800-966-4354 | |
(This Page Intentionally Left Blank.)
| STATEMENTS OF CHANGES IN NET ASSETS |
Financial Statements
| Statements of Changes in Net Assets |
| | | Year Ended | | | Year Ended | |
| | | October 31, 2018 | | | October 31, 2017 | |
| OPERATIONS: | | | | | | |
| Net investment income | | $ | 1,562,238 | | | $ | 233,529 | |
| Net realized loss on investments | | | (652,030 | ) | | | (281,051 | ) |
| Net change in unrealized | | | | | | | | |
| appreciation/depreciation on investments | | | (3,199,977 | ) | | | 36,173,877 | |
| Net increase (decrease) in net | | | | | | | | |
| assets resulting from operations | | | (2,289,769 | ) | | | 36,126,355 | |
| | | | | | | | | |
| DISTRIBUTIONS TO SHAREHOLDERS FROM: | | | | | | | | |
| Distributable earnings – Investor Class | | | (15,953 | ) | | | — | |
| Distributable earnings – Institutional Class | | | (192,575 | ) | | | — | |
| Total distributions | | | (208,528 | ) | | | — | |
| | | | | | | | | |
| CAPITAL SHARE TRANSACTIONS: | | | | | | | | |
| Proceeds from shares subscribed – Investor Class | | | 68,964,189 | | | | 48,195,357 | |
| Proceeds from shares subscribed – Institutional Class | | | 371,916,788 | | | | 115,058,173 | |
| Dividends reinvested – Investor Class | | | 15,517 | | | | — | |
| Dividends reinvested – Institutional Class | | | 171,054 | | | | — | |
| Cost of shares redeemed – Investor Class | | | (51,079,674 | ) | | | (38,068,126 | ) |
| Cost of shares redeemed – Institutional Class | | | (146,269,372 | ) | | | (29,067,977 | ) |
| Net increase in net assets derived | | | | | | | | |
| from capital share transactions | | | 243,718,502 | | | | 96,117,427 | |
| TOTAL INCREASE IN NET ASSETS | | | 241,220,205 | | | | 132,243,782 | |
| | | | | | | | | |
| NET ASSETS: | | | | | | | | |
| Beginning of year | | | 261,865,344 | | | | 129,621,562 | |
| End of year | | $ | 503,085,549 | | | $ | 261,865,344 | |
| | | | | | | | | |
| CHANGES IN SHARES OUTSTANDING: | | | | | | | | |
| Shares sold – Investor Class | | | 1,945,260 | | | | 1,683,845 | |
| Shares sold – Institutional Class | | | 10,243,014 | | | | 3,882,507 | |
| Shares issued to holders as reinvestment | | | | | | | | |
| of dividends – Investor Class | | | 445 | | | | — | |
| Shares issued to holders as reinvestment | | | | | | | | |
| of dividends – Institutional Class | | | 4,774 | | | | — | |
| Shares redeemed – Investor Class | | | (1,451,162 | ) | | | (1,329,272 | ) |
| Shares redeemed – Institutional Class | | | (3,991,370 | ) | | | (990,930 | ) |
| Net increase in shares outstanding | | | 6,750,961 | | | | 3,246,150 | |
The accompanying notes are an integral part of these financial statements.
| HENNESSY FUNDS | 1-800-966-4354 | |
Financial Statements
For an Investor Class share outstanding throughout each year
PER SHARE DATA:
Net asset value, beginning of year
Income from investment operations:
Net investment loss
Net realized and unrealized gains on investments
Total from investment operations
Less distributions:
Dividends from net investment income
Dividends from return of capital
Total distributions
Net asset value, end of year
TOTAL RETURN
SUPPLEMENTAL DATA AND RATIOS:
Net assets, end of year (millions)
Ratio of expenses to average net assets
Ratio of net investment loss to average net assets
Portfolio turnover rate(2)
(1) | Amount is less than $(0.01). |
(2) | Portfolio turnover is calculated on the basis of the Fund as a whole. |
The accompanying notes are an integral part of these financial statements.
| FINANCIAL HIGHLIGHTS — INVESTOR CLASS |
| Year Ended October 31, | |
| 2018 | | | 2017 | | | 2016 | | | 2015 | | | 2014 | |
| | | | | | | | | | | | | | |
| $ | 32.75 | | | $ | 27.81 | | | $ | 24.07 | | | $ | 21.77 | | | $ | 19.68 | |
| | | | | | | | | | | | | | | | | | | |
| | | | | | | | | | | | | | | | | | | |
| | (0.00 | )(1) | | | (0.03 | ) | | | (0.11 | ) | | | (0.10 | ) | | | (0.06 | ) |
| | 0.89 | | | | 4.97 | | | | 3.85 | | | | 2.40 | | | | 2.15 | |
| | 0.89 | | | | 4.94 | | | | 3.74 | | | | 2.30 | | | | 2.09 | |
| | | | | | | | | | | | | | | | | | | |
| | | | | | | | | | | | | | | | | | | |
| | (0.01 | ) | | | — | | | | — | | | | — | | | | — | |
| | — | | | | — | | | | — | | | | — | | | | — | |
| | (0.01 | ) | | | — | | | | — | | | | — | | | | — | |
| $ | 33.63 | | | $ | 32.75 | | | $ | 27.81 | | | $ | 24.07 | | | $ | 21.77 | |
| | | | | | | | | | | | | | | | | | | |
| | 2.70 | % | | | 17.76 | % | | | 15.54 | % | | | 10.56 | % | | | 10.62 | % |
| | | | | | | | | | | | | | | | | | | |
| | | | | | | | | | | | | | | | | | | |
| $ | 103.33 | | | $ | 84.44 | | | $ | 61.85 | | | $ | 61.56 | | | $ | 27.26 | |
| | 1.43 | % | | | 1.46 | % | | | 1.50 | % | | | 1.53 | % | | | 1.70 | % |
| | (0.02 | )% | | | (0.15 | )% | | | (0.38 | )% | | | (0.44 | )% | | | (0.18 | )% |
| | 1 | % | | | 0 | % | | | 5 | % | | | 21 | % | | | 22 | % |
The accompanying notes are an integral part of these financial statements.
| HENNESSY FUNDS | 1-800-966-4354 | |
Financial Statements
For an Institutional Class share outstanding throughout each year
PER SHARE DATA:
Net asset value, beginning of year
Income from investment operations:
Net investment income (loss)
Net realized and unrealized gains on investments
Total from investment operations
Less distributions:
Dividends from net investment income
Dividends from return of capital
Total distributions
Net asset value, end of year
TOTAL RETURN
SUPPLEMENTAL DATA AND RATIOS:
Net assets, end of year (millions)
Ratio of expenses to average net assets
Ratio of net investment income (loss) to average net assets
Portfolio turnover rate(1)
(1) | Portfolio turnover is calculated on the basis of the Fund as a whole. |
The accompanying notes are an integral part of these financial statements.
| FINANCIAL HIGHLIGHTS — INSTITUTIONAL CLASS |
| Year Ended October 31, | |
| 2018 | | | 2017 | | | 2016 | | | 2015 | | | 2014 | |
| | | | | | | | | | | | | | |
| $ | 33.64 | | | $ | 28.45 | | | $ | 24.55 | | | $ | 22.15 | | | $ | 19.98 | |
| | | | | | | | | | | | | | | | | | | |
| | | | | | | | | | | | | | | | | | | |
| | 0.15 | | | | 0.03 | | | | (0.01 | ) | | | (0.02 | ) | | | 0.07 | |
| | 0.91 | | | | 5.16 | | | | 3.91 | | | | 2.42 | | | | 2.10 | |
| | 1.06 | | | | 5.19 | | | | 3.90 | | | | 2.40 | | | | 2.17 | |
| | | | | | | | | | | | | | | | | | | |
| | | | | | | | | | | | | | | | | | | |
| | (0.03 | ) | | | — | | | | — | | | | — | | | | — | |
| | — | | | | — | | | | — | | | | — | | | | — | |
| | (0.03 | ) | | | — | | | | — | | | | — | | | | — | |
| $ | 34.67 | | | $ | 33.64 | | | $ | 28.45 | | | $ | 24.55 | | | $ | 22.15 | |
| | | | | | | | | | | | | | | | | | | |
| | 3.14 | % | | | 18.24 | % | | | 15.89 | % | | | 10.84 | % | | | 10.86 | % |
| | | | | | | | | | | | | | | | | | | |
| | | | | | | | | | | | | | | | | | | |
| $ | 399.76 | | | $ | 177.42 | | | $ | 67.78 | | | $ | 54.13 | | | $ | 25.75 | |
| | 1.01 | % | | | 1.05 | % | | | 1.17 | % | | | 1.27 | % | | | 1.50 | % |
| | 0.49 | % | | | 0.30 | % | | | (0.03 | )% | | | (0.08 | )% | | | 0.26 | % |
| | 1 | % | | | 0 | % | | | 5 | % | | | 21 | % | | | 22 | % |
The accompanying notes are an integral part of these financial statements.
| HENNESSY FUNDS | 1-800-966-4354 | |
Financial Statements
Notes to the Financial Statements October 31, 2018 |
1). ORGANIZATION
The Hennessy Japan Fund (the “Fund”) is a series of Hennessy Funds Trust (the “Trust”), which was organized as a Delaware statutory trust on September 17, 1992. The Fund is an open-end management investment company registered under the Investment Company Act of 1940, as amended. The investment objective of the Fund is long-term capital appreciation. The Fund is a diversified fund, but may employ a relatively focused investment strategy and may hold securities of fewer issuers than other diversified funds.
The Fund offers Investor Class and Institutional Class shares. Each class of shares differs principally in its respective 12b-1 distribution and service, shareholder servicing, and sub-transfer agent expenses. There are no sales charges. Each class has identical rights to earnings, assets, and voting privileges, except for class-specific expenses and exclusive rights to vote on matters affecting only an individual class.
As an investment company, the Fund follows the investment company accounting and reporting guidance of the Financial Accounting Standards Board (“FASB”) Accounting Standard Codification Topic 946 “Financial Services—Investment Companies.”
2). SIGNIFICANT ACCOUNTING POLICIES
The following is a summary of significant accounting policies consistently followed by the Fund in the preparation of the financial statements. These policies conform to U.S. generally accepted accounting principles (“GAAP”).
| a). | Securities Valuation – All investments in securities are recorded at their estimated fair value, as described in Note 3. |
| | |
| b). | Federal Income Taxes – No provision for federal income taxes or excise taxes has been made because the Fund has elected to be taxed as a regulated investment company and intends to distribute substantially all of its taxable income to its shareholders and otherwise comply with the provisions of the Internal Revenue Code of 1986, as amended, applicable to regulated investment companies. Net investment income/loss and realized gains/losses for federal income tax purposes may differ from those reported in the financial statements because of temporary book and tax basis differences. Temporary differences are primarily the result of the treatment of wash sales for tax reporting purposes. The Fund recognizes interest and penalties related to income tax benefits, if any, in the Statement of Operations as an income tax expense. Distributions from net realized gains for book purposes may include short-term capital gains, which are included as ordinary income to shareholders for tax purposes. The Fund may utilize equalization accounting for tax purposes and designate earnings and profits, including net realized gains distributed to shareholders on redemption of shares, as part of the dividends paid deduction for income tax purposes. |
| | |
| | Due to inherent differences in the recognition of income, expenses, and realized gains/losses under GAAP and federal income tax regulations, permanent differences between book and tax basis for reporting for fiscal year 2018 have been identified and appropriately reclassified in the Statement of Assets and Liabilities. The adjustments are as follows: |
| Total | |
| Distributable | |
Earnings | Capital Stock |
| $6,121,138 | $(6,121,138) |
| NOTES TO THE FINANCIAL STATEMENTS |
| c). | Accounting for Uncertainty in Income Taxes – The Fund has accounting policies regarding recognition and measurement of tax positions taken or expected to be taken on a tax return. The tax returns of the Fund for the prior three fiscal years are open for examination. The Fund has reviewed all open tax years in major jurisdictions and concluded that there is no impact on the Fund’s net assets and no tax liability resulting from unrecognized tax benefits relating to uncertain income tax positions taken or expected to be taken on a tax return. The Fund’s major tax jurisdictions are U.S. federal and Delaware. |
| | |
| d). | Income and Expenses – Dividend income is recognized on the ex-dividend date or as soon as information is available to the Fund. Interest income, which includes the amortization of premium and accretion of discount, is recognized on an accrual basis. Other non-cash dividends are recognized as investment income at the fair value of the property received. The Fund is charged for those expenses that are directly attributable to its portfolio, such as advisory, administration, and certain shareholder service fees. Income, expenses (other than expenses attributable to a specific class), and realized and unrealized gains/losses on investments are allocated to each class of shares based on such class’s net assets. |
| | |
| e). | Distributions to Shareholders – Dividends from net investment income for the Fund, if any, are declared and paid annually, usually in December. Distributions of net realized capital gains, if any, are declared and paid annually, usually in December. |
| | |
| f). | Security Transactions – Investment and shareholder transactions are recorded on the trade date. The Fund determines the realized gain/loss from an investment transaction by comparing the original cost of the security lot sold with the net sale proceeds. Discounts and premiums on securities purchased are accreted or amortized, respectively, over the life of each such security. |
| | |
| g). | Use of Estimates – The preparation of financial statements in conformity with GAAP requires management to make estimates and assumptions that affect the reported amounts of assets and liabilities and disclosure of contingent assets and liabilities at the date of the financial statements and the reported change in net assets during the reporting period. Actual results could differ from those estimates. |
| | |
| h). | Share Valuation – The net asset value (“NAV”) per share of the Fund is calculated by dividing (i) the total value of the securities held by the Fund, plus cash and other assets, minus all liabilities (including estimated accrued expenses) by (ii) the total number of shares outstanding for the Fund, rounded to the nearest cent. The Fund’s shares will not be priced on days the New York Stock Exchange is closed for trading. The offering and redemption price per share for the Fund is equal to the Fund’s NAV per share. |
| | |
| i). | Foreign Currency – Values of investments denominated in foreign currencies are converted into U.S. dollars using the spot market rate of exchange at the time of valuation. Purchases and sales of investments and income are translated into U.S. dollars using the spot market rate of exchange prevailing on the respective dates of such transactions. The Fund does not isolate the portion of the results of operations resulting from fluctuations in foreign exchange rates on investments from fluctuations resulting from changes in the market prices of securities held. Such fluctuations are included with the net realized and unrealized gain/loss on investments. Foreign investments present additional risks due to currency fluctuations, economic and political factors, lower liquidity, government regulations, differences in accounting standards, and other factors. |
| | |
| j). | New Accounting Pronouncements – In August 2018, the FASB issued Accounting Standards Update No. 2018-13 “Disclosure Framework—Changes to the Disclosure |
| HENNESSY FUNDS | 1-800-966-4354 | |
| | Requirements for Fair Value Measurement” (“ASU 2018-13”). ASU 2018-13 eliminates the requirement to disclose the amount of and reasons for transfers between Level 1 and Level 2 of the fair value hierarchy, the timing of transfers between levels of the fair value hierarchy, and the valuation processes for Level 3 fair value measurements. ASU 2018-13 does not eliminate the requirement to disclose the range and weighted average used to develop significant unobservable inputs for Level 3 fair value measurements, and the changes in unrealized gains and losses for recurring Level 3 fair value measurements. ASU 2018-13 requires that information is provided about the measurement uncertainty of Level 3 fair value measurements as of the reporting date. The guidance is effective for fiscal years beginning after December 15, 2019, and interim periods within those fiscal years. Management has evaluated the impact of this change in guidance, and due to the permissibility of early adoption, modified the Fund’s fair value disclosures for the current reporting period. |
| | |
| k). | New Rule Issuances – In August 2018, the Securities and Exchange Commission issued Final Rule Release No. 33 10532, Disclosure Update and Simplification, which in part amends certain financial statement disclosure requirements of Regulation S-X that have become redundant, duplicative, overlapping, outdated, or superseded, in light of other Commission disclosure requirements, GAAP, or changes in the information environment. The amendments are intended to facilitate the disclosure of information to investors and simplify compliance without significantly altering the total mix of information provided to investors. The amendments to Rule 6-04.17 of Regulation S-X (balance sheet) were amended to require presentation of the total, rather than the components of net assets, of distributable earnings on the balance sheet. Consistent with GAAP, funds will be required to disclose total distributable earnings. The amendments to Rule 6-09 of Regulation S-X (statement of changes in net assets) omit the requirement to separately state the sources of distributions paid as well as omit the requirement to parenthetically state the book basis amount of undistributed net investment income. Instead, consistent with GAAP, funds will be required to disclose the total amount of distributions paid, except that any tax return of capital must be separately disclosed. The requirements of the Final Rule Release are effective November 5, 2018 and the Fund’s Statement of Assets and Liabilities and the Statement of Changes in Net Assets for the current and prior reporting period have been modified accordingly. |
3). SECURITIES VALUATION
The Fund follows fair valuation accounting standards that establish an authoritative definition of fair value and set out a hierarchy for measuring fair value. These standards require additional disclosures about the various inputs and valuation techniques used to develop the measurements of fair value and a discussion of changes in valuation techniques and related inputs during the period. These inputs are summarized in the three broad levels listed below:
| | Level 1 – | Unadjusted, quoted prices in active markets for identical instruments that the Fund has the ability to access at the date of measurement. |
| | | |
| | Level 2 – | Other significant observable inputs (including, but not limited to, quoted prices in active markets for similar instruments, quoted prices in markets that are not active for identical or similar instruments, and model-derived valuations in which all significant inputs and significant value drivers are observable in active markets, such as interest rates, prepayment speeds, credit risk curves, default rates, and similar data). |
| NOTES TO THE FINANCIAL STATEMENTS |
| | Level 3 – | Significant unobservable inputs (including the Fund’s own assumptions about what market participants would use to price the asset or liability based on the best available information) when observable inputs are unavailable. |
Following is a description of the valuation techniques applied to the Fund’s major categories of assets and liabilities measured at fair value on a recurring basis.
| | Equity Securities – Equity securities, including common stocks, preferred stocks, foreign-issued common stocks, exchange-traded funds, closed-end mutual funds, partnerships, rights, and real estate investment trusts, that are traded on a securities exchange for which a last-quoted sales price is readily available will generally be valued at the last sales price as reported by the primary exchange on which the securities are listed. Securities listed on The NASDAQ Stock Market (“NASDAQ”) will generally be valued at the NASDAQ Official Closing Price, which may differ from the last sales price reported. Securities traded on a securities exchange for which a last-quoted sales price is not readily available will generally be valued at the mean between the bid and ask prices. To the extent these securities are actively traded and valuation adjustments are not applied, they are classified in Level 1 of the fair value hierarchy. Securities traded on foreign exchanges generally are not valued at the same time the Fund calculates its NAV because most foreign markets close well before such time. The earlier close of most foreign markets gives rise to the possibility that significant events, including broad market moves, may have occurred in the interim. In certain circumstances, it may be determined that a foreign security needs to be fair valued because it appears that the value of the security might have been materially affected by events occurring after the close of the market in which the security is principally traded, but before the time the Fund calculates its NAV, such as by a development that affects an entire market or region (e.g., a weather-related event) or a potentially global development (e.g., a terrorist attack that may be expected to have an effect on investor expectations worldwide). |
| | |
| | Registered Investment Companies – Investments in open-end registered investment companies, commonly referred to as mutual funds, are generally priced at the ending NAV provided by the applicable mutual fund’s service agent and will be classified in Level 1 of the fair value hierarchy. |
| | |
| | Debt Securities – Debt securities, including corporate bonds, asset-backed securities, mortgage-backed securities, municipal bonds, U.S. Treasuries, and U.S. government agency issues, are generally valued at market on the basis of valuations furnished by an independent pricing service that utilizes both dealer-supplied valuations and formula-based techniques. The pricing service may consider recently executed transactions in securities of the issuer or comparable issuers, market price quotations (where observable), bond spreads, and fundamental data relating to the issuer. In addition, the model may incorporate observable market data, such as reported sales of similar securities, broker quotes, yields, bids, offers, and reference data. Certain securities are valued primarily using dealer quotations. These securities are generally classified in Level 2 of the fair value hierarchy. |
| | |
| | Short-Term Securities – Short-term equity investments, including money market funds, are valued in the manner specified above. Short-term debt investments with an original term to maturity of 60 days or less are valued at amortized cost, which approximates fair market value. If the original term to maturity of a short-term debt investment exceeded 60 days, then the values as of the 61st day prior to maturity are amortized. Amortized cost is not used if its use would be inappropriate due to credit or other impairments of the issuer, in which case the security’s fair value would be |
| HENNESSY FUNDS | 1-800-966-4354 | |
| | determined, as described below. Short-term securities are generally classified in Level 1 or Level 2 of the fair market hierarchy depending on the inputs used and market activity levels for specific securities. |
The Board of Trustees of the Fund (the “Board”) has adopted fair value pricing procedures that are followed when a price for a security is not readily available or if a significant event has occurred that indicates the closing price of a security no longer represents the true value of that security. Fair value pricing determinations are made in good faith in accordance with these procedures. There are numerous criteria that will be given consideration in determining a fair value of a security, such as the trading volume of a security and markets, the values of other similar securities, and news events with direct bearing on a security or markets. Fair value pricing results in an estimated price for a security that reflects the amount the Fund might reasonably expect to receive in a current sale. Depending on the relative significance of the valuation inputs, these securities may be classified in either Level 2 or Level 3 of the fair value hierarchy.
The fair valuation of foreign securities may be determined with the assistance of a pricing service using correlations between the movement of prices of such securities and indices of domestic securities and other appropriate indicators, such as closing market prices of relevant American Depositary Receipts or futures contracts. The effect of using fair value pricing is that the Fund’s NAV will reflect the affected portfolio securities’ values as determined by the Board or its designee, pursuant to the fair value pricing procedures adopted by the Board, instead of being determined by the market. Using a fair value pricing methodology to price a foreign security may result in a value that is different from such foreign security’s most recent closing price and from the value used by other investment companies to calculate their NAVs. Such securities are generally classified in Level 2 of the fair valuation hierarchy. Because the Fund may invest in foreign securities, the value of the Fund’s portfolio securities may change on days when you will not be able to purchase or redeem your shares.
The Board has delegated day-to-day valuation matters to a Valuation Committee comprised of one or more representatives from Hennessy Advisors, Inc., the Fund’s investment advisor (the “Advisor”). The function of the Valuation Committee is to value securities where current and reliable market quotations are not readily available. All actions taken by the Valuation Committee are reviewed by the Board.
The Fund has performed an analysis of all existing investments to determine the significance and character of all inputs to their fair value determinations. Various inputs are used to determine the value of the Fund’s investments. The inputs or methodology used for valuing securities are not necessarily an indication of the risk associated with investing in those securities. Details related to the fair valuation hierarchy of the Fund’s securities as of October 31, 2018, are included in the Schedule of Investments.
4). INVESTMENT TRANSACTIONS
Purchases and sales of investment securities (excluding government and short-term investments) for the Fund during fiscal year 2018 were $223,968,754 and $2,744,713, respectively.
There were no purchases or sales/maturities of long-term U.S. government securities for the Fund during fiscal year 2018.
The Fund is permitted to purchase or sell securities from or to another fund in the Hennessy Funds family of funds (the “Hennessy Funds”) under specified conditions outlined in procedures adopted by the Board. The procedures have been designed to ensure that any purchase or sale of securities by the Fund from or to another Hennessy
| NOTES TO THE FINANCIAL STATEMENTS |
Fund complies with Rule 17a-7 of the Investment Company Act of 1940, as amended. During fiscal year 2018, the Fund did not engage in purchases or sales of securities pursuant to Rule 17a-7 of the Investment Company Act of 1940, as amended.
5). INVESTMENT ADVISORY FEE AND OTHER TRANSACTIONS WITH AFFILIATES
The Advisor provides the Fund with investment advisory services under an Investment Advisory Agreement. The Advisor oversees the provision of investment advice and furnishes office space and facilities, as well as most of the personnel needed by the Fund. As compensation for its services, the Advisor is entitled to a monthly fee from the Fund. The fee is based upon the average daily net assets of the Fund at an annual rate of 0.80%, effective as of March 1, 2016. Prior to that date, the annual rate was 1.00%. The net investment advisory fees expensed by the Fund during fiscal year 2018 are included in the Statement of Operations.
The Advisor has delegated the day-to-day management of the Fund to a sub-advisor, SPARX Asset Management Co., Ltd. The Advisor pays the sub-advisory fees from its own assets, and these fees are not an additional expense of the Fund. For the most recent fiscal year, the Advisor (not the Fund) paid a sub-advisory fee, based upon the daily net assets of the Fund, at an average rate of 0.35%. Effective February 28, 2018, the Advisor amended the sub-advisory agreement with SPARX Asset Management Co., Ltd. to increase the sub-advisory fee to 0.40% of daily net assets between $500 million and $1 billion and 0.42% of daily net assets over $1 billion. The sub-advisory fee for the first $500 million of daily net assets remained at 0.35%. At the time of the amendment, the Fund had less than $500 million of daily net assets.
The Board has approved a Shareholder Servicing Agreement for Investor Class shares of the Fund, which was instituted to compensate the Advisor for the non-investment advisory services it provides to the Fund. The Shareholder Servicing Agreement provides for a monthly fee paid to the Advisor at an annual rate of 0.10% of the average daily net assets of the Fund attributable to Investor Class shares. The shareholder service fees expensed by the Fund during fiscal year 2018 are included in the Statement of Operations.
The Fund has adopted a plan pursuant to Rule 12b-1 under the Investment Company Act of 1940, as amended, that authorizes payments in connection with the distribution of the Fund’s shares at an annual rate of up to 0.25% of the Fund’s average daily net assets attributable to Investor Class shares. Even though the authorized rate is up to 0.25%, the Fund is currently only using up to 0.15% of its average daily net assets attributable to Investor Class shares for such purpose. Amounts paid under the plan may be spent on any activities or expenses primarily intended to result in the sale of shares, including, but not limited to, advertising, shareholder account servicing, printing and mailing of prospectuses to other than current shareholders, printing and mailing of sales literature, and compensation for sales and marketing activities or to financial institutions and others, such as dealers and distributors. The distribution fees expensed by the Fund during fiscal year 2018 are included in the Statement of Operations.
The Fund has entered into agreements with various brokers, dealers, and financial intermediaries in connection with the sale of shares of the Fund. The agreements provide for periodic payments by the Fund to the brokers, dealers, and financial intermediaries for providing certain shareholder maintenance services (sub-transfer agent expenses). These shareholder services include the pre-processing and quality control of new accounts, shareholder correspondence, answering customer inquiries regarding account status, and facilitating shareholder telephone transactions. The sub-transfer agent fees expensed by the Fund during fiscal year 2018 are included in the Statement of Operations.
| HENNESSY FUNDS | 1-800-966-4354 | |
U.S. Bancorp Fund Services, LLC, d/b/a U.S. Bank Global Fund Services (“Fund Services”) provides the Fund with administrative, fund accounting, and transfer agent services. As administrator, Fund Services is responsible for activities such as (i) preparing various federal and state regulatory filings, reports, and returns for the Fund, (ii) preparing reports and materials to be supplied to the Board, (iii) monitoring the activities of the Fund’s custodian, transfer agent, and accountants, and (iv) coordinating the preparation and payment of the Fund’s expenses and reviewing the Fund’s expense accruals. U.S. Bank N.A., an affiliate of Fund Services, serves as the Fund’s custodian. The servicing agreements between the Trust and Fund Services and U.S. Bank N.A. contain a fee schedule that is inclusive of administrative, fund accounting, custody, and transfer agent fees. The administrative, fund accounting, custody, and transfer agent fees expensed by the Fund during fiscal year 2018 are included in the Statement of Operations.
Quasar Distributors, LLC acts as the Fund’s principal underwriter in a continuous public offering of the Fund’s shares. Quasar Distributors, LLC is an affiliate of Fund Services and U.S. Bank N.A.
The officers of the Fund are affiliated with the Advisor. Such officers, with the exception of the Chief Compliance Officer and the Senior Compliance Officer, receive no compensation from the Fund for serving in their respective roles. The Fund, along with the other Hennessy Funds, makes reimbursement payments, on an equal basis, to the Advisor for a portion of the salary and benefits associated with the office of the Chief Compliance Officer and for all of the salary and benefits associated with the office of the Senior Compliance Officer. The compliance fees expensed by the Fund during fiscal year 2018 are included in the Statement of Operations.
6). GUARANTEES AND INDEMNIFICATIONS
Under the Hennessy Funds’ organizational documents, their officers and trustees are indemnified by the Hennessy Funds against certain liabilities arising out of the performance of their duties to the Hennessy Funds. Additionally, in the normal course of business, the Hennessy Funds enter into contracts with service providers that contain general indemnification clauses. The Fund’s maximum exposure under these arrangements is unknown as this would involve future claims that may be made against the Fund that have not yet occurred. Currently, the Fund expects the risk of loss to be remote.
7). LINE OF CREDIT
The Fund has an uncommitted line of credit with the other Hennessy Funds in the amount of the lesser of (i) $100,000,000 or (ii) 33.33% of each Hennessy Fund’s net assets, or 30% for the Hennessy Gas Utility Fund and 10% for the Hennessy Balanced Fund, intended to provide short-term financing, if necessary, subject to certain restrictions, in connection with shareholder redemptions. The credit facility is with the Hennessy Funds’ custodian bank, U.S. Bank N.A. Borrowings under this arrangement bear interest at the bank’s prime rate and are secured by all of the Fund’s assets (as to its own borrowings only). During fiscal year 2018, the Fund did not have any borrowings outstanding under the line of credit.
| NOTES TO THE FINANCIAL STATEMENTS |
8). FEDERAL TAX INFORMATION
As of October 31, 2018, the components of accumulated earnings (losses) for income tax purposes were as follows:
| | | Investments | |
| Cost of investments for tax purposes | | $ | 436,311,692 | |
| Gross tax unrealized appreciation | | $ | 94,180,873 | |
| Gross tax unrealized depreciation | | | (24,408,547 | ) |
| Net tax unrealized appreciation/(depreciation) | | $ | 69,772,326 | |
| Undistributed ordinary income | | $ | 861,036 | |
| Undistributed long-term capital gains | | | — | |
| Total distributable earnings | | $ | 861,036 | |
| Other accumulated gain/(loss) | | $ | (279,907 | ) |
| Total accumulated gain/(loss) | | $ | 70,353,455 | |
The difference between book-basis unrealized appreciation/depreciation (as shown in the Statement of Assets and Liabilities) and tax-basis unrealized appreciation/depreciation (as shown above) is attributable primarily to wash sales.
As of October 31, 2018, the Fund had capital loss carryforwards that expire as follows:
| $ 31,383 | Unlimited Long-Term |
| $248,524 | Unlimited Short-Term |
During fiscal year 2018, capital losses expired were $6,121,138.
Capital losses sustained in fiscal year 2012 and in future taxable years will not expire and may be carried over by the Fund without limitation; however, they will retain the character of the original loss. Furthermore, any loss incurred during those taxable years will be required to be utilized prior to the losses incurred in taxable years prior to 2012. As a result of this ordering rule, pre-enactment capital loss carryforwards may be more likely to expire unused. Under pre-enactment law, capital losses could be carried forward for eight years, and carried forward as short-term capital losses, irrespective of the character of the original loss.
As of October 31, 2018, the Fund did not defer, on a tax basis, any late-year ordinary losses. Late-year ordinary losses are net ordinary losses incurred after December 31, 2017, but within the taxable year, that are deemed to arise on the first day of the Fund’s next taxable year.
During fiscal year 2018 and fiscal year 2017, the tax character of distributions paid by the Fund was as follows:
| | | Year Ended | | | Year Ended | |
| | | October 31, 2018 | | | October 31, 2017 | |
Ordinary income(1) | | $ | 208,528 | | | $ | — | |
| Long-term capital gain | | | — | | | | — | |
| | | $ | 208,528 | | | $ | — | |
(1) Ordinary income includes short-term capital gains.
| HENNESSY FUNDS | 1-800-966-4354 | |
9). EVENTS SUBSEQUENT TO YEAR END
Management has evaluated the Fund’s related events and transactions that occurred subsequent to October 31, 2018, through the date of issuance of the Fund’s financial statements. Other than as disclosed below, management has determined that there were no subsequent events requiring recognition or disclosure in the financial statements.
On December 27, 2018, income distributions were declared and paid to shareholders of record on December 26, 2018, as follows:
| Investor Class | $0.01193503 |
| Institutional Class | $0.10566737 |
| NOTES/REPORT OF INDEPENDENT REGISTERED PUBLIC ACCOUNTING FIRM |
Report of Independent Registered Public
Accounting Firm
To the Board of Trustees of Hennessy Funds Trust
and the shareholders of the Hennessy Japan Fund
Novato, CA
Opinion on the Financial Statements
We have audited the accompanying statement of assets and liabilities of the Hennessy Japan Fund (the “Fund”), a series of Hennessy Funds Trust, including the schedule of investments, as of October 31, 2018, the related statement of operations for the year then ended, the statements of changes in net assets and the financial highlights for each of the two years in the period then ended, and the related notes (collectively referred to as the “financial statements”). In our opinion, the financial statements present fairly, in all material respects, the financial position of the Fund as of October 31, 2018, the results of its operations for the year then ended, and the changes in its net assets and the financial highlights for each of the two years in the period then ended in conformity with accounting principles generally accepted in the United States of America.
The financial highlights for each of the three years in the period ended October 31, 2016 have been audited by other auditors, whose report dated December 22, 2016 expressed unqualified opinions on such financial highlights.
Basis for Opinion
These financial statements are the responsibility of the Fund’s management. Our responsibility is to express an opinion on the Fund’s financial statements based on our audits. We are a public accounting firm registered with the Public Company Accounting Oversight Board (United States) (“PCAOB”) and are required to be independent with respect to the Fund in accordance with the U.S. federal securities laws and the applicable rules and regulations of the Securities and Exchange Commission and the PCAOB. We have served as the auditor of one or more of the funds in the Trust since 2002.
We conducted our audits in accordance with the standards of the PCAOB. Those standards require that we plan and perform the audit to obtain reasonable assurance about whether the financial statements are free of material misstatement, whether due to error or fraud. The Fund is not required to have, nor were we engaged to perform, an audit of its internal control over financial reporting. As part of our audits we are required to obtain an understanding of internal control over financial reporting, but not for the purpose of expressing an opinion on the effectiveness of the Fund’s internal control over financial reporting. Accordingly, we express no such opinion.
Our audits included performing procedures to assess the risks of material misstatement of the financial statements, whether due to error or fraud, and performing procedures that respond to those risks. Such procedures included examining, on a test basis, evidence regarding the amounts and disclosures in the financial statements. Our audits also included evaluating the accounting principles used and significant estimates made by management, as well as evaluating the overall presentation of the financial statements. Our procedures included confirmation of securities owned as of October 31, 2018 by correspondence with the custodian and brokers, or other appropriate auditing procedures where replies from brokers were not received. We believe that our audits provide a reasonable basis for our opinion.
TAIT, WELLER & BAKER LLP
Philadelphia, Pennsylvania
December 27, 2018
| HENNESSY FUNDS | 1-800-966-4354 | |
Trustees and Officers of the Fund (Unaudited)
The business and affairs of the Funds are managed under the direction of the Board of Trustees of the Trust, and the Board of Trustees elects the Officers of the Trust. Beginning in March 2015, the Board of Trustees has from time to time appointed advisers to the Board of Trustees (“Advisers”) with the intention of having qualified individuals serve in an advisory capacity in order to garner experience in the mutual fund and asset management industry and be considered as potential Trustees in the future. There are currently three Advisers: Brian Alexander, Doug Franklin, and Claire Knoles. As Advisers, Mr. Alexander, Mr. Franklin, and Ms. Knoles attend meetings of the Board of Trustees and act as non-voting participants. Information pertaining to the Trustees, Advisers, and the Officers of the Trust is set forth below. The Trustees and Officers serve until their successors are duly elected and qualified or until their earlier death, resignation, or removal. Each Trustee oversees the 16 Hennessy Funds. Unless otherwise indicated, the address of all persons listed below is 7250 Redwood Boulevard, Suite 200, Novato, CA 94945. The Fund’s Statement of Additional Information includes more information about the persons listed below and is available, without charge, upon request by calling 1-800-966-4354.
| | | | Other |
| | | | Directorships |
| | | | Held Outside |
| Name, (Year of Birth), | | | of Fund |
| and Position Held | Start Date | Principal Occupation(s) | Complex During |
with the Trust | of Service | During Past Five Years | Past Five Years(1) |
| | |
| Disinterested Trustees and Advisers | |
| | | | |
| J. Dennis DeSousa | January 1996 | Mr. DeSousa is a real estate investor. | None. |
| (1936) | | | |
| Trustee | | | |
| | | | |
| Robert T. Doyle | January 1996 | Mr. Doyle has been the Sheriff of | None. |
| (1947) | | Marin County, California since 1996. | |
| Trustee | | | |
| | | | |
| Gerald P. Richardson | May 2004 | Mr. Richardson is an independent | None. |
| (1945) | | consultant in the securities industry. | |
| Trustee | | | |
| | | | |
| Brian Alexander | March 2015 | Mr. Alexander has worked for the | None. |
| (1981) | | Sutter Health organization since | |
| Adviser to the Board | | 2011 in various positions. He has | |
| | | served as the Chief Executive Officer | |
| | | of the Sutter Roseville Medical | |
| | | Center since 2018. From 2016 through | |
| | | 2018, he served as the Vice President | |
| | | of Strategy for the Sutter Health Valley | |
| | | Area, which includes 11 hospitals, | |
| | | 13 ambulatory surgery centers, | |
| | | 16,000 employees, and 1,900 physicians. | |
| | | From 2013 through 2016, Mr. Alexander | |
| | | served as Sutter Novato Community | |
| | | Hospital’s Chief Administrative Officer, | |
| | | and from 2011 through 2012, he | |
| | | served as a Director of Strategy | |
| | | within Sutter’s West Bay Region. | |
| TRUSTEES AND OFFICERS OF THE FUND |
| | | | Other |
| | | | Directorships |
| | | | Held Outside |
| Name, (Year of Birth), | | | of Fund |
| and Position Held | Start Date | Principal Occupation(s) | Complex During |
with the Trust | of Service | During Past Five Years | Past Five Years(1) |
| | | | |
| Doug Franklin | March 2016 | Mr. Franklin is a retired insurance | None. |
| (1964) | | industry executive. From 1987 | |
| Adviser to the Board | | through 2015, he was employed | |
| | | by the Allianz-Fireman’s Fund | |
| | | Insurance Company in various | |
| | | positions, including as its Chief | |
| | | Actuary and Chief Risk Officer. | |
| | | | |
| Claire Knoles | December 2015 | Ms. Knoles is a founder of Kiosk and | None. |
| (1974) | | has served as its Chief Operating | |
| Adviser to the Board | | Officer since 2004. Kiosk is a full | |
| | | service marketing agency with | |
| | | offices in the San Francisco Bay | |
| | | Area, Toronto, and Liverpool, UK. | |
| | | | |
Interested Trustee(2) | | | |
| | | | |
| Neil J. Hennessy | January 1996 as | Mr. Neil Hennessy has been employed | Hennessy |
| (1956) | a Trustee and | by Hennessy Advisors, Inc. since | Advisors, Inc. |
| Trustee, Chairman of | June 2008 as | 1989 and currently serves as its | |
| the Board, Chief | an Officer | Chairman and Chief Executive Officer. | |
| Investment Officer, | | | |
| Portfolio Manager, | | | |
| and President | | | |
| Name, (Year of Birth), | | |
| and Position Held | Start Date | Principal Occupation(s) |
with the Trust | of Service | During Past Five Years |
| | | |
| Officers | | |
| | | |
| Teresa M. Nilsen | January 1996 | Ms. Nilsen has been employed by Hennessy Advisors, Inc. |
| (1966) | | since 1989 and currently serves as its President, Chief Operating |
| Executive Vice President | | Officer, and Secretary. |
| and Treasurer | | |
| | | |
| Daniel B. Steadman | March 2000 | Mr. Steadman has been employed by Hennessy Advisors, Inc. |
| (1956) | | since 2000 and currently serves as its Executive Vice President. |
| Executive Vice President | | |
| and Secretary | | |
| | | |
| Brian Carlson | December 2013 | Mr. Carlson has been employed by Hennessy Advisors, Inc. |
| (1972) | | since December 2013 and currently serves as its Chief |
| Senior Vice President | | Compliance Officer and Senior Vice President. |
| and Head of Distribution | | |
| | | |
| Jennifer Cheskiewicz | June 2013 | Ms. Cheskiewicz has been employed by Hennessy Advisors, Inc. |
(1977)(3) | | as its General Counsel since June 2013. |
| Senior Vice President and | | |
| Chief Compliance Officer | | |
| HENNESSY FUNDS | 1-800-966-4354 | |
| Name, (Year of Birth), | | |
| and Position Held | Start Date | Principal Occupation(s) |
with the Trust | of Service | During Past Five Years |
| | | |
| David Ellison | October 2012 | Mr. Ellison has been employed by Hennessy Advisors, Inc. since |
(1958)(4) | | October 2012. He has served as a Portfolio Manager of the |
| Senior Vice President | | Hennessy Large Cap Financial Fund and the Hennessy Small |
| and Portfolio Manager | | Cap Financial Fund since inception. Mr. Ellison also served as a |
| | | Portfolio Manager of the Hennessy Technology Fund from its |
| | | inception until February 2017. Mr. Ellison served as Director, |
| | | CIO and President of FBR Fund Advisers, Inc. from December |
| | | 1999 to October 2012. |
| | | |
| Ryan C. Kelley | March 2013 | Mr. Kelley has been employed by Hennessy Advisors, Inc. since |
(1972)(5) | | October 2012. He has served as a Portfolio Manager of the |
| Senior Vice President | | Hennessy Gas Utility Fund, the Hennessy Large Cap Financial |
| and Portfolio Manager | | Fund, and the Hennessy Small Cap Financial Fund since |
| | | October 2014. He served as Co-Portfolio Manager of the same |
| | | funds from March 2013 through September 2014, and as a |
| | | Portfolio Analyst for the Hennessy Funds from October 2012 |
| | | through February 2013. Mr. Kelley has also served as a Portfolio |
| | | Manager of the Hennessy Cornerstone Growth Fund, the |
| | | Hennessy Cornerstone Mid Cap 30 Fund, the Hennessy |
| | | Cornerstone Large Growth Fund, and the Hennessy |
| | | Cornerstone Value Fund since February 2017, as a Co-Portfolio |
| | | Manager of the Hennessy Technology Fund since February |
| | | 2017, and as a Portfolio Manager of the Hennessy Total Return |
| | | Fund and the Hennessy Balanced Fund since May 2018. |
| | | Mr. Kelley served as Portfolio Manager of FBR Fund Advisers, |
| | | Inc. from January 2008 to October 2012. |
| | | |
| Tania Kelley | October 2003 | Ms. Kelley has been employed by Hennessy Advisors, Inc. |
| (1965) | | since October 2003. |
| Senior Vice President | | |
| and Head of Marketing | | |
| | | |
| Daniel P. Hennessy | December 2016 | Mr. Daniel Hennessy has been employed by Hennessy Advisors, |
| (1990) | | Inc. since 2015. He has served as an Associate Analyst or |
| Vice President | | Analyst of the Hennessy Technology Fund since February 2017. |
| and Analyst | | Mr. Daniel Hennessy previously served as a Mutual Fund |
| | | Specialist at U.S. Bancorp Fund Services, LLC (now doing |
| | | business as U.S. Bank Global Fund Services) from November |
| | | 2014 to July 2015. Prior to that, he attended the University of |
| | | San Diego, where he earned a degree in Political Science. |
_______________
(1) | Messrs. DeSousa, Doyle, N. Hennessy, and Richardson previously served on the Board of Directors of Hennessy Mutual Funds, Inc. (“HMFI”), The Hennessy Funds, Inc. (“HFI”), and Hennessy SPARX Funds Trust (“HSFT”). Pursuant to an internal reorganization effective as of February 28, 2014, the series of HFMI, HFI, and HSFT were reorganized into corresponding series of the Trust that mirrored them. Subsequent to the reorganization, HFMI, HFI, and HSFT were dissolved. |
(2) | Mr. N. Hennessy is considered an “interested person,” as defined in the Investment Company Act of 1940, as amended, because he is an officer of the Hennessy Funds. |
(3) | The address of this officer is 4800 Bee Caves Road, Suite 100, Austin, TX 78746. |
(4) | The address of this officer is 101 Federal Street, Suite 1900, Boston, MA 02110. |
(5) | The address of this officer is 1340 Environ Way, Suite 332, Chapel Hill, NC 27517. |
| TRUSTEES AND OFFICERS OF THE FUND |
(This Page Intentionally Left Blank.)
Expense Example (Unaudited)
October 31, 2018
As a shareholder of the Fund, you incur ongoing costs, including management fees, service fees, and other Fund expenses. This Example is intended to help you understand your ongoing costs (in dollars) of investing in the Fund and to compare these costs with the ongoing costs of investing in other mutual funds. The Example is based on an investment of $1,000 invested at the beginning of the period and held for the entire period from May 1, 2018, through October 31, 2018.
Actual Expenses
The first line of the table below under the “Investor Class” and “Institutional Class” headings provides information about actual account values and actual expenses. Although the Fund charges no sales loads or transaction fees, you will be assessed fees for outgoing wire transfers, returned checks and stop payment orders at prevailing rates charged by U.S. Bank Global Fund Services, the Fund’s transfer agent. If you request that a redemption be made by wire transfer, currently a $15 fee is charged by the Fund’s transfer agent. IRA accounts will be charged a $15 annual maintenance fee. The example below includes, but is not limited to, management fees, shareholder servicing fees, fund accounting, custody, and transfer agent fees. However, the example below does not include portfolio trading commissions and related expenses, and other extraordinary expenses as determined under generally accepted accounting principles. You may use the information in this line, together with the amount you invested, to estimate the expenses that you paid over the period. Simply divide your account value by $1,000 (for example, an $8,600 account value divided by $1,000 = 8.6), then multiply the result by the number in the first line of the table under the “Investor Class” or “Institutional Class” headings in the column entitled “Expenses Paid During Period” to estimate the expenses you paid on your account during this period.
Hypothetical Example for Comparison Purposes
The second line of the table below under the “Investor Class” and “Institutional Class” headings provides information about hypothetical account values and hypothetical expenses based on the Fund’s actual expense ratios and an assumed rate of return of 5% per year before expenses, which is not the Fund’s actual return. The hypothetical account values and expenses may not be used to estimate the actual ending account balance or expenses you paid for the period. You may use this information to compare the ongoing costs of investing in the Fund and other funds. To do so, compare this 5% hypothetical example with the 5% hypothetical examples that appear in the shareholder reports of the other funds. Please note that the expenses shown in the table are meant to highlight your ongoing costs only. Therefore, the second line of the table under the “Investor Class” and “Institutional Class” headings is useful in comparing ongoing costs only, and will not help you determine the relative total costs of owning different funds.
| | | | Expenses Paid |
| | Beginning | Ending | During Period(1) |
| | Account Value | Account Value | May 1, 2018 – |
| | May 1, 2018 | October 31, 2018 | October 31, 2018 |
| Investor Class | | | |
| Actual | $1,000.00 | $ 954.00 | $7.09 |
| Hypothetical (5% return before expenses) | $1,000.00 | $1,017.95 | $7.32 |
| | | | |
| Institutional Class | | | |
| Actual | $1,000.00 | $ 955.90 | $4.98 |
| Hypothetical (5% return before expenses) | $1,000.00 | $1,020.11 | $5.14 |
(1) | Expenses are equal to the Fund’s annualized expense ratio of 1.44% for Investor Class shares or 1.01% for Institutional Class shares, as applicable, multiplied by the average account value over the period, multiplied by 184/365 days (to reflect one-half year period). |
| HENNESSY FUNDS | 1-800-966-4354 | |
How to Obtain a Copy of the Fund’s
Proxy Voting Policy and Proxy Voting Records
A description of the policies and procedures the Fund uses to determine how to vote proxies relating to portfolio securities is available without charge: (1) by calling 1-800-966-4354; (2) on the Hennessy Funds’ website at www.hennessyfunds.com/proxy-voting/voting-policy; or (3) on the U.S. Securities and Exchange Commission’s (the “SEC”) website at www.sec.gov. The Fund’s proxy voting record is available without charge on both the Hennessy Funds’ website at www.hennessyfunds.com/proxy-voting/voting-record and the SEC’s website at www.sec.gov no later than August 31 for the prior 12 months ending June 30.
Quarterly Filings on Form N-Q
The Fund files a complete schedule of portfolio holdings with the SEC for the first and third quarters of each fiscal year on Form N-Q. The Fund’s Forms N-Q are available on the SEC’s website at www.sec.gov. Information included in the Fund’s Forms N-Q will also be available upon request by calling 1-800-966-4354.
Federal Tax Distribution Information
(Unaudited)
For fiscal year 2018, certain dividends paid by the Fund may be subject to a maximum tax rate of 23.8%, as provided for by the Jobs and Growth Tax Relief Reconciliation Act of 2003. The percentage of dividends declared from ordinary income designated as qualified dividend income was 100.00%.
For corporate shareholders, the percent of ordinary income distributions that qualified for the corporate dividends received deduction for fiscal year 2018 was 0.00%.
The percentage of taxable ordinary income distributions that were designated as short-term capital gain distributions under Section 871(k)(2)(C) of the Internal Revenue Code of 1986, as amended, for the Fund was 0.00%.
For the year ended October 31, 2018, the Fund earned foreign source income and paid foreign taxes, as noted below, which it intends to pass through to its shareholders pursuant to Section 853 of the Internal Revenue Code.
| | Gross Foreign Income | Foreign Tax Paid |
| Japan | $6,574,319 | $655,907 |
Important Notice Regarding Delivery
of Shareholder Documents
To help keep the Fund’s costs as low as possible, we generally deliver a single copy of shareholder reports, proxy statements, and prospectuses to shareholders who share an address and have the same last name. This process does not apply to account statements. You may request an individual copy of a shareholder document at any time. If you would like to receive separate mailings of shareholder documents, please call U.S. Bank Global Fund Services at 1-800-261-6950 or 1-414-765-4124, and individual delivery will begin within 30 days of your request. If your account is held through a financial institution or other intermediary, please contact such intermediary directly to request individual delivery.
| PROXY VOTING — PRIVACY POLICY | |
Privacy Policy
We collect the following non-public personal information about you:
| | • | information we receive from you on or in applications or other forms, correspondence, or conversations, including, but not limited to, your name, address, phone number, social security number, assets, income, and date of birth; and |
| | | |
| | • | information about your transactions with us, our affiliates, or others, including, but not limited to, your account number and balance, payment history, parties to transactions, cost basis information, and other financial information. |
We do not disclose any non-public personal information about our current or former shareholders to non-affiliated third parties, except as permitted by law. For example, we are permitted by law to disclose all of the information we collect, as described above, to our Transfer Agent to process your transactions. Furthermore, we restrict access to your non-public personal information to those persons who require such information to provide products or services to you. We maintain physical, electronic, and procedural safeguards that comply with federal standards to guard your non-public personal information.
In the event that you hold shares of the Fund through a financial intermediary, including, but not limited to, a broker-dealer, bank, or trust company, the privacy policy of your financial intermediary would govern how your non-public personal information will be shared with non-affiliated third parties.
| HENNESSY FUNDS | 1-800-966-4354 | |
(This Page Intentionally Left Blank.)
For information, questions or assistance, please call
The Hennessy Funds
1-800-966-4354 or 1-415-899-1555
INVESTMENT ADVISOR
Hennessy Advisors, Inc.
7250 Redwood Boulevard, Suite 200
Novato, California 94945
ADMINISTRATOR,
TRANSFER AGENT,
DIVIDEND PAYING AGENT, &
SHAREHOLDER SERVICING AGENT
U.S. Bancorp Fund Services, LLC
d/b/a U.S. Bank Global Fund Services
P.O. Box 701
Milwaukee, Wisconsin 53201-0701
CUSTODIAN
U.S. Bank N.A.
Custody Operations
1555 North River Center Drive, Suite 302
Milwaukee, Wisconsin 53212
TRUSTEES
Neil J. Hennessy
Robert T. Doyle
J. Dennis DeSousa
Gerald P. Richardson
COUNSEL
Foley & Lardner LLP
777 East Wisconsin Avenue
Milwaukee, Wisconsin 53202-5306
INDEPENDENT REGISTERED
PUBLIC ACCOUNTING FIRM
Tait, Weller & Baker LLP
Two Liberty Place
50 South 16th Street, Suite 2900
Philadelphia, Pennsylvania 19102-2529
DISTRIBUTOR
Quasar Distributors, LLC
777 East Wisconsin Avenue
Milwaukee, Wisconsin 53202
hennessyfunds.com | 1-800-966-4354
This report has been prepared for shareholders and may be distributed to
others only if preceded or accompanied by a current prospectus.
ANNUAL REPORT
OCTOBER 31, 2018
HENNESSY JAPAN SMALL CAP FUND
Investor Class HJPSX
Institutional Class HJSIX
hennessyfunds.com | 1-800-966-4354
(This Page Intentionally Left Blank.)
Contents
| Letter to Shareholders | 2 |
| Performance Overview | 4 |
| Financial Statements | |
| Schedule of Investments | 7 |
| Statement of Assets and Liabilities | 11 |
| Statement of Operations | 12 |
| Statements of Changes in Net Assets | 13 |
| Financial Highlights | 14 |
| Notes to the Financial Statements | 17 |
| Report of Independent Registered Public Accounting Firm | 25 |
| Trustees and Officers of the Fund | 26 |
| Expense Example | 30 |
| Proxy Voting Policy and Proxy Voting Records | 32 |
| Quarterly Schedule of Investments | 32 |
| Federal Tax Distribution Information | 32 |
| Important Notice Regarding Delivery of Shareholder Documents | 32 |
| Privacy Policy | 33 |
| HENNESSY FUNDS | 1-800-966-4354 | |
December 2018
Dear Hennessy Funds Shareholder:
Over the past year, the Japanese stock market lost ground, declining by -4.12% in U.S. dollar terms as measured by the Tokyo Stock Price Index (TOPIX) over the 12-months ended October 31, 2018. Japanese stocks rose through the last two months of 2017, but were subject to some volatility and downward pressure during 2018. Domestically, Japan made economic progress during the year. The Japanese economy continued to exhibit relatively strong growth, the inflation rate stayed positive, Shinzo Abe was reelected as leader of the Liberal Democratic Party, and corporate profits grew at a healthy rate. However, developments abroad had negative repercussions on Japanese markets. In particular, investors were dismayed by the imposition of trade tariffs by the U.S., which set off fears of an international trade war. In addition, investors worried about the steady rise in U.S. short-term interest rates, capital outflows from emerging markets as a result of these rate increases, the overvaluation of global technology stocks and fears of a further slowdown in the Chinese economy.
The Japanese economy continued to perform well this year, with GDP growth averaging 1.3% year-over-year over the last five quarters. Investors have also seen a welcome acceleration in the inflation rate, from roughly 0.5% in 2017 to 1.0% in 2018. There is little doubt that reaching the Bank of Japan’s target inflation rate of 2% will be hard in the short term. However, we believe keeping the consumer price index rising at a rate of about 1% will do much to help change inflation expectations for the better.
We believe the structural reform program in Japan is progressing well. Over the last few years, the Liberal Democratic Party’s administration has implemented scores of structural reforms affecting the tax code, the labor market, and corporate governance regulations. In June 2018, the government passed the much-anticipated labor market bill that introduced key reforms including “equal pay for equal work” for non-regular workers, and merit-based pay for highly-skilled employees. We believe these reforms represent an important step for Japan, and will help raise labor productivity, which today is lower than in many other developed countries. New revisions to the corporate governance code are also being discussed. Under the new guidelines, companies would have to publish a management succession plan, meet diversity criteria in their boardrooms, and justify non-strategic, crossholdings between companies.
Following the recent decline in stock prices, we believe stock valuations are very attractive. The prospective price to earnings multiple for the Tokyo Stock Price Index, or TOPIX, has come down from over 16x in January 2018 to 13x, well below its 7-year average of 15x. Moreover, we believe Japan has many high-quality, globally-oriented companies run by able management, and whose businesses are protected by high barriers to entry. Many of these companies operate in fast-growing, global industries, such as factory automation, Internet services, and robotics. As a result, we believe Japanese equities offer investors the opportunity to gain exposure to growth around the world, including developing countries, but with better transparency, better corporate governance, good liquidity, and reasonable valuations.
We remain optimistic about the long-term prospects for Japan and its stock market. Thank you for your continued confidence and investment in the Hennessy Funds.
Sincerely,
| |
| Tadahiro Fujimura | Masakazu Takeda |
| Portfolio Manager, | Portfolio Manager, |
| Hennessy Japan Small Cap Fund; | Hennessy Japan Fund; |
| Chief Investment Officer | Fund Manager |
| SPARX Asset Management Co., Ltd. | SPARX Asset Management Co., Ltd. |
SPARX Asset Management Co., Ltd., located in Tokyo, Japan, is the sub-advisor to the Hennessy Japan Fund and the Hennessy Japan Small Cap Fund.
Past performance does not guarantee future results.
Mutual fund investing involves risk. Principal loss is possible.
Opinions expressed are those of Tadahiro Fujimura and Masakazu Takeda and are subject to change, are not guaranteed, and should not be considered investment advice.
The Tokyo Stock Price Index (TOPIX) is an unmanaged index commonly used to measure the performance of Japanese stocks. One cannot invest directly in an index.
PE, or price to earnings, is a valuation measure and is calculated by dividing a company’s market price per share by its earnings per share.
| HENNESSY FUNDS | 1-800-966-4354 | |
Performance Overview (Unaudited)
CHANGE IN VALUE OF $10,000 INVESTMENT
This graph illustrates the performance of an initial investment of $10,000 made in the Fund ten years ago and assumes the reinvestment of dividends.
AVERAGE ANNUAL TOTAL RETURN FOR PERIODS ENDED OCTOBER 31, 2018
| | One | Five | Ten |
| | Year | Years | Years |
| Hennessy Japan Small Cap Fund – | | | |
| Investor Class (HJPSX) | 2.64% | 13.95% | 15.87% |
| Hennessy Japan Small Cap Fund – | | | |
Institutional Class (HJSIX)(1) | 3.12% | 14.20% | 15.99% |
Russell/Nomura Small CapTM Index | -6.62% | 8.32% | 10.46% |
| Tokyo Price Index (TOPIX) | -4.12% | 5.85% | 7.38% |
Expense ratios: 1.61% (Investor Class); 1.20% (Institutional Class)
(1) | The inception date of Institutional Class shares is June 15, 2015. Performance shown prior to the inception of Institutional Class shares reflects the performance of Investor Class shares and includes expenses that are not applicable to, and are higher than, those of Institutional Class shares. |
Performance data quoted represents past performance; past performance does not guarantee future results. The investment return and principal value of an investment will fluctuate so that an investor’s shares, when redeemed, may be worth more or less than their original cost. The performance table does not reflect the deduction of taxes that a shareholder would pay on Fund distributions or the redemption of Fund shares. Current performance of the Fund may be lower or higher than the performance quoted. Performance data current to the most recent month end may be obtained by visiting www.hennessyfunds.com.
The Russell/Nomura Small Cap™ Index contains the bottom 15% of the Russell/Nomura Total Market™ Index, which contains the top 98% of all stocks listed on Japan’s stock exchanges and registered on Japan’s OTC market in terms of market capitalization. The Tokyo Price Index (TOPIX) is a market capitalization-weighted index of all companies listed on the First Section of the Tokyo Stock Exchange. One cannot invest directly in an index.
Frank Russell Company (“Russell”) is the source and owner of the trademarks, service marks, and copyrights related to the Russell Indexes. Russell® is a trademark of Frank Russell Company. Neither Russell nor its licensors accept any liability for any errors or omissions in the Russell Indexes or Russell ratings or underlying data and no party may rely on any Russell Indexes or Russell ratings or underlying data contained in this
communication. No further distribution of Russell data is permitted without Russell’s express written consent. Russell does not promote, sponsor, or endorse the content of this communication.
The expense ratios presented are from the most recent prospectus. The expense ratios for the current reporting period are available in the Financial Highlights section of this report.
PERFORMANCE NARRATIVE
Portfolio Managers Tadahiro Fujimura, CFA and CMA*, and Tetsuya Hirano, CMA*
SPARX Asset Management Co., Ltd. (sub-advisor)
Performance:
For the 12-month period ended October 31, 2018, the Investor Class of the Hennessy Japan Small Cap Fund returned 2.64%, outperforming both the Russell/Nomura Small Cap™ Index (the Fund’s primary benchmark) and the Tokyo Stock Price Index (TOPIX), which returned -6.62% and -4.12%, respectively, for the same period, in U.S. dollar terms.
In the first half of the year, strong performance from high-tech and machinery-related stocks contributed positively to the Fund’s relative performance. In the second half, rising corporate spending on technology led to strong performance by software and service stocks held by the Fund. Fund holdings that performed poorly over the period included several stocks in the Consumer and Telecommunications sectors.
In terms of individual stocks, electron microscope and measuring device producer Jeol Ltd. was the greatest positive contributor to Fund performance. Rising spending on research and development led to increased demand for the company’s measuring devices, and the company also released a new product for semiconductor devices that had the potential for future growth. Midsized logistics firm SBS Holdings, Inc. also contributed positively to performance. Investors expected significant profits growth from an acquisition, and the company has been raising prices. Enterprise package software publisher Obic Business Consultants Co. Ltd. also performed well due to strong sales of its cloud-compatible software.
The largest negative contributor to Fund performance was Nippon Koei Co. Ltd. The company suffered from delays affecting long-term projects and lower demand for its consulting services from electric utilities. High-volume seller of smartphone earphones Foster Electric Co. Ltd. also performed poorly due to disappointing sales to major smartphone manufacturers. Shares of construction recycling and biomass power generation firm Takeei Corp. also declined as bans on plastic waste imports caused operating costs to rise.
The Fund continues to hold all the companies mentioned except Jeol Ltd. and Foster Electric Co. Ltd.
Portfolio Strategy and Investment Commentary:
During the upturn at the start of the period, small-cap stocks generally continued to generate positive performance. However, small stocks retreated along with the rest of the market over the balance of the period, as investors added worries about high equity valuations to their concerns over tariffs and Chinese GDP growth.
Following the recent decline in stock prices, we believe that many small-cap stocks, especially those outside technology-related sectors, look undervalued. We anticipate that the stock prices of many of these companies may rebound in the months ahead, should companies begin to actively repurchase their own shares after earnings announcements.
| HENNESSY FUNDS | 1-800-966-4354 | |
We also expect that high employment levels and slightly faster growth in wages will lead to a recovery in domestic demand in 2019.
The investment strategy of the Fund remains the same. The Fund seeks companies with strong business models and exceptional management trading at attractive valuations. Over the next few months, we will be looking for opportunities to add to existing positions where valuations look most attractive. We will also be watching earnings trends in both domestic and foreign demand-related stocks and considering options for investments that we believe promise long-term growth.
_______________
* Chartered Member of the Security Analysts Association of Japan
Opinions expressed are those of the Portfolio Manager as of the date written and are subject to change, are not guaranteed, and should not be considered investment advice or an indication of trading intent.
The Fund invests in small-capitalization and medium-capitalization companies, which may have more limited liquidity and greater price volatility than large-capitalization companies. The Fund invests in the stocks of companies operating in Japan; single-country funds may be subject to a higher degree of risk. The Fund may experience higher fees due to investments in pooled investment vehicles (including ETFs). Please see the Fund’s prospectus for a more complete discussion of these and other risks.
References to specific securities should not be considered a recommendation to buy or sell any security. Fund holdings and sector allocations are subject to change. Please refer to the Schedule of Investments included in this report for additional portfolio information.
Earnings growth is not a measure of the Fund’s future performance.
| PERFORMANCE OVERVIEW/SCHEDULE OF INVESTMENTS |
Financial Statements
Schedule of Investments as of October 31, 2018 |
HENNESSY JAPAN SMALL CAP FUND
(% of Net Assets)
| TOP TEN HOLDINGS (EXCLUDING MONEY MARKET FUNDS) | % NET ASSETS |
| Asahi Holdings, Inc. | 2.80% |
| NS Solutions Corp. | 2.78% |
| OBIC Business Consultants Co., Ltd. | 2.74% |
| Nippon Yusoki Co., Ltd. | 2.62% |
| DCM Holdings Co., Ltd. | 2.49% |
| Takuma Co., Ltd. | 2.46% |
| Sato Holdings Corp. | 2.37% |
| SBS Holdings, Inc. | 2.36% |
| Nihon Kohden Corp. | 2.35% |
| Hamakyorex Co., Ltd. | 2.31% |
Note: For presentation purposes, the Fund has grouped some of the industry categories. For purposes of categorizing securities for compliance with Section 8(b)(1) of the Investment Company Act of 1940, as amended, the Fund uses more specific industry classifications.
The Global Industry Classification Standard (GICS®) was developed by and is the exclusive property and a service mark of MSCI, Inc. and Standard & Poor Financial Services LLC. It has been licensed for use by the Hennessy Funds.
| HENNESSY FUNDS | 1-800-966-4354 | |
| COMMON STOCKS – 99.37% | | Number | | | | | | % of | |
| | | of Shares | | | Value | | | Net Assets | |
| Communication Services – 3.48% | | | | | | | | | |
| Kakaku.com., Inc. | | | 196,600 | | | $ | 3,560,840 | | | | 1.78 | % |
| Macromill, Inc. | | | 171,100 | | | | 3,385,870 | | | | 1.70 | % |
| | | | | | | | 6,946,710 | | | | 3.48 | % |
| | | | | | | | | | | | | |
| Consumer Discretionary – 15.69% | | | | | | | | | | | | |
| Bic Camera, Inc. | | | 237,400 | | | | 3,134,229 | | | | 1.57 | % |
| DCM Holdings Co., Ltd. | | | 511,100 | | | | 4,969,941 | | | | 2.49 | % |
| Doshisha Co., Ltd. | | | 200,300 | | | | 4,124,401 | | | | 2.07 | % |
| Hiramatsu, Inc. | | | 505,100 | | | | 2,111,338 | | | | 1.06 | % |
| Kasai Kogyo Co., Ltd. | | | 272,900 | | | | 2,516,043 | | | | 1.26 | % |
| Komeda Holdings Co., Ltd. | | | 167,500 | | | | 3,295,018 | | | | 1.65 | % |
| Pacific Industrial Co., Ltd. | | | 253,100 | | | | 3,697,842 | | | | 1.86 | % |
| Saizeriya Co., Ltd. | | | 167,100 | | | | 3,171,246 | | | | 1.59 | % |
| Seiren Co., Ltd. | | | 169,800 | | | | 2,415,767 | | | | 1.21 | % |
| TPR Co., Ltd. | | | 75,600 | | | | 1,841,341 | | | | 0.93 | % |
| | | | | | | | 31,277,166 | | | | 15.69 | % |
| | | | | | | | | | | | | |
| Consumer Staples – 4.60% | | | | | | | | | | | | |
| Kobe Bussan Co., Ltd. | | | 159,400 | | | | 4,047,504 | | | | 2.03 | % |
| Nishimoto Co., Ltd. | | | 80,600 | | | | 3,652,205 | | | | 1.83 | % |
| Soiken Holdings, Inc. | | | 348,600 | | | | 1,480,881 | | | | 0.74 | % |
| | | | | | | | 9,180,590 | | | | 4.60 | % |
| | | | | | | | | | | | | |
| Financials – 3.01% | | | | | | | | | | | | |
| Aozora Bank, Ltd. | | | 110,400 | | | | 3,809,507 | | | | 1.91 | % |
| Lifenet Insurance Co. (a) | | | 389,800 | | | | 2,185,322 | | | | 1.10 | % |
| | | | | | | | 5,994,829 | | | | 3.01 | % |
| | | | | | | | | | | | | |
| Health Care – 4.05% | | | | | | | | | | | | |
| JEOL Ltd. | | | 58,800 | | | | 968,779 | | | | 0.49 | % |
| Nihon Kohden Corp. | | | 156,800 | | | | 4,694,311 | | | | 2.35 | % |
| Ship Healthcare Holdings, Inc. | | | 66,800 | | | | 2,415,212 | | | | 1.21 | % |
| | | | | | | | 8,078,302 | | | | 4.05 | % |
| | | | | | | | | | | | | |
| Industrials – 41.66% | | | | | | | | | | | | |
| BELLSYSTEM24 Holdings, Inc. | | | 297,700 | | | | 3,932,346 | | | | 1.97 | % |
| Benefit One, Inc. | | | 157,700 | | | | 4,065,001 | | | | 2.04 | % |
| Daihen Corp. | | | 61,400 | | | | 1,439,222 | | | | 0.72 | % |
| EF-ON, Inc. | | | 299,100 | | | | 2,871,310 | | | | 1.44 | % |
The accompanying notes are an integral part of these financial statements.
| COMMON STOCKS | | Number | | | | | | % of | |
| | | of Shares | | | Value | | | Net Assets | |
| Industrials (Continued) | | | | | | | | | |
| Hamakyorex Co., Ltd. | | | 142,400 | | | $ | 4,597,940 | | | | 2.31 | % |
| Hanwa Co., Ltd. | | | 122,200 | | | | 4,001,930 | | | | 2.01 | % |
| Hito Communication, Inc. | | | 231,800 | | | | 4,100,317 | | | | 2.06 | % |
| Juki Corp. | | | 90,700 | | | | 1,015,700 | | | | 0.51 | % |
| Kanematsu Corp. | | | 296,600 | | | | 3,808,323 | | | | 1.91 | % |
| KAWADA TECHNOLOGIES, Inc. | | | 20,400 | | | | 1,173,808 | | | | 0.59 | % |
| Kito Corp. | | | 176,000 | | | | 2,661,080 | | | | 1.33 | % |
| Maeda Kosen Co., Ltd. | | | 143,800 | | | | 2,784,270 | | | | 1.40 | % |
| METAWATER Co., Ltd. | | | 116,700 | | | | 2,992,447 | | | | 1.50 | % |
| MIRAIT Holdings Corp. | | | 277,100 | | | | 4,474,280 | | | | 2.24 | % |
| Nihon Flush Co., Ltd. | | | 143,300 | | | | 2,745,915 | | | | 1.38 | % |
| Nippon Koei Co., Ltd. | | | 173,800 | | | | 3,912,189 | | | | 1.96 | % |
| Nippon Yusoki Co., Ltd. | | | 439,200 | | | | 5,222,081 | | | | 2.62 | % |
| Nissei ASB Machine Co., Ltd. | | | 35,600 | | | | 1,192,973 | | | | 0.60 | % |
| Okamura Corp. | | | 332,400 | | | | 4,531,001 | | | | 2.27 | % |
| Sato Holdings Corp. | | | 159,700 | | | | 4,719,250 | | | | 2.37 | % |
| SBS Holdings, Inc. | | | 371,700 | | | | 4,704,836 | | | | 2.36 | % |
| Shibuya Corp. | | | 110,400 | | | | 3,710,088 | | | | 1.86 | % |
| Takeei Corp. | | | 313,500 | | | | 1,991,796 | | | | 1.00 | % |
| Takuma Co., Ltd. | | | 384,700 | | | | 4,903,534 | | | | 2.46 | % |
| Tocalo Co., Ltd. | | | 171,200 | | | | 1,489,811 | | | | 0.75 | % |
| | | | | | | | 83,041,448 | | | | 41.66 | % |
| | | | | | | | | | | | | |
| Information Technology – 18.51% | | | | | | | | | | | | |
| Digital Garage, Inc. | | | 119,700 | | | | 3,273,437 | | | | 1.64 | % |
| Elecom Co., Ltd. | | | 176,500 | | | | 4,178,820 | | | | 2.10 | % |
| Macnica Fuji Electronics Holdings, Inc. | | | 252,400 | | | | 3,648,896 | | | | 1.83 | % |
| Mimaki Engineering Co., Ltd. | | | 442,900 | | | | 4,548,398 | | | | 2.28 | % |
| Nihon Unisys, Ltd. | | | 152,400 | | | | 3,339,733 | | | | 1.68 | % |
| Nippon Signal Company, Ltd. | | | 231,900 | | | | 2,123,307 | | | | 1.06 | % |
| NS Solutions Corp. | | | 185,500 | | | | 5,535,734 | | | | 2.78 | % |
| OBIC Business Consultants Co., Ltd. | | | 68,400 | | | | 5,466,984 | | | | 2.74 | % |
| Sun Corp. | | | 293,500 | | | | 1,410,029 | | | | 0.71 | % |
| UMC Electronics Co., Ltd. | | | 180,900 | | | | 3,365,957 | | | | 1.69 | % |
| | | | | | | | 36,891,295 | | | | 18.51 | % |
The accompanying notes are an integral part of these financial statements.
| HENNESSY FUNDS | 1-800-966-4354 | |
| COMMON STOCKS | | Number | | | | | | % of | |
| | | of Shares | | | Value | | | Net Assets | |
| Materials – 8.37% | | | | | | | | | |
| Asahi Holdings, Inc. | | | 260,800 | | | $ | 5,584,766 | | | | 2.80 | % |
| Asia Pile Holdings Co. | | | 692,000 | | | | 3,993,263 | | | | 2.00 | % |
| Kuriyama Holdings Corp. | | | 175,900 | | | | 2,733,051 | | | | 1.37 | % |
| Stella Chemifa Corp. | | | 143,900 | | | | 4,379,255 | | | | 2.20 | % |
| | | | | | | | 16,690,335 | | | | 8.37 | % |
| Total Common Stocks | | | | | | | | | | | | |
| (Cost $194,388,845) | | | | | | | 198,100,675 | | | | 99.37 | % |
| | | | | | | | | | | | | |
| SHORT-TERM INVESTMENTS – 0.69% | | | | | | | | | | | | |
| | | | | | | | | | | | | |
| Money Market Funds – 0.69% | | | | | | | | | | | | |
| Fidelity Government Portfolio, Institutional Class, 2.06% (b) | | | 1,368,475 | | | | 1,368,475 | | | | 0.69 | % |
| | | | | | | | | | | | | |
| Total Short-Term Investments | | | | | | | | | | | | |
| (Cost $1,368,475) | | | | | | | 1,368,475 | | | | 0.69 | % |
| | | | | | | | | | | | | |
| Total Investments | | | | | | | | | | | | |
| (Cost $195,757,320) – 100.06% | | | | | | | 199,469,150 | | | | 100.06 | % |
| Liabilities in Excess of Other Assets – (0.06)% | | | | | | | (116,910 | ) | | | (0.06 | )% |
| | | | | | | | | | | | | |
TOTAL NET ASSETS – 100.00% | | | | | | $ | 199,352,240 | | | | 100.00 | % |
Percentages are stated as a percent of net assets.
| (a) | Non-income producing security. |
| (b) | The rate listed is the fund’s seven-day yield as of October 31, 2018. |
Summary of Fair Value Exposure at October 31, 2018
The following is a summary of the inputs used to value the Fund’s net assets as of October 31, 2018 (See Note 3 in the accompanying notes to the financial statements):
| Common Stocks | | Level 1 | | | Level 2 | | | Level 3 | | | Total | |
| Communication Services | | $ | — | | | $ | 6,946,710 | | | $ | — | | | $ | 6,946,710 | |
| Consumer Discretionary | | | — | | | | 31,277,166 | | | | — | | | | 31,277,166 | |
| Consumer Staples | | | — | | | | 9,180,590 | | | | — | | | | 9,180,590 | |
| Financials | | | — | | | | 5,994,829 | | | | — | | | | 5,994,829 | |
| Health Care | | | — | | | | 8,078,302 | | | | — | | | | 8,078,302 | |
| Industrials | | | — | | | | 83,041,448 | | | | — | | | | 83,041,448 | |
| Information Technology | | | — | | | | 36,891,295 | | | | — | | | | 36,891,295 | |
| Materials | | | — | | | | 16,690,335 | | | | — | | | | 16,690,335 | |
| Total Common Stocks | | $ | — | | | $ | 198,100,675 | | | $ | — | | | $ | 198,100,675 | |
| Short-Term Investments | | | | | | | | | | | | | | | | |
| Money Market Funds | | $ | 1,368,475 | | | $ | — | | | $ | — | | | $ | 1,368,475 | |
| Total Short-Term Investments | | $ | 1,368,475 | | | $ | — | | | $ | — | | | $ | 1,368,475 | |
| Total Investments | | $ | 1,368,475 | | | $ | 198,100,675 | | | $ | — | | | $ | 199,469,150 | |
The accompanying notes are an integral part of these financial statements.
| SCHEDULE OF INVESTMENTS/STATEMENT OF ASSETS AND LIABILITIES |
Financial Statements
Statement of Assets and Liabilities as of October 31, 2018 |
| ASSETS: | | | |
| Investments in securities, at value (cost $195,757,320) | | $ | 199,469,150 | |
| Dividends and interest receivable | | | 1,435,971 | |
| Receivable for fund shares sold | | | 479,652 | |
| Prepaid expenses and other assets | | | 34,318 | |
| Total Assets | | | 201,419,091 | |
| | | | | |
| LIABILITIES: | | | | |
| Payable for securities purchased | | | 579,624 | |
| Payable for fund shares redeemed | | | 1,237,908 | |
| Payable to advisor | | | 143,911 | |
| Payable to administrator | | | 18,458 | |
| Payable to auditor | | | 21,900 | |
| Accrued distribution fees | | | 19,660 | |
| Accrued service fees | | | 8,976 | |
| Accrued trustees fees | | | 5,964 | |
| Accrued expenses and other payables | | | 30,450 | |
| Total Liabilities | | | 2,066,851 | |
| NET ASSETS | | $ | 199,352,240 | |
| | | | | |
| NET ASSETS CONSIST OF: | | | | |
| Capital stock | | $ | 189,397,047 | |
| Total distributable earnings | | | 9,955,193 | |
| Total Net Assets | | $ | 199,352,240 | |
| | | | | |
| NET ASSETS | | | | |
| Investor Class: | | | | |
| Shares authorized (no par value) | | Unlimited | |
| Net assets applicable to outstanding Investor Class shares | | $ | 100,934,185 | |
| Shares issued and outstanding | | | 6,735,449 | |
| Net asset value, offering price and redemption price per share | | $ | 14.99 | |
| | | | | |
| Institutional Class: | | | | |
| Shares authorized (no par value) | | Unlimited | |
| Net assets applicable to outstanding Institutional Class shares | | $ | 98,418,055 | |
| Shares issued and outstanding | | | 6,637,191 | |
| Net asset value, offering price and redemption price per share | | $ | 14.83 | |
The accompanying notes are an integral part of these financial statements.
| HENNESSY FUNDS | 1-800-966-4354 | |
Financial Statements
Statement of Operations for the year ended October 31, 2018 |
| INVESTMENT INCOME: | | | |
Dividend income(1) | | $ | 3,377,962 | |
| Interest income | | | 177,614 | |
| Total investment income | | | 3,555,576 | |
| | | | | |
| EXPENSES: | | | | |
| Investment advisory fees (See Note 5) | | | 1,642,461 | |
| Sub-transfer agent expenses – Investor Class (See Note 5) | | | 256,062 | |
| Sub-transfer agent expenses – Institutional Class (See Note 5) | | | 53,213 | |
| Administration, fund accounting, custody and transfer agent fees (See Note 5) | | | 196,932 | |
| Distribution fees – Investor Class (See Note 5) | | | 167,647 | |
| Service fees – Investor Class (See Note 5) | | | 111,765 | |
| Federal and state registration fees | | | 55,963 | |
| Reports to shareholders | | | 31,517 | |
| Compliance expense (See Note 5) | | | 29,499 | |
| Audit fees | | | 23,181 | |
| Trustees’ fees and expenses | | | 17,310 | |
| Legal fees | | | 1,581 | |
| Other expenses | | | 15,180 | |
| Total expenses | | | 2,602,311 | |
| NET INVESTMENT INCOME | | $ | 953,265 | |
| | | | | |
| REALIZED AND UNREALIZED GAINS (LOSSES): | | | | |
| Net realized gain on investments | | $ | 8,566,596 | |
| Net change in unrealized appreciation/depreciation on investments | | | (13,684,693 | ) |
| Net loss on investments | | | (5,118,097 | ) |
| NET DECREASE IN NET ASSETS RESULTING FROM OPERATIONS | | $ | (4,164,832 | ) |
(1) | Net of foreign taxes withheld of $375,218. |
The accompanying notes are an integral part of these financial statements.
| STATEMENT OF OPERATIONS/STATEMENTS OF CHANGES IN NET ASSETS |
Financial Statements
| Statements of Changes in Net Assets |
| | | Year Ended | | | Year Ended | |
| | | October 31, 2018 | | | October 31, 2017 | |
| OPERATIONS: | | | | | | |
| Net investment income | | $ | 953,265 | | | $ | 174,013 | |
| Net realized gain on investments | | | 8,566,596 | | | | 2,713,582 | |
| Net change in unrealized | | | | | | | | |
| appreciation/depreciation on investments | | | (13,684,693 | ) | | | 13,111,946 | |
| Net increase (decrease) in net | | | | | | | | |
| assets resulting from operations | | | (4,164,832 | ) | | | 15,999,541 | |
| | | | | | | | | |
| DISTRIBUTIONS TO SHAREHOLDERS FROM: | | | | | | | | |
| Distributable earnings – Investor Class | | | (1,780,476 | ) | | | (550,773 | ) |
| Distributable earnings – Institutional Class | | | (1,109,923 | ) | | | (37,604 | ) |
| Total distributions | | | (2,890,399 | ) | | | (588,377 | )(1) |
| | | | | | | | | |
| CAPITAL SHARE TRANSACTIONS: | | | | | | | | |
| Proceeds from shares subscribed – Investor Class | | | 111,702,386 | | | | 49,025,671 | |
| Proceeds from shares subscribed – Institutional Class | | | 137,676,100 | | | | 27,290,706 | |
| Dividends reinvested – Investor Class | | | 1,748,813 | | | | 545,989 | |
| Dividends reinvested – Institutional Class | | | 1,109,776 | | | | 37,604 | |
| Cost of shares redeemed – Investor Class | | | (80,170,785 | ) | | | (18,881,862 | ) |
| Cost of shares redeemed – Institutional Class | | | (64,230,751 | ) | | | (4,516,415 | ) |
| Net increase in net assets derived | | | | | | �� | | |
| from capital share transactions | | | 107,835,539 | | | | 53,501,693 | |
| TOTAL INCREASE IN NET ASSETS | | | 100,780,308 | | | | 68,912,857 | |
| | | | | | | | | |
| NET ASSETS: | | | | | | | | |
| Beginning of year | | | 98,571,932 | | | | 29,659,075 | |
| End of year | | $ | 199,352,240 | | | $ | 98,571,932 | (2) |
| | | | | | | | | |
| CHANGES IN SHARES OUTSTANDING: | | | | | | | | |
| Shares sold – Investor Class | | | 6,964,885 | | | | 3,750,829 | |
| Shares sold – Institutional Class | | | 8,685,841 | | | | 2,024,977 | |
| Shares issued to holders as reinvestment | | | | | | | | |
| of dividends – Investor Class | | | 113,712 | | | | 49,783 | |
| Shares issued to holders as reinvestment | | | | | | | | |
| of dividends – Institutional Class | | | 72,917 | | | | 3,468 | |
| Shares redeemed – Investor Class | | | (5,026,572 | ) | | | (1,440,939 | ) |
| Shares redeemed – Institutional Class | | | (4,071,372 | ) | | | (380,799 | ) |
| Net increase in shares outstanding | | | 6,739,411 | | | | 4,007,319 | |
(1) | Includes net investment income distributions of $307,249 and $7,754 and net realized gain distributions of $243,524 and $29,850 for the Investor Class and Institutional Class, respectively. |
(2) | Includes accumulated net investment loss of $(37,056). |
The accompanying notes are an integral part of these financial statements.
| HENNESSY FUNDS | 1-800-966-4354 | |
Financial Statements
For an Investor Class share outstanding throughout each year
PER SHARE DATA:
Net asset value, beginning of year
Income from investment operations:
Net investment income (loss)
Net realized and unrealized gains on investments
Total from investment operations
Less distributions:
Dividends from net investment income
Dividends from net realized gains
Total distributions
Net asset value, end of year
TOTAL RETURN
SUPPLEMENTAL DATA AND RATIOS:
Net assets, end of year (millions)
Ratio of expenses to average net assets
Ratio of net investment income (loss) to average net assets
Portfolio turnover rate(1)
(1) | Portfolio turnover is calculated on the basis of the Fund as a whole. |
The accompanying notes are an integral part of these financial statements.
| FINANCIAL HIGHLIGHTS — INVESTOR CLASS |
| Year Ended October 31, | |
| 2018 | | | 2017 | | | 2016 | | | 2015 | | | 2014 | |
| | | | | | | | | | | | | | |
| $ | 14.92 | | | $ | 11.29 | | | $ | 10.29 | | | $ | 10.51 | | | $ | 11.70 | |
| | | | | | | | | | | | | | | | | | | |
| | | | | | | | | | | | | | | | | | | |
| | 0.05 | | | | 0.08 | | | | 0.03 | | | | (0.02 | ) | | | (0.04 | ) |
| | 0.35 | | | | 3.77 | | | | 1.31 | | | | 0.71 | | | | 1.36 | |
| | 0.40 | | | | 3.85 | | | | 1.34 | | | | 0.69 | | | | 1.32 | |
| | | | | | | | | | | | | | | | | | | |
| | | | | | | | | | | | | | | | | | | |
| | (0.05 | ) | | | (0.12 | ) | | | — | | | | — | | | | — | |
| | (0.28 | ) | | | (0.10 | ) | | | (0.34 | ) | | | (0.91 | ) | | | (2.51 | ) |
| | (0.33 | ) | | | (0.22 | ) | | | (0.34 | ) | | | (0.91 | ) | | | (2.51 | ) |
| $ | 14.99 | | | $ | 14.92 | | | $ | 11.29 | | | $ | 10.29 | | | $ | 10.51 | |
| | | | | | | | | | | | | | | | | | | |
| | 2.64 | % | | | 34.82 | % | | | 13.44 | % | | | 7.37 | % | | | 13.99 | % |
| | | | | | | | | | | | | | | | | | | |
| | | | | | | | | | | | | | | | | | | |
| $ | 100.93 | | | $ | 69.86 | | | $ | 26.23 | | | $ | 22.68 | | | $ | 19.36 | |
| | 1.46 | % | | | 1.60 | % | | | 1.91 | % | | | 2.12 | % | | | 2.24 | % |
| | 0.21 | % | | | 0.26 | % | | | 0.25 | % | | | (0.38 | )% | | | (0.39 | )% |
| | 35 | % | | | 41 | % | | | 22 | % | | | 75 | % | | | 63 | % |
The accompanying notes are an integral part of these financial statements.
| HENNESSY FUNDS | 1-800-966-4354 | |
Financial Statements
For an Institutional Class share outstanding throughout each period
| | | | | | | | | | | | Period Ended | |
| | | Year Ended October 31, | | | October 31, | |
| | | 2018 | | | 2017 | | | 2016 | | | 2015(1) | |
| PER SHARE DATA: | | | | | | | | | | | | |
| Net asset value, beginning of period | | $ | 14.72 | | | $ | 11.33 | | | $ | 10.30 | | | $ | 10.89 | |
| | | | �� | | | | | | | | | | | | | |
| Income from | | | | | | | | | | | | | | | | |
| investment operations: | | | | | | | | | | | | | | | | |
| Net investment income (loss) | | | 0.11 | | | | 0.05 | | | | 0.06 | | | | (0.01 | ) |
| Net realized and unrealized | | | | | | | | | | | | | | | | |
| gains (losses) on investments | | | 0.36 | | | | 3.78 | | | | 1.31 | | | | (0.58 | ) |
| Total from investment operations | | | 0.47 | | | | 3.83 | | | | 1.37 | | | | (0.59 | ) |
| | | | | | | | | | | | | | | | | |
| Less distributions: | | | | | | | | | | | | | | | | |
| Dividends from net | | | | | | | | | | | | | | | | |
| investment income | | | (0.08 | ) | | | (0.10 | ) | | | — | | | | — | |
| Dividends from net realized gains | | | (0.28 | ) | | | (0.34 | ) | | | (0.34 | ) | | | — | |
| Total distributions | | | (0.36 | ) | | | (0.44 | ) | | | (0.34 | ) | | | — | |
| Net asset value, end of period | | $ | 14.83 | | | $ | 14.72 | | | $ | 11.33 | | | $ | 10.30 | |
| | | | | | | | | | | | | | | | | |
| TOTAL RETURN | | | 3.12 | % | | | 35.17 | % | | | 13.73 | % | | | (5.42 | )%(2) |
| | | | | | | | | | | | | | | | | |
| SUPPLEMENTAL | | | | | | | | | | | | | | | | |
| DATA AND RATIOS: | | | | | | | | | | | | | | | | |
| Net assets, end of period (millions) | | $ | 98.42 | | | $ | 28.71 | | | $ | 3.42 | | | $ | 2.65 | |
| Ratio of expenses to | | | | | | | | | | | | | | | | |
| average net assets | | | 1.04 | % | | | 1.19 | % | | | 1.63 | % | | | 1.86 | %(3) |
| Ratio of net investment income | | | | | | | | | | | | | | | | |
| (loss) to average net assets | | | 0.77 | % | | | 0.80 | % | | | 0.63 | % | | | (1.04 | )%(3) |
Portfolio turnover rate(4) | | | 35 | % | | | 41 | % | | | 22 | % | | | 75 | %(2) |
(1) | Institutional Class shares commenced operations on June 15, 2015. |
(2) | Not annualized. |
(3) | Annualized. |
(4) | Portfolio turnover is calculated on the basis of the Fund as a whole. |
The accompanying notes are an integral part of these financial statements.
| FINANCIAL HIGHLIGHTS — INSTITUTIONAL CLASS/NOTES TO THE FINANCIAL STATEMENTS |
Financial Statements
Notes to the Financial Statements October 31, 2018 |
1). ORGANIZATION
The Hennessy Japan Small Cap Fund (the “Fund”) is a series of Hennessy Funds Trust (the “Trust”), which was organized as a Delaware statutory trust on September 17, 1992. The Fund is an open-end management investment company registered under the Investment Company Act of 1940, as amended. The Fund did not have Institutional Class shares until June 15, 2015. The investment objective of the Fund is long-term capital appreciation. The Fund is a diversified fund.
The Fund offers Investor Class and Institutional Class shares. Each class of shares differs principally in its respective 12b-1 distribution and service, shareholder servicing, and sub-transfer agent expenses. There are no sales charges. Each class has identical rights to earnings, assets, and voting privileges, except for class-specific expenses and exclusive rights to vote on matters affecting only an individual class.
As an investment company, the Fund follows the investment company accounting and reporting guidance of the Financial Accounting Standards Board (“FASB”) Accounting Standard Codification Topic 946 “Financial Services—Investment Companies.”
2). SIGNIFICANT ACCOUNTING POLICIES
The following is a summary of significant accounting policies consistently followed by the Fund in the preparation of the financial statements. These policies conform to U.S. generally accepted accounting principles (“GAAP”).
| a). | Securities Valuation – All investments in securities are recorded at their estimated fair value, as described in Note 3. |
| | |
| b). | Federal Income Taxes – No provision for federal income taxes or excise taxes has been made because the Fund has elected to be taxed as a regulated investment company and intends to distribute substantially all of its taxable income to its shareholders and otherwise comply with the provisions of the Internal Revenue Code of 1986, as amended, applicable to regulated investment companies. Net investment income/loss and realized gains/losses for federal income tax purposes may differ from those reported in the financial statements because of temporary book and tax basis differences. Temporary differences are primarily the result of the treatment of wash sales for tax reporting purposes. The Fund recognizes interest and penalties related to income tax benefits, if any, in the Statement of Operations as an income tax expense. Distributions from net realized gains for book purposes may include short-term capital gains, which are included as ordinary income to shareholders for tax purposes. The Fund may utilize equalization accounting for tax purposes and designate earnings and profits, including net realized gains distributed to shareholders on redemption of shares, as part of the dividends paid deduction for income tax purposes. |
| | |
| | Due to inherent differences in the recognition of income, expenses, and realized gains/losses under GAAP and federal income tax regulations, permanent differences between book and tax basis for reporting for fiscal year 2018 have been identified and appropriately reclassified in the Statement of Assets and Liabilities. The adjustments are as follows: |
| Total | |
| Distributable | |
Earnings | Capital Stock |
| $(2,438,804) | $2,438,804 |
| HENNESSY FUNDS | 1-800-966-4354 | |
| c). | Accounting for Uncertainty in Income Taxes – The Fund has accounting policies regarding recognition and measurement of tax positions taken or expected to be taken on a tax return. The tax returns of the Fund for the prior three fiscal years are open for examination. The Fund has reviewed all open tax years in major jurisdictions and concluded that there is no impact on the Fund’s net assets and no tax liability resulting from unrecognized tax benefits relating to uncertain income tax positions taken or expected to be taken on a tax return. The Fund’s major tax jurisdictions are U.S. federal and Delaware. |
| | |
| d). | Income and Expenses – Dividend income is recognized on the ex-dividend date or as soon as information is available to the Fund. Interest income, which includes the amortization of premium and accretion of discount, is recognized on an accrual basis. Other non-cash dividends are recognized as investment income at the fair value of the property received. The Fund is charged for those expenses that are directly attributable to its portfolio, such as advisory, administration, and certain shareholder service fees. Income, expenses (other than expenses attributable to a specific class), and realized and unrealized gains/losses on investments are allocated to each class of shares based on such class’s net assets. |
| | |
| e). | Distributions to Shareholders – Dividends from net investment income for the Fund, if any, are declared and paid annually, usually in December. Distributions of net realized capital gains, if any, are declared and paid annually, usually in December. |
| | |
| f). | Security Transactions – Investment and shareholder transactions are recorded on the trade date. The Fund determines the realized gain/loss from an investment transaction by comparing the original cost of the security lot sold with the net sale proceeds. Discounts and premiums on securities purchased are accreted or amortized, respectively, over the life of each such security. |
| | |
| g). | Use of Estimates – The preparation of financial statements in conformity with GAAP requires management to make estimates and assumptions that affect the reported amounts of assets and liabilities and disclosure of contingent assets and liabilities at the date of the financial statements and the reported change in net assets during the reporting period. Actual results could differ from those estimates. |
| | |
| h). | Share Valuation – The net asset value (“NAV”) per share of the Fund is calculated by dividing (i) the total value of the securities held by the Fund, plus cash and other assets, minus all liabilities (including estimated accrued expenses) by (ii) the total number of shares outstanding for the Fund, rounded to the nearest cent. The Fund’s shares will not be priced on days the New York Stock Exchange is closed for trading. The offering and redemption price per share for the Fund is equal to the Fund’s NAV per share. |
| | |
| i). | Foreign Currency – Values of investments denominated in foreign currencies are converted into U.S. dollars using the spot market rate of exchange at the time of valuation. Purchases and sales of investments and income are translated into U.S. dollars using the spot market rate of exchange prevailing on the respective dates of such transactions. The Fund does not isolate the portion of the results of operations resulting from fluctuations in foreign exchange rates on investments from fluctuations resulting from changes in the market prices of securities held. Such fluctuations are included with the net realized and unrealized gain/loss on investments. Foreign investments present additional risks due to currency fluctuations, economic and political factors, lower liquidity, government regulations, differences in accounting standards, and other factors. |
| | |
| j). | New Accounting Pronouncements – In August 2018, the FASB issued Accounting Standards Update No. 2018-13 “Disclosure Framework—Changes to the Disclosure |
| NOTES TO THE FINANCIAL STATEMENTS |
| | Requirements for Fair Value Measurement” (“ASU 2018-13”). ASU 2018-13 eliminates the requirement to disclose the amount of and reasons for transfers between Level 1 and Level 2 of the fair value hierarchy, the timing of transfers between levels of the fair value hierarchy, and the valuation processes for Level 3 fair value measurements. ASU 2018-13 does not eliminate the requirement to disclose the range and weighted average used to develop significant unobservable inputs for Level 3 fair value measurements, and the changes in unrealized gains and losses for recurring Level 3 fair value measurements. ASU 2018-13 requires that information is provided about the measurement uncertainty of Level 3 fair value measurements as of the reporting date. The guidance is effective for fiscal years beginning after December 15, 2019, and interim periods within those fiscal years. Management has evaluated the impact of this change in guidance, and due to the permissibility of early adoption, modified the Fund’s fair value disclosures for the current reporting period. |
| | |
| k). | New Rule Issuances – In August 2018, the Securities and Exchange Commission issued Final Rule Release No. 33 10532, Disclosure Update and Simplification, which in part amends certain financial statement disclosure requirements of Regulation S-X that have become redundant, duplicative, overlapping, outdated, or superseded, in light of other Commission disclosure requirements, GAAP, or changes in the information environment. The amendments are intended to facilitate the disclosure of information to investors and simplify compliance without significantly altering the total mix of information provided to investors. The amendments to Rule 6-04.17 of Regulation S-X (balance sheet) were amended to require presentation of the total, rather than the components of net assets, of distributable earnings on the balance sheet. Consistent with GAAP, funds will be required to disclose total distributable earnings. The amendments to Rule 6-09 of Regulation S-X (statement of changes in net assets) omit the requirement to separately state the sources of distributions paid as well as omit the requirement to parenthetically state the book basis amount of undistributed net investment income. Instead, consistent with GAAP, funds will be required to disclose the total amount of distributions paid, except that any tax return of capital must be separately disclosed. The requirements of the Final Rule Release are effective November 5, 2018 and the Fund’s Statement of Assets and Liabilities and the Statement of Changes in Net Assets for the current and prior reporting period have been modified accordingly. |
3). SECURITIES VALUATION
The Fund follows fair valuation accounting standards that establish an authoritative definition of fair value and set out a hierarchy for measuring fair value. These standards require additional disclosures about the various inputs and valuation techniques used to develop the measurements of fair value and a discussion of changes in valuation techniques and related inputs during the period. These inputs are summarized in the three broad levels listed below:
| | Level 1 – | Unadjusted, quoted prices in active markets for identical instruments that the Fund has the ability to access at the date of measurement. |
| | | |
| | Level 2 – | Other significant observable inputs (including, but not limited to, quoted prices in active markets for similar instruments, quoted prices in markets that are not active for identical or similar instruments, and model-derived valuations in which all significant inputs and significant value drivers are observable in active markets, such as interest rates, prepayment speeds, credit risk curves, default rates, and similar data). |
| HENNESSY FUNDS | 1-800-966-4354 | |
| | Level 3 – | Significant unobservable inputs (including the Fund’s own assumptions about what market participants would use to price the asset or liability based on the best available information) when observable inputs are unavailable. |
Following is a description of the valuation techniques applied to the Fund’s major categories of assets and liabilities measured at fair value on a recurring basis.
| | Equity Securities – Equity securities, including common stocks, preferred stocks, foreign-issued common stocks, exchange-traded funds, closed-end mutual funds, partnerships, rights, and real estate investment trusts, that are traded on a securities exchange for which a last-quoted sales price is readily available will generally be valued at the last sales price as reported by the primary exchange on which the securities are listed. Securities listed on The NASDAQ Stock Market (“NASDAQ”) will generally be valued at the NASDAQ Official Closing Price, which may differ from the last sales price reported. Securities traded on a securities exchange for which a last-quoted sales price is not readily available will generally be valued at the mean between the bid and ask prices. To the extent these securities are actively traded and valuation adjustments are not applied, they are classified in Level 1 of the fair value hierarchy. Securities traded on foreign exchanges generally are not valued at the same time the Fund calculates its NAV because most foreign markets close well before such time. The earlier close of most foreign markets gives rise to the possibility that significant events, including broad market moves, may have occurred in the interim. In certain circumstances, it may be determined that a foreign security needs to be fair valued because it appears that the value of the security might have been materially affected by events occurring after the close of the market in which the security is principally traded, but before the time the Fund calculates its NAV, such as by a development that affects an entire market or region (e.g., a weather-related event) or a potentially global development (e.g., a terrorist attack that may be expected to have an effect on investor expectations worldwide). |
| | |
| | Registered Investment Companies – Investments in open-end registered investment companies, commonly referred to as mutual funds, are generally priced at the ending NAV provided by the applicable mutual fund’s service agent and will be classified in Level 1 of the fair value hierarchy. |
| | |
| | Debt Securities – Debt securities, including corporate bonds, asset-backed securities, mortgage-backed securities, municipal bonds, U.S. Treasuries, and U.S. government agency issues, are generally valued at market on the basis of valuations furnished by an independent pricing service that utilizes both dealer-supplied valuations and formula-based techniques. The pricing service may consider recently executed transactions in securities of the issuer or comparable issuers, market price quotations (where observable), bond spreads, and fundamental data relating to the issuer. In addition, the model may incorporate observable market data, such as reported sales of similar securities, broker quotes, yields, bids, offers, and reference data. Certain securities are valued primarily using dealer quotations. These securities are generally classified in Level 2 of the fair value hierarchy. |
| | |
| | Short-Term Securities – Short-term equity investments, including money market funds, are valued in the manner specified above. Short-term debt investments with an original term to maturity of 60 days or less are valued at amortized cost, which approximates fair market value. If the original term to maturity of a short-term debt investment exceeded 60 days, then the values as of the 61st day prior to maturity are amortized. Amortized cost is not used if its use would be inappropriate due to credit or other impairments of the issuer, in which case the security’s fair value would be |
| NOTES TO THE FINANCIAL STATEMENTS |
| | determined, as described below. Short-term securities are generally classified in Level 1 or Level 2 of the fair market hierarchy depending on the inputs used and market activity levels for specific securities. |
The Board of Trustees of the Fund (the “Board”) has adopted fair value pricing procedures that are followed when a price for a security is not readily available or if a significant event has occurred that indicates the closing price of a security no longer represents the true value of that security. Fair value pricing determinations are made in good faith in accordance with these procedures. There are numerous criteria that will be given consideration in determining a fair value of a security, such as the trading volume of a security and markets, the values of other similar securities, and news events with direct bearing on a security or markets. Fair value pricing results in an estimated price for a security that reflects the amount the Fund might reasonably expect to receive in a current sale. Depending on the relative significance of the valuation inputs, these securities may be classified in either Level 2 or Level 3 of the fair value hierarchy.
The fair valuation of foreign securities may be determined with the assistance of a pricing service using correlations between the movement of prices of such securities and indices of domestic securities and other appropriate indicators, such as closing market prices of relevant American Depositary Receipts or futures contracts. The effect of using fair value pricing is that the Fund’s NAV will reflect the affected portfolio securities’ values as determined by the Board or its designee, pursuant to the fair value pricing procedures adopted by the Board, instead of being determined by the market. Using a fair value pricing methodology to price a foreign security may result in a value that is different from such foreign security’s most recent closing price and from the value used by other investment companies to calculate their NAVs. Such securities are generally classified in Level 2 of the fair valuation hierarchy. Because the Fund may invest in foreign securities, the value of the Fund’s portfolio securities may change on days when you will not be able to purchase or redeem your shares.
The Board has delegated day-to-day valuation matters to a Valuation Committee comprised of one or more representatives from Hennessy Advisors, Inc., the Fund’s investment advisor (the “Advisor”). The function of the Valuation Committee is to value securities where current and reliable market quotations are not readily available. All actions taken by the Valuation Committee are reviewed by the Board.
The Fund has performed an analysis of all existing investments to determine the significance and character of all inputs to their fair value determinations. Various inputs are used to determine the value of the Fund’s investments. The inputs or methodology used for valuing securities are not necessarily an indication of the risk associated with investing in those securities. Details related to the fair valuation hierarchy of the Fund’s securities as of October 31, 2018, are included in the Schedule of Investments.
4). INVESTMENT TRANSACTIONS
Purchases and sales of investment securities (excluding government and short-term investments) for the Fund during fiscal year 2018 were $179,744,244 and $66,403,237, respectively.
There were no purchases or sales/maturities of long-term U.S. government securities for the Fund during fiscal year 2018.
The Fund is permitted to purchase or sell securities from or to another fund in the Hennessy Funds family of funds (the “Hennessy Funds”) under specified conditions outlined in procedures adopted by the Board. The procedures have been designed to ensure that any purchase or sale of securities by the Fund from or to another Hennessy
| HENNESSY FUNDS | 1-800-966-4354 | |
Fund complies with Rule 17a-7 of the Investment Company Act of 1940, as amended. During fiscal year 2018, the Fund did not engage in purchases or sales of securities pursuant to Rule 17a-7 of the Investment Company Act of 1940, as amended.
5). INVESTMENT ADVISORY FEE AND OTHER TRANSACTIONS WITH AFFILIATES
The Advisor provides the Fund with investment advisory services under an Investment Advisory Agreement. The Advisor oversees the provision of investment advice and furnishes office space and facilities, as well as most of the personnel needed by the Fund. As compensation for its services, the Advisor is entitled to a monthly fee from the Fund. The fee is based upon the average daily net assets of the Fund at an annual rate of 0.80%, effective as of March 1, 2016. Prior to that date, the annual rate was 1.20%. The net investment advisory fees expensed by the Fund during fiscal year 2018 are included in the Statement of Operations.
The Advisor has delegated the day-to-day management of the Fund to a sub-advisor, SPARX Asset Management Co., Ltd. The Advisor pays the sub-advisory fees from its own assets, and these fees are not an additional expense of the Fund. For the most recent fiscal year, the Advisor (not the Fund) paid a sub-advisory fee, based upon the daily net assets of the Fund, at an average rate of 0.31%. Prior to February 28, 2018, the sub-advisory fee for the Fund was 0.20%. Effective February 28, 2018, the Advisor amended the sub-advisory agreement with SPARX Asset Management Co., Ltd. to increase the sub-advisory fee to 0.35% of the first $500 million of daily net assets, 0.40% of the next $500 million of daily net assets, and 0.42% of daily net assets over $1 billion. The Fund currently has less than $500 million of daily net assets.
The Board has approved a Shareholder Servicing Agreement for Investor Class shares of the Fund, which was instituted to compensate the Advisor for the non-investment advisory services it provides to the Fund. The Shareholder Servicing Agreement provides for a monthly fee paid to the Advisor at an annual rate of 0.10% of the average daily net assets of the Fund attributable to Investor Class shares. The shareholder service fees expensed by the Fund during fiscal year 2018 are included in the Statement of Operations.
The Fund has adopted a plan pursuant to Rule 12b-1 under the Investment Company Act of 1940, as amended, that authorizes payments in connection with the distribution of the Fund’s shares at an annual rate of up to 0.25% of the Fund’s average daily net assets attributable to Investor Class shares. Even though the authorized rate is up to 0.25%, the Fund is currently only using up to 0.15% of its average daily net assets attributable to Investor Class shares for such purpose. Amounts paid under the plan may be spent on any activities or expenses primarily intended to result in the sale of shares, including, but not limited to, advertising, shareholder account servicing, printing and mailing of prospectuses to other than current shareholders, printing and mailing of sales literature, and compensation for sales and marketing activities or to financial institutions and others, such as dealers and distributors. The distribution fees expensed by the Fund during fiscal year 2018 are included in the Statement of Operations.
The Fund has entered into agreements with various brokers, dealers, and financial intermediaries in connection with the sale of shares of the Fund. The agreements provide for periodic payments by the Fund to the brokers, dealers, and financial intermediaries for providing certain shareholder maintenance services (sub-transfer agent expenses). These shareholder services include the pre-processing and quality control of new accounts, shareholder correspondence, answering customer inquiries regarding account status, and facilitating shareholder telephone transactions. The sub-transfer agent fees expensed by the Fund during fiscal year 2018 are included in the Statement of Operations.
| NOTES TO THE FINANCIAL STATEMENTS |
U.S. Bancorp Fund Services, LLC, d/b/a U.S. Bank Global Fund Services (“Fund Services”) provides the Fund with administrative, fund accounting, and transfer agent services. As administrator, Fund Services is responsible for activities such as (i) preparing various federal and state regulatory filings, reports, and returns for the Fund, (ii) preparing reports and materials to be supplied to the Board, (iii) monitoring the activities of the Fund’s custodian, transfer agent, and accountants, and (iv) coordinating the preparation and payment of the Fund’s expenses and reviewing the Fund’s expense accruals. U.S. Bank N.A., an affiliate of Fund Services, serves as the Fund’s custodian. The servicing agreements between the Trust and Fund Services and U.S. Bank N.A. contain a fee schedule that is inclusive of administrative, fund accounting, custody, and transfer agent fees. The administrative, fund accounting, custody, and transfer agent fees expensed by the Fund during fiscal year 2018 are included in the Statement of Operations.
Quasar Distributors, LLC acts as the Fund’s principal underwriter in a continuous public offering of the Fund’s shares. Quasar Distributors, LLC is an affiliate of Fund Services and U.S. Bank N.A.
The officers of the Fund are affiliated with the Advisor. Such officers, with the exception of the Chief Compliance Officer and the Senior Compliance Officer, receive no compensation from the Fund for serving in their respective roles. The Fund, along with the other Hennessy Funds, makes reimbursement payments, on an equal basis, to the Advisor for a portion of the salary and benefits associated with the office of the Chief Compliance Officer and for all of the salary and benefits associated with the office of the Senior Compliance Officer. The compliance fees expensed by the Fund during fiscal year 2018 are included in the Statement of Operations.
6). GUARANTEES AND INDEMNIFICATIONS
Under the Hennessy Funds’ organizational documents, their officers and trustees are indemnified by the Hennessy Funds against certain liabilities arising out of the performance of their duties to the Hennessy Funds. Additionally, in the normal course of business, the Hennessy Funds enter into contracts with service providers that contain general indemnification clauses. The Fund’s maximum exposure under these arrangements is unknown as this would involve future claims that may be made against the Fund that have not yet occurred. Currently, the Fund expects the risk of loss to be remote.
7). LINE OF CREDIT
The Fund has an uncommitted line of credit with the other Hennessy Funds in the amount of the lesser of (i) $100,000,000 or (ii) 33.33% of each Hennessy Fund’s net assets, or 30% for the Hennessy Gas Utility Fund and 10% for the Hennessy Balanced Fund, intended to provide short-term financing, if necessary, subject to certain restrictions, in connection with shareholder redemptions. The credit facility is with the Hennessy Funds’ custodian bank, U.S. Bank N.A. Borrowings under this arrangement bear interest at the bank’s prime rate and are secured by all of the Fund’s assets (as to its own borrowings only). During fiscal year 2018, the Fund did not have any borrowings outstanding under the line of credit.
| HENNESSY FUNDS | 1-800-966-4354 | |
8). FEDERAL TAX INFORMATION
As of October 31, 2018, the components of accumulated earnings (losses) for income tax purposes were as follows:
| | | Investments | |
| Cost of investments for tax purposes | | $ | 195,799,022 | |
| Gross tax unrealized appreciation | | $ | 22,448,859 | |
| Gross tax unrealized depreciation | | | (18,782,297 | ) |
| Net tax unrealized appreciation/(depreciation) | | $ | 3,666,562 | |
| Undistributed ordinary income | | $ | 275,368 | |
| Undistributed long-term capital gains | | | 6,013,263 | |
| Total distributable earnings | | $ | 6,288,631 | |
| Other accumulated gain/(loss) | | $ | — | |
| Total accumulated gain/(loss) | | $ | 9,955,193 | |
The difference between book-basis unrealized appreciation/depreciation (as shown in the Statement of Assets and Liabilities) and tax-basis unrealized appreciation/depreciation (as shown above) is attributable primarily to wash sales and passive foreign investment companies.
As of October 31, 2018, the Fund had no tax basis capital losses to offset future capital gains.
As of October 31, 2018, the Fund did not defer, on a tax basis, any late-year ordinary losses. Late-year ordinary losses are net ordinary losses incurred after December 31, 2017, but within the taxable year, that are deemed to arise on the first day of the Fund’s next taxable year.
During fiscal year 2018 and fiscal year 2017, the tax character of distributions paid by the Fund was as follows:
| | | Year Ended | | | Year Ended | |
| | | October 31, 2018 | | | October 31, 2017 | |
Ordinary income(1) | | $ | 583,714 | | | $ | 588,377 | |
| Long-term capital gain | | | 2,306,685 | | | | — | |
| | | $ | 2,890,399 | | | $ | 588,377 | |
(1) Ordinary income includes short-term capital gains.
9). EVENTS SUBSEQUENT TO YEAR END
Management has evaluated the Fund’s related events and transactions that occurred subsequent to October 31, 2018, through the date of issuance of the Fund’s financial statements. Other than as disclosed below, management has determined that there were no subsequent events requiring recognition or disclosure in the financial statements.
On December 7, 2018, capital gains were declared and paid to shareholders of record on December 6, 2018, as follows:
| | Long-term | Short-term |
| Investor Class | $0.46558 | $0.00020 |
| Institutional Class | $0.45707 | $0.00020 |
On December 27, 2018, income distributions were declared and paid to shareholders of record on December 26, 2018, as follows:
| Investor Class | $ — | |
| Institutional Class | $0.04449547 | |
| NOTES/REPORT OF INDEPENDENT REGISTERED PUBLIC ACCOUNTING FIRM |
Report of Independent Registered Public
Accounting Firm
To the Board of Trustees of Hennessy Funds Trust
and the shareholders of the Hennessy Japan Small Cap Fund
Novato, CA
Opinion on the Financial Statements
We have audited the accompanying statement of assets and liabilities of the Hennessy Japan Small Cap Fund (the “Fund”), a series of Hennessy Funds Trust, including the schedule of investments, as of October 31, 2018, the related statement of operations for the year then ended, the statements of changes in net assets and the financial highlights for each of the two years in the period then ended, and the related notes (collectively referred to as the “financial statements”). In our opinion, the financial statements present fairly, in all material respects, the financial position of the Fund as of October 31, 2018, the results of its operations for the year then ended, and the changes in its net assets and the financial highlights for each of the two years in the period then ended in conformity with accounting principles generally accepted in the United States of America.
The financial highlights for each of the three years in the period ended October 31, 2016 have been audited by other auditors, whose report dated December 22, 2016 expressed unqualified opinions on such financial highlights.
Basis for Opinion
These financial statements are the responsibility of the Fund’s management. Our responsibility is to express an opinion on the Fund’s financial statements based on our audits. We are a public accounting firm registered with the Public Company Accounting Oversight Board (United States) (“PCAOB”) and are required to be independent with respect to the Fund in accordance with the U.S. federal securities laws and the applicable rules and regulations of the Securities and Exchange Commission and the PCAOB. We have served as the auditor of one or more of the funds in the Trust since 2002.
We conducted our audits in accordance with the standards of the PCAOB. Those standards require that we plan and perform the audit to obtain reasonable assurance about whether the financial statements are free of material misstatement, whether due to error or fraud. The Fund is not required to have, nor were we engaged to perform, an audit of its internal control over financial reporting. As part of our audits we are required to obtain an understanding of internal control over financial reporting, but not for the purpose of expressing an opinion on the effectiveness of the Fund’s internal control over financial reporting. Accordingly, we express no such opinion.
Our audits included performing procedures to assess the risks of material misstatement of the financial statements, whether due to error or fraud, and performing procedures that respond to those risks. Such procedures included examining, on a test basis, evidence regarding the amounts and disclosures in the financial statements. Our audits also included evaluating the accounting principles used and significant estimates made by management, as well as evaluating the overall presentation of the financial statements. Our procedures included confirmation of securities owned as of October 31, 2018 by correspondence with the custodian and brokers, or other appropriate auditing procedures where replies from brokers were not received. We believe that our audits provide a reasonable basis for our opinion.
TAIT, WELLER & BAKER LLP
Philadelphia, Pennsylvania
December 27, 2018
| HENNESSY FUNDS | 1-800-966-4354 | |
Trustees and Officers of the Fund (Unaudited)
The business and affairs of the Funds are managed under the direction of the Board of Trustees of the Trust, and the Board of Trustees elects the Officers of the Trust. Beginning in March 2015, the Board of Trustees has from time to time appointed advisers to the Board of Trustees (“Advisers”) with the intention of having qualified individuals serve in an advisory capacity in order to garner experience in the mutual fund and asset management industry and be considered as potential Trustees in the future. There are currently three Advisers: Brian Alexander, Doug Franklin, and Claire Knoles. As Advisers, Mr. Alexander, Mr. Franklin, and Ms. Knoles attend meetings of the Board of Trustees and act as non-voting participants. Information pertaining to the Trustees, Advisers, and the Officers of the Trust is set forth below. The Trustees and Officers serve until their successors are duly elected and qualified or until their earlier death, resignation, or removal. Each Trustee oversees the 16 Hennessy Funds. Unless otherwise indicated, the address of all persons listed below is 7250 Redwood Boulevard, Suite 200, Novato, CA 94945. The Fund’s Statement of Additional Information includes more information about the persons listed below and is available, without charge, upon request by calling 1-800-966-4354.
| | | | Other |
| | | | Directorships |
| | | | Held Outside |
| Name, (Year of Birth), | | | of Fund |
| and Position Held | Start Date | Principal Occupation(s) | Complex During |
with the Trust | of Service | During Past Five Years | Past Five Years(1) |
| | |
| Disinterested Trustees and Advisers | |
| | | | |
| J. Dennis DeSousa | January 1996 | Mr. DeSousa is a real estate investor. | None. |
| (1936) | | | |
| Trustee | | | |
| | | | |
| Robert T. Doyle | January 1996 | Mr. Doyle has been the Sheriff of | None. |
| (1947) | | Marin County, California since 1996. | |
| Trustee | | | |
| | | | |
| Gerald P. Richardson | May 2004 | Mr. Richardson is an independent | None. |
| (1945) | | consultant in the securities industry. | |
| Trustee | | | |
| | | | |
| Brian Alexander | March 2015 | Mr. Alexander has worked for the | None. |
| (1981) | | Sutter Health organization since | |
| Adviser to the Board | | 2011 in various positions. He has | |
| | | served as the Chief Executive Officer | |
| | | of the Sutter Roseville Medical | |
| | | Center since 2018. From 2016 through | |
| | | 2018, he served as the Vice President | |
| | | of Strategy for the Sutter Health Valley | |
| | | Area, which includes 11 hospitals, | |
| | | 13 ambulatory surgery centers, | |
| | | 16,000 employees, and 1,900 physicians. | |
| | | From 2013 through 2016, Mr. Alexander | |
| | | served as Sutter Novato Community | |
| | | Hospital’s Chief Administrative Officer, | |
| | | and from 2011 through 2012, he | |
| | | served as a Director of Strategy | |
| | | within Sutter’s West Bay Region. | |
| TRUSTEES AND OFFICERS OF THE FUND |
| | | | Other |
| | | | Directorships |
| | | | Held Outside |
| Name, (Year of Birth), | | | of Fund |
| and Position Held | Start Date | Principal Occupation(s) | Complex During |
with the Trust | of Service | During Past Five Years | Past Five Years(1) |
| | | | |
| Doug Franklin | March 2016 | Mr. Franklin is a retired insurance | None. |
| (1964) | | industry executive. From 1987 | |
| Adviser to the Board | | through 2015, he was employed | |
| | | by the Allianz-Fireman’s Fund | |
| | | Insurance Company in various | |
| | | positions, including as its Chief | |
| | | Actuary and Chief Risk Officer. | |
| | | | |
| Claire Knoles | December 2015 | Ms. Knoles is a founder of Kiosk and | None. |
| (1974) | | has served as its Chief Operating | |
| Adviser to the Board | | Officer since 2004. Kiosk is a full | |
| | | service marketing agency with | |
| | | offices in the San Francisco Bay | |
| | | Area, Toronto, and Liverpool, UK. | |
| | | | |
Interested Trustee(2) | | | |
| | | | |
| Neil J. Hennessy | January 1996 as | Mr. Neil Hennessy has been employed | Hennessy |
| (1956) | a Trustee and | by Hennessy Advisors, Inc. since | Advisors, Inc. |
| Trustee, Chairman of | June 2008 as | 1989 and currently serves as its | |
| the Board, Chief | an Officer | Chairman and Chief Executive Officer. | |
| Investment Officer, | | | |
| Portfolio Manager, | | | |
| and President | | | |
| Name, (Year of Birth), | | |
| and Position Held | Start Date | Principal Occupation(s) |
with the Trust | of Service | During Past Five Years |
| | | |
| Officers | | |
| | | |
| Teresa M. Nilsen | January 1996 | Ms. Nilsen has been employed by Hennessy Advisors, Inc. |
| (1966) | | since 1989 and currently serves as its President, Chief Operating |
| Executive Vice President | | Officer, and Secretary. |
| and Treasurer | | |
| | | |
| Daniel B. Steadman | March 2000 | Mr. Steadman has been employed by Hennessy Advisors, Inc. |
| (1956) | | since 2000 and currently serves as its Executive Vice President. |
| Executive Vice President | | |
| and Secretary | | |
| | | |
| Brian Carlson | December 2013 | Mr. Carlson has been employed by Hennessy Advisors, Inc. |
| (1972) | | since December 2013 and currently serves as its Chief |
| Senior Vice President | | Compliance Officer and Senior Vice President. |
| and Head of Distribution | | |
| | | |
| Jennifer Cheskiewicz | June 2013 | Ms. Cheskiewicz has been employed by Hennessy Advisors, Inc. |
(1977)(3) | | as its General Counsel since June 2013. |
| Senior Vice President and | | |
| Chief Compliance Officer | | |
| HENNESSY FUNDS | 1-800-966-4354 | |
| Name, (Year of Birth), | | |
| and Position Held | Start Date | Principal Occupation(s) |
with the Trust | of Service | During Past Five Years |
| | | |
| David Ellison | October 2012 | Mr. Ellison has been employed by Hennessy Advisors, Inc. since |
(1958)(4) | | October 2012. He has served as a Portfolio Manager of the |
| Senior Vice President | | Hennessy Large Cap Financial Fund and the Hennessy Small |
| and Portfolio Manager | | Cap Financial Fund since inception. Mr. Ellison also served as a |
| | | Portfolio Manager of the Hennessy Technology Fund from its |
| | | inception until February 2017. Mr. Ellison served as Director, |
| | | CIO and President of FBR Fund Advisers, Inc. from December |
| | | 1999 to October 2012. |
| | | |
| Ryan C. Kelley | March 2013 | Mr. Kelley has been employed by Hennessy Advisors, Inc. since |
(1972)(5) | | October 2012. He has served as a Portfolio Manager of the |
| Senior Vice President | | Hennessy Gas Utility Fund, the Hennessy Large Cap Financial |
| and Portfolio Manager | | Fund, and the Hennessy Small Cap Financial Fund since |
| | | October 2014. He served as Co-Portfolio Manager of the same |
| | | funds from March 2013 through September 2014, and as a |
| | | Portfolio Analyst for the Hennessy Funds from October 2012 |
| | | through February 2013. Mr. Kelley has also served as a Portfolio |
| | | Manager of the Hennessy Cornerstone Growth Fund, the |
| | | Hennessy Cornerstone Mid Cap 30 Fund, the Hennessy |
| | | Cornerstone Large Growth Fund, and the Hennessy |
| | | Cornerstone Value Fund since February 2017, as a Co-Portfolio |
| | | Manager of the Hennessy Technology Fund since February |
| | | 2017, and as a Portfolio Manager of the Hennessy Total Return |
| | | Fund and the Hennessy Balanced Fund since May 2018. |
| | | Mr. Kelley served as Portfolio Manager of FBR Fund Advisers, |
| | | Inc. from January 2008 to October 2012. |
| | | |
| Tania Kelley | October 2003 | Ms. Kelley has been employed by Hennessy Advisors, Inc. |
| (1965) | | since October 2003. |
| Senior Vice President | | |
| and Head of Marketing | | |
| | | |
| Daniel P. Hennessy | December 2016 | Mr. Daniel Hennessy has been employed by Hennessy Advisors, |
| (1990) | | Inc. since 2015. He has served as an Associate Analyst or |
| Vice President | | Analyst of the Hennessy Technology Fund since February 2017. |
| and Analyst | | Mr. Daniel Hennessy previously served as a Mutual Fund |
| | | Specialist at U.S. Bancorp Fund Services, LLC (now doing |
| | | business as U.S. Bank Global Fund Services) from November |
| | | 2014 to July 2015. Prior to that, he attended the University of |
| | | San Diego, where he earned a degree in Political Science. |
_______________
(1) | Messrs. DeSousa, Doyle, N. Hennessy, and Richardson previously served on the Board of Directors of Hennessy Mutual Funds, Inc. (“HMFI”), The Hennessy Funds, Inc. (“HFI”), and Hennessy SPARX Funds Trust (“HSFT”). Pursuant to an internal reorganization effective as of February 28, 2014, the series of HFMI, HFI, and HSFT were reorganized into corresponding series of the Trust that mirrored them. Subsequent to the reorganization, HFMI, HFI, and HSFT were dissolved. |
(2) | Mr. N. Hennessy is considered an “interested person,” as defined in the Investment Company Act of 1940, as amended, because he is an officer of the Hennessy Funds. |
(3) | The address of this officer is 4800 Bee Caves Road, Suite 100, Austin, TX 78746. |
(4) | The address of this officer is 101 Federal Street, Suite 1900, Boston, MA 02110. |
(5) | The address of this officer is 1340 Environ Way, Suite 332, Chapel Hill, NC 27517. |
| TRUSTEES AND OFFICERS OF THE FUND |
(This Page Intentionally Left Blank.)
| HENNESSY FUNDS | 1-800-966-4354 | |
Expense Example (Unaudited)
October 31, 2018
As a shareholder of the Fund, you incur ongoing costs, including management fees, service fees, and other Fund expenses. This Example is intended to help you understand your ongoing costs (in dollars) of investing in the Fund and to compare these costs with the ongoing costs of investing in other mutual funds. The Example is based on an investment of $1,000 invested at the beginning of the period and held for the entire period from May 1, 2018, through October 31, 2018.
Actual Expenses
The first line of the table below under the “Investor Class” and “Institutional Class” headings provides information about actual account values and actual expenses. Although the Fund charges no sales loads or transaction fees, you will be assessed fees for outgoing wire transfers, returned checks and stop payment orders at prevailing rates charged by U.S. Bank Global Fund Services, the Fund’s transfer agent. If you request that a redemption be made by wire transfer, currently a $15 fee is charged by the Fund’s transfer agent. IRA accounts will be charged a $15 annual maintenance fee. The example below includes, but is not limited to, management fees, shareholder servicing fees, fund accounting, custody, and transfer agent fees. However, the example below does not include portfolio trading commissions and related expenses, and other extraordinary expenses as determined under generally accepted accounting principles. You may use the information in this line, together with the amount you invested, to estimate the expenses that you paid over the period. Simply divide your account value by $1,000 (for example, an $8,600 account value divided by $1,000 = 8.6), then multiply the result by the number in the first line of the table under the “Investor Class” or “Institutional Class” headings in the column entitled “Expenses Paid During Period” to estimate the expenses you paid on your account during this period.
Hypothetical Example for Comparison Purposes
The second line of the table below under the “Investor Class” and “Institutional Class” headings provides information about hypothetical account values and hypothetical expenses based on the Fund’s actual expense ratios and an assumed rate of return of 5% per year before expenses, which is not the Fund’s actual return. The hypothetical account values and expenses may not be used to estimate the actual ending account balance or expenses you paid for the period. You may use this information to compare the ongoing costs of investing in the Fund and other funds. To do so, compare this 5% hypothetical example with the 5% hypothetical examples that appear in the shareholder reports of the other funds. Please note that the expenses shown in the table are meant to highlight your ongoing costs only. Therefore, the second line of the table under the “Investor Class” and “Institutional Class” headings is useful in comparing ongoing costs only, and will not help you determine the relative total costs of owning different funds.
| | | | Expenses Paid |
| | Beginning | Ending | During Period(1) |
| | Account Value | Account Value | May 1, 2018 – |
| | May 1, 2018 | October 31, 2018 | October 31, 2018 |
| Investor Class | | | |
| Actual | $1,000.00 | $ 914.60 | $7.09 |
| Hypothetical (5% return before expenses) | $1,000.00 | $1,017.80 | $7.48 |
| | | | |
| Institutional Class | | | |
| Actual | $1,000.00 | $ 916.00 | $5.07 |
| Hypothetical (5% return before expenses) | $1,000.00 | $1,019.91 | $5.35 |
(1) | Expenses are equal to the Fund’s annualized expense ratio of 1.47% for Investor Class shares or 1.05% for Institutional Class shares, as applicable, multiplied by the average account value over the period, multiplied by 184/365 days (to reflect one-half year period). |
| HENNESSY FUNDS | 1-800-966-4354 | |
How to Obtain a Copy of the Fund’s
Proxy Voting Policy and Proxy Voting Records
A description of the policies and procedures the Fund uses to determine how to vote proxies relating to portfolio securities is available without charge: (1) by calling 1-800-966-4354; (2) on the Hennessy Funds’ website at www.hennessyfunds.com/proxy-voting/voting-policy; or (3) on the U.S. Securities and Exchange Commission’s (the “SEC”) website at www.sec.gov. The Fund’s proxy voting record is available without charge on both the Hennessy Funds’ website at www.hennessyfunds.com/proxy-voting/voting-record and the SEC’s website at www.sec.gov no later than August 31 for the prior 12 months ending June 30.
Quarterly Filings on Form N-Q
The Fund files a complete schedule of portfolio holdings with the SEC for the first and third quarters of each fiscal year on Form N-Q. The Fund’s Forms N-Q are available on the SEC’s website at www.sec.gov. Information included in the Fund’s Forms N-Q will also be available upon request by calling 1-800-966-4354.
Federal Tax Distribution Information
(Unaudited)
For fiscal year 2018, certain dividends paid by the Fund may be subject to a maximum tax rate of 23.8%, as provided for by the Jobs and Growth Tax Relief Reconciliation Act of 2003. The percentage of dividends declared from ordinary income designated as qualified dividend income was 100.00%.
For corporate shareholders, the percent of ordinary income distributions that qualified for the corporate dividends received deduction for fiscal year 2018 was 0.00%.
The percentage of taxable ordinary income distributions that were designated as short-term capital gain distributions under Section 871(k)(2)(C) of the Internal Revenue Code of 1986, as amended, for the Fund was 0.00%.
For the year ended October 31, 2018, the Fund earned foreign source income and paid foreign taxes, as noted below, which it intends to pass through to its shareholders pursuant to Section 853 of the Internal Revenue Code.
| | Gross Foreign Income | Foreign Tax Paid |
| Japan | $3,753,180 | $375,218 |
Important Notice Regarding Delivery
of Shareholder Documents
To help keep the Fund’s costs as low as possible, we generally deliver a single copy of shareholder reports, proxy statements, and prospectuses to shareholders who share an address and have the same last name. This process does not apply to account statements. You may request an individual copy of a shareholder document at any time. If you would like to receive separate mailings of shareholder documents, please call U.S. Bank Global Fund Services at 1-800-261-6950 or 1-414-765-4124, and individual delivery will begin within 30 days of your request. If your account is held through a financial institution or other intermediary, please contact such intermediary directly to request individual delivery.
| PROXY VOTING — PRIVACY POLICY |
Privacy Policy
We collect the following non-public personal information about you:
| | • | information we receive from you on or in applications or other forms, correspondence, or conversations, including, but not limited to, your name, address, phone number, social security number, assets, income, and date of birth; and |
| | | |
| | • | information about your transactions with us, our affiliates, or others, including, but not limited to, your account number and balance, payment history, parties to transactions, cost basis information, and other financial information. |
We do not disclose any non-public personal information about our current or former shareholders to non-affiliated third parties, except as permitted by law. For example, we are permitted by law to disclose all of the information we collect, as described above, to our Transfer Agent to process your transactions. Furthermore, we restrict access to your non-public personal information to those persons who require such information to provide products or services to you. We maintain physical, electronic, and procedural safeguards that comply with federal standards to guard your non-public personal information.
In the event that you hold shares of the Fund through a financial intermediary, including, but not limited to, a broker-dealer, bank, or trust company, the privacy policy of your financial intermediary would govern how your non-public personal information will be shared with non-affiliated third parties.
| HENNESSY FUNDS | 1-800-966-4354 | |
For information, questions or assistance, please call
The Hennessy Funds
1-800-966-4354 or 1-415-899-1555
INVESTMENT ADVISOR
Hennessy Advisors, Inc.
7250 Redwood Boulevard, Suite 200
Novato, California 94945
ADMINISTRATOR,
TRANSFER AGENT,
DIVIDEND PAYING AGENT, &
SHAREHOLDER SERVICING AGENT
U.S. Bancorp Fund Services, LLC
d/b/a U.S. Bank Global Fund Services
P.O. Box 701
Milwaukee, Wisconsin 53201-0701
CUSTODIAN
U.S. Bank N.A.
Custody Operations
1555 North River Center Drive, Suite 302
Milwaukee, Wisconsin 53212
TRUSTEES
Neil J. Hennessy
Robert T. Doyle
J. Dennis DeSousa
Gerald P. Richardson
COUNSEL
Foley & Lardner LLP
777 East Wisconsin Avenue
Milwaukee, Wisconsin 53202-5306
INDEPENDENT REGISTERED
PUBLIC ACCOUNTING FIRM
Tait, Weller & Baker LLP
Two Liberty Place
50 South 16th Street, Suite 2900
Philadelphia, Pennsylvania 19102-2529
DISTRIBUTOR
Quasar Distributors, LLC
777 East Wisconsin Avenue
Milwaukee, Wisconsin 53202
hennessyfunds.com | 1-800-966-4354
This report has been prepared for shareholders and may be distributed to
others only if preceded or accompanied by a current prospectus.
ANNUAL REPORT
OCTOBER 31, 2018
HENNESSY LARGE CAP
FINANCIAL FUND
Investor Class HLFNX
Institutional Class HILFX
hennessyfunds.com | 1-800-966-4354
(This Page Intentionally Left Blank.)
Contents
| Letter to Shareholders | 2 |
| Performance Overview | 4 |
| Financial Statements | |
| Schedule of Investments | 7 |
| Statement of Assets and Liabilities | 10 |
| Statement of Operations | 11 |
| Statements of Changes in Net Assets | 13 |
| Financial Highlights | 14 |
| Notes to the Financial Statements | 17 |
| Report of Independent Registered Public Accounting Firm | 25 |
| Trustees and Officers of the Fund | 26 |
| Expense Example | 30 |
| Proxy Voting Policy and Proxy Voting Records | 32 |
| Quarterly Schedule of Investments | 32 |
| Federal Tax Distribution Information | 32 |
| Important Notice Regarding Delivery of Shareholder Documents | 32 |
| Privacy Policy | 33 |
| HENNESSY FUNDS | 1-800-966-4354 | |
December 2018
Dear Hennessy Funds Shareholder:
Over the past year, we have witnessed the return of market volatility. U.S. stocks still registered healthy gains, bolstered by the impact on corporate profits of the successful passage of the tax reform bill in December 2017. However, concerns over potential trade disruptions, especially between the U.S. and China, and worries over higher short-term interest rates, which many believe could possibly trigger a recession down the road, put downward pressure on equity valuations.
The U.S. economy performed well over the period, and actually achieved an acceleration in GDP growth to over 3% on an annualized basis in the second and third quarters of calendar year 2018. During the past year, companies continued to hire workers, adding over 200,000 jobs per month on average, sending the unemployment rate down to 3.7% in October, which is the lowest it has been since 1969. Consumer confidence is high and still rising, and corporate profits reached record levels in the third quarter of calendar year 2018, posting a year-over-year increase of 26% for the companies in the S&P 500 Index.
The Federal Reserve, confident about the strength of the economy and mindful of a tight labor market, raised short-term interest rates four times over the last year, by a quarter point each time. Long-term bond yields also rose, driven higher primarily by evidence of faster wage growth, pushing the U.S. 10-year Treasury bond over 3% for the first time since 2013.
As I write this, we are experiencing the market’s 20th downturn since 2010. I have been saying that every bull market experiences volatility and pullbacks. Many financial commentators think this bull market is “long in the tooth.” I do not agree with them. I believe stock valuations are still very reasonable. The prospective price to earnings multiple for the Dow Jones Industrial Average has come down from almost 20x at the end of 2017 to 16x, just above its 10-year average of 15x. The prospective PE multiple for the S&P 500 Index has also come down, from 20x to 17x, and compares favorably to its 10-year average of 16x.
Cash, meanwhile, continues to build up on corporate balance sheets. The companies in the S&P 500 Index reported a total of over $5.4 trillion in cash and marketable securities in their latest filings. Companies have been spending some of their cash, increasing their investment spending and laying the groundwork for future earnings growth. However, they have also been returning capital to shareholders. S&P 500 Index companies announced $433.6 billion in share repurchases during the second quarter of calendar year 2018, nearly doubling the previous record of $242.1 billion set in the first quarter. Companies are also raising their dividends.
In addition, I believe the Federal Reserve will take care not to raise interest rates too high or too fast and endanger the economic expansion. While wage growth has risen to over 3% in October, other measures of inflationary pressure, such as the Consumer Price Index and the Producer Price Index, still show prices increasing at a more moderate pace, closer to 2%. Given continued evidence of modest rates of inflation, I believe the Fed will be able to maintain its gradual pace of interest rate hikes.
Finally and importantly, I still see no signs of euphoria in this market. In my opinion, the enthusiasm present earlier in the year, which followed the significant reduction in corporate income tax rates, has largely evaporated, and it has been replaced with anxiety
over higher interest rates and their potential impact on growth. In the past, I have likened the current bull market to that of 1982-2000, and I still believe this comparison holds true. I am confident in the strength of the market today and believe the economy will continue to grow in the coming year, albeit at a more moderate pace.
Thank you for your continued confidence and investment in the Hennessy Funds. If you have any questions or would like to speak with us directly, please don’t hesitate to call us at (800) 966-4354.
Best regards,
Neil J. Hennessy
President and Chief Investment Officer
Past performance does not guarantee future results.
Mutual fund investing involves risk. Principal loss is possible.
Opinions expressed are those of Neil Hennessy and are subject to change, are not guaranteed, and should not be considered investment advice.
The Dow Jones Industrial Average and S&P 500 Index are commonly used to measure the performance of U.S. stocks. One cannot invest directly in an index.
PE, or price to earnings, is a valuation measure and is calculated by dividing a company’s market price per share by its earnings per share. Earnings growth is not a measure of a fund’s future performance.
| HENNESSY FUNDS | 1-800-966-4354 | |
Performance Overview (Unaudited)
CHANGE IN VALUE OF $10,000 INVESTMENT
This graph illustrates the performance of an initial investment of $10,000 made in the Fund ten years ago and assumes the reinvestment of dividends.
AVERAGE ANNUAL TOTAL RETURN FOR PERIODS ENDED OCTOBER 31, 2018
| | One | Five | Ten |
| | Year | Years | Years |
| Hennessy Large Cap Financial Fund – | | | |
| Investor Class (HLFNX) | 1.82% | 8.31% | 9.92% |
| Hennessy Large Cap Financial Fund – | | | |
Institutional Class (HILFX)(1) | 2.16% | 8.59% | 10.07% |
Russell 1000® Financial Services Index | 3.72% | 11.52% | 10.68% |
Russell 1000® Index | 6.98% | 11.05% | 13.42% |
Expense ratios: 1.82% (Investor Class); 1.51% (Institutional Class)
(1) | The inception date of Institutional Class shares is June 15, 2015. Performance shown prior to the inception of Institutional Class shares reflects the performance of Investor Class shares and includes expenses that are not applicable to, and are higher than, those of Institutional Class shares. |
Performance data quoted represents past performance; past performance does not guarantee future results. The investment return and principal value of an investment will fluctuate so that an investor’s shares, when redeemed, may be worth more or less than their original cost. The performance table does not reflect the deduction of taxes that a shareholder would pay on Fund distributions or the redemption of Fund shares. Current performance of the Fund may be lower or higher than the performance quoted. Performance data current to the most recent month end may be obtained by visiting www.hennessyfunds.com. Performance for periods on or prior to October 26, 2012, is that of the FBR Large Cap Financial Fund.
The Russell 1000® Financial Services Index is commonly used to measure the performance of large-capitalization financial sector stocks. The Russell 1000® Index is commonly used to measure the performance of U.S. large-capitalization stocks. One cannot invest directly in an index.
Frank Russell Company (“Russell”) is the source and owner of the trademarks, service marks, and copyrights related to the Russell Indexes. Russell® is a trademark of Frank Russell Company. Neither Russell nor its licensors accept any liability for any errors or omissions in the Russell Indexes or Russell ratings or underlying data and no party may rely on any Russell Indexes or Russell ratings or underlying data contained in this
communication. No further distribution of Russell data is permitted without Russell’s express written consent. Russell does not promote, sponsor, or endorse the content of this communication.
The expense ratios presented are from the most recent prospectus. The expense ratios for the current reporting period are available in the Financial Highlights section of this report.
PERFORMANCE NARRATIVE
Portfolio Managers David H. Ellison and Ryan C. Kelley
Performance:
For the 12-month period ended October 31, 2018, the Investor Class of the Hennessy Large Cap Financial Fund returned 1.82%, underperforming the Russell 1000® Financial Services Index (the Fund’s primary benchmark) and the Russell 1000® Index, which returned 3.72% and 6.98%, respectively, for the same period.
The Fund’s underperformance relative to its primary benchmark can be attributed predominantly to stock selection, particularly in the Diversified Financials industry group. This underperformance was offset to some degree by positive contributions to relative performance from sub-industry allocation. The Fund’s overweight position in Software and Services contributed most significantly to relative performance, with payment services companies including Mastercard, Inc., Visa, Inc., PayPal Holdings, Inc., and Global Payments, Inc. performing well. The Fund’s underweight position in Insurance also helped relative performance. Among the holdings in the Diversified Financials industry group, State Street Corp., Morgan Stanley, and Goldman Sachs Group, Inc. performed poorly over the period.
The Fund continues to hold all of the companies mentioned.
Portfolio Strategy:
Historically, the Fund has tilted its investments more heavily toward regional banks and diversified global banks and to a lesser degree toward insurance companies, real estate companies, and asset managers. However, we have increased our exposure to electronic payment companies over the last few years. We believe that growth in the electronic payment industry will continue as the use of mobile payment methods spreads. In general, we seek companies that we believe have high-quality management teams, less complex business models, and the prospect of sustainable earnings growth over time. We also try to identify companies that we expect will do well in the current environment, which is characterized by low-but-rising interest rates, competitive loan markets, and growing competition from electronic payment platforms. We are less interested in focusing solely on companies that appear to promise an increase in profitability when interest rates rise, loan demand increases, or pricing becomes more favorable, as we believe the timing of these macro industry dynamics is difficult to predict.
Investment Commentary:
We continue to believe that the outlook for large-cap financial companies is good. The macroeconomic environment in the United States is positive. The U.S. economy is growing at a healthy rate, unemployment is low, and growth in both consumption and capital spending has accelerated over the last 12 months. Corporate earnings have risen significantly over the first nine months of 2018, helped, in part, by lower taxes. We expect earnings growth to be slower next year yet remain positive, driven primarily by continued steady economic growth.
| HENNESSY FUNDS | 1-800-966-4354 | |
The Fund remains overweight fee-based electronic service providers because we believe these companies will continue to grow their revenues and earnings, driven by the global shift towards cashless forms of payment. In our opinion, the outlook for larger banks is also favorable, with the prospect of higher net interest margins as the Federal Reserve continues to increase short-term interest rates. In addition, we believe many large banks have been slow to implement technology and operate too many branches, and management teams are now recognizing that they have an opportunity over the next decade to increase efficiency and drive earnings growth, regardless of the rate of loan growth or level of interest rates. In addition, banks are changing the way they do business, constructing their balance sheets with less risk and moving to increase their fee-based businesses.
_______________
Opinions expressed are those of the Portfolio Managers as of the date written and are subject to change, are not guaranteed, and should not be considered investment advice or an indication of trading intent.
The Fund is non-diversified, meaning it may concentrate its assets in fewer individual holdings than a diversified fund, making it more exposed to individual stock volatility than a diversified fund. Investments are focused in the financial services industry; sector funds may be subject to a higher degree of market risk. The Fund invests in medium-sized companies, which may have limited liquidity and greater volatility compared to larger companies. Please see the Fund’s prospectus for a more complete discussion of these and other risks.
References to specific securities should not be considered a recommendation to buy or sell any security. Fund holdings and sector allocations are subject to change. Please refer to the Schedule of Investments included in this report for additional portfolio information.
Earnings growth is not a measure of the Fund’s future performance.
| PERFORMANCE OVERVIEW/SCHEDULE OF INVESTMENTS |
Financial Statements
Schedule of Investments as of October 31, 2018 |
HENNESSY LARGE CAP FINANCIAL FUND
(% of Net Assets)
| TOP TEN HOLDINGS (EXCLUDING MONEY MARKET FUNDS) | % NET ASSETS |
| Visa, Inc., Class A | 5.25% |
| The PNC Financial Services Group, Inc. | 5.16% |
| Mastercard, Inc., Class A | 5.16% |
| JPMorgan Chase & Co. | 5.03% |
| Bank of America Corp. | 5.02% |
| Capital One Financial Corp. | 5.02% |
| Berkshire Hathaway, Inc., Class B | 4.94% |
| PayPal Holdings, Inc. | 4.90% |
| Citigroup, Inc. | 4.27% |
| Moody’s Corp. | 4.09% |
Note: For presentation purposes, the Fund has grouped some of the industry categories. For purposes of categorizing securities for compliance with section 8(b)(1) of the Investment Company Act of 1940, as amended, the Fund uses more specific industry classifications.
The Global Industry Classification Standard (GICS®) was developed by and is the exclusive property and a service mark of MSCI, Inc. and Standard & Poor Financial Services LLC. It has been licensed for use by the Hennessy Funds.
| HENNESSY FUNDS | 1-800-966-4354 | |
| COMMON STOCKS – 90.11% | | Number | | | | | | % of | |
| | | of Shares | | | Value | | | Net Assets | |
| Communication Services – 2.59% | | | | | | | | | |
| Zillow Group, Inc. (a) | | | 32,000 | | | $ | 1,291,840 | | | | 2.59 | % |
| | | | | | | | | | | | | |
| Financials – 63.42% | | | | | | | | | | | | |
| American Express Co. | | | 9,000 | | | | 924,570 | | | | 1.85 | % |
| Bank of America Corp. | | | 91,000 | | | | 2,502,500 | | | | 5.02 | % |
| Berkshire Hathaway, Inc., Class B (a) | | | 12,000 | | | | 2,463,360 | | | | 4.94 | % |
| Capital One Financial Corp. | | | 28,000 | | | | 2,500,400 | | | | 5.02 | % |
| Citigroup, Inc. | | | 32,500 | | | | 2,127,450 | | | | 4.27 | % |
| Citizens Financial Group, Inc. | | | 47,000 | | | | 1,755,450 | | | | 3.52 | % |
| Fifth Third Bancorp | | | 20,000 | | | | 539,800 | | | | 1.08 | % |
| JPMorgan Chase & Co. | | | 23,000 | | | | 2,507,460 | | | | 5.03 | % |
| KeyCorp | | | 60,000 | | | | 1,089,600 | | | | 2.19 | % |
| Moody’s Corp. | | | 14,000 | | | | 2,036,720 | | | | 4.09 | % |
| Morgan Stanley | | | 34,000 | | | | 1,552,440 | | | | 3.11 | % |
| MSCI, Inc. | | | 7,500 | | | | 1,127,850 | | | | 2.26 | % |
| State Street Corp. | | | 14,000 | | | | 962,500 | | | | 1.93 | % |
| SunTrust Banks, Inc. | | | 27,000 | | | | 1,691,820 | | | | 3.39 | % |
| The Charles Schwab Corp. | | | 39,000 | | | | 1,803,360 | | | | 3.62 | % |
| The Goldman Sachs Group, Inc. | | | 5,500 | | | | 1,239,535 | | | | 2.49 | % |
| The PNC Financial Services Group, Inc. | | | 20,000 | | | | 2,569,800 | | | | 5.16 | % |
| U.S. Bancorp (c) | | | 22,000 | | | | 1,149,940 | | | | 2.31 | % |
| Wells Fargo & Co. | | | 20,000 | | | | 1,064,600 | | | | 2.14 | % |
| | | | | | | | 31,609,155 | | | | 63.42 | % |
| | | | | | | | | | | | | |
| Information Technology – 24.10% | | | | | | | | | | | | |
| Global Payments, Inc. | | | 15,000 | | | | 1,713,450 | | | | 3.44 | % |
| Mastercard, Inc., Class A | | | 13,000 | | | | 2,569,710 | | | | 5.16 | % |
| PayPal Holdings, Inc. (a) | | | 29,000 | | | | 2,441,510 | | | | 4.90 | % |
| SS&C Technologies Holdings, Inc. | | | 7,500 | | | | 383,700 | | | | 0.77 | % |
| Total System Services, Inc. | | | 17,000 | | | | 1,549,550 | | | | 3.11 | % |
| Visa, Inc., Class A | | | 19,000 | | | | 2,619,150 | | | | 5.25 | % |
| Worldpay, Inc. (a) | | | 8,000 | | | | 734,720 | | | | 1.47 | % |
| | | | | | | | 12,011,790 | | | | 24.10 | % |
| | | | | | | | | | | | | |
| Total Common Stocks | | | | | | | | | | | | |
| (Cost $39,311,908) | | | | | | | 44,912,785 | | | | 90.11 | % |
The accompanying notes are an integral part of these financial statements.
| SHORT-TERM INVESTMENTS – 12.39% | | Number | | | | | | % of | |
| | | of Shares | | | Value | | | Net Assets | |
| Money Market Funds – 12.39% | | | | | | | | | |
| Fidelity Government Portfolio, Institutional Class, 2.06% (b) | | | 2,436,000 | | | $ | 2,436,000 | | | | 4.89 | % |
| Morgan Stanley Institutional Liquidity Fund Government Portfolio, | | | | | | | | | | | | |
| Institutional Class, 2.05% (b) | | | 1,302,912 | | | | 1,302,912 | | | | 2.61 | % |
| The Government & Agency Portfolio, Institutional Class, 2.08% (b) | | | 2,436,000 | | | | 2,436,000 | | | | 4.89 | % |
| | | | | | | | | | | | | |
| Total Short-Term Investments | | | | | | | | | | | | |
| (Cost $6,174,912) | | | | | | | 6,174,912 | | | | 12.39 | % |
| | | | | | | | | | | | | |
| Total Investments | | | | | | | | | | | | |
| (Cost $45,486,820) – 102.50% | | | | | | | 51,087,697 | | | | 102.50 | % |
| Liabilities in Excess of Other Assets – (2.50)% | | | | | | | (1,244,795 | ) | | | (2.50 | )% |
| | | | | | | | | | | | | |
TOTAL NET ASSETS – 100.00% | | | | | | $ | 49,842,902 | | | | 100.00 | % |
Percentages are stated as a percent of net assets.
| (a) | Non-income producing security. |
| (b) | The rate listed is the fund’s seven-day yield as of October 31, 2018. |
| (c) | Investment in affiliated security. Quasar Distributors, LLC, which serves as the Fund’s distributor, is a subsidiary of U.S. Bancorp. Details of transactions with this affiliated company for the year ended October 31, 2018, are as follows: |
| | Issuer | | U.S. Bancorp | | |
| | Beginning Cost | | $ | 838,120 | | |
| | Purchase Cost | | $ | 1,155,804 | | |
| | Sales Cost | | $ | (848,280 | ) | |
| | Ending Cost | | $ | 1,145,644 | | |
| | Dividend Income | | $ | 21,240 | | |
| | Net Change in | | | | | |
| | Unrealized Depreciation | | $ | (82,044 | ) | |
| | Realized Gain | | $ | 50,621 | | |
| | Shares | | | 22,000 | | |
| | Market Value | | $ | 1,149,940 | | |
Summary of Fair Value Exposure at October 31, 2018
The following is a summary of the inputs used to value the Fund’s net assets as of October 31, 2018 (See Note 3 in the accompanying notes to the financial statements):
| Common Stocks | | Level 1 | | | Level 2 | | | Level 3 | | | Total | |
| Communication Services | | $ | 1,291,840 | | | $ | — | | | $ | — | | | $ | 1,291,840 | |
| Financials | | | 31,609,155 | | | | — | | | | — | | | | 31,609,155 | |
| Information Technology | | | 12,011,790 | | | | — | | | | — | | | | 12,011,790 | |
| Total Common Stocks | | $ | 44,912,785 | | | $ | — | | | $ | — | | | $ | 44,912,785 | |
| Short-Term Investments | | | | | | | | | | | | | | | | |
| Money Market Funds | | $ | 6,174,912 | | | $ | — | | | $ | — | | | $ | 6,174,912 | |
| Total Short-Term Investments | | $ | 6,174,912 | | | $ | — | | | $ | — | | | $ | 6,174,912 | |
| Total Investments | | $ | 51,087,697 | | | $ | — | | | $ | — | | | $ | 51,087,697 | |
The accompanying notes are an integral part of these financial statements.
| HENNESSY FUNDS | 1-800-966-4354 | |
Financial Statements
Statement of Assets and Liabilities as of October 31, 2018 |
| ASSETS: | | | |
| Investments in unaffiliated securities, at value (cost $44,341,176) | | $ | 49,937,757 | |
| Investments in affiliated securities, at value (cost $1,145,644) | | | 1,149,940 | |
| Total investments in securities, at value (cost $45,486,820) | | | 51,087,697 | |
| Dividends and interest receivable | | | 55,963 | |
| Receivable for fund shares sold | | | 33,877 | |
| Receivable for securities sold | | | 246,097 | |
| Prepaid expenses and other assets | | | 15,197 | |
| Total Assets | | | 51,438,831 | |
| | | | | |
| LIABILITIES: | | | | |
| Payable for securities purchased | | | 1,479,002 | |
| Payable for fund shares redeemed | | | 19,521 | |
| Payable to advisor | | | 39,198 | |
| Payable to administrator | | | 4,590 | |
| Payable to auditor | | | 21,900 | |
| Accrued distribution fees | | | 8,586 | |
| Accrued service fees | | | 3,576 | |
| Accrued interest payable | | | 91 | |
| Accrued trustees fees | | | 5,960 | |
| Accrued expenses and other payables | | | 13,505 | |
| Total Liabilities | | | 1,595,929 | |
| NET ASSETS | | $ | 49,842,902 | |
| | | | | |
| NET ASSETS CONSIST OF: | | | | |
| Capital stock | | $ | 43,876,268 | |
| Total distributable earnings | | | 5,966,634 | |
| Total Net Assets | | $ | 49,842,902 | |
| | | | | |
| NET ASSETS | | | | |
| Investor Class: | | | | |
| Shares authorized (no par value) | | Unlimited | |
| Net assets applicable to outstanding Investor Class shares | | $ | 40,989,982 | |
| Shares issued and outstanding | | | 1,912,926 | |
| Net asset value, offering price and redemption price per share | | $ | 21.43 | |
| | | | | |
| Institutional Class: | | | | |
| Shares authorized (no par value) | | Unlimited | |
| Net assets applicable to outstanding Institutional Class shares | | $ | 8,852,920 | |
| Shares issued and outstanding | | | 413,800 | |
| Net asset value, offering price and redemption price per share | | $ | 21.39 | |
The accompanying notes are an integral part of these financial statements.
| STATEMENT OF ASSETS AND LIABILITIES/STATEMENT OF OPERATIONS |
Financial Statements
Statement of Operations for the year ended October 31, 2018 |
| INVESTMENT INCOME: | | | |
| Dividend income from unaffiliated securities | | $ | 542,564 | |
| Dividend income from affiliated securities | | | 21,240 | |
| Interest income | | | 32,642 | |
| Total investment income | | | 596,446 | |
| | | | | |
| EXPENSES: | | | | |
| Investment advisory fees (See Note 5) | | | 428,499 | |
| Sub-transfer agent expenses – Investor Class (See Note 5) | | | 69,674 | |
| Sub-transfer agent expenses – Institutional Class (See Note 5) | | | 5,749 | |
| Distribution fees – Investor Class (See Note 5) | | | 59,248 | |
| Administration, fund accounting, custody and transfer agent fees (See Note 5) | | | 45,895 | |
| Service fees – Investor Class (See Note 5) | | | 39,499 | |
| Federal and state registration fees | | | 34,329 | |
| Compliance expense (See Note 5) | | | 29,500 | |
| Audit fees | | | 22,501 | |
| Trustees’ fees and expenses | | | 16,727 | |
| Reports to shareholders | | | 16,621 | |
| Interest expense (See Note 7) | | | 4 | |
| Other expenses | | | 5,936 | |
| Total expenses | | | 774,182 | |
| NET INVESTMENT LOSS | | $ | (177,736 | ) |
| | | | | |
| REALIZED AND UNREALIZED GAINS (LOSSES): | | | | |
| Net realized gain on: | | | | |
| Unaffiliated investments | | $ | 1,150,798 | |
| Affiliated investments | | | 50,621 | |
| Net change in unrealized appreciation/depreciation on: | | | | |
| Unaffiliated investments | | | (1,576,046 | ) |
| Affiliated investments | | | (82,044 | ) |
| Net loss on investments | | | (456,671 | ) |
| NET DECREASE IN NET ASSETS RESULTING FROM OPERATIONS | | $ | (634,407 | ) |
The accompanying notes are an integral part of these financial statements.
| HENNESSY FUNDS | 1-800-966-4354 | |
(This Page Intentionally Left Blank.)
| STATEMENTS OF CHANGES IN NET ASSETS |
Financial Statements
| Statements of Changes in Net Assets |
| | | Year Ended | | | Year Ended | |
| | | October 31, 2018 | | | October 31, 2017 | |
| OPERATIONS: | | | | | | |
| Net investment loss | | $ | (177,736 | ) | | $ | (116,337 | ) |
| Net realized gain on investments | | | 1,201,419 | | | | 4,459,225 | |
| Net change in unrealized | | | | | | | | |
| appreciation/depreciation on investments | | | (1,658,090 | ) | | | 4,725,077 | |
| Net increase (decrease) in net | | | | | | | | |
| assets resulting from operations | | | (634,407 | ) | | | 9,067,965 | |
| | | | | | | | | |
| DISTRIBUTIONS TO SHAREHOLDERS FROM: | | | | | | | | |
| Distributable earnings – Investor Class | | | (1,219,312 | ) | | | (158,906 | ) |
| Distributable earnings – Institutional Class | | | (296,176 | ) | | | (29,650 | ) |
| Total distributions | | | (1,515,488 | ) | | | (188,556 | )(1) |
| | | | | | | | | |
| CAPITAL SHARE TRANSACTIONS: | | | | | | | | |
| Proceeds from shares subscribed – Investor Class | | | 24,589,903 | | | | 5,666,734 | |
| Proceeds from shares subscribed – Institutional Class | | | 7,641,988 | | | | 5,259,686 | |
| Dividends reinvested – Investor Class | | | 1,178,036 | | | | 154,596 | |
| Dividends reinvested – Institutional Class | | | 296,176 | | | | 29,650 | |
| Cost of shares redeemed – Investor Class | | | (9,240,403 | ) | | | (14,389,624 | ) |
| Cost of shares redeemed – Institutional Class | | | (4,636,260 | ) | | | (458,597 | ) |
| Net increase (decrease) in net assets derived | | | | | | | | |
| from capital share transactions | | | 19,829,440 | | | | (3,737,555 | ) |
| TOTAL INCREASE IN NET ASSETS | | | 17,679,545 | | | | 5,141,854 | |
| | | | | | | | | |
| NET ASSETS: | | | | | | | | |
| Beginning of year | | | 32,163,357 | | | | 27,021,503 | |
| End of year | | $ | 49,842,902 | | | $ | 32,163,357 | (2) |
| | | | | | | | | |
| CHANGES IN SHARES OUTSTANDING: | | | | | | | | |
| Shares sold – Investor Class | | | 1,072,989 | | | | 289,553 | |
| Shares sold – Institutional Class | | | 339,855 | | | | 265,747 | |
| Shares issued to holders as reinvestment | | | | | | | | |
| of dividends – Investor Class | | | 54,162 | | | | 8,027 | |
| Shares issued to holders as reinvestment | | | | | | | | |
| of dividends – Institutional Class | | | 13,686 | | | | 1,551 | |
| Shares redeemed – Investor Class | | | (410,285 | ) | | | (745,488 | ) |
| Shares redeemed – Institutional Class | | | (205,942 | ) | | | (22,449 | ) |
| Net increase (decrease) in shares outstanding | | | 864,465 | | | | (203,059 | ) |
(1) | All distributions were from net investment income. |
(2) | Includes accumulated undistributed net investment loss of $(114,001). |
The accompanying notes are an integral part of these financial statements.
| HENNESSY FUNDS | 1-800-966-4354 | |
Financial Statements
For an Investor Class share outstanding throughout each year
PER SHARE DATA:
Net asset value, beginning of year
Income from investment operations:
Net investment income (loss)
Net realized and unrealized gains (losses) on investments
Total from investment operations
Less distributions:
Dividends from net investment income
Dividends from net realized gains
Total distributions
Net asset value, end of year
TOTAL RETURN
SUPPLEMENTAL DATA AND RATIOS:
Net assets, end of year (millions)
Ratio of expenses to average net assets
Ratio of net investment income (loss) to average net assets
Portfolio turnover rate(2)
(1) | Amount is less than $0.01. |
(2) | Portfolio turnover is calculated on the basis of the Fund as a whole. |
The accompanying notes are an integral part of these financial statements.
| FINANCIAL HIGHLIGHTS — INVESTOR CLASS |
| Year Ended October 31, | |
| 2018 | | | 2017 | | | 2016 | | | 2015 | | | 2014 | |
| | | | | | | | | | | | | | |
| $ | 22.02 | | | $ | 16.23 | | | $ | 18.36 | | | $ | 20.87 | | | $ | 19.01 | |
| | | | | | | | | | | | | | | | | | | |
| | | | | | | | | | | | | | | | | | | |
| | (0.07 | ) | | | (0.08 | ) | | | 0.07 | | | | 0.01 | | | | 0.00 | (1) |
| | 0.48 | | | | 5.97 | | | | (0.49 | ) | | | (0.40 | ) | | | 2.44 | |
| | 0.41 | | | | 5.89 | | | | (0.42 | ) | | | (0.39 | ) | | | 2.44 | |
| | | | | | | | | | | | | | | | | | | |
| | | | | | | | | | | | | | | | | | | |
| | — | | | | (0.10 | ) | | | (0.02 | ) | | | — | | | | — | |
| | (1.00 | ) | | | — | | | | (1.69 | ) | | | (2.12 | ) | | | (0.58 | ) |
| | (1.00 | ) | | | (0.10 | ) | | | (1.71 | ) | | | (2.12 | ) | | | (0.58 | ) |
| $ | 21.43 | | | $ | 22.02 | | | $ | 16.23 | | | $ | 18.36 | | | $ | 20.87 | |
| | | | | | | | | | | | | | | | | | | |
| | 1.82 | % | | | 36.41 | % | | | (2.57 | )% | | | (2.57 | )% | | | 13.04 | % |
| | | | | | | | | | | | | | | | | | | |
| | | | | | | | | | | | | | | | | | | |
| $ | 40.99 | | | $ | 26.33 | | | $ | 26.67 | | | $ | 100.73 | | | $ | 98.07 | |
| | 1.69 | % | | | 1.81 | % | | | 1.66 | % | | | 1.57 | % | | | 1.49 | % |
| | (0.44 | )% | | | (0.41 | )% | | | 0.16 | % | | | 0.03 | % | | | (0.01 | )% |
| | 64 | % | | | 76 | % | | | 141 | % | | | 74 | % | | | 58 | % |
The accompanying notes are an integral part of these financial statements.
| HENNESSY FUNDS | 1-800-966-4354 | |
Financial Statements
For an Institutional Class share outstanding throughout each period
| | | | | | | | | | | | Period Ended | |
| | | Year Ended October 31, | | | October 31, | |
| | | 2018 | | | 2017 | | | 2016 | | | 2015(1) | |
| PER SHARE DATA: | | | | | | | | | | | | |
| Net asset value, beginning of period | | $ | 21.91 | | | $ | 16.26 | | | $ | 18.39 | | | $ | 19.72 | |
| | | | | | | | | | | | | | | | | |
| Income from | | | | | | | | | | | | | | | | |
| investment operations: | | | | | | | | | | | | | | | | |
| Net investment income (loss) | | | 0.03 | | | | 0.18 | | | | 0.02 | | | | 0.01 | |
| Net realized and unrealized | | | | | | | | | | | | | | | | |
| gains (losses) on investments | | | 0.45 | | | | 5.78 | | | | (0.36 | ) | | | (1.34 | ) |
| Total from investment operations | | | 0.48 | | | | 5.96 | | | | (0.34 | ) | | | (1.33 | ) |
| | | | | | | | | | | | | | | | | |
| Less distributions: | | | | | | | | | | | | | | | | |
| Dividends from net | | | | | | | | | | | | | | | | |
| investment income | | | — | | | | (0.31 | ) | | | (0.09 | ) | | | — | |
| Dividends from net realized gains | | | (1.00 | ) | | | — | | | | (1.70 | ) | | | — | |
| Total distributions | | | (1.00 | ) | | | (0.31 | ) | | | (1.79 | ) | | | — | |
| Net asset value, end of period | | $ | 21.39 | | | $ | 21.91 | | | $ | 16.26 | | | $ | 18.39 | |
| | | | | | | | | | | | | | | | | |
| TOTAL RETURN | | | 2.16 | % | | | 36.92 | % | | | (2.14 | )% | | | (6.74 | )%(2) |
| | | | | | | | | | | | | | | | | |
| SUPPLEMENTAL | | | | | | | | | | | | | | | | |
| DATA AND RATIOS: | | | | | | | | | | | | | | | | |
| Net assets, end of period (millions) | | $ | 8.85 | | | $ | 5.83 | | | $ | 0.35 | | | $ | 0.29 | |
| Ratio of expenses to | | | | | | | | | | | | | | | | |
| average net assets | | | 1.34 | % | | | 1.50 | % | | | 1.24 | % | | | 1.19 | %(3) |
| Ratio of net investment income | | | | | | | | | | | | | | | | |
| (loss) to average net assets | | | (0.07 | )% | | | (0.17 | )% | | | 0.52 | % | | | 0.25 | %(3) |
Portfolio turnover rate(4) | | | 64 | % | | | 76 | % | | | 141 | % | | | 74 | %(2) |
(1) | Institutional Class shares commenced operations on June 15, 2015. |
(2) | Not annualized. |
(3) | Annualized. |
(4) | Portfolio turnover is calculated on the basis of the Fund as a whole. |
The accompanying notes are an integral part of these financial statements.
| FINANCIAL HIGHLIGHTS — INSTITUTIONAL CLASS/NOTES TO THE FINANCIAL STATEMENTS |
Financial Statements
Notes to the Financial Statements October 31, 2018 |
1). ORGANIZATION
The Hennessy Large Cap Financial Fund (the “Fund”) is a series of Hennessy Funds Trust (the “Trust”), which was organized as a Delaware statutory trust on September 17, 1992. The Fund is an open-end management investment company registered under the Investment Company Act of 1940, as amended. The Fund did not have Institutional Class shares until June 15, 2015. The investment objective of the Fund is capital appreciation. The Fund is a non-diversified fund.
The Fund offers Investor Class and Institutional Class shares. Each class of shares differs principally in its respective 12b-1 distribution and service, shareholder servicing, and sub-transfer agent expenses. There are no sales charges. Each class has identical rights to earnings, assets, and voting privileges, except for class-specific expenses and exclusive rights to vote on matters affecting only an individual class.
As an investment company, the Fund follows the investment company accounting and reporting guidance of the Financial Accounting Standards Board (“FASB”) Accounting Standard Codification Topic 946 “Financial Services—Investment Companies.”
2). SIGNIFICANT ACCOUNTING POLICIES
The following is a summary of significant accounting policies consistently followed by the Fund in the preparation of the financial statements. These policies conform to U.S. generally accepted accounting principles (“GAAP”).
| a). | Securities Valuation – All investments in securities are recorded at their estimated fair value, as described in Note 3. |
| | |
| b). | Federal Income Taxes – No provision for federal income taxes or excise taxes has been made because the Fund has elected to be taxed as a regulated investment company and intends to distribute substantially all of its taxable income to its shareholders and otherwise comply with the provisions of the Internal Revenue Code of 1986, as amended, applicable to regulated investment companies. Net investment income/loss and realized gains/losses for federal income tax purposes may differ from those reported in the financial statements because of temporary book and tax basis differences. Temporary differences are primarily the result of the treatment of wash sales for tax reporting purposes. The Fund recognizes interest and penalties related to income tax benefits, if any, in the Statement of Operations as an income tax expense. Distributions from net realized gains for book purposes may include short-term capital gains, which are included as ordinary income to shareholders for tax purposes. The Fund may utilize equalization accounting for tax purposes and designate earnings and profits, including net realized gains distributed to shareholders on redemption of shares, as part of the dividends paid deduction for income tax purposes. |
| | |
| | Due to inherent differences in the recognition of income, expenses, and realized gains/losses under GAAP and federal income tax regulations, permanent differences between book and tax basis for reporting for fiscal year 2018 have been identified and appropriately reclassified in the Statement of Assets and Liabilities. The adjustments are as follows: |
| Total | |
| Distributable | |
Earnings | Capital Stock |
| $(64,607) | $64,607 |
| HENNESSY FUNDS | 1-800-966-4354 | |
| c). | Accounting for Uncertainty in Income Taxes – The Fund has accounting policies regarding recognition and measurement of tax positions taken or expected to be taken on a tax return. The tax returns of the Fund for the prior three fiscal years are open for examination. The Fund has reviewed all open tax years in major jurisdictions and concluded that there is no impact on the Fund’s net assets and no tax liability resulting from unrecognized tax benefits relating to uncertain income tax positions taken or expected to be taken on a tax return. The Fund’s major tax jurisdictions are U.S. federal and Delaware. |
| | |
| d). | Income and Expenses – Dividend income is recognized on the ex-dividend date or as soon as information is available to the Fund. Interest income, which includes the amortization of premium and accretion of discount, is recognized on an accrual basis. Other non-cash dividends are recognized as investment income at the fair value of the property received. The Fund is charged for those expenses that are directly attributable to its portfolio, such as advisory, administration, and certain shareholder service fees. Income, expenses (other than expenses attributable to a specific class), and realized and unrealized gains/losses on investments are allocated to each class of shares based on such class’s net assets. |
| | |
| e). | Distributions to Shareholders – Dividends from net investment income for the Fund, if any, are declared and paid annually, usually in December. Distributions of net realized capital gains, if any, are declared and paid annually, usually in December. |
| | |
| f). | Security Transactions – Investment and shareholder transactions are recorded on the trade date. The Fund determines the realized gain/loss from an investment transaction by comparing the original cost of the security lot sold with the net sale proceeds. Discounts and premiums on securities purchased are accreted or amortized, respectively, over the life of each such security. |
| | |
| g). | Use of Estimates – The preparation of financial statements in conformity with GAAP requires management to make estimates and assumptions that affect the reported amounts of assets and liabilities and disclosure of contingent assets and liabilities at the date of the financial statements and the reported change in net assets during the reporting period. Actual results could differ from those estimates. |
| | |
| h). | Share Valuation – The net asset value (“NAV”) per share of the Fund is calculated by dividing (i) the total value of the securities held by the Fund, plus cash and other assets, minus all liabilities (including estimated accrued expenses) by (ii) the total number of shares outstanding for the Fund, rounded to the nearest cent. The Fund’s shares will not be priced on days the New York Stock Exchange is closed for trading. The offering and redemption price per share for the Fund is equal to the Fund’s NAV per share. |
| | |
| i). | New Accounting Pronouncements – In August 2018, the FASB issued Accounting Standards Update No. 2018-13 “Disclosure Framework—Changes to the Disclosure Requirements for Fair Value Measurement” (“ASU 2018-13”). ASU 2018-13 eliminates the requirement to disclose the amount of and reasons for transfers between Level 1 and Level 2 of the fair value hierarchy, the timing of transfers between levels of the fair value hierarchy, and the valuation processes for Level 3 fair value measurements. ASU 2018-13 does not eliminate the requirement to disclose the range and weighted average used to develop significant unobservable inputs for Level 3 fair value measurements, and the changes in unrealized gains and losses for recurring Level 3 fair value measurements. ASU 2018-13 requires that information is provided about the measurement uncertainty of Level 3 fair value measurements as of the reporting date. The guidance is effective for fiscal years beginning after December 15, 2019, and interim periods within those fiscal years. Management has |
| NOTES TO THE FINANCIAL STATEMENTS |
| | evaluated the impact of this change in guidance, and due to the permissibility of early adoption, modified the Fund’s fair value disclosures for the current reporting period. |
| | |
| j). | New Rule Issuances – In August 2018, the Securities and Exchange Commission issued Final Rule Release No. 33 10532, Disclosure Update and Simplification, which in part amends certain financial statement disclosure requirements of Regulation S-X that have become redundant, duplicative, overlapping, outdated, or superseded, in light of other Commission disclosure requirements, GAAP, or changes in the information environment. The amendments are intended to facilitate the disclosure of information to investors and simplify compliance without significantly altering the total mix of information provided to investors. The amendments to Rule 6-04.17 of Regulation S-X (balance sheet) were amended to require presentation of the total, rather than the components of net assets, of distributable earnings on the balance sheet. Consistent with GAAP, funds will be required to disclose total distributable earnings. The amendments to Rule 6-09 of Regulation S-X (statement of changes in net assets) omit the requirement to separately state the sources of distributions paid as well as omit the requirement to parenthetically state the book basis amount of undistributed net investment income. Instead, consistent with GAAP, funds will be required to disclose the total amount of distributions paid, except that any tax return of capital must be separately disclosed. The requirements of the Final Rule Release are effective November 5, 2018 and the Fund’s Statement of Assets and Liabilities and the Statement of Changes in Net Assets for the current and prior reporting period have been modified accordingly. |
3). SECURITIES VALUATION
The Fund follows fair valuation accounting standards that establish an authoritative definition of fair value and set out a hierarchy for measuring fair value. These standards require additional disclosures about the various inputs and valuation techniques used to develop the measurements of fair value and a discussion of changes in valuation techniques and related inputs during the period. These inputs are summarized in the three broad levels listed below:
| | Level 1 – | Unadjusted, quoted prices in active markets for identical instruments that the Fund has the ability to access at the date of measurement. |
| | | |
| | Level 2 – | Other significant observable inputs (including, but not limited to, quoted prices in active markets for similar instruments, quoted prices in markets that are not active for identical or similar instruments, and model-derived valuations in which all significant inputs and significant value drivers are observable in active markets, such as interest rates, prepayment speeds, credit risk curves, default rates, and similar data). |
| | | |
| | Level 3 – | Significant unobservable inputs (including the Fund’s own assumptions about what market participants would use to price the asset or liability based on the best available information) when observable inputs are unavailable. |
Following is a description of the valuation techniques applied to the Fund’s major categories of assets and liabilities measured at fair value on a recurring basis.
| | Equity Securities – Equity securities, including common stocks, preferred stocks, foreign-issued common stocks, exchange-traded funds, closed-end mutual funds, partnerships, rights, and real estate investment trusts, that are traded on a securities exchange for which a last-quoted sales price is readily available will generally be valued at the last sales price as reported by the primary exchange on which the securities are listed. Securities listed on The NASDAQ Stock Market (“NASDAQ”) |
| HENNESSY FUNDS | 1-800-966-4354 | |
| | will generally be valued at the NASDAQ Official Closing Price, which may differ from the last sales price reported. Securities traded on a securities exchange for which a last-quoted sales price is not readily available will generally be valued at the mean between the bid and ask prices. To the extent these securities are actively traded and valuation adjustments are not applied, they are classified in Level 1 of the fair value hierarchy. Securities traded on foreign exchanges generally are not valued at the same time the Fund calculates its NAV because most foreign markets close well before such time. The earlier close of most foreign markets gives rise to the possibility that significant events, including broad market moves, may have occurred in the interim. In certain circumstances, it may be determined that a foreign security needs to be fair valued because it appears that the value of the security might have been materially affected by events occurring after the close of the market in which the security is principally traded, but before the time the Fund calculates its NAV, such as by a development that affects an entire market or region (e.g., a weather-related event) or a potentially global development (e.g., a terrorist attack that may be expected to have an effect on investor expectations worldwide). |
| | |
| | Registered Investment Companies – Investments in open-end registered investment companies, commonly referred to as mutual funds, are generally priced at the ending NAV provided by the applicable mutual fund’s service agent and will be classified in Level 1 of the fair value hierarchy. |
| | |
| | Debt Securities – Debt securities, including corporate bonds, asset-backed securities, mortgage-backed securities, municipal bonds, U.S. Treasuries, and U.S. government agency issues, are generally valued at market on the basis of valuations furnished by an independent pricing service that utilizes both dealer-supplied valuations and formula-based techniques. The pricing service may consider recently executed transactions in securities of the issuer or comparable issuers, market price quotations (where observable), bond spreads, and fundamental data relating to the issuer. In addition, the model may incorporate observable market data, such as reported sales of similar securities, broker quotes, yields, bids, offers, and reference data. Certain securities are valued primarily using dealer quotations. These securities are generally classified in Level 2 of the fair value hierarchy. |
| | |
| | Short-Term Securities – Short-term equity investments, including money market funds, are valued in the manner specified above. Short-term debt investments with an original term to maturity of 60 days or less are valued at amortized cost, which approximates fair market value. If the original term to maturity of a short-term debt investment exceeded 60 days, then the values as of the 61st day prior to maturity are amortized. Amortized cost is not used if its use would be inappropriate due to credit or other impairments of the issuer, in which case the security’s fair value would be determined, as described below. Short-term securities are generally classified in Level 1 or Level 2 of the fair market hierarchy depending on the inputs used and market activity levels for specific securities. |
The Board of Trustees of the Fund (the “Board”) has adopted fair value pricing procedures that are followed when a price for a security is not readily available or if a significant event has occurred that indicates the closing price of a security no longer represents the true value of that security. Fair value pricing determinations are made in good faith in accordance with these procedures. There are numerous criteria that will be given consideration in determining a fair value of a security, such as the trading volume of a security and markets, the values of other similar securities, and news events with direct bearing on a security or markets. Fair value pricing results in an estimated price for a
| NOTES TO THE FINANCIAL STATEMENTS |
security that reflects the amount the Fund might reasonably expect to receive in a current sale. Depending on the relative significance of the valuation inputs, these securities may be classified in either Level 2 or Level 3 of the fair value hierarchy.
The fair valuation of foreign securities may be determined with the assistance of a pricing service using correlations between the movement of prices of such securities and indices of domestic securities and other appropriate indicators, such as closing market prices of relevant American Depositary Receipts or futures contracts. The effect of using fair value pricing is that the Fund’s NAV will reflect the affected portfolio securities’ values as determined by the Board or its designee, pursuant to the fair value pricing procedures adopted by the Board, instead of being determined by the market. Using a fair value pricing methodology to price a foreign security may result in a value that is different from such foreign security’s most recent closing price and from the value used by other investment companies to calculate their NAVs. Such securities are generally classified in Level 2 of the fair valuation hierarchy. Because the Fund may invest in foreign securities, the value of the Fund’s portfolio securities may change on days when you will not be able to purchase or redeem your shares.
The Board has delegated day-to-day valuation matters to a Valuation Committee comprised of one or more representatives from Hennessy Advisors, Inc., the Fund’s investment advisor (the “Advisor”). The function of the Valuation Committee is to value securities where current and reliable market quotations are not readily available. All actions taken by the Valuation Committee are reviewed by the Board.
The Fund has performed an analysis of all existing investments to determine the significance and character of all inputs to their fair value determinations. Various inputs are used to determine the value of the Fund’s investments. The inputs or methodology used for valuing securities are not necessarily an indication of the risk associated with investing in those securities. Details related to the fair valuation hierarchy of the Fund’s securities as of October 31, 2018, are included in the Schedule of Investments.
4). INVESTMENT TRANSACTIONS
Purchases and sales of investment securities (excluding government and short-term investments) for the Fund during fiscal year 2018 were $42,122,633 and $28,569,905, respectively.
There were no purchases or sales/maturities of long-term U.S. government securities for the Fund during fiscal year 2018.
The Fund is permitted to purchase or sell securities from or to another fund in the Hennessy Funds family of funds (the “Hennessy Funds”) under specified conditions outlined in procedures adopted by the Board. The procedures have been designed to ensure that any purchase or sale of securities by the Fund from or to another Hennessy Fund complies with Rule 17a-7 of the Investment Company Act of 1940, as amended. During fiscal year 2018, the Fund did not engage in purchases or sales of securities pursuant to Rule 17a-7 of the Investment Company Act of 1940, as amended.
5). INVESTMENT ADVISORY FEE AND OTHER TRANSACTIONS WITH AFFILIATES
The Advisor provides the Fund with investment advisory services under an Investment Advisory Agreement. The Advisor furnishes all investment advice, office space, and facilities, as well as most of the personnel needed by the Fund. As compensation for its services, the Advisor is entitled to a monthly fee from the Fund. The fee is based upon the average daily net assets of the Fund at an annual rate of 0.90%. The net investment advisory fees expensed by the Fund during fiscal year 2018 are included in the Statement of Operations.
| HENNESSY FUNDS | 1-800-966-4354 | |
The Board has approved a Shareholder Servicing Agreement for Investor Class shares of the Fund, which was instituted to compensate the Advisor for the non-investment advisory services it provides to the Fund. The Shareholder Servicing Agreement provides for a monthly fee paid to the Advisor at an annual rate of 0.10% of the average daily net assets of the Fund attributable to Investor Class shares. The shareholder service fees expensed by the Fund during fiscal year 2018 are included in the Statement of Operations.
The Fund has adopted a plan pursuant to Rule 12b-1 under the Investment Company Act of 1940, as amended, that authorizes payments in connection with the distribution of the Fund’s shares at an annual rate of up to 0.25% of the Fund’s average daily net assets attributable to Investor Class shares. Even though the authorized rate is up to 0.25%, the Fund is currently only using up to 0.15% of its average daily net assets attributable to Investor Class shares for such purpose. Amounts paid under the plan may be spent on any activities or expenses primarily intended to result in the sale of shares, including, but not limited to, advertising, shareholder account servicing, printing and mailing of prospectuses to other than current shareholders, printing and mailing of sales literature, and compensation for sales and marketing activities or to financial institutions and others, such as dealers and distributors. The distribution fees expensed by the Fund during fiscal year 2018 are included in the Statement of Operations.
The Fund has entered into agreements with various brokers, dealers, and financial intermediaries in connection with the sale of shares of the Fund. The agreements provide for periodic payments by the Fund to the brokers, dealers, and financial intermediaries for providing certain shareholder maintenance services (sub-transfer agent expenses). These shareholder services include the pre-processing and quality control of new accounts, shareholder correspondence, answering customer inquiries regarding account status, and facilitating shareholder telephone transactions. The sub-transfer agent fees expensed by the Fund during fiscal year 2018 are included in the Statement of Operations.
U.S. Bancorp Fund Services, LLC, d/b/a U.S. Bank Global Fund Services (“Fund Services”) provides the Fund with administrative, fund accounting, and transfer agent services. As administrator, Fund Services is responsible for activities such as (i) preparing various federal and state regulatory filings, reports, and returns for the Fund, (ii) preparing reports and materials to be supplied to the Board, (iii) monitoring the activities of the Fund’s custodian, transfer agent, and accountants, and (iv) coordinating the preparation and payment of the Fund’s expenses and reviewing the Fund’s expense accruals. U.S. Bank N.A., an affiliate of Fund Services, serves as the Fund’s custodian. The servicing agreements between the Trust and Fund Services and U.S. Bank N.A. contain a fee schedule that is inclusive of administrative, fund accounting, custody, and transfer agent fees. The administrative, fund accounting, custody, and transfer agent fees expensed by the Fund during fiscal year 2018 are included in the Statement of Operations.
Quasar Distributors, LLC acts as the Fund’s principal underwriter in a continuous public offering of the Fund’s shares. Quasar Distributors, LLC is an affiliate of Fund Services and U.S. Bank N.A.
The officers of the Fund are affiliated with the Advisor. Such officers, with the exception of the Chief Compliance Officer and the Senior Compliance Officer, receive no compensation from the Fund for serving in their respective roles. The Fund, along with the other Hennessy Funds, makes reimbursement payments, on an equal basis, to the Advisor for a portion of the salary and benefits associated with the office of the Chief Compliance Officer and for all of the salary and benefits associated with the office of the Senior Compliance Officer. The compliance fees expensed by the Fund during fiscal year 2018 are included in the Statement of Operations.
| NOTES TO THE FINANCIAL STATEMENTS |
6). GUARANTEES AND INDEMNIFICATIONS
Under the Hennessy Funds’ organizational documents, their officers and trustees are indemnified by the Hennessy Funds against certain liabilities arising out of the performance of their duties to the Hennessy Funds. Additionally, in the normal course of business, the Hennessy Funds enter into contracts with service providers that contain general indemnification clauses. The Fund’s maximum exposure under these arrangements is unknown as this would involve future claims that may be made against the Fund that have not yet occurred. Currently, the Fund expects the risk of loss to be remote.
7). LINE OF CREDIT
The Fund has an uncommitted line of credit with the other Hennessy Funds in the amount of the lesser of (i) $100,000,000 or (ii) 33.33% of each Hennessy Fund’s net assets, or 30% for the Hennessy Gas Utility Fund and 10% for the Hennessy Balanced Fund, intended to provide short-term financing, if necessary, subject to certain restrictions, in connection with shareholder redemptions. The credit facility is with the Hennessy Funds’ custodian bank, U.S. Bank N.A. Borrowings under this arrangement bear interest at the bank’s prime rate and are secured by all of the Fund’s assets (as to its own borrowings only). During fiscal year 2018 the Fund had an outstanding average daily balance and a weighted average interest rate of $71 and 5.00%, respectively. The interest expensed by the Fund during fiscal year 2018 is included in the Statement of Operations. The maximum amount outstanding for the Fund during fiscal year 2018 was $26,000. As of October 31, 2018, the Fund did not have any borrowings outstanding under the line of credit.
8). FEDERAL TAX INFORMATION
As of October 31, 2018, the components of accumulated earnings (losses) for income tax purposes were as follows:
| | | Investments | |
| Cost of investments for tax purposes | | $ | 46,213,309 | |
| Gross tax unrealized appreciation | | $ | 7,356,788 | |
| Gross tax unrealized depreciation | | | (2,482,400 | ) |
| Net tax unrealized appreciation/(depreciation) | | $ | 4,874,388 | |
| Undistributed ordinary income | | $ | — | |
| Undistributed long-term capital gains | | | 1,232,897 | |
| Total distributable earnings | | $ | 1,232,897 | |
| Other accumulated gain/(loss) | | $ | (140,651 | ) |
| Total accumulated gain/(loss) | | $ | 5,966,634 | |
The difference between book-basis unrealized appreciation/depreciation (as shown in the Statement of Assets and Liabilities) and tax-basis unrealized appreciation/depreciation (as shown above) is attributable primarily to wash sales and late-year ordinary losses.
As of October 31, 2018, the Fund had no tax basis capital losses to offset future capital gains.
As of October 31, 2018, the Fund deferred, on a tax basis, a late-year ordinary loss of $140,651. Late-year ordinary losses are net ordinary losses incurred after December 31, 2017, but within the taxable year, that are deemed to arise on the first day of the Fund’s next taxable year.
| HENNESSY FUNDS | 1-800-966-4354 | |
During fiscal year 2018 and fiscal year 2017, the tax character of distributions paid by the Fund was as follows:
| | | Year Ended | | | Year Ended | |
| | | October 31, 2018 | | | October 31, 2017 | |
Ordinary income(1) | | $ | — | | | $ | 187,217 | |
| Long-term capital gain | | | 1,515,488 | | | | 1,339 | |
| | | $ | 1,515,488 | | | $ | 188,556 | |
(1) Ordinary income includes short-term capital gains.
9). EVENTS SUBSEQUENT TO YEAR END
Management has evaluated the Fund’s related events and transactions that occurred subsequent to October 31, 2018, through the date of issuance of the Fund’s financial statements. Other than as disclosed below, management has determined that there were no subsequent events requiring recognition or disclosure in the financial statements.
On December 7, 2018, capital gains were declared and paid to shareholders of record on December 6, 2018, as follows:
| | Long-term |
| Investor Class | $0.58896 |
| Institutional Class | $0.59199 |
| NOTES/REPORT OF INDEPENDENT REGISTERED PUBLIC ACCOUNTING FIRM |
Report of Independent Registered Public
Accounting Firm
To the Board of Trustees of Hennessy Funds Trust
and the shareholders of Hennessy Large Cap Financial Fund
Novato, CA
Opinion on the Financial Statements
We have audited the accompanying statement of assets and liabilities of Hennessy Large Cap Financial Fund (the “Fund”), a series of Hennessy Funds Trust, including the schedule of investments, as of October 31, 2018, the related statement of operations for the year then ended, the statements of changes in net assets for each of the two years in the period then ended, financial highlights for each of the five years in the period then ended, and the related notes (collectively referred to as the “financial statements”). In our opinion, the financial statements present fairly, in all material respects, the financial position of the Fund as of October 31, 2018, the results of its operations for the year then ended, the changes in its net assets for each of the two years in the period then ended, and the financial highlights for each of the five years in the period then ended, in conformity with accounting principles generally accepted in the United States of America.
Basis for Opinion
These financial statements are the responsibility of the Fund’s management. Our responsibility is to express an opinion on the Fund’s financial statements based on our audits. We are a public accounting firm registered with the Public Company Accounting Oversight Board (United States) (“PCAOB”) and are required to be independent with respect to the Fund in accordance with the U.S. federal securities laws and the applicable rules and regulations of the Securities and Exchange Commission and the PCAOB. We have served as the auditor of one or more of the funds in the Trust since 2002.
We conducted our audits in accordance with the standards of the PCAOB. Those standards require that we plan and perform the audit to obtain reasonable assurance about whether the financial statements are free of material misstatement, whether due to error or fraud. The Fund is not required to have, nor were we engaged to perform, an audit of its internal control over financial reporting. As part of our audits we are required to obtain an understanding of internal control over financial reporting, but not for the purpose of expressing an opinion on the effectiveness of the Fund’s internal control over financial reporting. Accordingly, we express no such opinion.
Our audits included performing procedures to assess the risks of material misstatement of the financial statements, whether due to error or fraud, and performing procedures that respond to those risks. Such procedures included examining, on a test basis, evidence regarding the amounts and disclosures in the financial statements. Our audits also included evaluating the accounting principles used and significant estimates made by management, as well as evaluating the overall presentation of the financial statements. Our procedures included confirmation of securities owned as of October 31, 2018 by correspondence with the custodian and brokers; when replies were not received from brokers, we performed other auditing procedures. We believe that our audits provide a reasonable basis for our opinion.
TAIT, WELLER & BAKER LLP
Philadelphia, Pennsylvania
December 27, 2018
| HENNESSY FUNDS | 1-800-966-4354 | |
Trustees and Officers of the Fund (Unaudited)
The business and affairs of the Funds are managed under the direction of the Board of Trustees of the Trust, and the Board of Trustees elects the Officers of the Trust. Beginning in March 2015, the Board of Trustees has from time to time appointed advisers to the Board of Trustees (“Advisers”) with the intention of having qualified individuals serve in an advisory capacity in order to garner experience in the mutual fund and asset management industry and be considered as potential Trustees in the future. There are currently three Advisers: Brian Alexander, Doug Franklin, and Claire Knoles. As Advisers, Mr. Alexander, Mr. Franklin, and Ms. Knoles attend meetings of the Board of Trustees and act as non-voting participants. Information pertaining to the Trustees, Advisers, and the Officers of the Trust is set forth below. The Trustees and Officers serve until their successors are duly elected and qualified or until their earlier death, resignation, or removal. Each Trustee oversees the 16 Hennessy Funds. Unless otherwise indicated, the address of all persons listed below is 7250 Redwood Boulevard, Suite 200, Novato, CA 94945. The Fund’s Statement of Additional Information includes more information about the persons listed below and is available, without charge, upon request by calling 1-800-966-4354.
| | | | Other |
| | | | Directorships |
| | | | Held Outside |
| Name, (Year of Birth), | | | of Fund |
| and Position Held | Start Date | Principal Occupation(s) | Complex During |
with the Trust | of Service | During Past Five Years | Past Five Years(1) |
| | |
| Disinterested Trustees and Advisers | |
| | | | |
| J. Dennis DeSousa | January 1996 | Mr. DeSousa is a real estate investor. | None. |
| (1936) | | | |
| Trustee | | | |
| | | | |
| Robert T. Doyle | January 1996 | Mr. Doyle has been the Sheriff of | None. |
| (1947) | | Marin County, California since 1996. | |
| Trustee | | | |
| | | | |
| Gerald P. Richardson | May 2004 | Mr. Richardson is an independent | None. |
| (1945) | | consultant in the securities industry. | |
| Trustee | | | |
| | | | |
| Brian Alexander | March 2015 | Mr. Alexander has worked for the | None. |
| (1981) | | Sutter Health organization since | |
| Adviser to the Board | | 2011 in various positions. He has | |
| | | served as the Chief Executive Officer | |
| | | of the Sutter Roseville Medical | |
| | | Center since 2018. From 2016 through | |
| | | 2018, he served as the Vice President | |
| | | of Strategy for the Sutter Health Valley | |
| | | Area, which includes 11 hospitals, | |
| | | 13 ambulatory surgery centers, | |
| | | 16,000 employees, and 1,900 physicians. | |
| | | From 2013 through 2016, Mr. Alexander | |
| | | served as Sutter Novato Community | |
| | | Hospital’s Chief Administrative Officer, | |
| | | and from 2011 through 2012, he | |
| | | served as a Director of Strategy | |
| | | within Sutter’s West Bay Region. | |
| TRUSTEES AND OFFICERS OF THE FUND |
| | | | Other |
| | | | Directorships |
| | | | Held Outside |
| Name, (Year of Birth), | | | of Fund |
| and Position Held | Start Date | Principal Occupation(s) | Complex During |
with the Trust | of Service | During Past Five Years | Past Five Years(1) |
| | | | |
| Doug Franklin | March 2016 | Mr. Franklin is a retired insurance | None. |
| (1964) | | industry executive. From 1987 | |
| Adviser to the Board | | through 2015, he was employed | |
| | | by the Allianz-Fireman’s Fund | |
| | | Insurance Company in various | |
| | | positions, including as its Chief | |
| | | Actuary and Chief Risk Officer. | |
| | | | |
| Claire Knoles | December 2015 | Ms. Knoles is a founder of Kiosk and | None. |
| (1974) | | has served as its Chief Operating | |
| Adviser to the Board | | Officer since 2004. Kiosk is a full | |
| | | service marketing agency with | |
| | | offices in the San Francisco Bay | |
| | | Area, Toronto, and Liverpool, UK. | |
| | | | |
Interested Trustee(2) | | | |
| | | | |
| Neil J. Hennessy | January 1996 as | Mr. Neil Hennessy has been employed | Hennessy |
| (1956) | a Trustee and | by Hennessy Advisors, Inc. since | Advisors, Inc. |
| Trustee, Chairman of | June 2008 as | 1989 and currently serves as its | |
| the Board, Chief | an Officer | Chairman and Chief Executive Officer. | |
| Investment Officer, | | | |
| Portfolio Manager, | | | |
| and President | | | |
| Name, (Year of Birth), | | |
| and Position Held | Start Date | Principal Occupation(s) |
with the Trust | of Service | During Past Five Years |
| | | |
| Officers | | |
| | | |
| Teresa M. Nilsen | January 1996 | Ms. Nilsen has been employed by Hennessy Advisors, Inc. |
| (1966) | | since 1989 and currently serves as its President, Chief Operating |
| Executive Vice President | | Officer, and Secretary. |
| and Treasurer | | |
| | | |
| Daniel B. Steadman | March 2000 | Mr. Steadman has been employed by Hennessy Advisors, Inc. |
| (1956) | | since 2000 and currently serves as its Executive Vice President. |
| Executive Vice President | | |
| and Secretary | | |
| | | |
| Brian Carlson | December 2013 | Mr. Carlson has been employed by Hennessy Advisors, Inc. |
| (1972) | | since December 2013 and currently serves as its Chief |
| Senior Vice President | | Compliance Officer and Senior Vice President. |
| and Head of Distribution | | |
| | | |
| Jennifer Cheskiewicz | June 2013 | Ms. Cheskiewicz has been employed by Hennessy Advisors, Inc. |
(1977)(3) | | as its General Counsel since June 2013. |
| Senior Vice President and | | |
| Chief Compliance Officer | | |
| HENNESSY FUNDS | 1-800-966-4354 | |
| Name, (Year of Birth), | | |
| and Position Held | Start Date | Principal Occupation(s) |
with the Trust | of Service | During Past Five Years |
| | | |
| David Ellison | October 2012 | Mr. Ellison has been employed by Hennessy Advisors, Inc. since |
(1958)(4) | | October 2012. He has served as a Portfolio Manager of the |
| Senior Vice President | | Hennessy Large Cap Financial Fund and the Hennessy Small |
| and Portfolio Manager | | Cap Financial Fund since inception. Mr. Ellison also served as a |
| | | Portfolio Manager of the Hennessy Technology Fund from its |
| | | inception until February 2017. Mr. Ellison served as Director, |
| | | CIO and President of FBR Fund Advisers, Inc. from December |
| | | 1999 to October 2012. |
| | | |
| Ryan C. Kelley | March 2013 | Mr. Kelley has been employed by Hennessy Advisors, Inc. since |
(1972)(5) | | October 2012. He has served as a Portfolio Manager of the |
| Senior Vice President | | Hennessy Gas Utility Fund, the Hennessy Large Cap Financial |
| and Portfolio Manager | | Fund, and the Hennessy Small Cap Financial Fund since |
| | | October 2014. He served as Co-Portfolio Manager of the same |
| | | funds from March 2013 through September 2014, and as a |
| | | Portfolio Analyst for the Hennessy Funds from October 2012 |
| | | through February 2013. Mr. Kelley has also served as a Portfolio |
| | | Manager of the Hennessy Cornerstone Growth Fund, the |
| | | Hennessy Cornerstone Mid Cap 30 Fund, the Hennessy |
| | | Cornerstone Large Growth Fund, and the Hennessy |
| | | Cornerstone Value Fund since February 2017, as a Co-Portfolio |
| | | Manager of the Hennessy Technology Fund since February |
| | | 2017, and as a Portfolio Manager of the Hennessy Total Return |
| | | Fund and the Hennessy Balanced Fund since May 2018. |
| | | Mr. Kelley served as Portfolio Manager of FBR Fund Advisers, |
| | | Inc. from January 2008 to October 2012. |
| | | |
| Tania Kelley | October 2003 | Ms. Kelley has been employed by Hennessy Advisors, Inc. |
| (1965) | | since October 2003. |
| Senior Vice President | | |
| and Head of Marketing | | |
| Daniel P. Hennessy | December 2016 | Mr. Daniel Hennessy has been employed by Hennessy Advisors, |
| (1990) | | Inc. since 2015. He has served as an Associate Analyst or |
| Vice President | | Analyst of the Hennessy Technology Fund since February 2017. |
| and Analyst | | Mr. Daniel Hennessy previously served as a Mutual Fund |
| | | Specialist at U.S. Bancorp Fund Services, LLC (now doing |
| | | business as U.S. Bank Global Fund Services) from November |
| | | 2014 to July 2015. Prior to that, he attended the University of |
| | | San Diego, where he earned a degree in Political Science. |
_______________
(1) | Messrs. DeSousa, Doyle, N. Hennessy, and Richardson previously served on the Board of Directors of Hennessy Mutual Funds, Inc. (“HMFI”), The Hennessy Funds, Inc. (“HFI”), and Hennessy SPARX Funds Trust (“HSFT”). Pursuant to an internal reorganization effective as of February 28, 2014, the series of HFMI, HFI, and HSFT were reorganized into corresponding series of the Trust that mirrored them. Subsequent to the reorganization, HFMI, HFI, and HSFT were dissolved. |
(2) | Mr. N. Hennessy is considered an “interested person,” as defined in the Investment Company Act of 1940, as amended, because he is an officer of the Hennessy Funds. |
(3) | The address of this officer is 4800 Bee Caves Road, Suite 100, Austin, TX 78746. |
(4) | The address of this officer is 101 Federal Street, Suite 1900, Boston, MA 02110. |
(5) | The address of this officer is 1340 Environ Way, Suite 332, Chapel Hill, NC 27517. |
| TRUSTEES AND OFFICERS OF THE FUND |
(This Page Intentionally Left Blank.)
| HENNESSY FUNDS | 1-800-966-4354 | |
Expense Example (Unaudited)
October 31, 2018
As a shareholder of the Fund, you incur ongoing costs, including management fees, service fees, and other Fund expenses. This Example is intended to help you understand your ongoing costs (in dollars) of investing in the Fund and to compare these costs with the ongoing costs of investing in other mutual funds. The Example is based on an investment of $1,000 invested at the beginning of the period and held for the entire period from May 1, 2018, through October 31, 2018.
Actual Expenses
The first line of the table below under the “Investor Class” and “Institutional Class” headings provides information about actual account values and actual expenses. Although the Fund charges no sales loads or transaction fees, you will be assessed fees for outgoing wire transfers, returned checks and stop payment orders at prevailing rates charged by U.S. Bank Global Fund Services, the Fund’s transfer agent. If you request that a redemption be made by wire transfer, currently a $15 fee is charged by the Fund’s transfer agent. IRA accounts will be charged a $15 annual maintenance fee. The example below includes, but is not limited to, management fees, shareholder servicing fees, fund accounting, custody, and transfer agent fees. However, the example below does not include portfolio trading commissions and related expenses, and other extraordinary expenses as determined under generally accepted accounting principles. You may use the information in this line, together with the amount you invested, to estimate the expenses that you paid over the period. Simply divide your account value by $1,000 (for example, an $8,600 account value divided by $1,000 = 8.6), then multiply the result by the number in the first line of the table under the “Investor Class” or “Institutional Class” headings in the column entitled “Expenses Paid During Period” to estimate the expenses you paid on your account during this period.
Hypothetical Example for Comparison Purposes
The second line of the table below under the “Investor Class” and “Institutional Class” headings provides information about hypothetical account values and hypothetical expenses based on the Fund’s actual expense ratios and an assumed rate of return of 5% per year before expenses, which is not the Fund’s actual return. The hypothetical account values and expenses may not be used to estimate the actual ending account balance or expenses you paid for the period. You may use this information to compare the ongoing costs of investing in the Fund and other funds. To do so, compare this 5% hypothetical example with the 5% hypothetical examples that appear in the shareholder reports of the other funds. Please note that the expenses shown in the table are meant to highlight your ongoing costs only. Therefore, the second line of the table under the “Investor Class” and “Institutional Class” headings is useful in comparing ongoing costs only, and will not help you determine the relative total costs of owning different funds.
| | | | Expenses Paid |
| | Beginning | Ending | During Period(1) |
| | Account Value | Account Value | May 1, 2018 – |
| | May 1, 2018 | October 31, 2018 | October 31, 2018 |
| Investor Class | | | |
| Actual | $1,000.00 | $ 965.30 | $8.27 |
| Hypothetical (5% return before expenses) | $1,000.00 | $1,016.79 | $8.49 |
| | | | |
| Institutional Class | | | |
| Actual | $1,000.00 | $ 967.00 | $6.40 |
| Hypothetical (5% return before expenses) | $1,000.00 | $1,018.70 | $6.56 |
(1) | Expenses are equal to the Fund’s annualized expense ratio of 1.67% for Investor Class shares or 1.29% for Institutional Class shares, as applicable, multiplied by the average account value over the period, multiplied by 184/365 days (to reflect one-half year period). |
| HENNESSY FUNDS | 1-800-966-4354 | |
How to Obtain a Copy of the Fund’s
Proxy Voting Policy and Proxy Voting Records
A description of the policies and procedures the Fund uses to determine how to vote proxies relating to portfolio securities is available without charge: (1) by calling 1-800-966-4354; (2) on the Hennessy Funds’ website at www.hennessyfunds.com/proxy-voting/voting-policy; or (3) on the U.S. Securities and Exchange Commission’s (the “SEC”) website at www.sec.gov. The Fund’s proxy voting record is available without charge on both the Hennessy Funds’ website at www.hennessyfunds.com/proxy-voting/voting-record and the SEC’s website at www.sec.gov no later than August 31 for the prior 12 months ending June 30.
Quarterly Filings on Form N-Q
The Fund files a complete schedule of portfolio holdings with the SEC for the first and third quarters of each fiscal year on Form N-Q. The Fund’s Forms N-Q are available on the SEC’s website at www.sec.gov. Information included in the Fund’s Forms N-Q will also be available upon request by calling 1-800-966-4354.
Federal Tax Distribution Information
(Unaudited)
For fiscal year 2018, certain dividends paid by the Fund may be subject to a maximum tax rate of 23.8%, as provided for by the Jobs and Growth Tax Relief Reconciliation Act of 2003. The percentage of dividends declared from ordinary income designated as qualified dividend income was 0.00%.
For corporate shareholders, the percent of ordinary income distributions that qualified for the corporate dividends received deduction for fiscal year 2018 was 0.00%.
The percentage of taxable ordinary income distributions that were designated as short-term capital gain distributions under Section 871(k)(2)(C) of the Internal Revenue Code of 1986, as amended, for the Fund was 0.00%.
Important Notice Regarding Delivery
of Shareholder Documents
To help keep the Fund’s costs as low as possible, we generally deliver a single copy of shareholder reports, proxy statements, and prospectuses to shareholders who share an address and have the same last name. This process does not apply to account statements. You may request an individual copy of a shareholder document at any time. If you would like to receive separate mailings of shareholder documents, please call U.S. Bank Global Fund Services at 1-800-261-6950 or 1-414-765-4124, and individual delivery will begin within 30 days of your request. If your account is held through a financial institution or other intermediary, please contact such intermediary directly to request individual delivery.
| PROXY VOTING — PRIVACY POLICY |
Privacy Policy
We collect the following non-public personal information about you:
| | • | information we receive from you on or in applications or other forms, correspondence, or conversations, including, but not limited to, your name, address, phone number, social security number, assets, income, and date of birth; and |
| | | |
| | • | information about your transactions with us, our affiliates, or others, including, but not limited to, your account number and balance, payment history, parties to transactions, cost basis information, and other financial information. |
We do not disclose any non-public personal information about our current or former shareholders to non-affiliated third parties, except as permitted by law. For example, we are permitted by law to disclose all of the information we collect, as described above, to our Transfer Agent to process your transactions. Furthermore, we restrict access to your non-public personal information to those persons who require such information to provide products or services to you. We maintain physical, electronic, and procedural safeguards that comply with federal standards to guard your non-public personal information.
In the event that you hold shares of the Fund through a financial intermediary, including, but not limited to, a broker-dealer, bank, or trust company, the privacy policy of your financial intermediary would govern how your non-public personal information will be shared with non-affiliated third parties.
| HENNESSY FUNDS | 1-800-966-4354 | |
For information, questions or assistance, please call
The Hennessy Funds
1-800-966-4354 or 1-415-899-1555
INVESTMENT ADVISOR
Hennessy Advisors, Inc.
7250 Redwood Boulevard, Suite 200
Novato, California 94945
ADMINISTRATOR,
TRANSFER AGENT,
DIVIDEND PAYING AGENT, &
SHAREHOLDER SERVICING AGENT
U.S. Bancorp Fund Services, LLC
d/b/a U.S. Bank Global Fund Services
P.O. Box 701
Milwaukee, Wisconsin 53201-0701
CUSTODIAN
U.S. Bank N.A.
Custody Operations
1555 North River Center Drive, Suite 302
Milwaukee, Wisconsin 53212
TRUSTEES
Neil J. Hennessy
Robert T. Doyle
J. Dennis DeSousa
Gerald P. Richardson
COUNSEL
Foley & Lardner LLP
777 East Wisconsin Avenue
Milwaukee, Wisconsin 53202-5306
INDEPENDENT REGISTERED
PUBLIC ACCOUNTING FIRM
Tait, Weller & Baker LLP
Two Liberty Place
50 South 16th Street, Suite 2900
Philadelphia, Pennsylvania 19102-2529
DISTRIBUTOR
Quasar Distributors, LLC
777 East Wisconsin Avenue
Milwaukee, Wisconsin 53202
hennessyfunds.com | 1-800-966-4354
This report has been prepared for shareholders and may be distributed to
others only if preceded or accompanied by a current prospectus.
ANNUAL REPORT
OCTOBER 31, 2018
HENNESSY SMALL CAP
FINANCIAL FUND
Investor Class HSFNX
Institutional Class HISFX
hennessyfunds.com | 1-800-966-4354
(This Page Intentionally Left Blank.)
Contents
| Letter to Shareholders | 2 |
| Performance Overview | 4 |
| Financial Statements | |
| Schedule of Investments | 7 |
| Statement of Assets and Liabilities | 10 |
| Statement of Operations | 11 |
| Statements of Changes in Net Assets | 13 |
| Financial Highlights | 14 |
| Notes to the Financial Statements | 18 |
| Report of Independent Registered Public Accounting Firm | 26 |
| Trustees and Officers of the Fund | 27 |
| Expense Example | 30 |
| Proxy Voting Policy and Proxy Voting Records | 32 |
| Quarterly Schedule of Investments | 32 |
| Federal Tax Distribution Information | 32 |
| Important Notice Regarding Delivery of Shareholder Documents | 32 |
| Privacy Policy | 33 |
| HENNESSY FUNDS | 1-800-966-4354 | |
December 2018
Dear Hennessy Funds Shareholder:
Over the past year, we have witnessed the return of market volatility. U.S. stocks still registered healthy gains, bolstered by the impact on corporate profits of the successful passage of the tax reform bill in December 2017. However, concerns over potential trade disruptions, especially between the U.S. and China, and worries over higher short-term interest rates, which many believe could possibly trigger a recession down the road, put downward pressure on equity valuations.
The U.S. economy performed well over the period, and actually achieved an acceleration in GDP growth to over 3% on an annualized basis in the second and third quarters of calendar year 2018. During the past year, companies continued to hire workers, adding over 200,000 jobs per month on average, sending the unemployment rate down to 3.7% in October, which is the lowest it has been since 1969. Consumer confidence is high and still rising, and corporate profits reached record levels in the third quarter of calendar year 2018, posting a year-over-year increase of 26% for the companies in the S&P 500 Index.
The Federal Reserve, confident about the strength of the economy and mindful of a tight labor market, raised short-term interest rates four times over the last year, by a quarter point each time. Long-term bond yields also rose, driven higher primarily by evidence of faster wage growth, pushing the U.S. 10-year Treasury bond over 3% for the first time since 2013.
As I write this, we are experiencing the market’s 20th downturn since 2010. I have been saying that every bull market experiences volatility and pullbacks. Many financial commentators think this bull market is “long in the tooth.” I do not agree with them. I believe stock valuations are still very reasonable. The prospective price to earnings multiple for the Dow Jones Industrial Average has come down from almost 20x at the end of 2017 to 16x, just above its 10-year average of 15x. The prospective PE multiple for the S&P 500 Index has also come down, from 20x to 17x, and compares favorably to its 10-year average of 16x.
Cash, meanwhile, continues to build up on corporate balance sheets. The companies in the S&P 500 Index reported a total of over $5.4 trillion in cash and marketable securities in their latest filings. Companies have been spending some of their cash, increasing their investment spending and laying the groundwork for future earnings growth. However, they have also been returning capital to shareholders. S&P 500 Index companies announced $433.6 billion in share repurchases during the second quarter of calendar year 2018, nearly doubling the previous record of $242.1 billion set in the first quarter. Companies are also raising their dividends.
In addition, I believe the Federal Reserve will take care not to raise interest rates too high or too fast and endanger the economic expansion. While wage growth has risen to over 3% in October, other measures of inflationary pressure, such as the Consumer Price Index and the Producer Price Index, still show prices increasing at a more moderate pace, closer to 2%. Given continued evidence of modest rates of inflation, I believe the Fed will be able to maintain its gradual pace of interest rate hikes.
Finally and importantly, I still see no signs of euphoria in this market. In my opinion, the enthusiasm present earlier in the year, which followed the significant reduction in corporate income tax rates, has largely evaporated, and it has been replaced with anxiety
over higher interest rates and their potential impact on growth. In the past, I have likened the current bull market to that of 1982-2000, and I still believe this comparison holds true. I am confident in the strength of the market today and believe the economy will continue to grow in the coming year, albeit at a more moderate pace.
Thank you for your continued confidence and investment in the Hennessy Funds. If you have any questions or would like to speak with us directly, please don’t hesitate to call us at (800) 966-4354.
Best regards,
Neil J. Hennessy
President and Chief Investment Officer
Past performance does not guarantee future results.
Mutual fund investing involves risk. Principal loss is possible.
Opinions expressed are those of Neil Hennessy and are subject to change, are not guaranteed, and should not be considered investment advice.
The Dow Jones Industrial Average and S&P 500 Index are commonly used to measure the performance of U.S. stocks. One cannot invest directly in an index.
PE, or price to earnings, is a valuation measure and is calculated by dividing a company’s market price per share by its earnings per share. Earnings growth is not a measure of a fund’s future performance.
| HENNESSY FUNDS | 1-800-966-4354 | |
Performance Overview (Unaudited)
CHANGE IN VALUE OF $10,000 INVESTMENT
This graph illustrates the performance of an initial investment of $10,000 made in the Fund ten years ago and assumes the reinvestment of dividends.
AVERAGE ANNUAL TOTAL RETURN FOR PERIODS ENDED OCTOBER 31, 2018
| | One | Five | Ten |
| | Year | Years | Years |
| Hennessy Small Cap Financial Fund – | | | |
| Investor Class (HSFNX) | -8.79% | 6.98% | 9.41% |
| Hennessy Small Cap Financial Fund – | | | |
| Institutional Class (HISFX) | -8.42% | 7.37% | 9.74% |
Russell 2000® Financial Services Index | -1.99% | 9.28% | 10.20% |
Russell 2000® Index | 1.85% | 8.01% | 12.44% |
Expense ratios: 1.53% (Investor Class); 1.16% (Institutional Class)
Performance data quoted represents past performance; past performance does not guarantee future results. The investment return and principal value of an investment will fluctuate so that an investor’s shares, when redeemed, may be worth more or less than their original cost. The performance table does not reflect the deduction of taxes that a shareholder would pay on Fund distributions or the redemption of Fund shares. Current performance of the Fund may be lower or higher than the performance quoted. Performance data current to the most recent month end may be obtained by visiting www.hennessyfunds.com. Performance for periods on or prior to October 26, 2012, is that of the FBR Small Cap Financial Fund.
The Russell 2000® Financial Services Index is commonly used to measure the performance of U.S. small-capitalization financial sector stocks. The Russell 2000® Index is commonly used to measure the performance of U.S. small-capitalization stocks. One cannot invest directly in an index.
Frank Russell Company (“Russell”) is the source and owner of the trademarks, service marks, and copyrights related to the Russell Indexes. Russell® is a trademark of Frank Russell Company. Neither Russell nor its licensors accept any liability for any errors or omissions in the Russell Indexes or Russell ratings or underlying data and no party may rely on any Russell Indexes or Russell ratings or underlying data contained in this communication. No further distribution of Russell data is permitted without Russell’s express written consent. Russell does not promote, sponsor, or endorse the content of this communication.
The expense ratios presented are from the most recent prospectus. The expense ratios for the current reporting period are available in the Financial Highlights section of this report.
PERFORMANCE NARRATIVE
Portfolio Managers David H. Ellison and Ryan C. Kelley
Performance:
For the 12-month period ended October 31, 2018, the Investor Class of the Hennessy Small Cap Financial Fund returned -8.79%, underperforming the Russell 2000® Financial Services Index (the Fund’s primary benchmark) and the Russell 2000® Index, which returned -1.99% and 1.85%, respectively, for the same period.
The Fund’s underperformance relative to its primary benchmark can be attributed predominantly to stock selection, mainly in the Banking sector. Much of the underperformance began in the latter part of the period – the Fund is primarily invested in smaller, traditional depository franchises, and investors became increasingly concerned regarding asset quality issues as well as lack of substantial net interest margin expansion or loan growth. Banc of California, Inc., ConnectOne Bancorp, Inc., Eagle Bancorp, Inc., and Dime Community Bancshares, Inc. were among the holdings that detracted most from relative performance over the period. First BanCorp, Hingham Institution for Savings, Brookline Bancorp, Inc., and Meta Financial Group, Inc. were among the Fund’s best performing holdings and contributed positively to the Fund’s relative performance.
The Fund continues to hold all of the companies mentioned except for Meta Financial Group, Inc.
Portfolio Strategy:
Generally, the Fund tilts its investments more heavily toward regional banks, thrifts, and, at times, mortgage finance companies. Within these preferred sub-industries, we seek companies that we believe have high-quality management teams, uncomplicated business models, and sustainable earnings growth opportunities. Moreover, we identify companies that we expect will do well in the current environment, which is characterized by low-but-rising interest rates, competitive loan markets, and heightened regulatory control. We are less interested in companies that appear to promise an increase in profitability when interest rates rise or loan demand and pricing becomes more favorable because we believe these industry dynamics are difficult to predict.
Investment Commentary:
We continue to believe that the outlook for small-cap financial companies is good. The macroeconomic environment in the United States is positive. The U.S. economy is growing at a healthy rate, unemployment is low, and growth in both consumption and capital spending has accelerated over the last 12 months. Corporate earnings have risen significantly over the first nine months of 2018, helped, in part, by lower taxes. We expect earnings growth to be slower next year yet remain positive, driven primarily by continued steady economic growth.
In our opinion, the outlook for smaller banks and thrifts is also favorable, with the prospect of higher net interest margins as the Federal Reserve continues to increase short-term interest rates. We also expect to see continued consolidation in the sector, which should offer additional opportunities for higher profitability as a result of greater market power and economies of scale.
| HENNESSY FUNDS | 1-800-966-4354 | |
_______________
Opinions expressed are those of the Portfolio Managers as of the date written and are subject to change, are not guaranteed, and should not be considered investment advice or an indication of trading intent.
The Fund is non-diversified, meaning it may concentrate its assets in fewer individual holdings than a diversified fund, making it more exposed to individual stock volatility than a diversified fund. Investments are focused in the financial services industry; sector funds may be subject to a higher degree of market risk. The Fund invests in smaller companies, which may have more limited liquidity and greater volatility compared to larger companies. Please see the Fund’s prospectus for a more complete discussion of these and other risks.
References to specific securities should not be considered a recommendation to buy or sell any security. Fund holdings and sector allocations are subject to change. Please refer to the Schedule of Investments included in this report for additional portfolio information.
Earnings growth is not a measure of the Fund’s future performance.
| PERFORMANCE OVERVIEW/SCHEDULE OF INVESTMENTS |
Financial Statements
Schedule of Investments as of October 31, 2018 |
HENNESSY SMALL CAP FINANCIAL FUND
(% of Net Assets)
| TOP TEN HOLDINGS (EXCLUDING MONEY MARKET FUNDS) | % NET ASSETS |
| Hingham Institution for Savings | 5.17% |
| Union Bankshares Corp. | 4.87% |
| Brookline Bancorp, Inc. | 4.77% |
| OceanFirst Financial Corp. | 4.74% |
| Meridian Bancorp, Inc. | 4.27% |
| Kearny Financial Corp. of Maryland | 4.19% |
| Eagle Bancorp, Inc. | 3.74% |
| First BanCorp. | 3.69% |
| ConnectOne Bancorp, Inc. | 3.55% |
| Independent Bank Corp. | 3.48% |
Note: For presentation purposes, the Fund has grouped some of the industry categories. For purposes of categorizing securities for compliance with section 8(b)(1) of the Investment Company Act of 1940, as amended, the Fund uses more specific industry classifications.
The Global Industry Classification Standard (GICS®) was developed by and is the exclusive property and a service mark of MSCI, Inc. and Standard & Poor Financial Services LLC. It has been licensed for use by the Hennessy Funds.
| HENNESSY FUNDS | 1-800-966-4354 | |
| COMMON STOCKS – 89.67% | | Number | | | | | | % of | |
| | | of Shares | | | Value | | | Net Assets | |
| Financials – 89.67% | | | | | | | | | |
| Axos Financial, Inc. (a) | | | 45,000 | | | $ | 1,366,200 | | | | 0.87 | % |
| Banc of California, Inc. | | | 264,000 | | | | 4,210,800 | | | | 2.67 | % |
| BankUnited, Inc. | | | 120,000 | | | | 3,972,000 | | | | 2.52 | % |
| Banner Corp. | | | 60,000 | | | | 3,469,200 | | | | 2.20 | % |
| Beneficial Bancorp, Inc. | | | 225,000 | | | | 3,516,750 | | | | 2.23 | % |
| Blue Hills Bancorp, Inc. | | | 125,000 | | | | 2,901,250 | | | | 1.84 | % |
| Brookline Bancorp, Inc. | | | 485,000 | | | | 7,517,500 | | | | 4.77 | % |
| Capstar Financial Holdings, Inc. | | | 10,000 | | | | 147,800 | | | | 0.09 | % |
| Columbia Financial, Inc. (a) | | | 360,000 | | | | 5,428,800 | | | | 3.44 | % |
| ConnectOne Bancorp, Inc. | | | 270,000 | | | | 5,597,100 | | | | 3.55 | % |
| Dime Community Bancshares, Inc. | | | 80,000 | | | | 1,289,600 | | | | 0.82 | % |
| Eagle Bancorp, Inc. (a) | | | 120,000 | | | | 5,900,400 | | | | 3.74 | % |
| FCB Financial Holdings, Inc., Class A (a) | | | 105,000 | | | | 4,108,650 | | | | 2.61 | % |
| First BanCorp. (a)(b) | | | 630,000 | | | | 5,814,900 | | | | 3.69 | % |
| Flushing Financial Corp. | | | 5,000 | | | | 113,450 | | | | 0.07 | % |
| Green Bancorp, Inc. | | | 175,000 | | | | 3,237,500 | | | | 2.05 | % |
| HarborOne Bancorp, Inc. (a) | | | 290,000 | | | | 5,278,000 | | | | 3.35 | % |
| Hingham Institution for Savings | | | 40,000 | | | | 8,144,000 | | | | 5.17 | % |
| IBERIABANK Corp. | | | 52,500 | | | | 3,910,725 | | | | 2.48 | % |
| Independent Bank Corp. | | | 70,000 | | | | 5,491,500 | | | | 3.48 | % |
| Kearny Financial Corp. of Maryland | | | 510,000 | | | | 6,599,400 | | | | 4.19 | % |
| Lakeland Bancorp, Inc. | | | 170,000 | | | | 2,799,900 | | | | 1.78 | % |
| Meridian Bancorp, Inc. | | | 425,000 | | | | 6,732,000 | | | | 4.27 | % |
| Midland States Bancorp, Inc. | | | 45,000 | | | | 1,213,650 | | | | 0.77 | % |
| OceanFirst Financial Corp. | | | 295,000 | | | | 7,469,400 | | | | 4.74 | % |
| Opus Bank | | | 180,000 | | | | 3,418,200 | | | | 2.17 | % |
| PacWest Bancorp | | | 92,500 | | | | 3,757,350 | | | | 2.38 | % |
| People’s United Financial, Inc. | | | 140,000 | | | | 2,192,400 | | | | 1.39 | % |
| Provident Financial Services, Inc. | | | 15,000 | | | | 366,000 | | | | 0.23 | % |
| Sterling Bancorp | | | 250,000 | | | | 4,495,000 | | | | 2.85 | % |
| The Bank of N.T. Butterfield & Son Ltd. (b) | | | 30,000 | | | | 1,208,700 | | | | 0.77 | % |
| Union Bankshares Corp. | | | 225,000 | | | | 7,681,500 | | | | 4.87 | % |
| United Financial Bancorp, Inc. | | | 230,000 | | | | 3,553,500 | | | | 2.25 | % |
| Washington Federal, Inc. | | | 140,000 | | | | 3,942,400 | | | | 2.50 | % |
The accompanying notes are an integral part of these financial statements.
| COMMON STOCKS | | Number | | | | | | % of | |
| | | of Shares | | | Value | | | Net Assets | |
| Financials (Continued) | | | | | | | | | |
| Western Alliance Bancorp (a) | | | 15,000 | | | $ | 723,600 | | | | 0.46 | % |
| Wintrust Financial Corp. | | | 50,000 | | | | 3,807,000 | | | | 2.41 | % |
| | | | | | | | 141,376,125 | | | | 89.67 | % |
| Total Common Stocks | | | | | | | | | | | | |
| (Cost $128,374,584) | | | | | | | 141,376,125 | | | | 89.67 | % |
| | | | | | | | | | | | | |
| SHORT-TERM INVESTMENTS – 10.05% | | | | | | | | | | | | |
| | | | | | | | | | | | | |
| Money Market Funds – 10.05% | | | | | | | | | | | | |
| Fidelity Government Portfolio, Institutional Class, 2.06% (c) | | | 7,911,000 | | | | 7,911,000 | | | | 5.02 | % |
| Morgan Stanley Institutional Liquidity Fund, Government Portfolio, | | | | | | | | | | | | |
| Institutional Class, 2.05% (c) | | | 89,297 | | | | 89,297 | | | | 0.05 | % |
| The Government & Agency Portfolio, Institutional Class, 2.08% (c) | | | 7,849,000 | | | | 7,849,000 | | | | 4.98 | % |
| | | | | | | | 15,849,297 | | | | 10.05 | % |
| Total Short-Term Investments | | | | | | | | | | | | |
| (Cost $15,849,297) | | | | | | | 15,849,297 | | | | 10.05 | % |
| | | | | | | | | | | | | |
| Total Investments | | | | | | | | | | | | |
| (Cost $144,223,881) – 99.72% | | | | | | | 157,225,422 | | | | 99.72 | % |
| Other Assets in Excess of Liabilities – 0.28% | | | | | | | 436,313 | | | | 0.28 | % |
| | | | | | | | | | | | | |
TOTAL NET ASSETS – 100.00% | | | | | | $ | 157,661,735 | | | | 100.00 | % |
Percentages are stated as a percent of net assets.
| (a) | | Non-income producing security. |
| (b) | | U.S.-traded security of a foreign corporation. |
| (c) | | The rate listed is the fund’s seven-day yield as of October 31, 2018. |
Summary of Fair Value Exposure at October 31, 2018
The following is a summary of the inputs used to value the Fund’s net assets as of October 31, 2018 (See Note 3 in the accompanying notes to the financial statements):
| Common Stocks | | Level 1 | | | Level 2 | | | Level 3 | | | Total | |
| Financials | | $ | 141,376,125 | | | $ | — | | | $ | — | | | $ | 141,376,125 | |
| Total Common Stocks | | $ | 141,376,125 | | | $ | — | | | $ | — | | | $ | 141,376,125 | |
| Short-Term Investments | | | | | | | | | | | | | | | | |
| Money Market Funds | | $ | 15,849,297 | | | $ | — | | | $ | — | | | $ | 15,849,297 | |
| Total Short-Term Investments | | $ | 15,849,297 | | | $ | — | | | $ | — | | | $ | 15,849,297 | |
| Total Investments | | $ | 157,225,422 | | | $ | — | | | $ | — | | | $ | 157,225,422 | |
The accompanying notes are an integral part of these financial statements.
| HENNESSY FUNDS | 1-800-966-4354 | |
Financial Statements
Statement of Assets and Liabilities as of October 31, 2018 |
| ASSETS: | | | |
| Investments in securities, at value (cost $144,223,881) | | $ | 157,225,422 | |
| Dividends and interest receivable | | | 130,120 | |
| Receivable for fund shares sold | | | 154,311 | |
| Receivable for securities sold | | | 1,330,052 | |
| Prepaid expenses and other assets | | | 22,071 | |
| Total Assets | | | 158,861,976 | |
| | | | | |
| LIABILITIES: | | | | |
| Payable for securities purchased | | | 655,633 | |
| Payable for fund shares redeemed | | | 295,502 | |
| Payable to advisor | | | 127,743 | |
| Payable to administrator | | | 15,425 | |
| Payable to auditor | | | 21,899 | |
| Accrued distribution fees | | | 26,086 | |
| Accrued service fees | | | 10,971 | |
| Accrued trustees fees | | | 5,964 | |
| Accrued expenses and other payables | | | 41,018 | |
| Total Liabilities | | | 1,200,241 | |
| NET ASSETS | | $ | 157,661,735 | |
| | | | | |
| NET ASSETS CONSIST OF: | | | | |
| Capital stock | | $ | 135,883,798 | |
| Total distributable earnings | | | 21,777,937 | |
| Total Net Assets | | $ | 157,661,735 | |
| | | | | |
| NET ASSETS | | | | |
| Investor Class: | | | | |
| Shares authorized (no par value) | | Unlimited | |
| Net assets applicable to outstanding Investor Class shares | | $ | 121,997,850 | |
| Shares issued and outstanding | | | 5,556,065 | |
| Net asset value, offering price and redemption price per share | | $ | 21.96 | |
| | | | | |
| Institutional Class: | | | | |
| Shares authorized (no par value) | | Unlimited | |
| Net assets applicable to outstanding Institutional Class shares | | $ | 35,663,885 | |
| Shares issued and outstanding | | | 2,686,067 | |
| Net asset value, offering price and redemption price per share | | $ | 13.28 | |
The accompanying notes are an integral part of these financial statements.
| STATEMENT OF ASSETS AND LIABILITIES/STATEMENT OF OPERATIONS |
Financial Statements
Statement of Operations for the year ended October 31, 2018 |
| INVESTMENT INCOME: | | | |
| Dividend income | | $ | 3,092,630 | |
| Interest income | | | 137,076 | |
| Total investment income | | | 3,229,706 | |
| | | | | |
| EXPENSES: | | | | |
| Investment advisory fees (See Note 5) | | | 1,757,915 | |
| Sub-transfer agent expenses – Investor Class (See Note 5) | | | 344,353 | |
| Sub-transfer agent expenses – Institutional Class (See Note 5) | | | 26,717 | |
| Distribution fees – Investor Class (See Note 5) | | | 236,954 | |
| Administration, fund accounting, custody and transfer agent fees (See Note 5) | | | 188,398 | |
| Service fees – Investor Class (See Note 5) | | | 157,969 | |
| Federal and state registration fees | | | 44,405 | |
| Compliance expense (See Note 5) | | | 29,500 | |
| Reports to shareholders | | | 23,763 | |
| Audit fees | | | 22,500 | |
| Trustees’ fees and expenses | | | 17,265 | |
| Legal fees | | | 1,184 | |
| Other expenses | | | 16,173 | |
| Total expenses | | | 2,867,096 | |
| NET INVESTMENT INCOME | | $ | 362,610 | |
| | | | | |
| REALIZED AND UNREALIZED GAINS (LOSSES): | | | | |
| Net realized gain on investments | | $ | 12,332,055 | |
| Net change in unrealized appreciation/depreciation on investments | | | (27,410,886 | ) |
| Net loss on investments | | | (15,078,831 | ) |
| NET DECREASE IN NET ASSETS RESULTING FROM OPERATIONS | | $ | (14,716,221 | ) |
The accompanying notes are an integral part of these financial statements.
| HENNESSY FUNDS | 1-800-966-4354 | |
(This Page Intentionally Left Blank.)
| STATEMENTS OF CHANGES IN NET ASSETS |
Financial Statements
| Statements of Changes in Net Assets |
| | | Year Ended | | | Year Ended | |
| | | October 31, 2018 | | | October 31, 2017 | |
| OPERATIONS: | | | | | | |
| Net investment income (loss) | | $ | 362,610 | | | $ | (3,352 | ) |
| Net realized gain on investments | | | 12,332,055 | | | | 19,986,888 | |
| Net change in unrealized | | | | | | | | |
| appreciation/depreciation on investments | | | (27,410,886 | ) | | | 17,014,799 | |
| Net increase (decrease) in net assets resulting from operations | | | (14,716,221 | ) | | | 36,998,335 | |
| | | | | | | | | |
| DISTRIBUTIONS TO SHAREHOLDERS FROM: | | | | | | | | |
| Distributable earnings – Investor Class | | | (12,667,248 | ) | | | (20,280,034 | ) |
| Distributable earnings – Institutional Class | | | (2,810,391 | ) | | | (3,532,520 | ) |
| Total distributions | | | (15,477,639 | ) | | | (23,812,554 | )(1) |
| | | | | | | | | |
| CAPITAL SHARE TRANSACTIONS: | | | | | | | | |
| Proceeds from shares subscribed – Investor Class | | | 21,302,624 | | | | 100,903,651 | |
| Proceeds from shares subscribed – Institutional Class | | | 22,839,938 | | | | 35,239,059 | |
| Dividends reinvested – Investor Class | | | 12,401,989 | | | | 19,917,344 | |
| Dividends reinvested – Institutional Class | | | 2,696,156 | | | | 3,189,710 | |
| Cost of shares redeemed – Investor Class | | | (62,443,809 | ) | | | (90,350,351 | ) |
| Cost of shares redeemed – Institutional Class | | | (20,874,270 | ) | | | (23,511,159 | ) |
| Net increase (decrease) in net | | | | | | | | |
| assets derived from capital share transactions | | | (24,077,372 | ) | | | 45,388,254 | |
| TOTAL INCREASE (DECREASE) IN NET ASSETS | | | (54,271,232 | ) | | | 58,574,035 | |
| | | | | | | | | |
| NET ASSETS: | | | | | | | | |
| Beginning of year | | | 211,932,967 | | | | 153,358,932 | |
| End of year | | $ | 157,661,735 | | | $ | 211,932,967 | |
| | | | | | | | | |
| CHANGES IN SHARES OUTSTANDING: | | | | | | | | |
| Shares sold – Investor Class | | | 852,589 | | | | 3,914,617 | |
| Shares sold – Institutional Class | | | 1,489,112 | | | | 2,297,508 | |
| Shares issued to holders as reinvestment | | | | | | | | |
| of dividends – Investor Class | | | 506,624 | | | | 782,880 | |
| Shares issued to holders as reinvestment | | | | | | | | |
| of dividends – Institutional Class | | | 182,573 | | | | 206,594 | |
| Shares redeemed – Investor Class | | | (2,490,267 | ) | | | (3,635,991 | ) |
| Shares redeemed – Institutional Class | | | (1,402,574 | ) | | | (1,581,565 | ) |
| Net increase (decrease) in shares outstanding | | | (861,943 | ) | | | 1,984,043 | |
(1) | Includes net investment income distributions of $483,756 and $414,103 and net realized gain distributions of $19,796,278 and $3,118,417 for the Investor Class and Institutional Class, respectively. |
The accompanying notes are an integral part of these financial statements.
| HENNESSY FUNDS | 1-800-966-4354 | |
Financial Statements
For an Investor Class share outstanding throughout each year
PER SHARE DATA:
Net asset value, beginning of year
Income from investment operations:
Net investment income (loss)
Net realized and unrealized gains (losses) on investments
Total from investment operations
Less distributions:
Dividends from net investment income
Dividends from net realized gains
Total distributions
Paid-in capital from redemption fees
Net asset value, end of year
TOTAL RETURN
SUPPLEMENTAL DATA AND RATIOS:
Net assets, end of year (millions)
Ratio of expenses to average net assets
Ratio of net investment income (loss) to average net assets
Portfolio turnover rate(3)
(1) | Calculated based on average shares outstanding method. |
(2) | Amount is less than $0.01 or $(0.01). |
(3) | Portfolio turnover is calculated on the basis of the Fund as a whole. |
The accompanying notes are an integral part of these financial statements.
| FINANCIAL HIGHLIGHTS — INVESTOR CLASS |
| Year Ended October 31, | |
| 2018 | | | 2017 | | | 2016 | | | 2015 | | | 2014 | |
| | | | | | | | | | | | | | |
| $ | 26.02 | | | $ | 23.48 | | | $ | 23.81 | | | $ | 24.13 | | | $ | 25.40 | |
| | | | | | | | | | | | | | | | | | | |
| | | | | | | | | | | | | | | | | | | |
| | 0.03 | | | | (0.04 | ) | | | 0.10 | | | | 0.03 | (1) | | | (0.10 | ) |
| | (2.12 | ) | | | 5.83 | | | | 1.20 | | | | 2.99 | | | | 0.49 | |
| | (2.09 | ) | | | 5.79 | | | | 1.30 | | | | 3.02 | | | | 0.39 | |
| | | | | | | | | | | | | | | | | | | |
| | | | | | | | | | | | | | | | | | | |
| | (0.00 | )(2) | | | (0.06 | ) | | | (0.03 | ) | | | — | | | | (0.06 | ) |
| | (1.97 | ) | | | (3.19 | ) | | | (1.60 | ) | | | (3.34 | ) | | | (1.60 | ) |
| | (1.97 | ) | | | (3.25 | ) | | | (1.63 | ) | | | (3.34 | ) | | | (1.66 | ) |
| | — | | | | — | | | | — | | | | — | | | | 0.00 | (2) |
| $ | 21.96 | | | $ | 26.02 | | | $ | 23.48 | | | $ | 23.81 | | | $ | 24.13 | |
| | | | | | | | | | | | | | | | | | | |
| | (8.79 | )% | | | 25.03 | % | | | 5.80 | % | | | 14.51 | % | | | 1.40 | % |
| | | | | | | | | | | | | | | | | | | |
| | | | | | | | | | | | | | | | | | | |
| $ | 122.00 | | | $ | 174.01 | | | $ | 132.09 | | | $ | 218.50 | | | $ | 193.09 | |
| | 1.54 | % | | | 1.52 | % | | | 1.54 | % | | | 1.50 | % | | | 1.44 | % |
| | 0.11 | % | | | (0.06 | )% | | | 0.38 | % | | | 0.17 | % | | | (0.36 | )% |
| | 28 | % | | | 46 | % | | | 46 | % | | | 49 | % | | | 47 | % |
The accompanying notes are an integral part of these financial statements.
| HENNESSY FUNDS | 1-800-966-4354 | |
Financial Statements
For an Institutional Class share outstanding throughout each year
PER SHARE DATA:
Net asset value, beginning of year
Income from investment operations:
Net investment income (loss)
Net realized and unrealized gains (losses) on investments
Total from investment operations
Less distributions:
Dividends from net investment income
Dividends from net realized gains
Total distributions
Net asset value, end of year
TOTAL RETURN
SUPPLEMENTAL DATA AND RATIOS:
Net assets, end of year (millions)
Ratio of expenses to average net assets
Ratio of net investment income (loss) to average net assets
Portfolio turnover rate(2)
(1) | Calculated based on average shares outstanding method. |
(2) | Portfolio turnover is calculated on the basis of the Fund as a whole. |
The accompanying notes are an integral part of these financial statements.
| FINANCIAL HIGHLIGHTS — INSTITUTIONAL CLASS |
| Year Ended October 31, | |
| 2018 | | | 2017 | | | 2016 | | | 2015 | | | 2014 | |
| | | | | | | | | | | | | | |
| $ | 15.69 | | | $ | 14.23 | | | $ | 14.39 | | | $ | 14.53 | | | $ | 15.96 | |
| | | | | | | | | | | | | | | | | | | |
| | | | | | | | | | | | | | | | | | | |
| | 0.07 | | | | 0.02 | | | | 0.09 | | | | 0.06 | (1) | | | (0.09 | ) |
| | (1.27 | ) | | | 3.56 | | | | 0.75 | | | | 1.81 | | | | 0.40 | |
| | (1.20 | ) | | | 3.58 | | | | 0.84 | | | | 1.87 | | | | 0.31 | |
| | | | | | | | | | | | | | | | | | | |
| | | | | | | | | | | | | | | | | | | |
| | (0.02 | ) | | | (0.17 | ) | | | (0.04 | ) | | | — | | | | (0.14 | ) |
| | (1.19 | ) | | | (1.95 | ) | | | (0.96 | ) | | | (2.01 | ) | | | (1.60 | ) |
| | (1.21 | ) | | | (2.12 | ) | | | (1.00 | ) | | | (2.01 | ) | | | (1.74 | ) |
| $ | 13.28 | | | $ | 15.69 | | | $ | 14.23 | | | $ | 14.39 | | | $ | 14.53 | |
| | | | | | | | | | | | | | | | | | | |
| | (8.42 | )% | | | 25.56 | % | | | 6.22 | % | | | 14.91 | % | | | 1.70 | % |
| | | | | | | | | | | | | | | | | | | |
| | | | | | | | | | | | | | | | | | | |
| $ | 35.66 | | | $ | 37.92 | | | $ | 21.27 | | | $ | 25.94 | | | $ | 42.23 | |
| | 1.15 | % | | | 1.15 | % | | | 1.17 | % | | | 1.17 | % | | | 1.12 | % |
| | 0.51 | % | | | 0.30 | % | | | 0.72 | % | | | 0.48 | % | | | (0.04 | )% |
| | 28 | % | | | 46 | % | | | 46 | % | | | 49 | % | | | 47 | % |
The accompanying notes are an integral part of these financial statements.
| HENNESSY FUNDS | 1-800-966-4354 | |
Financial Statements
Notes to the Financial Statements October 31, 2018 |
1). ORGANIZATION
The Hennessy Small Cap Financial Fund (the “Fund”) is a series of Hennessy Funds Trust (the “Trust”), which was organized as a Delaware statutory trust on September 17, 1992. The Fund is an open-end management investment company registered under the Investment Company Act of 1940, as amended. The investment objective of the Fund is capital appreciation. The Fund is a non-diversified fund.
The Fund offers Investor Class and Institutional Class shares. Each class of shares differs principally in its respective 12b-1 distribution and service, shareholder servicing, and sub-transfer agent expenses. There are no sales charges. Each class has identical rights to earnings, assets, and voting privileges, except for class-specific expenses and exclusive rights to vote on matters affecting only an individual class.
As an investment company, the Fund follows the investment company accounting and reporting guidance of the Financial Accounting Standards Board (“FASB”) Accounting Standard Codification Topic 946 “Financial Services—Investment Companies.”
2). SIGNIFICANT ACCOUNTING POLICIES
The following is a summary of significant accounting policies consistently followed by the Fund in the preparation of the financial statements. These policies conform to U.S. generally accepted accounting principles (“GAAP”).
| a). | Securities Valuation – All investments in securities are recorded at their estimated fair value, as described in Note 3. |
| | |
| b). | Federal Income Taxes – No provision for federal income taxes or excise taxes has been made because the Fund has elected to be taxed as a regulated investment company and intends to distribute substantially all of its taxable income to its shareholders and otherwise comply with the provisions of the Internal Revenue Code of 1986, as amended, applicable to regulated investment companies. Net investment income/loss and realized gains/losses for federal income tax purposes may differ from those reported in the financial statements because of temporary book and tax basis differences. Temporary differences are primarily the result of the treatment of wash sales for tax reporting purposes. The Fund recognizes interest and penalties related to income tax benefits, if any, in the Statement of Operations as an income tax expense. Distributions from net realized gains for book purposes may include short-term capital gains, which are included as ordinary income to shareholders for tax purposes. The Fund may utilize equalization accounting for tax purposes and designate earnings and profits, including net realized gains distributed to shareholders on redemption of shares, as part of the dividends paid deduction for income tax purposes. |
| | |
| | Due to inherent differences in the recognition of income, expenses, and realized gains/losses under GAAP and federal income tax regulations, permanent differences between book and tax basis for reporting for fiscal year 2018 have been identified and appropriately reclassified in the Statement of Assets and Liabilities. The adjustments are as follows: |
| Total | |
| Distributable | |
Earnings | Capital Stock |
| $(2,752,574) | $2,752,574 |
| NOTES TO THE FINANCIAL STATEMENTS |
| c). | Accounting for Uncertainty in Income Taxes – The Fund has accounting policies regarding recognition and measurement of tax positions taken or expected to be taken on a tax return. The tax returns of the Fund for the prior three fiscal years are open for examination. The Fund has reviewed all open tax years in major jurisdictions and concluded that there is no impact on the Fund’s net assets and no tax liability resulting from unrecognized tax benefits relating to uncertain income tax positions taken or expected to be taken on a tax return. The Fund’s major tax jurisdictions are U.S. federal and Delaware. |
| | |
| d). | Income and Expenses – Dividend income is recognized on the ex-dividend date or as soon as information is available to the Fund. Interest income, which includes the amortization of premium and accretion of discount, is recognized on an accrual basis. Other non-cash dividends are recognized as investment income at the fair value of the property received. The Fund is charged for those expenses that are directly attributable to its portfolio, such as advisory, administration, and certain shareholder service fees. Income, expenses (other than expenses attributable to a specific class), and realized and unrealized gains/losses on investments are allocated to each class of shares based on such class’s net assets. |
| | |
| e). | Distributions to Shareholders – Dividends from net investment income for the Fund, if any, are declared and paid annually, usually in December. Distributions of net realized capital gains, if any, are declared and paid annually, usually in December. |
| | |
| f). | Security Transactions – Investment and shareholder transactions are recorded on the trade date. The Fund determines the realized gain/loss from an investment transaction by comparing the original cost of the security lot sold with the net sale proceeds. Discounts and premiums on securities purchased are accreted or amortized, respectively, over the life of each such security. |
| | |
| g). | Use of Estimates – The preparation of financial statements in conformity with GAAP requires management to make estimates and assumptions that affect the reported amounts of assets and liabilities and disclosure of contingent assets and liabilities at the date of the financial statements and the reported change in net assets during the reporting period. Actual results could differ from those estimates. |
| | |
| h). | Share Valuation – The net asset value (“NAV”) per share of the Fund is calculated by dividing (i) the total value of the securities held by the Fund, plus cash and other assets, minus all liabilities (including estimated accrued expenses) by (ii) the total number of shares outstanding for the Fund, rounded to the nearest cent. The Fund’s shares will not be priced on days the New York Stock Exchange is closed for trading. The offering and redemption price per share for the Fund is equal to the Fund’s NAV per share. |
| | |
| i). | New Accounting Pronouncements – In August 2018, the FASB issued Accounting Standards Update No. 2018-13 “Disclosure Framework—Changes to the Disclosure Requirements for Fair Value Measurement” (“ASU 2018-13”). ASU 2018-13 eliminates the requirement to disclose the amount of and reasons for transfers between Level 1 and Level 2 of the fair value hierarchy, the timing of transfers between levels of the fair value hierarchy, and the valuation processes for Level 3 fair value measurements. ASU 2018-13 does not eliminate the requirement to disclose the range and weighted average used to develop significant unobservable inputs for Level 3 fair value measurements, and the changes in unrealized gains and losses for recurring Level 3 fair value measurements. ASU 2018-13 requires that information is provided about the measurement uncertainty of Level 3 fair value measurements as of the reporting date. The guidance is effective for fiscal years beginning after December 15, 2019, and interim periods within those fiscal years. Management has |
| HENNESSY FUNDS | 1-800-966-4354 | |
| | evaluated the impact of this change in guidance, and due to the permissibility of early adoption, modified the Fund’s fair value disclosures for the current reporting period. |
| | |
| j). | New Rule Issuances – In August 2018, the Securities and Exchange Commission issued Final Rule Release No. 33 10532, Disclosure Update and Simplification, which in part amends certain financial statement disclosure requirements of Regulation S-X that have become redundant, duplicative, overlapping, outdated, or superseded, in light of other Commission disclosure requirements, GAAP, or changes in the information environment. The amendments are intended to facilitate the disclosure of information to investors and simplify compliance without significantly altering the total mix of information provided to investors. The amendments to Rule 6-04.17 of Regulation S-X (balance sheet) were amended to require presentation of the total, rather than the components of net assets, of distributable earnings on the balance sheet. Consistent with GAAP, funds will be required to disclose total distributable earnings. The amendments to Rule 6-09 of Regulation S-X (statement of changes in net assets) omit the requirement to separately state the sources of distributions paid as well as omit the requirement to parenthetically state the book basis amount of undistributed net investment income. Instead, consistent with GAAP, funds will be required to disclose the total amount of distributions paid, except that any tax return of capital must be separately disclosed. The requirements of the Final Rule Release are effective November 5, 2018 and the Fund’s Statement of Assets and Liabilities and the Statement of Changes in Net Assets for the current and prior reporting period have been modified accordingly. |
3). SECURITIES VALUATION
The Fund follows fair valuation accounting standards that establish an authoritative definition of fair value and set out a hierarchy for measuring fair value. These standards require additional disclosures about the various inputs and valuation techniques used to develop the measurements of fair value and a discussion of changes in valuation techniques and related inputs during the period. These inputs are summarized in the three broad levels listed below:
| | Level 1 – | Unadjusted, quoted prices in active markets for identical instruments that the Fund has the ability to access at the date of measurement. |
| | | |
| | Level 2 – | Other significant observable inputs (including, but not limited to, quoted prices in active markets for similar instruments, quoted prices in markets that are not active for identical or similar instruments, and model-derived valuations in which all significant inputs and significant value drivers are observable in active markets, such as interest rates, prepayment speeds, credit risk curves, default rates, and similar data). |
| | | |
| | Level 3 – | Significant unobservable inputs (including the Fund’s own assumptions about what market participants would use to price the asset or liability based on the best available information) when observable inputs are unavailable. |
Following is a description of the valuation techniques applied to the Fund’s major categories of assets and liabilities measured at fair value on a recurring basis.
| | Equity Securities – Equity securities, including common stocks, preferred stocks, foreign-issued common stocks, exchange-traded funds, closed-end mutual funds, partnerships, rights, and real estate investment trusts, that are traded on a securities exchange for which a last-quoted sales price is readily available will generally be valued at the last sales price as reported by the primary exchange on which the securities are listed. Securities listed on The NASDAQ Stock Market (“NASDAQ”) |
| NOTES TO THE FINANCIAL STATEMENTS |
| | will generally be valued at the NASDAQ Official Closing Price, which may differ from the last sales price reported. Securities traded on a securities exchange for which a last-quoted sales price is not readily available will generally be valued at the mean between the bid and ask prices. To the extent these securities are actively traded and valuation adjustments are not applied, they are classified in Level 1 of the fair value hierarchy. Securities traded on foreign exchanges generally are not valued at the same time the Fund calculates its NAV because most foreign markets close well before such time. The earlier close of most foreign markets gives rise to the possibility that significant events, including broad market moves, may have occurred in the interim. In certain circumstances, it may be determined that a foreign security needs to be fair valued because it appears that the value of the security might have been materially affected by events occurring after the close of the market in which the security is principally traded, but before the time the Fund calculates its NAV, such as by a development that affects an entire market or region (e.g., a weather-related event) or a potentially global development (e.g., a terrorist attack that may be expected to have an effect on investor expectations worldwide). |
| | |
| | Registered Investment Companies – Investments in open-end registered investment companies, commonly referred to as mutual funds, are generally priced at the ending NAV provided by the applicable mutual fund’s service agent and will be classified in Level 1 of the fair value hierarchy. |
| | |
| | Debt Securities – Debt securities, including corporate bonds, asset-backed securities, mortgage-backed securities, municipal bonds, U.S. Treasuries, and U.S. government agency issues, are generally valued at market on the basis of valuations furnished by an independent pricing service that utilizes both dealer-supplied valuations and formula-based techniques. The pricing service may consider recently executed transactions in securities of the issuer or comparable issuers, market price quotations (where observable), bond spreads, and fundamental data relating to the issuer. In addition, the model may incorporate observable market data, such as reported sales of similar securities, broker quotes, yields, bids, offers, and reference data. Certain securities are valued primarily using dealer quotations. These securities are generally classified in Level 2 of the fair value hierarchy. |
| | |
| | Short-Term Securities – Short-term equity investments, including money market funds, are valued in the manner specified above. Short-term debt investments with an original term to maturity of 60 days or less are valued at amortized cost, which approximates fair market value. If the original term to maturity of a short-term debt investment exceeded 60 days, then the values as of the 61st day prior to maturity are amortized. Amortized cost is not used if its use would be inappropriate due to credit or other impairments of the issuer, in which case the security’s fair value would be determined, as described below. Short-term securities are generally classified in Level 1 or Level 2 of the fair market hierarchy depending on the inputs used and market activity levels for specific securities. |
The Board of Trustees of the Fund (the “Board”) has adopted fair value pricing procedures that are followed when a price for a security is not readily available or if a significant event has occurred that indicates the closing price of a security no longer represents the true value of that security. Fair value pricing determinations are made in good faith in accordance with these procedures. There are numerous criteria that will be given consideration in determining a fair value of a security, such as the trading volume of a security and markets, the values of other similar securities, and news events with direct bearing on a security or markets. Fair value pricing results in an estimated price for a security that reflects the amount the Fund might reasonably expect to receive in a current
| HENNESSY FUNDS | 1-800-966-4354 | |
sale. Depending on the relative significance of the valuation inputs, these securities may be classified in either Level 2 or Level 3 of the fair value hierarchy.
The fair valuation of foreign securities may be determined with the assistance of a pricing service using correlations between the movement of prices of such securities and indices of domestic securities and other appropriate indicators, such as closing market prices of relevant American Depositary Receipts or futures contracts. The effect of using fair value pricing is that the Fund’s NAV will reflect the affected portfolio securities’ values as determined by the Board or its designee, pursuant to the fair value pricing procedures adopted by the Board, instead of being determined by the market. Using a fair value pricing methodology to price a foreign security may result in a value that is different from such foreign security’s most recent closing price and from the value used by other investment companies to calculate their NAVs. Such securities are generally classified in Level 2 of the fair valuation hierarchy. Because the Fund may invest in foreign securities, the value of the Fund’s portfolio securities may change on days when you will not be able to purchase or redeem your shares.
The Board has delegated day-to-day valuation matters to a Valuation Committee comprised of one or more representatives from Hennessy Advisors, Inc., the Fund’s investment advisor (the “Advisor”). The function of the Valuation Committee is to value securities where current and reliable market quotations are not readily available. All actions taken by the Valuation Committee are reviewed by the Board.
The Fund has performed an analysis of all existing investments to determine the significance and character of all inputs to their fair value determinations. Various inputs are used to determine the value of the Fund’s investments. The inputs or methodology used for valuing securities are not necessarily an indication of the risk associated with investing in those securities. Details related to the fair valuation hierarchy of the Fund’s securities as of October 31, 2018, are included in the Schedule of Investments.
4). INVESTMENT TRANSACTIONS
Purchases and sales of investment securities (excluding government and short-term investments) for the Fund during fiscal year 2018 were $52,311,129 and $100,724,973, respectively.
There were no purchases or sales/maturities of long-term U.S. government securities for the Fund during fiscal year 2018.
The Fund is permitted to purchase or sell securities from or to another fund in the Hennessy Funds family of funds (the “Hennessy Funds”) under specified conditions outlined in procedures adopted by the Board. The procedures have been designed to ensure that any purchase or sale of securities by the Fund from or to another Hennessy Fund complies with Rule 17a-7 of the Investment Company Act of 1940, as amended. During fiscal year 2018, the Fund did not engage in purchases or sales of securities pursuant to Rule 17a-7 of the Investment Company Act of 1940, as amended.
5). INVESTMENT ADVISORY FEE AND OTHER TRANSACTIONS WITH AFFILIATES
The Advisor provides the Fund with investment advisory services under an Investment Advisory Agreement. The Advisor furnishes all investment advice, office space, and facilities, as well as most of the personnel needed by the Fund. As compensation for its services, the Advisor is entitled to a monthly fee from the Fund. The fee is based upon the average daily net assets of the Fund at an annual rate of 0.90%. The net investment advisory fees expensed by the Fund during fiscal year 2018 are included in the Statement of Operations.
| NOTES TO THE FINANCIAL STATEMENTS |
The Board has approved a Shareholder Servicing Agreement for Investor Class shares of the Fund, which was instituted to compensate the Advisor for the non-investment advisory services it provides to the Fund. The Shareholder Servicing Agreement provides for a monthly fee paid to the Advisor at an annual rate of 0.10% of the average daily net assets of the Fund attributable to Investor Class shares. The shareholder service fees expensed by the Fund during fiscal year 2018 are included in the Statement of Operations.
The Fund has adopted a plan pursuant to Rule 12b-1 under the Investment Company Act of 1940, as amended, that authorizes payments in connection with the distribution of the Fund’s shares at an annual rate of up to 0.25% of the Fund’s average daily net assets attributable to Investor Class shares. Even though the authorized rate is up to 0.25%, the Fund is currently only using up to 0.15% of its average daily net assets attributable to Investor Class shares for such purpose. Amounts paid under the plan may be spent on any activities or expenses primarily intended to result in the sale of shares, including, but not limited to, advertising, shareholder account servicing, printing and mailing of prospectuses to other than current shareholders, printing and mailing of sales literature, and compensation for sales and marketing activities or to financial institutions and others, such as dealers and distributors. The distribution fees expensed by the Fund during fiscal year 2018 are included in the Statement of Operations.
The Fund has entered into agreements with various brokers, dealers, and financial intermediaries in connection with the sale of shares of the Fund. The agreements provide for periodic payments by the Fund to the brokers, dealers, and financial intermediaries for providing certain shareholder maintenance services (sub-transfer agent expenses). These shareholder services include the pre-processing and quality control of new accounts, shareholder correspondence, answering customer inquiries regarding account status, and facilitating shareholder telephone transactions. The sub-transfer agent fees expensed by the Fund during fiscal year 2018 are included in the Statement of Operations.
U.S. Bancorp Fund Services, LLC, d/b/a U.S. Bank Global Fund Services (“Fund Services”) provides the Fund with administrative, fund accounting, and transfer agent services. As administrator, Fund Services is responsible for activities such as (i) preparing various federal and state regulatory filings, reports, and returns for the Fund, (ii) preparing reports and materials to be supplied to the Board, (iii) monitoring the activities of the Fund’s custodian, transfer agent, and accountants, and (iv) coordinating the preparation and payment of the Fund’s expenses and reviewing the Fund’s expense accruals. U.S. Bank N.A., an affiliate of Fund Services, serves as the Fund’s custodian. The servicing agreements between the Trust and Fund Services and U.S. Bank N.A. contain a fee schedule that is inclusive of administrative, fund accounting, custody, and transfer agent fees. The administrative, fund accounting, custody, and transfer agent fees expensed by the Fund during fiscal year 2018 are included in the Statement of Operations.
Quasar Distributors, LLC acts as the Fund’s principal underwriter in a continuous public offering of the Fund’s shares. Quasar Distributors, LLC is an affiliate of Fund Services and U.S. Bank N.A.
The officers of the Fund are affiliated with the Advisor. Such officers, with the exception of the Chief Compliance Officer and the Senior Compliance Officer, receive no compensation from the Fund for serving in their respective roles. The Fund, along with the other Hennessy Funds, makes reimbursement payments, on an equal basis, to the Advisor for a portion of the salary and benefits associated with the office of the Chief Compliance Officer and for all of the salary and benefits associated with the office of the Senior Compliance Officer. The compliance fees expensed by the Fund during fiscal year 2018 are included in the Statement of Operations.
| HENNESSY FUNDS | 1-800-966-4354 | |
6). GUARANTEES AND INDEMNIFICATIONS
Under the Hennessy Funds’ organizational documents, their officers and trustees are indemnified by the Hennessy Funds against certain liabilities arising out of the performance of their duties to the Hennessy Funds. Additionally, in the normal course of business, the Hennessy Funds enter into contracts with service providers that contain general indemnification clauses. The Fund’s maximum exposure under these arrangements is unknown as this would involve future claims that may be made against the Fund that have not yet occurred. Currently, the Fund expects the risk of loss to be remote.
7). LINE OF CREDIT
The Fund has an uncommitted line of credit with the other Hennessy Funds in the amount of the lesser of (i) $100,000,000 or (ii) 33.33% of each Hennessy Fund’s net assets, or 30% for the Hennessy Gas Utility Fund and 10% for the Hennessy Balanced Fund, intended to provide short-term financing, if necessary, subject to certain restrictions, in connection with shareholder redemptions. The credit facility is with the Hennessy Funds’ custodian bank, U.S. Bank N.A. Borrowings under this arrangement bear interest at the bank’s prime rate and are secured by all of the Fund’s assets (as to its own borrowings only). During fiscal year 2018, the Fund did not have any borrowings outstanding under the line of credit.
8). FEDERAL TAX INFORMATION
As of October 31, 2018, the components of accumulated earnings (losses) for income tax purposes were as follows:
| | | Investments | |
| Cost of investments for tax purposes | | $ | 144,911,472 | |
| Gross tax unrealized appreciation | | $ | 20,712,537 | |
| Gross tax unrealized depreciation | | | (8,398,587 | ) |
| Net tax unrealized appreciation/(depreciation) | | $ | 12,313,950 | |
| Undistributed ordinary income | | $ | 304,362 | |
| Undistributed long-term capital gains | | | 9,159,625 | |
| Total distributable earnings | | $ | 9,463,987 | |
| Other accumulated gain/(loss) | | $ | — | |
| Total accumulated gain/(loss) | | $ | 21,777,937 | |
The difference between book-basis unrealized appreciation/depreciation (as shown in the Statement of Assets and Liabilities) and tax-basis unrealized appreciation/depreciation (as shown above) is attributable primarily to wash sales.
As of October 31, 2018, the Fund had no tax basis capital losses to offset future capital gains.
As of October 31, 2018, the Fund did not defer, on a tax basis, any late-year ordinary losses. Late-year ordinary losses are net ordinary losses incurred after December 31, 2017, but within the taxable year, that are deemed to arise on the first day of the Fund’s next taxable year.
| NOTES TO THE FINANCIAL STATEMENTS |
During fiscal year 2018 and fiscal year 2017, the tax character of distributions paid by the Fund was as follows:
| | | Year Ended | | | Year Ended | |
| | | October 31, 2018 | | | October 31, 2017 | |
Ordinary income(1) | | $ | 1,372,736 | | | $ | 897,859 | |
| Long-term capital gain | | | 14,104,903 | | | | 22,914,695 | |
| | | $ | 15,477,639 | | | $ | 23,812,554 | |
(1) Ordinary income includes short-term capital gains.
9). EVENTS SUBSEQUENT TO YEAR END
Management has evaluated the Fund’s related events and transactions that occurred subsequent to October 31, 2018, through the date of issuance of the Fund’s financial statements. Other than as disclosed below, management has determined that there were no subsequent events requiring recognition or disclosure in the financial statements.
On December 7, 2018, capital gains were declared and paid to shareholders of record on December 6, 2018, as follows:
| | Long-term | Short-term |
| Investor Class | $1.31958 | $0.00162 |
| Institutional Class | $0.82307 | $0.00101 |
On December 27, 2018, income distributions were declared and paid to shareholders of record on December 26, 2018, as follows:
| Investor Class | $0.07118721 | |
| Institutional Class | $0.18030516 | |
| HENNESSY FUNDS | 1-800-966-4354 | |
Report of Independent Registered Public
Accounting Firm
To the Board of Trustees of Hennessy Funds Trust
and the shareholders of Hennessy Small Cap Financial Fund
Novato, CA
Opinion on the Financial Statements
We have audited the accompanying statement of assets and liabilities of Hennessy Small Cap Financial Fund (the “Fund”), a series of Hennessy Funds Trust, including the schedule of investments, as of October 31, 2018, the related statement of operations for the year then ended, the statements of changes in net assets for each of the two years in the period then ended, financial highlights for each of the five years in the period then ended, and the related notes (collectively referred to as the “financial statements”). In our opinion, the financial statements present fairly, in all material respects, the financial position of the Fund as of October 31, 2018, the results of its operations for the year then ended, the changes in its net assets for each of the two years in the period then ended, and the financial highlights for each of the five years in the period then ended, in conformity with accounting principles generally accepted in the United States of America.
Basis for Opinion
These financial statements are the responsibility of the Fund’s management. Our responsibility is to express an opinion on the Fund’s financial statements based on our audits. We are a public accounting firm registered with the Public Company Accounting Oversight Board (United States) (“PCAOB”) and are required to be independent with respect to the Fund in accordance with the U.S. federal securities laws and the applicable rules and regulations of the Securities and Exchange Commission and the PCAOB. We have served as the auditor of one or more of the funds in the Trust since 2002.
We conducted our audits in accordance with the standards of the PCAOB. Those standards require that we plan and perform the audit to obtain reasonable assurance about whether the financial statements are free of material misstatement, whether due to error or fraud. The Fund is not required to have, nor were we engaged to perform, an audit of its internal control over financial reporting. As part of our audits we are required to obtain an understanding of internal control over financial reporting, but not for the purpose of expressing an opinion on the effectiveness of the Fund’s internal control over financial reporting. Accordingly, we express no such opinion.
Our audits included performing procedures to assess the risks of material misstatement of the financial statements, whether due to error or fraud, and performing procedures that respond to those risks. Such procedures included examining, on a test basis, evidence regarding the amounts and disclosures in the financial statements. Our audits also included evaluating the accounting principles used and significant estimates made by management, as well as evaluating the overall presentation of the financial statements. Our procedures included confirmation of securities owned as of October 31, 2018 by correspondence with the custodian and brokers; when replies were not received from brokers, we performed other auditing procedures. We believe that our audits provide a reasonable basis for our opinion.
TAIT, WELLER & BAKER LLP
Philadelphia, Pennsylvania
December 27, 2018
| REPORT OF INDEPENDENT REGISTERED PUBLIC ACCOUNTING FIRM/ TRUSTEES AND OFFICERS |
Trustees and Officers of the Fund (Unaudited)
The business and affairs of the Funds are managed under the direction of the Board of Trustees of the Trust, and the Board of Trustees elects the Officers of the Trust. Beginning in March 2015, the Board of Trustees has from time to time appointed advisers to the Board of Trustees (“Advisers”) with the intention of having qualified individuals serve in an advisory capacity in order to garner experience in the mutual fund and asset management industry and be considered as potential Trustees in the future. There are currently three Advisers: Brian Alexander, Doug Franklin, and Claire Knoles. As Advisers, Mr. Alexander, Mr. Franklin, and Ms. Knoles attend meetings of the Board of Trustees and act as non-voting participants. Information pertaining to the Trustees, Advisers, and the Officers of the Trust is set forth below. The Trustees and Officers serve until their successors are duly elected and qualified or until their earlier death, resignation, or removal. Each Trustee oversees the 16 Hennessy Funds. Unless otherwise indicated, the address of all persons listed below is 7250 Redwood Boulevard, Suite 200, Novato, CA 94945. The Fund’s Statement of Additional Information includes more information about the persons listed below and is available, without charge, upon request by calling 1-800-966-4354.
| | | | Other |
| | | | Directorships |
| | | | Held Outside |
| Name, (Year of Birth), | | | of Fund |
| and Position Held | Start Date | Principal Occupation(s) | Complex During |
with the Trust | of Service | During Past Five Years | Past Five Years(1) |
| | |
| Disinterested Trustees and Advisers | |
| | | | |
| J. Dennis DeSousa | January 1996 | Mr. DeSousa is a real estate investor. | None. |
| (1936) | | | |
| Trustee | | | |
| | | | |
| Robert T. Doyle | January 1996 | Mr. Doyle has been the Sheriff of | None. |
| (1947) | | Marin County, California since 1996. | |
| Trustee | | | |
| | | | |
| Gerald P. Richardson | May 2004 | Mr. Richardson is an independent | None. |
| (1945) | | consultant in the securities industry. | |
| Trustee | | | |
| | | | |
| Brian Alexander | March 2015 | Mr. Alexander has worked for the | None. |
| (1981) | | Sutter Health organization since | |
| Adviser to the Board | | 2011 in various positions. He has | |
| | | served as the Chief Executive Officer | |
| | | of the Sutter Roseville Medical | |
| | | Center since 2018. From 2016 through | |
| | | 2018, he served as the Vice President | |
| | | of Strategy for the Sutter Health Valley | |
| | | Area, which includes 11 hospitals, | |
| | | 13 ambulatory surgery centers, | |
| | | 16,000 employees, and 1,900 physicians. | |
| | | From 2013 through 2016, Mr. Alexander | |
| | | served as Sutter Novato Community | |
| | | Hospital’s Chief Administrative Officer, | |
| | | and from 2011 through 2012, he | |
| | | served as a Director of Strategy | |
| | | within Sutter’s West Bay Region. | |
| HENNESSY FUNDS | 1-800-966-4354 | |
| | | | Other |
| | | | Directorships |
| | | | Held Outside |
| Name, (Year of Birth), | | | of Fund |
| and Position Held | Start Date | Principal Occupation(s) | Complex During |
with the Trust | of Service | During Past Five Years | Past Five Years(1) |
| | | | |
| Doug Franklin | March 2016 | Mr. Franklin is a retired insurance | None. |
| (1964) | | industry executive. From 1987 | |
| Adviser to the Board | | through 2015, he was employed | |
| | | by the Allianz-Fireman’s Fund | |
| | | Insurance Company in various | |
| | | positions, including as its Chief | |
| | | Actuary and Chief Risk Officer. | |
| | | | |
| Claire Knoles | December 2015 | Ms. Knoles is a founder of Kiosk and | None. |
| (1974) | | has served as its Chief Operating | |
| Adviser to the Board | | Officer since 2004. Kiosk is a full | |
| | | service marketing agency with | |
| | | offices in the San Francisco Bay | |
| | | Area, Toronto, and Liverpool, UK. | |
| | | | |
Interested Trustee(2) | | | |
| | | | |
| Neil J. Hennessy | January 1996 as | Mr. Neil Hennessy has been employed | Hennessy |
| (1956) | a Trustee and | by Hennessy Advisors, Inc. since | Advisors, Inc. |
| Trustee, Chairman of | June 2008 as | 1989 and currently serves as its | |
| the Board, Chief | an Officer | Chairman and Chief Executive Officer. | |
| Investment Officer, | | | |
| Portfolio Manager, | | | |
| and President | | | |
| Name, (Year of Birth), | | |
| and Position Held | Start Date | Principal Occupation(s) |
with the Trust | of Service | During Past Five Years |
| | | |
| Officers | | |
| | | |
| Teresa M. Nilsen | January 1996 | Ms. Nilsen has been employed by Hennessy Advisors, Inc. |
| (1966) | | since 1989 and currently serves as its President, Chief Operating |
| Executive Vice President | | Officer, and Secretary. |
| and Treasurer | | |
| | | |
| Daniel B. Steadman | March 2000 | Mr. Steadman has been employed by Hennessy Advisors, Inc. |
| (1956) | | since 2000 and currently serves as its Executive Vice President. |
| Executive Vice President | | |
| and Secretary | | |
| | | |
| Brian Carlson | December 2013 | Mr. Carlson has been employed by Hennessy Advisors, Inc. |
| (1972) | | since December 2013 and currently serves as its Chief |
| Senior Vice President | | Compliance Officer and Senior Vice President. |
| and Head of Distribution | | |
| | | |
| Jennifer Cheskiewicz | June 2013 | Ms. Cheskiewicz has been employed by Hennessy Advisors, Inc. |
(1977)(3) | | as its General Counsel since June 2013. |
| Senior Vice President and | | |
| Chief Compliance Officer | | |
| TRUSTEES AND OFFICERS OF THE FUND |
| Name, (Year of Birth), | | |
| and Position Held | Start Date | Principal Occupation(s) |
with the Trust | of Service | During Past Five Years |
| | | |
| David Ellison | October 2012 | Mr. Ellison has been employed by Hennessy Advisors, Inc. since |
(1958)(4) | | October 2012. He has served as a Portfolio Manager of the |
| Senior Vice President | | Hennessy Large Cap Financial Fund and the Hennessy Small |
| and Portfolio Manager | | Cap Financial Fund since inception. Mr. Ellison also served as a |
| | | Portfolio Manager of the Hennessy Technology Fund from its |
| | | inception until February 2017. Mr. Ellison served as Director, |
| | | CIO and President of FBR Fund Advisers, Inc. from December |
| | | 1999 to October 2012. |
| | | |
| Ryan C. Kelley | March 2013 | Mr. Kelley has been employed by Hennessy Advisors, Inc. since |
(1972)(5) | | October 2012. He has served as a Portfolio Manager of the |
| Senior Vice President | | Hennessy Gas Utility Fund, the Hennessy Large Cap Financial |
| and Portfolio Manager | | Fund, and the Hennessy Small Cap Financial Fund since |
| | | October 2014. He served as Co-Portfolio Manager of the same |
| | | funds from March 2013 through September 2014, and as a |
| | | Portfolio Analyst for the Hennessy Funds from October 2012 |
| | | through February 2013. Mr. Kelley has also served as a Portfolio |
| | | Manager of the Hennessy Cornerstone Growth Fund, the |
| | | Hennessy Cornerstone Mid Cap 30 Fund, the Hennessy |
| | | Cornerstone Large Growth Fund, and the Hennessy |
| | | Cornerstone Value Fund since February 2017, as a Co-Portfolio |
| | | Manager of the Hennessy Technology Fund since February |
| | | 2017, and as a Portfolio Manager of the Hennessy Total Return |
| | | Fund and the Hennessy Balanced Fund since May 2018. |
| | | Mr. Kelley served as Portfolio Manager of FBR Fund Advisers, |
| | | Inc. from January 2008 to October 2012. |
| | | |
| Tania Kelley | October 2003 | Ms. Kelley has been employed by Hennessy Advisors, Inc. |
| (1965) | | since October 2003. |
| Senior Vice President | | |
| and Head of Marketing | | |
| Daniel P. Hennessy | December 2016 | Mr. Daniel Hennessy has been employed by Hennessy Advisors, |
| (1990) | | Inc. since 2015. He has served as an Associate Analyst or |
| Vice President | | Analyst of the Hennessy Technology Fund since February 2017. |
| and Analyst | | Mr. Daniel Hennessy previously served as a Mutual Fund |
| | | Specialist at U.S. Bancorp Fund Services, LLC (now doing |
| | | business as U.S. Bank Global Fund Services) from November |
| | | 2014 to July 2015. Prior to that, he attended the University of |
| | | San Diego, where he earned a degree in Political Science. |
_______________
(1) | Messrs. DeSousa, Doyle, N. Hennessy, and Richardson previously served on the Board of Directors of Hennessy Mutual Funds, Inc. (“HMFI”), The Hennessy Funds, Inc. (“HFI”), and Hennessy SPARX Funds Trust (“HSFT”). Pursuant to an internal reorganization effective as of February 28, 2014, the series of HFMI, HFI, and HSFT were reorganized into corresponding series of the Trust that mirrored them. Subsequent to the reorganization, HFMI, HFI, and HSFT were dissolved. |
(2) | Mr. N. Hennessy is considered an “interested person,” as defined in the Investment Company Act of 1940, as amended, because he is an officer of the Hennessy Funds. |
(3) | The address of this officer is 4800 Bee Caves Road, Suite 100, Austin, TX 78746. |
(4) | The address of this officer is 101 Federal Street, Suite 1900, Boston, MA 02110. |
(5) | The address of this officer is 1340 Environ Way, Suite 332, Chapel Hill, NC 27517. |
| HENNESSY FUNDS | 1-800-966-4354 | |
Expense Example (Unaudited)
October 31, 2018
As a shareholder of the Fund, you incur ongoing costs, including management fees, service fees, and other Fund expenses. This Example is intended to help you understand your ongoing costs (in dollars) of investing in the Fund and to compare these costs with the ongoing costs of investing in other mutual funds. The Example is based on an investment of $1,000 invested at the beginning of the period and held for the entire period from May 1, 2018, through October 31, 2018.
Actual Expenses
The first line of the table below under the “Investor Class” and “Institutional Class” headings provides information about actual account values and actual expenses. Although the Fund charges no sales loads or transaction fees, you will be assessed fees for outgoing wire transfers, returned checks and stop payment orders at prevailing rates charged by U.S. Bank Global Fund Services, the Fund’s transfer agent. If you request that a redemption be made by wire transfer, currently a $15 fee is charged by the Fund’s transfer agent. IRA accounts will be charged a $15 annual maintenance fee. The example below includes, but is not limited to, management fees, shareholder servicing fees, fund accounting, custody, and transfer agent fees. However, the example below does not include portfolio trading commissions and related expenses, and other extraordinary expenses as determined under generally accepted accounting principles. You may use the information in this line, together with the amount you invested, to estimate the expenses that you paid over the period. Simply divide your account value by $1,000 (for example, an $8,600 account value divided by $1,000 = 8.6), then multiply the result by the number in the first line of the table under the “Investor Class” or “Institutional Class” headings in the column entitled “Expenses Paid During Period” to estimate the expenses you paid on your account during this period.
Hypothetical Example for Comparison Purposes
The second line of the table below under the “Investor Class” and “Institutional Class” headings provides information about hypothetical account values and hypothetical expenses based on the Fund’s actual expense ratios and an assumed rate of return of 5% per year before expenses, which is not the Fund’s actual return. The hypothetical account values and expenses may not be used to estimate the actual ending account balance or expenses you paid for the period. You may use this information to compare the ongoing costs of investing in the Fund and other funds. To do so, compare this 5% hypothetical example with the 5% hypothetical examples that appear in the shareholder reports of the other funds. Please note that the expenses shown in the table are meant to highlight your ongoing costs only. Therefore, the second line of the table under the “Investor Class” and “Institutional Class” headings is useful in comparing ongoing costs only, and will not help you determine the relative total costs of owning different funds.
| | | | Expenses Paid |
| | Beginning | Ending | During Period(1) |
| | Account Value | Account Value | May 1, 2018 – |
| | May 1, 2018 | October 31, 2018 | October 31, 2018 |
| Investor Class | | | |
| Actual | $1,000.00 | $ 901.10 | $7.38 |
| Hypothetical (5% return before expenses) | $1,000.00 | $1,017.44 | $7.83 |
| | | | |
| Institutional Class | | | |
| Actual | $1,000.00 | $ 902.80 | $5.47 |
| Hypothetical (5% return before expenses) | $1,000.00 | $1,019.46 | $5.80 |
(1) | Expenses are equal to the Fund’s annualized expense ratio of 1.54% for Investor Class shares or 1.14% for Institutional Class shares, as applicable, multiplied by the average account value over the period, multiplied by 184/365 days (to reflect one-half year period). |
| HENNESSY FUNDS | 1-800-966-4354 | |
How to Obtain a Copy of the Fund’s
Proxy Voting Policy and Proxy Voting Records
A description of the policies and procedures the Fund uses to determine how to vote proxies relating to portfolio securities is available without charge: (1) by calling 1-800-966-4354; (2) on the Hennessy Funds’ website at www.hennessyfunds.com/proxy-voting/voting-policy; or (3) on the U.S. Securities and Exchange Commission’s (the “SEC”) website at www.sec.gov. The Fund’s proxy voting record is available without charge on both the Hennessy Funds’ website at www.hennessyfunds.com/proxy-voting/voting-record and the SEC’s website at www.sec.gov no later than August 31 for the prior 12 months ending June 30.
Quarterly Filings on Form N-Q
The Fund files a complete schedule of portfolio holdings with the SEC for the first and third quarters of each fiscal year on Form N-Q. The Fund’s Forms N-Q are available on the SEC’s website at www.sec.gov. Information included in the Fund’s Forms N-Q will also be available upon request by calling 1-800-966-4354.
Federal Tax Distribution Information
(Unaudited)
For fiscal year 2018, certain dividends paid by the Fund may be subject to a maximum tax rate of 23.8%, as provided for by the Jobs and Growth Tax Relief Reconciliation Act of 2003. The percentage of dividends declared from ordinary income designated as qualified dividend income was 100.00%.
For corporate shareholders, the percent of ordinary income distributions that qualified for the corporate dividends received deduction for fiscal year 2018 was 100.00%.
The percentage of taxable ordinary income distributions that were designated as short-term capital gain distributions under Section 871(k)(2)(C) of the Internal Revenue Code of 1986, as amended, for the Fund was 94.94%.
Important Notice Regarding Delivery
of Shareholder Documents
To help keep the Fund’s costs as low as possible, we generally deliver a single copy of shareholder reports, proxy statements, and prospectuses to shareholders who share an address and have the same last name. This process does not apply to account statements. You may request an individual copy of a shareholder document at any time. If you would like to receive separate mailings of shareholder documents, please call U.S. Bank Global Fund Services at 1-800-261-6950 or 1-414-765-4124, and individual delivery will begin within 30 days of your request. If your account is held through a financial institution or other intermediary, please contact such intermediary directly to request individual delivery.
| PROXY VOTING — PRIVACY POLICY |
Privacy Policy
We collect the following non-public personal information about you:
| | • | information we receive from you on or in applications or other forms, correspondence, or conversations, including, but not limited to, your name, address, phone number, social security number, assets, income, and date of birth; and |
| | | |
| | • | information about your transactions with us, our affiliates, or others, including, but not limited to, your account number and balance, payment history, parties to transactions, cost basis information, and other financial information. |
We do not disclose any non-public personal information about our current or former shareholders to non-affiliated third parties, except as permitted by law. For example, we are permitted by law to disclose all of the information we collect, as described above, to our Transfer Agent to process your transactions. Furthermore, we restrict access to your non-public personal information to those persons who require such information to provide products or services to you. We maintain physical, electronic, and procedural safeguards that comply with federal standards to guard your non-public personal information.
In the event that you hold shares of the Fund through a financial intermediary, including, but not limited to, a broker-dealer, bank, or trust company, the privacy policy of your financial intermediary would govern how your non-public personal information will be shared with non-affiliated third parties.
| HENNESSY FUNDS | 1-800-966-4354 | |
For information, questions or assistance, please call
The Hennessy Funds
1-800-966-4354 or 1-415-899-1555
INVESTMENT ADVISOR
Hennessy Advisors, Inc.
7250 Redwood Boulevard, Suite 200
Novato, California 94945
ADMINISTRATOR,
TRANSFER AGENT,
DIVIDEND PAYING AGENT, &
SHAREHOLDER SERVICING AGENT
U.S. Bancorp Fund Services, LLC
d/b/a U.S. Bank Global Fund Services
P.O. Box 701
Milwaukee, Wisconsin 53201-0701
CUSTODIAN
U.S. Bank N.A.
Custody Operations
1555 North River Center Drive, Suite 302
Milwaukee, Wisconsin 53212
TRUSTEES
Neil J. Hennessy
Robert T. Doyle
J. Dennis DeSousa
Gerald P. Richardson
COUNSEL
Foley & Lardner LLP
777 East Wisconsin Avenue
Milwaukee, Wisconsin 53202-5306
INDEPENDENT REGISTERED
PUBLIC ACCOUNTING FIRM
Tait, Weller & Baker LLP
Two Liberty Place
50 South 16th Street, Suite 2900
Philadelphia, Pennsylvania 19102-2529
DISTRIBUTOR
Quasar Distributors, LLC
777 East Wisconsin Avenue
Milwaukee, Wisconsin 53202
hennessyfunds.com | 1-800-966-4354
This report has been prepared for shareholders and may be distributed to
others only if preceded or accompanied by a current prospectus.
ANNUAL REPORT
OCTOBER 31, 2018
HENNESSY TECHNOLOGY FUND
Investor Class HTECX
Institutional Class HTCIX
hennessyfunds.com | 1-800-966-4354
(This Page Intentionally Left Blank.)
Contents
| Letter to Shareholders | 2 |
| Performance Overview | 4 |
| Financial Statements | |
| Schedule of Investments | 7 |
| Statement of Assets and Liabilities | 11 |
| Statement of Operations | 12 |
| Statements of Changes in Net Assets | 13 |
| Financial Highlights | 14 |
| Notes to the Financial Statements | 18 |
| Report of Independent Registered Public Accounting Firm | 26 |
| Trustees and Officers of the Fund | 27 |
| Expense Example | 30 |
| Proxy Voting Policy and Proxy Voting Records | 32 |
| Quarterly Schedule of Investments | 32 |
| Federal Tax Distribution Information | 32 |
| Important Notice Regarding Delivery of Shareholder Documents | 32 |
| Privacy Policy | 33 |
| HENNESSY FUNDS | 1-800-966-4354 | |
December 2018
Dear Hennessy Funds Shareholder:
Over the past year, we have witnessed the return of market volatility. U.S. stocks still registered healthy gains, bolstered by the impact on corporate profits of the successful passage of the tax reform bill in December 2017. However, concerns over potential trade disruptions, especially between the U.S. and China, and worries over higher short-term interest rates, which many believe could possibly trigger a recession down the road, put downward pressure on equity valuations.
The U.S. economy performed well over the period, and actually achieved an acceleration in GDP growth to over 3% on an annualized basis in the second and third quarters of calendar year 2018. During the past year, companies continued to hire workers, adding over 200,000 jobs per month on average, sending the unemployment rate down to 3.7% in October, which is the lowest it has been since 1969. Consumer confidence is high and still rising, and corporate profits reached record levels in the third quarter of calendar year 2018, posting a year-over-year increase of 26% for the companies in the S&P 500 Index.
The Federal Reserve, confident about the strength of the economy and mindful of a tight labor market, raised short-term interest rates four times over the last year, by a quarter point each time. Long-term bond yields also rose, driven higher primarily by evidence of faster wage growth, pushing the U.S. 10-year Treasury bond over 3% for the first time since 2013.
As I write this, we are experiencing the market’s 20th downturn since 2010. I have been saying that every bull market experiences volatility and pullbacks. Many financial commentators think this bull market is “long in the tooth.” I do not agree with them. I believe stock valuations are still very reasonable. The prospective price to earnings multiple for the Dow Jones Industrial Average has come down from almost 20x at the end of 2017 to 16x, just above its 10-year average of 15x. The prospective PE multiple for the S&P 500 Index has also come down, from 20x to 17x, and compares favorably to its 10-year average of 16x.
Cash, meanwhile, continues to build up on corporate balance sheets. The companies in the S&P 500 Index reported a total of over $5.4 trillion in cash and marketable securities in their latest filings. Companies have been spending some of their cash, increasing their investment spending and laying the groundwork for future earnings growth. However, they have also been returning capital to shareholders. S&P 500 Index companies announced $433.6 billion in share repurchases during the second quarter of calendar year 2018, nearly doubling the previous record of $242.1 billion set in the first quarter. Companies are also raising their dividends.
In addition, I believe the Federal Reserve will take care not to raise interest rates too high or too fast and endanger the economic expansion. While wage growth has risen to over 3% in October, other measures of inflationary pressure, such as the Consumer Price Index and the Producer Price Index, still show prices increasing at a more moderate pace, closer to 2%. Given continued evidence of modest rates of inflation, I believe the Fed will be able to maintain its gradual pace of interest rate hikes.
Finally and importantly, I still see no signs of euphoria in this market. In my opinion, the enthusiasm present earlier in the year, which followed the significant reduction in corporate income tax rates, has largely evaporated, and it has been replaced with anxiety
over higher interest rates and their potential impact on growth. In the past, I have likened the current bull market to that of 1982-2000, and I still believe this comparison holds true. I am confident in the strength of the market today and believe the economy will continue to grow in the coming year, albeit at a more moderate pace.
Thank you for your continued confidence and investment in the Hennessy Funds. If you have any questions or would like to speak with us directly, please don’t hesitate to call us at (800) 966-4354.
Best regards,
Neil J. Hennessy
President and Chief Investment Officer
Past performance does not guarantee future results.
Mutual fund investing involves risk. Principal loss is possible.
Opinions expressed are those of Neil Hennessy and are subject to change, are not guaranteed, and should not be considered investment advice.
The Dow Jones Industrial Average and S&P 500 Index are commonly used to measure the performance of U.S. stocks. One cannot invest directly in an index.
PE, or price to earnings, is a valuation measure and is calculated by dividing a company’s market price per share by its earnings per share. Earnings growth is not a measure of a fund’s future performance.
| HENNESSY FUNDS | 1-800-966-4354 | |
Performance Overview (Unaudited)
CHANGE IN VALUE OF $10,000 INVESTMENT
This graph illustrates the performance of an initial investment of $10,000 made in the Fund ten years ago and assumes the reinvestment of dividends.
AVERAGE ANNUAL TOTAL RETURN FOR PERIODS ENDED OCTOBER 31, 2018
| | One | Five | Ten |
| | Year | Years | Years |
| Hennessy Technology Fund – | | | |
| Investor Class (HTECX) | 7.25% | 7.85% | 11.02% |
| Hennessy Technology Fund – | | | |
Institutional Class (HTCIX)(1) | 7.54% | 8.18% | 11.28% |
| NASDAQ Composite Index | 9.74% | 14.58% | 16.92% |
| S&P 500 Index | 7.35% | 11.34% | 13.24% |
Expense ratios: | Gross 4.12%, Net 1.24%(2) (Investor Class); |
| Gross 3.70%, Net 0.99%(2) (Institutional Class) |
(1) | The inception date of Institutional Class shares is March 12, 2010. Performance shown prior to the inception of Institutional Class shares reflects the performance of Investor Class shares and includes expenses that are not applicable to, and are higher than, those of Institutional Class shares. |
(2) | The Fund’s investment advisor has contractually agreed to limit expenses until February 28, 2019. |
Performance data quoted represents past performance; past performance does not guarantee future results. The investment return and principal value of an investment will fluctuate so that an investor’s shares, when redeemed, may be worth more or less than their original cost. The performance table does not reflect the deduction of taxes that a shareholder would pay on Fund distributions or the redemption of Fund shares. Current performance of the Fund may be lower or higher than the performance quoted. Performance data current to the most recent month end may be obtained by visiting www.hennessyfunds.com. Performance for periods on or prior to October 26, 2012, is that of the FBR Technology Fund.
The NASDAQ Composite Index is a broad-based capitalization-weighted index of all common stocks listed on The NASDAQ Stock Market. The S&P 500 Index is commonly used to measure the performance of U.S. stocks. One cannot invest directly in an index.
The expense ratios presented are from the most recent prospectus. The expense ratios for the current reporting period are available in the Financial Highlights section of this report.
PERFORMANCE NARRATIVE
Portfolio Manager Ryan C. Kelley
Performance:
For the 12-month period ended October 31, 2018, the Investor Class of the Hennessy Technology Fund returned 7.25%, underperforming the NASDAQ Composite Index (the Fund’s primary benchmark) and the S&P 500 Index, which returned 9.74% and 7.35%, respectively, for the same period.
The Fund’s underperformance relative to its primary benchmark can be attributed predominantly to stock selection within the Information Technology sector. Applied Materials, Inc., a capital equipment manufacturer for the semiconductor industry, LG Display Co. Ltd., a producer of digital display products and Box, Inc., an Internet applications software company, were among the Information Technology sector holdings that detracted the most from performance. The Fund’s underweight positions in Apple, Inc. and Amazon.com, Inc. also hurt performance. Match Group, Inc., an online dating service, Fortinet, Inc., a provider of network security solutions, Cardtronics PLC, a cash machine provider, and Paycom Software, Inc., an employment software solutions company, were among the holdings that contributed most positively to relative performance.
The Fund continues to hold all of the companies mentioned with the exception of Cardtronics PLC.
Portfolio Strategy:
The Fund utilizes a quantitative investment strategy based on identifying technology-related stocks that have strong cash flows and the ability to sustain profitability. The Fund seeks to build a portfolio of companies that have historically delivered returns in excess of their cost of capital, exhibit strong cash flows and profits, have relatively low debt on their balance sheets, and trade at attractive relative valuations.
Investment Commentary:
We continue to believe that the outlook for U.S. stocks is positive. The U.S. economy is growing at a healthy rate, unemployment is low, and growth in both consumption and capital spending has accelerated over the last 12 months. Corporate earnings have risen significantly over the first nine months of 2018, helped, in part, by lower taxes. We expect earnings growth to be slower next year yet remain positive, driven primarily by continued steady economic growth.
We believe the outlook for the Technology sector and technology-related stocks is also positive. Earnings growth for technology stocks has been outpacing earnings growth for the market as a whole by a significant margin. However, technology stocks are not trading at a premium in terms of valuation, either relative to the market or relative to historical averages. PE multiples for both the Information Technology sector and the S&P 500 Index on a forward basis are approximately 16.5x, while the average forward PE multiple for the Information Technology sector since 1990 is approximately 19.6x.
_______________
Opinions expressed are those of the Portfolio Manager as of the date written and are subject to change, are not guaranteed, and should not be considered investment advice or an indication of trading intent.
Investments are focused in the Technology sector as well as the following sub-industries: Internet & Direct Marketing Retail, Interactive Home Entertainment, and Interactive Media Services. Sector funds may be subject to a higher degree of market risk. Investments in foreign securities
| HENNESSY FUNDS | 1-800-966-4354 | |
may involve political, economic, and currency risks, greater volatility, and differences in accounting methods. The Fund invests in small-sized and medium-sized companies, which may have more limited liquidity and greater volatility compared to larger companies. Please see the Fund’s prospectus for a more complete discussion of these and other risks.
References to specific securities should not be considered a recommendation to buy or sell any security. Fund holdings and sector allocations are subject to change. Please refer to the Schedule of Investments included in this report for additional portfolio information.
PE, or price to earnings, is calculated by dividing a company’s market price per share by its earnings per share. Cash flow refers to the net amount of cash and cash equivalents being transferred into and out of a company. Earnings growth is not a measure of the Fund’s future performance.
| PERFORMANCE OVERVIEW/SCHEDULE OF INVESTMENTS |
Financial Statements
Schedule of Investments as of October 31, 2018 |
HENNESSY TECHNOLOGY FUND
(% of Net Assets)
| TOP TEN HOLDINGS (EXCLUDING MONEY MARKET FUNDS) | % NET ASSETS |
| Red Hat, Inc. | 2.31% |
| Xerox Corp. | 1.85% |
| CDW Corp. of Delaware | 1.81% |
| NCR Corp. | 1.74% |
| Amkor Technology, Inc. | 1.72% |
| Ituran Location and Control Ltd. | 1.72% |
| Cadence Design Systems, Inc. | 1.71% |
| Ubiquiti Networks, Inc. | 1.71% |
| Celestica, Inc. | 1.71% |
| The Western Union Co. | 1.70% |
Note: For presentation purposes, the Fund has grouped some of the industry categories. For purposes of categorizing securities for compliance with section 8(b)(1) of the Investment Company Act of 1940, as amended, the Fund uses more specific industry classifications.
The Global Industry Classification Standard (GICS®) was developed by and is the exclusive property and a service mark of MSCI, Inc. and Standard & Poor Financial Services LLC. It has been licensed for use by the Hennessy Funds.
| HENNESSY FUNDS | 1-800-966-4354 | |
| COMMON STOCKS – 94.00% | | Number | | | | | | % of | |
| | | of Shares | | | Value | | | Net Assets | |
| Communication Services – 1.55% | | | | | | | | | |
| Match Group, Inc. (a) | | | 1,321 | | | $ | 68,322 | | | | 1.55 | % |
| | | | | | | | | | | | | |
| Consumer Discretionary – 3.15% | | | | | | | | | | | | |
| JD.com, Inc. – ADR (a)(b) | | | 3,106 | | | | 73,053 | | | | 1.66 | % |
| Vipshop Holdings Ltd. – ADR (a)(b) | | | 13,463 | | | | 65,431 | | | | 1.49 | % |
| | | | | | | | 138,484 | | | | 3.15 | % |
| | | | | | | | | | | | | |
| Information Technology – 89.30% | | | | | | | | | | | | |
| Accenture PLC, Class A (b) | | | 435 | | | | 68,565 | | | | 1.56 | % |
| Adobe, Inc. (a) | | | 283 | | | | 69,550 | | | | 1.58 | % |
| Advanced Micro Devices, Inc. (a) | | | 2,717 | | | | 49,477 | | | | 1.12 | % |
| Amkor Technology, Inc. (a) | | | 10,576 | | | | 75,618 | | | | 1.72 | % |
| Apple, Inc. | | | 334 | | | | 73,099 | | | | 1.66 | % |
| Applied Materials, Inc. | | | 2,002 | | | | 65,826 | | | | 1.50 | % |
| Arista Networks, Inc. (a) | | | 298 | | | | 68,644 | | | | 1.56 | % |
| Autodesk, Inc. (a) | | | 491 | | | | 63,462 | | | | 1.44 | % |
| Automatic Data Processing, Inc. | | | 493 | | | | 71,031 | | | | 1.61 | % |
| Booz Allen Hamilton Holding Corp. | | | 1,501 | | | | 74,360 | | | | 1.69 | % |
| Box, Inc., Class A (a) | | | 3,627 | | | | 65,286 | | | | 1.48 | % |
| Broadridge Financial Solutions, Inc. | | | 603 | | | | 70,515 | | | | 1.60 | % |
| Cadence Design Systems, Inc. (a) | | | 1,689 | | | | 75,279 | | | | 1.71 | % |
| CDW Corp. of Delaware | | | 885 | | | | 79,659 | | | | 1.81 | % |
| Celestica, Inc. (a)(b) | | | 7,228 | | | | 75,027 | | | | 1.71 | % |
| Citrix Systems, Inc. (a) | | | 685 | | | | 70,192 | | | | 1.60 | % |
| Cornerstone OnDemand, Inc. (a) | | | 1,404 | | | | 69,147 | | | | 1.57 | % |
| DXC Technology Co. | | | 845 | | | | 61,541 | | | | 1.40 | % |
| F5 Networks, Inc. (a) | | | 410 | | | | 71,865 | | | | 1.63 | % |
| Fair Isaac Corp. (a) | | | 338 | | | | 65,136 | | | | 1.48 | % |
| Fiserv, Inc. (a) | | | 919 | | | | 72,877 | | | | 1.66 | % |
| Fortinet, Inc. (a) | | | 868 | | | | 71,332 | | | | 1.62 | % |
| Hewlett Packard Enterprise Co. | | | 4,633 | | | | 70,653 | | | | 1.61 | % |
| Hortonworks, Inc. (a) | | | 3,143 | | | | 56,134 | | | | 1.28 | % |
| Ichor Holdings, Ltd. (a)(b) | | | 3,711 | | | | 65,870 | | | | 1.50 | % |
| Intuit, Inc. | | | 336 | | | | 70,896 | | | | 1.61 | % |
| Ituran Location and Control Ltd. (b) | | | 2,215 | | | | 75,576 | | | | 1.72 | % |
| Jabil Circuit, Inc. | | | 2,915 | | | | 72,088 | | | | 1.64 | % |
The accompanying notes are an integral part of these financial statements.
| COMMON STOCKS | | Number | | | | | | % of | |
| | | of Shares | | | Value | | | Net Assets | |
| Information Technology (Continued) | | | | | | | | | |
| KLA-Tencor Corp. | | | 751 | | | $ | 68,747 | | | | 1.56 | % |
| Lam Research Corp. | | | 502 | | | | 71,148 | | | | 1.62 | % |
| LG Display Co., Ltd – ADR (a)(b) | | | 9,169 | | | | 67,300 | | | | 1.53 | % |
| Logitech International S.A. (b) | | | 1,785 | | | | 65,902 | | | | 1.50 | % |
| Mastercard, Inc., Class A | | | 355 | | | | 70,173 | | | | 1.60 | % |
| NCR Corp. (a) | | | 2,845 | | | | 76,388 | | | | 1.74 | % |
| NetApp, Inc. | | | 928 | | | | 72,839 | | | | 1.66 | % |
| Palo Alto Networks, Inc. (a) | | | 352 | | | | 64,430 | | | | 1.46 | % |
| Paychex, Inc. | | | 1,063 | | | | 69,616 | | | | 1.58 | % |
| Paycom Software, Inc. (a) | | | 540 | | | | 67,608 | | | | 1.54 | % |
| Paylocity Holding Corp. (a) | | | 1,017 | | | | 66,908 | | | | 1.52 | % |
| Proofpoint, Inc. (a) | | | 759 | | | | 69,031 | | | | 1.57 | % |
| Red Hat, Inc. (a) | | | 591 | | | | 101,439 | | | | 2.31 | % |
| Sabre Corp. | | | 3,007 | | | | 74,123 | | | | 1.69 | % |
| Sanmina Corp. (a) | | | 2,920 | | | | 73,876 | | | | 1.68 | % |
| Science Applications International Corp. | | | 971 | | | | 67,494 | | | | 1.53 | % |
| Seagate Technology PLC (b) | | | 1,629 | | | | 65,535 | | | | 1.49 | % |
| ServiceNow, Inc. (a) | | | 412 | | | | 74,588 | | | | 1.70 | % |
| SMART Global Holdings, Inc. (a)(b) | | | 2,317 | | | | 64,899 | | | | 1.48 | % |
| SYNNEX Corp. | | | 836 | | | | 64,882 | | | | 1.47 | % |
| Texas Instruments, Inc. | | | 716 | | | | 66,466 | | | | 1.51 | % |
| The Ultimate Software Group, Inc. (a) | | | 248 | | | | 66,124 | | | | 1.50 | % |
| The Western Union Co. | | | 4,145 | | | | 74,776 | | | | 1.70 | % |
| Ubiquiti Networks, Inc. | | | 808 | | | | 75,217 | | | | 1.71 | % |
| Versum Materials, Inc. | | | 2,175 | | | | 68,643 | | | | 1.56 | % |
| Vishay Intertechnology, Inc. | | | 3,954 | | | | 72,358 | | | | 1.64 | % |
| Wix.com Ltd. (a)(b) | | | 693 | | | | 67,464 | | | | 1.53 | % |
| Xerox Corp. | | | 2,923 | | | | 81,464 | | | | 1.85 | % |
| | | | | | | | 3,928,143 | | | | 89.30 | % |
| Total Common Stocks | | | | | | | | | | | | |
| (Cost $4,087,704) | | | | | | | 4,134,949 | | | | 94.00 | % |
The accompanying notes are an integral part of these financial statements.
| HENNESSY FUNDS | 1-800-966-4354 | |
| SHORT-TERM INVESTMENTS – 6.54% | | Number | | | | | | % of | |
| | | of Shares | | | Value | | | Net Assets | |
| Money Market Funds – 6.54% | | | | | | | | | |
| Fidelity Government Portfolio, Institutional Class, 2.06% (c) | | | 215,000 | | | $ | 215,000 | | | | 4.89 | % |
| The Government & Agency Portfolio, Institutional Class, 2.08% (c) | | | 72,501 | | | | 72,501 | | | | 1.65 | % |
| | | | | | | | | | | | | |
| Total Short-Term Investments | | | | | | | | | | | | |
| (Cost $287,501) | | | | | | | 287,501 | | | | 6.54 | % |
| | | | | | | | | | | | | |
| Total Investments | | | | | | | | | | | | |
| (Cost $4,375,205) – 100.54% | | | | | | | 4,422,450 | | | | 100.54 | % |
| Liabilities in Excess of Other Assets – (0.54)% | | | | | | | (23,848 | ) | | | (0.54 | )% |
| | | | | | | | | | | | | |
TOTAL NET ASSETS – 100.00% | | | | | | $ | 4,398,602 | | | | 100.00 | % |
Percentages are stated as a percent of net assets.
ADR – American Depositary Receipt
PLC – Public Limited Company
| (a) | Non-income producing security. |
| (b) | U.S.-traded security of a foreign corporation. |
| (c) | The rate listed is the fund’s seven-day yield as of October 31, 2018. |
Summary of Fair Value Exposure at October 31, 2018
The following is a summary of the inputs used to value the Fund’s net assets as of October 31, 2018 (See Note 3 in the accompanying notes to the financial statements):
| Common Stocks | | Level 1 | | | Level 2 | | | Level 3 | | | Total | |
| Communication Services | | $ | 68,322 | | | $ | — | | | $ | — | | | $ | 68,322 | |
| Consumer Discretionary | | | 138,484 | | | | — | | | | — | | | | 138,484 | |
| Information Technology | | | 3,928,143 | | | | — | | | | — | | | | 3,928,143 | |
| Total Common Stocks | | $ | 4,134,949 | | | $ | — | | | $ | — | | | $ | 4,134,949 | |
| Short-Term Investments | | | | | | | | | | | | | | | | |
| Money Market Funds | | $ | 287,501 | | | $ | — | | | $ | — | | | $ | 287,501 | |
| Total Short-Term Investments | | $ | 287,501 | | | $ | — | | | $ | — | | | $ | 287,501 | |
| Total Investments | | $ | 4,422,450 | | | $ | — | | | $ | — | | | $ | 4,422,450 | |
The accompanying notes are an integral part of these financial statements.
| SCHEDULE OF INVESTMENTS/STATEMENT OF ASSETS AND LIABILITIES |
Financial Statements
Statement of Assets and Liabilities as of October 31, 2018 |
| ASSETS: | | | |
| Investments in securities, at value (cost $4,375,205) | | $ | 4,422,450 | |
| Dividends and interest receivable | | | 2,774 | |
| Receivable for fund shares sold | | | 176 | |
| Prepaid expenses and other assets | | | 16,217 | |
| Due from Advisor | | | 8,057 | |
| Total Assets | | | 4,449,674 | |
| | | | | |
| LIABILITIES: | | | | |
| Payable for fund shares redeemed | | | 7,156 | |
| Payable to administrator | | | 404 | |
| Payable to auditor | | | 21,899 | |
| Accrued distribution fees | | | 6,841 | |
| Accrued service fees | | | 287 | |
| Accrued trustees fees | | | 5,961 | |
| Accrued expenses and other payables | | | 8,524 | |
| Total Liabilities | | | 51,072 | |
| NET ASSETS | | $ | 4,398,602 | |
| | | | | |
| NET ASSETS CONSIST OF: | | | | |
| Capital stock | | $ | 3,829,622 | |
| Total distributable earnings | | | 568,980 | |
| Total Net Assets | | $ | 4,398,602 | |
| | | | | |
| NET ASSETS | | | | |
| Investor Class: | | | | |
| Shares authorized (no par value) | | Unlimited | |
| Net assets applicable to outstanding Investor Class shares | | $ | 3,308,812 | |
| Shares issued and outstanding | | | 183,382 | |
| Net asset value, offering price and redemption price per share | | $ | 18.04 | |
| | | | | |
| Institutional Class: | | | | |
| Shares authorized (no par value) | | Unlimited | |
| Net assets applicable to outstanding Institutional Class shares | | $ | 1,089,790 | |
| Shares issued and outstanding | | | 59,007 | |
| Net asset value, offering price and redemption price per share | | $ | 18.47 | |
The accompanying notes are an integral part of these financial statements.
| HENNESSY FUNDS | 1-800-966-4354 | |
Financial Statements
Statement of Operations for the year ended October 31, 2018 |
| INVESTMENT INCOME: | | | |
Dividend income(1) | | $ | 36,306 | |
| Interest income | | | 2,944 | |
| Total investment income | | | 39,250 | |
| | | | | |
| EXPENSES: | | | | |
| Investment advisory fees (See Note 5) | | | 33,671 | |
| Federal and state registration fees | | | 32,563 | |
| Compliance expense (See Note 5) | | | 29,500 | |
| Audit fees | | | 22,499 | |
| Trustees’ fees and expenses | | | 16,623 | |
| Reports to shareholders | | | 6,022 | |
| Sub-transfer agent expenses – Investor Class (See Note 5) | | | 5,871 | |
| Sub-transfer agent expenses – Institutional Class (See Note 5) | | | 4 | |
| Distribution fees – Investor Class (See Note 5) | | | 5,067 | |
| Administration, fund accounting, custody and transfer agent fees (See Note 5) | | | 4,008 | |
| Service fees – Investor Class (See Note 5) | | | 3,378 | |
| Interest expense (See Note 7) | | | 31 | |
| Other expenses | | | 4,001 | |
| Total expenses before reimbursement by advisor | | | 163,238 | |
| Expense reimbursement by advisor – Investor Class (See Note 5) | | | (83,351 | ) |
| Expense reimbursement by advisor – Institutional Class (See Note 5) | | | (26,820 | ) |
| Net expenses | | | 53,067 | |
| NET INVESTMENT LOSS | | $ | (13,817 | ) |
| | | | | |
| REALIZED AND UNREALIZED GAINS (LOSSES): | | | | |
| Net realized gain on investments | | $ | 629,547 | |
| Net change in unrealized appreciation/depreciation on investments | | | (302,826 | ) |
| Net gain on investments | | | 326,721 | |
| NET INCREASE IN NET ASSETS RESULTING FROM OPERATIONS | | $ | 312,904 | |
(1) | Net of foreign taxes withheld and issuance fees of $721. |
The accompanying notes are an integral part of these financial statements.
| STATEMENT OF OPERATIONS/STATEMENTS OF CHANGES IN NET ASSETS |
Financial Statements
| Statements of Changes in Net Assets |
| | | Year Ended | | | Year Ended | |
| | | October 31, 2018 | | | October 31, 2017 | |
| OPERATIONS: | | | | | | |
| Net investment loss | | $ | (13,817 | ) | | $ | (41,753 | ) |
| Net realized gain on investments | | | 629,547 | | | | 632,539 | |
| Net change in unrealized | | | | | | | | |
| appreciation/depreciation on investments | | | (302,826 | ) | | | 31,853 | |
| Net increase in net assets resulting from operations | | | 312,904 | | | | 622,639 | |
| | | | | | | | | |
| DISTRIBUTIONS TO SHAREHOLDERS FROM: | | | | | | | | |
| Distributable earnings – Investor Class | | | (284,124 | ) | | | — | |
| Distributable earnings – Institutional Class | | | (107,305 | ) | | | — | |
| Total distributions | | | (391,429 | ) | | | — | |
| | | | | | | | | |
| CAPITAL SHARE TRANSACTIONS: | | | | | | | | |
| Proceeds from shares subscribed – Investor Class | | | 552,927 | | | | 422,345 | |
| Proceeds from shares subscribed – Institutional Class | | | 88,271 | | | | 218,028 | |
| Dividends reinvested – Investor Class | | | 278,793 | | | | — | |
| Dividends reinvested – Institutional Class | | | 106,216 | | | | — | |
| Cost of shares redeemed – Investor Class | | | (654,226 | ) | | | (587,405 | ) |
| Cost of shares redeemed – Institutional Class | | | (308,951 | ) | | | (74,362 | ) |
| Net increase (decrease) in net assets derived | | | | | | | | |
| from capital share transactions | | | 63,030 | | | | (21,394 | ) |
| TOTAL INCREASE (DECREASE) IN NET ASSETS | | | (15,495 | ) | | | 601,245 | |
| | | | | | | | | |
| NET ASSETS: | | | | | | | | |
| Beginning of year | | | 4,414,097 | | | | 3,812,852 | |
| End of year | | $ | 4,398,602 | | | $ | 4,414,097 | (1) |
| | | | | | | | | |
| CHANGES IN SHARES OUTSTANDING: | | | | | | | | |
| Shares sold – Investor Class | | | 29,132 | | | | 24,507 | |
| Shares sold – Institutional Class | | | 4,606 | | | | 12,743 | |
| Shares issued to holders as reinvestment | | | | | | | | |
| of dividends – Investor Class | | | 16,634 | | | | — | |
| Shares issued to holders as reinvestment | | | | | | | | |
| of dividends – Institutional Class | | | 6,208 | | | | — | |
| Shares redeemed – Investor Class | | | (35,601 | ) | | | (35,133 | ) |
| Shares redeemed – Institutional Class | | | (16,346 | ) | | | (4,356 | ) |
| Net increase (decrease) in shares outstanding | | | 4,633 | | | | (2,239 | ) |
(1) | Includes accumulated net investment loss of $(22,185). |
The accompanying notes are an integral part of these financial statements.
| HENNESSY FUNDS | 1-800-966-4354 | |
Financial Statements
For an Investor Class share outstanding throughout each year
PER SHARE DATA:
Net asset value, beginning of year
Income from investment operations:
Net investment loss
Net realized and unrealized gains on investments
Total from investment operations
Less distributions:
Dividends from net realized gains
Total distributions
Net asset value, end of year
TOTAL RETURN
SUPPLEMENTAL DATA AND RATIOS:
Net assets, end of year (millions)
Ratio of expenses to average net assets:
Before expense reimbursement
After expense reimbursement
Ratio of net investment loss to average net assets:
Before expense reimbursement
After expense reimbursement
Portfolio turnover rate(2)
(1) | The Fund’s current expense limitation agreement, which became effective on February 28, 2017, was in effect for eight months of the year ended October 31, 2017. The Fund previously had an expense limitation agreement in effect from October 26, 2012, to February 28, 2015. |
(2) | Portfolio turnover is calculated on the basis of the Fund as a whole. |
The accompanying notes are an integral part of these financial statements.
| FINANCIAL HIGHLIGHTS — INVESTOR CLASS |
| Year Ended October 31, | |
| 2018 | | | 2017 | | | 2016 | | | 2015 | | | 2014 | |
| | | | | | | | | | | | | | |
| $ | 18.46 | | | $ | 15.82 | | | $ | 15.36 | | | $ | 14.86 | | | $ | 13.57 | |
| | | | | | | | | | | | | | | | | | | |
| | | | | | | | | | | | | | | | | | | |
| | (0.05 | ) | | | (0.23 | ) | | | (0.68 | ) | | | (0.38 | ) | | | (0.23 | ) |
| | 1.26 | | | | 2.87 | | | | 1.14 | | | | 0.88 | | | | 1.52 | |
| | 1.21 | | | | 2.64 | | | | 0.46 | | | | 0.50 | | | | 1.29 | |
| | | | | | | | | | | | | | | | | | | |
| | | | | | | | | | | | | | | | | | | |
| | (1.63 | ) | | | — | | | | — | | | | — | | | | — | |
| | (1.63 | ) | | | — | | | | — | | | | — | | | | — | |
| $ | 18.04 | | | $ | 18.46 | | | $ | 15.82 | | | $ | 15.36 | | | $ | 14.86 | |
| | | | | | | | | | | | | | | | | | | |
| | 7.25 | % | | | 16.69 | % | | | 2.99 | % | | | 3.36 | % | | | 9.51 | % |
| | | | | | | | | | | | | | | | | | | |
| | | | | | | | | | | | | | | | | | | |
| $ | 3.31 | | | $ | 3.20 | | �� | $ | 2.91 | | | $ | 4.04 | | | $ | 4.99 | |
| | | | | | | | | | | | | | | | | | | |
| | 3.70 | % | | | 4.16 | % | | | 3.61 | % | | | 3.13 | % | | | 2.92 | % |
| | 1.23 | % | | | 2.15 | %(1) | | | 3.61 | % | | | 2.75 | % | | | 1.95 | % |
| | | | | | | | | | | | | | | | | | | |
| | (2.83 | )% | | | (3.16 | )% | | | (2.92 | )% | | | (2.30 | )% | | | (2.53 | )% |
| | (0.36 | )% | | | (1.15 | )%(1) | | | (2.92 | )% | | | (1.92 | )% | | | (1.55 | )% |
| | 225 | % | | | 267 | % | | | 80 | % | | | 163 | % | | | 204 | % |
The accompanying notes are an integral part of these financial statements.
| HENNESSY FUNDS | 1-800-966-4354 | |
Financial Statements
For an Institutional Class share outstanding throughout each year
PER SHARE DATA:
Net asset value, beginning of year
Income from investment operations:
Net investment income (loss)
Net realized and unrealized gains on investments
Total from investment operations
Less distributions:
Dividends from net realized gains
Total distributions
Net asset value, end of year
TOTAL RETURN
SUPPLEMENTAL DATA AND RATIOS:
Net assets, end of year (millions)
Ratio of expenses to average net assets:
Before expense reimbursement
After expense reimbursement
Ratio of net investment income (loss) to average net assets:
Before expense reimbursement
After expense reimbursement
Portfolio turnover rate(2)
(1) | The Fund’s current expense limitation agreement, which became effective on February 28, 2017, was in effect for eight months of the year ended October 31, 2017. The Fund previously had an expense limitation agreement in effect from October 26, 2012, to February 28, 2015. |
(2) | Portfolio turnover is calculated on the basis of the Fund as a whole. |
The accompanying notes are an integral part of these financial statements.
| FINANCIAL HIGHLIGHTS — INSTITUTIONAL CLASS |
| Year Ended October 31, | |
| 2018 | | | 2017 | | | 2016 | | | 2015 | | | 2014 | |
| | | | | | | | | | | | | | |
| $ | 18.85 | | | $ | 16.11 | | | $ | 15.58 | | | $ | 15.02 | | | $ | 13.68 | |
| | | | | | | | | | | | | | | | | | | |
| | | | | | | | | | | | | | | | | | | |
| | 0.01 | | | | (0.12 | ) | | | (0.43 | ) | | | (0.25 | ) | | | (0.26 | ) |
| | 1.28 | | | | 2.86 | | | | 0.96 | | | | 0.81 | | | | 1.60 | |
| | 1.29 | | | | 2.74 | | | | 0.53 | | | | 0.56 | | | | 1.34 | |
| | | | | | | | | | | | | | | | | | | |
| | | | | | | | | | | | | | | | | | | |
| | (1.67 | ) | | | — | | | | — | | | | — | | | | — | |
| | (1.67 | ) | | | — | | | | — | | | | — | | | | — | |
| $ | 18.47 | | | $ | 18.85 | | | $ | 16.11 | | | $ | 15.58 | | | $ | 15.02 | |
| | | | | | | | | | | | | | | | | | | |
| | 7.54 | % | | | 17.01 | % | | | 3.40 | % | | | 3.73 | % | | | 9.80 | % |
| | | | | | | | | | | | | | | | | | | |
| | | | | | | | | | | | | | | | | | | |
| $ | 1.09 | | | $ | 1.22 | | | $ | 0.90 | | | $ | 0.95 | | | $ | 0.93 | |
| | | | | | | | | | | | | | | | | | | |
| | 3.27 | % | | | 3.74 | % | | | 3.28 | % | | | 2.76 | % | | | 2.60 | % |
| | 0.98 | % | | | 1.77 | %(1) | | | 3.28 | % | | | 2.44 | % | | | 1.70 | % |
| | | | | | | | | | | | | | | | | | | |
| | (2.41 | )% | | | (2.74 | )% | | | (2.59 | )% | | | (1.92 | )% | | | (2.23 | )% |
| | (0.12 | )% | | | (0.77 | )%(1) | | | (2.59 | )% | | | (1.60 | )% | | | (1.33 | )% |
| | 225 | % | | | 267 | % | | | 80 | % | | | 163 | % | | | 204 | % |
The accompanying notes are an integral part of these financial statements.
| HENNESSY FUNDS | 1-800-966-4354 | |
Financial Statements
Notes to the Financial Statements October 31, 2018 |
1). ORGANIZATION
The Hennessy Technology Fund (the “Fund”) is a series of Hennessy Funds Trust (the “Trust”), which was organized as a Delaware statutory trust on September 17, 1992. The Fund is an open-end management investment company registered under the Investment Company Act of 1940, as amended. The investment objective of the Fund is long-term capital appreciation. The Fund is a diversified fund.
The Fund offers Investor Class and Institutional Class shares. Each class of shares differs principally in its respective 12b-1 distribution and service, shareholder servicing, and sub-transfer agent expenses. There are no sales charges. Each class has identical rights to earnings, assets, and voting privileges, except for class-specific expenses and exclusive rights to vote on matters affecting only an individual class.
As an investment company, the Fund follows the investment company accounting and reporting guidance of the Financial Accounting Standards Board (“FASB”) Accounting Standard Codification Topic 946 “Financial Services—Investment Companies.”
2). SIGNIFICANT ACCOUNTING POLICIES
The following is a summary of significant accounting policies consistently followed by the Fund in the preparation of the financial statements. These policies conform to U.S. generally accepted accounting principles (“GAAP”).
| a). | Securities Valuation – All investments in securities are recorded at their estimated fair value, as described in Note 3. |
| | |
| b). | Federal Income Taxes – No provision for federal income taxes or excise taxes has been made because the Fund has elected to be taxed as a regulated investment company and intends to distribute substantially all of its taxable income to its shareholders and otherwise comply with the provisions of the Internal Revenue Code of 1986, as amended, applicable to regulated investment companies. Net investment income/loss and realized gains/losses for federal income tax purposes may differ from those reported in the financial statements because of temporary book and tax basis differences. Temporary differences are primarily the result of the treatment of wash sales for tax reporting purposes. The Fund recognizes interest and penalties related to income tax benefits, if any, in the Statement of Operations as an income tax expense. Distributions from net realized gains for book purposes may include short-term capital gains, which are included as ordinary income to shareholders for tax purposes. The Fund may utilize equalization accounting for tax purposes and designate earnings and profits, including net realized gains distributed to shareholders on redemption of shares, as part of the dividends paid deduction for income tax purposes. |
| | |
| | Due to inherent differences in the recognition of income, expenses, and realized gains/losses under GAAP and federal income tax regulations, permanent differences between book and tax basis for reporting for fiscal year 2018 have been identified and appropriately reclassified in the Statement of Assets and Liabilities. The adjustments are as follows: |
| Total | |
| Distributable | |
Earnings | Capital Stock |
| $(52,368) | $52,368 |
| NOTES TO THE FINANCIAL STATEMENTS |
| c). | Accounting for Uncertainty in Income Taxes – The Fund has accounting policies regarding recognition and measurement of tax positions taken or expected to be taken on a tax return. The tax returns of the Fund for the prior three fiscal years are open for examination. The Fund has reviewed all open tax years in major jurisdictions and concluded that there is no impact on the Fund’s net assets and no tax liability resulting from unrecognized tax benefits relating to uncertain income tax positions taken or expected to be taken on a tax return. The Fund’s major tax jurisdictions are U.S. federal and Delaware. |
| | |
| d). | Income and Expenses – Dividend income is recognized on the ex-dividend date or as soon as information is available to the Fund. Interest income, which includes the amortization of premium and accretion of discount, is recognized on an accrual basis. Other non-cash dividends are recognized as investment income at the fair value of the property received. The Fund is charged for those expenses that are directly attributable to its portfolio, such as advisory, administration, and certain shareholder service fees. Income, expenses (other than expenses attributable to a specific class), and realized and unrealized gains/losses on investments are allocated to each class of shares based on such class’s net assets. |
| | |
| e). | Distributions to Shareholders – Dividends from net investment income for the Fund, if any, are declared and paid annually, usually in December. Distributions of net realized capital gains, if any, are declared and paid annually, usually in December. |
| | |
| f). | Security Transactions – Investment and shareholder transactions are recorded on the trade date. The Fund determines the realized gain/loss from an investment transaction by comparing the original cost of the security lot sold with the net sale proceeds. Discounts and premiums on securities purchased are accreted or amortized, respectively, over the life of each such security. |
| | |
| g). | Use of Estimates – The preparation of financial statements in conformity with GAAP requires management to make estimates and assumptions that affect the reported amounts of assets and liabilities and disclosure of contingent assets and liabilities at the date of the financial statements and the reported change in net assets during the reporting period. Actual results could differ from those estimates. |
| | |
| h). | Share Valuation – The net asset value (“NAV”) per share of the Fund is calculated by dividing (i) the total value of the securities held by the Fund, plus cash and other assets, minus all liabilities (including estimated accrued expenses) by (ii) the total number of shares outstanding for the Fund, rounded to the nearest cent. The Fund’s shares will not be priced on days the New York Stock Exchange is closed for trading. The offering and redemption price per share for the Fund is equal to the Fund’s NAV per share. |
| | |
| i). | New Accounting Pronouncements – In August 2018, the FASB issued Accounting Standards Update No. 2018-13 “Disclosure Framework—Changes to the Disclosure Requirements for Fair Value Measurement” (“ASU 2018-13”). ASU 2018-13 eliminates the requirement to disclose the amount of and reasons for transfers between Level 1 and Level 2 of the fair value hierarchy, the timing of transfers between levels of the fair value hierarchy, and the valuation processes for Level 3 fair value measurements. ASU 2018-13 does not eliminate the requirement to disclose the range and weighted average used to develop significant unobservable inputs for Level 3 fair value measurements, and the changes in unrealized gains and losses for recurring Level 3 fair value measurements. ASU 2018-13 requires that information is provided about the measurement uncertainty of Level 3 fair value measurements as of the reporting date. The guidance is effective for fiscal years beginning after December 15, 2019, and interim periods within those fiscal years. Management has |
| HENNESSY FUNDS | 1-800-966-4354 | |
| | evaluated the impact of this change in guidance, and due to the permissibility of early adoption, modified the Fund’s fair value disclosures for the current reporting period. |
| | |
| j). | New Rule Issuances – In August 2018, the Securities and Exchange Commission issued Final Rule Release No. 33 10532, Disclosure Update and Simplification, which in part amends certain financial statement disclosure requirements of Regulation S-X that have become redundant, duplicative, overlapping, outdated, or superseded, in light of other Commission disclosure requirements, GAAP, or changes in the information environment. The amendments are intended to facilitate the disclosure of information to investors and simplify compliance without significantly altering the total mix of information provided to investors. The amendments to Rule 6-04.17 of Regulation S-X (balance sheet) were amended to require presentation of the total, rather than the components of net assets, of distributable earnings on the balance sheet. Consistent with GAAP, funds will be required to disclose total distributable earnings. The amendments to Rule 6-09 of Regulation S-X (statement of changes in net assets) omit the requirement to separately state the sources of distributions paid as well as omit the requirement to parenthetically state the book basis amount of undistributed net investment income. Instead, consistent with GAAP, funds will be required to disclose the total amount of distributions paid, except that any tax return of capital must be separately disclosed. The requirements of the Final Rule Release are effective November 5, 2018 and the Fund’s Statement of Assets and Liabilities and the Statement of Changes in Net Assets for the current and prior reporting period have been modified accordingly. |
3). SECURITIES VALUATION
The Fund follows fair valuation accounting standards that establish an authoritative definition of fair value and set out a hierarchy for measuring fair value. These standards require additional disclosures about the various inputs and valuation techniques used to develop the measurements of fair value and a discussion of changes in valuation techniques and related inputs during the period. These inputs are summarized in the three broad levels listed below:
| | Level 1 – | Unadjusted, quoted prices in active markets for identical instruments that the Fund has the ability to access at the date of measurement. |
| | | |
| | Level 2 – | Other significant observable inputs (including, but not limited to, quoted prices in active markets for similar instruments, quoted prices in markets that are not active for identical or similar instruments, and model-derived valuations in which all significant inputs and significant value drivers are observable in active markets, such as interest rates, prepayment speeds, credit risk curves, default rates, and similar data). |
| | | |
| | Level 3 – | Significant unobservable inputs (including the Fund’s own assumptions about what market participants would use to price the asset or liability based on the best available information) when observable inputs are unavailable. |
Following is a description of the valuation techniques applied to the Fund’s major categories of assets and liabilities measured at fair value on a recurring basis.
| | Equity Securities – Equity securities, including common stocks, preferred stocks, foreign-issued common stocks, exchange-traded funds, closed-end mutual funds, partnerships, rights, and real estate investment trusts, that are traded on a securities exchange for which a last-quoted sales price is readily available will generally be valued at the last sales price as reported by the primary exchange on which the securities are listed. Securities listed on The NASDAQ Stock Market (“NASDAQ”) |
| NOTES TO THE FINANCIAL STATEMENTS |
| | will generally be valued at the NASDAQ Official Closing Price, which may differ from the last sales price reported. Securities traded on a securities exchange for which a last-quoted sales price is not readily available will generally be valued at the mean between the bid and ask prices. To the extent these securities are actively traded and valuation adjustments are not applied, they are classified in Level 1 of the fair value hierarchy. Securities traded on foreign exchanges generally are not valued at the same time the Fund calculates its NAV because most foreign markets close well before such time. The earlier close of most foreign markets gives rise to the possibility that significant events, including broad market moves, may have occurred in the interim. In certain circumstances, it may be determined that a foreign security needs to be fair valued because it appears that the value of the security might have been materially affected by events occurring after the close of the market in which the security is principally traded, but before the time the Fund calculates its NAV, such as by a development that affects an entire market or region (e.g., a weather-related event) or a potentially global development (e.g., a terrorist attack that may be expected to have an effect on investor expectations worldwide). |
| | |
| | Registered Investment Companies – Investments in open-end registered investment companies, commonly referred to as mutual funds, are generally priced at the ending NAV provided by the applicable mutual fund’s service agent and will be classified in Level 1 of the fair value hierarchy. |
| | |
| | Debt Securities – Debt securities, including corporate bonds, asset-backed securities, mortgage-backed securities, municipal bonds, U.S. Treasuries, and U.S. government agency issues, are generally valued at market on the basis of valuations furnished by an independent pricing service that utilizes both dealer-supplied valuations and formula-based techniques. The pricing service may consider recently executed transactions in securities of the issuer or comparable issuers, market price quotations (where observable), bond spreads, and fundamental data relating to the issuer. In addition, the model may incorporate observable market data, such as reported sales of similar securities, broker quotes, yields, bids, offers, and reference data. Certain securities are valued primarily using dealer quotations. These securities are generally classified in Level 2 of the fair value hierarchy. |
| | |
| | Short-Term Securities – Short-term equity investments, including money market funds, are valued in the manner specified above. Short-term debt investments with an original term to maturity of 60 days or less are valued at amortized cost, which approximates fair market value. If the original term to maturity of a short-term debt investment exceeded 60 days, then the values as of the 61st day prior to maturity are amortized. Amortized cost is not used if its use would be inappropriate due to credit or other impairments of the issuer, in which case the security’s fair value would be determined, as described below. Short-term securities are generally classified in Level 1 or Level 2 of the fair market hierarchy depending on the inputs used and market activity levels for specific securities. |
The Board of Trustees of the Fund (the “Board”) has adopted fair value pricing procedures that are followed when a price for a security is not readily available or if a significant event has occurred that indicates the closing price of a security no longer represents the true value of that security. Fair value pricing determinations are made in good faith in accordance with these procedures. There are numerous criteria that will be given consideration in determining a fair value of a security, such as the trading volume of a security and markets, the values of other similar securities, and news events with direct bearing on a security or markets. Fair value pricing results in an estimated price for a
| HENNESSY FUNDS | 1-800-966-4354 | |
security that reflects the amount the Fund might reasonably expect to receive in a current sale. Depending on the relative significance of the valuation inputs, these securities may be classified in either Level 2 or Level 3 of the fair value hierarchy.
The fair valuation of foreign securities may be determined with the assistance of a pricing service using correlations between the movement of prices of such securities and indices of domestic securities and other appropriate indicators, such as closing market prices of relevant American Depositary Receipts or futures contracts. The effect of using fair value pricing is that the Fund’s NAV will reflect the affected portfolio securities’ values as determined by the Board or its designee, pursuant to the fair value pricing procedures adopted by the Board, instead of being determined by the market. Using a fair value pricing methodology to price a foreign security may result in a value that is different from such foreign security’s most recent closing price and from the value used by other investment companies to calculate their NAVs. Such securities are generally classified in Level 2 of the fair valuation hierarchy. Because the Fund may invest in foreign securities, the value of the Fund’s portfolio securities may change on days when you will not be able to purchase or redeem your shares.
The Board has delegated day-to-day valuation matters to a Valuation Committee comprised of one or more representatives from Hennessy Advisors, Inc., the Fund’s investment advisor (the “Advisor”). The function of the Valuation Committee is to value securities where current and reliable market quotations are not readily available. All actions taken by the Valuation Committee are reviewed by the Board.
The Fund has performed an analysis of all existing investments to determine the significance and character of all inputs to their fair value determinations. Various inputs are used to determine the value of the Fund’s investments. The inputs or methodology used for valuing securities are not necessarily an indication of the risk associated with investing in those securities. Details related to the fair valuation hierarchy of the Fund’s securities as of October 31, 2018, are included in the Schedule of Investments.
4). INVESTMENT TRANSACTIONS
Purchases and sales of investment securities (excluding government and short-term investments) for the Fund during fiscal year 2018 were $9,788,697 and $10,204,517, respectively.
There were no purchases or sales/maturities of long-term U.S. government securities for the Fund during fiscal year 2018.
The Fund is permitted to purchase or sell securities from or to another fund in the Hennessy Funds family of funds (the “Hennessy Funds”) under specified conditions outlined in procedures adopted by the Board. The procedures have been designed to ensure that any purchase or sale of securities by the Fund from or to another Hennessy Fund complies with Rule 17a-7 of the Investment Company Act of 1940, as amended. During fiscal year 2018, the Fund did not engage in purchases or sales of securities pursuant to Rule 17a-7 of the Investment Company Act of 1940, as amended.
5). INVESTMENT ADVISORY FEE AND OTHER TRANSACTIONS WITH AFFILIATES
The Advisor provides the Fund with investment advisory services under an Investment Advisory Agreement. The Advisor furnishes all investment advice, office space, and facilities, as well as most of the personnel needed by the Fund. As compensation for its services, the Advisor is entitled to a monthly fee from the Fund. The fee is based upon the average daily net assets of the Fund at an annual rate of 0.74%, effective as of February 28, 2017. Prior to that date, the annual rate was 0.90%. The net investment advisory fees expensed by the Fund during fiscal year 2018 are included in the Statement of Operations.
| NOTES TO THE FINANCIAL STATEMENTS |
The Advisor has contractually agreed to limit total annual operating expenses of the Fund to 0.98% of the Fund’s net assets for both Investor Class shares and Institutional Class shares (excluding all federal, state and local taxes, interest, brokerage commissions, 12b-1 fees, shareholder servicing fees payable to the Advisor, acquired fund fees and expenses and other costs incurred in connection with the purchase and sale of securities, and extraordinary items) through February 28, 2019. In addition, in the past, the Advisor had contractually agreed to limit total annual operating expenses to 1.95% and 1.70% of the Fund’s net assets for Investor Class shares and Institutional Class shares, respectively (excluding interest, taxes, brokerage commissions, dividend expenses, acquired fund fees and expenses, extraordinary legal expenses, any other extraordinary expenses and, from and after November 1, 2014, 12b-1 fees). This prior expense limitation agreement for the Fund expired on February 28, 2015.
For a period of three years after the year in which the Advisor waives or reimburses expenses, the Advisor may seek reimbursement from the Fund to the extent that total annual fund operating expenses are less than the expense limitation that was in effect at the time the Advisor waived or reimbursed expenses. As of October 31, 2018, cumulative expenses subject to potential recovery under the aforementioned conditions and year of expiration were as follows:
| | | October 31, | | | October 31, | | | | |
| | | 2020 | | | 2021 | | | Total | |
| Investor Class | | $ | 58,612 | | | $ | 83,351 | | | $ | 141,963 | |
| Institutional Class | | $ | 20,906 | | | $ | 26,820 | | | $ | 47,726 | |
The Board has approved a Shareholder Servicing Agreement for Investor Class shares of the Fund, which was instituted to compensate the Advisor for the non-investment advisory services it provides to the Fund. The Shareholder Servicing Agreement provides for a monthly fee paid to the Advisor at an annual rate of 0.10% of the average daily net assets of the Fund attributable to Investor Class shares. The shareholder service fees expensed by the Fund during fiscal year 2018 are included in the Statement of Operations.
The Fund has adopted a plan pursuant to Rule 12b-1 under the Investment Company Act of 1940, as amended, that authorizes payments in connection with the distribution of the Fund’s shares at an annual rate of up to 0.25% of the Fund’s average daily net assets attributable to Investor Class shares. Even though the authorized rate is up to 0.25%, the Fund is currently only using up to 0.15% of its average daily net assets attributable to Investor Class shares for such purpose. Amounts paid under the plan may be spent on any activities or expenses primarily intended to result in the sale of shares, including, but not limited to, advertising, shareholder account servicing, printing and mailing of prospectuses to other than current shareholders, printing and mailing of sales literature, and compensation for sales and marketing activities or to financial institutions and others, such as dealers and distributors. The distribution fees expensed by the Fund during fiscal year 2018 are included in the Statement of Operations.
The Fund has entered into agreements with various brokers, dealers, and financial intermediaries in connection with the sale of shares of the Fund. The agreements provide for periodic payments by the Fund to the brokers, dealers, and financial intermediaries for providing certain shareholder maintenance services (sub-transfer agent expenses). These shareholder services include the pre-processing and quality control of new accounts, shareholder correspondence, answering customer inquiries regarding account status, and facilitating shareholder telephone transactions. The sub-transfer agent fees expensed by the Fund during fiscal year 2018 are included in the Statement of Operations.
| HENNESSY FUNDS | 1-800-966-4354 | |
U.S. Bancorp Fund Services, LLC, d/b/a U.S. Bank Global Fund Services (“Fund Services”) provides the Fund with administrative, fund accounting, and transfer agent services. As administrator, Fund Services is responsible for activities such as (i) preparing various federal and state regulatory filings, reports, and returns for the Fund, (ii) preparing reports and materials to be supplied to the Board, (iii) monitoring the activities of the Fund’s custodian, transfer agent, and accountants, and (iv) coordinating the preparation and payment of the Fund’s expenses and reviewing the Fund’s expense accruals. U.S. Bank N.A., an affiliate of Fund Services, serves as the Fund’s custodian. The servicing agreements between the Trust and Fund Services and U.S. Bank N.A. contain a fee schedule that is inclusive of administrative, fund accounting, custody, and transfer agent fees. The administrative, fund accounting, custody, and transfer agent fees expensed by the Fund during fiscal year 2018 are included in the Statement of Operations.
Quasar Distributors, LLC acts as the Fund’s principal underwriter in a continuous public offering of the Fund’s shares. Quasar Distributors, LLC is an affiliate of Fund Services and U.S. Bank N.A.
The officers of the Fund are affiliated with the Advisor. Such officers, with the exception of the Chief Compliance Officer and the Senior Compliance Officer, receive no compensation from the Fund for serving in their respective roles. The Fund, along with the other Hennessy Funds, makes reimbursement payments, on an equal basis, to the Advisor for a portion of the salary and benefits associated with the office of the Chief Compliance Officer and for all of the salary and benefits associated with the office of the Senior Compliance Officer. The compliance fees expensed by the Fund during fiscal year 2018 are included in the Statement of Operations.
6). GUARANTEES AND INDEMNIFICATIONS
Under the Hennessy Funds’ organizational documents, their officers and trustees are indemnified by the Hennessy Funds against certain liabilities arising out of the performance of their duties to the Hennessy Funds. Additionally, in the normal course of business, the Hennessy Funds enter into contracts with service providers that contain general indemnification clauses. The Fund’s maximum exposure under these arrangements is unknown as this would involve future claims that may be made against the Fund that have not yet occurred. Currently, the Fund expects the risk of loss to be remote.
7). LINE OF CREDIT
The Fund has an uncommitted line of credit with the other Hennessy Funds in the amount of the lesser of (i) $100,000,000 or (ii) 33.33% of each Hennessy Fund’s net assets, or 30% for the Hennessy Gas Utility Fund and 10% for the Hennessy Balanced Fund, intended to provide short-term financing, if necessary, subject to certain restrictions, in connection with shareholder redemptions. The credit facility is with the Hennessy Funds’ custodian bank, U.S. Bank N.A. Borrowings under this arrangement bear interest at the bank’s prime rate and are secured by all of the Fund’s assets (as to its own borrowings only). During fiscal year 2018, the Fund had an outstanding average daily balance and a weighted average interest rate of $630 and 4.56%, respectively. The interest expensed by the Fund during fiscal year 2018 is included in the Statement of Operations. The maximum amount outstanding for the Fund during fiscal year 2018 was $171,000. As of October 31, 2018, the Fund did not have any borrowings outstanding under the line of credit.
8). FEDERAL TAX INFORMATION
As of October 31, 2018, the components of accumulated earnings (losses) for income tax purposes were as follows:
| NOTES TO THE FINANCIAL STATEMENTS |
| | | Investments | |
| Cost of investments for tax purposes | | $ | 4,400,905 | |
| Gross tax unrealized appreciation | | $ | 423,601 | |
| Gross tax unrealized depreciation | | | (402,056 | ) |
| Net tax unrealized appreciation/(depreciation) | | $ | 21,545 | |
| Undistributed ordinary income | | $ | 381,138 | |
| Undistributed long-term capital gains | | | 166,307 | |
| Total distributable earnings | | $ | 547,445 | |
| Other accumulated gain/(loss) | | $ | (10 | ) |
| Total accumulated gain/(loss) | | $ | 568,980 | |
The difference between book-basis unrealized appreciation/depreciation (as shown in the Statement of Assets and Liabilities) and tax-basis unrealized appreciation/depreciation (as shown above) is attributable primarily to wash sales.
As of October 31, 2018, the Fund had no tax basis capital losses to offset future capital gains.
As of October 31, 2018, the Fund did not defer, on a tax basis, any late-year ordinary losses. Late-year ordinary losses are net ordinary losses incurred after December 31, 2017, but within the taxable year, that are deemed to arise on the first day of the Fund’s next taxable year.
During fiscal year 2018 and fiscal year 2017, the tax character of distributions paid by the Fund was as follows:
| | | Year Ended | | | Year Ended | |
| | | October 31, 2018 | | | October 31, 2017 | |
| Ordinary income | | $ | — | | | $ | — | |
| Long-term capital gain | | | 391,429 | | | | — | |
| | | $ | 391,429 | | | $ | — | |
9). EVENTS SUBSEQUENT TO YEAR END
Management has evaluated the Fund’s related events and transactions that occurred subsequent to October 31, 2018, through the date of issuance of the Fund’s financial statements. Other than as disclosed below, management has determined that there were no subsequent events requiring recognition or disclosure in the financial statements.
On December 7, 2018, capital gains were declared and paid to shareholders of record on December 6, 2018, as follows:
| | Long-term | Short-term |
| Investor Class | $0.68615 | $1.57251 |
| Institutional Class | $0.70239 | $1.60970 |
| HENNESSY FUNDS | 1-800-966-4354 | |
Report of Independent Registered Public
Accounting Firm
To the Board of Trustees of Hennessy Funds Trust
and the shareholders of Hennessy Technology Fund
Novato, CA
Opinion on the Financial Statements
We have audited the accompanying statement of assets and liabilities of Hennessy Technology Fund (the “Fund”), a series of Hennessy Funds Trust, including the schedule of investments, as of October 31, 2018, the related statement of operations for the year then ended, the statements of changes in net assets for each of the two years in the period then ended, financial highlights for each of the five years in the period then ended, and the related notes (collectively referred to as the “financial statements”). In our opinion, the financial statements present fairly, in all material respects, the financial position of the Fund as of October 31, 2018, the results of its operations for the year then ended, the changes in its net assets for each of the two years in the period then ended, and the financial highlights for each of the five years in the period then ended, in conformity with accounting principles generally accepted in the United States of America.
Basis for Opinion
These financial statements are the responsibility of the Fund’s management. Our responsibility is to express an opinion on the Fund’s financial statements based on our audits. We are a public accounting firm registered with the Public Company Accounting Oversight Board (United States) (“PCAOB”) and are required to be independent with respect to the Fund in accordance with the U.S. federal securities laws and the applicable rules and regulations of the Securities and Exchange Commission and the PCAOB. We have served as the auditor of one or more of the funds in the Trust since 2002.
We conducted our audits in accordance with the standards of the PCAOB. Those standards require that we plan and perform the audit to obtain reasonable assurance about whether the financial statements are free of material misstatement, whether due to error or fraud. The Fund is not required to have, nor were we engaged to perform, an audit of its internal control over financial reporting. As part of our audits we are required to obtain an understanding of internal control over financial reporting, but not for the purpose of expressing an opinion on the effectiveness of the Fund’s internal control over financial reporting. Accordingly, we express no such opinion.
Our audits included performing procedures to assess the risks of material misstatement of the financial statements, whether due to error or fraud, and performing procedures that respond to those risks. Such procedures included examining, on a test basis, evidence regarding the amounts and disclosures in the financial statements. Our audits also included evaluating the accounting principles used and significant estimates made by management, as well as evaluating the overall presentation of the financial statements. Our procedures included confirmation of securities owned as of October 31, 2018 by correspondence with the custodian. We believe that our audits provide a reasonable basis for our opinion.
TAIT, WELLER & BAKER LLP
Philadelphia, Pennsylvania
December 27, 2018
| REPORT OF INDEPENDENT REGISTERED PUBLIC ACCOUNTING FIRM/TRUSTEES AND OFFICERS |
Trustees and Officers of the Fund (Unaudited)
The business and affairs of the Funds are managed under the direction of the Board of Trustees of the Trust, and the Board of Trustees elects the Officers of the Trust. Beginning in March 2015, the Board of Trustees has from time to time appointed advisers to the Board of Trustees (“Advisers”) with the intention of having qualified individuals serve in an advisory capacity in order to garner experience in the mutual fund and asset management industry and be considered as potential Trustees in the future. There are currently three Advisers: Brian Alexander, Doug Franklin, and Claire Knoles. As Advisers, Mr. Alexander, Mr. Franklin, and Ms. Knoles attend meetings of the Board of Trustees and act as non-voting participants. Information pertaining to the Trustees, Advisers, and the Officers of the Trust is set forth below. The Trustees and Officers serve until their successors are duly elected and qualified or until their earlier death, resignation, or removal. Each Trustee oversees the 16 Hennessy Funds. Unless otherwise indicated, the address of all persons listed below is 7250 Redwood Boulevard, Suite 200, Novato, CA 94945. The Fund’s Statement of Additional Information includes more information about the persons listed below and is available, without charge, upon request by calling 1-800-966-4354.
| | | | Other |
| | | | Directorships |
| | | | Held Outside |
| Name, (Year of Birth), | | | of Fund |
| and Position Held | Start Date | Principal Occupation(s) | Complex During |
with the Trust | of Service | During Past Five Years | Past Five Years(1) |
| | |
| Disinterested Trustees and Advisers | |
| | | | |
| J. Dennis DeSousa | January 1996 | Mr. DeSousa is a real estate investor. | None. |
| (1936) | | | |
| Trustee | | | |
| | | | |
| Robert T. Doyle | January 1996 | Mr. Doyle has been the Sheriff of | None. |
| (1947) | | Marin County, California since 1996. | |
| Trustee | | | |
| | | | |
| Gerald P. Richardson | May 2004 | Mr. Richardson is an independent | None. |
| (1945) | | consultant in the securities industry. | |
| Trustee | | | |
| | | | |
| Brian Alexander | March 2015 | Mr. Alexander has worked for the | None. |
| (1981) | | Sutter Health organization since | |
| Adviser to the Board | | 2011 in various positions. He has | |
| | | served as the Chief Executive Officer | |
| | | of the Sutter Roseville Medical | |
| | | Center since 2018. From 2016 through | |
| | | 2018, he served as the Vice President | |
| | | of Strategy for the Sutter Health Valley | |
| | | Area, which includes 11 hospitals, | |
| | | 13 ambulatory surgery centers, | |
| | | 16,000 employees, and 1,900 physicians. | |
| | | From 2013 through 2016, Mr. Alexander | |
| | | served as Sutter Novato Community | |
| | | Hospital’s Chief Administrative Officer, | |
| | | and from 2011 through 2012, he | |
| | | served as a Director of Strategy | |
| | | within Sutter’s West Bay Region. | |
| HENNESSY FUNDS | 1-800-966-4354 | |
| | | | Other |
| | | | Directorships |
| | | | Held Outside |
| Name, (Year of Birth), | | | of Fund |
| and Position Held | Start Date | Principal Occupation(s) | Complex During |
with the Trust | of Service | During Past Five Years | Past Five Years(1) |
| | | | |
| Doug Franklin | March 2016 | Mr. Franklin is a retired insurance | None. |
| (1964) | | industry executive. From 1987 | |
| Adviser to the Board | | through 2015, he was employed | |
| | | by the Allianz-Fireman’s Fund | |
| | | Insurance Company in various | |
| | | positions, including as its Chief | |
| | | Actuary and Chief Risk Officer. | |
| | | | |
| Claire Knoles | December 2015 | Ms. Knoles is a founder of Kiosk and | None. |
| (1974) | | has served as its Chief Operating | |
| Adviser to the Board | | Officer since 2004. Kiosk is a full | |
| | | service marketing agency with | |
| | | offices in the San Francisco Bay | |
| | | Area, Toronto, and Liverpool, UK. | |
| | | | |
Interested Trustee(2) | | | |
| | | | |
| Neil J. Hennessy | January 1996 as | Mr. Neil Hennessy has been employed | Hennessy |
| (1956) | a Trustee and | by Hennessy Advisors, Inc. since | Advisors, Inc. |
| Trustee, Chairman of | June 2008 as | 1989 and currently serves as its | |
| the Board, Chief | an Officer | Chairman and Chief Executive Officer. | |
| Investment Officer, | | | |
| Portfolio Manager, | | | |
| and President | | | |
| Name, (Year of Birth), | | |
| and Position Held | Start Date | Principal Occupation(s) |
with the Trust | of Service | During Past Five Years |
| | | |
| Officers | | |
| | | |
| Teresa M. Nilsen | January 1996 | Ms. Nilsen has been employed by Hennessy Advisors, Inc. |
| (1966) | | since 1989 and currently serves as its President, Chief Operating |
| Executive Vice President | | Officer, and Secretary. |
| and Treasurer | | |
| | | |
| Daniel B. Steadman | March 2000 | Mr. Steadman has been employed by Hennessy Advisors, Inc. |
| (1956) | | since 2000 and currently serves as its Executive Vice President. |
| Executive Vice President | | |
| and Secretary | | |
| | | |
| Brian Carlson | December 2013 | Mr. Carlson has been employed by Hennessy Advisors, Inc. |
| (1972) | | since December 2013 and currently serves as its Chief |
| Senior Vice President | | Compliance Officer and Senior Vice President. |
| and Head of Distribution | | |
| | | |
| Jennifer Cheskiewicz | June 2013 | Ms. Cheskiewicz has been employed by Hennessy Advisors, Inc. |
(1977)(3) | | as its General Counsel since June 2013. |
| Senior Vice President and | | |
| Chief Compliance Officer | | |
| TRUSTEES AND OFFICERS OF THE FUND |
| Name, (Year of Birth), | | |
| and Position Held | Start Date | Principal Occupation(s) |
with the Trust | of Service | During Past Five Years |
| | | |
| David Ellison | October 2012 | Mr. Ellison has been employed by Hennessy Advisors, Inc. since |
(1958)(4) | | October 2012. He has served as a Portfolio Manager of the |
| Senior Vice President | | Hennessy Large Cap Financial Fund and the Hennessy Small |
| and Portfolio Manager | | Cap Financial Fund since inception. Mr. Ellison also served as a |
| | | Portfolio Manager of the Hennessy Technology Fund from its |
| | | inception until February 2017. Mr. Ellison served as Director, |
| | | CIO and President of FBR Fund Advisers, Inc. from December |
| | | 1999 to October 2012. |
| | | |
| Ryan C. Kelley | March 2013 | Mr. Kelley has been employed by Hennessy Advisors, Inc. since |
(1972)(5) | | October 2012. He has served as a Portfolio Manager of the |
| Senior Vice President | | Hennessy Gas Utility Fund, the Hennessy Large Cap Financial |
| and Portfolio Manager | | Fund, and the Hennessy Small Cap Financial Fund since |
| | | October 2014. He served as Co-Portfolio Manager of the same |
| | | funds from March 2013 through September 2014, and as a |
| | | Portfolio Analyst for the Hennessy Funds from October 2012 |
| | | through February 2013. Mr. Kelley has also served as a Portfolio |
| | | Manager of the Hennessy Cornerstone Growth Fund, the |
| | | Hennessy Cornerstone Mid Cap 30 Fund, the Hennessy |
| | | Cornerstone Large Growth Fund, and the Hennessy |
| | | Cornerstone Value Fund since February 2017, as a Co-Portfolio |
| | | Manager of the Hennessy Technology Fund since February |
| | | 2017, and as a Portfolio Manager of the Hennessy Total Return |
| | | Fund and the Hennessy Balanced Fund since May 2018. |
| | | Mr. Kelley served as Portfolio Manager of FBR Fund Advisers, |
| | | Inc. from January 2008 to October 2012. |
| | | |
| Tania Kelley | October 2003 | Ms. Kelley has been employed by Hennessy Advisors, Inc. |
| (1965) | | since October 2003. |
| Senior Vice President | | |
| and Head of Marketing | | |
| | | |
| Daniel P. Hennessy | December 2016 | Mr. Daniel Hennessy has been employed by Hennessy Advisors, |
| (1990) | | Inc. since 2015. He has served as an Associate Analyst or |
| Vice President | | Analyst of the Hennessy Technology Fund since February 2017. |
| and Analyst | | Mr. Daniel Hennessy previously served as a Mutual Fund |
| | | Specialist at U.S. Bancorp Fund Services, LLC (now doing |
| | | business as U.S. Bank Global Fund Services) from November |
| | | 2014 to July 2015. Prior to that, he attended the University of |
| | | San Diego, where he earned a degree in Political Science. |
_______________
(1) | Messrs. DeSousa, Doyle, N. Hennessy, and Richardson previously served on the Board of Directors of Hennessy Mutual Funds, Inc. (“HMFI”), The Hennessy Funds, Inc. (“HFI”), and Hennessy SPARX Funds Trust (“HSFT”). Pursuant to an internal reorganization effective as of February 28, 2014, the series of HFMI, HFI, and HSFT were reorganized into corresponding series of the Trust that mirrored them. Subsequent to the reorganization, HFMI, HFI, and HSFT were dissolved. |
(2) | Mr. N. Hennessy is considered an “interested person,” as defined in the Investment Company Act of 1940, as amended, because he is an officer of the Hennessy Funds. |
(3) | The address of this officer is 4800 Bee Caves Road, Suite 100, Austin, TX 78746. |
(4) | The address of this officer is 101 Federal Street, Suite 1900, Boston, MA 02110. |
(5) | The address of this officer is 1340 Environ Way, Suite 332, Chapel Hill, NC 27517. |
| HENNESSY FUNDS | 1-800-966-4354 | |
Expense Example (Unaudited)
October 31, 2018
As a shareholder of the Fund, you incur ongoing costs, including management fees, service fees, and other Fund expenses. This Example is intended to help you understand your ongoing costs (in dollars) of investing in the Fund and to compare these costs with the ongoing costs of investing in other mutual funds. The Example is based on an investment of $1,000 invested at the beginning of the period and held for the entire period from May 1, 2018, through October 31, 2018.
Actual Expenses
The first line of the table below under the “Investor Class” and “Institutional Class” headings provides information about actual account values and actual expenses. Although the Fund charges no sales loads or transaction fees, you will be assessed fees for outgoing wire transfers, returned checks and stop payment orders at prevailing rates charged by U.S. Bank Global Fund Services, the Fund’s transfer agent. If you request that a redemption be made by wire transfer, currently a $15 fee is charged by the Fund’s transfer agent. IRA accounts will be charged a $15 annual maintenance fee. The example below includes, but is not limited to, management fees, shareholder servicing fees, fund accounting, custody, and transfer agent fees. However, the example below does not include portfolio trading commissions and related expenses, and other extraordinary expenses as determined under generally accepted accounting principles. You may use the information in this line, together with the amount you invested, to estimate the expenses that you paid over the period. Simply divide your account value by $1,000 (for example, an $8,600 account value divided by $1,000 = 8.6), then multiply the result by the number in the first line of the table under the “Investor Class” or “Institutional Class” headings in the column entitled “Expenses Paid During Period” to estimate the expenses you paid on your account during this period.
Hypothetical Example for Comparison Purposes
The second line of the table below under the “Investor Class” and “Institutional Class” headings provides information about hypothetical account values and hypothetical expenses based on the Fund’s actual expense ratios and an assumed rate of return of 5% per year before expenses, which is not the Fund’s actual return. The hypothetical account values and expenses may not be used to estimate the actual ending account balance or expenses you paid for the period. You may use this information to compare the ongoing costs of investing in the Fund and other funds. To do so, compare this 5% hypothetical example with the 5% hypothetical examples that appear in the shareholder reports of the other funds. Please note that the expenses shown in the table are meant to highlight your ongoing costs only. Therefore, the second line of the table under the “Investor Class” and “Institutional Class” headings is useful in comparing ongoing costs only, and will not help you determine the relative total costs of owning different funds.
| | | | Expenses Paid |
| | Beginning | Ending | During Period(1) |
| | Account Value | Account Value | May 1, 2018 – |
| | May 1, 2018 | October 31, 2018 | October 31, 2018 |
| Investor Class | | | |
| Actual | $1,000.00 | $ 992.80 | $6.18 |
| Hypothetical (5% return before expenses) | $1,000.00 | $1,019.00 | $6.26 |
| | | | |
| Institutional Class | | | |
| Actual | $1,000.00 | $ 994.60 | $4.93 |
| Hypothetical (5% return before expenses) | $1,000.00 | $1,020.27 | $4.99 |
(1) | Expenses are equal to the Fund’s annualized expense ratio of 1.23% for Investor Class shares or 0.98% for Institutional Class shares, as applicable, multiplied by the average account value over the period, multiplied by 184/365 days (to reflect one-half year period). |
| HENNESSY FUNDS | 1-800-966-4354 | |
How to Obtain a Copy of the Fund’s
Proxy Voting Policy and Proxy Voting Records
A description of the policies and procedures the Fund uses to determine how to vote proxies relating to portfolio securities is available without charge: (1) by calling 1-800-966-4354; (2) on the Hennessy Funds’ website at www.hennessyfunds.com/proxy-voting/voting-policy; or (3) on the U.S. Securities and Exchange Commission’s (the “SEC”) website at www.sec.gov. The Fund’s proxy voting record is available without charge on both the Hennessy Funds’ website at www.hennessyfunds.com/proxy-voting/voting-record and the SEC’s website at www.sec.gov no later than August 31 for the prior 12 months ending June 30.
Quarterly Filings on Form N-Q
The Fund files a complete schedule of portfolio holdings with the SEC for the first and third quarters of each fiscal year on Form N-Q. The Fund’s Forms N-Q are available on the SEC’s website at www.sec.gov. Information included in the Fund’s Forms N-Q will also be available upon request by calling 1-800-966-4354.
Federal Tax Distribution Information
(Unaudited)
For fiscal year 2018, certain dividends paid by the Fund may be subject to a maximum tax rate of 23.8%, as provided for by the Jobs and Growth Tax Relief Reconciliation Act of 2003. The percentage of dividends declared from ordinary income designated as qualified dividend income was 0.00%.
For corporate shareholders, the percent of ordinary income distributions that qualified for the corporate dividends received deduction for fiscal year 2018 was 0.00%.
The percentage of taxable ordinary income distributions that were designated as short-term capital gain distributions under Section 871(k)(2)(C) of the Internal Revenue Code of 1986, as amended, for the Fund was 0.00%.
Important Notice Regarding Delivery
of Shareholder Documents
To help keep the Fund’s costs as low as possible, we generally deliver a single copy of shareholder reports, proxy statements, and prospectuses to shareholders who share an address and have the same last name. This process does not apply to account statements. You may request an individual copy of a shareholder document at any time. If you would like to receive separate mailings of shareholder documents, please call U.S. Bank Global Fund Services at 1-800-261-6950 or 1-414-765-4124, and individual delivery will begin within 30 days of your request. If your account is held through a financial institution or other intermediary, please contact such intermediary directly to request individual delivery.
| PROXY VOTING — PRIVACY POLICY |
Privacy Policy
We collect the following non-public personal information about you:
| | • | information we receive from you on or in applications or other forms, correspondence, or conversations, including, but not limited to, your name, address, phone number, social security number, assets, income, and date of birth; and |
| | | |
| | • | information about your transactions with us, our affiliates, or others, including, but not limited to, your account number and balance, payment history, parties to transactions, cost basis information, and other financial information. |
We do not disclose any non-public personal information about our current or former shareholders to non-affiliated third parties, except as permitted by law. For example, we are permitted by law to disclose all of the information we collect, as described above, to our Transfer Agent to process your transactions. Furthermore, we restrict access to your non-public personal information to those persons who require such information to provide products or services to you. We maintain physical, electronic, and procedural safeguards that comply with federal standards to guard your non-public personal information.
In the event that you hold shares of the Fund through a financial intermediary, including, but not limited to, a broker-dealer, bank, or trust company, the privacy policy of your financial intermediary would govern how your non-public personal information will be shared with non-affiliated third parties.
| HENNESSY FUNDS | 1-800-966-4354 | |
For information, questions or assistance, please call
The Hennessy Funds
1-800-966-4354 or 1-415-899-1555
INVESTMENT ADVISOR
Hennessy Advisors, Inc.
7250 Redwood Boulevard, Suite 200
Novato, California 94945
ADMINISTRATOR,
TRANSFER AGENT,
DIVIDEND PAYING AGENT, &
SHAREHOLDER SERVICING AGENT
U.S. Bancorp Fund Services, LLC
d/b/a U.S. Bank Global Fund Services
P.O. Box 701
Milwaukee, Wisconsin 53201-0701
CUSTODIAN
U.S. Bank N.A.
Custody Operations
1555 North River Center Drive, Suite 302
Milwaukee, Wisconsin 53212
TRUSTEES
Neil J. Hennessy
Robert T. Doyle
J. Dennis DeSousa
Gerald P. Richardson
COUNSEL
Foley & Lardner LLP
777 East Wisconsin Avenue
Milwaukee, Wisconsin 53202-5306
INDEPENDENT REGISTERED
PUBLIC ACCOUNTING FIRM
Tait, Weller & Baker LLP
Two Liberty Place
50 South 16th Street, Suite 2900
Philadelphia, Pennsylvania 19102-2529
DISTRIBUTOR
Quasar Distributors, LLC
777 East Wisconsin Avenue
Milwaukee, Wisconsin 53202
hennessyfunds.com | 1-800-966-4354
This report has been prepared for shareholders and may be distributed to
others only if preceded or accompanied by a current prospectus.
Item 2. Code of Ethics.
The registrant has adopted a code of ethics that applies to the registrant’s principal executive officer and principal financial officer. The registrant amended its code of ethics in February 2018 to (i) remove the employee pre-clearance requirement for transactions in the Hennessy Funds, (ii) clarify that the exceptions to the pre-clearance requirements include gifts of exempted securities, and (iii) make certain administrative amendments to reflect the registrant’s use of a third-party website to report employee securities holdings and seek pre-clearance. The registrant has not granted any waivers from any provisions of the code of ethics during the period covered by this report.
A copy of the registrant’s Code of Ethics is filed herewith, along with an exhibit that shows the portions of the Code of Ethics that were updated, as discussed above.
Item 3. Audit Committee Financial Expert.
The registrant’s board of directors has determined that it does not have an audit committee financial expert serving on its audit committee. At this time, the registrant believes that the financial and business experience provided by each member of the audit committee together offers the registrant adequate oversight for the registrant’s level of financial complexity.
Item 4. Principal Accountant Fees and Services.
The registrant has engaged the principal accountant to the Hennessy Funds, Tait, Weller & Baker LLP, to perform audit services, audit-related services, tax services and other services during the past two fiscal years. “Audit services” refer to performing an audit of the registrant's annual financial statements or services that are normally provided by the accountant in connection with statutory and regulatory filings or engagements for those fiscal years. “Audit‑related services” refer to the assurance and related services by the principal accountant that are reasonably related to the performance of the audit. “Tax services” refer to professional services rendered by the principal accountant for tax compliance, tax advice, and tax planning. The following table details the aggregate fees billed or expected to be billed for each of the last two fiscal years for audit fees, audit-related fees, tax fees and other fees by the principal accountant to the Hennessy Funds.
| | FYE 10/31/2018 | FYE 10/31/2017 |
| Audit Fees | $313,500 | $249,200 |
| Audit-Related Fees | - | - |
| Tax Fees | $64,200 | $49,000 |
| All Other Fees | - | - |
The audit committee has adopted pre-approval procedures for audit and non-audit services provided to the registrant. Under the procedures, at any regularly scheduled audit committee meeting, the audit committee may pre-approve any audit, audit-related, tax and other non-audit services to be rendered or that may be rendered by a principal accountant to the registrant and certain non-audit services to be rendered by a principal accountant to the investment advisor to the registrant’s series or such advisor’s affiliates that provide ongoing services to the registrant. The audit committee either specifically pre-approves the services or pre-approves a type of a service. No pre-approval is required for non-audit services that meet the following criteria: (1) the aggregate amount of fees to be paid for all such non-audit services is not more than 5% of the total revenues paid by the registrant to the principal accountant in the fiscal year in which the non-audit services are provided; (2) such services were not recognized by the registrant at the time of the engagement to be non-audit services; and (3) such services are promptly brought to the attention of the audit committee and approved prior to the completion of the audit.
The audit committee must pre-approve a principal accountant’s engagements for non-audit services with the investment advisor to the registrant’s series and such advisor’s affiliates that provide ongoing services to the registrant, if the engagement relates directly to the operations and financial reporting of the registrant, unless the aggregate amount of fees to be paid for all such services provided constitutes no more than 5% of the aggregate revenues paid to the principal accountant by the registrant, the investment advisor and such advisor’s affiliates that provide ongoing services to the registrant, during the fiscal year in which the services are to be provided.
If a service has not been pre-approved at a regularly scheduled audit committee meeting, and if, in the opinion of the Chief Compliance Officer of the registrant, a proposed engagement must commence before the next regularly scheduled audit committee meeting, any member of the audit committee is authorized under the procedures to pre-approve the engagement. The Chief Compliance Officer of the registrant will arrange for this interim review, coordinate with the designated member of the audit committee and provide, with the assistance of the principal accountant, information about the service to be pre-approved for the interim period. Any interim pre-approval decisions are reported (for informational purposes) to the audit committee at its next regularly scheduled meeting.
All of the tax services referenced above were pre-approved in accordance with the pre-approval procedures for audit and non-audit services.
The percentage of fees billed by Tait, Weller & Baker LLP applicable to non-audit services pursuant to waiver of pre-approval requirement were as follows:
| | FYE 10/31/2018 | FYE 10/31/2017 |
| Audit-Related Fees | 0% | 0% |
| Tax Fees | 0% | 0% |
| All Other Fees | 0% | 0% |
All of the principal accountant’s hours spent on auditing the registrant’s financial statements were attributed to work performed by full‑time permanent employees of the principal accountant.
In assessing the independence of the registrant’s principal accountant, the registrant’s board of trustees noted that the principal accountant has not provided any audit or non-audit services to the investment advisor to the registrant’s series, Hennessy Advisors, Inc., or any entity controlling, controlled by, or under common control with Hennessy Advisors, Inc.
Item 5. Audit Committee of Listed Registrants.
Not applicable to registrants who are not listed issuers (as defined in Rule 10A-3 under the Securities Exchange Act of 1934).
Item 6. Investments.
The Schedules of Investments are included as part of the reports to shareholders filed under Item 1 of this Form.
Item 7. Disclosure of Proxy Voting Policies and Procedures for Closed-End Management Investment Companies.
Not applicable to open-end investment companies.
Item 8. Portfolio Managers of Closed-End Management Investment Companies.
Not applicable to open-end investment companies.
Item 9. Purchases of Equity Securities by Closed‑End Management Investment Company and Affiliated Purchasers.
Not applicable to open-end investment companies.
Item 10. Submission of Matters to a Vote of Security Holders.
Not Applicable.
Item 11. Controls and Procedures.
| (a) | The Registrant’s President and Treasurer have reviewed the Registrant's disclosure controls and procedures (as defined in Rule 30a-3(c) under the Investment Company Act of 1940 (the “Act”)) as of a date within 90 days of the filing of this report, as required by Rule 30a‑3(b) under the Act and Rules 13a-15(b) or 15d‑15(b) under the Securities Exchange Act of 1934. Based on their review, such officers have concluded that the disclosure controls and procedures are effective in ensuring that information required to be disclosed in this report is appropriately recorded, processed, summarized and reported and made known to them by others within the Registrant and by the Registrant’s service providers. |
| (b) | There were no changes in the Registrant's internal control over financial reporting (as defined in Rule 30a-3(d) under the Act) that occurred during the second fiscal quarter of the period covered by this report that has materially affected, or is reasonably likely to materially affect, the Registrant's internal control over financial reporting. |
Item 12. Disclosure of Securities Lending Activities for Closed-End Management Investment Companies.
Not applicable to open-end investment companies.
Item 13. Exhibits.
| (a) | (1) Code of ethics, or amendments thereto, that is the subject of the disclosure required by Item 2, to the extent that the registrant intends to satisfy Item 2 requirements through filing of an exhibit. Filed herewith. |
(2) A separate certification for each principal executive and principal financial officer pursuant to Rule 30a‑2(a) under the Act and Section 302 of the Sarbanes-Oxley Act of 2002. Filed herewith.
(3) Any written solicitation to purchase securities under Rule 23c‑1 under the Act sent or given during the period covered by the report by or on behalf of the registrant to 10 or more persons. Not applicable to open-end investment companies.
(4) Change in the registrant’s independent public accountant. Provide the information called for by Item 4 of Form 8-K under the Exchange Act (17 CFR 249.308). Unless otherwise specified by Item 4, or related to and necessary for a complete understanding of information not previously disclosed, the information should relate to events occurring during the reporting period. There was no change in the registrant's independent public accountant for the period covered by this report.
| (b) | Certifications pursuant to Rule 30a‑2(b) under the Act and Section 906 of the Sarbanes‑Oxley Act of 2002. Furnished herewith. |
SIGNATURES
Pursuant to the requirements of the Securities Exchange Act of 1934 and the Investment Company Act of 1940, the registrant has duly caused this report to be signed on its behalf by the undersigned, thereunto duly authorized.
HENNESSY FUNDS TRUST
(Registrant)
By: /s/ Neil J. Hennessy
Neil J. Hennessy
President
Date: January 9, 2019
Pursuant to the requirements of the Securities Exchange Act of 1934 and the Investment Company Act of 1940, this report has been signed below by the following persons on behalf of the registrant and in the capacities and on the dates indicated.
By: /s/ Neil J. Hennessy
Neil J. Hennessy, President |
| |
| Date: January 9, 2019 |
| |
By: /s/ Teresa M. Nilsen
Teresa M. Nilsen, Treasurer |
| |
| Date: January 9, 2019 |