As filed with the Securities and Exchange Commission on January 6, 2017
UNITED STATES
SECURITIES AND EXCHANGE COMMISSION
Washington, D.C. 20549
FORM N-CSR
CERTIFIED SHAREHOLDER REPORT OF REGISTERED
MANAGEMENT INVESTMENT COMPANIES
Investment Company Act file number (811-07168)
Hennessy Funds Trust
(Exact name of registrant as specified in charter)
7250 Redwood Blvd., Suite 200
Novato, CA 94945
(Address of principal executive offices) (Zip code)
Neil J. Hennessy
7250 Redwood Blvd., Suite 200
Novato, CA 94945
(Name and address of agent for service)
800-966-4354
Registrant’s telephone number, including area code
Date of fiscal year end: October 31, 2016
Date of reporting period: October 31, 2016
Item 1. Reports to Stockholders.
ANNUAL REPORT
OCTOBER 31, 2016
HENNESSY CORNERSTONE
GROWTH FUND
Investor Class HFCGX
Institutional Class HICGX
hennessyfunds.com | 1-800-966-4354
(This Page Intentionally Left Blank.)
Contents
| Letter to Shareholders | 2 |
| Performance Overview | 4 |
| Financial Statements | |
| Schedule of Investments | 7 |
| Statement of Assets and Liabilities | 12 |
| Statement of Operations | 13 |
| Statements of Changes in Net Assets | 15 |
| Financial Highlights | 16 |
| Notes to the Financial Statements | 20 |
| Report of Independent Registered Public Accounting Firm | 28 |
| Trustees and Officers of the Fund | 29 |
| Expense Example | 32 |
| Proxy Voting | 34 |
| Quarterly Filings on Form N-Q | 34 |
| Householding | 34 |
| Privacy Policy | 35 |
| HENNESSY FUNDS | 1-800-966-4354 | |
December 2016
Dear Hennessy Funds Shareholder:
Over the past year investors here in the U.S. and around the world have weathered a great deal of turmoil, especially in the political arena. Foremost, the bitterly divisive and all-consuming U.S. Presidential election, with its unanticipated outcome, is finally behind us. While the equity markets were jittery at first, they now appear more comfortable with the prospect of a Trump presidency and seem to be looking forward to diminished government regulation and intervention.
The Brexit vote in the U.K. cast a shadow over the European Union’s future. There remains uncertainty over the details and timing of the break and the economic consequences for both Britain and Europe, but early signs suggest the impact on growth in Britain will not be as severe as initially feared.
Additionally, uncertainty over whether the Federal Reserve would raise short-term interest rates has hung over the economy for well over a year now. The effects that higher rates could have on growth, the strength of the U.S. Dollar, corporate profits and loan supply and demand seem to have weighed heavily on investors, causing paralysis and money to remain on the sidelines of the market.
Despite all these concerns, U.S. equity markets have pushed higher, with both the Dow Jones Industrial Average and S&P 500 Index posting returns of approximately 5% during the twelve-month period ended October 31, 2016. The U.S. economy has continued to grow at a respectable annual rate of about 2%, and corporate profits have started to move higher. Today, as of mid-December, bond and Treasury yields have risen a bit from record lows just this summer, and the bond market is finishing the year on slightly rocky footing. Bond yields are still very low relative to historical averages, while the prospective PE multiples for the Dow Jones Industrial Average and S&P 500 Index are just above long-term averages at 18.0x and 18.9x, respectively. We believe that equity valuations could go considerably higher and still be at appropriate levels relative to bond yields. And, while we do expect the Fed to raise interest rates in the coming year, we believe that inflation will stay under control, so that short-term interest rates will not have to rise too fast or too far.
As I reflect over the past twelve months, what I realize is that many of the worries this year are not new. For the past several years, American businesses have operated in an environment characterized by highly partisan politics, mounting regulations, uncertainty over interest rates, and a lack of clarity regarding taxes and healthcare costs. Despite all these headwinds, U.S. corporations have been incredibly resilient and found ways to impress investors. If the newly elected administration follows through on campaign promises of reigning in regulation, lowering taxes for corporations and individuals, or reforming healthcare to drive down costs, then companies, which are already lean, should be able to post higher profits. And, that growth should lead to more jobs and a stronger economy, potentially creating a very positive cycle going forward.
With the bull market in U.S. equities entering its ninth year, many believe the economy is due for a recession and the market is due for a downturn. But, the euphoria that usually accompanies a peak in the market is absent. Since the recovery began after the financial crisis, I have found myself pondering the bull run of 1982 to 2000, powered, in part, by a significant increase in valuations. I believe today’s market displays the fundamentals to sustain a similarly strong and lengthy bull market. Meanwhile, companies are largely profitable and many corporate balance sheets are cash-rich, with
HENNESSYFUNDS.COM
relatively little debt. Unemployment is low and real wages are rising, helping to drive consumption. We are hopeful that these factors will provide support for positive market returns in the year to come.
Thank you for your continued confidence and investment in our funds. If you have any questions or would like to speak with us directly, please don’t hesitate to call us at (800) 966-4354.
Best regards,
Neil J. Hennessy
President and Chief Investment Officer
Past performance does not guarantee future results.
Mutual fund investing involves risk. Principal loss is possible.
Opinions expressed are those of Neil Hennessy and are subject to change, are not guaranteed and should not be considered investment advice.
The Dow Jones Industrial Average and S&P 500 Index are unmanaged indices commonly used to measure the performance of U.S. stocks. One cannot invest directly in an index.
PE, or price to earnings, is calculated by dividing a company’s market price per share by its earnings per share.
| HENNESSY FUNDS | 1-800-966-4354 | |
Performance Overview (Unaudited)
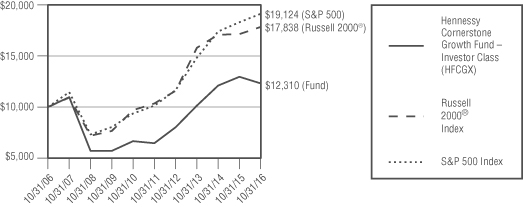
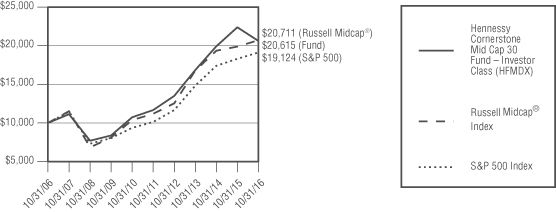
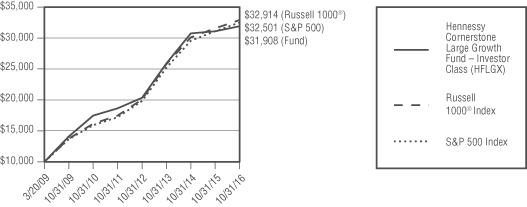
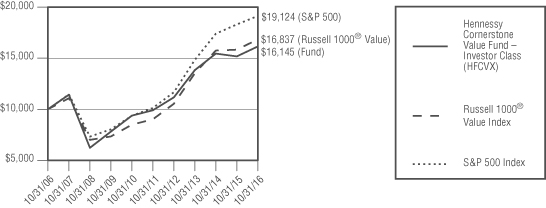
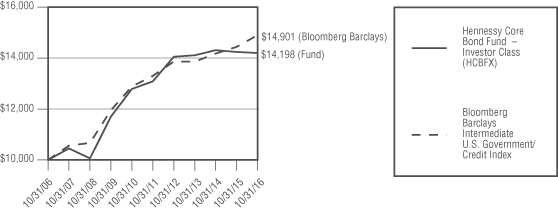
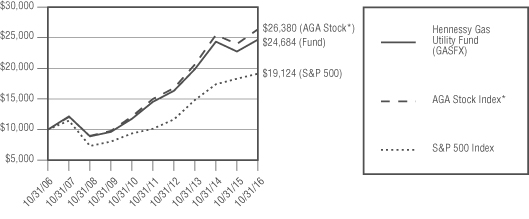
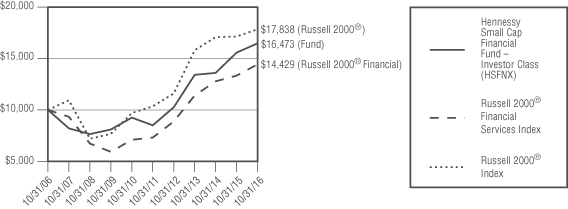
CHANGE IN VALUE OF $10,000 INVESTMENT
This graph illustrates the performance of an initial investment of $10,000 made in the Fund ten years ago and assumes the reinvestment of dividends.
AVERAGE ANNUAL TOTAL RETURN FOR PERIODS ENDED OCTOBER 31, 2016
| | One | Five | Ten |
| | Year | Years | Years |
| Hennessy Cornerstone Growth Fund – | | | |
| Investor Class (HFCGX) | -5.00% | 13.77% | 2.10% |
| Hennessy Cornerstone Growth Fund – | | | |
Institutional Class (HICGX)(1) | -4.69% | 14.10% | 2.37% |
Russell 2000® Index | 4.11% | 11.51% | 5.96% |
| S&P 500 Index | 4.51% | 13.57% | 6.70% |
Expense ratios: 1.31% (Investor Class); 1.00% (Institutional Class)
Performance data quoted represents past performance; past performance does not guarantee future results. The investment return and principal value of an investment will fluctuate so that an investor’s shares, when redeemed, may be worth more or less than their original cost. The performance graph and table do not reflect the deduction of taxes that a shareholder would pay on Fund distributions or the redemption of Fund shares. Current performance of the Fund may be lower or higher than the performance quoted. Performance data current to the most recent month end may be obtained by visiting hennessyfunds.com.
The expense ratios presented are from the most recent prospectus.
(1) | The inception date of Institutional Class shares is March 3, 2008. Performance shown prior to the inception of Institutional Class shares reflects the performance of Investor Class shares and includes expenses that are not applicable to and are higher than those of Institutional Class shares. |
PERFORMANCE NARRATIVE
Portfolio Managers Neil J. Hennessy and Brian E. Peery
Performance:
For the twelve-month period ended October 31, 2016, the Investor Class of the Hennessy Cornerstone Growth Fund returned -5.00%, underperforming both the Russell 2000® Index and the S&P 500 Index, which returned 4.11% and 4.51% for the same period, respectively.
HENNESSYFUNDS.COM
The Fund’s underperformance relative to its benchmark was almost entirely due to stock selection. Within the Consumer Staples sector, our holdings in three food stocks, Amira Nature Foods Ltd., Ingles Markets, Inc. and John B. Sanfilippo & Son, Inc., all contributed significantly to the underperformance over the period. Investments in the Consumer Discretionary sector also performed poorly, with Vista Outdoor, Inc. and Movado Group, Inc. adding to the underperformance. We continue to hold Amira Nature Foods, Vista Outdoor and Movado Group in the portfolio, but have sold Ingles Markets and John B. Sanfilippo & Son.
Portfolio Strategy:
We believe that the Fund’s investment strategy, which seeks companies that are reporting growth in earnings, whose stock prices are showing positive relative strength, but that still trade on low price-to-sales ratios, offers investors true “growth at a reasonable price.” Limiting the Fund’s portfolio to 50 stocks produces a relatively concentrated portfolio, where individual stock performance can influence the performance of the portfolio as a whole. We believe this stock selection approach has served us well over time, and we wholeheartedly support utilizing this methodology when investing.
Market Outlook:
Over the twelve-month period ended October 31, 2016, U.S. equities produced moderate, positive returns. The period was once again marked by a great deal of volatility, with major market indices dropping more than 10% at one point early in the year before recovering all of their losses. Throughout this period, there have been concerns about interest rates, commodity prices, economic growth (both domestic and international) and the U.S. Presidential election. Many, if not all, of these concerns still exist in the marketplace today, but we have reasons to be hopeful for the year to come.
First, while corporate profits have been on a gentle slide downwards since the fourth quarter of 2014, market analysts are now forecasting a return to growth in profits in the fourth quarter of this year. We believe these forecasts have a good chance of being proved correct. Second, mergers and acquisitions have been strong and steady this year and we believe such activity will continue next year, helping drive revenue and earnings for the acquiring companies. Third, we do not believe the majority of stocks are expensive at this point, though many are probably fairly valued. The Dow Jones Industrial Average and the S&P 500 Index have forward PE ratios of roughly 18x and 19x, respectively, close to long-term averages although slightly higher than six months ago. Corporate balance sheets appear to be in excellent shape, and while executives have shown some reluctance to increase capital spending beyond maintenance levels this cycle, we believe companies outside of the Energy sector will eventually start investing for expansion. Overall, we believe the basic fundamentals of the market are attractive, and we continue to be optimistic about the possibility of further moderate market advances over the course of next year.
Investment Outlook:
We continue to believe that there are good investment opportunities among small- and mid-cap stocks. Many investors gravitated away from smaller stocks last year as they sought safety in larger, more well-established businesses in a year of much political uncertainty. Many of these smaller companies have purely domestic businesses, which are benefiting from steady, albeit slow, economic growth at home, low inflation and low energy prices. With consumer debt levels falling and wage growth finally starting to accelerate, we are expecting a good year for domestically oriented small and mid-cap stocks. We believe that investors will also begin to favor smaller stocks as valuations of larger capitalization stocks continue to rise, leaving small and mid-cap stocks looking attractive on a relative basis.
| HENNESSY FUNDS | 1-800-966-4354 | |
We remain pleased with the positioning of the portfolio, which remains overweight in cyclical stocks, which generally fare better in a period of economic expansion, and domestically oriented stocks that we believe are reasonably valued and appear poised for growth. Relative to the Fund’s benchmarks, the portfolio remains overweight in both the Consumer Discretionary and Industrial sectors and we think that these areas of the market offer great growth potential in 2017.
_______________
Opinions expressed are those of the Portfolio Managers as of the date written and are subject to change, are not guaranteed, and should not be considered investment advice or an indication of trading intent.
The Russell 2000® Index is an index commonly used to measure the performance of U.S. small-capitalization stocks. The S&P 500 Index and Dow Jones Industrial Average are unmanaged indices commonly used to measure the performance of U.S. stocks. One cannot invest directly in an index.
The Fund invests in small and medium capitalized companies, which may have limited liquidity and greater price volatility than large capitalization companies. Investments in foreign securities may involve political, economic and currency risks, greater volatility and differences in accounting methods. The Fund’s formula-based strategy may cause the Fund to buy or sell securities at times when it may not be advantageous. Please see the Fund’s prospectus for a more complete discussion of these and other risks.
References to specific securities should not be considered a recommendation to buy or sell any security. Fund holdings and sector allocations are subject to change. Please refer to the Schedule of Investments included in this report for additional portfolio information.
Earnings growth is not a measure of the Fund’s future performance. Price-to-sales ratio is a tool for calculating a stock’s valuation relative to other companies. It is calculated by dividing a stock’s current price by its revenue per share. PE, or price to earnings, is calculated by dividing a company’s market price per share by its earnings per share.
HENNESSYFUNDS.COM
| PERFORMANCE OVERVIEW/SCHEDULE OF INVESTMENTS |
Financial Statements
Schedule of Investments as of October 31, 2016 |
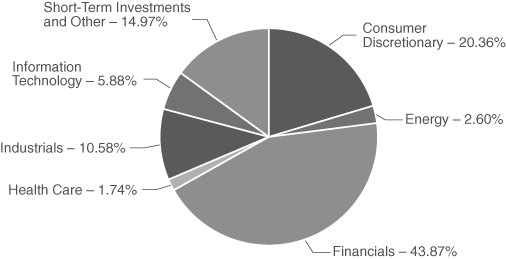
HENNESSY CORNERSTONE GROWTH FUND
(% of Net Assets)
| TOP TEN HOLDINGS (EXCLUDING CASH/CASH EQUIVALENTS) | % NET ASSETS |
| | |
| Insperity, Inc. | 2.97% |
| | |
| John Bean Technologies Corp. | 2.85% |
| | |
| Itron, Inc. | 2.54% |
| | |
| Burlington Stores, Inc. | 2.51% |
| | |
| Ingredion, Inc. | 2.43% |
| | |
| NeoPhotonics Corp. | 2.40% |
| | |
| Astec Industries, Inc. | 2.39% |
| | |
| Brady Corp., Class A | 2.38% |
| | |
| UGI Corp. | 2.35% |
| | |
| Superior Industries International, Inc. | 2.33% |
Note: For presentation purposes, the Fund has grouped some of the industry categories. For purposes of categorizing securities for compliance with Section 8(b)(1) of the Investment Company Act of 1940, as amended, the Fund uses more specific industry classifications.
| HENNESSY FUNDS | 1-800-966-4354 | |
| | COMMON STOCKS – 97.80% | | Number | | | | | | % of | |
| | | | of Shares | | | Value | | | Net Assets | |
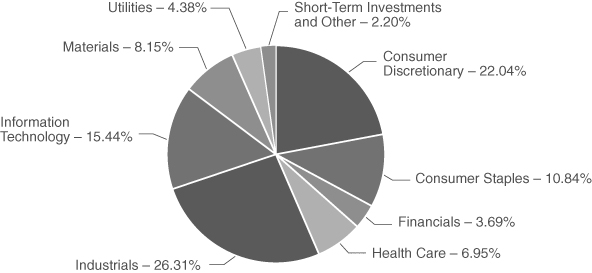
| | Consumer Discretionary – 22.04% | | | | | | | | | |
| | BJ’s Restaurants, Inc. (a) | | | 89,600 | | | $ | 3,234,560 | | | | 1.54 | % |
| | Burlington Stores, Inc. (a) | | | 70,400 | | | | 5,275,776 | | | | 2.51 | % |
| | Dollar General Corp. | | | 53,200 | | | | 3,675,588 | | | | 1.75 | % |
| | Genesco, Inc. (a) | | | 59,800 | | | | 3,217,240 | | | | 1.53 | % |
| | Genuine Parts Co. | | | 43,800 | | | | 3,967,842 | | | | 1.89 | % |
| | Movado Group, Inc. | | | 135,200 | | | | 2,981,160 | | | | 1.42 | % |
| | Omnicom Group, Inc. | | | 50,700 | | | | 4,046,874 | | | | 1.92 | % |
| | Potbelly Corp. (a) | | | 314,600 | | | | 4,105,530 | | | | 1.95 | % |
| | Superior Industries International, Inc. | | | 199,900 | | | | 4,897,550 | | | | 2.33 | % |
| | Target Corp. | | | 50,300 | | | | 3,457,119 | | | | 1.64 | % |
| | The Children’s Place, Inc. | | | 57,900 | | | | 4,397,505 | | | | 2.09 | % |
| | Vista Outdoor, Inc. (a) | | | 80,100 | | | | 3,097,467 | | | | 1.47 | % |
| | | | | | | | | 46,354,211 | | | | 22.04 | % |
| | | | | | | | | | | | | | |
| | Consumer Staples – 10.84% | | | | | | | | | | | | |
| | Amira Nature Foods, Ltd. (a)(b) | | | 310,100 | | | | 2,431,184 | | | | 1.15 | % |
| | Dean Foods Co. | | | 204,700 | | | | 3,737,822 | | | | 1.78 | % |
| | Ingredion, Inc. | | | 39,000 | | | | 5,115,630 | | | | 2.43 | % |
| | John B. Sanfilippo & Son, Inc. | | | 56,700 | | | | 2,873,556 | | | | 1.37 | % |
| | Post Holdings, Inc. (a) | | | 56,800 | | | | 4,329,864 | | | | 2.06 | % |
| | Tyson Foods, Inc., Class A | | | 61,000 | | | | 4,321,850 | | | | 2.05 | % |
| | | | | | | | | 22,809,906 | | | | 10.84 | % |
| | | | | | | | | | | | | | |
| | Financials – 3.69% | | | | | | | | | | | | |
| | The Progressive Corp. | | | 123,700 | | | | 3,897,787 | | | | 1.85 | % |
| | United Fire Group, Inc. | | | 97,900 | | | | 3,869,008 | | | | 1.84 | % |
| | | | | | | | | 7,766,795 | | | | 3.69 | % |
| | | | | | | | | | | | | | |
| | Health Care – 6.95% | | | | | | | | | | | | |
| | Henry Schein, Inc. (a) | | | 23,900 | | | | 3,565,880 | | | | 1.70 | % |
| | Owens & Minor, Inc. | | | 100,200 | | | | 3,251,490 | | | | 1.55 | % |
| | Triple-S Management Corp., Class B (a)(b) | | | 150,600 | | | | 3,114,408 | | | | 1.48 | % |
| | UnitedHealth Group, Inc. | | | 33,100 | | | | 4,678,023 | | | | 2.22 | % |
| | | | | | | | | 14,609,801 | | | | 6.95 | % |
The accompanying notes are an integral part of these financial statements.
HENNESSYFUNDS.COM
| | COMMON STOCKS | | Number | | | | | | % of | |
| | | | of Shares | | | Value | | | Net Assets | |
| | Industrials – 26.31% | | | | | | | | | |
| | Air Transport Services Group, Inc. (a) | | | 341,800 | | | $ | 4,522,014 | | | | 2.15 | % |
| | Astec Industries, Inc. | | | 90,900 | | | | 5,032,224 | | | | 2.39 | % |
| | Brady Corp., Class A | | | 151,100 | | | | 5,001,410 | | | | 2.38 | % |
| | Briggs & Stratton Corp. | | | 185,600 | | | | 3,455,872 | | | | 1.64 | % |
| | C.H. Robinson Worldwide, Inc. | | | 56,500 | | | | 3,848,780 | | | | 1.83 | % |
| | Hawaiian Holdings, Inc. (a) | | | 91,800 | | | | 4,133,295 | | | | 1.97 | % |
| | Huntington Ingalls Industries, Inc. | | | 30,100 | | | | 4,856,936 | | | | 2.31 | % |
| | Insperity, Inc. | | | 83,100 | | | | 6,249,120 | | | | 2.97 | % |
| | Insteel Industries, Inc. | | | 150,800 | | | | 4,056,520 | | | | 1.93 | % |
| | John Bean Technologies Corp. | | | 75,100 | | | | 5,996,735 | | | | 2.85 | % |
| | Kaman Corp. | | | 89,900 | | | | 3,925,034 | | | | 1.87 | % |
| | Watsco, Inc. | | | 31,000 | | | | 4,255,990 | | | | 2.02 | % |
| | | | | | | | | 55,333,930 | | | | 26.31 | % |
| | | | | | | | | | | | | | |
| | Information Technology – 15.44% | | | | | | | | | | | | |
| | Arrow Electronics, Inc. (a) | | | 69,100 | | | | 4,223,392 | | | | 2.01 | % |
| | Convergys Corp. | | | 153,100 | | | | 4,470,520 | | | | 2.12 | % |
| | Itron, Inc. (a) | | | 99,100 | | | | 5,341,490 | | | | 2.54 | % |
| | NeoPhotonics Corp. (a) | | | 360,200 | | | | 5,042,800 | | | | 2.40 | % |
| | Orbotech, Ltd. (a)(b) | | | 174,300 | | | | 4,775,820 | | | | 2.27 | % |
| | SYNNEX Corp. | | | 42,000 | | | | 4,306,680 | | | | 2.05 | % |
| | Tech Data Corp. (a) | | | 56,100 | | | | 4,320,822 | | | | 2.05 | % |
| | | | | | | | | 32,481,524 | | | | 15.44 | % |
| | | | | | | | | | | | | | |
| | Materials – 8.15% | | | | | | | | | | | | |
| | Avery Dennison Corp. | | | 60,600 | | | | 4,229,274 | | | | 2.01 | % |
| | Bemis Co., Inc. | | | 80,500 | | | | 3,921,960 | | | | 1.86 | % |
| | Reliance Steel & Aluminum Co. | | | 64,800 | | | | 4,456,944 | | | | 2.12 | % |
| | Sonoco Products Co. | | | 90,300 | | | | 4,541,187 | | | | 2.16 | % |
| | | | | | | | | 17,149,365 | | | | 8.15 | % |
| | | | | | | | | | | | | | |
| | Utilities – 4.38% | | | | | | | | | | | | |
| | Exelon Corp. | | | 125,400 | | | | 4,272,378 | | | | 2.03 | % |
| | UGI Corp. | | | 106,800 | | | | 4,943,772 | | | | 2.35 | % |
| | | | | | | | | 9,216,150 | | | | 4.38 | % |
| | | | | | | | | | | | | | |
| | Total Common Stocks | | | | | | | | | | | | |
| | (Cost $198,765,034) | | | | | | | 205,721,682 | | | | 97.80 | % |
The accompanying notes are an integral part of these financial statements.
| HENNESSY FUNDS | 1-800-966-4354 | |
| | RIGHTS – 0.00% | | Number | | | | | | % of | |
| | | | of Shares | | | Value | | | Net Assets | |
| | Health Care – 0.00% | | | | | | | | | |
| | Forest Laboratories, Inc. (a)(c) | | | 5,500 | | | $ | 275 | | | | 0.00 | % |
| | | | | | | | | | | | | | |
| | Total Rights | | | | | | | | | | | | |
| | (Cost $0) | | | | | | | 275 | | | | 0.00 | % |
| | | | | | | | | | | | | | |
| | SHORT-TERM INVESTMENTS – 2.46% | | | | | | | | | | | | |
| | | | | | | | | | | | | | |
| | Money Market Funds – 2.46% | | | | | | | | | | | | |
| | Fidelity Government Portfolio, | | | | | | | | | | | | |
| | Institutional Class, 0.27% (d) | | | 5,179,813 | | | | 5,179,813 | | | | 2.46 | % |
| | | | | | | | | | | | | | |
| | Total Short-Term Investments | | | | | | | | | | | | |
| | (Cost $5,179,813) | | | | | | | 5,179,813 | | | | 2.46 | % |
| | | | | | | | | | | | | | |
| | Total Investments | | | | | | | | | | | | |
| | (Cost $203,944,847) – 100.26% | | | | | | | 210,901,770 | | | | 100.26 | % |
| | Liabilities in Excess | | | | | | | | | | | | |
| | of Other Assets – (0.26)% | | | | | | | (546,091 | ) | | | (0.26 | )% |
| | | | | | | | | | | | | | |
| | TOTAL NET ASSETS – 100.00% | | | | | | $ | 210,355,679 | | | | 100.00 | % |
Percentages are stated as a percent of net assets.
| (a) | Non-income producing security. |
| (b) | U.S. traded security of a foreign corporation. |
| (c) | Security is fair valued in good faith. |
| (d) | The rate listed is the fund’s 7-day yield as of October 31, 2016. |
The accompanying notes are an integral part of these financial statements.
HENNESSYFUNDS.COM
Summary of Fair Value Exposure at October 31, 2016
The following is a summary of the inputs used to value the Fund’s net assets as of October 31, 2016 (see Note 3 in the accompanying notes to the financial statements):
| Common Stocks | | Level 1 | | | Level 2 | | | Level 3 | | | Total | |
| Consumer Discretionary | | $ | 46,354,211 | | | $ | — | | | $ | — | | | $ | 46,354,211 | |
| Consumer Staples | | | 22,809,906 | | | | — | | | | — | | | | 22,809,906 | |
| Financials | | | 7,766,795 | | | | — | | | | — | | | | 7,766,795 | |
| Health Care | | | 14,609,801 | | | | — | | | | — | | | | 14,609,801 | |
| Industrials | | | 55,333,930 | | | | — | | | | — | | | | 55,333,930 | |
| Information Technology | | | 32,481,524 | | | | — | | | | — | | | | 32,481,524 | |
| Materials | | | 17,149,365 | | | | — | | | | — | | | | 17,149,365 | |
| Utilities | | | 9,216,150 | | | | — | | | | — | | | | 9,216,150 | |
| Total Common Stocks | | $ | 205,721,682 | | | $ | — | | | $ | — | | | $ | 205,721,682 | |
| Rights | | | | | | | | | | | | | | | | |
| Health Care | | $ | — | | | $ | — | | | $ | 275 | * | | $ | 275 | |
| Total Rights | | $ | — | | | $ | — | | | $ | 275 | | | $ | 275 | |
| Short-Term Investments | | | | | | | | | | | | | | | | |
| Money Market Funds | | $ | 5,179,813 | | | $ | — | | | $ | — | | | $ | 5,179,813 | |
| Total Short-Term Investments | | $ | 5,179,813 | | | $ | — | | | $ | — | | | $ | 5,179,813 | |
| Total Investments | | $ | 210,901,495 | | | $ | — | | | $ | 275 | | | $ | 210,901,770 | |
| * | Acquired as partial consideration in an acquisition of an issuer whose securities were held by the Fund immediately prior to such acquisition. |
Transfers between levels are recognized at the end of the reporting period. During the year ended October 31, 2016, the Fund recognized no transfers between levels.
Level 3 Reconciliation Disclosure
Following is a reconciliation of Level 3 assets for which significant unobservable inputs were used to determine fair value.
| | | Rights | |
| Balance as of October 31, 2015 | | $ | 275 | |
| Accrued discounts/premiums | | | — | |
| Realized gain (loss) | | | — | |
| Change in unrealized appreciation (depreciation) | | | — | |
| Purchases | | | — | |
| (Sales) | | | — | |
| Transfer in and/or out of Level 3 | | | — | |
| Balance as of October 31, 2016 | | $ | 275 | |
| | | | | |
| Change in unrealized appreciation/depreciation during the period for | | | | |
| Level 3 investments held at October 31, 2016 | | $ | — | |
The Level 3 investments as of October 31, 2016, represented 0.00% of net assets and did not warrant a disclosure of significant unobservable valuation inputs.
The accompanying notes are an integral part of these financial statements.
| HENNESSY FUNDS | 1-800-966-4354 | |
Financial Statements
Statement of Assets and Liabilities as of October 31, 2016 |
| ASSETS: | | | |
| Investments in securities, at value (cost $203,944,847) | | $ | 210,901,770 | |
| Dividends and interest receivable | | | 622 | |
| Receivable for fund shares sold | | | 4,801 | |
| Prepaid expenses and other assets | | | 30,672 | |
| Total Assets | | | 210,937,865 | |
| | | | | |
| LIABILITIES: | | | | |
| Payable for fund shares redeemed | | | 223,869 | |
| Payable to advisor | | | 135,746 | |
| Payable to administrator | | | 36,812 | |
| Payable to auditor | | | 27,579 | |
| Accrued distribution fees | | | 71,609 | |
| Accrued service fees | | | 16,088 | |
| Accrued trustees fees | | | 3,872 | |
| Accrued expenses and other payables | | | 66,611 | |
| Total Liabilities | | | 582,186 | |
| NET ASSETS | | $ | 210,355,679 | |
| | | | | |
| NET ASSETS CONSIST OF: | | | | |
| Capital stock | | $ | 310,276,652 | |
| Accumulated net investment loss | | | (180,958 | ) |
| Accumulated net realized loss on investments | | | (106,696,938 | ) |
| Unrealized net appreciation on investments | | | 6,956,923 | |
| Total Net Assets | | $ | 210,355,679 | |
| | | | | |
| NET ASSETS | | | | |
| Investor Class: | | | | |
| Shares authorized (no par value) | | Unlimited | |
| Net assets applicable to outstanding Investor Class shares | | $ | 184,614,311 | |
| Shares issued and outstanding | | | 9,725,748 | |
| Net asset value, offering price and redemption price per share | | $ | 18.98 | |
| | | | | |
| Institutional Class: | | | | |
| Shares authorized (no par value) | | Unlimited | |
| Net assets applicable to outstanding Institutional Class shares | | $ | 25,741,368 | |
| Shares issued and outstanding | | | 1,322,800 | |
| Net asset value, offering price and redemption price per share | | $ | 19.46 | |
The accompanying notes are an integral part of these financial statements.
HENNESSYFUNDS.COM
| STATEMENT OF ASSETS AND LIABILITIES/STATEMENT OF OPERATIONS |
Financial Statements
Statement of Operations for the year ended October 31, 2016 |
| INVESTMENT INCOME: | | | |
| Dividend income | | $ | 2,803,007 | |
| Interest income | | | 12,462 | |
| Total investment income | | | 2,815,469 | |
| | | | | |
| EXPENSES: | | | | |
| Investment advisory fees (See Note 5) | | | 1,839,205 | |
| Sub-transfer agent expenses – Investor Class (See Note 5) | | | 363,691 | |
| Sub-transfer agent expenses – Institutional Class (See Note 5) | | | 24,712 | |
| Distribution fees – Investor Class (See Note 5) | | | 324,967 | |
| Administration, fund accounting, custody and transfer agent fees (See Note 5) | | | 242,477 | |
| Service fees – Investor Class (See Note 5) | | | 216,645 | |
| Audit fees | | | 28,766 | |
| Federal and state registration fees | | | 27,330 | |
| Reports to shareholders | | | 25,751 | |
| Compliance expense (See Note 5) | | | 23,709 | |
| Trustees’ fees and expenses | | | 15,948 | |
| Interest expense (See Note 7) | | | 5,265 | |
| Legal fees | | | 2,743 | |
| Other expenses | | | 20,367 | |
| Total expenses | | | 3,161,576 | |
| NET INVESTMENT LOSS | | $ | (346,107 | ) |
| | | | | |
| REALIZED AND UNREALIZED LOSSES: | | | | |
| Net realized loss on investments | | $ | (8,409,990 | ) |
| Net change in unrealized appreciation on investments | | | (5,945,754 | ) |
| Net loss on investments | | | (14,355,744 | ) |
| NET DECREASE IN NET ASSETS RESULTING FROM OPERATIONS | | $ | (14,701,851 | ) |
The accompanying notes are an integral part of these financial statements.
| HENNESSY FUNDS | 1-800-966-4354 | |
(This Page Intentionally Left Blank.)
HENNESSYFUNDS.COM
| STATEMENTS OF CHANGES IN NET ASSETS |
Financial Statements
| Statements of Changes in Net Assets |
| | | Year Ended | | | Year Ended | |
| | | October 31, 2016 | | | October 31, 2015 | |
| OPERATIONS: | | | | | | |
| Net investment income (loss) | | $ | (346,107 | ) | | $ | 926,445 | |
| Net realized gain (loss) on investments | | | (8,409,990 | ) | | | 50,172,808 | |
| Net change in unrealized appreciation on investments | | | (5,945,754 | ) | | | (32,171,870 | ) |
| Net increase (decrease) in net | | | | | | | | |
| assets resulting from operations | | | (14,701,851 | ) | | | 18,927,383 | |
| | | | | | | | | |
| DISTRIBUTIONS TO SHAREHOLDERS FROM: | | | | | | | | |
| Net investment income | | | | | | | | |
| Investor Class | | | (255,352 | ) | | | — | |
| Institutional Class | | | (98,941 | ) | | | — | |
| Total distributions | | | (354,293 | ) | | | — | |
| | | | | | | | | |
| CAPITAL SHARE TRANSACTIONS: | | | | | | | | |
| Proceeds from shares subscribed – Investor Class | | | 23,250,634 | | | | 52,930,420 | |
| Proceeds from shares subscribed – Institutional Class | | | 4,485,262 | | | | 31,992,911 | |
| Dividends reinvested – Investor Class | | | 249,654 | | | | — | |
| Dividends reinvested – Institutional Class | | | 93,766 | | | | — | |
| Cost of shares redeemed – Investor Class | | | (74,707,125 | ) | | | (48,171,421 | ) |
| Cost of shares redeemed – Institutional Class | | | (15,664,076 | ) | | | (21,201,209 | ) |
| Net increase (decrease) in net assets derived | | | | | | | | |
| from capital share transactions | | | (62,291,885 | ) | | | 15,550,701 | |
| TOTAL INCREASE (DECREASE) IN NET ASSETS | | | (77,348,029 | ) | | | 34,478,084 | |
| | | | | | | | | |
| NET ASSETS: | | | | | | | | |
| Beginning of year | | | 287,703,708 | | | | 253,225,624 | |
| End of year | | $ | 210,355,679 | | | $ | 287,703,708 | |
| Undistributed net investment | | | | | | | | |
| income (loss), end of year | | $ | (180,958 | ) | | $ | 354,293 | |
| | | | | | | | | |
| CHANGES IN SHARES OUTSTANDING: | | | | | | | | |
| Shares sold – Investor Class | | | 1,215,295 | | | | 2,691,286 | |
| Shares sold – Institutional Class | | | 231,105 | | | | 1,609,045 | |
| Shares issued to holders as | | | | | | | | |
| reinvestment of dividends – Investor Class | | | 12,816 | | | | — | |
| Shares issued to holders as reinvestment | | | | | | | | |
| of dividends – Institutional Class | | | 4,710 | | | | — | |
| Shares redeemed – Investor Class | | | (3,937,410 | ) | | | (2,447,997 | ) |
| Shares redeemed – Institutional Class | | | (816,510 | ) | | | (1,044,452 | ) |
| Net increase (decrease) in shares outstanding | | | (3,289,994 | ) | | | 807,882 | |
The accompanying notes are an integral part of these financial statements.
| HENNESSY FUNDS | 1-800-966-4354 | |
Financial Statements
For an Investor Class share outstanding throughout each year
PER SHARE DATA:
Net asset value, beginning of year
Income from investment operations:
Net investment income (loss)
Net realized and unrealized gains (losses) on investments
Total from investment operations
Less distributions:
Dividends from net investment income
Total distributions
Net asset value, end of year
TOTAL RETURN
SUPPLEMENTAL DATA AND RATIOS:
Net assets, end of year (millions)
Ratio of expenses to average net assets
Ratio of net investment income (loss) to average net assets
Portfolio turnover rate(1)
(1) | Portfolio turnover is calculated on the basis of the Fund as a whole. |
The accompanying notes are an integral part of these financial statements.
HENNESSYFUNDS.COM
| FINANCIAL HIGHLIGHTS — INVESTOR CLASS |
| Year Ended October 31, | |
| 2016 | | | 2015 | | | 2014 | | | 2013 | | | 2012 | |
| | | | | | | | | | | | | | |
| $ | 20.00 | | | $ | 18.68 | | | $ | 15.65 | | | $ | 12.38 | | | $ | 9.97 | |
| | | | | | | | | | | | | | | | | | | |
| | | | | | | | | | | | | | | | | | | |
| | (0.02 | ) | | | 0.06 | | | | (0.04 | ) | | | (0.11 | ) | | | (0.07 | ) |
| | (0.98 | ) | | | 1.26 | | | | 3.07 | | | | 3.38 | | | | 2.48 | |
| | (1.00 | ) | | | 1.32 | | | | 3.03 | | | | 3.27 | | | | 2.41 | |
| | | | | | | | | | | | | | | | | | | |
| | | | | | | | | | | | | | | | | | | |
| | (0.02 | ) | | | — | | | | — | | | | — | | | | — | |
| | (0.02 | ) | | | — | | | | — | | | | — | | | | — | |
| $ | 18.98 | | | $ | 20.00 | | | $ | 18.68 | | | $ | 15.65 | | | $ | 12.38 | |
| | | | | | | | | | | | | | | | | | | |
| | (5.00 | )% | | | 7.07 | % | | | 19.36 | % | | | 26.41 | % | | | 24.17 | % |
| | | | | | | | | | | | | | | | | | | |
| | | | | | | | | | | | | | | | | | | |
| $ | 184.61 | | | $ | 248.74 | | | $ | 227.68 | | | $ | 220.83 | | | $ | 265.60 | |
| | 1.32 | % | | | 1.15 | % | | | 1.23 | % | | | 1.29 | % | | | 1.34 | % |
| | (0.18 | )% | | | 0.30 | % | | | (0.17 | )% | | | (0.26 | )% | | | (0.66 | )% |
| | 97 | % | | | 102 | % | | | 84 | % | | | 105 | % | | | 90 | % |
The accompanying notes are an integral part of these financial statements.
| HENNESSY FUNDS | 1-800-966-4354 | |
Financial Statements
For an Institutional Class share outstanding throughout each year
PER SHARE DATA:
Net asset value, beginning of year
Income from investment operations:
Net investment income (loss)
Net realized and unrealized gains (losses) on investments
Total from investment operations
Less distributions:
Dividends from net investment income
Total distributions
Net asset value, end of year
TOTAL RETURN
SUPPLEMENTAL DATA AND RATIOS:
Net assets, end of year (millions)
Ratio of expenses to average net assets:
Before expense reimbursement
After expense reimbursement
Ratio of net investment income (loss) to average net assets:
Before expense reimbursement
After expense reimbursement
Portfolio turnover rate(1)
(1) | Portfolio turnover is calculated on the basis of the Fund as a whole. |
The accompanying notes are an integral part of these financial statements.
HENNESSYFUNDS.COM
| FINANCIAL HIGHLIGHTS — INSTITUTIONAL CLASS |
| Year Ended October 31, | |
| 2016 | | | 2015 | | | 2014 | | | 2013 | | | 2012 | |
| | | | | | | | | | | | | | |
| $ | 20.47 | | | $ | 19.08 | | | $ | 15.94 | | | $ | 12.57 | | | $ | 10.09 | |
| | | | | | | | | | | | | | | | | | | |
| | | | | | | | | | | | | | | | | | | |
| | 0.17 | | | | 0.03 | | | | 0.06 | | | | 0.01 | | | | (0.04 | ) |
| | (1.13 | ) | | | 1.36 | | | | 3.08 | | | | 3.36 | | | | 2.52 | |
| | (0.96 | ) | | | 1.39 | | | | 3.14 | | | | 3.37 | | | | 2.48 | |
| | | | | | | | | | | | | | | | | | | |
| | | | | | | | | | | | | | | | | | | |
| | (0.05 | ) | | | — | | | | — | | | | — | | | | — | |
| | (0.05 | ) | | | — | | | | — | | | | — | | | | — | |
| $ | 19.46 | | | $ | 20.47 | | | $ | 19.08 | | | $ | 15.94 | | | $ | 12.57 | |
| | | | | | | | | | | | | | | | | | | |
| | (4.69 | )% | | | 7.29 | % | | | 19.70 | % | | | 26.81 | % | | | 24.58 | % |
| | | | | | | | | | | | | | | | | | | |
| | | | | | | | | | | | | | | | | | | |
| $ | 25.74 | | | $ | 38.96 | | | $ | 25.54 | | | $ | 26.23 | | | $ | 37.11 | |
| | | | | | | | | | | | | | | | | | | |
| | 0.98 | % | | | 0.99 | % | | | 1.03 | % | | | 1.11 | % | | | 1.11 | % |
| | 0.98 | % | | | 0.99 | % | | | 0.98 | % | | | 0.98 | % | | | 0.98 | % |
| | | | | | | | | | | | | | | | | | | |
| | 0.14 | % | | | 0.51 | % | | | 0.03 | % | | | (0.01 | )% | | | (0.51 | )% |
| | 0.14 | % | | | 0.51 | % | | | 0.08 | % | | | 0.12 | % | | | (0.38 | )% |
| | 97 | % | | | 102 | % | | | 84 | % | | | 105 | % | | | 90 | % |
The accompanying notes are an integral part of these financial statements.
| HENNESSY FUNDS | 1-800-966-4354 | |
Financial Statements
Notes to the Financial Statements October 31, 2016 |
1). ORGANIZATION
The Hennessy Cornerstone Growth Fund (the “Fund”) is a series of Hennessy Funds Trust (the “Trust”), which was organized as a Delaware statutory trust on September 17, 1992. The Fund is an open-end management investment company registered under the Investment Company Act of 1940, as amended. The Fund is a successor to a fund with the same name (the “Predecessor Fund”) that was a series of Hennessy Mutual Funds, Inc., a Maryland corporation, pursuant to a reorganization that took place after the close of business on February 28, 2014. Prior to February 28, 2014, the Fund had no investment operations. As a result of the reorganization, holders of Investor Class shares of the Predecessor Fund received Investor Class shares of the Fund (the Investor Class shares of the Fund are the successor to the accounting and performance information of the corresponding shares of the Predecessor Fund), and holders of Institutional Class shares of the Predecessor Fund received Institutional Class shares of the Fund (the Institutional Class shares of the Fund are the successor to the accounting and performance information of the corresponding shares of the Predecessor Fund). The investment objective of the Fund is long-term growth of capital. The Fund is a diversified fund.
The Fund offers Investor Class and Institutional Class shares. Each class of shares differs principally in its respective administration, 12b-1 distribution and service, shareholder servicing, and transfer agent expenses (there are no sales charges). Each class has identical rights to earnings, assets, and voting privileges, except for class-specific expenses and exclusive rights to vote on matters affecting only an individual class.
As an investment company, the Fund follows the investment company accounting and reporting guidance of the Financial Accounting Standards Board (“FASB”) Accounting Standard Codification Topic 946 “Financial Services—Investment Companies.”
2). SIGNIFICANT ACCOUNTING POLICIES
The following is a summary of significant accounting policies consistently followed by the Fund in the preparation of the financial statements. These policies conform with U.S. generally accepted accounting principles (“GAAP”).
| a). | Investment Valuation – All investments in securities are recorded at their estimated fair value, as described in Note 3. |
| | |
| b). | Federal Income Taxes – No provision for federal income taxes or excise taxes has been made since the Fund has elected to be taxed as a “regulated investment company” and intends to distribute substantially all of its taxable income to its shareholders and otherwise comply with the provisions of the Internal Revenue Code of 1986, as amended, applicable to regulated investment companies. Net investment income or loss and realized gains and losses for federal income tax purposes may differ from that reported on the financial statements because of temporary book and tax basis differences. Temporary differences are primarily the result of the treatment of wash sales for tax reporting purposes. The Fund recognizes interest and penalties related to income tax benefits, if any, in the statement of operations as an income tax expense. Distributions from net realized gains for book purposes may include short-term capital gains, which are included as ordinary income to shareholders for tax purposes. |
| | |
| | Due to inherent differences in the recognition of income, expenses, and realized gains/losses under GAAP and federal income tax regulations, permanent differences |
HENNESSYFUNDS.COM
| NOTES TO THE FINANCIAL STATEMENTS |
| | between book and tax basis for reporting for the fiscal year ended October 31, 2016, have been identified and appropriately reclassified on the Statement of Assets and Liabilities. The adjustments are as follows: |
| | Undistributed | Accumulated | | |
| | Net Investment | Net Realized | | |
| | Income/(Loss) | Gain/(Loss) | Paid-in Capital | |
| | $165,149 | $1,040,214 | $(1,205,363) | |
| c). | Accounting for Uncertainty in Income Taxes – The Fund has accounting policies regarding recognition and measurement of tax positions taken or expected to be taken on a tax return. The tax returns of the Fund for the prior three fiscal years are open for examination. The Fund has reviewed all open tax years in major jurisdictions and concluded that there is no impact on the Fund’s net assets and no tax liability resulting from unrecognized tax benefits relating to uncertain income tax positions taken or expected to be taken on a tax return. The Fund’s major tax jurisdictions are U.S. federal and Delaware. |
| | |
| d). | Income and Expenses – Dividend income is recognized on the ex-dividend date or as soon as information is available to the Fund. Interest income, which includes the amortization of premium and accretion of discount, is recognized on an accrual basis. The Fund is charged for those expenses that are directly attributable to the portfolio, such as advisory, administration, and certain shareholder service fees. Income, expenses (other than expenses attributable to a specific class), and realized and unrealized gains or losses on investments are allocated to each class of shares based on its respective net assets. |
| | |
| e). | Distributions to Shareholders – Dividends from net investment income for the Fund, if any, are declared and paid annually, usually in December. Distributions of net realized capital gains, if any, are declared and paid annually, usually in December. |
| | |
| f). | Security Transactions – Investment and shareholder transactions are recorded on the trade date. The Fund determines the gain or loss realized from the investment transactions by comparing the original cost of the security lot sold with the net sale proceeds. Discounts and premiums on securities purchased are accreted/amortized over the life of the respective security. |
| | |
| g). | Use of Estimates – The preparation of financial statements in conformity with GAAP requires management to make estimates and assumptions that affect the reported amounts of assets and liabilities and disclosure of contingent assets and liabilities at the date of the financial statements and the reported change in net assets during the reporting period. Actual results could differ from those estimates. |
| | |
| h). | Share Valuation – The net asset value (“NAV”) per share of the Fund is calculated by dividing the sum of the value of the securities held by the Fund, plus cash or other assets, minus all liabilities (including estimated accrued expenses) by the total number of shares outstanding for the Fund, rounded to the nearest cent. The Fund’s shares will not be priced on days the New York Stock Exchange is closed for trading. The offering and redemption price per share for the Fund is equal to the Fund’s NAV per share. |
| | |
| i). | Foreign Currency – Values of investments denominated in foreign currencies, if any, are converted into U.S. dollars using the spot market rate of exchange at the time of valuation. Purchases and sales of investments and income are translated into U.S. dollars using the spot market rate of exchange prevailing on the respective dates of such transactions. The Fund does not isolate the portion of the results of operations resulting from |
| HENNESSY FUNDS | 1-800-966-4354 | |
| | fluctuations in foreign exchange rates on investments from fluctuations resulting from changes in the market prices of securities held. Such fluctuations are included with the net realized and unrealized gain or loss on investments. Foreign investments present additional risks due to currency fluctuations, economic and political factors, lower liquidity, government regulations, differences in accounting standards, and other factors. |
| | |
| j). | Forward Contracts – The Fund may enter into forward currency contracts to reduce its exposure to changes in foreign currency exchange rates on its foreign holdings and to lock in the U.S. dollar cost of firm purchase and sale commitments for securities denominated in foreign currencies. A forward currency contract is a commitment to purchase or sell a foreign currency at a future date at a negotiated forward rate. The gain or loss arising from the difference between the U.S. dollar cost of the original contract and the value of the foreign currency in U.S. dollars upon closing of such contract is included in net realized gain or loss from foreign currency transactions. During the fiscal year ended October 31, 2016, the Fund did not enter into any forward contracts. |
| | |
| k). | Repurchase Agreements – The Fund may enter into repurchase agreements with member banks or security dealers of the Federal Reserve Board whom the investment advisor deems creditworthy. The repurchase price generally equals the price paid by the Fund plus interest negotiated on the basis of current short-term rates. |
| | |
| | Securities pledged as collateral for repurchase agreements are held by the custodian bank until the respective agreements mature. Provisions of the repurchase agreements ensure that the market value of the collateral, including accrued interest thereon, is sufficient to cover the repurchase amount in the event of default of the counterparty. If the counterparty defaults and the value of the collateral declines or if the counterparty enters an insolvency proceeding, realization of the collateral by the Fund may be delayed or limited. During the fiscal year ended October 31, 2016, the Fund did not enter into any repurchase agreements. |
| | |
| l). | New Accounting Pronouncements – In May 2015, the FASB issued ASU No. 2015-07 “Disclosure for Investments in Certain Entities that Calculate Net Asset Value per Share (or Its Equivalent).” The amendments in ASU No. 2015-07 remove the requirement to categorize within the fair value hierarchy investments measured at NAV and require the disclosure of sufficient information to reconcile the fair value of the remaining assets categorized within the fair value hierarchy to the financial statements. The amendments in ASU No. 2015-07 are effective for fiscal years beginning after December 15, 2015, and interim periods within those fiscal years. Management has reviewed the requirements and believes the adoption of ASU 2015-07 will not have a material impact on the Fund’s financial statements and related disclosures. |
3). SECURITIES VALUATION
The Fund follows authoritative fair valuation accounting standards that establish an authoritative definition of fair value and set out a hierarchy for measuring fair value. These standards require additional disclosures about the various inputs and valuation techniques used to develop the measurements of fair value and a discussion in changes in valuation techniques and related inputs during the period. These inputs are summarized in the three broad levels listed below:
| | Level 1 – | Unadjusted, quoted prices in active markets for identical instruments that the Fund has the ability to access at the date of measurement. |
| | | |
| | Level 2 – | Other significant observable inputs (including, but not limited to, quoted prices in active markets for similar instruments, quoted prices in markets |
HENNESSYFUNDS.COM
| NOTES TO THE FINANCIAL STATEMENTS |
| | | that are not active for identical or similar instruments, and model-derived valuations in which all significant inputs and significant value drivers are observable in active markets (such as interest rates, prepayment speeds, credit risk curves, default rates, and similar data)). |
| | | |
| | Level 3 – | Significant unobservable inputs (including the Fund’s own assumptions about what market participants would use to price the asset or liability based on the best available information) when observable inputs are unavailable. |
Following is a description of the valuation techniques applied to the Fund’s major categories of assets and liabilities measured at fair value on a recurring basis.
Equity Securities – Equity securities, including common stocks, preferred stocks, foreign-issued common stocks, exchange-traded funds, closed-end mutual funds, partnerships, rights, and real estate investment trusts, that are traded on a securities exchange for which a last-quoted sales price is readily available will generally be valued at the last sales price as reported by the primary exchange on which the securities are listed. Securities listed on The NASDAQ Stock Market (“NASDAQ”) will generally be valued at the NASDAQ Official Closing Price, which may differ from the last sales price reported. Securities traded on a securities exchange for which a last-quoted sales price is not readily available will generally be valued at the mean between the bid and ask prices. To the extent these securities are actively traded and valuation adjustments are not applied, they are classified in Level 1 of the fair value hierarchy. Securities traded on foreign exchanges generally are not valued at the same time the Fund calculates its NAV because most foreign markets close well before such time. The earlier close of most foreign markets gives rise to the possibility that significant events, including broad market moves, may have occurred in the interim. In certain circumstances, it may be determined that a security needs to be fair valued because it appears that the value of the security might have been materially affected by events occurring after the close of the market in which the security is principally traded, but before the time the Fund calculates its NAV, such as by a development that affects an entire market or region (e.g., weather-related events) or a potentially global development (e.g., a terrorist attack that may be expected to have an effect on investor expectations worldwide).
Registered Investment Companies – Investments in registered investment companies (e.g., mutual funds) are generally priced at the ending NAV provided by the applicable registered investment company’s service agent and will be classified in Level 1 of the fair value hierarchy.
Debt Securities – Debt securities, including corporate bonds, asset-backed securities, mortgage-backed securities, municipal bonds, U.S. Treasuries, and U.S. government agency issues, are generally valued at market on the basis of valuations furnished by an independent pricing service that utilizes both dealer-supplied valuations and formula-based techniques. The pricing service may consider recently executed transactions in securities of the issuer or comparable issuers, market price quotations (where observable), bond spreads, and fundamental data relating to the issuer. In addition, the model may incorporate observable market data, such as reported sales of similar securities, broker quotes, yields, bids, offers, and reference data. Certain securities are valued primarily using dealer quotations. These securities are generally classified in Level 2 of the fair value hierarchy.
Short-Term Securities – Short-term equity investments, including money market funds, are valued in the manner specified above. Short-term debt investments with an original term to maturity of 60 days or less are valued at amortized cost, which approximates fair market value. If the original term to maturity of a short-term debt investment exceeded 60 days, then the values as of the 61st day prior to maturity are amortized. Amortized
| HENNESSY FUNDS | 1-800-966-4354 | |
cost is not used if its use would be inappropriate due to credit or other impairments of the issuer, in which case the security’s fair value would be determined, as described below. Short-term securities are generally classified in Level 1 or Level 2 of the fair market hierarchy depending on the inputs used and market activity levels for specific securities.
The Board of Trustees of the Fund (the “Board”) has adopted fair value pricing procedures that are followed when a price for a security is not readily available or if a significant event has occurred that indicates the closing price of a security no longer represents the true value of that security. Fair value pricing determinations are made in good faith in accordance with these procedures. There are numerous criteria that will be given consideration in determining a fair value of a security, such as the trading volume of a security and markets, the value of other like securities, and news events with direct bearing to a security or markets. Fair value pricing results in an estimated price for a security that reflects the amount the Fund might reasonably expect to receive in a current sale. Depending on the relative significance of the valuation inputs, these securities may be classified in either Level 2 or Level 3 of the fair value hierarchy.
The fair valuation of foreign securities may be determined with the assistance of a pricing service using correlations between the movement of prices of such securities and indices of domestic securities and other appropriate indicators, such as closing market prices of relevant American Depositary Receipts or futures contracts. The effect of using fair value pricing is that the Fund’s NAV will reflect the affected portfolio securities’ value as determined by the Board or its designee instead of being determined by the market. Using a fair value pricing methodology to price foreign securities may result in a value that is different from a foreign security’s most recent closing price and from the prices used by other investment companies to calculate their NAVs and are generally considered Level 2 prices in the fair valuation hierarchy. Because the Fund may invest in foreign securities, the value of the Fund’s portfolio securities may change on days when you will not be able to purchase or redeem your shares.
The Board has delegated day-to-day valuation matters to a Valuation Committee comprised of one or more representatives from Hennessy Advisors, Inc., the Fund’s investment advisor. The function of the Valuation Committee is to value securities where current and reliable market quotations are not readily available. All actions taken by the Valuation Committee are reviewed by the Board.
The Fund has performed an analysis of all existing investments to determine the significance and character of all inputs to their fair value determination. Various inputs are used in determining the value of the Fund’s investments. The inputs or methodology used for valuing securities are not necessarily an indication of the risk associated with investing in those securities. Details related to the fair valuation hierarchy of the Fund’s securities as of October 31, 2016, are included in the Fund’s Schedule of Investments.
4). INVESTMENT TRANSACTIONS
Purchases and sales of investment securities (excluding government and short-term investments) for the Fund during the fiscal year ended October 31, 2016, were $235,715,965 and $290,154,139, respectively.
There were no purchases or sales/maturities of long-term U.S. government securities for the Fund during the fiscal year ended October 31, 2016.
The Fund is permitted to purchase or sell securities from or to another fund in the Hennessy Funds family of funds (the “Hennessy Funds”) under specified conditions outlined in procedures adopted by the Board of Trustees. The procedures have been designed to ensure that any purchase or sale of securities by the Fund from or to another
HENNESSYFUNDS.COM
| NOTES TO THE FINANCIAL STATEMENTS |
Hennessy Fund complies with Rule 17a-7 of the Investment Company Act of 1940. For the fiscal year ended October 31, 2016, the Fund did not engage in purchases and sales of securities pursuant to Rule 17a-7 of the Investment Company Act of 1940.
5). INVESTMENT MANAGEMENT FEE AND OTHER TRANSACTIONS WITH AFFILIATES
Hennessy Advisors, Inc. (the “Advisor”) is the investment advisor of the Fund. The Advisor provides the Fund with investment management services under an Investment Advisory Agreement. The Advisor furnishes all investment advice, office space, facilities, and provides most of the personnel needed by the Fund. As compensation for its services, the Advisor is entitled to a monthly fee from the Fund. The fee is based upon the average daily net assets of the Fund at the annual rate of 0.74%. The net investment advisory fees payable by the Fund as of October 31, 2016, were $135,746.
In the past, the Advisor had contractually agreed to waive its fees and absorb expenses to the extent that the total annual operating expenses exceeded 0.98% of the Fund’s net assets for Institutional Class shares of the Fund (excluding all federal, state and local taxes, interest, brokerage commissions, acquired fund fees and expenses and other costs incurred in connection with the purchase and sale of securities and extraordinary items). The expense limitation agreement was terminated by the Board as of February 28, 2015.
For a period of three years after the year in which the Advisor waived or reimbursed expenses, the Advisor may seek reimbursement from the Fund to the extent that total annual fund operating expenses are less than the expense limitation that was in effect at the time the Advisor waived or reimbursed expenses. As of October 31, 2016, cumulative expenses subject to potential recovery under the aforementioned conditions were $1,023 for Institutional Class shares, which will expire on October 31, 2018.
The Board has approved a Shareholder Servicing Agreement for Investor Class shares of the Fund, which was instituted to compensate the Advisor for the non-investment management services it provides to the Fund. The Shareholder Servicing Agreement provides for a monthly fee paid to the Advisor at an annual rate of 0.10% of the average daily net assets of the Fund attributable to Investor Class shares. Shareholder service fees payable by the Fund as of October 31, 2016, were $16,088.
The Fund has adopted a plan pursuant to Rule 12b-1 under the Investment Company Act of 1940, as amended, that authorizes payments in connection with the distribution of the Fund’s shares at an annual rate of up to 0.25% of the Fund’s average daily net assets attributable to Investor Class shares. Even though the authorized rate is up to 0.25%, the Fund has only used up to 0.15% of its average daily net assets attributable to Investor Class shares for such purpose since the plan was implemented on November 1, 2015. Amounts paid under the plan may be spent on any activities or expenses primarily intended to result in the sale of shares, including, but not limited to, advertising, shareholder account servicing, the printing and mailing of prospectuses to other than current shareholders, the printing and mailing of sales literature, and compensation for sales and marketing activities or to financial institutions and others, such as dealers and distributors.
The Fund has entered into agreements with various brokers, dealers, and financial intermediaries in connection with the sale of shares of the Fund. The agreements provide for periodic payments by the Fund to the brokers, dealers, and financial intermediaries for providing certain shareholder maintenance services (sub-transfer agent expenses). These shareholder services include the pre-processing and quality control of new accounts, shareholder correspondence, answering customer inquiries regarding account status, and facilitating shareholder telephone transactions. Fees paid by the
| HENNESSY FUNDS | 1-800-966-4354 | |
Fund to various brokers, dealers, and financial intermediaries during the fiscal year ended October 31, 2016, were $388,403.
U.S. Bancorp Fund Services, LLC (“USBFS”) provides the Fund with administrative, fund accounting, and transfer agent services, and necessary office equipment. As administrator, USBFS is responsible for activities such as (i) preparing various federal and state regulatory filings, reports, and returns for the Fund, (ii) preparing reports and materials to be supplied to the Board, (iii) monitoring the activities of the Fund’s custodian, transfer agent, and accountants, and (iv) coordinating the preparation and payment of the Fund’s expenses and reviewing the Fund’s expense accruals. Fees paid to USBFS during the fiscal year ended October 31, 2016, were $242,477.
U.S. Bank, N.A., an affiliate of USBFS, serves as the Fund’s custodian. Quasar Distributors, LLC acts as the Fund’s principal underwriter in a continuous public offering of the Fund’s shares. Quasar Distributors, LLC is an affiliate of USBFS and U.S. Bank, N.A.
The officers of the Fund are affiliated with the Advisor. Such officers, with the exception of the Chief Compliance Officer and the Senior Compliance Officer, receive no compensation from the Fund for serving in their respective roles. The Fund, along with the other Hennessy Funds, makes reimbursement payments, on an equal basis, to the Advisor for a portion of the salary and benefits associated with the office of the Chief Compliance Officer and for all of the salary and benefits associated with the office of the Senior Compliance Officer. Such amounts are included on the Statement of Operations.
6). GUARANTEES AND INDEMNIFICATIONS
Under the Hennessy Funds’ organizational documents, their officers and trustees are indemnified by the Hennessy Funds against certain liabilities arising out of the performance of their duties to the Hennessy Funds. Additionally, in the normal course of business, the Hennessy Funds enter into contracts with service providers that contain general indemnification clauses. The Fund’s maximum exposure under these arrangements is unknown as this would involve future claims that may be made against the Fund that have not yet occurred. Currently, the Fund expects the risk of loss to be remote.
7). LINE OF CREDIT
The Fund has an uncommitted line of credit with the Hennessy Funds in the amount of the lesser of (i) $100,000,000 or (ii) 33.33% of each Hennessy Fund’s net assets, or 30% for the Hennessy Gas Utility Fund and 10% for the Hennessy Balanced Fund, intended to provide short-term financing, if necessary, subject to certain restrictions, in connection with shareholder redemptions. The credit facility is with the Hennessy Funds’ custodian bank, U.S. Bank, N.A. Borrowings under this arrangement bear interest at the bank’s prime rate and are secured by all of the Fund’s assets (as to its own borrowings only). During the fiscal year ended October 31, 2016, the Fund had an outstanding average daily balance and a weighted average interest rate of $152,383 and 3.47%, respectively. The maximum amount outstanding for the Fund during the period was $6,290,000. At October 31, 2016, the Fund did not have any borrowings outstanding under the line of credit.
HENNESSYFUNDS.COM
| NOTES TO THE FINANCIAL STATEMENTS |
8). FEDERAL TAX INFORMATION
As of October 31, 2016, the components of accumulated earnings (losses) for income tax purposes were as follows:
| | Cost of investments for tax purposes | | $ | 203,944,847 | |
| | Gross tax unrealized appreciation | | $ | 18,628,329 | |
| | Gross tax unrealized depreciation | | | (11,671,406 | ) |
| | Net tax unrealized appreciation | | $ | 6,956,923 | |
| | Undistributed ordinary income | | $ | — | |
| | Undistributed long-term capital gains | | | — | |
| | Total distributable earnings | | $ | — | |
| | Other accumulated loss | | $ | (106,877,896 | ) |
| | Total accumulated loss | | $ | (99,920,973 | ) |
The difference between book-basis unrealized appreciation/depreciation (as shown in the Statement of Assets and Liabilities) and tax-basis unrealized appreciation/depreciation (as shown above) is attributable primarily to wash sales and partnership adjustments.
At October 31, 2016, the Fund had capital loss carryforwards that expire as follows:
| $97,943,326 | October 31, 2017 | |
| $8,753,612 | Indefinite ST | |
Capital losses sustained in the fiscal year ended October 31, 2012, and in future taxable years will not expire and may be carried over by the Fund without limitation; however, they will retain the character of the original loss. Furthermore, any loss incurred during those taxable years will be required to be utilized prior to the losses incurred in taxable years prior to 2012. As a result of this ordering rule, pre-enactment capital loss carryforwards may be more likely to expire unused. Under pre-enactment law, capital losses could be carried forward for eight years, and carried forward as short-term capital losses, irrespective of the character of the original loss.
At October 31, 2016, the Fund deferred on a tax basis, a post-December late year ordinary loss deferral of $180,958.
During the fiscal years ended October 31, 2016 and 2015, the tax character of distributions paid by the Fund was as follows:
| | | | Year Ended | | | Year Ended | |
| | | | October 31, 2016 | | | October 31, 2015 | |
| | Ordinary income(1) | | $ | 354,293 | | | $ | — | |
| | Long-term capital gain | | | — | | | | — | |
| | | | $ | 354,293 | | | $ | — | |
| | (1) Ordinary income includes short-term gain or loss. |
9). EVENTS SUBSEQUENT TO YEAR END
Management has evaluated the Fund’s related events and transactions that occurred subsequent to October 31, 2016, through the date of issuance of the Fund’s financial statements. Management has determined that there were no subsequent events requiring recognition or disclosure in the financial statements.
| HENNESSY FUNDS | 1-800-966-4354 | |
Report of Independent Registered Public Accounting Firm
The Board of Trustees of Hennessy Funds Trust
and the Shareholders of the Hennessy Cornerstone Growth Fund:
We have audited the accompanying statement of assets and liabilities of the Hennessy Cornerstone Growth Fund (the Fund), a series of Hennessy Funds Trust, including the schedule of investments, as of October 31, 2016, and the related statement of operations for the year then ended, the statements of changes in net assets for each of the years in the two year period then ended, and the financial highlights for each of the years in the five year period then ended. These financial statements and financial highlights are the responsibility of the Fund’s management. Our responsibility is to express an opinion on these financial statements and financial highlights based on our audits.
We conducted our audits in accordance with the standards of the Public Company Accounting Oversight Board (United States). Those standards require that we plan and perform the audit to obtain reasonable assurance about whether the financial statements and financial highlights are free of material misstatement. An audit includes examining, on a test basis, evidence supporting the amounts and disclosures in the financial statements. Our procedures included confirmation of securities owned as of October 31, 2016, by correspondence with custodians and brokers or by other appropriate auditing procedures. An audit also includes assessing the accounting principles used and significant estimates made by management, as well as evaluating the overall financial statement presentation. We believe that our audits provide a reasonable basis for our opinion.
In our opinion, the financial statements and financial highlights referred to above present fairly, in all material respects, the financial position of the Fund as of October 31, 2016, the results of its operations for the year then ended, the changes in its net assets for each of the years in the two year period then ended, and the financial highlights for each of the years in the five year period then ended, in conformity with U.S. generally accepted accounting principles.
Chicago, Illinois
December 22, 2016
HENNESSYFUNDS.COM
| REPORT OF INDEPENDENT REGISTERED PUBLIC ACCOUNTING FIRM/TRUSTEES AND OFFICERS |
Trustees and Officers of the Fund (Unaudited)
The business and affairs of the Fund are managed under the direction of the Board of Trustees of the Trust, and the Board of Trustees elects the Officers of the Trust. Beginning in March 2015, the Board of Trustees has from time to time appointed advisers (“Advisers “) to the Board of Trustees, with the intention of having qualified individuals serve in an advisory capacity in order to garner experience in the mutual fund and asset management industry and be considered as potential Trustees in the future. There are currently three Advisers to the Board of Trustees: Brian Alexander, Doug Franklin, and Claire Knoles. As Advisers, Mr. Alexander, Mr. Franklin, and Ms. Knoles attend meetings of the Board and act as non-voting participants. Information pertaining to the Trustees, Advisers, and the Officers of the Trust is set forth below. The Trustees and Officers serve until their successors are duly elected and qualified or until their earlier death, resignation, or removal. Each of the Trustees oversees 16 Hennessy Funds. Unless otherwise indicated, the address of all persons listed below is 7250 Redwood Boulevard, Suite 200, Novato, CA 94945. The Fund’s Statement of Additional Information includes more information about the persons listed below and is available, without charge, upon request by calling 1-800-966-4354.
| | | | Other |
| | | | Directorships |
| | | | Held Outside |
| Name, (Year of Birth), | | | of Fund |
| and Position Held | Start Date | Principal Occupation(s) | Complex During |
with the Trust | of Service | During Past Five Years | Past Five Years(1) |
| |
| Disinterested Trustees and Advisers |
| | | | |
| J. Dennis DeSousa | January 1996 | Mr. DeSousa is a real estate investor. | None. |
| (1936) | | | |
| Trustee | | | |
| | | | |
| Robert T. Doyle | January 1996 | Mr. Doyle has been the Sheriff of | None. |
| (1947) | | Marin County, California since 1996. | |
| Trustee | | | |
| | | | |
| Gerald P. Richardson | May 2004 | Mr. Richardson is an independent | None. |
| (1945) | | consultant in the securities industry. | |
| Trustee | | | |
| | | | |
| Brian Alexander | March 2015 | Mr. Alexander has been employed | None. |
| (1981) | | by Sutter Health Novato Community | |
| Adviser to the Board | | Hospital since 2012, first as an | |
| | | Assistant Administrator and then, | |
| | | beginning in 2013, as the Chief | |
| | | Administrative Officer. From 2011 | |
| | | through 2012, Mr. Alexander was | |
| | | employed by Sutter Health West Bay | |
| | | Region as the Regional Director of | |
| | | Strategic Decision Support. Prior to | |
| | | that, in 2011, he served as the | |
| | | Director of Managed Care | |
| | | Contracting and also the Director of | |
| | | Compensation, Benefits, and | |
| | | Compliance for the Rehabilitation | |
| | | Institute of Chicago. | |
| HENNESSY FUNDS | 1-800-966-4354 | |
| | | | Other |
| | | | Directorships |
| | | | Held Outside |
| Name, (Year of Birth), | | | of Fund |
| and Position Held | Start Date | Principal Occupation(s) | Complex During |
with the Trust | of Service | During Past Five Years | Past Five Years(1) |
| | | | |
| Doug Franklin | March 2016 | Mr. Franklin is a retired insurance | None. |
| (1964) | | industry executive. From 1987 | |
| Adviser to the Board | | through 2015, he was employed by | |
| | | the Allianz-Fireman’s Fund Insurance | |
| | | Company in various positions, | |
| | | including as its Chief Actuary and | |
| | | Chief Risk Officer. | |
| | | | |
| Claire Knoles | December 2015 | Ms. Knoles is a founder of Kiosk and | None. |
| (1974) | | has served as its Chief Operating | |
| Adviser to the Board | | Officer since 2004. Kiosk is a full | |
| | | service marketing agency with | |
| | | offices in the San Francisco Bay | |
| | | Area, Toronto, and Liverpool, UK. | |
| | | | |
Interested Trustee(2) | | | |
| | | | |
| Neil J. Hennessy | January 1996 as | Mr. Hennessy has been employed by | Hennessy |
| (1956) | a Trustee and | Hennessy Advisors, Inc. since 1989 | Advisors, Inc. |
| Trustee, Chairman of | June 2008 as | and currently serves as its President, | |
| the Board, Chief | an Officer | Chairman and Chief Executive Officer. | |
| Investment Officer, | | | |
| Portfolio Manager, | | | |
| and President | | | |
| Name, (Year of Birth), | | |
| and Position Held | Start Date | Principal Occupation(s) |
with the Trust | of Service | During Past Five Years |
| | | |
| Officers | | |
| | | |
| Teresa M. Nilsen | January 1996 | Ms. Nilsen has been employed by Hennessy Advisors, Inc. |
| (1966) | | since 1989 and currently serves as its Executive Vice President, |
| Executive Vice President | | Chief Operations Officer, Chief Financial Officer, and Secretary. |
| and Treasurer | | |
| | | |
| Daniel B. Steadman | March 2000 | Mr. Steadman has been employed by Hennessy Advisors, Inc. |
| (1956) | | since 2000 and currently serves as its Executive Vice President |
| Executive Vice President | | and Chief Compliance Officer. |
| and Secretary | | |
| | | |
| Jennifer Cheskiewicz | June 2013 | Ms. Cheskiewicz has been employed by Hennessy Advisors, Inc. |
| (1977) | | as its General Counsel since June 2013. She previously served |
| Senior Vice President and | | as in-house counsel to Carlson Capital, L.P., an SEC-registered |
| Chief Compliance Officer | | investment advisor to several private funds, from |
| | | February 2010 to May 2013. |
| | | |
| Brian Carlson | December 2013 | Mr. Carlson has been employed by Hennessy Advisors, Inc. |
| (1972) | | since December 2013. Mr. Carlson was previously a co-founder |
| Senior Vice President and | | and principal of Trivium Consultants, LLC from February 2011 |
| Head of Distribution | | through November 2013. |
HENNESSYFUNDS.COM
| TRUSTEES AND OFFICERS OF THE FUND |
| Name, (Year of Birth), | | |
| and Position Held | Start Date | Principal Occupation(s) |
with the Trust | of Service | During Past Five Years |
| | | |
| David Ellison | October 2012 | Mr. Ellison has been employed by Hennessy Advisors, Inc. since |
(1958)(3) | | October 2012. He has served as a Portfolio Manager of the |
| Senior Vice President and | | Hennessy Small Cap Financial Fund, the Hennessy Large Cap |
| Portfolio Manager | | Financial Fund, and the Hennessy Technology Fund since |
| | | inception. Prior to that, Mr. Ellison served as Director, CIO and |
| | | President of FBR Fund Advisers, Inc. from December |
| | | 1999 to October 2012. |
| | | |
| Brian Peery | March 2003 as | Mr. Peery has been employed by Hennessy Advisors, Inc. since |
| (1969) | an Officer and | 2002. He has served as a Portfolio Manager of the Hennessy |
| Senior Vice President and | February 2011 | Cornerstone Growth Fund, the Hennessy Cornerstone Mid Cap |
| Portfolio Manager | as a Co-Portfolio | 30 Fund, the Hennessy Cornerstone Large Growth Fund, the |
| | Manager or | Hennessy Cornerstone Value Fund, the Hennessy Total Return |
| | Portfolio Manager | Fund, and the Hennessy Balanced Fund since October 2014. |
| | | He served as Co-Portfolio Manager of the same funds from |
| | | February 2011 through September 2014. Mr. Peery has also |
| | | served as a Portfolio Manager of the Hennessy Gas Utility Fund |
| | | since February 2015. |
| | | |
| Winsor (Skip) Aylesworth | October 2012 | Mr. Aylesworth has been employed by Hennessy Advisors, Inc. |
(1947)(3) | | since October 2012. He has served as a Portfolio Manager of |
| Vice President and | | the Hennessy Gas Utility Fund since 1998 and as a Portfolio |
| Portfolio Manager | | Manager of the Hennessy Technology Fund since inception. |
| | | Prior to that, Mr. Aylesworth served as Executive Vice President |
| | | of FBR Fund Advisers, Inc. from 1999 to October 2012. |
| | | |
| Ryan Kelley | March 2013 | Mr. Kelley has been employed by Hennessy Advisors, Inc. since |
(1972)(4) | | October 2012. He has served as a Portfolio Manager of the |
| Vice President and | | Hennessy Gas Utility Fund, the Hennessy Small Cap Financial |
| Portfolio Manager | | Fund, and the Hennessy Large Cap Financial Fund since |
| | | October 2014. He served as Co-Portfolio Manager of the same |
| | | funds from March 2013 through September 2014, and as a |
| | | Portfolio Analyst for the Hennessy Funds from October 2012 |
| | | through February 2013. Prior to that, Mr. Kelley served as |
| | | Portfolio Manager of FBR Fund Advisers, Inc. from |
| | | January 2008 to October 2012. |
(1) | Messrs. DeSousa, Doyle, Hennessy, and Richardson previously served on the Board of Directors of Hennessy Mutual Funds, Inc. (“HMFI”), The Hennessy Funds, Inc. (“HFI”), and Hennessy SPARX Funds Trust (“HSFT”). Pursuant to an internal reorganization effective as of February 28, 2014, the series of HFMI, HFI, and HSFT were reorganized into corresponding series of Hennessy Funds Trust that mirrored them. Subsequent to the reorganization, HFMI, HFI, and HSFT were dissolved. |
(2) | Mr. Hennessy is considered an “interested person,” as defined in the Investment Company Act of 1940, as amended, because he is an officer of the Hennessy Funds. |
(3) | The address of these officers is 101 Federal Street, Suite 1900, Boston, MA 02110. |
(4) | The address of this officer is 1340 Environ Way, Suite 305, Chapel Hill, NC 27517. |
| HENNESSY FUNDS | 1-800-966-4354 | |
Expense Example (Unaudited)
October 31, 2016
As a shareholder of the Fund, you incur two types of costs: (1) transaction costs, including sales charges (loads) on purchase payments, reinvested dividends, or other distributions; redemption fees; and exchange fees; and (2) ongoing costs, including management fees; service fees; and other Fund expenses. This Example is intended to help you understand your ongoing costs (in dollars) of investing in the Fund and to compare these costs with the ongoing costs of investing in other mutual funds. The Example is based on an investment of $1,000 invested at the beginning of the period and held for the entire period from May 1, 2016, through October 31, 2016.
Actual Expenses
The first line of the table below under the “Investor Class” and “Institutional Class” headings provides information about actual account values and actual expenses. Although the Fund charges no sales loads or transaction fees, you will be assessed fees for outgoing wire transfers, returned checks and stop payment orders at prevailing rates charged by U.S. Bancorp Fund Services, LLC, the Fund’s transfer agent. If you request that a redemption be made by wire transfer, currently a $15 fee is charged by the Fund’s transfer agent. IRA accounts will be charged a $15 annual maintenance fee. The example below includes, but is not limited to, management fees, shareholder servicing fees, fund accounting, custody, and transfer agent fees. However, the example below does not include portfolio trading commissions and related expenses, and other extraordinary expenses as determined under generally accepted accounting principles. You may use the information in this line, together with the amount you invested, to estimate the expenses that you paid over the period. Simply divide your account value by $1,000 (for example, an $8,600 account value divided by $1,000 = 8.6), then multiply the result by the number in the first line of the table under the “Investor Class” and “Institutional Class” headings in the column entitled “Expenses Paid During Period” to estimate the expenses you paid on your account during this period.
Hypothetical Example for Comparison Purposes
The second line of the table below under the “Investor Class” and “Institutional Class” headings provides information about hypothetical account values and hypothetical expenses based on the Fund’s actual expense ratios and an assumed rate of return of 5% per year before expenses, which is not the Fund’s actual return. The hypothetical account values and expenses may not be used to estimate the actual ending account balance or expenses you paid for the period. You may use this information to compare the ongoing costs of investing in the Fund and other funds. To do so, compare this 5% hypothetical example with the 5% hypothetical examples that appear in the shareholder reports of the other funds. Please note that the expenses shown in the table are meant to highlight your ongoing costs only and do not reflect any transactional costs, such as sales charges (loads), or exchange fees. Therefore, the second line of the table under the “Investor Class” and “Institutional Class” headings is useful in comparing ongoing costs only, and will not help you determine the relative total costs of owning different funds. In addition, if these transactional costs were included, your costs would have been higher.
HENNESSYFUNDS.COM
| | | | Expenses Paid |
| | Beginning | Ending | During Period(1) |
| | Account Value | Account Value | May 1, 2016 – |
| | May 1, 2016 | October 31, 2016 | October 31, 2016 |
| Investor Class | | | |
| Actual | $1,000.00 | $1,022.10 | $6.71 |
| Hypothetical (5% return before expenses) | $1,000.00 | $1,018.50 | $6.70 |
| | | | |
| Institutional Class | | | |
| Actual | $1,000.00 | $1,024.20 | $4.99 |
| Hypothetical (5% return before expenses) | $1,000.00 | $1,020.21 | $4.98 |
(1) | Expenses are equal to the Fund’s annualized expense ratio of 1.32% for Investor Class shares or 0.98% for Institutional Class shares, as applicable, multiplied by the average account value over the period, multiplied by 184/366 days (to reflect one-half year period). |
| HENNESSY FUNDS | 1-800-966-4354 | |
How to Obtain a Copy of the Fund’s
Proxy Voting Policy and Proxy Voting Records
A description of the policies and procedures the Fund uses to determine how to vote proxies relating to portfolio securities is available without charge: (1) by calling 1-800-966-4354; (2) on the Hennessy Funds’ website at hennessyfunds.com/proxy-voting/policy.fs; or (3) on the U.S. Securities and Exchange Commission’s website at www.sec.gov. The Fund’s proxy voting record is available without charge on both the Hennessy Funds’ website at hennessyfunds.com/proxy-voting/vote.fs and the SEC’s website at www.sec.gov no later than August 31 for the prior 12 months ending June 30.
Quarterly Filings on Form N-Q
The Fund files its complete schedule of portfolio holdings with the SEC for the first and third quarters of each fiscal year on Form N-Q. The Fund’s Form N-Q will be available on the SEC’s website at www.sec.gov. The Fund’s Form N-Q may be reviewed and copied at the SEC’s Public Reference Room in Washington, DC and information on the operation of the Public Reference Room may be obtained by calling 1-800-SEC-0330. Information included in the Fund’s N-Q will also be available upon request by calling 1-800-966-4354.
Federal Tax Distribution Information
(Unaudited)
For the fiscal year ended October 31, 2016, certain dividends paid by the Fund may be subject to a maximum tax rate of 23.8%, as provided for by the Jobs and Growth Tax Relief Reconciliation Act of 2003. The percentage of dividends declared from ordinary income designated as qualified dividend income was 100%.
For corporate shareholders, the percent of ordinary income distributions that qualified for the corporate dividends received deduction for the fiscal year ended October 31, 2016, was 100%.
The percentage of taxable ordinary income distributions that are designated as short-term capital gain distributions under Section 871(k)(2)(C) of the Internal Revenue Code of 1986, as amended, for the Fund was 0%.
Householding
To help keep the Fund’s costs as low as possible, we generally deliver a single copy of most financial reports and prospectuses to shareholders who share an address, even if the accounts are registered under different names. This process, known as “householding,” does not apply to account statements. You may, of course, request an individual copy of a prospectus or financial report at any time. If you would like to receive separate mailings, please call the Administrator at 1-800-261-6950 or 1-414-765-4124 and we will begin individual delivery within 30 days of your request. If your account is held through a financial institution or other intermediary, please contact them directly to request individual delivery.
HENNESSYFUNDS.COM
| PROXY VOTING — PRIVACY POLICY |
Privacy Policy
We collect the following non-public personal information about you:
| | • | information we receive from you on or in applications or other forms, correspondence, or conversations, including, but not limited to, your name, address, phone number, social security number, assets, income, and date of birth; and |
| | • | information about your transactions with us, our affiliates, or others, including, but not limited to, your account number and balance, payment history, parties to transactions, cost basis information, and other financial information. |
We do not disclose any non-public personal information about our current or former shareholders to non-affiliated third parties, except as permitted by law. For example, we are permitted by law to disclose all of the information we collect, as described above, to our Transfer Agent to process your transactions. Furthermore, we restrict access to your non-public personal information to those persons who require such information to provide products or services to you. We maintain physical, electronic, and procedural safeguards that comply with federal standards to guard your non-public personal information.
In the event that you hold shares of the Fund through a financial intermediary, including, but not limited to, a broker-dealer, bank or trust company, the privacy policy of your financial intermediary would govern how your non-public personal information would be shared with non-affiliated third parties.
| HENNESSY FUNDS | 1-800-966-4354 | |
(This Page Intentionally Left Blank.)
For information, questions or assistance, please call
The Hennessy Funds
1-800-966-4354 or 1-415-899-1555
INVESTMENT ADVISOR
Hennessy Advisors, Inc.
7250 Redwood Blvd., Suite 200
Novato, California 94945
ADMINISTRATOR,
TRANSFER AGENT,
DIVIDEND PAYING AGENT &
SHAREHOLDER SERVICING AGENT
U.S. Bancorp Fund Services, LLC
P.O. Box 701
Milwaukee, Wisconsin 53201-0701
CUSTODIAN
U.S. Bank N.A.
Custody Operations
1555 North River Center Dr., Suite 302
Milwaukee, Wisconsin 53212
TRUSTEES
Neil J. Hennessy
Robert T. Doyle
J. Dennis DeSousa
Gerald P. Richardson
COUNSEL
Foley & Lardner LLP
777 East Wisconsin Avenue
Milwaukee, Wisconsin 53202-5306
INDEPENDENT REGISTERED
PUBLIC ACCOUNTING FIRM
KPMG LLP
200 East Randolph Street
Chicago, Illinois 60601
DISTRIBUTOR
Quasar Distributors, LLC
615 East Michigan Street
Milwaukee, Wisconsin 53202
hennessyfunds.com | 1-800-966-4354
This report has been prepared for shareholders and may be distributed to
others only if preceded or accompanied by a current prospectus.

ANNUAL REPORT
OCTOBER 31, 2016
HENNESSY FOCUS FUND
Investor Class HFCSX
Institutional Class HFCIX
hennessyfunds.com|1-800-966-4354
(This Page Intentionally Left Blank.)
Contents
| Letter to Shareholders | | | 2 |
| Performance Overview | | | 4 |
| Financial Statements | | | |
| Schedule of Investments | | | 9 |
| Statement of Assets and Liabilities | | | 13 |
| Statement of Operations | | | 14 |
| Statements of Changes in Net Assets | | | 15 |
| Financial Highlights | | | 16 |
| Notes to the Financial Statements | | | 20 |
| Report of Independent Registered Public Accounting Firm | | | 28 |
| Trustees and Officers of the Fund | | | 29 |
| Expense Example | | | 32 |
| Proxy Voting | | | 34 |
| Quarterly Filings on Form N-Q | | | 34 |
| Federal Tax Distribution Information | | | 34 |
| Householding | | | 34 |
| Privacy Policy | | | 35 |
| HENNESSY FUNDS | 1-800-966-4354 | |
December 2016
Dear Hennessy Funds Shareholder:
Over the past year investors here in the U.S. and around the world have weathered a great deal of turmoil, especially in the political arena. Foremost, the bitterly divisive and all-consuming U.S. Presidential election, with its unanticipated outcome, is finally behind us. While the equity markets were jittery at first, they now appear more comfortable with the prospect of a Trump presidency and seem to be looking forward to diminished government regulation and intervention.
The Brexit vote in the U.K. cast a shadow over the European Union’s future. There remains uncertainty over the details and timing of the break and the economic consequences for both Britain and Europe, but early signs suggest the impact on growth in Britain will not be as severe as initially feared.
Additionally, uncertainty over whether the Federal Reserve would raise short-term interest rates has hung over the economy for well over a year now. The effects that higher rates could have on growth, the strength of the U.S. Dollar, corporate profits and loan supply and demand seem to have weighed heavily on investors, causing paralysis and money to remain on the sidelines of the market.
Despite all these concerns, U.S. equity markets have pushed higher, with both the Dow Jones Industrial Average and S&P 500 Index posting returns of approximately 5% during the twelve-month period ended October 31, 2016. The U.S. economy has continued to grow at a respectable annual rate of about 2%, and corporate profits have started to move higher. Today, as of mid-December, bond and Treasury yields have risen a bit from record lows just this summer, and the bond market is finishing the year on slightly rocky footing. Bond yields are still very low relative to historical averages, while the prospective PE multiples for the Dow Jones Industrial Average and S&P 500 Index are just above long-term averages at 18.0x and 18.9x, respectively. We believe that equity valuations could go considerably higher and still be at appropriate levels relative to bond yields. And, while we do expect the Fed to raise interest rates in the coming year, we believe that inflation will stay under control, so that short-term interest rates will not have to rise too fast or too far.
As I reflect over the past twelve months, what I realize is that many of the worries this year are not new. For the past several years, American businesses have operated in an environment characterized by highly partisan politics, mounting regulations, uncertainty over interest rates, and a lack of clarity regarding taxes and healthcare costs. Despite all these headwinds, U.S. corporations have been incredibly resilient and found ways to impress investors. If the newly elected administration follows through on campaign promises of reigning in regulation, lowering taxes for corporations and individuals, or reforming healthcare to drive down costs, then companies, which are already lean, should be able to post higher profits. And, that growth should lead to more jobs and a stronger economy, potentially creating a very positive cycle going forward.
With the bull market in U.S. equities entering its ninth year, many believe the economy is due for a recession and the market is due for a downturn. But, the euphoria that usually accompanies a peak in the market is absent. Since the recovery began after the financial crisis, I have found myself pondering the bull run of 1982 to 2000, powered, in part, by a significant increase in valuations. I believe today’s market displays the fundamentals to sustain a similarly strong and lengthy bull market. Meanwhile, companies are largely profitable and many corporate balance sheets are cash-rich, with
HENNESSYFUNDS.COM
relatively little debt. Unemployment is low and real wages are rising, helping to drive consumption. We are hopeful that these factors will provide support for positive market returns in the year to come.
Thank you for your continued confidence and investment in our funds. If you have any questions or would like to speak with us directly, please don’t hesitate to call us at (800) 966-4354.
Best regards,
Neil J. Hennessy
President and Chief Investment Officer
Past performance does not guarantee future results.
Mutual fund investing involves risk. Principal loss is possible.
Opinions expressed are those of Neil Hennessy and are subject to change, are not guaranteed and should not be considered investment advice.
The Dow Jones Industrial Average and S&P 500 Index are unmanaged indices commonly used to measure the performance of U.S. stocks. One cannot invest directly in an index.
PE, or price to earnings, is calculated by dividing a company’s market price per share by its earnings per share.
| HENNESSY FUNDS | 1-800-966-4354 | |
Performance Overview (Unaudited)
CHANGE IN VALUE OF $10,000 INVESTMENT
This graph illustrates the performance of an initial investment of $10,000 made in the Fund ten years ago and assumes the reinvestment of dividends.
AVERAGE ANNUAL TOTAL RETURN FOR PERIODS ENDED OCTOBER 31, 2016
| | One | Five | Ten |
| | Year | Years | Years |
| Hennessy Focus Fund – | | | |
| Investor Class (HFCSX) | -1.63% | 13.64% | 8.93% |
| Hennessy Focus Fund – | | | |
Institutional Class (HFCIX)(1) | -1.27% | 14.01% | 9.24% |
Russell 3000® Index | 4.24% | 13.35% | 6.76% |
Russell Mid Cap® Growth Index | 0.40% | 12.02% | 7.65% |
Expense ratios: 1.47% (Investor Class); 1.12% (Institutional Class)
Performance data quoted represents past performance; past performance does not guarantee future results. The investment return and principal value of an investment will fluctuate so that an investor’s shares, when redeemed, may be worth more or less than their original cost. The performance graph and table do not reflect the deduction of taxes that a shareholder would pay on Fund distributions or the redemption of Fund shares. Current performance of the Fund may be lower or higher than the performance quoted. Performance data current to the most recent month end may be obtained by visiting hennessyfunds.com. Performance for periods prior to October 26, 2012, is that of the FBR Focus Fund.
The expense ratios presented are from the most recent prospectus.
(1) | The inception date of Institutional Class shares is May 30, 2008. Performance shown prior to the inception of Institutional Class shares reflects the performance of Investor Class shares and includes expenses that are not applicable to and are higher than those of Institutional Class shares. |
PERFORMANCE NARRATIVE
Portfolio Managers Brian E. Macauley, CFA, David S. Rainey, CFA, and Ira M. Rothberg, CFA
Broad Run Investment Management, LLC (sub-advisor)
Performance:
For the twelve-month period ended October 31, 2016, the Investor Class of the Hennessy Focus Fund returned -1.63%, underperforming both the Russell 3000® Index and the
HENNESSYFUNDS.COM
Russell Midcap® Growth Index, which returned 4.24% and 0.40%, respectively, for the same period.
Leading contributors to the Fund’s performance were American Tower Corporation, Aon plc, and Gaming and Leisure Properties, Inc., all of which the Fund continues to hold. Each of these companies produced attractive financial results over the twelve-month period, which helped drive appreciation in their stock prices. Leading detractors from the Fund’s performance were Encore Capital Group, Inc., CarMax, Inc., and Twenty-First Century Fox, Inc. We believe that these businesses are likely to provide compelling forward returns, so the Fund continues to hold these investments.
We invest with a long-term time horizon and encourage shareholders to do the same. Despite the discussion of twelve-month results referenced above, we encourage fellow shareholders to also evaluate the Fund’s performance over five- and ten-year periods since shorter time periods can be influenced by many transitory issues unrelated to the growth in the intrinsic value of the Fund’s holdings.
Investment Outlook:
In the Fund, we target “compounders” – businesses trading at reasonable valuations that have the competitive position, management, and growth to potentially create outsized value for an extended period of time. We believe that our criteria-driven, fundamental research, applied with a long-term investment horizon, allows us to identify these opportunities. We continue to have a positive outlook for the Fund because we believe its holdings are predominately a collection of “compounders” that should grow their earnings at attractive rates for a long time to come.
To further your understanding of what the Fund owns, and why, we will use this letter to describe our thinking behind American Tower (AMT), the Fund’s largest holding at the end of the period. We have a long history with AMT and believe it measures very well against our five investment criteria (high quality business, large growth opportunity, excellent management, low tail risk and discount valuation) as explained below.
AMT is the largest owner and operator of cellular towers in the U.S., with a growing presence in select emerging markets, including Mexico, Brazil, India, Nigeria and South Africa. These towers provide critical infrastructure to the wireless industry. Wireless carriers, such as AT&T, Verizon, T-Mobile and Sprint, rent space on towers to install communications equipment that transmits and receives wireless signals from mobile phones and other devices.
A cell tower has wonderful economic characteristics. A typical tower has capacity for four tenants. The first tenant covers the cost of tower construction by providing a mid- to high-single digit return on capital. Each subsequent tenant requires virtually no incremental capital or operating cost by the tower owner, so more than 90% of rental revenue flows through to EBITDA. A tower with three or four tenants can have a 25%-plus return on invested capital and an 80%-plus EBITDA margin with de minimis maintenance capital expenditure needs.
So with these economics, what keeps everyone from building a cell tower in their back yard? For one, these are tall unsightly metal structures. So neighbors, preservationists and zoning boards make it very difficult to get a new cell tower permit. But equally important, there are only a handful of large wireless carriers in most markets. Tower lease agreements typically include five- to 10-year initial terms with multiple five-year renewal options. If an incumbent tower has two or three carriers under contract, a new tower in the same trade area has limited opportunity to win clients. Over the last four years, the number of cell towers in the U.S. has grown at less than 2% per annum.
| HENNESSY FUNDS | 1-800-966-4354 | |
While owning a cell tower is a good business, owning a nationwide portfolio of towers is an even better business. With over 40,000 towers across the U.S. (about 25% of all cell towers in the country), AMT gets scale efficiencies in purchasing, construction and management, while also streamlining the administrative cost and time to market for national wireless carriers. Against this backdrop of attractive tower economics and supply constraints, there is dramatic growth in wireless data demand that is pushing carriers to lease more space on more tower locations to maintain the quality of their signal. Over the last two years, U.S. wireless data demand has doubled as data intensive 4G phones replace less data intensive 3G phones. Continued 4G phone adoption, supplemented by growth in tablets and other devices, is forecast to drive 40-50% annual wireless data growth over the next five years (according to Cisco Systems). Further, we expect the 5G rollout in the U.S. to begin around 2020, driving another big uplift in data demand and cell tower utilization.
The wireless trends we see in the U.S. are playing out overseas on a lagged basis. We believe the U.S. is in the fifth or sixth inning of 4G adoption, while many emerging markets are still deploying 2G or 3G networks, putting them about five or 10 years behind on the wireless technology adoption curve. Most emerging markets lack legacy fixed-line infrastructure for Wi-Fi offload, so the capture rate of data growth on wireless networks and cell towers is significantly higher than it is in the U.S. Today, AMT generates about 40% of its revenue from these faster growing overseas markets. We give credit to AMT management for investing in emerging market cell towers way ahead of competitors, establishing leadership positions that are paying off nicely today.
Unfortunately, a 40-50% annual increase in wireless data demand does not translate into a 40-50% increase in cell tower occupancy. Increased equipment occupancy is one of several solutions carriers have to meet this wireless demand, along with buying / deploying additional wireless spectrum, upgrading transmission equipment, and using non-tower transmission sites (rooftops, water towers, small-cells, DAS). Over the next five years, we expect AMT to grow revenue organically at 6-8% per annum in the U.S. and 10-14% overseas for a 9-10% blended organic revenue growth rate. With operating leverage, this organic revenue growth should translate into 10-12% organic EBITDA growth. In addition, we expect AMT’s 4-5% free cash flow yield, deployed into dividends and select acquisitions, to push total returns higher. Today AMT trades at about 18x adjusted funds from operations (or AFFO, which is a reasonable approximation of owner earnings), a slight premium to the broader market earnings multiple, but with twice the expected growth of the market.
The risks we think are most pertinent to our AMT investment are technological threats / substitutes and financial leverage. Over the years, we have seen many perceived technological threats emerge, only to be proven uneconomic or technically flawed in practice. Today, traditional cell towers (150+ feet tall) are the most cost effective means to provide a strong wireless signal to a wide area. There are supplemental solutions, such as “small-cell” towers (under 30 feet tall), that can make economic sense for dense urban infill (mostly supplementing rooftop antennas, not cell towers), however, with an all-in cost that is approximately 10x that of a macro tower site, small-cell towers have limited applicability elsewhere. Historically, satellite phones have been viewed as a possible alternative to terrestrial wireless, but billions of dollars of losses, accompanied by four major bankruptcies, have demonstrated satellite phones are only practical in niche situations (ships at sea, deep in jungles). Finally, Wi-Fi hot spots are a long-rumored competitor to traditional cellular networks. Wi-Fi works well at a coffee shop or in your home, but it suffers from poor signal quality due to interference, a small service range and a lack of mobility. We continue to watch technological developments in the industry by attending trade shows, reviewing industry publications and speaking with consultants.
HENNESSYFUNDS.COM
This research informs our view that traditional cell towers will persist as the low cost, base-load solution for wireless communications.
Relative to most businesses we own, AMT uses significant financial leverage (~5x debt to EBITDA). We believe this leverage is appropriate given the predictable nature of the business (the debt is rated investment grade), however, it subjects the company to higher interest expense if rates rise. Simplistically, a 100 basis point (bp) rise in the cost of debt for AMT would increase interest expense by about 25%, decreasing AFFO by about 7.5% (the actual interest expense would change gradually over time since AMT has an average five-year remaining term on its debt). Since we expect a mid-teens underlying growth rate in AMT’s AFFO, it would take about two quarters of expected growth to recoup the AFFO lost to a 100 bp rise in financing rates, or about four quarters to recoup a 200 bp rise in rates. We would not be surprised to see a 100 or 200 bp rise in rates over our investment horizon, and consider this an acceptable risk / headwind in exchange for the significant underlying compounding of AFFO we expect from AMT. A rise in long-term rates might also impact the valuation multiple the market is willing to assign to AMT – as well as all other equities – but we believe we are reasonably well insulated with the current valuation of 18x AFFO.
Finally, we have followed the wireless and cell tower industry since the late 1990s. Over this time, we have observed that many investors understand near-term industry growth, but consistently underestimate the long-term potential. We believe this is because they fail to appreciate the virtuous cycle that is at work across the industry; increasingly powerful handheld devices enable more robust applications, which require increased wireless bandwidth and throughput. Each turn of the cycle feeds the next, propelling the industry in unexpectedly favorable ways. We do not know of anyone that foresaw voice-centric Nokia phones from the late 1990s would be replaced by multifunctional BlackBerrys in the early 2000s, then full-featured Apple iPhones in the late 2000s. Without the now ubiquitous smartphone, demand for YouTube, Pandora, Google Maps, and Facebook would not be clogging up the airwaves creating the need for more broadband wireless today. With the arrival of 4G, and eventually 5G, the connected home, the connected car, and wireless delivery of cable TV become huge potential bandwidth hogs just over the horizon. While precisely modeling what impact these, and unknowable future applications will have on AMT is an exercise in futility, we believe the virtuous cycle is alive and well, and will lead to strong secular demand for wireless tower infrastructure far into the future.
_______________
Opinions expressed are those of the Portfolio Managers as of the date written and are subject to change, are not guaranteed, and should not be considered investment advice or an indication of trading intent.
The Russell 3000® Index is an unmanaged index commonly used to measure the performance of U.S. stocks. The Russell Midcap® Growth Index is an unmanaged index commonly used to measure the performance of U.S. medium-capitalization growth stocks. One cannot invest directly in an index.
The Fund is non-diversified, meaning it may concentrate its assets in fewer individual holdings than a diversified fund, making it more exposed to individual stock volatility than a diversified fund. The Fund invests in small and medium capitalized companies, which involves additional risks such as limited liquidity and greater volatility. Investments in foreign securities involve greater volatility and political, economic and currency risk and differences in accounting methods. Please see the Fund’s prospectus for a more complete discussion of these and other risks.
References to specific securities should not be considered a recommendation to buy or sell any security. Fund holdings and sector allocations are subject to change. Please refer to the Schedule of Investments included in this report for additional portfolio information.
| HENNESSY FUNDS | 1-800-966-4354 | |
Free cash flow is a measure of financial performance calculated as operating cash flow minus capital expenditures. Adjusted funds from operations (AFFO) refers to the financial performance measure primarily used in the analysis of real estate investment trusts (REITs). EBITDA is the acronym for earnings before interest, taxes, depreciation, amortization – a measure of a company’s operating performance. Basis point is a unit that is equal to 1/100th of 1% and is used to denote the change in a financial instrument. Return on capital is a profitability ratio that measures the return that an investment generates for capital contributors, i.e. bondholders and stockholders, and it indicates how effective a company is at turning capital into profits.
HENNESSYFUNDS.COM
| PERFORMANCE OVERVIEW/SCHEDULE OF INVESTMENTS |
Financial Statements
Schedule of Investments as of October 31, 2016 |
HENNESSY FOCUS FUND
(% of Net Assets)
| TOP TEN HOLDINGS (EXCLUDING CASH/CASH EQUIVALENTS) | % NET ASSETS |
| | |
| American Tower Corp., Class A | 10.50% |
| | |
| O’Reilly Automotive, Inc. | 9.32% |
| | |
| Markel Corp. | 7.91% |
| | |
| Brookfield Asset Management, Inc. | 6.65% |
| | |
| CarMax, Inc. | 6.18% |
| | |
| Aon PLC | 5.46% |
| | |
| The Charles Schwab Corp. | 5.34% |
| | |
| Hexcel Corp. | 4.93% |
| | |
| Gaming and Leisure Properties, Inc. | 4.28% |
| | |
| Twenty First Century Fox, Inc. | 4.21% |
Note: For presentation purposes, the Fund has grouped some of the industry categories. For purposes of categorizing securities for compliance with Section 8(b)(1) of the Investment Company Act of 1940, as amended, the Fund uses more specific industry classifications.
| HENNESSY FUNDS | 1-800-966-4354 | |
| | COMMON STOCKS – 63.59% | | Number | | | | | | % of | |
| | | | of Shares | | | Value | | | Net Assets | |
| | Consumer Discretionary – 20.36% | | | | | | | | | |
| | CarMax, Inc. (a) | | | 2,962,712 | | | $ | 147,957,837 | | | | 6.18 | % |
| | O’Reilly Automotive, Inc. (a) | | | 842,815 | | | | 222,873,999 | | | | 9.32 | % |
| | Penn National Gaming, Inc. (a) | | | 1,197,772 | | | | 15,487,192 | | | | 0.65 | % |
| | Twenty First Century Fox, Inc. | | | 3,837,592 | | | | 100,813,542 | | | | 4.21 | % |
| | | | | | | | | 487,132,570 | | | | 20.36 | % |
| | | | | | | | | | | | | | |
| | Energy – 2.60% | | | | | | | | | | | | |
| | World Fuel Services Corp. | | | 1,547,585 | | | | 62,290,296 | | | | 2.60 | % |
| | | | | | | | | | | | | | |
| | Financials – 22.43% | | | | | | | | | | | | |
| | Aon PLC (b) | | | 1,179,036 | | | | 130,672,560 | | | | 5.46 | % |
| | Diamond Hill Investment Group, Inc. | | | 145,893 | | | | 26,553,985 | | | | 1.11 | % |
| | Encore Capital Group, Inc. (a) (d) | | | 2,258,784 | | | | 44,836,862 | | | | 1.87 | % |
| | Markel Corp. (a) | | | 215,672 | | | | 189,237,083 | | | | 7.91 | % |
| | Marlin Business Services Corp. (d) | | | 1,010,273 | | | | 17,679,777 | | | | 0.74 | % |
| | The Charles Schwab Corp. | | | 4,029,065 | | | | 127,721,361 | | | | 5.34 | % |
| | | | | | | | | 536,701,628 | | | | 22.43 | % |
| | | | | | | | | | | | | | |
| | Health Care – 1.74% | | | | | | | | | | | | |
| | Henry Schein, Inc. (a) | | | 279,398 | | | | 41,686,181 | | | | 1.74 | % |
| | | | | | | | | | | | | | |
| | Industrials – 10.58% | | | | | | | | | | | | |
| | American Woodmark Corp. (a) (d) | | | 1,209,780 | | | | 90,370,566 | | | | 3.78 | % |
| | Ametek, Inc. | | | 459,822 | | | | 20,278,150 | | | | 0.85 | % |
| | Hexcel Corp. | | | 2,592,037 | | | | 117,911,763 | | | | 4.93 | % |
| | Mistras Group, Inc. (a) | | | 1,171,870 | | | | 24,538,958 | | | | 1.02 | % |
| | | | | | | | | 253,099,437 | | | | 10.58 | % |
| | | | | | | | | | | | | | |
| | Information Technology – 5.88% | | | | | | | | | | | | |
| | Alphabet, Inc., Class A (a) | | | 68,984 | | | | 55,870,142 | | | | 2.34 | % |
| | Alphabet, Inc., Class C (a) | | | 108,017 | | | | 84,743,657 | | | | 3.54 | % |
| | | | | | | | | 140,613,799 | | | | 5.88 | % |
| | | | | | | | | | | | | | |
| | Total Common Stocks | | | | | | | | | | | | |
| | (Cost $904,303,452) | | | | | | | 1,521,523,911 | | | | 63.59 | % |
The accompanying notes are an integral part of these financial statements.
HENNESSYFUNDS.COM
| | REITS – 21.44% | | Number | | | | | | % of | |
| | | | of Shares | | | Value | | | Net Assets | |
| | Financials – 21.44% | | | | | | | | | |
| | American Tower Corp., Class A | | | 2,145,080 | | | $ | 251,381,925 | | | | 10.51 | % |
| | Brookfield Asset Management, Inc. (b) | | | 4,543,328 | | | | 159,107,347 | | | | 6.65 | % |
| | Gaming and Leisure Properties, Inc. | | | 3,122,341 | | | | 102,506,455 | | | | 4.28 | % |
| | | | | | | | | 512,995,727 | | | | 21.44 | % |
| | | | | | | | | | | | | | |
| | Total REITS | | | | | | | | | | | | |
| | (Cost $324,420,323) | | | | | | | 512,995,727 | | | | 21.44 | % |
| | | | | | | | | | | | | | |
| | SHORT-TERM INVESTMENTS – 15.11% | | | | | | | | | | | | |
| | | | | | | | | | | | | | |
| | Money Market Funds – 15.11% | | | | | | | | | | | | |
| | Fidelity Government Portfolio, Institutional Class, 0.27% (c) | | | 119,705,000 | | | | 119,705,000 | | | | 5.01 | % |
| | First American Government Obligations Fund, 0.24% (c) | | | 2,339,306 | | | | 2,339,306 | | | | 0.10 | % |
| | The Government & Agency Portfolio, Institutional Class, 0.29% (c) | | | 119,705,000 | | | | 119,705,000 | | | | 5.00 | % |
| | Morgan Stanley Institutional Liquidity Fund – | | | | | | | | | | | | |
| | Government Portfolio, 0.30% (c) | | | 119,705,000 | | | | 119,705,000 | | | | 5.00 | % |
| | | | | | | | | 361,454,306 | | | | 15.11 | % |
| | | | | | | | | | | | | | |
| | Total Short-Term Investments | | | | | | | | | | | | |
| | (Cost $361,454,306) | | | | | | | 361,454,306 | | | | 15.11 | % |
| | | | | | | | | | | | | | |
| | Total Investments | | | | | | | | | | | | |
| | (Cost $1,590,178,081) – 100.14% | | | | | | | 2,395,973,944 | | | | 100.14 | % |
| | Liabilities in Excess of Other Assets – (0.14)% | | | | | | | (3,442,456 | ) | | | (0.14 | )% |
| | | | | | | | | | | | | | |
| | TOTAL NET ASSETS – 100.00% | | | | | | $ | 2,392,531,488 | | | | 100.00 | % |
Percentages are stated as a percent of net assets.
REIT – Real Estate Investment Trust
| (a) | Non-income producing security. |
| (b) | U.S. traded security of a foreign corporation. |
| (c) | The rate listed is the fund’s 7-day yield as of October 31, 2016. |
| (d) | Investment represents five percent or more of the outstanding voting securities of the issuer, and is or was an affiliate of the Hennessy Focus Fund, as defined in the Investment Company Act of 1940, as amended, at or during the year ended October 31, 2016. Details of transactions with these affiliated companies for the year ended October 31, 2016, are as follows: |
| | | | American | | | Encore Capital | | | Marlin Business | |
| | Issuer | | Woodmark Corp. | | | Group, Inc. | | | Services Corp. | |
| | Beginning Cost | | $ | 32,425,960 | | | $ | 72,792,945 | | | $ | 15,865,289 | |
| | Purchase Cost | | $ | 19,466,818 | | | $ | 732,458 | | | | — | |
| | Sales Cost | | | — | | | | — | | | | — | |
| | Ending Cost | | $ | 51,892,778 | | | $ | 73,525,403 | | | $ | 15,865,289 | |
| | Dividend Income | | | — | | | | — | | | $ | 565,753 | |
| | Shares | | | 1,209,780 | | | | 2,258,784 | | | | 1,010,273 | |
| | Market Value | | $ | 90,370,566 | | | $ | 44,836,862 | | | $ | 17,679,777 | |
The accompanying notes are an integral part of these financial statements.
| HENNESSY FUNDS | 1-800-966-4354 | |
Summary of Fair Value Exposure at October 31, 2016
The following is a summary of the inputs used to value the Fund’s net assets as of October 31, 2016 (see Note 3 in the accompanying notes to the financial statements):
| Common Stocks | | Level 1 | | | Level 2 | | | Level 3 | | | Total | |
| Consumer Discretionary | | $ | 487,132,570 | | | $ | — | | | $ | — | | | $ | 487,132,570 | |
| Energy | | | 62,290,296 | | | | — | | | | — | | | | 62,290,296 | |
| Financials | | | 536,701,628 | | | | — | | | | — | | | | 536,701,628 | |
| Health Care | | | 41,686,181 | | | | — | | | | — | | | | 41,686,181 | |
| Industrials | | | 253,099,437 | | | | — | | | | — | | | | 253,099,437 | |
| Information Technology | | | 140,613,799 | | | | — | | | | — | | | | 140,613,799 | |
| Total Common Stocks | | $ | 1,521,523,911 | | | $ | — | | | $ | — | | | $ | 1,521,523,911 | |
| REITS | | | | | | | | | | | | | | | | |
| Financials | | $ | 512,995,727 | | | $ | — | | | $ | — | | | $ | 512,995,727 | |
| Total REITS | | $ | 512,995,727 | | | $ | — | | | $ | — | | | $ | 512,995,727 | |
| Short-Term Investments | | | | | | | | | | | | | | | | |
| Money Market Funds | | $ | 361,454,306 | | | $ | — | | | $ | — | | | $ | 361,454,306 | |
| Total Short-Term Investments | | $ | 361,454,306 | | | $ | — | | | $ | — | | | $ | 361,454,306 | |
| Total Investments | | $ | 2,395,973,944 | | | $ | — | | | $ | — | | | $ | 2,395,973,944 | |
Transfers between levels are recognized at the end of the reporting period. During the year ended October 31, 2016, the Fund recognized no transfers between levels.
The accompanying notes are an integral part of these financial statements.
HENNESSYFUNDS.COM
| SCHEDULE OF INVESTMENTS/STATEMENT OF ASSETS AND LIABILITIES |
Financial Statements
Statement of Assets and Liabilities as of October 31, 2016 |
| ASSETS: | | | |
| Investments in securities, at value (cost $1,448,894,611) | | $ | 2,243,086,739 | |
| Investments in affiliated securities, at value (cost $141,283,470) | | | 152,887,205 | |
| Total Investments in securities, at value (cost $1,590,178,081) | | | 2,395,973,944 | |
| Dividends and interest receivable | | | 763,395 | |
| Receivable for fund shares sold | | | 2,747,797 | |
| Prepaid expenses and other assets | | | 89,921 | |
| Total Assets | | | 2,399,575,057 | |
| | | | | |
| LIABILITIES: | | | | |
| Payable for fund shares redeemed | | | 3,900,537 | |
| Payable to advisor | | | 1,853,205 | |
| Payable to administrator | | | 398,595 | |
| Payable to auditor | | | 20,699 | |
| Accrued distribution fees | | | 305,646 | |
| Accrued service fees | | | 140,290 | |
| Accrued trustees fees | | | 3,896 | |
| Accrued expenses and other payables | | | 420,701 | |
| Total Liabilities | | | 7,043,569 | |
| NET ASSETS | | $ | 2,392,531,488 | |
| | | | | |
| NET ASSETS CONSIST OF: | | | | |
| Capital stock | | $ | 1,602,944,656 | |
| Accumulated net investment loss | | | (10,118,034 | ) |
| Accumulated net realized loss on investments | | | (6,090,997 | ) |
| Unrealized net appreciation on investments | | | 805,795,863 | |
| Total Net Assets | | $ | 2,392,531,488 | |
| | | | | |
| NET ASSETS | | | | |
| Investor Class: | | | | |
| Shares authorized (no par value) | | Unlimited | |
| Net assets applicable to outstanding Investor Class shares | | $ | 1,626,709,875 | |
| Shares issued and outstanding | | | 23,029,973 | |
| Net asset value, offering price and redemption price per share | | $ | 70.63 | |
| | | | | |
| Institutional Class: | | | | |
| Shares authorized (no par value) | | Unlimited | |
| Net assets applicable to outstanding Institutional Class shares | | $ | 765,821,613 | |
| Shares issued and outstanding | | | 10,610,944 | |
| Net asset value, offering price and redemption price per share | | $ | 72.17 | |
The accompanying notes are an integral part of these financial statements.
| HENNESSY FUNDS | 1-800-966-4354 | |
Financial Statements
Statement of Operations for the year ended October 31, 2016 |
| INVESTMENT INCOME: | | | |
Dividend income(1) | | $ | 17,557,919 | |
| Dividend income from affiliated securities | | | 565,753 | |
| Interest income | | | 718,429 | |
| Total investment income | | | 18,842,101 | |
| | | | | |
| EXPENSES: | | | | |
| Investment advisory fees (See Note 5) | | | 20,616,778 | |
| Sub-transfer agent expenses – Investor Class (See Note 5) | | | 3,349,325 | |
| Sub-transfer agent expenses – Institutional Class (See Note 5) | | | 548,698 | |
| Distribution fees – Investor Class (See Note 5) | | | 2,439,835 | |
| Administration, fund accounting, custody and transfer agent fees (See Note 5) | | | 2,232,718 | |
| Service fees – Investor Class (See Note 5) | | | 1,626,556 | |
| Reports to shareholders | | | 150,078 | |
| Federal and state registration fees | | | 87,138 | |
| Compliance expense (See Note 5) | | | 23,709 | |
| Trustees’ fees and expenses | | | 22,538 | |
| Legal fees | | | 22,070 | |
| Audit fees | | | 20,697 | |
| Other expenses | | | 149,203 | |
| Total expenses | | | 31,289,343 | |
| NET INVESTMENT LOSS | | $ | (12,447,242 | ) |
| | | | | |
| REALIZED AND UNREALIZED LOSSES: | | | | |
| Net realized loss on investments | | $ | (5,426,283 | ) |
| Net change in unrealized appreciation on investments | | | (13,249,337 | ) |
| Net loss on investments | | | (18,675,620 | ) |
| NET DECREASE IN NET ASSETS RESULTING FROM OPERATIONS | | $ | (31,122,862 | ) |
(1) | Net of foreign taxes withheld of $601,522. |
The accompanying notes are an integral part of these financial statements.
HENNESSYFUNDS.COM
| STATEMENT OF OPERATIONS/STATEMENTS OF CHANGES IN NET ASSETS |
Financial Statements
| Statements of Changes in Net Assets |
| | | Year Ended | | | Year Ended | |
| | | October 31, 2016 | | | October 31, 2015 | |
| OPERATIONS: | | | | | | |
| Net investment loss | | $ | (12,447,242 | ) | | $ | (8,322,351 | ) |
| Net realized gain (loss) on investments | | | (5,426,283 | ) | | | 4,582,644 | |
| Net change in unrealized appreciation on investments | | | (13,249,337 | ) | | | 189,175,587 | |
| Net increase (decrease) in net assets resulting from operations | | | (31,122,862 | ) | | | 185,435,880 | |
| | | | | | | | | |
| DISTRIBUTIONS TO SHAREHOLDERS FROM: | | | | | | | | |
| Net investment income | | | | | | | | |
| Investor Class | | | — | | | | (320,240 | ) |
| Institutional Class | | | — | | | | (218,677 | ) |
| Net realized gains | | | | | | | | |
| Investor Class | | | (3,251,490 | ) | | | (91,635,474 | ) |
| Institutional Class | | | (1,083,008 | ) | | | (21,665,079 | ) |
| Total distributions | | | (4,334,498 | ) | | | (113,839,470 | ) |
| | | | | | | | | |
| CAPITAL SHARE TRANSACTIONS: | | | | | | | | |
| Proceeds from shares subscribed – Investor Class | | | 443,753,342 | | | | 523,376,866 | |
| Proceeds from shares subscribed – Institutional Class | | | 408,969,650 | | | | 279,633,599 | |
| Dividends reinvested – Investor Class | | | 3,188,245 | | | | 90,396,629 | |
| Dividends reinvested – Institutional Class | | | 867,516 | | | | 16,054,210 | |
| Cost of shares redeemed – Investor Class | | | (402,722,784 | ) | | | (266,214,310 | ) |
| Cost of shares redeemed – Institutional Class | | | (161,483,885 | ) | | | (75,766,873 | ) |
| Net increase in net assets derived | | | | | | | | |
| from capital share transactions | | | 292,572,084 | | | | 567,480,121 | |
| TOTAL INCREASE IN NET ASSETS | | | 257,114,724 | | | | 639,076,531 | |
| | | | | | | | | |
| NET ASSETS: | | | | | | | | |
| Beginning of year | | | 2,135,416,764 | | | | 1,496,340,233 | |
| End of year | | $ | 2,392,531,488 | | | $ | 2,135,416,764 | |
| Undistributed net investment loss, end of year | | $ | (10,118,034 | ) | | $ | (8,330,095 | ) |
| | | | | | | | | |
| CHANGES IN SHARES OUTSTANDING: | | | | | | | | |
| Shares sold – Investor Class | | | 6,346,130 | | | | 7,439,297 | |
| Shares sold – Institutional Class | | | 5,766,791 | | | | 3,920,855 | |
| Shares issued to holders as reinvestment | | | | | | | | |
| of dividends – Investor Class | | | 45,333 | | | | 1,371,829 | |
| Shares issued to holders as reinvestment | | | | | | | | |
| of dividends – Institutional Class | | | 12,111 | | | | 239,922 | |
| Shares redeemed – Investor Class | | | (5,815,084 | ) | | | (3,820,415 | ) |
| Shares redeemed – Institutional Class | | | (2,269,086 | ) | | | (1,078,256 | ) |
| Net increase in shares outstanding | | | 4,086,195 | | | | 8,073,232 | |
The accompanying notes are an integral part of these financial statements.
| HENNESSY FUNDS | 1-800-966-4354 | |
Financial Statements
For an Investor Class share outstanding throughout each year
PER SHARE DATA:
Net asset value, beginning of year
Income from investment operations:
Net investment income (loss)
Net realized and unrealized gains (losses) on investments
Total from investment operations
Less distributions:
Dividends from net investment income
Dividends from net realized gains
Total distributions
Paid-in capital from redemption fees
Net asset value, end of year
TOTAL RETURN
SUPPLEMENTAL DATA AND RATIOS:
Net assets, end of year (millions)
Ratio of expenses to average net assets
Ratio of net investment income (loss) to average net assets
Portfolio turnover rate(2)
(1) | Amount is less than $0.01. |
(2) | Portfolio turnover is calculated on the basis of the Fund as a whole. |
HENNESSYFUNDS.COM
| FINANCIAL HIGHLIGHTS — INVESTOR CLASS |
| Year Ended October 31, | |
| 2016 | | | 2015 | | | 2014 | | | 2013 | | | 2012 | |
| | | | | | | | | | | | | | |
| $ | 71.94 | | | $ | 69.46 | | | $ | 63.58 | | | $ | 51.78 | | | $ | 49.80 | |
| | | | | | | | | | | | | | | | | | | |
| | | | | | | | | | | | | | | | | | | |
| | (0.45 | ) | | | (0.33 | ) | | | 0.27 | | | | (0.32 | ) | | | (0.39 | ) |
| | (0.72 | ) | | | 8.07 | | | | 6.68 | | | | 16.44 | | | | 7.61 | |
| | (1.17 | ) | | | 7.74 | | | | 6.95 | | | | 16.12 | | | | 7.22 | |
| | | | | | | | | | | | | | | | | | | |
| | | | | | | | | | | | | | | | | | | |
| | — | | | | (0.02 | ) | | | — | | | | — | | | | — | |
| | (0.14 | ) | | | (5.24 | ) | | | (1.07 | ) | | | (4.32 | ) | | | (5.24 | ) |
| | (0.14 | ) | | | (5.26 | ) | | | (1.07 | ) | | | (4.32 | ) | | | (5.24 | ) |
| | — | | | | — | | | | 0.00 | (1) | | | 0.00 | (1) | | | 0.00 | (1) |
| $ | 70.63 | | | $ | 71.94 | | | $ | 69.46 | | | $ | 63.58 | | | $ | 51.78 | |
| | | | | | | | | | | | | | | | | | | |
| | (1.63 | )% | | | 11.83 | % | | | 11.05 | % | | | 33.54 | % | | | 16.17 | % |
| | | | | | | | | | | | | | | | | | | |
| | | | | | | | | | | | | | | | | | | |
| $ | 1,626.71 | | | $ | 1,615.36 | | | $ | 1,213.03 | | | $ | 1,139.85 | | | $ | 707.61 | |
| | 1.47 | % | | | 1.46 | % | | | 1.41 | % | | | 1.43 | % | | | 1.41 | % |
| | (0.65 | )% | | | (0.55 | )% | | | 0.41 | % | | | (0.85 | )% | | | (0.79 | )% |
| | 2 | % | | | 4 | % | | | 18 | % | | | 4 | % | | | 13 | % |
The accompanying notes are an integral part of these financial statements.
| HENNESSY FUNDS | 1-800-966-4354 | |
Financial Statements
For an Institutional Class share outstanding throughout each year
PER SHARE DATA:
Net asset value, beginning of year
Income from investment operations:
Net investment income (loss)
Net realized and unrealized gains (losses) on investments
Total from investment operations
Less distributions:
Dividends from net investment income
Dividends from net realized gains
Total distributions
Net asset value, end of year
TOTAL RETURN
SUPPLEMENTAL DATA AND RATIOS:
Net assets, end of year (millions)
Ratio of expenses to average net assets
Ratio of net investment income (loss) to average net assets
Portfolio turnover rate(2)
(1) | Amount is less than $0.01. |
(2) | Portfolio turnover is calculated on the basis of the Fund as a whole. |
The accompanying notes are an integral part of these financial statements.
HENNESSYFUNDS.COM
| FINANCIAL HIGHLIGHTS — INSTITUTIONAL CLASS |
| Year Ended October 31, | |
| 2016 | | | 2015 | | | 2014 | | | 2013 | | | 2012 | |
| | | | | | | | | | | | | | |
| $ | 73.24 | | | $ | 70.50 | | | $ | 64.32 | | | $ | 52.19 | | | $ | 50.02 | |
| | | | | | | | | | | | | | | | | | | |
| | | | | | | | | | | | | | | | | | | |
| | (0.14 | ) | | | (0.08 | ) | | | 0.35 | | | | (0.13 | ) | | | (0.22 | ) |
| | (0.79 | ) | | | 8.19 | | | | 6.90 | | | | 16.58 | | | | 7.63 | |
| | (0.93 | ) | | | 8.11 | | | | 7.25 | | | | 16.45 | | | | 7.41 | |
| | | | | | | | | | | | | | | | | | | |
| | | | | | | | | | | | | | | | | | | |
| | — | | | | (0.05 | ) | | | — | | | | — | | | | — | |
| | (0.14 | ) | | | (5.32 | ) | | | (1.07 | ) | | | (4.32 | ) | | | (5.24 | ) |
| | (0.14 | ) | | | (5.37 | ) | | | (1.07 | ) | | | (4.32 | ) | | | (5.24 | ) |
| $ | 72.17 | | | $ | 73.24 | | | $ | 70.50 | | | $ | 64.32 | | | $ | 52.19 | |
| | | | | | | | | | | | | | | | | | | |
| | (1.27 | )% | | | 12.23 | % | | | 11.40 | % | | | 33.94 | % | | | 16.51 | % |
| | | | | | | | | | | | | | | | | | | |
| | | | | | | | | | | | | | | | | | | |
| $ | 765.82 | | | $ | 520.06 | | | $ | 283.31 | | | $ | 179.89 | | | $ | 77.28 | |
| | 1.10 | % | | | 1.11 | % | | | 1.10 | % | | | 1.13 | % | | | 1.12 | % |
| | (0.28 | )% | | | (0.19 | )% | | | 0.59 | % | | | (0.52 | )% | | | (0.52 | )% |
| | 2 | % | | | 4 | % | | | 18 | % | | | 4 | % | | | 13 | % |
The accompanying notes are an integral part of these financial statements.
| HENNESSY FUNDS | 1-800-966-4354 | |
Financial Statements
Notes to the Financial Statements October 31, 2016 |
1). ORGANIZATION
The Hennessy Focus Fund (the “Fund”) is a series of Hennessy Funds Trust (the “Trust”), which was organized as a Delaware statutory trust on September 17, 1992. The Fund is an open-end management investment company registered under the Investment Company Act of 1940, as amended. The Fund is a successor to the FBR Focus Fund (the “Predecessor FBR Fund”), a series of The FBR Funds, a Delaware statutory trust, pursuant to a reorganization that took place after the close of business on October 26, 2012. Prior to October 26, 2012, the Fund had no investment operations. As a result of the reorganization, holders of Investor Class shares of the Predecessor FBR Fund received Investor Class shares of the Fund (the Investor Class shares of the Fund are the successor to the accounting and performance information of the corresponding shares of the Predecessor FBR Fund), and holders of Institutional Class shares of the Predecessor FBR Fund received Institutional Class shares of the Fund (the Institutional Class shares of the Fund are the successor to the accounting and performance information of the corresponding shares of the Predecessor FBR Fund). The investment objective of the Fund is capital appreciation. The Fund is a non-diversified fund.
The Fund offers Investor Class and Institutional Class shares. Each class of shares differs principally in its respective administration, 12b-1 distribution and service, shareholder servicing, and transfer agent expenses (there are no sales charges). Each class has identical rights to earnings, assets, and voting privileges, except for class-specific expenses and exclusive rights to vote on matters affecting only an individual class.
As an investment company, the Fund follows the investment company accounting and reporting guidance of the Financial Accounting Standards Board (“FASB”) Accounting Standard Codification Topic 946 “Financial Services—Investment Companies.”
2). SIGNIFICANT ACCOUNTING POLICIES
The following is a summary of significant accounting policies consistently followed by the Fund in the preparation of the financial statements. These policies conform with U.S. generally accepted accounting principles (“GAAP”).
| a). | Investment Valuation – All investments in securities are recorded at their estimated fair value, as described in Note 3. |
| | |
| b). | Federal Income Taxes – No provision for federal income taxes or excise taxes has been made since the Fund has elected to be taxed as a “regulated investment company” and intends to distribute substantially all of its taxable income to its shareholders and otherwise comply with the provisions of the Internal Revenue Code of 1986, as amended, applicable to regulated investment companies. Net investment income or loss and realized gains and losses for federal income tax purposes may differ from that reported on the financial statements because of temporary book and tax basis differences. Temporary differences are primarily the result of the treatment of wash sales for tax reporting purposes. The Fund recognizes interest and penalties related to income tax benefits, if any, in the statement of operations as an income tax expense. Distributions from net realized gains for book purposes may include short-term capital gains, which are included as ordinary income to shareholders for tax purposes. |
HENNESSYFUNDS.COM
| NOTES TO THE FINANCIAL STATEMENTS |
| | Due to inherent differences in the recognition of income, expenses, and realized gains/losses under GAAP and federal income tax regulations, permanent differences between book and tax basis for reporting for the fiscal year ended October 31, 2016, have been identified and appropriately reclassified on the Statement of Assets and Liabilities. The adjustments are as follows: |
| | Undistributed | Accumulated | | |
| | Net Investment | Net Realized | | |
| | Income/(Loss) | Gain/(Loss) | Paid-in Capital | |
| | $10,659,303 | $(381,450) | $(10,277,853) | |
| c). | Accounting for Uncertainty in Income Taxes – The Fund has accounting policies regarding recognition and measurement of tax positions taken or expected to be taken on a tax return. The tax returns of the Fund for the prior three fiscal years are open for examination. The Fund has reviewed all open tax years in major jurisdictions and concluded that there is no impact on the Fund’s net assets and no tax liability resulting from unrecognized tax benefits relating to uncertain income tax positions taken or expected to be taken on a tax return. The Fund’s major tax jurisdictions are U.S. federal and Delaware. |
| | |
| d). | Income and Expenses – Dividend income is recognized on the ex-dividend date or as soon as information is available to the Fund. Interest income, which includes the amortization of premium and accretion of discount, is recognized on an accrual basis. The Fund is charged for those expenses that are directly attributable to the portfolio, such as advisory, administration, and certain shareholder service fees. Income, expenses (other than expenses attributable to a specific class), and realized and unrealized gains or losses on investments are allocated to each class of shares based on its respective net assets. |
| | |
| e). | Distributions to Shareholders – Dividends from net investment income for the Fund, if any, are declared and paid annually, usually in December. Distributions of net realized capital gains, if any, are declared and paid annually, usually in December. |
| | |
| f). | Security Transactions – Investment and shareholder transactions are recorded on the trade date. The Fund determines the gain or loss realized from the investment transactions by comparing the original cost of the security lot sold with the net sale proceeds. Discounts and premiums on securities purchased are accreted/amortized over the life of the respective security. |
| | |
| g). | Use of Estimates – The preparation of financial statements in conformity with GAAP requires management to make estimates and assumptions that affect the reported amounts of assets and liabilities and disclosure of contingent assets and liabilities at the date of the financial statements and the reported change in net assets during the reporting period. Actual results could differ from those estimates. |
| | |
| h). | Share Valuation – The net asset value (“NAV”) per share of the Fund is calculated by dividing the sum of the value of the securities held by the Fund, plus cash or other assets, minus all liabilities (including estimated accrued expenses) by the total number of shares outstanding for the Fund, rounded to the nearest cent. The Fund’s shares will not be priced on days the New York Stock Exchange is closed for trading. The offering and redemption price per share for the Fund is equal to the Fund’s NAV per share. |
| | |
| i). | Foreign Currency – Values of investments denominated in foreign currencies, if any, are converted into U.S. dollars using the spot market rate of exchange at the time of valuation. Purchases and sales of investments and income are translated into U.S. dollars using the spot market rate of exchange prevailing on the respective dates of |
| HENNESSY FUNDS | 1-800-966-4354 | |
| | such transactions. The Fund does not isolate the portion of the results of operations resulting from fluctuations in foreign exchange rates on investments from fluctuations resulting from changes in the market prices of securities held. Such fluctuations are included with the net realized and unrealized gain or loss on investments. Foreign investments present additional risks due to currency fluctuations, economic and political factors, lower liquidity, government regulations, differences in accounting standards, and other factors. |
| | |
| j). | Forward Contracts – The Fund may enter into forward currency contracts to reduce its exposure to changes in foreign currency exchange rates on its foreign holdings and to lock in the U.S. dollar cost of firm purchase and sale commitments for securities denominated in foreign currencies. A forward currency contract is a commitment to purchase or sell a foreign currency at a future date at a negotiated forward rate. The gain or loss arising from the difference between the U.S. dollar cost of the original contract and the value of the foreign currency in U.S. dollars upon closing of such contract is included in net realized gain or loss from foreign currency transactions. During the fiscal year ended October 31, 2016, the Fund did not enter into any forward contracts. |
| | |
| k). | Repurchase Agreements – The Fund may enter into repurchase agreements with member banks or security dealers of the Federal Reserve Board whom the investment advisor deems creditworthy. The repurchase price generally equals the price paid by the Fund plus interest negotiated on the basis of current short-term rates. |
| | |
| | Securities pledged as collateral for repurchase agreements are held by the custodian bank until the respective agreements mature. Provisions of the repurchase agreements ensure that the market value of the collateral, including accrued interest thereon, is sufficient to cover the repurchase amount in the event of default of the counterparty. If the counterparty defaults and the value of the collateral declines or if the counterparty enters an insolvency proceeding, realization of the collateral by the Fund may be delayed or limited. During the fiscal year ended October 31, 2016, the Fund did not enter into any repurchase agreements. |
| | |
| l). | Derivatives – The Fund may invest in, or enter into, derivatives, such as options, futures contracts, options on futures contracts, and swaps, for a variety of reasons, including to hedge certain risks, to provide a substitute for purchasing or selling particular securities, or to increase potential income gain. Derivatives are financial contracts based on an underlying or notional amount, require no initial investment or an initial net investment that is smaller than would normally be required to have a similar response to changes in market factors, and require or permit net settlement. Derivatives may allow the Fund to increase or decrease the level of risk to which the Fund is exposed more quickly and efficiently than transactions in other types of instruments. The main purpose of utilizing derivative instruments is for hedging purposes. |
| | |
| | The Fund follows the financial accounting reporting rules as required by the Derivatives and Hedging Topic of the FASB Accounting Standards Codification. Under such rules, the Fund is required to include enhanced disclosure that enables investors to understand how and why an entity uses derivatives, how derivatives are accounted for, and how derivatives instruments affect an entity’s results of operations and financial position. During the fiscal year ended October 31, 2016, the Fund did not hold any derivative instruments. |
| | |
| m). | New Accounting Pronouncements – In May 2015, the FASB issued ASU No. 2015-07 “Disclosure for Investments in Certain Entities that Calculate Net Asset Value per Share (or Its Equivalent).” The amendments in ASU No. 2015-07 remove the |
HENNESSYFUNDS.COM
| NOTES TO THE FINANCIAL STATEMENTS |
| | requirement to categorize within the fair value hierarchy investments measured at NAV and require the disclosure of sufficient information to reconcile the fair value of the remaining assets categorized within the fair value hierarchy to the financial statements. The amendments in ASU No. 2015-07 are effective for fiscal years beginning after December 15, 2015, and interim periods within those fiscal years. Management has reviewed the requirements and believes the adoption of ASU 2015-07 will not have a material impact on the Fund’s financial statements and related disclosures. |
3). SECURITIES VALUATION
The Fund follows authoritative fair valuation accounting standards that establish an authoritative definition of fair value and set out a hierarchy for measuring fair value. These standards require additional disclosures about the various inputs and valuation techniques used to develop the measurements of fair value and a discussion in changes in valuation techniques and related inputs during the period. These inputs are summarized in the three broad levels listed below:
| | Level 1 – | Unadjusted, quoted prices in active markets for identical instruments that the Fund has the ability to access at the date of measurement. |
| | | |
| | Level 2 – | Other significant observable inputs (including, but not limited to, quoted prices in active markets for similar instruments, quoted prices in markets that are not active for identical or similar instruments, and model-derived valuations in which all significant inputs and significant value drivers are observable in active markets (such as interest rates, prepayment speeds, credit risk curves, default rates, and similar data)). |
| | | |
| | Level 3 – | Significant unobservable inputs (including the Fund’s own assumptions about what market participants would use to price the asset or liability based on the best available information) when observable inputs are unavailable. |
Following is a description of the valuation techniques applied to the Fund’s major categories of assets and liabilities measured at fair value on a recurring basis.
Equity Securities – Equity securities, including common stocks, preferred stocks, foreign-issued common stocks, exchange-traded funds, closed-end mutual funds, partnerships, rights, and real estate investment trusts, that are traded on a securities exchange for which a last-quoted sales price is readily available will generally be valued at the last sales price as reported by the primary exchange on which the securities are listed. Securities listed on The NASDAQ Stock Market (“NASDAQ”) will generally be valued at the NASDAQ Official Closing Price, which may differ from the last sales price reported. Securities traded on a securities exchange for which a last-quoted sales price is not readily available will generally be valued at the mean between the bid and ask prices. To the extent these securities are actively traded and valuation adjustments are not applied, they are classified in Level 1 of the fair value hierarchy. Securities traded on foreign exchanges generally are not valued at the same time the Fund calculates its NAV because most foreign markets close well before such time. The earlier close of most foreign markets gives rise to the possibility that significant events, including broad market moves, may have occurred in the interim. In certain circumstances, it may be determined that a security needs to be fair valued because it appears that the value of the security might have been materially affected by events occurring after the close of the market in which the security is principally traded, but before the time the Fund calculates its NAV, such as by a development that affects an entire market or region (e.g., weather-related events) or a potentially global development (e.g., a terrorist attack that may be expected to have an effect on investor expectations worldwide).
| HENNESSY FUNDS | 1-800-966-4354 | |
Registered Investment Companies – Investments in registered investment companies (e.g., mutual funds) are generally priced at the ending NAV provided by the applicable registered investment company’s service agent and will be classified in Level 1 of the fair value hierarchy.
Debt Securities – Debt securities, including corporate bonds, asset-backed securities, mortgage-backed securities, municipal bonds, U.S. Treasuries, and U.S. government agency issues, are generally valued at market on the basis of valuations furnished by an independent pricing service that utilizes both dealer-supplied valuations and formula-based techniques. The pricing service may consider recently executed transactions in securities of the issuer or comparable issuers, market price quotations (where observable), bond spreads, and fundamental data relating to the issuer. In addition, the model may incorporate observable market data, such as reported sales of similar securities, broker quotes, yields, bids, offers, and reference data. Certain securities are valued primarily using dealer quotations. These securities are generally classified in Level 2 of the fair value hierarchy.
Short-Term Securities – Short-term equity investments, including money market funds, are valued in the manner specified above. Short-term debt investments with an original term to maturity of 60 days or less are valued at amortized cost, which approximates fair market value. If the original term to maturity of a short-term debt investment exceeded 60 days, then the values as of the 61st day prior to maturity are amortized. Amortized cost is not used if its use would be inappropriate due to credit or other impairments of the issuer, in which case the security’s fair value would be determined, as described below. Short-term securities are generally classified in Level 1 or Level 2 of the fair market hierarchy depending on the inputs used and market activity levels for specific securities.
The Board of Trustees of the Fund (the “Board”) has adopted fair value pricing procedures that are followed when a price for a security is not readily available or if a significant event has occurred that indicates the closing price of a security no longer represents the true value of that security. Fair value pricing determinations are made in good faith in accordance with these procedures. There are numerous criteria that will be given consideration in determining a fair value of a security, such as the trading volume of a security and markets, the value of other like securities, and news events with direct bearing to a security or markets. Fair value pricing results in an estimated price for a security that reflects the amount the Fund might reasonably expect to receive in a current sale. Depending on the relative significance of the valuation inputs, these securities may be classified in either Level 2 or Level 3 of the fair value hierarchy.
The fair valuation of foreign securities may be determined with the assistance of a pricing service using correlations between the movement of prices of such securities and indices of domestic securities and other appropriate indicators, such as closing market prices of relevant American Depositary Receipts or futures contracts. The effect of using fair value pricing is that the Fund’s NAV will reflect the affected portfolio securities’ value as determined by the Board or its designee instead of being determined by the market. Using a fair value pricing methodology to price foreign securities may result in a value that is different from a foreign security’s most recent closing price and from the prices used by other investment companies to calculate their NAVs and are generally considered Level 2 prices in the fair valuation hierarchy. Because the Fund may invest in foreign securities, the value of the Fund’s portfolio securities may change on days when you will not be able to purchase or redeem your shares.
The Board has delegated day-to-day valuation matters to a Valuation Committee comprised of one or more representatives from Hennessy Advisors, Inc., the Fund’s investment advisor. The function of the Valuation Committee is to value securities where
HENNESSYFUNDS.COM
| NOTES TO THE FINANCIAL STATEMENTS |
current and reliable market quotations are not readily available. All actions taken by the Valuation Committee are reviewed by the Board.
The Fund has performed an analysis of all existing investments to determine the significance and character of all inputs to their fair value determination. Various inputs are used in determining the value of the Fund’s investments. The inputs or methodology used for valuing securities are not necessarily an indication of the risk associated with investing in those securities. Details related to the fair valuation hierarchy of the Fund’s securities as of October 31, 2016, are included in the Fund’s Schedule of Investments.
4). INVESTMENT TRANSACTIONS
Purchases and sales of investment securities (excluding government and short-term investments) for the Fund during the fiscal year ended October 31, 2016, were $286,219,604 and $41,752,479, respectively.
There were no purchases or sales/maturities of long-term U.S. government securities for the Fund during the fiscal year ended October 31, 2016.
The Fund is permitted to purchase or sell securities from or to another fund in the Hennessy Funds family of funds (the “Hennessy Funds”) under specified conditions outlined in procedures adopted by the Board of Trustees. The procedures have been designed to ensure that any purchase or sale of securities by the Fund from or to another Hennessy Fund complies with Rule 17a-7 of the Investment Company Act of 1940. For the fiscal year ended October 31, 2016, the Fund did not engage in purchases and sales of securities pursuant to Rule 17a-7 of the Investment Company Act of 1940.
5). INVESTMENT MANAGEMENT FEE AND OTHER TRANSACTIONS WITH AFFILIATES
Hennessy Advisors, Inc. (the “Advisor”) is the investment advisor of the Fund. The Advisor provides the Fund with investment management services under an Investment Advisory Agreement. The Advisor furnishes all investment advice, office space, facilities, and provides most of the personnel needed by the Fund. As compensation for its services, the Advisor is entitled to a monthly fee from the Fund. The fee is based upon the average daily net assets of the Fund at the annual rate of 0.90%. The net investment advisory fees payable by the Fund as of October 31, 2016, were $1,853,205.
The Advisor has delegated the day-to-day management of the Fund to a sub-advisor, Broad Run Investment Management, LLC. The Advisor pays the sub-advisor fees from its own assets and these fees are not an additional expense of the Fund. For the most recent fiscal year, the Advisor (not the Fund) paid a sub-advisory fee, based upon the daily net assets of the Fund, at the rate of 0.29%.
The Board has approved a Shareholder Servicing Agreement for Investor Class shares of the Fund, effective as of March 1, 2015, which was instituted to compensate the Advisor for the non-investment management services it provides to the Fund. The Shareholder Servicing Agreement provides for a monthly fee paid to the Advisor at an annual rate of 0.10% of the average daily net assets of the Fund attributable to Investor Class shares. Shareholder service fees payable by the Fund as of October 31, 2016, were $140,290.
The Fund has adopted a plan pursuant to Rule 12b-1 under the Investment Company Act of 1940, as amended, that authorizes payments in connection with the distribution of the Fund’s shares at an annual rate of up to 0.25% of the Fund’s average daily net assets attributable to Investor Class shares. Even though the authorized rate is up to 0.25%, the Fund has only used up to 0.15% of its average daily net assets attributable to Investor Class shares for such purpose since March 1, 2015. Amounts paid under the plan may be spent on any activities or expenses primarily intended to result in the sale of shares, including, but not limited to, advertising, shareholder account
| HENNESSY FUNDS | 1-800-966-4354 | |
servicing, the printing and mailing of prospectuses to other than current shareholders, the printing and mailing of sales literature, and compensation for sales and marketing activities or to financial institutions and others, such as dealers and distributors.
The Fund has entered into agreements with various brokers, dealers, and financial intermediaries in connection with the sale of shares of the Fund. The agreements provide for periodic payments by the Fund to the brokers, dealers, and financial intermediaries for providing certain shareholder maintenance services (sub-transfer agent expenses). These shareholder services include the pre-processing and quality control of new accounts, shareholder correspondence, answering customer inquiries regarding account status, and facilitating shareholder telephone transactions. Fees paid by the Fund to various brokers, dealers, and financial intermediaries during the fiscal year ended October 31, 2016, were $3,898,023.
U.S. Bancorp Fund Services, LLC (“USBFS”) provides the Fund with administrative, fund accounting, and transfer agent services, and necessary office equipment. As administrator, USBFS is responsible for activities such as (i) preparing various federal and state regulatory filings, reports, and returns for the Fund, (ii) preparing reports and materials to be supplied to the Board, (iii) monitoring the activities of the Fund’s custodian, transfer agent, and accountants, and (iv) coordinating the preparation and payment of the Fund’s expenses and reviewing the Fund’s expense accruals. Fees paid to USBFS during the fiscal year ended October 31, 2016, were $2,232,718.
U.S. Bank, N.A., an affiliate of USBFS, serves as the Fund’s custodian. Quasar Distributors, LLC acts as the Fund’s principal underwriter in a continuous public offering of the Fund’s shares. Quasar Distributors, LLC is an affiliate of USBFS and U.S. Bank, N.A.
The officers of the Fund are affiliated with the Advisor. Such officers, with the exception of the Chief Compliance Officer and the Senior Compliance Officer, receive no compensation from the Fund for serving in their respective roles. The Fund, along with the other Hennessy Funds, makes reimbursement payments, on an equal basis, to the Advisor for a portion of the salary and benefits associated with the office of the Chief Compliance Officer and for all of the salary and benefits associated with the office of the Senior Compliance Officer. Such amounts are included on the Statement of Operations.
6). GUARANTEES AND INDEMNIFICATIONS
Under the Hennessy Funds’ organizational documents, their officers and trustees are indemnified by the Hennessy Funds against certain liabilities arising out of the performance of their duties to the Hennessy Funds. Additionally, in the normal course of business, the Hennessy Funds enter into contracts with service providers that contain general indemnification clauses. The Fund’s maximum exposure under these arrangements is unknown as this would involve future claims that may be made against the Fund that have not yet occurred. Currently, the Fund expects the risk of loss to be remote.
7). LINE OF CREDIT
The Fund has an uncommitted line of credit with the other Hennessy Funds in the amount of the lesser of (i) $100,000,000 or (ii) 33.33% of each Hennessy Fund’s net assets, or 30% for the Hennessy Gas Utility Fund and 10% for the Hennessy Balanced Fund, intended to provide short-term financing, if necessary, subject to certain restrictions, in connection with shareholder redemptions. The credit facility is with the Hennessy Funds’ custodian bank, U.S. Bank, N.A. Borrowings under this arrangement bear interest at the bank’s prime rate and are secured by all of the Fund’s assets (as to its own borrowings only). During the fiscal year ended October 31, 2016, the Fund did not have any borrowings outstanding under the line of credit.
HENNESSYFUNDS.COM
| NOTES TO THE FINANCIAL STATEMENTS |
8). FEDERAL TAX INFORMATION
As of October 31, 2016, the components of accumulated earnings (losses) for income tax purposes were as follows:
| | Cost of investments for tax purposes | | $ | 1,590,178,081 | |
| | Gross tax unrealized appreciation | | $ | 869,999,821 | |
| | Gross tax unrealized depreciation | | | (64,203,958 | ) |
| | Net tax unrealized appreciation | | $ | 805,795,863 | |
| | Undistributed ordinary income | | $ | — | |
| | Undistributed long-term capital gains | | | — | |
| | Total distributable earnings | | $ | — | |
| | Other accumulated loss | | $ | (16,209,031 | ) |
| | Total accumulated gain | | $ | 789,586,832 | |
At October 31, 2016, the Fund had capital loss carryforwards that expire as follows:
| | $ | 447,571 | | Indefinite ST |
| | $ | 5,643,426 | | Indefinite LT |
At October 31, 2016, the Fund deferred, on a tax basis, a late year ordinary loss of $10,118,034.
During the fiscal years ended October 31, 2016 and 2015, the tax character of distributions paid by the Fund was as follows:
| | | Year Ended | | | Year Ended | |
| | | October 31, 2016 | | | October 31, 2015 | |
Ordinary income(1) | | $ | — | | | $ | 2,736,846 | |
| Long-term capital gain | | | 4,334,498 | | | | 111,102,624 | |
| | | $ | 4,334,498 | | | $ | 113,839,470 | |
| (1) | Ordinary income includes short-term gain or loss. |
9). EVENTS SUBSEQUENT TO YEAR END
Management has evaluated the Fund’s related events and transactions that occurred subsequent to October 31, 2016, through the date of issuance of the Fund’s financial statements. Management has determined that there were no subsequent events requiring recognition or disclosure in the financial statements.
| HENNESSY FUNDS | 1-800-966-4354 | |
Report of Independent Registered Public Accounting Firm
To the Board of Trustees of Hennessy Funds Trust
and the Shareholders of the Hennessy Focus Fund
Novato, CA
We have audited the accompanying statement of assets and liabilities, including the schedule of investments, of the Hennessy Focus Fund (the “Fund”), a series of Hennessy Funds Trust, as of October 31, 2016, and the related statement of operations for the year then ended, the statements of changes in net assets for each of the two years in the period then ended, and the financial highlights for each of the five years in the period then ended. These financial statements and financial highlights are the responsibility of the Fund’s management. Our responsibility is to express an opinion on these financial statements and financial highlights based on our audits.
We conducted our audits in accordance with the standards of the Public Company Accounting Oversight Board (United States). Those standards require that we plan and perform the audits to obtain reasonable assurance about whether the financial statements and financial highlights are free of material misstatement. The Fund is not required to have, nor were we engaged to perform, an audit of its internal control over financial reporting. Our audits included consideration of internal control over financial reporting as a basis for designing audit procedures that are appropriate in the circumstances, but not for the purposes of expressing an opinion on the effectiveness of the Fund’s internal control over financial reporting. Accordingly, we express no such opinion. An audit includes examining, on a test basis, evidence supporting the amounts and disclosures in the financial statements. Our procedures included confirmation of securities owned as of October 31, 2016, by correspondence with the custodian. An audit also includes assessing the accounting principles used and significant estimates made by management, as well as evaluating the overall financial statement presentation. We believe that our audits provide a reasonable basis for our opinion.
In our opinion, the financial statements and financial highlights referred to above present fairly, in all material respects, the financial position of the Hennessy Focus Fund as of October 31, 2016, the results of its operations for the year then ended, the changes in its net assets for each of the two years in the period then ended, and the financial highlights for each of the five years in the period then ended, in conformity with accounting principles generally accepted in the United States of America.
TAIT, WELLER & BAKER LLP
Philadelphia, Pennsylvania
December 22, 2016
HENNESSYFUNDS.COM
| REPORT OF INDEPENDENT REGISTERED PUBLIC ACCOUNTING FIRM/TRUSTEES AND OFFICERS |
Trustees and Officers of the Fund (Unaudited)
The business and affairs of the Fund are managed under the direction of the Board of Trustees of the Trust, and the Board of Trustees elects the Officers of the Trust. Beginning in March 2015, the Board of Trustees has from time to time appointed advisers (“Advisers”) to the Board of Trustees, with the intention of having qualified individuals serve in an advisory capacity in order to garner experience in the mutual fund and asset management industry and be considered as potential Trustees in the future. There are currently three Advisers to the Board of Trustees: Brian Alexander, Doug Franklin, and Claire Knoles. As Advisers, Mr. Alexander, Mr. Franklin, and Ms. Knoles attend meetings of the Board and act as non-voting participants. Information pertaining to the Trustees, Advisers, and the Officers of the Trust is set forth below. The Trustees and Officers serve until their successors are duly elected and qualified or until their earlier death, resignation, or removal. Each of the Trustees oversees 16 Hennessy Funds. Unless otherwise indicated, the address of all persons listed below is 7250 Redwood Boulevard, Suite 200, Novato, CA 94945. The Fund’s Statement of Additional Information includes more information about the persons listed below and is available, without charge, upon request by calling 1-800-966-4354.
| | | | Other |
| | | | Directorships |
| | | | Held Outside |
| Name, (Year of Birth), | | | of Fund |
| and Position Held | Start Date | Principal Occupation(s) | Complex During |
with the Trust | of Service | During Past Five Years | Past Five Years(1) |
| | | | |
| Disinterested Trustees and Advisers | | |
| | | | |
| J. Dennis DeSousa | January 1996 | Mr. DeSousa is a real estate investor. | None. |
| (1936) | | | |
| Trustee | | | |
| | | | |
| Robert T. Doyle | January 1996 | Mr. Doyle has been the Sheriff of | None. |
| (1947) | | Marin County, California since 1996. | |
| Trustee | | | |
| | | | |
| Gerald P. Richardson | May 2004 | Mr. Richardson is an independent | None. |
| (1945) | | consultant in the securities industry. | |
| Trustee | | | |
| | | | |
| Brian Alexander | March 2015 | Mr. Alexander has been employed | None. |
| (1981) | | by Sutter Health Novato Community | |
| Adviser to the Board | | Hospital since 2012, first as an | |
| | | Assistant Administrator and then, | |
| | | beginning in 2013, as the Chief | |
| | | Administrative Officer. From 2011 | |
| | | through 2012, Mr. Alexander was | |
| | | employed by Sutter Health West Bay | |
| | | Region as the Regional Director of | |
| | | Strategic Decision Support. Prior to | |
| | | that, in 2011, he served as the | |
| | | Director of Managed Care | |
| | | Contracting and also the Director of | |
| | | Compensation, Benefits, and | |
| | | Compliance for the Rehabilitation | |
| | | Institute of Chicago. | |
| HENNESSY FUNDS | 1-800-966-4354 | |
| | | | Other |
| | | | Directorships |
| | | | Held Outside |
| Name, (Year of Birth), | | | of Fund |
| and Position Held | Start Date | Principal Occupation(s) | Complex During |
with the Trust | of Service | During Past Five Years | Past Five Years(1) |
| | | | |
| Doug Franklin | March 2016 | Mr. Franklin is a retired insurance | None. |
| (1964) | | industry executive. From 1987 | |
| Adviser to the Board | | through 2015, he was employed by | |
| | | the Allianz-Fireman’s Fund Insurance | |
| | | Company in various positions, | |
| | | including as its Chief Actuary and | |
| | | Chief Risk Officer. | |
| | | | |
| Claire Knoles | December 2015 | Ms. Knoles is a founder of Kiosk and | None. |
| (1974) | | has served as its Chief Operating | |
| Adviser to the Board | | Officer since 2004. Kiosk is a full | |
| | | service marketing agency with | |
| | | offices in the San Francisco Bay | |
| | | Area, Toronto, and Liverpool, UK. | |
| | | | |
Interested Trustee(2) | | | |
| | | | |
| Neil J. Hennessy | January 1996 as | Mr. Hennessy has been employed by | Hennessy |
| (1956) | a Trustee and | Hennessy Advisors, Inc. since 1989 | Advisors, Inc. |
| Trustee, Chairman of | June 2008 as | and currently serves as its President, | |
| the Board, Chief | an Officer | Chairman and Chief Executive Officer. | |
| Investment Officer, | | | |
| Portfolio Manager, | | | |
| and President | | | |
| Name, (Year of Birth), | | |
| and Position Held | Start Date | Principal Occupation(s) |
with the Trust | of Service | During Past Five Years |
| | | |
| Officers | | |
| | | |
| Teresa M. Nilsen | January 1996 | Ms. Nilsen has been employed by Hennessy Advisors, Inc. |
| (1966) | | since 1989 and currently serves as its Executive Vice President, |
| Executive Vice President | | Chief Operations Officer, Chief Financial Officer, and Secretary. |
| and Treasurer | | |
| | | |
| Daniel B. Steadman | March 2000 | Mr. Steadman has been employed by Hennessy Advisors, Inc. |
| (1956) | | since 2000 and currently serves as its Executive Vice President |
| Executive Vice President | | and Chief Compliance Officer. |
| and Secretary | | |
| | | |
| Jennifer Cheskiewicz | June 2013 | Ms. Cheskiewicz has been employed by Hennessy Advisors, Inc. |
| (1977) | | as its General Counsel since June 2013. She previously served |
| Senior Vice President and | | as in-house counsel to Carlson Capital, L.P., an SEC-registered |
| Chief Compliance Officer | | investment advisor to several private funds, from |
| | | February 2010 to May 2013. |
| | | |
| Brian Carlson | December 2013 | Mr. Carlson has been employed by Hennessy Advisors, Inc. |
| (1972) | | since December 2013. Mr. Carlson was previously a co-founder |
| Senior Vice President and | | and principal of Trivium Consultants, LLC from February 2011 |
| Head of Distribution | | through November 2013. |
HENNESSYFUNDS.COM
| TRUSTEES AND OFFICERS OF THE FUND |
| Name, (Year of Birth), | | |
| and Position Held | Start Date | Principal Occupation(s) |
with the Trust | of Service | During Past Five Years |
| | | |
| David Ellison | October 2012 | Mr. Ellison has been employed by Hennessy Advisors, Inc. since |
(1958)(3) | | October 2012. He has served as a Portfolio Manager of the |
| Senior Vice President and | | Hennessy Small Cap Financial Fund, the Hennessy Large Cap |
| Portfolio Manager | | Financial Fund, and the Hennessy Technology Fund since |
| | | inception. Prior to that, Mr. Ellison served as Director, CIO and |
| | | President of FBR Fund Advisers, Inc. from December |
| | | 1999 to October 2012. |
| | | |
| Brian Peery | March 2003 as | Mr. Peery has been employed by Hennessy Advisors, Inc. since |
| (1969) | an Officer and | 2002. He has served as a Portfolio Manager of the Hennessy |
| Senior Vice President and | February 2011 | Cornerstone Growth Fund, the Hennessy Cornerstone Mid Cap |
| Portfolio Manager | as a Co-Portfolio | 30 Fund, the Hennessy Cornerstone Large Growth Fund, the |
| | Manager or | Hennessy Cornerstone Value Fund, the Hennessy Total Return |
| | Portfolio Manager | Fund, and the Hennessy Balanced Fund since October 2014. |
| | | He served as Co-Portfolio Manager of the same funds from |
| | | February 2011 through September 2014. Mr. Peery has also |
| | | served as a Portfolio Manager of the Hennessy Gas Utility Fund |
| | | since February 2015. |
| | | |
| Winsor (Skip) Aylesworth | October 2012 | Mr. Aylesworth has been employed by Hennessy Advisors, Inc. |
(1947)(3) | | since October 2012. He has served as a Portfolio Manager of |
| Vice President and | | the Hennessy Gas Utility Fund since 1998 and as a Portfolio |
| Portfolio Manager | | Manager of the Hennessy Technology Fund since inception. |
| | | Prior to that, Mr. Aylesworth served as Executive Vice President |
| | | of FBR Fund Advisers, Inc. from 1999 to October 2012. |
| | | |
| Ryan Kelley | March 2013 | Mr. Kelley has been employed by Hennessy Advisors, Inc. since |
(1972)(4) | | October 2012. He has served as a Portfolio Manager of the |
| Vice President and | | Hennessy Gas Utility Fund, the Hennessy Small Cap Financial |
| Portfolio Manager | | Fund, and the Hennessy Large Cap Financial Fund since |
| | | October 2014. He served as Co-Portfolio Manager of the same |
| | | funds from March 2013 through September 2014, and as a |
| | | Portfolio Analyst for the Hennessy Funds from October 2012 |
| | | through February 2013. Prior to that, Mr. Kelley served as |
| | | Portfolio Manager of FBR Fund Advisers, Inc. from |
| | | January 2008 to October 2012. |
_______________
(1) | Messrs. DeSousa, Doyle, Hennessy, and Richardson previously served on the Board of Directors of Hennessy Mutual Funds, Inc. (“HMFI”), The Hennessy Funds, Inc. (“HFI”), and Hennessy SPARX Funds Trust (“HSFT”). Pursuant to an internal reorganization effective as of February 28, 2014, the series of HFMI, HFI, and HSFT were reorganized into corresponding series of Hennessy Funds Trust that mirrored them. Subsequent to the reorganization, HFMI, HFI, and HSFT were dissolved. |
(2) | Mr. Hennessy is considered an “interested person,” as defined in the Investment Company Act of 1940, as amended, because he is an officer of the Hennessy Funds. |
(3) | The address of these officers is 101 Federal Street, Suite 1900, Boston, MA 02110. |
(4) | The address of this officer is 1340 Environ Way, Suite 305, Chapel Hill, NC 27517. |
| HENNESSY FUNDS | 1-800-966-4354 | |
Expense Example (Unaudited)
October 31, 2016
As a shareholder of the Fund, you incur two types of costs: (1) transaction costs, including sales charges (loads) on purchase payments, reinvested dividends, or other distributions; redemption fees; and exchange fees; and (2) ongoing costs, including management fees; service fees; and other Fund expenses. This Example is intended to help you understand your ongoing costs (in dollars) of investing in the Fund and to compare these costs with the ongoing costs of investing in other mutual funds. The Example is based on an investment of $1,000 invested at the beginning of the period and held for the entire period from May 1, 2016, through October 31, 2016.
Actual Expenses
The first line of the table below under the “Investor Class” and “Institutional Class” headings provides information about actual account values and actual expenses. Although the Fund charges no sales loads or transaction fees, you will be assessed fees for outgoing wire transfers, returned checks and stop payment orders at prevailing rates charged by U.S. Bancorp Fund Services, LLC, the Fund’s transfer agent. If you request that a redemption be made by wire transfer, currently a $15 fee is charged by the Fund’s transfer agent. IRA accounts will be charged a $15 annual maintenance fee. The example below includes, but is not limited to, management fees, shareholder servicing fees, fund accounting, custody, and transfer agent fees. However, the example below does not include portfolio trading commissions and related expenses, and other extraordinary expenses as determined under generally accepted accounting principles. You may use the information in this line, together with the amount you invested, to estimate the expenses that you paid over the period. Simply divide your account value by $1,000 (for example, an $8,600 account value divided by $1,000 = 8.6), then multiply the result by the number in the first line of the table under the “Investor Class” and “Institutional Class” headings in the column entitled “Expenses Paid During Period” to estimate the expenses you paid on your account during this period.
Hypothetical Example for Comparison Purposes
The second line of the table below under the “Investor Class” and “Institutional Class” headings provides information about hypothetical account values and hypothetical expenses based on the Fund’s actual expense ratios and an assumed rate of return of 5% per year before expenses, which is not the Fund’s actual return. The hypothetical account values and expenses may not be used to estimate the actual ending account balance or expenses you paid for the period. You may use this information to compare the ongoing costs of investing in the Fund and other funds. To do so, compare this 5% hypothetical example with the 5% hypothetical examples that appear in the shareholder reports of the other funds. Please note that the expenses shown in the table are meant to highlight your ongoing costs only and do not reflect any transactional costs, such as sales charges (loads), or exchange fees. Therefore, the second line of the table under the “Investor Class” and “Institutional Class” headings is useful in comparing ongoing costs only, and will not help you determine the relative total costs of owning different funds. In addition, if these transactional costs were included, your costs would have been higher.
HENNESSYFUNDS.COM
| | | | Expenses Paid |
| | Beginning | Ending | During Period(1) |
| | Account Value | Account Value | May 1, 2016 – |
| | May 1, 2016 | October 31, 2016 | October 31, 2016 |
| Investor Class | | | |
| Actual | $1,000.00 | $1,000.10 | $7.44 |
| Hypothetical (5% return before expenses) | $1,000.00 | $1,017.70 | $7.51 |
| | | | |
| Institutional Class | | | |
| Actual | $1,000.00 | $1,001.90 | $5.54 |
| Hypothetical (5% return before expenses) | $1,000.00 | $1,019.61 | $5.58 |
(1) | Expenses are equal to the Fund’s annualized expense ratio of 1.48% for Investor Class shares or 1.10% for Institutional Class shares, as applicable, multiplied by the average account value over the period, multiplied by 184/366 days (to reflect one-half year period). |
| HENNESSY FUNDS | 1-800-966-4354 | |
How to Obtain a Copy of the Fund’s
Proxy Voting Policy and Proxy Voting Records
A description of the policies and procedures the Fund uses to determine how to vote proxies relating to portfolio securities is available without charge: (1) by calling 1-800-966-4354; (2) on the Hennessy Funds’ website at hennessyfunds.com/proxy-voting/policy.fs; or (3) on the U.S. Securities and Exchange Commission’s website at www.sec.gov. The Fund’s proxy voting record is available without charge on both the Hennessy Funds’ website at hennessyfunds.com/proxy-voting/vote.fs and the SEC’s website at www.sec.gov no later than August 31 for the prior 12 months ending June 30.
Quarterly Filings on Form N-Q
The Fund files its complete schedule of portfolio holdings with the SEC for the first and third quarters of each fiscal year on Form N-Q. The Fund’s Form N-Q will be available on the SEC’s website at www.sec.gov. The Fund’s Form N-Q may be reviewed and copied at the SEC’s Public Reference Room in Washington, DC and information on the operation of the Public Reference Room may be obtained by calling 1-800-SEC-0330. Information included in the Fund’s N-Q will also be available upon request by calling 1-800-966-4354.
Federal Tax Distribution Information
(Unaudited)
For the fiscal year ended October 31, 2016, certain dividends paid by the Fund may be subject to a maximum tax rate of 23.8%, as provided for by the Jobs and Growth Tax Relief Reconciliation Act of 2003. The percentage of dividends declared from ordinary income designated as qualified dividend income was 0%.
For corporate shareholders, the percent of ordinary income distributions that qualified for the corporate dividends received deduction for the fiscal year ended October 31, 2016, was 0%.
The percentage of taxable ordinary income distributions that are designated as short-term capital gain distributions under Section 871(k)(2)(C) of the Internal Revenue Code of 1986, as amended, for the Fund was 0%.
Householding
To help keep the Fund’s costs as low as possible, we generally deliver a single copy of most financial reports and prospectuses to shareholders who share an address, even if the accounts are registered under different names. This process, known as “householding,” does not apply to account statements. You may, of course, request an individual copy of a prospectus or financial report at any time. If you would like to receive separate mailings, please call the Administrator at 1-800-261-6950 or 1-414-765-4124 and we will begin individual delivery within 30 days of your request. If your account is held through a financial institution or other intermediary, please contact them directly to request individual delivery.
HENNESSYFUNDS.COM
| PROXY VOTING — PRIVACY POLICY |
Privacy Policy
We collect the following non-public personal information about you:
| | • | information we receive from you on or in applications or other forms, correspondence, or conversations, including, but not limited to, your name, address, phone number, social security number, assets, income, and date of birth; and |
| | | |
| | • | information about your transactions with us, our affiliates, or others, including, but not limited to, your account number and balance, payment history, parties to transactions, cost basis information, and other financial information. |
We do not disclose any non-public personal information about our current or former shareholders to non-affiliated third parties, except as permitted by law. For example, we are permitted by law to disclose all of the information we collect, as described above, to our Transfer Agent to process your transactions. Furthermore, we restrict access to your non-public personal information to those persons who require such information to provide products or services to you. We maintain physical, electronic, and procedural safeguards that comply with federal standards to guard your non-public personal information.
In the event that you hold shares of the Fund through a financial intermediary, including, but not limited to, a broker-dealer, bank or trust company, the privacy policy of your financial intermediary would govern how your non-public personal information would be shared with non-affiliated third parties.
| HENNESSY FUNDS | 1-800-966-4354 | |
(This Page Intentionally Left Blank.)
For information, questions or assistance, please call
The Hennessy Funds
1-800-966-4354 or 1-415-899-1555
INVESTMENT ADVISOR
Hennessy Advisors, Inc.
7250 Redwood Blvd., Suite 200
Novato, California 94945
ADMINISTRATOR,
TRANSFER AGENT,
DIVIDEND PAYING AGENT &
SHAREHOLDER SERVICING AGENT
U.S. Bancorp Fund Services, LLC
P.O. Box 701
Milwaukee, Wisconsin 53201-0701
CUSTODIAN
U.S. Bank N.A.
Custody Operations
1555 North River Center Dr., Suite 302
Milwaukee, Wisconsin 53212
TRUSTEES
Neil J. Hennessy
Robert T. Doyle
J. Dennis DeSousa
Gerald P. Richardson
COUNSEL
Foley & Lardner LLP
777 East Wisconsin Avenue
Milwaukee, Wisconsin 53202-5306
INDEPENDENT REGISTERED
PUBLIC ACCOUNTING FIRM
Tait, Weller & Baker LLP
1818 Market Street, Suite 2400
Philadelphia, Pennsylvania 19103
DISTRIBUTOR
Quasar Distributors, LLC
615 East Michigan Street
Milwaukee, Wisconsin 53202
hennessyfunds.com | 1-800-966-4354
This report has been prepared for shareholders and may be distributed to
others only if preceded or accompanied by a current prospectus.
ANNUAL REPORT
OCTOBER 31, 2016
HENNESSY CORNERSTONE
MID CAP 30 FUND
Investor Class HFMDX
Institutional Class HIMDX
hennessyfunds.com | 1-800-966-4354
(This Page Intentionally Left Blank.)
Contents
| Letter to Shareholders | | | 2 |
| Performance Overview | | | 4 |
| Financial Statements | | | |
| Schedule of Investments | | | 7 |
| Statement of Assets and Liabilities | | | 11 |
| Statement of Operations | | | 12 |
| Statements of Changes in Net Assets | | | 13 |
| Financial Highlights | | | 14 |
| Notes to the Financial Statements | | | 18 |
| Report of Independent Registered Public Accounting Firm | | | 26 |
| Trustees and Officers of the Fund | | | 27 |
| Expense Example | | | 30 |
| Proxy Voting | | | 32 |
| Quarterly Filings on Form N-Q | | | 32 |
| Federal Tax Distribution Information | | | 32 |
| Householding | | | 32 |
| Privacy Policy | | | 33 |
| HENNESSY FUNDS | 1-800-966-4354 | |
December 2016
Dear Hennessy Funds Shareholder:
Over the past year investors here in the U.S. and around the world have weathered a great deal of turmoil, especially in the political arena. Foremost, the bitterly divisive and all-consuming U.S. Presidential election, with its unanticipated outcome, is finally behind us. While the equity markets were jittery at first, they now appear more comfortable with the prospect of a Trump presidency and seem to be looking forward to diminished government regulation and intervention.
The Brexit vote in the U.K. cast a shadow over the European Union’s future. There remains uncertainty over the details and timing of the break and the economic consequences for both Britain and Europe, but early signs suggest the impact on growth in Britain will not be as severe as initially feared.
Additionally, uncertainty over whether the Federal Reserve would raise short-term interest rates has hung over the economy for well over a year now. The effects that higher rates could have on growth, the strength of the U.S. Dollar, corporate profits and loan supply and demand seem to have weighed heavily on investors, causing paralysis and money to remain on the sidelines of the market.
Despite all these concerns, U.S. equity markets have pushed higher, with both the Dow Jones Industrial Average and S&P 500 Index posting returns of approximately 5% during the twelve-month period ended October 31, 2016. The U.S. economy has continued to grow at a respectable annual rate of about 2%, and corporate profits have started to move higher. Today, as of mid-December, bond and Treasury yields have risen a bit from record lows just this summer, and the bond market is finishing the year on slightly rocky footing. Bond yields are still very low relative to historical averages, while the prospective PE multiples for the Dow Jones Industrial Average and S&P 500 Index are just above long-term averages at 18.0x and 18.9x, respectively. We believe that equity valuations could go considerably higher and still be at appropriate levels relative to bond yields. And, while we do expect the Fed to raise interest rates in the coming year, we believe that inflation will stay under control, so that short-term interest rates will not have to rise too fast or too far.
As I reflect over the past twelve months, what I realize is that many of the worries this year are not new. For the past several years, American businesses have operated in an environment characterized by highly partisan politics, mounting regulations, uncertainty over interest rates, and a lack of clarity regarding taxes and healthcare costs. Despite all these headwinds, U.S. corporations have been incredibly resilient and found ways to impress investors. If the newly elected administration follows through on campaign promises of reigning in regulation, lowering taxes for corporations and individuals, or reforming healthcare to drive down costs, then companies, which are already lean, should be able to post higher profits. And, that growth should lead to more jobs and a stronger economy, potentially creating a very positive cycle going forward.
With the bull market in U.S. equities entering its ninth year, many believe the economy is due for a recession and the market is due for a downturn. But, the euphoria that usually accompanies a peak in the market is absent. Since the recovery began after the financial crisis, I have found myself pondering the bull run of 1982 to 2000, powered, in part, by a significant increase in valuations. I believe today’s market displays the fundamentals to sustain a similarly strong and lengthy bull market. Meanwhile, companies are largely profitable and many corporate balance sheets are cash-rich, with
HENNESSYFUNDS.COM
relatively little debt. Unemployment is low and real wages are rising, helping to drive consumption. We are hopeful that these factors will provide support for positive market returns in the year to come.
Thank you for your continued confidence and investment in our funds. If you have any questions or would like to speak with us directly, please don’t hesitate to call us at (800) 966-4354.
Best regards,
Neil J. Hennessy
President and Chief Investment Officer
Past performance does not guarantee future results.
Mutual fund investing involves risk. Principal loss is possible.
Opinions expressed are those of Neil Hennessy and are subject to change, are not guaranteed and should not be considered investment advice.
The Dow Jones Industrial Average and S&P 500 Index are unmanaged indices commonly used to measure the performance of U.S. stocks. One cannot invest directly in an index.
PE, or price to earnings, is calculated by dividing a company’s market price per share by its earnings per share.
| HENNESSY FUNDS | 1-800-966-4354 | |
Performance Overview (Unaudited)
CHANGE IN VALUE OF $10,000 INVESTMENT
This graph illustrates the performance of an initial investment of $10,000 made in the Fund ten years ago and assumes the reinvestment of dividends.
AVERAGE ANNUAL TOTAL RETURN FOR PERIODS ENDED OCTOBER 31, 2016
| | One | Five | Ten |
| | Year | Years | Years |
| Hennessy Cornerstone Mid Cap 30 Fund – | | | |
| Investor Class (HFMDX) | -7.89% | 12.06% | 7.50% |
| Hennessy Cornerstone Mid Cap 30 Fund – | | | |
Institutional Class (HIMDX)(1) | -7.53% | 12.41% | 7.82% |
Russell Midcap® Index | 4.17% | 13.12% | 7.55% |
| S&P 500 Index | 4.51% | 13.57% | 6.70% |
Expense ratios: 1.33% (Investor Class); 0.97% (Institutional Class)
Performance data quoted represents past performance; past performance does not guarantee future results. The investment return and principal value of an investment will fluctuate so that an investor’s shares, when redeemed, may be worth more or less than their original cost. The performance graph and table do not reflect the deduction of taxes that a shareholder would pay on Fund distributions or the redemption of Fund shares. Current performance of the Fund may be lower or higher than the performance quoted. Performance data current to the most recent month end may be obtained by visiting hennessyfunds.com.
The expense ratios presented are from the most recent prospectus.
(1) | The inception date of Institutional Class shares is March 3, 2008. Performance shown prior to the inception of Institutional Class shares reflects the performance of Investor Class shares and includes expenses that are not applicable to and are higher than those of Institutional Class shares. |
PERFORMANCE NARRATIVE
Portfolio Managers Neil J. Hennessy and Brian E. Peery
Performance:
For the twelve-month period ended October 31, 2016, the Investor Class of the Hennessy Cornerstone Mid Cap 30 Fund returned -7.89%, underperforming both the Russell Midcap® Index and the S&P 500 Index, which returned 4.17% and 4.51% for the same period, respectively.
HENNESSYFUNDS.COM
The Fund’s underperformance relative to its benchmark index was due to stock selection and an overweight position within the Consumer Discretionary sector. Express, Inc., GameStop Corporation, AutoNation, Inc. and Lithia Motors, Inc. all contributed significantly to the underperformance over the period. Price weakness in three other investments, JetBlue Airways Corporation, Ciena Corporation and Sinclair Broadcast Group, largely accounted for the remaining underperformance. We no longer hold any of the stocks mentioned.
Portfolio Strategy:
We believe that limiting the Fund to 30 stocks produces a relatively concentrated portfolio, where individual stock performance can influence the performance of the portfolio as a whole, while at the same time providing what we consider to be ample diversification. Additionally, the Fund employs a strict price-to-sales ratio limit of 1.5, resulting in the Fund investing in what we deem to be reasonably valued stocks rather than those whose price may be predicated on expected future growth. We believe this “growth at a reasonable price” stock selection approach has served us well over time, and we wholeheartedly support utilizing this methodology when investing.
In September, the Fund’s investment advisor purchased the assets related to the management of two funds previously managed by Westport Advisers, LLC (the “Westport Funds”), and reorganized the assets of the Westport Funds into the Fund. The securities held by the Westport Funds were added to the Fund’s portfolio on September 26, 2016, and were held in the portfolio as of the end of the Fund’s fiscal year. The Fund’s policy with regards to stock holdings acquired in a reorganization is to make appropriate purchase and sale decisions in conjunction with the Fund’s annual rebalance. The Fund’s annual rebalance took place in November, during which time the number of stock holdings in the Fund was reduced to 30.*
Market Outlook:
Over the twelve-month period ended October 31, 2016, U.S. equities produced moderate, positive returns. The period was once again marked by a great deal of volatility, with major market indices dropping more than 10% at one point early in the year before recovering all of their losses. Throughout this period, there have been concerns about interest rates, commodity prices, economic growth (both domestic and international) and the U.S. Presidential election. Many, if not all, of these concerns still exist in the marketplace today, but we have reasons to be hopeful for the year to come.
First, while corporate profits have been on a gentle slide downwards since the fourth quarter of 2014, market analysts are now forecasting a return to growth in profits in the fourth quarter of this year. We believe these forecasts have a good chance of being proved correct. Second, mergers and acquisitions have been strong and steady this year and we believe such activity will continue next year, helping drive revenue and earnings for the acquiring companies. Third, we do not believe the majority of stocks are expensive at this point, though many are probably fairly valued. The Dow Jones Industrial Average and the S&P 500 Index have forward PE ratios of roughly 18x and 19x, respectively, close to long-term averages although slightly higher than six months ago. Corporate balance sheets appear to be in excellent shape, and while executives have shown some reluctance to increase capital spending beyond maintenance levels this cycle, we believe companies outside of the Energy sector will eventually start investing for expansion. Overall, we believe the basic fundamentals of the market are attractive, and we continue to be optimistic about the possibility of further moderate market advances over the course of next year.
| HENNESSY FUNDS | 1-800-966-4354 | |
Investment Outlook:
We continue to believe that there are good investment opportunities among mid-cap stocks. Many investors gravitated away from the stocks of small and mid sized companies last year as they sought safety in larger, more well-established businesses in a year of much political uncertainty. Many of these smaller and mid-sized companies have purely domestic businesses, which are benefiting from steady, albeit slow, economic growth at home, low inflation and low energy prices. With consumer debt levels falling and wage growth finally starting to accelerate, we are expecting a good year for domestically oriented small and mid-cap stocks. We believe that investors will also begin to favor stocks of small and mid sized companies as valuations of larger capitalization stocks continue to rise, leaving small and mid-cap stocks looking attractive on a relative basis.
We remain pleased with the positioning of the portfolio, which remains overweight in cyclical stocks, which generally fare better in a period of economic expansion, and domestically oriented stocks that we believe are reasonably valued and appear poised for growth. Relative to the Fund’s benchmarks, the portfolio remains overweight in both the Consumer Discretionary and Industrial sectors, and we think that these areas of the market offer great growth potential in 2017.
______________
| * | The Fund’s most recent holdings list, including all of the stocks in the rebalanced portfolio, may be obtained by visiting hennessyfunds.com. |
Opinions expressed are those of the Portfolio Managers as of the date written and are subject to change, are not guaranteed, and should not be considered investment advice or an indication of trading intent.
The Russell Midcap® Index is an index commonly used to measure the performance of U.S. medium-capitalization stocks. The S&P 500 Index and Dow Jones Industrial Average are unmanaged indices commonly used to measure the performance of U.S. stocks. One cannot invest directly in an index.
The Fund invests in small and medium capitalized companies, which may have limited liquidity and greater price volatility than large capitalization companies. The Fund’s formula-based strategy may cause the Fund to buy or sell securities at times when it may not be advantageous. Please see the Fund’s prospectus for a more complete discussion of these and other risks.
References to specific securities should not be considered a recommendation to buy or sell any security. Fund holdings and sector allocations are subject to change. Please refer to the Schedule of Investments included in this report for additional portfolio information.
Diversification does not assure a profit or protect against loss in a declining market. Price-to-sales ratio is a tool for calculating a stock’s valuation relative to other companies. It is calculated by dividing a company’s market price per share by its revenue per share. PE, or price to earnings, is calculated by dividing a company’s market price per share by its earnings per share. Earnings growth is not a measure of the Fund’s future performance.
HENNESSYFUNDS.COM
| PERFORMANCE OVERVIEW/SCHEDULE OF INVESTMENTS |
Financial Statements
Schedule of Investments as of October 31, 2016 |
HENNESSY CORNERSTONE MID CAP 30 FUND
(% of Net Assets)
| TOP TEN HOLDINGS (EXCLUDING CASH/CASH EQUIVALENTS) | % NET ASSETS |
| | |
| Ingredion, Inc. | 3.57% |
| | |
| The Interpublic Group of Companies, Inc. | 3.56% |
| | |
| Hawaiian Holdings, Inc. | 3.33% |
| | |
| Synopsys, Inc. | 3.12% |
| | |
| Atmos Energy Corp. | 3.08% |
| | |
| SYNNEX Corp. | 3.00% |
| | |
| Pool Corp. | 2.95% |
| | |
| Avery Dennison Corp. | 2.77% |
| | |
| Tech Data Corp. | 2.72% |
| | |
| Casey's General Stores, Inc. | 2.70% |
Note: For presentation purposes, the Fund has grouped some of the industry categories. For purposes of categorizing securities for compliance with Section 8(b)(1) of the Investment Company Act of 1940, as amended, the Fund uses more specific industry classifications.
| HENNESSY FUNDS | 1-800-966-4354 | |
| | COMMON STOCKS – 99.72% | | Number | | | | | | % of | |
| | | | of Shares | | | Value | | | Net Assets | |
| | Consumer Discretionary – 33.66% | | | | | | | | | |
| | AutoNation, Inc. (a) | | | 510,500 | | | $ | 22,395,635 | | | | 1.81 | % |
| | Big Lots, Inc. | | | 204,800 | | | | 8,888,320 | | | | 0.72 | % |
| | Boyd Gaming Corp. (a) | | | 1,584,600 | | | | 28,300,956 | | | | 2.28 | % |
| | Express, Inc. (a) | | | 1,662,900 | | | | 19,988,058 | | | | 1.61 | % |
| | GameStop Corp., Class A | | | 700,400 | | | | 16,844,620 | | | | 1.36 | % |
| | JC Penney Co., Inc. (a) | | | 3,597,600 | | | | 30,903,384 | | | | 2.49 | % |
| | Lear Corp. | | | 256,000 | | | | 31,431,680 | | | | 2.53 | % |
| | Lennar Corp. | | | 642,500 | | | | 26,785,825 | | | | 2.16 | % |
| | Lithia Motors, Inc., Class A | | | 275,418 | | | | 23,625,356 | | | | 1.91 | % |
| | Mohawk Industries, Inc. (a) | | | 13,400 | | | | 2,469,620 | | | | 0.20 | % |
| | NVR, Inc. (a) | | | 19,614 | | | | 29,872,122 | | | | 2.41 | % |
| | Pool Corp. | | | 395,000 | | | | 36,569,100 | | | | 2.95 | % |
| | Ross Stores, Inc. | | | 264,600 | | | | 16,548,084 | | | | 1.33 | % |
| | Sinclair Broadcast Group Inc. | | | 1,032,600 | | | | 25,918,260 | | | | 2.09 | % |
| | The Goodyear Tire & Rubber Co. | | | 965,700 | | | | 28,034,271 | | | | 2.26 | % |
| | The Interpublic Group of Companies, Inc. | | | 1,969,779 | | | | 44,103,352 | | | | 3.56 | % |
| | Wayfair, Inc., Class A (a) | | | 741,757 | | | | 24,722,761 | | | | 1.99 | % |
| | | | | | | | | 417,401,404 | | | | 33.66 | % |
| | | | | | | | | | | | | | |
| | Consumer Staples – 7.08% | | | | | | | | | | | | |
| | Casey's General Stores, Inc. | | | 295,900 | | | | 33,433,741 | | | | 2.70 | % |
| | CVS Health Corp. | | | 119,690 | | | | 10,065,929 | | | | 0.81 | % |
| | Ingredion, Inc. | | | 337,700 | | | | 44,296,109 | | | | 3.57 | % |
| | | | | | | | | 87,795,779 | | | | 7.08 | % |
| | | | | | | | | | | | | | |
| | Energy – 2.52% | | | | | | | | | | | | |
| | Anadarko Petroleum Corp. | | | 115,800 | | | | 6,883,152 | | | | 0.56 | % |
| | EOG Resources, Inc. | | | 269,500 | | | | 24,368,190 | | | | 1.96 | % |
| | | | | | | | | 31,251,342 | | | | 2.52 | % |
| | | | | | | | | | | | | | |
| | Financials – 5.11% | | | | | | | | | | | | |
| | AmTrust Financial Services, Inc. | | | 955,000 | | | | 25,202,450 | | | | 2.03 | % |
| | Hanover Insurance Group, Inc. | | | 375,200 | | | | 28,586,488 | | | | 2.31 | % |
| | Willis Towers Watson PLC (b) | | | 75,800 | | | | 9,543,220 | | | | 0.77 | % |
| | | | | | | | | 63,332,158 | | | | 5.11 | % |
| | | | | | | | | | | | | | |
| | Health Care – 6.64% | | | | | | | | | | | | |
| | Abbott Laboratories | | | 122,100 | | | | 4,791,204 | | | | 0.39 | % |
| | Charles River Laboratories International, Inc. (a) | | | 105,300 | | | | 7,990,164 | | | | 0.64 | % |
The accompanying notes are an integral part of these financial statements.
HENNESSYFUNDS.COM
| | COMMON STOCKS | | Number | | | | | | % of | |
| | | | of Shares | | | Value | | | Net Assets | |
| | Health Care (Continued) | | | | | | | | | |
| | Owens & Minor, Inc. | | | 892,700 | | | $ | 28,968,115 | | | | 2.33 | % |
| | Universal Health Services, Inc., Class B | | | 197,427 | | | | 23,831,413 | | | | 1.92 | % |
| | Varian Medical Systems, Inc. (a) | | | 185,500 | | | | 16,830,415 | | | | 1.36 | % |
| | | | | | | | | 82,411,311 | | | | 6.64 | % |
| | | | | | | | | | | | | | |
| | Industrials – 14.96% | | | | | | | | | | | | |
| | Dycom Industries, Inc. (a) | | | 403,400 | | | | 31,033,562 | | | | 2.50 | % |
| | Expeditors International of Washington, Inc. | | | 636,700 | | | | 32,770,949 | | | | 2.64 | % |
| | FedEx Corp. | | | 90,500 | | | | 15,775,960 | | | | 1.27 | % |
| | Hawaiian Holdings, Inc. (a) | | | 916,000 | | | | 41,242,900 | | | | 3.33 | % |
| | JetBlue Airways Corp. (a) | | | 1,257,500 | | | | 21,981,100 | | | | 1.77 | % |
| | ManpowerGroup, Inc. | | | 348,300 | | | | 26,749,440 | | | | 2.16 | % |
| | Rockwell Collins, Inc. | | | 59,000 | | | | 4,974,880 | | | | 0.40 | % |
| | United Rentals, Inc. (a) | | | 146,100 | | | | 11,053,926 | | | | 0.89 | % |
| | | | | | | | | 185,582,717 | | | | 14.96 | % |
| | | | | | | | | | | | | | |
| | Information Technology – 22.66% | | | | | | | | | | | | |
| | Amphenol Corp., Class A | | | 248,500 | | | | 16,383,605 | | | | 1.32 | % |
| | CACI International, Inc., Class A (a) | | | 29,400 | | | | 2,876,790 | | | | 0.23 | % |
| | CDW Corp. | | | 724,500 | | | | 32,537,295 | | | | 2.62 | % |
| | Check Point Software Technologies Ltd. (a)(b) | | | 227,500 | | | | 19,237,400 | | | | 1.55 | % |
| | Ciena Corp. (a) | | | 1,323,900 | | | | 25,657,182 | | | | 2.07 | % |
| | IPG Photonics Corp. (a) | | | 128,900 | | | | 12,504,589 | | | | 1.01 | % |
| | Mastercard, Inc., Class A | | | 122,100 | | | | 13,067,142 | | | | 1.05 | % |
| | PTC, Inc. (a) | | | 699,200 | | | | 33,170,048 | | | | 2.68 | % |
| | Rogers Corp. (a) | | | 136,900 | | | | 7,451,467 | | | | 0.60 | % |
| | SYNNEX Corp. | | | 363,000 | | | | 37,222,020 | | | | 3.00 | % |
| | Synopsys, Inc. (a) | | | 652,412 | | | | 38,694,556 | | | | 3.12 | % |
| | Tech Data Corp. (a) | | | 437,500 | | | | 33,696,250 | | | | 2.72 | % |
| | Teradata Corp. (a) | | | 175,380 | | | | 4,728,245 | | | | 0.38 | % |
| | Zebra Technologies Corp., Class A (a) | | | 57,700 | | | | 3,798,968 | | | | 0.31 | % |
| | | | | | | | | 281,025,557 | | | | 22.66 | % |
| | | | | | | | | | | | | | |
| | Materials – 4.01% | | | | | | | | | | | | |
| | Agrium, Inc. (b) | | | 29,400 | | | | 2,699,508 | | | | 0.22 | % |
| | Avery Dennison Corp. | | | 492,300 | | | | 34,357,617 | | | | 2.77 | % |
| | FMC Corp. | | | 269,500 | | | | 12,636,855 | | | | 1.02 | % |
| | | | | | | | | 49,693,980 | | | | 4.01 | % |
The accompanying notes are an integral part of these financial statements.
| HENNESSY FUNDS | 1-800-966-4354 | |
| | COMMON STOCKS | | Number | | | | | | % of | |
| | | | of Shares | | | Value | | | Net Assets | |
| | Utilities – 3.08% | | | | | | | | | |
| | Atmos Energy Corp. | | | 513,100 | | | $ | 38,169,509 | | | | 3.08 | % |
| | | | | | | | | | | | | | |
| | Total Common Stocks | | | | | | | | | | | | |
| | (Cost $1,042,234,381) | | | | | | | 1,236,663,757 | | | | 99.72 | % |
| | | | | | | | | | | | | | |
| | SHORT-TERM INVESTMENTS – 0.75% | | | | | | | | | | | | |
| | | | | | | | | | | | | | |
| | Money Market Funds – 0.75% | | | | | | | | | | | | |
| | Fidelity Government Portfolio, Institutional Class, 0.27% (c) | | | 9,291,972 | | | | 9,291,972 | | | | 0.75 | % |
| | | | | | | | | | | | | | |
| | Total Short-Term Investments | | | | | | | | | | | | |
| | (Cost $9,291,972) | | | | | | | 9,291,972 | | | | 0.75 | % |
| | | | | | | | | | | | | | |
| | Total Investments | | | | | | | | | | | | |
| | (Cost $1,051,526,353) – 100.47% | | | | | | | 1,245,955,729 | | | | 100.47 | % |
| | | | | | | | | | | | | | |
| | Liabilities in Excess of Other Assets – (0.47)% | | | | | | | (5,839,078 | ) | | | (0.47 | )% |
| | | | | | | | | | | | | | |
| | TOTAL NET ASSETS – 100.00% | | | | | | $ | 1,240,116,651 | | | | 100.00 | % |
Percentages are stated as a percent of net assets.
| (a) | Non-income producing security. |
| (b) | U.S. traded security of a foreign corporation. |
| (c) | The rate listed is the fund's 7-day yield as of October 31, 2016. |
Summary of Fair Value Exposure at October 31, 2016
The following is a summary of the inputs used to value the Fund's net assets as of October, 2016 (see Note 3 in the accompanying notes to the financial statements):
| Common Stocks | | Level 1 | | | Level 2 | | | Level 3 | | | Total | |
| Consumer Discretionary | | $ | 417,401,404 | | | $ | — | | | $ | — | | | $ | 417,401,404 | |
| Consumer Staples | | | 87,795,779 | | | | — | | | | — | | | | 87,795,779 | |
| Energy | | | 31,251,342 | | | | — | | | | — | | | | 31,251,342 | |
| Financials | | | 63,332,158 | | | | — | | | | — | | | | 63,332,158 | |
| Health Care | | | 82,411,311 | | | | — | | | | — | | | | 82,411,311 | |
| Industrials | | | 185,582,717 | | | | — | | | | — | | | | 185,582,717 | |
| Information Technology | | | 281,025,557 | | | | — | | | | — | | | | 281,025,557 | |
| Materials | | | 49,693,980 | | | | — | | | | — | | | | 49,693,980 | |
| Utilities | | | 38,169,509 | | | | — | | | | — | | | | 38,169,509 | |
| Total Common Stocks | | $ | 1,236,663,757 | | | $ | — | | | $ | — | | | $ | 1,236,663,757 | |
| Short-Term Investments | | | | | | | | | | | | | | | | |
| Money Market Funds | | $ | 9,291,972 | | | $ | — | | | $ | — | | | $ | 9,291,972 | |
| Total Short-Term Investments | | $ | 9,291,972 | | | $ | — | | | $ | — | | | $ | 9,291,972 | |
| Total Investments | | $ | 1,245,955,729 | | | $ | — | | | $ | — | | | $ | 1,245,955,729 | |
Transfers between levels are recognized at the end of the reporting period. During the year ended October 31, 2016, the Fund recognized no transfers between levels.
The accompanying notes are an integral part of these financial statements.
HENNESSYFUNDS.COM
| SCHEDULE OF INVESTMENTS/STATEMENT OF ASSETS AND LIABILITIES |
Financial Statements
Statement of Assets and Liabilities as of October 31, 2016 |
| ASSETS: | | | |
| Investments in securities, at value (cost $1,051,526,353) | | $ | 1,245,955,729 | |
| Dividends and interest receivable | | | 282,563 | |
| Receivable for fund shares sold | | | 831,788 | |
| Prepaid expenses and other assets | | | 58,537 | |
| Total Assets | | | 1,247,128,617 | |
| | | | | |
| LIABILITIES: | | | | |
| Payable for fund shares redeemed | | | 5,538,041 | |
| Payable to advisor | | | 851,049 | |
| Payable to administrator | | | 210,799 | |
| Payable to auditor | | | 22,881 | |
| Accrued distribution fees | | | 83,969 | |
| Accrued service fees | | | 59,264 | |
| Accrued interest payable | | | 1,780 | |
| Accrued trustees fees | | | 3,898 | |
| Accrued expenses and other payables | | | 240,285 | |
| Total Liabilities | | | 7,011,966 | |
| NET ASSETS | | $ | 1,240,116,651 | |
| | | | | |
| NET ASSETS CONSIST OF: | | | | |
| Capital stock | | $ | 1,300,283,246 | |
| Accumulated net investment loss | | | (1,670,147 | ) |
| Accumulated net realized gain on investments | | | 4,701,455 | |
| Unrealized net appreciation on investments | | | (63,197,903 | ) |
| Total Net Assets | | $ | 1,240,116,651 | |
| | | | | |
| NET ASSETS | | | | |
| Investor Class: | | | | |
| Shares authorized (no par value) | | Unlimited | |
| Net assets applicable to outstanding Investor Class shares | | $ | 485,147,576 | |
| Shares issued and outstanding | | | 26,408,820 | |
| Net asset value, offering price and redemption price per share | | $ | 18.37 | |
| | | | | |
| Institutional Class: | | | | |
| Shares authorized (no par value) | | Unlimited | |
| Net assets applicable to outstanding Institutional Class shares | | $ | 754,969,075 | |
| Shares issued and outstanding | | | 40,167,581 | |
| Net asset value, offering price and redemption price per share | | $ | 18.80 | |
The accompanying notes are an integral part of these financial statements.
| HENNESSY FUNDS | 1-800-966-4354 | |
Financial Statements
Statement of Operations for the year ended October 31, 2016 |
| INVESTMENT INCOME: | | | |
Dividend income(1) | | $ | 11,472,235 | |
| Interest income | | | 39,471 | |
| Total investment income | | | 11,511,706 | |
| | | | | |
| EXPENSES: | | | | |
| Investment advisory fees (See Note 5) | | | 7,856,506 | |
| Sub-transfer agent expenses – Investor Class (See Note 5) | | | 1,420,424 | |
| Sub-transfer agent expenses – Institutional Class (See Note 5) | | | 391,620 | |
| Administration, fund accounting, custody and transfer agent fees (See Note 5) | | | 1,034,908 | |
| Distribution fees – Investor Class (See Note 5) | | | 963,758 | |
| Service fees – Investor Class (See Note 5) | | | 642,505 | |
| Federal and state registration fees | | | 152,884 | |
| Reports to shareholders | | | 125,770 | |
| Audit fees | | | 23,842 | |
| Compliance expense (See Note 5) | | | 23,709 | |
| Trustees' fees and expenses | | | 18,314 | |
| Interest expense (See Note 7) | | | 14,025 | |
| Legal fees | | | 12,786 | |
| Other expenses | | | 54,880 | |
| Total expenses | | | 12,735,931 | |
| NET INVESTMENT LOSS | | $ | (1,224,225 | ) |
| | | | | |
| REALIZED AND UNREALIZED GAINS (LOSSES): | | | | |
| Net realized gain on investments | | $ | 5,942,875 | |
| Net change in unrealized appreciation on investments | | | (104,787,882 | ) |
| Net loss on investments | | | (98,845,007 | ) |
| NET DECREASE IN NET ASSETS RESULTING FROM OPERATIONS | | $ | (100,069,232 | ) |
(1) | Net of foreign taxes withheld of $4,594. |
The accompanying notes are an integral part of these financial statements.
HENNESSYFUNDS.COM
| STATEMENT OF OPERATIONS/STATEMENTS OF CHANGES IN NET ASSETS |
Financial Statements
| Statements of Changes in Net Assets |
| | | Year Ended | | | Year Ended | |
| | | October 31, 2016 | | | October 31, 2015 | |
| OPERATIONS: | | | | | | |
| Net investment income (loss) | | $ | (1,224,225 | ) | | $ | 1,830,521 | |
| Net realized gain on investments | | | 5,942,875 | | | | 8,189,909 | |
| Net change in unrealized appreciation on investments | | | (104,787,882 | ) | | | 19,847,205 | |
| Net increase in net assets resulting from operations | | | (100,069,232 | ) | | | 29,867,635 | |
| | | | | | | | | |
| DISTRIBUTIONS TO SHAREHOLDERS FROM: | | | | | | | | |
| Net investment income | | | | | | | | |
| Investor Class | | | (983,702 | ) | | | — | |
| Institutional Class | | | (1,004,373 | ) | | | — | |
| Net realized gains | | | | | | | | |
| Investor Class | | | (5,450,291 | ) | | | (16,025,638 | ) |
| Institutional Class | | | (2,201,769 | ) | | | (4,641,869 | ) |
| Total distributions | | | (9,640,135 | ) | | | (20,667,507 | ) |
| | | | | | | | | |
| CAPITAL SHARE TRANSACTIONS: | | | | | | | | |
| Proceeds from shares issued in the Reorganization – | | | | | | | | |
| Institutional Class (See Note 8) | | | 434,529,979 | | | | — | |
| Proceeds from shares subscribed – Investor Class | | | 281,456,239 | | | | 626,037,117 | |
| Proceeds from shares subscribed – Institutional Class | | | 340,887,989 | | | | 265,472,593 | |
| Dividends reinvested – Investor Class | | | 6,357,569 | | | | 15,829,426 | |
| Dividends reinvested – Institutional Class | | | 2,729,983 | | | | 4,211,897 | |
| Cost of shares redeemed – Investor Class | | | (500,557,212 | ) | | | (143,926,929 | ) |
| Cost of shares redeemed – Institutional Class | | | (287,519,806 | ) | | | (38,580,417 | ) |
| Net increase in net assets derived | | | | | | | | |
| from capital share transactions | | | 277,884,741 | | | | 729,043,687 | |
| TOTAL INCREASE IN NET ASSETS | | | 168,175,374 | | | | 738,243,815 | |
| | | | | | | | | |
| NET ASSETS: | | | | | | | | |
| Beginning of year | | | 1,071,941,277 | | | | 333,697,462 | |
| End of year | | $ | 1,240,116,651 | | | $ | 1,071,941,277 | |
| Undistributed net investment | | | | | | | | |
| income (loss), end of year | | $ | (1,670,147 | ) | | $ | 797,037 | |
| | | | | | | | | |
| CHANGES IN SHARES OUTSTANDING: | | | | | | | | |
| Shares issued in the Reorganization – Institutional Class | | | 22,309,002 | | | | — | |
| Shares sold – Investor Class | | | 15,025,505 | | | | 30,736,606 | |
| Shares sold – Institutional Class | | | 17,897,465 | | | | 12,673,580 | |
| Shares issued to holders as reinvestment | | | | | | | | |
| of dividends – Investor Class | | | 332,871 | | | | 847,400 | |
| Shares issued to holders as reinvestment | | | | | | | | |
| of dividends – Institutional Class | | | 140,179 | | | | 221,213 | |
| Shares redeemed – Investor Class | | | (27,012,121 | ) | | | (7,112,737 | ) |
| Shares redeemed – Institutional Class | | | (15,071,054 | ) | | | (1,904,158 | ) |
| Net increase in shares outstanding | | | 13,621,847 | | | | 35,461,904 | |
The accompanying notes are an integral part of these financial statements.
| HENNESSY FUNDS | 1-800-966-4354 | |
Financial Statements
For an Investor Class share outstanding throughout each year
PER SHARE DATA:
Net asset value, beginning of year
Income from investment operations:
Net investment income (loss)
Net realized and unrealized gains (losses) on investments
Total from investment operations
Less distributions:
Dividends from net investment income
Dividends from net realized gains
Total distributions
Net asset value, end of year
TOTAL RETURN
SUPPLEMENTAL DATA AND RATIOS:
Net assets, end of year (millions)
Ratio of expenses to average net assets
Ratio of net investment income (loss) to average net assets
Portfolio turnover rate(1)
(1) | Portfolio turnover is calculated on the basis of the Fund as a whole. |
The accompanying notes are an integral part of these financial statements.
HENNESSYFUNDS.COM
| FINANCIAL HIGHLIGHTS — INVESTOR CLASS |
| Year Ended October 31, | |
| 2016 | | | 2015 | | | 2014 | | | 2013 | | | 2012 | |
| | | | | | | | | | | | | | |
| $ | 20.12 | | | $ | 19.00 | | | $ | 17.32 | | | $ | 14.06 | | | $ | 12.15 | |
| | | | | | | | | | | | | | | | | | | |
| | | | | | | | | | | | | | | | | | | |
| | (0.07 | ) | | | 0.10 | | | | (0.05 | ) | | | 0.09 | | | | 0.08 | |
| | (1.51 | ) | | | 2.16 | | | | 3.04 | | | | 3.35 | | | | 1.83 | |
| | (1.58 | ) | | | 2.26 | | | | 2.99 | | | | 3.44 | | | | 1.91 | |
| | | | | | | | | | | | | | | | | | | |
| | | | | | | | | | | | | | | | | | | |
| | (0.03 | ) | | | — | | | | (0.05 | ) | | | (0.18 | ) | | | — | |
| | (0.14 | ) | | | (1.14 | ) | | | (1.26 | ) | | | — | | | | — | |
| | (0.17 | ) | | | (1.14 | ) | | | (1.31 | ) | | | (0.18 | ) | | | — | |
| $ | 18.37 | | | $ | 20.12 | | | $ | 19.00 | | | $ | 17.32 | | | $ | 14.06 | |
| | | | | | | | | | | | | | | | | | | |
| | (7.89 | )% | | | 12.35 | % | | | 18.25 | % | | | 24.78 | % | | | 15.72 | % |
| | | | | | | | | | | | | | | | | | | |
| | | | | | | | | | | | | | | | | | | |
| $ | 485.15 | | | $ | 765.90 | | | $ | 258.17 | | | $ | 159.45 | | | $ | 145.85 | |
| | 1.35 | % | | | 1.17 | % | | | 1.25 | % | | | 1.31 | % | | | 1.37 | % |
| | (0.24 | )% | | | 0.27 | % | | | (0.47 | )% | | | 0.51 | % | | | 0.59 | % |
| | 108 | % | | | 5 | % | | | 132 | % | | | 212 | % | | | 25 | % |
The accompanying notes are an integral part of these financial statements.
| HENNESSY FUNDS | 1-800-966-4354 | |
Financial Statements
For an Institutional Class share outstanding throughout each year
PER SHARE DATA:
Net asset value, beginning of year
Income from investment operations:
Net investment income (loss)
Net realized and unrealized gains (losses) on investments
Total from investment operations
Less distributions:
Dividends from net investment income
Dividends from net realized gains
Total distributions
Net asset value, end of year
TOTAL RETURN
SUPPLEMENTAL DATA AND RATIOS:
Net assets, end of year (millions)
Ratio of expenses to average net assets:
Before reimbursement
After reimbursement
Ratio of net investment income (loss) to average net assets:
Before reimbursement
After reimbursement
Portfolio turnover rate(2)
(1) | Amount is less than $0.01. |
(2) | Portfolio turnover is calculated on the basis of the Fund as a whole. |
The accompanying notes are an integral part of these financial statements.
HENNESSYFUNDS.COM
| FINANCIAL HIGHLIGHTS — INSTITUTIONAL CLASS |
| Year Ended October 31, | |
| 2016 | | | 2015 | | | 2014 | | | 2013 | | | 2012 | |
| | | | | | | | | | | | | | |
| $ | 20.55 | | | $ | 19.36 | | | $ | 17.62 | | | $ | 14.31 | | | $ | 12.32 | |
| | | | | | | | | | | | | | | | | | | |
| | | | | | | | | | | | | | | | | | | |
| | 0.00 | (1) | | | (0.03 | ) | | | (0.08 | ) | | | 0.14 | | | | 0.09 | |
| | (1.54 | ) | | | 2.38 | | | | 3.17 | | | | 3.41 | | | | 1.90 | |
| | (1.54 | ) | | | 2.35 | | | | 3.09 | | | | 3.55 | | | | 1.99 | |
| | | | | | | | | | | | | | | | | | | |
| | | | | | | | | | | | | | | | | | | |
| | (0.06 | ) | | | — | | | | (0.09 | ) | | | (0.24 | ) | | | — | |
| | (0.15 | ) | | | (1.16 | ) | | | (1.26 | ) | | | — | | | | — | |
| | (0.21 | ) | | | (1.16 | ) | | | (1.35 | ) | | | (0.24 | ) | | | — | |
| $ | 18.80 | | | $ | 20.55 | | | $ | 19.36 | | | $ | 17.62 | | | $ | 14.31 | |
| | | | | | | | | | | | | | | | | | | |
| | (7.53 | )% | | | 12.62 | % | | | 18.57 | % | | | 25.15 | % | | | 16.15 | % |
| | | | | | | | | | | | | | | | | | | |
| | | | | | | | | | | | | | | | | | | |
| $ | 754.97 | | | $ | 306.04 | | | $ | 75.53 | | | $ | 51.19 | | | $ | 41.62 | |
| | | | | | | | | | | | | | | | | | | |
| | 0.97 | % | | | 0.96 | % | | | 1.07 | % | | | 1.11 | % | | | 1.16 | % |
| | 0.97 | % | | | 0.97 | % | | | 0.98 | % | | | 0.98 | % | | | 0.98 | % |
| | | | | | | | | | | | | | | | | | | |
| | 0.07 | % | | | 0.41 | % | | | (0.29 | )% | | | 0.71 | % | | | 0.90 | % |
| | 0.07 | % | | | 0.41 | % | | | (0.20 | )% | | | 0.84 | % | | | 1.08 | % |
| | 108 | % | | | 5 | % | | | 132 | % | | | 212 | % | | | 25 | % |
The accompanying notes are an integral part of these financial statements.
| HENNESSY FUNDS | 1-800-966-4354 | |
Financial Statements
Notes to the Financial Statements October 31, 2016 |
1). ORGANIZATION
The Hennessy Cornerstone Mid Cap 30 Fund (the “Fund”) is a series of Hennessy Funds Trust (the “Trust”), which was organized as a Delaware statutory trust on September 17, 1992. The Fund is an open-end management investment company registered under the Investment Company Act of 1940, as amended. The Fund is a successor to a fund with the same name (the “Predecessor Fund”) that was a series of Hennessy Mutual Funds, Inc., a Maryland corporation, pursuant to a reorganization that took place after the close of business on February 28, 2014. Prior to February 28, 2014, the Fund had no investment operations. As a result of the reorganization, holders of Investor Class shares of the Predecessor Fund received Investor Class shares of the Fund (the Investor Class shares of the Fund are the successor to the accounting and performance information of the corresponding shares of the Predecessor Fund), and holders of Institutional Class shares of the Predecessor Fund received Institutional Class shares of the Fund (the Institutional Class shares of the Fund are the successor to the accounting and performance information of the corresponding shares of the Predecessor Fund). The investment objective of the Fund is long-term growth of capital. The Fund is a diversified fund.
The Fund offers Investor Class and Institutional Class shares. Each class of shares differs principally in its respective administration, 12b-1 distribution and service, shareholder servicing, and transfer agent expenses (there are no sales charges). Each class has identical rights to earnings, assets, and voting privileges, except for class-specific expenses and exclusive rights to vote on matters affecting only an individual class.
As an investment company, the Fund follows the investment company accounting and reporting guidance of the Financial Accounting Standards Board (“FASB”) Accounting Standard Codification Topic 946 “Financial Services—Investment Companies.”
2). SIGNIFICANT ACCOUNTING POLICIES
The following is a summary of significant accounting policies consistently followed by the Fund in the preparation of the financial statements. These policies conform with U.S. generally accepted accounting principles (“GAAP”).
| a). | Investment Valuation – All investments in securities are recorded at their estimated fair value, as described in Note 3. |
| | |
| b). | Federal Income Taxes – No provision for federal income taxes or excise taxes has been made since the Fund has elected to be taxed as a “regulated investment company” and intends to distribute substantially all of its taxable income to its shareholders and otherwise comply with the provisions of the Internal Revenue Code of 1986, as amended, applicable to regulated investment companies. Net investment income or loss and realized gains and losses for federal income tax purposes may differ from that reported on the financial statements because of temporary book and tax basis differences. Temporary differences are primarily the result of the treatment of wash sales for tax reporting purposes. The Fund recognizes interest and penalties related to income tax benefits, if any, in the statement of operations as an income tax expense. Distributions from net realized gains for book purposes may include short-term capital gains, which are included as ordinary income to shareholders for tax purposes. |
HENNESSYFUNDS.COM
| NOTES TO THE FINANCIAL STATEMENTS |
| | Due to inherent differences in the recognition of income, expenses, and realized gains/losses under GAAP and federal income tax regulations, permanent differences between book and tax basis for reporting for the fiscal year ended October 31, 2016, have been identified and appropriately reclassified on the Statement of Assets and Liabilities. The adjustments are as follows: |
| | Undistributed | Accumulated | | |
| | Net Investment | Net Realized | | |
| | Income/(Loss) | Gain/(Loss) | Paid-in Capital | |
| | $745,116 | $(745,116) | $— | |
| c). | Accounting for Uncertainty in Income Taxes – The Fund has accounting policies regarding recognition and measurement of tax positions taken or expected to be taken on a tax return. The tax returns of the Fund for the prior three fiscal years are open for examination. The Fund has reviewed all open tax years in major jurisdictions and concluded that there is no impact on the Fund’s net assets and no tax liability resulting from unrecognized tax benefits relating to uncertain income tax positions taken or expected to be taken on a tax return. The Fund’s major tax jurisdictions are U.S. federal and Delaware. |
| | |
| d). | Income and Expenses – Dividend income is recognized on the ex-dividend date or as soon as information is available to the Fund. Interest income, which includes the amortization of premium and accretion of discount, is recognized on an accrual basis. The Fund is charged for those expenses that are directly attributable to the portfolio, such as advisory, administration, and certain shareholder service fees. Income, expenses (other than expenses attributable to a specific class), and realized and unrealized gains or losses on investments are allocated to each class of shares based on its respective net assets. |
| | |
| e). | Distributions to Shareholders – Dividends from net investment income for the Fund, if any, are declared and paid annually, usually in December. Distributions of net realized capital gains, if any, are declared and paid annually, usually in December. |
| | |
| f). | Security Transactions – Investment and shareholder transactions are recorded on the trade date. The Fund determines the gain or loss realized from the investment transactions by comparing the original cost of the security lot sold with the net sale proceeds. Discounts and premiums on securities purchased are accreted/amortized over the life of the respective security. |
| | |
| g). | Use of Estimates – The preparation of financial statements in conformity with GAAP requires management to make estimates and assumptions that affect the reported amounts of assets and liabilities and disclosure of contingent assets and liabilities at the date of the financial statements and the reported change in net assets during the reporting period. Actual results could differ from those estimates. |
| | |
| h). | Share Valuation – The net asset value (“NAV”) per share of the Fund is calculated by dividing the sum of the value of the securities held by the Fund, plus cash or other assets, minus all liabilities (including estimated accrued expenses) by the total number of shares outstanding for the Fund, rounded to the nearest cent. The Fund’s shares will not be priced on days the New York Stock Exchange is closed for trading. The offering and redemption price per share for the Fund is equal to the Fund’s NAV per share. |
| | |
| i). | Repurchase Agreements – The Fund may enter into repurchase agreements with member banks or security dealers of the Federal Reserve Board whom the investment advisor deems creditworthy. The repurchase price generally equals the price paid by the Fund plus interest negotiated on the basis of current short-term rates. |
| HENNESSY FUNDS | 1-800-966-4354 | |
| | Securities pledged as collateral for repurchase agreements are held by the custodian bank until the respective agreements mature. Provisions of the repurchase agreements ensure that the market value of the collateral, including accrued interest thereon, is sufficient to cover the repurchase amount in the event of default of the counterparty. If the counterparty defaults and the value of the collateral declines or if the counterparty enters an insolvency proceeding, realization of the collateral by the Fund may be delayed or limited. During the fiscal year ended October 31, 2016, the Fund did not enter into any repurchase agreements. |
| | |
| j). | Derivatives – The Fund may invest in, or enter into, derivatives, such as options, futures contracts, options on futures contracts, and swaps, for a variety of reasons, including to hedge certain risks, to provide a substitute for purchasing or selling particular securities, or to increase potential income gain. Derivatives are financial contracts based on an underlying or notional amount, require no initial investment or an initial net investment that is smaller than would normally be required to have a similar response to changes in market factors, and require or permit net settlement. Derivatives may allow the Fund to increase or decrease the level of risk to which the Fund is exposed more quickly and efficiently than transactions in other types of instruments. The main purpose of utilizing derivative instruments is for hedging purposes. |
| | |
| | The Fund follows the financial accounting reporting rules as required by the Derivatives and Hedging Topic of the FASB Accounting Standards Codification. Under such rules, the Fund is required to include enhanced disclosure that enables investors to understand how and why an entity uses derivatives, how derivatives are accounted for, and how derivatives instruments affect an entity’s results of operations and financial position. During the fiscal year ended October 31, 2016, the Fund did not hold any derivative instruments. |
| | |
| k). | New Accounting Pronouncements – In May 2015, the FASB issued ASU No. 2015-07 “Disclosure for Investments in Certain Entities that Calculate Net Asset Value per Share (or Its Equivalent).” The amendments in ASU No. 2015-07 remove the requirement to categorize within the fair value hierarchy investments measured at NAV and require the disclosure of sufficient information to reconcile the fair value of the remaining assets categorized within the fair value hierarchy to the financial statements. The amendments in ASU No. 2015-07 are effective for fiscal years beginning after December 15, 2015, and interim periods within those fiscal years. Management has reviewed the requirements and believes the adoption of ASU 2015-07 will not have a material impact on the Fund’s financial statements and related disclosures. |
3). SECURITIES VALUATION
The Fund follows authoritative fair valuation accounting standards that establish an authoritative definition of fair value and set out a hierarchy for measuring fair value. These standards require additional disclosures about the various inputs and valuation techniques used to develop the measurements of fair value and a discussion in changes in valuation techniques and related inputs during the period. These inputs are summarized in the three broad levels listed below:
| | Level 1 – | Unadjusted, quoted prices in active markets for identical instruments that the Fund has the ability to access at the date of measurement. |
| | | |
| | Level 2 – | Other significant observable inputs (including, but not limited to, quoted prices in active markets for similar instruments, quoted prices in markets that are not active for identical or similar instruments, and model-derived valuations in which all significant inputs and significant value drivers are |
HENNESSYFUNDS.COM
| NOTES TO THE FINANCIAL STATEMENTS |
| | | observable in active markets (such as interest rates, prepayment speeds, credit risk curves, default rates, and similar data)). |
| | | |
| | Level 3 – | Significant unobservable inputs (including the Fund’s own assumptions about what market participants would use to price the asset or liability based on the best available information) when observable inputs are unavailable. |
Following is a description of the valuation techniques applied to the Fund’s major categories of assets and liabilities measured at fair value on a recurring basis.
Equity Securities – Equity securities, including common stocks, preferred stocks, exchange-traded funds, closed-end mutual funds, partnerships, rights, and real estate investment trusts, that are traded on a securities exchange for which a last-quoted sales price is readily available will generally be valued at the last sales price as reported by the primary exchange on which the securities are listed. Securities listed on The NASDAQ Stock Market (“NASDAQ”) will generally be valued at the NASDAQ Official Closing Price, which may differ from the last sales price reported. Securities traded on a securities exchange for which a last-quoted sales price is not readily available will generally be valued at the mean between the bid and ask prices. To the extent these securities are actively traded and valuation adjustments are not applied, they are classified in Level 1 of the fair value hierarchy.
Registered Investment Companies – Investments in registered investment companies (e.g., mutual funds) are generally priced at the ending NAV provided by the applicable registered investment company’s service agent and will be classified in Level 1 of the fair value hierarchy.
Debt Securities – Debt securities, including corporate bonds, asset-backed securities, mortgage-backed securities, municipal bonds, U.S. Treasuries, and U.S. government agency issues, are generally valued at market on the basis of valuations furnished by an independent pricing service that utilizes both dealer-supplied valuations and formula-based techniques. The pricing service may consider recently executed transactions in securities of the issuer or comparable issuers, market price quotations (where observable), bond spreads, and fundamental data relating to the issuer. In addition, the model may incorporate observable market data, such as reported sales of similar securities, broker quotes, yields, bids, offers, and reference data. Certain securities are valued primarily using dealer quotations. These securities are generally classified in Level 2 of the fair value hierarchy.
Short-Term Securities – Short-term equity investments, including money market funds, are valued in the manner specified above. Short-term debt investments with an original term to maturity of 60 days or less are valued at amortized cost, which approximates fair market value. If the original term to maturity of a short-term debt investment exceeded 60 days, then the values as of the 61st day prior to maturity are amortized. Amortized cost is not used if its use would be inappropriate due to credit or other impairments of the issuer, in which case the security’s fair value would be determined, as described below. Short-term securities are generally classified in Level 1 or Level 2 of the fair market hierarchy depending on the inputs used and market activity levels for specific securities.
The Board of Trustees of the Fund (the “Board”) has adopted fair value pricing procedures that are followed when a price for a security is not readily available or if a significant event has occurred that indicates the closing price of a security no longer represents the true value of that security. Fair value pricing determinations are made in good faith in accordance with these procedures. There are numerous criteria that will be given consideration in determining a fair value of a security, such as the trading volume of a security and markets, the value of other like securities, and news events with direct
| HENNESSY FUNDS | 1-800-966-4354 | |
bearing to a security or markets. Fair value pricing results in an estimated price for a security that reflects the amount the Fund might reasonably expect to receive in a current sale. Depending on the relative significance of the valuation inputs, these securities may be classified in either Level 2 or Level 3 of the fair value hierarchy.
The Board has delegated day-to-day valuation matters to a Valuation Committee comprised of one or more representatives from Hennessy Advisors, Inc., the Fund’s investment advisor. The function of the Valuation Committee is to value securities where current and reliable market quotations are not readily available. All actions taken by the Valuation Committee are reviewed by the Board.
The Fund has performed an analysis of all existing investments to determine the significance and character of all inputs to their fair value determination. Various inputs are used in determining the value of the Fund’s investments. The inputs or methodology used for valuing securities are not necessarily an indication of the risk associated with investing in those securities. Details related to the fair valuation hierarchy of the Fund’s securities as of October 31, 2016, are included in the Fund’s Schedule of Investments.
4). INVESTMENT TRANSACTIONS
Purchases and sales of investment securities (excluding government and short-term investments) for the Fund during the fiscal year ended October 31, 2016, were $1,142,738,094 and $1,243,780,938, respectively.
There were no purchases or sales/maturities of long-term U.S. government securities for the Fund during the fiscal year ended October 31, 2016.
The Fund is permitted to purchase or sell securities from or to another fund in the Hennessy Funds family of funds (the “Hennessy Funds”) under specified conditions outlined in procedures adopted by the Board of Trustees. The procedures have been designed to ensure that any purchase or sale of securities by the Fund from or to another Hennessy Fund complies with Rule 17a-7 of the Investment Company Act of 1940. For the fiscal year ended October 31, 2016, the Fund did not engage in purchases and sales of securities pursuant to Rule 17a-7 of the Investment Company Act of 1940.
5). INVESTMENT MANAGEMENT FEE AND OTHER TRANSACTIONS WITH AFFILIATES
Hennessy Advisors, Inc. (the “Advisor”) is the investment advisor of the Fund. The Advisor provides the Fund with investment management services under an Investment Advisory Agreement. The Advisor furnishes all investment advice, office space, facilities, and provides most of the personnel needed by the Fund. As compensation for its services, the Advisor is entitled to a monthly fee from the Fund. The fee is based upon the average daily net assets of the Fund at the annual rate of 0.74%. The net investment advisory fees payable by the Fund as of October 31, 2016, were $851,049.
The Board has approved a Shareholder Servicing Agreement for Investor Class shares of the Fund, which was instituted to compensate the Advisor for the non-investment management services it provides to the Fund. The Shareholder Servicing Agreement provides for a monthly fee paid to the Advisor at an annual rate of 0.10% of the average daily net assets of the Fund attributable to Investor Class shares. Shareholder service fees payable by the Fund as of October 31, 2016, were $59,264.
The Fund has adopted a plan pursuant to Rule 12b-1 under the Investment Company Act of 1940, as amended, that authorizes payments in connection with the distribution of the Fund’s shares at an annual rate of up to 0.25% of the Fund’s average daily net assets attributable to Investor Class shares. Even though the authorized rate is up to 0.25%, the Fund has only used up to 0.15% of its average daily net assets attributable to Investor Class shares for such purpose since the plan was implemented on
| NOTES TO THE FINANCIAL STATEMENTS |
November 1, 2015. Amounts paid under the plan may be spent on any activities or expenses primarily intended to result in the sale of shares, including, but not limited to, advertising, shareholder account servicing, the printing and mailing of prospectuses to other than current shareholders, the printing and mailing of sales literature, and compensation for sales and marketing activities or to financial institutions and others, such as dealers and distributors.
The Fund has entered into agreements with various brokers, dealers, and financial intermediaries in connection with the sale of shares of the Fund. The agreements provide for periodic payments by the Fund to the brokers, dealers, and financial intermediaries for providing certain shareholder maintenance services (sub-transfer agent expenses). These shareholder services include the pre-processing and quality control of new accounts, shareholder correspondence, answering customer inquiries regarding account status, and facilitating shareholder telephone transactions. Fees paid by the Fund to various brokers, dealers, and financial intermediaries during the fiscal year ended October 31, 2016, were $1,812,044.
U.S. Bancorp Fund Services, LLC (“USBFS”) provides the Fund with administrative, fund accounting, and transfer agent services, and necessary office equipment. As administrator, USBFS is responsible for activities such as (i) preparing various federal and state regulatory filings, reports, and returns for the Fund, (ii) preparing reports and materials to be supplied to the Board, (iii) monitoring the activities of the Fund’s custodian, transfer agent, and accountants, and (iv) coordinating the preparation and payment of the Fund’s expenses and reviewing the Fund’s expense accruals. Fees paid to USBFS during the fiscal year ended October 31, 2016, were $1,034,908.
U.S. Bank, N.A., an affiliate of USBFS, serves as the Fund’s custodian. Quasar Distributors, LLC acts as the Fund’s principal underwriter in a continuous public offering of the Fund’s shares. Quasar Distributors, LLC is an affiliate of USBFS and U.S. Bank, N.A.
The officers of the Fund are affiliated with the Advisor. Such officers, with the exception of the Chief Compliance Officer and the Senior Compliance Officer, receive no compensation from the Fund for serving in their respective roles. The Fund, along with the other Hennessy Funds, makes reimbursement payments, on an equal basis, to the Advisor for a portion of the salary and benefits associated with the office of the Chief Compliance Officer and for all of the salary and benefits associated with the office of the Senior Compliance Officer. Such amounts are included on the Statement of Operations.
6). GUARANTEES AND INDEMNIFICATIONS
Under the Hennessy Funds’ organizational documents, their officers and trustees are indemnified by the Hennessy Funds against certain liabilities arising out of the performance of their duties to the Hennessy Funds. Additionally, in the normal course of business, the Hennessy Funds enter into contracts with service providers that contain general indemnification clauses. The Fund’s maximum exposure under these arrangements is unknown as this would involve future claims that may be made against the Fund that have not yet occurred. Currently, the Fund expects the risk of loss to be remote.
7). LINE OF CREDIT
The Fund has an uncommitted line of credit with the other Hennessy Funds in the amount of the lesser of (i) $100,000,000 or (ii) 33.33% of each Hennessy Fund’s net assets, or 30% for the Hennessy Gas Utility Fund and 10% for the Hennessy Balanced Fund, intended to provide short-term financing, if necessary, subject to certain restrictions, in connection with shareholder redemptions. The credit facility is with the Hennessy Funds’ custodian bank, U.S. Bank, N.A. Borrowings under this arrangement
| HENNESSY FUNDS | 1-800-966-4354 | |
bear interest at the bank’s prime rate and are secured by all of the Fund’s assets (as to its own borrowings only). During the fiscal year ended October 31, 2016, the Fund had an outstanding average daily balance and a weighted average interest rate of $346,842 and 3.47%, respectively. The maximum amount outstanding for the Fund during the period was $31,985,000. At October 31, 2016, the Fund did not have any borrowings outstanding under the line of credit.
8). FEDERAL TAX INFORMATION
As of October 31, 2016, the components of accumulated earnings (losses) for income tax purposes were as follows:
| | Cost of investments for tax purposes | | $ | 1,054,679,591 | |
| | Gross tax unrealized appreciation | | $ | 277,332,537 | |
| | Gross tax unrealized depreciation | | | (86,056,399 | ) |
| | Net tax unrealized appreciation | | $ | 191,276,138 | |
| | Undistributed ordinary income | | $ | — | |
| | Undistributed long-term capital gains | | | 7,854,693 | |
| | Total distributable earnings | | $ | 7,854,693 | |
| | Other accumulated loss | | $ | (259,297,426 | ) |
| | Total accumulated loss | | $ | (60,166,595 | ) |
The difference between book-basis unrealized appreciation/depreciation (as shown in the Statement of Assets and Liabilities) and tax-basis unrealized appreciation/depreciation (as shown above) is attributable primarily to wash sales.
At October 31, 2016, the Fund had no tax basis capital losses to offset future capital gains.
During the fiscal year ended October 31, 2016, the capital loss carryforwards utilized for the Fund were $493,673.
At October 31, 2016, the Fund deferred on a tax basis, a post-December late year ordinary loss deferral of $1,670,147.
During the fiscal years ended October 31, 2016 and 2015, the tax character of distributions paid by the Fund was as follows:
| | | | Year Ended | | | Year Ended | |
| | | | October 31, 2016 | | | October 31, 2015 | |
| | Ordinary income(1) | | $ | 8,894,689 | | | $ | 44,515 | |
| | Long-term capital gain | | | 745,446 | | | | 20,622,992 | |
| | | | $ | 9,640,135 | | | $ | 20,667,507 | |
| | (1) | Ordinary income includes short-term gain or loss. |
9). AGREEMENT AND PLAN OF REORGANIZATION
On September 23, 2016, shareholders of the Westport Fund and the Westport Select Cap Fund approved an Agreement and Plan of Reorganization between the Trust, on behalf of the Fund, and The Westport Funds, a Delaware statutory trust, on behalf of the Westport Fund and the Westport Select Cap Fund. The Agreement and Plan of Reorganization provides for the transfer of all of the assets of the Westport Fund and the Westport Select Cap Fund to the Fund and the assumption of the liabilities (other than any excluded liabilities) of the Westport Fund and the Westport Select Cap Fund by the Fund. Each of the Westport Fund, the Westport Select Cap Fund, and the Fund have substantially similar investment objectives. The following tables illustrate the specifics of the Fund’s reorganization:
HENNESSYFUNDS.COM
| NOTES TO THE FINANCIAL STATEMENTS |
| | Shares issued | Westport | Shares issued | Hennessy | | |
| | to Shareholders | Select Cap | to Shareholders | Mid Cap 30 | | |
| Westport Fund | of Westport | Fund | of Westport | Fund | Combined | Tax Status |
Net Assets | Fund | Net Assets | Select Cap Fund | Net Assets | Net Assets | of Transfer |
$327,593,695(1) | 16,818,829 | $106,936,284(2) | 5,490,173 | $944,525,090 | $1,379,055,069 | Non-taxable |
(1) | Includes accumulated realized losses and unrealized appreciation in the amounts of $24,482,976 and $179,647,207, respectively. |
(2) | Includes accumulated realized losses and unrealized appreciation in the amounts of $49,229,674 and $77,980,073, respectively. |
Assuming the reorganization had been completed on November 1, 2015, the beginning of the annual reporting period of the Fund, the pro forma results of operation (unaudited) for the year ended October 31, 2016, would have been as follows:
| | Net investment loss | | $ | (3,630,389 | ) |
| | Net realized gain on investments | | $ | 187,733,108 | |
| | Net change in unrealized appreciation on investments | | $ | 5,795,235 | |
| | Net increase in net assets resulting from operations | | $ | 189,897,954 | |
Because the combined investment portfolios have been managed as a single integrated portfolio since the reorganization was completed, it is not practicable to separate the amounts of revenue and earnings of the Westport Fund and the Westport Select Cap Fund that have been included in the Fund’s Statement of Operations since September 23, 2016.
10). EVENTS SUBSEQUENT TO YEAR END
Management has evaluated the Fund’s related events and transactions that occurred subsequent to October 31, 2016, through the date of issuance of the Fund’s financial statements. Other than as disclosed below, management has determined that there were no subsequent events requiring recognition or disclosure in the financial statements.
On December 7, 2016, capital gains were declared and paid to shareholders of record as of December 6, 2016, as follows:
| | Long-term | |
| | Amount Per Share | |
| Investor Class | $0.12486 | |
| Institutional Class | $0.12776 | |
| HENNESSY FUNDS | 1-800-966-4354 | |
Report of Independent Registered Public Accounting Firm
The Board of Trustees of Hennessy Funds Trust
and the Shareholders of the Hennessy Cornerstone Mid Cap 30 Fund:
We have audited the accompanying statement of assets and liabilities of the Hennessy Cornerstone Mid Cap 30 Fund (the Fund), a series of Hennessy Funds Trust, including the schedule of investments, as of October 31, 2016, and the related statement of operations for the year then ended, the statements of changes in net assets for each of the years in the two year period then ended, and the financial highlights for each of the years in the five year period then ended. These financial statements and financial highlights are the responsibility of the Fund’s management. Our responsibility is to express an opinion on these financial statements and financial highlights based on our audits.
We conducted our audits in accordance with the standards of the Public Company Accounting Oversight Board (United States). Those standards require that we plan and perform the audit to obtain reasonable assurance about whether the financial statements and financial highlights are free of material misstatement. An audit includes examining, on a test basis, evidence supporting the amounts and disclosures in the financial statements. Our procedures included confirmation of securities owned as of October 31, 2016, by correspondence with custodians and brokers or by other appropriate auditing procedures. An audit also includes assessing the accounting principles used and significant estimates made by management, as well as evaluating the overall financial statement presentation. We believe that our audits provide a reasonable basis for our opinion.
In our opinion, the financial statements and financial highlights referred to above present fairly, in all material respects, the financial position of the Fund as of October 31, 2016, the results of its operations for the year then ended, the changes in its net assets for each of the years in the two year period then ended, and the financial highlights for each of the years in the five year period then ended, in conformity with U.S. generally accepted accounting principles.
Chicago, Illinois
December 22, 2016
HENNESSYFUNDS.COM
| REPORT OF INDEPENDENT REGISTERED PUBLIC ACCOUNTING FIRM/TRUSTEES AND OFFICERS |
Trustees and Officers of the Fund (Unaudited)
The business and affairs of the Fund are managed under the direction of the Board of Trustees of the Trust, and the Board of Trustees elects the Officers of the Trust. Beginning in March 2015, the Board of Trustees has from time to time appointed advisers (“Advisers “) to the Board of Trustees, with the intention of having qualified individuals serve in an advisory capacity in order to garner experience in the mutual fund and asset management industry and be considered as potential Trustees in the future. There are currently three Advisers to the Board of Trustees: Brian Alexander, Doug Franklin, and Claire Knoles. As Advisers, Mr. Alexander, Mr. Franklin, and Ms. Knoles attend meetings of the Board and act as non-voting participants. Information pertaining to the Trustees, Advisers, and the Officers of the Trust is set forth below. The Trustees and Officers serve until their successors are duly elected and qualified or until their earlier death, resignation, or removal. Each of the Trustees oversees 16 Hennessy Funds. Unless otherwise indicated, the address of all persons listed below is 7250 Redwood Boulevard, Suite 200, Novato, CA 94945. The Fund’s Statement of Additional Information includes more information about the persons listed below and is available, without charge, upon request by calling 1-800-966-4354.
| | | | Other |
| | | | Directorships |
| | | | Held Outside |
| Name, (Year of Birth), | | | of Fund |
| and Position Held | Start Date | Principal Occupation(s) | Complex During |
with the Trust | of Service | During Past Five Years | Past Five Years(1) |
| | | | |
| Disinterested Trustees and Advisers | | |
| | | | |
| J. Dennis DeSousa | January 1996 | Mr. DeSousa is a real estate investor. | None. |
| (1936) | | | |
| Trustee | | | |
| | | | |
| Robert T. Doyle | January 1996 | Mr. Doyle has been the Sheriff of | None. |
| (1947) | | Marin County, California since 1996. | |
| Trustee | | | |
| | | | |
| Gerald P. Richardson | May 2004 | Mr. Richardson is an independent | None. |
| (1945) | | consultant in the securities industry. | |
| Trustee | | | |
| | | | |
| Brian Alexander | March 2015 | Mr. Alexander has been employed | None. |
| (1981) | | by Sutter Health Novato Community | |
| Adviser to the Board | | Hospital since 2012, first as an | |
| | | Assistant Administrator and then, | |
| | | beginning in 2013, as the Chief | |
| | | Administrative Officer. From 2011 | |
| | | through 2012, Mr. Alexander was | |
| | | employed by Sutter Health West Bay | |
| | | Region as the Regional Director of | |
| | | Strategic Decision Support. Prior to | |
| | | that, in 2011, he served as the | |
| | | Director of Managed Care | |
| | | Contracting and also the Director of | |
| | | Compensation, Benefits, and | |
| | | Compliance for the Rehabilitation | |
| | | Institute of Chicago. | |
| HENNESSY FUNDS | 1-800-966-4354 | |
| | | | Other |
| | | | Directorships |
| | | | Held Outside |
| Name, (Year of Birth), | | | of Fund |
| and Position Held | Start Date | Principal Occupation(s) | Complex During |
with the Trust | of Service | During Past Five Years | Past Five Years(1) |
| | | | |
| Doug Franklin | March 2016 | Mr. Franklin is a retired insurance | None. |
| (1964) | | industry executive. From 1987 | |
| Adviser to the Board | | through 2015, he was employed by | |
| | | the Allianz-Fireman’s Fund Insurance | |
| | | Company in various positions, | |
| | | including as its Chief Actuary and | |
| | | Chief Risk Officer. | |
| | | | |
| Claire Knoles | December 2015 | Ms. Knoles is a founder of Kiosk and | None. |
| (1974) | | has served as its Chief Operating | |
| Adviser to the Board | | Officer since 2004. Kiosk is a full | |
| | | service marketing agency with | |
| | | offices in the San Francisco Bay | |
| | | Area, Toronto, and Liverpool, UK. | |
| | | | |
Interested Trustee(2) | | | |
| | | | |
| Neil J. Hennessy | January 1996 as | Mr. Hennessy has been employed by | Hennessy |
| (1956) | a Trustee and | Hennessy Advisors, Inc. since 1989 | Advisors, Inc. |
| Trustee, Chairman of | June 2008 as | and currently serves as its President, | |
| the Board, Chief | an Officer | Chairman and Chief Executive Officer. | |
| Investment Officer, | | | |
| Portfolio Manager, | | | |
| and President | | | |
| Name, (Year of Birth), | | |
| and Position Held | Start Date | Principal Occupation(s) |
with the Trust | of Service | During Past Five Years |
| | | |
| Officers | | |
| | | |
| Teresa M. Nilsen | January 1996 | Ms. Nilsen has been employed by Hennessy Advisors, Inc. |
| (1966) | | since 1989 and currently serves as its Executive Vice President, |
| Executive Vice President | | Chief Operations Officer, Chief Financial Officer, and Secretary. |
| and Treasurer | | |
| | | |
| Daniel B. Steadman | March 2000 | Mr. Steadman has been employed by Hennessy Advisors, Inc. |
| (1956) | | since 2000 and currently serves as its Executive Vice President |
| Executive Vice President | | and Chief Compliance Officer. |
| and Secretary | | |
| | | |
| Jennifer Cheskiewicz | June 2013 | Ms. Cheskiewicz has been employed by Hennessy Advisors, Inc. |
| (1977) | | as its General Counsel since June 2013. She previously served |
| Senior Vice President and | | as in-house counsel to Carlson Capital, L.P., an SEC-registered |
| Chief Compliance Officer | | investment advisor to several private funds, from |
| | | February 2010 to May 2013. |
| | | |
| Brian Carlson | December 2013 | Mr. Carlson has been employed by Hennessy Advisors, Inc. |
| (1972) | | since December 2013. Mr. Carlson was previously a co-founder |
| Senior Vice President and | | and principal of Trivium Consultants, LLC from February 2011 |
| Head of Distribution | | through November 2013. |
HENNESSYFUNDS.COM
| TRUSTEES AND OFFICERS OF THE FUND |
| Name, (Year of Birth), | | |
| and Position Held | Start Date | Principal Occupation(s) |
with the Trust | of Service | During Past Five Years |
| | | |
| David Ellison | October 2012 | Mr. Ellison has been employed by Hennessy Advisors, Inc. since |
(1958)(3) | | October 2012. He has served as a Portfolio Manager of the |
| Senior Vice President and | | Hennessy Small Cap Financial Fund, the Hennessy Large Cap |
| Portfolio Manager | | Financial Fund, and the Hennessy Technology Fund since |
| | | inception. Prior to that, Mr. Ellison served as Director, CIO and |
| | | President of FBR Fund Advisers, Inc. from December |
| | | 1999 to October 2012. |
| | | |
| Brian Peery | March 2003 as | Mr. Peery has been employed by Hennessy Advisors, Inc. since |
| (1969) | an Officer and | 2002. He has served as a Portfolio Manager of the Hennessy |
| Senior Vice President and | February 2011 | Cornerstone Growth Fund, the Hennessy Cornerstone Mid Cap |
| Portfolio Manager | as a Co-Portfolio | 30 Fund, the Hennessy Cornerstone Large Growth Fund, the |
| | Manager or | Hennessy Cornerstone Value Fund, the Hennessy Total Return |
| | Portfolio Manager | Fund, and the Hennessy Balanced Fund since October 2014. |
| | | He served as Co-Portfolio Manager of the same funds from |
| | | February 2011 through September 2014. Mr. Peery has also |
| | | served as a Portfolio Manager of the Hennessy Gas Utility Fund |
| | | since February 2015. |
| | | |
| Winsor (Skip) Aylesworth | October 2012 | Mr. Aylesworth has been employed by Hennessy Advisors, Inc. |
(1947)(3) | | since October 2012. He has served as a Portfolio Manager of |
| Vice President and | | the Hennessy Gas Utility Fund since 1998 and as a Portfolio |
| Portfolio Manager | | Manager of the Hennessy Technology Fund since inception. |
| | | Prior to that, Mr. Aylesworth served as Executive Vice President |
| | | of FBR Fund Advisers, Inc. from 1999 to October 2012. |
| | | |
| Ryan Kelley | March 2013 | Mr. Kelley has been employed by Hennessy Advisors, Inc. since |
(1972)(4) | | October 2012. He has served as a Portfolio Manager of the |
| Vice President and | | Hennessy Gas Utility Fund, the Hennessy Small Cap Financial |
| Portfolio Manager | | Fund, and the Hennessy Large Cap Financial Fund since |
| | | October 2014. He served as Co-Portfolio Manager of the same |
| | | funds from March 2013 through September 2014, and as a |
| | | Portfolio Analyst for the Hennessy Funds from October 2012 |
| | | through February 2013. Prior to that, Mr. Kelley served as |
| | | Portfolio Manager of FBR Fund Advisers, Inc. from |
| | | January 2008 to October 2012. |
_______________
(1) | Messrs. DeSousa, Doyle, Hennessy, and Richardson previously served on the Board of Directors of Hennessy Mutual Funds, Inc. (“HMFI”), The Hennessy Funds, Inc. (“HFI”), and Hennessy SPARX Funds Trust (“HSFT”). Pursuant to an internal reorganization effective as of February 28, 2014, the series of HFMI, HFI, and HSFT were reorganized into corresponding series of Hennessy Funds Trust that mirrored them. Subsequent to the reorganization, HFMI, HFI, and HSFT were dissolved. |
(2) | Mr. Hennessy is considered an “interested person,” as defined in the Investment Company Act of 1940, as amended, because he is an officer of the Hennessy Funds. |
(3) | The address of these officers is 101 Federal Street, Suite 1900, Boston, MA 02110. |
(4) | The address of this officer is 1340 Environ Way, Suite 305, Chapel Hill, NC 27517. |
| HENNESSY FUNDS | 1-800-966-4354 | |
Expense Example (Unaudited)
October 31, 2016
As a shareholder of the Fund, you incur two types of costs: (1) transaction costs, including sales charges (loads) on purchase payments, reinvested dividends, or other distributions; redemption fees; and exchange fees; and (2) ongoing costs, including management fees; service fees; and other Fund expenses. This Example is intended to help you understand your ongoing costs (in dollars) of investing in the Fund and to compare these costs with the ongoing costs of investing in other mutual funds. The Example is based on an investment of $1,000 invested at the beginning of the period and held for the entire period from May 1, 2016, through October 31, 2016.
Actual Expenses
The first line of the table below under the “Investor Class” and “Institutional Class” headings provides information about actual account values and actual expenses. Although the Fund charges no sales loads or transaction fees, you will be assessed fees for outgoing wire transfers, returned checks and stop payment orders at prevailing rates charged by U.S. Bancorp Fund Services, LLC, the Fund’s transfer agent. If you request that a redemption be made by wire transfer, currently a $15 fee is charged by the Fund’s transfer agent. IRA accounts will be charged a $15 annual maintenance fee. The example below includes, but is not limited to, management fees, shareholder servicing fees, fund accounting, custody, and transfer agent fees. However, the example below does not include portfolio trading commissions and related expenses, and other extraordinary expenses as determined under generally accepted accounting principles. You may use the information in this line, together with the amount you invested, to estimate the expenses that you paid over the period. Simply divide your account value by $1,000 (for example, an $8,600 account value divided by $1,000 = 8.6), then multiply the result by the number in the first line of the table under the “Investor Class” and “Institutional Class” headings in the column entitled “Expenses Paid During Period” to estimate the expenses you paid on your account during this period.
Hypothetical Example for Comparison Purposes
The second line of the table below under the “Investor Class” and “Institutional Class” headings provides information about hypothetical account values and hypothetical expenses based on the Fund’s actual expense ratios and an assumed rate of return of 5% per year before expenses, which is not the Fund’s actual return. The hypothetical account values and expenses may not be used to estimate the actual ending account balance or expenses you paid for the period. You may use this information to compare the ongoing costs of investing in the Fund and other funds. To do so, compare this 5% hypothetical example with the 5% hypothetical examples that appear in the shareholder reports of the other funds. Please note that the expenses shown in the table are meant to highlight your ongoing costs only and do not reflect any transactional costs, such as sales charges (loads), or exchange fees. Therefore, the second line of the table under the “Investor Class” and “Institutional Class” headings is useful in comparing ongoing costs only, and will not help you determine the relative total costs of owning different funds. In addition, if these transactional costs were included, your costs would have been higher.
HENNESSYFUNDS.COM
| | | | Expenses Paid |
| | Beginning | Ending | During Period(1) |
| | Account Value | Account Value | May 1, 2016 – |
| | May 1, 2016 | October 31, 2016 | October 31, 2016 |
| Investor Class | | | |
| Actual | $1,000.00 | $1,000.00 | $6.79 |
| Hypothetical (5% return before expenses) | $1,000.00 | $1,018.35 | $6.85 |
| | | | |
| Institutional Class | | | |
| Actual | $1,000.00 | $1,002.10 | $4.98 |
| Hypothetical (5% return before expenses) | $1,000.00 | $1,020.16 | $5.03 |
(1) | Expenses are equal to the Fund’s annualized expense ratio of 1.35% for Investor Class shares or 0.99% for Institutional Class shares, as applicable, multiplied by the average account value over the period, multiplied by 184/366 days (to reflect one-half year period). |
| HENNESSY FUNDS | 1-800-966-4354 | |
How to Obtain a Copy of the Fund’s
Proxy Voting Policy and Proxy Voting Records
A description of the policies and procedures the Fund uses to determine how to vote proxies relating to portfolio securities is available without charge: (1) by calling 1-800-966-4354; (2) on the Hennessy Funds’ website at hennessyfunds.com/proxy-voting/policy.fs; or (3) on the U.S. Securities and Exchange Commission’s website at www.sec.gov. The Fund’s proxy voting record is available without charge on both the Hennessy Funds’ website at hennessyfunds.com/proxy-voting/vote.fs and the SEC’s website at www.sec.gov no later than August 31 for the prior 12 months ending June 30.
Quarterly Filings on Form N-Q
The Fund files its complete schedule of portfolio holdings with the SEC for the first and third quarters of each fiscal year on Form N-Q. The Fund’s Form N-Q will be available on the SEC’s website at www.sec.gov. The Fund’s Form N-Q may be reviewed and copied at the SEC’s Public Reference Room in Washington, DC and information on the operation of the Public Reference Room may be obtained by calling 1-800-SEC-0330. Information included in the Fund’s N-Q will also be available upon request by calling 1-800-966-4354.
Federal Tax Distribution Information
(Unaudited)
For the fiscal year ended October 31, 2016, certain dividends paid by the Fund may be subject to a maximum tax rate of 23.8%, as provided for by the Jobs and Growth Tax Relief Reconciliation Act of 2003. The percentage of dividends declared from ordinary income designated as qualified dividend income was 99.79%.
For corporate shareholders, the percent of ordinary income distributions that qualified for the corporate dividends received deduction for the fiscal year ended October 31, 2016, was 99.79%.
The percentage of taxable ordinary income distributions that are designated as short-term capital gain distributions under Section 871(k)(2)(C) of the Internal Revenue Code of 1986, as amended, for the Fund was 86.03%.
Householding
To help keep the Fund’s costs as low as possible, we generally deliver a single copy of most financial reports and prospectuses to shareholders who share an address, even if the accounts are registered under different names. This process, known as “householding,” does not apply to account statements. You may, of course, request an individual copy of a prospectus or financial report at any time. If you would like to receive separate mailings, please call the Administrator at 1-800-261-6950 or 1-414-765-4124 and we will begin individual delivery within 30 days of your request. If your account is held through a financial institution or other intermediary, please contact them directly to request individual delivery.
HENNESSYFUNDS.COM
| PROXY VOTING — PRIVACY POLICY |
Privacy Policy
We collect the following non-public personal information about you:
| | • | information we receive from you on or in applications or other forms, correspondence, or conversations, including, but not limited to, your name, address, phone number, social security number, assets, income, and date of birth; and |
| | | |
| | • | information about your transactions with us, our affiliates, or others, including, but not limited to, your account number and balance, payment history, parties to transactions, cost basis information, and other financial information. |
We do not disclose any non-public personal information about our current or former shareholders to non-affiliated third parties, except as permitted by law. For example, we are permitted by law to disclose all of the information we collect, as described above, to our Transfer Agent to process your transactions. Furthermore, we restrict access to your non-public personal information to those persons who require such information to provide products or services to you. We maintain physical, electronic, and procedural safeguards that comply with federal standards to guard your non-public personal information.
In the event that you hold shares of the Fund through a financial intermediary, including, but not limited to, a broker-dealer, bank or trust company, the privacy policy of your financial intermediary would govern how your non-public personal information would be shared with non-affiliated third parties.
| HENNESSY FUNDS | 1-800-966-4354 | |
For information, questions or assistance, please call
The Hennessy Funds
1-800-966-4354 or 1-415-899-1555
INVESTMENT ADVISOR
Hennessy Advisors, Inc.
7250 Redwood Blvd., Suite 200
Novato, California 94945
ADMINISTRATOR,
TRANSFER AGENT,
DIVIDEND PAYING AGENT &
SHAREHOLDER SERVICING AGENT
U.S. Bancorp Fund Services, LLC
P.O. Box 701
Milwaukee, Wisconsin 53201-0701
CUSTODIAN
U.S. Bank N.A.
Custody Operations
1555 North River Center Dr., Suite 302
Milwaukee, Wisconsin 53212
TRUSTEES
Neil J. Hennessy
Robert T. Doyle
J. Dennis DeSousa
Gerald P. Richardson
COUNSEL
Foley & Lardner LLP
777 East Wisconsin Avenue
Milwaukee, Wisconsin 53202-5306
INDEPENDENT REGISTERED
PUBLIC ACCOUNTING FIRM
KPMG LLP
200 East Randolph Street
Chicago, Illinois 60601
DISTRIBUTOR
Quasar Distributors, LLC
615 East Michigan Street
Milwaukee, Wisconsin 53202
hennessyfunds.com | 1-800-966-4354
This report has been prepared for shareholders and may be distributed to
others only if preceded or accompanied by a current prospectus.
ANNUAL REPORT
OCTOBER 31, 2016
HENNESSY CORNERSTONE
LARGE GROWTH FUND
Investor Class HFLGX
Institutional Class HILGX
hennessyfunds.com | 1-800-966-4354
(This Page Intentionally Left Blank.)
Contents
| Letter to Shareholders | | | 2 |
| Performance Overview | | | 4 |
| Financial Statements | | | |
| Schedule of Investments | | | 7 |
| Statement of Assets and Liabilities | | | 11 |
| Statement of Operations | | | 12 |
| Statements of Changes in Net Assets | | | 13 |
| Financial Highlights | | | 14 |
| Notes to the Financial Statements | | | 18 |
| Report of Independent Registered Public Accounting Firm | | | 26 |
| Trustees and Officers of the Fund | | | 27 |
| Expense Example | | | 30 |
| Proxy Voting | | | 32 |
| Quarterly Filings on Form N-Q | | | 32 |
| Federal Tax Distribution Information | | | 32 |
| Householding | | | 32 |
| Privacy Policy | | | 33 |
| HENNESSY FUNDS | 1-800-966-4354 | |
December 2016
Dear Hennessy Funds Shareholder:
Over the past year investors here in the U.S. and around the world have weathered a great deal of turmoil, especially in the political arena. Foremost, the bitterly divisive and all-consuming U.S. Presidential election, with its unanticipated outcome, is finally behind us. While the equity markets were jittery at first, they now appear more comfortable with the prospect of a Trump presidency and seem to be looking forward to diminished government regulation and intervention.
The Brexit vote in the U.K. cast a shadow over the European Union’s future. There remains uncertainty over the details and timing of the break and the economic consequences for both Britain and Europe, but early signs suggest the impact on growth in Britain will not be as severe as initially feared.
Additionally, uncertainty over whether the Federal Reserve would raise short-term interest rates has hung over the economy for well over a year now. The effects that higher rates could have on growth, the strength of the U.S. Dollar, corporate profits and loan supply and demand seem to have weighed heavily on investors, causing paralysis and money to remain on the sidelines of the market.
Despite all these concerns, U.S. equity markets have pushed higher, with both the Dow Jones Industrial Average and S&P 500 Index posting returns of approximately 5% during the twelve-month period ended October 31, 2016. The U.S. economy has continued to grow at a respectable annual rate of about 2%, and corporate profits have started to move higher. Today, as of mid-December, bond and Treasury yields have risen a bit from record lows just this summer, and the bond market is finishing the year on slightly rocky footing. Bond yields are still very low relative to historical averages, while the prospective PE multiples for the Dow Jones Industrial Average and S&P 500 Index are just above long-term averages at 18.0x and 18.9x, respectively. We believe that equity valuations could go considerably higher and still be at appropriate levels relative to bond yields. And, while we do expect the Fed to raise interest rates in the coming year, we believe that inflation will stay under control, so that short-term interest rates will not have to rise too fast or too far.
As I reflect over the past twelve months, what I realize is that many of the worries this year are not new. For the past several years, American businesses have operated in an environment characterized by highly partisan politics, mounting regulations, uncertainty over interest rates, and a lack of clarity regarding taxes and healthcare costs. Despite all these headwinds, U.S. corporations have been incredibly resilient and found ways to impress investors. If the newly elected administration follows through on campaign promises of reigning in regulation, lowering taxes for corporations and individuals, or reforming healthcare to drive down costs, then companies, which are already lean, should be able to post higher profits. And, that growth should lead to more jobs and a stronger economy, potentially creating a very positive cycle going forward.
With the bull market in U.S. equities entering its ninth year, many believe the economy is due for a recession and the market is due for a downturn. But, the euphoria that usually accompanies a peak in the market is absent. Since the recovery began after the financial crisis, I have found myself pondering the bull run of 1982 to 2000, powered, in part, by a significant increase in valuations. I believe today’s market displays the fundamentals to sustain a similarly strong and lengthy bull market. Meanwhile, companies are largely profitable and many corporate balance sheets are cash-rich, with
HENNESSYFUNDS.COM
relatively little debt. Unemployment is low and real wages are rising, helping to drive consumption. We are hopeful that these factors will provide support for positive market returns in the year to come.
Thank you for your continued confidence and investment in our funds. If you have any questions or would like to speak with us directly, please don’t hesitate to call us at (800) 966-4354.
Best regards,
Neil J. Hennessy
President and Chief Investment Officer
Past performance does not guarantee future results.
Mutual fund investing involves risk. Principal loss is possible.
Opinions expressed are those of Neil Hennessy and are subject to change, are not guaranteed and should not be considered investment advice.
The Dow Jones Industrial Average and S&P 500 Index are unmanaged indices commonly used to measure the performance of U.S. stocks. One cannot invest directly in an index.
PE, or price to earnings, is calculated by dividing a company’s market price per share by its earnings per share.
| HENNESSY FUNDS | 1-800-966-4354 | |
Performance Overview (Unaudited)
CHANGE IN VALUE OF $10,000 INVESTMENT
This graph illustrates the performance of an initial investment of $10,000 made in the Fund on its inception date and assumes the reinvestment of dividends.
AVERAGE ANNUAL TOTAL RETURN FOR PERIODS ENDED OCTOBER 31, 2016
| | | | Since |
| | One | Five | Inception |
| | Year | Years | (3/20/09) |
| Hennessy Cornerstone Large Growth Fund – | | | |
| Investor Class (HFLGX) | 2.63% | 11.35% | 16.46% |
| Hennessy Cornerstone Large Growth Fund – | | | |
| Institutional Class (HILGX) | 2.92% | 11.59% | 16.74% |
Russell 1000® Index | 4.26% | 13.51% | 16.93% |
| S&P 500 Index | 4.51% | 13.57% | 16.74% |
Expense ratios: 1.24% (Investor Class); 0.99% (Institutional Class)
Performance data quoted represents past performance; past performance does not guarantee future results. The investment return and principal value of an investment will fluctuate so that an investor’s shares, when redeemed, may be worth more or less than their original cost. The performance graph and table do not reflect the deduction of taxes that a shareholder would pay on Fund distributions or the redemption of Fund shares. Current performance of the Fund may be lower or higher than the performance quoted. Performance data current to the most recent month end may be obtained by visiting hennessyfunds.com.
The expense ratios presented are from the most recent prospectus.
PERFORMANCE NARRATIVE
Portfolio Managers Neil J. Hennessy and Brian E. Peery
Performance:
For the twelve-month period ended October 31, 2016, the Investor Class of the Hennessy Cornerstone Large Growth Fund returned 2.63%, underperforming both the Russell 1000® Index and the S&P 500 Index, which returned 4.26% and 4.51% for the same period, respectively.
HENNESSYFUNDS.COM
On a sector basis, the Fund’s overweight position in the Industrial Sector aided overall performance, as did its underweight positions in the Healthcare and Consumer Staples sectors. However, these positive contributions were offset by the Fund’s overweight position in retailers, including Bed, Bath & Beyond, Inc. and Macy’s, Inc., which hurt the Fund’s relative performance. Many retailers are struggling with slow growth in demand and increased competition from internet shopping. Airline stocks in the portfolio, which include JetBlue Airways Corp, Southwest Airlines Co., Alaska Air Group, Inc., and Delta Air Lines, Inc., also hampered the portfolio’s overall performance. The Fund continues to hold all of the stocks mentioned.
Portfolio Strategy:
The Fund’s investment strategy is based on identifying large and well-established companies that trade at below average price-to-cash flow ratios. The Fund also seeks to invest only in what it deems to be higher-quality businesses and thus focuses on companies with high returns on total capital.
Market Outlook:
Over the twelve-month period ended October 31, 2016, U.S. equities produced moderate, positive returns. The period was once again marked by a great deal of volatility, with major market indices dropping more than 10% at one point early in the year before recovering all of their losses. Throughout this period, there have been concerns about interest rates, commodity prices, economic growth (both domestic and international) and the U.S. Presidential election. Many, if not all, of these concerns still exist in the marketplace today, but we have reasons to be hopeful for the year to come.
First, while corporate profits have been on a gentle slide downwards since the fourth quarter of 2014, market analysts are now forecasting a return to growth in profits in the fourth quarter of this year. We believe these forecasts have a good chance of being proved correct. Second, mergers and acquisitions have been strong and steady this year and we believe such activity will continue next year, helping drive revenue and earnings for the acquiring companies. Third, we do not believe the majority of stocks are expensive at this point, though many are probably fairly valued. The Dow Jones Industrial Average and the S&P 500 Index have forward PE ratios of roughly 18x and 19x, respectively, close to long-term averages although slightly higher than six months ago. Corporate balance sheets appear to be in excellent shape, and while executives have shown some reluctance to increase capital spending beyond maintenance levels this cycle, we believe companies outside of the Energy sector will eventually start investing for expansion. Overall, we believe the basic fundamentals of the market are attractive, and we continue to be optimistic about the possibility of further moderate market advances over the course of next year.
Investment Outlook:
We are confident that there continue to be good investment opportunities in the large-cap space. While we believe higher interest rates may lead to an even stronger U.S. Dollar and difficulties for exporters, large-cap companies with more domestically focused businesses are benefiting from steady economic growth at home, low inflation and low energy prices. With consumer debt levels falling and wage growth finally starting to accelerate, we are expecting a good year for consumer-based companies. We remain pleased with the positioning of the portfolio, which includes a large number of companies that are domestically focused and that we believe are reasonably valued and appear poised for growth. Relative to the Fund’s benchmarks, the portfolio remains overweight in both the Consumer Discretionary and Industrial sectors, and we think that these areas of the market offer great growth potential in 2017.
| HENNESSY FUNDS | 1-800-966-4354 | |
_______________
Opinions expressed are those of the Portfolio Managers as of the date written and are subject to change, are not guaranteed, and should not be considered investment advice or an indication of trading intent.
The Russell 1000® Index is commonly used to measure the performance of large-capitalization U.S. stocks. The S&P 500 Index and Dow Jones Industrial Average are unmanaged indices commonly used to measure the performance of U.S. stocks. One cannot invest directly in an index.
The Fund may invest in medium capitalized companies, which may have more limited liquidity and greater price volatility than large capitalization companies. The Fund’s formula-based strategy may cause the Fund to buy or sell securities at times when it may not be advantageous. Please see the Fund’s prospectus for a more complete discussion of these and other risks.
References to specific securities should not be considered a recommendation to buy or sell any security. Fund holdings and sector allocations are subject to change. Please refer to the Schedule of Investments included in this report for additional portfolio information.
Earnings growth is not a measure of the Fund’s future performance. PE, or price to earnings, is calculated by dividing a company’s market price per share by its earnings per share. Price-to-cash flow ratio is a stock valuation measure calculated by dividing a company’s cash flow per share into its current stock price.
HENNESSYFUNDS.COM
| PERFORMANCE OVERVIEW/SCHEDULE OF INVESTMENTS |
Financial Statements
Schedule of Investments as of October 31, 2016 |
HENNESSY CORNERSTONE LARGE GROWTH FUND
(% of Net Assets)
| TOP TEN HOLDINGS (EXCLUDING CASH/CASH EQUIVALENTS) | % NET ASSETS |
| | |
| QUALCOMM, Inc. | 2.76% |
| | |
| Cummins, Inc. | 2.57% |
| | |
| Harley-Davidson, Inc. | 2.57% |
| | |
| Best Buy Co., Inc. | 2.53% |
| | |
| Caterpillar, Inc. | 2.40% |
| | |
| FedEx Corp. | 2.39% |
| | |
| Las Vegas Sands Corp. | 2.37% |
| | |
| Baxter International, Inc. | 2.34% |
| | |
| Parker-Hannifin Corp. | 2.28% |
| | |
| Union Pacific Corp. | 2.20% |
Note: For presentation purposes, the Fund has grouped some of the industry categories. For purposes of categorizing securities for compliance with Section 8(b)(1) of the Investment Company Act of 1940, as amended, the Fund uses more specific industry classifications.
| HENNESSY FUNDS | 1-800-966-4354 | |
| | COMMON STOCKS – 99.05% | | Number | | | | | | % of | |
| | | | of Shares | | | Value | | | Net Assets | |
| | Consumer Discretionary – 24.92% | | | | | | | | | |
| | Bed Bath & Beyond, Inc. | | | 41,800 | | | $ | 1,689,556 | | | | 1.69 | % |
| | Best Buy Co., Inc. | | | 65,000 | | | | 2,529,150 | | | | 2.53 | % |
| | Darden Restaurants, Inc. | | | 27,700 | | | | 1,794,683 | | | | 1.79 | % |
| | Harley-Davidson, Inc. | | | 45,000 | | | | 2,565,900 | | | | 2.57 | % |
| | Kohl’s Corp. | | | 36,500 | | | | 1,596,875 | | | | 1.60 | % |
| | Las Vegas Sands Corp. | | | 40,900 | | | | 2,367,292 | | | | 2.37 | % |
| | Macy’s, Inc. | | | 44,300 | | | | 1,616,507 | | | | 1.62 | % |
| | Nordstrom, Inc. | | | 36,500 | | | | 1,898,000 | | | | 1.90 | % |
| | Ralph Lauren Corp. | | | 16,000 | | | | 1,569,600 | | | | 1.57 | % |
| | Target Corp. | | | 24,700 | | | | 1,697,631 | | | | 1.70 | % |
| | The Gap, Inc. | | | 73,000 | | | | 2,014,070 | | | | 2.01 | % |
| | Tiffany & Co. | | | 28,500 | | | | 2,092,470 | | | | 2.09 | % |
| | Viacom, Inc. | | | 39,300 | | | | 1,476,108 | | | | 1.48 | % |
| | | | | | | | | 24,907,842 | | | | 24.92 | % |
| | | | | | | | | | | | | | |
| | Consumer Staples – 5.07% | | | | | | | | | | | | |
| | The Kroger Co. | | | 46,300 | | | | 1,434,374 | | | | 1.44 | % |
| | Wal-Mart Stores, Inc. | | | 27,300 | | | | 1,911,546 | | | | 1.91 | % |
| | Whole Foods Market, Inc. | | | 60,700 | | | | 1,717,203 | | | | 1.72 | % |
| | | | | | | | | 5,063,123 | | | | 5.07 | % |
| | | | | | | | | | | | | | |
| | Energy – 5.28% | | | | | | | | | | | | |
| | Marathon Petroleum Corp. | | | 43,600 | | | | 1,900,524 | | | | 1.90 | % |
| | Tesoro Corp. | | | 20,900 | | | | 1,775,873 | | | | 1.78 | % |
| | Valero Energy Corp. | | | 27,100 | | | | 1,605,404 | | | | 1.60 | % |
| | | | | | | | | 5,281,801 | | | | 5.28 | % |
| | | | | | | | | | | | | | |
| | Financials – 3.57% | | | | | | | | | | | | |
| | Franklin Resources, Inc. | | | 52,600 | | | | 1,770,516 | | | | 1.77 | % |
| | The Progressive Corp. | | | 57,000 | | | | 1,796,070 | | | | 1.80 | % |
| | | | | | | | | 3,566,586 | | | | 3.57 | % |
| | | | | | | | | | | | | | |
| | Health Care – 5.79% | | | | | | | | | | | | |
| | Baxter International, Inc. | | | 49,100 | | | | 2,336,669 | | | | 2.34 | % |
| | Gilead Sciences, Inc. | | | 20,000 | | | | 1,472,600 | | | | 1.47 | % |
| | HCA Holdings, Inc. (a) | | | 25,900 | | | | 1,982,127 | | | | 1.98 | % |
| | | | | | | | | 5,791,396 | | | | 5.79 | % |
The accompanying notes are an integral part of these financial statements.
HENNESSYFUNDS.COM
| | COMMON STOCKS | | Number | | | | | | % of | |
| | | | of Shares | | | Value | | | Net Assets | |
| | Industrials – 37.26% | | | | | | | | | |
| | Alaska Air Group, Inc. | | | 25,500 | | | $ | 1,841,610 | | | | 1.84 | % |
| | American Airlines Group, Inc. | | | 45,900 | | | | 1,863,540 | | | | 1.86 | % |
| | Caterpillar, Inc. | | | 28,700 | | | | 2,395,302 | | | | 2.40 | % |
| | Cummins, Inc. | | | 20,100 | | | | 2,569,182 | | | | 2.57 | % |
| | Deere & Co. | | | 23,400 | | | | 2,066,220 | | | | 2.07 | % |
| | Delta Air Lines, Inc. | | | 40,600 | | | | 1,695,862 | | | | 1.70 | % |
| | Dover Corp. | | | 30,900 | | | | 2,066,901 | | | | 2.07 | % |
| | Emerson Electric Co. | | | 39,300 | | | | 1,991,724 | | | | 1.99 | % |
| | FedEx Corp. | | | 13,700 | | | | 2,388,184 | | | | 2.39 | % |
| | General Dynamics Corp. | | | 13,600 | | | | 2,050,064 | | | | 2.05 | % |
| | JetBlue Airways Corp. (a) | | | 87,900 | | | | 1,536,492 | | | | 1.54 | % |
| | PACCAR, Inc. | | | 37,000 | | | | 2,032,040 | | | | 2.03 | % |
| | Parker-Hannifin Corp. | | | 18,600 | | | | 2,283,150 | | | | 2.28 | % |
| | Southwest Airlines Co. | | | 48,400 | | | | 1,938,420 | | | | 1.94 | % |
| | The Boeing Co. | | | 14,800 | | | | 2,107,964 | | | | 2.11 | % |
| | Union Pacific Corp. | | | 25,000 | | | | 2,204,500 | | | | 2.20 | % |
| | United Continental Holdings, Inc. (a) | | | 38,000 | | | | 2,136,740 | | | | 2.14 | % |
| | United Technologies Corp. | | | 20,300 | | | | 2,074,660 | | | | 2.08 | % |
| | | | | | | | | 37,242,555 | | | | 37.26 | % |
| | | | | | | | | | | | | | |
| | Information Technology – 13.36% | | | | | | | | | | | | |
| | Apple, Inc. | | | 18,650 | | | | 2,117,521 | | | | 2.12 | % |
| | eBay, Inc. (a) | | | 75,700 | | | | 2,158,207 | | | | 2.16 | % |
| | Intel Corp. | | | 58,500 | | | | 2,039,895 | | | | 2.04 | % |
| | International Business Machines Corp. | | | 14,300 | | | | 2,197,767 | | | | 2.20 | % |
| | QUALCOMM, Inc. | | | 40,200 | | | | 2,762,544 | | | | 2.76 | % |
| | Skyworks Solutions, Inc. | | | 27,000 | | | | 2,077,380 | | | | 2.08 | % |
| | | | | | | | | 13,353,314 | | | | 13.36 | % |
| | | | | | | | | | | | | | |
| | Materials – 2.08% | | | | | | | | | | | | |
| | Praxair, Inc. | | | 17,800 | | | | 2,083,668 | | | | 2.08 | % |
| | | | | | | | | | | | | | |
| | Telecommunication Services – 1.72% | | | | | | | | | | | | |
| | Verizon Communications, Inc. | | | 35,700 | | | | 1,717,170 | | | | 1.72 | % |
| | | | | | | | | | | | | | |
| | Total Common Stocks | | | | | | | | | | | | |
| | (Cost $91,866,661) | | | | | | | 99,007,455 | | | | 99.05 | % |
The accompanying notes are an integral part of these financial statements.
| HENNESSY FUNDS | 1-800-966-4354 | |
| | SHORT-TERM INVESTMENTS – 1.10% | | Number | | | | | | % of | |
| | | | of Shares | | | Value | | | Net Assets | |
| | Money Market Funds – 1.10% | | | | | | | | | |
| | Fidelity Government Portfolio, Institutional Class, 0.27% (b) | | | 1,104,589 | | | $ | 1,104,589 | | | | 1.10 | % |
| | | | | | | | | | | | | | |
| | Total Short-Term Investments | | | | | | | | | | | | |
| | (Cost $1,104,589) | | | | | | | 1,104,589 | | | | 1.10 | % |
| | | | | | | | | | | | | | |
| | Total Investments | | | | | | | | | | | | |
| | (Cost $92,971,250) – 100.15% | | | | | | | 100,112,044 | | | | 100.15 | % |
| | Liabilities in Excess | | | | | | | | | | | | |
| | of Other Assets – (0.15)% | | | | | | | (145,637 | ) | | | (0.15 | )% |
| | | | | | | | | | | | | | |
| | TOTAL NET ASSETS – 100.00% | | | | | | $ | 99,966,407 | | | | 100.00 | % |
Percentages are stated as a percent of net assets.
| (a) | Non-income producing security. |
| (b) | The rate listed is the fund’s 7-day yield as of October 31, 2016. |
Summary of Fair Value Exposure at October 31, 2016
The following is a summary of the inputs used to value the Fund’s net assets as of October 31, 2016 (see Note 3 in the accompanying notes to the financial statements):
| Common Stocks | | Level 1 | | | Level 2 | | | Level 3 | | | Total | |
| Consumer Discretionary | | $ | 24,907,842 | | | $ | — | | | $ | — | | | $ | 24,907,842 | |
| Consumer Staples | | | 5,063,123 | | | | — | | | | — | | | | 5,063,123 | |
| Energy | | | 5,281,801 | | | | — | | | | — | | | | 5,281,801 | |
| Financials | | | 3,566,586 | | | | — | | | | — | | | | 3,566,586 | |
| Health Care | | | 5,791,396 | | | | — | | | | — | | | | 5,791,396 | |
| Industrials | | | 37,242,555 | | | | — | | | | — | | | | 37,242,555 | |
| Information Technology | | | 13,353,314 | | | | — | | | | — | | | | 13,353,314 | |
| Materials | | | 2,083,668 | | | | — | | | | — | | | | 2,083,668 | |
| Telecommunication Services | | | 1,717,170 | | | | — | | | | — | | | | 1,717,170 | |
| Total Common Stocks | | $ | 99,007,455 | | | $ | — | | | $ | — | | | $ | 99,007,455 | |
| Short-Term Investments | | | | | | | | | | | | | | | | |
| Money Market Funds | | $ | 1,104,589 | | | $ | — | | | $ | — | | | $ | 1,104,589 | |
| Total Short-Term Investments | | $ | 1,104,589 | | | $ | — | | | $ | — | | | $ | 1,104,589 | |
| Total Investments | | $ | 100,112,044 | | | $ | — | | | $ | — | | | $ | 100,112,044 | |
Transfers between levels are recognized at the end of the reporting period. During the year ended October 31, 2016, the Fund recognized no transfers between levels.
The accompanying notes are an integral part of these financial statements.
HENNESSYFUNDS.COM
| SCHEDULE OF INVESTMENTS/STATEMENT OF ASSETS AND LIABILITIES |
Financial Statements
Statement of Assets and Liabilities as of October 31, 2016 |
| ASSETS: | | | |
| Investments in securities, at value (cost $92,971,250) | | $ | 100,112,044 | |
| Dividends and interest receivable | | | 82,878 | |
| Receivable for fund shares sold | | | 572 | |
| Prepaid expenses and other assets | | | 16,097 | |
| Total Assets | | | 100,211,591 | |
| | | | | |
| LIABILITIES: | | | | |
| Payable for fund shares redeemed | | | 24,275 | |
| Payable to advisor | | | 62,796 | |
| Payable to administrator | | | 16,487 | |
| Payable to auditor | | | 21,280 | |
| Accrued distribution fees | | | 84,845 | |
| Accrued service fees | | | 7,442 | |
| Accrued trustees fees | | | 3,898 | |
| Accrued expenses and other payables | | | 24,161 | |
| Total Liabilities | | | 245,184 | |
| NET ASSETS | | $ | 99,966,407 | |
| | | | | |
| NET ASSETS CONSIST OF: | | | | |
| Capital stock | | $ | 96,254,709 | |
| Accumulated net investment income | | | 1,258,527 | |
| Accumulated net realized loss on investments | | | (4,687,623 | ) |
| Unrealized net appreciation on investments | | | 7,140,794 | |
| Total Net Assets | | $ | 99,966,407 | |
| | | | | |
| NET ASSETS | | | | |
| Investor Class: | | | | |
| Shares authorized (no par value) | | Unlimited | |
| Net assets applicable to outstanding Investor Class shares | | $ | 87,728,399 | |
| Shares issued and outstanding | | | 8,542,207 | |
| Net asset value, offering price and redemption price per share | | $ | 10.27 | |
| | | | | |
| Institutional Class: | | | | |
| Shares authorized (no par value) | | Unlimited | |
| Net assets applicable to outstanding Institutional Class shares | | $ | 12,238,008 | |
| Shares issued and outstanding | | | 1,180,401 | |
| Net asset value, offering price and redemption price per share | | $ | 10.37 | |
The accompanying notes are an integral part of these financial statements.
| HENNESSY FUNDS | 1-800-966-4354 | |
Financial Statements
Statement of Operations for the year ended October 31, 2016 |
| INVESTMENT INCOME: | | | |
| Dividend income | | $ | 2,483,487 | |
| Interest income | | | 5,789 | |
| Total investment income | | | 2,489,276 | |
| | | | | |
| EXPENSES: | | | | |
| Investment advisory fees (See Note 5) | | | 744,336 | |
| Distribution fees – Investor Class (See Note 5) | | | 132,283 | |
| Administration, fund accounting, custody and transfer agent fees (See Note 5) | | | 98,085 | |
| Service fees – Investor Class (See Note 5) | | | 88,189 | |
| Sub-transfer agent expenses – Investor Class (See Note 5) | | | 42,576 | |
| Sub-transfer agent expenses – Institutional Class (See Note 5) | | | 6,257 | |
| Federal and state registration fees | | | 30,392 | |
| Compliance expense (See Note 5) | | | 23,710 | |
| Audit fees | | | 21,772 | |
| Reports to shareholders | | | 16,094 | |
| Trustees’ fees and expenses | | | 15,403 | |
| Legal fees | | | 790 | |
| Interest expense (See Note 7) | | | 276 | |
| Other expenses | | | 10,539 | |
| Total expenses | | | 1,230,702 | |
| NET INVESTMENT INCOME | | $ | 1,258,574 | |
| | | | | |
| REALIZED AND UNREALIZED GAINS (LOSSES): | | | | |
| Net realized loss on investments | | $ | (4,660,170 | ) |
| Net change in unrealized appreciation on investments | | | 5,641,171 | |
| Net gain on investments | | | 981,001 | |
| NET INCREASE IN NET ASSETS RESULTING FROM OPERATIONS | | $ | 2,239,575 | |
The accompanying notes are an integral part of these financial statements.
HENNESSYFUNDS.COM
| STATEMENT OF OPERATIONS/STATEMENTS OF CHANGES IN NET ASSETS |
Financial Statements
| Statements of Changes in Net Assets |
| | | Year Ended | | | Year Ended | |
| | | October 31, 2016 | | | October 31, 2015 | |
| OPERATIONS: | | | | | | |
| Net investment income | | $ | 1,258,574 | | | $ | 1,652,828 | |
| Net realized gain (loss) on investments | | | (4,660,170 | ) | | | 23,691,496 | |
| Net change in unrealized | | | | | | | | |
| appreciation (depreciation) on investments | | | 5,641,171 | | | | (23,789,596 | ) |
| Net increase in net assets resulting from operations | | | 2,239,575 | | | | 1,554,728 | |
| | | | | | | | | |
| DISTRIBUTIONS TO SHAREHOLDERS FROM: | | | | | | | | |
| Net investment income | | | | | | | | |
| Investor Class | | | (1,432,337 | ) | | | (1,131,289 | ) |
| Institutional Class | | | (220,462 | ) | | | (182,392 | ) |
| Net realized gains | | | | | | | | |
| Investor Class | | | (19,800,250 | ) | | | (15,515,006 | ) |
| Institutional Class | | | (2,853,456 | ) | | | (2,199,959 | ) |
| Total distributions | | | (24,306,505 | ) | | | (19,028,646 | ) |
| | | | | | | | | |
| CAPITAL SHARE TRANSACTIONS: | | | | | | | | |
| Proceeds from shares subscribed – Investor Class | | | 3,720,536 | | | | 10,488,951 | |
| Proceeds from shares subscribed – Institutional Class | | | 414,799 | | | | 1,162,873 | |
| Dividends reinvested – Investor Class | | | 20,149,648 | | | | 15,613,606 | |
| Dividends reinvested – Institutional Class | | | 2,974,276 | | | | 2,276,330 | |
| Cost of shares redeemed – Investor Class | | | (15,493,334 | ) | | | (17,679,567 | ) |
| Cost of shares redeemed – Institutional Class | | | (2,192,433 | ) | | | (2,316,917 | ) |
| Net increase in net assets derived from | | | | | | | | |
| capital share transactions | | | 9,573,492 | | | | 9,545,276 | |
| TOTAL DECREASE IN NET ASSETS | | | (12,493,438 | ) | | | (7,928,641 | ) |
| | | | | | | | | |
| NET ASSETS: | | | | | | | | |
| Beginning of year | | | 112,459,845 | | | | 120,388,486 | |
| End of year | | $ | 99,966,407 | | | $ | 112,459,845 | |
| Undistributed net investment income, end of year | | $ | 1,258,527 | | | $ | 1,652,799 | |
| | | | | | | | | |
| CHANGES IN SHARES OUTSTANDING: | | | | | | | | |
| Shares sold – Investor Class | | | 366,149 | | | | 772,173 | |
| Shares sold – Institutional Class | | | 40,906 | | | | 84,750 | |
| Shares issued to holders as reinvestment | | | | | | | | |
| of dividends – Investor Class | | | 2,044,705 | | | | 1,169,440 | |
| Shares issued to holders as reinvestment | | | | | | | | |
| of dividends – Institutional Class | | | 299,398 | | | | 168,993 | |
| Shares redeemed – Investor Class | | | (1,461,302 | ) | | | (1,307,953 | ) |
| Shares redeemed – Institutional Class | | | (214,449 | ) | | | (171,821 | ) |
| Net increase in shares outstanding | | | 1,075,407 | | | | 715,582 | |
The accompanying notes are an integral part of these financial statements.
| HENNESSY FUNDS | 1-800-966-4354 | |
Financial Statements
For an Investor Class share outstanding throughout each year
PER SHARE DATA:
Net asset value, beginning of year
Income from investment operations:
Net investment income
Net realized and unrealized gains on investments
Total from investment operations
Less distributions:
Dividends from net investment income
Dividends from net realized gains
Total distributions
Net asset value, end of year
TOTAL RETURN
SUPPLEMENTAL DATA AND RATIOS:
Net assets, end of year (millions)
Ratio of expenses to average net assets
Ratio of net investment income to average net assets
Portfolio turnover rate(1)
(1) | Portfolio turnover is calculated on the basis of the Fund as a whole. |
The accompanying notes are an integral part of these financial statements.
HENNESSYFUNDS.COM
| FINANCIAL HIGHLIGHTS — INVESTOR CLASS |
| Year Ended October 31, | |
| 2016 | | | 2015 | | | 2014 | | | 2013 | | | 2012 | |
| | | | | | | | | | | | | | |
| $ | 12.99 | | | $ | 15.16 | | | $ | 13.56 | | | $ | 10.77 | | | $ | 12.37 | |
| | | | | | | | | | | | | | | | | | | |
| | | | | | | | | | | | | | | | | | | |
| | 0.09 | | | | 0.17 | | | | 0.15 | | | | 0.14 | | | | 0.13 | |
| | 0.08 | | | | 0.04 | | | | 2.28 | | | | 2.77 | | | | 0.80 | |
| | 0.17 | | | | 0.21 | | | | 2.43 | | | | 2.91 | | | | 0.93 | |
| | | | | | | | | | | | | | | | | | | |
| | | | | | | | | | | | | | | | | | | |
| | (0.16 | ) | | | (0.14 | ) | | | (0.15 | ) | | | (0.10 | ) | | | (0.07 | ) |
| | (2.73 | ) | | | (2.24 | ) | | | (0.68 | ) | | | (0.02 | ) | | | (2.46 | ) |
| | (2.89 | ) | | | (2.38 | ) | | | (0.83 | ) | | | (0.12 | ) | | | (2.53 | ) |
| $ | 10.27 | | | $ | 12.99 | | | $ | 15.16 | | | $ | 13.56 | | | $ | 10.77 | |
| | | | | | | | | | | | | | | | | | | |
| | 2.63 | % | | | 1.11 | % | | | 18.73 | % | | | 27.32 | % | | | 9.14 | % |
| | | | | | | | | | | | | | | | | | | |
| | | | | | | | | | | | | | | | | | | |
| $ | 87.73 | | | $ | 98.64 | | | $ | 105.51 | | | $ | 88.77 | | | $ | 75.83 | |
| | 1.25 | % | | | 1.09 | % | | | 1.15 | % | | | 1.19 | % | | | 1.27 | % |
| | 1.22 | % | | | 1.37 | % | | | 1.12 | % | | | 1.10 | % | | | 1.35 | % |
| | 53 | % | | | 79 | % | | | 57 | % | | | 73 | % | | | 0 | % |
The accompanying notes are an integral part of these financial statements.
| HENNESSY FUNDS | 1-800-966-4354 | |
Financial Statements
For an Institutional Class share outstanding throughout each year
PER SHARE DATA:
Net asset value, beginning of year
Income from investment operations:
Net investment income
Net realized and unrealized gains on investments
Total from investment operations
Less distributions:
Dividends from net investment income
Dividends from net realized gains
Total distributions
Net asset value, end of year
TOTAL RETURN
SUPPLEMENTAL DATA AND RATIOS:
Net assets, end of year (millions)
Ratio of expenses to average net assets:
Before expense reimbursement
After expense reimbursement
Ratio of net investment income to average net assets:
Before expense reimbursement
After expense reimbursement
Portfolio turnover rate(1)
(1) | Portfolio turnover is calculated on the basis of the Fund as a whole. |
The accompanying notes are an integral part of these financial statements.
HENNESSYFUNDS.COM
| FINANCIAL HIGHLIGHTS — INSTITUTIONAL CLASS |
| Year Ended October 31, | |
| 2016 | | | 2015 | | | 2014 | | | 2013 | | | 2012 | |
| | | | | | | | | | | | | | |
| $ | 13.10 | | | $ | 15.30 | | | $ | 13.68 | | | $ | 10.85 | | | $ | 12.44 | |
| | | | | | | | | | | | | | | | | | | |
| | | | | | | | | | | | | | | | | | | |
| | 0.13 | | | | 0.20 | | | | 0.17 | | | | 0.09 | | | | 0.07 | |
| | 0.07 | | | | 0.02 | | | | 2.30 | | | | 2.88 | | | | 0.89 | |
| | 0.20 | | | | 0.22 | | | | 2.47 | | | | 2.97 | | | | 0.96 | |
| | | | | | | | | | | | | | | | | | | |
| | | | | | | | | | | | | | | | | | | |
| | (0.17 | ) | | | (0.16 | ) | | | (0.17 | ) | | | (0.12 | ) | | | (0.09 | ) |
| | (2.76 | ) | | | (2.26 | ) | | | (0.68 | ) | | | (0.02 | ) | | | (2.46 | ) |
| | (2.93 | ) | | | (2.42 | ) | | | (0.85 | ) | | | (0.14 | ) | | | (2.55 | ) |
| $ | 10.37 | | | $ | 13.10 | | | $ | 15.30 | | | $ | 13.68 | | | $ | 10.85 | |
| | | | | | | | | | | | | | | | | | | |
| | 2.92 | % | | | 1.19 | % | | | 18.96 | % | | | 27.63 | % | | | 9.43 | % |
| | | | | | | | | | | | | | | | | | | |
| | | | | | | | | | | | | | | | | | | |
| $ | 12.24 | | | $ | 13.82 | | | $ | 14.88 | | | $ | 16.19 | | | $ | 33.94 | |
| | | | | | | | | | | | | | | | | | | |
| | 1.01 | % | | | 0.99 | % | | | 1.06 | % | | | 1.10 | % | | | 1.41 | % |
| | 1.01 | % | | | 0.99 | % | | | 0.98 | % | | | 0.98 | % | | | 0.98 | % |
| | | | | | | | | | | | | | | | | | | |
| | 1.47 | % | | | 1.47 | % | | | 1.21 | % | | | 1.38 | % | | | 6.44 | % |
| | 1.47 | % | | | 1.47 | % | | | 1.30 | % | | | 1.50 | % | | | 6.87 | % |
| | 53 | % | | | 79 | % | | | 57 | % | | | 73 | % | | | 0 | % |
The accompanying notes are an integral part of these financial statements.
| HENNESSY FUNDS | 1-800-966-4354 | |
Financial Statements
Notes to the Financial Statements October 31, 2016 |
1). ORGANIZATION
The Hennessy Cornerstone Large Growth Fund (the “Fund”) is a series of Hennessy Funds Trust (the “Trust”), which was organized as a Delaware statutory trust on September 17, 1992. The Fund is an open-end management investment company registered under the Investment Company Act of 1940, as amended. The investment objective of the Fund is long-term growth of capital. The Fund is a diversified fund.
The Fund offers Investor Class and Institutional Class shares. Each class of shares differs principally in its respective administration, 12b-1 distribution and service, shareholder servicing, and transfer agent expenses (there are no sales charges). Each class has identical rights to earnings, assets, and voting privileges, except for class-specific expenses and exclusive rights to vote on matters affecting only an individual class.
As an investment company, the Fund follows the investment company accounting and reporting guidance of the Financial Accounting Standards Board (“FASB”) Accounting Standard Codification Topic 946 “Financial Services—Investment Companies.”
2). SIGNIFICANT ACCOUNTING POLICIES
The following is a summary of significant accounting policies consistently followed by the Fund in the preparation of the financial statements. These policies conform with U.S. generally accepted accounting principles (“GAAP”).
| a). | Investment Valuation – All investments in securities are recorded at their estimated fair value, as described in Note 3. |
| | |
| b). | Federal Income Taxes – No provision for federal income taxes or excise taxes has been made since the Fund has elected to be taxed as a “regulated investment company” and intends to distribute substantially all of its taxable income to its shareholders and otherwise comply with the provisions of the Internal Revenue Code of 1986, as amended, applicable to regulated investment companies. Net investment income or loss and realized gains and losses for federal income tax purposes may differ from that reported on the financial statements because of temporary book and tax basis differences. Temporary differences are primarily the result of the treatment of wash sales for tax reporting purposes. The Fund recognizes interest and penalties related to income tax benefits, if any, in the statement of operations as an income tax expense. Distributions from net realized gains for book purposes may include short-term capital gains, which are included as ordinary income to shareholders for tax purposes. |
| | |
| | Due to inherent differences in the recognition of income, expenses, and realized gains/losses under GAAP and federal income tax regulations, permanent differences between book and tax basis for reporting for the fiscal year ended October 31, 2016, have been identified and appropriately reclassified on the Statement of Assets and Liabilities. The adjustments are as follows: |
| | Undistributed | Accumulated | | |
| | Net Investment | Net Realized | | |
| | Income/(Loss) | Gain/(Loss) | Paid-in Capital | |
| | $(47) | $1,015,300 | $(1,015,253) | |
HENNESSYFUNDS.COM
| NOTES TO THE FINANCIAL STATEMENTS |
| c). | Accounting for Uncertainty in Income Taxes – The Fund has accounting policies regarding recognition and measurement of tax positions taken or expected to be taken on a tax return. The tax returns of the Fund for the prior three fiscal years are open for examination. The Fund has reviewed all open tax years in major jurisdictions and concluded that there is no impact on the Fund’s net assets and no tax liability resulting from unrecognized tax benefits relating to uncertain income tax positions taken or expected to be taken on a tax return. The Fund’s major tax jurisdictions are U.S. federal and Delaware. |
| | |
| d). | Income and Expenses – Dividend income is recognized on the ex-dividend date or as soon as information is available to the Fund. Interest income, which includes the amortization of premium and accretion of discount, is recognized on an accrual basis. The Fund is charged for those expenses that are directly attributable to the portfolio, such as advisory, administration, and certain shareholder service fees. Income, expenses (other than expenses attributable to a specific class), and realized and unrealized gains or losses on investments are allocated to each class of shares based on its respective net assets. |
| | |
| e). | Distributions to Shareholders – Dividends from net investment income for the Fund, if any, are declared and paid annually, usually in December. Distributions of net realized capital gains, if any, are declared and paid annually, usually in December. |
| | |
| f). | Security Transactions – Investment and shareholder transactions are recorded on the trade date. The Fund determines the gain or loss realized from the investment transactions by comparing the original cost of the security lot sold with the net sale proceeds. Discounts and premiums on securities purchased are accreted/amortized over the life of the respective security. |
| | |
| g). | Use of Estimates – The preparation of financial statements in conformity with GAAP requires management to make estimates and assumptions that affect the reported amounts of assets and liabilities and disclosure of contingent assets and liabilities at the date of the financial statements and the reported change in net assets during the reporting period. Actual results could differ from those estimates. |
| | |
| h). | Share Valuation – The net asset value (“NAV”) per share of the Fund is calculated by dividing the sum of the value of the securities held by the Fund, plus cash or other assets, minus all liabilities (including estimated accrued expenses) by the total number of shares outstanding for the Fund, rounded to the nearest cent. The Fund’s shares will not be priced on days the New York Stock Exchange is closed for trading. The offering and redemption price per share for the Fund is equal to the Fund’s NAV per share. |
| | |
| i). | Repurchase Agreements – The Fund may enter into repurchase agreements with member banks or security dealers of the Federal Reserve Board whom the investment advisor deems creditworthy. The repurchase price generally equals the price paid by the Fund plus interest negotiated on the basis of current short-term rates. |
| | |
| | Securities pledged as collateral for repurchase agreements are held by the custodian bank until the respective agreements mature. Provisions of the repurchase agreements ensure that the market value of the collateral, including accrued interest thereon, is sufficient to cover the repurchase amount in the event of default of the counterparty. If the counterparty defaults and the value of the collateral declines or if the counterparty enters an insolvency proceeding, realization of the collateral by the Fund may be delayed or limited. During the fiscal year ended October 31, 2016, the Fund did not enter into any repurchase agreements. |
| | |
| j). | Derivatives – The Fund may invest in, or enter into, derivatives, such as options, futures contracts, options on futures contracts, and swaps, for a variety of reasons, including to |
| HENNESSY FUNDS | 1-800-966-4354 | |
| | hedge certain risks, to provide a substitute for purchasing or selling particular securities, or to increase potential income gain. Derivatives are financial contracts based on an underlying or notional amount, require no initial investment or an initial net investment that is smaller than would normally be required to have a similar response to changes in market factors, and require or permit net settlement. Derivatives may allow the Fund to increase or decrease the level of risk to which the Fund is exposed more quickly and efficiently than transactions in other types of instruments. The main purpose of utilizing derivative instruments is for hedging purposes. |
| | |
| | The Fund follows the financial accounting reporting rules as required by the Derivatives and Hedging Topic of the FASB Accounting Standards Codification. Under such rules, the Fund is required to include enhanced disclosure that enables investors to understand how and why an entity uses derivatives, how derivatives are accounted for, and how derivatives instruments affect an entity’s results of operations and financial position. During the fiscal year ended October 31, 2016, the Fund did not hold any derivative instruments. |
| | |
| k). | New Accounting Pronouncements – In May 2015, the FASB issued ASU No. 2015-07 “Disclosure for Investments in Certain Entities that Calculate Net Asset Value per Share (or Its Equivalent).” The amendments in ASU No. 2015-07 remove the requirement to categorize within the fair value hierarchy investments measured at NAV and require the disclosure of sufficient information to reconcile the fair value of the remaining assets categorized within the fair value hierarchy to the financial statements. The amendments in ASU No. 2015-07 are effective for fiscal years beginning after December 15, 2015, and interim periods within those fiscal years. Management has reviewed the requirements and believes the adoption of ASU 2015-07 will not have a material impact on the Fund’s financial statements and related disclosures. |
3). SECURITIES VALUATION
The Fund follows authoritative fair valuation accounting standards that establish an authoritative definition of fair value and set out a hierarchy for measuring fair value. These standards require additional disclosures about the various inputs and valuation techniques used to develop the measurements of fair value and a discussion in changes in valuation techniques and related inputs during the period. These inputs are summarized in the three broad levels listed below:
| | Level 1 – | Unadjusted, quoted prices in active markets for identical instruments that the Fund has the ability to access at the date of measurement. |
| | | |
| | Level 2 – | Other significant observable inputs (including, but not limited to, quoted prices in active markets for similar instruments, quoted prices in markets that are not active for identical or similar instruments, and model-derived valuations in which all significant inputs and significant value drivers are observable in active markets (such as interest rates, prepayment speeds, credit risk curves, default rates, and similar data)). |
| | | |
| | Level 3 – | Significant unobservable inputs (including the Fund’s own assumptions about what market participants would use to price the asset or liability based on the best available information) when observable inputs are unavailable. |
Following is a description of the valuation techniques applied to the Fund’s major categories of assets and liabilities measured at fair value on a recurring basis.
Equity Securities – Equity securities, including common stocks, preferred stocks, exchange-traded funds, closed-end mutual funds, partnerships, rights, and real estate investment trusts, that are traded on a securities exchange for which a last-quoted sales
HENNESSYFUNDS.COM
| NOTES TO THE FINANCIAL STATEMENTS |
price is readily available will generally be valued at the last sales price as reported by the primary exchange on which the securities are listed. Securities listed on The NASDAQ Stock Market (“NASDAQ”) will generally be valued at the NASDAQ Official Closing Price, which may differ from the last sales price reported. Securities traded on a securities exchange for which a last-quoted sales price is not readily available will generally be valued at the mean between the bid and ask prices. To the extent these securities are actively traded and valuation adjustments are not applied, they are classified in Level 1 of the fair value hierarchy.
Registered Investment Companies – Investments in registered investment companies (e.g., mutual funds) are generally priced at the ending NAV provided by the applicable registered investment company’s service agent and will be classified in Level 1 of the fair value hierarchy.
Debt Securities – Debt securities, including corporate bonds, asset-backed securities, mortgage-backed securities, municipal bonds, U.S. Treasuries, and U.S. government agency issues, are generally valued at market on the basis of valuations furnished by an independent pricing service that utilizes both dealer-supplied valuations and formula-based techniques. The pricing service may consider recently executed transactions in securities of the issuer or comparable issuers, market price quotations (where observable), bond spreads, and fundamental data relating to the issuer. In addition, the model may incorporate observable market data, such as reported sales of similar securities, broker quotes, yields, bids, offers, and reference data. Certain securities are valued primarily using dealer quotations. These securities are generally classified in Level 2 of the fair value hierarchy.
Short-Term Securities – Short-term equity investments, including money market funds, are valued in the manner specified above. Short-term debt investments with an original term to maturity of 60 days or less are valued at amortized cost, which approximates fair market value. If the original term to maturity of a short-term debt investment exceeded 60 days, then the values as of the 61st day prior to maturity are amortized. Amortized cost is not used if its use would be inappropriate due to credit or other impairments of the issuer, in which case the security’s fair value would be determined, as described below. Short-term securities are generally classified in Level 1 or Level 2 of the fair market hierarchy depending on the inputs used and market activity levels for specific securities.
The Board of Trustees of the Fund (the “Board”) has adopted fair value pricing procedures that are followed when a price for a security is not readily available or if a significant event has occurred that indicates the closing price of a security no longer represents the true value of that security. Fair value pricing determinations are made in good faith in accordance with these procedures. There are numerous criteria that will be given consideration in determining a fair value of a security, such as the trading volume of a security and markets, the value of other like securities, and news events with direct bearing to a security or markets. Fair value pricing results in an estimated price for a security that reflects the amount the Fund might reasonably expect to receive in a current sale. Depending on the relative significance of the valuation inputs, these securities may be classified in either Level 2 or Level 3 of the fair value hierarchy.
The Board has delegated day-to-day valuation matters to a Valuation Committee comprised of one or more representatives from Hennessy Advisors, Inc., the Fund’s investment advisor. The function of the Valuation Committee is to value securities where current and reliable market quotations are not readily available. All actions taken by the Valuation Committee are reviewed by the Board.
The Fund has performed an analysis of all existing investments to determine the significance and character of all inputs to their fair value determination. Various inputs
| HENNESSY FUNDS | 1-800-966-4354 | |
are used in determining the value of the Fund’s investments. The inputs or methodology used for valuing securities are not necessarily an indication of the risk associated with investing in those securities. Details related to the fair valuation hierarchy of the Fund’s securities as of October 31, 2016, are included in the Fund’s Schedule of Investments.
4). INVESTMENT TRANSACTIONS
Purchases and sales of investment securities (excluding government and short-term investments) for the Fund during the fiscal year ended October 31, 2016, were $52,445,861 and $63,166,264, respectively.
There were no purchases or sales/maturities of long-term U.S. government securities for the Fund during the fiscal year ended October 31, 2016.
The Fund is permitted to purchase or sell securities from or to another fund in the Hennessy Funds family of funds (the “Hennessy Funds”) under specified conditions outlined in procedures adopted by the Board of Trustees. The procedures have been designed to ensure that any purchase or sale of securities by the Fund from or to another Hennessy Fund complies with Rule 17a-7 of the Investment Company Act of 1940. For the fiscal year ended October 31, 2016, the Fund did not engage in purchases and sales of securities pursuant to Rule 17a-7 of the Investment Company Act of 1940.
5). INVESTMENT MANAGEMENT FEE AND OTHER TRANSACTIONS WITH AFFILIATES
Hennessy Advisors, Inc. (the “Advisor”) is the investment advisor of the Fund. The Advisor provides the Fund with investment management services under an Investment Advisory Agreement. The Advisor furnishes all investment advice, office space, facilities, and provides most of the personnel needed by the Fund. As compensation for its services, the Advisor is entitled to a monthly fee from the Fund. The fee is based upon the average daily net assets of the Fund at the annual rate of 0.74%. The net investment advisory fees payable by the Fund as of October 31, 2016, were $62,796.
In the past, the Advisor had contractually agreed to waive its fees and absorb expenses to the extent that the total annual operating expenses exceeded 0.98% of the Fund’s net assets for Institutional Class shares of the Fund (excluding all federal, state and local taxes, interest, brokerage commissions, acquired fund fees and expenses and other costs incurred in connection with the purchase and sale of securities and extraordinary items). The expense limitation agreement was terminated by the Board as of February 28, 2015.
For a period of three years after the year in which the Advisor waived or reimbursed expenses, the Advisor may seek reimbursement from the Fund to the extent that total annual fund operating expenses are less than the expense limitation that was in effect at the time the Advisor waived or reimbursed expenses. As of October 31, 2016, cumulative expenses subject to potential recovery under the aforementioned conditions were $238 for Institutional Class shares, which will expire on October 31, 2018.
The Board has approved a Shareholder Servicing Agreement for Investor Class shares of the Fund, which was instituted to compensate the Advisor for the non-investment management services it provides to the Fund. The Shareholder Servicing Agreement provides for a monthly fee paid to the Advisor at an annual rate of 0.10% of the average daily net assets of the Fund attributable to Investor Class shares. Shareholder service fees payable by the Fund as of October 31, 2016, were $7,442.
The Fund has adopted a plan pursuant to Rule 12b-1 under the Investment Company Act of 1940, as amended, that authorizes payments in connection with the distribution of the Fund’s shares at an annual rate of up to 0.25% of the Fund’s average daily net assets attributable to Investor Class shares. Even though the authorized rate is
HENNESSYFUNDS.COM
| NOTES TO THE FINANCIAL STATEMENTS |
up to 0.25%, the Fund has only used up to 0.15% of its average daily net assets attributable to Investor Class shares for such purpose since the plan was implemented on November 1, 2015. Amounts paid under the plan may be spent on any activities or expenses primarily intended to result in the sale of shares, including, but not limited to, advertising, shareholder account servicing, the printing and mailing of prospectuses to other than current shareholders, the printing and mailing of sales literature, and compensation for sales and marketing activities or to financial institutions and others, such as dealers and distributors.
The Fund has entered into agreements with various brokers, dealers, and financial intermediaries in connection with the sale of shares of the Fund. The agreements provide for periodic payments by the Fund to the brokers, dealers, and financial intermediaries for providing certain shareholder maintenance services (sub-transfer agent expenses). These shareholder services include the pre-processing and quality control of new accounts, shareholder correspondence, answering customer inquiries regarding account status, and facilitating shareholder telephone transactions. Fees paid by the Fund to various brokers, dealers, and financial intermediaries during the fiscal year ended October 31, 2016, were $48,833.
U.S. Bancorp Fund Services, LLC (“USBFS”) provides the Fund with administrative, fund accounting, and transfer agent services, and necessary office equipment. As administrator, USBFS is responsible for activities such as (i) preparing various federal and state regulatory filings, reports, and returns for the Fund, (ii) preparing reports and materials to be supplied to the Board, (iii) monitoring the activities of the Fund’s custodian, transfer agent, and accountants, and (iv) coordinating the preparation and payment of the Fund’s expenses and reviewing the Fund’s expense accruals. Fees paid to USBFS during the fiscal year ended October 31, 2016, were $98,085.
U.S. Bank, N.A., an affiliate of USBFS, serves as the Fund’s custodian. Quasar Distributors, LLC acts as the Fund’s principal underwriter in a continuous public offering of the Fund’s shares. Quasar Distributors, LLC is an affiliate of USBFS and U.S. Bank, N.A.
The officers of the Fund are affiliated with the Advisor. Such officers, with the exception of the Chief Compliance Officer and the Senior Compliance Officer, receive no compensation from the Fund for serving in their respective roles. The Fund, along with the other Hennessy Funds, makes reimbursement payments, on an equal basis, to the Advisor for a portion of the salary and benefits associated with the office of the Chief Compliance Officer and for all of the salary and benefits associated with the office of the Senior Compliance Officer. Such amounts are included on the Statement of Operations.
6). GUARANTEES AND INDEMNIFICATIONS
Under the Hennessy Funds’ organizational documents, their officers and trustees are indemnified by the Hennessy Funds against certain liabilities arising out of the performance of their duties to the Hennessy Funds. Additionally, in the normal course of business, the Hennessy Funds enter into contracts with service providers that contain general indemnification clauses. The Fund’s maximum exposure under these arrangements is unknown as this would involve future claims that may be made against the Fund that have not yet occurred. Currently, the Fund expects the risk of loss to be remote.
7). LINE OF CREDIT
The Fund has an uncommitted line of credit with the other Hennessy Funds in the amount of the lesser of (i) $100,000,000 or (ii) 33.33% of each Hennessy Fund’s net assets, or 30% for the Hennessy Gas Utility Fund and 10% for the Hennessy Balanced Fund, intended to provide short-term financing, if necessary, subject to certain
| HENNESSY FUNDS | 1-800-966-4354 | |
restrictions, in connection with shareholder redemptions. The credit facility is with the Hennessy Funds’ custodian bank, U.S. Bank, N.A. Borrowings under this arrangement bear interest at the bank’s prime rate and are secured by all of the Fund’s assets (as to its own borrowings only). During the fiscal year ended October 31, 2016, the Fund had an outstanding average daily balance and a weighted average interest rate of $10,464 and 3.47%, respectively. The maximum amount outstanding for the Fund during the period was $1,291,000. At October 31, 2016, the Fund did not have any borrowings outstanding under the line of credit.
8). FEDERAL TAX INFORMATION
As of October 31, 2016, the components of accumulated earnings (losses) for income tax purposes were as follows:
| | Cost of investments for tax purposes | | $ | 92,974,941 | |
| | Gross tax unrealized appreciation | | $ | 13,252,735 | |
| | Gross tax unrealized depreciation | | | (6,115,632 | ) |
| | Net tax unrealized appreciation | | $ | 7,137,103 | |
| | Undistributed ordinary income | | $ | 1,258,527 | |
| | Undistributed long-term capital gains | | | — | |
| | Total distributable earnings | | $ | 1,258,527 | |
| | Other accumulated loss | | $ | (4,683,932 | ) |
| | Total accumulated gain | | $ | 3,711,698 | |
The difference between book-basis unrealized appreciation/depreciation (as shown in the Statement of Assets and Liabilities) and tax-basis unrealized appreciation/depreciation (as shown above) is attributable primarily to wash sales.
At October 31, 2016, the Fund had capital loss carryforwards that expire as follows:
| $846,889 | Indefinite ST | |
| $3,837,043 | Indefinite LT | |
At October 31, 2016, the Fund did not defer, on a tax basis, any post-December late year ordinary loss deferrals.
During the fiscal years ended October 31, 2016 and 2015, the tax character of distributions paid by the Fund was as follows:
| | | Year Ended | | | Year Ended | |
| | | October 31, 2016 | | | October 31, 2015 | |
Ordinary income(1) | | $ | 1,652,846 | | | $ | 1,313,681 | |
| Long-term capital gain | | | 22,653,659 | | | | 17,714,965 | |
| | | $ | 24,306,505 | | | $ | 19,028,646 | |
(1) Ordinary income includes short-term gain or loss.
8). EVENTS SUBSEQUENT TO YEAR END
Management has evaluated the Fund’s related events and transactions that occurred subsequent to October 31, 2016, through the date of issuance of the Fund’s financial statements. Management has determined that there were no subsequent events requiring recognition or disclosure in the financial statements.
HENNESSYFUNDS.COM
| NOTES TO THE FINANCIAL STATEMENTS |
(This Page Intentionally Left Blank.)
| HENNESSY FUNDS | 1-800-966-4354 | |
Report of Independent Registered Public Accounting Firm
The Board of Trustees of Hennessy Funds Trust
and Shareholders of the Hennessy Cornerstone Large Growth Fund:
We have audited the accompanying statement of assets and liabilities of the Hennessy Cornerstone Large Growth Fund (the Fund), a series of Hennessy Funds Trust, including the schedule of investments, as of October 31, 2016, and the related statement of operations for the year then ended, the statements of changes in net assets for each of the years in the two year period then ended, and the financial highlights for each of the years in the five year period then ended. These financial statements and financial highlights are the responsibility of the Fund’s management. Our responsibility is to express an opinion on these financial statements and financial highlights based on our audits.
We conducted our audits in accordance with the standards of the Public Company Accounting Oversight Board (United States). Those standards require that we plan and perform the audit to obtain reasonable assurance about whether the financial statements and financial highlights are free of material misstatement. An audit includes examining, on a test basis, evidence supporting the amounts and disclosures in the financial statements. Our procedures included confirmation of securities owned as of October 31, 2016, by correspondence with custodians and brokers or by other appropriate auditing procedures. An audit also includes assessing the accounting principles used and significant estimates made by management, as well as evaluating the overall financial statement presentation. We believe that our audits provide a reasonable basis for our opinion.
In our opinion, the financial statements and financial highlights referred to above present fairly, in all material respects, the financial position of the Fund as of October 31, 2016, the results of its operations for the year then ended, the changes in its net assets for each of the years in the two year period then ended, and the financial highlights for each of the years in the five year period then ended, in conformity with U.S. generally accepted accounting principles.
Chicago, Illinois
December 22, 2016
HENNESSYFUNDS.COM
| REPORT OF INDEPENDENT REGISTERED PUBLIC ACCOUNTING FIRM/TRUSTEES AND OFFICERS |
Trustees and Officers of the Fund (Unaudited)
The business and affairs of the Fund are managed under the direction of the Board of Trustees of the Trust, and the Board of Trustees elects the Officers of the Trust. Beginning in March 2015, the Board of Trustees has from time to time appointed advisers (“Advisers”) to the Board of Trustees, with the intention of having qualified individuals serve in an advisory capacity in order to garner experience in the mutual fund and asset management industry and be considered as potential Trustees in the future. There are currently three Advisers to the Board of Trustees: Brian Alexander, Doug Franklin, and Claire Knoles. As Advisers, Mr. Alexander, Mr. Franklin, and Ms. Knoles attend meetings of the Board and act as non-voting participants. Information pertaining to the Trustees, Advisers, and the Officers of the Trust is set forth below. The Trustees and Officers serve until their successors are duly elected and qualified or until their earlier death, resignation, or removal. Each of the Trustees oversees 16 Hennessy Funds. Unless otherwise indicated, the address of all persons listed below is 7250 Redwood Boulevard, Suite 200, Novato, CA 94945. The Fund’s Statement of Additional Information includes more information about the persons listed below and is available, without charge, upon request by calling 1-800-966-4354.
| | | | Other |
| | | | Directorships |
| | | | Held Outside |
| Name, (Year of Birth), | | | of Fund |
| and Position Held | Start Date | Principal Occupation(s) | Complex During |
with the Trust | of Service | During Past Five Years | Past Five Years(1) |
| |
| Disinterested Trustees and Advisers |
| | | | |
| J. Dennis DeSousa | January 1996 | Mr. DeSousa is a real estate investor. | None. |
| (1936) | | | |
| Trustee | | | |
| | | | |
| Robert T. Doyle | January 1996 | Mr. Doyle has been the Sheriff of | None. |
| (1947) | | Marin County, California since 1996. | |
| Trustee | | | |
| | | | |
| Gerald P. Richardson | May 2004 | Mr. Richardson is an independent | None. |
| (1945) | | consultant in the securities industry. | |
| Trustee | | | |
| | | | |
| Brian Alexander | March 2015 | Mr. Alexander has been employed | None. |
| (1981) | | by Sutter Health Novato Community | |
| Adviser to the Board | | Hospital since 2012, first as an | |
| | | Assistant Administrator and then, | |
| | | beginning in 2013, as the Chief | |
| | | Administrative Officer. From 2011 | |
| | | through 2012, Mr. Alexander was | |
| | | employed by Sutter Health West Bay | |
| | | Region as the Regional Director of | |
| | | Strategic Decision Support. Prior to | |
| | | that, in 2011, he served as the | |
| | | Director of Managed Care | |
| | | Contracting and also the Director of | |
| | | Compensation, Benefits, and | |
| | | Compliance for the Rehabilitation | |
| | | Institute of Chicago. | |
| HENNESSY FUNDS | 1-800-966-4354 | |
| | | | Other |
| | | | Directorships |
| | | | Held Outside |
| Name, (Year of Birth), | | | of Fund |
| and Position Held | Start Date | Principal Occupation(s) | Complex During |
with the Trust | of Service | During Past Five Years | Past Five Years(1) |
| | | | |
| Doug Franklin | March 2016 | Mr. Franklin is a retired insurance | None. |
| (1964) | | industry executive. From 1987 | |
| Adviser to the Board | | through 2015, he was employed by | |
| | | the Allianz-Fireman’s Fund Insurance | |
| | | Company in various positions, | |
| | | including as its Chief Actuary and | |
| | | Chief Risk Officer. | |
| | | | |
| Claire Knoles | December 2015 | Ms. Knoles is a founder of Kiosk and | None. |
| (1974) | | has served as its Chief Operating | |
| Adviser to the Board | | Officer since 2004. Kiosk is a full | |
| | | service marketing agency with | |
| | | offices in the San Francisco Bay | |
| | | Area, Toronto, and Liverpool, UK. | |
| | | | |
Interested Trustee(2) | | | |
| | | | |
| Neil J. Hennessy | January 1996 as | Mr. Hennessy has been employed by | Hennessy |
| (1956) | a Trustee and | Hennessy Advisors, Inc. since 1989 | Advisors, Inc. |
| Trustee, Chairman of | June 2008 as | and currently serves as its President, | |
| the Board, Chief | an Officer | Chairman and Chief Executive Officer. | |
| Investment Officer, | | | |
| Portfolio Manager, | | | |
| and President | | | |
| Name, (Year of Birth), | | |
| and Position Held | Start Date | Principal Occupation(s) |
with the Trust | of Service | During Past Five Years |
| | | |
| Officers | | |
| | | |
| Teresa M. Nilsen | January 1996 | Ms. Nilsen has been employed by Hennessy Advisors, Inc. |
| (1966) | | since 1989 and currently serves as its Executive Vice President, |
| Executive Vice President | | Chief Operations Officer, Chief Financial Officer, and Secretary. |
| and Treasurer | | |
| | | |
| Daniel B. Steadman | March 2000 | Mr. Steadman has been employed by Hennessy Advisors, Inc. |
| (1956) | | since 2000 and currently serves as its Executive Vice President |
| Executive Vice President | | and Chief Compliance Officer. |
| and Secretary | | |
| | | |
| Jennifer Cheskiewicz | June 2013 | Ms. Cheskiewicz has been employed by Hennessy Advisors, Inc. |
| (1977) | | as its General Counsel since June 2013. She previously served |
| Senior Vice President and | | as in-house counsel to Carlson Capital, L.P., an SEC-registered |
| Chief Compliance Officer | | investment advisor to several private funds, from |
| | | February 2010 to May 2013. |
| | | |
| Brian Carlson | December 2013 | Mr. Carlson has been employed by Hennessy Advisors, Inc. |
| (1972) | | since December 2013. Mr. Carlson was previously a co-founder |
| Senior Vice President and | | and principal of Trivium Consultants, LLC from February 2011 |
| Head of Distribution | | through November 2013. |
HENNESSYFUNDS.COM
| TRUSTEES AND OFFICERS OF THE FUND |
| Name, (Year of Birth), | | |
| and Position Held | Start Date | Principal Occupation(s) |
with the Trust | of Service | During Past Five Years |
| | | |
| David Ellison | October 2012 | Mr. Ellison has been employed by Hennessy Advisors, Inc. since |
(1958)(3) | | October 2012. He has served as a Portfolio Manager of the |
| Senior Vice President and | | Hennessy Small Cap Financial Fund, the Hennessy Large Cap |
| Portfolio Manager | | Financial Fund, and the Hennessy Technology Fund since |
| | | inception. Prior to that, Mr. Ellison served as Director, CIO and |
| | | President of FBR Fund Advisers, Inc. from December |
| | | 1999 to October 2012. |
| | | |
| Brian Peery | March 2003 as | Mr. Peery has been employed by Hennessy Advisors, Inc. since |
| (1969) | an Officer and | 2002. He has served as a Portfolio Manager of the Hennessy |
| Senior Vice President and | February 2011 | Cornerstone Growth Fund, the Hennessy Cornerstone Mid Cap |
| Portfolio Manager | as a Co-Portfolio | 30 Fund, the Hennessy Cornerstone Large Growth Fund, the |
| | Manager or | Hennessy Cornerstone Value Fund, the Hennessy Total Return |
| | Portfolio Manager | Fund, and the Hennessy Balanced Fund since October 2014. |
| | | He served as Co-Portfolio Manager of the same funds from |
| | | February 2011 through September 2014. Mr. Peery has also |
| | | served as a Portfolio Manager of the Hennessy Gas Utility Fund |
| | | since February 2015. |
| | | |
| Winsor (Skip) Aylesworth | October 2012 | Mr. Aylesworth has been employed by Hennessy Advisors, Inc. |
(1947)(3) | | since October 2012. He has served as a Portfolio Manager of |
| Vice President and | | the Hennessy Gas Utility Fund since 1998 and as a Portfolio |
| Portfolio Manager | | Manager of the Hennessy Technology Fund since inception. |
| | | Prior to that, Mr. Aylesworth served as Executive Vice President |
| | | of FBR Fund Advisers, Inc. from 1999 to October 2012. |
| | | |
| Ryan Kelley | March 2013 | Mr. Kelley has been employed by Hennessy Advisors, Inc. since |
(1972)(4) | | October 2012. He has served as a Portfolio Manager of the |
| Vice President and | | Hennessy Gas Utility Fund, the Hennessy Small Cap Financial |
| Portfolio Manager | | Fund, and the Hennessy Large Cap Financial Fund since |
| | | October 2014. He served as Co-Portfolio Manager of the same |
| | | funds from March 2013 through September 2014, and as a |
| | | Portfolio Analyst for the Hennessy Funds from October 2012 |
| | | through February 2013. Prior to that, Mr. Kelley served as |
| | | Portfolio Manager of FBR Fund Advisers, Inc. from |
| | | January 2008 to October 2012. |
(1) | Messrs. DeSousa, Doyle, Hennessy, and Richardson previously served on the Board of Directors of Hennessy Mutual Funds, Inc. (“HMFI”), The Hennessy Funds, Inc. (“HFI”), and Hennessy SPARX Funds Trust (“HSFT”). Pursuant to an internal reorganization effective as of February 28, 2014, the series of HFMI, HFI, and HSFT were reorganized into corresponding series of Hennessy Funds Trust that mirrored them. Subsequent to the reorganization, HFMI, HFI, and HSFT were dissolved. |
(2) | Mr. Hennessy is considered an “interested person,” as defined in the Investment Company Act of 1940, as amended, because he is an officer of the Hennessy Funds. |
(3) | The address of these officers is 101 Federal Street, Suite 1900, Boston, MA 02110. |
(4) | The address of this officer is 1340 Environ Way, Suite 305, Chapel Hill, NC 27517. |
| HENNESSY FUNDS | 1-800-966-4354 | |
Expense Example (Unaudited)
October 31, 2016
As a shareholder of the Fund, you incur two types of costs: (1) transaction costs, including sales charges (loads) on purchase payments, reinvested dividends, or other distributions; redemption fees; and exchange fees; and (2) ongoing costs, including management fees; service fees; and other Fund expenses. This Example is intended to help you understand your ongoing costs (in dollars) of investing in the Fund and to compare these costs with the ongoing costs of investing in other mutual funds. The Example is based on an investment of $1,000 invested at the beginning of the period and held for the entire period from May 1, 2016, through October 31, 2016.
Actual Expenses
The first line of the table below under the “Investor Class” and “Institutional Class” headings provides information about actual account values and actual expenses. Although the Fund charges no sales loads or transaction fees, you will be assessed fees for outgoing wire transfers, returned checks and stop payment orders at prevailing rates charged by U.S. Bancorp Fund Services, LLC, the Fund’s transfer agent. If you request that a redemption be made by wire transfer, currently a $15 fee is charged by the Fund’s transfer agent. IRA accounts will be charged a $15 annual maintenance fee. The example below includes, but is not limited to, management fees, shareholder servicing fees, fund accounting, custody, and transfer agent fees. However, the example below does not include portfolio trading commissions and related expenses, and other extraordinary expenses as determined under generally accepted accounting principles. You may use the information in this line, together with the amount you invested, to estimate the expenses that you paid over the period. Simply divide your account value by $1,000 (for example, an $8,600 account value divided by $1,000 = 8.6), then multiply the result by the number in the first line of the table under the “Investor Class” and “Institutional Class” headings in the column entitled “Expenses Paid During Period” to estimate the expenses you paid on your account during this period.
Hypothetical Example for Comparison Purposes
The second line of the table below under the “Investor Class” and “Institutional Class” headings provides information about hypothetical account values and hypothetical expenses based on the Fund’s actual expense ratios and an assumed rate of return of 5% per year before expenses, which is not the Fund’s actual return. The hypothetical account values and expenses may not be used to estimate the actual ending account balance or expenses you paid for the period. You may use this information to compare the ongoing costs of investing in the Fund and other funds. To do so, compare this 5% hypothetical example with the 5% hypothetical examples that appear in the shareholder reports of the other funds. Please note that the expenses shown in the table are meant to highlight your ongoing costs only and do not reflect any transactional costs, such as sales charges (loads), or exchange fees. Therefore, the second line of the table under the “Investor Class” and “Institutional Class” headings is useful in comparing ongoing costs only, and will not help you determine the relative total costs of owning different funds. In addition, if these transactional costs were included, your costs would have been higher.
HENNESSYFUNDS.COM
| | | | Expenses Paid |
| | Beginning | Ending | During Period(1) |
| | Account Value | Account Value | May 1, 2016 – |
| | May 1, 2016 | October 31, 2016 | October 31, 2016 |
| Investor Class | | | |
| Actual | $1,000.00 | $1,043.70 | $6.47 |
| Hypothetical (5% return before expenses) | $1,000.00 | $1,018.80 | $6.39 |
| | | | |
| Institutional Class | | | |
| Actual | $1,000.00 | $1,045.40 | $5.24 |
| Hypothetical (5% return before expenses) | $1,000.00 | $1,020.01 | $5.18 |
(1) | Expenses are equal to the Fund’s annualized expense ratio of 1.26% for Investor Class shares or 1.02% for Institutional Class shares, as applicable, multiplied by the average account value over the period, multiplied by 184/366 days (to reflect one-half year period). |
| HENNESSY FUNDS | 1-800-966-4354 | |
How to Obtain a Copy of the Fund’s
Proxy Voting Policy and Proxy Voting Records
A description of the policies and procedures the Fund uses to determine how to vote proxies relating to portfolio securities is available without charge: (1) by calling 1-800-966-4354; (2) on the Hennessy Funds’ website at hennessyfunds.com/proxy-voting/policy.fs; or (3) on the U.S. Securities and Exchange Commission’s website at www.sec.gov. The Fund’s proxy voting record is available without charge on both the Hennessy Funds’ website at hennessyfunds.com/proxy-voting/vote.fs and the SEC’s website at www.sec.gov no later than August 31 for the prior 12 months ending June 30.
Quarterly Filings on Form N-Q
The Fund files its complete schedule of portfolio holdings with the SEC for the first and third quarters of each fiscal year on Form N-Q. The Fund’s Form N-Q will be available on the SEC’s website at www.sec.gov. The Fund’s Form N-Q may be reviewed and copied at the SEC’s Public Reference Room in Washington, DC and information on the operation of the Public Reference Room may be obtained by calling 1-800-SEC-0330. Information included in the Fund’s N-Q will also be available upon request by calling 1-800-966-4354.
Federal Tax Distribution Information
(Unaudited)
For the fiscal year ended October 31, 2016, certain dividends paid by the Fund may be subject to a maximum tax rate of 23.8%, as provided for by the Jobs and Growth Tax Relief Reconciliation Act of 2003. The percentage of dividends declared from ordinary income designated as qualified dividend income was 100%.
For corporate shareholders, the percent of ordinary income distributions that qualified for the corporate dividends received deduction for the fiscal year ended October 31, 2016, was 100%.
The percentage of taxable ordinary income distributions that are designated as short-term capital gain distributions under Section 871(k)(2)(C) of the Internal Revenue Code of 1986, as amended, for the Fund was 0%.
Householding
To help keep the Fund’s costs as low as possible, we generally deliver a single copy of most financial reports and prospectuses to shareholders who share an address, even if the accounts are registered under different names. This process, known as “householding,” does not apply to account statements. You may, of course, request an individual copy of a prospectus or financial report at any time. If you would like to receive separate mailings, please call the Administrator at 1-800-261-6950 or 1-414-765-4124 and we will begin individual delivery within 30 days of your request. If your account is held through a financial institution or other intermediary, please contact them directly to request individual delivery.
HENNESSYFUNDS.COM
| PROXY VOTING — PRIVACY POLICY |
Privacy Policy
We collect the following non-public personal information about you:
| | • | information we receive from you on or in applications or other forms, correspondence, or conversations, including, but not limited to, your name, address, phone number, social security number, assets, income, and date of birth; and |
| | | |
| | • | information about your transactions with us, our affiliates, or others, including, but not limited to, your account number and balance, payment history, parties to transactions, cost basis information, and other financial information. |
We do not disclose any non-public personal information about our current or former shareholders to non-affiliated third parties, except as permitted by law. For example, we are permitted by law to disclose all of the information we collect, as described above, to our Transfer Agent to process your transactions. Furthermore, we restrict access to your non-public personal information to those persons who require such information to provide products or services to you. We maintain physical, electronic, and procedural safeguards that comply with federal standards to guard your non-public personal information.
In the event that you hold shares of the Fund through a financial intermediary, including, but not limited to, a broker-dealer, bank or trust company, the privacy policy of your financial intermediary would govern how your non-public personal information would be shared with non-affiliated third parties.
| HENNESSY FUNDS | 1-800-966-4354 | |
For information, questions or assistance, please call
The Hennessy Funds
1-800-966-4354 or 1-415-899-1555
INVESTMENT ADVISOR
Hennessy Advisors, Inc.
7250 Redwood Blvd., Suite 200
Novato, California 94945
ADMINISTRATOR,
TRANSFER AGENT,
DIVIDEND PAYING AGENT &
SHAREHOLDER SERVICING AGENT
U.S. Bancorp Fund Services, LLC
P.O. Box 701
Milwaukee, Wisconsin 53201-0701
CUSTODIAN
U.S. Bank N.A.
Custody Operations
1555 North River Center Dr., Suite 302
Milwaukee, Wisconsin 53212
TRUSTEES
Neil J. Hennessy
Robert T. Doyle
J. Dennis DeSousa
Gerald P. Richardson
COUNSEL
Foley & Lardner LLP
777 East Wisconsin Avenue
Milwaukee, Wisconsin 53202-5306
INDEPENDENT REGISTERED
PUBLIC ACCOUNTING FIRM
KPMG LLP
200 East Randolph Street
Chicago, Illinois 60601
DISTRIBUTOR
Quasar Distributors, LLC
615 East Michigan Street
Milwaukee, Wisconsin 53202
hennessyfunds.com | 1-800-966-4354
This report has been prepared for shareholders and may be distributed to
others only if preceded or accompanied by a current prospectus.
ANNUAL REPORT
OCTOBER 31, 2016
HENNESSY CORNERSTONE
VALUE FUND
Investor Class HFCVX
Institutional Class HICVX
hennessyfunds.com | 1-800-966-4354
(This Page Intentionally Left Blank.)
Contents
| Letter to Shareholders | | | 2 |
| Performance Overview | | | 4 |
| Financial Statements | | | |
| Schedule of Investments | | | 7 |
| Statement of Assets and Liabilities | | | 11 |
| Statement of Operations | | | 12 |
| Statements of Changes in Net Assets | | | 13 |
| Financial Highlights | | | 14 |
| Notes to the Financial Statements | | | 18 |
| Report of Independent Registered Public Accounting Firm | | | 26 |
| Trustees and Officers of the Fund | | | 27 |
| Expense Example | | | 30 |
| Proxy Voting | | | 32 |
| Quarterly Filings on Form N-Q | | | 32 |
| Federal Tax Distribution Information | | | 32 |
| Householding | | | 32 |
| Privacy Policy | | | 33 |
| HENNESSY FUNDS | 1-800-966-4354 | |
December 2016
Dear Hennessy Funds Shareholder:
Over the past year investors here in the U.S. and around the world have weathered a great deal of turmoil, especially in the political arena. Foremost, the bitterly divisive and all-consuming U.S. Presidential election, with its unanticipated outcome, is finally behind us. While the equity markets were jittery at first, they now appear more comfortable with the prospect of a Trump presidency and seem to be looking forward to diminished government regulation and intervention.
The Brexit vote in the U.K. cast a shadow over the European Union’s future. There remains uncertainty over the details and timing of the break and the economic consequences for both Britain and Europe, but early signs suggest the impact on growth in Britain will not be as severe as initially feared.
Additionally, uncertainty over whether the Federal Reserve would raise short-term interest rates has hung over the economy for well over a year now. The effects that higher rates could have on growth, the strength of the U.S. Dollar, corporate profits and loan supply and demand seem to have weighed heavily on investors, causing paralysis and money to remain on the sidelines of the market.
Despite all these concerns, U.S. equity markets have pushed higher, with both the Dow Jones Industrial Average and S&P 500 Index posting returns of approximately 5% during the twelve-month period ended October 31, 2016. The U.S. economy has continued to grow at a respectable annual rate of about 2%, and corporate profits have started to move higher. Today, as of mid-December, bond and Treasury yields have risen a bit from record lows just this summer, and the bond market is finishing the year on slightly rocky footing. Bond yields are still very low relative to historical averages, while the prospective PE multiples for the Dow Jones Industrial Average and S&P 500 Index are just above long-term averages at 18.0x and 18.9x, respectively. We believe that equity valuations could go considerably higher and still be at appropriate levels relative to bond yields. And, while we do expect the Fed to raise interest rates in the coming year, we believe that inflation will stay under control, so that short-term interest rates will not have to rise too fast or too far.
As I reflect over the past twelve months, what I realize is that many of the worries this year are not new. For the past several years, American businesses have operated in an environment characterized by highly partisan politics, mounting regulations, uncertainty over interest rates, and a lack of clarity regarding taxes and healthcare costs. Despite all these headwinds, U.S. corporations have been incredibly resilient and found ways to impress investors. If the newly elected administration follows through on campaign promises of reigning in regulation, lowering taxes for corporations and individuals, or reforming healthcare to drive down costs, then companies, which are already lean, should be able to post higher profits. And, that growth should lead to more jobs and a stronger economy, potentially creating a very positive cycle going forward.
With the bull market in U.S. equities entering its ninth year, many believe the economy is due for a recession and the market is due for a downturn. But, the euphoria that usually accompanies a peak in the market is absent. Since the recovery began after the financial crisis, I have found myself pondering the bull run of 1982 to 2000, powered, in part, by a significant increase in valuations. I believe today’s market displays the fundamentals to sustain a similarly strong and lengthy bull market. Meanwhile, companies are largely profitable and many corporate balance sheets are cash-rich, with
HENNESSYFUNDS.COM
relatively little debt. Unemployment is low and real wages are rising, helping to drive consumption. We are hopeful that these factors will provide support for positive market returns in the year to come.
Thank you for your continued confidence and investment in our funds. If you have any questions or would like to speak with us directly, please don’t hesitate to call us at (800) 966-4354.
Best regards,
Neil J. Hennessy
President and Chief Investment Officer
Past performance does not guarantee future results.
Mutual fund investing involves risk. Principal loss is possible.
Opinions expressed are those of Neil Hennessy and are subject to change, are not guaranteed and should not be considered investment advice.
The Dow Jones Industrial Average and S&P 500 Index are unmanaged indices commonly used to measure the performance of U.S. stocks. One cannot invest directly in an index.
PE, or price to earnings, is calculated by dividing a company’s market price per share by its earnings per share.
| HENNESSY FUNDS | 1-800-966-4354 | |
Performance Overview (Unaudited)
CHANGE IN VALUE OF $10,000 INVESTMENT
This graph illustrates the performance of an initial investment of $10,000 made in the Fund ten years ago and assumes the reinvestment of dividends.
AVERAGE ANNUAL TOTAL RETURN FOR PERIODS ENDED OCTOBER 31, 2016
| | One | Five | Ten |
| | Year | Years | Years |
| Hennessy Cornerstone Value Fund – | | | |
| Investor Class (HFCVX) | 6.41% | 10.27% | 4.91% |
| Hennessy Cornerstone Value Fund – | | | |
Institutional Class (HICVX)(1) | 6.72% | 10.50% | 5.13% |
Russell 1000® Value Index | 6.37% | 13.31% | 5.35% |
| S&P 500 Index | 4.51% | 13.57% | 6.70% |
Expense ratios: 1.25% (Investor Class); 1.00% (Institutional Class)
Performance data quoted represents past performance; past performance does not guarantee future results. The investment return and principal value of an investment will fluctuate so that an investor’s shares, when redeemed, may be worth more or less than their original cost. The performance graph and table do not reflect the deduction of taxes that a shareholder would pay on Fund distributions or the redemption of Fund shares. Current performance of the Fund may be lower or higher than the performance quoted. Performance data current to the most recent month end may be obtained by visiting hennessyfunds.com.
The expense ratios presented are from the most recent prospectus.
(1) | The inception date of Institutional Class shares is March 3, 2008. Performance shown prior to the inception of Institutional Class shares reflects the performance of Investor Class shares and includes expenses that are not applicable to and are higher than those of Institutional Class shares. |
PERFORMANCE NARRATIVE
Portfolio Managers Neil J. Hennessy and Brian E. Peery
Performance:
For the twelve-month period ended October 31, 2016, the Investor Class of the Hennessy Cornerstone Value Fund returned 6.41%, outperforming both the Russell 1000® Value Index and the S&P 500 Index, which returned 6.37% and 4.51% for the same period, respectively.
HENNESSYFUNDS.COM
The Fund outperformed its primary benchmark as a result of both sector allocation and stock selection. From an allocation perspective, the portfolio’s overweight position in Consumer Staples companies accounted for nearly all of the sector-related outperformance. We also had smaller positive allocation contributions from Financials, Materials, Information Technology and Telecom Services. Partially offsetting these gains was the Fund’s zero allocation to Utilities, a sector that performed well over the year. On a stock specific basis, Archer-Daniels-Midland Company and three Canadian Banks, Bank of Nova Scotia, Toronto Dominion Bank and Royal Bank of Canada, all performed particularly well. The Fund’s investments in the Energy Sector, principally Marathon Oil Corporation, Exxon Mobil Corporation and National Oilwell Varco, however, hurt overall performance. While oil prices have rebounded recently, concern over dividend payments and a difficult operating environment have kept the equity prices of many Energy stocks relatively depressed. The Fund continues to hold all the stocks mentioned.
Portfolio Strategy:
The Fund’s investment strategy is to identify large, widely-held stocks with strong operating cash flow. The Fund then selects the companies it believes are best able to pay and maintain a relatively high dividend yield. Limiting the Fund’s portfolio to 50 stocks produces a relatively concentrated portfolio, where individual stock performance can influence the performance of the portfolio as a whole.
Market Outlook:
Over the twelve-month period ended October 31, 2016, U.S. equities produced moderate, positive returns. The period was once again marked by a great deal of volatility, with major market indices dropping more than 10% at one point early in the year before recovering all of their losses. Throughout this period, there have been concerns about interest rates, commodity prices, economic growth (both domestic and international) and the U.S. Presidential election. Many, if not all, of these concerns still exist in the marketplace today, but we have reasons to be hopeful for the year to come.
First, while corporate profits have been on a gentle slide downwards since the fourth quarter of 2014, market analysts are now forecasting a return to growth in profits in the fourth quarter of this year. We believe these forecasts have a good chance of being proved correct. Second, mergers and acquisitions have been strong and steady this year and we believe such activity will continue next year, helping drive revenue and earnings for the acquiring companies. Third, we do not believe the majority of stocks are expensive at this point, though many are probably fairly valued. The Dow Jones Industrial Average and the S&P 500 Index have forward PE ratios of roughly 18x and 19x, respectively, close to long-term averages although slightly higher than six months ago. Corporate balance sheets appear to be in excellent shape, and while executives have shown some reluctance to increase capital spending beyond maintenance levels this cycle, we believe companies outside of the Energy sector will eventually start investing for expansion. Overall, we believe the basic fundamentals of the market are attractive, and we continue to be optimistic about the possibility of further moderate market advances over the course of next year.
Investment Outlook:
The overall performance of large, dividend-paying stocks this year has been impressive, and these stocks have outperformed most other segments of the market. While there is some concern that after such a long period of outperformance valuations are becoming stretched, we are still finding that some of what we believe to be the highest quality companies in the U.S. are trading at attractive valuations. Going into next year, we think large-cap Industrial, Materials, Energy and Consumer stocks should continue to perform
| HENNESSY FUNDS | 1-800-966-4354 | |
well. We think the portfolio is very well positioned for the coming year, and that the Fund is an attractive vehicle which seeks to provide investors with both yield and capital appreciation while investing in what are, in our opinion, large, well-funded, well-managed companies with attractive dividend yields.
_______________
Opinions expressed are those of the Portfolio Managers as of the date written and are subject to change, are not guaranteed, and should not be considered investment advice or an indication of trading intent.
The Russell 1000® Value Index is an unmanaged index commonly used to measure the performance of U.S. large-capitalization value stocks. The S&P 500 Index and Dow Jones Industrial Average are unmanaged indices commonly used to measure the performance of U.S. stocks. One cannot invest directly in an index.
The Fund may invest in medium capitalized companies, which may have more limited liquidity and greater price volatility than large capitalization companies. Investments in foreign securities may involve political, economic and currency risks, greater volatility and differences in accounting methods. The Fund’s formula-based strategy may cause the Fund to buy or sell securities at times when it may not be advantageous. Please see the Fund’s prospectus for a more complete discussion of these and other risks.
References to specific securities should not be considered a recommendation to buy or sell any security. Fund holdings and sector allocations are subject to change. Please refer to the Schedule of Investments included in this report for additional portfolio information.
Operating cash flow is a measure of the amount of cash generated by a company’s normal business operations. Dividend yield is calculated as the annual dividends paid by a company divided by the price of a share of their stock. PE, or price to earnings, is calculated by dividing a company’s market price per share by its earnings per share.
HENNESSYFUNDS.COM
| PERFORMANCE OVERVIEW/SCHEDULE OF INVESTMENTS |
Financial Statements
Schedule of Investments as of October 31, 2016 |
HENNESSY CORNERSTONE VALUE FUND
(% of Net Assets)
| TOP TEN HOLDINGS (EXCLUDING CASH/CASH EQUIVALENTS) | % NET ASSETS |
| | |
| HP, Inc. | 2.49% |
| | |
| QUALCOMM, Inc. | 2.46% |
| | |
| Marathon Petroleum Corp. | 2.29% |
| | |
| Bank of Nova Scotia | 2.27% |
| | |
| Archer Daniels Midland Co. | 2.26% |
| | |
| Prudential Financial, Inc. | 2.21% |
| | |
| International Paper Co. | 2.20% |
| | |
| Suncor Energy, Inc. | 2.17% |
| | |
| Las Vegas Sands Corp. | 2.17% |
| | |
| Caterpillar, Inc. | 2.15% |
Note: For presentation purposes, the Fund has grouped some of the industry categories. For purposes of categorizing securities for compliance with Section 8(b)(1) of the Investment Company Act of 1940, as amended, the Fund uses more specific industry classifications.
| HENNESSY FUNDS | 1-800-966-4354 | |
| | COMMON STOCKS – 96.05% | | Number | | | | | | % of | |
| | | | of Shares | | | Value | | | Net Assets | |
| | Consumer Discretionary – 11.26% | | | | | | | | | |
| | Ford Motor Co. | | | 181,600 | | | $ | 2,131,984 | | | | 1.66 | % |
| | General Motors Co. | | | 76,100 | | | | 2,404,760 | | | | 1.87 | % |
| | Las Vegas Sands Corp. | | | 48,100 | | | | 2,784,028 | | | | 2.17 | % |
| | The Gap, Inc. | | | 87,500 | | | | 2,414,125 | | | | 1.88 | % |
| | Thomson Reuters Corp. (b) | | | 60,900 | | | | 2,400,069 | | | | 1.87 | % |
| | Viacom, Inc. | | | 62,100 | | | | 2,332,476 | | | | 1.81 | % |
| | | | | | | | | 14,467,442 | | | | 11.26 | % |
| | | | | | | | | | | | | | |
| | Consumer Staples – 9.77% | | | | | | | | | | | | |
| | Altria Group, Inc. | | | 36,900 | | | | 2,439,828 | | | | 1.90 | % |
| | Archer Daniels Midland Co. | | | 66,700 | | | | 2,906,119 | | | | 2.26 | % |
| | Philip Morris International, Inc. | | | 24,400 | | | | 2,353,136 | | | | 1.83 | % |
| | Procter & Gamble Co. | | | 27,000 | | | | 2,343,600 | | | | 1.83 | % |
| | Reynolds American, Inc. | | | 45,500 | | | | 2,506,140 | | | | 1.95 | % |
| | | | | | | | | 12,548,823 | | | | 9.77 | % |
| | | | | | | | | | | | | | |
| | Energy – 13.77% | | | | | | | | | | | | |
| | California Resources Corp. (a) | | | 4 | | | | 41 | | | | 0.00 | % |
| | Chevron Corp. | | | 25,200 | | | | 2,639,700 | | | | 2.06 | % |
| | Exxon Mobil Corp. | | | 27,200 | | | | 2,266,304 | | | | 1.77 | % |
| | Marathon Petroleum Corp. | | | 67,600 | | | | 2,946,684 | | | | 2.29 | % |
| | National Oilwell Varco, Inc. | | | 76,500 | | | | 2,455,650 | | | | 1.91 | % |
| | Occidental Petroleum Corp. | | | 31,500 | | | | 2,296,665 | | | | 1.79 | % |
| | Suncor Energy, Inc. (b) | | | 92,900 | | | | 2,788,858 | | | | 2.17 | % |
| | Valero Energy Corp. | | | 38,600 | | | | 2,286,664 | | | | 1.78 | % |
| | | | | | | | | 17,680,566 | | | | 13.77 | % |
| | | | | | | | | | | | | | |
| | Financials – 14.65% | | | | | | | | | | | | |
| | Bank of Montreal (b) | | | 40,900 | | | | 2,601,240 | | | | 2.03 | % |
| | Bank of Nova Scotia (b) | | | 54,300 | | | | 2,919,168 | | | | 2.27 | % |
| | Manulife Financial Corp. (b) | | | 170,700 | | | | 2,471,736 | | | | 1.92 | % |
| | MetLife, Inc. | | | 56,700 | | | | 2,662,632 | | | | 2.07 | % |
| | Prudential Financial, Inc. | | | 33,400 | | | | 2,831,986 | | | | 2.21 | % |
| | Royal Bank of Canada (b) | | | 43,100 | | | | 2,692,888 | | | | 2.10 | % |
| | Toronto-Dominion Bank (b) | | | 58,100 | | | | 2,636,578 | | | | 2.05 | % |
| | | | | | | | | 18,816,228 | | | | 14.65 | % |
The accompanying notes are an integral part of these financial statements.
HENNESSYFUNDS.COM
| | COMMON STOCKS | | Number | | | | | | % of | |
| | | | of Shares | | | Value | | | Net Assets | |
| | Health Care – 5.63% | | | | | | | | | |
| | AbbVie, Inc. | | | 40,500 | | | $ | 2,259,090 | | | | 1.76 | % |
| | Merck & Co., Inc. | | | 44,000 | | | | 2,583,680 | | | | 2.01 | % |
| | Pfizer, Inc. | | | 75,200 | | | | 2,384,592 | | | | 1.86 | % |
| | | | | | | | | 7,227,362 | | | | 5.63 | % |
| | | | | | | | | | | | | | |
| | Industrials – 11.71% | | | | | | | | | | | | |
| | Caterpillar, Inc. | | | 33,100 | | | | 2,762,526 | | | | 2.15 | % |
| | Eaton Corp. PLC (b) | | | 39,800 | | | | 2,538,046 | | | | 1.98 | % |
| | Emerson Electric Co. | | | 46,600 | | | | 2,361,688 | | | | 1.84 | % |
| | General Electric Co. | | | 75,900 | | | | 2,208,690 | | | | 1.72 | % |
| | The Boeing Co. | | | 19,100 | | | | 2,720,413 | | | | 2.12 | % |
| | United Parcel Service, Inc. | | | 22,700 | | | �� | 2,446,152 | | | | 1.90 | % |
| | | | | | | | | 15,037,515 | | | | 11.71 | % |
| | | | | | | | | | | | | | |
| | Information Technology – 12.98% | | | | | | | | | | | | |
| | Cisco Systems, Inc. | | | 84,200 | | | | 2,583,256 | | | | 2.01 | % |
| | HP, Inc. | | | 221,000 | | | | 3,202,290 | | | | 2.49 | % |
| | Intel Corp. | | | 75,600 | | | | 2,636,172 | | | | 2.05 | % |
| | International Business Machines Corp. | | | 17,700 | | | | 2,720,313 | | | | 2.12 | % |
| | QUALCOMM, Inc. | | | 46,000 | | | | 3,161,120 | | | | 2.46 | % |
| | Xerox Corp. | | | 242,400 | | | | 2,368,248 | | | | 1.85 | % |
| | | | | | | | | 16,671,399 | | | | 12.98 | % |
| | | | | | | | | | | | | | |
| | Materials – 7.50% | | | | | | | | | | | | |
| | International Paper Co. | | | 62,600 | | | | 2,818,878 | | | | 2.20 | % |
| | LyondellBasell Industries NV (b) | | | 28,200 | | | | 2,243,310 | | | | 1.75 | % |
| | The Dow Chemical Co. | | | 46,400 | | | | 2,496,784 | | | | 1.94 | % |
| | The Mosaic Co. | | | 88,000 | | | | 2,070,640 | | | | 1.61 | % |
| | | | | | | | | 9,629,612 | | | | 7.50 | % |
| | | | | | | | | | | | | | |
| | Telecommunication Services – 8.78% | | | | | | | | | | | | |
| | AT&T, Inc. | | | 60,800 | | | | 2,236,832 | | | | 1.74 | % |
| | BCE, Inc. (b) | | | 52,600 | | | | 2,390,144 | | | | 1.86 | % |
| | CenturyLink, Inc. | | | 74,900 | | | | 1,990,842 | | | | 1.55 | % |
| | Rogers Communications, Inc. (b) | | | 62,700 | | | | 2,522,421 | | | | 1.97 | % |
| | Verizon Communications, Inc. | | | 44,300 | | | | 2,130,830 | | | | 1.66 | % |
| | | | | | | | | 11,271,069 | | | | 8.78 | % |
| | | | | | | | | | | | | | |
| | Total Common Stocks | | | | | | | | | | | | |
| | (Cost $107,932,923) | | | | | | | 123,350,016 | | | | 96.05 | % |
The accompanying notes are an integral part of these financial statements.
| HENNESSY FUNDS | 1-800-966-4354 | |
| | SHORT-TERM INVESTMENTS – 3.98% | | Number | | | | | | % of | |
| | | | of Shares | | | Value | | | Net Assets | |
| | Money Market Funds – 3.98% | | | | | | | | | |
| | Fidelity Government Portfolio, Institutional Class, 0.27% (c) | | | 5,104,550 | | | $ | 5,104,550 | | | | 3.98 | % |
| | | | | | | | | | | | | | |
| | Total Short-Term Investments | | | | | | | | | | | | |
| | (Cost $5,104,550) | | | | | | | 5,104,550 | | | | 3.98 | % |
| | | | | | | | | | | | | | |
| | Total Investments | | | | | | | | | | | | |
| | (Cost $113,037,473) – 100.03% | | | | | | | 128,454,566 | | | | 100.03 | % |
| | | | | | | | | | | | | | |
| | Liabilities in Excess | | | | | | | | | | | | |
| | of Other Assets – (0.03)% | | | | | | | (41,220 | ) | | | (0.03 | )% |
| | | | | | | | | | | | | | |
| | TOTAL NET ASSETS – 100.00% | | | | | | $ | 128,413,346 | | | | 100.00 | % |
Percentages are stated as a percent of net assets.
| (a) | Non-income producing security. |
| (b) | U.S. traded security of a foreign corporation. |
| (c) | The rate listed is the fund’s 7-day yield as of October 31, 2016. |
Summary of Fair Value Exposure at October 31, 2016
The following is a summary of the inputs used to value the Fund’s net assets as of October 31, 2016 (see Note 3 in the accompanying notes to the financial statements):
| Common Stocks | | Level 1 | | | Level 2 | | | Level 3 | | | Total | |
| Consumer Discretionary | | $ | 14,467,442 | | | $ | — | | | $ | — | | | $ | 14,467,442 | |
| Consumer Staples | | | 12,548,823 | | | | — | | | | — | | | | 12,548,823 | |
| Energy | | | 17,680,566 | | | | — | | | | — | | | | 17,680,566 | |
| Financials | | | 18,816,228 | | | | — | | | | — | | | | 18,816,228 | |
| Health Care | | | 7,227,362 | | | | — | | | | — | | | | 7,227,362 | |
| Industrials | | | 15,037,515 | | | | — | | | | — | | | | 15,037,515 | |
| Information Technology | | | 16,671,399 | | | | — | | | | — | | | | 16,671,399 | |
| Materials | | | 9,629,612 | | | | — | | | | — | | | | 9,629,612 | |
| Telecommunication Services | | | 11,271,069 | | | | — | | | | — | | | | 11,271,069 | |
| Total Common Stocks | | $ | 123,350,016 | | | $ | — | | | $ | — | | | $ | 123,350,016 | |
| Short-Term Investments | | | | | | | | | | | | | | | | |
| Money Market Funds | | $ | 5,104,550 | | | $ | — | | | $ | — | | | $ | 5,104,550 | |
| Total Short-Term Investments | | $ | 5,104,550 | | | $ | — | | | $ | — | | | $ | 5,104,550 | |
| Total Investments | | $ | 128,454,566 | | | $ | — | | | $ | — | | | $ | 128,454,566 | |
Transfers between levels are recognized at the end of the reporting period. During the year ended October 31, 2016, the Fund recognized no transfers between levels.
The accompanying notes are an integral part of these financial statements.
HENNESSYFUNDS.COM
| SCHEDULE OF INVESTMENTS/STATEMENT OF ASSETS AND LIABILITIES |
Financial Statements
Statement of Assets and Liabilities as of October 31, 2016 |
| ASSETS: | | | |
| Investments in securities, at value (cost $113,037,473) | | $ | 128,454,566 | |
| Dividends and interest receivable | | | 234,109 | |
| Receivable for fund shares sold | | | 602 | |
| Prepaid expenses and other assets | | | 21,546 | |
| Total Assets | | | 128,710,823 | |
| | | | | |
| LIABILITIES: | | | | |
| Payable for securities purchased | | | 20,252 | |
| Payable for fund shares redeemed | | | 1,423 | |
| Payable to advisor | | | 81,026 | |
| Payable to administrator | | | 21,816 | |
| Payable to auditor | | | 24,380 | |
| Accrued distribution fees | | | 107,221 | |
| Accrued service fees | | | 10,788 | |
| Accrued trustees fees | | | 3,898 | |
| Accrued expenses and other payables | | | 26,673 | |
| Total Liabilities | | | 297,477 | |
| NET ASSETS | | $ | 128,413,346 | |
| | | | | |
| NET ASSETS CONSIST OF: | | | | |
| Capital stock | | $ | 113,778,905 | |
| Accumulated net investment income | | | 2,433,078 | |
| Accumulated net realized loss on investments | | | (3,215,495 | ) |
| Unrealized net appreciation on investments | | | 15,416,858 | |
| Total Net Assets | | $ | 128,413,346 | |
| | | | | |
| NET ASSETS | | | | |
| Investor Class: | | | | |
| Shares authorized (no par value) | | Unlimited | |
| Net assets applicable to outstanding Investor Class shares | | $ | 126,532,210 | |
| Shares issued and outstanding | | | 6,892,092 | |
| Net asset value, offering price and redemption price per share | | $ | 18.36 | |
| | | | | |
| Institutional Class: | | | | |
| Shares authorized (no par value) | | Unlimited | |
| Net assets applicable to outstanding Institutional Class shares | | $ | 1,881,136 | |
| Shares issued and outstanding | | | 102,229 | |
| Net asset value, offering price and redemption price per share | | $ | 18.40 | |
The accompanying notes are an integral part of these financial statements.
| HENNESSY FUNDS | 1-800-966-4354 | |
Financial Statements
Statement of Operations for the year ended October 31, 2016 |
| INVESTMENT INCOME: | | | |
Dividend income(1) | | $ | 4,531,943 | |
| Interest income | | | 7,458 | |
| Total investment income | | | 4,539,401 | |
| | | | | |
| EXPENSES: | | | | |
| Investment advisory fees (See Note 5) | | | 937,669 | |
| Distribution fees – Investor Class (See Note 5) | | | 187,302 | |
| Service fees – Investor Class (See Note 5) | | | 124,868 | |
| Administration, fund accounting, custody and transfer agent fees (See Note 5) | | | 123,534 | |
| Sub-transfer agent expenses – Investor Class (See Note 5) | | | 88,926 | |
| Sub-transfer agent expenses – Institutional Class (See Note 5) | | | 322 | |
| Federal and state registration fees | | | 25,638 | |
| Audit fees | | | 25,166 | |
| Compliance expense (See Note 5) | | | 23,709 | |
| Reports to shareholders | | | 16,120 | |
| Trustees’ fees and expenses | | | 15,360 | |
| Legal fees | | | 378 | |
| Interest expense (See Note 7) | | | 14 | |
| Other expenses | | | 12,262 | |
| Total expenses | | | 1,581,268 | |
| NET INVESTMENT INCOME | | $ | 2,958,133 | |
| | | | | |
| REALIZED AND UNREALIZED GAINS: | | | | |
| Net realized gain on investments | | $ | 1,221,525 | |
| Net change in unrealized appreciation on investments | | | 3,724,830 | |
| Net gain on investments | | | 4,946,355 | |
| NET INCREASE IN NET ASSETS RESULTING FROM OPERATIONS | | $ | 7,904,488 | |
(1) | Net of foreign taxes withheld and issuance fees of $134,128. |
The accompanying notes are an integral part of these financial statements.
HENNESSYFUNDS.COM
| STATEMENT OF OPERATIONS/STATEMENTS OF CHANGES IN NET ASSETS |
Financial Statements
| Statements of Changes in Net Assets |
| | | Year Ended | | | Year Ended | |
| | | October 31, 2016 | | | October 31, 2015 | |
| OPERATIONS: | | | | | | |
| Net investment income | | $ | 2,958,133 | | | $ | 3,327,853 | |
| Net realized gain on investments | | | 1,221,525 | | | | 19,281,025 | |
| Net change in unrealized appreciation (depreciation) | | | | | | | | |
| on investments | | | 3,724,830 | | | | (25,214,358 | ) |
| Net increase (decrease) in net assets | | | | | | | | |
| resulting from operations | | | 7,904,488 | | | | (2,605,480 | ) |
| | | | | | | | | |
| DISTRIBUTIONS TO SHAREHOLDERS FROM: | | | | | | | | |
| Net investment income | | | | | | | | |
| Investor Class | | | (3,068,445 | ) | | | (3,147,811 | ) |
| Institutional Class | | | (41,663 | ) | | | (257,598 | ) |
| Total distributions | | | (3,110,108 | ) | | | (3,405,409 | ) |
| | | | | | | | | |
| CAPITAL SHARE TRANSACTIONS: | | | | | | | | |
| Proceeds from shares subscribed – Investor Class | | | 1,543,678 | | | | 2,074,393 | |
| Proceeds from shares subscribed – Institutional Class | | | 427,866 | | | | 1,559,641 | |
| Dividends reinvested – Investor Class | | | 2,748,595 | | | | 2,823,170 | |
| Dividends reinvested – Institutional Class | | | 26,592 | | | | 243,110 | |
| Cost of shares redeemed – Investor Class | | | (12,330,203 | ) | | | (14,508,452 | ) |
| Cost of shares redeemed – Institutional Class | | | (410,243 | ) | | | (10,255,757 | ) |
| Net decrease in net assets derived | | | | | | | | |
| from capital share transactions | | | (7,993,715 | ) | | | (18,063,895 | ) |
| TOTAL DECREASE IN NET ASSETS | | | (3,199,335 | ) | | | (24,074,784 | ) |
| | | | | | | | | |
| NET ASSETS: | | | | | | | | |
| Beginning of year | | | 131,612,681 | | | | 155,687,465 | |
| End of year | | $ | 128,413,346 | | | $ | 131,612,681 | |
| Undistributed net investment income, end of year | | $ | 2,433,078 | | | $ | 2,587,361 | |
| | | | | | | | | |
| CHANGES IN SHARES OUTSTANDING: | | | | | | | | |
| Shares sold – Investor Class | | | 88,366 | | | | 115,014 | |
| Shares sold – Institutional Class | | | 24,407 | | | | 88,261 | |
| Shares issued to holders as reinvestment | | | | | | | | |
| of dividends – Investor Class | | | 162,543 | | | | 155,034 | |
| Shares issued to holders as reinvestment | | | | | | | | |
| of dividends – Institutional Class | | | 1,573 | | | | 13,365 | |
| Shares redeemed – Investor Class | | | (701,433 | ) | | | (807,635 | ) |
| Shares redeemed – Institutional Class | | | (22,974 | ) | | | (580,726 | ) |
| Net decrease in shares outstanding | | | (447,518 | ) | | | (1,016,687 | ) |
The accompanying notes are an integral part of these financial statements.
| HENNESSY FUNDS | 1-800-966-4354 | |
Financial Statements
For an Investor Class share outstanding throughout each year
PER SHARE DATA:
Net asset value, beginning of year
Income from investment operations:
Net investment income
Net realized and unrealized gains (losses) on investments
Total from investment operations
Less distributions:
Dividends from net investment income
Total distributions
Net asset value, end of year
TOTAL RETURN
SUPPLEMENTAL DATA AND RATIOS:
Net assets, end of year (millions)
Ratio of expenses to average net assets
Ratio of net investment income to average net assets
Portfolio turnover rate(1)
(1) | Portfolio turnover is calculated on the basis of the Fund as a whole. |
The accompanying notes are an integral part of these financial statements.
HENNESSYFUNDS.COM
| FINANCIAL HIGHLIGHTS — INVESTOR CLASS |
| Year Ended October 31, | |
| 2016 | | | 2015 | | | 2014 | | | 2013 | | | 2012 | |
| | | | | | | | | | | | | | |
| $ | 17.69 | | | $ | 18.41 | | | $ | 16.90 | | | $ | 14.02 | | | $ | 12.84 | |
| | | | | | | | | | | | | | | | | | | |
| | | | | | | | | | | | | | | | | | | |
| | 0.43 | | | | 0.44 | | | | 0.39 | | | | 0.42 | | | | 0.37 | |
| | 0.67 | | | | (0.75 | ) | | | 1.55 | | | | 2.84 | | | | 1.23 | |
| | 1.10 | | | | (0.31 | ) | | | 1.94 | | | | 3.26 | | | | 1.60 | |
| | | | | | | | | | | | | | | | | | | |
| | | | | | | | | | | | | | | | | | | |
| | (0.43 | ) | | | (0.41 | ) | | | (0.43 | ) | | | (0.38 | ) | | | (0.42 | ) |
| | (0.43 | ) | | | (0.41 | ) | | | (0.43 | ) | | | (0.38 | ) | | | (0.42 | ) |
| $ | 18.36 | | | $ | 17.69 | | | $ | 18.41 | | | $ | 16.90 | | | $ | 14.02 | |
| | | | | | | | | | | | | | | | | | | |
| | 6.41 | % | | | (1.77 | )% | | | 11.69 | % | | | 23.84 | % | | | 12.79 | % |
| | | | | | | | | | | | | | | | | | | |
| | | | | | | | | | | | | | | | | | | |
| $ | 126.53 | | | $ | 129.86 | | | $ | 145.04 | | | $ | 138.94 | | | $ | 124.99 | |
| | 1.25 | % | | | 1.09 | % | | | 1.17 | % | | | 1.22 | % | | | 1.26 | % |
| | 2.33 | % | | | 2.32 | % | | | 2.18 | % | | | 2.60 | % | | | 2.67 | % |
| | 36 | % | | | 46 | % | | | 34 | % | | | 41 | % | | | 47 | % |
The accompanying notes are an integral part of these financial statements.
| HENNESSY FUNDS | 1-800-966-4354 | |
Financial Statements
For an Institutional Class share outstanding throughout each year
PER SHARE DATA:
Net asset value, beginning of year
Income from investment operations:
Net investment income
Net realized and unrealized gains (losses) on investments
Total from investment operations
Less distributions:
Dividends from net investment income
Total distributions
Net asset value, end of year
TOTAL RETURN
SUPPLEMENTAL DATA AND RATIOS:
Net assets, end of year (millions)
Ratio of expenses to average net assets:
Before expense reimbursement
After expense rei mbursement
Ratio of net investment income to average net assets:
Before expense reimbursement
After expense reimbursement
Portfolio Turnover(1)
(1) | Portfolio turnover is calculated on the basis of the Fund as a whole. |
The accompanying notes are an integral part of these financial statements.
HENNESSYFUNDS.COM
| FINANCIAL HIGHLIGHTS — INSTITUTIONAL CLASS |
| Year Ended October 31, | |
| 2016 | | | 2015 | | | 2014 | | | 2013 | | | 2012 | |
| | | | | | | | | | | | | | |
| $ | 17.67 | | | $ | 18.41 | | | $ | 16.92 | | | $ | 14.04 | | | $ | 12.86 | |
| | | | | | | | | | | | | | | | | | | |
| | | | | | | | | | | | | | | | | | | |
| | 0.48 | | | | 0.53 | | | | 0.59 | | | | 0.50 | | | | 0.45 | |
| | 0.67 | | | | (0.83 | ) | | | 1.37 | | | | 2.80 | | | | 1.19 | |
| | 1.15 | | | | (0.30 | ) | | | 1.96 | | | | 3.30 | | | | 1.64 | |
| | | | | | | | | | | | | | | | | | | |
| | | | | | | | | | | | | | | | | | | |
| | (0.42 | ) | | | (0.44 | ) | | | (0.47 | ) | | | (0.42 | ) | | | (0.46 | ) |
| | (0.42 | ) | | | (0.44 | ) | | | (0.47 | ) | | | (0.42 | ) | | | (0.46 | ) |
| $ | 18.40 | | | $ | 17.67 | | | $ | 18.41 | | | $ | 16.92 | | | $ | 14.04 | |
| | | | | | | | | | | | | | | | | | | |
| | 6.72 | % | | | (1.72 | )% | | | 11.82 | % | | | 24.13 | % | | | 13.13 | % |
| | | | | | | | | | | | | | | | | | | |
| | | | | | | | | | | | | | | | | | | |
| $ | 1.88 | | | $ | 1.75 | | | $ | 10.65 | | | $ | 4.09 | | | $ | 2.53 | |
| | | | | | | | | | | | | | | | | | | |
| | 0.95 | % | | | 1.00 | % | | | 1.03 | % | | | 1.10 | % | | | 1.20 | % |
| | 0.95 | % | | | 1.00 | % | | | 0.98 | % | | | 0.98 | % | | | 0.98 | % |
| | | | | | | | | | | | | | | | | | | |
| | 2.63 | % | | | 2.43 | % | | | 2.30 | % | | | 2.64 | % | | | 2.72 | % |
| | 2.63 | % | | | 2.43 | % | | | 2.35 | % | | | 2.76 | % | | | 2.94 | % |
| | 36 | % | | | 46 | % | | | 34 | % | | | 41 | % | | | 47 | % |
The accompanying notes are an integral part of these financial statements.
| HENNESSY FUNDS | 1-800-966-4354 | |
Financial Statements
Notes to the Financial Statements October 31, 2016 |
1). ORGANIZATION
The Hennessy Cornerstone Value Fund (the “Fund”) is a series of Hennessy Funds Trust (the “Trust”), which was organized as a Delaware statutory trust on September 17, 1992. The Fund is an open-end management investment company registered under the Investment Company Act of 1940, as amended. The Fund is a successor to a fund with the same name (the “Predecessor Fund”) that was a series of Hennessy Mutual Funds, Inc., a Maryland corporation, pursuant to a reorganization that took place after the close of business on February 28, 2014. Prior to February 28, 2014, the Fund had no investment operations. As a result of the reorganization, holders of Investor Class shares of the Predecessor Fund received Investor Class shares of the Fund (the Investor Class shares of the Fund are the successor to the accounting and performance information of the corresponding shares of the Predecessor Fund), and holders of Institutional Class shares of the Predecessor Fund received Institutional Class shares of the Fund (the Institutional Class shares of the Fund are the successor to the accounting and performance information of the corresponding shares of the Predecessor Fund). The investment objective of the Fund is total return, consisting of capital appreciation and current income. The Fund is a diversified fund.
The Fund offers Investor Class and Institutional Class shares. Each class of shares differs principally in its respective administration, 12b-1 distribution and service, shareholder servicing, and transfer agent expenses (there are no sales charges). Each class has identical rights to earnings, assets, and voting privileges, except for class-specific expenses and exclusive rights to vote on matters affecting only an individual class.
As an investment company, the Fund follows the investment company accounting and reporting guidance of the Financial Accounting Standards Board (“FASB”) Accounting Standard Codification Topic 946 “Financial Services—Investment Companies.”
2). SIGNIFICANT ACCOUNTING POLICIES
The following is a summary of significant accounting policies consistently followed by the Fund in the preparation of the financial statements. These policies conform with U.S. generally accepted accounting principles (“GAAP”).
| a). | Investment Valuation – All investments in securities are recorded at their estimated fair value, as described in Note 3. |
| | |
| b). | Federal Income Taxes – No provision for federal income taxes or excise taxes has been made since the Fund has elected to be taxed as a “regulated investment company” and intends to distribute substantially all of its taxable income to its shareholders and otherwise comply with the provisions of the Internal Revenue Code of 1986, as amended, applicable to regulated investment companies. Net investment income or loss and realized gains and losses for federal income tax purposes may differ from that reported on the financial statements because of temporary book and tax basis differences. Temporary differences are primarily the result of the treatment of wash sales for tax reporting purposes. The Fund recognizes interest and penalties related to income tax benefits, if any, in the statement of operations as an income tax expense. Distributions from net realized gains for book purposes may include short-term capital gains, which are included as ordinary income to shareholders for tax purposes. |
HENNESSYFUNDS.COM
| NOTES TO THE FINANCIAL STATEMENTS |
| | Due to inherent differences in the recognition of income, expenses, and realized gains/losses under GAAP and federal income tax regulations, permanent differences between book and tax basis for reporting for the fiscal year ended October 31, 2016, have been identified and appropriately reclassified on the Statement of Assets and Liabilities. The adjustments are as follows: |
| | Undistributed | Accumulated | | |
| | Net Investment | Net Realized | | |
| | Income/(Loss) | Gain/(Loss) | Paid-in Capital | |
| | $(2,308) | $2,308 | $— | |
| c). | Accounting for Uncertainty in Income Taxes – The Fund has accounting policies regarding recognition and measurement of tax positions taken or expected to be taken on a tax return. The tax returns of the Fund for the prior three fiscal years are open for examination. The Fund has reviewed all open tax years in major jurisdictions and concluded that there is no impact on the Fund’s net assets and no tax liability resulting from unrecognized tax benefits relating to uncertain income tax positions taken or expected to be taken on a tax return. The Fund’s major tax jurisdictions are U.S. federal and Delaware. |
| | |
| d). | Income and Expenses – Dividend income is recognized on the ex-dividend date or as soon as information is available to the Fund. Interest income, which includes the amortization of premium and accretion of discount, is recognized on an accrual basis. The Fund is charged for those expenses that are directly attributable to the portfolio, such as advisory, administration, and certain shareholder service fees. Income, expenses (other than expenses attributable to a specific class), and realized and unrealized gains or losses on investments are allocated to each class of shares based on its respective net assets. |
| | |
| e). | Distributions to Shareholders – Dividends from net investment income for the Fund, if any, are declared and paid annually, usually in December. Distributions of net realized capital gains, if any, are declared and paid annually, usually in December. |
| | |
| f). | Security Transactions – Investment and shareholder transactions are recorded on the trade date. The Fund determines the gain or loss realized from the investment transactions by comparing the original cost of the security lot sold with the net sale proceeds. Discounts and premiums on securities purchased are accreted/amortized over the life of the respective security. |
| | |
| g). | Use of Estimates – The preparation of financial statements in conformity with GAAP requires management to make estimates and assumptions that affect the reported amounts of assets and liabilities and disclosure of contingent assets and liabilities at the date of the financial statements and the reported change in net assets during the reporting period. Actual results could differ from those estimates. |
| | |
| h). | Share Valuation – The net asset value (“NAV”) per share of the Fund is calculated by dividing the sum of the value of the securities held by the Fund, plus cash or other assets, minus all liabilities (including estimated accrued expenses) by the total number of shares outstanding for the Fund, rounded to the nearest cent. The Fund’s shares will not be priced on days the New York Stock Exchange is closed for trading. The offering and redemption price per share for the Fund is equal to the Fund’s NAV per share. |
| | |
| i). | Foreign Currency – Values of investments denominated in foreign currencies, if any, are converted into U.S. dollars using the spot market rate of exchange at the time of valuation. Purchases and sales of investments and income are translated into U.S. dollars using the spot market rate of exchange prevailing on the respective dates of |
| HENNESSY FUNDS | 1-800-966-4354 | |
| | such transactions. The Fund does not isolate the portion of the results of operations resulting from fluctuations in foreign exchange rates on investments from fluctuations resulting from changes in the market prices of securities held. Such fluctuations are included with the net realized and unrealized gain or loss on investments. Foreign investments present additional risks due to currency fluctuations, economic and political factors, lower liquidity, government regulations, differences in accounting standards, and other factors. |
| | |
| j). | Forward Contracts – The Fund may enter into forward currency contracts to reduce its exposure to changes in foreign currency exchange rates on its foreign holdings and to lock in the U.S. dollar cost of firm purchase and sale commitments for securities denominated in foreign currencies. A forward currency contract is a commitment to purchase or sell a foreign currency at a future date at a negotiated forward rate. The gain or loss arising from the difference between the U.S. dollar cost of the original contract and the value of the foreign currency in U.S. dollars upon closing of such contract is included in net realized gain or loss from foreign currency transactions. During the fiscal year ended October 31, 2016, the Fund did not enter into any forward contracts. |
| | |
| k). | Repurchase Agreements – The Fund may enter into repurchase agreements with member banks or security dealers of the Federal Reserve Board whom the investment advisor deems creditworthy. The repurchase price generally equals the price paid by the Fund plus interest negotiated on the basis of current short-term rates. |
| | |
| | Securities pledged as collateral for repurchase agreements are held by the custodian bank until the respective agreements mature. Provisions of the repurchase agreements ensure that the market value of the collateral, including accrued interest thereon, is sufficient to cover the repurchase amount in the event of default of the counterparty. If the counterparty defaults and the value of the collateral declines or if the counterparty enters an insolvency proceeding, realization of the collateral by the Fund may be delayed or limited. During the fiscal year ended October 31, 2016, the Fund did not enter into any repurchase agreements. |
| | |
| l). | Derivatives – The Fund may invest in, or enter into, derivatives, such as options, futures contracts, options on futures contracts, and swaps, for a variety of reasons, including to hedge certain risks, to provide a substitute for purchasing or selling particular securities, or to increase potential income gain. Derivatives are financial contracts based on an underlying or notional amount, require no initial investment or an initial net investment that is smaller than would normally be required to have a similar response to changes in market factors, and require or permit net settlement. Derivatives may allow the Fund to increase or decrease the level of risk to which the Fund is exposed more quickly and efficiently than transactions in other types of instruments. The main purpose of utilizing derivative instruments is for hedging purposes. |
| | |
| | The Fund follows the financial accounting reporting rules as required by the Derivatives and Hedging Topic of the FASB Accounting Standards Codification. Under such rules, the Fund is required to include enhanced disclosure that enables investors to understand how and why an entity uses derivatives, how derivatives are accounted for, and how derivatives instruments affect an entity’s results of operations and financial position. During the fiscal year ended October 31, 2016, the Fund did not hold any derivative instruments. |
| | |
| m). | New Accounting Pronouncements – In May 2015, the FASB issued ASU No. 2015-07 “Disclosure for Investments in Certain Entities that Calculate Net Asset Value per Share (or Its Equivalent).” The amendments in ASU No. 2015-07 remove the |
HENNESSYFUNDS.COM
| NOTES TO THE FINANCIAL STATEMENTS |
| | requirement to categorize within the fair value hierarchy investments measured at NAV and require the disclosure of sufficient information to reconcile the fair value of the remaining assets categorized within the fair value hierarchy to the financial statements. The amendments in ASU No. 2015-07 are effective for fiscal years beginning after December 15, 2015, and interim periods within those fiscal years. Management has reviewed the requirements and believes the adoption of ASU 2015-07 will not have a material impact on the Fund’s financial statements and related disclosures. |
3). SECURITIES VALUATION
The Fund follows authoritative fair valuation accounting standards that establish an authoritative definition of fair value and set out a hierarchy for measuring fair value. These standards require additional disclosures about the various inputs and valuation techniques used to develop the measurements of fair value and a discussion in changes in valuation techniques and related inputs during the period. These inputs are summarized in the three broad levels listed below:
| | Level 1 – | Unadjusted, quoted prices in active markets for identical instruments that the Fund has the ability to access at the date of measurement. |
| | | |
| | Level 2 – | Other significant observable inputs (including, but not limited to, quoted prices in active markets for similar instruments, quoted prices in markets that are not active for identical or similar instruments, and model-derived valuations in which all significant inputs and significant value drivers are observable in active markets (such as interest rates, prepayment speeds, credit risk curves, default rates, and similar data)). |
| | | |
| | Level 3 – | Significant unobservable inputs (including the Fund’s own assumptions about what market participants would use to price the asset or liability based on the best available information) when observable inputs are unavailable. |
Following is a description of the valuation techniques applied to the Fund’s major categories of assets and liabilities measured at fair value on a recurring basis.
Equity Securities – Equity securities, including common stocks, preferred stocks, foreign-issued common stocks, exchange-traded funds, closed-end mutual funds, partnerships, rights, and real estate investment trusts, that are traded on a securities exchange for which a last-quoted sales price is readily available will generally be valued at the last sales price as reported by the primary exchange on which the securities are listed. Securities listed on The NASDAQ Stock Market (“NASDAQ”) will generally be valued at the NASDAQ Official Closing Price, which may differ from the last sales price reported. Securities traded on a securities exchange for which a last-quoted sales price is not readily available will generally be valued at the mean between the bid and ask prices. To the extent these securities are actively traded and valuation adjustments are not applied, they are classified in Level 1 of the fair value hierarchy. Securities traded on foreign exchanges generally are not valued at the same time the Fund calculates its NAV because most foreign markets close well before such time. The earlier close of most foreign markets gives rise to the possibility that significant events, including broad market moves, may have occurred in the interim. In certain circumstances, it may be determined that a security needs to be fair valued because it appears that the value of the security might have been materially affected by events occurring after the close of the market in which the security is principally traded, but before the time the Fund calculates its NAV, such as by a development that affects an entire market or region (e.g., weather-related events) or a potentially global development (e.g., a terrorist attack that may be expected to have an effect on investor expectations worldwide).
| HENNESSY FUNDS | 1-800-966-4354 | |
Registered Investment Companies – Investments in registered investment companies (e.g., mutual funds) are generally priced at the ending NAV provided by the applicable registered investment company’s service agent and will be classified in Level 1 of the fair value hierarchy.
Debt Securities – Debt securities, including corporate bonds, asset-backed securities, mortgage-backed securities, municipal bonds, U.S. Treasuries, and U.S. government agency issues, are generally valued at market on the basis of valuations furnished by an independent pricing service that utilizes both dealer-supplied valuations and formula-based techniques. The pricing service may consider recently executed transactions in securities of the issuer or comparable issuers, market price quotations (where observable), bond spreads, and fundamental data relating to the issuer. In addition, the model may incorporate observable market data, such as reported sales of similar securities, broker quotes, yields, bids, offers, and reference data. Certain securities are valued primarily using dealer quotations. These securities are generally classified in Level 2 of the fair value hierarchy.
Short-Term Securities – Short-term equity investments, including money market funds, are valued in the manner specified above. Short-term debt investments with an original term to maturity of 60 days or less are valued at amortized cost, which approximates fair market value. If the original term to maturity of a short-term debt investment exceeded 60 days, then the values as of the 61st day prior to maturity are amortized. Amortized cost is not used if its use would be inappropriate due to credit or other impairments of the issuer, in which case the security’s fair value would be determined, as described below. Short-term securities are generally classified in Level 1 or Level 2 of the fair market hierarchy depending on the inputs used and market activity levels for specific securities.
The Board of Trustees of the Fund (the “Board”) has adopted fair value pricing procedures that are followed when a price for a security is not readily available or if a significant event has occurred that indicates the closing price of a security no longer represents the true value of that security. Fair value pricing determinations are made in good faith in accordance with these procedures. There are numerous criteria that will be given consideration in determining a fair value of a security, such as the trading volume of a security and markets, the value of other like securities, and news events with direct bearing to a security or markets. Fair value pricing results in an estimated price for a security that reflects the amount the Fund might reasonably expect to receive in a current sale. Depending on the relative significance of the valuation inputs, these securities may be classified in either Level 2 or Level 3 of the fair value hierarchy.
The fair valuation of foreign securities may be determined with the assistance of a pricing service using correlations between the movement of prices of such securities and indices of domestic securities and other appropriate indicators, such as closing market prices of relevant American Depositary Receipts or futures contracts. The effect of using fair value pricing is that the Fund’s NAV will reflect the affected portfolio securities’ value as determined by the Board or its designee instead of being determined by the market. Using a fair value pricing methodology to price foreign securities may result in a value that is different from a foreign security’s most recent closing price and from the prices used by other investment companies to calculate their NAVs and are generally considered Level 2 prices in the fair valuation hierarchy. Because the Fund may invest in foreign securities, the value of the Fund’s portfolio securities may change on days when you will not be able to purchase or redeem your shares.
The Board has delegated day-to-day valuation matters to a Valuation Committee comprised of one or more representatives from Hennessy Advisors, Inc., the Fund’s investment advisor. The function of the Valuation Committee is to value securities where
HENNESSYFUNDS.COM
| NOTES TO THE FINANCIAL STATEMENTS |
current and reliable market quotations are not readily available. All actions taken by the Valuation Committee are reviewed by the Board.
The Fund has performed an analysis of all existing investments to determine the significance and character of all inputs to their fair value determination. Various inputs are used in determining the value of the Fund’s investments. The inputs or methodology used for valuing securities are not necessarily an indication of the risk associated with investing in those securities. Details related to the fair valuation hierarchy of the Fund’s securities as of October 31, 2016, are included in the Fund’s Schedule of Investments.
4). INVESTMENT TRANSACTIONS
Purchases and sales of investment securities (excluding government and short-term investments) for the Fund during the fiscal year ended October 31, 2016, were $44,110,949 and $55,625,456, respectively.
There were no purchases or sales/maturities of long-term U.S. government securities for the Fund during the fiscal year ended October 31, 2016.
The Fund is permitted to purchase or sell securities from or to another fund in the Hennessy Funds family of funds (the “Hennessy Funds”) under specified conditions outlined in procedures adopted by the Board of Trustees. The procedures have been designed to ensure that any purchase or sale of securities by the Fund from or to another Hennessy Fund complies with Rule 17a-7 of the Investment Company Act of 1940. For the fiscal year ended October 31, 2016, the Fund did not engage in purchases and sales of securities pursuant to Rule 17a-7 of the Investment Company Act of 1940.
5). INVESTMENT MANAGEMENT FEE AND OTHER TRANSACTIONS WITH AFFILIATES
Hennessy Advisors, Inc. (the “Advisor”) is the investment advisor of the Fund. The Advisor provides the Fund with investment management services under an Investment Advisory Agreement. The Advisor furnishes all investment advice, office space, facilities, and provides most of the personnel needed by the Fund. As compensation for its services, the Advisor is entitled to a monthly fee from the Fund. The fee is based upon the average daily net assets of the Fund at the annual rate of 0.74%. The net investment advisory fees payable by the Fund as of October 31, 2016, were $81,026.
The Board has approved a Shareholder Servicing Agreement for Investor Class shares of the Fund, which was instituted to compensate the Advisor for the non-investment management services it provides to the Fund. The Shareholder Servicing Agreement provides for a monthly fee paid to the Advisor at an annual rate of 0.10% of the average daily net assets of the Fund attributable to Investor Class shares. Shareholder service fees payable by the Fund as of October 31, 2016, were $10,788.
The Fund has adopted a plan pursuant to Rule 12b-1 under the Investment Company Act of 1940, as amended, that authorizes payments in connection with the distribution of the Fund’s shares at an annual rate of up to 0.25% of the Fund’s average daily net assets attributable to Investor Class shares. Even though the authorized rate is up to 0.25%, the Fund has only used up to 0.15% of its average daily net assets attributable to Investor Class shares for such purpose since the plan was implemented on November 1, 2015. Amounts paid under the plan may be spent on any activities or expenses primarily intended to result in the sale of shares, including, but not limited to, advertising, shareholder account servicing, the printing and mailing of prospectuses to other than current shareholders, the printing and mailing of sales literature, and compensation for sales and marketing activities or to financial institutions and others, such as dealers and distributors.
| HENNESSY FUNDS | 1-800-966-4354 | |
The Fund has entered into agreements with various brokers, dealers, and financial intermediaries in connection with the sale of shares of the Fund. The agreements provide for periodic payments by the Fund to the brokers, dealers, and financial intermediaries for providing certain shareholder maintenance services (sub-transfer agent expenses). These shareholder services include the pre-processing and quality control of new accounts, shareholder correspondence, answering customer inquiries regarding account status, and facilitating shareholder telephone transactions. Fees paid by the Fund to various brokers, dealers, and financial intermediaries during the fiscal year ended October 31, 2016, were $89,248.
U.S. Bancorp Fund Services, LLC (“USBFS”) provides the Fund with administrative, fund accounting, and transfer agent services, and necessary office equipment. As administrator, USBFS is responsible for activities such as (i) preparing various federal and state regulatory filings, reports, and returns for the Fund, (ii) preparing reports and materials to be supplied to the Board, (iii) monitoring the activities of the Fund’s custodian, transfer agent, and accountants, and (iv) coordinating the preparation and payment of the Fund’s expenses and reviewing the Fund’s expense accruals. Fees paid to USBFS during the fiscal year ended October 31, 2016, were $123,534.
U.S. Bank, N.A., an affiliate of USBFS, serves as the Fund’s custodian. Quasar Distributors, LLC acts as the Fund’s principal underwriter in a continuous public offering of the Fund’s shares. Quasar Distributors, LLC is an affiliate of USBFS and U.S. Bank, N.A.
The officers of the Fund are affiliated with the Advisor. Such officers, with the exception of the Chief Compliance Officer and the Senior Compliance Officer, receive no compensation from the Fund for serving in their respective roles. The Fund, along with the other Hennessy Funds, makes reimbursement payments, on an equal basis, to the Advisor for a portion of the salary and benefits associated with the office of the Chief Compliance Officer and for all of the salary and benefits associated with the office of the Senior Compliance Officer. Such amounts are included on the Statement of Operations.
6). GUARANTEES AND INDEMNIFICATIONS
Under the Hennessy Funds’ organizational documents, their officers and trustees are indemnified by the Hennessy Funds against certain liabilities arising out of the performance of their duties to the Hennessy Funds. Additionally, in the normal course of business, the Hennessy Funds enter into contracts with service providers that contain general indemnification clauses. The Fund’s maximum exposure under these arrangements is unknown as this would involve future claims that may be made against the Fund that have not yet occurred. Currently, the Fund expects the risk of loss to be remote.
7). LINE OF CREDIT
The Fund has an uncommitted line of credit with the other Hennessy Funds in the amount of the lesser of (i) $100,000,000 or (ii) 33.33% of each Hennessy Fund’s net assets, or 30% for the Hennessy Gas Utility Fund and 10% for the Hennessy Balanced Fund, intended to provide short-term financing, if necessary, subject to certain restrictions, in connection with shareholder redemptions. The credit facility is with the Hennessy Funds’ custodian bank, U.S. Bank, N.A. Borrowings under this arrangement bear interest at the bank’s prime rate and are secured by all of the Fund’s assets (as to its own borrowings only). During the fiscal year ended October 31, 2016, the Fund had an outstanding average daily balance and a weighted average interest rate of $4,254 and 3.47%, respectively. The maximum amount outstanding for the Fund during the period was $244,000. At October 31, 2016, the Fund did not have any borrowings outstanding under the line of credit.
HENNESSYFUNDS.COM
| NOTES TO THE FINANCIAL STATEMENTS |
8). FEDERAL TAX INFORMATION
As of October 31, 2016, the components of accumulated earnings (losses) for income tax purposes were as follows:
| | Cost of investments for tax purposes | | $ | 113,352,695 | |
| | Gross tax unrealized appreciation | | $ | 19,322,753 | |
| | Gross tax unrealized depreciation | | | (4,220,882 | ) |
| | Net tax unrealized appreciation | | $ | 15,101,871 | |
| | Undistributed ordinary income | | $ | 2,433,078 | |
| | Undistributed long-term capital gains | | | — | |
| | Total distributable earnings | | $ | 2,433,078 | |
| | Other accumulated loss | | $ | (2,900,508 | ) |
| | Total accumulated gain | | $ | 14,634,441 | |
The difference between book-basis unrealized appreciation/depreciation (as shown in the Statement of Assets and Liabilities) and tax-basis unrealized appreciation/depreciation (as shown above) is attributable primarily to wash sales.
At October 31, 2016, the Fund had capital loss carryforwards of $2,900,273 that expire on October 31, 2017.
During the fiscal year ended October 31, 2016, the capital loss carryforwards utilized for the Fund were $1,094,478.
Capital losses sustained in the fiscal year ended October 31, 2012, and in future taxable years will not expire and may be carried over by the Fund without limitation; however, they will retain the character of the original loss. Furthermore, any loss incurred during those taxable years will be required to be utilized prior to the losses incurred in taxable years prior to 2012. As a result of this ordering rule, pre-enactment capital loss carryforwards may be more likely to expire unused. Under pre-enactment law, capital losses could be carried forward for eight years, and carried forward as short-term capital losses, irrespective of the character of the original loss.
At October 31, 2016, the Fund did not defer, on a tax basis, any post-December late year ordinary loss deferrals.
During the fiscal years ended October 31, 2016 and 2015, the tax character of distributions paid by the Fund was as follows:
| | | Year Ended | | | Year Ended | |
| | | October 31, 2016 | | | October 31, 2015 | |
Ordinary income(1) | | $ | 3,110,108 | | | $ | 3,405,409 | |
| Long-term capital gain | | | — | | | | — | |
| | | $ | 3,110,108 | | | $ | 3,405,409 | |
(1) Ordinary income includes short-term gain or loss.
9). EVENTS SUBSEQUENT TO YEAR END
Management has evaluated the Fund’s related events and transactions that occurred subsequent to October 31, 2016, through the date of issuance of the Fund’s financial statements. Management has determined that there were no subsequent events requiring recognition or disclosure in the financial statements.
| HENNESSY FUNDS | 1-800-966-4354 | |
Report of Independent Registered Public Accounting Firm
The Board of Trustees of Hennessy Funds Trust
and Shareholders of the Hennessy Cornerstone Value Fund:
We have audited the accompanying statement of assets and liabilities of the Hennessy Cornerstone Value Fund (the Fund), a series of Hennessy Funds Trust, including the schedule of investments, as of October 31, 2016, and the related statement of operations for the year then ended, the statements of changes in net assets for each of the years in the two year period then ended, and the financial highlights for each of the years in the five year period then ended. These financial statements and financial highlights are the responsibility of the Fund’s management. Our responsibility is to express an opinion on these financial statements and financial highlights based on our audits.
We conducted our audits in accordance with the standards of the Public Company Accounting Oversight Board (United States). Those standards require that we plan and perform the audit to obtain reasonable assurance about whether the financial statements and financial highlights are free of material misstatement. An audit includes examining, on a test basis, evidence supporting the amounts and disclosures in the financial statements. Our procedures included confirmation of securities owned as of October 31, 2016, by correspondence with custodians and brokers or by other appropriate auditing procedures. An audit also includes assessing the accounting principles used and significant estimates made by management, as well as evaluating the overall financial statement presentation. We believe that our audits provide a reasonable basis for our opinion.
In our opinion, the financial statements and financial highlights referred to above present fairly, in all material respects, the financial position of the Fund as of October 31, 2016, the results of its operations for the year then ended, the changes in its net assets for each of the years in the two year period then ended, and the financial highlights for each of the years in the five year period then ended, in conformity with U.S. generally accepted accounting principles.
Chicago, Illinois
December 22, 2016
HENNESSYFUNDS.COM
| REPORT OF INDEPENDENT REGISTERED PUBLIC ACCOUNTING FIRM/TRUSTEES AND OFFICERS |
Trustees and Officers of the Fund (Unaudited)
The business and affairs of the Fund are managed under the direction of the Board of Trustees of the Trust, and the Board of Trustees elects the Officers of the Trust. Beginning in March 2015, the Board of Trustees has from time to time appointed advisers (“Advisers “) to the Board of Trustees, with the intention of having qualified individuals serve in an advisory capacity in order to garner experience in the mutual fund and asset management industry and be considered as potential Trustees in the future. There are currently three Advisers to the Board of Trustees: Brian Alexander, Doug Franklin, and Claire Knoles. As Advisers, Mr. Alexander, Mr. Franklin, and Ms. Knoles attend meetings of the Board and act as non-voting participants. Information pertaining to the Trustees, Advisers, and the Officers of the Trust is set forth below. The Trustees and Officers serve until their successors are duly elected and qualified or until their earlier death, resignation, or removal. Each of the Trustees oversees 16 Hennessy Funds. Unless otherwise indicated, the address of all persons listed below is 7250 Redwood Boulevard, Suite 200, Novato, CA 94945. The Fund’s Statement of Additional Information includes more information about the persons listed below and is available, without charge, upon request by calling 1-800-966-4354.
| | | | Other |
| | | | Directorships |
| | | | Held Outside |
| Name, (Year of Birth), | | | of Fund |
| and Position Held | Start Date | Principal Occupation(s) | Complex During |
with the Trust | of Service | During Past Five Years | Past Five Years(1) |
| | | | |
| Disinterested Trustees and Advisers |
| | | | |
| J. Dennis DeSousa | January 1996 | Mr. DeSousa is a real estate investor. | None. |
| (1936) | | | |
| Trustee | | | |
| | | | |
| Robert T. Doyle | January 1996 | Mr. Doyle has been the Sheriff of | None. |
| (1947) | | Marin County, California since 1996. | |
| Trustee | | | |
| | | | |
| Gerald P. Richardson | May 2004 | Mr. Richardson is an independent | None. |
| (1945) | | consultant in the securities industry. | |
| Trustee | | | |
| | | | |
| Brian Alexander | March 2015 | Mr. Alexander has been employed | None. |
| (1981) | | by Sutter Health Novato Community | |
| Adviser to the Board | | Hospital since 2012, first as an | |
| | | Assistant Administrator and then, | |
| | | beginning in 2013, as the Chief | |
| | | Administrative Officer. From 2011 | |
| | | through 2012, Mr. Alexander was | |
| | | employed by Sutter Health West Bay | |
| | | Region as the Regional Director of | |
| | | Strategic Decision Support. Prior to | |
| | | that, in 2011, he served as the | |
| | | Director of Managed Care | |
| | | Contracting and also the Director of | |
| | | Compensation, Benefits, and | |
| | | Compliance for the Rehabilitation | |
| | | Institute of Chicago. | |
| HENNESSY FUNDS | 1-800-966-4354 | |
| | | | Other |
| | | | Directorships |
| | | | Held Outside |
| Name, (Year of Birth), | | | of Fund |
| and Position Held | Start Date | Principal Occupation(s) | Complex During |
with the Trust | of Service | During Past Five Years | Past Five Years(1) |
| | | | |
| Doug Franklin | March 2016 | Mr. Franklin is a retired insurance | None. |
| (1964) | | industry executive. From 1987 | |
| Adviser to the Board | | through 2015, he was employed by | |
| | | the Allianz-Fireman’s Fund Insurance | |
| | | Company in various positions, | |
| | | including as its Chief Actuary and | |
| | | Chief Risk Officer. | |
| | | | |
| Claire Knoles | December 2015 | Ms. Knoles is a founder of Kiosk and | None. |
| (1974) | | has served as its Chief Operating | |
| Adviser to the Board | | Officer since 2004. Kiosk is a full | |
| | | service marketing agency with | |
| | | offices in the San Francisco Bay | |
| | | Area, Toronto, and Liverpool, UK. | |
| | | | |
Interested Trustee(2) | | | |
| | | | |
| Neil J. Hennessy | January 1996 as | Mr. Hennessy has been employed by | Hennessy |
| (1956) | a Trustee and | Hennessy Advisors, Inc. since 1989 | Advisors, Inc. |
| Trustee, Chairman of | June 2008 as | and currently serves as its President, | |
| the Board, Chief | an Officer | Chairman and Chief Executive Officer. | |
| Investment Officer, | | | |
| Portfolio Manager, | | | |
| and President | | | |
| Name, (Year of Birth), | | |
| and Position Held | Start Date | Principal Occupation(s) |
with the Trust | of Service | During Past Five Years |
| | | |
| Officers | | |
| | | |
| Teresa M. Nilsen | January 1996 | Ms. Nilsen has been employed by Hennessy Advisors, Inc. |
| (1966) | | since 1989 and currently serves as its Executive Vice President, |
| Executive Vice President | | Chief Operations Officer, Chief Financial Officer, and Secretary. |
| and Treasurer | | |
| | | |
| Daniel B. Steadman | March 2000 | Mr. Steadman has been employed by Hennessy Advisors, Inc. |
| (1956) | | since 2000 and currently serves as its Executive Vice President |
| Executive Vice President | | and Chief Compliance Officer. |
| and Secretary | | |
| | | |
| Jennifer Cheskiewicz | June 2013 | Ms. Cheskiewicz has been employed by Hennessy Advisors, Inc. |
| (1977) | | as its General Counsel since June 2013. She previously served |
| Senior Vice President and | | as in-house counsel to Carlson Capital, L.P., an SEC-registered |
| Chief Compliance Officer | | investment advisor to several private funds, from |
| | | February 2010 to May 2013. |
| | | |
| Brian Carlson | December 2013 | Mr. Carlson has been employed by Hennessy Advisors, Inc. |
| (1972) | | since December 2013. Mr. Carlson was previously a co-founder |
| Senior Vice President and | | and principal of Trivium Consultants, LLC from February 2011 |
| Head of Distribution | | through November 2013. |
HENNESSYFUNDS.COM
| TRUSTEES AND OFFICERS OF THE FUND |
| Name, (Year of Birth), | | |
| and Position Held | Start Date | Principal Occupation(s) |
with the Trust | of Service | During Past Five Years |
| | | |
| David Ellison | October 2012 | Mr. Ellison has been employed by Hennessy Advisors, Inc. since |
(1958)(3) | | October 2012. He has served as a Portfolio Manager of the |
| Senior Vice President and | | Hennessy Small Cap Financial Fund, the Hennessy Large Cap |
| Portfolio Manager | | Financial Fund, and the Hennessy Technology Fund since |
| | | inception. Prior to that, Mr. Ellison served as Director, CIO and |
| | | President of FBR Fund Advisers, Inc. from December |
| | | 1999 to October 2012. |
| | | |
| Brian Peery | March 2003 as | Mr. Peery has been employed by Hennessy Advisors, Inc. since |
| (1969) | an Officer and | 2002. He has served as a Portfolio Manager of the Hennessy |
| Senior Vice President and | February 2011 | Cornerstone Growth Fund, the Hennessy Cornerstone Mid Cap |
| Portfolio Manager | as a Co-Portfolio | 30 Fund, the Hennessy Cornerstone Large Growth Fund, the |
| | Manager or | Hennessy Cornerstone Value Fund, the Hennessy Total Return |
| | Portfolio Manager | Fund, and the Hennessy Balanced Fund since October 2014. |
| | | He served as Co-Portfolio Manager of the same funds from |
| | | February 2011 through September 2014. Mr. Peery has also |
| | | served as a Portfolio Manager of the Hennessy Gas Utility Fund |
| | | since February 2015. |
| | | |
| Winsor (Skip) Aylesworth | October 2012 | Mr. Aylesworth has been employed by Hennessy Advisors, Inc. |
(1947)(3) | | since October 2012. He has served as a Portfolio Manager of |
| Vice President and | | the Hennessy Gas Utility Fund since 1998 and as a Portfolio |
| Portfolio Manager | | Manager of the Hennessy Technology Fund since inception. |
| | | Prior to that, Mr. Aylesworth served as Executive Vice President |
| | | of FBR Fund Advisers, Inc. from 1999 to October 2012. |
| | | |
| Ryan Kelley | March 2013 | Mr. Kelley has been employed by Hennessy Advisors, Inc. since |
(1972)(4) | | October 2012. He has served as a Portfolio Manager of the |
| Vice President and | | Hennessy Gas Utility Fund, the Hennessy Small Cap Financial |
| Portfolio Manager | | Fund, and the Hennessy Large Cap Financial Fund since |
| | | October 2014. He served as Co-Portfolio Manager of the same |
| | | funds from March 2013 through September 2014, and as a |
| | | Portfolio Analyst for the Hennessy Funds from October 2012 |
| | | through February 2013. Prior to that, Mr. Kelley served as |
| | | Portfolio Manager of FBR Fund Advisers, Inc. from |
| | | January 2008 to October 2012. |
(1) | Messrs. DeSousa, Doyle, Hennessy, and Richardson previously served on the Board of Directors of Hennessy Mutual Funds, Inc. (“HMFI”), The Hennessy Funds, Inc. (“HFI”), and Hennessy SPARX Funds Trust (“HSFT”). Pursuant to an internal reorganization effective as of February 28, 2014, the series of HFMI, HFI, and HSFT were reorganized into corresponding series of Hennessy Funds Trust that mirrored them. Subsequent to the reorganization, HFMI, HFI, and HSFT were dissolved. |
(2) | Mr. Hennessy is considered an “interested person,” as defined in the Investment Company Act of 1940, as amended, because he is an officer of the Hennessy Funds. |
(3) | The address of these officers is 101 Federal Street, Suite 1900, Boston, MA 02110. |
(4) | The address of this officer is 1340 Environ Way, Suite 305, Chapel Hill, NC 27517. |
| HENNESSY FUNDS | 1-800-966-4354 | |
Expense Example (Unaudited)
October 31, 2016
As a shareholder of the Fund, you incur two types of costs: (1) transaction costs, including sales charges (loads) on purchase payments, reinvested dividends, or other distributions; redemption fees; and exchange fees; and (2) ongoing costs, including management fees; service fees; and other Fund expenses. This Example is intended to help you understand your ongoing costs (in dollars) of investing in the Fund and to compare these costs with the ongoing costs of investing in other mutual funds. The Example is based on an investment of $1,000 invested at the beginning of the period and held for the entire period from May 1, 2016, through October 31, 2016.
Actual Expenses
The first line of the table below under the “Investor Class” and “Institutional Class” headings provides information about actual account values and actual expenses. Although the Fund charges no sales loads or transaction fees, you will be assessed fees for outgoing wire transfers, returned checks and stop payment orders at prevailing rates charged by U.S. Bancorp Fund Services, LLC, the Fund’s transfer agent. If you request that a redemption be made by wire transfer, currently a $15 fee is charged by the Fund’s transfer agent. IRA accounts will be charged a $15 annual maintenance fee. The example below includes, but is not limited to, management fees, shareholder servicing fees, fund accounting, custody, and transfer agent fees. However, the example below does not include portfolio trading commissions and related expenses, and other extraordinary expenses as determined under generally accepted accounting principles. You may use the information in this line, together with the amount you invested, to estimate the expenses that you paid over the period. Simply divide your account value by $1,000 (for example, an $8,600 account value divided by $1,000 = 8.6), then multiply the result by the number in the first line of the table under the “Investor Class” and “Institutional Class” headings in the column entitled “Expenses Paid During Period” to estimate the expenses you paid on your account during this period.
Hypothetical Example for Comparison Purposes
The second line of the table below under the “Investor Class” and “Institutional Class” headings provides information about hypothetical account values and hypothetical expenses based on the Fund’s actual expense ratios and an assumed rate of return of 5% per year before expenses, which is not the Fund’s actual return. The hypothetical account values and expenses may not be used to estimate the actual ending account balance or expenses you paid for the period. You may use this information to compare the ongoing costs of investing in the Fund and other funds. To do so, compare this 5% hypothetical example with the 5% hypothetical examples that appear in the shareholder reports of the other funds. Please note that the expenses shown in the table are meant to highlight your ongoing costs only and do not reflect any transactional costs, such as sales charges (loads), or exchange fees. Therefore, the second line of the table under the “Investor Class” and “Institutional Class” headings is useful in comparing ongoing costs only, and will not help you determine the relative total costs of owning different funds. In addition, if these transactional costs were included, your costs would have been higher.
HENNESSYFUNDS.COM
| | | | Expenses Paid |
| | Beginning | Ending | During Period(1) |
| | Account Value | Account Value | May 1, 2016 – |
| | May 1, 2016 | October 31, 2016 | October 31, 2016 |
| Investor Class | | | |
| Actual | $1,000.00 | $1,033.20 | $6.39 |
| Hypothetical (5% return before expenses) | $1,000.00 | $1,018.85 | $6.34 |
| | | | |
| Institutional Class | | | |
| Actual | $1,000.00 | $1,034.90 | $5.01 |
| Hypothetical (5% return before expenses) | $1,000.00 | $1,020.21 | $4.98 |
(1) | Expenses are equal to the Fund’s annualized expense ratio of 1.25% for Investor Class shares or 0.98% for Institutional Class shares, as applicable, multiplied by the average account value over the period, multiplied by 184/366 days (to reflect one-half year period). |
| HENNESSY FUNDS | 1-800-966-4354 | |
How to Obtain a Copy of the Fund’s
Proxy Voting Policy and Proxy Voting Records
A description of the policies and procedures the Fund uses to determine how to vote proxies relating to portfolio securities is available without charge: (1) by calling 1-800-966-4354; (2) on the Hennessy Funds’ website at hennessyfunds.com/proxy-voting/policy.fs; or (3) on the U.S. Securities and Exchange Commission’s website at www.sec.gov. The Fund’s proxy voting record is available without charge on both the Hennessy Funds’ website at hennessyfunds.com/proxy-voting/vote.fs and the SEC’s website at www.sec.gov no later than August 31 for the prior 12 months ending June 30.
Quarterly Filings on Form N-Q
The Fund files its complete schedule of portfolio holdings with the SEC for the first and third quarters of each fiscal year on Form N-Q. The Fund’s Form N-Q will be available on the SEC’s website at www.sec.gov. The Fund’s Form N-Q may be reviewed and copied at the SEC’s Public Reference Room in Washington, DC and information on the operation of the Public Reference Room may be obtained by calling 1-800-SEC-0330. Information included in the Fund’s N-Q will also be available upon request by calling 1-800-966-4354.
Federal Tax Distribution Information
(Unaudited)
For the fiscal year ended October 31, 2016, certain dividends paid by the Fund may be subject to a maximum tax rate of 23.8%, as provided for by the Jobs and Growth Tax Relief Reconciliation Act of 2003. The percentage of dividends declared from ordinary income designated as qualified dividend income was 100%.
For corporate shareholders, the percent of ordinary income distributions that qualified for the corporate dividends received deduction for the fiscal year ended October 31, 2016, was 100%.
The percentage of taxable ordinary income distributions that are designated as short-term capital gain distributions under Section 871(k)(2)(C) of the Internal Revenue Code of 1986, as amended, for the Fund was 0%.
Householding
To help keep the Fund’s costs as low as possible, we generally deliver a single copy of most financial reports and prospectuses to shareholders who share an address, even if the accounts are registered under different names. This process, known as “householding,” does not apply to account statements. You may, of course, request an individual copy of a prospectus or financial report at any time. If you would like to receive separate mailings, please call the Administrator at 1-800-261-6950 or 1-414-765-4124 and we will begin individual delivery within 30 days of your request. If your account is held through a financial institution or other intermediary, please contact them directly to request individual delivery.
HENNESSYFUNDS.COM
| PROXY VOTING — PRIVACY POLICY |
Privacy Policy
We collect the following non-public personal information about you:
| | • | information we receive from you on or in applications or other forms, correspondence, or conversations, including, but not limited to, your name, address, phone number, social security number, assets, income, and date of birth; and |
| | • | information about your transactions with us, our affiliates, or others, including, but not limited to, your account number and balance, payment history, parties to transactions, cost basis information, and other financial information. |
We do not disclose any non-public personal information about our current or former shareholders to non-affiliated third parties, except as permitted by law. For example, we are permitted by law to disclose all of the information we collect, as described above, to our Transfer Agent to process your transactions. Furthermore, we restrict access to your non-public personal information to those persons who require such information to provide products or services to you. We maintain physical, electronic, and procedural safeguards that comply with federal standards to guard your non-public personal information.
In the event that you hold shares of the Fund through a financial intermediary, including, but not limited to, a broker-dealer, bank or trust company, the privacy policy of your financial intermediary would govern how your non-public personal information would be shared with non-affiliated third parties.
| HENNESSY FUNDS | 1-800-966-4354 | |
For information, questions or assistance, please call
The Hennessy Funds
1-800-966-4354 or 1-415-899-1555
INVESTMENT ADVISOR
Hennessy Advisors, Inc.
7250 Redwood Blvd., Suite 200
Novato, California 94945
ADMINISTRATOR,
TRANSFER AGENT,
DIVIDEND PAYING AGENT &
SHAREHOLDER SERVICING AGENT
U.S. Bancorp Fund Services, LLC
P.O. Box 701
Milwaukee, Wisconsin 53201-0701
CUSTODIAN
U.S. Bank N.A.
Custody Operations
1555 North River Center Dr., Suite 302
Milwaukee, Wisconsin 53212
TRUSTEES
Neil J. Hennessy
Robert T. Doyle
J. Dennis DeSousa
Gerald P. Richardson
COUNSEL
Foley & Lardner LLP
777 East Wisconsin Avenue
Milwaukee, Wisconsin 53202-5306
INDEPENDENT REGISTERED
PUBLIC ACCOUNTING FIRM
KPMG LLP
200 East Randolph Street
Chicago, Illinois 60601
DISTRIBUTOR
Quasar Distributors, LLC
615 East Michigan Street
Milwaukee, Wisconsin 53202
hennessyfunds.com | 1-800-966-4354
This report has been prepared for shareholders and may be distributed to
others only if preceded or accompanied by a current prospectus.
ANNUAL REPORT
OCTOBER 31, 2016
HENNESSY LARGE VALUE FUND
Investor Class HLVFX
Institutional Class HLVIX
hennessyfunds.com | 1-800-966-4354
(This Page Intentionally Left Blank.)
Contents
| Letter to Shareholders | | | 2 |
| Performance Overview | | | 4 |
| Financial Statements | | | |
| Schedule of Investments | | | 7 |
| Statement of Assets and Liabilities | | | 13 |
| Statement of Operations | | | 14 |
| Statements of Changes in Net Assets | | | 15 |
| Financial Highlights | | | 16 |
| Notes to the Financial Statements | | | 20 |
| Report of Independent Registered Public Accounting Firm | | | 28 |
| Trustees and Officers of the Fund | | | 29 |
| Expense Example | | | 32 |
| Proxy Voting | | | 34 |
| Quarterly Filings on Form N-Q | | | 34 |
| Federal Tax Distribution Information | | | 34 |
| Householding | | | 34 |
| Privacy Policy | | | 35 |
| HENNESSY FUNDS | 1-800-966-4354 | |
December 2016
Dear Hennessy Funds Shareholder:
Over the past year investors here in the U.S. and around the world have weathered a great deal of turmoil, especially in the political arena. Foremost, the bitterly divisive and all-consuming U.S. Presidential election, with its unanticipated outcome, is finally behind us. While the equity markets were jittery at first, they now appear more comfortable with the prospect of a Trump presidency and seem to be looking forward to diminished government regulation and intervention.
The Brexit vote in the U.K. cast a shadow over the European Union’s future. There remains uncertainty over the details and timing of the break and the economic consequences for both Britain and Europe, but early signs suggest the impact on growth in Britain will not be as severe as initially feared.
Additionally, uncertainty over whether the Federal Reserve would raise short-term interest rates has hung over the economy for well over a year now. The effects that higher rates could have on growth, the strength of the U.S. Dollar, corporate profits and loan supply and demand seem to have weighed heavily on investors, causing paralysis and money to remain on the sidelines of the market.
Despite all these concerns, U.S. equity markets have pushed higher, with both the Dow Jones Industrial Average and S&P 500 Index posting returns of approximately 5% during the twelve-month period ended October 31, 2016. The U.S. economy has continued to grow at a respectable annual rate of about 2%, and corporate profits have started to move higher. Today, as of mid-December, bond and Treasury yields have risen a bit from record lows just this summer, and the bond market is finishing the year on slightly rocky footing. Bond yields are still very low relative to historical averages, while the prospective PE multiples for the Dow Jones Industrial Average and S&P 500 Index are just above long-term averages at 18.0x and 18.9x, respectively. We believe that equity valuations could go considerably higher and still be at appropriate levels relative to bond yields. And, while we do expect the Fed to raise interest rates in the coming year, we believe that inflation will stay under control, so that short-term interest rates will not have to rise too fast or too far.
As I reflect over the past twelve months, what I realize is that many of the worries this year are not new. For the past several years, American businesses have operated in an environment characterized by highly partisan politics, mounting regulations, uncertainty over interest rates, and a lack of clarity regarding taxes and healthcare costs. Despite all these headwinds, U.S. corporations have been incredibly resilient and found ways to impress investors. If the newly elected administration follows through on campaign promises of reigning in regulation, lowering taxes for corporations and individuals, or reforming healthcare to drive down costs, then companies, which are already lean, should be able to post higher profits. And, that growth should lead to more jobs and a stronger economy, potentially creating a very positive cycle going forward.
With the bull market in U.S. equities entering its ninth year, many believe the economy is due for a recession and the market is due for a downturn. But, the euphoria that usually accompanies a peak in the market is absent. Since the recovery began after the financial crisis, I have found myself pondering the bull run of 1982 to 2000, powered, in part, by a significant increase in valuations. I believe today’s market displays the fundamentals to sustain a similarly strong and lengthy bull market. Meanwhile, companies are largely profitable and many corporate balance sheets are cash-rich, with
HENNESSYFUNDS.COM
relatively little debt. Unemployment is low and real wages are rising, helping to drive consumption. We are hopeful that these factors will provide support for positive market returns in the year to come.
Thank you for your continued confidence and investment in our funds. If you have any questions or would like to speak with us directly, please don’t hesitate to call us at (800) 966-4354.
Best regards,
Neil J. Hennessy
President and Chief Investment Officer
Past performance does not guarantee future results.
Mutual fund investing involves risk. Principal loss is possible.
Opinions expressed are those of Neil Hennessy and are subject to change, are not guaranteed and should not be considered investment advice.
The Dow Jones Industrial Average and S&P 500 Index are unmanaged indices commonly used to measure the performance of U.S. stocks. One cannot invest directly in an index.
PE, or price to earnings, is calculated by dividing a company’s market price per share by its earnings per share.
| HENNESSY FUNDS | 1-800-966-4354 | |
Performance Overview (Unaudited)
CHANGE IN VALUE OF $10,000 INVESTMENT
This graph illustrates the performance of an initial investment of $10,000 made in the Fund ten years ago and assumes the reinvestment of dividends.
AVERAGE ANNUAL TOTAL RETURN FOR PERIODS ENDED OCTOBER 31, 2016
| | One | Five | Ten |
| | Year | Years | Years |
| Hennessy Large Value Fund – | | | |
| Investor Class (HLVFX) | 0.11% | 11.15% | 4.27% |
| Hennessy Large Value Fund – | | | |
Institutional Class (HLVIX)(1) | 0.21% | 11.45% | 4.51% |
Russell 1000® Value Index | 6.37% | 13.31% | 5.35% |
| S&P 500 Index | 4.51% | 13.57% | 6.70% |
Expense ratios: 1.35% (Investor Class); 1.18% (Institutional Class)
Performance data quoted represents past performance; past performance does not guarantee future results. The investment return and principal value of an investment will fluctuate so that an investor’s shares, when redeemed, may be worth more or less than their original cost. The performance graph and table do not reflect the deduction of taxes that a shareholder would pay on Fund distributions or the redemption of Fund shares. Current performance of the Fund may be lower or higher than the performance quoted. Performance for periods prior to March 20, 2009 reflects the performance of the Tamarack Value Fund, the predecessor to the Hennessy Large Value Fund. Performance data current to the most recent month end may be obtained by visiting hennessyfunds.com.
The expense ratios presented are from the most recent prospectus.
(1) | The inception date of Institutional Class shares is March 20, 2009. Performance shown prior to the inception of Institutional Class shares reflects the performance of Investor Class shares and includes expenses that are not applicable to and are higher than those of Institutional Class shares |
HENNESSYFUNDS.COM
PERFORMANCE NARRATIVE
Portfolio Managers Stuart A. Lippe, Barbara S. Browning, CFA, and Adam D. Scheiner, CFA
RBC Global Asset Management (U.S.) Inc. (sub-advisor)
Performance:
For the twelve-month period ended October 31, 2016, the Investor Class of the Hennessy Large Value Fund returned 0.11%, underperforming both the Russell 1000® Value Index and the S&P 500 Index, which returned 6.37% and 4.51%, respectively, for the same period.
The Fund’s relative underperformance was due primarily to adverse stock selection in the Financials, Energy, and Information Technology sectors. Performance due to sector allocation decisions was moderately negative, although by design the Fund’s sector neutral mandate limits the impact of sector-weighting decisions. Nevertheless, the negative effect of the slight overweight position in the Utilities sector, as well as the moderate underweight position in the Telecommunication Services sector, detracted from returns.
Within the Financials sector, Affiliated Managers Group, Inc. and Morgan Stanley were the worst performers. After strong stock performance at the beginning of the year, AMG’s stock fell due to concerns about asset management trends globally and fears over economic growth following the Brexit vote late in the second quarter. Morgan Stanley fell in sympathy with weakness in the banking sector. The Fund continues to hold Affiliated Managers Group, but has since liquidated Morgan Stanley. Stock selection within the Energy sector was also a significant detractor from the Fund’s relative performance. FMC Technologies, Inc., an oilfield services and equipment company, was the largest detractor from performance within the sector as investors realized that the long term outlook for offshore and international drilling has deteriorated. The Fund has since liquidated FMC Technologies.
Our stock selection within the Information Technology sector also negatively impacted performance. Ciena Corp, a provider of network and communication infrastructure, was a weak performer. Although the company operates in an attractive growth market, management missteps caused revenues to fall. The Fund has since liquidated Ciena Corp.
Investment Outlook:
We remain confident in our stock selection-driven process and our ability to find stocks that have the potential to outperform regardless of the market environment. While investment decisions are the result of bottom-up stock selection and our sector-neutral mandate limits the impact of sector allocation decisions, there are a number of industry-based themes that we believe could drive performance of the Fund over the coming year.
Within the Consumer Staples sector, we have several investments in food products companies that we hope will benefit from positive trends within the industry. With regards to Technology, we continue to favor companies exposed to the secular growth areas of mobile content, cloud computing and software. We continue to look for attractively valued opportunities in these areas. We are overweight semiconductors as we look for exposure to the Internet of Things (IoT). Essentially, the IoT is the idea of everyday things becoming “connected” or “smart.” This transition is occurring primarily in autos through infotainment offerings, safety features and fuel efficiency mechanisms, which all require integrated circuits and sensors to communicate, measure and process data. Finally, within Industrials, we are overweight aerospace and defense due to good fundamentals in a slow growth environment.
_______________
| HENNESSY FUNDS | 1-800-966-4354 | |
Opinions expressed are those of the Portfolio Managers as of the date written and are subject to change, are not guaranteed, and should not be considered investment advice or an indication of trading intent.
The Russell 1000® Value Index is an unmanaged index commonly used to measure the performance of U.S. large-capitalization value stocks. The S&P 500 Index is an unmanaged index commonly used to measure the performance of U.S. stocks. One cannot invest directly in an index.
The Fund may invest in medium-capitalization companies, which may have more limited liquidity and greater price volatility than large-capitalization companies. Please see the Fund’s prospectus for a more complete discussion of these and other risks.
References to specific securities should not be considered a recommendation to buy or sell any security. Fund holdings and sector allocations are subject to change. Please refer to the Schedule of Investments included in this report for additional portfolio information.
HENNESSYFUNDS.COM
| PERFORMANCE OVERVIEW/SCHEDULE OF INVESTMENTS |
Financial Statements
Schedule of Investments as of October 31, 2016 |
HENNESSY LARGE VALUE FUND
(% of Net Assets)
| TOP TEN HOLDINGS (EXCLUDING CASH/CASH EQUIVALENTS) | % NET ASSETS |
| | |
| Johnson & Johnson | 4.33% |
| | |
| Exxon Mobil Corp. | 2.96% |
| | |
| NextEra Energy, Inc. | 2.62% |
| | |
| DTE Energy Co. | 2.56% |
| | |
| American Electric Power, Inc. | 2.48% |
| | |
| Citigroup, Inc. | 2.35% |
| | |
| Bank of America Corp. | 2.27% |
| | |
| Cisco Systems, Inc. | 2.09% |
| | |
| Procter & Gamble Co. | 1.98% |
| | |
| Pioneer Natural Resources Co. | 1.88% |
Note: For presentation purposes, the Fund has grouped some of the industry categories. For purposes of categorizing securities for compliance with Section 8(b)(1) of the Investment Company Act of 1940, as amended, the Fund uses more specific industry classifications.
| HENNESSY FUNDS | 1-800-966-4354 | |
| | COMMON STOCKS – 94.72% | | Number | | | | | | % of | |
| | | | of Shares | | | Value | | | Net Assets | |
| | Consumer Discretionary – 5.22% | | | | | | | | | |
| | Ford Motor Co. | | | 111,935 | | | $ | 1,314,117 | | | | 0.99 | % |
| | L Brands, Inc. | | | 11,450 | | | | 826,575 | | | | 0.62 | % |
| | Macy’s, Inc. | | | 32,170 | | | | 1,173,883 | | | | 0.89 | % |
| | Newell Brands, Inc. | | | 20,430 | | | | 981,049 | | | | 0.74 | % |
| | Signet Jewelers, Ltd. (b) | | | 10,820 | | | | 879,233 | | | | 0.66 | % |
| | Time Warner, Inc. | | | 19,600 | | | | 1,744,204 | | | | 1.32 | % |
| | | | | | | | | 6,919,061 | | | | 5.22 | % |
| | | | | | | | | | | | | | |
| | Consumer Staples – 8.40% | | | | | | | | | | | | |
| | ConAgra Foods, Inc. | | | 30,590 | | | | 1,473,826 | | | | 1.11 | % |
| | Ingredion, Inc. | | | 9,670 | | | | 1,268,414 | | | | 0.96 | % |
| | Mondelez International, Inc. | | | 45,800 | | | | 2,058,252 | | | | 1.55 | % |
| | PepsiCo, Inc. | | | 11,540 | | | | 1,237,088 | | | | 0.93 | % |
| | Procter & Gamble Co. | | | 30,235 | | | | 2,624,398 | | | | 1.98 | % |
| | Reynolds American, Inc. | | | 18,140 | | | | 999,151 | | | | 0.76 | % |
| | Tyson Foods, Inc., Class A | | | 20,700 | | | | 1,466,595 | | | | 1.11 | % |
| | | | | | | | | 11,127,724 | | | | 8.40 | % |
| | | | | | | | | | | | | | |
| | Energy – 11.97% | | | | | | | | | | | | |
| | Anadarko Petroleum Corp. | | | 21,150 | | | | 1,257,156 | | | | 0.95 | % |
| | Chevron Corp. | | | 12,295 | | | | 1,287,901 | | | | 0.97 | % |
| | ConocoPhillips | | | 53,110 | | | | 2,307,629 | | | | 1.74 | % |
| | Exxon Mobil Corp. | | | 47,130 | | | | 3,926,872 | | | | 2.96 | % |
| | Helmerich & Payne, Inc. | | | 9,400 | | | | 593,234 | | | | 0.45 | % |
| | Marathon Oil Corp. | | | 119,705 | | | | 1,577,712 | | | | 1.19 | % |
| | Occidental Petroleum Corp. | | | 22,580 | | | | 1,646,308 | | | | 1.24 | % |
| | Pioneer Natural Resources Co. | | | 13,890 | | | | 2,486,588 | | | | 1.88 | % |
| | Valero Energy Corp. | | | 13,175 | | | | 780,487 | | | | 0.59 | % |
| | | | | | | | | 15,863,887 | | | | 11.97 | % |
| | | | | | | | | | | | | | |
| | Financials – 22.71% | | | | | | | | | | | | |
| | Affiliated Managers Group, Inc. (a) | | | 11,493 | | | | 1,524,661 | | | | 1.15 | % |
| | Allstate Corp. | | | 23,062 | | | | 1,565,910 | | | | 1.18 | % |
| | American International Group, Inc. | | | 29,835 | | | | 1,840,819 | | | | 1.39 | % |
| | Bank of America Corp. | | | 182,671 | | | | 3,014,072 | | | | 2.27 | % |
| | BlackRock, Inc. | | | 4,530 | | | | 1,545,817 | | | | 1.17 | % |
| | Chubb, Ltd. (b) | | | 18,140 | | | | 2,303,780 | | | | 1.74 | % |
The accompanying notes are an integral part of these financial statements.
HENNESSYFUNDS.COM
| | COMMON STOCKS | | Number | | | | | | % of | |
| | | | of Shares | | | Value | | | Net Assets | |
| | Financials (Continued) | | | | | | | | | |
| | Citigroup, Inc. | | | 63,495 | | | $ | 3,120,779 | | | | 2.35 | % |
| | CME Group, Inc. | | | 14,578 | | | | 1,459,258 | | | | 1.10 | % |
| | First Republic Bank | | | 18,215 | | | | 1,355,742 | | | | 1.02 | % |
| | JPMorgan Chase & Co. | | | 35,125 | | | | 2,432,758 | | | | 1.84 | % |
| | KeyCorp | | | 51,290 | | | | 724,215 | | | | 0.55 | % |
| | Prudential Financial, Inc. | | | 18,057 | | | | 1,531,053 | | | | 1.16 | % |
| | SunTrust Banks, Inc. | | | 48,664 | | | | 2,201,073 | | | | 1.66 | % |
| | Synchrony Financial | | | 69,515 | | | | 1,987,434 | | | | 1.50 | % |
| | The Goldman Sachs Group, Inc. | | | 9,966 | | | | 1,776,340 | | | | 1.34 | % |
| | Wells Fargo & Co. | | | 37,293 | | | | 1,715,851 | | | | 1.29 | % |
| | | | | | | | | 30,099,562 | | | | 22.71 | % |
| | | | | | | | | | | | | | |
| | Health Care – 11.89% | | | | | | | | | | | | |
| | Aetna, Inc. | | | 14,742 | | | | 1,582,554 | | | | 1.19 | % |
| | Allergan PLC (a)(b) | | | 2,570 | | | | 536,976 | | | | 0.40 | % |
| | Jazz Pharmaceuticals PLC (a)(b) | | | 6,800 | | | | 744,396 | | | | 0.56 | % |
| | Johnson & Johnson | | | 49,460 | | | | 5,736,865 | | | | 4.33 | % |
| | Medtronic PLC (b) | | | 30,225 | | | | 2,479,055 | | | | 1.87 | % |
| | Merck & Co., Inc. | | | 20,110 | | | | 1,180,859 | | | | 0.89 | % |
| | Pfizer, Inc. | | | 42,925 | | | | 1,361,152 | | | | 1.03 | % |
| | Thermo Fisher Scientific, Inc. | | | 14,580 | | | | 2,143,697 | | | | 1.62 | % |
| | | | | | | | | 15,765,554 | | | | 11.89 | % |
| | | | | | | | | | | | | | |
| | Industrials – 10.51% | | | | | | | | | | | | |
| | CSX Corp. | | | 70,400 | | | | 2,147,904 | | | | 1.62 | % |
| | FedEx Corp. | | | 7,132 | | | | 1,243,250 | | | | 0.94 | % |
| | Flowserve Corp. | | | 7,622 | | | | 322,792 | | | | 0.24 | % |
| | General Electric Co. | | | 73,554 | | | | 2,140,421 | | | | 1.62 | % |
| | Honeywell International, Inc. | | | 13,540 | | | | 1,485,067 | | | | 1.12 | % |
| | Ingersoll-Rand PLC (b) | | | 25,943 | | | | 1,745,705 | | | | 1.32 | % |
| | Pentair PLC (b) | | | 11,593 | | | | 639,122 | | | | 0.48 | % |
| | Raytheon Co. | | | 10,700 | | | | 1,461,727 | | | | 1.10 | % |
| | Southwest Airlines Co. | | | 38,708 | | | | 1,550,255 | | | | 1.17 | % |
| | United Technologies Corp. | | | 11,650 | | | | 1,190,630 | | | | 0.90 | % |
| | | | | | | | | 13,926,873 | | | | 10.51 | % |
The accompanying notes are an integral part of these financial statements.
| HENNESSY FUNDS | 1-800-966-4354 | |
| | COMMON STOCKS | | Number | | | | | | % of | |
| | | | of Shares | | | Value | | | Net Assets | |
| | Information Technology – 11.09% | | | | | | | | | |
| | Broadcom, Ltd. (b) | | | 13,650 | | | $ | 2,324,322 | | | | 1.75 | % |
| | Cisco Systems, Inc. | | | 90,460 | | | | 2,775,313 | | | | 2.09 | % |
| | Citrix Systems, Inc. (a) | | | 12,340 | | | | 1,046,432 | | | | 0.79 | % |
| | Fidelity National Information Services, Inc. | | | 11,150 | | | | 824,208 | | | | 0.62 | % |
| | LAM Research Corp. | | | 11,735 | | | | 1,136,652 | | | | 0.86 | % |
| | Microsemi Corp. (a) | | | 17,130 | | | | 721,687 | | | | 0.55 | % |
| | Oracle Corp. | | | 50,120 | | | | 1,925,610 | | | | 1.45 | % |
| | Skyworks Solutions, Inc. | | | 14,455 | | | | 1,112,168 | | | | 0.84 | % |
| | Total System Services, Inc. | | | 19,850 | | | | 990,118 | | | | 0.75 | % |
| | Western Digital Corp. | | | 31,556 | | | | 1,844,133 | | | | 1.39 | % |
| | | | | | | | | 14,700,643 | | | | 11.09 | % |
| | | | | | | | | | | | | | |
| | Materials – 3.21% | | | | | | | | | | | | |
| | Albemarle Corp. | | | 14,430 | | | | 1,205,627 | | | | 0.91 | % |
| | Ball Corp. | | | 8,490 | | | | 654,324 | | | | 0.49 | % |
| | PPG Industries, Inc. | | | 13,870 | | | | 1,291,713 | | | | 0.97 | % |
| | WestRock Co. | | | 23,975 | | | | 1,107,405 | | | | 0.84 | % |
| | | | | | | | | 4,259,069 | | | | 3.21 | % |
| | | | | | | | | | | | | | |
| | Telecommunication Services – 2.06% | | | | | | | | | | | | |
| | AT&T, Inc. | | | 36,300 | | | | 1,335,477 | | | | 1.01 | % |
| | T- Mobile US, Inc. (a) | | | 27,970 | | | | 1,390,948 | | | | 1.05 | % |
| | | | | | | | | 2,726,425 | | | | 2.06 | % |
| | | | | | | | | | | | | | |
| | Utilities – 7.66% | | | | | | | | | | | | |
| | American Electric Power, Inc. | | | 50,790 | | | | 3,293,223 | | | | 2.48 | % |
| | DTE Energy Co. | | | 35,285 | | | | 3,387,713 | | | | 2.56 | % |
| | NextEra Energy, Inc. | | | 27,170 | | | | 3,477,760 | | | | 2.62 | % |
| | | | | | | | | 10,158,696 | | | | 7.66 | % |
| | | | | | | | | | | | | | |
| | Total Common Stocks | | | | | | | | | | | | |
| | (Cost $108,177,400) | | | | | | | 125,547,494 | | | | 94.72 | % |
The accompanying notes are an integral part of these financial statements.
HENNESSYFUNDS.COM
| | REITS – 4.79% | | Number | | | | | | % of | |
| | | | of Shares | | | Value | | | Net Assets | |
| | Financials – 4.79% | | | | | | | | | |
| | AvalonBay Communities, Inc. | | | 9,344 | | | $ | 1,599,506 | | | | 1.21 | % |
| | Kilroy Realty Corp. | | | 26,437 | | | | 1,898,970 | | | | 1.43 | % |
| | Simon Property Group, Inc. | | | 8,032 | | | | 1,493,631 | | | | 1.13 | % |
| | Ventas, Inc. | | | 19,970 | | | | 1,352,967 | | | | 1.02 | % |
| | | | | | | | | 6,345,074 | | | | 4.79 | % |
| | | | | | | | | | | | | | |
| | Total REITS | | | | | | | | | | | | |
| | (Cost $6,127,403) | | | | | | | 6,345,074 | | | | 4.79 | % |
| | | | | | | | | | | | | | |
| | | | | | | | | | | | | | |
| | SHORT-TERM INVESTMENTS – 0.96% | | | | | | | | | | | | |
| | | | | | | | | | | | | | |
| | Money Market Funds – 0.96% | | | | | | | | | | | | |
| | Fidelity Government Portfolio, Institutional Class, 0.27% (c) | | | 1,267,959 | | | | 1,267,959 | | | | 0.96 | % |
| | | | | | | | | | | | | | |
| | Total Short-Term Investments | | | | | | | | | | | | |
| | (Cost $1,267,959) | | | | | | | 1,267,959 | | | | 0.96 | % |
| | | | | | | | | | | | | | |
| | Total Investments | | | | | | | | | | | | |
| | (Cost $115,572,762) – 100.47% | | | | | | | 133,160,527 | | | | 100.47 | % |
| | Liabilities in | | | | | | | | | | | | |
| | Excess of Other Assets – (0.47)% | | | | | | | (618,586 | ) | | | (0.47 | )% |
| | | | | | | | | | | | | | |
| | TOTAL NET ASSETS – 100.00% | | | | | | $ | 132,541,941 | | | | 100.00 | % |
Percentages are stated as a percent of net assets.
REIT – Real Estate Investment Trust
| (a) | Non-income producing security. |
| (b) | U.S. traded security of a foreign corporation. |
| (c) | The rate listed is the fund’s 7-day yield as of October 31, 2016. |
The accompanying notes are an integral part of these financial statements.
| HENNESSY FUNDS | 1-800-966-4354 | |
Summary of Fair Value Exposure at October 31, 2016
The following is a summary of the inputs used to value the Fund’s net assets as of October 31, 2016 (see Note 3 in the accompanying notes to the financial statements):
| Common Stocks | | Level 1 | | | Level 2 | | | Level 3 | | | Total | |
| Consumer Discretionary | | $ | 6,919,061 | | | $ | — | | | $ | — | | | $ | 6,919,061 | |
| Consumer Staples | | | 11,127,724 | | | | — | | | | — | | | | 11,127,724 | |
| Energy | | | 15,863,887 | | | | — | | | | — | | | | 15,863,887 | |
| Financials | | | 30,099,562 | | | | — | | | | — | | | | 30,099,562 | |
| Health Care | | | 15,765,554 | | | | — | | | | — | | | | 15,765,554 | |
| Industrials | | | 13,926,873 | | | | — | | | | — | | | | 13,926,873 | |
| Information Technology | | | 14,700,643 | | | | — | | | | — | | | | 14,700,643 | |
| Materials | | | 4,259,069 | | | | — | | | | — | | | | 4,259,069 | |
| Telecommunication Services | | | 2,726,425 | | | | — | | | | — | | | | 2,726,425 | |
| Utilities | | | 10,158,696 | | | | — | | | | — | | | | 10,158,696 | |
| Total Common Stocks | | $ | 125,547,494 | | | $ | — | | | $ | — | | | $ | 125,547,494 | |
| REITS | | | | | | | | | | | | | | | | |
| Financials | | $ | 6,345,074 | | | $ | — | | | $ | — | | | $ | 6,345,074 | |
| Total REITS | | $ | 6,345,074 | | | $ | — | | | $ | — | | | $ | 6,345,074 | |
| Short-Term Investments | | | | | | | | | | | | | | | | |
| Money Market Funds | | $ | 1,267,959 | | | $ | — | | | $ | — | | | $ | 1,267,959 | |
| Total Short-Term Investments | | $ | 1,267,959 | | | $ | — | | | $ | — | | | $ | 1,267,959 | |
| Total Investments | | $ | 133,160,527 | | | $ | — | | | $ | — | | | $ | 133,160,527 | |
Transfers between levels are recognized at the end of the reporting period. During the year ended October 31, 2016, the Fund recognized no transfers between levels.
The accompanying notes are an integral part of these financial statements.
HENNESSYFUNDS.COM
| SCHEDULE OF INVESTMENTS/STATEMENT OF ASSETS AND LIABILITIES |
Financial Statements
Statement of Assets and Liabilities as of October 31, 2016 |
| ASSETS: | | | |
| Investments in securities, at value (cost $115,572,762) | | $ | 133,160,527 | |
| Dividends and interest receivable | | | 101,404 | |
| Receivable for fund shares sold | | | 7,153 | |
| Receivable for securities sold | | | 1,682,610 | |
| Prepaid expenses and other assets | | | 14,310 | |
| Total Assets | | | 134,966,004 | |
| | | | | |
| LIABILITIES: | | | | |
| Payable for securities purchased | | | 2,019,778 | |
| Payable for fund shares redeemed | | | 101,548 | |
| Payable to advisor | | | 96,283 | |
| Payable to administrator | | | 22,080 | |
| Payable to auditor | | | 23,381 | |
| Accrued distribution fees | | | 116,697 | |
| Accrued service fees | | | 11,085 | |
| Accrued trustees fees | | | 3,897 | |
| Accrued expenses and other payables | | | 29,314 | |
| Total Liabilities | | | 2,424,063 | |
| NET ASSETS | | $ | 132,541,941 | |
| | | | | |
| NET ASSETS CONSIST OF: | | | | |
| Capital stock | | $ | 112,060,513 | |
| Accumulated net investment income | | | 978,600 | |
| Accumulated net realized gain on investments | | | 1,915,063 | |
| Unrealized net appreciation on investments | | | 17,587,765 | |
| Total Net Assets | | $ | 132,541,941 | |
| | | | | |
| NET ASSETS | | | | |
| Investor Class: | | | | |
| Shares authorized (no par value) | | Unlimited | |
| Net assets applicable to outstanding Investor Class shares | | $ | 129,683,391 | |
| Shares issued and outstanding | | | 4,221,633 | |
| Net asset value, offering price and redemption price per share | | $ | 30.72 | |
| | | | | |
| Institutional Class: | | | | |
| Shares authorized (no par value) | | Unlimited | |
| Net assets applicable to outstanding Institutional Class shares | | $ | 2,858,550 | |
| Shares issued and outstanding | | | 92,822 | |
| Net asset value, offering price and redemption price per share | | $ | 30.80 | |
The accompanying notes are an integral part of these financial statements.
| HENNESSY FUNDS | 1-800-966-4354 | |
Financial Statements
Statement of Operations for the year ended October 31, 2016 |
| INVESTMENT INCOME: | | | |
| Dividend income | | $ | 3,210,869 | |
| Interest income | | | 2,056 | |
| Total investment income | | | 3,212,925 | |
| | | | | |
| EXPENSES: | | | | |
| Investment advisory fees (See Note 5) | | | 1,136,994 | |
| Distribution fees – Investor Class (See Note 5) | | | 197,935 | |
| Service fees – Investor Class (See Note 5) | | | 131,956 | |
| Administration, fund accounting, custody and transfer agent fees (See Note 5) | | | 130,436 | |
| Sub-transfer agent expenses – Investor Class (See Note 5) | | | 99,712 | |
| Sub-transfer agent expenses – Institutional Class (See Note 5) | | | 4,188 | |
| Federal and state registration fees | | | 27,311 | |
| Audit fees | | | 24,104 | |
| Compliance expense (See Note 5) | | | 23,709 | |
| Reports to shareholders | | | 20,274 | |
| Trustees’ fees and expenses | | | 15,481 | |
| Legal fees | | | 504 | |
| Other expenses | | | 12,374 | |
| Total expenses | | | 1,824,978 | |
| NET INVESTMENT INCOME | | $ | 1,387,947 | |
| | | | | |
| REALIZED AND UNREALIZED GAINS (LOSSES): | | | | |
| Net realized gain on investments | | $ | 2,564,142 | |
| Net change in unrealized depreciation on investments | | | (4,107,054 | ) |
| Net loss on investments | | | (1,542,912 | ) |
| NET DECREASE IN NET ASSETS RESULTING FROM OPERATIONS | | $ | (154,965 | ) |
The accompanying notes are an integral part of these financial statements.
HENNESSYFUNDS.COM
| STATEMENT OF OPERATIONS/STATEMENTS OF CHANGES IN NET ASSETS |
Financial Statements
| Statements of Changes in Net Assets |
| | | Year Ended | | | Year Ended | |
| | | October 31, 2016 | | | October 31, 2015 | |
| OPERATIONS: | | | | | | |
| Net investment income | | $ | 1,387,947 | | | $ | 1,340,808 | |
| Net realized gain on investments | | | 2,564,142 | | | | 10,907,367 | |
| Net change in unrealized depreciation on investments | | | (4,107,054 | ) | | | (9,429,582 | ) |
| Net increase (decrease) in net | | | | | | | | |
| assets resulting from operations | | | (154,965 | ) | | | 2,818,593 | |
| | | | | | | | | |
| DISTRIBUTIONS TO SHAREHOLDERS FROM: | | | | | | | | |
| Net investment income | | | | | | | | |
| Investor Class | | | (1,379,214 | ) | | | (1,223,834 | ) |
| Institutional Class | | | (18,326 | ) | | | (4,422 | ) |
| Net realized gains | | | | | | | | |
| Investor Class | | | (11,104,771 | ) | | | (6,143,232 | ) |
| Institutional Class | | | (125,019 | ) | | | (16,453 | ) |
| Total distributions | | | (12,627,330 | ) | | | (7,387,941 | ) |
| | | | | | | | | |
| CAPITAL SHARE TRANSACTIONS: | | | | | | | | |
| Proceeds from shares subscribed – Investor Class | | | 890,995 | | | | 1,694,661 | |
| Proceeds from shares subscribed – Institutional Class | | | 2,536,101 | | | | 963,669 | |
| Dividends reinvested – Investor Class | | | 12,006,353 | | | | 7,104,575 | |
| Dividends reinvested – Institutional Class | | | 140,185 | | | | 20,495 | |
| Cost of shares redeemed – Investor Class | | | (12,544,355 | ) | | | (13,521,759 | ) |
| Cost of shares redeemed – Institutional Class | | | (962,439 | ) | | | (82,147 | ) |
| Net increase (decrease) in net assets derived from | | | | | | | | |
| capital share transactions | | | 2,066,840 | | | | (3,820,506 | ) |
| TOTAL DECREASE IN NET ASSETS | | | (10,715,455 | ) | | | (8,389,854 | ) |
| | | | | | | | | |
| NET ASSETS: | | | | | | | | |
| Beginning of year | | | 143,257,396 | | | | 151,647,250 | |
| End of year | | $ | 132,541,941 | | | $ | 143,257,396 | |
| Undistributed net investment income, end of year | | $ | 978,600 | | | $ | 1,020,438 | |
| | | | | | | | | |
| CHANGES IN SHARES OUTSTANDING: | | | | | | | | |
| Shares sold – Investor Class | | | 29,586 | | | | 49,427 | |
| Shares sold – Institutional Class | | | 81,884 | | | | 28,858 | |
| Shares issued to holders as reinvestment | | | | | | | | |
| of dividends – Investor Class | | | 397,477 | | | | 208,039 | |
| Shares issued to holders as reinvestment | | | | | | | | |
| of dividends – Institutional Class | | | 4,626 | | | | 598 | |
| Shares redeemed – Investor Class | | | (414,867 | ) | | | (395,518 | ) |
| Shares redeemed – Institutional Class | | | (32,144 | ) | | | (2,406 | ) |
| Net increase (decrease) in shares outstanding | | | 66,562 | | | | (111,002 | ) |
The accompanying notes are an integral part of these financial statements.
| HENNESSY FUNDS | 1-800-966-4354 | |
Financial Statements
For an Investor Class share outstanding throughout each year
PER SHARE DATA:
Net asset value, beginning of year
Income from investment operations:
Net investment income
Net realized and unrealized gains (losses) on investments
Total from investment operations
Less distributions:
Dividends from net investment income
Dividends from net realized gains
Total distributions
Net asset value, end of year
TOTAL RETURN
SUPPLEMENTAL DATA AND RATIOS:
Net assets, end of year (millions)
Ratio of expenses to average net assets
Ratio of net investment income to average net assets
Portfolio turnover rate(1)
(1) | Portfolio turnover is calculated on the basis of the Fund as a whole. |
The accompanying notes are an integral part of these financial statements.
HENNESSYFUNDS.COM
| FINANCIAL HIGHLIGHTS — INVESTOR CLASS |
| Year Ended October 31, | |
| 2016 | | | 2015 | | | 2014 | | | 2013 | | | 2012 | |
| | | | | | | | | | | | | | |
| $ | 33.72 | | | $ | 34.79 | | | $ | 30.70 | | | $ | 24.71 | | | $ | 21.47 | |
| | | | | | | | | | | | | | | | | | | |
| | | | | | | | | | | | | | | | | | | |
| | 0.30 | | | | 0.30 | | | | 0.28 | | | | 0.28 | | | | 0.28 | |
| | (0.34 | ) | | | 0.32 | | | | 4.06 | | | | 6.00 | | | | 3.14 | |
| | (0.04 | ) | | | 0.62 | | | | 4.34 | | | | 6.28 | | | | 3.42 | |
| | | | | | | | | | | | | | | | | | | |
| | | | | | | | | | | | | | | | | | | |
| | (0.31 | ) | | | (0.27 | ) | | | (0.25 | ) | | | (0.29 | ) | | | (0.18 | ) |
| | (2.65 | ) | | | (1.42 | ) | | | — | | | | — | | | | — | |
| | (2.96 | ) | | | (1.69 | ) | | | (0.25 | ) | | | (0.29 | ) | | | (0.18 | ) |
| $ | 30.72 | | | $ | 33.72 | | | $ | 34.79 | | | $ | 30.70 | | | $ | 24.71 | |
| | | | | | | | | | | | | | | | | | | |
| | 0.11 | % | | | 1.77 | % | | | 14.20 | % | | | 25.64 | % | | | 16.07 | % |
| | | | | | | | | | | | | | | | | | | |
| | | | | | | | | | | | | | | | | | | |
| $ | 129.68 | | | $ | 141.96 | | | $ | 151.25 | | | $ | 143.48 | | | $ | 125.00 | |
| | 1.37 | % | | | 1.20 | % | | | 1.28 | % | | | 1.33 | % | | | 1.40 | % |
| | 1.04 | % | | | 0.90 | % | | | 0.80 | % | | | 0.98 | % | | | 1.16 | % |
| | 80 | % | | | 85 | % | | | 85 | % | | | 91 | % | | | 111 | % |
The accompanying notes are an integral part of these financial statements.
| HENNESSY FUNDS | 1-800-966-4354 | |
Financial Statements
For an Institutional Class share outstanding throughout each year
PER SHARE DATA:
Net asset value, beginning of year
Income from investment operations:
Net investment income
Net realized and unrealized gains (losses) on investments
Total from investment operations
Less distributions:
Dividends from net investment income
Dividends from net realized gains
Total distributions
Net asset value, end of year
TOTAL RETURN
SUPPLEMENTAL DATA AND RATIOS:
Net assets, end of year (millions)
Ratio of expenses to average net assets:
Before expense reimbursement
After expense reimbursement
Ratio of net investment income to average net assets:
Before expense reimbursement
After expense reimbursement
Portfolio turnover rate(1)
(1) | Portfolio turnover is calculated on the basis of the Fund as a whole. |
The accompanying notes are an integral part of these financial statements.
HENNESSYFUNDS.COM
| FINANCIAL HIGHLIGHTS — INSTITUTIONAL CLASS |
| Year Ended October 31, | |
| 2016 | | | 2015 | | | 2014 | | | 2013 | | | 2012 | |
| | | | | | | | | | | | | | |
| $ | 33.82 | | | $ | 34.94 | | | $ | 30.83 | | | $ | 24.83 | | | $ | 21.56 | |
| | | | | | | | | | | | | | | | | | | |
| | | | | | | | | | | | | | | | | | | |
| | 0.33 | | | | 0.23 | | | | 0.34 | | | | 0.49 | | | | 0.39 | |
| | (0.34 | ) | | | 0.44 | | | | 4.11 | | | | 5.90 | | | | 3.15 | |
| | (0.01 | ) | | | 0.67 | | | | 4.45 | | | | 6.39 | | | | 3.54 | |
| | | | | | | | | | | | | | | | | | | |
| | | | | | | | | | | | | | | | | | | |
| | (0.35 | ) | | | (0.36 | ) | | | (0.34 | ) | | | (0.39 | ) | | | (0.27 | ) |
| | (2.66 | ) | | | (1.43 | ) | | | — | | | | — | | | | — | |
| | (3.01 | ) | | | (1.79 | ) | | | (0.34 | ) | | | (0.39 | ) | | | (0.27 | ) |
| $ | 30.80 | | | $ | 33.82 | | | $ | 34.94 | | | $ | 30.83 | | | $ | 24.83 | |
| | | | | | | | | | | | | | | | | | | |
| | 0.21 | % | | | 1.89 | % | | | 14.55 | % | | | 26.08 | % | | | 16.58 | % |
| | | | | | | | | | | | | | | | | | | |
| | | | | | | | | | | | | | | | | | | |
| $ | 2.86 | | | $ | 1.30 | | | $ | 0.40 | | | $ | 0.34 | | | $ | 0.06 | |
| | | | | | | | | | | | | | | | | | | |
| | 1.28 | % | | | 1.18 | % | | | 1.18 | % | | | 1.14 | % | | | 1.22 | % |
| | 1.28 | % | | | 1.15 | % | | | 0.98 | % | | | 0.98 | % | | | 0.98 | % |
| | | | | | | | | | | | | | | | | | | |
| | 1.07 | % | | | 0.83 | % | | | 0.91 | % | | | 1.07 | % | | | 1.29 | % |
| | 1.07 | % | | | 0.86 | % | | | 1.11 | % | | | 1.23 | % | | | 1.53 | % |
| | 80 | % | | | 85 | % | | | 85 | % | | | 91 | % | | | 111 | % |
The accompanying notes are an integral part of these financial statements.
| HENNESSY FUNDS | 1-800-966-4354 | |
Financial Statements
Notes to the Financial Statements October 31, 2016 |
1). ORGANIZATION
The Hennessy Large Value Fund (the “Fund”) is a series of Hennessy Funds Trust (the “Trust”), which was organized as a Delaware statutory trust on September 17, 1992. The Fund is an open-end management investment company registered under the Investment Company Act of 1940, as amended. The investment objective of the Fund is long-term growth of capital and current income. The Fund is a diversified fund.
The Fund offers Investor Class and Institutional Class shares. Each class of shares differs principally in its respective administration, 12b-1 distribution and service, shareholder servicing, and transfer agent expenses (there are no sales charges). Each class has identical rights to earnings, assets, and voting privileges, except for class-specific expenses and exclusive rights to vote on matters affecting only an individual class.
As an investment company, the Fund follows the investment company accounting and reporting guidance of the Financial Accounting Standards Board (“FASB”) Accounting Standard Codification Topic 946 “Financial Services—Investment Companies.”
2). SIGNIFICANT ACCOUNTING POLICIES
The following is a summary of significant accounting policies consistently followed by the Fund in the preparation of the financial statements. These policies conform with U.S. generally accepted accounting principles (“GAAP”).
| a). | Investment Valuation – All investments in securities are recorded at their estimated fair value, as described in Note 3. |
| | |
| b). | Federal Income Taxes – No provision for federal income taxes or excise taxes has not been made since the Fund has elected to be taxed as a “regulated investment company” and intends to distribute substantially all of its taxable income to its shareholders and otherwise comply with the provisions of the Internal Revenue Code of 1986, as amended, applicable to regulated investment companies. Net investment income or loss and realized gains and losses for federal income tax purposes may differ from that reported on the financial statements because of temporary book and tax basis differences. Temporary differences are primarily the result of the treatment of wash sales for tax reporting purposes. The Fund recognizes interest and penalties related to income tax benefits, if any, in the statement of operations as an income tax expense. Distributions from net realized gains for book purposes may include short-term capital gains, which are included as ordinary income to shareholders for tax purposes. |
| | |
| | Due to inherent differences in the recognition of income, expenses, and realized gains/losses under GAAP and federal income tax regulations, permanent differences between book and tax basis for reporting for the fiscal year ended October 31, 2016, have been identified and appropriately reclassified on the Statement of Assets and Liabilities. The adjustments are as follows: |
| | Undistributed | Accumulated | | |
| | Net Investment | Net Realized | | |
| | Income/(Loss) | Gain/(Loss) | Paid-in Capital | |
| | $(32,245) | $32,245 | $— | |
HENNESSYFUNDS.COM
| NOTES TO THE FINANCIAL STATEMENTS |
| c). | Accounting for Uncertainty in Income Taxes – The Fund has accounting policies regarding recognition and measurement of tax positions taken or expected to be taken on a tax return. The tax returns of the Fund for the prior three fiscal years are open for examination. The Fund has reviewed all open tax years in major jurisdictions and concluded that there is no impact on the Fund’s net assets and no tax liability resulting from unrecognized tax benefits relating to uncertain income tax positions taken or expected to be taken on a tax return. The Fund’s major tax jurisdictions are U.S. federal and Delaware. |
| | |
| d). | Income and Expenses – Dividend income is recognized on the ex-dividend date or as soon as information is available to the Fund. Interest income, which includes the amortization of premium and accretion of discount, is recognized on an accrual basis. The Fund is charged for those expenses that are directly attributable to the portfolio, such as advisory, administration, and certain shareholder service fees. Income, expenses (other than expenses attributable to a specific class), and realized and unrealized gains or losses on investments are allocated to each class of shares based on its respective net assets. |
| | |
| e). | Distributions to Shareholders – Dividends from net investment income for the Fund, if any, are declared and paid annually, usually in December. Distributions of net realized capital gains, if any, are declared and paid annually, usually in December. |
| | |
| f). | Security Transactions – Investment and shareholder transactions are recorded on the trade date. The Fund determines the gain or loss realized from the investment transactions by comparing the original cost of the security lot sold with the net sale proceeds. Discounts and premiums on securities purchased are accreted/amortized over the life of the respective security. |
| | |
| g). | Use of Estimates – The preparation of financial statements in conformity with GAAP requires management to make estimates and assumptions that affect the reported amounts of assets and liabilities and disclosure of contingent assets and liabilities at the date of the financial statements and the reported change in net assets during the reporting period. Actual results could differ from those estimates. |
| | |
| h). | Share Valuation – The net asset value (“NAV”) per share of the Fund is calculated by dividing the sum of the value of the securities held by the Fund, plus cash or other assets, minus all liabilities (including estimated accrued expenses) by the total number of shares outstanding for the Fund, rounded to the nearest cent. The Fund’s shares will not be priced on days the New York Stock Exchange is closed for trading. The offering and redemption price per share for the Fund is equal to the Fund’s NAV per share. |
| | |
| i). | Foreign Currency – Values of investments denominated in foreign currencies, if any, are converted into U.S. dollars using the spot market rate of exchange at the time of valuation. Purchases and sales of investments and income are translated into U.S. dollars using the spot market rate of exchange prevailing on the respective dates of such transactions. The Fund does not isolate the portion of the results of operations resulting from fluctuations in foreign exchange rates on investments from fluctuations resulting from changes in the market prices of securities held. Such fluctuations are included with the net realized and unrealized gain or loss on investments. Foreign investments present additional risks due to currency fluctuations, economic and political factors, lower liquidity, government regulations, differences in accounting standards, and other factors. |
| | |
| j). | Forward Contracts – The Fund may enter into forward currency contracts to reduce its exposure to changes in foreign currency exchange rates on its foreign holdings and to lock in the U.S. dollar cost of firm purchase and sale commitments for |
| HENNESSY FUNDS | 1-800-966-4354 | |
| | securities denominated in foreign currencies. A forward currency contract is a commitment to purchase or sell a foreign currency at a future date at a negotiated forward rate. The gain or loss arising from the difference between the U.S. dollar cost of the original contract and the value of the foreign currency in U.S. dollars upon closing of such contract is included in net realized gain or loss from foreign currency transactions. During the fiscal year ended October 31, 2016, the Fund did not enter into any forward contracts. |
| | |
| k). | Repurchase Agreements – The Fund may enter into repurchase agreements with member banks or security dealers of the Federal Reserve Board whom the investment advisor deems creditworthy. The repurchase price generally equals the price paid by the Fund plus interest negotiated on the basis of current short-term rates. |
| | |
| | Securities pledged as collateral for repurchase agreements are held by the custodian bank until the respective agreements mature. Provisions of the repurchase agreements ensure that the market value of the collateral, including accrued interest thereon, is sufficient to cover the repurchase amount in the event of default of the counterparty. If the counterparty defaults and the value of the collateral declines or if the counterparty enters an insolvency proceeding, realization of the collateral by the Fund may be delayed or limited. During the fiscal year ended October 31, 2016, the Fund did not enter into any repurchase agreements. |
| | |
| l). | Derivatives – The Fund may invest in, or enter into, derivatives, such as options, futures contracts, options on futures contracts, and swaps, for a variety of reasons, including to hedge certain risks, to provide a substitute for purchasing or selling particular securities, or to increase potential income gain. Derivatives are financial contracts based on an underlying or notional amount, require no initial investment or an initial net investment that is smaller than would normally be required to have a similar response to changes in market factors, and require or permit net settlement. Derivatives may allow the Fund to increase or decrease the level of risk to which the Fund is exposed more quickly and efficiently than transactions in other types of instruments. The main purpose of utilizing derivative instruments is for hedging purposes. |
| | |
| | The Fund follows the financial accounting reporting rules as required by the Derivatives and Hedging Topic of the FASB Accounting Standards Codification. Under such rules, the Fund is required to include enhanced disclosure that enables investors to understand how and why an entity uses derivatives, how derivatives are accounted for, and how derivatives instruments affect an entity’s results of operations and financial position. During the fiscal year ended October 31, 2016, the Fund did not hold any derivative instruments. |
| | |
| m). | New Accounting Pronouncements – In May 2015, the FASB issued ASU No. 2015-07 “Disclosure for Investments in Certain Entities that Calculate Net Asset Value per Share (or Its Equivalent).” The amendments in ASU No. 2015-07 remove the requirement to categorize within the fair value hierarchy investments measured at NAV and require the disclosure of sufficient information to reconcile the fair value of the remaining assets categorized within the fair value hierarchy to the financial statements. The amendments in ASU No. 2015-07 are effective for fiscal years beginning after December 15, 2015, and interim periods within those fiscal years. Management has reviewed the requirements and believes the adoption of ASU 2015-07 will not have a material impact on the Fund’s financial statements and related disclosures. |
HENNESSYFUNDS.COM
| NOTES TO THE FINANCIAL STATEMENTS |
3). SECURITIES VALUATION
The Fund follows authoritative fair valuation accounting standards that establish an authoritative definition of fair value and set out a hierarchy for measuring fair value. These standards require additional disclosures about the various inputs and valuation techniques used to develop the measurements of fair value and a discussion in changes in valuation techniques and related inputs during the period. These inputs are summarized in the three broad levels listed below:
| | Level 1 – | Unadjusted, quoted prices in active markets for identical instruments that the Fund has the ability to access at the date of measurement. |
| | | |
| | Level 2 – | Other significant observable inputs (including, but not limited to, quoted prices in active markets for similar instruments, quoted prices in markets that are not active for identical or similar instruments, and model-derived valuations in which all significant inputs and significant value drivers are observable in active markets (such as interest rates, prepayment speeds, credit risk curves, default rates, and similar data)). |
| | | |
| | Level 3 – | Significant unobservable inputs (including the Fund’s own assumptions about what market participants would use to price the asset or liability based on the best available information) when observable inputs are unavailable. |
Following is a description of the valuation techniques applied to the Fund’s major categories of assets and liabilities measured at fair value on a recurring basis.
Equity Securities – Equity securities, including common stocks, preferred stocks, foreign-issued common stocks, exchange-traded funds, closed-end mutual funds, partnerships, rights, and real estate investment trusts, that are traded on a securities exchange for which a last-quoted sales price is readily available will generally be valued at the last sales price as reported by the primary exchange on which the securities are listed. Securities listed on The NASDAQ Stock Market (“NASDAQ”) will generally be valued at the NASDAQ Official Closing Price, which may differ from the last sales price reported. Securities traded on a securities exchange for which a last-quoted sales price is not readily available will generally be valued at the mean between the bid and ask prices. To the extent these securities are actively traded and valuation adjustments are not applied, they are classified in Level 1 of the fair value hierarchy. Securities traded on foreign exchanges generally are not valued at the same time the Fund calculates its NAV because most foreign markets close well before such time. The earlier close of most foreign markets gives rise to the possibility that significant events, including broad market moves, may have occurred in the interim. In certain circumstances, it may be determined that a security needs to be fair valued because it appears that the value of the security might have been materially affected by events occurring after the close of the market in which the security is principally traded, but before the time the Fund calculates its NAV, such as by a development that affects an entire market or region (e.g., weather-related events) or a potentially global development (e.g., a terrorist attack that may be expected to have an effect on investor expectations worldwide).
Registered Investment Companies – Investments in registered investment companies (e.g., mutual funds) are generally priced at the ending NAV provided by the applicable registered investment company’s service agent and will be classified in Level 1 of the fair value hierarchy.
Debt Securities – Debt securities, including corporate bonds, asset-backed securities, mortgage-backed securities, municipal bonds, U.S. Treasuries, and U.S. government agency issues, are generally valued at market on the basis of valuations furnished by an independent pricing service that utilizes both dealer-supplied valuations and formula-based
| HENNESSY FUNDS | 1-800-966-4354 | |
techniques. The pricing service may consider recently executed transactions in securities of the issuer or comparable issuers, market price quotations (where observable), bond spreads, and fundamental data relating to the issuer. In addition, the model may incorporate observable market data, such as reported sales of similar securities, broker quotes, yields, bids, offers, and reference data. Certain securities are valued primarily using dealer quotations. These securities are generally classified in Level 2 of the fair value hierarchy.
Short-Term Securities – Short-term equity investments, including money market funds, are valued in the manner specified above. Short-term debt investments with an original term to maturity of 60 days or less are valued at amortized cost, which approximates fair market value. If the original term to maturity of a short-term debt investment exceeded 60 days, then the values as of the 61st day prior to maturity are amortized. Amortized cost is not used if its use would be inappropriate due to credit or other impairments of the issuer, in which case the security’s fair value would be determined, as described below. Short-term securities are generally classified in Level 1 or Level 2 of the fair market hierarchy depending on the inputs used and market activity levels for specific securities.
The Board of Trustees of the Fund (the “Board”) has adopted fair value pricing procedures that are followed when a price for a security is not readily available or if a significant event has occurred that indicates the closing price of a security no longer represents the true value of that security. Fair value pricing determinations are made in good faith in accordance with these procedures. There are numerous criteria that will be given consideration in determining a fair value of a security, such as the trading volume of a security and markets, the value of other like securities, and news events with direct bearing to a security or markets. Fair value pricing results in an estimated price for a security that reflects the amount the Fund might reasonably expect to receive in a current sale. Depending on the relative significance of the valuation inputs, these securities may be classified in either Level 2 or Level 3 of the fair value hierarchy.
The fair valuation of foreign securities may be determined with the assistance of a pricing service using correlations between the movement of prices of such securities and indices of domestic securities and other appropriate indicators, such as closing market prices of relevant American Depositary Receipts or futures contracts. The effect of using fair value pricing is that the Fund’s NAV will reflect the affected portfolio securities’ value as determined by the Board or its designee instead of being determined by the market. Using a fair value pricing methodology to price foreign securities may result in a value that is different from a foreign security’s most recent closing price and from the prices used by other investment companies to calculate their NAVs and are generally considered Level 2 prices in the fair valuation hierarchy. Because the Fund may invest in foreign securities, the value of the Fund’s portfolio securities may change on days when you will not be able to purchase or redeem your shares.
The Board has delegated day-to-day valuation matters to a Valuation Committee comprised of one or more representatives from Hennessy Advisors, Inc., the Fund’s investment advisor. The function of the Valuation Committee is to value securities where current and reliable market quotations are not readily available. All actions taken by the Valuation Committee are reviewed by the Board.
The Fund has performed an analysis of all existing investments to determine the significance and character of all inputs to their fair value determination. Various inputs are used in determining the value of the Fund’s investments. The inputs or methodology used for valuing securities are not necessarily an indication of the risk associated with investing in those securities. Details related to the fair valuation hierarchy of the Fund’s securities as of October 31, 2016, are included in the Fund’s Schedule of Investments.
HENNESSYFUNDS.COM
| NOTES TO THE FINANCIAL STATEMENTS |
4). INVESTMENT TRANSACTIONS
Purchases and sales of investment securities (excluding government and short-term investments) for the Fund during the fiscal year ended October 31, 2016, were $106,837,633 and $115,650,296, respectively.
There were no purchases or sales/maturities of long-term U.S. government securities for the Fund during the fiscal year ended October 31, 2016.
The Fund is permitted to purchase or sell securities from or to another fund in the Hennessy Funds family of funds (the “Hennessy Funds”) under specified conditions outlined in procedures adopted by the Board of Trustees. The procedures have been designed to ensure that any purchase or sale of securities by the Fund from or to another Hennessy Fund complies with Rule 17a-7 of the Investment Company Act of 1940. For the fiscal year ended October 31, 2016, the Fund did not engage in purchases and sales of securities pursuant to Rule 17a-7 of the Investment Company Act of 1940.
5). INVESTMENT MANAGEMENT FEE AND OTHER TRANSACTIONS WITH AFFILIATES
Hennessy Advisors, Inc. (the “Advisor”) is the investment advisor of the Fund. The Advisor provides the Fund with investment management services under an Investment Advisory Agreement. The Advisor furnishes all investment advice, office space, facilities, and provides most of the personnel needed by the Fund. As compensation for its services, the Advisor is entitled to a monthly fee from the Fund. The fee is based upon the average daily net assets of the Fund at the annual rate of 0.85%. The net investment advisory fees payable by the Fund as of October 31, 2016, were $96,283.
The Advisor has delegated the day-to-day management of the Fund to a sub-advisor, RBC Global Asset Management (U.S.) Inc. The Advisor pays the sub-advisor fees from its own assets and these fees are not an additional expense of the Fund. For the most recent fiscal year, the Advisor (not the Fund) paid a sub-advisory fee, based upon the daily net assets of the Fund, at the rate of 0.35%.
In the past, the Advisor had contractually agreed to waive its fees and absorb expenses to the extent that the total annual operating expenses exceeded 0.98% of the Fund’s net assets for Institutional Class shares of the Fund (excluding all federal, state and local taxes, interest, brokerage commissions, acquired fund fees and expenses and other costs incurred in connection with the purchase and sale of securities and extraordinary items). The expense limitation agreement was terminated by the Board as of February 28, 2015.
For a period of three years after the year in which the Advisor waived or reimbursed expenses, the Advisor may seek reimbursement from the Fund to the extent that total annual fund operating expenses are less than the expense limitation that was in effect at the time the Advisor waived or reimbursed expenses. As of October 31, 2016, cumulative expenses subject to potential recovery under the aforementioned conditions were $153 for Institutional Class shares, of which $9 will expire on October 31, 2017, and $144 will expire on October 31, 2018.
The Board has approved a Shareholder Servicing Agreement for Investor Class shares of the Fund, which was instituted to compensate the Advisor for the non-investment management services it provides to the Fund. The Shareholder Servicing Agreement provides for a monthly fee paid to the Advisor at an annual rate of 0.10% of the average daily net assets of the Fund attributable to Investor Class shares. Shareholder service fees payable by the Fund as of October 31, 2016, were $11,085.
The Fund has adopted a plan pursuant to Rule 12b-1 under the Investment Company Act of 1940, as amended, that authorizes payments in connection with the distribution of the Fund’s shares at an annual rate of up to 0.25% of the Fund’s average
| HENNESSY FUNDS | 1-800-966-4354 | |
daily net assets attributable to Investor Class shares. Even though the authorized rate is up to 0.25%, the Fund has only used up to 0.15% of its average daily net assets attributable to Investor Class shares for such purpose since the plan was implemented on November 1, 2015. Amounts paid under the plan may be spent on any activities or expenses primarily intended to result in the sale of shares, including, but not limited to, advertising, shareholder account servicing, the printing and mailing of prospectuses to other than current shareholders, the printing and mailing of sales literature, and compensation for sales and marketing activities or to financial institutions and others, such as dealers and distributors.
The Fund has entered into agreements with various brokers, dealers, and financial intermediaries in connection with the sale of shares of the Fund. The agreements provide for periodic payments by the Fund to the brokers, dealers, and financial intermediaries for providing certain shareholder maintenance services (sub-transfer agent expenses). These shareholder services include the pre-processing and quality control of new accounts, shareholder correspondence, answering customer inquiries regarding account status, and facilitating shareholder telephone transactions. Fees paid by the Fund to various brokers, dealers, and financial intermediaries during the fiscal year ended October 31, 2016, were $103,900.
U.S. Bancorp Fund Services, LLC (“USBFS”) provides the Fund with administrative, fund accounting, and transfer agent services, and necessary office equipment. As administrator, USBFS is responsible for activities such as (i) preparing various federal and state regulatory filings, reports, and returns for the Fund, (ii) preparing reports and materials to be supplied to the Board, (iii) monitoring the activities of the Fund’s custodian, transfer agent, and accountants, and (iv) coordinating the preparation and payment of the Fund’s expenses and reviewing the Fund’s expense accruals. Fees paid to USBFS during the fiscal year ended October 31, 2016, were $130,436.
U.S. Bank, N.A., an affiliate of USBFS, serves as the Fund’s custodian. Quasar Distributors, LLC acts as the Fund’s principal underwriter in a continuous public offering of the Fund’s shares. Quasar Distributors, LLC is an affiliate of USBFS and U.S. Bank, N.A.
The officers of the Fund are affiliated with the Advisor. Such officers, with the exception of the Chief Compliance Officer and the Senior Compliance Officer, receive no compensation from the Fund for serving in their respective roles. The Fund, along with the other Hennessy Funds, makes reimbursement payments, on an equal basis, to the Advisor for a portion of the salary and benefits associated with the office of the Chief Compliance Officer and for all of the salary and benefits associated with the office of the Senior Compliance Officer. Such amounts are included on the Statement of Operations.
6). GUARANTEES AND INDEMNIFICATIONS
Under the Hennessy Funds’ organizational documents, their officers and trustees are indemnified by the Hennessy Funds against certain liabilities arising out of the performance of their duties to the Hennessy Funds. Additionally, in the normal course of business, the Hennessy Funds enter into contracts with service providers that contain general indemnification clauses. The Fund’s maximum exposure under these arrangements is unknown as this would involve future claims that may be made against the Fund that have not yet occurred. Currently, the Fund expects the risk of loss to be remote.
7). LINE OF CREDIT
The Fund has an uncommitted line of credit with the other Hennessy Funds in the amount of the lesser of (i) $100,000,000 or (ii) 33.33% of each Hennessy Fund’s net assets, or 30% for the Hennessy Gas Utility Fund and 10% for the Hennessy Balanced
HENNESSYFUNDS.COM
| NOTES TO THE FINANCIAL STATEMENTS |
Fund, intended to provide short-term financing, if necessary, subject to certain restrictions, in connection with shareholder redemptions. The credit facility is with the Hennessy Funds’ custodian bank, U.S. Bank, N.A. Borrowings under this arrangement bear interest at the bank’s prime rate and are secured by all of the Fund’s assets (as to its own borrowings only). During the fiscal year ended October 31, 2016, the Fund did not have any borrowings outstanding under the line of credit.
8). FEDERAL TAX INFORMATION
As of October 31, 2016, the components of accumulated earnings (losses) for income tax purposes were as follows:
| | Cost of investments for tax purposes | | $ | 117,141,865 | |
| | Gross tax unrealized appreciation | | $ | 20,864,823 | |
| | Gross tax unrealized depreciation | | | (4,846,161 | ) |
| | Net tax unrealized appreciation | | $ | 16,018,662 | |
| | Undistributed ordinary income | | $ | 978,600 | |
| | Undistributed long-term capital gains | | | 3,484,166 | |
| | Total distributable earnings | | $ | 4,462,766 | |
| | Other accumulated loss | | $ | — | |
| | Total accumulated gain | | $ | 20,481,428 | |
The difference between book-basis unrealized appreciation/depreciation (as shown in the Statement of Assets and Liabilities) and tax-basis unrealized appreciation/depreciation (as shown above) is attributable primarily to wash sales.
At October 31, 2016, the Fund had no tax basis capital losses to offset future capital gains.
At October 31, 2016, the Fund did not defer, on a tax basis, any post-December late year ordinary loss deferrals.
During the fiscal years ended October 31, 2016 and 2015, the tax character of distributions paid by the Fund was as follows:
| | | Year Ended | | | Year Ended | |
| | | October 31, 2016 | | | October 31, 2015 | |
Ordinary income(1) | | $ | 2,222,426 | | | $ | 1,228,256 | |
| Long-term capital gain | | | 10,404,904 | | | | 6,159,685 | |
| | | $ | 12,627,330 | | | $ | 7,387,941 | |
(1) Ordinary income includes short-term gain or loss.
9). EVENTS SUBSEQUENT TO YEAR END
Management has evaluated the Fund’s related events and transactions that occurred subsequent to October 31, 2016, through the date of issuance of the Fund’s financial statements. Other than as disclosed below, management has determined that there were no subsequent events requiring recognition or disclosure in the financial statements.
On December 7, 2016, capital gains were declared and paid to shareholders of record as of December 6, 2016, as follows:
| | Long-term | |
| | Amount Per Share | |
| Investor Class | $0.81510 | |
| Institutional Class | $0.81676 | |
| HENNESSY FUNDS | 1-800-966-4354 | |
Report of Independent Registered Public Accounting Firm
The Board of Trustees of Hennessy Funds Trust
and Shareholders of the Hennessy Large Value Fund:
We have audited the accompanying statement of assets and liabilities of the Hennessy Large Value Fund (the Fund), a series of Hennessy Funds Trust, including the schedule of investments, as of October 31, 2016, and the related statement of operations for the year then ended, the statements of changes in net assets for each of the years in the two year period then ended, and the financial highlights for each of the years in the five year period then ended. These financial statements and financial highlights are the responsibility of the Fund’s management. Our responsibility is to express an opinion on these financial statements and financial highlights based on our audits.
We conducted our audits in accordance with the standards of the Public Company Accounting Oversight Board (United States). Those standards require that we plan and perform the audit to obtain reasonable assurance about whether the financial statements and financial highlights are free of material misstatement. An audit includes examining, on a test basis, evidence supporting the amounts and disclosures in the financial statements. Our procedures included confirmation of securities owned as of October 31, 2016, by correspondence with custodians and brokers or by other appropriate auditing procedures. An audit also includes assessing the accounting principles used and significant estimates made by management, as well as evaluating the overall financial statement presentation. We believe that our audits provide a reasonable basis for our opinion.
In our opinion, the financial statements and financial highlights referred to above present fairly, in all material respects, the financial position of the Fund as of October 31, 2016, the results of its operations for the year then ended, the changes in its net assets for each of the years in the two year period then ended, and the financial highlights for each of the years in the five year period then ended, in conformity with U.S. generally accepted accounting principles.
Chicago, Illinois
December 22, 2016
HENNESSYFUNDS.COM
| REPORT OF INDEPENDENT REGISTERED PUBLIC ACCOUNTING FIRM/TRUSTEES AND OFFICERS |
Trustees and Officers of the Fund (Unaudited)
The business and affairs of the Fund are managed under the direction of the Board of Trustees of the Trust, and the Board of Trustees elects the Officers of the Trust. Beginning in March 2015, the Board of Trustees has from time to time appointed advisers (“Advisers “) to the Board of Trustees, with the intention of having qualified individuals serve in an advisory capacity in order to garner experience in the mutual fund and asset management industry and be considered as potential Trustees in the future. There are currently three Advisers to the Board of Trustees: Brian Alexander, Doug Franklin, and Claire Knoles. As Advisers, Mr. Alexander, Mr. Franklin, and Ms. Knoles attend meetings of the Board and act as non-voting participants. Information pertaining to the Trustees, Advisers, and the Officers of the Trust is set forth below. The Trustees and Officers serve until their successors are duly elected and qualified or until their earlier death, resignation, or removal. Each of the Trustees oversees 16 Hennessy Funds. Unless otherwise indicated, the address of all persons listed below is 7250 Redwood Boulevard, Suite 200, Novato, CA 94945. The Fund’s Statement of Additional Information includes more information about the persons listed below and is available, without charge, upon request by calling 1-800-966-4354.
| | | | Other |
| | | | Directorships |
| | | | Held Outside |
| Name, (Year of Birth), | | | of Fund |
| and Position Held | Start Date | Principal Occupation(s) | Complex During |
with the Trust | of Service | During Past Five Years | Past Five Years(1) |
| |
| Disinterested Trustees and Advisers |
| | | | |
| J. Dennis DeSousa | January 1996 | Mr. DeSousa is a real estate investor. | None. |
| (1936) | | | |
| Trustee | | | |
| | | | |
| Robert T. Doyle | January 1996 | Mr. Doyle has been the Sheriff of | None. |
| (1947) | | Marin County, California since 1996. | |
| Trustee | | | |
| | | | |
| Gerald P. Richardson | May 2004 | Mr. Richardson is an independent | None. |
| (1945) | | consultant in the securities industry. | |
| Trustee | | | |
| | | | |
| Brian Alexander | March 2015 | Mr. Alexander has been employed | None. |
| (1981) | | by Sutter Health Novato Community | |
| Adviser to the Board | | Hospital since 2012, first as an | |
| | | Assistant Administrator and then, | |
| | | beginning in 2013, as the Chief | |
| | | Administrative Officer. From 2011 | |
| | | through 2012, Mr. Alexander was | |
| | | employed by Sutter Health West Bay | |
| | | Region as the Regional Director of | |
| | | Strategic Decision Support. Prior to | |
| | | that, in 2011, he served as the | |
| | | Director of Managed Care | |
| | | Contracting and also the Director of | |
| | | Compensation, Benefits, and | |
| | | Compliance for the Rehabilitation | |
| | | Institute of Chicago. | |
| HENNESSY FUNDS | 1-800-966-4354 | |
| | | | Other |
| | | | Directorships |
| | | | Held Outside |
| Name, (Year of Birth), | | | of Fund |
| and Position Held | Start Date | Principal Occupation(s) | Complex During |
with the Trust | of Service | During Past Five Years | Past Five Years(1) |
| | | | |
| Doug Franklin | March 2016 | Mr. Franklin is a retired insurance | None. |
| (1964) | | industry executive. From 1987 | |
| Adviser to the Board | | through 2015, he was employed by | |
| | | the Allianz-Fireman’s Fund Insurance | |
| | | Company in various positions, | |
| | | including as its Chief Actuary and | |
| | | Chief Risk Officer. | |
| | | | |
| Claire Knoles | December 2015 | Ms. Knoles is a founder of Kiosk and | None. |
| (1974) | | has served as its Chief Operating | |
| Adviser to the Board | | Officer since 2004. Kiosk is a full | |
| | | service marketing agency with | |
| | | offices in the San Francisco Bay | |
| | | Area, Toronto, and Liverpool, UK. | |
| | | | |
Interested Trustee(2) | | | |
| | | | |
| Neil J. Hennessy | January 1996 as | Mr. Hennessy has been employed by | Hennessy |
| (1956) | a Trustee and | Hennessy Advisors, Inc. since 1989 | Advisors, Inc. |
| Trustee, Chairman of | June 2008 as | and currently serves as its President, | |
| the Board, Chief | an Officer | Chairman and Chief Executive Officer. | |
| Investment Officer, | | | |
| Portfolio Manager, | | | |
| and President | | | |
| Name, (Year of Birth), | | |
| and Position Held | Start Date | Principal Occupation(s) |
with the Trust | of Service | During Past Five Years |
| | | |
| Officers | | |
| | | |
| Teresa M. Nilsen | January 1996 | Ms. Nilsen has been employed by Hennessy Advisors, Inc. |
| (1966) | | since 1989 and currently serves as its Executive Vice President, |
| Executive Vice President | | Chief Operations Officer, Chief Financial Officer, and Secretary. |
| and Treasurer | | |
| | | |
| Daniel B. Steadman | March 2000 | Mr. Steadman has been employed by Hennessy Advisors, Inc. |
| (1956) | | since 2000 and currently serves as its Executive Vice President |
| Executive Vice President | | and Chief Compliance Officer. |
| and Secretary | | |
| | | |
| Jennifer Cheskiewicz | June 2013 | Ms. Cheskiewicz has been employed by Hennessy Advisors, Inc. |
| (1977) | | as its General Counsel since June 2013. She previously served |
| Senior Vice President and | | as in-house counsel to Carlson Capital, L.P., an SEC-registered |
| Chief Compliance Officer | | investment advisor to several private funds, from |
| | | February 2010 to May 2013. |
| | | |
| Brian Carlson | December 2013 | Mr. Carlson has been employed by Hennessy Advisors, Inc. |
| (1972) | | since December 2013. Mr. Carlson was previously a co-founder |
| Senior Vice President and | | and principal of Trivium Consultants, LLC from February 2011 |
| Head of Distribution | | through November 2013. |
HENNESSYFUNDS.COM
| TRUSTEES AND OFFICERS OF THE FUND |
| Name, (Year of Birth), | | |
| and Position Held | Start Date | Principal Occupation(s) |
with the Trust | of Service | During Past Five Years |
| | | |
| David Ellison | October 2012 | Mr. Ellison has been employed by Hennessy Advisors, Inc. since |
(1958)(3) | | October 2012. He has served as a Portfolio Manager of the |
| Senior Vice President and | | Hennessy Small Cap Financial Fund, the Hennessy Large Cap |
| Portfolio Manager | | Financial Fund, and the Hennessy Technology Fund since |
| | | inception. Prior to that, Mr. Ellison served as Director, CIO and |
| | | President of FBR Fund Advisers, Inc. from December |
| | | 1999 to October 2012. |
| | | |
| Brian Peery | March 2003 as | Mr. Peery has been employed by Hennessy Advisors, Inc. since |
| (1969) | an Officer and | 2002. He has served as a Portfolio Manager of the Hennessy |
| Senior Vice President and | February 2011 | Cornerstone Growth Fund, the Hennessy Cornerstone Mid Cap |
| Portfolio Manager | as a Co-Portfolio | 30 Fund, the Hennessy Cornerstone Large Growth Fund, the |
| | Manager or | Hennessy Cornerstone Value Fund, the Hennessy Total Return |
| | Portfolio Manager | Fund, and the Hennessy Balanced Fund since October 2014. |
| | | He served as Co-Portfolio Manager of the same funds from |
| | | February 2011 through September 2014. Mr. Peery has also |
| | | served as a Portfolio Manager of the Hennessy Gas Utility Fund |
| | | since February 2015. |
| | | |
| Winsor (Skip) Aylesworth | October 2012 | Mr. Aylesworth has been employed by Hennessy Advisors, Inc. |
(1947)(3) | | since October 2012. He has served as a Portfolio Manager of |
| Vice President and | | the Hennessy Gas Utility Fund since 1998 and as a Portfolio |
| Portfolio Manager | | Manager of the Hennessy Technology Fund since inception. |
| | | Prior to that, Mr. Aylesworth served as Executive Vice President |
| | | of FBR Fund Advisers, Inc. from 1999 to October 2012. |
| | | |
| Ryan Kelley | March 2013 | Mr. Kelley has been employed by Hennessy Advisors, Inc. since |
(1972)(4) | | October 2012. He has served as a Portfolio Manager of the |
| Vice President and | | Hennessy Gas Utility Fund, the Hennessy Small Cap Financial |
| Portfolio Manager | | Fund, and the Hennessy Large Cap Financial Fund since |
| | | October 2014. He served as Co-Portfolio Manager of the same |
| | | funds from March 2013 through September 2014, and as a |
| | | Portfolio Analyst for the Hennessy Funds from October 2012 |
| | | through February 2013. Prior to that, Mr. Kelley served as |
| | | Portfolio Manager of FBR Fund Advisers, Inc. from |
| | | January 2008 to October 2012. |
_______________
(1) | Messrs. DeSousa, Doyle, Hennessy, and Richardson previously served on the Board of Directors of Hennessy Mutual Funds, Inc. (“HMFI”), The Hennessy Funds, Inc. (“HFI”), and Hennessy SPARX Funds Trust (“HSFT”). Pursuant to an internal reorganization effective as of February 28, 2014, the series of HFMI, HFI, and HSFT were reorganized into corresponding series of Hennessy Funds Trust that mirrored them. Subsequent to the reorganization, HFMI, HFI, and HSFT were dissolved. |
(2) | Mr. Hennessy is considered an “interested person,” as defined in the Investment Company Act of 1940, as amended, because he is an officer of the Hennessy Funds. |
(3) | The address of these officers is 101 Federal Street, Suite 1900, Boston, MA 02110. |
(4) | The address of this officer is 1340 Environ Way, Suite 305, Chapel Hill, NC 27517. |
| HENNESSY FUNDS | 1-800-966-4354 | |
Expense Example (Unaudited)
October 31, 2016
As a shareholder of the Fund, you incur two types of costs: (1) transaction costs, including sales charges (loads) on purchase payments, reinvested dividends, or other distributions; redemption fees; and exchange fees; and (2) ongoing costs, including management fees; service fees; and other Fund expenses. This Example is intended to help you understand your ongoing costs (in dollars) of investing in the Fund and to compare these costs with the ongoing costs of investing in other mutual funds. The Example is based on an investment of $1,000 invested at the beginning of the period and held for the entire period from May 1, 2016, through October 31, 2016.
Actual Expenses
The first line of the table below under the “Investor Class” and “Institutional Class” headings provides information about actual account values and actual expenses. Although the Fund charges no sales loads or transaction fees, you will be assessed fees for outgoing wire transfers, returned checks and stop payment orders at prevailing rates charged by U.S. Bancorp Fund Services, LLC, the Fund’s transfer agent. If you request that a redemption be made by wire transfer, currently a $15 fee is charged by the Fund’s transfer agent. IRA accounts will be charged a $15 annual maintenance fee. The example below includes, but is not limited to, management fees, shareholder servicing fees, fund accounting, custody, and transfer agent fees. However, the example below does not include portfolio trading commissions and related expenses, and other extraordinary expenses as determined under generally accepted accounting principles. You may use the information in this line, together with the amount you invested, to estimate the expenses that you paid over the period. Simply divide your account value by $1,000 (for example, an $8,600 account value divided by $1,000 = 8.6), then multiply the result by the number in the first line of the table under the “Investor Class” and “Institutional Class” headings in the column entitled “Expenses Paid During Period” to estimate the expenses you paid on your account during this period.
Hypothetical Example for Comparison Purposes
The second line of the table below under the “Investor Class” and “Institutional Class” headings provides information about hypothetical account values and hypothetical expenses based on the Fund’s actual expense ratios and an assumed rate of return of 5% per year before expenses, which is not the Fund’s actual return. The hypothetical account values and expenses may not be used to estimate the actual ending account balance or expenses you paid for the period. You may use this information to compare the ongoing costs of investing in the Fund and other funds. To do so, compare this 5% hypothetical example with the 5% hypothetical examples that appear in the shareholder reports of the other funds. Please note that the expenses shown in the table are meant to highlight your ongoing costs only and do not reflect any transactional costs, such as sales charges (loads), or exchange fees. Therefore, the second line of the table under the “Investor Class” and “Institutional Class” headings is useful in comparing ongoing costs only, and will not help you determine the relative total costs of owning different funds. In addition, if these transactional costs were included, your costs would have been higher.
HENNESSYFUNDS.COM
| | | | Expenses Paid |
| | Beginning | Ending | During Period(1) |
| | Account Value | Account Value | May 1, 2016 – |
| | May 1, 2016 | October 31, 2016 | October 31, 2016 |
| Investor Class | | | |
| Actual | $1,000.00 | $1,026.10 | $6.93 |
| Hypothetical (5% return before expenses) | $1,000.00 | $1,018.30 | $6.90 |
| | | | |
| Institutional Class | | | |
| Actual | $1,000.00 | $1,026.70 | $6.57 |
| Hypothetical (5% return before expenses) | $1,000.00 | $1,018.65 | $6.55 |
(1) | Expenses are equal to the Fund’s annualized expense ratio of 1.36% for Investor Class shares or 1.29% for Institutional Class shares, as applicable, multiplied by the average account value over the period, multiplied by 184/366 days (to reflect one-half year period). |
| HENNESSY FUNDS | 1-800-966-4354 | |
How to Obtain a Copy of the Fund’s
Proxy Voting Policy and Proxy Voting Records
A description of the policies and procedures the Fund uses to determine how to vote proxies relating to portfolio securities is available without charge: (1) by calling 1-800-966-4354; (2) on the Hennessy Funds’ website at hennessyfunds.com/proxy-voting/policy.fs; or (3) on the U.S. Securities and Exchange Commission’s website at www.sec.gov. The Fund’s proxy voting record is available without charge on both the Hennessy Funds’ website at hennessyfunds.com/proxy-voting/vote.fs and the SEC’s website at www.sec.gov no later than August 31 for the prior 12 months ending June 30.
Quarterly Filings on Form N-Q
The Fund files its complete schedule of portfolio holdings with the SEC for the first and third quarters of each fiscal year on Form N-Q. The Fund’s Form N-Q will be available on the SEC’s website at www.sec.gov. The Fund’s Form N-Q may be reviewed and copied at the SEC’s Public Reference Room in Washington, DC and information on the operation of the Public Reference Room may be obtained by calling 1-800-SEC-0330. Information included in the Fund’s N-Q will also be available upon request by calling 1-800-966-4354.
Federal Tax Distribution Information
(Unaudited)
For the fiscal year ended October 31, 2016, certain dividends paid by the Fund may be subject to a maximum tax rate of 23.8%, as provided for by the Jobs and Growth Tax Relief Reconciliation Act of 2003. The percentage of dividends declared from ordinary income designated as qualified dividend income was 100%.
For corporate shareholders, the percent of ordinary income distributions that qualified for the corporate dividends received deduction for the fiscal year ended October 31, 2016, was 100%.
The percentage of taxable ordinary income distributions that are designated as short-term capital gain distributions under Section 871(k)(2)(C) of the Internal Revenue Code of 1986, as amended, for the Fund was 37.07%.
Householding
To help keep the Fund’s costs as low as possible, we generally deliver a single copy of most financial reports and prospectuses to shareholders who share an address, even if the accounts are registered under different names. This process, known as “householding,” does not apply to account statements. You may, of course, request an individual copy of a prospectus or financial report at any time. If you would like to receive separate mailings, please call the Administrator at 1-800-261-6950 or 1-414-765-4124 and we will begin individual delivery within 30 days of your request. If your account is held through a financial institution or other intermediary, please contact them directly to request individual delivery.
HENNESSYFUNDS.COM
| PROXY VOTING — PRIVACY POLICY |
Privacy Policy
We collect the following non-public personal information about you:
| | • | information we receive from you on or in applications or other forms, correspondence, or conversations, including, but not limited to, your name, address, phone number, social security number, assets, income, and date of birth; and |
| | • | information about your transactions with us, our affiliates, or others, including, but not limited to, your account number and balance, payment history, parties to transactions, cost basis information, and other financial information. |
We do not disclose any non-public personal information about our current or former shareholders to non-affiliated third parties, except as permitted by law. For example, we are permitted by law to disclose all of the information we collect, as described above, to our Transfer Agent to process your transactions. Furthermore, we restrict access to your non-public personal information to those persons who require such information to provide products or services to you. We maintain physical, electronic, and procedural safeguards that comply with federal standards to guard your non-public personal information.
In the event that you hold shares of the Fund through a financial intermediary, including, but not limited to, a broker-dealer, bank or trust company, the privacy policy of your financial intermediary would govern how your non-public personal information would be shared with non-affiliated third parties.
| HENNESSY FUNDS | 1-800-966-4354 | |
(This Page Intentionally Left Blank.)
For information, questions or assistance, please call
The Hennessy Funds
1-800-966-4354 or 1-415-899-1555
INVESTMENT ADVISOR
Hennessy Advisors, Inc.
7250 Redwood Blvd., Suite 200
Novato, California 94945
ADMINISTRATOR,
TRANSFER AGENT,
DIVIDEND PAYING AGENT &
SHAREHOLDER SERVICING AGENT
U.S. Bancorp Fund Services, LLC
P.O. Box 701
Milwaukee, Wisconsin 53201-0701
CUSTODIAN
U.S. Bank N.A.
Custody Operations
1555 North River Center Dr., Suite 302
Milwaukee, Wisconsin 53212
TRUSTEES
Neil J. Hennessy
Robert T. Doyle
J. Dennis DeSousa
Gerald P. Richardson
COUNSEL
Foley & Lardner LLP
777 East Wisconsin Avenue
Milwaukee, Wisconsin 53202-5306
INDEPENDENT REGISTERED
PUBLIC ACCOUNTING FIRM
KPMG LLP
200 East Randolph Street
Chicago, Illinois 60601
DISTRIBUTOR
Quasar Distributors, LLC
615 East Michigan Street
Milwaukee, Wisconsin 53202
hennessyfunds.com | 1-800-966-4354
This report has been prepared for shareholders and may be distributed to
others only if preceded or accompanied by a current prospectus.
ANNUAL REPORT
OCTOBER 31, 2016
HENNESSY TOTAL RETURN FUND
Investor Class HDOGX
hennessyfunds.com | 1-800-966-4354
(This Page Intentionally Left Blank.)
Contents
| Letter to Shareholders | | | 2 |
| Performance Overview | | | 4 |
| Financial Statements | | | |
| Schedule of Investments | | | 7 |
| Statement of Assets and Liabilities | | | 11 |
| Statement of Operations | | | 12 |
| Statements of Changes in Net Assets | | | 13 |
| Statement of Cash Flows | | | 14 |
| Financial Highlights | | | 16 |
| Notes to the Financial Statements | | | 18 |
| Report of Independent Registered Public Accounting Firm | | | 26 |
| Trustees and Officers of the Fund | | | 27 |
| Expense Example | | | 30 |
| Proxy Voting | | | 32 |
| Quarterly Filings on Form N-Q | | | 32 |
| Federal Tax Distribution Information | | | 32 |
| Householding | | | 32 |
| Privacy Policy | | | 33 |
| HENNESSY FUNDS | 1-800-966-4354 | |
December 2016
Dear Hennessy Funds Shareholder:
Over the past year investors here in the U.S. and around the world have weathered a great deal of turmoil, especially in the political arena. Foremost, the bitterly divisive and all-consuming U.S. Presidential election, with its unanticipated outcome, is finally behind us. While the equity markets were jittery at first, they now appear more comfortable with the prospect of a Trump presidency and seem to be looking forward to diminished government regulation and intervention.
The Brexit vote in the U.K. cast a shadow over the European Union’s future. There remains uncertainty over the details and timing of the break and the economic consequences for both Britain and Europe, but early signs suggest the impact on growth in Britain will not be as severe as initially feared.
Additionally, uncertainty over whether the Federal Reserve would raise short-term interest rates has hung over the economy for well over a year now. The effects that higher rates could have on growth, the strength of the U.S. Dollar, corporate profits and loan supply and demand seem to have weighed heavily on investors, causing paralysis and money to remain on the sidelines of the market.
Despite all these concerns, U.S. equity markets have pushed higher, with both the Dow Jones Industrial Average and S&P 500 Index posting returns of approximately 5% during the twelve-month period ended October 31, 2016. The U.S. economy has continued to grow at a respectable annual rate of about 2%, and corporate profits have started to move higher. Today, as of mid-December, bond and Treasury yields have risen a bit from record lows just this summer, and the bond market is finishing the year on slightly rocky footing. Bond yields are still very low relative to historical averages, while the prospective PE multiples for the Dow Jones Industrial Average and S&P 500 Index are just above long-term averages at 18.0x and 18.9x, respectively. We believe that equity valuations could go considerably higher and still be at appropriate levels relative to bond yields. And, while we do expect the Fed to raise interest rates in the coming year, we believe that inflation will stay under control, so that short-term interest rates will not have to rise too fast or too far.
As I reflect over the past twelve months, what I realize is that many of the worries this year are not new. For the past several years, American businesses have operated in an environment characterized by highly partisan politics, mounting regulations, uncertainty over interest rates, and a lack of clarity regarding taxes and healthcare costs. Despite all these headwinds, U.S. corporations have been incredibly resilient and found ways to impress investors. If the newly elected administration follows through on campaign promises of reigning in regulation, lowering taxes for corporations and individuals, or reforming healthcare to drive down costs, then companies, which are already lean, should be able to post higher profits. And, that growth should lead to more jobs and a stronger economy, potentially creating a very positive cycle going forward.
With the bull market in U.S. equities entering its ninth year, many believe the economy is due for a recession and the market is due for a downturn. But, the euphoria that usually accompanies a peak in the market is absent. Since the recovery began after the financial crisis, I have found myself pondering the bull run of 1982 to 2000, powered, in part, by a significant increase in valuations. I believe today’s market displays the fundamentals to sustain a similarly strong and lengthy bull market. Meanwhile, companies are largely profitable and many corporate balance sheets are cash-rich, with
HENNESSYFUNDS.COM
relatively little debt. Unemployment is low and real wages are rising, helping to drive consumption. We are hopeful that these factors will provide support for positive market returns in the year to come.
Thank you for your continued confidence and investment in our funds. If you have any questions or would like to speak with us directly, please don’t hesitate to call us at (800) 966-4354.
Best regards,
Neil J. Hennessy
President and Chief Investment Officer
Past performance does not guarantee future results.
Mutual fund investing involves risk. Principal loss is possible.
Opinions expressed are those of Neil Hennessy and are subject to change, are not guaranteed and should not be considered investment advice.
The Dow Jones Industrial Average and S&P 500 Index are unmanaged indices commonly used to measure the performance of U.S. stocks. One cannot invest directly in an index.
PE, or price to earnings, is calculated by dividing a company’s market price per share by its earnings per share.
| HENNESSY FUNDS | 1-800-966-4354 | |
Performance Overview (Unaudited)
CHANGE IN VALUE OF $10,000 INVESTMENT
This graph illustrates the performance of an initial investment of $10,000 made in the Fund ten years ago and assumes the reinvestment of dividends.
AVERAGE ANNUAL TOTAL RETURN FOR PERIODS ENDED OCTOBER 31, 2016
| | One | Five | Ten |
| | Year | Years | Years |
| Hennessy Total | | | |
| Return Fund (HDOGX) | 8.20% | 8.68% | 4.36% |
| 75/25 Blended DJIA/Treasury Index* | 4.26% | 8.65% | 5.59% |
| Dow Jones Industrial Average | 5.49% | 11.50% | 6.93% |
Expense ratio: 1.28%
Performance data quoted represents past performance; past performance does not guarantee future results. The investment return and principal value of an investment will fluctuate so that an investor’s shares, when redeemed, may be worth more or less than their original cost. The performance graph and table do not reflect the deduction of taxes that a shareholder would pay on Fund distributions or the redemption of Fund shares. Current performance of the Fund may be lower or higher than the performance quoted. Performance data current to the most recent month end may be obtained by visiting hennessyfunds.com.
The expense ratio presented is from the most recent prospectus.
| * | The 75/25 Blended DJIA/Treasury Index consists of 75% common stocks represented by the Dow Jones Industrial Average and 25% short-duration Treasury securities represented by the BofA Merrill Lynch 90-day U.S. Treasury Bill Index. |
PERFORMANCE NARRATIVE
Portfolio Managers Neil J. Hennessy and Brian E. Peery
Performance:
For the twelve-month period ended October 31, 2016, the Hennessy Total Return Fund returned 8.20%, outperforming both the 75/25 Blended DJIA/Treasury Index* and the Dow Jones Industrial Average, which returned 4.26% and 5.49% for the same period, respectively.
The Fund outperformed its primary benchmark, the 75/25 Blended DJIA/Treasury Index,* as a result of both sector allocation and stock selection. Two of the largest
HENNESSYFUNDS.COM
contributors to the Fund’s relative outperformance were The Boeing Company and Caterpillar, Inc. Pfizer, Inc. was the largest detractor from overall performance. From a sector perspective, an overweight position in the Energy sector as oil prices rebounded, and an underweight position in the Financials sector, aided performance. The Fund continues to hold Boeing, Caterpillar and Pfizer. Good returns from the equity investments in the portfolio more than offset a negative relative contribution from the Government Securities portion of the portfolio.
Portfolio Strategy:
The Fund invests approximately 75% of its assets in the “Dogs of the Dow,” the 10 highest dividend-yielding Dow stocks, and 25% of its assets in U.S. Treasuries. As a result of this “blended” strategy, the Fund may be expected to underperform equities in periods when markets rise and outperform in periods when markets fall. The Fund is designed to allow investors to gain exposure to the equity market while maintaining a percentage of their investment in fixed income securities. We believe the Fund is well positioned for the more conservative investor, as the equity portion of the portfolio is invested in what we would deem to be high-quality companies, each with a historically high dividend yield. The relatively short duration of the 25% weighting of U.S. Treasuries in the portfolio (all less than one year) may allow us the ability to roll into higher-yielding Treasuries in the event yields rise.
Market Outlook:
Over the twelve-month period ended October 31, 2016, U.S. equities produced moderate, positive returns. The period was once again marked by a great deal of volatility, with major market indices dropping more than 10% at one point early in the year before recovering all of their losses. Throughout this period, there have been concerns about interest rates, commodity prices, economic growth (both domestic and international) and the U.S. Presidential election. Many, if not all, of these concerns still exist in the marketplace today, but we have reasons to be hopeful for the year to come.
First, while corporate profits have been on a gentle slide downwards since the fourth quarter of 2014, market analysts are now forecasting a return to growth in profits in the fourth quarter of this year. We believe these forecasts have a good chance of being proved correct. Second, mergers and acquisitions have been strong and steady this year, and we believe such activity will continue next year, helping drive revenue and earnings for the acquiring companies. Third, we do not believe the majority of stocks are expensive at this point, though many are probably fairly valued. The Dow Jones Industrial Average and the S&P 500 Index have forward PE ratios of roughly 18x and 19x, respectively, close to long-term averages, although slightly higher than six months ago. Corporate balance sheets appear to be in excellent shape, and while executives have shown some reluctance to increase capital spending beyond maintenance levels this cycle, we believe companies outside of the Energy sector will eventually start investing for expansion. Overall, we believe the basic fundamentals of the market are attractive, and we continue to be optimistic about the possibility of further moderate market advances over the course of next year.
We believe the balance between risk and reward afforded by the Fund’s stock selection and asset allocation policies provides conservative investors with a compelling way to participate in the market longer term while maintaining a lower risk profile.
_______________
| * | The 75/25 Blended DJIA/Treasury Index consists of 75% common stocks represented by the Dow Jones Industrial Average and 25% short-duration Treasury securities represented by the BofA Merrill Lynch 90-day U.S. Treasury Bill Index. |
| HENNESSY FUNDS | 1-800-966-4354 | |
Opinions expressed are those of the Portfolio Managers as of the date written and are subject to change, are not guaranteed, and should not be considered investment advice or an indication of trading intent.
The S&P 500 Index and Dow Jones Industrial Average are unmanaged indices commonly used to measure the performance of U.S. stocks. The BofA Merrill Lynch 90-day U.S. Treasury Bill Index is an unmanaged index of Treasury securities maturing in 90 days. One cannot invest directly in an index.
The Fund is non-diversified, meaning it may concentrate its assets in fewer individual holdings than a diversified fund, making it more exposed to individual stock volatility than a diversified fund. The Fund’s formula-based strategy may cause the Fund to buy or sell securities at times when it may not be advantageous. Please see the Fund’s prospectus for a more complete discussion of these and other risks.
References to specific securities should not be considered a recommendation to buy or sell any security. Fund holdings and sector allocations are subject to change. Please refer to the Schedule of Investments included in this report for additional portfolio information.
Dividend yield is calculated as the annual dividends paid by a company divided by its market price per share. PE, or price to earnings, is calculated by dividing a company’s market price per share by its earnings per share.
HENNESSYFUNDS.COM
| PERFORMANCE OVERVIEW/SCHEDULE OF INVESTMENTS |
Financial Statements
Schedule of Investments as of October 31, 2016 |
HENNESSY TOTAL RETURN FUND
(% of Net Assets)
| TOP TEN HOLDINGS | % NET ASSETS |
| | |
| U.S. Treasury Bill, 0.240%, 11/25/2016 | 25.03% |
| | |
| U.S. Treasury Bill, 0.360%, 01/12/2017 | 25.02% |
| | |
| U.S. Treasury Bill, 0.305%, 12/22/2016 | 21.46% |
| | |
| Cisco Systems, Inc. | 7.04% |
| | |
| Chevron Corp. | 6.90% |
| | |
| Caterpillar, Inc. | 6.71% |
| | |
| International Business Machines Corp. | 6.59% |
| | |
| Exxon Mobil Corp. | 6.49% |
| | |
| Pfizer, Inc. | 6.48% |
| | |
| Verizon Communications, Inc. | 6.32% |
Note: For presentation purposes, the Fund has grouped some of the industry categories. For purposes of categorizing securities for compliance with Section 8(b)(1) of the Investment Company Act of 1940, as amended, the Fund uses more specific industry classifications.
| HENNESSY FUNDS | 1-800-966-4354 | |
| | COMMON STOCKS – 67.55% | | Number | | | | | | % of | |
| | | | of Shares | | | Value | | | Net Assets | |
| | Consumer Discretionary – 3.19% | | | | | | | | | |
| | McDonald’s Corp. | | | 23,800 | | | $ | 2,679,166 | | | | 3.19 | % |
| | | | | | | | | | | | | | |
| | Consumer Staples – 6.82% | | | | | | | | | | | | |
| | Procter & Gamble Co. | | | 23,000 | | | | 1,996,400 | | | | 2.38 | % |
| | The Coca-Cola Co. | | | 67,500 | | | | 2,862,000 | | | | 3.41 | % |
| | Wal-Mart Stores, Inc. | | | 12,300 | | | | 861,246 | | | | 1.03 | % |
| | | | | | | | | 5,719,646 | | | | 6.82 | % |
| | | | | | | | | | | | | | |
| | Energy – 13.39% | | | | | | | | | | | | |
| | Chevron Corp. | | | 55,300 | | | | 5,792,675 | | | | 6.90 | % |
| | Exxon Mobil Corp. | | | 65,300 | | | | 5,440,796 | | | | 6.49 | % |
| | | | | | | | | 11,233,471 | | | | 13.39 | % |
| | | | | | | | | | | | | | |
| | Health Care – 9.60% | | | | | | | | | | | | |
| | Merck & Co., Inc. | | | 44,600 | | | | 2,618,912 | | | | 3.12 | % |
| | Pfizer, Inc. | | | 171,200 | | | | 5,428,752 | | | | 6.48 | % |
| | | | | | | | | 8,047,664 | | | | 9.60 | % |
| | | | | | | | | | | | | | |
| | Industrials – 13.20% | | | | | | | | | | | | |
| | Caterpillar, Inc. | | | 67,400 | | | | 5,625,204 | | | | 6.71 | % |
| | General Electric Co. | | | 57,800 | | | | 1,681,980 | | | | 2.01 | % |
| | The Boeing Co. | | | 26,400 | | | | 3,760,152 | | | | 4.48 | % |
| | | | | | | | | 11,067,336 | | | | 13.20 | % |
| | | | | | | | | | | | | | |
| | Information Technology – 15.03% | | | | | | | | | | | | |
| | Cisco Systems, Inc. | | | 192,400 | | | | 5,902,832 | | | | 7.04 | % |
| | Intel Corp. | | | 33,600 | | | | 1,171,632 | | | | 1.40 | % |
| | International Business Machines Corp. | | | 36,000 | | | | 5,532,840 | | | | 6.59 | % |
| | | | | | | | | 12,607,304 | | | | 15.03 | % |
| | | | | | | | | | | | | | |
| | Telecommunication Services – 6.32% | | | | | | | | | | | | |
| | Verizon Communications, Inc. | | | 110,200 | | | | 5,300,620 | | | | 6.32 | % |
| | | | | | | | | | | | | | |
| | Total Common Stocks | | | | | | | | | | | | |
| | (Cost $51,960,615) | | | | | | | 56,655,207 | | | | 67.55 | % |
The accompanying notes are an integral part of these financial statements.
HENNESSYFUNDS.COM
| | SHORT-TERM INVESTMENTS – 72.41% | | Number of Shares/ | | | | | | % of | |
| | | | Par Amount | | | Value | | | Net Assets | |
| | Money Market Funds – 0.90% | | | | | | | | | |
| | Fidelity Government Portfolio, Institutional Class, 0.27% (a) | | | 750,819 | | | $ | 750,819 | | | | 0.90 | % |
| | | | | | | | | | | | | | |
| | U.S. Treasury Bills (c) – 71.51% | | | | | | | | | | | | |
| | 0.240%, 11/25/2016 (b) | | | 21,000,000 | | | | 20,996,395 | | | | 25.03 | % |
| | 0.305%, 12/22/2016 (b) | | | 18,000,000 | | | | 17,995,665 | | | | 21.46 | % |
| | 0.360%, 01/12/2017 (b) | | | 21,000,000 | | | | 20,989,122 | | | | 25.02 | % |
| | | | | | | | | | | | | | |
| | | | | | | | | 59,981,182 | | | | 71.51 | % |
| | | | | | | | | | | | | | |
| | Total Short-Term Investments | | | | | | | | | | | | |
| | (Cost $60,731,119) | | | | | | | 60,732,001 | | | | 72.41 | % |
| | | | | | | | | | | | | | |
| | Total Investments | | | | | | | | | | | | |
| | (Cost $112,691,734) – 139.96% | | | | | | | 117,387,208 | | | | 139.96 | % |
| | Liabilities in Excess | | | | | | | | | | | | |
| | of Other Assets – (39.96)% | | | | | | | (33,517,235 | ) | | | (39.96 | )% |
| | | | | | | | | | | | | | |
| | TOTAL NET ASSETS – 100.00% | | | | | | $ | 83,869,973 | | | | 100.00 | % |
Percentages are stated as a percent of net assets.
| (a) | The rate listed is the fund’s 7-day yield as of October 31, 2016. |
| (b) | The rate listed is discount rate at issue. |
| (c) | Collateral or partial collateral for securities sold subject to repurchase. |
The accompanying notes are an integral part of these financial statements.
| HENNESSY FUNDS | 1-800-966-4354 | |
Summary of Fair Value Exposure at October 31, 2016
The following is a summary of the inputs used to value the Fund’s net assets as of October 31, 2016 (see Note 3 in the accompanying notes to the financial statements):
| Common Stocks | | Level 1 | | | Level 2 | | | Level 3 | | | Total | |
| Consumer Discretionary | | $ | 2,679,166 | | | $ | — | | | $ | — | | | $ | 2,679,166 | |
| Consumer Staples | | | 5,719,646 | | | | — | | | | — | | | | 5,719,646 | |
| Energy | | | 11,233,471 | | | | — | | | | — | | | | 11,233,471 | |
| Health Care | | | 8,047,664 | | | | — | | | | — | | | | 8,047,664 | |
| Industrials | | | 11,067,336 | | | | — | | | | — | | | | 11,067,336 | |
| Information Technology | | | 12,607,304 | | | | — | | | | — | | | | 12,607,304 | |
| Telecommunication Services | | | 5,300,620 | | | | — | | | | — | | | | 5,300,620 | |
| Total Common Stocks | | $ | 56,655,207 | | | $ | — | | | $ | — | | | $ | 56,655,207 | |
| Short-Term Investments | | | | | | | | | | | | | | | | |
| Money Market Funds | | $ | 750,819 | | | $ | — | | | $ | — | | | $ | 750,819 | |
| U.S. Treasury Bills | | | — | | | | 59,981,182 | | | | — | | | | 59,981,182 | |
| Total Short-Term Investments | | $ | 750,819 | | | $ | 59,981,182 | | | $ | — | | | $ | 60,732,001 | |
| Total Investments | | $ | 57,406,026 | | | $ | 59,981,182 | | | $ | — | | | $ | 117,387,208 | |
Transfers between levels are recognized at the end of the reporting period. During the year ended October 31, 2016, the Fund recognized no transfers between levels.
Schedule of Reverse Repurchase Agreements
| | | | | | | Principal | Maturity | | Maturity | |
| Face Value | | Counterparty | | Rate | | Trade Date | Date | | Amount | |
| $ | 12,593,000 | | Jefferies LLC | | | 0.75% | | 8/19/16 | 11/25/16 | | $ | 12,618,711 | |
| | 10,794,000 | | Jefferies LLC | | | 0.75% | | 9/23/16 | 12/22/16 | | | 10,814,239 | |
| | 12,593,000 | | Jefferies LLC | | | 0.75% | | 10/21/16 | 1/12/17 | | | 12,614,775 | |
| $ | 35,980,000 | | | | | | | | | | $ | 36,047,725 | |
As of October 31, 2016, the fair value of securities held as collateral for reverse repurchase agreements was $59,981,182 as noted on the Schedule of Investments.
The accompanying notes are an integral part of these financial statements.
HENNESSYFUNDS.COM
| SCHEDULE OF INVESTMENTS/STATEMENT OF ASSETS AND LIABILITIES |
Financial Statements
Statement of Assets and Liabilities as of October 31, 2016 |
| ASSETS: | | | |
| Investments in securities, at value (cost $112,691,734) | | $ | 117,387,208 | |
| Dividends and interest receivable | | | 156,847 | |
| Receivable for fund shares sold | | | 51,509 | |
| Receivable for securities sold | | | 2,553,727 | |
| Prepaid expenses and other assets | | | 10,227 | |
| Total Assets | | | 120,159,518 | |
| | | | | |
| LIABILITIES: | | | | |
| Payable for fund shares redeemed | | | 82,339 | |
| Payable to advisor | | | 45,072 | |
| Payable to administrator | | | 15,016 | |
| Payable to auditor | | | 22,381 | |
| Accrued distribution fees | | | 64,686 | |
| Accrued service fees | | | 7,512 | |
| Reverse repurchase agreements | | | 35,980,000 | |
| Accrued interest payable | | | 30,537 | |
| Accrued trustees fees | | | 3,898 | |
| Accrued expenses and other payables | | | 38,104 | |
| Total Liabilities | | | 36,289,545 | |
| NET ASSETS | | $ | 83,869,973 | |
| | | | | |
| NET ASSETS CONSIST OF: | | | | |
| Capital stock | | $ | 74,751,785 | |
| Accumulated net investment income | | | 96,662 | |
| Accumulated net realized gain on investments | | | 4,326,052 | |
| Unrealized net appreciation on investments | | | 4,695,474 | |
| Total Net Assets | | $ | 83,869,973 | |
| | | | | |
| NET ASSETS | | | | |
| Investor Class: | | | | |
| Shares authorized (no par value) | | Unlimited | |
| Net assets applicable to outstanding Investor Class shares | | $ | 83,869,973 | |
| Shares issued and outstanding | | | 6,061,249 | |
| Net asset value, offering price and redemption price per share | | $ | 13.84 | |
The accompanying notes are an integral part of these financial statements.
| HENNESSY FUNDS | 1-800-966-4354 | |
Financial Statements
Statement of Operations for the year ended October 31, 2016 |
| INVESTMENT INCOME: | | | |
| Dividend income | | $ | 1,887,300 | |
| Interest income | | | 113,258 | |
| Total investment income | | | 2,000,558 | |
| | | | | |
| EXPENSES: | | | | |
| Investment advisory fees (See Note 5) | | | 452,740 | |
| Interest expense (See Notes 7 and 9) | | | 206,647 | |
| Distribution fees – Investor Class (See Note 5) | | | 113,185 | |
| Service fees – Investor Class (See Note 5) | | | 75,457 | |
| Administration, fund accounting, custody and transfer agent fees (See Note 5) | | | 73,531 | |
| Sub-transfer agent expenses – Investor Class (See Note 5) | | | 59,736 | |
| Compliance expense (See Note 5) | | | 23,710 | |
| Audit fees | | | 23,042 | |
| Federal and state registration fees | | | 17,620 | |
| Trustees’ fees and expenses | | | 15,999 | |
| Reports to shareholders | | | 13,562 | |
| Legal fees | | | 252 | |
| Other expenses | | | 7,858 | |
| Total expenses | | | 1,083,339 | |
| NET INVESTMENT INCOME | | $ | 917,219 | |
| | | | | |
| REALIZED AND UNREALIZED GAINS (LOSSES): | | | | |
| Net realized gain on investments | | $ | 4,429,880 | |
| Net change in unrealized appreciation on investments | | | (36,877 | ) |
| Net gain on investments | | | 4,393,003 | |
| NET INCREASE IN NET ASSETS RESULTING FROM OPERATIONS | | $ | 5,310,222 | |
The accompanying notes are an integral part of these financial statements.
HENNESSYFUNDS.COM
| STATEMENT OF OPERATIONS/STATEMENTS OF CHANGES IN NET ASSETS |
Financial Statements
| Statements of Changes in Net Assets |
| | | Year Ended | | | Year Ended | |
| | | October 31, 2016 | | | October 31, 2015 | |
| OPERATIONS: | | | | | | |
| Net investment income | | $ | 917,219 | | | $ | 1,074,164 | |
| Net realized gain on investments | | | 4,429,880 | | | | 5,969,412 | |
| Net change in unrealized appreciation on investments | | | (36,877 | ) | | | (6,270,901 | ) |
| Net increase in net assets resulting from operations | | | 5,310,222 | | | | 772,675 | |
| | | | | | | | | |
| DISTRIBUTIONS TO SHAREHOLDERS FROM: | | | | | | | | |
| Net investment income – Investor Class | | | (921,292 | ) | | | (1,084,818 | ) |
| Net realized gains – Investor Class | | | (5,932,910 | ) | | | (5,767,007 | ) |
| Total distributions | | | (6,854,202 | ) | | | (6,851,825 | ) |
| | | | | | | | | |
| CAPITAL SHARE TRANSACTIONS: | | | | | | | | |
| Proceeds from shares subscribed – Investor Class | | | 25,999,315 | | | | 2,980,355 | |
| Dividends reinvested – Investor Class | | | 6,430,792 | | | | 6,420,583 | |
| Cost of shares redeemed – Investor Class | | | (16,432,231 | ) | | | (17,800,502 | ) |
| Net increase (decrease) in net assets derived | | | | | | | | |
| from capital share transactions | | | 15,997,876 | | | | (8,399,564 | ) |
| TOTAL INCREASE (DECREASE) IN NET ASSETS | | | 14,453,896 | | | | (14,478,714 | ) |
| | | | | | | | | |
| NET ASSETS: | | | | | | | | |
| Beginning of year | | | 69,416,077 | | | | 83,894,791 | |
| End of year | | $ | 83,869,973 | | | $ | 69,416,077 | |
| Undistributed net investment income, end of year | | $ | 96,662 | | | $ | 100,735 | |
| | | | | | | | | |
| CHANGES IN SHARES OUTSTANDING: | | | | | | | | |
| Shares sold – Investor Class | | | 1,870,317 | | | | 203,884 | |
| Shares issued to holders as reinvestment | | | | | | | | |
| of dividends – Investor Class | | | 498,039 | | | | 448,889 | |
| Shares redeemed – Investor Class | | | (1,198,857 | ) | | | (1,254,599 | ) |
| Net increase (decrease) in shares outstanding | | | 1,169,499 | | | | (601,826 | ) |
The accompanying notes are an integral part of these financial statements.
| HENNESSY FUNDS | 1-800-966-4354 | |
Financial Statements
Statement of Cash Flows for the year ended October 31, 2016 |
| Cash flows from operating activities: | | | |
| Net increase in net assets from operations | | $ | 5,310,222 | |
| Adjustments to reconcile net increase in net assets from | | | | |
| operations to net cash provided by operating activities: | | | | |
| Payments to purchase securities | | | (26,886,584 | ) |
| Proceeds from sale of securities | | | 23,136,722 | |
| (Purchase) sale of short term investments, net | | | (11,766,484 | ) |
| Realized gain on investments in securities | | | (4,429,880 | ) |
| Net accretion of discount on securities | | | (105,371 | ) |
| Change in unrealized appreciation on investments in securities | | | 36,877 | |
| (Increases) decreases in operating assets: | | | | |
| Decrease in dividends and interest receivable | | | 3,186 | |
| Increase in receivable for securities sold | | | (2,553,727 | ) |
| Increase in prepaid expenses and other assets | | | (788 | ) |
| Increases (decreases) in operating liabilities: | | | | |
| Increase in payable to advisor | | | 10,190 | |
| Increase in payable to administrator | | | 3,593 | |
| Increase in accrued distribution fees | | | 380 | |
| Increase in accrued service fees | | | 1,698 | |
| Increase in accrued interest payable | | | 19,108 | |
| Increase in accrued audit fees | | | 781 | |
| Increase in accrued trustee fees | | | 2,238 | |
| Decrease in other accrued expenses and payables | | | (5,196 | ) |
| Net cash used in operating activities | | | (17,223,035 | ) |
| | | | | |
| Cash flows from financing activities: | | | | |
| Increase in reverse repurchase agreements | | | 8,095,500 | |
| Proceeds from shares sold | | | 25,948,535 | |
| Payment on shares redeemed | | | (16,397,590 | ) |
| Distributions paid in cash, net of reinvestments | | | (423,410 | ) |
| Net cash provided by financing activities | | | 17,223,035 | |
| Net increase in cash | | | — | |
| | | | | |
| Cash: | | | | |
| Beginning balance | | | — | |
| Ending balance | | $ | — | |
| | | | | |
| Supplemental information: | | | | |
| Non-cash financing activities not included herein consists | | | | |
| of dividend reinvestment of dividends and distributions | | $ | 6,430,792 | |
| Proceeds from securities litigation | | | 8,739 | |
| | | | | |
| Cash paid for interest | | $ | 187,539 | |
The accompanying notes are an integral part of these financial statements.
HENNESSYFUNDS.COM
(This Page Intentionally Left Blank.)
| HENNESSY FUNDS | 1-800-966-4354 | |
Financial Statements
For an Investor Class share outstanding throughout each year
PER SHARE DATA:
Net asset value, beginning of year
Income from investment operations:
Net investment income
Net realized and unrealized gains (losses) on investments
Total from investment operations
Less distributions:
Dividends from net investment income
Dividends from net realized gains
Total distributions
Net asset value, end of year
TOTAL RETURN
SUPPLEMENTAL DATA AND RATIOS:
Net assets, end of year (millions)
Ratio of expenses to average net assets
Ratio of net investment income to average net assets
Portfolio turnover rate
The accompanying notes are an integral part of these financial statements.
HENNESSYFUNDS.COM
| FINANCIAL HIGHLIGHTS — INVESTOR CLASS |
| Year Ended October 31, | |
| 2016 | | | 2015 | | | 2014 | | | 2013 | | | 2012 | |
| | | | | | | | | | | | | | |
| $ | 14.19 | | | $ | 15.27 | | | $ | 14.30 | | | $ | 12.64 | | | $ | 11.47 | |
| | | | | | | | | | | | | | | | | | | |
| | | | | | | | | | | | | | | | | | | |
| | 0.16 | | | | 0.20 | | | | 0.20 | | | | 0.16 | | | | 0.18 | |
| | 0.88 | | | | (0.02 | ) | | | 0.96 | | | | 1.66 | | | | 1.17 | |
| | 1.04 | | | | 0.18 | | | | 1.16 | | | | 1.82 | | | | 1.35 | |
| | | | | | | | | | | | | | | | | | | |
| | | | | | | | | | | | | | | | | | | |
| | (0.16 | ) | | | (0.20 | ) | | | (0.19 | ) | | | (0.16 | ) | | | (0.18 | ) |
| | (1.23 | ) | | | (1.06 | ) | | | — | | | | — | | | | — | |
| | (1.39 | ) | | | (1.26 | ) | | | (0.19 | ) | | | (0.16 | ) | | | (0.18 | ) |
| $ | 13.84 | | | $ | 14.19 | | | $ | 15.27 | | | $ | 14.30 | | | $ | 12.64 | |
| | | | | | | | | | | | | | | | | | | |
| | 8.20 | % | | | 1.22 | % | | | 8.15 | % | | | 14.49 | % | | | 11.78 | % |
| | | | | | | | | | | | | | | | | | | |
| | | | | | | | | | | | | | | | | | | |
| $ | 83.87 | | | $ | 69.42 | | | $ | 83.89 | | | $ | 90.24 | | | $ | 77.67 | |
| | 1.44 | % | | | 1.28 | % | | | 1.34 | % | | | 1.37 | % | | | 1.37 | % |
| | 1.22 | % | | | 1.40 | % | | | 1.31 | % | | | 1.16 | % | | | 1.44 | % |
| | 44 | % | | | 27 | % | | | 23 | % | | | 31 | % | | | 22 | % |
The accompanying notes are an integral part of these financial statements.
| HENNESSY FUNDS | 1-800-966-4354 | |
Financial Statements
Notes to the Financial Statements October 31, 2016 |
1). ORGANIZATION
The Hennessy Total Return Fund (the “Fund”) is a series of Hennessy Funds Trust (the “Trust”), which was organized as a Delaware statutory trust on September 17, 1992. The Fund is an open-end management investment company registered under the Investment Company Act of 1940, as amended. The Fund is a successor to a fund with the same name (the “Predecessor Fund”) that was a series of The Hennessy Funds, Inc., a Maryland corporation, pursuant to a reorganization that took place after the close of business on February 28, 2014. Prior to February 28, 2014, the Fund had no investment operations. As a result of the reorganization, holders of Investor Class shares of the Predecessor Fund received Investor Class shares of the Fund (the Investor Class shares of the Fund are the successor to the accounting and performance information of the corresponding shares of the Predecessor Fund). The investment objective of the Fund is total return, consisting of capital appreciation and current income. The Fund is a non-diversified fund and offers Investor Class shares.
As an investment company, the Fund follows the investment company accounting and reporting guidance of the Financial Accounting Standards Board (“FASB”) Accounting Standard Codification Topic 946 “Financial Services—Investment Companies.”
2). SIGNIFICANT ACCOUNTING POLICIES
The following is a summary of significant accounting policies consistently followed by the Fund in the preparation of the financial statements. These policies conform with U.S. generally accepted accounting principles (“GAAP”).
| a). | Investment Valuation – All investments in securities are recorded at their estimated fair value, as described in Note 3. |
| | |
| b). | Federal Income Taxes – No provision for federal income taxes or excise taxes has been made since the Fund has elected to be taxed as a “regulated investment company” and intends to distribute substantially all of its taxable income to its shareholders and otherwise comply with the provisions of the Internal Revenue Code of 1986, as amended, applicable to regulated investment companies. Net investment income or loss and realized gains and losses for federal income tax purposes may differ from that reported on the financial statements because of temporary book and tax basis differences. Temporary differences are primarily the result of the treatment of wash sales for tax reporting purposes. The Fund recognizes interest and penalties related to income tax benefits, if any, in the statement of operations as an income tax expense. Distributions from net realized gains for book purposes may include short-term capital gains, which are included as ordinary income to shareholders for tax purposes. |
| | |
| c). | Accounting for Uncertainty in Income Taxes – The Fund has accounting policies regarding recognition and measurement of tax positions taken or expected to be taken on a tax return. The tax returns of the Fund for the prior three fiscal years are open for examination. The Fund has reviewed all open tax years in major jurisdictions and concluded that there is no impact on the Fund’s net assets and no tax liability resulting from unrecognized tax benefits relating to uncertain income tax positions taken or expected to be taken on a tax return. The Fund’s major tax jurisdictions are U.S. federal and Delaware. |
HENNESSYFUNDS.COM
| NOTES TO THE FINANCIAL STATEMENTS |
| d). | Income and Expenses – Dividend income is recognized on the ex-dividend date or as soon as information is available to the Fund. Interest income, which includes the amortization of premium and accretion of discount, is recognized on an accrual basis. The Fund is charged for those expenses that are directly attributable to the portfolio, such as advisory, administration, and certain shareholder service fees. |
| | |
| e). | Distributions to Shareholders – Dividends from net investment income for the Fund, if any, are declared and paid on a calendar quarter basis. Distributions of net realized capital gains, if any, are declared and paid annually, usually in December. |
| | |
| f). | Security Transactions – Investment and shareholder transactions are recorded on the trade date. The Fund determines the gain or loss realized from the investment transactions by comparing the original cost of the security lot sold with the net sale proceeds. Discounts and premiums on securities purchased are accreted/amortized over the life of the respective security. |
| | |
| g). | Use of Estimates – The preparation of financial statements in conformity with GAAP requires management to make estimates and assumptions that affect the reported amounts of assets and liabilities and disclosure of contingent assets and liabilities at the date of the financial statements and the reported change in net assets during the reporting period. Actual results could differ from those estimates. |
| | |
| h). | Share Valuation – The net asset value (“NAV”) per share of the Fund is calculated by dividing the sum of the value of the securities held by the Fund, plus cash or other assets, minus all liabilities (including estimated accrued expenses) by the total number of shares outstanding for the Fund, rounded to the nearest cent. The Fund’s shares will not be priced on days the New York Stock Exchange is closed for trading. The offering and redemption price per share for the Fund is equal to the Fund’s NAV per share. |
| | |
| i). | Repurchase Agreements – The Fund may enter into repurchase agreements with member banks or security dealers of the Federal Reserve Board whom the investment advisor deems creditworthy. The repurchase price generally equals the price paid by the Fund plus interest negotiated on the basis of current short-term rates. |
| | |
| | Securities pledged as collateral for repurchase agreements are held by the custodian bank until the respective agreements mature. Provisions of the repurchase agreements ensure that the market value of the collateral, including accrued interest thereon, is sufficient to cover the repurchase amount in the event of default of the counterparty. If the counterparty defaults and the value of the collateral declines or if the counterparty enters an insolvency proceeding, realization of the collateral by the Fund may be delayed or limited. |
| | |
| j). | Offsetting Assets and Liabilities – The Fund follows the financial reporting rules regarding offsetting assets and liabilities and related netting arrangements to enable users of its financial statements to understand the effect of those arrangements on its financial position. Reverse repurchase transactions are entered into by the Fund under Master Repurchase Agreements (“MRA”) that permit the Fund, under certain circumstances, including an event of default (such as bankruptcy or insolvency), to offset payables under the MRA with collateral held with the counterparty and create one single net payment from the Fund. Upon a bankruptcy or insolvency of the MRA counterparty, the Fund is considered an unsecured creditor with respect to excess collateral and, as such, the return of excess collateral may be delayed. In the event the buyer of securities under an MRA files for bankruptcy or becomes insolvent, the Fund’s use of the proceeds of the agreement may be restricted while the other party, or its trustee or receiver, determines whether or not to enforce the Fund’s obligation |
| HENNESSY FUNDS | 1-800-966-4354 | |
| | to repurchase the securities. For additional information regarding the offsetting of assets and liabilities at October 31, 2016, please reference the table in Note 9. |
| | |
| k). | New Accounting Pronouncements – In May 2015, the FASB issued ASU No. 2015-07 “Disclosure for Investments in Certain Entities that Calculate Net Asset Value per Share (or Its Equivalent).” The amendments in ASU No. 2015-07 remove the requirement to categorize within the fair value hierarchy investments measured at NAV and require the disclosure of sufficient information to reconcile the fair value of the remaining assets categorized within the fair value hierarchy to the financial statements. The amendments in ASU No. 2015-07 are effective for fiscal years beginning after December 15, 2015, and interim periods within those fiscal years. Management has reviewed the requirements and believes the adoption of ASU 2015-07 will not have a material impact on the Fund’s financial statements and related disclosures. |
3). SECURITIES VALUATION
The Fund follows authoritative fair valuation accounting standards that establish an authoritative definition of fair value and set out a hierarchy for measuring fair value. These standards require additional disclosures about the various inputs and valuation techniques used to develop the measurements of fair value and a discussion in changes in valuation techniques and related inputs during the period. These inputs are summarized in the three broad levels listed below:
| | Level 1 – | Unadjusted, quoted prices in active markets for identical instruments that the Fund has the ability to access at the date of measurement. |
| | | |
| | Level 2 – | Other significant observable inputs (including, but not limited to, quoted prices in active markets for similar instruments, quoted prices in markets that are not active for identical or similar instruments, and model-derived valuations in which all significant inputs and significant value drivers are observable in active markets (such as interest rates, prepayment speeds, credit risk curves, default rates, and similar data)). |
| | | |
| | Level 3 – | Significant unobservable inputs (including the Fund’s own assumptions about what market participants would use to price the asset or liability based on the best available information) when observable inputs are unavailable. |
Following is a description of the valuation techniques applied to the Fund’s major categories of assets and liabilities measured at fair value on a recurring basis.
Equity Securities – Equity securities, including common stocks, preferred stocks, exchange-traded funds, closed-end mutual funds, partnerships, rights, and real estate investment trusts, that are traded on a securities exchange for which a last-quoted sales price is readily available will generally be valued at the last sales price as reported by the primary exchange on which the securities are listed. Securities listed on The NASDAQ Stock Market (“NASDAQ”) will generally be valued at the NASDAQ Official Closing Price, which may differ from the last sales price reported. Securities traded on a securities exchange for which a last-quoted sales price is not readily available will generally be valued at the mean between the bid and ask prices. To the extent these securities are actively traded and valuation adjustments are not applied, they are classified in Level 1 of the fair value hierarchy.
Registered Investment Companies – Investments in registered investment companies (e.g., mutual funds) are generally priced at the ending NAV provided by the applicable registered investment company’s service agent and will be classified in Level 1 of the fair value hierarchy.
HENNESSYFUNDS.COM
| NOTES TO THE FINANCIAL STATEMENTS |
Debt Securities – Debt securities, including corporate bonds, asset-backed securities, mortgage-backed securities, municipal bonds, U.S. Treasuries, and U.S. government agency issues, are generally valued at market on the basis of valuations furnished by an independent pricing service that utilizes both dealer-supplied valuations and formula-based techniques. The pricing service may consider recently executed transactions in securities of the issuer or comparable issuers, market price quotations (where observable), bond spreads, and fundamental data relating to the issuer. In addition, the model may incorporate observable market data such as reported sales of similar securities, broker quotes, yields, bids, offers, and reference data. Certain securities are valued primarily using dealer quotations. These securities are generally classified in Level 2 of the fair value hierarchy.
Short-Term Securities – Short-term equity investments, including money market funds, are valued in the manner specified above. Short-term debt investments with an original term to maturity of 60 days or less are valued at amortized cost, which approximates fair market value. If the original term to maturity of a short-term debt investment exceeded 60 days, then the values as of the 61st day prior to maturity are amortized. Amortized cost is not used if its use would be inappropriate due to credit or other impairments of the issuer, in which case the security’s fair value would be determined, as described below. Short-term securities are generally classified in Level 1 or Level 2 of the fair market hierarchy depending on the inputs used and market activity levels for specific securities.
The Board of Trustees of the Fund (the “Board”) has adopted fair value pricing procedures that are followed when a price for a security is not readily available or if a significant event has occurred that indicates the closing price of a security no longer represents the true value of that security. Fair value pricing determinations are made in good faith in accordance with these procedures. There are numerous criteria that will be given consideration in determining a fair value of a security such as the trading volume of a security and markets, the value of other like securities, and news events with direct bearing to a security or markets. Fair value pricing results in an estimated price for a security that reflects the amount the Fund might reasonably expect to receive in a current sale. Depending on the relative significance of the valuation inputs, these securities may be classified in either Level 2 or Level 3 of the fair value hierarchy.
The Board has delegated day-to-day valuation matters to a Valuation Committee comprised of one or more representatives from Hennessy Advisors, Inc., the Fund’s investment advisor. The function of the Valuation Committee is to value securities where current and reliable market quotations are not readily available. All actions taken by the Valuation Committee are reviewed by the Board.
The Fund has performed an analysis of all existing investments to determine the significance and character of all inputs to their fair value determination. Various inputs are used in determining the value of the Fund’s investments. The inputs or methodology used for valuing securities are not necessarily an indication of the risk associated with investing in those securities. Details related to the fair valuation hierarchy of the Fund’s securities as of October 31, 2016, are included in the Fund’s Schedule of Investments.
4). INVESTMENT TRANSACTIONS
Purchases and sales of investment securities (excluding government and short-term investments) for the Fund during the fiscal year ended October 31, 2016, were $26,886,584 and $23,127,983, respectively.
There were no purchases or sales/maturities of long-term U.S. government securities for the Fund during the fiscal year ended October 31, 2016.
| HENNESSY FUNDS | 1-800-966-4354 | |
The Fund is permitted to purchase or sell securities from or to another fund in the Hennessy Funds family of funds (the “Hennessy Funds”) under specified conditions outlined in procedures adopted by the Board of Trustees. The procedures have been designed to ensure that any purchase or sale of securities by the Fund from or to another Hennessy Fund complies with Rule 17a-7 of the Investment Company Act of 1940. For the fiscal year ended October 31, 2016, the Fund did not engage in purchases and sales of securities pursuant to Rule 17a-7 of the Investment Company Act of 1940.
5). INVESTMENT MANAGEMENT FEE AND OTHER TRANSACTIONS WITH AFFILIATES
Hennessy Advisors, Inc. (the “Advisor”) is the investment advisor of the Fund. The Advisor provides the Fund with investment management services under an Investment Advisory Agreement. The Advisor furnishes all investment advice, office space, facilities, and provides most of the personnel needed by the Fund. As compensation for its services, the Advisor is entitled to a monthly fee from the Fund. The fee is based upon the average daily net assets of the Fund at the annual rate of 0.60%. The net investment advisory fees payable by the Fund as of October 31, 2016, were $45,072.
The Board has approved a Shareholder Servicing Agreement for the Fund, which was instituted to compensate the Advisor for the non-investment management services it provides to the Fund. The Shareholder Servicing Agreement provides for a monthly fee paid to the Advisor at an annual rate of 0.10% of the average daily net assets of the Fund. Shareholder service fees payable by the Fund as of October 31, 2016, were $7,512.
The Fund has adopted a plan pursuant to Rule 12b-1 under the Investment Company Act of 1940, as amended, that authorizes payments in connection with the distribution of the Fund’s shares at an annual rate of up to 0.25% of the Fund’s average daily net assets, although the Fund is currently only using up to 0.15% of its average daily net assets for such purpose. Amounts paid under the plan may be spent on any activities or expenses primarily intended to result in the sale of shares, including, but not limited to, advertising, shareholder account servicing, the printing and mailing of prospectuses to other than current shareholders, the printing and mailing of sales literature, and compensation for sales and marketing activities or to financial institutions and others, such as dealers and distributors.
The Fund has entered into agreements with various brokers, dealers, and financial intermediaries in connection with the sale of shares of the Fund. The agreements provide for periodic payments by the Fund to the brokers, dealers, and financial intermediaries for providing certain shareholder maintenance services (sub-transfer agent expenses). These shareholder services include the pre-processing and quality control of new accounts, shareholder correspondence, answering customer inquiries regarding account status, and facilitating shareholder telephone transactions. Fees paid by the Fund to various brokers, dealers, and financial intermediaries during the fiscal year ended October 31, 2016, were $59,736.
U.S. Bancorp Fund Services, LLC (“USBFS”) provides the Fund with administrative, fund accounting, and transfer agent services and necessary office equipment. As administrator, USBFS is responsible for activities such as (i) preparing various federal and state regulatory filings, reports, and returns for the Fund, (ii) preparing reports and materials to be supplied to the Board, (iii) monitoring the activities of the Fund’s custodian, transfer agent, and accountants, and (iv) coordinating the preparation and payment of the Fund’s expenses and reviewing the Fund’s expense accruals. Fees paid to USBFS during the fiscal year ended October 31, 2016, were $73,531.
U.S. Bank, N.A., an affiliate of USBFS, serves as the Fund’s custodian. Quasar Distributors, LLC acts as the Fund’s principal underwriter in a continuous public offering of the Fund’s shares. Quasar Distributors, LLC is an affiliate of USBFS and U.S. Bank, N.A.
HENNESSYFUNDS.COM
| NOTES TO THE FINANCIAL STATEMENTS |
The officers of the Fund are affiliated with the Advisor. Such officers, with the exception of the Chief Compliance Officer and the Senior Compliance Officer, receive no compensation from the Fund for serving in their respective roles. The Fund, along with the other Hennessy Funds, makes reimbursement payments, on an equal basis, to the Advisor for a portion of the salary and benefits associated with the office of the Chief Compliance Officer and for all of the salary and benefits associated with the office of the Senior Compliance Officer. Such amounts are included on the Statement of Operations.
6). GUARANTEES AND INDEMNIFICATIONS
Under the Hennessy Funds’ organizational documents, their officers and trustees are indemnified by the Hennessy Funds against certain liabilities arising out of the performance of their duties to the Hennessy Funds. Additionally, in the normal course of business, the Hennessy Funds enter into contracts with service providers that contain general indemnification clauses. The Fund’s maximum exposure under these arrangements is unknown as this would involve future claims that may be made against the Fund that have not yet occurred. Currently, the Fund expects the risk of loss to be remote.
7). LINE OF CREDIT
The Fund has an uncommitted line of credit with the other Hennessy Funds in the amount of the lesser of (i) $100,000,000 or (ii) 33.33% of each Hennessy Fund’s net assets, or 30% for the Hennessy Gas Utility Fund and 10% for the Hennessy Balanced Fund, intended to provide short-term financing, if necessary, subject to certain restrictions, in connection with shareholder redemptions. The credit facility is with the Hennessy Funds’ custodian bank, U.S. Bank, N.A. Borrowings under this arrangement bear interest at the bank’s prime rate and are secured by all of the Fund’s assets (as to its own borrowings only). During the fiscal year ended October 31, 2016, the Fund had an outstanding average daily balance and a weighted average interest rate of $13,795 and 3.47%, respectively. The maximum amount outstanding for the Fund during the period was $1,299,000. At October 31, 2016, the Fund did not have any borrowings outstanding under the line of credit.
8). FEDERAL TAX INFORMATION
As of October 31, 2016, the components of accumulated earnings (losses) for income tax purposes were as follows:
| | Cost of investments for tax purposes | | $ | 112,794,423 | |
| | Gross tax unrealized appreciation | | $ | 5,664,482 | |
| | Gross tax unrealized depreciation | | | (1,071,697 | ) |
| | Net tax unrealized appreciation | | $ | 4,592,785 | |
| | Undistributed ordinary income | | $ | 142,034 | |
| | Undistributed long-term capital gains | | | 4,383,369 | |
| | Total distributable earnings | | $ | 4,525,403 | |
| | Other accumulated loss | | $ | — | |
| | Total accumulated gain | | $ | 9,118,188 | |
The difference between book-basis unrealized appreciation/depreciation (as shown in the Statement of Assets and Liabilities) and tax-basis unrealized appreciation/depreciation (as shown above) is attributable primarily to wash sales.
At October 31, 2016, the Fund had no tax basis capital losses to offset future capital gains.
At October 31, 2016, the Fund did not defer, on a tax basis, any post-December late year ordinary loss deferrals.
| HENNESSY FUNDS | 1-800-966-4354 | |
During the fiscal years ended October 31, 2016 and 2015, the tax character of distributions paid by the Fund was as follows:
| | | | Year Ended | | | | Year Ended | |
| | | October 31, 2016 | | October 31, 2015 |
| | Ordinary income(1) | | $ | 1,010,164 | | | | $ | 1,084,818 | |
| | Long-term capital gain | | | 5,844,038 | | | | | 5,767,007 | |
| | | | $ | 6,854,202 | | | | $ | 6,851,825 | |
(1) Ordinary income includes short-term gain or loss.
9). REVERSE REPURCHASE AGREEMENTS
The Fund may enter into reverse repurchase agreements with the same parties with whom it may enter into repurchase agreements. Under a reverse repurchase agreement, the Fund sells securities and agrees to repurchase them at a mutually agreed upon date and price. Reverse repurchase agreements are regarded as a form of secured borrowing by the Fund. Securities sold under reverse repurchase agreements are reflected as a liability on the Statement of Assets and Liabilities. Interest payments made are recorded as a component of interest expense on the Statement of Operations.
For the fiscal year ended October 31, 2016, the average daily balance and average interest rate in effect for reverse repurchase agreements were $29,774,433 and 0.681%, respectively. Below is information about the scheduled maturity date, amount, and interest rate for outstanding reverse repurchase agreements as of October 31, 2016:
| | Maturity Date | Amount | Interest Rate | |
| | November 25, 2016 | $12,593,000 | 0.75% | |
| | December 22, 2016 | $10,794,000 | 0.75% | |
| | January 12, 2017 | $12,593,000 | 0.75% | |
Outstanding reverse repurchase agreements at October 31, 2016, were equal to 42.90% of the Fund’s net assets.
Below is information about instruments and transactions eligible for offset in the Statement of Assets and Liabilities, on both a gross and net basis, as well as instruments and transactions subject to an agreement similar to a master netting arrangement:
| | | Gross | Net | | | |
| | | Amounts | Amounts | | |
| | | Offset | Presented | Gross Amounts Not | |
| | | in the | in the | Offset in the Statement | |
| | Gross | Statement | Statement | of Assets and Liabilities | |
| | Amounts of | of | of | | Collateral | |
| | Recognized | Assets and | Assets and | Financial | Pledged | Net |
Description | Liabilities | Liabilities | Liabilities | Instruments | (Received) | Amount |
| Reverse | | | | | | |
| Repurchase | | | | | | |
| Agreements | $35,980,000 | $— | $35,980,000 | $35,980,000 | $— | $— |
| | $35,980,000 | $— | $35,980,000 | $35,980,000 | $— | $— |
For additional information, please reference the “Offsetting Assets and Liabilities” section in Note 2.
HENNESSYFUNDS.COM
| NOTES TO THE FINANCIAL STATEMENTS |
10). EVENTS SUBSEQUENT TO YEAR END
Management has evaluated the Fund’s related events and transactions that occurred subsequent to October 31, 2016, through the date of issuance of the Fund’s financial statements. Other than as disclosed below, management has determined that there were no subsequent events requiring recognition or disclosure in the financial statements.
On December 7, 2016, capital gains were declared and paid to shareholders of record as of December 6, 2016, as follows:
| | | Amount Per Share | |
| | | Long-term | | | Short-term | |
| Investor Class | | $ | 0.64969 | | | $ | 0.00673 | |
| HENNESSY FUNDS | 1-800-966-4354 | |
Report of Independent Registered Public Accounting Firm
The Board of Trustees of Hennessy Funds Trust
and Shareholders of the Hennessy Total Return Fund:
We have audited the accompanying statement of assets and liabilities of the Hennessy Total Return Fund (the Fund), a series of Hennessy Funds Trust, including the schedule of investments, as of October 31, 2016, and the related statement of operations and cash flows for the year then ended, the statements of changes in net assets for each of the years in the two year period then ended, and the financial highlights for each of the years in the five year period then ended. These financial statements and financial highlights are the responsibility of the Fund’s management. Our responsibility is to express an opinion on these financial statements and financial highlights based on our audits.
We conducted our audits in accordance with the standards of the Public Company Accounting Oversight Board (United States). Those standards require that we plan and perform the audit to obtain reasonable assurance about whether the financial statements and financial highlights are free of material misstatement. An audit includes examining, on a test basis, evidence supporting the amounts and disclosures in the financial statements. Our procedures included confirmation of securities owned as of October 31, 2016, by correspondence with custodians and brokers or by other appropriate auditing procedures. An audit also includes assessing the accounting principles used and significant estimates made by management, as well as evaluating the overall financial statement presentation. We believe that our audits provide a reasonable basis for our opinion.
In our opinion, the financial statements and financial highlights referred to above present fairly, in all material respects, the financial position of the Fund as of October 31, 2016, the results of its operations and its cash flows for the year then ended, the changes in its net assets for each of the years in the two year period then ended, and the financial highlights for each of the years in the five year period then ended, in conformity with U.S. generally accepted accounting principles.
Chicago, Illinois
December 22, 2016
HENNESSYFUNDS.COM
| REPORT OF INDEPENDENT REGISTERED PUBLIC ACCOUNTING FIRM/TRUSTEES AND OFFICERS |
Trustees and Officers of the Fund (Unaudited)
The business and affairs of the Fund are managed under the direction of the Board of Trustees of the Trust, and the Board of Trustees elects the Officers of the Trust. Beginning in March 2015, the Board of Trustees has from time to time appointed advisers (“Advisers “) to the Board of Trustees, with the intention of having qualified individuals serve in an advisory capacity in order to garner experience in the mutual fund and asset management industry and be considered as potential Trustees in the future. There are currently three Advisers to the Board of Trustees: Brian Alexander, Doug Franklin, and Claire Knoles. As Advisers, Mr. Alexander, Mr. Franklin, and Ms. Knoles attend meetings of the Board and act as non-voting participants. Information pertaining to the Trustees, Advisers, and the Officers of the Trust is set forth below. The Trustees and Officers serve until their successors are duly elected and qualified or until their earlier death, resignation, or removal. Each of the Trustees oversees 16 Hennessy Funds. Unless otherwise indicated, the address of all persons listed below is 7250 Redwood Boulevard, Suite 200, Novato, CA 94945. The Fund’s Statement of Additional Information includes more information about the persons listed below and is available, without charge, upon request by calling 1-800-966-4354.
| | | | Other |
| | | | Directorships |
| | | | Held Outside |
| Name, (Year of Birth), | | | of Fund |
| and Position Held | Start Date | Principal Occupation(s) | Complex During |
with the Trust | of Service | During Past Five Years | Past Five Years(1) |
| | | | |
| Disinterested Trustees and Advisers | | |
| | | | |
| J. Dennis DeSousa | January 1996 | Mr. DeSousa is a real estate investor. | None. |
| (1936) | | | |
| Trustee | | | |
| | | | |
| Robert T. Doyle | January 1996 | Mr. Doyle has been the Sheriff of | None. |
| (1947) | | Marin County, California since 1996. | |
| Trustee | | | |
| | | | |
| Gerald P. Richardson | May 2004 | Mr. Richardson is an independent | None. |
| (1945) | | consultant in the securities industry. | |
| Trustee | | | |
| | | | |
| Brian Alexander | March 2015 | Mr. Alexander has been employed | None. |
| (1981) | | by Sutter Health Novato Community | |
| Adviser to the Board | | Hospital since 2012, first as an | |
| | | Assistant Administrator and then, | |
| | | beginning in 2013, as the Chief | |
| | | Administrative Officer. From 2011 | |
| | | through 2012, Mr. Alexander was | |
| | | employed by Sutter Health West Bay | |
| | | Region as the Regional Director of | |
| | | Strategic Decision Support. Prior to | |
| | | that, in 2011, he served as the | |
| | | Director of Managed Care | |
| | | Contracting and also the Director of | |
| | | Compensation, Benefits, and | |
| | | Compliance for the Rehabilitation | |
| | | Institute of Chicago. | |
| HENNESSY FUNDS | 1-800-966-4354 | |
| | | | Other |
| | | | Directorships |
| | | | Held Outside |
| Name, (Year of Birth), | | | of Fund |
| and Position Held | Start Date | Principal Occupation(s) | Complex During |
with the Trust | of Service | During Past Five Years | Past Five Years(1) |
| | | | |
| Doug Franklin | March 2016 | Mr. Franklin is a retired insurance | None. |
| (1964) | | industry executive. From 1987 | |
| Adviser to the Board | | through 2015, he was employed by | |
| | | the Allianz-Fireman’s Fund Insurance | |
| | | Company in various positions, | |
| | | including as its Chief Actuary and | |
| | | Chief Risk Officer. | |
| | | | |
| Claire Knoles | December 2015 | Ms. Knoles is a founder of Kiosk and | None. |
| (1974) | | has served as its Chief Operating | |
| Adviser to the Board | | Officer since 2004. Kiosk is a full | |
| | | service marketing agency with | |
| | | offices in the San Francisco Bay | |
| | | Area, Toronto, and Liverpool, UK. | |
| | | | |
Interested Trustee(2) | | | |
| | | | |
| Neil J. Hennessy | January 1996 as | Mr. Hennessy has been employed by | Hennessy |
| (1956) | a Trustee and | Hennessy Advisors, Inc. since 1989 | Advisors, Inc. |
| Trustee, Chairman of | June 2008 as | and currently serves as its President, | |
| the Board, Chief | an Officer | Chairman and Chief Executive Officer. | |
| Investment Officer, | | | |
| Portfolio Manager, | | | |
| and President | | | |
| Name, (Year of Birth), | | |
| and Position Held | Start Date | Principal Occupation(s) |
with the Trust | of Service | During Past Five Years |
| | | |
| Officers | | |
| | | |
| Teresa M. Nilsen | January 1996 | Ms. Nilsen has been employed by Hennessy Advisors, Inc. |
| (1966) | | since 1989 and currently serves as its Executive Vice President, |
| Executive Vice President | | Chief Operations Officer, Chief Financial Officer, and Secretary. |
| and Treasurer | | |
| | | |
| Daniel B. Steadman | March 2000 | Mr. Steadman has been employed by Hennessy Advisors, Inc. |
| (1956) | | since 2000 and currently serves as its Executive Vice President |
| Executive Vice President | | and Chief Compliance Officer. |
| and Secretary | | |
| | | |
| Jennifer Cheskiewicz | June 2013 | Ms. Cheskiewicz has been employed by Hennessy Advisors, Inc. |
| (1977) | | as its General Counsel since June 2013. She previously served |
| Senior Vice President and | | as in-house counsel to Carlson Capital, L.P., an SEC-registered |
| Chief Compliance Officer | | investment advisor to several private funds, from |
| | | February 2010 to May 2013. |
| | | |
| Brian Carlson | December 2013 | Mr. Carlson has been employed by Hennessy Advisors, Inc. |
| (1972) | | since December 2013. Mr. Carlson was previously a co-founder |
| Senior Vice President and | | and principal of Trivium Consultants, LLC from February 2011 |
| Head of Distribution | | through November 2013. |
HENNESSYFUNDS.COM
| TRUSTEES AND OFFICERS OF THE FUND |
| Name, (Year of Birth), | | |
| and Position Held | Start Date | Principal Occupation(s) |
with the Trust | of Service | During Past Five Years |
| | | |
| David Ellison | October 2012 | Mr. Ellison has been employed by Hennessy Advisors, Inc. since |
(1958)(3) | | October 2012. He has served as a Portfolio Manager of the |
| Senior Vice President and | | Hennessy Small Cap Financial Fund, the Hennessy Large Cap |
| Portfolio Manager | | Financial Fund, and the Hennessy Technology Fund since |
| | | inception. Prior to that, Mr. Ellison served as Director, CIO and |
| | | President of FBR Fund Advisers, Inc. from December |
| | | 1999 to October 2012. |
| | | |
| Brian Peery | March 2003 as | Mr. Peery has been employed by Hennessy Advisors, Inc. since |
| (1969) | an Officer and | 2002. He has served as a Portfolio Manager of the Hennessy |
| Senior Vice President and | February 2011 | Cornerstone Growth Fund, the Hennessy Cornerstone Mid Cap |
| Portfolio Manager | as a Co-Portfolio | 30 Fund, the Hennessy Cornerstone Large Growth Fund, the |
| | Manager or | Hennessy Cornerstone Value Fund, the Hennessy Total Return |
| | Portfolio Manager | Fund, and the Hennessy Balanced Fund since October 2014. |
| | | He served as Co-Portfolio Manager of the same funds from |
| | | February 2011 through September 2014. Mr. Peery has also |
| | | served as a Portfolio Manager of the Hennessy Gas Utility Fund |
| | | since February 2015. |
| | | |
| Winsor (Skip) Aylesworth | October 2012 | Mr. Aylesworth has been employed by Hennessy Advisors, Inc. |
(1947)(3) | | since October 2012. He has served as a Portfolio Manager of |
| Vice President and | | the Hennessy Gas Utility Fund since 1998 and as a Portfolio |
| Portfolio Manager | | Manager of the Hennessy Technology Fund since inception. |
| | | Prior to that, Mr. Aylesworth served as Executive Vice President |
| | | of FBR Fund Advisers, Inc. from 1999 to October 2012. |
| | | |
| Ryan Kelley | March 2013 | Mr. Kelley has been employed by Hennessy Advisors, Inc. since |
(1972)(4) | | October 2012. He has served as a Portfolio Manager of the |
| Vice President and | | Hennessy Gas Utility Fund, the Hennessy Small Cap Financial |
| Portfolio Manager | | Fund, and the Hennessy Large Cap Financial Fund since |
| | | October 2014. He served as Co-Portfolio Manager of the same |
| | | funds from March 2013 through September 2014, and as a |
| | | Portfolio Analyst for the Hennessy Funds from October 2012 |
| | | through February 2013. Prior to that, Mr. Kelley served as |
| | | Portfolio Manager of FBR Fund Advisers, Inc. from |
| | | January 2008 to October 2012. |
(1) | Messrs. DeSousa, Doyle, Hennessy, and Richardson previously served on the Board of Directors of Hennessy Mutual Funds, Inc. (“HMFI”), The Hennessy Funds, Inc. (“HFI”), and Hennessy SPARX Funds Trust (“HSFT”). Pursuant to an internal reorganization effective as of February 28, 2014, the series of HFMI, HFI, and HSFT were reorganized into corresponding series of Hennessy Funds Trust that mirrored them. Subsequent to the reorganization, HFMI, HFI, and HSFT were dissolved. |
(2) | Mr. Hennessy is considered an “interested person,” as defined in the Investment Company Act of 1940, as amended, because he is an officer of the Hennessy Funds. |
(3) | The address of these officers is 101 Federal Street, Suite 1900, Boston, MA 02110. |
(4) | The address of this officer is 1340 Environ Way, Suite 305, Chapel Hill, NC 27517. |
| HENNESSY FUNDS | 1-800-966-4354 | |
Expense Example (Unaudited)
October 31, 2016
As a shareholder of the Fund, you incur two types of costs: (1) transaction costs, including sales charges (loads) on purchase payments, reinvested dividends, or other distributions; redemption fees; and exchange fees; and (2) ongoing costs, including management fees; service fees; and other Fund expenses. This Example is intended to help you understand your ongoing costs (in dollars) of investing in the Fund and to compare these costs with the ongoing costs of investing in other mutual funds. The Example is based on an investment of $1,000 invested at the beginning of the period and held for the entire period from May 1, 2016, through October 31, 2016.
Actual Expenses
The first line of the table below provides information about actual account values and actual expenses. Although the Fund charges no sales loads or transaction fees, you will be assessed fees for outgoing wire transfers, returned checks and stop payment orders at prevailing rates charged by U.S. Bancorp Fund Services, LLC, the Fund’s transfer agent. If you request that a redemption be made by wire transfer, currently a $15 fee is charged by the Fund’s transfer agent. IRA accounts will be charged a $15 annual maintenance fee. The example below includes, but is not limited to, management fees, shareholder servicing fees, fund accounting, custody, and transfer agent fees. However, the example below does not include portfolio trading commissions and related expenses, and other extraordinary expenses as determined under generally accepted accounting principles. You may use the information in this line, together with the amount you invested, to estimate the expenses that you paid over the period. Simply divide your account value by $1,000 (for example, an $8,600 account value divided by $1,000 = 8.6), then multiply the result by the number in the first line of the table under the heading entitled “Expenses Paid During Period” to estimate the expenses you paid on your account during this period.
Hypothetical Example for Comparison Purposes
The second line of the table below provides information about hypothetical account values and hypothetical expenses based on the Fund’s actual expense ratios and an assumed rate of return of 5% per year before expenses, which is not the Fund’s actual return. The hypothetical account values and expenses may not be used to estimate the actual ending account balance or expenses you paid for the period. You may use this information to compare the ongoing costs of investing in the Fund and other funds. To do so, compare this 5% hypothetical example with the 5% hypothetical examples that appear in the shareholder reports of the other funds. Please note that the expenses shown in the table are meant to highlight your ongoing costs only and do not reflect any transactional costs, such as sales charges (loads), or exchange fees. Therefore, the second line of the table is useful in comparing ongoing costs only, and will not help you determine the relative total costs of owning different funds. In addition, if these transactional costs were included, your costs would have been higher.
HENNESSYFUNDS.COM
| | | | Expenses Paid |
| | Beginning | Ending | During Period(1) |
| | Account Value | Account Value | May 1, 2016 – |
| | May 1, 2016 | October 31, 2016 | October 31, 2016 |
| Investor Class | | | |
| Actual | $1,000.00 | $1,025.20 | $7.38 |
| Hypothetical (5% return before expenses) | $1,000.00 | $1,017.85 | $7.35 |
(1) | Expenses are equal to the Fund’s annualized expense ratio of 1.45%, multiplied by the average account value over the period, multiplied by 184/366 days (to reflect one-half year period). |
| HENNESSY FUNDS | 1-800-966-4354 | |
How to Obtain a Copy of the Fund’s
Proxy Voting Policy and Proxy Voting Records
A description of the policies and procedures the Fund uses to determine how to vote proxies relating to portfolio securities is available without charge: (1) by calling 1-800-966-4354; (2) on the Hennessy Funds’ website at hennessyfunds.com/proxy-voting/policy.fs; or (3) on the U.S. Securities and Exchange Commission’s website at www.sec.gov. The Fund’s proxy voting record is available without charge on both the Hennessy Funds’ website at hennessyfunds.com/proxy-voting/vote.fs and the SEC’s website at www.sec.gov no later than August 31 for the prior 12 months ending June 30.
Quarterly Filings on Form N-Q
The Fund files its complete schedule of portfolio holdings with the SEC for the first and third quarters of each fiscal year on Form N-Q. The Fund’s Form N-Q will be available on the SEC’s website at www.sec.gov. The Fund’s Form N-Q may be reviewed and copied at the SEC’s Public Reference Room in Washington, DC and information on the operation of the Public Reference Room may be obtained by calling 1-800-SEC-0330. Information included in the Fund’s N-Q will also be available upon request by calling 1-800-966-4354.
Federal Tax Distribution Information
(Unaudited)
For the fiscal year ended October 31, 2016, certain dividends paid by the Fund may be subject to a maximum tax rate of 23.8%, as provided for by the Jobs and Growth Tax Relief Reconciliation Act of 2003. The percentage of dividends declared from ordinary income designated as qualified dividend income was 100%.
For corporate shareholders, the percent of ordinary income distributions that qualified for the corporate dividends received deduction for the fiscal year ended October 31, 2016, was 100%.
The percentage of taxable ordinary income distributions that are designated as short-term capital gain distributions under Section 871(k)(2)(C) of the Internal Revenue Code of 1986, as amended, for the Fund was 8.80%.
Householding
To help keep the Fund’s costs as low as possible, we generally deliver a single copy of most financial reports and prospectuses to shareholders who share an address, even if the accounts are registered under different names. This process, known as “householding,” does not apply to account statements. You may, of course, request an individual copy of a prospectus or financial report at any time. If you would like to receive separate mailings, please call the Administrator at 1-800-261-6950 or 1-414-765-4124 and we will begin individual delivery within 30 days of your request. If your account is held through a financial institution or other intermediary, please contact them directly to request individual delivery.
HENNESSYFUNDS.COM
| PROXY VOTING — PRIVACY POLICY |
Privacy Policy
We collect the following non-public personal information about you:
| | • | information we receive from you on or in applications or other forms, correspondence, or conversations, including, but not limited to, your name, address, phone number, social security number, assets, income, and date of birth; and |
| | | |
| | • | information about your transactions with us, our affiliates, or others, including, but not limited to, your account number and balance, payment history, parties to transactions, cost basis information, and other financial information. |
We do not disclose any non-public personal information about our current or former shareholders to non-affiliated third parties, except as permitted by law. For example, we are permitted by law to disclose all of the information we collect, as described above, to our Transfer Agent to process your transactions. Furthermore, we restrict access to your non-public personal information to those persons who require such information to provide products or services to you. We maintain physical, electronic, and procedural safeguards that comply with federal standards to guard your non-public personal information.
In the event that you hold shares of the Fund through a financial intermediary, including, but not limited to, a broker-dealer, bank or trust company, the privacy policy of your financial intermediary would govern how your non-public personal information would be shared with non-affiliated third parties.
| HENNESSY FUNDS | 1-800-966-4354 | |
For information, questions or assistance, please call
The Hennessy Funds
1-800-966-4354 or 1-415-899-1555
INVESTMENT ADVISOR
Hennessy Advisors, Inc.
7250 Redwood Blvd., Suite 200
Novato, California 94945
ADMINISTRATOR,
TRANSFER AGENT,
DIVIDEND PAYING AGENT &
SHAREHOLDER SERVICING AGENT
U.S. Bancorp Fund Services, LLC
P.O. Box 701
Milwaukee, Wisconsin 53201-0701
CUSTODIAN
U.S. Bank N.A.
Custody Operations
1555 North River Center Dr., Suite 302
Milwaukee, Wisconsin 53212
TRUSTEES
Neil J. Hennessy
Robert T. Doyle
J. Dennis DeSousa
Gerald P. Richardson
COUNSEL
Foley & Lardner LLP
777 East Wisconsin Avenue
Milwaukee, Wisconsin 53202-5306
INDEPENDENT REGISTERED
PUBLIC ACCOUNTING FIRM
KPMG LLP
200 East Randolph Street
Chicago, Illinois 60601
DISTRIBUTOR
Quasar Distributors, LLC
615 East Michigan Street
Milwaukee, Wisconsin 53202
hennessyfunds.com | 1-800-966-4354
This report has been prepared for shareholders and may be distributed to
others only if preceded or accompanied by a current prospectus.
ANNUAL REPORT
OCTOBER 31, 2016
HENNESSY EQUITY AND
INCOME FUND
Investor Class HEIFX
Institutional Class HEIIX
hennessyfunds.com | 1-800-966-4354
(This Page Intentionally Left Blank.)
Contents
| Letter to Shareholders | | | 2 |
| Performance Overview | | | 4 |
| Financial Statements | | | |
| Schedule of Investments | | | 7 |
| Statement of Assets and Liabilities | | | 18 |
| Statement of Operations | | | 19 |
| Statements of Changes in Net Assets | | | 21 |
| Financial Highlights | | | 22 |
| Notes to the Financial Statements | | | 26 |
| Report of Independent Registered Public Accounting Firm | | | 34 |
| Trustees and Officers of the Fund | | | 35 |
| Expense Example | | | 38 |
| Proxy Voting | | | 40 |
| Quarterly Filings on Form N-Q | | | 40 |
| Federal Tax Distribution Information | | | 40 |
| Householding | | | 40 |
| Privacy Policy | | | 41 |
| HENNESSY FUNDS | 1-800-966-4354 | |
December 2016
Dear Hennessy Funds Shareholder:
Over the past year investors here in the U.S. and around the world have weathered a great deal of turmoil, especially in the political arena. Foremost, the bitterly divisive and all-consuming U.S. Presidential election, with its unanticipated outcome, is finally behind us. While the equity markets were jittery at first, they now appear more comfortable with the prospect of a Trump presidency and seem to be looking forward to diminished government regulation and intervention.
The Brexit vote in the U.K. cast a shadow over the European Union’s future. There remains uncertainty over the details and timing of the break and the economic consequences for both Britain and Europe, but early signs suggest the impact on growth in Britain will not be as severe as initially feared.
Additionally, uncertainty over whether the Federal Reserve would raise short-term interest rates has hung over the economy for well over a year now. The effects that higher rates could have on growth, the strength of the U.S. Dollar, corporate profits and loan supply and demand seem to have weighed heavily on investors, causing paralysis and money to remain on the sidelines of the market.
Despite all these concerns, U.S. equity markets have pushed higher, with both the Dow Jones Industrial Average and S&P 500 Index posting returns of approximately 5% during the twelve-month period ended October 31, 2016. The U.S. economy has continued to grow at a respectable annual rate of about 2%, and corporate profits have started to move higher. Today, as of mid-December, bond and Treasury yields have risen a bit from record lows just this summer, and the bond market is finishing the year on slightly rocky footing. Bond yields are still very low relative to historical averages, while the prospective PE multiples for the Dow Jones Industrial Average and S&P 500 Index are just above long-term averages at 18.0x and 18.9x, respectively. We believe that equity valuations could go considerably higher and still be at appropriate levels relative to bond yields. And, while we do expect the Fed to raise interest rates in the coming year, we believe that inflation will stay under control, so that short-term interest rates will not have to rise too fast or too far.
As I reflect over the past twelve months, what I realize is that many of the worries this year are not new. For the past several years, American businesses have operated in an environment characterized by highly partisan politics, mounting regulations, uncertainty over interest rates, and a lack of clarity regarding taxes and healthcare costs. Despite all these headwinds, U.S. corporations have been incredibly resilient and found ways to impress investors. If the newly elected administration follows through on campaign promises of reigning in regulation, lowering taxes for corporations and individuals, or reforming healthcare to drive down costs, then companies, which are already lean, should be able to post higher profits. And, that growth should lead to more jobs and a stronger economy, potentially creating a very positive cycle going forward.
With the bull market in U.S. equities entering its ninth year, many believe the economy is due for a recession and the market is due for a downturn. But, the euphoria that usually accompanies a peak in the market is absent. Since the recovery began after the financial crisis, I have found myself pondering the bull run of 1982 to 2000, powered, in part, by a significant increase in valuations. I believe today’s market displays the fundamentals to sustain a similarly strong and lengthy bull market. Meanwhile, companies are largely profitable and many corporate balance sheets are cash-rich, with
HENNESSYFUNDS.COM
relatively little debt. Unemployment is low and real wages are rising, helping to drive consumption. We are hopeful that these factors will provide support for positive market returns in the year to come.
Thank you for your continued confidence and investment in our funds. If you have any questions or would like to speak with us directly, please don’t hesitate to call us at (800) 966-4354.
Best regards,
Neil J. Hennessy
President and Chief Investment Officer
Past performance does not guarantee future results.
Mutual fund investing involves risk. Principal loss is possible.
Opinions expressed are those of Neil Hennessy and are subject to change, are not guaranteed and should not be considered investment advice.
The Dow Jones Industrial Average and S&P 500 Index are unmanaged indices commonly used to measure the performance of U.S. stocks. One cannot invest directly in an index.
PE, or price to earnings, is calculated by dividing a company’s market price per share by its earnings per share.
| HENNESSY FUNDS | 1-800-966-4354 | |
Performance Overview (Unaudited)
CHANGE IN VALUE OF $10,000 INVESTMENT
This graph illustrates the performance of an initial investment of $10,000 made in the Fund ten years ago and assumes the reinvestment of dividends.
AVERAGE ANNUAL TOTAL RETURN FOR PERIODS ENDED OCTOBER 31, 2016
| | One | Five | Ten |
| | Year | Years | Years |
| Hennessy Equity and Income Fund – | | | |
| Investor Class (HEIFX) | -0.12% | 6.92% | 5.89% |
| Hennessy Equity and Income Fund – | | | |
| Institutional Class (HEIIX) | 0.30% | 7.23% | 6.17% |
Blended Balanced Index(1) | 4.10% | 9.07% | 5.95% |
| S&P 500 Index | 4.51% | 13.57% | 6.70% |
Expense ratios: 1.43% (Investor Class); 1.09% (Institutional Class)
Performance data quoted represents past performance; past performance does not guarantee future results. The investment return and principal value of an investment will fluctuate so that an investor’s shares, when redeemed, may be worth more or less than their original cost. The performance graph and table do not reflect the deduction of taxes that a shareholder would pay on Fund distributions or the redemption of Fund shares. Current performance of the Fund may be lower or higher than the performance quoted. Performance data current to the most recent month end may be obtained by visiting hennessyfunds.com. Performance for the period from March 12, 2010 to October 26, 2012 is that of the FBR Balanced Fund and for the periods prior to March 12, 2010 is that of the AFBA 5 Star Balanced Fund.
The expense ratios presented are from the most recent prospectus.
(1) | The Blended Balanced Index consists of 60% common stocks represented by the S&P 500 Index and 40% bonds represented by the Bloomberg Barclays Intermediate U.S. Government/Credit Index. |
PERFORMANCE NARRATIVE
Portfolio Managers for Equity Allocation: Stephen M. Goddard, CFA (Lead Portfolio Manager), Jonathan T. Moody, CFA, J. Brian Campbell, CFA, and Mark E. DeVaul, CFA, CPA
The London Company of Virginia, LLC (sub-advisor)
Portfolio Managers for Fixed Income Portion: Gary B. Cloud, CFA, and Peter G. Greig, CFA
Financial Counselors, Inc. (sub-advisor)
HENNESSYFUNDS.COM
| LETTER TO SHAREHOLDERSPERFORMANCE OVERVIEW |
Performance:
For the twelve-month period ended October 31, 2016, the Investor Class of the Hennessy Equity and Income Fund returned -0.12%, underperforming the Blended Balanced Index* and the S&P 500 Index, which returned 4.10% and 4.51% for the same period, respectively.
Equities: Stock selection accounted for the most of the relative underperformance of the equity allocation of the Fund over the twelve-month period, while sector allocation also had a slightly negative impact. At the sector level, an underweight position in Information Technology and an overweight position in Consumer Discretionary both had a negative impact on relative performance. This underperformance was partially offset by the positive impact of an underweight position in Healthcare and an overweight position in Industrials.
On an individual stock level, the top contributors to the performance of the equity allocation of the Fund for the twelve-month period were Apple, Inc., Altria Group, Inc., Norfolk Southern Corporation, Deere & Company, and Dollar Tree Inc. The top detractors from performance were CarMax Inc., Bristol Myers Squibb Company, Carnival Corporation, Progressive Corporation, and Mosaic Company. All of the stocks mentioned are still owned in the portfolio.
Fixed Income: The overweight position in investment grade corporate credit was the largest contributor to the performance of the fixed income allocation of the Fund over the twelve-month period. Issue selection drove most of this performance. The income and aging from these higher-yielding investment grade securities exceeded the amount represented in the benchmark. The Fund’s slight exposure to preferred stocks and high-yield credit securities, or junk bonds, was another positive factor aiding performance. Effective duration was the largest detractor from overall performance compared to the benchmark. Portfolio convexity and volatility were neutral contributors to overall performance.
Portfolio Strategy:
The Fund seeks a balanced portfolio of 60% equities and 40% fixed income, with the goal of maintaining broad market exposure with lower volatility. Our bottom-up equity selection strategy seeks companies with strong returns on capital and the flexibility to enhance shareholder value by using their balance sheets. The fixed income allocation of the portfolio focuses on high-quality domestic corporate, agency and government bonds.
Investment Outlook:
Equities: Based on recent economic news, it appears that the US economy is continuing to grow at a low, single-digit rate. The labor market remains buoyant while the housing market and the manufacturing sector are improving. While interest rates may move slightly higher over the next few months, we believe rates will remain low relative to historical averages for quite some time. Low rates should be a positive for the equity market. Nonetheless, we note that the U.S. economy is now entering its eighth year of continuous expansion and in our opinion, equity markets are not as cheap as they were a few years ago based on traditional metrics. Fortunately, we are still finding what we believe to be high-conviction investment ideas with a focus on limiting downside risk in each holding.
Our strategy is to focus on stocks from a bottom-up point of view. We seek to own companies with strong returns on capital and flexibility to enhance shareholder value using their balance sheet. Low interest rates and relatively high equity risk premiums enable companies to increase shareholder value by adjusting their capital structures. We expect investors to reward companies that wisely deploy capital by using it to pay for higher dividends, finance share repurchases at attractive prices, and make sensible
| HENNESSY FUNDS | 1-800-966-4354 | |
acquisitions. We believe our more conservative portfolio is well positioned for a slow-growth environment that should reward more efficient capital allocation.
Fixed Income: In our opinion, the last few months may have marked the beginning of a slow change in central bank monetary policy worldwide. It might be too soon to ring the death knell for quantitative easing, but it is possible that progress towards even lower negative interest rates in Japan, Europe and Switzerland has been halted. Part of the reasoning behind this change in policy is the realization by many central bankers that negative interest rates can cause more harm than expected to the business models of financial intermediaries such as banks and insurance companies, while their macroeconomic benefit has not materialized as hoped.
Over the last twelve months, we have also witnessed a further reduction in consensus expectations among Federal Reserve Bank members regarding the timing and magnitude of rate increases over the next few years. Publications from the Federal Reserve now indicate that members expect two rate hikes in 2017 and three in 2018. For the first time in this lengthy rate-hiking cycle, both Federal Reserve Bank members and market participants see a fairly similar pathway forward for the level of short-term interest rates. This is significant because harmony between the Federal Reserve and market expectations reduces the possibility of surprises for the markets and a potential policy error.
As we look forward, prospects for economic growth remain subdued. Unanticipated election results in the United States and Europe coupled with a nationalist and populist electoral surge hurt prospects for trade liberalization and economic cooperation. Brexit negotiations with the European Union next year will add to political and economic uncertainty. Conflict in the Middle East, South China Sea disputes and potential terrorism events, all contribute to the unsettled political and social environment around the world. Overall, we expect to see modest rate movements in either direction as economic and political events dictate trading levels.
_______________
| * | The Blended Balanced Index consists of 60% common stocks represented by the S&P 500 Index and 40% bonds represented by the Bloomberg Barclays Intermediate U.S. Government/Credit Index. |
Opinions expressed are those of the Portfolio Managers as of the date written and are subject to change, are not guaranteed, and should not be considered investment advice or an indication of trading intent.
The S&P 500 Index is an unmanaged index commonly used to measure the performance of U.S. stocks. The Bloomberg Barclays Capital Intermediate U.S. Government/Credit Index is an unmanaged index commonly used to measure the performance of U.S. bonds. One cannot invest directly in an index.
Investments in debt securities typically decrease in value when interest rates rise. The risk is greater for longer-term debt securities. Investments by the Fund in lower-rated and non-rated securities presents a greater risk of loss to principal and interest than higher-rated securities. Investments in Asset-Backed and Mortgage-Backed securities include additional risks that investors should be aware of including credit risk, prepayment risk, possible illiquidity and default, as well as increased susceptibility to adverse economic developments. Investments in foreign securities may involve political, economic and currency risks, greater volatility and differences in accounting methods. The Fund may experience higher fees due to investments in pooled investment vehicles (including ETFs). Please see the Fund’s prospectus for a more complete discussion of these and other risks.
References to specific securities should not be considered a recommendation to buy or sell any security. Fund holdings and sector allocations are subject to change. Please refer to the Schedule of Investments included in this report for additional portfolio information.
Dividend payout ratio is calculated as a company’s yearly dividend per share divided by its earnings per share. Return on capital is a profitability ratio that measures the return that an investment generates for capital contributors, i.e. bondholders and stockholders, and it indicates how effective a company is at turning capital into profits.
HENNESSYFUNDS.COM
| PERFORMANCE OVERVIEW/SCHEDULE OF INVESTMENTS |
Financial Statements
Schedule of Investments as of October 31, 2016 |
HENNESSY EQUITY AND INCOME FUND
(% of Net Assets)
| TOP TEN HOLDINGS (EXCLUDING CASH/CASH EQUIVALENTS) | % NET ASSETS |
| | |
| Berkshire Hathaway, Inc., Class B | 4.25% |
| | |
| Edgewell Personal Care Co. | 2.96% |
| | |
| Dollar Tree, Inc. | 2.91% |
| | |
| Carnival Corp. | 2.76% |
| | |
| Apple, Inc. | 2.68% |
| | |
| Altria Group, Inc. | 2.67% |
| | |
| Visa, Inc., Class A | 2.49% |
| | |
| General Dynamics Corp. | 2.43% |
| | |
| Eli Lilly & Co. | 2.34% |
| | |
| CarMax, Inc. | 2.32% |
Note: For presentation purposes, the Fund has grouped some of the industry categories. For purposes of categorizing securities for compliance with Section 8(b)(1) of the Investment Company Act of 1940, as amended, the Fund uses more specific industry classifications.
| HENNESSY FUNDS | 1-800-966-4354 | |
| | COMMON STOCKS – 59.71% | | Number | | | | | | % of | |
| | | | of Shares | | | Value | | | Net Assets | |
| | Consumer Discretionary – 13.28% | | | | | | | | | |
| | CarMax, Inc. (a) | | | 154,299 | | | $ | 7,705,692 | | | | 2.32 | % |
| | Carnival Corp. (b) | | | 186,820 | | | | 9,172,862 | | | | 2.76 | % |
| | Dollar Tree, Inc. (a) | | | 127,700 | | | | 9,647,735 | | | | 2.91 | % |
| | Lowe’s Companies, Inc. | | | 71,666 | | | | 4,776,539 | | | | 1.44 | % |
| | NIKE, Inc., Class B | | | 122,400 | | | | 6,142,032 | | | | 1.85 | % |
| | O’Reilly Automotive, Inc. (a) | | | 25,070 | | | | 6,629,511 | | | | 2.00 | % |
| | | | | | | | | 44,074,371 | | | | 13.28 | % |
| | | | | | | | | | | | | | |
| | Consumer Staples – 6.99% | | | | | | | | | | | | |
| | Altria Group, Inc. | | | 134,177 | | | | 8,871,783 | | | | 2.67 | % |
| | Edgewell Personal Care Co. (a) | | | 130,232 | | | | 9,819,493 | | | | 2.96 | % |
| | The Coca-Cola Co. | | | 106,161 | | | | 4,501,226 | | | | 1.36 | % |
| | | | | | | | | 23,192,502 | | | | 6.99 | % |
| | | | | | | | | | | | | | |
| | Energy – 1.57% | | | | | | | | | | | | |
| | Chevron Corp. | | | 49,691 | | | | 5,205,132 | | | | 1.57 | % |
| | | | | | | | | | | | | | |
| | Financials – 13.89% | | | | | | | | | | | | |
| | Alleghany Corp. (a) | | | 13,960 | | | | 7,206,292 | | | | 2.17 | % |
| | Bank of America Corp. | | | 158,499 | | | | 2,615,233 | | | | 0.79 | % |
| | Berkshire Hathaway, Inc., Class B (a) | | | 97,679 | | | | 14,095,080 | | | | 4.25 | % |
| | BlackRock, Inc. | | | 22,038 | | | | 7,520,247 | | | | 2.26 | % |
| | The Progressive Corp. | | | 230,540 | | | | 7,264,315 | | | | 2.19 | % |
| | Wells Fargo & Co. | | | 160,803 | | | | 7,398,546 | | | | 2.23 | % |
| | | | | | | | | 46,099,713 | | | | 13.89 | % |
| | | | | | | | | | | | | | |
| | Health Care – 3.78% | | | | | | | | | | | | |
| | Bristol-Myers Squibb Co. | | | 94,133 | | | | 4,792,311 | | | | 1.44 | % |
| | Eli Lilly & Co. | | | 105,220 | | | | 7,769,445 | | | | 2.34 | % |
| | | | | | | | | 12,561,756 | | | | 3.78 | % |
| | | | | | | | | | | | | | |
| | Industrials – 9.36% | | | | | | | | | | | | |
| | Deere & Co. | | | 69,410 | | | | 6,128,903 | | | | 1.85 | % |
| | FedEx Corp. | | | 25,578 | | | | 4,458,757 | | | | 1.34 | % |
| | General Dynamics Corp. | | | 53,450 | | | | 8,057,053 | | | | 2.43 | % |
| | General Electric Co. | | | 198,670 | | | | 5,781,297 | | | | 1.74 | % |
| | Norfolk Southern Corp. | | | 71,470 | | | | 6,646,710 | | | | 2.00 | % |
| | | | | | | | | 31,072,720 | | | | 9.36 | % |
The accompanying notes are an integral part of these financial statements.
HENNESSYFUNDS.COM
| | COMMON STOCKS | | Number | | | | | | % of | |
| | | | of Shares | | | Value | | | Net Assets | |
| | Information Technology – 6.87% | | | | | | | | | |
| | Apple, Inc. | | | 78,540 | | | $ | 8,917,431 | | | | 2.68 | % |
| | Cisco Systems, Inc. | | | 183,706 | | | | 5,636,100 | | | | 1.70 | % |
| | Visa, Inc., Class A | | | 100,176 | | | | 8,265,522 | | | | 2.49 | % |
| | | | | | | | | 22,819,053 | | | | 6.87 | % |
| | | | | | | | | | | | | | |
| | Materials – 2.79% | | | | | | | | | | | | |
| | NewMarket Corp. | | | 17,940 | | | | 7,192,326 | | | | 2.17 | % |
| | The Mosaic Co. | | | 87,840 | | | | 2,066,875 | | | | 0.62 | % |
| | | | | | | | | 9,259,201 | | | | 2.79 | % |
| | | | | | | | | | | | | | |
| | Telecommunication Services – 1.18% | | | | | | | | | | | | |
| | Verizon Communications, Inc. | | | 81,538 | | | | 3,921,978 | | | | 1.18 | % |
| | | | | | | | | | | | | | |
| | Total Common Stocks | | | | | | | | | | | | |
| | (Cost $183,658,167) | | | | | | | 198,206,426 | | | | 59.71 | % |
| | | | | | | | | | | | | | |
| | PREFERRED STOCKS – 2.29% | | | | | | | | | | | | |
| | | | | | | | | | | | | | |
| | Consumer Staples – 0.10% | | | | | | | | | | | | |
| | CHS, Inc., Series 4, 7.500%, 01/21/2025 | | | 10,960 | | | | 320,580 | | | | 0.10 | % |
| | | | | | | | | | | | | | |
| | Financials – 2.19% | | | | | | | | | | | | |
| | Aegon N.V., 6.375%, 11/30/2016 (b) | | | 3,070 | | | | 78,162 | | | | 0.02 | % |
| | Ares Management LP, Series A, 7.000%, 06/30/2021 | | | 3,059 | | | | 79,320 | | | | 0.02 | % |
| | Banc of California, Inc., Series E, 7.000%, 03/15/2021 | | | 3,075 | | | | 76,567 | | | | 0.02 | % |
| | Bank of America Corp. | | | | | | | | | | | | |
| | Series EE, 6.000%, 04/25/2021 | | | 5,015 | | | | 130,390 | | | | 0.04 | % |
| | Series, W, 6.625%, 09/09/2019 | | | 3,540 | | | | 96,536 | | | | 0.03 | % |
| | BB&T Corp., Series F, 5.200%, 11/01/2017 | | | 13,715 | | | | 348,224 | | | | 0.11 | % |
| | Capital One Financial Corp. | | | | | | | | | | | | |
| | Series F, 6.200%, 12/01/2020 | | | 6,805 | | | | 181,625 | | | | 0.05 | % |
| | Series G, 5.200%, 12/01/2021 | | | 7,360 | | | | 182,749 | | | | 0.06 | % |
| | Citigroup, Inc. | | | | | | | | | | | | |
| | Series S, 6.300%, 02/12/2021 | | | 5,805 | | | | 153,891 | | | | 0.05 | % |
| | Series C, 5.800%, 04/22/2018 | | | 5,820 | | | | 147,304 | | | | 0.04 | % |
| | Discover Financial Services, Series B, 6.500%, 12/01/2017 | | | 13,190 | | | | 345,446 | | | | 0.10 | % |
| | Fannie Mae Preferred, Series S, 8.250%, 12/31/2020 (a) | | | 10,600 | | | | 41,764 | | | | 0.01 | % |
| | First Republic Bank | | | | | | | | | | | | |
| | Series G, 5.500%, 03/30/2021 | | | 5,025 | | | | 131,303 | | | | 0.04 | % |
| | Series F, 5.700%, 06/30/2020 | | | 4,800 | | | | 132,000 | | | | 0.04 | % |
| | Huntington Bancshares, Inc., Series D, 6.250%, 04/15/2021 | | | 9,510 | | | | 254,488 | | | | 0.08 | % |
The accompanying notes are an integral part of these financial statements.
| HENNESSY FUNDS | 1-800-966-4354 | |
| | PREFERRED STOCKS | | Number | | | | | | % of | |
| | | | of Shares | | | Value | | | Net Assets | |
| | Financials (Continued) | | | | | | | | | |
| | IBERIABANK Corp., Series A, 6.625%, 08/01/2025 | | | 3,090 | | | $ | 83,399 | | | | 0.03 | % |
| | ING Groep N.V., 6.125%, 01/15/2017 (b) | | | 3,185 | | | | 81,186 | | | | 0.02 | % |
| | JPMorgan Chase & Co., Series Bb, 6.150%, 09/01/2020 | | | 13,430 | | | | 358,178 | | | | 0.11 | % |
| | Legg Mason, Inc., 5.450%, 09/15/2021 (a) | | | 6,570 | | | | 163,527 | | | | 0.05 | % |
| | MetLife, Inc., Series A, 4.000%, 11/30/2016 | | | 13,860 | | | | 350,797 | | | | 0.11 | % |
| | Morgan Stanley, Series I, 6.375%, 10/15/2024 | | | 11,470 | | | | 316,572 | | | | 0.10 | % |
| | National General Holdings Corp., Series C, 7.500%, 07/15/2021 | | | 7,890 | | | | 202,300 | | | | 0.06 | % |
| | Northern Trust Corp., Series C, 5.850%, 10/01/2019 | | | 13,015 | | | | 350,234 | | | | 0.11 | % |
| | PNC Financial Services Group, Inc., Series Q, 5.375%, 12/01/2017 | | | 13,430 | | | | 340,988 | | | | 0.10 | % |
| | Regions Financial Corp. | | | | | | | | | | | | |
| | Series B, 6.375%, 09/15/2024 | | | 6,650 | | | | 191,320 | | | | 0.06 | % |
| | Series A, 6.375%, 12/15/2017 | | | 6,790 | | | | 176,404 | | | | 0.05 | % |
| | State Street Corp. | | | | | | | | | | | | |
| | Series D, 5.900%, 03/15/2024 | | | 6,350 | | | | 178,118 | | | | 0.05 | % |
| | Series G, 5.300%, 03/15/2026 | | | 6,600 | | | | 176,682 | | | | 0.05 | % |
| | SunTrust Banks, Inc., Series E, 5.875%, 03/15/2018 | | | 13,540 | | | | 351,092 | | | | 0.11 | % |
| | The Allstate Corp., Series E, 6.625%, 04/15/2019 | | | 12,395 | | | | 336,648 | | | | 0.10 | % |
| | The Charles Schwab Corp. | | | | | | | | | | | | |
| | Series C, 6.000%, 12/01/2020 | | | 6,765 | | | | 187,052 | | | | 0.06 | % |
| | Series A, 5.950%, 06/01/2021 | | | 6,910 | | | | 187,054 | | | | 0.06 | % |
| | The Goldman Sachs Group, Inc. | | | | | | | | | | | | |
| | Series D, 4.000%, 11/30/2016 | | | 4,175 | | | | 93,603 | | | | 0.03 | % |
| | Series N, 6.300%, 05/10/2021 | | | 4,300 | | | | 114,638 | | | | 0.03 | % |
| | U.S. Bancorp, Series H, 5.150%, 07/01/2018 (d) | | | 4,465 | | | | 115,733 | | | | 0.03 | % |
| | Validus Holdings, Ltd., Series A, 5.875%, 06/15/2021 (b) | | | 7,935 | | | | 201,152 | | | | 0.06 | % |
| | Wells Fargo & Co. | | | | | | | | | | | | |
| | Series V, 6.000%, 12/15/2020 | | | 6,555 | | | | 170,954 | | | | 0.05 | % |
| | Series X, 5.500%, 09/15/2021 | | | 7,000 | | | | 178,150 | | | | 0.05 | % |
| | | | | | | | | | | | | | |
| | | | | | | | | 7,285,550 | | | | 2.19 | % |
| | | | | | | | | | | | | | |
| | Total Preferred Stocks | | | | | | | | | | | | |
| | (Cost $7,609,118) | | | | | | | 7,606,130 | | | | 2.29 | % |
The accompanying notes are an integral part of these financial statements.
HENNESSYFUNDS.COM
| | REITS – 0.29% | | Par | | | | | | % of | |
| | | | Amount | | | Value | | | Net Assets | |
| | Financials – 0.29% | | | | | | | | | |
| | Apollo Commercial Real Estate Finance, Inc. | | | 28,000 | | | $ | 473,760 | | | | 0.14 | % |
| | Chimera Investment Corp. | | | 19,000 | | | | 297,730 | | | | 0.09 | % |
| | Monmouth Real Estate Investment Corp., Series C, 6.125%, 09/15/2021 (a) | | | 3,300 | | | | 86,559 | | | | 0.02 | % |
| | Public Storage, Series D, 4.950%, 07/20/2021 | | | 4,900 | | | | 120,540 | | | | 0.04 | % |
| | | | | | | | | 978,589 | | | | 0.29 | % |
| | | | | | | | | | | | | | |
| | Total REITS | | | | | | | | | | | | |
| | (Cost $945,318) | | | | | | | 978,589 | | | | 0.29 | % |
| | | | | | | | | | | | | | |
| | CORPORATE BONDS – 26.35% | | | | | | | | | | | | |
| | | | | | | | | | | | | | |
| | Consumer Discretionary – 0.32% | | | | | | | | | | | | |
| | Amazon.com, Inc., 3.300%, 12/05/2021 | | | 1,000,000 | | | | 1,061,038 | | | | 0.32 | % |
| | | | | | | | | | | | | | |
| | Consumer Staples – 1.04% | | | | | | | | | | | | |
| | Anheuser-Busch InBev Worldwide, Inc., 7.750%, 01/15/2019 | | | 150,000 | | | | 169,662 | | | | 0.05 | % |
| | CVS Health Corp. | | | | | | | | | | | | |
| | 1.900%, 07/20/2018 | | | 1,300,000 | | | | 1,310,574 | | | | 0.40 | % |
| | 2.250%, 12/05/2018 | | | 500,000 | | | | 507,143 | | | | 0.15 | % |
| | 4.125%, 05/15/2021 | | | 1,000,000 | | | | 1,083,883 | | | | 0.33 | % |
| | Wal-Mart Stores, Inc., 5.000%, 10/25/2040 | | | 300,000 | | | | 363,230 | | | | 0.11 | % |
| | | | | | | | | 3,434,492 | | | | 1.04 | % |
| | | | | | | | | | | | | | |
| | Energy – 1.38% | | | | | | | | | | | | |
| | Canadian Natural Resources Ltd., 3.900%, 02/01/2025 (b) | | | 1,000,000 | | | | 1,021,755 | | | | 0.31 | % |
| | Chevron Corp., 2.355%, 12/05/2022 | | | 790,000 | | | | 795,946 | | | | 0.24 | % |
| | Encana Corp., 3.900%, 11/15/2021 (b) | | | 1,600,000 | | | | 1,622,880 | | | | 0.49 | % |
| | National Oilwell Varco, Inc., 2.600%, 12/01/2022 | | | 1,200,000 | | | | 1,133,082 | | | | 0.34 | % |
| | | | | | | | | 4,573,663 | | | | 1.38 | % |
| | | | | | | �� | | | | | | | |
| | Financials – 14.33% | | | | | | | | | | | | |
| | American Express Co., 6.150%, 08/28/2017 | | | 1,550,000 | | | | 1,610,903 | | | | 0.49 | % |
| | American International Group, Inc., 4.875%, 06/01/2022 | | | 1,600,000 | | | | 1,789,050 | | | | 0.54 | % |
| | Associates Corporation of North America, 6.950%, 11/01/2018 | | | 300,000 | | | | 329,710 | | | | 0.10 | % |
| | Bank of New York Mellon Corp., 1.969%, 06/20/2017 | | | 500,000 | | | | 502,900 | | | | 0.15 | % |
| | BB&T Corp., 2.300%, 10/15/2018 | | | 1,000,000 | | | | 1,015,589 | | | | 0.31 | % |
| | BlackRock, Inc., 3.500%, 03/18/2024 | | | 1,000,000 | | | | 1,076,802 | | | | 0.32 | % |
| | Boston Properties, Inc., 5.875%, 10/15/2019 | | | 700,000 | | | | 775,651 | | | | 0.23 | % |
| | Capital One Financial Corp., 4.750%, 07/15/2021 | | | 1,500,000 | | | | 1,656,333 | | | | 0.50 | % |
| | Capital One NA, 2.250%, 09/13/2021 | | | 500,000 | | | | 497,780 | | | | 0.15 | % |
The accompanying notes are an integral part of these financial statements.
| HENNESSY FUNDS | 1-800-966-4354 | |
| | CORPORATE BONDS | | Par | | | | | | % of | |
| | | | Amount | | | Value | | | Net Assets | |
| | Financials (Continued) | | | | | | | | | |
| | Comerica, Inc., 2.125%, 05/23/2019 | | | 500,000 | | | $ | 503,627 | | | | 0.15 | % |
| | Diamond 1 Finance Corp. / Diamond 2 | | | | | | | | | | | | |
| | Finance Corp., 5.450%, 06/15/2023 (e) | | | 1,220,000 | | | | 1,308,228 | | | | 0.40 | % |
| | Discover Financial Services, 5.200%, 04/27/2022 | | | 900,000 | | | | 995,744 | | | | 0.30 | % |
| | Fifth Third Bancorp | | | | | | | | | | | | |
| | 1.350%, 06/01/2017 | | | 1,000,000 | | | | 1,001,008 | | | | 0.30 | % |
| | 2.375%, 04/25/2019 | | | 1,775,000 | | | | 1,804,110 | | | | 0.54 | % |
| | First Niagara Financial Group, Inc., 6.750%, 03/19/2020 | | | 590,000 | | | | 677,206 | | | | 0.20 | % |
| | Ford Motor Credit Co. LLC, 3.000%, 06/12/2017 | | | 1,750,000 | | | | 1,767,199 | | | | 0.53 | % |
| | Franklin Resources, Inc., 1.375%, 09/15/2017 | | | 1,080,000 | | | | 1,082,724 | | | | 0.33 | % |
| | General Electric Capital Corp. | | | | | | | | | | | | |
| | 1.625%, 04/02/2018 | | | 500,000 | | | | 502,348 | | | | 0.15 | % |
| | 5.625%, 05/01/2018 | | | 550,000 | | | | 586,523 | | | | 0.18 | % |
| | 6.000%, 08/07/2019 | | | 1,610,000 | | | | 1,808,490 | | | | 0.54 | % |
| | JPMorgan Chase & Co., 6.000%, 01/15/2018 | | | 1,000,000 | | | | 1,052,995 | | | | 0.32 | % |
| | KeyCorp | | | | | | | | | | | | |
| | 2.300%, 12/13/2018 | | | 2,600,000 | | | | 2,634,996 | | | | 0.79 | % |
| | 5.100%, 03/24/2021 | | | 950,000 | | | | 1,065,592 | | | | 0.32 | % |
| | Lazard Group, 6.850%, 06/15/2017 | | | 56,000 | | | | 57,619 | | | | 0.02 | % |
| | Lincoln National Corp., 6.250%, 02/15/2020 | | | 780,000 | | | | 877,633 | | | | 0.26 | % |
| | Merrill Lynch & Company, Inc., 6.875%, 04/25/2018 | | | 955,000 | | | | 1,027,716 | | | | 0.31 | % |
| | MetLife, Inc., Series A, 6.817%, 08/15/2018 | | | 100,000 | | | | 109,221 | | | | 0.03 | % |
| | Morgan Stanley | | | | | | | | | | | | |
| | 5.500%, 07/28/2021 | | | 2,333,000 | | | | 2,651,020 | | | | 0.80 | % |
| | 6.625%, 04/01/2018 | | | 750,000 | | | | 801,041 | | | | 0.24 | % |
| | PNC Financial Services Group, Inc., 1.600%, 06/01/2018 | | | 1,000,000 | | | | 1,002,589 | | | | 0.30 | % |
| | Qwest Capital Funding, Inc., 6.500%, 11/15/2018 | | | 700,000 | | | | 743,750 | | | | 0.22 | % |
| | Raymond James Financial, Inc. | | | | | | | | | | | | |
| | 3.625%, 09/15/2026 | | | 1,500,000 | | | | 1,518,287 | | | | 0.46 | % |
| | 5.625%, 04/01/2024 | | | 700,000 | | | | 798,332 | | | | 0.24 | % |
| | Royal Bank of Canada, 2.200%, 07/27/2018 (b) | | | 1,000,000 | | | | 1,012,824 | | | | 0.31 | % |
| | Schlumberger Investment SA, 3.650%, 12/01/2023 (b) | | | 1,265,000 | | | | 1,354,341 | | | | 0.41 | % |
| | SunTrust Banks, Inc., 6.000%, 09/11/2017 | | | 250,000 | | | | 259,511 | | | | 0.08 | % |
| | Synchrony Financial, 3.750%, 08/15/2021 | | | 1,200,000 | | | | 1,260,386 | | | | 0.38 | % |
| | The Bear Stearns Companies, Inc., 6.400%, 10/02/2017 | | | 1,350,000 | | | | 1,411,223 | | | | 0.43 | % |
| | The Goldman Sachs Group, Inc. | | | | | | | | | | | | |
| | 5.375%, 03/15/2020 | | | 1,100,000 | | | | 1,215,389 | | | | 0.37 | % |
| | 6.000%, 06/15/2020 | | | 1,500,000 | | | | 1,696,045 | | | | 0.51 | % |
| | The Hartford Financial Services Group, Inc., 5.375%, 03/15/2017 | | | 300,000 | | | | 304,242 | | | | 0.09 | % |
The accompanying notes are an integral part of these financial statements.
HENNESSYFUNDS.COM
| | CORPORATE BONDS | | Par | | | | | | % of | |
| | | | Amount | | | Value | | | Net Assets | |
| | Financials (Continued) | | | | | | | | | |
| | Wachovia Corp., 5.750%, 06/15/2017 | | | 850,000 | | | $ | 872,971 | | | | 0.26 | % |
| | Wells Fargo & Co. | | | | | | | | | | | | |
| | 2.550%, 12/07/2020 | | | 1,000,000 | | | | 1,018,049 | | | | 0.31 | % |
| | 5.625%, 12/11/2017 | | | 1,000,000 | | | | 1,046,130 | | | | 0.31 | % |
| | Westpac Banking Corp., 4.875%, 11/19/2019 (b) | | | 450,000 | | | | 489,357 | | | | 0.15 | % |
| | | | | | | | | 47,573,184 | | | | 14.33 | % |
| | | | | | | | | | | | | | |
| | Health Care – 2.95% | | | | | | | | | | | | |
| | Agilent Technologies, Inc., 5.000%, 07/15/2020 | | | 650,000 | | | | 719,084 | | | | 0.22 | % |
| | Amgen, Inc. | | | | | | | | | | | | |
| | 3.450%, 10/01/2020 | | | 1,000,000 | | | | 1,055,487 | | | | 0.32 | % |
| | 3.625%, 05/22/2024 | | | 1,500,000 | | | | 1,579,027 | | | | 0.48 | % |
| | Celgene Corp. | | | | | | | | | | | | |
| | 2.300%, 08/15/2018 | | | 1,000,000 | | | | 1,012,902 | | | | 0.30 | % |
| | 3.625%, 05/15/2024 | | | 1,600,000 | | | | 1,651,378 | | | | 0.50 | % |
| | Express Scripts Holding Co. | | | | | | | | | | | | |
| | 1.250%, 06/02/2017 | | | 500,000 | | | | 500,236 | | | | 0.15 | % |
| | 2.250%, 06/15/2019 | | | 1,250,000 | | | | 1,265,876 | | | | 0.38 | % |
| | 3.500%, 06/15/2024 | | | 700,000 | | | | 723,808 | | | | 0.22 | % |
| | GlaxoSmithKline Capital, Inc., 1.500%, 05/08/2017 (b) | | | 500,000 | | | | 501,314 | | | | 0.15 | % |
| | Zoetis, Inc., 3.250%, 02/01/2023 | | | 750,000 | | | | 767,447 | | | | 0.23 | % |
| | | | | | | | | 9,776,559 | | | | 2.95 | % |
| | | | | | | | | | | | | | |
| | Information Technology – 1.51% | | | | | | | | | | | | |
| | Alphabet, Inc., 1.998%, 08/15/2026 | | | 550,000 | | | | 531,424 | | | | 0.16 | % |
| | Apple, Inc., 4.500%, 02/23/2036 | | | 250,000 | | | | 279,211 | | | | 0.08 | % |
| | Applied Materials, Inc., 4.300%, 06/15/2021 | | | 300,000 | | | | 331,568 | | | | 0.10 | % |
| | Corning, Inc. | | | | | | | | | | | | |
| | 1.500%, 05/08/2018 | | | 390,000 | | | | 389,880 | | | | 0.12 | % |
| | 6.625%, 05/15/2019 | | | 695,000 | | | | 774,493 | | | | 0.23 | % |
| | 6.850%, 03/01/2029 | | | 275,000 | | | | 348,388 | | | | 0.11 | % |
| | eBay, Inc., 3.250%, 10/15/2020 | | | 1,000,000 | | | | 1,036,785 | | | | 0.31 | % |
| | Juniper Networks, Inc., 4.600%, 03/15/2021 | | | 1,000,000 | | | | 1,078,555 | | | | 0.33 | % |
| | Oracle Corp., 2.650%, 07/15/2026 | | | 250,000 | | | | 246,921 | | | | 0.07 | % |
| | | | | | | | | 5,017,225 | | | | 1.51 | % |
| | | | | | | | | | | | | | |
| | Manufacturing – 0.42% | | | | | | | | | | | | |
| | Teva Pharmaceutical Financial Co. BV, 2.950%, 12/18/2022 (b) | | | 1,380,000 | | | | 1,397,401 | | | | 0.42 | % |
The accompanying notes are an integral part of these financial statements.
| HENNESSY FUNDS | 1-800-966-4354 | |
| | CORPORATE BONDS | | Par | | | | | | % of | |
| | | | Amount | | | Value | | | Net Assets | |
| | Materials – 2.09% | | | | | | | | | |
| | Alcoa, Inc., 6.150%, 08/15/2020 | | | 625,000 | | | $ | 684,963 | | | | 0.21 | % |
| | AngloGold Ashanti Holdings PLC, 5.125%, 08/01/2022 (b) | | | 1,000,000 | | | | 1,026,797 | | | | 0.31 | % |
| | Goldcorp, Inc. (b) | | | | | | | | | | | | |
| | 2.125%, 03/15/2018 | | | 1,250,000 | | | | 1,253,191 | | | | 0.38 | % |
| | 3.625%, 06/09/2021 | | | 750,000 | | | | 783,553 | | | | 0.23 | % |
| | Newmont Mining Corp., 3.500%, 03/15/2022 | | | 1,000,000 | | | | 1,058,120 | | | | 0.32 | % |
| | Rio Tinto Finance USA Ltd., 3.750%, 06/15/2025 (b) | | | 1,000,000 | | | | 1,066,962 | | | | 0.32 | % |
| | The Dow Chemical Co., 4.250%, 11/15/2020 | | | 1,000,000 | | | | 1,078,742 | | | | 0.32 | % |
| | | | | | | | | 6,952,328 | | | | 2.09 | % |
| | | | | | | | | | | | | | |
| | Telecommunication Services – 2.31% | | | | | | | | | | | | |
| | AT&T, Inc. | | | | | | | | | | | | |
| | 3.000%, 02/15/2022 | | | 1,000,000 | | | | 1,015,394 | | | | 0.31 | % |
| | 5.350%, 09/01/2040 | | | 200,000 | | | | 210,988 | | | | 0.06 | % |
| | 5.500%, 02/01/2018 | | | 1,600,000 | | | | 1,677,149 | | | | 0.51 | % |
| | 5.800%, 02/15/2019 | | | 800,000 | | | | 869,499 | | | | 0.26 | % |
| | CenturyLink, Inc., 5.150%, 06/15/2017 | | | 400,000 | | | | 407,500 | | | | 0.12 | % |
| | Deutsche Telekom AG, 6.000%, 07/08/2019 (b) | | | 1,160,000 | | | | 1,289,608 | | | | 0.39 | % |
| | Verizon Communications, Inc., 2.450%, 11/01/2022 | | | 1,200,000 | | | | 1,201,663 | | | | 0.36 | % |
| | Vodafone Group PLC, 1.500%, 02/19/2018 (b) | | | 1,000,000 | | | | 998,930 | | | | 0.30 | % |
| | | | | | | | | 7,670,731 | | | | 2.31 | % |
| | | | | | | | | | | | | | |
| | Total Corporate Bonds | | | | | | | | | | | | |
| | (Cost $85,318,970) | | | | | | | 87,456,621 | | | | 26.35 | % |
| | | | | | | | | | | | | | |
| | MORTGAGE BACKED SECURITIES – 4.85% | | | | | | | | | | | | |
| | Federal Home Loan Mortgage Corp. | | | | | | | | | | | | |
| | 1.500%, 10/15/2042 | | | 147,167 | | | | 146,152 | | | | 0.04 | % |
| | 2.000%, 10/15/2043 | | | 149,852 | | | | 149,995 | | | | 0.05 | % |
| | 2.500%, 08/15/2040 | | | 534,900 | | | | 543,007 | | | | 0.16 | % |
| | 2.750%, 01/15/2041 | | | 123,702 | | | | 125,810 | | | | 0.04 | % |
| | 3.000%, 09/15/2039 | | | 478,080 | | | | 490,766 | | | | 0.15 | % |
| | 3.000%, 05/15/2043 | | | 470,668 | | | | 486,999 | | | | 0.15 | % |
| | 3.000%, 05/01/2042 | | | 1,169,004 | | | | 1,207,068 | | | | 0.36 | % |
| | 3.000%, 09/01/2042 | | | 2,224,878 | | | | 2,297,272 | | | | 0.69 | % |
| | 5.000%, 05/01/2020 | | | 49,746 | | | | 52,329 | | | | 0.02 | % |
| | 5.500%, 04/01/2037 | | | 111,162 | | | | 127,533 | | | | 0.04 | % |
| | Federal National Mortgage Association | | | | | | | | | | | | |
| | 1.250%, 06/25/2043 | | | 273,422 | | | | 263,704 | | | | 0.08 | % |
| | 1.500%, 08/10/2021 | | | 1,000,000 | | | | 989,879 | | | | 0.30 | % |
| | 1.500%, 03/30/2026 | | | 1,200,000 | | | | 1,198,138 | | | | 0.36 | % |
| | 1.500%, 04/18/2028 | | | 1,000,000 | | | | 996,616 | | | | 0.30 | % |
| | 2.000%, 11/25/2040 | | | 245,230 | | | | 245,881 | | | | 0.07 | % |
The accompanying notes are an integral part of these financial statements.
HENNESSYFUNDS.COM
| | MORTGAGE BACKED SECURITIES – 4.85% | | Par | | | | | | % of | |
| | | | Amount | | | Value | | | Net Assets | |
| | Federal National Mortgage Association (Continued) | | | | | | | | | |
| | 2.000%, 11/25/2041 | | | 168,270 | | | $ | 169,129 | | | | 0.05 | % |
| | 2.250%, 03/25/2039 | | | 178,393 | | | | 181,379 | | | | 0.06 | % |
| | 3.000%, 10/01/2043 | | | 3,235,047 | | | | 3,337,960 | | | | 1.00 | % |
| | 3.500%, 01/01/2042 | | | 663,287 | | | | 699,368 | | | | 0.21 | % |
| | 4.000%, 10/01/2041 | | | 891,038 | | | | 957,994 | | | | 0.29 | % |
| | 4.000%, 12/01/2041 | | | 765,521 | | | | 822,887 | | | | 0.25 | % |
| | 4.500%, 08/01/2020 | | | 57,259 | | | | 59,450 | | | | 0.02 | % |
| | 6.000%, 10/01/2037 | | | 135,923 | | | | 155,991 | | | | 0.04 | % |
| | Government National Mortgage Association, 1.750%, 02/16/2043 | | | 406,470 | | | | 402,931 | | | | 0.12 | % |
| | | | | | | | | | | | | | |
| | Total Mortgage Backed Securities | | | | | | | | | | | | |
| | (Cost $15,819,471) | | | | | | | 16,108,238 | | | | 4.85 | % |
| | | | | | | | | | | | | | |
| | U.S. TREASURY OBLIGATIONS – 3.98% | | | | | | | | | | | | |
| | | | | | | | | | | | | | |
| | U.S. Treasury Bonds – 1.01% | | | | | | | | | | | | |
| | U.S. Treasury Bonds, 3.625%, 02/15/2044 | | | 2,750,000 | | | | 3,342,914 | | | | 1.00 | % |
| | U.S. Treasury Inflation Index Bond, 0.125%, 07/15/2022 | | | 26,184 | | | | 26,802 | | | | 0.01 | % |
| | | | | | | | | 3,369,716 | | | | 1.01 | % |
| | | | | | | | | | | | | | |
| | U.S. Treasury Notes – 2.97% | | | | | | | | | | | | |
| | U.S. Treasury Notes | | | | | | | | | | | | |
| | 1.625%, 02/15/2026 | | | 4,500,000 | | | | 4,426,259 | | | | 1.33 | % |
| | 2.125%, 05/15/2025 | | | 1,350,000 | | | | 1,388,311 | | | | 0.42 | % |
| | 3.250%, 03/31/2017 | | | 4,000,000 | | | | 4,046,800 | | | | 1.22 | % |
| | | | | | | | | 9,861,370 | | | | 2.97 | % |
| | | | | | | | | | | | | | |
| | Total U.S. Treasury Obligations | | | | | | | | | | | | |
| | (Cost $12,880,510) | | | | | | | 13,231,086 | | | | 3.98 | % |
| | | | | | | | | | | | | | |
| | U.S. GOVERNMENT AGENCY ISSUES – 0.56% | | | | | | | | | | | | |
| | | | | | | | | | | | | | |
| | Finance and Insurance – 0.56% | | | | | | | | | | | | |
| | Federal Home Loan Banks | | | | | | | | | | | | |
| | 1.250%, 10/17/2031 | | | 1,250,000 | | | | 1,231,888 | | | | 0.37 | % |
| | 5.750%, 06/15/2037 | | | 600,000 | | | | 613,607 | | | | 0.19 | % |
| | | | | | | | | | | | | | |
| | Total U.S. Government Agency Issues | | | | | | | | | | | | |
| | (Cost $1,925,418) | | | | | | | 1,845,495 | | | | 0.56 | % |
The accompanying notes are an integral part of these financial statements.
| HENNESSY FUNDS | 1-800-966-4354 | |
| | INVESTMENT COMPANIES (EXCLUDING | | Number | | | | | | % of | |
| | MONEY MARKET FUNDS) – 0.79% | | of Shares | | | Value | | | Net Assets | |
| | | | | | | | | | | | | | |
| | Apollo Investment Corp. | | | 30,000 | | | $ | 177,300 | | | | 0.05 | % |
| | Ares Capital Corp. | | | 16,000 | | | | 244,800 | | | | 0.08 | % |
| | FS Investment Corp. | | | 78,000 | | | | 748,800 | | | | 0.23 | % |
| | Guggenheim Credit Allocation Fund | | | 34,000 | | | | 736,780 | | | | 0.22 | % |
| | OHA Investment Corp. | | | 8,000 | | | | 22,880 | | | | 0.01 | % |
| | SPDR Barclays Capital High Yield Bond | | | 1,000 | | | | 36,260 | | | | 0.01 | % |
| | SPDR Barclays Short Term High Yield | | | 4,000 | | | | 109,920 | | | | 0.03 | % |
| | Vanguard High-Yield Corporate Fund | | | 89,820 | | | | 526,346 | | | | 0.16 | % |
| | | | | | | | | | | | | | |
| | Total Investment Companies (Excluding | | | | | | | | | | | | |
| | Money Market Funds) | | | | | | | | | | | | |
| | (Cost $2,587,215) | | | | | | | 2,603,086 | | | | 0.79 | % |
| | | | | | | | | | | | | | |
| | SHORT-TERM INVESTMENTS – 0.43% | | | | | | | | | | | | |
| | | | | | | | | | | | | | |
| | Money Market Funds – 0.43% | | | | | | | | | | | | |
| | Fidelity Government Portfolio, Institutional Class, 0.27% (c) | | | 1,441,985 | | | | 1,441,985 | | | | 0.43 | % |
| | | | | | | | | | | | | | |
| | Total Short-Term Investments | | | | | | | | | | | | |
| | (Cost $1,441,985) | | | | | | | 1,441,985 | | | | 0.43 | % |
| | | | | | | | | | | | | | |
| | Total Investments | | | | | | | | | | | | |
| | (Cost $312,186,172) – 99.25% | | | | | | | 329,477,656 | | | | 99.25 | % |
| | Other Assets in Excess of Liabilities – 0.75% | | | | | | | 2,479,995 | | | | 0.75 | % |
| | | | | | | | | | | | | | |
| | TOTAL NET ASSETS – 100.00% | | | | | | $ | 331,957,651 | | | | 100.00 | % |
Percentages are stated as a percent of net assets.
REIT – Real Estate Investment Trust
| (a) | Non-income producing security. |
| (b) | U.S. traded security of a foreign corporation. |
| (c) | The rate listed is the fund’s 7-day yield as of October 31, 2016. |
| (d) | Investment in affiliated security. Quasar Distributors, LLC, which serves as the Fund’s distributor, is a subsidiary of U.S. Bancorp. Details of transactions with this affiliated company for the year ended October 31, 2016, are as follows: |
| | Issuer | | U.S. Bancorp | |
| | Beginning Cost | | $ | 269,800 | |
| | Purchase Cost | | $ | 172,068 | |
| | Sales Cost | | $ | (327,061 | ) |
| | Ending Cost | | $ | 114,807 | |
| | Dividend Income | | $ | 13,049 | |
| | Realized Gains | | $ | 21,601 | |
| | Shares | | | 4,465 | |
| | Market Value | | $ | 115,733 | |
The accompanying notes are an integral part of these financial statements.
HENNESSYFUNDS.COM
Summary of Fair Value Exposure at October 31, 2016
The following is a summary of the inputs used to value the Fund’s net assets as of October 31, 2016 (see Note 3 in the accompanying notes to the financial statements):
| Common Stocks | | Level 1 | | | Level 2 | | | Level 3 | | | Total | |
| Consumer Discretionary | | $ | 44,074,371 | | | $ | — | | | $ | — | | | $ | 44,074,371 | |
| Consumer Staples | | | 23,192,502 | | | | — | | | | — | | | | 23,192,502 | |
| Energy | | | 5,205,132 | | | | — | | | | — | | | | 5,205,132 | |
| Financials | | | 46,099,713 | | | | — | | | | — | | | | 46,099,713 | |
| Health Care | | | 12,561,756 | | | | — | | | | — | | | | 12,561,756 | |
| Industrials | | | 31,072,720 | | | | — | | | | — | | | | 31,072,720 | |
| Information Technology | | | 22,819,053 | | | | — | | | | — | | | | 22,819,053 | |
| Materials | | | 9,259,201 | | | | — | | | | — | | | | 9,259,201 | |
| Telecommunication Services | | | 3,921,978 | | | | — | | | | — | | | | 3,921,978 | |
| Total Common Stocks | | $ | 198,206,426 | | | $ | — | | | $ | — | | | $ | 198,206,426 | |
| Preferred Stocks | | | | | | | | | | | | | | | | |
| Consumer Staples | | $ | 320,580 | | | $ | — | | | $ | — | | | $ | 320,580 | |
| Financials | | | 7,285,550 | | | | — | | | | — | | | | 7,285,550 | |
| Total Preferred Stocks | | $ | 7,606,130 | | | $ | — | | | $ | — | | | $ | 7,606,130 | |
| REITS | | | | | | | | | | | | | | | | |
| Financials | | $ | 978,589 | | | $ | — | | | $ | — | | | $ | 978,589 | |
| Total REITS | | $ | 978,589 | | | $ | — | | | $ | — | | | $ | 978,589 | |
| Corporate Bonds | | | | | | | | | | | | | | | | |
| Consumer Discretionary | | $ | — | | | $ | 1,061,038 | | | $ | — | | | $ | 1,061,038 | |
| Consumer Staples | | | — | | | | 3,434,492 | | | | — | | | | 3,434,492 | |
| Energy | | | — | | | | 4,573,663 | | | | — | | | | 4,573,663 | |
| Financials | | | — | | | | 47,573,184 | | | | — | | | | 47,573,184 | |
| Health Care | | | — | | | | 9,776,559 | | | | — | | | | 9,776,559 | |
| Information Technology | | | — | | | | 5,017,225 | | | | — | | | | 5,017,225 | |
| Manufacturing | | | — | | | | 1,397,401 | | | | — | | | | 1,397,401 | |
| Materials | | | — | | | | 6,952,328 | | | | — | | | | 6,952,328 | |
| Telecommunication Services | | | — | | | | 7,670,731 | | | | — | | | | 7,670,731 | |
| Total Corporate Bonds | | $ | — | | | $ | 87,456,621 | | | $ | — | | | $ | 87,456,621 | |
| Mortgage Backed Securities | | $ | — | | | $ | 16,108,238 | | | $ | — | | | $ | 16,108,238 | |
| U.S. Treasury Obligations | | | | | | | | | | | | | | | | |
| U.S. Treasury Bonds | | $ | — | | | $ | 3,369,716 | | | $ | — | | | $ | 3,369,716 | |
| U.S. Treasury Notes | | | — | | | | 9,861,370 | | | | — | | | | 9,861,370 | |
| Total U.S. Treasury Obligations | | $ | — | | | $ | 13,231,086 | | | $ | — | | | $ | 13,231,086 | |
| U.S. Government Agency Issues | | $ | — | | | $ | 1,845,495 | | | $ | — | | | $ | 1,845,495 | |
| Investment Companies (Excluding | | | | | | | | | | | | | | | | |
| Money Market Funds) | | $ | 2,603,086 | | | $ | — | | | $ | — | | | $ | 2,603,086 | |
| Short-Term Investments | | | | | | | | | | | | | | | | |
| Money Market Funds | | $ | 1,441,985 | | | $ | — | | | $ | — | | | $ | 1,441,985 | |
| Total Short-Term Investments | | $ | 1,441,985 | | | $ | — | | | $ | — | | | $ | 1,441,985 | |
| Total Investments | | $ | 210,836,216 | | | $ | 118,641,440 | | | $ | — | | | $ | 329,477,656 | |
Transfers between levels are recognized at the end of the reporting period. During the year ended October 31, 2016, the Fund recognized no transfers between levels.
The accompanying notes are an integral part of these financial statements.
| HENNESSY FUNDS | 1-800-966-4354 | |
Financial Statements
Statement of Assets and Liabilities as of October 31, 2016 |
| ASSETS: | | | |
| Investments in securities, at value (cost $312,071,365) | | $ | 329,361,923 | |
| Investments in affiliated securities, at value (cost $114,807) | | | 115,733 | |
| Total Investments in securities, at value (cost $312,186,172) | | | 329,477,656 | |
| Cash | | | 1,211 | |
| Dividends and interest receivable | | | 1,247,161 | |
| Receivable for fund shares sold | | | 70,511 | |
| Receivable for securities sold | | | 2,271,106 | |
| Prepaid expenses and other assets | | | 28,295 | |
| Total Assets | | | 333,095,940 | |
| | | | | |
| LIABILITIES: | | | | |
| Payable for fund shares redeemed | | | 430,835 | |
| Payable to advisor | | | 232,075 | |
| Payable to administrator | | | 60,016 | |
| Payable to auditor | | | 20,698 | |
| Accrued distribution fees | | | 34,812 | |
| Accrued service fees | | | 17,643 | |
| Loan Payable | | | 258,000 | |
| Accrued interest payable | | | 237 | |
| Accrued trustees fees | | | 3,901 | |
| Accrued expenses and other payables | | | 80,072 | |
| Total Liabilities | | | 1,138,289 | |
| NET ASSETS | | $ | 331,957,651 | |
| | | | | |
| NET ASSETS CONSIST OF: | | | | |
| Capital stock | | $ | 288,045,574 | |
| Accumulated net investment income | | | 129,004 | |
| Accumulated net realized gain on investments | | | 26,491,589 | |
| Unrealized net appreciation on investments | | | 17,291,484 | |
| Total Net Assets | | $ | 331,957,651 | |
| | | | | |
| NET ASSETS | | | | |
| Investor Class: | | | | |
| Shares authorized (no par value) | | Unlimited | |
| Net assets applicable to outstanding Investor Class shares | | $ | 202,043,410 | |
| Shares issued and outstanding | | | 12,942,600 | |
| Net asset value, offering price and redemption price per share | | $ | 15.61 | |
| | | | | |
| Institutional Class: | | | | |
| Shares authorized (no par value) | | Unlimited | |
| Net assets applicable to outstanding Institutional Class shares | | $ | 129,914,241 | |
| Shares issued and outstanding | | | 8,802,224 | |
| Net asset value, offering price and redemption price per share | | $ | 14.76 | |
The accompanying notes are an integral part of these financial statements.
HENNESSYFUNDS.COM
| STATEMENT OF ASSETS AND LIABILITIES/STATEMENT OF OPERATIONS |
Financial Statements
Statement of Operations for the year ended October 31, 2016 |
| INVESTMENT INCOME: | | | |
| Dividend income | | $ | 5,476,967 | |
| Dividend income from affiliated securities | | | 13,049 | |
| Interest income | | | 3,498,634 | |
| Total investment income | | | 8,988,650 | |
| | | | | |
| EXPENSES: | | | | |
| Investment advisory fees (See Note 5) | | | 3,171,157 | |
| Sub-transfer agent expenses – Investor Class (See Note 5) | | | 577,083 | |
| Sub-transfer agent expenses – Institutional Class (See Note 5) | | | 131,012 | |
| Administration, fund accounting, custody and transfer agent fees (See Note 5) | | | 386,741 | |
| Distribution fees – Investor Class (See Note 5) | | | 370,133 | |
| Service fees – Investor Class (See Note 5) | | | 246,755 | |
| Federal and state registration fees | | | 43,947 | |
| Reports to shareholders | | | 36,202 | |
| Compliance expense (See Note 5) | | | 23,709 | |
| Audit fees | | | 20,699 | |
| Trustees’ fees and expenses | | | 16,581 | |
| Interest expense (See Note 7) | | | 6,447 | |
| Legal fees | | | 5,017 | |
| Other expenses | | | 38,363 | |
| Total expenses | | | 5,073,846 | |
| NET INVESTMENT INCOME | | $ | 3,914,804 | |
| | | | | |
| REALIZED AND UNREALIZED GAINS (LOSSES): | | | | |
| Net realized gain on: | | | | |
| Unaffiliated investments | | $ | 26,622,366 | |
| Affiliated investments | | | 21,601 | |
| Net change in unrealized appreciation on investments | | | (30,923,043 | ) |
| Net loss on investments | | | (4,279,076 | ) |
| NET DECREASE IN NET ASSETS RESULTING FROM OPERATIONS | | $ | (364,272 | ) |
The accompanying notes are an integral part of these financial statements.
| HENNESSY FUNDS | 1-800-966-4354 | |
(This Page Intentionally Left Blank.)
HENNESSYFUNDS.COM
| STATEMENTS OF CHANGES IN NET ASSETS |
Financial Statements
| Statements of Changes in Net Assets |
| | | Year Ended | | | Year Ended | |
| | | October 31, 2016 | | | October 31, 2015 | |
| OPERATIONS: | | | | | | |
| Net investment income | | $ | 3,914,804 | | | $ | 4,479,495 | |
| Net realized gain on investments | | | 26,643,967 | | | | 10,940,484 | |
| Net change in unrealized appreciation on investments | | | (30,923,043 | ) | | | (11,492,039 | ) |
| Net increase (decrease) in net assets | | | | | | | | |
| resulting from operations | | | (364,272 | ) | | | 3,927,940 | |
| | | | | | | | | |
| DISTRIBUTIONS TO SHAREHOLDERS FROM: | | | | | | | | |
| Net investment income – Investor Class | | | (2,087,209 | ) | | | (2,652,418 | ) |
| Net investment income – Institutional Class | | | (1,972,744 | ) | | | (1,838,359 | ) |
| Net realized gains – Investor Class | | | (6,952,737 | ) | | | (11,372,184 | ) |
| Net realized gains – Institutional Class | | | (3,988,610 | ) | | | (4,128,029 | ) |
| Total distributions | | | (15,001,300 | ) | | | (19,990,990 | ) |
| | | | | | | | | |
| CAPITAL SHARE TRANSACTIONS: | | | | | | | | |
| Proceeds from shares subscribed – Investor Class | | | 30,705,146 | | | | 135,379,984 | |
| Proceeds from shares subscribed – Institutional Class | | | 27,173,057 | | | | 108,112,772 | |
| Dividends reinvested – Investor Class | | | 8,885,747 | | | | 13,787,702 | |
| Dividends reinvested – Institutional Class | | | 4,372,535 | | | | 4,360,249 | |
| Cost of shares redeemed – Investor Class | | | (120,741,346 | ) | | | (129,944,959 | ) |
| Cost of shares redeemed – Institutional Class | | | (64,754,302 | ) | | | (40,503,901 | ) |
| Net increase (decrease) in net assets derived | | | | | | | | |
| from capital share transactions | | | (114,359,163 | ) | | | 91,191,847 | |
| TOTAL INCREASE (DECREASE) IN NET ASSETS | | | (129,724,735 | ) | | | 75,128,797 | |
| | | | | | | | | |
| NET ASSETS: | | | | | | | | |
| Beginning of year | | | 461,682,386 | | | | 386,553,589 | |
| End of year | | $ | 331,957,651 | | | $ | 461,682,386 | |
| Undistributed net investment income, end of year | | $ | 129,004 | | | $ | 243,451 | |
| | | | | | | | | |
| CHANGES IN SHARES OUTSTANDING: | | | | | | | | |
| Shares sold – Investor Class | | | 1,962,156 | | | | 8,189,500 | |
| Shares sold – Institutional Class | | | 1,843,177 | | | | 6,931,570 | |
| Shares issued to holders as reinvestment | | | | | | | | |
| of dividends – Investor Class | | | 567,440 | | | | 839,879 | |
| Shares issued to holders as reinvestment | | | | | | | | |
| of dividends – Institutional Class | | | 294,768 | | | | 281,456 | |
| Shares redeemed – Investor Class | | | (7,724,036 | ) | | | (7,942,623 | ) |
| Shares redeemed – Institutional Class | | | (4,386,391 | ) | | | (2,624,280 | ) |
| Net increase (decrease) in shares outstanding | | | (7,442,886 | ) | | | 5,675,502 | |
The accompanying notes are an integral part of these financial statements.
| HENNESSY FUNDS | 1-800-966-4354 | |
Financial Statements
For an Investor Class share outstanding throughout each year
PER SHARE DATA:
Net asset value, beginning of year
Income from investment operations:
Net investment income
Net realized and unrealized gains (losses) on investments
Total from investment operations
Less distributions:
Dividends from net investment income
Dividends from net realized gains
Total distributions
Net asset value, end of year
TOTAL RETURN
SUPPLEMENTAL DATA AND RATIOS:
Net assets, end of year (millions)
Ratio of expenses to average net assets:
Before expense reimbursement
After expense reimbursement
Ratio of net investment income to average net assets:
Before expense reimbursement
After expense reimbursement
Portfolio turnover rate(1)
(1) | Portfolio turnover is calculated on the basis of the Fund as a whole. |
The accompanying notes are an integral part of these financial statements.
HENNESSYFUNDS.COM
| FINANCIAL HIGHLIGHTS — INVESTOR CLASS |
| Year Ended October 31, | |
| 2016 | | | 2015 | | | 2014 | | | 2013 | | | 2012 | |
| | | | | | | | | | | | | | |
| $ | 16.15 | | | $ | 16.68 | | | $ | 15.77 | | | $ | 13.96 | | | $ | 12.99 | |
| | | | | | | | | | | | | | | | | | | |
| | | | | | | | | | | | | | | | | | | |
| | 0.14 | | | | 0.13 | | | | 0.16 | | | | 0.23 | | | | 0.18 | |
| | (0.16 | ) | | | 0.11 | | | | 1.41 | | | | 1.81 | | | | 0.99 | |
| | (0.02 | ) | | | 0.24 | | | | 1.57 | | | | 2.04 | | | | 1.17 | |
| | | | | | | | | | | | | | | | | | | |
| | | | | | | | | | | | | | | | | | | |
| | (0.13 | ) | | | (0.13 | ) | | | (0.16 | ) | | | (0.23 | ) | | | (0.20 | ) |
| | (0.39 | ) | | | (0.64 | ) | | | (0.50 | ) | | | — | | | | — | |
| | (0.52 | ) | | | (0.77 | ) | | | (0.66 | ) | | | (0.23 | ) | | | (0.20 | ) |
| $ | 15.61 | | | $ | 16.15 | | | $ | 16.68 | | | $ | 15.77 | | | $ | 13.96 | |
| | | | | | | | | | | | | | | | | | | |
| | (0.12 | )% | | | 1.43 | % | | | 10.28 | % | | | 14.72 | % | | | 9.01 | % |
| | | | | | | | | | | | | | | | | | | |
| | | | | | | | | | | | | | | | | | | |
| $ | 202.04 | | | $ | 292.84 | | | $ | 284.45 | | | $ | 233.25 | | | $ | 196.92 | |
| | | | | | | | | | | | | | | | | | | |
| | 1.43 | % | | | 1.38 | % | | | 1.33 | % | | | 1.36 | % | | | 1.33 | % |
| | 1.43 | % | | | 1.38 | % | | | 1.33 | % | | | 1.33 | % | | | 1.24 | % |
| | | | | | | | | | | | | | | | | | | |
| | 0.84 | % | | | 0.83 | % | | | 1.01 | % | | | 1.51 | % | | | 1.37 | % |
| | 0.84 | % | | | 0.83 | % | | | 1.01 | % | | | 1.54 | % | | | 1.46 | % |
| | 24 | % | | | 39 | % | | | 28 | % | | | 52 | % | | | 34 | % |
The accompanying notes are an integral part of these financial statements.
| HENNESSY FUNDS | 1-800-966-4354 | |
Financial Statements
For an Institutional Class share outstanding throughout each year
PER SHARE DATA:
Net asset value, beginning of year
Income from investment operations:
Net investment income
Net realized and unrealized gains (losses) on investments
Total from investment operations
Less distributions:
Dividends from net investment income
Dividends from net realized gains
Total distributions
Net asset value, end of year
TOTAL RETURN
SUPPLEMENTAL DATA AND RATIOS:
Net assets, end of year (millions)
Ratio of expenses to average net assets:
Before expense reimbursement
After expense reimbursement
Ratio of net investment income to average net assets:
Before expense reimbursement
After expense reimbursement
Portfolio turnover rate(1)
(1) | Portfolio turnover is calculated on the basis of the Fund as a whole. |
The accompanying notes are an integral part of these financial statements.
HENNESSYFUNDS.COM
| FINANCIAL HIGHLIGHTS — INSTITUTIONAL CLASS |
| Year Ended October 31, | |
| 2016 | | | 2015 | | | 2014 | | | 2013 | | | 2012 | |
| | | | | | | | | | | | | | |
| $ | 15.28 | | | $ | 15.80 | | | $ | 14.97 | | | $ | 13.29 | | | $ | 12.38 | |
| | | | | | | | | | | | | | | | | | | |
| | | | | | | | | | | | | | | | | | | |
| | 0.18 | | | | 0.19 | | | | 0.20 | | | | 0.25 | | | | 0.22 | |
| | (0.13 | ) | | | 0.09 | | | | 1.33 | | | | 1.72 | | | | 0.92 | |
| | 0.05 | | | | 0.28 | | | | 1.53 | | | | 1.97 | | | | 1.14 | |
| | | | | | | | | | | | | | | | | | | |
| | | | | | | | | | | | | | | | | | | |
| | (0.20 | ) | | | (0.19 | ) | | | (0.20 | ) | | | (0.29 | ) | | | (0.23 | ) |
| | (0.37 | ) | | | (0.61 | ) | | | (0.50 | ) | | | — | | | | — | |
| | (0.57 | ) | | | (0.80 | ) | | | (0.70 | ) | | | (0.29 | ) | | | (0.23 | ) |
| $ | 14.76 | | | $ | 15.28 | | | $ | 15.80 | | | $ | 14.97 | | | $ | 13.29 | |
| | | | | | | | | | | | | | | | | | | |
| | 0.30 | % | | | 1.75 | % | | | 10.60 | % | | | 14.99 | % | | | 9.23 | % |
| | | | | | | | | | | | | | | | | | | |
| | | | | | | | | | | | | | | | | | | |
| $ | 129.91 | | | $ | 168.84 | | | $ | 102.10 | | | $ | 85.12 | | | $ | 108.49 | |
| | | | | | | | | | | | | | | | | | | |
| | 1.03 | % | | | 1.04 | % | | | 1.05 | % | | | 1.06 | % | | | 1.06 | % |
| | 1.03 | % | | | 1.04 | % | | | 1.05 | % | | | 1.06 | % | | | 0.99 | % |
| | | | | | | | | | | | | | | | | | | |
| | 1.23 | % | | | 1.18 | % | | | 1.29 | % | | | 1.95 | % | | | 1.68 | % |
| | 1.23 | % | | | 1.18 | % | | | 1.29 | % | | | 1.95 | % | | | 1.75 | % |
| | 24 | % | | | 39 | % | | | 28 | % | | | 52 | % | | | 34 | % |
The accompanying notes are an integral part of these financial statements.
| HENNESSY FUNDS | 1-800-966-4354 | |
Financial Statements
Notes to the Financial Statements October 31, 2016 |
1). ORGANIZATION
The Hennessy Equity and Income Fund (the “Fund”) is a series of Hennessy Funds Trust (the “Trust”), which was organized as a Delaware statutory trust on September 17, 1992. The Fund is an open-end management investment company registered under the Investment Company Act of 1940, as amended. The Fund is a successor to the FBR Balanced Fund (the “Predecessor FBR Fund”), a series of The FBR Funds, a Delaware statutory trust, pursuant to a reorganization that took place after the close of business on October 26, 2012. Prior to October 26, 2012, the Fund had no investment operations. As a result of the reorganization, holders of Investor Class shares of the Predecessor FBR Fund received Investor Class shares of the Fund (the Investor Class shares of the Fund are the successor to the accounting and performance information of the corresponding shares of the Predecessor FBR Fund), and holders of Institutional Class shares of the Predecessor FBR Fund received Institutional Class shares of the Fund (the Institutional Class shares of the Fund are the successor to the accounting and performance information of the corresponding shares of the Predecessor FBR Fund). The investment objective of the Fund is long-term capital growth and current income. The Fund is a diversified fund.
The Fund offers Investor Class and Institutional Class shares. Each class of shares differs principally in its respective administration, 12b-1 distribution and service, shareholder servicing, and transfer agent expenses (there are no sales charges). Each class has identical rights to earnings, assets, and voting privileges, except for class-specific expenses and exclusive rights to vote on matters affecting only an individual class.
As an investment company, the Fund follows the investment company accounting and reporting guidance of the Financial Accounting Standards Board (“FASB”) Accounting Standard Codification Topic 946 “Financial Services—Investment Companies.”
2). SIGNIFICANT ACCOUNTING POLICIES
The following is a summary of significant accounting policies consistently followed by the Fund in the preparation of the financial statements. These policies conform with U.S. generally accepted accounting principles (“GAAP”).
| a). | Investment Valuation – All investments in securities are recorded at their estimated fair value, as described in Note 3. |
| | |
| b). | Federal Income Taxes – No provision for federal income taxes or excise taxes has been made since the Fund has elected to be taxed as a “regulated investment company” and intends to distribute substantially all of its taxable income to its shareholders and otherwise comply with the provisions of the Internal Revenue Code of 1986, as amended, applicable to regulated investment companies. Net investment income or loss and realized gains and losses for federal income tax purposes may differ from that reported on the financial statements because of temporary book and tax basis differences. Temporary differences are primarily the result of the treatment of wash sales for tax reporting purposes. The Fund recognizes interest and penalties related to income tax benefits, if any, in the statement of operations as an income tax expense. Distributions from net realized gains for book purposes may include short-term capital gains, which are included as ordinary income to shareholders for tax purposes. |
HENNESSYFUNDS.COM
| NOTES TO THE FINANCIAL STATEMENTS |
| | Due to inherent differences in the recognition of income, expenses, and realized gains/losses under GAAP and federal income tax regulations, permanent differences between book and tax basis for reporting for the fiscal year ended October 31, 2016, have been identified and appropriately reclassified on the Statement of Assets and Liabilities. The adjustments are as follows: |
| | Undistributed | Accumulated | | |
| | Net Investment | Net Realized | | |
| | Income/(Loss) | Gain/(Loss) | Paid-in Capital | |
| | $30,702 | $(30,702) | $— | |
| c). | Accounting for Uncertainty in Income Taxes – The Fund has accounting policies regarding recognition and measurement of tax positions taken or expected to be taken on a tax return. The tax returns of the Fund for the prior three fiscal years are open for examination. The Fund has reviewed all open tax years in major jurisdictions and concluded that there is no impact on the Fund’s net assets and no tax liability resulting from unrecognized tax benefits relating to uncertain income tax positions taken or expected to be taken on a tax return. The Fund’s major tax jurisdictions are U.S. federal and Delaware. |
| | |
| d). | Income and Expenses – Dividend income is recognized on the ex-dividend date or as soon as information is available to the Fund. Interest income, which includes the amortization of premium and accretion of discount, is recognized on an accrual basis. The Fund is charged for those expenses that are directly attributable to the portfolio, such as advisory, administration, and certain shareholder service fees. Income, expenses (other than expenses attributable to a specific class), and realized and unrealized gains or losses on investments are allocated to each class of shares based on its respective net assets. |
| | |
| e). | Distributions to Shareholders – Dividends from net investment income for the Fund, if any, are declared and paid on a calendar quarter basis. Distributions of net realized capital gains, if any, are declared and paid annually, usually in December. |
| | |
| f). | Security Transactions – Investment and shareholder transactions are recorded on the trade date. The Fund determines the gain or loss realized from the investment transactions by comparing the original cost of the security lot sold with the net sale proceeds. Discounts and premiums on securities purchased are accreted/amortized over the life of the respective security. |
| | |
| g). | Use of Estimates – The preparation of financial statements in conformity with GAAP requires management to make estimates and assumptions that affect the reported amounts of assets and liabilities and disclosure of contingent assets and liabilities at the date of the financial statements and the reported change in net assets during the reporting period. Actual results could differ from those estimates. |
| | |
| h). | Share Valuation – The net asset value (“NAV”) per share of the Fund is calculated by dividing the sum of the value of the securities held by the Fund, plus cash or other assets, minus all liabilities (including estimated accrued expenses) by the total number of shares outstanding for the Fund, rounded to the nearest cent. The Fund’s shares will not be priced on days the New York Stock Exchange is closed for trading. The offering and redemption price per share for the Fund is equal to the Fund’s NAV per share. |
| | |
| i). | Foreign Currency – Values of investments denominated in foreign currencies, if any, are converted into U.S. dollars using the spot market rate of exchange at the time of valuation. Purchases and sales of investments and income are translated into U.S. dollars using the spot market rate of exchange prevailing on the respective dates of |
| HENNESSY FUNDS | 1-800-966-4354 | |
| | such transactions. The Fund does not isolate the portion of the results of operations resulting from fluctuations in foreign exchange rates on investments from fluctuations resulting from changes in the market prices of securities held. Such fluctuations are included with the net realized and unrealized gain or loss on investments. Foreign investments present additional risks due to currency fluctuations, economic and political factors, lower liquidity, government regulations, differences in accounting standards, and other factors. |
| | |
| j). | Forward Contracts – The Fund may enter into forward currency contracts to reduce its exposure to changes in foreign currency exchange rates on its foreign holdings and to lock in the U.S. dollar cost of firm purchase and sale commitments for securities denominated in foreign currencies. A forward currency contract is a commitment to purchase or sell a foreign currency at a future date at a negotiated forward rate. The gain or loss arising from the difference between the U.S. dollar cost of the original contract and the value of the foreign currency in U.S. dollars upon closing of such contract is included in net realized gain or loss from foreign currency transactions. During the fiscal year ended October 31, 2016, the Fund did not enter into any forward contracts. |
| | |
| k). | Repurchase Agreements – The Fund may enter into repurchase agreements with member banks or security dealers of the Federal Reserve Board whom the investment advisor deems creditworthy. The repurchase price generally equals the price paid by the Fund plus interest negotiated on the basis of current short-term rates. |
| | |
| | Securities pledged as collateral for repurchase agreements are held by the custodian bank until the respective agreements mature. Provisions of the repurchase agreements ensure that the market value of the collateral, including accrued interest thereon, is sufficient to cover the repurchase amount in the event of default of the counterparty. If the counterpartys defaults and the value of the collateral declines or if the counterparty enters an insolvency proceeding, realization of the collateral by the Fund may be delayed or limited. During the fiscal year ended October 31, 2016, the Fund did not enter into any repurchase agreements. |
| | |
| l). | Derivatives – The Fund may invest in, or enter into, derivatives, such as options, futures contracts, options on futures contracts, and swaps, for a variety of reasons, including to hedge certain risks, to provide a substitute for purchasing or selling particular securities, or to increase potential income gain. Derivatives are financial contracts based on an underlying or notional amount, require no initial investment or an initial net investment that is smaller than would normally be required to have a similar response to changes in market factors, and require or permit net settlement. Derivatives may allow the Fund to increase or decrease the level of risk to which the Fund is exposed more quickly and efficiently than transactions in other types of instruments. The main purpose of utilizing derivative instruments is for hedging purposes. |
| | |
| | The Fund follows the financial accounting reporting rules as required by the Derivatives and Hedging Topic of the FASB Accounting Standards Codification. Under such rules, the Fund is required to include enhanced disclosure that enables investors to understand how and why an entity uses derivatives, how derivatives are accounted for, and how derivatives instruments affect an entity’s results of operations and financial position. During the fiscal year ended October 31, 2016, the Fund did not hold any derivative instruments. |
| | |
| m). | New Accounting Pronouncements – In May 2015, the FASB issued ASU No. 2015-07 “Disclosure for Investments in Certain Entities that Calculate Net Asset Value per Share (or Its Equivalent).” The amendments in ASU No. 2015-07 remove the |
HENNESSYFUNDS.COM
| NOTES TO THE FINANCIAL STATEMENTS |
| | requirement to categorize within the fair value hierarchy investments measured at NAV and require the disclosure of sufficient information to reconcile the fair value of the remaining assets categorized within the fair value hierarchy to the financial statements. The amendments in ASU No. 2015-07 are effective for fiscal years beginning after December 15, 2015, and interim periods within those fiscal years. Management has reviewed the requirements and believes the adoption of ASU 2015-07 will not have a material impact on the Fund’s financial statements and related disclosures. |
3). SECURITIES VALUATION
The Fund follows authoritative fair valuation accounting standards that establish an authoritative definition of fair value and set out a hierarchy for measuring fair value. These standards require additional disclosures about the various inputs and valuation techniques used to develop the measurements of fair value and a discussion in changes in valuation techniques and related inputs during the period. These inputs are summarized in the three broad levels listed below:
| | Level 1 – | Unadjusted, quoted prices in active markets for identical instruments that the Fund has the ability to access at the date of measurement. |
| | | |
| | Level 2 – | Other significant observable inputs (including, but not limited to, quoted prices in active markets for similar instruments, quoted prices in markets that are not active for identical or similar instruments, and model-derived valuations in which all significant inputs and significant value drivers are observable in active markets (such as interest rates, prepayment speeds, credit risk curves, default rates, and similar data)). |
| | | |
| | Level 3 – | Significant unobservable inputs (including the Fund’s own assumptions about what market participants would use to price the asset or liability based on the best available information) when observable inputs are unavailable. |
Following is a description of the valuation techniques applied to the Fund’s major categories of assets and liabilities measured at fair value on a recurring basis.
Equity Securities – Equity securities, including common stocks, preferred stocks, foreign-issued common stocks, exchange-traded funds, closed-end mutual funds, partnerships, rights, and real estate investment trusts, that are traded on a securities exchange for which a last-quoted sales price is readily available will generally be valued at the last sales price as reported by the primary exchange on which the securities are listed. Securities listed on The NASDAQ Stock Market (“NASDAQ”) will generally be valued at the NASDAQ Official Closing Price, which may differ from the last sales price reported. Securities traded on a securities exchange for which a last-quoted sales price is not readily available will generally be valued at the mean between the bid and ask prices. To the extent these securities are actively traded and valuation adjustments are not applied, they are classified in Level 1 of the fair value hierarchy. Securities traded on foreign exchanges generally are not valued at the same time the Fund calculates its NAV because most foreign markets close well before such time. The earlier close of most foreign markets gives rise to the possibility that significant events, including broad market moves, may have occurred in the interim. In certain circumstances, it may be determined that a security needs to be fair valued because it appears that the value of the security might have been materially affected by events occurring after the close of the market in which the security is principally traded, but before the time the Fund calculates its NAV, such as by a development that affects an entire market or region (e.g., weather-related events) or a potentially global development (e.g., a terrorist attack that may be expected to have an effect on investor expectations worldwide).
| HENNESSY FUNDS | 1-800-966-4354 | |
Registered Investment Companies – Investments in registered investment companies (e.g., mutual funds) are generally priced at the ending NAV provided by the applicable registered investment company’s service agent and will be classified in Level 1 of the fair value hierarchy.
Debt Securities – Debt securities, including corporate bonds, asset-backed securities, mortgage-backed securities, municipal bonds, U.S. Treasuries, and U.S. government agency issues, are generally valued at market on the basis of valuations furnished by an independent pricing service that utilizes both dealer-supplied valuations and formula-based techniques. The pricing service may consider recently executed transactions in securities of the issuer or comparable issuers, market price quotations (where observable), bond spreads, and fundamental data relating to the issuer. In addition, the model may incorporate observable market data, such as reported sales of similar securities, broker quotes, yields, bids, offers, and reference data. Certain securities are valued primarily using dealer quotations. These securities are generally classified in Level 2 of the fair value hierarchy.
Short-Term Securities – Short-term equity investments, including money market funds, are valued in the manner specified above. Short-term debt investments with an original term to maturity of 60 days or less are valued at amortized cost, which approximates fair market value. If the original term to maturity of a short-term debt investment exceeded 60 days, then the values as of the 61st day prior to maturity are amortized. Amortized cost is not used if its use would be inappropriate due to credit or other impairments of the issuer, in which case the security’s fair value would be determined, as described below. Short-term securities are generally classified in Level 1 or Level 2 of the fair market hierarchy depending on the inputs used and market activity levels for specific securities.
The Board of Trustees of the Fund (the “Board”) has adopted fair value pricing procedures that are followed when a price for a security is not readily available or if a significant event has occurred that indicates the closing price of a security no longer represents the true value of that security. Fair value pricing determinations are made in good faith in accordance with these procedures. There are numerous criteria that will be given consideration in determining a fair value of a security, such as the trading volume of a security and markets, the value of other like securities, and news events with direct bearing to a security or markets. Fair value pricing results in an estimated price for a security that reflects the amount the Fund might reasonably expect to receive in a current sale. Depending on the relative significance of the valuation inputs, these securities may be classified in either Level 2 or Level 3 of the fair value hierarchy.
The fair valuation of foreign securities may be determined with the assistance of a pricing service using correlations between the movement of prices of such securities and indices of domestic securities and other appropriate indicators, such as closing market prices of relevant American Depositary Receipts or futures contracts. The effect of using fair value pricing is that the Fund’s NAV will reflect the affected portfolio securities’ value as determined by the Board or its designee instead of being determined by the market. Using a fair value pricing methodology to price foreign securities may result in a value that is different from a foreign security’s most recent closing price and from the prices used by other investment companies to calculate their NAVs and are generally considered Level 2 prices in the fair valuation hierarchy. Because the Fund may invest in foreign securities, the value of the Fund’s portfolio securities may change on days when you will not be able to purchase or redeem your shares.
The Board has delegated day-to-day valuation matters to a Valuation Committee comprised of one or more representatives from Hennessy Advisors, Inc., the Fund’s investment advisor. The function of the Valuation Committee is to value securities where
HENNESSYFUNDS.COM
| NOTES TO THE FINANCIAL STATEMENTS |
current and reliable market quotations are not readily available. All actions taken by the Valuation Committee are reviewed by the Board.
The Fund has performed an analysis of all existing investments to determine the significance and character of all inputs to their fair value determination. Various inputs are used in determining the value of the Fund’s investments. The inputs or methodology used for valuing securities are not necessarily an indication of the risk associated with investing in those securities. Details related to the fair valuation hierarchy of the Fund’s securities as of October 31, 2016, are included in the Fund’s Schedule of Investments.
4). INVESTMENT TRANSACTIONS
Purchases and sales of investment securities (excluding government and short-term investments) for the Fund during the fiscal year ended October 31, 2016, were $77,676,758 and $172,399,183, respectively.
Purchases and sales/maturities of long-term U.S. government securities for the Fund during the fiscal year ended October 31, 2016, were $17,344,648 and $44,614,515, respectively.
The Fund is permitted to purchase or sell securities from or to another fund in the Hennessy Funds family of funds (the “Hennessy Funds”) under specified conditions outlined in procedures adopted by the Board of Trustees. The procedures have been designed to ensure that any purchase or sale of securities by the Fund from or to another Hennessy Fund complies with Rule 17a-7 of the Investment Company Act of 1940. For the fiscal year ended October 31, 2016, the Fund did not engage in purchases and sales of securities pursuant to Rule 17a-7 of the Investment Company Act of 1940.
5). INVESTMENT MANAGEMENT FEE AND OTHER TRANSACTIONS WITH AFFILIATES
Hennessy Advisors, Inc. (the “Advisor”) is the investment advisor of the Fund. The Advisor provides the Fund with investment management services under an Investment Advisory Agreement. The Advisor furnishes all investment advice, office space, facilities, and provides most of the personnel needed by the Fund. As compensation for its services, the Advisor is entitled to a monthly fee from the Fund. The fee is based upon the average daily net assets of the Fund at the annual rate of 0.80%. The net investment advisory fees payable by the Fund as of October 31, 2016, were $232,075.
The Advisor has delegated the day-to-day management of the equity allocation of the Fund to The London Company of Virginia, LLC, and has delegated the day-to-day management of the fixed income allocation of the Fund to Financial Counselors, Inc. The Advisor pays the sub-advisor fees from its own assets and these fees are not an additional expense of the Fund. For the most recent fiscal year, the Advisor (not the Fund) paid a sub-advisory fee, based upon the daily net assets of the Fund, at the rate of 0.33% for the equity allocation and 0.27% for the fixed income allocation.
The Board has approved a Shareholder Servicing Agreement for Investor Class shares of the Fund, effective as of March 1, 2015, which was instituted to compensate the Advisor for the non-investment management services it provides to the Fund. The Shareholder Servicing Agreement provides for a monthly fee paid to the Advisor at an annual rate of 0.10% of the average daily net assets of the Fund attributable to Investor Class shares. Shareholder service fees payable by the Fund as of October 31, 2016, were $17,643.
The Fund has adopted a plan pursuant to Rule 12b-1 under the Investment Company Act of 1940, as amended, that authorizes payments in connection with the distribution of the Fund’s shares at an annual rate of up to 0.25% of the Fund’s average daily net assets attributable to Investor Class shares. Even though the authorized rate is up to 0.25%, the Fund has only used up to 0.15% of its average daily net assets
| HENNESSY FUNDS | 1-800-966-4354 | |
attributable to Investor Class shares for such purpose since March 1, 2015. Amounts paid under the plan may be spent on any activities or expenses primarily intended to result in the sale of shares, including, but not limited to, advertising, shareholder account servicing, the printing and mailing of prospectuses to other than current shareholders, the printing and mailing of sales literature, and compensation for sales and marketing activities or to financial institutions and others, such as dealers and distributors.
The Fund has entered into agreements with various brokers, dealers, and financial intermediaries in connection with the sale of shares of the Fund. The agreements provide for periodic payments by the Fund to the brokers, dealers, and financial intermediaries for providing certain shareholder maintenance services (sub-transfer agent expenses). These shareholder services include the pre-processing and quality control of new accounts, shareholder correspondence, answering customer inquiries regarding account status, and facilitating shareholder telephone transactions. Fees paid by the Fund to various brokers, dealers, and financial intermediaries during the fiscal year ended October 31, 2016, were $708,095.
U.S. Bancorp Fund Services, LLC (“USBFS”) provides the Fund with administrative, fund accounting, and transfer agent services, and necessary office equipment. As administrator, USBFS is responsible for activities such as (i) preparing various federal and state regulatory filings, reports, and returns for the Fund, (ii) preparing reports and materials to be supplied to the Board, (iii) monitoring the activities of the Fund’s custodian, transfer agent, and accountants, and (iv) coordinating the preparation and payment of the Fund’s expenses and reviewing the Fund’s expense accruals. Fees paid to USBFS during the fiscal year ended October 31, 2016, were $386,741.
U.S. Bank, N.A., an affiliate of USBFS, serves as the Fund’s custodian. Quasar Distributors, LLC acts as the Fund’s principal underwriter in a continuous public offering of the Fund’s shares. Quasar Distributors, LLC is an affiliate of USBFS and U.S. Bank, N.A.
The officers of the Fund are affiliated with the Advisor. Such officers, with the exception of the Chief Compliance Officer and the Senior Compliance Officer, receive no compensation from the Fund for serving in their respective roles. The Fund, along with the other Hennessy Funds, makes reimbursement payments, on an equal basis, to the Advisor for a portion of the salary and benefits associated with the office of the Chief Compliance Officer and for all of the salary and benefits associated with the office of the Senior Compliance Officer. Such amounts are included on the Statement of Operations.
6). GUARANTEES AND INDEMNIFICATIONS
Under the Hennessy Funds’ organizational documents, their officers and trustees are indemnified by the Hennessy Funds against certain liabilities arising out of the performance of their duties to the Hennessy Funds. Additionally, in the normal course of business, the Hennessy Funds enter into contracts with service providers that contain general indemnification clauses. The Fund’s maximum exposure under these arrangements is unknown as this would involve future claims that may be made against the Fund that have not yet occurred. Currently, the Fund expects the risk of loss to be remote.
7). LINE OF CREDIT
The Fund has an uncommitted line of credit with the other Hennessy Funds in the amount of the lesser of (i) $100,000,000 or (ii) 33.33% of each Hennessy Fund’s net assets, or 30% for the Hennessy Gas Utility Fund and 10% for the Hennessy Balanced Fund, intended to provide short-term financing, if necessary, subject to certain restrictions, in connection with shareholder redemptions. The credit facility is with the Hennessy Funds’ custodian bank, U.S. Bank, N.A. Borrowings under this arrangement
HENNESSYFUNDS.COM
| NOTES TO THE FINANCIAL STATEMENTS |
bear interest at the bank’s prime rate and are secured by all of the Fund’s assets (as to its own borrowings only). During the fiscal year ended October 31, 2016, the Fund had an outstanding average daily balance and a weighted average interest rate of $179,954 and 3.47%, respectively. The maximum amount outstanding for the Fund during the period was $13,622,000. At October 31, 2016, the Fund had borrowings of $258,000 outstanding under the line of credit.
8). FEDERAL TAX INFORMATION
As of October 31, 2016, the components of accumulated earnings (losses) for income tax purposes were as follows:
| | Cost of investments for tax purposes | | $ | 312,244,344 | |
| | Gross tax unrealized appreciation | | $ | 26,058,387 | |
| | Gross tax unrealized depreciation | | | (8,825,075 | ) |
| | Net tax unrealized appreciation | | $ | 17,233,312 | |
| | Undistributed ordinary income | | $ | 129,004 | |
| | Undistributed long-term capital gains | | $ | 26,549,761 | |
| | Total distributable earnings | | $ | 26,678,765 | |
| | Other accumulated loss | | $ | — | |
| | Total accumulated gain | | $ | 43,912,077 | |
The difference between book-basis unrealized appreciation/depreciation (as shown in the Statement of Assets and Liabilities) and tax-basis unrealized appreciation/depreciation (as shown above) is attributable primarily to wash sales.
At October 31, 2016, the Fund had no tax basis capital losses to offset future capital gains.
At October 31, 2016, the Fund did not defer, on a tax basis, any late year ordinary losses.
During the fiscal years ended October 31, 2016 and 2015, the tax character of distributions paid by the Fund was as follows:
| | | | Year Ended | | | Year Ended | |
| | | | October 31, 2016 | | | October 31, 2015 | |
| | Ordinary income(1) | | $ | 4,059,953 | | | $ | 4,605,202 | |
| | Long-term capital gain | | | 10,941,347 | | | | 15,385,788 | |
| | | | $ | 15,001,300 | | | $ | 19,990,990 | |
(1) Ordinary income includes short-term gain or loss.
9). EVENTS SUBSEQUENT TO YEAR END
Management has evaluated the Fund’s related events and transactions that occurred subsequent to October 31, 2016, through the date of issuance of the Fund’s financial statements. Other than as disclosed below, management has determined that there were no subsequent events requiring recognition or disclosure in the financial statements.
On December 7, 2016, capital gains were declared and paid to shareholders of record as of December 6, 2016, as follows:
| | Long-term | |
| | Amount Per Share | |
| Investor Class | $1.33654 | |
| Institutional Class | $1.26622 | |
| HENNESSY FUNDS | 1-800-966-4354 | |
Report of Independent Registered Public Accounting Firm
To the Board of Trustees of Hennessy Funds Trust
and the Shareholders of the Hennessy Equity and Income Fund
Novato, CA
We have audited the accompanying statement of assets and liabilities, including the schedule of investments, of the Hennessy Equity and Income Fund (the “Fund”), a series of Hennessy Funds Trust, as of October 31, 2016, and the related statement of operations for the year then ended, the statements of changes in net assets for each of the two years in the period then ended and the financial highlights for each of the five years in the period then ended. These financial statements and financial highlights are the responsibility of the Fund’s management. Our responsibility is to express an opinion on these financial statements and financial highlights based on our audits.
We conducted our audits in accordance with the standards of the Public Company Accounting Oversight Board (United States). Those standards require that we plan and perform the audits to obtain reasonable assurance about whether the financial statements and financial highlights are free of material misstatement. The Fund is not required to have, nor were we engaged to perform, an audit of the Fund’s internal control over financial reporting. Our audits included consideration of internal control over financial reporting as a basis for designing audit procedures that are appropriate in the circumstances, but not for the purposes of expressing an opinion on the effectiveness of the Fund’s internal control over financial reporting. Accordingly, we express no such opinion. An audit includes examining, on a test basis, evidence supporting the amounts and disclosures in the financial statements. Our procedures included confirmation of securities owned as of October 31, 2016, by correspondence with the custodian. An audit also includes assessing the accounting principles used and significant estimates made by management, as well as evaluating the overall financial statement presentation. We believe that our audits provide a reasonable basis for our opinion.
In our opinion, the financial statements and financial highlights referred to above present fairly, in all material respects, the financial position of the Hennessy Equity and Income Fund as of October 31, 2016, the results of its operations for the year then ended, the changes in its net assets for each of the two years in the period then ended, and the financial highlights for each of the five years in the period then ended, in conformity with accounting principles generally accepted in the United States of America.
TAIT, WELLER & BAKER LLP
Philadelphia, Pennsylvania
December 22, 2016
HENNESSYFUNDS.COM
| REPORT OF INDEPENDENT REGISTERED PUBLIC ACCOUNTING FIRM/TRUSTEES AND OFFICERS |
Trustees and Officers of the Fund (Unaudited)
The business and affairs of the Fund are managed under the direction of the Board of Trustees of the Trust, and the Board of Trustees elects the Officers of the Trust. Beginning in March 2015, the Board of Trustees has from time to time appointed advisers (“Advisers”) to the Board of Trustees, with the intention of having qualified individuals serve in an advisory capacity in order to garner experience in the mutual fund and asset management industry and be considered as potential Trustees in the future. There are currently three Advisers to the Board of Trustees: Brian Alexander, Doug Franklin, and Claire Knoles. As Advisers, Mr. Alexander, Mr. Franklin, and Ms. Knoles attend meetings of the Board and act as non-voting participants. Information pertaining to the Trustees, Advisers, and the Officers of the Trust is set forth below. The Trustees and Officers serve until their successors are duly elected and qualified or until their earlier death, resignation, or removal. Each of the Trustees oversees 16 Hennessy Funds. Unless otherwise indicated, the address of all persons listed below is 7250 Redwood Boulevard, Suite 200, Novato, CA 94945. The Fund’s Statement of Additional Information includes more information about the persons listed below and is available, without charge, upon request by calling 1-800-966-4354.
| | | | Other |
| | | | Directorships |
| | | | Held Outside |
| Name, (Year of Birth), | | | of Fund |
| and Position Held | Start Date | Principal Occupation(s) | Complex During |
with the Trust | of Service | During Past Five Years | Past Five Years(1) |
| | | | |
| Disinterested Trustees and Advisers | | |
| | | | |
| J. Dennis DeSousa | January 1996 | Mr. DeSousa is a real estate investor. | None. |
| (1936) | | | |
| Trustee | | | |
| | | | |
| Robert T. Doyle | January 1996 | Mr. Doyle has been the Sheriff of | None. |
| (1947) | | Marin County, California since 1996. | |
| Trustee | | | |
| | | | |
| Gerald P. Richardson | May 2004 | Mr. Richardson is an independent | None. |
| (1945) | | consultant in the securities industry. | |
| Trustee | | | |
| | | | |
| Brian Alexander | March 2015 | Mr. Alexander has been employed | None. |
| (1981) | | by Sutter Health Novato Community | |
| Adviser to the Board | | Hospital since 2012, first as an | |
| | | Assistant Administrator and then, | |
| | | beginning in 2013, as the Chief | |
| | | Administrative Officer. From 2011 | |
| | | through 2012, Mr. Alexander was | |
| | | employed by Sutter Health West Bay | |
| | | Region as the Regional Director of | |
| | | Strategic Decision Support. Prior to | |
| | | that, in 2011, he served as the | |
| | | Director of Managed Care | |
| | | Contracting and also the Director of | |
| | | Compensation, Benefits, and | |
| | | Compliance for the Rehabilitation | |
| | | Institute of Chicago. | |
| HENNESSY FUNDS | 1-800-966-4354 | |
| | | | Other |
| | | | Directorships |
| | | | Held Outside |
| Name, (Year of Birth), | | | of Fund |
| and Position Held | Start Date | Principal Occupation(s) | Complex During |
with the Trust | of Service | During Past Five Years | Past Five Years(1) |
| | | | |
| Doug Franklin | March 2016 | Mr. Franklin is a retired insurance | None. |
| (1964) | | industry executive. From 1987 | |
| Adviser to the Board | | through 2015, he was employed by | |
| | | the Allianz-Fireman’s Fund Insurance | |
| | | Company in various positions, | |
| | | including as its Chief Actuary and | |
| | | Chief Risk Officer. | |
| | | | |
| Claire Knoles | December 2015 | Ms. Knoles is a founder of Kiosk and | None. |
| (1974) | | has served as its Chief Operating | |
| Adviser to the Board | | Officer since 2004. Kiosk is a full | |
| | | service marketing agency with | |
| | | offices in the San Francisco Bay | |
| | | Area, Toronto, and Liverpool, UK. | |
| | | | |
Interested Trustee(2) | | | |
| | | | |
| Neil J. Hennessy | January 1996 as | Mr. Hennessy has been employed by | Hennessy |
| (1956) | a Trustee and | Hennessy Advisors, Inc. since 1989 | Advisors, Inc. |
| Trustee, Chairman of | June 2008 as | and currently serves as its President, | |
| the Board, Chief | an Officer | Chairman and Chief Executive Officer. | |
| Investment Officer, | | | |
| Portfolio Manager, | | | |
| and President | | | |
| Name, (Year of Birth), | | |
| and Position Held | Start Date | Principal Occupation(s) |
with the Trust | of Service | During Past Five Years |
| | | |
| Officers | | |
| | | |
| Teresa M. Nilsen | January 1996 | Ms. Nilsen has been employed by Hennessy Advisors, Inc. |
| (1966) | | since 1989 and currently serves as its Executive Vice President, |
| Executive Vice President | | Chief Operations Officer, Chief Financial Officer, and Secretary. |
| and Treasurer | | |
| | | |
| Daniel B. Steadman | March 2000 | Mr. Steadman has been employed by Hennessy Advisors, Inc. |
| (1956) | | since 2000 and currently serves as its Executive Vice President |
| Executive Vice President | | and Chief Compliance Officer. |
| and Secretary | | |
| | | |
| Jennifer Cheskiewicz | June 2013 | Ms. Cheskiewicz has been employed by Hennessy Advisors, Inc. |
| (1977) | | as its General Counsel since June 2013. She previously served |
| Senior Vice President and | | as in-house counsel to Carlson Capital, L.P., an SEC-registered |
| Chief Compliance Officer | | investment advisor to several private funds, from |
| | | February 2010 to May 2013. |
| | | |
| Brian Carlson | December 2013 | Mr. Carlson has been employed by Hennessy Advisors, Inc. |
| (1972) | | since December 2013. Mr. Carlson was previously a co-founder |
| Senior Vice President and | | and principal of Trivium Consultants, LLC from February 2011 |
| Head of Distribution | | through November 2013. |
HENNESSYFUNDS.COM
| TRUSTEES AND OFFICERS OF THE FUND |
| Name, (Year of Birth), | | |
| and Position Held | Start Date | Principal Occupation(s) |
with the Trust | of Service | During Past Five Years |
| | | |
| David Ellison | October 2012 | Mr. Ellison has been employed by Hennessy Advisors, Inc. since |
(1958)(3) | | October 2012. He has served as a Portfolio Manager of the |
| Senior Vice President and | | Hennessy Small Cap Financial Fund, the Hennessy Large Cap |
| Portfolio Manager | | Financial Fund, and the Hennessy Technology Fund since |
| | | inception. Prior to that, Mr. Ellison served as Director, CIO and |
| | | President of FBR Fund Advisers, Inc. from December |
| | | 1999 to October 2012. |
| | | |
| Brian Peery | March 2003 as | Mr. Peery has been employed by Hennessy Advisors, Inc. since |
| (1969) | an Officer and | 2002. He has served as a Portfolio Manager of the Hennessy |
| Senior Vice President and | February 2011 | Cornerstone Growth Fund, the Hennessy Cornerstone Mid Cap |
| Portfolio Manager | as a Co-Portfolio | 30 Fund, the Hennessy Cornerstone Large Growth Fund, the |
| | Manager or | Hennessy Cornerstone Value Fund, the Hennessy Total Return |
| | Portfolio Manager | Fund, and the Hennessy Balanced Fund since October 2014. |
| | | He served as Co-Portfolio Manager of the same funds from |
| | | February 2011 through September 2014. Mr. Peery has also |
| | | served as a Portfolio Manager of the Hennessy Gas Utility Fund |
| | | since February 2015. |
| | | |
| Winsor (Skip) Aylesworth | October 2012 | Mr. Aylesworth has been employed by Hennessy Advisors, Inc. |
(1947)(3) | | since October 2012. He has served as a Portfolio Manager of |
| Vice President and | | the Hennessy Gas Utility Fund since 1998 and as a Portfolio |
| Portfolio Manager | | Manager of the Hennessy Technology Fund since inception. |
| | | Prior to that, Mr. Aylesworth served as Executive Vice President |
| | | of FBR Fund Advisers, Inc. from 1999 to October 2012. |
| | | |
| Ryan Kelley | March 2013 | Mr. Kelley has been employed by Hennessy Advisors, Inc. since |
(1972)(4) | | October 2012. He has served as a Portfolio Manager of the |
| Vice President and | | Hennessy Gas Utility Fund, the Hennessy Small Cap Financial |
| Portfolio Manager | | Fund, and the Hennessy Large Cap Financial Fund since |
| | | October 2014. He served as Co-Portfolio Manager of the same |
| | | funds from March 2013 through September 2014, and as a |
| | | Portfolio Analyst for the Hennessy Funds from October 2012 |
| | | through February 2013. Prior to that, Mr. Kelley served as |
| | | Portfolio Manager of FBR Fund Advisers, Inc. from |
| | | January 2008 to October 2012. |
_______________
(1) | Messrs. DeSousa, Doyle, Hennessy, and Richardson previously served on the Board of Directors of Hennessy Mutual Funds, Inc. (“HMFI”), The Hennessy Funds, Inc. (“HFI”), and Hennessy SPARX Funds Trust (“HSFT”). Pursuant to an internal reorganization effective as of February 28, 2014, the series of HFMI, HFI, and HSFT were reorganized into corresponding series of Hennessy Funds Trust that mirrored them. Subsequent to the reorganization, HFMI, HFI, and HSFT were dissolved. |
(2) | Mr. Hennessy is considered an “interested person,” as defined in the Investment Company Act of 1940, as amended, because he is an officer of the Hennessy Funds. |
(3) | The address of these officers is 101 Federal Street, Suite 1900, Boston, MA 02110. |
(4) | The address of this officer is 1340 Environ Way, Suite 305, Chapel Hill, NC 27517. |
| HENNESSY FUNDS | 1-800-966-4354 | |
Expense Example (Unaudited)
October 31, 2016
As a shareholder of the Fund, you incur two types of costs: (1) transaction costs, including sales charges (loads) on purchase payments, reinvested dividends, or other distributions; redemption fees; and exchange fees; and (2) ongoing costs, including management fees; service fees; and other Fund expenses. This Example is intended to help you understand your ongoing costs (in dollars) of investing in the Fund and to compare these costs with the ongoing costs of investing in other mutual funds. The Example is based on an investment of $1,000 invested at the beginning of the period and held for the entire period from May 1, 2016, through October 31, 2016.
Actual Expenses
The first line of the table below under the “Investor Class” and “Institutional Class” headings provides information about actual account values and actual expenses. Although the Fund charges no sales loads or transaction fees, you will be assessed fees for outgoing wire transfers, returned checks and stop payment orders at prevailing rates charged by U.S. Bancorp Fund Services, LLC, the Fund’s transfer agent. If you request that a redemption be made by wire transfer, currently a $15 fee is charged by the Fund’s transfer agent. IRA accounts will be charged a $15 annual maintenance fee. The example below includes, but is not limited to, management fees, shareholder servicing fees, fund accounting, custody, and transfer agent fees. However, the example below does not include portfolio trading commissions and related expenses, and other extraordinary expenses as determined under generally accepted accounting principles. You may use the information in this line, together with the amount you invested, to estimate the expenses that you paid over the period. Simply divide your account value by $1,000 (for example, an $8,600 account value divided by $1,000 = 8.6), then multiply the result by the number in the first line of the table under the “Investor Class” and “Institutional Class” headings in the column entitled “Expenses Paid During Period” to estimate the expenses you paid on your account during this period.
Hypothetical Example for Comparison Purposes
The second line of the table below under the “Investor Class” and “Institutional Class” headings provides information about hypothetical account values and hypothetical expenses based on the Fund’s actual expense ratios and an assumed rate of return of 5% per year before expenses, which is not the Fund’s actual return. The hypothetical account values and expenses may not be used to estimate the actual ending account balance or expenses you paid for the period. You may use this information to compare the ongoing costs of investing in the Fund and other funds. To do so, compare this 5% hypothetical example with the 5% hypothetical examples that appear in the shareholder reports of the other funds. Please note that the expenses shown in the table are meant to highlight your ongoing costs only and do not reflect any transactional costs, such as sales charges (loads), or exchange fees. Therefore, the second line of the table under the “Investor Class” and “Institutional Class” headings is useful in comparing ongoing costs only, and will not help you determine the relative total costs of owning different funds. In addition, if these transactional costs were included, your costs would have been higher.
HENNESSYFUNDS.COM
| | | | Expenses Paid |
| | Beginning | Ending | During Period(1) |
| | Account Value | Account Value | May 1, 2016 – |
| | May 1, 2016 | October 31, 2016 | October 31, 2016 |
| Investor Class | | | |
| Actual | $1,000.00 | $ 995.60 | $7.07 |
| Hypothetical (5% return before expenses) | $1,000.00 | $1,018.15 | $7.15 |
| | | | |
| Institutional Class | | | |
| Actual | $1,000.00 | $ 998.30 | $5.07 |
| Hypothetical (5% return before expenses) | $1,000.00 | $1,020.06 | $5.13 |
(1) | Expenses are equal to the Fund’s annualized expense ratio of 1.41% for Investor Class shares or 1.01% for Institutional Class shares, as applicable, multiplied by the average account value over the period, multiplied by 184/366 days (to reflect one-half year period). |
| HENNESSY FUNDS | 1-800-966-4354 | |
How to Obtain a Copy of the Fund’s
Proxy Voting Policy and Proxy Voting Records
A description of the policies and procedures the Fund uses to determine how to vote proxies relating to portfolio securities is available without charge: (1) by calling 1-800-966-4354; (2) on the Hennessy Funds’ website at hennessyfunds.com/proxy-voting/policy.fs; or (3) on the U.S. Securities and Exchange Commission’s website at www.sec.gov. The Fund’s proxy voting record is available without charge on both the Hennessy Funds’ website at hennessyfunds.com/proxy-voting/vote.fs and the SEC’s website at www.sec.gov no later than August 31 for the prior 12 months ending June 30.
Quarterly Filings on Form N-Q
The Fund files its complete schedule of portfolio holdings with the SEC for the first and third quarters of each fiscal year on Form N-Q. The Fund’s Form N-Q will be available on the SEC’s website at www.sec.gov. The Fund’s Form N-Q may be reviewed and copied at the SEC’s Public Reference Room in Washington, DC and information on the operation of the Public Reference Room may be obtained by calling 1-800-SEC-0330. Information included in the Fund’s N-Q will also be available upon request by calling 1-800-966-4354.
Federal Tax Distribution Information
(Unaudited)
For the fiscal year ended October 31, 2016, certain dividends paid by the Fund may be subject to a maximum tax rate of 23.8%, as provided for by the Jobs and Growth Tax Relief Reconciliation Act of 2003. The percentage of dividends declared from ordinary income designated as qualified dividend income was 100%.
For corporate shareholders, the percent of ordinary income distributions that qualified for the corporate dividends received deduction for the fiscal year ended October 31, 2016, was 100%.
The percentage of taxable ordinary income distributions that are designated as short-term capital gain distributions under Section 871(k)(2)(C) of the Internal Revenue Code of 1986, as amended, for the Fund was 0%.
Householding
To help keep the Fund’s costs as low as possible, we generally deliver a single copy of most financial reports and prospectuses to shareholders who share an address, even if the accounts are registered under different names. This process, known as “householding,” does not apply to account statements. You may, of course, request an individual copy of a prospectus or financial report at any time. If you would like to receive separate mailings, please call the Administrator at 1-800-261-6950 or 1-414-765-4124 and we will begin individual delivery within 30 days of your request. If your account is held through a financial institution or other intermediary, please contact them directly to request individual delivery.
HENNESSYFUNDS.COM
| PROXY VOTING — PRIVACY POLICY |
Privacy Policy
We collect the following non-public personal information about you:
| | • | information we receive from you on or in applications or other forms, correspondence, or conversations, including, but not limited to, your name, address, phone number, social security number, assets, income, and date of birth; and |
| | • | information about your transactions with us, our affiliates, or others, including, but not limited to, your account number and balance, payment history, parties to transactions, cost basis information, and other financial information. |
We do not disclose any non-public personal information about our current or former shareholders to non-affiliated third parties, except as permitted by law. For example, we are permitted by law to disclose all of the information we collect, as described above, to our Transfer Agent to process your transactions. Furthermore, we restrict access to your non-public personal information to those persons who require such information to provide products or services to you. We maintain physical, electronic, and procedural safeguards that comply with federal standards to guard your non-public personal information.
In the event that you hold shares of the Fund through a financial intermediary, including, but not limited to, a broker-dealer, bank or trust company, the privacy policy of your financial intermediary would govern how your non-public personal information would be shared with non-affiliated third parties.
| HENNESSY FUNDS | 1-800-966-4354 | |
For information, questions or assistance, please call
The Hennessy Funds
1-800-966-4354 or 1-415-899-1555
INVESTMENT ADVISOR
Hennessy Advisors, Inc.
7250 Redwood Blvd., Suite 200
Novato, California 94945
ADMINISTRATOR,
TRANSFER AGENT,
DIVIDEND PAYING AGENT &
SHAREHOLDER SERVICING AGENT
U.S. Bancorp Fund Services, LLC
P.O. Box 701
Milwaukee, Wisconsin 53201-0701
CUSTODIAN
U.S. Bank N.A.
Custody Operations
1555 North River Center Dr., Suite 302
Milwaukee, Wisconsin 53212
TRUSTEES
Neil J. Hennessy
Robert T. Doyle
J. Dennis DeSousa
Gerald P. Richardson
COUNSEL
Foley & Lardner LLP
777 East Wisconsin Avenue
Milwaukee, Wisconsin 53202-5306
INDEPENDENT REGISTERED
PUBLIC ACCOUNTING FIRM
Tait, Weller & Baker LLP
1818 Market Street, Suite 2400
Philadelphia, Pennsylvania 19103
DISTRIBUTOR
Quasar Distributors, LLC
615 East Michigan Street
Milwaukee, Wisconsin 53202
hennessyfunds.com | 1-800-966-4354
This report has been prepared for shareholders and may be distributed to
others only if preceded or accompanied by a current prospectus.
ANNUAL REPORT
OCTOBER 31, 2016
HENNESSY BALANCED
FUND
Investor Class HBFBX
hennessyfunds.com | 1-800-966-4354
(This Page Intentionally Left Blank.)
Contents
| Letter to Shareholders | | | 2 |
| Performance Overview | | | 4 |
| Financial Statements | | | |
| Schedule of Investments | | | 7 |
| Statement of Assets and Liabilities | | | 11 |
| Statement of Operations | | | 12 |
| Statements of Changes in Net Assets | | | 13 |
| Financial Highlights | | | 14 |
| Notes to the Financial Statements | | | 16 |
| Report of Independent Registered Public Accounting Firm | | | 24 |
| Trustees and Officers of the Fund | | | 25 |
| Expense Example | | | 28 |
| Proxy Voting | | | 30 |
| Quarterly Filings on Form N-Q | | | 30 |
| Federal Tax Distribution Information | | | 30 |
| Householding | | | 30 |
| Privacy Policy | | | 31 |
| HENNESSY FUNDS | 1-800-966-4354 | |
December 2016
Dear Hennessy Funds Shareholder:
Over the past year investors here in the U.S. and around the world have weathered a great deal of turmoil, especially in the political arena. Foremost, the bitterly divisive and all-consuming U.S. Presidential election, with its unanticipated outcome, is finally behind us. While the equity markets were jittery at first, they now appear more comfortable with the prospect of a Trump presidency and seem to be looking forward to diminished government regulation and intervention.
The Brexit vote in the U.K. cast a shadow over the European Union’s future. There remains uncertainty over the details and timing of the break and the economic consequences for both Britain and Europe, but early signs suggest the impact on growth in Britain will not be as severe as initially feared.
Additionally, uncertainty over whether the Federal Reserve would raise short-term interest rates has hung over the economy for well over a year now. The effects that higher rates could have on growth, the strength of the U.S. Dollar, corporate profits and loan supply and demand seem to have weighed heavily on investors, causing paralysis and money to remain on the sidelines of the market.
Despite all these concerns, U.S. equity markets have pushed higher, with both the Dow Jones Industrial Average and S&P 500 Index posting returns of approximately 5% during the twelve-month period ended October 31, 2016. The U.S. economy has continued to grow at a respectable annual rate of about 2%, and corporate profits have started to move higher. Today, as of mid-December, bond and Treasury yields have risen a bit from record lows just this summer, and the bond market is finishing the year on slightly rocky footing. Bond yields are still very low relative to historical averages, while the prospective PE multiples for the Dow Jones Industrial Average and S&P 500 Index are just above long-term averages at 18.0x and 18.9x, respectively. We believe that equity valuations could go considerably higher and still be at appropriate levels relative to bond yields. And, while we do expect the Fed to raise interest rates in the coming year, we believe that inflation will stay under control, so that short-term interest rates will not have to rise too fast or too far.
As I reflect over the past twelve months, what I realize is that many of the worries this year are not new. For the past several years, American businesses have operated in an environment characterized by highly partisan politics, mounting regulations, uncertainty over interest rates, and a lack of clarity regarding taxes and healthcare costs. Despite all these headwinds, U.S. corporations have been incredibly resilient and found ways to impress investors. If the newly elected administration follows through on campaign promises of reigning in regulation, lowering taxes for corporations and individuals, or reforming healthcare to drive down costs, then companies, which are already lean, should be able to post higher profits. And, that growth should lead to more jobs and a stronger economy, potentially creating a very positive cycle going forward.
With the bull market in U.S. equities entering its ninth year, many believe the economy is due for a recession and the market is due for a downturn. But, the euphoria that usually accompanies a peak in the market is absent. Since the recovery began after the financial crisis, I have found myself pondering the bull run of 1982 to 2000, powered, in part, by a significant increase in valuations. I believe today’s market displays the fundamentals to sustain a similarly strong and lengthy bull market. Meanwhile, companies are largely profitable and many corporate balance sheets are cash-rich, with
HENNESSYFUNDS.COM
relatively little debt. Unemployment is low and real wages are rising, helping to drive consumption. We are hopeful that these factors will provide support for positive market returns in the year to come.
Thank you for your continued confidence and investment in our funds. If you have any questions or would like to speak with us directly, please don’t hesitate to call us at (800) 966-4354.
Best regards,
Neil J. Hennessy
President and Chief Investment Officer
Past performance does not guarantee future results.
Mutual fund investing involves risk. Principal loss is possible.
Opinions expressed are those of Neil Hennessy and are subject to change, are not guaranteed and should not be considered investment advice.
The Dow Jones Industrial Average and S&P 500 Index are unmanaged indices commonly used to measure the performance of U.S. stocks. One cannot invest directly in an index.
PE, or price to earnings, is calculated by dividing a company’s market price per share by its earnings per share.
| HENNESSY FUNDS | 1-800-966-4354 | |
Performance Overview (Unaudited)
CHANGE IN VALUE OF $10,000 INVESTMENT
This graph illustrates the performance of an initial investment of $10,000 made in the Fund ten years ago and assumes the reinvestment of dividends.
AVERAGE ANNUAL TOTAL RETURN FOR PERIODS ENDED OCTOBER 31, 2016
| | One | Five | Ten |
| | Year | Years | Years |
| Hennessy Balanced Fund (HBFBX) | 5.20% | 5.05% | 3.19% |
| 50/50 Blended DJIA/Treasury Index* | 3.14% | 5.91% | 4.45% |
| Dow Jones Industrial Average | 5.49% | 11.50% | 6.93% |
Expense ratio: 1.68%
Performance data quoted represents past performance; past performance does not guarantee future results. The investment return and principal value of an investment will fluctuate so that an investor’s shares, when redeemed, may be worth more or less than their original cost. The performance graph and table do not reflect the deduction of taxes that a shareholder would pay on Fund distributions or the redemption of Fund shares. Current performance of the Fund may be lower or higher than the performance quoted. Performance data current to the most recent month end may be obtained by visiting hennessyfunds.com.
The expense ratio presented is from the most recent prospectus.
| * | The 50/50 Blended DJIA/Treasury Index consists of 50% common stocks represented by the Dow Jones Industrial Average and 50% short-duration Treasury securities represented by the BofA Merrill Lynch 1-year U.S. Treasury Note Index. |
PERFORMANCE NARRATIVE
Portfolio Managers Neil J. Hennessy and Brian E. Peery
Performance:
For the twelve-month period ended October 31, 2016, the Hennessy Balanced Fund returned 5.20%, outperforming the 50/50 Blended DJIA/Treasury Index*, which returned 3.14%, but underperforming the Dow Jones Industrial Average, which returned 5.49%, for the same period.
The Fund outperformed its primary benchmark, the 50/50 Blended DJIA/Treasury Index,* as a result of both sector allocation and stock selection. Two of the largest contributors to the Fund’s relative outperformance were The Boeing Company and
HENNESSYFUNDS.COM
McDonald’s Corporation. Pfizer, Inc. was the largest detractor to overall performance. From a sector perspective, an overweight position in the Energy sector as oil prices rebounded, and underweight positions in the Financials and Consumer Discretionary sectors, aided performance. The Fund continues to hold Boeing, McDonald’s and Pfizer. Stronger returns from the equity investments in the portfolio more than offset a negative relative contribution from the Government Securities portion of the portfolio as compared to the Fund’s primary benchmark.
Portfolio Strategy:
The Fund invests approximately 50% of its assets in the “Dogs of the Dow,” the 10 highest dividend-yielding Dow stocks, and 50% of its assets in U.S. Treasuries. As a result of this “balanced” strategy, the Fund may be expected to underperform equities in periods when markets rise and outperform in periods when markets fall. The Fund is designed to allow investors to gain some exposure to the equity market while maintaining a significant share of their investment in fixed income securities. We believe the Fund is well positioned for the more conservative investor, as the equity portion of the portfolio is invested in what we would deem to be high-quality companies, each with a historically high dividend yield. The relatively short duration of the 50% weighting of U.S. Treasuries in the portfolio (all less than one year) may allow us the ability to roll into higher yielding Treasuries in the event yields rise.
Market Outlook:
Over the twelve-month period ended October 31, 2016, U.S. equities produced moderate, positive returns. The period was once again marked by a great deal of volatility, with major market indices dropping more than 10% at one point early in the year before recovering all of their losses. Throughout this period, there have been concerns about interest rates, commodity prices, economic growth (both domestic and international) and the U.S. Presidential election. Many, if not all, of these concerns still exist in the marketplace today, but we have reasons to be hopeful for the year to come.
First, while corporate profits have been on a gentle slide downwards since the fourth quarter of 2014, market analysts are now forecasting a return to growth in profits in the fourth quarter of this year. We believe these forecasts have a good chance of being proved correct. Second, mergers and acquisitions have been strong and steady this year, and we believe such activity will continue next year, helping drive revenue and earnings for the acquiring companies. Third, we do not believe the majority of stocks are expensive at this point, though many are probably fairly valued. The Dow Jones Industrial Average and the S&P 500 Index have forward PE ratios of roughly 18x and 19x, respectively, close to long-term averages, although slightly higher than six months ago. Corporate balance sheets appear to be in excellent shape, and while executives have shown some reluctance to increase capital spending beyond maintenance levels this cycle, we believe companies outside of the Energy sector will eventually start investing for expansion. Overall, we believe the basic fundamentals of the market are attractive, and we continue to be optimistic about the possibility of further moderate market advances over the course of next year.
We believe the balance between risk and reward afforded by the Fund’s stock selection and asset allocation policies provides conservative investors with a compelling way to participate in the market longer term while maintaining a lower risk profile.
_______________
| * | The 50/50 Blended DJIA/Treasury Index consists of 50% common stocks represented by the Dow Jones Industrial Average and 50% short duration Treasury securities represented by the BofA Merrill Lynch 1-Year U.S. Treasury Note Index. |
| HENNESSY FUNDS | 1-800-966-4354 | |
Opinions expressed are those of the Portfolio Managers as of the date written and are subject to change, are not guaranteed, and should not be considered investment advice or an indication of trading intent.
The S&P 500 Index and Dow Jones Industrial Average are unmanaged indices commonly used to measure the performance of U.S. stocks. The BofA Merrill Lynch 1-Year U.S. Treasury Note Index is an unmanaged index comprised of Treasury securities maturing in approximately one year. One cannot invest directly in an index.
The Fund is non-diversified, meaning it may concentrate its assets in fewer individual holdings than a diversified fund, making it more exposed to individual stock volatility than a diversified fund. The Fund’s formula-based strategy may cause the Fund to buy or sell securities at times when it may not be advantageous. Please see the Fund’s prospectus for a more complete discussion of these and other risks.
References to specific securities should not be considered a recommendation to buy or sell any security. Fund holdings and sector allocations are subject to change. Please refer to the Schedule of Investments included in this report for additional portfolio information.
Dividend yield is calculated as the annual dividends paid by a company divided by its market price per share. PE, or price to earnings, is calculated by dividing a company’s market price per share by its earnings per share.
HENNESSYFUNDS.COM
| PERFORMANCE OVERVIEW/SCHEDULE OF INVESTMENTS |
Financial Statements
Schedule of Investments as of October 31, 2016 |
HENNESSY BALANCED FUND
(% of Net Assets)
| TOP TEN HOLDINGS | % NET ASSETS |
| | |
| U.S. Treasury Bill, 0.350%, 02/02/2017 | 8.27% |
| | |
| U.S. Treasury Bill, 0.480%, 03/02/2017 | 8.27% |
| | |
| U.S. Treasury Bill, 0.420%, 03/30/2017 | 8.26% |
| | |
| U.S. Treasury Bill, 0.685%, 05/25/2017 | 8.26% |
| | |
| U.S. Treasury Bill, 0.560%, 06/22/2017 | 8.25% |
| | |
| The Boeing Co. | 5.60% |
| | |
| Caterpillar, Inc. | 5.60% |
| | |
| International Business Machines Corp. | 5.35% |
| | |
| Chevron Corp. | 5.29% |
| | |
| Cisco Systems, Inc. | 5.09% |
Note: For presentation purposes, the Fund has grouped some of the industry categories. For purposes of categorizing securities for compliance with Section 8(b)(1) of the Investment Company Act of 1940, as amended, the Fund uses more specific industry classifications.
| HENNESSY FUNDS | 1-800-966-4354 | |
| | COMMON STOCKS – 53.18% | | Number | | | | | | % of | |
| | | | of Shares | | | Value | | | Net Assets | |
| | Consumer Discretionary – 2.47% | | | | | | | | | |
| | McDonald’s Corp. | | | 2,650 | | | $ | 298,311 | | | | 2.47 | % |
| | | | | | | | | | | | | | |
| | Consumer Staples – 3.13% | | | | | | | | | | | | |
| | Procter & Gamble Co. | | | 400 | | | | 34,720 | | | | 0.29 | % |
| | The Coca-Cola Co. | | | 7,200 | | | | 305,280 | | | | 2.52 | % |
| | Wal-Mart Stores, Inc. | | | 550 | | | | 38,511 | | | | 0.32 | % |
| | | | | | | | | 378,511 | | | | 3.13 | % |
| | | | | | | | | | | | | | |
| | Energy – 10.29% | | | | | | | | | | | | |
| | Chevron Corp. | | | 6,100 | | | | 638,975 | | | | 5.29 | % |
| | Exxon Mobil Corp. | | | 7,250 | | | | 604,070 | | | | 5.00 | % |
| | | | | | | | | 1,243,045 | | | | 10.29 | % |
| | | | | | | | | | | | | | |
| | Health Care – 8.10% | | | | | | | | | | | | |
| | Merck & Co., Inc. | | | 6,550 | | | | 384,616 | | | | 3.18 | % |
| | Pfizer, Inc. | | | 18,750 | | | | 594,563 | | | | 4.92 | % |
| | | | | | | | | 979,179 | | | | 8.10 | % |
| | | | | | | | | | | | | | |
| | Industrials – 11.20% | | | | | | | | | | | | |
| | Caterpillar, Inc. | | | 8,100 | | | | 676,026 | | | | 5.60 | % |
| | The Boeing Co. | | | 4,750 | | | | 676,542 | | | | 5.60 | % |
| | | | | | | | | 1,352,568 | | | | 11.20 | % |
| | | | | | | | | | | | | | |
| | Information Technology – 13.41% | | | | | | | | | | | | |
| | Cisco Systems, Inc. | | | 20,050 | | | | 615,134 | | | | 5.09 | % |
| | Intel Corp. | | | 10,300 | | | | 359,161 | | | | 2.97 | % |
| | International Business Machines Corp. | | | 4,200 | | | | 645,498 | | | | 5.35 | % |
| | | | | | | | | 1,619,793 | | | | 13.41 | % |
| | | | | | | | | | | | | | |
| | Telecommunication Services – 4.58% | | | | | | | | | | | | |
| | Verizon Communications, Inc. | | | 11,500 | | | | 553,150 | | | | 4.58 | % |
| | | | | | | | | | | | | | |
| | Total Common Stocks | | | | | | | | | | | | |
| | (Cost $5,806,728) | | | | | | | 6,424,557 | | | | 53.18 | % |
The accompanying notes are an integral part of these financial statements.
HENNESSYFUNDS.COM
| | SHORT-TERM INVESTMENTS – 47.28% | | Number of Shares/ | | | | | | % of | |
| | | | Par Amount | | | Value | | | Net Assets | |
| | Money Market Funds – 1.85% | | | | | | | | | |
| | Fidelity Government Portfolio, Institutional Class, 0.27% (a) | | | 222,976 | | | $ | 222,976 | | | | 1.85 | % |
| | | | | | | | | | | | | | |
| | U.S. Treasury Bills – 45.43% | | | | | | | | | | | | |
| | 0.350%, 02/02/2017 (b) | | | 1,000,000 | | | | 999,130 | | | | 8.27 | % |
| | 0.480%, 03/02/2017 (b) | | | 1,000,000 | | | | 998,840 | | | | 8.27 | % |
| | 0.420%, 03/30/2017 (b) | | | 1,000,000 | | | | 998,397 | | | | 8.26 | % |
| | 0.685%, 05/25/2017 (b) | | | 1,000,000 | | | | 997,338 | | | | 8.26 | % |
| | 0.560%, 06/22/2017 (b) | | | 1,000,000 | | | | 996,821 | | | | 8.25 | % |
| | 0.550%, 07/20/2017 (b) | | | 500,000 | | | | 498,069 | | | | 4.12 | % |
| | | | | | | | | 5,488,595 | | | | 45.43 | % |
| | | | | | | | | | | | | | |
| | Total Short-Term Investments | | | | | | | | | | | | |
| | (Cost $5,707,925) | | | | | | | 5,711,571 | | | | 47.28 | % |
| | | | | | | | | | | | | | |
| | Total Investments | | | | | | | | | | | | |
| | (Cost $11,514,653) – 100.46% | | | | | | | 12,136,128 | | | | 100.46 | % |
| | | | | | | | | | | | | | |
| | Liabilities in Excess | | | | | | | | | | | | |
| | of Other Assets – (0.46)% | | | | | | | (55,837 | ) | | | (0.46 | )% |
| | | | | | | | | | | | | | |
| | TOTAL NET ASSETS – 100.00% | | | | | | $ | 12,080,291 | | | | 100.00 | % |
Percentages are stated as a percent of net assets.
| (a) | The rate listed is the fund’s 7-day yield as of October 31, 2016. |
| (b) | The rate listed is discount rate at issue. |
The accompanying notes are an integral part of these financial statements.
| HENNESSY FUNDS | 1-800-966-4354 | |
Summary of Fair Value Exposure at October 31, 2016
The following is a summary of the inputs used to value the Fund’s net assets as of October 31, 2016 (see Note 3 in the accompanying notes to the financial statements):
| Common Stocks | | Level 1 | | | Level 2 | | | Level 3 | | | Total | |
| Consumer Discretionary | | $ | 298,311 | | | $ | — | | | $ | — | | | $ | 298,311 | |
| Consumer Staples | | | 378,511 | | | | — | | | | — | | | | 378,511 | |
| Energy | | | 1,243,045 | | | | — | | | | — | | | | 1,243,045 | |
| Health Care | | | 979,179 | | | | — | | | | — | | | | 979,179 | |
| Industrials | | | 1,352,568 | | | | — | | | | — | | | | 1,352,568 | |
| Information Technology | | | 1,619,793 | | | | — | | | | — | | | | 1,619,793 | |
| Telecommunication Services | | | 553,150 | | | | — | | | | — | | | | 553,150 | |
| Total Common Stocks | | $ | 6,424,557 | | | $ | — | | | $ | — | | | $ | 6,424,557 | |
| Short-Term Investments | | | | | | | | | | | | | | | | |
| Money Market Funds | | $ | 222,976 | | | $ | — | | | $ | — | | | $ | 222,976 | |
| U.S. Treasury Bills | | | — | | | | 5,488,595 | | | | — | | | | 5,488,595 | |
| Total Short-Term Investments | | $ | 222,976 | | | $ | 5,488,595 | | | $ | — | | | $ | 5,711,571 | |
| Total Investments | | $ | 6,647,533 | | | $ | 5,488,595 | | | $ | — | | | $ | 12,136,128 | |
Transfers between levels are recognized at the end of the reporting period. During the year ended October 31, 2016, the Fund recognized no transfers between levels.
The accompanying notes are an integral part of these financial statements.
HENNESSYFUNDS.COM
| SCHEDULE OF INVESTMENTS/STATEMENT OF ASSETS AND LIABILITIES |
Financial Statements
Statement of Assets and Liabilities as of October 31, 2016 |
| ASSETS: | | | |
| Investments in securities, at value (cost $11,514,653) | | $ | 12,136,128 | |
| Dividends and interest receivable | | | 13,215 | |
| Prepaid expenses and other assets | | | 9,048 | |
| Total Assets | | | 12,158,391 | |
| | | | | |
| LIABILITIES: | | | | |
| Payable to advisor | | | 6,234 | |
| Payable to administrator | | | 2,208 | |
| Payable to auditor | | | 19,601 | |
| Accrued distribution fees | | | 33,092 | |
| Accrued service fees | | | 1,039 | |
| Accrued trustees fees | | | 3,898 | |
| Accrued expenses and other payables | | | 12,028 | |
| Total Liabilities | | | 78,100 | |
| NET ASSETS | | $ | 12,080,291 | |
| | | | | |
| NET ASSETS CONSIST OF: | | | | |
| Capital stock | | $ | 10,629,708 | |
| Accumulated net realized gain on investments | | | 829,108 | |
| Unrealized net appreciation on investments | | | 621,475 | |
| Total Net Assets | | $ | 12,080,291 | |
| | | | | |
| NET ASSETS | | | | |
| Investor Class: | | | | |
| Shares authorized (no par value) | | Unlimited | |
| Net assets applicable to outstanding Investor Class shares | | $ | 12,080,291 | |
| Shares issued and outstanding | | | 952,703 | |
| Net asset value, offering price and redemption price per share | | $ | 12.68 | |
The accompanying notes are an integral part of these financial statements.
| HENNESSY FUNDS | 1-800-966-4354 | |
Financial Statements
Statement of Operations for the year ended October 31, 2016 |
| INVESTMENT INCOME: | | | |
| Dividend income | | $ | 250,772 | |
| Interest income | | | 30,459 | |
| Total investment income | | | 281,231 | |
| | | | | |
| EXPENSES: | | | | |
| Investment advisory fees (See Note 5) | | | 83,934 | |
| Compliance expense (See Note 5) | | | 23,709 | |
| Distribution fees – Investor Class (See Note 5) | | | 20,984 | |
| Audit fees | | | 20,030 | |
| Federal and state registration fees | | | 16,100 | |
| Trustees’ fees and expenses | | | 15,806 | |
| Service fees – Investor Class (See Note 5) | | | 13,989 | |
| Administration, fund accounting, custody and transfer agent fees (See Note 5) | | | 13,627 | |
| Sub-transfer agent expenses – Investor Class (See Note 5) | | | 13,539 | |
| Reports to shareholders | | | 7,327 | |
| Interest expense (See Note 7) | | | 1,325 | |
| Legal fees | | | 62 | |
| Other expenses | | | 4,181 | |
| Net expenses | | | 234,613 | |
| NET INVESTMENT INCOME | | $ | 46,618 | |
| | | | | |
| REALIZED AND UNREALIZED GAINS: | | | | |
| Net realized gain on investments | | $ | 843,528 | |
| Net change in unrealized appreciation on investments | | | 21,866 | |
| Net gain on investments | | | 865,394 | |
| NET INCREASE IN NET ASSETS RESULTING FROM OPERATIONS | | $ | 912,012 | |
The accompanying notes are an integral part of these financial statements.
HENNESSYFUNDS.COM
| STATEMENT OF OPERATIONS/STATEMENTS OF CHANGES IN NET ASSETS |
Financial Statements
| Statements of Changes in Net Assets |
| | | Year Ended | | | Year Ended | |
| | | October 31, 2016 | | | October 31, 2015 | |
| OPERATIONS: | | | | | | |
| Net investment income | | $ | 46,618 | | | $ | 24,074 | |
| Net realized gain on investments | | | 843,528 | | | | 250,576 | |
| Net change in unrealized | | | | | | | | |
| appreciation (depreciation) on investments | | | 21,866 | | | | (265,259 | ) |
| Net increase in net assets resulting from operations | | | 912,012 | | | | 9,391 | |
| | | | | | | | | |
| DISTRIBUTIONS TO SHAREHOLDERS FROM: | | | | | | | | |
| Net investment income – Investor Class | | | (50,622 | ) | | | (30,298 | ) |
| Net realized gains – Investor Class | | | (254,142 | ) | | | (571,934 | ) |
| Total distributions | | | (304,764 | ) | | | (602,232 | ) |
| | | | | | | | | |
| CAPITAL SHARE TRANSACTIONS: | | | | | | | | |
| Proceeds from shares subscribed – Investor Class | | | 6,936,800 | | | | 450,977 | |
| Dividends reinvested – Investor Class | | | 299,526 | | | | 589,193 | |
| Cost of shares redeemed – Investor Class | | | (7,390,889 | ) | | | (1,362,738 | ) |
| Net decrease in net assets derived | | | | | | | | |
| from capital share transactions | | | (154,563 | ) | | | (322,568 | ) |
| TOTAL INCREASE (DECREASE) IN NET ASSETS | | | 452,685 | | | | (915,409 | ) |
| | | | | | | | | |
| NET ASSETS: | | | | | | | | |
| Beginning of year | | | 11,627,606 | | | | 12,543,015 | |
| End of year | | $ | 12,080,291 | | | $ | 11,627,606 | |
| Undistributed net investment | | | | | | | | |
| income, end of year | | $ | — | | | $ | 1,890 | |
| | | | | | | | | |
| CHANGES IN SHARES OUTSTANDING: | | | | | | | | |
| Shares sold – Investor Class | | | 574,534 | | | | 36,214 | |
| Shares issued to holders as reinvestment of dividends – | | | | | | | | |
| Investor Class | | | 24,799 | | | | 47,227 | |
| Shares redeemed – Investor Class | | | (586,933 | ) | | | (109,315 | ) |
| Net increase (decrease) in shares outstanding | | | 12,400 | | | | (25,874 | ) |
The accompanying notes are an integral part of these financial statements.
| HENNESSY FUNDS | 1-800-966-4354 | |
Financial Statements
For an Investor Class share outstanding throughout each year
PER SHARE DATA:
Net asset value, beginning of year
Income from investment operations:
Net investment income
Net realized and unrealized gains (losses) on investments
Total from investment operations
Less distributions:
Dividends from net investment income
Dividends from net realized gains
Total distributions
Net asset value, end of year
TOTAL RETURN
SUPPLEMENTAL DATA AND RATIOS:
Net assets, end of year (millions)
Ratio of expenses to average net assets
Ratio of net investment income to average net assets
Portfolio turnover rate
The accompanying notes are an integral part of these financial statements.
HENNESSYFUNDS.COM
| FINANCIAL HIGHLIGHTS — INVESTOR CLASS |
| Year Ended October 31, | |
| 2016 | | | 2015 | | | 2014 | | | 2013 | | | 2012 | |
| | | | | | | | | | | | | | |
| $ | 12.37 | | | $ | 12.98 | | | $ | 12.90 | | | $ | 11.88 | | | $ | 11.13 | |
| | | | | | | | | | | | | | | | | | | |
| | | | | | | | | | | | | | | | | | | |
| | 0.04 | | | | 0.03 | | | | 0.02 | | | | 0.02 | | | | 0.04 | |
| | 0.58 | | | | (0.01 | ) | | | 0.51 | | | | 1.02 | | | | 0.75 | |
| | 0.62 | | | | 0.02 | | | | 0.53 | | | | 1.04 | | | | 0.79 | |
| | | | | | | | | | | | | | | | | | | |
| | | | | | | | | | | | | | | | | | | |
| | (0.04 | ) | | | (0.03 | ) | | | (0.01 | ) | | | (0.02 | ) | | | (0.04 | ) |
| | (0.27 | ) | | | (0.60 | ) | | | (0.44 | ) | | | — | | | | — | |
| | (0.31 | ) | | | (0.63 | ) | | | (0.45 | ) | | | (0.02 | ) | | | (0.04 | ) |
| $ | 12.68 | | | $ | 12.37 | | | $ | 12.98 | | | $ | 12.90 | | | $ | 11.88 | |
| | | | | | | | | | | | | | | | | | | |
| | 5.20 | % | | | 0.11 | % | | | 4.26 | % | | | 8.77 | % | | | 7.13 | % |
| | | | | | | | | | | | | | | | | | | |
| | | | | | | | | | | | | | | | | | | |
| $ | 12.08 | | | $ | 11.63 | | | $ | 12.54 | | | $ | 12.21 | | | $ | 25.17 | |
| | 1.68 | % | | | 1.68 | % | | | 1.75 | % | | | 1.75 | % | | | 1.54 | % |
| | 0.33 | % | | | 0.20 | % | | | 0.17 | % | | | 0.14 | % | | | 0.34 | % |
| | 51 | % | | | 34 | % | | | 23 | % | | | 22 | % | | | 17 | % |
The accompanying notes are an integral part of these financial statements.
| HENNESSY FUNDS | 1-800-966-4354 | |
Financial Statements
Notes to the Financial Statements October 31, 2016 |
1). ORGANIZATION
The Hennessy Balanced Fund (the “Fund”) is a series of Hennessy Funds Trust (the “Trust”), which was organized as a Delaware statutory trust on September 17, 1992. The Fund is an open-end management investment company registered under the Investment Company Act of 1940, as amended. The Fund is a successor to a fund with the same name (the “Predecessor Fund”) that was a series of The Hennessy Funds, Inc., a Maryland corporation, pursuant to a reorganization that took place after the close of business on February 28, 2014. Prior to February 28, 2014, the Fund had no investment operations. As a result of the reorganization, holders of Investor Class shares of the Predecessor Fund received Investor Class shares of the Fund (the Investor Class shares of the Fund are the successor to the accounting and performance information of the Predecessor Fund). The investment objective of the Fund is a combination of capital appreciation and current income. The Fund is a non-diversified fund and offers Investor Class shares.
As an investment company, the Fund follows the investment company accounting and reporting guidance of the Financial Accounting Standards Board (“FASB”) Accounting Standard Codification Topic 946 “Financial Services—Investment Companies.”
2). SIGNIFICANT ACCOUNTING POLICIES
The following is a summary of significant accounting policies consistently followed by the Fund in the preparation of the financial statements. These policies conform with U.S. generally accepted accounting principles (“GAAP”).
| a). | Investment Valuation – All investments in securities are recorded at their estimated fair value, as described in Note 3. |
| | |
| b). | Federal Income Taxes – No provision for federal income taxes or excise taxes has been made since the Fund has elected to be taxed as a “regulated investment company” and intends to distribute substantially all of its taxable income to its shareholders and otherwise comply with the provisions of the Internal Revenue Code of 1986, as amended, applicable to regulated investment companies. Net investment income or loss and realized gains and losses for federal income tax purposes may differ from that reported on the financial statements because of temporary book and tax basis differences. Temporary differences are primarily the result of the treatment of wash sales for tax reporting purposes. The Fund recognizes interest and penalties related to income tax benefits, if any, in the statement of operations as an income tax expense. Distributions from net realized gains for book purposes may include short-term capital gains, which are included as ordinary income to shareholders for tax purposes. |
| | |
| | Due to inherent differences in the recognition of income, expenses, and realized gains/losses under GAAP and federal income tax regulations, permanent differences between book and tax basis for reporting for the fiscal year ended October 31, 2016, have been identified and appropriately reclassified on the Statement of Assets and Liabilities. The adjustments are as follows: |
| | Undistributed | Accumulated | | |
| | Net Investment | Net Realized | | |
| | Income/(Loss) | Gain/(Loss) | Paid-in Capital | |
| | $2,114 | $(2,114) | $— | |
HENNESSYFUNDS.COM
| NOTES TO THE FINANCIAL STATEMENTS |
| c). | Accounting for Uncertainty in Income Taxes – The Fund has accounting policies regarding recognition and measurement of tax positions taken or expected to be taken on a tax return. The tax returns of the Fund for the prior three fiscal years are open for examination. The Fund has reviewed all open tax years in major jurisdictions and concluded that there is no impact on the Fund’s net assets and no tax liability resulting from unrecognized tax benefits relating to uncertain income tax positions taken or expected to be taken on a tax return. The Fund’s major tax jurisdictions are U.S. federal and Delaware. |
| | |
| d). | Income and Expenses – Dividend income is recognized on the ex-dividend date or as soon as information is available to the Fund. Interest income, which includes the amortization of premium and accretion of discount, is recognized on an accrual basis. The Fund is charged for those expenses that are directly attributable to the portfolio, such as advisory, administration, and certain shareholder service fees. |
| | |
| e). | Distributions to Shareholders – Dividends from net investment income for the Fund, if any, are declared and paid on a calendar quarter basis. Distributions of net realized capital gains, if any, are declared and paid annually, usually in December. |
| | |
| f). | Security Transactions – Investment and shareholder transactions are recorded on the trade date. The Fund determines the gain or loss realized from the investment transactions by comparing the original cost of the security lot sold with the net sale proceeds. Discounts and premiums on securities purchased are accreted/amortized over the life of the respective security. |
| | |
| g). | Use of Estimates – The preparation of financial statements in conformity with GAAP requires management to make estimates and assumptions that affect the reported amounts of assets and liabilities and disclosure of contingent assets and liabilities at the date of the financial statements and the reported change in net assets during the reporting period. Actual results could differ from those estimates. |
| | |
| h). | Share Valuation – The net asset value (“NAV”) per share of the Fund is calculated by dividing the sum of the value of the securities held by the Fund, plus cash or other assets, minus all liabilities (including estimated accrued expenses) by the total number of shares outstanding for the Fund, rounded to the nearest cent. The Fund’s shares will not be priced on days the New York Stock Exchange is closed for trading. The offering and redemption price per share for the Fund is equal to the Fund’s NAV per share. |
| | |
| i). | Repurchase Agreements – The Fund may enter into repurchase agreements with member banks or security dealers of the Federal Reserve Board whom the investment advisor deems creditworthy. The repurchase price generally equals the price paid by the Fund plus interest negotiated on the basis of current short-term rates. |
| | |
| | Securities pledged as collateral for repurchase agreements are held by the custodian bank until the respective agreements mature. Provisions of the repurchase agreements ensure that the market value of the collateral, including accrued interest thereon, is sufficient to cover the repurchase amount in the event of default of the counterparty. If the counterparty defaults and the value of the collateral declines or if the counterparty enters an insolvency proceeding, realization of the collateral by the Fund may be delayed or limited. During the fiscal year ended October 31, 2016, the Fund did not enter into any repurchase agreements. |
| | |
| j). | New Accounting Pronouncements – In May 2015, the FASB issued ASU No. 2015-07 “Disclosure for Investments in Certain Entities that Calculate Net Asset Value per Share (or Its Equivalent).” The amendments in ASU No. 2015-07 remove the requirement to categorize within the fair value hierarchy investments measured at NAV |
| HENNESSY FUNDS | 1-800-966-4354 | |
| and require the disclosure of sufficient information to reconcile the fair value of the remaining assets categorized within the fair value hierarchy to the financial statements. The amendments in ASU No. 2015-07 are effective for fiscal years beginning after December 15, 2015, and interim periods within those fiscal years. Management has reviewed the requirements and believes the adoption of ASU 2015-07 will not have a material impact on the Fund’s financial statements and related disclosures. |
3). SECURITIES VALUATION
The Fund follows authoritative fair valuation accounting standards that establish an authoritative definition of fair value and set out a hierarchy for measuring fair value. These standards require additional disclosures about the various inputs and valuation techniques used to develop the measurements of fair value and a discussion in changes in valuation techniques and related inputs during the period. These inputs are summarized in the three broad levels listed below:
| | Level 1 – | Unadjusted, quoted prices in active markets for identical instruments that the Fund has the ability to access at the date of measurement. |
| | | |
| | Level 2 – | Other significant observable inputs (including, but not limited to, quoted prices in active markets for similar instruments, quoted prices in markets that are not active for identical or similar instruments, and model-derived valuations in which all significant inputs and significant value drivers are observable in active markets (such as interest rates, prepayment speeds, credit risk curves, default rates, and similar data)). |
| | | |
| | Level 3 – | Significant unobservable inputs (including the Fund’s own assumptions about what market participants would use to price the asset or liability based on the best available information) when observable inputs are unavailable. |
Following is a description of the valuation techniques applied to the Fund’s major categories of assets and liabilities measured at fair value on a recurring basis.
Equity Securities – Equity securities, including common stocks, preferred stocks, exchange-traded funds, closed-end mutual funds, partnerships, rights, and real estate investment trusts, that are traded on a securities exchange for which a last-quoted sales price is readily available will generally be valued at the last sales price as reported by the primary exchange on which the securities are listed. Securities listed on The NASDAQ Stock Market (“NASDAQ”) will generally be valued at the NASDAQ Official Closing Price, which may differ from the last sales price reported. Securities traded on a securities exchange for which a last-quoted sales price is not readily available will generally be valued at the mean between the bid and ask prices. To the extent these securities are actively traded and valuation adjustments are not applied, they are classified in Level 1 of the fair value hierarchy.
Registered Investment Companies – Investments in registered investment companies (e.g., mutual funds) are generally priced at the ending NAV provided by the applicable registered investment company’s service agent and will be classified in Level 1 of the fair value hierarchy.
Debt Securities – Debt securities, including corporate bonds, asset-backed securities, mortgage-backed securities, municipal bonds, U.S. Treasuries, and U.S. government agency issues, are generally valued at market on the basis of valuations furnished by an independent pricing service that utilizes both dealer-supplied valuations and formula-based techniques. The pricing service may consider recently executed transactions in securities of the issuer or comparable issuers, market price quotations (where observable), bond spreads, and fundamental data relating to the issuer. In addition, the model may incorporate
HENNESSYFUNDS.COM
| NOTES TO THE FINANCIAL STATEMENTS |
observable market data such as reported sales of similar securities, broker quotes, yields, bids, offers, and reference data. Certain securities are valued primarily using dealer quotations. These securities are generally classified in Level 2 of the fair value hierarchy.
Short-Term Securities – Short-term equity investments, including money market funds, are valued in the manner specified above. Short-term debt investments with an original term to maturity of 60 days or less are valued at amortized cost, which approximates fair market value. If the original term to maturity of a short-term debt investment exceeded 60 days, then the values as of the 61st day prior to maturity are amortized. Amortized cost is not used if its use would be inappropriate due to credit or other impairments of the issuer, in which case the security’s fair value would be determined, as described below. Short-term securities are generally classified in Level 1 or Level 2 of the fair market hierarchy depending on the inputs used and market activity levels for specific securities.
The Board of Trustees of the Fund (the “Board”) has adopted fair value pricing procedures that are followed when a price for a security is not readily available or if a significant event has occurred that indicates the closing price of a security no longer represents the true value of that security. Fair value pricing determinations are made in good faith in accordance with these procedures. There are numerous criteria that will be given consideration in determining a fair value of a security such as the trading volume of a security and markets, the value of other like securities, and news events with direct bearing to a security or markets. Fair value pricing results in an estimated price for a security that reflects the amount the Fund might reasonably expect to receive in a current sale. Depending on the relative significance of the valuation inputs, these securities may be classified in either Level 2 or Level 3 of the fair value hierarchy.
The Board has delegated day-to-day valuation matters to a Valuation Committee comprised of one or more representatives from Hennessy Advisors, Inc., the Fund’s investment advisor. The function of the Valuation Committee is to value securities where current and reliable market quotations are not readily available. All actions taken by the Valuation Committee are reviewed by the Board.
The Fund has performed an analysis of all existing investments to determine the significance and character of all inputs to their fair value determination. Various inputs are used in determining the value of the Fund’s investments. The inputs or methodology used for valuing securities are not necessarily an indication of the risk associated with investing in those securities. Details related to the fair valuation hierarchy of the Fund’s securities as of October 31, 2016, are included in the Fund’s Schedule of Investments.
4). INVESTMENT TRANSACTIONS
Purchases and sales of investment securities (excluding government and short-term investments) for the Fund during the fiscal year ended October 31, 2016, were $3,639,046 and $3,947,953, respectively.
There were no purchases or sales/maturities of long-term U.S. government securities for the Fund during the fiscal year ended October 31, 2016.
The Fund is permitted to purchase or sell securities from or to another fund in the Hennessy Funds family of funds (the “Hennessy Funds”) under specified conditions outlined in procedures adopted by the Board of Trustees. The procedures have been designed to ensure that any purchase or sale of securities by the Fund from or to another Hennessy Fund complies with Rule 17a-7 of the Investment Company Act of 1940. For the fiscal year ended October 31, 2016, the Fund did not engage in purchases and sales of securities pursuant to Rule 17a-7 of the Investment Company Act of 1940.
| HENNESSY FUNDS | 1-800-966-4354 | |
5). INVESTMENT MANAGEMENT FEE AND OTHER TRANSACTIONS WITH AFFILIATES
Hennessy Advisors, Inc. (the “Advisor”) is the investment advisor of the Fund. The Advisor provides the Fund with investment management services under an Investment Advisory Agreement. The Advisor furnishes all investment advice, office space, facilities, and provides most of the personnel needed by the Fund. As compensation for its services, the Advisor is entitled to a monthly fee from the Fund. The fee is based upon the average daily net assets of the Fund at the annual rate of 0.60%. The net investment advisory fees payable by the Fund as of October 31, 2016, were $6,234.
The Board has approved a Shareholder Servicing Agreement for the Fund, which was instituted to compensate the Advisor for the non-investment management services it provides to the Fund. The Shareholder Servicing Agreement provides for a monthly fee paid to the Advisor at an annual rate of 0.10% of the average daily net assets of the Fund. Shareholder service fees payable by the Fund as of October 31, 2016, were $1,039.
The Fund has adopted a plan pursuant to Rule 12b-1 under the Investment Company Act of 1940, as amended, that authorizes payments in connection with the distribution of the Fund’s shares at an annual rate of up to 0.25% of the Fund’s average daily net assets, although the Fund is currently only using up to 0.15% of its average daily net assets for such purpose. Amounts paid under the plan may be spent on any activities or expenses primarily intended to result in the sale of shares, including, but not limited to, advertising, shareholder account servicing, the printing and mailing of prospectuses to other than current shareholders, the printing and mailing of sales literature, and compensation for sales and marketing activities or to financial institutions and others, such as dealers and distributors.
The Fund has entered into agreements with various brokers, dealers, and financial intermediaries in connection with the sale of shares of the Fund. The agreements provide for periodic payments by the Fund to the brokers, dealers, and financial intermediaries for providing certain shareholder maintenance services (sub-transfer agent expenses). These shareholder services include the pre-processing and quality control of new accounts, shareholder correspondence, answering customer inquiries regarding account status, and facilitating shareholder telephone transactions. Fees paid by the Fund to various brokers, dealers, and financial intermediaries during the fiscal year ended October 31, 2016, were $13,539.
U.S. Bancorp Fund Services, LLC (“USBFS”) provides the Fund with administrative, fund accounting, and transfer agent services and necessary office equipment. As administrator, USBFS is responsible for activities such as (i) preparing various federal and state regulatory filings, reports, and returns for the Fund, (ii) preparing reports and materials to be supplied to the Board, (iii) monitoring the activities of the Fund’s custodian, transfer agent, and accountants, and (iv) coordinating the preparation and payment of the Fund’s expenses and reviewing the Fund’s expense accruals. Fees paid to USBFS during the fiscal year ended October 31, 2016, were $13,627.
U.S. Bank, N.A., an affiliate of USBFS, serves as the Fund’s custodian. Quasar Distributors, LLC acts as the Fund’s principal underwriter in a continuous public offering of the Fund’s shares. Quasar Distributors, LLC is an affiliate of USBFS and U.S. Bank, N.A.
The officers of the Fund are affiliated with the Advisor. Such officers, with the exception of the Chief Compliance Officer and the Senior Compliance Officer, receive no compensation from the Fund for serving in their respective roles. The Fund, along with the other Hennessy Funds, makes reimbursement payments, on an equal basis, to the Advisor for a portion of the salary and benefits associated with the office of the Chief
HENNESSYFUNDS.COM
| NOTES TO THE FINANCIAL STATEMENTS |
Compliance Officer and for all of the salary and benefits associated with the office of the Senior Compliance Officer. Such amounts are included on the Statement of Operations.
6). GUARANTEES AND INDEMNIFICATIONS
Under the Hennessy Funds’ organizational documents, their officers and trustees are indemnified by the Hennessy Funds against certain liabilities arising out of the performance of their duties to the Hennessy Funds. Additionally, in the normal course of business, the Hennessy Funds enter into contracts with service providers that contain general indemnification clauses. The Fund’s maximum exposure under these arrangements is unknown as this would involve future claims that may be made against the Fund that have not yet occurred. Currently, the Fund expects the risk of loss to be remote.
7). LINE OF CREDIT
The Fund has an uncommitted line of credit with the other Hennessy Funds in the amount of the lesser of (i) $100,000,000 or (ii) 33.33% of each Hennessy Fund’s net assets, or 30% for the Hennessy Gas Utility Fund and 10% for the Fund, intended to provide short-term financing, if necessary, subject to certain restrictions, in connection with shareholder redemptions. The credit facility is with the Hennessy Funds’ custodian bank, U.S. Bank, N.A. Borrowings under this arrangement bear interest at the bank’s prime rate and are secured by all of the Fund’s assets (as to its own borrowings only). During the fiscal year ended October 31, 2016, the Fund had an outstanding average daily balance and a weighted average interest rate of $36,541 and 3.47%, respectively. The maximum amount outstanding for the Fund during the period was $1,600,000. At October 31, 2016, the Fund did not have any borrowings outstanding under the line of credit.
8). FEDERAL TAX INFORMATION
As of October 31, 2016, the components of accumulated earnings (losses) for income tax purposes were as follows:
| | Cost of investments for tax purposes | | $ | 11,530,781 | |
| | Gross tax unrealized appreciation | | $ | 667,411 | |
| | Gross tax unrealized depreciation | | | (62,064 | ) |
| | Net tax unrealized appreciation | | $ | 605,347 | |
| | Undistributed ordinary income | | $ | 43,032 | |
| | Undistributed long-term capital gains | | | 802,204 | |
| | Total distributable earnings | | $ | 845,236 | |
| | Other accumulated loss | | $ | — | |
| | Total accumulated gain | | $ | 1,450,583 | |
The difference between book-basis unrealized appreciation/depreciation (as shown in the Statement of Assets and Liabilities) and tax-basis unrealized appreciation/depreciation (as shown above) is attributable primarily to wash sales.
At October 31, 2016, the Fund had no tax basis capital losses to offset future capital gains.
At October 31, 2016, the Fund did not defer, on a tax basis, any post-December late year ordinary loss deferrals.
| HENNESSY FUNDS | 1-800-966-4354 | |
During the fiscal years ended October 31, 2016 and 2015, the tax character of distributions paid by the Fund was as follows:
| | | Year Ended | | | Year Ended | |
| | | October 31, 2016 | | | October 31, 2015 | |
Ordinary income(1) | | $ | 66,296 | | | $ | 39,518 | |
| Long-term capital gain | | | 238,468 | | | | 562,714 | |
| | | $ | 304,764 | | | $ | 602,232 | |
(1) Ordinary income includes short-term gain or loss.
9). EVENTS SUBSEQUENT TO YEAR END
Management has evaluated the Fund’s related events and transactions that occurred subsequent to October 31, 2016, through the date of issuance of the Fund’s financial statements. Other than as disclosed below, management has determined that there were no subsequent events requiring recognition or disclosure in the financial statements.
On December 7, 2016, capital gains were declared and paid to shareholders of record as of December 6, 2016, as follows:
| | | Amount Per Share | |
| | | Long-term | | | Short-term | |
| Investor Class | | $ | 0.85723 | | | $ | 0.04599 | |
HENNESSYFUNDS.COM
| NOTES TO THE FINANCIAL STATEMENTS |
(This Page Intentionally Left Blank.)
| HENNESSY FUNDS | 1-800-966-4354 | |
Report of Independent Registered Public Accounting Firm
The Board of Trustees of Hennessy Funds Trust
and Shareholders of the Hennessy Balanced Fund:
We have audited the accompanying statement of assets and liabilities of the Hennessy Balanced Fund (the Fund), a series of Hennessy Funds Trust, including the schedule of investments, as of October 31, 2016, and the related statement of operations for the year then ended, the statements of changes in net assets for each of the years in the two year period then ended, and the financial highlights for each of the years in the five year period then ended. These financial statements and financial highlights are the responsibility of the Fund’s management. Our responsibility is to express an opinion on these financial statements and financial highlights based on our audits.
We conducted our audits in accordance with the standards of the Public Company Accounting Oversight Board (United States). Those standards require that we plan and perform the audit to obtain reasonable assurance about whether the financial statements and financial highlights are free of material misstatement. An audit includes examining, on a test basis, evidence supporting the amounts and disclosures in the financial statements. Our procedures included confirmation of securities owned as of October 31, 2016, by correspondence with custodians and brokers or by other appropriate auditing procedures. An audit also includes assessing the accounting principles used and significant estimates made by management, as well as evaluating the overall financial statement presentation. We believe that our audits provide a reasonable basis for our opinion.
In our opinion, the financial statements and financial highlights referred to above present fairly, in all material respects, the financial position of the Fund as of October 31, 2016, the results of its operations for the year then ended, the changes in its net assets for each of the years in the two year period then ended, and the financial highlights for each of the years in the five year period then ended, in conformity with U.S. generally accepted accounting principles.
Chicago, Illinois
December 22, 2016
HENNESSYFUNDS.COM
| REPORT OF INDEPENDENT REGISTERED PUBLIC ACCOUNTING FIRM/TRUSTEES AND OFFICERS |
Trustees and Officers of the Fund (Unaudited)
The business and affairs of the Fund are managed under the direction of the Board of Trustees of the Trust, and the Board of Trustees elects the Officers of the Trust. Beginning in March 2015, the Board of Trustees has from time to time appointed advisers (“Advisers”) to the Board of Trustees, with the intention of having qualified individuals serve in an advisory capacity in order to garner experience in the mutual fund and asset management industry and be considered as potential Trustees in the future. There are currently three Advisers to the Board of Trustees: Brian Alexander, Doug Franklin, and Claire Knoles. As Advisers, Mr. Alexander, Mr. Franklin, and Ms. Knoles attend meetings of the Board and act as non-voting participants. Information pertaining to the Trustees, Advisers, and the Officers of the Trust is set forth below. The Trustees and Officers serve until their successors are duly elected and qualified or until their earlier death, resignation, or removal. Each of the Trustees oversees 16 Hennessy Funds. Unless otherwise indicated, the address of all persons listed below is 7250 Redwood Boulevard, Suite 200, Novato, CA 94945. The Fund’s Statement of Additional Information includes more information about the persons listed below and is available, without charge, upon request by calling 1-800-966-4354.
| | | | Other |
| | | | Directorships |
| | | | Held Outside |
| Name, (Year of Birth), | | | of Fund |
| and Position Held | Start Date | Principal Occupation(s) | Complex During |
with the Trust | of Service | During Past Five Years | Past Five Years(1) |
| | | | |
| Disinterested Trustees and Advisers | | |
| | | | |
| J. Dennis DeSousa | January 1996 | Mr. DeSousa is a real estate investor. | None. |
| (1936) | | | |
| Trustee | | | |
| | | | |
| Robert T. Doyle | January 1996 | Mr. Doyle has been the Sheriff of | None. |
| (1947) | | Marin County, California since 1996. | |
| Trustee | | | |
| | | | |
| Gerald P. Richardson | May 2004 | Mr. Richardson is an independent | None. |
| (1945) | | consultant in the securities industry. | |
| Trustee | | | |
| | | | |
| Brian Alexander | March 2015 | Mr. Alexander has been employed | None. |
| (1981) | | by Sutter Health Novato Community | |
| Adviser to the Board | | Hospital since 2012, first as an | |
| | | Assistant Administrator and then, | |
| | | beginning in 2013, as the Chief | |
| | | Administrative Officer. From 2011 | |
| | | through 2012, Mr. Alexander was | |
| | | employed by Sutter Health West Bay | |
| | | Region as the Regional Director of | |
| | | Strategic Decision Support. Prior to | |
| | | that, in 2011, he served as the | |
| | | Director of Managed Care | |
| | | Contracting and also the Director of | |
| | | Compensation, Benefits, and | |
| | | Compliance for the Rehabilitation | |
| | | Institute of Chicago. | |
| HENNESSY FUNDS | 1-800-966-4354 | |
| | | | Other |
| | | | Directorships |
| | | | Held Outside |
| Name, (Year of Birth), | | | of Fund |
| and Position Held | Start Date | Principal Occupation(s) | Complex During |
with the Trust | of Service | During Past Five Years | Past Five Years(1) |
| | | | |
| Doug Franklin | March 2016 | Mr. Franklin is a retired insurance | None. |
| (1964) | | industry executive. From 1987 | |
| Adviser to the Board | | through 2015, he was employed by | |
| | | the Allianz-Fireman’s Fund Insurance | |
| | | Company in various positions, | |
| | | including as its Chief Actuary and | |
| | | Chief Risk Officer. | |
| | | | |
| Claire Knoles | December 2015 | Ms. Knoles is a founder of Kiosk and | None. |
| (1974) | | has served as its Chief Operating | |
| Adviser to the Board | | Officer since 2004. Kiosk is a full | |
| | | service marketing agency with | |
| | | offices in the San Francisco Bay | |
| | | Area, Toronto, and Liverpool, UK. | |
| | | | |
Interested Trustee(2) | | | |
| | | | |
| Neil J. Hennessy | January 1996 as | Mr. Hennessy has been employed by | Hennessy |
| (1956) | a Trustee and | Hennessy Advisors, Inc. since 1989 | Advisors, Inc. |
| Trustee, Chairman of | June 2008 as | and currently serves as its President, | |
| the Board, Chief | an Officer | Chairman and Chief Executive Officer. | |
| Investment Officer, | | | |
| Portfolio Manager, | | | |
| and President | | | |
| Name, (Year of Birth), | | |
| and Position Held | Start Date | Principal Occupation(s) |
with the Trust | of Service | During Past Five Years |
| | | |
| Officers | | |
| | | |
| Teresa M. Nilsen | January 1996 | Ms. Nilsen has been employed by Hennessy Advisors, Inc. |
| (1966) | | since 1989 and currently serves as its Executive Vice President, |
| Executive Vice President | | Chief Operations Officer, Chief Financial Officer, and Secretary. |
| and Treasurer | | |
| | | |
| Daniel B. Steadman | March 2000 | Mr. Steadman has been employed by Hennessy Advisors, Inc. |
| (1956) | | since 2000 and currently serves as its Executive Vice President |
| Executive Vice President | | and Chief Compliance Officer. |
| and Secretary | | |
| | | |
| Jennifer Cheskiewicz | June 2013 | Ms. Cheskiewicz has been employed by Hennessy Advisors, Inc. |
| (1977) | | as its General Counsel since June 2013. She previously served |
| Senior Vice President and | | as in-house counsel to Carlson Capital, L.P., an SEC-registered |
| Chief Compliance Officer | | investment advisor to several private funds, from |
| | | February 2010 to May 2013. |
| | | |
| Brian Carlson | December 2013 | Mr. Carlson has been employed by Hennessy Advisors, Inc. |
| (1972) | | since December 2013. Mr. Carlson was previously a co-founder |
| Senior Vice President and | | and principal of Trivium Consultants, LLC from February 2011 |
| Head of Distribution | | through November 2013. |
HENNESSYFUNDS.COM
| TRUSTEES AND OFFICERS OF THE FUND |
| Name, (Year of Birth), | | |
| and Position Held | Start Date | Principal Occupation(s) |
with the Trust | of Service | During Past Five Years |
| | | |
| David Ellison | October 2012 | Mr. Ellison has been employed by Hennessy Advisors, Inc. since |
(1958)(3) | | October 2012. He has served as a Portfolio Manager of the |
| Senior Vice President and | | Hennessy Small Cap Financial Fund, the Hennessy Large Cap |
| Portfolio Manager | | Financial Fund, and the Hennessy Technology Fund since |
| | | inception. Prior to that, Mr. Ellison served as Director, CIO and |
| | | President of FBR Fund Advisers, Inc. from December |
| | | 1999 to October 2012. |
| | | |
| Brian Peery | March 2003 as | Mr. Peery has been employed by Hennessy Advisors, Inc. since |
| (1969) | an Officer and | 2002. He has served as a Portfolio Manager of the Hennessy |
| Senior Vice President and | February 2011 | Cornerstone Growth Fund, the Hennessy Cornerstone Mid Cap |
| Portfolio Manager | as a Co-Portfolio | 30 Fund, the Hennessy Cornerstone Large Growth Fund, the |
| | Manager or | Hennessy Cornerstone Value Fund, the Hennessy Total Return |
| | Portfolio Manager | Fund, and the Hennessy Balanced Fund since October 2014. |
| | | He served as Co-Portfolio Manager of the same funds from |
| | | February 2011 through September 2014. Mr. Peery has also |
| | | served as a Portfolio Manager of the Hennessy Gas Utility Fund |
| | | since February 2015. |
| | | |
| Winsor (Skip) Aylesworth | October 2012 | Mr. Aylesworth has been employed by Hennessy Advisors, Inc. |
(1947)(3) | | since October 2012. He has served as a Portfolio Manager of |
| Vice President and | | the Hennessy Gas Utility Fund since 1998 and as a Portfolio |
| Portfolio Manager | | Manager of the Hennessy Technology Fund since inception. |
| | | Prior to that, Mr. Aylesworth served as Executive Vice President |
| | | of FBR Fund Advisers, Inc. from 1999 to October 2012. |
| | | |
| Ryan Kelley | March 2013 | Mr. Kelley has been employed by Hennessy Advisors, Inc. since |
(1972)(4) | | October 2012. He has served as a Portfolio Manager of the |
| Vice President and | | Hennessy Gas Utility Fund, the Hennessy Small Cap Financial |
| Portfolio Manager | | Fund, and the Hennessy Large Cap Financial Fund since |
| | | October 2014. He served as Co-Portfolio Manager of the same |
| | | funds from March 2013 through September 2014, and as a |
| | | Portfolio Analyst for the Hennessy Funds from October 2012 |
| | | through February 2013. Prior to that, Mr. Kelley served as |
| | | Portfolio Manager of FBR Fund Advisers, Inc. from |
| | | January 2008 to October 2012. |
_______________
(1) | Messrs. DeSousa, Doyle, Hennessy, and Richardson previously served on the Board of Directors of Hennessy Mutual Funds, Inc. (“HMFI”), The Hennessy Funds, Inc. (“HFI”), and Hennessy SPARX Funds Trust (“HSFT”). Pursuant to an internal reorganization effective as of February 28, 2014, the series of HFMI, HFI, and HSFT were reorganized into corresponding series of Hennessy Funds Trust that mirrored them. Subsequent to the reorganization, HFMI, HFI, and HSFT were dissolved. |
(2) | Mr. Hennessy is considered an “interested person,” as defined in the Investment Company Act of 1940, as amended, because he is an officer of the Hennessy Funds. |
(3) | The address of these officers is 101 Federal Street, Suite 1900, Boston, MA 02110. |
(4) | The address of this officer is 1340 Environ Way, Suite 305, Chapel Hill, NC 27517. |
| HENNESSY FUNDS | 1-800-966-4354 | |
Expense Example (Unaudited)
October 31, 2016
As a shareholder of the Fund, you incur two types of costs: (1) transaction costs, including sales charges (loads) on purchase payments, reinvested dividends, or other distributions; redemption fees; and exchange fees; and (2) ongoing costs, including management fees; service fees; and other Fund expenses. This Example is intended to help you understand your ongoing costs (in dollars) of investing in the Fund and to compare these costs with the ongoing costs of investing in other mutual funds. The Example is based on an investment of $1,000 invested at the beginning of the period and held for the entire period from May 1, 2016, through October 31, 2016.
Actual Expenses
The first line of the table below provides information about actual account values and actual expenses. Although the Fund charges no sales loads or transaction fees, you will be assessed fees for outgoing wire transfers, returned checks and stop payment orders at prevailing rates charged by U.S. Bancorp Fund Services, LLC, the Fund’s transfer agent. If you request that a redemption be made by wire transfer, currently a $15 fee is charged by the Fund’s transfer agent. IRA accounts will be charged a $15 annual maintenance fee. The example below includes, but is not limited to, management fees, shareholder servicing fees, fund accounting, custody, and transfer agent fees. However, the example below does not include portfolio trading commissions and related expenses, and other extraordinary expenses as determined under generally accepted accounting principles. You may use the information in this line, together with the amount you invested, to estimate the expenses that you paid over the period. Simply divide your account value by $1,000 (for example, an $8,600 account value divided by $1,000 = 8.6), then multiply the result by the number in the first line of the table under the heading entitled “Expenses Paid During Period” to estimate the expenses you paid on your account during this period.
Hypothetical Example for Comparison Purposes
The second line of the table below provides information about hypothetical account values and hypothetical expenses based on the Fund’s actual expense ratios and an assumed rate of return of 5% per year before expenses, which is not the Fund’s actual return. The hypothetical account values and expenses may not be used to estimate the actual ending account balance or expenses you paid for the period. You may use this information to compare the ongoing costs of investing in the Fund and other funds. To do so, compare this 5% hypothetical example with the 5% hypothetical examples that appear in the shareholder reports of the other funds. Please note that the expenses shown in the table are meant to highlight your ongoing costs only and do not reflect any transactional costs, such as sales charges (loads), or exchange fees. Therefore, the second line of the table is useful in comparing ongoing costs only, and will not help you determine the relative total costs of owning different funds. In addition, if these transactional costs were included, your costs would have been higher.
HENNESSYFUNDS.COM
| | | | Expenses Paid |
| | Beginning | Ending | During Period(1) |
| | Account Value | Account Value | May 1, 2016 – |
| | May 1, 2016 | October 31, 2016 | October 31, 2016 |
| Investor Class | | | |
| Actual | $1,000.00 | $1,018.40 | $8.73 |
| Hypothetical (5% return before expenses) | $1,000.00 | $1,016.49 | $8.72 |
(1) | Expenses are equal to the Fund’s annualized expense ratio of 1.72% multiplied by the average account value over the period, multiplied by 184/366 days (to reflect one-half year period). |
| HENNESSY FUNDS | 1-800-966-4354 | |
How to Obtain a Copy of the Fund’s
Proxy Voting Policy and Proxy Voting Records
A description of the policies and procedures the Fund uses to determine how to vote proxies relating to portfolio securities is available without charge: (1) by calling 1-800-966-4354; (2) on the Hennessy Funds’ website at hennessyfunds.com/proxy-voting/policy.fs; or (3) on the U.S. Securities and Exchange Commission’s website at www.sec.gov. The Fund’s proxy voting record is available without charge on both the Hennessy Funds’ website at hennessyfunds.com/proxy-voting/vote.fs and the SEC’s website at www.sec.gov no later than August 31 for the prior 12 months ending June 30.
Quarterly Filings on Form N-Q
The Fund files its complete schedule of portfolio holdings with the SEC for the first and third quarters of each fiscal year on Form N-Q. The Fund’s Form N-Q will be available on the SEC’s website at www.sec.gov. The Fund’s Form N-Q may be reviewed and copied at the SEC’s Public Reference Room in Washington, DC and information on the operation of the Public Reference Room may be obtained by calling 1-800-SEC-0330. Information included in the Fund’s N-Q will also be available upon request by calling 1-800-966-4354.
Federal Tax Distribution Information
(Unaudited)
For the fiscal year ended October 31, 2016, certain dividends paid by the Fund may be subject to a maximum tax rate of 23.8%, as provided for by the Jobs and Growth Tax Relief Reconciliation Act of 2003. The percentage of dividends declared from ordinary income designated as qualified dividend income was 100%.
For corporate shareholders, the percent of ordinary income distributions that qualified for the corporate dividends received deduction for the fiscal year ended October 31, 2016, was 100%.
The percentage of taxable ordinary income distributions that are designated as short-term capital gain distributions under Section 871(k)(2)(C) of the Internal Revenue Code of 1986, as amended, for the Fund was 26.83%.
Householding
To help keep the Fund’s costs as low as possible, we generally deliver a single copy of most financial reports and prospectuses to shareholders who share an address, even if the accounts are registered under different names. This process, known as “householding,” does not apply to account statements. You may, of course, request an individual copy of a prospectus or financial report at any time. If you would like to receive separate mailings, please call the Administrator at 1-800-261-6950 or 1-414-765-4124 and we will begin individual delivery within 30 days of your request. If your account is held through a financial institution or other intermediary, please contact them directly to request individual delivery.
HENNESSYFUNDS.COM
| PROXY VOTING — PRIVACY POLICY |
Privacy Policy
We collect the following non-public personal information about you:
| | • | information we receive from you on or in applications or other forms, correspondence, or conversations, including, but not limited to, your name, address, phone number, social security number, assets, income, and date of birth; and |
| | | |
| | • | information about your transactions with us, our affiliates, or others, including, but not limited to, your account number and balance, payment history, parties to transactions, cost basis information, and other financial information. |
We do not disclose any non-public personal information about our current or former shareholders to non-affiliated third parties, except as permitted by law. For example, we are permitted by law to disclose all of the information we collect, as described above, to our Transfer Agent to process your transactions. Furthermore, we restrict access to your non-public personal information to those persons who require such information to provide products or services to you. We maintain physical, electronic, and procedural safeguards that comply with federal standards to guard your non-public personal information.
In the event that you hold shares of the Fund through a financial intermediary, including, but not limited to, a broker-dealer, bank or trust company, the privacy policy of your financial intermediary would govern how your non-public personal information would be shared with non-affiliated third parties.
| HENNESSY FUNDS | 1-800-966-4354 | |
(This Page Intentionally Left Blank.)
For information, questions or assistance, please call
The Hennessy Funds
1-800-966-4354 or 1-415-899-1555
INVESTMENT ADVISOR
Hennessy Advisors, Inc.
7250 Redwood Blvd., Suite 200
Novato, California 94945
ADMINISTRATOR,
TRANSFER AGENT,
DIVIDEND PAYING AGENT &
SHAREHOLDER SERVICING AGENT
U.S. Bancorp Fund Services, LLC
P.O. Box 701
Milwaukee, Wisconsin 53201-0701
CUSTODIAN
U.S. Bank N.A.
Custody Operations
1555 North River Center Dr., Suite 302
Milwaukee, Wisconsin 53212
TRUSTEES
Neil J. Hennessy
Robert T. Doyle
J. Dennis DeSousa
Gerald P. Richardson
COUNSEL
Foley & Lardner LLP
777 East Wisconsin Avenue
Milwaukee, Wisconsin 53202-5306
INDEPENDENT REGISTERED
PUBLIC ACCOUNTING FIRM
KPMG LLP
200 East Randolph Street
Chicago, Illinois 60601
DISTRIBUTOR
Quasar Distributors, LLC
615 East Michigan Street
Milwaukee, Wisconsin 53202
hennessyfunds.com | 1-800-966-4354
This report has been prepared for shareholders and may be distributed to
others only if preceded or accompanied by a current prospectus.
ANNUAL REPORT
OCTOBER 31, 2016
HENNESSY CORE BOND FUND
Investor Class HCBFX
Institutional Class HCBIX
hennessyfunds.com | 1-800-966-4354
(This Page Intentionally Left Blank.)
Contents
| Letter to Shareholders | | | 2 |
| Performance Overview | | | 4 |
| Financial Statements | | | |
| Schedule of Investments | | | 6 |
| Statement of Assets and Liabilities | | | 12 |
| Statement of Operations | | | 13 |
| Statements of Changes in Net Assets | | | 14 |
| Financial Highlights | | | 16 |
| Notes to the Financial Statements | | | 20 |
| Report of Independent Registered Public Accounting Firm | | | 30 |
| Trustees and Officers of the Fund | | | 31 |
| Expense Example | | | 34 |
| Proxy Voting | | | 36 |
| Quarterly Filings on Form N-Q | | | 36 |
| Federal Tax Distribution Information | | | 36 |
| Householding | | | 36 |
| Privacy Policy | | | 37 |
| HENNESSY FUNDS | 1-800-966-4354 | |
December 2016
Dear Hennessy Funds Shareholder:
Over the past year investors here in the U.S. and around the world have weathered a great deal of turmoil, especially in the political arena. Foremost, the bitterly divisive and all-consuming U.S. Presidential election, with its unanticipated outcome, is finally behind us. While the equity markets were jittery at first, they now appear more comfortable with the prospect of a Trump presidency and seem to be looking forward to diminished government regulation and intervention.
The Brexit vote in the U.K. cast a shadow over the European Union’s future. There remains uncertainty over the details and timing of the break and the economic consequences for both Britain and Europe, but early signs suggest the impact on growth in Britain will not be as severe as initially feared.
Additionally, uncertainty over whether the Federal Reserve would raise short-term interest rates has hung over the economy for well over a year now. The effects that higher rates could have on growth, the strength of the U.S. Dollar, corporate profits and loan supply and demand seem to have weighed heavily on investors, causing paralysis and money to remain on the sidelines of the market.
Despite all these concerns, U.S. equity markets have pushed higher, with both the Dow Jones Industrial Average and S&P 500 Index posting returns of approximately 5% during the twelve-month period ended October 31, 2016. The U.S. economy has continued to grow at a respectable annual rate of about 2%, and corporate profits have started to move higher. Today, as of mid-December, bond and Treasury yields have risen a bit from record lows just this summer, and the bond market is finishing the year on slightly rocky footing. Bond yields are still very low relative to historical averages, while the prospective PE multiples for the Dow Jones Industrial Average and S&P 500 Index are just above long-term averages at 18.0x and 18.9x, respectively. We believe that equity valuations could go considerably higher and still be at appropriate levels relative to bond yields. And, while we do expect the Fed to raise interest rates in the coming year, we believe that inflation will stay under control, so that short-term interest rates will not have to rise too fast or too far.
As I reflect over the past twelve months, what I realize is that many of the worries this year are not new. For the past several years, American businesses have operated in an environment characterized by highly partisan politics, mounting regulations, uncertainty over interest rates, and a lack of clarity regarding taxes and healthcare costs. Despite all these headwinds, U.S. corporations have been incredibly resilient and found ways to impress investors. If the newly elected administration follows through on campaign promises of reigning in regulation, lowering taxes for corporations and individuals, or reforming healthcare to drive down costs, then companies, which are already lean, should be able to post higher profits. And, that growth should lead to more jobs and a stronger economy, potentially creating a very positive cycle going forward.
With the bull market in U.S. equities entering its ninth year, many believe the economy is due for a recession and the market is due for a downturn. But, the euphoria that usually accompanies a peak in the market is absent. Since the recovery began after the financial crisis, I have found myself pondering the bull run of 1982 to 2000, powered, in part, by a significant increase in valuations. I believe today’s market displays the fundamentals to sustain a similarly strong and lengthy bull market. Meanwhile, companies are largely profitable and many corporate balance sheets are cash-rich, with
HENNESSYFUNDS.COM
relatively little debt. Unemployment is low and real wages are rising, helping to drive consumption. We are hopeful that these factors will provide support for positive market returns in the year to come.
Thank you for your continued confidence and investment in our funds. If you have any questions or would like to speak with us directly, please don’t hesitate to call us at (800) 966-4354.
Best regards,
Neil J. Hennessy
President and Chief Investment Officer
Past performance does not guarantee future results.
Mutual fund investing involves risk. Principal loss is possible.
Opinions expressed are those of Neil Hennessy and are subject to change, are not guaranteed and should not be considered investment advice.
The Dow Jones Industrial Average and S&P 500 Index are unmanaged indices commonly used to measure the performance of U.S. stocks. One cannot invest directly in an index.
PE, or price to earnings, is calculated by dividing a company’s market price per share by its earnings per share.
| HENNESSY FUNDS | 1-800-966-4354 | |
Performance Overview (Unaudited)
CHANGE IN VALUE OF $10,000 INVESTMENT
This graph illustrates the performance of an initial investment of $10,000 made in the Fund ten years ago and assumes the reinvestment of dividends.
AVERAGE ANNUAL TOTAL RETURN FOR PERIODS ENDED OCTOBER 31, 2016
| | One | Five | Ten |
| | Year | Years | Years |
| Hennessy Core Bond Fund – | | | |
| Investor Class (HCBFX) | -0.28% | 1.64% | 3.57% |
| Hennessy Core Bond Fund – | | | |
| Institutional Class (HCBIX) | 0.23% | 1.96% | 3.86% |
| Bloomberg Barclays Intermediate | | | |
| U.S. Government/Credit Index | 3.19% | 2.30% | 4.07% |
Expense ratios: 3.20% (Investor Class); 2.83% (Institutional Class)
Performance data quoted represents past performance; past performance does not guarantee future results. The investment return and principal value of an investment will fluctuate so that an investor’s shares, when redeemed, may be worth more or less than their original cost. The performance graph and table do not reflect the deduction of taxes that a shareholder would pay on Fund distributions or the redemption of Fund shares. Current performance of the Fund may be lower or higher than the performance quoted. Performance data current to the most recent month end may be obtained by visiting hennessyfunds.com. Performance for the period from March 12, 2010 to October 26, 2012 is that of the FBR Core Bond Fund and for the periods prior to March 12, 2010 is that of the AFBA 5 Star Total Return Bond Fund.
The expense ratios presented are from the most recent prospectus.
PERFORMANCE NARRATIVE
Portfolio Managers Gary B. Cloud, CFA, and Peter G. Greig, CFA
Financial Counselors, Inc. (sub-advisor)
Performance:
For the twelve-month period ended October 31, 2016, the Investor Class of the Hennessy Core Bond Fund returned -0.28%, underperforming the Bloomberg Barclays Intermediate U.S. Government/Credit Index, which returned 3.19% for the same period.
HENNESSYFUNDS.COM
The overweight position in investment grade corporate credit was the largest contributor to the Fund’s performance over the past twelve months. Issue selection drove most of this performance. The income and aging from these higher-yielding investment grade securities exceeded the amount represented in the benchmark. The Fund’s slight exposure to preferred stocks and high-yield credit securities, or junk bonds, was another positive factor adding to performance. Effective duration was the largest detractor to overall performance compared to the benchmark. Portfolio convexity and volatility were neutral contributors to overall performance.
Investment Outlook:
In our opinion, the last few months may have marked the beginning of a slow change in central bank monetary policy worldwide. It might be too soon to ring the death knell for quantitative easing, but it is possible that progress towards even lower negative interest rates in Japan, Europe and Switzerland has been halted. Part of the reasoning behind this change in policy is the realization by many central bankers that negative interest rates can cause more harm than expected to the business models of financial intermediaries like banks and insurance companies, while their macroeconomic benefit has not been as apparent as hoped.
Over the last twelve months, we have also witnessed a further reduction in consensus expectations among Federal Reserve Bank members regarding the timing and magnitude of rate increases over the next few years. Publications from the Federal Reserve now indicate that members expect two rate hikes in 2017 and three in 2018. For the first time in this lengthy rate-hiking cycle, both Federal Reserve Bank members and market participants see a fairly similar pathway forward for the level of short-term interest rates. This is significant because harmony between the Federal Reserve and market expectations reduces the possibility of surprises for the markets and a potential policy error.
As we look forward, prospects for economic growth remain subdued. Unanticipated election results in the United States and Europe coupled with a nationalist and populist electoral surge hurt prospects for trade liberalization and economic cooperation. Brexit negotiations with the European Union next year will add to political and economic uncertainty. Conflict in the Middle East, South China Sea disputes and potential terrorism events, all contribute to the unsettling political and social environment around the world. Overall, we expect to see modest rate movements in either direction as economic and political events dictate trading levels.
_______________
Opinions expressed are those of the Portfolio Managers as of the date written and are subject to change, are not guaranteed, and should not be considered investment advice or an indication of trading intent.
The Bloomberg Barclays Intermediate U.S. Government/Credit Index is an unmanaged index commonly used to measure the performance of U.S. bonds. One cannot invest directly in an index.
Investments in debt securities typically decrease in value when interest rates rise. The risk is greater for longer-term debt securities. Investments by the Fund in lower-rated and non-rated securities presents a greater risk of loss to principal and interest than higher-rated securities. Investments in Asset-Backed and Mortgage-Backed securities include additional risks that investors should be aware of including credit risk, prepayment risk, possible illiquidity and default, as well as increased susceptibility to adverse economic developments. Investments in foreign securities may involve political, economic and currency risks, greater volatility and differences in accounting methods. The Fund may experience higher fees due to investments in pooled investment vehicles (including ETFs). Please see the Fund’s prospectus for a more complete discussion of these and other risks.
References to specific securities should not be considered a recommendation to buy or sell any security. Fund holdings and sector allocations are subject to change. Please refer to the Schedule of Investments included in this report for additional portfolio information.
| HENNESSY FUNDS | 1-800-966-4354 | |
Financial Statements
Schedule of Investments as of October 31, 2016 |
HENNESSY CORE BOND FUND
(% of Net Assets)
| TOP TEN HOLDINGS (EXCLUDING CASH/CASH EQUIVALENTS) | % NET ASSETS |
| | |
| U.S. Treasury Note, 1.625%, 04/30/2019 | 7.70% |
| | |
| Federal National Mortgage Association, 3.000%, 08/01/2042 | 7.35% |
| | |
| U.S. Treasury Note, 1.625%, 02/15/2026 | 5.76% |
| | |
| Ford Motor Credit Co. LLC, 3.000%, 06/12/2017 | 5.51% |
| | |
| The Hartford Financial Services Group, Inc., 5.375%, 03/15/2017 | 5.39% |
| | |
| Discover Financial Services, 5.200%, 04/27/2022 | 5.15% |
| | |
| Agilent Technologies, Inc., 5.000%, 07/15/2020 | 5.15% |
| | |
| Associates Corporation of North America, 6.950%, 11/01/2018 | 5.11% |
| | |
| YUM! Brands, Inc., 5.300%, 09/15/2019 | 5.03% |
| | |
| U.S. Treasury Note, 2.750%, 02/15/2024 | 3.29% |
Note: For presentation purposes, the Fund has grouped some of the industry categories. For purposes of categorizing securities for compliance with Section 8(b)(1) of the Investment Company Act of 1940, as amended, the Fund uses more specific industry classifications.
HENNESSYFUNDS.COM
| | PREFERRED STOCKS – 8.90% | | Number of Shares/ | | | | | | % of | |
| | | | Par Amount | | | Value | | | Net Assets | |
| | Consumer Staples – 0.33% | | | | | | | | | |
| | CHS, Inc., Series 4, 7.500%, 01/21/2025 | | | 430 | | | $ | 12,578 | | | | 0.33 | % |
| | | | | | | | | | | | | | |
| | Financials – 8.57% | | | | | | | | | | | | |
| | Aegon N.V., 6.375%, 11/30/2016 (b) | | | 125 | | | | 3,182 | | | | 0.08 | % |
| | Ares Management LP, Series A, 7.000%, 06/30/2021 | | | 124 | | | | 3,215 | | | | 0.09 | % |
| | Banc of California, Inc., Series E, 7.000%, 03/15/2021 | | | 125 | | | | 3,112 | | | | 0.08 | % |
| | Bank of America Corp. | | | | | | | | | | | | |
| | Series EE, 6.000%, 04/25/2021 | | | 200 | | | | 5,200 | | | | 0.14 | % |
| | Series W, 6.625%, 09/09/2019 | | | 145 | | | | 3,954 | | | | 0.10 | % |
| | BB&T Corp., Series F, 5.200%, 11/01/2017 | | | 555 | | | | 14,091 | | | | 0.37 | % |
| | Capital One Financial Corp. | | | | | | | | | | | | |
| | Series F, 6.200%, 12/01/2020 | | | 275 | | | | 7,340 | | | | 0.20 | % |
| | Series G, 5.200%, 12/01/2021 (a) | | | 295 | | | | 7,325 | | | | 0.19 | % |
| | Citigroup, Inc. | | | | | | | | | | | | |
| | Series C, 5.800%, 04/22/2018 | | | 235 | | | | 5,948 | | | | 0.16 | % |
| | Series S, 6.300%, 02/12/2021 | | | 235 | | | | 6,230 | | | | 0.17 | % |
| | Discover Financial Services, Series B, 6.500%, 12/01/2017 | | | 510 | | | | 13,357 | | | | 0.35 | % |
| | Fannie Mae Preferred, Series S, 8.250%, 12/31/2020 (a) | | | 7,900 | | | | 31,126 | | | | 0.83 | % |
| | First Republic Bank | | | | | | | | | | | | |
| | Series F, 5.700%, 06/30/2020 | | | 195 | | | | 5,362 | | | | 0.14 | % |
| | Series G, 5.500%, 03/30/2021 | | | 200 | | | | 5,226 | | | | 0.14 | % |
| | Huntington Bancshares, Inc., Series D, 6.250%, 04/15/2021 | | | 385 | | | | 10,303 | | | | 0.27 | % |
| | IBERIABANK Corp., Series A, 6.625%, 08/01/2025 | | | 125 | | | | 3,374 | | | | 0.09 | % |
| | ING Groep N.V., 6.125%, 01/15/2017 (b) | | | 130 | | | | 3,314 | | | | 0.09 | % |
| | JPMorgan Chase & Co., Series Bb, 6.150%, 09/01/2020 | | | 535 | | | | 14,268 | | | | 0.38 | % |
| | Legg Mason, Inc., 5.45%, 09/15/2021 (a) | | | 265 | | | | 6,596 | | | | 0.18 | % |
| | MetLife, Inc., Series A, 4.000%, 11/30/2016 | | | 550 | | | | 13,920 | | | | 0.37 | % |
| | Morgan Stanley, Series I, 6.375%, 10/15/2024 | | | 460 | | | | 12,696 | | | | 0.34 | % |
| | National General Holdings Corp., Series C, 7.500%, 07/15/2021 | | | 320 | | | | 8,205 | | | | 0.22 | % |
| | Northern Trust Corp., Series C, 5.850%, 10/01/2019 | | | 525 | | | | 14,128 | | | | 0.38 | % |
| | PNC Financial Services Group, Inc., Series Q, 5.375%, 12/01/2017 | | | 540 | | | | 13,711 | | | | 0.36 | % |
| | Regions Financial Corp. | | | | | | | | | | | | |
| | Series B, 6.375%, 09/15/2024 | | | 265 | | | | 7,624 | | | | 0.20 | % |
| | Series A, 6.375%, 12/15/2017 | | | 275 | | | | 7,144 | | | | 0.19 | % |
| | State Street Corp. | | | | | | | | | | | | |
| | Series G, 5.350%, 03/15/2026 | | | 265 | | | | 7,094 | | | | 0.19 | % |
| | Series D, 5.900%, 03/15/2024 | | | 255 | | | | 7,153 | | | | 0.19 | % |
| | SunTrust Banks, Inc., Series E, 5.875%, 03/15/2018 | | | 535 | | | | 13,872 | | | | 0.37 | % |
| | The Allstate Corp., Series E, 6.625%, 04/15/2019 | | | 500 | | | | 13,580 | | | | 0.36 | % |
The accompanying notes are an integral part of these financial statements.
| HENNESSY FUNDS | 1-800-966-4354 | |
| | PREFERRED STOCKS | | Number of Shares/ | | | | | | % of | |
| | | | Par Amount | | | Value | | | Net Assets | |
| | Financials (Continued) | | | | | | | | | |
| | The Charles Schwab Corp. | | | | | | | | | |
| | Series C, 6.000%, 12/01/2020 | | | 275 | | | $ | 7,604 | | | | 0.20 | % |
| | Series A, 5.950%, 06/01/2021 | | | 280 | | | | 7,580 | | | | 0.20 | % |
| | The Goldman Sachs Group, Inc. | | | | | | | | | | | | |
| | Series D, 4.000%, 11/30/2016 | | | 170 | | | | 3,811 | | | | 0.10 | % |
| | Series N, 6.300%, 05/10/2021 | | | 180 | | | | 4,799 | | | | 0.13 | % |
| | U.S. Bancorp, Series H, 5.150%, 07/01/2018 (d) | | | 180 | | | | 4,666 | | | | 0.12 | % |
| | Validus Holdings, Ltd., Series A, 5.875%, 06/15/2021 (b) | | | 320 | | | | 8,112 | | | | 0.22 | % |
| | Wells Fargo & Co. | | | | | | | | | | | | |
| | Series V, 6.000%, 12/15/2020 | | | 270 | | | | 7,042 | | | | 0.19 | % |
| | Series X, 5.500%, 09/15/2021 | | | 275 | | | | 6,999 | | | | 0.19 | % |
| | | | | | | | | 322,263 | | | | 8.57 | % |
| | | | | | | | | | | | | | |
| | Total Preferred Stocks | | | | | | | | | | | | |
| | (Cost $491,455) | | | | | | | 334,841 | | | | 8.90 | % |
| | | | | | | | | | | | | | |
| | REITS – 2.91% | | | | | | | | | | | | |
| | | | | | | | | | | | | | |
| | Financials – 2.91% | | | | | | | | | | | | |
| | Apollo Commercial Real Estate Finance, Inc. | | | 6,000 | | | | 101,520 | | | | 2.70 | % |
| | Monmouth Real Estate Investment Corp., Series C, 6.125%, 09/15/2021 (a) | | | 140 | | | | 3,672 | | | | 0.10 | % |
| | Public Storage, Series D, 4.950%, 07/20/2021 | | | 175 | | | | 4,305 | | | | 0.11 | % |
| | | | | | | | | | | | | | |
| | Total REITS | | | | | | | | | | | | |
| | (Cost $107,211) | | | | | | | 109,497 | | | | 2.91 | % |
| | | | | | | | | | | | | | |
| | CORPORATE BONDS – 54.92% | | | | | | | | | | | | |
| | | | | | | | | | | | | | |
| | Consumer Discretionary – 9.15% | | | | | | | | | | | | |
| | Amazon.com, Inc., 2.500%, 11/29/2022 | | | 75,000 | | | | 76,613 | | | | 2.04 | % |
| | Time Warner, Inc., 3.400%, 06/15/2022 | | | 75,000 | | | | 78,326 | | | | 2.08 | % |
| | YUM! Brands, Inc., 5.300%, 09/15/2019 | | | 175,000 | | | | 189,219 | | | | 5.03 | % |
| | | | | | | | | 344,158 | | | | 9.15 | % |
| | | | | | | | | | | | | | |
| | Energy – 1.63% | | | | | | | | | | | | |
| | National Oilwell Varco, Inc., 2.600%, 12/01/2022 | | | 65,000 | | | | 61,375 | | | | 1.63 | % |
| | | | | | | | | | | | | | |
| | Financials – 32.30% | | | | | | | | | | | | |
| | Associates Corporation of North America, 6.950%, 11/01/2018 | | | 175,000 | | | | 192,331 | | | | 5.11 | % |
| | Diamond 1 Finance Corp. / | | | | | | | | | | | | |
| | Diamond 2 Finance Corp., 5.450%, 06/15/2023 (e) | | | 50,000 | | | | 53,616 | | | | 1.42 | % |
| | Discover Financial Services, 5.200%, 04/27/2022 | | | 175,000 | | | | 193,617 | | | | 5.15 | % |
| | Ford Motor Credit Co. LLC, 3.000%, 06/12/2017 | | | 205,000 | | | | 207,015 | | | | 5.51 | % |
The accompanying notes are an integral part of these financial statements.
HENNESSYFUNDS.COM
| | CORPORATE BONDS | | Number of Shares/ | | | | | | % of | |
| | | | Par Amount | | | Value | | | Net Assets | |
| | Financials (Continued) | | | | | | | | | |
| | Kimco Realty Corp., 2.800%, 10/01/2026 | | | 70,000 | | | $ | 68,559 | | | | 1.82 | % |
| | Lazard Group, 6.850%, 06/15/2017 | | | 37,000 | | | | 38,070 | | | | 1.01 | % |
| | Merrill Lynch Co., Inc., 6.400%, 08/28/2017 | | | 70,000 | | | | 72,826 | | | | 1.94 | % |
| | Raymond James Financial, Inc., 3.625%, 09/15/2026 | | | 50,000 | | | | 50,609 | | | | 1.35 | % |
| | The Goldman Sachs Group, Inc., 6.000%, 06/15/2020 | | | 70,000 | | | | 79,149 | | | | 2.11 | % |
| | The Hartford Financial Services Group, Inc., 5.375%, 03/15/2017 | | | 200,000 | | | | 202,828 | | | | 5.39 | % |
| | Wells Fargo & Co., 2.550%, 12/07/2020 | | | 55,000 | | | | 55,993 | | | | 1.49 | % |
| | | | | | | | | 1,214,613 | | | | 32.30 | % |
| | | | | | | | | | | | | | |
| | Health Care – 7.89% | | | | | | | | | | | | |
| | Agilent Technologies, Inc., 5.000%, 07/15/2020 | | | 175,000 | | | | 193,600 | | | | 5.15 | % |
| | Celgene Corp., 3.625%, 05/15/2024 | | | 100,000 | | | | 103,211 | | | | 2.74 | % |
| | | | | | | | | 296,811 | | | | 7.89 | % |
| | | | | | | | | | | | | | |
| | Telecommunication Services – 3.95% | | | | | | | | | | | | |
| | AT&T, Inc., 5.500%, 02/01/2018 | | | 70,000 | | | | 73,375 | | | | 1.95 | % |
| | Verizon Communications, Inc., 2.450%, 11/01/2022 | | | 75,000 | | | | 75,104 | | | | 2.00 | % |
| | | | | | | | | 148,479 | | | | 3.95 | % |
| | | | | | | | | | | | | | |
| | Total Corporate Bonds | | | | | | | | | | | | |
| | (Cost $2,009,304) | | | | | | | 2,065,436 | | | | 54.92 | % |
| | | | | | | | | | | | | | |
| | MORTGAGE BACKED SECURITIES – 7.35% | | | | | | | | | | | | |
| | | | | | | | | | | | | | |
| | Federal National Mortgage Association, 3.000%, 08/01/2042 | | | 267,814 | | | | 276,424 | | | | 7.35 | % |
| | | | | | | | | | | | | | |
| | Total Mortgage Backed Securities | | | | | | | | | | | | |
| | (Cost $274,306) | | | | | | | 276,424 | | | | 7.35 | % |
| | | | | | | | | | | | | | |
| | U.S. TREASURY OBLIGATIONS – 24.57% | | | | | | | | | | | | |
| | | | | | | | | | | | | | |
| | U.S. Treasury Notes – 24.57% | | | | | | | | | | | | |
| | U.S. Treasury Notes | | | | | | | | | | | | |
| | 1.500%, 08/31/2018 | | | 90,000 | | | | 91,051 | | | | 2.42 | % |
| | 1.625%, 02/15/2026 | | | 220,000 | | | | 216,395 | | | | 5.76 | % |
| | 1.625%, 04/30/2019 | | | 285,000 | | | | 289,815 | | | | 7.70 | % |
| | 2.125%, 05/15/2025 | | | 105,000 | | | | 107,980 | | | | 2.87 | % |
| | 2.500%, 08/15/2023 | | | 50,000 | | | | 52,894 | | | | 1.41 | % |
| | 2.625%, 11/15/2020 | | | 40,000 | | | | 42,217 | | | | 1.12 | % |
| | 2.750%, 02/15/2024 | | | 115,000 | | | | 123,780 | | | | 3.29 | % |
| | | | | | | | | 924,132 | | | | 24.57 | % |
| | | | | | | | | | | | | | |
| | Total U.S. Treasury Obligations | | | | | | | | | | | | |
| | (Cost $926,094) | | | | | | | 924,132 | | | | 24.57 | % |
The accompanying notes are an integral part of these financial statements.
| HENNESSY FUNDS | 1-800-966-4354 | |
| | SHORT-TERM INVESTMENTS – 1.33% | | Number | | | | | | % of | |
| | | | of Shares | | | Value | | | Net Assets | |
| | Money Market Funds – 1.33% | | | | | | | | | |
| | Fidelity Government Portfolio, Institutional Class, 0.27% (c) | | | 49,912 | | | $ | 49,912 | | | | 1.33 | % |
| | | | | | | | | | | | | | |
| | Total Short-Term Investments | | | | | | | | | | | | |
| | (Cost $49,912) | | | | | | | 49,912 | | | | 1.33 | % |
| | | | | | | | | | | | | | |
| | Total Investments | | | | | | | | | | | | |
| | (Cost $3,858,282) – 99.98% | | | | | | | 3,760,242 | | | | 99.98 | % |
| | Other Assets in | | | | | | | | | | | | |
| | Excess of Liabilities – 0.02% | | | | | | | 627 | | | | 0.02 | % |
| | | | | | | | | | | | | | |
| | TOTAL NET ASSETS – 100.00% | | | | | | $ | 3,760,869 | | | | 100.00 | % |
Percentages are stated as a percent of net assets.
REIT – Real Estate Investment Trust
| (a) | Non-income producing security. |
| (b) | U.S. traded security of a foreign corporation. |
| (c) | The rate listed is the fund’s 7-day yield as of October 31, 2016. |
| (d) | Investment in affiliated security. Quasar Distributors, LLC, which serves as the Fund’s distributor, is a subsidiary of U.S. Bancorp. Details of transactions with this affiliated company for the year ended October 31, 2016, are as follows: |
| | Issuer | | U.S. Bancorp | |
| | Beginning Cost | | $ | 13,348 | |
| | Purchase Cost | | $ | 4,628 | |
| | Sales Cost | | $ | (13,348 | ) |
| | Ending Cost | | $ | 4,628 | |
| | Dividend Income | | $ | 526 | |
| | Realized Gain | | $ | 729 | |
| | Shares | | | 180 | |
| | Market Value | | $ | 4,666 | |
The accompanying notes are an integral part of these financial statements.
HENNESSYFUNDS.COM
Summary of Fair Value Exposure at October 31, 2016
The following is a summary of the inputs used to value the Fund’s net assets as of October 31, 2016 (see Note 3 in the accompanying notes to the financial statements):
| Preferred Stocks | | Level 1 | | | Level 2 | | | Level 3 | | | Total | |
| Consumer Staples | | $ | 12,578 | | | $ | — | | | $ | — | | | $ | 12,578 | |
| Financials | | | 322,263 | | | | — | | | | — | | | | 322,263 | |
| Total Preferred Stocks | | $ | 334,841 | | | $ | — | | | $ | — | | | $ | 334,841 | |
| REITS | | | | | | | | | | | | | | | | |
| Financials | | $ | 109,497 | | | $ | — | | | $ | — | | | $ | 109,497 | |
| Total REITS | | $ | 109,497 | | | $ | — | | | $ | — | | | $ | 109,497 | |
| Corporate Bonds | | | | | | | | | | | | | | | | |
| Consumer Discretionary | | $ | — | | | $ | 344,158 | | | $ | — | | | $ | 344,158 | |
| Energy | | | — | | | | 61,375 | | | | — | | | | 61,375 | |
| Financials | | | — | | | | 1,214,613 | | | | — | | | | 1,214,613 | |
| Health Care | | | — | | | | 296,811 | | | | — | | | | 296,811 | |
| Telecommunication Services | | | — | | | | 148,479 | | | | — | | | | 148,479 | |
| Total Corporate Bonds | | $ | — | | | $ | 2,065,436 | | | $ | — | | | $ | 2,065,436 | |
| Mortgage Backed Securities | | $ | — | | | $ | 276,424 | | | $ | — | | | $ | 276,424 | |
| U.S. Treasury Obligations | | | | | | | | | | | | | | | | |
| U.S. Treasury Notes | | $ | — | | | $ | 924,132 | | | $ | — | | | $ | 924,132 | |
| Total U.S. Treasury Obligations | | $ | — | | | $ | 924,132 | | | $ | — | | | $ | 924,132 | |
| Short-Term Investments | | | | | | | | | | | | | | | | |
| Money Market Funds | | $ | 49,912 | | | $ | — | | | $ | — | | | $ | 49,912 | |
| Total Short-Term Investments | | $ | 49,912 | | | $ | — | | | $ | — | | | $ | 49,912 | |
| Total Investments | | $ | 494,250 | | | $ | 3,265,992 | | | $ | — | | | $ | 3,760,242 | |
Transfers between levels are recognized at the end of the reporting period. During the year ended October 31, 2016, the Fund recognized no transfers between levels.
The accompanying notes are an integral part of these financial statements.
| HENNESSY FUNDS | 1-800-966-4354 | |
Financial Statements
Statement of Assets and Liabilities as of October 31, 2016 |
| ASSETS: | | | |
| Investments in securities, at value (cost $3,853,654) | | $ | 3,755,576 | |
| Investments in affiliated securities, at value (cost $4,628) | | | 4,666 | |
| Total Investments in securities, at value (cost $3,858,282) | | | 3,760,242 | |
| Dividends and interest receivable | | | 30,219 | |
| Prepaid expenses and other assets | | | 16,525 | |
| Total Assets | | | 3,806,986 | |
| | | | | |
| LIABILITIES: | | | | |
| Payable for fund shares redeemed | | | 2,096 | |
| Payable to advisor | | | 2,593 | |
| Payable to administrator | | | 753 | |
| Payable to auditor | | | 20,698 | |
| Accrued distribution fees | | | 4,394 | |
| Accrued service fees | | | 138 | |
| Accrued trustees fees | | | 4,254 | |
| Accrued expenses and other payables | | | 11,191 | |
| Total Liabilities | | | 46,117 | |
| NET ASSETS | | $ | 3,760,869 | |
| | | | | |
| NET ASSETS CONSIST OF: | | | | |
| Capital stock | | $ | 3,902,033 | |
| Accumulated net investment loss | | | (15,263 | ) |
| Accumulated net realized loss on investments | | | (27,861 | ) |
| Unrealized net depreciation on investments | | | (98,040 | ) |
| Total Net Assets | | $ | 3,760,869 | |
| | | | | |
| NET ASSETS | | | | |
| Investor Class: | | | | |
| Shares authorized (no par value) | | Unlimited | |
| Net assets applicable to outstanding Investor Class shares | | $ | 1,575,305 | |
| Shares issued and outstanding | | | 215,718 | |
| Net asset value, offering price and redemption price per share | | $ | 7.30 | |
| | | | | |
| Institutional Class: | | | | |
| Shares authorized (no par value) | | Unlimited | |
| Net assets applicable to outstanding Institutional Class shares | | $ | 2,185,564 | |
| Shares issued and outstanding | | | 338,960 | |
| Net asset value, offering price and redemption price per share | | $ | 6.45 | |
The accompanying notes are an integral part of these financial statements.
HENNESSYFUNDS.COM
| STATEMENT OF ASSETS AND LIABILITIES/STATEMENT OF OPERATIONS |
Financial Statements
Statement of Operations for the year ended October 31, 2016 |
| INVESTMENT INCOME: | | | |
| Dividend income | | $ | 32,887 | |
| Dividend income from affiliated securities | | | 526 | |
| Interest income | | | 97,321 | |
| Total investment income | | | 130,734 | |
| | | | | |
| EXPENSES: | | | | |
| Investment advisory fees (See Note 5) | | | 32,840 | |
| Federal and state registration fees | | | 27,800 | |
| Compliance expense (See Note 5) | | | 23,709 | |
| Audit fees | | | 20,741 | |
| Trustees’ fees and expenses | | | 15,385 | |
| Reports to shareholders | | | 7,972 | |
| Administration, fund accounting, custody and transfer agent fees (See Note 5) | | | 4,004 | |
| Sub-transfer agent expenses – Investor Class (See Note 5) | | | 2,972 | |
| Distribution fees – Investor Class (See Note 5) | | | 2,598 | |
| Service fees – Investor Class (See Note 5) | | | 1,732 | |
| Other expenses | | | 3,952 | |
| Total expenses | | | 143,705 | |
| NET INVESTMENT LOSS | | $ | (12,971 | ) |
| | | | | |
| REALIZED AND UNREALIZED GAINS (LOSSES): | | | | |
| Net realized gain (loss) on: | | | | |
| Unaffiliated investments | | $ | (27,812 | ) |
| Affiliated investments | | | 729 | |
| Net change in unrealized depreciation on investments | | | 36,873 | |
| Net gain on investments | | | 9,790 | |
| NET DECREASE IN NET ASSETS RESULTING FROM OPERATIONS | | $ | (3,181 | ) |
The accompanying notes are an integral part of these financial statements.
| HENNESSY FUNDS | 1-800-966-4354 | |
Financial Statements
| Statements of Changes in Net Assets |
| | | Year Ended | | | Year Ended | |
| | | October 31, 2016 | | | October 31, 2015 | |
| OPERATIONS: | | | | | | |
| Net investment income (loss) | | $ | (12,971 | ) | | $ | 52,926 | |
| Net realized gain (loss) on investments | | | (27,083 | ) | | | 51,572 | |
| Net change in unrealized appreciation (depreciation) | | | | | | | | |
| on investments | | | 36,873 | | | | (121,931 | ) |
| Net decrease in net assets resulting from operations | | | (3,181 | ) | | | (17,433 | ) |
| | | | | | | | | |
| DISTRIBUTIONS TO SHAREHOLDERS FROM: | | | | | | | | |
| Net investment income | | | | | | | | |
| Investor Class | | | (715 | ) | | | (24,771 | ) |
| Institutional Class | | | (2,869 | ) | | | (30,102 | ) |
| Net realized gains | | | | | | | | |
| Investor Class | | | (19,448 | ) | | | (37,403 | ) |
| Institutional Class | | | (29,843 | ) | | | (30,800 | ) |
| Total distributions | | | (52,875 | ) | | | (123,076 | ) |
| | | | | | | | | |
| CAPITAL SHARE TRANSACTIONS: | | | | | | | | |
| Proceeds from shares subscribed – Investor Class | | | 497,984 | | | | 435,393 | |
| Proceeds from shares subscribed – Institutional Class | | | 735,742 | | | | 1,039,343 | |
| Dividends reinvested – Investor Class | | | 18,154 | | | | 56,956 | |
| Dividends reinvested – Institutional Class | | | 25,941 | | | | 60,107 | |
| Cost of shares redeemed – Investor Class | | | (783,650 | ) | | | (1,369,633 | ) |
| Cost of shares redeemed – Institutional Class | | | (937,786 | ) | | | (924,976 | ) |
| Net decrease in net assets derived | | | | | | | | |
| from capital share transactions | | | (443,615 | ) | | | (702,810 | ) |
| TOTAL DECREASE IN NET ASSETS | | | (499,671 | ) | | | (843,319 | ) |
| | | | | | | | | |
| NET ASSETS: | | | | | | | | |
| Beginning of year | | | 4,260,540 | | | | 5,103,859 | |
| End of year | | $ | 3,760,869 | | | $ | 4,260,540 | |
| Undistributed net investment loss, end of year | | $ | (15,263 | ) | | $ | — | |
The accompanying notes are an integral part of these financial statements.
HENNESSYFUNDS.COM
| STATEMENTS OF CHANGES IN NET ASSETS |
| Statements of Changes in Net Assets – Continued |
| | | Year Ended | | | Year Ended | |
| | | October 31, 2016 | | | October 31, 2015 | |
| CHANGES IN SHARES OUTSTANDING: | | | | | | |
| Shares sold – Investor Class | | | 68,119 | | | | 58,095 | |
| Shares sold – Institutional Class | | | 113,634 | | | | 157,489 | |
| Shares issued to holders as reinvestment | | | | | | | | |
| of dividends – Investor Class | | | 2,491 | | | | 7,586 | |
| Shares issued to holders as reinvestment | | | | | | | | |
| of dividends – Institutional Class | | | 4,048 | | | | 9,104 | |
| Shares redeemed – Investor Class | | | (107,149 | ) | | | (183,613 | ) |
| Shares redeemed – Institutional Class | | | (146,141 | ) | | | (140,907 | ) |
| Net decrease in shares outstanding | | | (64,998 | ) | | | (92,246 | ) |
The accompanying notes are an integral part of these financial statements.
| HENNESSY FUNDS | 1-800-966-4354 | |
Financial Statements
For an Investor Class share outstanding throughout each year
PER SHARE DATA:
Net asset value, beginning of year
Income from investment operations:
Net investment income (loss)
Net realized and unrealized gains (losses) on investments
Total from investment operations
Less distributions:
Dividends from net investment income
Dividends from net realized gains
Total distributions
Net asset value, end of year
TOTAL RETURN
SUPPLEMENTAL DATA AND RATIOS:
Net assets, end of year (millions)
Ratio of expenses to average net assets:
Before expense reimbursement
After expense reimbursement
Ratio of net investment income (loss) to average net assets:
Before expense reimbursement
After expense reimbursement
Portfolio turnover rate(2)
(1) | Amount is less than $(0.01). |
(2) | Portfolio turnover is calculated on the basis of the Fund as a whole. |
The accompanying notes are an integral part of these financial statements.
HENNESSYFUNDS.COM
| FINANCIAL HIGHLIGHTS — INVESTOR CLASS |
| Year Ended October 31, | |
| 2016 | | | 2015 | | | 2014 | | | 2013 | | | 2012 | |
| | | | | | | | | | | | | | |
| $ | 7.40 | | | $ | 7.61 | | | $ | 9.56 | | | $ | 9.97 | | | $ | 9.56 | |
| | | | | | | | | | | | | | | | | | | |
| | | | | | | | | | | | | | | | | | | |
| | (0.04 | ) | | | 0.06 | | | | 0.17 | | | | 0.27 | | | | 0.28 | |
| | 0.02 | | | | (0.10 | ) | | | (0.06 | ) | | | (0.23 | ) | | | 0.41 | |
| | (0.02 | ) | | | (0.04 | ) | | | 0.11 | | | | 0.04 | | | | 0.69 | |
| | | | | | | | | | | | | | | | | | | |
| | | | | | | | | | | | | | | | | | | |
| | (0.00 | )(1) | | | (0.07 | ) | | | (0.18 | ) | | | (0.27 | ) | | | (0.20 | ) |
| | (0.08 | ) | | | (0.10 | ) | | | (1.88 | ) | | | (0.18 | ) | | | (0.08 | ) |
| | (0.08 | ) | | | (0.17 | ) | | | (2.06 | ) | | | (0.45 | ) | | | (0.28 | ) |
| $ | 7.30 | | | $ | 7.40 | | | $ | 7.61 | | | $ | 9.56 | | | $ | 9.97 | |
| | | | | | | | | | | | | | | | | | | |
| | (0.28 | )% | | | (0.50 | )% | | | 1.41 | % | | | 0.41 | % | | | 7.38 | % |
| | | | | | | | | | | | | | | | | | | |
| | | | | | | | | | | | | | | | | | | |
| $ | 1.58 | | | $ | 1.87 | | | $ | 2.82 | | | $ | 3.02 | | | $ | 3.57 | |
| | | | | | | | | | | | | | | | | | | |
| | 3.74 | % | | | 3.16 | % | | | 2.85 | % | | | 2.26 | % | | | 2.12 | % |
| | 3.74 | % | | | 2.52 | % | | | 1.30 | % | | | 1.30 | % | | | 1.30 | % |
| | | | | | | | | | | | | | | | | | | |
| | (0.56 | )% | | | 0.32 | % | | | 0.74 | % | | | 1.70 | % | | | 2.01 | % |
| | (0.56 | )% | | | 0.96 | % | | | 2.29 | % | | | 2.66 | % | | | 2.83 | % |
| | 65 | % | | | 50 | % | | | 54 | % | | | 74 | % | | | 75 | % |
The accompanying notes are an integral part of these financial statements.
| HENNESSY FUNDS | 1-800-966-4354 | |
Financial Statements
For an Institutional Class share outstanding throughout each year
PER SHARE DATA:
Net asset value, beginning of year
Income from investment operations:
Net investment income (loss)
Net realized and unrealized gains (losses) on investments
Total from investment operations
Less distributions:
Dividends from net investment income
Dividends from net realized gains
Total distributions
Net asset value, end of year
TOTAL RETURN
SUPPLEMENTAL DATA AND RATIOS:
Net assets, end of year (millions)
Ratio of expenses to average net assets:
Before expense reimbursement
After expense reimbursement
Ratio of net investment income (loss) to average net assets:
Before expense reimbursement
After expense reimbursement
Portfolio turnover rate(1)
(1) | Portfolio turnover is calculated on the basis of the Fund as a whole. |
The accompanying notes are an integral part of these financial statements.
HENNESSYFUNDS.COM
| FINANCIAL HIGHLIGHTS — INSTITUTIONAL CLASS |
| Year Ended October 31, | |
| 2016 | | | 2015 | | | 2014 | | | 2013 | | | 2012 | |
| | | | | | | | | | | | | | |
| $ | 6.51 | | | $ | 6.69 | | | $ | 8.65 | | | $ | 9.06 | | | $ | 8.77 | |
| | | | | | | | | | | | | | | | | | | |
| | | | | | | | | | | | | | | | | | | |
| | (0.01 | ) | | | 0.09 | | | | 0.16 | | | | 0.19 | | | | 0.27 | |
| | 0.03 | | | | (0.09 | ) | | | (0.06 | ) | | | (0.13 | ) | | | 0.38 | |
| | 0.02 | | | | — | | | | 0.10 | | | | 0.06 | | | | 0.65 | |
| | | | | | | | | | | | | | | | | | | |
| | | | | | | | | | | | | | | | | | | |
| | (0.01 | ) | | | (0.09 | ) | | | (0.18 | ) | | | (0.29 | ) | | | (0.28 | ) |
| | (0.07 | ) | | | (0.09 | ) | | | (1.88 | ) | | | (0.18 | ) | | | (0.08 | ) |
| | (0.08 | ) | | | (0.18 | ) | | | (2.06 | ) | | | (0.47 | ) | | | (0.36 | ) |
| $ | 6.45 | | | $ | 6.51 | | | $ | 6.69 | | | $ | 8.65 | | | $ | 9.06 | |
| | | | | | | | | | | | | | | | | | | |
| | 0.23 | % | | | (0.06 | )% | | | 1.53 | % | | | 0.69 | % | | | 7.63 | % |
| | | | | | | | | | | | | | | | | | | |
| | | | | | | | | | | | | | | | | | | |
| $ | 2.19 | | | $ | 2.39 | | | $ | 2.29 | | | $ | 3.38 | | | $ | 33.34 | |
| | | | | | | | | | | | | | | | | | | |
| | 3.32 | % | | | 2.79 | % | | | 2.53 | % | | | 1.67 | % | | | 1.31 | % |
| | 3.32 | % | | | 2.25 | % | | | 1.05 | % | | | 1.05 | % | | | 1.05 | % |
| | | | | | | | | | | | | | | | | | | |
| | (0.14 | )% | | | 0.66 | % | | | 1.06 | % | | | 2.28 | % | | | 2.74 | % |
| | (0.14 | )% | | | 1.20 | % | | | 2.54 | % | | | 2.90 | % | | | 3.00 | % |
| | 65 | % | | | 50 | % | | | 54 | % | | | 74 | % | | | 75 | % |
The accompanying notes are an integral part of these financial statements.
| HENNESSY FUNDS | 1-800-966-4354 | |
Financial Statements
Notes to the Financial Statements October 31, 2016 |
1). ORGANIZATION
The Hennessy Core Bond Fund (the “Fund”) is a series of Hennessy Funds Trust (the “Trust”), which was organized as a Delaware statutory trust on September 17, 1992. The Fund is an open-end management investment company registered under the Investment Company Act of 1940, as amended. The Fund is a successor to the FBR Core Bond Fund (the “Predecessor FBR Fund”), a series of The FBR Funds, a Delaware statutory trust, pursuant to a reorganization that took place after the close of business on October 26, 2012. Prior to October 26, 2012, the Fund had no investment operations. As a result of the reorganization, holders of Investor Class shares of the Predecessor FBR Fund received Investor Class shares of the Fund (the Investor Class shares of the Fund are the successor to the accounting and performance information of the corresponding shares of the Predecessor FBR Fund), and holders of Institutional Class shares of the Predecessor FBR Fund received Institutional Class shares of the Fund (the Institutional Class shares of the Fund are the successor to the accounting and performance information of the corresponding shares of the Predecessor FBR Fund). The investment objective of the Fund is current income with capital growth as a secondary objective. The Fund is a diversified fund.
The Fund offers Investor Class and Institutional Class shares. Each class of shares differs principally in its respective administration, 12b-1 distribution and service, shareholder servicing, and transfer agent expenses (there are no sales charges). Each class has identical rights to earnings, assets, and voting privileges, except for class-specific expenses and exclusive rights to vote on matters affecting only an individual class.
As an investment company, the Fund follows the investment company accounting and reporting guidance of the Financial Accounting Standards Board (“FASB”) Accounting Standard Codification Topic 946 “Financial Services—Investment Companies.”
2). SIGNIFICANT ACCOUNTING POLICIES
The following is a summary of significant accounting policies consistently followed by the Fund in the preparation of the financial statements. These policies conform with U.S. generally accepted accounting principles (“GAAP”).
| a). | Investment Valuation – All investments in securities are recorded at their estimated fair value, as described in Note 3. |
| | |
| b). | Federal Income Taxes – No provision for federal income taxes or excise taxes has been made since the Fund has elected to be taxed as a “regulated investment company” and intends to distribute substantially all of its taxable income to its shareholders and otherwise comply with the provisions of the Internal Revenue Code of 1986, as amended, applicable to regulated investment companies. Net investment income or loss and realized gains and losses for federal income tax purposes may differ from that reported on the financial statements because of temporary book and tax basis differences. Temporary differences are primarily the result of the treatment of wash sales for tax reporting purposes. The Fund recognizes interest and penalties related to income tax benefits, if any, in the statement of operations as an income tax expense. Distributions from net realized gains for book purposes may include short-term capital gains, which are included as ordinary income to shareholders for tax purposes. |
HENNESSYFUNDS.COM
| NOTES TO THE FINANCIAL STATEMENTS |
| | Due to inherent differences in the recognition of income, expenses, and realized gains/losses under GAAP and federal income tax regulations, permanent differences between book and tax basis for reporting for the fiscal year ended October 31, 2016, have been identified and appropriately reclassified on the Statement of Assets and Liabilities. The adjustments are as follows: |
| | Undistributed | Accumulated | | |
| | Net Investment | Net Realized | | |
| | Income/(Loss) | Gain/(Loss) | Paid-in Capital | |
| | $1,292 | $(769) | $(523) | |
| c). | Accounting for Uncertainty in Income Taxes – The Fund has accounting policies regarding recognition and measurement of tax positions taken or expected to be taken on a tax return. The tax returns of the Fund for the prior three fiscal years are open for examination. The Fund has reviewed all open tax years in major jurisdictions and concluded that there is no impact on the Fund’s net assets and no tax liability resulting from unrecognized tax benefits relating to uncertain income tax positions taken or expected to be taken on a tax return. The Fund’s major tax jurisdictions are U.S. federal and Delaware. |
| | |
| d). | Income and Expenses – Dividend income is recognized on the ex-dividend date or as soon as information is available to the Fund. Interest income, which includes the amortization of premium and accretion of discount, is recognized on an accrual basis. The Fund is charged for those expenses that are directly attributable to the portfolio, such as advisory, administration, and certain shareholder service fees. Income, expenses (other than expenses attributable to a specific class), and realized and unrealized gains or losses on investments are allocated to each class of shares based on its respective net assets. |
| | |
| e). | Distributions to Shareholders – Dividends from net investment income for the Fund, if any, are declared and paid monthly. Distributions of net realized capital gains, if any, are declared and paid annually, usually in December. |
| | |
| f). | Security Transactions – Investment and shareholder transactions are recorded on the trade date. The Fund determines the gain or loss realized from the investment transactions by comparing the original cost of the security lot sold with the net sale proceeds. Discounts and premiums on securities purchased are accreted/amortized over the life of the respective security. |
| | |
| g). | Use of Estimates – The preparation of financial statements in conformity with GAAP requires management to make estimates and assumptions that affect the reported amounts of assets and liabilities and disclosure of contingent assets and liabilities at the date of the financial statements and the reported change in net assets during the reporting period. Actual results could differ from those estimates. |
| | |
| h). | Share Valuation – The net asset value (“NAV”) per share of the Fund is calculated by dividing the sum of the value of the securities held by the Fund, plus cash or other assets, minus all liabilities (including estimated accrued expenses) by the total number of shares outstanding for the Fund, rounded to the nearest cent. The Fund’s shares will not be priced on days the New York Stock Exchange is closed for trading. The offering and redemption price per share for the Fund is equal to the Fund’s NAV per share. |
| | |
| i). | Foreign Currency – Values of investments denominated in foreign currencies, if any, are converted into U.S. dollars using the spot market rate of exchange at the time of valuation. Purchases and sales of investments and income are translated into U.S. dollars using the spot market rate of exchange prevailing on the respective dates of |
| HENNESSY FUNDS | 1-800-966-4354 |
| | such transactions. The Fund does not isolate the portion of the results of operations resulting from fluctuations in foreign exchange rates on investments from fluctuations resulting from changes in the market prices of securities held. Such fluctuations are included with the net realized and unrealized gain or loss on investments. Foreign investments present additional risks due to currency fluctuations, economic and political factors, lower liquidity, government regulations, differences in accounting standards, and other factors. |
| | |
| j). | Forward Contracts – The Fund may enter into forward currency contracts to reduce its exposure to changes in foreign currency exchange rates on its foreign holdings and to lock in the U.S. dollar cost of firm purchase and sale commitments for securities denominated in foreign currencies. A forward currency contract is a commitment to purchase or sell a foreign currency at a future date at a negotiated forward rate. The gain or loss arising from the difference between the U.S. dollar cost of the original contract and the value of the foreign currency in U.S. dollars upon closing of such contract is included in net realized gain or loss from foreign currency transactions. During the fiscal year ended October 31, 2016, the Fund did not enter into any forward contracts. |
| | |
| k). | Repurchase Agreements – The Fund may enter into repurchase agreements with member banks or security dealers of the Federal Reserve Board whom the investment advisor deems creditworthy. The repurchase price generally equals the price paid by the Fund plus interest negotiated on the basis of current short-term rates. |
| | |
| | Securities pledged as collateral for repurchase agreements are held by the custodian bank until the respective agreements mature. Provisions of the repurchase agreements ensure that the market value of the collateral, including accrued interest thereon, is sufficient to cover the repurchase amount in the event of default of the counterparty. If the counterparty defaults and the value of the collateral declines or if the counterparty enters an insolvency proceeding, realization of the collateral by the Fund may be delayed or limited. During the fiscal year ended October 31, 2016, the Fund did not enter into any repurchase agreements. |
| | |
| l). | Derivatives – The Fund may invest in, or enter into, derivatives, such as options, futures contracts, options on futures contracts, and swaps, for a variety of reasons, including to hedge certain risks, to provide a substitute for purchasing or selling particular securities, or to increase potential income gain. Derivatives are financial contracts based on an underlying or notional amount, require no initial investment or an initial net investment that is smaller than would normally be required to have a similar response to changes in market factors, and require or permit net settlement. Derivatives may allow the Fund to increase or decrease the level of risk to which the Fund is exposed more quickly and efficiently than transactions in other types of instruments. The main purpose of utilizing derivative instruments is for hedging purposes. |
| | |
| | The Fund follows the financial accounting reporting rules as required by the Derivatives and Hedging Topic of the FASB Accounting Standards Codification. Under such rules, the Fund is required to include enhanced disclosure that enables investors to understand how and why an entity uses derivatives, how derivatives are accounted for, and how derivatives instruments affect an entity’s results of operations and financial position. During the fiscal year ended October 31, 2016, the Fund did not hold any derivative instruments. |
| | |
| m). | New Accounting Pronouncements – In May 2015, the FASB issued ASU No. 2015-07 “Disclosure for Investments in Certain Entities that Calculate Net Asset Value per Share (or Its Equivalent).” The amendments in ASU No. 2015-07 remove the |
HENNESSYFUNDS.COM
| NOTES TO THE FINANCIAL STATEMENTS |
| | requirement to categorize within the fair value hierarchy investments measured at NAV and require the disclosure of sufficient information to reconcile the fair value of the remaining assets categorized within the fair value hierarchy to the financial statements. The amendments in ASU No. 2015-07 are effective for fiscal years beginning after December 15, 2015, and interim periods within those fiscal years. Management has reviewed the requirements and believes the adoption of ASU 2015-07 will not have a material impact on the Fund’s financial statements and related disclosures. |
3). SECURITIES VALUATION
The Fund follows authoritative fair valuation accounting standards that establish an authoritative definition of fair value and set out a hierarchy for measuring fair value. These standards require additional disclosures about the various inputs and valuation techniques used to develop the measurements of fair value and a discussion in changes in valuation techniques and related inputs during the period. These inputs are summarized in the three broad levels listed below:
| | Level 1 – | Unadjusted, quoted prices in active markets for identical instruments that the Fund has the ability to access at the date of measurement. |
| | | |
| | Level 2 – | Other significant observable inputs (including, but not limited to, quoted prices in active markets for similar instruments, quoted prices in markets that are not active for identical or similar instruments, and model-derived valuations in which all significant inputs and significant value drivers are observable in active markets (such as interest rates, prepayment speeds, credit risk curves, default rates, and similar data)). |
| | | |
| | Level 3 – | Significant unobservable inputs (including the Fund’s own assumptions about what market participants would use to price the asset or liability based on the best available information) when observable inputs are unavailable. |
Following is a description of the valuation techniques applied to the Fund’s major categories of assets and liabilities measured at fair value on a recurring basis.
Equity Securities – Equity securities, including common stocks, preferred stocks, foreign-issued common stocks, exchange-traded funds, closed-end mutual funds, partnerships, rights, and real estate investment trusts, that are traded on a securities exchange for which a last-quoted sales price is readily available will generally be valued at the last sales price as reported by the primary exchange on which the securities are listed. Securities listed on The NASDAQ Stock Market (“NASDAQ”) will generally be valued at the NASDAQ Official Closing Price, which may differ from the last sales price reported. Securities traded on a securities exchange for which a last-quoted sales price is not readily available will generally be valued at the mean between the bid and ask prices. To the extent these securities are actively traded and valuation adjustments are not applied, they are classified in Level 1 of the fair value hierarchy. Securities traded on foreign exchanges generally are not valued at the same time the Fund calculates its NAV because most foreign markets close well before such time. The earlier close of most foreign markets gives rise to the possibility that significant events, including broad market moves, may have occurred in the interim. In certain circumstances, it may be determined that a security needs to be fair valued because it appears that the value of the security might have been materially affected by events occurring after the close of the market in which the security is principally traded, but before the time the Fund calculates its NAV, such as by a development that affects an entire market or region (e.g., weather-related events) or a potentially global development (e.g., a terrorist attack that may be expected to have an effect on investor expectations worldwide).
| HENNESSY FUNDS | 1-800-966-4354 | |
Registered Investment Companies – Investments in registered investment companies (e.g., mutual funds) are generally priced at the ending NAV provided by the applicable registered investment company’s service agent and will be classified in Level 1 of the fair value hierarchy.
Debt Securities – Debt securities, including corporate bonds, asset-backed securities, mortgage-backed securities, municipal bonds, U.S. Treasuries, and U.S. government agency issues, are generally valued at market on the basis of valuations furnished by an independent pricing service that utilizes both dealer-supplied valuations and formula-based techniques. The pricing service may consider recently executed transactions in securities of the issuer or comparable issuers, market price quotations (where observable), bond spreads, and fundamental data relating to the issuer. In addition, the model may incorporate observable market data, such as reported sales of similar securities, broker quotes, yields, bids, offers, and reference data. Certain securities are valued primarily using dealer quotations. These securities are generally classified in Level 2 of the fair value hierarchy.
Short-Term Securities – Short-term equity investments, including money market funds, are valued in the manner specified above. Short-term debt investments with an original term to maturity of 60 days or less are valued at amortized cost, which approximates fair market value. If the original term to maturity of a short-term debt investment exceeded 60 days, then the values as of the 61st day prior to maturity are amortized. Amortized cost is not used if its use would be inappropriate due to credit or other impairments of the issuer, in which case the security’s fair value would be determined, as described below. Short-term securities are generally classified in Level 1 or Level 2 of the fair market hierarchy depending on the inputs used and market activity levels for specific securities.
The Board of Trustees of the Fund (the “Board”) has adopted fair value pricing procedures that are followed when a price for a security is not readily available or if a significant event has occurred that indicates the closing price of a security no longer represents the true value of that security. Fair value pricing determinations are made in good faith in accordance with these procedures. There are numerous criteria that will be given consideration in determining a fair value of a security, such as the trading volume of a security and markets, the value of other like securities, and news events with direct bearing to a security or markets. Fair value pricing results in an estimated price for a security that reflects the amount the Fund might reasonably expect to receive in a current sale. Depending on the relative significance of the valuation inputs, these securities may be classified in either Level 2 or Level 3 of the fair value hierarchy.
The fair valuation of foreign securities may be determined with the assistance of a pricing service using correlations between the movement of prices of such securities and indices of domestic securities and other appropriate indicators, such as closing market prices of relevant American Depositary Receipts or futures contracts. The effect of using fair value pricing is that the Fund’s NAV will reflect the affected portfolio securities’ value as determined by the Board or its designee instead of being determined by the market. Using a fair value pricing methodology to price foreign securities may result in a value that is different from a foreign security’s most recent closing price and from the prices used by other investment companies to calculate their NAVs and are generally considered Level 2 prices in the fair valuation hierarchy. Because the Fund may invest in foreign securities, the value of the Fund’s portfolio securities may change on days when you will not be able to purchase or redeem your shares.
The Board has delegated day-to-day valuation matters to a Valuation Committee comprised of one or more representatives from Hennessy Advisors, Inc., the Fund’s investment advisor. The function of the Valuation Committee is to value securities where
HENNESSYFUNDS.COM
| NOTES TO THE FINANCIAL STATEMENTS |
current and reliable market quotations are not readily available. All actions taken by the Valuation Committee are reviewed by the Board.
The Fund has performed an analysis of all existing investments to determine the significance and character of all inputs to their fair value determination. Various inputs are used in determining the value of the Fund’s investments. The inputs or methodology used for valuing securities are not necessarily an indication of the risk associated with investing in those securities. Details related to the fair valuation hierarchy of the Fund’s securities as of October 31, 2016, are included in the Fund’s Schedule of Investments.
4). INVESTMENT TRANSACTIONS
Purchases and sales of investment securities (excluding government and short-term investments) for the Fund during the fiscal year ended October 31, 2016 were $622,835 and $977,562, respectively.
Purchases and sales/maturities of long-term U.S. government securities for the Fund during the fiscal year ended October 31, 2016, were $1,978,160 and $2,090,277, respectively.
The Fund is permitted to purchase or sell securities from or to another fund in the Hennessy Funds family of funds (the “Hennessy Funds”) under specified conditions outlined in procedures adopted by the Board of Trustees. The procedures have been designed to ensure that any purchase or sale of securities by the Fund from or to another Hennessy Fund complies with Rule 17a-7 of the Investment Company Act of 1940. For the fiscal year ended October 31, 2016, the Fund did not engage in purchases and sales of securities pursuant to Rule 17a-7 of the Investment Company Act of 1940.
5). INVESTMENT MANAGEMENT FEE AND OTHER TRANSACTIONS WITH AFFILIATES
Hennessy Advisors, Inc. (the “Advisor”) is the investment advisor of the Fund. The Advisor provides the Fund with investment management services under an Investment Advisory Agreement. The Advisor furnishes all investment advice, office space, facilities, and provides most of the personnel needed by the Fund. As compensation for its services, the Advisor is entitled to a monthly fee from the Fund. The fee is based upon the average daily net assets of the Fund at the annual rate of 0.80%. The net investment advisory fees payable by the Fund as of October 31, 2016, were $2,593.
The Advisor has delegated the day-to-day management of the Fund to a sub-advisor, Financial Counselors, Inc. The Advisor pays the sub-advisor fees from its own assets and these fees are not an additional expense of the Fund. For the most recent fiscal year, the Advisor (not the Fund) paid a sub-advisory fee, based upon the daily net assets of the Fund, at the rate of 0.15%, as the sub-advisor voluntarily agreed to reduce its sub-advisory fee to 0.15% of the Fund’s average daily net assets for the most recent fiscal year.
In the past, the Advisor had contractually agreed to limit the total annual operating expenses of the Fund to 1.05% of the Fund’s net assets for both Investor Class shares and Institutional Class shares of the Fund (excluding interest, taxes, brokerage commissions, dividend expenses, 12b-1 fees, acquired fund fees and expenses, extraordinary legal expenses, or any other extraordinary expenses). The expense limitation agreement for the Fund expired as of February 28, 2015.
For a period of three years after the year in which the Advisor waived or reimbursed expenses, the Advisor may seek reimbursement from the Fund to the extent that total annual fund operating expenses are less than the expense limitation that was in effect at the time the Advisor waived or reimbursed expenses. As of October 31, 2016, cumulative expenses subject to potential recovery under the aforementioned conditions and year of expiration were as follows:
| HENNESSY FUNDS | 1-800-966-4354 | |
| | October 31, | October 31, | |
| | 2017 | 2018 | Total |
| Investor Class | $46,263 | $16,047 | $62,310 |
| Institutional Class | $42,715 | $13,084 | $55,799 |
The Board has approved a Shareholder Servicing Agreement for Investor Class shares of the Fund, effective as of March 1, 2015, which was instituted to compensate the Advisor for the non-investment management services it provides to the Fund. The Shareholder Servicing Agreement provides for a monthly fee paid to the Advisor at an annual rate of 0.10% of the average daily net assets of the Fund attributable to Investor Class shares. Shareholder service fees payable by the Fund as of October 31, 2016, were $138.
The Fund has adopted a plan pursuant to Rule 12b-1 under the Investment Company Act of 1940, as amended, that authorizes payments in connection with the distribution of the Fund’s shares at an annual rate of up to 0.25% of the Fund’s average daily net assets attributable to Investor Class shares. Even though the authorized rate is up to 0.25%, the Fund has only used up to 0.15% of its average daily net assets attributable to Investor Class shares for such purpose since March 1, 2015. Amounts paid under the plan may be spent on any activities or expenses primarily intended to result in the sale of shares, including, but not limited to, advertising, shareholder account servicing, the printing and mailing of prospectuses to other than current shareholders, the printing and mailing of sales literature, and compensation for sales and marketing activities or to financial institutions and others, such as dealers and distributors.
The Fund has entered into agreements with various brokers, dealers, and financial intermediaries in connection with the sale of shares of the Fund. The agreements provide for periodic payments by the Fund to the brokers, dealers, and financial intermediaries for providing certain shareholder maintenance services (sub-transfer agent expenses). These shareholder services include the pre-processing and quality control of new accounts, shareholder correspondence, answering customer inquiries regarding account status, and facilitating shareholder telephone transactions. Fees paid by the Fund to various brokers, dealers, and financial intermediaries during the fiscal year ended October 31, 2016, were $2,972.
U.S. Bancorp Fund Services, LLC (“USBFS”) provides the Fund with administrative, fund accounting, and transfer agent services and necessary office equipment. As administrator, USBFS is responsible for activities such as (i) preparing various federal and state regulatory filings, reports, and returns for the Fund, (ii) preparing reports and materials to be supplied to the Board, (iii) monitoring the activities of the Fund’s custodian, transfer agent, and accountants, and (iv) coordinating the preparation and payment of the Fund’s expenses and reviewing the Fund’s expense accruals. Fees paid to USBFS during the fiscal year ended October 31, 2016, were $4,004.
U.S. Bank, N.A., an affiliate of USBFS, serves as the Fund’s custodian. Quasar Distributors, LLC acts as the Fund’s principal underwriter in a continuous public offering of the Fund’s shares. Quasar Distributors, LLC is an affiliate of USBFS and U.S. Bank, N.A.
The officers of the Fund are affiliated with the Advisor. Such officers, with the exception of the Chief Compliance Officer and the Senior Compliance Officer, receive no compensation from the Fund for serving in their respective roles. The Fund, along with the other Hennessy Funds, makes reimbursement payments, on an equal basis, to the Advisor for a portion of the salary and benefits associated with the office of the Chief Compliance Officer and for all of the salary and benefits associated with the office of the Senior Compliance Officer. Such amounts are included on the Statement of Operations.
HENNESSYFUNDS.COM
| NOTES TO THE FINANCIAL STATEMENTS |
6). GUARANTEES AND INDEMNIFICATIONS
Under the Hennessy Funds’ organizational documents, their officers and trustees are indemnified by the Hennessy Funds against certain liabilities arising out of the performance of their duties to the Hennessy Funds. Additionally, in the normal course of business, the Hennessy Funds enter into contracts with service providers that contain general indemnification clauses. The Fund’s maximum exposure under these arrangements is unknown as this would involve future claims that may be made against the Fund that have not yet occurred. Currently, the Fund expects the risk of loss to be remote.
7). LINE OF CREDIT
The Fund has an uncommitted line of credit with the other Hennessy Funds in the amount of the lesser of (i) $100,000,000 or (ii) 33.33% of each Hennessy Fund’s net assets, or 30% for the Hennessy Gas Utility Fund and 10% for the Hennessy Balanced Fund, intended to provide short-term financing, if necessary, subject to certain restrictions, in connection with shareholder redemptions. The credit facility is with the Hennessy Funds’ custodian bank, U.S. Bank, N.A. Borrowings under this arrangement bear interest at the bank’s prime rate and are secured by all of the Fund’s assets (as to its own borrowings only). During the fiscal year ended October 31, 2016, the Fund did not have any borrowings outstanding under the line of credit.
8). FEDERAL TAX INFORMATION
As of October 31, 2016, the components of accumulated earnings (losses) for income tax purposes were as follows:
| | Cost of investments for tax purposes | | $ | 3,858,512 | |
| | Gross tax unrealized appreciation | | $ | 79,202 | |
| | Gross tax unrealized depreciation | | | (177,472 | ) |
| | Net tax unrealized appreciation | | $ | (98,270 | ) |
| | Undistributed ordinary income | | $ | — | |
| | Undistributed long-term capital gains | | | — | |
| | Total distributable earnings | | $ | — | |
| | Other accumulated loss | | $ | (42,894 | ) |
| | Total accumulated loss | | $ | (141,164 | ) |
At October 31, 2016, the Fund had capital loss carryforwards that expire as follows:
| $11,619 | Indefinite ST | |
| $16,012 | Indefinite LT | |
At October 31, 2016, the Fund deferred on a tax basis, a late year ordinary loss of $15,263.
During the fiscal years ended October 31, 2016 and 2015, the tax character of distributions paid by the Fund was as follows:
| | | | Year Ended | | | Year Ended | |
| | | | October 31, 2016 | | | October 31, 2015 | |
| | Ordinary income(1) | | $ | 5,416 | | | $ | 54,190 | |
| | Long-term capital gain | | | 46,936 | | | | 68,886 | |
| | Return of capital | | | 523 | | | | — | |
| | | | $ | 52,875 | | | $ | 123,076 | |
(1) Ordinary income includes short-term gain or loss.
| HENNESSY FUNDS | 1-800-966-4354 | |
9). EVENTS SUBSEQUENT TO YEAR END
Management has evaluated the Fund’s related events and transactions that occurred subsequent to October 31, 2016, through the date of issuance of the Fund’s financial statements. Other than as disclosed below, management has determined that there were no subsequent events requiring recognition or disclosure in the financial statements.
On December 2, 2016, the Board determined that it is in the best interests of the shareholders of the Fund to liquidate the Fund. The liquidation of the Fund is expected to be effective on or about Friday, February 17, 2017, or at such other time as may be authorized by the Board.
Shareholders of the Fund may redeem their shares at any time prior to the liquidation date. If a shareholder has not redeemed his or her shares as of the liquidation date, the shareholder’s account will be automatically redeemed and proceeds will be sent to the shareholder at his or her address of record. Liquidation proceeds will be paid in cash for the redeemed shares at their net asset value.
All expenses of the liquidation of the Fund will be borne by the Advisor.
HENNESSYFUNDS.COM
| NOTES TO THE FINANCIAL STATEMENTS |
(This Page Intentionally Left Blank.)
| HENNESSY FUNDS | 1-800-966-4354 | |
Report of Independent Registered Public Accounting Firm
To the Board of Trustees of Hennessy Funds Trust
and the Shareholders of the Hennessy Core Bond Fund
Novato, CA
We have audited the accompanying statement of assets and liabilities, including the schedule of investments, of the Hennessy Core Bond Fund (the “Fund”), a series of Hennessy Funds Trust, as of October 31, 2016, and the related statement of operations for the year then ended, the statements of changes in net assets for each of the two years in the period then ended and the financial highlights for each of the five years in the period then ended. These financial statements and financial highlights are the responsibility of the Fund’s management. Our responsibility is to express an opinion on these financial statements and financial highlights based on our audits.
We conducted our audits in accordance with the standards of the Public Company Accounting Oversight Board (United States). Those standards require that we plan and perform the audits to obtain reasonable assurance about whether the financial statements and financial highlights are free of material misstatement. The Fund is not required to have, nor were we engaged to perform, an audit of the Fund’s internal control over financial reporting. Our audits included consideration of internal control over financial reporting as a basis for designing audit procedures that are appropriate in the circumstances, but not for the purposes of expressing an opinion on the effectiveness of the Fund’s internal control over financial reporting. Accordingly, we express no such opinion. An audit includes examining, on a test basis, evidence supporting the amounts and disclosures in the financial statements. Our procedures included confirmation of securities owned as of October 31, 2016, by correspondence with the custodian. An audit also includes assessing the accounting principles used and significant estimates made by management, as well as evaluating the overall financial statement presentation. We believe that our audits provide a reasonable basis for our opinion.
In our opinion, the financial statements and financial highlights referred to above present fairly, in all material respects, the financial position of the Hennessy Core Bond Fund as of October 31, 2016, the results of its operations for the year then ended, the changes in its net assets for each of the two years in the period then ended, and the financial highlights for each of the five years in the period then ended, in conformity with accounting principles generally accepted in the United States of America.
TAIT, WELLER & BAKER LLP
Philadelphia, Pennsylvania
December 22, 2016
HENNESSYFUNDS.COM
| REPORT OF INDEPENDENT REGISTERED PUBLIC ACCOUNTING FIRM/TRUSTEES AND OFFICERS |
Trustees and Officers of the Fund (Unaudited)
The business and affairs of the Fund are managed under the direction of the Board of Trustees of the Trust, and the Board of Trustees elects the Officers of the Trust. Beginning in March 2015, the Board of Trustees has from time to time appointed advisers (“Advisers”) to the Board of Trustees, with the intention of having qualified individuals serve in an advisory capacity in order to garner experience in the mutual fund and asset management industry and be considered as potential Trustees in the future. There are currently three Advisers to the Board of Trustees: Brian Alexander, Doug Franklin, and Claire Knoles. As Advisers, Mr. Alexander, Mr. Franklin, and Ms. Knoles attend meetings of the Board and act as non-voting participants. Information pertaining to the Trustees, Advisers, and the Officers of the Trust is set forth below. The Trustees and Officers serve until their successors are duly elected and qualified or until their earlier death, resignation, or removal. Each of the Trustees oversees 16 Hennessy Funds. Unless otherwise indicated, the address of all persons listed below is 7250 Redwood Boulevard, Suite 200, Novato, CA 94945. The Fund’s Statement of Additional Information includes more information about the persons listed below and is available, without charge, upon request by calling 1-800-966-4354.
| | | | Other |
| | | | Directorships |
| | | | Held Outside |
| Name, (Year of Birth), | | | of Fund |
| and Position Held | Start Date | Principal Occupation(s) | Complex During |
with the Trust | of Service | During Past Five Years | Past Five Years(1) |
| | | | |
| Disinterested Trustees and Advisers | | |
| | | | |
| J. Dennis DeSousa | January 1996 | Mr. DeSousa is a real estate investor. | None. |
| (1936) | | | |
| Trustee | | | |
| | | | |
| Robert T. Doyle | January 1996 | Mr. Doyle has been the Sheriff of | None. |
| (1947) | | Marin County, California since 1996. | |
| Trustee | | | |
| | | | |
| Gerald P. Richardson | May 2004 | Mr. Richardson is an independent | None. |
| (1945) | | consultant in the securities industry. | |
| Trustee | | | |
| | | | |
| Brian Alexander | March 2015 | Mr. Alexander has been employed | None. |
| (1981) | | by Sutter Health Novato Community | |
| Adviser to the Board | | Hospital since 2012, first as an | |
| | | Assistant Administrator and then, | |
| | | beginning in 2013, as the Chief | |
| | | Administrative Officer. From 2011 | |
| | | through 2012, Mr. Alexander was | |
| | | employed by Sutter Health West Bay | |
| | | Region as the Regional Director of | |
| | | Strategic Decision Support. Prior to | |
| | | that, in 2011, he served as the | |
| | | Director of Managed Care | |
| | | Contracting and also the Director of | |
| | | Compensation, Benefits, and | |
| | | Compliance for the Rehabilitation | |
| | | Institute of Chicago. | |
| HENNESSY FUNDS | 1-800-966-4354 | |
| | | | Other |
| | | | Directorships |
| | | | Held Outside |
| Name, (Year of Birth), | | | of Fund |
| and Position Held | Start Date | Principal Occupation(s) | Complex During |
with the Trust | of Service | During Past Five Years | Past Five Years(1) |
| | | | |
| Doug Franklin | March 2016 | Mr. Franklin is a retired insurance | None. |
| (1964) | | industry executive. From 1987 | |
| Adviser to the Board | | through 2015, he was employed by | |
| | | the Allianz-Fireman’s Fund Insurance | |
| | | Company in various positions, | |
| | | including as its Chief Actuary and | |
| | | Chief Risk Officer. | |
| | | | |
| Claire Knoles | December 2015 | Ms. Knoles is a founder of Kiosk and | None. |
| (1974) | | has served as its Chief Operating | |
| Adviser to the Board | | Officer since 2004. Kiosk is a full | |
| | | service marketing agency with | |
| | | offices in the San Francisco Bay | |
| | | Area, Toronto, and Liverpool, UK. | |
| | | | |
Interested Trustee(2) | | | |
| | | | |
| Neil J. Hennessy | January 1996 as | Mr. Hennessy has been employed by | Hennessy |
| (1956) | a Trustee and | Hennessy Advisors, Inc. since 1989 | Advisors, Inc. |
| Trustee, Chairman of | June 2008 as | and currently serves as its President, | |
| the Board, Chief | an Officer | Chairman and Chief Executive Officer. | |
| Investment Officer, | | | |
| Portfolio Manager, | | | |
| and President | | | |
| Name, (Year of Birth), | | |
| and Position Held | Start Date | Principal Occupation(s) |
with the Trust | of Service | During Past Five Years |
| | | |
| Officers | | |
| | | |
| Teresa M. Nilsen | January 1996 | Ms. Nilsen has been employed by Hennessy Advisors, Inc. |
| (1966) | | since 1989 and currently serves as its Executive Vice President, |
| Executive Vice President | | Chief Operations Officer, Chief Financial Officer, and Secretary. |
| and Treasurer | | |
| | | |
| Daniel B. Steadman | March 2000 | Mr. Steadman has been employed by Hennessy Advisors, Inc. |
| (1956) | | since 2000 and currently serves as its Executive Vice President |
| Executive Vice President | | and Chief Compliance Officer. |
| and Secretary | | |
| | | |
| Jennifer Cheskiewicz | June 2013 | Ms. Cheskiewicz has been employed by Hennessy Advisors, Inc. |
| (1977) | | as its General Counsel since June 2013. She previously served |
| Senior Vice President and | | as in-house counsel to Carlson Capital, L.P., an SEC-registered |
| Chief Compliance Officer | | investment advisor to several private funds, from |
| | | February 2010 to May 2013. |
| | | |
| Brian Carlson | December 2013 | Mr. Carlson has been employed by Hennessy Advisors, Inc. |
| (1972) | | since December 2013. Mr. Carlson was previously a co-founder |
| Senior Vice President and | | and principal of Trivium Consultants, LLC from February 2011 |
| Head of Distribution | | through November 2013. |
HENNESSYFUNDS.COM
| TRUSTEES AND OFFICERS OF THE FUND |
| Name, (Year of Birth), | | |
| and Position Held | Start Date | Principal Occupation(s) |
with the Trust | of Service | During Past Five Years |
| | | |
| David Ellison | October 2012 | Mr. Ellison has been employed by Hennessy Advisors, Inc. since |
(1958)(3) | | October 2012. He has served as a Portfolio Manager of the |
| Senior Vice President and | | Hennessy Small Cap Financial Fund, the Hennessy Large Cap |
| Portfolio Manager | | Financial Fund, and the Hennessy Technology Fund since |
| | | inception. Prior to that, Mr. Ellison served as Director, CIO and |
| | | President of FBR Fund Advisers, Inc. from December |
| | | 1999 to October 2012. |
| | | |
| Brian Peery | March 2003 as | Mr. Peery has been employed by Hennessy Advisors, Inc. since |
| (1969) | an Officer and | 2002. He has served as a Portfolio Manager of the Hennessy |
| Senior Vice President and | February 2011 | Cornerstone Growth Fund, the Hennessy Cornerstone Mid Cap |
| Portfolio Manager | as a Co-Portfolio | 30 Fund, the Hennessy Cornerstone Large Growth Fund, the |
| | Manager or | Hennessy Cornerstone Value Fund, the Hennessy Total Return |
| | Portfolio Manager | Fund, and the Hennessy Balanced Fund since October 2014. |
| | | He served as Co-Portfolio Manager of the same funds from |
| | | February 2011 through September 2014. Mr. Peery has also |
| | | served as a Portfolio Manager of the Hennessy Gas Utility Fund |
| | | since February 2015. |
| | | |
| Winsor (Skip) Aylesworth | October 2012 | Mr. Aylesworth has been employed by Hennessy Advisors, Inc. |
(1947)(3) | | since October 2012. He has served as a Portfolio Manager of |
| Vice President and | | the Hennessy Gas Utility Fund since 1998 and as a Portfolio |
| Portfolio Manager | | Manager of the Hennessy Technology Fund since inception. |
| | | Prior to that, Mr. Aylesworth served as Executive Vice President |
| | | of FBR Fund Advisers, Inc. from 1999 to October 2012. |
| | | |
| Ryan Kelley | March 2013 | Mr. Kelley has been employed by Hennessy Advisors, Inc. since |
(1972)(4) | | October 2012. He has served as a Portfolio Manager of the |
| Vice President and | | Hennessy Gas Utility Fund, the Hennessy Small Cap Financial |
| Portfolio Manager | | Fund, and the Hennessy Large Cap Financial Fund since |
| | | October 2014. He served as Co-Portfolio Manager of the same |
| | | funds from March 2013 through September 2014, and as a |
| | | Portfolio Analyst for the Hennessy Funds from October 2012 |
| | | through February 2013. Prior to that, Mr. Kelley served as |
| | | Portfolio Manager of FBR Fund Advisers, Inc. from |
| | | January 2008 to October 2012. |
_______________
(1) | Messrs. DeSousa, Doyle, Hennessy, and Richardson previously served on the Board of Directors of Hennessy Mutual Funds, Inc. (“HMFI”), The Hennessy Funds, Inc. (“HFI”), and Hennessy SPARX Funds Trust (“HSFT”). Pursuant to an internal reorganization effective as of February 28, 2014, the series of HFMI, HFI, and HSFT were reorganized into corresponding series of Hennessy Funds Trust that mirrored them. Subsequent to the reorganization, HFMI, HFI, and HSFT were dissolved. |
(2) | Mr. Hennessy is considered an “interested person,” as defined in the Investment Company Act of 1940, as amended, because he is an officer of the Hennessy Funds. |
(3) | The address of these officers is 101 Federal Street, Suite 1900, Boston, MA 02110. |
(4) | The address of this officer is 1340 Environ Way, Suite 305, Chapel Hill, NC 27517. |
| HENNESSY FUNDS | 1-800-966-4354 | |
Expense Example (Unaudited)
October 31, 2016
As a shareholder of the Fund, you incur two types of costs: (1) transaction costs, including sales charges (loads) on purchase payments, reinvested dividends, or other distributions; redemption fees; and exchange fees; and (2) ongoing costs, including management fees; service fees; and other Fund expenses. This Example is intended to help you understand your ongoing costs (in dollars) of investing in the Fund and to compare these costs with the ongoing costs of investing in other mutual funds. The Example is based on an investment of $1,000 invested at the beginning of the period and held for the entire period from May 1, 2016, through October 31, 2016.
Actual Expenses
The first line of the table below under the “Investor Class” and “Institutional Class” headings provides information about actual account values and actual expenses. Although the Fund charges no sales loads or transaction fees, you will be assessed fees for outgoing wire transfers, returned checks and stop payment orders at prevailing rates charged by U.S. Bancorp Fund Services, LLC, the Fund’s transfer agent. If you request that a redemption be made by wire transfer, currently a $15 fee is charged by the Fund’s transfer agent. IRA accounts will be charged a $15 annual maintenance fee. The example below includes, but is not limited to, management fees, shareholder servicing fees, fund accounting, custody, and transfer agent fees. However, the example below does not include portfolio trading commissions and related expenses, and other extraordinary expenses as determined under generally accepted accounting principles. You may use the information in this line, together with the amount you invested, to estimate the expenses that you paid over the period. Simply divide your account value by $1,000 (for example, an $8,600 account value divided by $1,000 = 8.6), then multiply the result by the number in the first line of the table under the “Investor Class” and “Institutional Class” headings in the column entitled “Expenses Paid During Period” to estimate the expenses you paid on your account during this period.
Hypothetical Example for Comparison Purposes
The second line of the table below under the “Investor Class” and “Institutional Class” headings provides information about hypothetical account values and hypothetical expenses based on the Fund’s actual expense ratios and an assumed rate of return of 5% per year before expenses, which is not the Fund’s actual return. The hypothetical account values and expenses may not be used to estimate the actual ending account balance or expenses you paid for the period. You may use this information to compare the ongoing costs of investing in the Fund and other funds. To do so, compare this 5% hypothetical example with the 5% hypothetical examples that appear in the shareholder reports of the other funds. Please note that the expenses shown in the table are meant to highlight your ongoing costs only and do not reflect any transactional costs, such as sales charges (loads), or exchange fees. Therefore, the second line of the table under the “Investor Class” and “Institutional Class” headings is useful in comparing ongoing costs only, and will not help you determine the relative total costs of owning different funds. In addition, if these transactional costs were included, your costs would have been higher.
HENNESSYFUNDS.COM
| | | | Expenses Paid |
| | Beginning | Ending | During Period(1) |
| | Account Value | Account Value | May 1, 2016 – |
| | May 1, 2016 | October 31, 2016 | October 31, 2016 |
| Investor Class | | | |
| Actual | $1,000.00 | $ 998.60 | $19.94 |
| Hypothetical (5% return before expenses) | $1,000.00 | $1,005.18 | $20.01 |
| | | | |
| Institutional Class | | | |
| Actual | $1,000.00 | $1,001.60 | $17.81 |
| Hypothetical (5% return before expenses) | $1,000.00 | $1,007.34 | $17.86 |
(1) | Expenses are equal to the Fund’s annualized expense ratio of 3.97% for Investor Class shares or 3.54% for Institutional Class shares, as applicable, multiplied by the average account value over the period, multiplied by 184/366 days (to reflect one-half year period). |
| HENNESSY FUNDS | 1-800-966-4354 | |
How to Obtain a Copy of the Fund’s
Proxy Voting Policy and Proxy Voting Records
A description of the policies and procedures the Fund uses to determine how to vote proxies relating to portfolio securities is available without charge: (1) by calling 1-800-966-4354; (2) on the Hennessy Funds’ website at hennessyfunds.com/proxy-voting/policy.fs; or (3) on the U.S. Securities and Exchange Commission’s website at www.sec.gov. The Fund’s proxy voting record is available without charge on both the Hennessy Funds’ website at hennessyfunds.com/proxy-voting/vote.fs and the SEC’s website at www.sec.gov no later than August 31 for the prior 12 months ending June 30.
Quarterly Filings on Form N-Q
The Fund files its complete schedule of portfolio holdings with the SEC for the first and third quarters of each fiscal year on Form N-Q. The Fund’s Form N-Q will be available on the SEC’s website at www.sec.gov. The Fund’s Form N-Q may be reviewed and copied at the SEC’s Public Reference Room in Washington, DC and information on the operation of the Public Reference Room may be obtained by calling 1-800-SEC-0330. Information included in the Fund’s N-Q will also be available upon request by calling 1-800-966-4354.
Federal Tax Distribution Information
(Unaudited)
For the fiscal year ended October 31, 2016, certain dividends paid by the Fund may be subject to a maximum tax rate of 23.8%, as provided for by the Jobs and Growth Tax Relief Reconciliation Act of 2003. The percentage of dividends declared from ordinary income designated as qualified dividend income was 58.09%.
For corporate shareholders, the percent of ordinary income distributions that qualified for the corporate dividends received deduction for the fiscal year ended October 31, 2016, was 58.09%.
The percentage of taxable ordinary income distributions that are designated as short-term capital gain distributions under Section 871(k)(2)(C) of the Internal Revenue Code of 1986, as amended, for the Fund was 43.32%.
Householding
To help keep the Fund’s costs as low as possible, we generally deliver a single copy of most financial reports and prospectuses to shareholders who share an address, even if the accounts are registered under different names. This process, known as “householding,” does not apply to account statements. You may, of course, request an individual copy of a prospectus or financial report at any time. If you would like to receive separate mailings, please call the Administrator at 1-800-261-6950 or 1-414-765-4124 and we will begin individual delivery within 30 days of your request. If your account is held through a financial institution or other intermediary, please contact them directly to request individual delivery.
HENNESSYFUNDS.COM
| PROXY VOTING — PRIVACY POLICY |
Privacy Policy
We collect the following non-public personal information about you:
| | • | information we receive from you on or in applications or other forms, correspondence, or conversations, including, but not limited to, your name, address, phone number, social security number, assets, income, and date of birth; and |
| | | |
| | • | information about your transactions with us, our affiliates, or others, including, but not limited to, your account number and balance, payment history, parties to transactions, cost basis information, and other financial information. |
We do not disclose any non-public personal information about our current or former shareholders to non-affiliated third parties, except as permitted by law. For example, we are permitted by law to disclose all of the information we collect, as described above, to our Transfer Agent to process your transactions. Furthermore, we restrict access to your non-public personal information to those persons who require such information to provide products or services to you. We maintain physical, electronic, and procedural safeguards that comply with federal standards to guard your non-public personal information.
In the event that you hold shares of the Fund through a financial intermediary, including, but not limited to, a broker-dealer, bank or trust company, the privacy policy of your financial intermediary would govern how your non-public personal information would be shared with non-affiliated third parties.
| HENNESSY FUNDS | 1-800-966-4354 | |
For information, questions or assistance, please call
The Hennessy Funds
1-800-966-4354 or 1-415-899-1555
INVESTMENT ADVISOR
Hennessy Advisors, Inc.
7250 Redwood Blvd., Suite 200
Novato, California 94945
ADMINISTRATOR,
TRANSFER AGENT,
DIVIDEND PAYING AGENT &
SHAREHOLDER SERVICING AGENT
U.S. Bancorp Fund Services, LLC
P.O. Box 701
Milwaukee, Wisconsin 53201-0701
CUSTODIAN
U.S. Bank N.A.
Custody Operations
1555 North River Center Dr., Suite 302
Milwaukee, Wisconsin 53212
TRUSTEES
Neil J. Hennessy
Robert T. Doyle
J. Dennis DeSousa
Gerald P. Richardson
COUNSEL
Foley & Lardner LLP
777 East Wisconsin Avenue
Milwaukee, Wisconsin 53202-5306
INDEPENDENT REGISTERED
PUBLIC ACCOUNTING FIRM
Tait, Weller & Baker LLP
1818 Market Street, Suite 2400
Philadelphia, Pennsylvania 19103
DISTRIBUTOR
Quasar Distributors, LLC
615 East Michigan Street
Milwaukee, Wisconsin 53202
hennessyfunds.com | 1-800-966-4354
This report has been prepared for shareholders and may be distributed to
others only if preceded or accompanied by a current prospectus.
ANNUAL REPORT
OCTOBER 31, 2016
HENNESSY GAS UTILITY FUND
Investor Class GASFX
hennessyfunds.com | 1-800-966-4354
(This Page Intentionally Left Blank.)
Contents
| Letter to Shareholders | | | 2 |
| Performance Overview | | | 4 |
| Financial Statements | | | |
| Schedule of Investments | | | 7 |
| Statement of Assets and Liabilities | | | 11 |
| Statement of Operations | | | 12 |
| Statements of Changes in Net Assets | | | 13 |
| Financial Highlights | | | 14 |
| Notes to the Financial Statements | | | 16 |
| Report of Independent Registered Public Accounting Firm | | | 24 |
| Trustees and Officers of the Fund | | | 25 |
| Expense Example | | | 28 |
| Proxy Voting | | | 30 |
| Quarterly Filings on Form N-Q | | | 30 |
| Federal Tax Distribution Information | | | 30 |
| Householding | | | 30 |
| Privacy Policy | | | 31 |
| HENNESSY FUNDS | 1-800-966-4354 | |
December 2016
Dear Hennessy Funds Shareholder:
Over the past year investors here in the U.S. and around the world have weathered a great deal of turmoil, especially in the political arena. Foremost, the bitterly divisive and all-consuming U.S. Presidential election, with its unanticipated outcome, is finally behind us. While the equity markets were jittery at first, they now appear more comfortable with the prospect of a Trump presidency and seem to be looking forward to diminished government regulation and intervention.
The Brexit vote in the U.K. cast a shadow over the European Union’s future. There remains uncertainty over the details and timing of the break and the economic consequences for both Britain and Europe, but early signs suggest the impact on growth in Britain will not be as severe as initially feared.
Additionally, uncertainty over whether the Federal Reserve would raise short-term interest rates has hung over the economy for well over a year now. The effects that higher rates could have on growth, the strength of the U.S. Dollar, corporate profits and loan supply and demand seem to have weighed heavily on investors, causing paralysis and money to remain on the sidelines of the market.
Despite all these concerns, U.S. equity markets have pushed higher, with both the Dow Jones Industrial Average and S&P 500 Index posting returns of approximately 5% during the twelve-month period ended October 31, 2016. The U.S. economy has continued to grow at a respectable annual rate of about 2%, and corporate profits have started to move higher. Today, as of mid-December, bond and Treasury yields have risen a bit from record lows just this summer, and the bond market is finishing the year on slightly rocky footing. Bond yields are still very low relative to historical averages, while the prospective PE multiples for the Dow Jones Industrial Average and S&P 500 Index are just above long-term averages at 18.0x and 18.9x, respectively. We believe that equity valuations could go considerably higher and still be at appropriate levels relative to bond yields. And, while we do expect the Fed to raise interest rates in the coming year, we believe that inflation will stay under control, so that short-term interest rates will not have to rise too fast or too far.
As I reflect over the past twelve months, what I realize is that many of the worries this year are not new. For the past several years, American businesses have operated in an environment characterized by highly partisan politics, mounting regulations, uncertainty over interest rates, and a lack of clarity regarding taxes and healthcare costs. Despite all these headwinds, U.S. corporations have been incredibly resilient and found ways to impress investors. If the newly elected administration follows through on campaign promises of reigning in regulation, lowering taxes for corporations and individuals, or reforming healthcare to drive down costs, then companies, which are already lean, should be able to post higher profits. And, that growth should lead to more jobs and a stronger economy, potentially creating a very positive cycle going forward.
With the bull market in U.S. equities entering its ninth year, many believe the economy is due for a recession and the market is due for a downturn. But, the euphoria that usually accompanies a peak in the market is absent. Since the recovery began after the financial crisis, I have found myself pondering the bull run of 1982 to 2000, powered, in part, by a significant increase in valuations. I believe today’s market displays the fundamentals to sustain a similarly strong and lengthy bull market. Meanwhile, companies are largely profitable and many corporate balance sheets are cash-rich, with
HENNESSYFUNDS.COM
relatively little debt. Unemployment is low and real wages are rising, helping to drive consumption. We are hopeful that these factors will provide support for positive market returns in the year to come.
Thank you for your continued confidence and investment in our funds. If you have any questions or would like to speak with us directly, please don’t hesitate to call us at (800) 966-4354.
Best regards,
Neil J. Hennessy
President and Chief Investment Officer
Past performance does not guarantee future results.
Mutual fund investing involves risk. Principal loss is possible.
Opinions expressed are those of Neil Hennessy and are subject to change, are not guaranteed and should not be considered investment advice.
The Dow Jones Industrial Average and S&P 500 Index are unmanaged indices commonly used to measure the performance of U.S. stocks. One cannot invest directly in an index.
PE, or price to earnings, is calculated by dividing a company’s market price per share by its earnings per share.
| HENNESSY FUNDS | 1-800-966-4354 | |
Performance Overview (Unaudited)
CHANGE IN VALUE OF $10,000 INVESTMENT
This graph illustrates the performance of an initial investment of $10,000 made in the Fund ten years ago and assumes the reinvestment of dividends.
AVERAGE ANNUAL TOTAL RETURN FOR PERIODS ENDED OCTOBER 31, 2016
| | One | Five | Ten |
| | Year | Years | Years |
| Hennessy Gas Utility Fund – | | | |
| Investor Class (GASFX) | 8.52% | 11.18% | 9.46% |
| AGA Stock Index* | 10.04% | 11.96% | 10.19% |
| S&P 500 Index | 4.51% | 13.57% | 6.70% |
Expense ratio: 1.02%
Performance data quoted represents past performance; past performance does not guarantee future results. The investment return and principal value of an investment will fluctuate so that an investor’s shares, when redeemed, may be worth more or less than their original cost. The performance graph and table do not reflect the deduction of taxes that a shareholder would pay on Fund distributions or the redemption of Fund shares. Current performance of the Fund may be lower or higher than the performance quoted. Performance data current to the most recent month end may be obtained by visiting hennessyfunds.com. Performance for periods prior to October 26, 2012 is that of the FBR Gas Utility Index Fund.
The expense ratio presented is from the most recent prospectus.
| * | The AGA Stock Index is a market capitalization-weighted index, consisting of member companies of the American Gas Association. Performance for the AGA Stock Index is provided monthly by the American Gas Association. |
PERFORMANCE NARRATIVE
Portfolio Managers Winsor H. (Skip) Aylesworth, Ryan C. Kelley and Brian E. Perry
Performance:
For the twelve-month period ended October 31, 2016, the Hennessy Gas Utility Fund returned 8.52%, outperforming the S&P 500 Index, which returned 4.51%, but underperforming the AGA Stock Index,* which returned 10.04%, for the same period.
We are pleased with the Fund’s performance this year as it outperformed the overall market, as represented by the S&P 500 Index, and only slightly underperformed its
HENNESSYFUNDS.COM
benchmark index, the AGA Stock Index, after taking into account Fund expenses. A major contributor to performance relative to the S&P 500 Index was merger and acquisition (M&A) activity within the portfolio. In addition, as oil prices improved from their early year lows, the Fund’s investments in interstate pipelines and liquefied natural gas, or LNG, exporters performed well. Finally, the core part of the portfolio that includes Local Distribution Companies and Diversified Utilities did well due to higher rates driven by higher fixed investment and increased gas demand due to warmer than normal summer weather patterns.
Portfolio Strategy:
The Fund’s investment objective is to provide investors with the return of the AGA Stock Index less expenses. The AGA Stock Index is comprised of publicly-traded members of the American Gas Association (AGA), a national trade association of natural gas distribution companies. The investment thesis of the Fund centers on the presence of abundant natural gas supplies here in the U.S. keeping natural gas prices low and competitive. Low prices, in turn, can lead to steady growth in demand for and consumption of natural gas, which should drive growth in revenues for the natural gas distribution companies owned by the Fund. Natural gas’s position as the most environmentally friendly of all the fossil fuels is also helping drive growth in demand, especially within the power generation industry.
The M&A activity first mentioned in the Fund’s semi-annual report continued in the second half of the fiscal year. On July 1, 2016, three previously announced transactions were completed: TransCanada Corporation** bought Columbia Pipeline Group**, The Southern Company acquired AGL Resources** and Emera Corp. bought TECO Energy**. On September 19, 2016, Dominion Resources** bought Questar Corp.** Finally, Duke Energy** acquired Piedmont Natural Gas** on October 4, 2016. As a result of all this activity, Columbia Pipeline Group, AGL Resources, TECO Energy, Questar Corp. and Piedmont Natural Gas, as well as UIL Holdings Corp and Pepco Holdings, were all deleted from the AGA Stock Index during fiscal year 2016. The Southern Company, as a result of its merger above, joined AGA and hence the AGA Stock Index in July 2016. Lastly, The Williams Companies left the AGA Stock Index in June 2016 when it dropped its AGA membership as it restructured from its failed merger with Energy Transfer Equity, L.P.
Investment Outlook:
Despite the volatility in commodity prices over this last year, we believe the thesis of the Fund remains firmly intact. The attractive environmental characteristics of natural gas together with competitive pricing should continue to drive demand growth, which, we believe, should drive long-term revenue and profit growth for the distribution companies in the Fund.
_______________
| * | The AGA Stock Index is a market capitalization-weighted index, consisting of member companies of the American Gas Association. Performance for the AGA Stock Index is provided monthly by the American Gas Association. |
| ** | Member of the American Gas Association (AGA). |
Opinions expressed are those of the Portfolio Managers as of the date written and are subject to change, are not guaranteed, and should not be considered investment advice or an indication of trading intent.
The S&P 500 Index is an unmanaged index commonly used to measure the performance of U.S. stocks. One cannot invest directly in an index.
The Fund is non-diversified, meaning it may concentrate its assets in fewer individual holdings than a diversified fund, making it more exposed to individual stock volatility than a diversified
| HENNESSY FUNDS | 1-800-966-4354 | |
fund. Investments in foreign securities may involve political, economic and currency risks, greater volatility and differences in accounting methods. Investments are focused in the natural gas distribution and transmission industry; sector funds may be subject to a higher degree of market risk. Please see the Fund’s prospectus for a more complete discussion of these and other risks.
References to specific securities should not be considered a recommendation to buy or sell any security. Fund holdings and sector allocations are subject to change. Please refer to the Schedule of Investments included in this report for additional portfolio information.
HENNESSYFUNDS.COM
| PERFORMANCE OVERVIEW/SCHEDULE OF INVESTMENTS |
Financial Statements
Schedule of Investments as of October 31, 2016 |
HENNESSY GAS UTILITY FUND
(% of Net Assets)
| TOP TEN HOLDINGS (EXCLUDING CASH/CASH EQUIVALENTS) | % NET ASSETS |
| | |
| Dominion Resources, Inc. | 5.04% |
| | |
| Sempra Energy | 5.02% |
| | |
| National Grid PLC | 4.97% |
| | |
| TransCanada Corp. | 4.90% |
| | |
| Enbridge, Inc. | 4.90% |
| | |
| Spectra Energy Corp. | 4.90% |
| | |
| Kinder Morgan, Inc. | 4.89% |
| | |
| PG&E Corp. | 4.80% |
| | |
| Cheniere Energy, Inc. | 4.74% |
| | |
| Atmos Energy Corp. | 4.68% |
Note: For presentation purposes, the Fund has grouped some of the industry categories. For purposes of categorizing securities for compliance with Section 8(b)(1) of the Investment Company Act of 1940, as amended, the Fund uses more specific industry classifications.
| HENNESSY FUNDS | 1-800-966-4354 | |
| | COMMON STOCKS – 97.99% | | Number | | | | | | % of | |
| | | | of Shares | | | Value | | | Net Assets | |
| | Energy – 26.03% | | | | | | | | | |
| | Cheniere Energy, Inc. (a) | | | 1,830,617 | | | $ | 69,014,261 | | | | 4.74 | % |
| | Enbridge, Inc. (b) | | | 1,651,432 | | | | 71,292,319 | | | | 4.90 | % |
| | EQT Corp. | | | 374,532 | | | | 24,719,112 | | | | 1.70 | % |
| | Kinder Morgan, Inc. | | | 3,480,601 | | | | 71,108,678 | | | | 4.89 | % |
| | Spectra Energy Corp. | | | 1,704,555 | | | | 71,267,445 | | | | 4.90 | % |
| | TransCanada Corp. (b) | | | 1,574,553 | | | | 71,295,760 | | | | 4.90 | % |
| | | | | | | | | 378,697,575 | | | | 26.03 | % |
| | | | | | | | | | | | | | |
| | Financials – 0.50% | | | | | | | | | | | | |
| | Berkshire Hathaway, Inc., Class A (a) | | | 34 | | | | 7,333,800 | | | | 0.50 | % |
| | | | | | | | | | | | | | |
| | Utilities – 71.46% | | | | | | | | | | | | |
| | ALLETE, Inc. | | | 2,200 | | | | 134,838 | | | | 0.01 | % |
| | Alliant Energy Corp. | | | 146,308 | | | | 5,567,019 | | | | 0.38 | % |
| | Ameren Corp. | | | 187,990 | | | | 9,390,101 | | | | 0.65 | % |
| | Atmos Energy Corp. | | | 915,536 | | | | 68,106,723 | | | | 4.68 | % |
| | Avangrid, Inc. | | | 117,800 | | | | 4,642,498 | | | | 0.32 | % |
| | Avista Corp. | | | 104,472 | | | | 4,325,141 | | | | 0.30 | % |
| | Black Hills Corp. | | | 84,459 | | | | 5,223,789 | | | | 0.36 | % |
| | Centerpoint Energy, Inc. | | | 1,025,328 | | | | 23,377,478 | | | | 1.61 | % |
| | Chesapeake Utilities Corp. | | | 103,658 | | | | 6,639,295 | | | | 0.46 | % |
| | CMS Energy Corp. | | | 746,648 | | | | 31,471,213 | | | | 2.16 | % |
| | Consolidated Edison, Inc. | | | 445,286 | | | | 33,641,357 | | | | 2.31 | % |
| | Corning Natural Gas Holding Corp. | | | 21,064 | | | | 452,876 | | | | 0.03 | % |
| | Delta Natural Gas Company, Inc. | | | 60,928 | | | | 1,434,854 | | | | 0.10 | % |
| | Dominion Resources, Inc. | | | 974,446 | | | | 73,278,339 | | | | 5.04 | % |
| | DTE Energy Co. | | | 294,754 | | | | 28,299,332 | | | | 1.95 | % |
| | Duke Energy Corp. | | | 298,737 | | | | 23,904,935 | | | | 1.64 | % |
| | Entergy Corp. | | | 12,300 | | | | 906,264 | | | | 0.06 | % |
| �� | Eversource Energy | | | 281,475 | | | | 15,498,014 | | | | 1.07 | % |
| | Exelon Corp. | | | 424,831 | | | | 14,473,992 | | | | 0.99 | % |
| | Gas Natural, Inc. | | | 62,718 | | | | 774,567 | | | | 0.05 | % |
| | MDU Resources Group, Inc. | | | 696,907 | | | | 18,265,933 | | | | 1.26 | % |
| | MGE Energy, Inc. | | | 52,554 | | | | 3,071,781 | | | | 0.21 | % |
| | National Fuel Gas Co. | | | 398,524 | | | | 20,874,687 | | | | 1.43 | % |
| | National Grid PLC – ADR (b) | | | 1,105,558 | | | | 72,325,604 | | | | 4.97 | % |
The accompanying notes are an integral part of these financial statements.
HENNESSYFUNDS.COM
| | COMMON STOCKS | | Number | | | | | | % of | |
| | | | of Shares | | | Value | | | Net Assets | |
| | Utilities (Continued) | | | | | | | | | |
| | New Jersey Resources Corp. | | | 542,084 | | | $ | 18,403,752 | | | | 1.26 | % |
| | NiSource, Inc. | | | 1,657,631 | | | | 38,556,497 | | | | 2.65 | % |
| | Northwest Natural Gas Co. | | | 239,286 | | | | 14,070,017 | | | | 0.97 | % |
| | NorthWestern Corp. | | | 84,648 | | | | 4,871,492 | | | | 0.33 | % |
| | ONE Gas, Inc. | | | 464,625 | | | | 28,472,220 | | | | 1.96 | % |
| | PG&E Corp. | | | 1,125,149 | | | | 69,894,256 | | | | 4.80 | % |
| | PPL Corp. | | | 541,819 | | | | 18,606,065 | | | | 1.28 | % |
| | Public Service Enterprise Group, Inc. | | | 759,790 | | | | 31,971,963 | | | | 2.20 | % |
| | RGC Resources, Inc. | | | 40,244 | | | | 990,002 | | | | 0.07 | % |
| | SCANA Corp. | | | 189,966 | | | | 13,935,906 | | | | 0.96 | % |
| | Sempra Energy | | | 682,340 | | | | 73,078,614 | | | | 5.02 | % |
| | South Jersey Industries, Inc. | | | 466,421 | | | | 13,829,383 | | | | 0.95 | % |
| | Southwest Gas Corp. | | | 380,317 | | | | 27,557,770 | | | | 1.89 | % |
| | Spire, Inc. | | | 348,291 | | | | 21,872,675 | | | | 1.50 | % |
| | The Empire District Electric Co. | | | 19,825 | | | | 678,610 | | | | 0.05 | % |
| | The Southern Co. | | | 1,246,600 | | | | 64,287,162 | | | | 4.42 | % |
| | UGI Corp. | | | 343,402 | | | | 15,896,079 | | | | 1.09 | % |
| | Unitil Corp. | | | 69,698 | | | | 2,827,648 | | | | 0.19 | % |
| | Vectren Corp. | | | 372,228 | | | | 18,726,791 | | | | 1.29 | % |
| | WEC Energy Group, Inc. | | | 861,590 | | | | 51,454,155 | | | | 3.54 | % |
| | WGL Holdings, Inc. | | | 359,092 | | | | 22,647,932 | | | | 1.56 | % |
| | Xcel Energy, Inc. | | | 504,399 | | | | 20,957,778 | | | | 1.44 | % |
| | | | | | | | | 1,039,667,397 | | | | 71.46 | % |
| | | | | | | | | | | | | | |
| | Total Common Stocks | | | | | | | | | | | | |
| | (Cost $979,419,101) | | | | | | | 1,425,698,772 | | | | 97.99 | % |
| | | | | | | | | | | | | | |
| | PARTNERSHIPS – 1.15% | | | | | | | | | | | | |
| | | | | | | | | | | | | | |
| | Energy – 1.15% | | | | | | | | | | | | |
| | Plains GP Holdings LP | | | 1,323,277 | | | | 16,620,359 | | | | 1.15 | % |
| | | | | | | | | | | | | | |
| | Total Partnerships | | | | | | | | | | | | |
| | (Cost $21,344,499) | | | | | | | 16,620,359 | | | | 1.15 | % |
The accompanying notes are an integral part of these financial statements.
| HENNESSY FUNDS | 1-800-966-4354 | |
| | SHORT-TERM INVESTMENTS – 1.21% | | Number | | | | | | % of | |
| | | | of Shares | | | Value | | | Net Assets | |
| | Money Market Funds – 1.21% | | | | | | | | | |
| | Fidelity Government Portfolio, Institutional Class, 0.27% (c) | | | 17,666,707 | | | $ | 17,666,707 | | | | 1.21 | % |
| | | | | | | | | | | | | | |
| | Total Short-Term Investments | | | | | | | | | | | | |
| | (Cost $17,666,707) | | | | | | | 17,666,707 | | | | 1.21 | % |
| | | | | | | | | | | | | | |
| | Total Investments | | | | | | | | | | | | |
| | (Cost $1,018,430,307) – 100.35% | | | | | | | 1,459,985,838 | | | | 100.35 | % |
| | Liabilities in Excess of Other Assets – (0.35)% | | | | | | | (5,060,407 | ) | | | (0.35 | )% |
| | | | | | | | | | | | | | |
| | TOTAL NET ASSETS – 100.00% | | | | | | $ | 1,454,925,431 | | | | 100.00 | % |
Percentages are stated as a percent of net assets.
ADR – American Depositary Receipt
| (a) | Non-income producing security. |
| (b) | U.S. traded security of a foreign corporation. |
| (c) | The rate listed is the fund’s 7-day yield as of October 31, 2016. |
Summary of Fair Value Exposure at October 31, 2016
The following is a summary of the inputs used to value the Fund’s net assets as of October 31, 2016 (see Note 3 in the accompanying notes to the financial statements):
| Common Stocks | | Level 1 | | | Level 2 | | | Level 3 | | | Total | |
| Energy | | $ | 378,697,575 | | | $ | — | | | $ | — | | | $ | 378,697,575 | |
| Financials | | | 7,333,800 | | | | — | | | | — | | | | 7,333,800 | |
| Utilities | | | 1,039,667,397 | | | | — | | | | — | | | | 1,039,667,397 | |
| Total Common Stocks | | $ | 1,425,698,772 | | | $ | — | | | $ | — | | | $ | 1,425,698,772 | |
| Partnerships | | | | | | | | | | | | | | | | |
| Energy | | $ | 16,620,359 | | | $ | — | | | $ | — | | | $ | 16,620,359 | |
| Total Partnerships | | $ | 16,620,359 | | | $ | — | | | $ | — | | | $ | 16,620,359 | |
| Short-Term Investments | | | | | | | | | | | | | | | | |
| Money Market Funds | | $ | 17,666,707 | | | $ | — | | | $ | — | | | $ | 17,666,707 | |
| Total Short-Term Investments | | $ | 17,666,707 | | | $ | — | | | $ | — | | | $ | 17,666,707 | |
| Total Investments | | $ | 1,459,985,838 | | | $ | — | | | $ | — | | | $ | 1,459,985,838 | |
Transfers between levels are recognized at the end of the reporting period. During the year ended October 31, 2016, the Fund recognized no transfers between levels.
The accompanying notes are an integral part of these financial statements.
HENNESSYFUNDS.COM
| SCHEDULE OF INVESTMENTS/STATEMENT OF ASSETS AND LIABILITIES |
Financial Statements
Statement of Assets and Liabilities as of October 31, 2016 | | | |
| | | | |
| ASSETS: | | | |
| Investments in securities, at value (cost $1,018,430,307) | | $ | 1,459,985,838 | |
| Dividends and interest receivable | | | 1,339,540 | |
| Receivable for fund shares sold | | | 698,850 | |
| Receivable for securities sold | | | 5,012,756 | |
| Prepaid expenses and other assets | | | 45,781 | |
| Total Assets | | | 1,467,082,765 | |
| | | | | |
| LIABILITIES: | | | | |
| Due to custodian | | | 100,490 | |
| Payable for securities purchased | | | 8,589,680 | |
| Payable for fund shares redeemed | | | 1,667,056 | |
| Payable to advisor | | | 491,083 | |
| Payable to administrator | | | 244,411 | |
| Payable to auditor | | | 20,698 | |
| Accrued distribution fees | | | 523,059 | |
| Accrued service fees | | | 122,771 | |
| Accrued trustees fees | | | 3,900 | |
| Accrued expenses and other payables | | | 394,186 | |
| Total Liabilities | | | 12,157,334 | |
| NET ASSETS | | $ | 1,454,925,431 | |
| | | | | |
| NET ASSETS CONSIST OF: | | | | |
| Capital stock | | $ | 1,080,380,133 | |
| Accumulated net realized loss on investments | | | (67,011,531 | ) |
| Unrealized net appreciation on investments and foreign currency translation | | | 441,556,829 | |
| Total Net Assets | | $ | 1,454,925,431 | |
| | | | | |
| NET ASSETS | | | | |
| Investor Class: | | | | |
| Shares authorized (no par value) | | Unlimited | |
| Net assets applicable to outstanding Investor Class shares | | $ | 1,454,925,431 | |
| Shares issued and outstanding | | | 50,929,293 | |
| Net asset value, offering price and redemption price per share | | $ | 28.57 | |
The accompanying notes are an integral part of these financial statements.
| HENNESSY FUNDS | 1-800-966-4354 | |
Financial Statements
Statement of Operations for the year ended October 31, 2016 | | | |
| | | | |
| INVESTMENT INCOME: | | | |
Dividend income(1) | | $ | 47,369,221 | |
| Interest income | | | 42,178 | |
| Total investment income | | | 47,411,399 | |
| | | | | |
| EXPENSES: | | | | |
| Investment advisory fees (See Note 5) | | | 5,822,629 | |
| Sub-transfer agent expenses – Investor Class (See Note 5) | | | 2,798,280 | |
| Distribution fees – Investor Class (See Note 5) | | | 2,183,486 | |
| Service fees – Investor Class (See Note 5) | | | 1,455,657 | |
| Administration, fund accounting, custody and transfer agent fees (See Note 5) | | | 1,419,188 | |
| Reports to shareholders | | | 120,049 | |
| Federal and state registration fees | | | 48,994 | |
| Compliance expense (See Note 5) | | | 23,710 | |
| Audit fees | | | 20,700 | |
| Trustees’ fees and expenses | | | 19,890 | |
| Legal fees | | | 18,629 | |
| Interest expense (See Note 7) | | | 674 | |
| Other expenses | | | 701,407 | |
| Total expenses | | | 14,633,293 | |
| NET INVESTMENT INCOME | | $ | 32,778,106 | |
| | | | | |
| REALIZED AND UNREALIZED GAINS (LOSSES): | | | | |
| Net realized gain (loss) on: | | | | |
| Investments | | $ | (19,604,689 | ) |
| Foreign currency translation | | | 22,029 | |
| Net change in unrealized appreciation on: | | | | |
| Investments | | | 87,365,207 | |
| Foreign currency translation | | | 1,298 | |
| Net gain on investments | | | 67,783,845 | |
| NET INCREASE IN NET ASSETS RESULTING FROM OPERATIONS | | $ | 100,561,951 | |
(1) | Net of foreign taxes withheld and issuance fees of $866,788. |
HENNESSYFUNDS.COM
| STATEMENT OF OPERATIONS/STATEMENTS OF CHANGES IN NET ASSETS |
Financial Statements
| Statements of Changes in Net Assets |
| | | Year Ended | | | Year Ended | |
| | | October 31, 2016 | | | October 31, 2015 | |
| OPERATIONS: | | | | | | |
| Net investment income | | $ | 32,778,106 | | | $ | 47,740,935 | |
| Net realized gain (loss) on investments | | | | | | | | |
| and foreign currency translation | | | (19,582,660 | ) | | | 34,462,135 | |
| Net change in unrealized appreciation (depreciation) | | | | | | | | |
| on investments and foreign currency translation | | | 87,366,505 | | | | (223,791,585 | ) |
| Net increase (decrease) in net | | | | | | | | |
| assets resulting from operations | | | 100,561,951 | | | | (141,588,515 | ) |
| | | | | | | | | |
| DISTRIBUTIONS TO SHAREHOLDERS FROM: | | | | | | | | |
| Net investment income – Investor Class | | | (36,851,113 | ) | | | (48,567,636 | ) |
| Net realized gains – Investor Class | | | (35,850,694 | ) | | | (66,085,456 | ) |
| Total distributions | | | (72,701,807 | ) | | | (114,653,092 | ) |
| | | | | | | | | |
| CAPITAL SHARE TRANSACTIONS: | | | | | | | | |
| Proceeds from shares subscribed – Investor Class | | | 168,313,204 | | | | 442,529,547 | |
| Dividends reinvested – Investor Class | | | 68,537,893 | | | | 108,194,311 | |
| Cost of shares redeemed – Investor Class | | | (458,991,855 | ) | | | (900,257,726 | ) |
| Net decrease in net assets derived | | | | | | | | |
| from capital share transactions | | | (222,140,758 | ) | | | (349,533,868 | ) |
| TOTAL DECREASE IN NET ASSETS | | | (194,280,614 | ) | | | (605,775,475 | ) |
| | | | | | | | | |
| NET ASSETS: | | | �� | | | | | |
| Beginning of year | | | 1,649,206,045 | | | | 2,254,981,520 | |
| End of year | | $ | 1,454,925,431 | | | $ | 1,649,206,045 | |
| Undistributed net investment | | | | | | | | |
| income, end of year | | $ | — | | | $ | 3,171,307 | |
| | | | | | | | | |
| CHANGES IN SHARES OUTSTANDING: | | | | | | | | |
| Shares sold – Investor Class | | | 6,213,940 | | | | 14,803,286 | |
| Shares issued to holders as reinvestment | | | | | | | | |
| of dividends – Investor Class | | | 2,666,176 | | | | 3,682,284 | |
| Shares redeemed – Investor Class | | | (17,517,095 | ) | | | (30,966,426 | ) |
| Net decrease in shares outstanding | | | (8,636,979 | ) | | | (12,480,856 | ) |
The accompanying notes are an integral part of these financial statements.
| HENNESSY FUNDS | 1-800-966-4354 | |
Financial Statements
For an Investor Class share outstanding throughout each year
PER SHARE DATA:
Net asset value, beginning of year
Income from investment operations:
Net investment income
Net realized and unrealized gains (losses) on investments
Total from investment operations
Less distributions:
Dividends from net investment income
Dividends from net realized gains
Total distributions
Paid-in capital from redemption fees
Net asset value, end of year
TOTAL RETURN
SUPPLEMENTAL DATA AND RATIOS:
Net assets, end of year (millions)
Ratio of expenses to average net assets
Ratio of net investment income to average net assets
Portfolio turnover rate
(1) | Amount is less than $0.01. |
The accompanying notes are an integral part of these financial statements.
HENNESSYFUNDS.COM
| FINANCIAL HIGHLIGHTS — INVESTOR CLASS |
| Year Ended October 31, | |
| 2016 | | | 2015 | | | 2014 | | | 2013 | | | 2012 | |
| | | | | | | | | | | | | | |
| $ | 27.69 | | | $ | 31.30 | | | $ | 26.69 | | | $ | 23.05 | | | $ | 21.21 | |
| | | | | | | | | | | | | | | | | | | |
| | | | | | | | | | | | | | | | | | | |
| | 0.62 | | | | 0.69 | | | | 0.62 | | | | 0.62 | | | | 0.58 | |
| | 1.58 | | | | (2.69 | ) | | | 5.18 | | | | 4.18 | | | | 1.99 | |
| | 2.20 | | | | (2.00 | ) | | | 5.80 | | | | 4.80 | | | | 2.57 | |
| | | | | | | | | | | | | | | | | | | |
| | | | | | | | | | | | | | | | | | | |
| | (0.69 | ) | | | (0.70 | ) | | | (0.59 | ) | | | (0.61 | ) | | | (0.58 | ) |
| | (0.63 | ) | | | (0.91 | ) | | | (0.60 | ) | | | (0.55 | ) | | | (0.16 | ) |
| | (1.32 | ) | | | (1.61 | ) | | | (1.19 | ) | | | (1.16 | ) | | | (0.74 | ) |
| | — | | | | — | | | | 0.00 | (1) | | | 0.00 | (1) | | | 0.01 | |
| $ | 28.57 | | | $ | 27.69 | | | $ | 31.30 | | | $ | 26.69 | | | $ | 23.05 | |
| | | | | | | | | | | | | | | | | | | |
| | 8.52 | % | | | (6.59 | )% | | | 22.49 | % | | | 21.70 | % | | | 12.41 | % |
| | | | | | | | | | | | | | | | | | | |
| | | | | | | | | | | | | | | | | | | |
| $ | 1,454.93 | | | $ | 1,649.21 | | | $ | 2,254.98 | | | $ | 1,182.79 | | | $ | 746.82 | |
| | 1.01 | % | | | 0.93 | % | | | 0.77 | % | | | 0.80 | % | | | 0.69 | % |
| | 2.25 | % | | | 2.33 | % | | | 2.26 | % | | | 2.56 | % | �� | | 2.72 | % |
| | 38 | % | | | 37 | % | | | 20 | % | | | 18 | % | | | 16 | % |
| | | | | | | | | | | | | | | | | | | |
The accompanying notes are an integral part of these financial statements.
| HENNESSY FUNDS | 1-800-966-4354 | |
Financial Statements
Notes to the Financial Statements October 31, 2016 |
1). ORGANIZATION
The Hennessy Gas Utility Fund (the “Fund”) is a series of Hennessy Funds Trust (the “Trust”), which was organized as a Delaware statutory trust on September 17, 1992. The Fund is an open-end management investment company registered under the Investment Company Act of 1940, as amended. The Fund is a successor to the FBR Gas Utility Index Fund (the “Predecessor FBR Fund”), a series of The FBR Funds, a Delaware statutory trust, pursuant to a reorganization that took place after the close of business on October 26, 2012. Prior to October 26, 2012, the Fund had no investment operations. As a result of the reorganization, holders of Investor Class shares of the Predecessor FBR Fund received Investor Class shares of the Fund (the Investor Class shares of the Fund are the successor to the accounting and performance information of the corresponding shares of the Predecessor FBR Fund). The investment objective of the Fund is income and capital appreciation. The Fund is a non-diversified fund and offers Investor Class shares.
As an investment company, the Fund follows the investment company accounting and reporting guidance of the Financial Accounting Standards Board (“FASB”) Accounting Standard Codification Topic 946 “Financial Services—Investment Companies.”
2). SIGNIFICANT ACCOUNTING POLICIES
The following is a summary of significant accounting policies consistently followed by the Fund in the preparation of the financial statements. These policies are in conformity with U.S. generally accepted accounting principles (“GAAP”).
| a). | Investment Valuation – All investments in securities are recorded at their estimated fair value, as described in Note 3. |
| | |
| b). | Federal Income Taxes – No provision for federal income taxes or excise taxes has been made since the Fund has elected to be taxed as a “regulated investment company” and intends to distribute substantially all of its taxable income to its shareholders and otherwise comply with the provisions of the Internal Revenue Code of 1986, as amended, applicable to regulated investment companies. Net investment income or loss and realized gains and losses for federal income tax purposes may differ from that reported on the financial statements because of temporary book and tax basis differences. Temporary differences are primarily the result of the treatment of wash sales for tax reporting purposes. The Fund recognizes interest and penalties related to income tax benefits, if any, in the statement of operations as an income tax expense. Distributions from net realized gains for book purposes may include short-term capital gains, which are included as ordinary income to shareholders for tax purposes. |
| | |
| | Due to inherent differences in the recognition of income, expenses, and realized gains/losses under GAAP and federal income tax regulations, permanent differences between book and tax basis for reporting for the fiscal year ended October 31, 2016, have been identified and appropriately reclassified on the Statement of Assets and Liabilities. The adjustments are as follows: |
| | Undistributed | Accumulated | | |
| | Net Investment | Net Realized | | |
| | Income/(Loss) | Gain/(Loss) | Paid-in Capital | |
| | $901,700 | $(901,700) | $— | |
HENNESSYFUNDS.COM
| NOTES TO THE FINANCIAL STATEMENTS |
| c). | Accounting for Uncertainty in Income Taxes – The Fund has accounting policies regarding recognition and measurement of tax positions taken or expected to be taken on a tax return. The tax returns of the Fund for the prior three fiscal years are open for examination. The Fund has reviewed all open tax years in major jurisdictions and concluded that there is no impact on the Fund’s net assets and no tax liability resulting from unrecognized tax benefits relating to uncertain income tax positions taken or expected to be taken on a tax return. The Fund’s major tax jurisdictions are U.S. federal and Delaware. |
| | |
| d). | Income and Expenses – Dividend income is recognized on the ex-dividend date or as soon as information is available to the Fund. Interest income, which includes the amortization of premium and accretion of discount, is recognized on an accrual basis. The Fund is charged for those expenses that are directly attributable to the portfolio, such as advisory, administration, and certain shareholder service fees. |
| | |
| e). | Distributions to Shareholders – Dividends from net investment income for the Fund, if any, are declared and paid on a calendar quarter basis. Distributions of net realized capital gains, if any, are declared and paid annually, usually in December. |
| | |
| f). | Security Transactions – Investment and shareholder transactions are recorded on the trade date. The Fund determines the gain or loss realized from the investment transactions by comparing the original cost of the security lot sold with the net sale proceeds. Discounts and premiums on securities purchased are accreted/amortized over the life of the respective security. |
| | |
| g). | Use of Estimates – The preparation of financial statements in conformity with GAAP requires management to make estimates and assumptions that affect the reported amounts of assets and liabilities and disclosure of contingent assets and liabilities at the date of the financial statements and the reported change in net assets during the reporting period. Actual results could differ from those estimates. |
| | |
| h). | Share Valuation – The net asset value (“NAV”) per share of the Fund is calculated by dividing the sum of the value of the securities held by the Fund, plus cash or other assets, minus all liabilities (including estimated accrued expenses) by the total number of shares outstanding for the Fund, rounded to the nearest cent. The Fund’s shares will not be priced on days the New York Stock Exchange is closed for trading. The offering and redemption price per share for the Fund is equal to the Fund’s NAV per share. |
| | |
| i). | Foreign Currency – Values of investments denominated in foreign currencies, if any, are converted into U.S. dollars using the spot market rate of exchange at the time of valuation. Purchases and sales of investments and income are translated into U.S. dollars using the spot market rate of exchange prevailing on the respective dates of such transactions. The Fund does not isolate the portion of the results of operations resulting from fluctuations in foreign exchange rates on investments from fluctuations resulting from changes in the market prices of securities held. Such fluctuations are included with the net realized and unrealized gain or loss on investments. Foreign investments present additional risks due to currency fluctuations, economic and political factors, lower liquidity, government regulations, differences in accounting standards, and other factors. |
| | |
| j). | Forward Contracts – The Fund may enter into forward currency contracts to reduce its exposure to changes in foreign currency exchange rates on its foreign holdings and to lock in the U.S. dollar cost of firm purchase and sale commitments for securities denominated in foreign currencies. A forward currency contract is a commitment to purchase or sell a foreign currency at a future date at a negotiated |
| HENNESSY FUNDS | 1-800-966-4354 | |
| | forward rate. The gain or loss arising from the difference between the U.S. dollar cost of the original contract and the value of the foreign currency in U.S. dollars upon closing of such contract is included in net realized gain or loss from foreign currency transactions. During the fiscal year ended October 31, 2016, the Fund did not enter into any forward contracts. |
| | |
| k). | Repurchase Agreements – The Fund may enter into repurchase agreements with member banks or security dealers of the Federal Reserve Board whom the investment advisor deems creditworthy. The repurchase price generally equals the price paid by the Fund plus interest negotiated on the basis of current short-term rates. |
| | |
| | Securities pledged as collateral for repurchase agreements are held by the custodian bank until the respective agreements mature. Provisions of the repurchase agreements ensure that the market value of the collateral, including accrued interest thereon, is sufficient to cover the repurchase amount in the event of default of the counterparty. If the counterparty defaults and the value of the collateral declines or if the counterparty enters an insolvency proceeding, realization of the collateral by the Fund may be delayed or limited. During the fiscal year ended October 31, 2016, the Fund did not enter into any repurchase agreements. |
| | |
| l). | New Accounting Pronouncements – In May 2015, the FASB issued ASU No. 2015-07 “Disclosure for Investments in Certain Entities that Calculate Net Asset Value per Share (or Its Equivalent).” The amendments in ASU No. 2015-07 remove the requirement to categorize within the fair value hierarchy investments measured at NAV and require the disclosure of sufficient information to reconcile the fair value of the remaining assets categorized within the fair value hierarchy to the financial statements. The amendments in ASU No. 2015-07 are effective for fiscal years beginning after December 15, 2015, and interim periods within those fiscal years. Management has reviewed the requirements and believes the adoption of ASU 2015-07 will not have a material impact on the Fund’s financial statements and related disclosures. |
3). SECURITIES VALUATION
The Fund follows authoritative fair valuation accounting standards that establish an authoritative definition of fair value and set out a hierarchy for measuring fair value. These standards require additional disclosures about the various inputs and valuation techniques used to develop the measurements of fair value and a discussion in changes in valuation techniques and related inputs during the period. These inputs are summarized in the three broad levels listed below:
| | Level 1 – | Unadjusted, quoted prices in active markets for identical instruments that the Fund has the ability to access at the date of measurement. |
| | | |
| | Level 2 – | Other significant observable inputs (including, but not limited to, quoted prices in active markets for similar instruments, quoted prices in markets that are not active for identical or similar instruments, and model-derived valuations in which all significant inputs and significant value drivers are observable in active markets (such as interest rates, prepayment speeds, credit risk curves, default rates, and similar data)). |
| | | |
| | Level 3 – | Significant unobservable inputs (including the Fund’s own assumptions about what market participants would use to price the asset or liability based on the best available information) when observable inputs are unavailable. |
Following is a description of the valuation techniques applied to the Fund’s major categories of assets and liabilities measured at fair value on a recurring basis.
HENNESSYFUNDS.COM
| NOTES TO THE FINANCIAL STATEMENTS |
Equity Securities – Equity securities, including common stocks, preferred stocks, foreign-issued common stocks, exchange-traded funds, closed-end mutual funds, partnerships, rights, and real estate investment trusts, that are traded on a securities exchange for which a last-quoted sales price is readily available will generally be valued at the last sales price as reported by the primary exchange on which the securities are listed. Securities listed on The NASDAQ Stock Market (“NASDAQ”) will generally be valued at the NASDAQ Official Closing Price, which may differ from the last sales price reported. Securities traded on a securities exchange for which a last-quoted sales price is not readily available will generally be valued at the mean between the bid and ask prices. To the extent these securities are actively traded and valuation adjustments are not applied, they are classified in Level 1 of the fair value hierarchy. Securities traded on foreign exchanges generally are not valued at the same time the Fund calculates its NAV because most foreign markets close well before such time. The earlier close of most foreign markets gives rise to the possibility that significant events, including broad market moves, may have occurred in the interim. In certain circumstances, it may be determined that a security needs to be fair valued because it appears that the value of the security might have been materially affected by events occurring after the close of the market in which the security is principally traded, but before the time the Fund calculates its NAV, such as by a development that affects an entire market or region (e.g., weather-related events) or a potentially global development (e.g., a terrorist attack that may be expected to have an effect on investor expectations worldwide).
Registered Investment Companies – Investments in registered investment companies (e.g., mutual funds) are generally priced at the ending NAV provided by the applicable registered investment company’s service agent and will be classified in Level 1 of the fair value hierarchy.
Debt Securities – Debt securities, including corporate bonds, asset-backed securities, mortgage-backed securities, municipal bonds, U.S. Treasuries, and U.S. government agency issues, are generally valued at market on the basis of valuations furnished by an independent pricing service that utilizes both dealer-supplied valuations and formula-based techniques. The pricing service may consider recently executed transactions in securities of the issuer or comparable issuers, market price quotations (where observable), bond spreads, and fundamental data relating to the issuer. In addition, the model may incorporate observable market data, such as reported sales of similar securities, broker quotes, yields, bids, offers, and reference data. Certain securities are valued primarily using dealer quotations. These securities are generally classified in Level 2 of the fair value hierarchy.
Short-Term Securities – Short-term equity investments, including money market funds, are valued in the manner specified above. Short-term debt investments with an original term to maturity of 60 days or less are valued at amortized cost, which approximates fair market value. If the original term to maturity of a short-term debt investment exceeded 60 days, then the values as of the 61st day prior to maturity are amortized. Amortized cost is not used if its use would be inappropriate due to credit or other impairments of the issuer, in which case the security’s fair value would be determined, as described below. Short-term securities are generally classified in Level 1 or Level 2 of the fair market hierarchy depending on the inputs used and market activity levels for specific securities.
The Board of Trustees of the Fund (the “Board”) has adopted fair value pricing procedures that are followed when a price for a security is not readily available or if a significant event has occurred that indicates the closing price of a security no longer represents the true value of that security. Fair value pricing determinations are made in good faith in accordance with these procedures. There are numerous criteria that will be given consideration in determining a fair value of a security, such as the trading volume of
| HENNESSY FUNDS | 1-800-966-4354 | |
a security and markets, the value of other like securities, and news events with direct bearing to a security or markets. Fair value pricing results in an estimated price for a security that reflects the amount the Fund might reasonably expect to receive in a current sale. Depending on the relative significance of the valuation inputs, these securities may be classified in either Level 2 or Level 3 of the fair value hierarchy.
The fair valuation of foreign securities may be determined with the assistance of a pricing service using correlations between the movement of prices of such securities and indices of domestic securities and other appropriate indicators, such as closing market prices of relevant American Depositary Receipts or futures contracts. The effect of using fair value pricing is that the Fund’s NAV will reflect the affected portfolio securities’ value as determined by the Board or its designee instead of being determined by the market. Using a fair value pricing methodology to price foreign securities may result in a value that is different from a foreign security’s most recent closing price and from the prices used by other investment companies to calculate their NAVs and are generally considered Level 2 prices in the fair valuation hierarchy. Because the Fund may invest in foreign securities, the value of the Fund’s portfolio securities may change on days when you will not be able to purchase or redeem your shares.
The Board has delegated day-to-day valuation matters to a Valuation Committee comprised of one or more representatives from Hennessy Advisors, Inc., the Fund’s investment advisor. The function of the Valuation Committee is to value securities where current and reliable market quotations are not readily available. All actions taken by the Valuation Committee are reviewed by the Board.
The Fund has performed an analysis of all existing investments to determine the significance and character of all inputs to their fair value determination. Various inputs are used in determining the value of the Fund’s investments. The inputs or methodology used for valuing securities are not necessarily an indication of the risk associated with investing in those securities. Details related to the fair valuation hierarchy of the Fund’s securities as of October 31, 2016, are included in the Fund’s Schedule of Investments.
4). INVESTMENT TRANSACTIONS
Purchases and sales of investment securities (excluding government and short-term investments) for the Fund during the fiscal year ended October 31, 2016, were $546,821,075 and $590,084,700, respectively.
There were no purchases or sales/maturities of long-term U.S. government securities for the Fund during the fiscal year ended October 31, 2016.
The Fund is permitted to purchase or sell securities from or to another fund in the Hennessy Funds family of funds (the “Hennessy Funds”) under specified conditions outlined in procedures adopted by the Board of Trustees. The procedures have been designed to ensure that any purchase or sale of securities by the Fund from or to another Hennessy Fund complies with Rule 17a-7 of the Investment Company Act of 1940. For the fiscal year ended October 31, 2016, the Fund did not engage in purchases and sales of securities pursuant to Rule 17a-7 of the Investment Company Act of 1940.
5). INVESTMENT MANAGEMENT FEE AND OTHER TRANSACTIONS WITH AFFILIATES
Hennessy Advisors, Inc. (the “Advisor”) is the investment advisor of the Fund. The Advisor provides the Fund with investment management services under an Investment Advisory Agreement. The Advisor furnishes all investment advice, office space, facilities, and provides most of the personnel needed by the Fund. As compensation for its services, the Advisor is entitled to a monthly fee from the Fund. The fee is based upon the average
HENNESSYFUNDS.COM
| NOTES TO THE FINANCIAL STATEMENTS |
daily net assets of the Fund at the annual rate of 0.40%. The net investment advisory fees payable by the Fund as of October 31, 2016, were $491,083.
The Board has approved a Shareholder Servicing Agreement for the Fund, effective as of March 1, 2015, which was instituted to compensate the Advisor for the non-investment management services it provides to the Fund. The Shareholder Servicing Agreement provides for a monthly fee paid to the Advisor at an annual rate of 0.10% of the average daily net assets of the Fund. Shareholder service fees payable by the Fund as of October 31, 2016, were $122,771.
The Fund has adopted a plan pursuant to Rule 12b-1 under the Investment Company Act of 1940, as amended, that authorizes payments in connection with the distribution of the Fund’s shares at an annual rate of up to 0.25% of the Fund’s average daily net assets attributable to Investor Class shares. Even though the authorized rate is up to 0.25%, the Fund has only used up to 0.15% of its average daily net assets attributable to Investor Class shares for such purpose since the plan was implemented on March 1, 2015. Amounts paid under the plan may be spent on any activities or expenses primarily intended to result in the sale of shares, including, but not limited to, advertising, shareholder account servicing, the printing and mailing of prospectuses to other than current shareholders, the printing and mailing of sales literature, and compensation for sales and marketing activities or to financial institutions and others, such as dealers and distributors.
The Fund has entered into agreements with various brokers, dealers, and financial intermediaries in connection with the sale of shares of the Fund. The agreements provide for periodic payments by the Fund to the brokers, dealers, and financial intermediaries for providing certain shareholder maintenance services (sub-transfer agent expenses). These shareholder services include the pre-processing and quality control of new accounts, shareholder correspondence, answering customer inquiries regarding account status, and facilitating shareholder telephone transactions. Fees paid by the Fund to various brokers, dealers, and financial intermediaries during the fiscal year ended October 31, 2016, were $2,798,280.
The Fund has entered into an Administrative Services Agreement among the Fund, the Advisor, and the American Gas Association (“AGA”), pursuant to which the AGA provides administrative services to the Fund. These administrative services include overseeing the calculation of the AGA Stock Index. Prior to January 1, 2015, AUS Consultants Utility Services performed the actual computations required to produce the AGA Stock Index and received a fee for such calculations pursuant to a contractual arrangement with AGA. As of January 1, 2015, AUS Consultants Utility Services was replaced by Sussex Economic Advisors, LLC. AGA does not furnish other securities advice to the Fund or the Advisor or make recommendations regarding the purchase or sale of securities by the Fund. Under the terms of the Administrative Services Agreement, which has been approved by the Board, AGA provides the Fund with current information regarding the common stock composition of the AGA Stock Index at least monthly. In addition, upon request, AGA provides the Fund and the Advisor with information on the natural gas industry. The Fund pays AGA a fee at an annual rate of 0.04% of the average daily net assets of the Fund.
U.S. Bancorp Fund Services, LLC (“USBFS”) provides the Fund with administrative, fund accounting, and transfer agent services, and necessary office equipment. As administrator, USBFS is responsible for activities such as (i) preparing various federal and state regulatory filings, reports, and returns for the Fund, (ii) preparing reports and materials to be supplied to the Board, (iii) monitoring the activities of the Fund’s
| HENNESSY FUNDS | 1-800-966-4354 | |
custodian, transfer agent, and accountants, and (iv) coordinating the preparation and payment of the Fund’s expenses and reviewing the Fund’s expense accruals. Fees paid to USBFS during the fiscal year ended October 31, 2016, were $1,419,188.
U.S. Bank, N.A., an affiliate of USBFS, serves as the Fund’s custodian. Quasar Distributors, LLC acts as the Fund’s principal underwriter in a continuous public offering of the Fund’s shares. Quasar Distributors, LLC is an affiliate of USBFS and U.S. Bank, N.A.
The officers of the Fund are affiliated with the Advisor. Such officers, with the exception of the Chief Compliance Officer and the Senior Compliance Officer, receive no compensation from the Fund for serving in their respective roles. The Fund, along with the other Hennessy Funds, makes reimbursement payments, on an equal basis, to the Advisor for a portion of the salary and benefits associated with the office of the Chief Compliance Officer and for all of the salary and benefits associated with the office of the Senior Compliance Officer. Such amounts are included on the Statement of Operations.
6). GUARANTEES AND INDEMNIFICATIONS
Under the Hennessy Funds’ organizational documents, their officers and trustees are indemnified by the Hennessy Funds against certain liabilities arising out of the performance of their duties to the Hennessy Funds. Additionally, in the normal course of business, the Hennessy Funds enter into contracts with service providers that contain general indemnification clauses. The Fund’s maximum exposure under these arrangements is unknown as this would involve future claims that may be made against the Fund that have not yet occurred. Currently, the Fund expects the risk of loss to be remote.
7). LINE OF CREDIT
The Fund has an uncommitted line of credit with the other Hennessy Funds in the amount of the lesser of (i) $100,000,000 or (ii) 33.33% of each Hennessy Fund’s net assets, or 30% for the Fund and 10% for the Hennessy Balanced Fund, intended to provide short-term financing, if necessary, subject to certain restrictions, in connection with shareholder redemptions. The credit facility is with the Hennessy Funds’ custodian bank, U.S. Bank, N.A. Borrowings under this arrangement bear interest at the bank’s prime rate and are secured by all of the Fund’s assets (as to its own borrowings only). During the fiscal year ended October 31, 2016, the Fund had an outstanding average daily balance and a weighted average interest rate of $20,452 and 3.47%, respectively. The maximum amount outstanding for the Fund during the period was $4,678,000. At October 31, 2016, the Fund did not have any borrowings outstanding under the line of credit.
8). FEDERAL TAX INFORMATION
As of October 31, 2016, the components of accumulated earnings (losses) for income tax purposes were as follows:
| | Cost of investments for tax purposes | | $ | 1,105,247,006 | |
| | Gross tax unrealized appreciation on investments | | $ | 462,497,659 | |
| | Gross tax unrealized depreciation on investments | | | (107,758,827 | ) |
| | Net tax unrealized appreciation on investments | | $ | 354,738,832 | |
| | Net tax unrealized appreciation of foreign currency translation | | $ | 1,298 | |
| | Undistributed ordinary income | | $ | — | |
| | Undistributed long-term capital gains | | | 19,805,168 | |
| | Total distributable earnings | | $ | 19,805,168 | |
| | Other accumulated loss | | $ | — | |
| | Total accumulated gain | | $ | 374,545,298 | |
HENNESSYFUNDS.COM
| NOTES TO THE FINANCIAL STATEMENTS |
The difference between book-basis unrealized appreciation/depreciation (as shown in the Statement of Assets and Liabilities) and tax-basis unrealized appreciation/depreciation (as shown above) is attributable primarily to wash sales.
At October 31, 2016, the Fund had no tax basis capital losses to offset future capital gains.
At October 31, 2016, the Fund did not defer, on a tax basis, any late year ordinary losses.
During the fiscal years ended October 31, 2016 and 2015, the tax character of distributions paid by the Fund was as follows:
| | | Year Ended | | | Year Ended | |
| | | October 31, 2016 | | | October 31, 2015 | |
Ordinary income(1) | | $ | 36,851,113 | | | $ | 90,813,646 | |
| Long-term capital gain | | | 35,850,694 | | | | 23,839,446 | |
| | | $ | 72,701,807 | | | $ | 114,653,092 | |
| | (1) | Ordinary income includes short-term gain or loss. |
9). EVENTS SUBSEQUENT TO YEAR END
Management has evaluated the Fund’s related events and transactions that occurred subsequent to October 31, 2016, through the date of issuance of the Fund’s financial statements. Other than as disclosed below, management has determined that there were no subsequent events requiring recognition or disclosure in the financial statements.
On December 7, 2016, capital gains were declared and paid to shareholders of record as of December 6, 2016, as follows:
| | Long-term | |
| | Amount Per Share | |
| Investor Class | $0.39616 | |
On December 2, 2016, the Board approved the addition of Institutional Class shares for the Fund. The Fund filed a post-effective amendment to its registration statement reflecting such addition on December 16, 2016, which is anticipated to become effective on or after February 14, 2017.
| HENNESSY FUNDS | 1-800-966-4354 | |
Report of Independent Registered Public Accounting Firm
To the Board of Trustees of Hennessy Funds Trust
and the Shareholders of the Hennessy Gas Utility Fund
Novato, CA
We have audited the accompanying statement of assets and liabilities, including the schedule of investments, of the Hennessy Gas Utility Fund (the “Fund”), a series of Hennessy Funds Trust, as of October 31, 2016, and the related statement of operations for the year then ended, the statements of changes in net assets for each of the two years in the period then ended, and the financial highlights for each of the five years in the period then ended. These financial statements and financial highlights are the responsibility of the Fund’s management. Our responsibility is to express an opinion on these financial statements and financial highlights based on our audits.
We conducted our audits in accordance with the standards of the Public Company Accounting Oversight Board (United States). Those standards require that we plan and perform the audits to obtain reasonable assurance about whether the financial statements and financial highlights are free of material misstatement. The Fund is not required to have, nor were we engaged to perform, an audit of its internal control over financial reporting. Our audits included consideration of internal control over financial reporting as a basis for designing audit procedures that are appropriate in the circumstances, but not for the purposes of expressing an opinion on the effectiveness of the Fund’s internal control over financial reporting. Accordingly, we express no such opinion. An audit includes examining, on a test basis, evidence supporting the amounts and disclosures in the financial statements. Our procedures included confirmation of securities owned as of October 31, 2016, by correspondence with the custodian and brokers. An audit also includes assessing the accounting principles used and significant estimates made by management, as well as evaluating the overall financial statement presentation. We believe that our audits provide a reasonable basis for our opinion.
In our opinion, the financial statements and financial highlights referred to above present fairly, in all material respects, the financial position of the Hennessy Gas Utility Fund as of October 31, 2016, the results of its operations for the year then ended, the changes in its net assets for each of the two years in the period then ended, and the financial highlights for each of the five years in the period then ended, in conformity with accounting principles generally accepted in the United States of America.
TAIT, WELLER & BAKER LLP
Philadelphia, Pennsylvania
December 22, 2016
HENNESSYFUNDS.COM
| REPORT OF INDEPENDENT REGISTERED PUBLIC ACCOUNTING FIRM/TRUSTEES AND OFFICERS |
Trustees and Officers of the Fund (Unaudited)
The business and affairs of the Fund are managed under the direction of the Board of Trustees of the Trust, and the Board of Trustees elects the Officers of the Trust. Beginning in March 2015, the Board of Trustees has from time to time appointed advisers (“Advisers”) to the Board of Trustees, with the intention of having qualified individuals serve in an advisory capacity in order to garner experience in the mutual fund and asset management industry and be considered as potential Trustees in the future. There are currently three Advisers to the Board of Trustees: Brian Alexander, Doug Franklin, and Claire Knoles. As Advisers, Mr. Alexander, Mr. Franklin, and Ms. Knoles attend meetings of the Board and act as non-voting participants. Information pertaining to the Trustees, Advisers, and the Officers of the Trust is set forth below. The Trustees and Officers serve until their successors are duly elected and qualified or until their earlier death, resignation, or removal. Each of the Trustees oversees 16 Hennessy Funds. Unless otherwise indicated, the address of all persons listed below is 7250 Redwood Boulevard, Suite 200, Novato, CA 94945. The Fund’s Statement of Additional Information includes more information about the persons listed below and is available, without charge, upon request by calling 1-800-966-4354.
| | | | Other |
| | | | Directorships |
| | | | Held Outside |
| Name, (Year of Birth), | | | of Fund |
| and Position Held | Start Date | Principal Occupation(s) | Complex During |
with the Trust | of Service | During Past Five Years | Past Five Years(1) |
| | | | |
| Disinterested Trustees and Advisers | | |
| | | | |
| J. Dennis DeSousa | January 1996 | Mr. DeSousa is a real estate investor. | None. |
| (1936) | | | |
| Trustee | | | |
| | | | |
| Robert T. Doyle | January 1996 | Mr. Doyle has been the Sheriff of | None. |
| (1947) | | Marin County, California since 1996. | |
| Trustee | | | |
| | | | |
| Gerald P. Richardson | May 2004 | Mr. Richardson is an independent | None. |
| (1945) | | consultant in the securities industry. | |
| Trustee | | | |
| | | | |
| Brian Alexander | March 2015 | Mr. Alexander has been employed | None. |
| (1981) | | by Sutter Health Novato Community | |
| Adviser to the Board | | Hospital since 2012, first as an | |
| | | Assistant Administrator and then, | |
| | | beginning in 2013, as the Chief | |
| | | Administrative Officer. From 2011 | |
| | | through 2012, Mr. Alexander was | |
| | | employed by Sutter Health West Bay | |
| | | Region as the Regional Director of | |
| | | Strategic Decision Support. Prior to | |
| | | that, in 2011, he served as the | |
| | | Director of Managed Care | |
| | | Contracting and also the Director of | |
| | | Compensation, Benefits, and | |
| | | Compliance for the Rehabilitation | |
| | | Institute of Chicago. | |
| HENNESSY FUNDS | 1-800-966-4354 | |
| | | | Other |
| | | | Directorships |
| | | | Held Outside |
| Name, (Year of Birth), | | | of Fund |
| and Position Held | Start Date | Principal Occupation(s) | Complex During |
with the Trust | of Service | During Past Five Years | Past Five Years(1) |
| | | | |
| Doug Franklin | March 2016 | Mr. Franklin is a retired insurance | None. |
| (1964) | | industry executive. From 1987 | |
| Adviser to the Board | | through 2015, he was employed by | |
| | | the Allianz-Fireman’s Fund Insurance | |
| | | Company in various positions, | |
| | | including as its Chief Actuary and | |
| | | Chief Risk Officer. | |
| | | | |
| Claire Knoles | December 2015 | Ms. Knoles is a founder of Kiosk and | None. |
| (1974) | | has served as its Chief Operating | |
| Adviser to the Board | | Officer since 2004. Kiosk is a full | |
| | | service marketing agency with | |
| | | offices in the San Francisco Bay | |
| | | Area, Toronto, and Liverpool, UK. | |
| | | | |
Interested Trustee(2) | | | |
| | | | |
| Neil J. Hennessy | January 1996 as | Mr. Hennessy has been employed by | Hennessy |
| (1956) | a Trustee and | Hennessy Advisors, Inc. since 1989 | Advisors, Inc. |
| Trustee, Chairman of | June 2008 as | and currently serves as its President, | |
| the Board, Chief | an Officer | Chairman and Chief Executive Officer. | |
| Investment Officer, | | | |
| Portfolio Manager, | | | |
| and President | | | |
| Name, (Year of Birth), | | |
| and Position Held | Start Date | Principal Occupation(s) |
with the Trust | of Service | During Past Five Years |
| | | |
| Officers | | |
| | | |
| Teresa M. Nilsen | January 1996 | Ms. Nilsen has been employed by Hennessy Advisors, Inc. |
| (1966) | | since 1989 and currently serves as its Executive Vice President, |
| Executive Vice President | | Chief Operations Officer, Chief Financial Officer, and Secretary. |
| and Treasurer | | |
| | | |
| Daniel B. Steadman | March 2000 | Mr. Steadman has been employed by Hennessy Advisors, Inc. |
| (1956) | | since 2000 and currently serves as its Executive Vice President |
| Executive Vice President | | and Chief Compliance Officer. |
| and Secretary | | |
| | | |
| Jennifer Cheskiewicz | June 2013 | Ms. Cheskiewicz has been employed by Hennessy Advisors, Inc. |
| (1977) | | as its General Counsel since June 2013. She previously served |
| Senior Vice President and | | as in-house counsel to Carlson Capital, L.P., an SEC-registered |
| Chief Compliance Officer | | investment advisor to several private funds, from |
| | | February 2010 to May 2013. |
| | | |
| Brian Carlson | December 2013 | Mr. Carlson has been employed by Hennessy Advisors, Inc. |
| (1972) | | since December 2013. Mr. Carlson was previously a co-founder |
| Senior Vice President and | | and principal of Trivium Consultants, LLC from February 2011 |
| Head of Distribution | | through November 2013. |
HENNESSYFUNDS.COM
| TRUSTEES AND OFFICERS OF THE FUND |
| Name, (Year of Birth), | | |
| and Position Held | Start Date | Principal Occupation(s) |
with the Trust | of Service | During Past Five Years |
| | | |
| David Ellison | October 2012 | Mr. Ellison has been employed by Hennessy Advisors, Inc. since |
(1958)(3) | | October 2012. He has served as a Portfolio Manager of the |
| Senior Vice President and | | Hennessy Small Cap Financial Fund, the Hennessy Large Cap |
| Portfolio Manager | | Financial Fund, and the Hennessy Technology Fund since |
| | | inception. Prior to that, Mr. Ellison served as Director, CIO and |
| | | President of FBR Fund Advisers, Inc. from December |
| | | 1999 to October 2012. |
| | | |
| Brian Peery | March 2003 as | Mr. Peery has been employed by Hennessy Advisors, Inc. since |
| (1969) | an Officer and | 2002. He has served as a Portfolio Manager of the Hennessy |
| Senior Vice President and | February 2011 | Cornerstone Growth Fund, the Hennessy Cornerstone Mid Cap |
| Portfolio Manager | as a Co-Portfolio | 30 Fund, the Hennessy Cornerstone Large Growth Fund, the |
| | Manager or | Hennessy Cornerstone Value Fund, the Hennessy Total Return |
| | Portfolio Manager | Fund, and the Hennessy Balanced Fund since October 2014. |
| | | He served as Co-Portfolio Manager of the same funds from |
| | | February 2011 through September 2014. Mr. Peery has also |
| | | served as a Portfolio Manager of the Hennessy Gas Utility Fund |
| | | since February 2015. |
| | | |
| Winsor (Skip) Aylesworth | October 2012 | Mr. Aylesworth has been employed by Hennessy Advisors, Inc. |
(1947)(3) | | since October 2012. He has served as a Portfolio Manager of |
| Vice President and | | the Hennessy Gas Utility Fund since 1998 and as a Portfolio |
| Portfolio Manager | | Manager of the Hennessy Technology Fund since inception. |
| | | Prior to that, Mr. Aylesworth served as Executive Vice President |
| | | of FBR Fund Advisers, Inc. from 1999 to October 2012. |
| | | |
| Ryan Kelley | March 2013 | Mr. Kelley has been employed by Hennessy Advisors, Inc. since |
(1972)(4) | | October 2012. He has served as a Portfolio Manager of the |
| Vice President and | | Hennessy Gas Utility Fund, the Hennessy Small Cap Financial |
| Portfolio Manager | | Fund, and the Hennessy Large Cap Financial Fund since |
| | | October 2014. He served as Co-Portfolio Manager of the same |
| | | funds from March 2013 through September 2014, and as a |
| | | Portfolio Analyst for the Hennessy Funds from October 2012 |
| | | through February 2013. Prior to that, Mr. Kelley served as |
| | | Portfolio Manager of FBR Fund Advisers, Inc. from |
| | | January 2008 to October 2012. |
_______________
(1) | Messrs. DeSousa, Doyle, Hennessy, and Richardson previously served on the Board of Directors of Hennessy Mutual Funds, Inc. (“HMFI”), The Hennessy Funds, Inc. (“HFI”), and Hennessy SPARX Funds Trust (“HSFT”). Pursuant to an internal reorganization effective as of February 28, 2014, the series of HFMI, HFI, and HSFT were reorganized into corresponding series of Hennessy Funds Trust that mirrored them. Subsequent to the reorganization, HFMI, HFI, and HSFT were dissolved. |
(2) | Mr. Hennessy is considered an “interested person,” as defined in the Investment Company Act of 1940, as amended, because he is an officer of the Hennessy Funds. |
(3) | The address of these officers is 101 Federal Street, Suite 1900, Boston, MA 02110. |
(4) | The address of this officer is 1340 Environ Way, Suite 305, Chapel Hill, NC 27517. |
| HENNESSY FUNDS | 1-800-966-4354 | |
Expense Example (Unaudited)
October 31, 2016
As a shareholder of the Fund, you incur two types of costs: (1) transaction costs, including sales charges (loads) on purchase payments, reinvested dividends, or other distributions; redemption fees; and exchange fees; and (2) ongoing costs, including management fees; service fees; and other Fund expenses. This Example is intended to help you understand your ongoing costs (in dollars) of investing in the Fund and to compare these costs with the ongoing costs of investing in other mutual funds. The Example is based on an investment of $1,000 invested at the beginning of the period and held for the entire period from May 1, 2016, through October 31, 2016.
Actual Expenses
The first line of the table below provides information about actual account values and actual expenses. Although the Fund charges no sales loads or transaction fees, you will be assessed fees for outgoing wire transfers, returned checks and stop payment orders at prevailing rates charged by U.S. Bancorp Fund Services, LLC, the Fund’s transfer agent. If you request that a redemption be made by wire transfer, currently a $15 fee is charged by the Fund’s transfer agent. IRA accounts will be charged a $15 annual maintenance fee. The example below includes, but is not limited to, management fees, shareholder servicing fees, fund accounting, custody, and transfer agent fees. However, the example below does not include portfolio trading commissions and related expenses, and other extraordinary expenses as determined under generally accepted accounting principles. You may use the information in this line, together with the amount you invested, to estimate the expenses that you paid over the period. Simply divide your account value by $1,000 (for example, an $8,600 account value divided by $1,000 = 8.6), then multiply the result by the number in the first line of the table under the heading entitled “Expenses Paid During Period” to estimate the expenses you paid on your account during this period.
Hypothetical Example for Comparison Purposes
The second line of the table below provides information about hypothetical account values and hypothetical expenses based on the Fund’s actual expense ratios and an assumed rate of return of 5% per year before expenses, which is not the Fund’s actual return. The hypothetical account values and expenses may not be used to estimate the actual ending account balance or expenses you paid for the period. You may use this information to compare the ongoing costs of investing in the Fund and other funds. To do so, compare this 5% hypothetical example with the 5% hypothetical examples that appear in the shareholder reports of the other funds. Please note that the expenses shown in the table are meant to highlight your ongoing costs only and do not reflect any transactional costs, such as sales charges (loads), or exchange fees. Therefore, the second line of the table is useful in comparing ongoing costs only, and will not help you determine the relative total costs of owning different funds. In addition, if these transactional costs were included, your costs would have been higher.
HENNESSYFUNDS.COM
| | Expenses Paid | | |
| | Beginning | Ending | During Period(1) |
| | Account Value | Account Value | May 1, 2016 – |
| | May 1, 2016 | October 31, 2016 | October 31, 2016 |
| Investor Class | | | |
| Actual | $1,000.00 | $1,054.50 | $5.16 |
| Hypothetical (5% return before expenses) | $1,000.00 | $1,020.11 | $5.08 |
(1) | Expenses are equal to the Fund’s annualized expense ratio of 1.00%, multiplied by the average account value over the period, multiplied by 184/366 days (to reflect one-half year period). |
| HENNESSY FUNDS | 1-800-966-4354 | |
How to Obtain a Copy of the Fund’s
Proxy Voting Policy and Proxy Voting Records
A description of the policies and procedures the Fund uses to determine how to vote proxies relating to portfolio securities is available without charge: (1) by calling 1-800-966-4354; (2) on the Hennessy Funds’ website at hennessyfunds.com/proxy-voting/policy.fs; or (3) on the U.S. Securities and Exchange Commission’s website at www.sec.gov. The Fund’s proxy voting record is available without charge on both the Hennessy Funds’ website at hennessyfunds.com/proxy-voting/vote.fs and the SEC’s website at www.sec.gov no later than August 31 for the prior 12 months ending June 30.
Quarterly Filings on Form N-Q
The Fund files its complete schedule of portfolio holdings with the SEC for the first and third quarters of each fiscal year on Form N-Q. The Fund’s Form N-Q will be available on the SEC’s website at www.sec.gov. The Fund’s Form N-Q may be reviewed and copied at the SEC’s Public Reference Room in Washington, DC and information on the operation of the Public Reference Room may be obtained by calling 1-800-SEC-0330. Information included in the Fund’s N-Q will also be available upon request by calling 1-800-966-4354.
Federal Tax Distribution Information
(Unaudited)
For the fiscal year ended October 31, 2016, certain dividends paid by the Fund may be subject to a maximum tax rate of 23.8%, as provided for by the Jobs and Growth Tax Relief Reconciliation Act of 2003. The percentage of dividends declared from ordinary income designated as qualified dividend income was 100%.
For corporate shareholders, the percent of ordinary income distributions that qualified for the corporate dividends received deduction for the fiscal year ended October 31, 2016, was 100%.
The percentage of taxable ordinary income distributions that are designated as short-term capital gain distributions under Section 871(k)(2)(C) of the Internal Revenue Code of 1986, as amended, for the Fund was 0%.
Householding
To help keep the Fund’s costs as low as possible, we generally deliver a single copy of most financial reports and prospectuses to shareholders who share an address, even if the accounts are registered under different names. This process, known as “householding,” does not apply to account statements. You may, of course, request an individual copy of a prospectus or financial report at any time. If you would like to receive separate mailings, please call the Administrator at 1-800-261-6950 or 1-414-765-4124 and we will begin individual delivery within 30 days of your request. If your account is held through a financial institution or other intermediary, please contact them directly to request individual delivery.
HENNESSYFUNDS.COM
| PROXY VOTING — PRIVACY POLICY |
Privacy Policy
We collect the following non-public personal information about you:
| | • | information we receive from you on or in applications or other forms, correspondence, or conversations, including, but not limited to, your name, address, phone number, social security number, assets, income, and date of birth; and |
| | | |
| | • | information about your transactions with us, our affiliates, or others, including, but not limited to, your account number and balance, payment history, parties to transactions, cost basis information, and other financial information. |
We do not disclose any non-public personal information about our current or former shareholders to non-affiliated third parties, except as permitted by law. For example, we are permitted by law to disclose all of the information we collect, as described above, to our Transfer Agent to process your transactions. Furthermore, we restrict access to your non-public personal information to those persons who require such information to provide products or services to you. We maintain physical, electronic, and procedural safeguards that comply with federal standards to guard your non-public personal information.
In the event that you hold shares of the Fund through a financial intermediary, including, but not limited to, a broker-dealer, bank or trust company, the privacy policy of your financial intermediary would govern how your non-public personal information would be shared with non-affiliated third parties.
| HENNESSY FUNDS | 1-800-966-4354 | |
(This Page Intentionally Left Blank.)
For information, questions or assistance, please call
The Hennessy Funds
1-800-966-4354 or 1-415-899-1555
INVESTMENT ADVISOR
Hennessy Advisors, Inc.
7250 Redwood Blvd., Suite 200
Novato, California 94945
ADMINISTRATOR,
TRANSFER AGENT,
DIVIDEND PAYING AGENT &
SHAREHOLDER SERVICING AGENT
U.S. Bancorp Fund Services, LLC
P.O. Box 701
Milwaukee, Wisconsin 53201-0701
CUSTODIAN
U.S. Bank N.A.
Custody Operations
1555 North River Center Dr., Suite 302
Milwaukee, Wisconsin 53212
TRUSTEES
Neil J. Hennessy
Robert T. Doyle
J. Dennis DeSousa
Gerald P. Richardson
COUNSEL
Foley & Lardner LLP
777 East Wisconsin Avenue
Milwaukee, Wisconsin 53202-5306
INDEPENDENT REGISTERED
PUBLIC ACCOUNTING FIRM
Tait, Weller & Baker LLP
1818 Market Street, Suite 2400
Philadelphia, Pennsylvania 19103
DISTRIBUTOR
Quasar Distributors, LLC
615 East Michigan Street
Milwaukee, Wisconsin 53202
hennessyfunds.com | 1-800-966-4354
This report has been prepared for shareholders and may be distributed to
others only if preceded or accompanied by a current prospectus.
ANNUAL REPORT
OCTOBER 31, 2016
HENNESSY SMALL CAP
FINANCIAL FUND
Investor Class HSFNX
Institutional Class HISFX
hennessyfunds.com | 1-800-966-4354
(This Page Intentionally Left Blank.)
Contents
| Letter to Shareholders | 2 |
| Performance Overview | 4 |
| Financial Statements | |
| Schedule of Investments | 6 |
| Statement of Assets and Liabilities | 9 |
| Statement of Operations | 10 |
| Statements of Changes in Net Assets | 12 |
| Financial Highlights | 14 |
| Notes to the Financial Statements | 18 |
| Report of Independent Registered Public Accounting Firm | 26 |
| Trustees and Officers of the Fund | 27 |
| Expense Example | 30 |
| Proxy Voting | 32 |
| Quarterly Filings on Form N-Q | 32 |
| Householding | 32 |
| Privacy Policy | 33 |
| HENNESSY FUNDS | 1-800-966-4354 | |
December 2016
Dear Hennessy Funds Shareholder:
Over the past year investors here in the U.S. and around the world have weathered a great deal of turmoil, especially in the political arena. Foremost, the bitterly divisive and all-consuming U.S. Presidential election, with its unanticipated outcome, is finally behind us. While the equity markets were jittery at first, they now appear more comfortable with the prospect of a Trump presidency and seem to be looking forward to diminished government regulation and intervention.
The Brexit vote in the U.K. cast a shadow over the European Union’s future. There remains uncertainty over the details and timing of the break and the economic consequences for both Britain and Europe, but early signs suggest the impact on growth in Britain will not be as severe as initially feared.
Additionally, uncertainty over whether the Federal Reserve would raise short-term interest rates has hung over the economy for well over a year now. The effects that higher rates could have on growth, the strength of the U.S. Dollar, corporate profits and loan supply and demand seem to have weighed heavily on investors, causing paralysis and money to remain on the sidelines of the market.
Despite all these concerns, U.S. equity markets have pushed higher, with both the Dow Jones Industrial Average and S&P 500 Index posting returns of approximately 5% during the twelve-month period ended October 31, 2016. The U.S. economy has continued to grow at a respectable annual rate of about 2%, and corporate profits have started to move higher. Today, as of mid-December, bond and Treasury yields have risen a bit from record lows just this summer, and the bond market is finishing the year on slightly rocky footing. Bond yields are still very low relative to historical averages, while the prospective PE multiples for the Dow Jones Industrial Average and S&P 500 Index are just above long-term averages at 18.0x and 18.9x, respectively. We believe that equity valuations could go considerably higher and still be at appropriate levels relative to bond yields. And, while we do expect the Fed to raise interest rates in the coming year, we believe that inflation will stay under control, so that short-term interest rates will not have to rise too fast or too far.
As I reflect over the past twelve months, what I realize is that many of the worries this year are not new. For the past several years, American businesses have operated in an environment characterized by highly partisan politics, mounting regulations, uncertainty over interest rates, and a lack of clarity regarding taxes and healthcare costs. Despite all these headwinds, U.S. corporations have been incredibly resilient and found ways to impress investors. If the newly elected administration follows through on campaign promises of reigning in regulation, lowering taxes for corporations and individuals, or reforming healthcare to drive down costs, then companies, which are already lean, should be able to post higher profits. And, that growth should lead to more jobs and a stronger economy, potentially creating a very positive cycle going forward.
With the bull market in U.S. equities entering its ninth year, many believe the economy is due for a recession and the market is due for a downturn. But, the euphoria that usually accompanies a peak in the market is absent. Since the recovery began after the financial crisis, I have found myself pondering the bull run of 1982 to 2000, powered, in part, by a significant increase in valuations. I believe today’s market displays the fundamentals to sustain a similarly strong and lengthy bull market. Meanwhile, companies are largely profitable and many corporate balance sheets are cash-rich, with
HENNESSYFUNDS.COM
relatively little debt. Unemployment is low and real wages are rising, helping to drive consumption. We are hopeful that these factors will provide support for positive market returns in the year to come.
Thank you for your continued confidence and investment in our funds. If you have any questions or would like to speak with us directly, please don’t hesitate to call us at (800) 966-4354.
Best regards,
Neil J. Hennessy
President and Chief Investment Officer
Past performance does not guarantee future results.
Mutual fund investing involves risk. Principal loss is possible.
Opinions expressed are those of Neil Hennessy and are subject to change, are not guaranteed and should not be considered investment advice.
The Dow Jones Industrial Average and S&P 500 Index are unmanaged indices commonly used to measure the performance of U.S. stocks. One cannot invest directly in an index.
PE, or price to earnings, is calculated by dividing a company’s market price per share by its earnings per share.
| HENNESSY FUNDS | 1-800-966-4354 | |
Performance Overview (Unaudited)
CHANGE IN VALUE OF $10,000 INVESTMENT
This graph illustrates the performance of an initial investment of $10,000 made in the Fund ten years ago and assumes the reinvestment of dividends.
AVERAGE ANNUAL TOTAL RETURN FOR PERIODS ENDED OCTOBER 31, 2016
| | One | Five | Ten |
| | Year | Years | Years |
| Hennessy Small Cap Financial Fund – | | | |
| Investor Class (HSFNX) | 5.80% | 14.15% | 5.12% |
| Hennessy Small Cap Financial Fund – | | | |
Institutional Class (HISFX)(1) | 6.22% | 14.52% | 5.37% |
Russell 2000® Financial Services Index | 8.26% | 14.58% | 3.73% |
Russell 2000® Index | 4.11% | 11.51% | 5.96% |
Expense ratios: 1.50% (Investor Class); 1.17% (Institutional Class)
Performance data quoted represents past performance; past performance does not guarantee future results. The investment return and principal value of an investment will fluctuate so that an investor’s shares, when redeemed, may be worth more or less than their original cost. The performance graph and table do not reflect the deduction of taxes that a shareholder would pay on Fund distributions or the redemption of Fund shares. Current performance of the Fund may be lower or higher than the performance quoted. Performance data current to the most recent month end may be obtained by visiting hennessyfunds.com. Performance for periods prior to October 26, 2012 is that of the FBR Small Cap Financial Fund.
The expense ratios presented are from the most recent prospectus.
(1) | The inception date of Institutional Class shares is May 30, 2008. Performance shown prior to the inception of Institutional Class shares reflects the performance of Investor Class shares and includes expenses that are not applicable to and are higher than those of Institutional Class shares. |
PERFORMANCE NARRATIVE
Portfolio Managers David H. Ellison and Ryan C. Kelley
Performance:
For the twelve-month period ended October 31, 2016, the Investor Class of the Hennessy Small Cap Financial Fund returned 5.80%, outperforming the Russell 2000® Index, which
HENNESSYFUNDS.COM
returned 4.11%, but underperforming the Russell 2000® Financial Services Index, which returned 8.26%, for the same period.
The Fund’s underperformance versus its primary benchmark index was principally due to the Fund’s concentration in small and regional banks and thrifts, which underperformed other sectors of the broader financial sector. Renewed uncertainty surrounding Federal Reserve rate policy in light of softer economic signals at home and limp growth abroad, together with generally weak financial market conditions, combined to dampen the returns of regional banks and thrifts. Positive contributors to the Fund’s performance included Independent Bank Corp., First BanCorp, and Brookline Bancorp, Inc. Companies with the weakest performance during period were Opus Bank, BankUnited, Inc. and Banner Corporation. The Fund continues to hold all six companies mentioned.
Portfolio Strategy:
Generally, the Fund tilts its investments more heavily toward regional banks, thrifts and, at times, mortgage finance companies. Within these preferred sub-industries, we seek companies that we believe have high-quality management teams, uncomplicated business models and sustainable earnings growth opportunities. Moreover, we identify companies that we expect will do well in the current environment, which is characterized by low interest rates, competitive loan markets and heightened regulatory control. We are less interested in focusing solely on companies that appear to promise an increase in profitability when interest rates rise or loan demand and pricing becomes more favorable, because these industry dynamics are difficult to predict.
Investment Outlook:
After many years of credit quality problems, costly regulatory mandates, low rates pressuring lending margins and a sluggish economic recovery, headwinds for small-cap financial companies appear to be abating. The residential housing market has improved, credit quality concerns have decreased, deposit balances are growing and consolidation activity is picking up. Industry measures of liquidity, capital, credit, reserves, book value and earnings are all showing steady improvement. We believe the industry should begin to see improved lending margins and earnings if interest rates rise, as expected, in the coming fiscal year.
Finally, we believe the condition of the financial system in the U.S. today is stronger than it has been in quite some time. With improving fundamentals and increased mergers and acquisition activity in the banking sector, the outlook for small financials appears bright.
_______________
Opinions expressed are those of the Portfolio Managers as of the date written and are subject to change, are not guaranteed, and should not be considered investment advice or an indication of trading intent.
The Russell 2000® Financial Services Index is an unmanaged index commonly used to measure the performance of U.S. small-capitalization financial sector stocks. The Russell 2000® Index is an unmanaged index commonly used to measure the performance of U.S. small-capitalization stocks. One cannot invest directly in an index.
The Fund is non-diversified, meaning it may concentrate its assets in fewer individual holdings than a diversified fund, making it more exposed to individual stock volatility than a diversified fund. Investments are focused in the financial services industry; sector funds may be subject to a higher degree of market risk. The Fund invests in smaller companies, which may have more limited liquidity and greater volatility compared to larger companies. Please see the Fund’s prospectus for a more complete discussion of these and other risks.
References to specific securities should not be considered a recommendation to buy or sell any security. Fund holdings and sector allocations are subject to change. Please refer to the Schedule of Investments included in this report for additional portfolio information.
Earnings growth is not a measure of the Fund’s future performance. Book value is the net asset value of a company, calculated by total assets minus liabilities.
| HENNESSY FUNDS | 1-800-966-4354 | |
Financial Statements
Schedule of Investments as of October 31, 2016 |
HENNESSY SMALL CAP FINANCIAL FUND
(% of Net Assets)
| TOP TEN HOLDINGS (EXCLUDING CASH/CASH EQUIVALENTS) | % NET ASSETS |
| | |
| Hingham Institution for Savings | 5.71% |
| | |
| Brookline Bancorp, Inc. | 5.68% |
| | |
| Independent Bank Corp. | 5.30% |
| | |
| Kearny Financial Corp. of Maryland | 5.18% |
| | |
| Washington Federal, Inc. | 5.02% |
| | |
| Eagle Bancorp, Inc. | 4.81% |
| | |
| Flushing Financial Corp. | 4.75% |
| | |
| Meridian Bancorp, Inc. | 4.63% |
| | |
| PacWest Bancorp | 4.31% |
| | |
| Clifton Bancorp, Inc. | 4.24% |
Note: For presentation purposes, the Fund has grouped some of the industry categories. For purposes of categorizing securities for compliance with section 8(b)(1) of the Investment Company Act of 1940, as amended, the Fund uses more specific industry classifications.
HENNESSYFUNDS.COM
| | COMMON STOCKS – 92.54% | | Number | | | | | | % of | |
| | | | of Shares | | | Value | | | Net Assets | |
| | Financials – 92.54% | | | | | | | | | |
| | BankUnited, Inc. | | | 82,500 | | | $ | 2,404,050 | | | | 1.57 | % |
| | Banner Corp. | | | 88,000 | | | | 3,972,320 | | | | 2.59 | % |
| | Beneficial Bancorp, Inc. | | | 320,000 | | | | 4,640,000 | | | | 3.03 | % |
| | Brookline Bancorp, Inc. | | | 680,000 | | | | 8,704,000 | | | | 5.68 | % |
| | Capstar Financial Holdings, Inc. (a) | | | 180,000 | | | | 3,060,000 | | | | 2.00 | % |
| | Clifton Bancorp, Inc. | | | 425,000 | | | | 6,498,250 | | | | 4.24 | % |
| | Eagle Bancorp, Inc. (a) | | | 150,000 | | | | 7,372,500 | | | | 4.81 | % |
| | FCB Financial Holdings, Inc., Class A (a) | | | 140,000 | | | | 5,222,000 | | | | 3.40 | % |
| | First BanCorp. (a) (b) | | | 730,000 | | | | 3,744,900 | | | | 2.44 | % |
| | First Connecticut Bancorp, Inc. | | | 257,483 | | | | 4,570,323 | | | | 2.98 | % |
| | Flushing Financial Corp. | | | 340,000 | | | | 7,282,800 | | | | 4.75 | % |
| | Hingham Institution for Savings | | | 61,000 | | | | 8,750,450 | | | | 5.71 | % |
| | Independent Bank Corp. | | | 147,500 | | | | 8,134,625 | | | | 5.30 | % |
| | Kearny Financial Corp. of Maryland | | | 570,000 | | | | 7,951,500 | | | | 5.18 | % |
| | Meridian Bancorp, Inc. | | | 445,000 | | | | 7,097,750 | | | | 4.63 | % |
| | OceanFirst Financial Corp. | | | 222,500 | | | | 4,601,300 | | | | 3.00 | % |
| | Opus Bank | | | 80,000 | | | | 1,604,000 | | | | 1.05 | % |
| | PacWest Bancorp | | | 152,500 | | | | 6,616,975 | | | | 4.31 | % |
| | Pinnacle Financial Partners, Inc. | | | 27,500 | | | | 1,419,000 | | | | 0.92 | % |
| | Provident Financial Services, Inc. | | | 270,000 | | | | 6,126,300 | | | | 3.99 | % |
| | ServisFirst Bancshares, Inc. | | | 7,500 | | | | 406,050 | | | | 0.26 | % |
| | Texas Capital Bancshares, Inc. (a) | | | 30,000 | | | | 1,779,000 | | | | 1.16 | % |
| | United Financial Bancorp, Inc. | | | 370,000 | | | | 5,442,700 | | | | 3.55 | % |
| | Washington Federal, Inc. | | | 282,500 | | | | 7,698,125 | | | | 5.02 | % |
| | Western Alliance Bancorp (a) | | | 80,000 | | | | 2,988,800 | | | | 1.95 | % |
| | Wintrust Financial Corp. | | | 85,000 | | | | 4,585,750 | | | | 2.99 | % |
| | WSFS Financial Corp. | | | 97,500 | | | | 3,417,375 | | | | 2.23 | % |
| | Yadkin Financial Corp. | | | 210,000 | | | | 5,825,400 | | | | 3.80 | % |
| | | | | | | | | | | | | | |
| | | | | | | | | 141,916,243 | | | | 92.54 | % |
| | | | | | | | | | | | | | |
| | Total Common Stocks | | | | | | | | | | | | |
| | (Cost $118,518,615) | | | | | | | 141,916,243 | | | | 92.54 | % |
The accompanying notes are an integral part of these financial statements.
| HENNESSY FUNDS | 1-800-966-4354 | |
| | SHORT-TERM INVESTMENTS – 7.54% | | Number | | | | | | % of | |
| | | | of Shares | | | Value | | | Net Assets | |
| | Money Market Funds – 7.54% | | | | | | | | | |
| | Fidelity Government Portfolio, Institutional Class, 0.27% (c) | | | 7,639,000 | | | $ | 7,639,000 | | | | 4.98 | % |
| | The Government & Agency Portfolio, Institutional Class, 0.29% (c) | | | 3,920,898 | | | | 3,920,898 | | | | 2.56 | % |
| | | | | | | | | | | | | | |
| | | | | | | | | 11,559,898 | | | | 7.54 | % |
| | | | | | | | | | | | | | |
| | Total Short-Term Investments | | | | | | | | | | | | |
| | (Cost $11,559,898) | | | | | | | 11,559,898 | | | | 7.54 | % |
| | | | | | | | | | | | | | |
| | Total Investments | | | | | | | | | | | | |
| | (Cost $130,078,513) – 100.08% | | | | | | | 153,476,141 | | | | 100.08 | % |
| | Liabilities in Excess | | | | | | | | | | | | |
| | of Other Assets – (0.08)% | | | | | | | (117,209 | ) | | | (0.08 | )% |
| | | | | | | | | | | | | | |
| | TOTAL NET ASSETS – 100.00% | | | | | | $ | 153,358,932 | | | | 100.00 | % |
Percentages are stated as a percent of net assets.
| (a) | Non-income producing security. |
| (b) | U.S. traded security of a foreign corporation. |
| (c) | The rate listed is the fund’s 7-day yield as of October 31, 2016. |
Summary of Fair Value Exposure at October 31, 2016
The following is a summary of the inputs used to value the Fund’s net assets as of October 31, 2016 (see Note 3 in the accompanying notes to the financial statements):
| Common Stocks | | Level 1 | | | Level 2 | | | Level 3 | | | Total | |
| Financials | | $ | 141,916,243 | | | $ | — | | | $ | — | | | $ | 141,916,243 | |
| Total Common Stocks | | $ | 141,916,243 | | | $ | — | | | $ | — | | | $ | 141,916,243 | |
| Short-Term Investments | | | | | | | | | | | | | | | | |
| Money Market Funds | | $ | 11,559,898 | | | $ | — | | | $ | — | | | $ | 11,559,898 | |
| Total Short-Term Investments | | $ | 11,559,898 | | | $ | — | | | $ | — | | | $ | 11,559,898 | |
| Total Investments | | $ | 153,476,141 | | | $ | — | | | $ | — | | | $ | 153,476,141 | |
Transfers between levels are recognized at the end of the reporting period. During the year ended October 31, 2016, the Fund recognized no transfers between levels.
The accompanying notes are an integral part of these financial statements.
HENNESSYFUNDS.COM
| SCHEDULE OF INVESTMENTS/STATEMENT OF ASSETS AND LIABILITIES |
Financial Statements
Statement of Assets and Liabilities as of October 31, 2016 |
| ASSETS: | | | |
| Investments in securities, at value (cost $130,078,513) | | $ | 153,476,141 | |
| Dividends and interest receivable | | | 65,578 | |
| Receivable for fund shares sold | | | 114,495 | |
| Prepaid expenses and other assets | | | 18,694 | |
| Total Assets | | | 153,674,908 | |
| | | | | |
| LIABILITIES: | | | | |
| Payable for fund shares redeemed | | | 70,535 | |
| Payable to advisor | | | 117,044 | |
| Payable to administrator | | | 24,666 | |
| Payable to auditor | | | 20,700 | |
| Accrued distribution fees | | | 19,855 | |
| Accrued service fees | | | 11,231 | |
| Accrued trustees fees | | | 3,911 | |
| Accrued expenses and other payables | | | 48,034 | |
| Total Liabilities | | | 315,976 | |
| NET ASSETS | | $ | 153,358,932 | |
| | | | | |
| NET ASSETS CONSIST OF: | | | | |
| Capital stock | | $ | 107,387,187 | |
| Accumulated net investment income | | | 492,304 | |
| Accumulated net realized gain on investments | | | 22,081,813 | |
| Unrealized net appreciation on investments | | | 23,397,628 | |
| Total Net Assets | | $ | 153,358,932 | |
| | | | | |
| NET ASSETS | | | | |
| Investor Class: | | | | |
| Shares authorized (no par value) | | Unlimited | |
| Net assets applicable to outstanding Investor Class shares | | $ | 132,091,764 | |
| Shares issued and outstanding | | | 5,625,613 | |
| Net asset value, offering price and redemption price per share | | $ | 23.48 | |
| | | | | |
| Institutional Class: | | | | |
| Shares authorized (no par value) | | Unlimited | |
| Net assets applicable to outstanding Institutional Class shares | | $ | 21,267,168 | |
| Shares issued and outstanding | | | 1,494,419 | |
| Net asset value, offering price and redemption price per share | | $ | 14.23 | |
The accompanying notes are an integral part of these financial statements.
| HENNESSY FUNDS | 1-800-966-4354 | |
Financial Statements
Statement of Operations for the year ended October 31, 2016 |
| INVESTMENT INCOME: | | | |
Dividend income(1) | | $ | 3,904,376 | |
| Interest income | | | 27,852 | |
| Total investment income | | | 3,932,228 | |
| | | | | |
| EXPENSES: | | | | |
| Investment advisory fees (See Note 5) | | | 1,848,196 | |
| Sub-transfer agent expenses – Investor Class (See Note 5) | | | 404,545 | |
| Sub-transfer agent expenses – Institutional Class (See Note 5) | | | 21,875 | |
| Distribution fees – Investor Class (See Note 5) | | | 273,787 | |
| Administration, fund accounting, custody and transfer agent fees (See Note 5) | | | 200,492 | |
| Service fees – Investor Class (See Note 5) | | | 182,525 | |
| Federal and state registration fees | | | 37,444 | |
| Compliance expense (See Note 5) | | | 23,709 | |
| Reports to shareholders | | | 22,654 | |
| Audit fees | | | 20,699 | |
| Trustees’ fees and expenses | | | 15,946 | |
| Interest expense (See Note 7) | | | 8,193 | |
| Legal fees | | | 1,551 | |
| Other expenses | | | 16,984 | |
| Total expenses | | | 3,078,600 | |
| NET INVESTMENT INCOME | | $ | 853,628 | |
| | | | | |
| REALIZED AND UNREALIZED GAINS (LOSSES): | | | | |
| Net realized gain on investments | | $ | 22,692,434 | |
| Net change in unrealized appreciation on investments | | | (20,515,915 | ) |
| Net gain on investments | | | 2,176,519 | |
| NET INCREASE IN NET ASSETS RESULTING FROM OPERATIONS | | $ | 3,030,147 | |
(1) | Net of foreign taxes withheld of $1,425. |
The accompanying notes are an integral part of these financial statements.
HENNESSYFUNDS.COM
(This Page Intentionally Left Blank.)
| HENNESSY FUNDS | 1-800-966-4354 | |
Financial Statements
| Statements of Changes in Net Assets |
| | | Year Ended | | | Year Ended | |
| | | October 31, 2016 | | | October 31, 2015 | |
| OPERATIONS: | | | | | | |
| Net investment income | | $ | 853,628 | | | $ | 408,940 | |
| Net realized gain on investments | | | 22,692,434 | | | | 18,278,191 | |
| Net change in unrealized appreciation on investments | | | (20,515,915 | ) | | | 8,241,257 | |
| Net increase in net assets resulting from operations | | | 3,030,147 | | | | 26,928,388 | |
| | | | | | | | | |
| DISTRIBUTIONS TO SHAREHOLDERS FROM: | | | | | | | | |
| Net investment income | | | | | | | | |
| Investor Class | | | (267,832 | ) | | | — | |
| Institutional Class | | | (92,618 | ) | | | — | |
| Net realized gains | | | | | | | | |
| Investor Class | | | (15,913,393 | ) | | | (25,724,771 | ) |
| Institutional Class | | | (2,010,713 | ) | | | (5,914,515 | ) |
| Total distributions | | | (18,284,556 | ) | | | (31,639,286 | ) |
| | | | | | | | | |
| CAPITAL SHARE TRANSACTIONS: | | | | | | | | |
| Proceeds from shares subscribed – Investor Class | | | 45,732,345 | | | | 54,313,216 | |
| Proceeds from shares subscribed – Institutional Class | | | 13,512,825 | | | | 13,953,486 | |
| Dividends reinvested – Investor Class | | | 15,949,973 | | | | 25,337,010 | |
| Dividends reinvested – Institutional Class | | | 1,873,063 | | | | 3,720,941 | |
| Cost of shares redeemed – Investor Class | | | (134,605,880 | ) | | | (53,885,643 | ) |
| Cost of shares redeemed – Institutional Class | | | (18,295,342 | ) | | | (29,606,425 | ) |
| Net increase (decrease) in net assets derived | | | | | | | | |
| from capital share transactions | | | (75,833,016 | ) | | | 13,832,585 | |
| TOTAL INCREASE (DECREASE) IN NET ASSETS | | | (91,087,425 | ) | | | 9,121,687 | |
| | | | | | | | | |
| NET ASSETS: | | | | | | | | |
| Beginning of year | | | 244,446,357 | | | | 235,324,670 | |
| End of year | | $ | 153,358,932 | | | $ | 244,446,357 | |
| Undistributed net investment income, end of year | | $ | 492,304 | | | $ | — | |
The accompanying notes are an integral part of these financial statements.
HENNESSYFUNDS.COM
| STATEMENTS OF CHANGES IN NET ASSETS |
| Statements of Changes in Net Assets – Continued |
| | | Year Ended | | | Year Ended | |
| | | October 31, 2016 | | | October 31, 2015 | |
| CHANGES IN SHARES OUTSTANDING: | | | | | | |
| Shares sold – Investor Class | | | 1,969,658 | | | | 2,361,827 | |
| Shares sold – Institutional Class | | | 966,693 | | | | 1,012,204 | |
| Shares issued to holders as reinvestment | | | | | | | | |
| of dividends – Investor Class | | | 712,600 | | | | 1,216,371 | |
| Shares issued to holders as reinvestment | | | | | | | | |
| of dividends – Institutional Class | | | 138,299 | | | | 296,489 | |
| Shares redeemed – Investor Class | | | (6,232,464 | ) | | | (2,404,812 | ) |
| Shares redeemed – Institutional Class | | | (1,412,772 | ) | | | (2,412,721 | ) |
| Net increase (decrease) in shares outstanding | | | (3,857,986 | ) | | | 69,358 | |
The accompanying notes are an integral part of these financial statements.
| HENNESSY FUNDS | 1-800-966-4354 | |
Financial Statements
For an Investor Class share outstanding throughout each year
PER SHARE DATA:
Net asset value, beginning of year
Income from investment operations:
Net investment income (loss)
Net realized and unrealized gains on investments
Total from investment operations
Less distributions:
Dividends from net investment income
Dividends from net realized gains
Total distributions
Paid-in capital from redemption fees
Net asset value, end of year
TOTAL RETURN
SUPPLEMENTAL DATA AND RATIOS:
Net assets, end of year (millions)
Ratio of expenses to average net assets
Ratio of net investment income (loss) to average net assets
Portfolio turnover rate(3)
(1) | Calculated based on average shares outstanding method. |
(2) | Amount is less than $0.01. |
(3) | Portfolio turnover is calculated on the basis of the Fund as a whole. |
The accompanying notes are an integral part of these financial statements.
HENNESSYFUNDS.COM
| FINANCIAL HIGHLIGHTS — INVESTOR CLASS |
| Year Ended October 31, | |
| 2016 | | | 2015 | | | 2014 | | | 2013 | | | 2012 | |
| | | | | | | | | | | | | | |
| $ | 23.81 | | | $ | 24.13 | | | $ | 25.40 | | | $ | 19.54 | | | $ | 16.48 | |
| | | | | | | | | | | | | | | | | | | |
| | | | | | | | | | | | | | | | | | | |
| | 0.10 | | | | 0.03 | (1) | | | (0.10 | ) | | | 0.10 | | | | 0.11 | |
| | 1.20 | | | | 2.99 | | | | 0.49 | | | | 5.88 | | | | 3.24 | |
| | 1.30 | | | | 3.02 | | | | 0.39 | | | | 5.98 | | | | 3.35 | |
| | | | | | | | | | | | | | | | | | | |
| | | | | | | | | | | | | | | | | | | |
| | (0.03 | ) | | | — | | | | (0.06 | ) | | | (0.12 | ) | | | (0.29 | ) |
| | (1.60 | ) | | | (3.34 | ) | | | (1.60 | ) | | | — | | | | — | |
| | (1.63 | ) | | | (3.34 | ) | | | (1.66 | ) | | | (0.12 | ) | | | (0.29 | ) |
| | — | | | | — | | | | 0.00 | (2) | | | 0.00 | (2) | | | 0.00 | (2) |
| $ | 23.48 | | | $ | 23.81 | | | $ | 24.13 | | | $ | 25.40 | | | $ | 19.54 | |
| | | | | | | | | | | | | | | | | | | |
| | 5.80 | % | | | 14.51 | % | | | 1.40 | % | | | 30.80 | % | | | 20.65 | % |
| | | | | | | | | | | | | | | | | | | |
| | | | | | | | | | | | | | | | | | | |
| $ | 132.09 | | | $ | 218.50 | | | $ | 193.09 | | | $ | 243.42 | | | $ | 167.20 | |
| | 1.54 | % | | | 1.50 | % | | | 1.44 | % | | | 1.46 | % | | | 1.45 | % |
| | 0.38 | % | | | 0.17 | % | | | (0.36 | )% | | | 0.48 | % | | | 0.56 | % |
| | 46 | % | | | 49 | % | | | 47 | % | | | 57 | % | | | 43 | % |
The accompanying notes are an integral part of these financial statements.
| HENNESSY FUNDS | 1-800-966-4354 | |
Financial Statements
For an Institutional Class share outstanding throughout each year
PER SHARE DATA:
Net asset value, beginning of year
Income from investment operations:
Net investment income (loss)
Net realized and unrealized gains on investments
Total from investment operations
Less distributions:
Dividends from net investment income
Dividends from net realized gains
Total distributions
Net asset value, end of year
TOTAL RETURN
SUPPLEMENTAL DATA AND RATIOS:
Net assets, end of year (millions)
Ratio of expenses to average net assets
Ratio of net investment income (loss) to average net assets
Portfolio turnover rate(2)
(1) | Calculated based on average shares outstanding method. |
(2) | Portfolio turnover is calculated on the basis of the Fund as a whole. |
The accompanying notes are an integral part of these financial statements.
HENNESSYFUNDS.COM
| FINANCIAL HIGHLIGHTS — INSTITUTIONAL CLASS |
| Year Ended October 31, | |
| 2016 | | | 2015 | | | 2014 | | | 2013 | | | 2012 | |
| | | | | | | | | | | | | | |
| $ | 14.39 | | | $ | 14.53 | | | $ | 15.96 | | | $ | 12.34 | | | $ | 10.55 | |
| | | | | | | | | | | | | | | | | | | |
| | | | | | | | | | | | | | | | | | | |
| | 0.09 | | | | 0.06 | (1) | | | (0.09 | ) | | | 0.14 | | | | 0.16 | |
| | 0.75 | | | | 1.81 | | | | 0.40 | | | | 3.66 | | | | 1.98 | |
| | 0.84 | | | | 1.87 | | | | 0.31 | | | | 3.80 | | | | 2.14 | |
| | | | | | | | | | | | | | | | | | | |
| | | | | | | | | | | | | | | | | | | |
| | (0.04 | ) | | | — | | | | (0.14 | ) | | | (0.18 | ) | | | (0.35 | ) |
| | (0.96 | ) | | | (2.01 | ) | | | (1.60 | ) | | | — | | | | — | |
| | (1.00 | ) | | | (2.01 | ) | | | (1.74 | ) | | | (0.18 | ) | | | (0.35 | ) |
| $ | 14.23 | | | $ | 14.39 | | | $ | 14.53 | | | $ | 15.96 | | | $ | 12.34 | |
| | | | | | | | | | | | | | | | | | | |
| | 6.22 | % | | | 14.91 | % | | | 1.70 | % | | | 31.18 | % | | | 20.95 | % |
| | | | | | | | | | | | | | | | | | | |
| | | | | | | | | | | | | | | | | | | |
| $ | 21.27 | | | $ | 25.94 | | | $ | 42.23 | | | $ | 68.80 | | | $ | 43.79 | |
| | 1.17 | % | | | 1.17 | % | | | 1.12 | % | | | 1.15 | % | | | 1.25 | % |
| | 0.72 | % | | | 0.48 | % | | | (0.04 | )% | | | 0.74 | % | | | 0.72 | % |
| | 46 | % | | | 49 | % | | | 47 | % | | | 57 | % | | | 43 | % |
The accompanying notes are an integral part of these financial statements.
| HENNESSY FUNDS | 1-800-966-4354 | |
Financial Statements
Notes to the Financial Statements October 31, 2016 |
1). ORGANIZATION
The Hennessy Small Cap Financial Fund (the “Fund”) is a series of Hennessy Funds Trust (the “Trust”), which was organized as a Delaware statutory trust on September 17, 1992. The Fund is an open-end management investment company registered under the Investment Company Act of 1940, as amended. The Fund is a successor to the FBR Small Cap Financial Fund (the “Predecessor FBR Fund”), a series of The FBR Funds, a Delaware statutory trust, pursuant to a reorganization that took place after the close of business on October 26, 2012. Prior to October 26, 2012, the Fund had no investment operations. As a result of the reorganization, holders of Investor Class shares of the Predecessor FBR Fund received Investor Class shares of the Fund (the Investor Class shares of the Fund are the successor to the accounting and performance information of the corresponding shares of the Predecessor FBR Fund), and holders of Institutional Class shares of the Predecessor FBR Fund received Institutional Class shares of the Fund (the Institutional Class shares of the Fund are the successor to the accounting and performance information of the corresponding shares of the Predecessor FBR Fund). The investment objective of the Fund is capital appreciation. The Fund is a non-diversified fund.
The Fund offers Investor Class and Institutional Class shares. Each class of shares differs principally in its respective administration, 12b-1 distribution and service, shareholder servicing, and transfer agent expenses (there are no sales charges). Each class has identical rights to earnings, assets, and voting privileges, except for class-specific expenses and exclusive rights to vote on matters affecting only an individual class.
As an investment company, the Fund follows the investment company accounting and reporting guidance of the Financial Accounting Standards Board (“FASB”) Accounting Standard Codification Topic 946 “Financial Services—Investment Companies.”
2). SIGNIFICANT ACCOUNTING POLICIES
The following is a summary of significant accounting policies consistently followed by the Fund in the preparation of the financial statements. These policies are in conformity with U.S. generally accepted accounting principles (“GAAP”).
| a). | Investment Valuation – All investments in securities are recorded at their estimated fair value, as described in Note 3. |
| b). | Federal Income Taxes – No provision for federal income taxes or excise taxes has been made since the Fund has elected to be taxed as a “regulated investment company” and intends to distribute substantially all of its taxable income to its shareholders and otherwise comply with the provisions of the Internal Revenue Code of 1986, as amended, applicable to regulated investment companies. Net investment income or loss and realized gains and losses for federal income tax purposes may differ from that reported on the financial statements because of temporary book and tax basis differences. Temporary differences are primarily the result of the treatment of wash sales for tax reporting purposes. The Fund recognizes interest and penalties related to income tax benefits, if any, in the statement of operations as an income tax expense. Distributions from net realized gains for book purposes may include short-term capital gains, which are included as ordinary income to shareholders for tax purposes. |
HENNESSYFUNDS.COM
| NOTES TO THE FINANCIAL STATEMENTS |
| | Due to inherent differences in the recognition of income, expenses, and realized gains/losses under GAAP and federal income tax regulations, permanent differences between book and tax basis for reporting for the fiscal year ended October 31, 2016, have been identified and appropriately reclassified on the Statement of Assets and Liabilities. The adjustments are as follows: |
| | Undistributed | Accumulated | | |
| | Net Investment | Net Realized | | |
| | Income/(Loss) | Gain/(Loss) | Paid-in Capital | |
| | $(874) | $874 | $— | |
| c). | Accounting for Uncertainty in Income Taxes – The Fund has accounting policies regarding recognition and measurement of tax positions taken or expected to be taken on a tax return. The tax returns of the Fund for the prior three fiscal years are open for examination. The Fund has reviewed all open tax years in major jurisdictions and concluded that there is no impact on the Fund’s net assets and no tax liability resulting from unrecognized tax benefits relating to uncertain income tax positions taken or expected to be taken on a tax return. The Fund’s major tax jurisdictions are U.S. federal and Delaware. |
| d). | Income and Expenses – Dividend income is recognized on the ex-dividend date or as soon as information is available to the Fund. Interest income, which includes the amortization of premium and accretion of discount, is recognized on an accrual basis. The Fund is charged for those expenses that are directly attributable to the portfolio, such as advisory, administration, and certain shareholder service fees. Income, expenses (other than expenses attributable to a specific class), and realized and unrealized gains or losses on investments are allocated to each class of shares based on its respective net assets. |
| e). | Distributions to Shareholders – Dividends from net investment income for the Fund, if any, are declared and paid annually, usually in December. Distributions of net realized capital gains, if any, are declared and paid annually, usually in December. |
| f). | Security Transactions – Investment and shareholder transactions are recorded on the trade date. The Fund determines the gain or loss realized from the investment transactions by comparing the original cost of the security lot sold with the net sale proceeds. Discounts and premiums on securities purchased are accreted/amortized over the life of the respective security. |
| g). | Use of Estimates – The preparation of financial statements in conformity with GAAP requires management to make estimates and assumptions that affect the reported amounts of assets and liabilities and disclosure of contingent assets and liabilities at the date of the financial statements and the reported change in net assets during the reporting period. Actual results could differ from those estimates. |
| h). | Share Valuation – The net asset value (“NAV”) per share of the Fund is calculated by dividing the sum of the value of the securities held by the Fund, plus cash or other assets, minus all liabilities (including estimated accrued expenses) by the total number of shares outstanding for the Fund, rounded to the nearest cent. The Fund’s shares will not be priced on days the New York Stock Exchange is closed for trading. The offering and redemption price per share for the Fund is equal to the Fund’s NAV per share. |
| i). | Foreign Currency – Values of investments denominated in foreign currencies, if any, are converted into U.S. dollars using the spot market rate of exchange at the time of valuation. Purchases and sales of investments and income are translated into U.S. dollars using the spot market rate of exchange prevailing on the respective dates of |
| HENNESSY FUNDS | 1-800-966-4354 | |
| | such transactions. The Fund does not isolate the portion of the results of operations resulting from fluctuations in foreign exchange rates on investments from fluctuations resulting from changes in the market prices of securities held. Such fluctuations are included with the net realized and unrealized gain or loss on investments. Foreign investments present additional risks due to currency fluctuations, economic and political factors, lower liquidity, government regulations, differences in accounting standards, and other factors. |
| j). | Forward Contracts – The Fund may enter into forward currency contracts to reduce its exposure to changes in foreign currency exchange rates on its foreign holdings and to lock in the U.S. dollar cost of firm purchase and sale commitments for securities denominated in foreign currencies. A forward currency contract is a commitment to purchase or sell a foreign currency at a future date at a negotiated forward rate. The gain or loss arising from the difference between the U.S. dollar cost of the original contract and the value of the foreign currency in U.S. dollars upon closing of such contract is included in net realized gain or loss from foreign currency transactions. During the fiscal year ended October 31, 2016, the Fund did not enter into any forward contracts. |
| k). | Repurchase Agreements – The Fund may enter into repurchase agreements with member banks or security dealers of the Federal Reserve Board whom the investment advisor deems creditworthy. The repurchase price generally equals the price paid by the Fund plus interest negotiated on the basis of current short-term rates. |
| | Securities pledged as collateral for repurchase agreements are held by the custodian bank until the respective agreements mature. Provisions of the repurchase agreements ensure that the market value of the collateral, including accrued interest thereon, is sufficient to cover the repurchase amount in the event of default of the counterparty. If the counterparty defaults and the value of the collateral declines or if the counterparty enters an insolvency proceeding, realization of the collateral by the Fund may be delayed or limited. During the fiscal year ended October 31, 2016, the Fund did not enter into any repurchase agreements. |
| l). | Derivatives – The Fund may invest in, or enter into, derivatives, such as options, futures contracts, options on futures contracts, and swaps, for a variety of reasons, including to hedge certain risks, to provide a substitute for purchasing or selling particular securities, or to increase potential income gain. Derivatives are financial contracts based on an underlying or notional amount, require no initial investment or an initial net investment that is smaller than would normally be required to have a similar response to changes in market factors, and require or permit net settlement. Derivatives may allow the Fund to increase or decrease the level of risk to which the Fund is exposed more quickly and efficiently than transactions in other types of instruments. The main purpose of utilizing derivative instruments is for hedging purposes. |
| | The Fund follows the financial accounting reporting rules as required by the Derivatives and Hedging Topic of the FASB Accounting Standards Codification. Under such rules, the Fund is required to include enhanced disclosure that enables investors to understand how and why an entity uses derivatives, how derivatives are accounted for, and how derivatives instruments affect an entity’s results of operations and financial position. During the fiscal year ended October 31, 2016, the Fund did not hold any derivative instruments. |
| m). | New Accounting Pronouncements – In May 2015, the FASB issued ASU No. 2015-07 “Disclosure for Investments in Certain Entities that Calculate Net Asset Value per Share (or Its Equivalent).” The amendments in ASU No. 2015-07 remove the |
HENNESSYFUNDS.COM
| NOTES TO THE FINANCIAL STATEMENTS |
| | requirement to categorize within the fair value hierarchy investments measured at NAV and require the disclosure of sufficient information to reconcile the fair value of the remaining assets categorized within the fair value hierarchy to the financial statements. The amendments in ASU No. 2015-07 are effective for fiscal years beginning after December 15, 2015, and interim periods within those fiscal years. Management has reviewed the requirements and believes the adoption of ASU 2015-07 will not have a material impact on the Fund’s financial statements and related disclosures. |
3). SECURITIES VALUATION
The Fund follows authoritative fair valuation accounting standards that establish an authoritative definition of fair value and set out a hierarchy for measuring fair value. These standards require additional disclosures about the various inputs and valuation techniques used to develop the measurements of fair value and a discussion in changes in valuation techniques and related inputs during the period. These inputs are summarized in the three broad levels listed below:
| | Level 1 – | Unadjusted, quoted prices in active markets for identical instruments that the Fund has the ability to access at the date of measurement. |
| | Level 2 – | Other significant observable inputs (including, but not limited to, quoted prices in active markets for similar instruments, quoted prices in markets that are not active for identical or similar instruments, and model-derived valuations in which all significant inputs and significant value drivers are observable in active markets (such as interest rates, prepayment speeds, credit risk curves, default rates, and similar data)). |
| | Level 3 – | Significant unobservable inputs (including the Fund’s own assumptions about what market participants would use to price the asset or liability based on the best available information) when observable inputs are unavailable. |
Following is a description of the valuation techniques applied to the Fund’s major categories of assets and liabilities measured at fair value on a recurring basis.
Equity Securities – Equity securities, including common stocks, preferred stocks, foreign-issued common stocks, exchange-traded funds, closed-end mutual funds, partnerships, rights, and real estate investment trusts, that are traded on a securities exchange for which a last-quoted sales price is readily available will generally be valued at the last sales price as reported by the primary exchange on which the securities are listed. Securities listed on The NASDAQ Stock Market (“NASDAQ”) will generally be valued at the NASDAQ Official Closing Price, which may differ from the last sales price reported. Securities traded on a securities exchange for which a last-quoted sales price is not readily available will generally be valued at the mean between the bid and ask prices. To the extent these securities are actively traded and valuation adjustments are not applied, they are classified in Level 1 of the fair value hierarchy. Securities traded on foreign exchanges generally are not valued at the same time the Fund calculates its NAV because most foreign markets close well before such time. The earlier close of most foreign markets gives rise to the possibility that significant events, including broad market moves, may have occurred in the interim. In certain circumstances, it may be determined that a security needs to be fair valued because it appears that the value of the security might have been materially affected by events occurring after the close of the market in which the security is principally traded, but before the time the Fund calculates its NAV, such as by a development that affects an entire market or region (e.g., weather-related events) or a potentially global development (e.g., a terrorist attack that may be expected to have an effect on investor expectations worldwide).
| HENNESSY FUNDS | 1-800-966-4354 | |
Registered Investment Companies – Investments in registered investment companies (e.g., mutual funds) are generally priced at the ending NAV provided by the applicable registered investment company’s service agent and will be classified in Level 1 of the fair value hierarchy.
Debt Securities – Debt securities, including corporate bonds, asset-backed securities, mortgage-backed securities, municipal bonds, U.S. Treasuries, and U.S. government agency issues, are generally valued at market on the basis of valuations furnished by an independent pricing service that utilizes both dealer-supplied valuations and formula-based techniques. The pricing service may consider recently executed transactions in securities of the issuer or comparable issuers, market price quotations (where observable), bond spreads, and fundamental data relating to the issuer. In addition, the model may incorporate observable market data, such as reported sales of similar securities, broker quotes, yields, bids, offers, and reference data. Certain securities are valued primarily using dealer quotations. These securities are generally classified in Level 2 of the fair value hierarchy.
Short-Term Securities – Short-term equity investments, including money market funds, are valued in the manner specified above. Short-term debt investments with an original term to maturity of 60 days or less are valued at amortized cost, which approximates fair market value. If the original term to maturity of a short-term debt investment exceeded 60 days, then the values as of the 61st day prior to maturity are amortized. Amortized cost is not used if its use would be inappropriate due to credit or other impairments of the issuer, in which case the security’s fair value would be determined, as described below. Short-term securities are generally classified in Level 1 or Level 2 of the fair market hierarchy depending on the inputs used and market activity levels for specific securities.
The Board of Trustees of the Fund (the “Board”) has adopted fair value pricing procedures that are followed when a price for a security is not readily available or if a significant event has occurred that indicates the closing price of a security no longer represents the true value of that security. Fair value pricing determinations are made in good faith in accordance with these procedures. There are numerous criteria that will be given consideration in determining a fair value of a security, such as the trading volume of a security and markets, the value of other like securities, and news events with direct bearing to a security or markets. Fair value pricing results in an estimated price for a security that reflects the amount the Fund might reasonably expect to receive in a current sale. Depending on the relative significance of the valuation inputs, these securities may be classified in either Level 2 or Level 3 of the fair value hierarchy.
The fair valuation of foreign securities may be determined with the assistance of a pricing service using correlations between the movement of prices of such securities and indices of domestic securities and other appropriate indicators, such as closing market prices of relevant American Depositary Receipts or futures contracts. The effect of using fair value pricing is that the Fund’s NAV will reflect the affected portfolio securities’ value as determined by the Board or its designee instead of being determined by the market. Using a fair value pricing methodology to price foreign securities may result in a value that is different from a foreign security’s most recent closing price and from the prices used by other investment companies to calculate their NAVs and are generally considered Level 2 prices in the fair valuation hierarchy. Because the Fund may invest in foreign securities, the value of the Fund’s portfolio securities may change on days when you will not be able to purchase or redeem your shares.
The Board has delegated day-to-day valuation matters to a Valuation Committee comprised of one or more representatives from Hennessy Advisors, Inc., the Fund’s
HENNESSYFUNDS.COM
| NOTES TO THE FINANCIAL STATEMENTS |
investment advisor. The function of the Valuation Committee is to value securities where current and reliable market quotations are not readily available. All actions taken by the Valuation Committee are reviewed by the Board.
The Fund has performed an analysis of all existing investments to determine the significance and character of all inputs to their fair value determination. Various inputs are used in determining the value of the Fund’s investments. The inputs or methodology used for valuing securities are not necessarily an indication of the risk associated with investing in those securities. Details related to the fair valuation hierarchy of the Fund’s securities as of October 31, 2016, are included in the Fund’s Schedule of Investments.
4). INVESTMENT TRANSACTIONS
Purchases and sales of investment securities (excluding government and short-term investments) for the Fund during the fiscal year ended October 31, 2016, were $88,252,798 and $178,245,979, respectively.
There were no purchases or sales/maturities of long-term U.S. government securities for the Fund during the fiscal year ended October 31, 2016.
The Fund is permitted to purchase or sell securities from or to another fund in the Hennessy Funds family of funds (the “Hennessy Funds”) under specified conditions outlined in procedures adopted by the Board of Trustees. The procedures have been designed to ensure that any purchase or sale of securities by the Fund from or to another Hennessy Fund complies with Rule 17a-7 of the Investment Company Act of 1940. For the fiscal year ended October 31, 2016, the Fund did not engage in purchases and sales of securities pursuant to Rule 17a-7 of the Investment Company Act of 1940.
5). INVESTMENT MANAGEMENT FEE AND OTHER TRANSACTIONS WITH AFFILIATES
Hennessy Advisors, Inc. (the “Advisor”) is the investment advisor of the Fund. The Advisor provides the Fund with investment management services under an Investment Advisory Agreement. The Advisor furnishes all investment advice, office space, facilities, and provides most of the personnel needed by the Fund. As compensation for its services, the Advisor is entitled to a monthly fee from the Fund. The fee is based upon the average daily net assets of the Fund at the annual rate of 0.90%. The net investment advisory fees payable by the Fund as of October 31, 2016, were $117,044.
The Board has approved a Shareholder Servicing Agreement for Investor Class shares of the Fund, effective as of March 1, 2015, which was instituted to compensate the Advisor for the non-investment management services it provides to the Fund. The Shareholder Servicing Agreement provides for a monthly fee paid to the Advisor at an annual rate of 0.10% of the average daily net assets of the Fund attributable to Investor Class shares. Shareholder service fees payable by the Fund as of October 31, 2016, were $11,231.
The Fund has adopted a plan pursuant to Rule 12b-1 under the Investment Company Act of 1940, as amended, that authorizes payments in connection with the distribution of the Fund’s shares at an annual rate of up to 0.25% of the Fund’s average daily net assets attributable to Investor Class shares. Even though the authorized rate is up to 0.25%, the Fund has only used up to 0.15% of its average daily net assets attributable to Investor Class shares for such purpose since March 1, 2015. Amounts paid under the plan may be spent on any activities or expenses primarily intended to result in the sale of shares, including, but not limited to, advertising, shareholder account servicing, the printing and mailing of prospectuses to other than current shareholders, the printing and mailing of sales literature, and compensation for sales and marketing activities or to financial institutions and others, such as dealers and distributors.
| HENNESSY FUNDS | 1-800-966-4354 | |
The Fund has entered into agreements with various brokers, dealers, and financial intermediaries in connection with the sale of shares of the Fund. The agreements provide for periodic payments by the Fund to the brokers, dealers, and financial intermediaries for providing certain shareholder maintenance services (sub-transfer agent expenses). These shareholder services include the pre-processing and quality control of new accounts, shareholder correspondence, answering customer inquiries regarding account status, and facilitating shareholder telephone transactions. Fees paid by the Fund to various brokers, dealers, and financial intermediaries during the fiscal year ended October 31, 2016, were $426,420.
U.S. Bancorp Fund Services, LLC (“USBFS”) provides the Fund with administrative, fund accounting, and transfer agent services, and necessary office equipment. As administrator, USBFS is responsible for activities such as (i) preparing various federal and state regulatory filings, reports, and returns for the Fund, (ii) preparing reports and materials to be supplied to the Board, (iii) monitoring the activities of the Fund’s custodian, transfer agent, and accountants, and (iv) coordinating the preparation and payment of the Fund’s expenses and reviewing the Fund’s expense accruals. Fees paid to USBFS during the fiscal year ended October 31, 2016, were $200,492.
U.S. Bank, N.A., an affiliate of USBFS, serves as the Fund’s custodian. Quasar Distributors, LLC acts as the Fund’s principal underwriter in a continuous public offering of the Fund’s shares. Quasar Distributors, LLC is an affiliate of USBFS and U.S. Bank, N.A.
The officers of the Fund are affiliated with the Advisor. Such officers, with the exception of the Chief Compliance Officer and the Senior Compliance Officer, receive no compensation from the Fund for serving in their respective roles. The Fund, along with the other Hennessy Funds, makes reimbursement payments, on an equal basis, to the Advisor for a portion of the salary and benefits associated with the office of the Chief Compliance Officer and for all of the salary and benefits associated with the office of the Senior Compliance Officer. Such amounts are included on the Statement of Operations.
6). GUARANTEES AND INDEMNIFICATIONS
Under the Hennessy Funds’ organizational documents, their officers and trustees are indemnified by the Hennessy Funds against certain liabilities arising out of the performance of their duties to the Hennessy Funds. Additionally, in the normal course of business, the Hennessy Funds enter into contracts with service providers that contain general indemnification clauses. The Fund’s maximum exposure under these arrangements is unknown as this would involve future claims that may be made against the Fund that have not yet occurred. Currently, the Fund expects the risk of loss to be remote.
7). LINE OF CREDIT
The Fund has an uncommitted line of credit with the other Hennessy Funds in the amount of the lesser of (i) $100,000,000 or (ii) 33.33% of each Hennessy Fund’s net assets, or 30% for the Hennessy Gas Utility Fund and 10% for the Hennessy Balanced Fund, intended to provide short-term financing, if necessary, subject to certain restrictions, in connection with shareholder redemptions. The credit facility is with the Hennessy Funds’ custodian bank, U.S. Bank, N.A. Borrowings under this arrangement bear interest at the bank’s prime rate and are secured by all of the Fund’s assets (as to its own borrowings only). During the fiscal year ended October 31, 2016, the Fund had an outstanding average daily balance and a weighted average interest rate of $217,945 and 3.47%, respectively. The maximum amount outstanding for the Fund during the period was $10,412,000. At October 31, 2016, the Fund did not have any borrowings outstanding under the line of credit.
HENNESSYFUNDS.COM
| NOTES TO THE FINANCIAL STATEMENTS |
8). FEDERAL TAX INFORMATION
As of October 31, 2016, the components of accumulated earnings (losses) for income tax purposes were as follows:
| Cost of investments for tax purposes | | $ | 130,922,641 | |
| Gross tax unrealized appreciation | | $ | 25,325,854 | |
| Gross tax unrealized depreciation | | | (2,772,354 | ) |
| Net tax unrealized appreciation | | $ | 22,553,500 | |
| Undistributed ordinary income | | $ | 492,304 | |
| Undistributed long-term capital gains | | | 22,925,941 | |
| Total distributable earnings | | $ | 23,418,245 | |
| Other accumulated loss | | $ | — | |
| Total accumulated gain | | $ | 45,971,745 | |
The difference between book-basis unrealized appreciation/depreciation (as shown in the Statement of Assets and Liabilities) and tax-basis unrealized appreciation/depreciation (as shown above) is attributable primarily to wash sales.
At October 31, 2016, the Fund had no tax basis capital losses to offset future capital gains.
At October 31, 2016, the Fund did not defer, on a tax basis, any late year ordinary losses.
During the fiscal years ended October 31, 2016 and 2015, the tax character of distributions paid by the Fund was as follows:
| | | Year Ended | | | Year Ended | |
| | | October 31, 2016 | | | October 31, 2015 | |
Ordinary income(1) | | $ | 2,097,406 | | | $ | — | |
| Long-term capital gain | | | 16,187,150 | | | | 31,639,286 | |
| | | $ | 18,284,556 | | | $ | 31,639,286 | |
(1) Ordinary income includes short-term gain or loss.
9). EVENTS SUBSEQUENT TO YEAR END
Management has evaluated the Fund’s related events and transactions that occurred subsequent to October 31, 2016, through the date of issuance of the Fund’s financial statements. Other than as disclosed below, management has determined that there were no subsequent events requiring recognition or disclosure in the financial statements.
On December 7, 2016, capital gains were declared and paid to shareholders of record as of December 6, 2016, as follows:
| | Long-term | |
| | Amount Per Share | |
| Investor Class | $3.19063 | |
| Institutional Class | $1.95258 | |
| HENNESSY FUNDS | 1-800-966-4354 | |
Report of Independent Registered Public Accounting Firm
To the Board of Trustees of Hennessy Funds Trust
and the Shareholders of the Hennessy Small Cap Financial Fund
Novato, CA
We have audited the accompanying statement of assets and liabilities, including the schedule of investments, of the Hennessy Small Cap Financial Fund (the “Fund”), a series of Hennessy Funds Trust, as of October 31, 2016, and the related statement of operations for the year then ended, the statements of changes in net assets for each of the two years in the period then ended, and the financial highlights for each of the five years in the period then ended. These financial statements and financial highlights are the responsibility of the Fund’s management. Our responsibility is to express an opinion on these financial statements and financial highlights based on our audits.
We conducted our audits in accordance with the standards of the Public Company Accounting Oversight Board (United States). Those standards require that we plan and perform the audits to obtain reasonable assurance about whether the financial statements and financial highlights are free of material misstatement. The Fund is not required to have, nor were we engaged to perform, an audit of its internal control over financial reporting. Our audits included consideration of internal control over financial reporting as a basis for designing audit procedures that are appropriate in the circumstances, but not for the purposes of expressing an opinion on the effectiveness of the Fund’s internal control over financial reporting. Accordingly, we express no such opinion. An audit includes examining, on a test basis, evidence supporting the amounts and disclosures in the financial statements. Our procedures included confirmation of securities owned as of October 31, 2016, by correspondence with the custodian. An audit also includes assessing the accounting principles used and significant estimates made by management, as well as evaluating the overall financial statement presentation. We believe that our audits provide a reasonable basis for our opinion.
In our opinion, the financial statements and financial highlights referred to above present fairly, in all material respects, the financial position of the Hennessy Small Cap Financial Fund as of October 31, 2016, the results of its operations for the year then ended, the changes in its net assets for each of the two years in the period then ended, and the financial highlights for each of the five years in the period then ended, in conformity with accounting principles generally accepted in the United States of America.
TAIT, WELLER & BAKER LLP
Philadelphia, Pennsylvania
December 22, 2016
HENNESSYFUNDS.COM
| REPORT OF INDEPENDENT REGISTERED PUBLIC ACCOUNTING FIRM/TRUSTEES AND OFFICERS |
Trustees and Officers of the Fund (Unaudited)
The business and affairs of the Fund are managed under the direction of the Board of Trustees of the Trust, and the Board of Trustees elects the Officers of the Trust. Beginning in March 2015, the Board of Trustees has from time to time appointed advisers (“Advisers”) to the Board of Trustees, with the intention of having qualified individuals serve in an advisory capacity in order to garner experience in the mutual fund and asset management industry and be considered as potential Trustees in the future. There are currently three Advisers to the Board of Trustees: Brian Alexander, Doug Franklin, and Claire Knoles. As Advisers, Mr. Alexander, Mr. Franklin, and Ms. Knoles attend meetings of the Board and act as non-voting participants. Information pertaining to the Trustees, Advisers, and the Officers of the Trust is set forth below. The Trustees and Officers serve until their successors are duly elected and qualified or until their earlier death, resignation, or removal. Each of the Trustees oversees 16 Hennessy Funds. Unless otherwise indicated, the address of all persons listed below is 7250 Redwood Boulevard, Suite 200, Novato, CA 94945. The Fund’s Statement of Additional Information includes more information about the persons listed below and is available, without charge, upon request by calling 1-800-966-4354.
| | | | Other |
| | | | Directorships |
| | | | Held Outside |
| Name, (Year of Birth), | | | of Fund |
| and Position Held | Start Date | Principal Occupation(s) | Complex During |
with the Trust | of Service | During Past Five Years | Past Five Years(1) |
| | | |
| Disinterested Trustees and Advisers | | |
| | | | |
| J. Dennis DeSousa | January 1996 | Mr. DeSousa is a real estate investor. | None. |
| (1936) | | | |
| Trustee | | | |
| | | | |
| Robert T. Doyle | January 1996 | Mr. Doyle has been the Sheriff of | None. |
| (1947) | | Marin County, California since 1996. | |
| Trustee | | | |
| | | | |
| Gerald P. Richardson | May 2004 | Mr. Richardson is an independent | None. |
| (1945) | | consultant in the securities industry. | |
| Trustee | | | |
| | | | |
| Brian Alexander | March 2015 | Mr. Alexander has been employed | None. |
| (1981) | | by Sutter Health Novato Community | |
| Adviser to the Board | | Hospital since 2012, first as an | |
| | | Assistant Administrator and then, | |
| | | beginning in 2013, as the Chief | |
| | | Administrative Officer. From 2011 | |
| | | through 2012, Mr. Alexander was | |
| | | employed by Sutter Health West Bay | |
| | | Region as the Regional Director of | |
| | | Strategic Decision Support. Prior to | |
| | | that, in 2011, he served as the | |
| | | Director of Managed Care | |
| | | Contracting and also the Director of | |
| | | Compensation, Benefits, and | |
| | | Compliance for the Rehabilitation | |
| | | Institute of Chicago. | |
| HENNESSY FUNDS | 1-800-966-4354 | |
| | | | Other |
| | | | Directorships |
| | | | Held Outside |
| Name, (Year of Birth), | | | of Fund |
| and Position Held | Start Date | Principal Occupation(s) | Complex During |
with the Trust | of Service | During Past Five Years | Past Five Years(1) |
| | | | |
| Doug Franklin | March 2016 | Mr. Franklin is a retired insurance | None. |
| (1964) | | industry executive. From 1987 | |
| Adviser to the Board | | through 2015, he was employed by | |
| | | the Allianz-Fireman’s Fund Insurance | |
| | | Company in various positions, | |
| | | including as its Chief Actuary and | |
| | | Chief Risk Officer. | |
| | | | |
| Claire Knoles | December 2015 | Ms. Knoles is a founder of Kiosk and | None. |
| (1974) | | has served as its Chief Operating | |
| Adviser to the Board | | Officer since 2004. Kiosk is a full | |
| | | service marketing agency with | |
| | | offices in the San Francisco Bay | |
| | | Area, Toronto, and Liverpool, UK. | |
| | | | |
Interested Trustee(2) | | | |
| | | | |
| Neil J. Hennessy | January 1996 as | Mr. Hennessy has been employed by | Hennessy |
| (1956) | a Trustee and | Hennessy Advisors, Inc. since 1989 | Advisors, Inc. |
| Trustee, Chairman of | June 2008 as | and currently serves as its President, | |
| the Board, Chief | an Officer | Chairman and Chief Executive Officer. | |
| Investment Officer, | | | |
| Portfolio Manager, | | | |
| and President | | | |
| Name, (Year of Birth), | | |
| and Position Held | Start Date | Principal Occupation(s) |
with the Trust | of Service | During Past Five Years |
| | | |
| Officers | | |
| | | |
| Teresa M. Nilsen | January 1996 | Ms. Nilsen has been employed by Hennessy Advisors, Inc. |
| (1966) | | since 1989 and currently serves as its Executive Vice President, |
| Executive Vice President | | Chief Operations Officer, Chief Financial Officer, and Secretary. |
| and Treasurer | | |
| | | |
| Daniel B. Steadman | March 2000 | Mr. Steadman has been employed by Hennessy Advisors, Inc. |
| (1956) | | since 2000 and currently serves as its Executive Vice President |
| Executive Vice President | | and Chief Compliance Officer. |
| and Secretary | | |
| | | |
| Jennifer Cheskiewicz | June 2013 | Ms. Cheskiewicz has been employed by Hennessy Advisors, Inc. |
| (1977) | | as its General Counsel since June 2013. She previously served |
| Senior Vice President and | | as in-house counsel to Carlson Capital, L.P., an SEC-registered |
| Chief Compliance Officer | | investment advisor to several private funds, from |
| | | February 2010 to May 2013. |
| | | |
| Brian Carlson | December 2013 | Mr. Carlson has been employed by Hennessy Advisors, Inc. |
| (1972) | | since December 2013. Mr. Carlson was previously a co-founder |
| Senior Vice President and | | and principal of Trivium Consultants, LLC from February 2011 |
| Head of Distribution | | through November 2013. |
HENNESSYFUNDS.COM
| TRUSTEES AND OFFICERS OF THE FUND |
| Name, (Year of Birth), | | |
| and Position Held | Start Date | Principal Occupation(s) |
with the Trust | of Service | During Past Five Years |
| | | |
| David Ellison | October 2012 | Mr. Ellison has been employed by Hennessy Advisors, Inc. since |
(1958)(3) | | October 2012. He has served as a Portfolio Manager of the |
| Senior Vice President and | | Hennessy Small Cap Financial Fund, the Hennessy Large Cap |
| Portfolio Manager | | Financial Fund, and the Hennessy Technology Fund since |
| | | inception. Prior to that, Mr. Ellison served as Director, CIO and |
| | | President of FBR Fund Advisers, Inc. from December |
| | | 1999 to October 2012. |
| | | |
| Brian Peery | March 2003 as | Mr. Peery has been employed by Hennessy Advisors, Inc. since |
| (1969) | an Officer and | 2002. He has served as a Portfolio Manager of the Hennessy |
| Senior Vice President and | February 2011 | Cornerstone Growth Fund, the Hennessy Cornerstone Mid Cap |
| Portfolio Manager | as a Co-Portfolio | 30 Fund, the Hennessy Cornerstone Large Growth Fund, the |
| | Manager or | Hennessy Cornerstone Value Fund, the Hennessy Total Return |
| | Portfolio Manager | Fund, and the Hennessy Balanced Fund since October 2014. |
| | | He served as Co-Portfolio Manager of the same funds from |
| | | February 2011 through September 2014. Mr. Peery has also |
| | | served as a Portfolio Manager of the Hennessy Gas Utility Fund |
| | | since February 2015. |
| | | |
| Winsor (Skip) Aylesworth | October 2012 | Mr. Aylesworth has been employed by Hennessy Advisors, Inc. |
(1947)(3) | | since October 2012. He has served as a Portfolio Manager of |
| Vice President and | | the Hennessy Gas Utility Fund since 1998 and as a Portfolio |
| Portfolio Manager | | Manager of the Hennessy Technology Fund since inception. |
| | | Prior to that, Mr. Aylesworth served as Executive Vice President |
| | | of FBR Fund Advisers, Inc. from 1999 to October 2012. |
| | | |
| Ryan Kelley | March 2013 | Mr. Kelley has been employed by Hennessy Advisors, Inc. since |
(1972)(4) | | October 2012. He has served as a Portfolio Manager of the |
| Vice President and | | Hennessy Gas Utility Fund, the Hennessy Small Cap Financial |
| Portfolio Manager | | Fund, and the Hennessy Large Cap Financial Fund since |
| | | October 2014. He served as Co-Portfolio Manager of the same |
| | | funds from March 2013 through September 2014, and as a |
| | | Portfolio Analyst for the Hennessy Funds from October 2012 |
| | | through February 2013. Prior to that, Mr. Kelley served as |
| | | Portfolio Manager of FBR Fund Advisers, Inc. from |
| | | January 2008 to October 2012. |
_______________
(1) | Messrs. DeSousa, Doyle, Hennessy, and Richardson previously served on the Board of Directors of Hennessy Mutual Funds, Inc. (“HMFI”), The Hennessy Funds, Inc. (“HFI”), and Hennessy SPARX Funds Trust (“HSFT”). Pursuant to an internal reorganization effective as of February 28, 2014, the series of HFMI, HFI, and HSFT were reorganized into corresponding series of Hennessy Funds Trust that mirrored them. Subsequent to the reorganization, HFMI, HFI, and HSFT were dissolved. |
(2) | Mr. Hennessy is considered an “interested person,” as defined in the Investment Company Act of 1940, as amended, because he is an officer of the Hennessy Funds. |
(3) | The address of these officers is 101 Federal Street, Suite 1900, Boston, MA 02110. |
(4) | The address of this officer is 1340 Environ Way, Suite 305, Chapel Hill, NC 27517. |
| HENNESSY FUNDS | 1-800-966-4354 | |
Expense Example (Unaudited)
October 31, 2016
As a shareholder of the Fund, you incur two types of costs: (1) transaction costs, including sales charges (loads) on purchase payments, reinvested dividends, or other distributions; redemption fees; and exchange fees; and (2) ongoing costs, including management fees; service fees; and other Fund expenses. This Example is intended to help you understand your ongoing costs (in dollars) of investing in the Fund and to compare these costs with the ongoing costs of investing in other mutual funds. The Example is based on an investment of $1,000 invested at the beginning of the period and held for the entire period from May 1, 2016, through October 31, 2016.
Actual Expenses
The first line of the table below under the “Investor Class” and “Institutional Class” headings provides information about actual account values and actual expenses. Although the Fund charges no sales loads or transaction fees, you will be assessed fees for outgoing wire transfers, returned checks and stop payment orders at prevailing rates charged by U.S. Bancorp Fund Services, LLC, the Fund’s transfer agent. If you request that a redemption be made by wire transfer, currently a $15 fee is charged by the Fund’s transfer agent. IRA accounts will be charged a $15 annual maintenance fee. The example below includes, but is not limited to, management fees, shareholder servicing fees, fund accounting, custody, and transfer agent fees. However, the example below does not include portfolio trading commissions and related expenses, and other extraordinary expenses as determined under generally accepted accounting principles. You may use the information in this line, together with the amount you invested, to estimate the expenses that you paid over the period. Simply divide your account value by $1,000 (for example, an $8,600 account value divided by $1,000 = 8.6), then multiply the result by the number in the first line of the table under the “Investor Class” and “Institutional Class” headings in the column entitled “Expenses Paid During Period” to estimate the expenses you paid on your account during this period.
Hypothetical Example for Comparison Purposes
The second line of the table below under the “Investor Class” and “Institutional Class” headings provides information about hypothetical account values and hypothetical expenses based on the Fund’s actual expense ratios and an assumed rate of return of 5% per year before expenses, which is not the Fund’s actual return. The hypothetical account values and expenses may not be used to estimate the actual ending account balance or expenses you paid for the period. You may use this information to compare the ongoing costs of investing in the Fund and other funds. To do so, compare this 5% hypothetical example with the 5% hypothetical examples that appear in the shareholder reports of the other funds. Please note that the expenses shown in the table are meant to highlight your ongoing costs only and do not reflect any transactional costs, such as sales charges (loads), or exchange fees. Therefore, the second line of the table under the “Investor Class” and “Institutional Class” headings is useful in comparing ongoing costs only, and will not help you determine the relative total costs of owning different funds. In addition, if these transactional costs were included, your costs would have been higher.
HENNESSYFUNDS.COM
| | | | Expenses Paid |
| | Beginning | Ending | During Period(1) |
| | Account Value | Account Value | May 1, 2016 – |
| | May 1, 2016 | October 31, 2016 | October 31, 2016 |
| Investor Class | | | |
| Actual | $1,000.00 | $1,064.90 | $8.15 |
| Hypothetical (5% return before expenses) | $1,000.00 | $1,017.24 | $7.96 |
| | | | |
| Institutional Class | | | |
| Actual | $1,000.00 | $1,066.70 | $6.23 |
| Hypothetical (5% return before expenses) | $1,000.00 | $1,019.10 | $6.09 |
(1) | Expenses are equal to the Fund’s annualized expense ratio of 1.57% for Investor Class shares or 1.20% for Institutional Class shares, as applicable, multiplied by the average account value over the period, multiplied by 184/366 days (to reflect one-half year period). |
| HENNESSY FUNDS | 1-800-966-4354 | |
How to Obtain a Copy of the Fund’s
Proxy Voting Policy and Proxy Voting Records
A description of the policies and procedures the Fund uses to determine how to vote proxies relating to portfolio securities is available without charge: (1) by calling 1-800-966-4354; (2) on the Hennessy Funds’ website at hennessyfunds.com/proxy-voting/policy.fs; or (3) on the U.S. Securities and Exchange Commission’s website at www.sec.gov. The Fund’s proxy voting record is available without charge on both the Hennessy Funds’ website at hennessyfunds.com/proxy-voting/vote.fs and the SEC’s website at www.sec.gov no later than August 31 for the prior 12 months ending June 30.
Quarterly Filings on Form N-Q
The Fund files its complete schedule of portfolio holdings with the SEC for the first and third quarters of each fiscal year on Form N-Q. The Fund’s Form N-Q will be available on the SEC’s website at www.sec.gov. The Fund’s Form N-Q may be reviewed and copied at the SEC’s Public Reference Room in Washington, DC and information on the operation of the Public Reference Room may be obtained by calling 1-800-SEC-0330. Information included in the Fund’s N-Q will also be available upon request by calling 1-800-966-4354.
Federal Tax Distribution Information
(Unaudited)
For the fiscal year ended October 31, 2016, certain dividends paid by the Fund may be subject to a maximum tax rate of 23.8%, as provided for by the Jobs and Growth Tax Relief Reconciliation Act of 2003. The percentage of dividends declared from ordinary income designated as qualified dividend income was 100%.
For corporate shareholders, the percent of ordinary income distributions that qualified for the corporate dividends received deduction for the fiscal year ended October 31, 2016, was 100%.
The percentage of taxable ordinary income distributions that are designated as short-term capital gain distributions under Section 871(k)(2)(C) of the Internal Revenue Code of 1986, as amended, for the Fund was 82.78%.
Householding
To help keep the Fund’s costs as low as possible, we generally deliver a single copy of most financial reports and prospectuses to shareholders who share an address, even if the accounts are registered under different names. This process, known as “householding,” does not apply to account statements. You may, of course, request an individual copy of a prospectus or financial report at any time. If you would like to receive separate mailings, please call the Administrator at 1-800-261-6950 or 1-414-765-4124 and we will begin individual delivery within 30 days of your request. If your account is held through a financial institution or other intermediary, please contact them directly to request individual delivery.
HENNESSYFUNDS.COM
| PROXY VOTING — PRIVACY POLICY |
Privacy Policy
We collect the following non-public personal information about you:
| | • | information we receive from you on or in applications or other forms, correspondence, or conversations, including, but not limited to, your name, address, phone number, social security number, assets, income, and date of birth; and |
| | • | information about your transactions with us, our affiliates, or others, including, but not limited to, your account number and balance, payment history, parties to transactions, cost basis information, and other financial information. |
We do not disclose any non-public personal information about our current or former shareholders to non-affiliated third parties, except as permitted by law. For example, we are permitted by law to disclose all of the information we collect, as described above, to our Transfer Agent to process your transactions. Furthermore, we restrict access to your non-public personal information to those persons who require such information to provide products or services to you. We maintain physical, electronic, and procedural safeguards that comply with federal standards to guard your non-public personal information.
In the event that you hold shares of the Fund through a financial intermediary, including, but not limited to, a broker-dealer, bank or trust company, the privacy policy of your financial intermediary would govern how your non-public personal information would be shared with non-affiliated third parties.
| HENNESSY FUNDS | 1-800-966-4354 | |
For information, questions or assistance, please call
The Hennessy Funds
1-800-966-4354 or 1-415-899-1555
INVESTMENT ADVISOR
Hennessy Advisors, Inc.
7250 Redwood Blvd., Suite 200
Novato, California 94945
ADMINISTRATOR,
TRANSFER AGENT,
DIVIDEND PAYING AGENT &
SHAREHOLDER SERVICING AGENT
U.S. Bancorp Fund Services, LLC
P.O. Box 701
Milwaukee, Wisconsin 53201-0701
CUSTODIAN
U.S. Bank N.A.
Custody Operations
1555 North River Center Dr., Suite 302
Milwaukee, Wisconsin 53212
TRUSTEES
Neil J. Hennessy
Robert T. Doyle
J. Dennis DeSousa
Gerald P. Richardson
COUNSEL
Foley & Lardner LLP
777 East Wisconsin Avenue
Milwaukee, Wisconsin 53202-5306
INDEPENDENT REGISTERED
PUBLIC ACCOUNTING FIRM
Tait, Weller & Baker LLP
1818 Market Street, Suite 2400
Philadelphia, Pennsylvania 19103
DISTRIBUTOR
Quasar Distributors, LLC
615 East Michigan Street
Milwaukee, Wisconsin 53202
hennessyfunds.com | 1-800-966-4354
This report has been prepared for shareholders and may be distributed to
others only if preceded or accompanied by a current prospectus.
ANNUAL REPORT
OCTOBER 31, 2016
HENNESSY LARGE CAP
FINANCIAL FUND
Investor Class HLFNX
Institutional Class HILFX
hennessyfunds.com | 1-800-966-4354
(This Page Intentionally Left Blank.)
Contents
| Letter to Shareholders | 2 |
| Performance Overview | 4 |
| Financial Statements | |
| Schedule of Investments | 7 |
| Statement of Assets and Liabilities | 10 |
| Statement of Operations | 11 |
| Statements of Changes in Net Assets | 13 |
| Financial Highlights | 14 |
| Notes to the Financial Statements | 17 |
| Report of Independent Registered Public Accounting Firm | 26 |
| Trustees and Officers of the Fund | 27 |
| Expense Example | 30 |
| Proxy Voting | 32 |
| Quarterly Filings on Form N-Q | 32 |
| Federal Tax Distribution Information | 32 |
| Householding | 32 |
| Privacy Policy | 33 |
| HENNESSY FUNDS | 1-800-966-4354 | |
December 2016
Dear Hennessy Funds Shareholder:
Over the past year investors here in the U.S. and around the world have weathered a great deal of turmoil, especially in the political arena. Foremost, the bitterly divisive and all-consuming U.S. Presidential election, with its unanticipated outcome, is finally behind us. While the equity markets were jittery at first, they now appear more comfortable with the prospect of a Trump presidency and seem to be looking forward to diminished government regulation and intervention.
The Brexit vote in the U.K. cast a shadow over the European Union’s future. There remains uncertainty over the details and timing of the break and the economic consequences for both Britain and Europe, but early signs suggest the impact on growth in Britain will not be as severe as initially feared.
Additionally, uncertainty over whether the Federal Reserve would raise short-term interest rates has hung over the economy for well over a year now. The effects that higher rates could have on growth, the strength of the U.S. Dollar, corporate profits and loan supply and demand seem to have weighed heavily on investors, causing paralysis and money to remain on the sidelines of the market.
Despite all these concerns, U.S. equity markets have pushed higher, with both the Dow Jones Industrial Average and S&P 500 Index posting returns of approximately 5% during the twelve-month period ended October 31, 2016. The U.S. economy has continued to grow at a respectable annual rate of about 2%, and corporate profits have started to move higher. Today, as of mid-December, bond and Treasury yields have risen a bit from record lows just this summer, and the bond market is finishing the year on slightly rocky footing. Bond yields are still very low relative to historical averages, while the prospective PE multiples for the Dow Jones Industrial Average and S&P 500 Index are just above long-term averages at 18.0x and 18.9x, respectively. We believe that equity valuations could go considerably higher and still be at appropriate levels relative to bond yields. And, while we do expect the Fed to raise interest rates in the coming year, we believe that inflation will stay under control, so that short-term interest rates will not have to rise too fast or too far.
As I reflect over the past twelve months, what I realize is that many of the worries this year are not new. For the past several years, American businesses have operated in an environment characterized by highly partisan politics, mounting regulations, uncertainty over interest rates, and a lack of clarity regarding taxes and healthcare costs. Despite all these headwinds, U.S. corporations have been incredibly resilient and found ways to impress investors. If the newly elected administration follows through on campaign promises of reigning in regulation, lowering taxes for corporations and individuals, or reforming healthcare to drive down costs, then companies, which are already lean, should be able to post higher profits. And, that growth should lead to more jobs and a stronger economy, potentially creating a very positive cycle going forward.
With the bull market in U.S. equities entering its ninth year, many believe the economy is due for a recession and the market is due for a downturn. But, the euphoria that usually accompanies a peak in the market is absent. Since the recovery began after the financial crisis, I have found myself pondering the bull run of 1982 to 2000, powered, in part, by a significant increase in valuations. I believe today’s market displays the fundamentals to sustain a similarly strong and lengthy bull market. Meanwhile, companies are largely profitable and many corporate balance sheets are cash-rich, with
HENNESSYFUNDS.COM
relatively little debt. Unemployment is low and real wages are rising, helping to drive consumption. We are hopeful that these factors will provide support for positive market returns in the year to come.
Thank you for your continued confidence and investment in our funds. If you have any questions or would like to speak with us directly, please don’t hesitate to call us at (800) 966-4354.
Best regards,
Neil J. Hennessy
President and Chief Investment Officer
Past performance does not guarantee future results.
Mutual fund investing involves risk. Principal loss is possible.
Opinions expressed are those of Neil Hennessy and are subject to change, are not guaranteed and should not be considered investment advice.
The Dow Jones Industrial Average and S&P 500 Index are unmanaged indices commonly used to measure the performance of U.S. stocks. One cannot invest directly in an index.
PE, or price to earnings, is calculated by dividing a company’s market price per share by its earnings per share.
| HENNESSY FUNDS | 1-800-966-4354 | |
Performance Overview (Unaudited)
CHANGE IN VALUE OF $10,000 INVESTMENT
This graph illustrates the performance of an initial investment of $10,000 made in the Fund ten years ago and assumes the reinvestment of dividends.
AVERAGE ANNUAL TOTAL RETURN FOR PERIODS ENDED OCTOBER 31, 2016
| | One | Five | Ten |
| | Year | Years | Years |
| Hennessy Large Cap | | | |
| Financial Fund (HLFNX) | -2.57% | 11.38% | 3.04% |
| Hennessy Large Cap Financial Fund – | | | |
Institutional Class (HILFX)(1) | -2.14% | 11.52% | 3.10% |
Russell 1000® Financial | | | |
| Services Index | 3.20% | 15.05% | 0.27% |
Russell 1000® Index | 4.26% | 13.51% | 6.83% |
Expense ratios: 1.58% (Investor Class); 1.20% (Institutional Class)
Performance data quoted represents past performance; past performance does not guarantee future results. The investment return and principal value of an investment will fluctuate so that an investor’s shares, when redeemed, may be worth more or less than their original cost. The performance graph and table do not reflect the deduction of taxes that a shareholder would pay on Fund distributions or the redemption of Fund shares. Current performance of the Fund may be lower or higher than the performance quoted. Performance data current to the most recent month end may be obtained by visiting hennessyfunds.com. Performance for periods prior to October 26, 2012 is that of the FBR Large Cap Financial Fund.
The expense ratios presented are from the most recent prospectus.
(1) | The inception date of Institutional Class shares is June 15, 2015. Performance shown prior to the inception of Institutional Class shares reflects the performance of Investor Class shares and includes expenses that are not applicable to and are higher than those of Institutional Class shares. |
PERFORMANCE NARRATIVE
Portfolio Managers David H. Ellison and Ryan C. Kelley
Performance:
For the twelve-month period ended October 31, 2016, the Investor Class of the Hennessy Large Cap Financial Fund returned -2.57%, underperforming the Russell 1000® Financial
HENNESSYFUNDS.COM
Services Index and the Russell 1000® Index, which returned 3.20% and 4.26% for the same period, respectively.
The Fund’s underperformance versus its benchmark index was principally due to the Fund’s overweight positions in asset managers, banks, and property REITs (Real Estate Investment Trusts), which performed poorly relative to other financial companies over the period. Renewed uncertainty surrounding Federal Reserve rate policy in light of softer economic signals at home and limp growth abroad, together with generally weak financial market conditions, combined to dampen returns of bank stocks in particular during the period. Additionally, regulatory changes and their costs remained a concern for investors in the financial sector as a whole.
Positive contributors to the Fund’s performance included Fifth Third Bancorp, Lincoln National Corporation, and PayPal Holdings, Inc. The Fund continues to own Fifth Third Bancorp and PayPal Holdings, Inc. Companies with the weakest performance over the period included Public Storage, Wells Fargo & Co. and Citigroup, Inc. The Fund continues to hold Wells Fargo & Co. and Citigroup, Inc.
Portfolio Strategy:
Traditionally, the Fund tilts its investments more heavily toward regional banks and diversified global banks, and to a lesser degree, insurance companies, Real Estate Investment Trusts (REITs) and asset managers. We generally do not diversify the Fund’s investments over all the different sub-industries in the financial sector. We seek companies that we believe have high-quality management teams, less complicated business models and sustainable earnings growth opportunities over time. Moreover, we identify companies that we expect will do well in the current environment, which is currently characterized by low interest rates, competitive loan markets and heightened regulatory control. We are less interested in focusing solely on companies that appear to promise an increase in profitability when interest rates rise, loan demand increases, or pricing becomes more favorable, because these industry dynamics are difficult to predict.
Investment Outlook:
We believe that the financial industry as a whole continues to recover well from the financial crisis. Larger financial companies in the U.S. are generally profitable and continue to make improvements to their operations. However, investors remain concerned about global growth, additional regulatory burdens, the negative impact on lending margins from low interest rates and the possibility of damage to credit quality as a result of volatility in asset prices or reduced underwriting standards. Nevertheless, we continue to see improvement in many industry metrics, including liquidity, capital, credit, reserves, book value and cost ratios. As a result, profits, as measured by returns on assets and equity, are at the higher end of historical measures, and have become more sustainable in our opinion. We expect any upward movement in interest rates to improve lending and investing spreads and add to profitability.
We believe the condition of the financial system in the U.S. today is stronger than it has been in quite some time and that the outlook for stocks in the financial sector is bright.
_______________
Opinions expressed are those of the Portfolio Managers as of the date written and are subject to change, are not guaranteed, and should not be considered investment advice or an indication of trading intent.
The Russell 1000® Financial Services Index is an unmanaged index commonly used to measure the performance of large-capitalization financial sector stocks. The Russell 1000® Index is an unmanaged index commonly used to measure the performance of U.S. stocks. One cannot invest directly in an index.
| HENNESSY FUNDS | 1-800-966-4354 | |
The Fund is non-diversified, meaning it may concentrate its assets in fewer individual holdings than a diversified fund, making it more exposed to individual stock volatility than a diversified fund. Investments are focused in the financial services industry; sector funds may be subject to a higher degree of market risk. The Fund invests in medium sized companies, which may have limited liquidity and greater volatility compared to larger companies. Please see the Fund’s prospectus for a more complete discussion of these and other risks.
References to specific securities should not be considered a recommendation to buy or sell any security. Fund holdings and sector allocations are subject to change. Please refer to the Schedule of Investments included in this report for additional portfolio information.
Book value is the net asset value of a company, calculated by total assets minus liabilities. Return on assets is an indicator of how profitable a company is relative to its total assets. Return on equity shows how much profit a company generates with the money shareholders have invested. Earnings growth is not a measure of the Fund’s future performance.
HENNESSYFUNDS.COM
| PERFORMANCE OVERVIEW/SCHEDULE OF INVESTMENTS |
Financial Statements
Schedule of Investments as of October 31, 2016 |
HENNESSY LARGE CAP FINANCIAL FUND
(% of Net Assets)
| TOP TEN HOLDINGS (EXCLUDING CASH/CASH EQUIVALENTS) | % NET ASSETS |
| | |
| Visa, Inc., Class A | 5.34% |
| | |
| Berkshire Hathaway, Inc., Class B | 5.34% |
| | |
| The PNC Financial Services Group, Inc. | 5.31% |
| | |
| Fifth Third Bancorp | 5.07% |
| | |
| SunTrust Banks, Inc. | 5.02% |
| | |
| Comerica, Inc. | 5.01% |
| | |
| Wells Fargo & Co. | 4.94% |
| | |
| PayPal Holdings, Inc. | 4.93% |
| | |
| Bank of America Corp. | 4.89% |
| | |
| Citizens Financial Group, Inc. | 4.87% |
Note: For presentation purposes, the Fund has grouped some of the industry categories. For purposes of categorizing securities for compliance with Section 8(b)(1) of the Investment Company Act of 1940, as amended, the Fund uses more specific industry classifications.
| HENNESSY FUNDS | 1-800-966-4354 | |
| | COMMON STOCKS – 89.87% | | Number | | | | | | % of | |
| | | | of Shares | | | Value | | | Net Assets | |
| | Financials – 76.03% | | | | | | | | | |
| | Bank of America Corp. | | | 80,000 | | | $ | 1,320,000 | | | | 4.89 | % |
| | Berkshire Hathaway, Inc., Class B (a) | | | 10,000 | | | | 1,443,000 | | | | 5.34 | % |
| | Capital One Financial Corp. | | | 13,000 | | | | 962,520 | | | | 3.56 | % |
| | Citigroup, Inc. | | | 17,000 | | | | 835,550 | | | | 3.09 | % |
| | Citizens Financial Group, Inc. | | | 50,000 | | | | 1,317,000 | | | | 4.87 | % |
| | Comerica, Inc. | | | 26,000 | | | | 1,354,340 | | | | 5.01 | % |
| | Fifth Third Bancorp | | | 63,000 | | | | 1,370,880 | | | | 5.07 | % |
| | Huntington Bancshares, Inc. | | | 80,000 | | | | 848,000 | | | | 3.14 | % |
| | JPMorgan Chase & Co. | | | 15,000 | | | | 1,038,900 | | | | 3.85 | % |
| | KeyCorp | | | 72,000 | | | | 1,016,640 | | | | 3.76 | % |
| | Morgan Stanley | | | 20,000 | | | | 671,400 | | | | 2.48 | % |
| | Regions Financial Corp. | | | 80,000 | | | | 856,800 | | | | 3.17 | % |
| | SunTrust Banks, Inc. | | | 30,000 | | | | 1,356,900 | | | | 5.02 | % |
| | Synchrony Financial | | | 37,000 | | | | 1,057,830 | | | | 3.92 | % |
| | The Bank of New York Mellon Corp. | | | 12,500 | | | | 540,875 | | | | 2.00 | % |
| | The Goldman Sachs Group, Inc. | | | 5,500 | | | | 980,320 | | | | 3.63 | % |
| | The PNC Financial Services Group, Inc. | | | 15,000 | | | | 1,434,000 | | | | 5.31 | % |
| | U.S. Bancorp (c) | | | 18,000 | | | | 805,680 | | | | 2.98 | % |
| | Wells Fargo & Co. | | | 29,000 | | | | 1,334,290 | | | | 4.94 | % |
| | | | | | | | | 20,544,925 | | | | 76.03 | % |
| | | | | | | | | | | | | | |
| | Information Technology – 13.84% | | | | | | | | | | | | |
| | MasterCard, Inc., Class A | | | 9,000 | | | | 963,180 | | | | 3.57 | % |
| | PayPal Holdings, Inc. (a) | | | 32,000 | | | | 1,333,120 | | | | 4.93 | % |
| | Visa, Inc., Class A | | | 17,500 | | | | 1,443,925 | | | | 5.34 | % |
| | | | | | | | | 3,740,225 | | | | 13.84 | % |
| | | | | | | | | | | | | | |
| | Total Common Stocks | | | | | | | | | | | | |
| | (Cost $21,669,253) | | | | | | | 24,285,150 | | | | 89.87 | % |
| | | | | | | | | | | | | | |
| | REITS – 4.89% | | | | | | | | | | | | |
| | | | | | | | | | | | | | |
| | Financials – 4.89% | | | | | | | | | | | | |
| | Public Storage | | | 3,000 | | | | 641,160 | | | | 2.38 | % |
| | Ventas, Inc. | | | 10,000 | | | | 677,500 | | | | 2.51 | % |
| | | | | | | | | 1,318,660 | | | | 4.89 | % |
| | | | | | | | | | | | | | |
| | Total REITS | | | | | | | | | | | | |
| | (Cost $1,400,667) | | | | | | | 1,318,660 | | | | 4.89 | % |
The accompanying notes are an integral part of these financial statements.
HENNESSYFUNDS.COM
| | SHORT-TERM INVESTMENTS – 4.78% | | Number | | | | | | % of | |
| | | | of Shares | | | Value | | | Net Assets | |
| | Money Market Funds – 4.78% | | | | | | | | | |
| | Fidelity Government Portfolio, Institutional Class, 0.27% (b) | | | 1,292,546 | | | $ | 1,292,546 | | | | 4.78 | % |
| | | | | | | | | | | | | | |
| | Total Short-Term Investments | | | | | | | | | | | | |
| | (Cost $1,292,546) | | | | | | | 1,292,546 | | | | 4.78 | % |
| | | | | | | | | | | | | | |
| | Total Investments | | | | | | | | | | | | |
| | (Cost $24,362,466) – 99.54% | | | | | | | 26,896,356 | | | | 99.54 | % |
| | Other Assets in Excess of Liabilities – 0.46% | | | | | | | 125,147 | | | | 0.46 | % |
| | | | | | | | | | | | | | |
| | TOTAL NET ASSETS – 100.00% | | | | | | $ | 27,021,503 | | | | 100.00 | % |
Percentages are stated as a percent of net assets.
REIT – Real Estate Investment Trust
| (a) | Non-income producing security. |
| (b) | The rate listed is the fund’s 7-day yield as of October 31, 2016. |
| (c) | Investment in affiliated security. Quasar Distributors, LLC, which serves as the Fund’s distributor, is a subsidiary of U.S. Bancorp. Details of transactions with this affiliated company for the year ended October 31, 2016, are as follows: |
| | Issuer | | U.S. Bancorp | | |
| | Beginning Cost | | $ | 4,466,872 | | |
| | Purchase Cost | | $ | 1,414,106 | | |
| | Sales Cost | | $ | (5,129,578 | ) | |
| | Ending Cost | | $ | 751,400 | | |
| | Dividend Income | | $ | 68,890 | | |
| | Realized Loss | | $ | (13,695 | ) | |
| | Shares | | | 18,000 | | |
| | Market Value | | $ | 805,680 | | |
Summary of Fair Value Exposure at October 31, 2016
The following is a summary of the inputs used to value the Fund’s net assets as of October 31, 2016 (see Note 3 in the accompanying notes to the financial statements):
| Common Stocks | | Level 1 | | | Level 2 | | | Level 3 | | | Total | |
| Financials | | $ | 20,544,925 | | | $ | — | | | $ | — | | | $ | 20,544,925 | |
| Information Technology | | | 3,740,225 | | | | — | | | | — | | | | 3,740,225 | |
| Total Common Stocks | | $ | 24,285,150 | | | $ | — | | | $ | — | | | $ | 24,285,150 | |
| REITS | | | | | | | | | | | | | | | | |
| Financials | | $ | 1,318,660 | | | $ | — | | | $ | — | | | $ | 1,318,660 | |
| Total REITS | | $ | 1,318,660 | | | $ | — | | | $ | — | | | $ | 1,318,660 | |
| Short-Term Investments | | | | | | | | | | | | | | | | |
| Money Market Funds | | $ | 1,292,546 | | | $ | — | | | $ | — | | | $ | 1,292,546 | |
| Total Short-Term Investments | | $ | 1,292,546 | | | $ | — | | | $ | — | | | $ | 1,292,546 | |
| Total Investments | | $ | 26,896,356 | | | $ | — | | | $ | — | | | $ | 26,896,356 | |
Transfers between levels are recognized at the end of the reporting period. During the year ended October 31, 2016, the Fund recognized no transfers between levels.
The accompanying notes are an integral part of these financial statements.
| HENNESSY FUNDS | 1-800-966-4354 | |
Financial Statements
Statement of Assets and Liabilities as of October 31, 2016 |
| ASSETS: | | | |
| Investments in securities, at value (cost $23,611,066) | | $ | 26,090,676 | |
| Investments in affiliated securities, at value (cost $751,400) | | | 805,680 | |
| Total Investments in securities, at value (cost $24,362,466) | | | 26,896,356 | |
| Dividends and interest receivable | | | 24,533 | |
| Receivable for fund shares sold | | | 6,800 | |
| Receivable for securities sold | | | 752,144 | |
| Prepaid expenses and other assets | | | 13,290 | |
| Total Assets | | | 27,693,123 | |
| | | | | |
| LIABILITIES: | | | | |
| Payable for securities purchased | | | 592,732 | |
| Payable for fund shares redeemed | | | 946 | |
| Payable to advisor | | | 20,625 | |
| Payable to administrator | | | 4,646 | |
| Payable to auditor | | | 20,699 | |
| Accrued distribution fees | | | 716 | |
| Accrued service fees | | | 2,263 | |
| Accrued trustees fees | | | 3,897 | |
| Accrued expenses and other payables | | | 25,096 | |
| Total Liabilities | | | 671,620 | |
| NET ASSETS | | $ | 27,021,503 | |
| | | | | |
| NET ASSETS CONSIST OF: | | | | |
| Capital stock | | $ | 27,508,992 | |
| Accumulated net investment income | | | 188,556 | |
| Accumulated net realized loss on investments | | | (3,209,935 | ) |
| Unrealized net appreciation on investments | | | 2,533,890 | |
| Total Net Assets | | $ | 27,021,503 | |
| | | | | |
| NET ASSETS | | | | |
| Investor Class: | | | | |
| Shares authorized (no par value) | | Unlimited | |
| Net assets applicable to outstanding Investor Class shares | | $ | 26,674,296 | |
| Shares issued and outstanding | | | 1,643,968 | |
| Net asset value, offering price and redemption price per share | | $ | 16.23 | |
| | | | | |
| Institutional Class: | | | | |
| Shares authorized (no par value) | | Unlimited | |
| Net assets applicable to outstanding Institutional Class shares | | $ | 347,207 | |
| Shares issued and outstanding | | | 21,352 | |
| Net asset value, offering price and redemption price per share | | $ | 16.26 | |
The accompanying notes are an integral part of these financial statements.
HENNESSYFUNDS.COM
| STATEMENT OF ASSETS AND LIABILITIES/STATEMENT OF OPERATIONS |
Financial Statements
Statement of Operations for the year ended October 31, 2016 |
| INVESTMENT INCOME: | | | |
| Dividend income | | $ | 1,290,058 | |
| Dividend income from affiliated securities | | | 68,890 | |
| Interest income | | | 15,914 | |
| Total investment income | | | 1,374,862 | |
| | | | | |
| EXPENSES: | | | | |
| Investment advisory fees (See Note 5) | | | 678,056 | |
| Sub-transfer agent expenses – Investor Class (See Note 5) | | | 177,895 | |
| Sub-transfer agent expenses – Institutional Class (See Note 5) | | | 156 | |
| Distribution fees – Investor Class (See Note 5) | | | 112,316 | |
| Service fees – Investor Class (See Note 5) | | | 74,877 | |
| Administration, fund accounting, custody and transfer agent fees (See Note 5) | | | 73,601 | |
| Federal and state registration fees | | | 36,457 | |
| Compliance expense (See Note 5) | | | 23,710 | |
| Audit fees | | | 20,699 | |
| Trustees’ fees and expenses | | | 15,387 | |
| Reports to shareholders | | | 14,016 | |
| Interest expense (See Note 7) | | | 12,373 | |
| Legal fees | | | 1,073 | |
| Other expenses | | | 9,274 | |
| Total expenses | | | 1,249,890 | |
| NET INVESTMENT INCOME | | $ | 124,972 | |
| | | | | |
| REALIZED AND UNREALIZED LOSSES: | | | | |
| Net realized loss on: | | | | |
| Unaffiliated investments | | $ | (3,019,345 | ) |
| Affiliated investments | | | (13,695 | ) |
| Net change in unrealized appreciation on investments | | | (2,828,079 | ) |
| Net loss on investments | | | (5,861,119 | ) |
| NET DECREASE IN NET ASSETS RESULTING FROM OPERATIONS | | $ | (5,736,147 | ) |
The accompanying notes are an integral part of these financial statements.
| HENNESSY FUNDS | 1-800-966-4354 | |
(This Page Intentionally Left Blank.)
HENNESSYFUNDS.COM
| STATEMENTS OF CHANGES IN NET ASSETS |
Financial Statements
| Statements of Changes in Net Assets |
| | | Year Ended | | | Year Ended | |
| | | October 31, 2016 | | | October 31, 2015(1) | |
| OPERATIONS: | | | | | | |
| Net investment income | | $ | 124,972 | | | $ | 27,847 | |
| Net realized gain (loss) on investments | | | (3,033,040 | ) | | | 10,567,773 | |
| Net change in unrealized appreciation on investments | | | (2,828,079 | ) | | | (13,399,391 | ) |
| Net decrease in net assets resulting from operations | | | (5,736,147 | ) | | | (2,803,771 | ) |
| | | | | | | | | |
| DISTRIBUTIONS TO SHAREHOLDERS FROM: | | | | | | | | |
| Net investment income | | | | | | | | |
| Investor Class | | | (132,180 | ) | | | — | |
| Institutional Class | | | (3,703 | ) | | | — | |
| Net realized gains | | | | | | | | |
| Investor Class | | | (9,653,373 | ) | | | (9,953,546 | ) |
| Institutional Class | | | (61,676 | ) | | | — | |
| Total distributions | | | (9,850,932 | ) | | | (9,953,546 | ) |
| | | | | | | | | |
| CAPITAL SHARE TRANSACTIONS: | | | | | | | | |
| Proceeds from shares subscribed – Investor Class | | | 87,222,461 | | | | 45,802,881 | |
| Proceeds from shares subscribed – Institutional Class | | | 415,907 | | | | 352,187 | |
| Dividends reinvested – Investor Class | | | 9,523,602 | | | | 9,642,825 | |
| Dividends reinvested – Institutional Class | | | 65,379 | | | | — | |
| Cost of shares redeemed – Investor Class | | | (155,323,687 | ) | | | (40,051,718 | ) |
| Cost of shares redeemed – Institutional Class | | | (319,893 | ) | | | (38,886 | ) |
| Net increase (decrease) in net assets derived | | | | | | | | |
| from capital share transactions | | | (58,416,231 | ) | | | 15,707,289 | |
| TOTAL INCREASE (DECREASE) IN NET ASSETS | | | (74,003,310 | ) | | | 2,949,972 | |
| | | | | | | | | |
| NET ASSETS: | | | | | | | | |
| Beginning of year | | | 101,024,813 | | | | 98,074,841 | |
| End of year | | $ | 27,021,503 | | | $ | 101,024,813 | |
| Undistributed net investment income, end of year | | $ | 188,556 | | | $ | 135,883 | |
| | | | | | | | | |
| CHANGES IN SHARES OUTSTANDING: | | | | | | | | |
| Shares sold – Investor Class | | | 5,612,390 | | | | 2,388,963 | |
| Shares sold – Institutional Class | | | 22,100 | | | | 17,958 | |
| Shares issued to holders as reinvestment | | | | | | | | |
| of dividends – Investor Class | | | 567,448 | | | | 489,235 | |
| Shares issued to holders as reinvestment | | | | | | | | |
| of dividends – Institutional Class | | | 3,885 | | | | — | |
| Shares redeemed – Investor Class | | | (10,022,406 | ) | | | (2,090,781 | ) |
| Shares redeemed – Institutional Class | | | (20,446 | ) | | | (2,145 | ) |
| Net increase (decrease) in shares outstanding | | | (3,837,029 | ) | | | 803,230 | |
(1) | Institutional Class shares commenced operations on June 15, 2015. |
The accompanying notes are an integral part of these financial statements.
| HENNESSY FUNDS | 1-800-966-4354 | |
Financial Statements
For an Investor Class share outstanding throughout each year
PER SHARE DATA:
Net asset value, beginning of year
Income from investment operations:
Net investment income (loss)
Net realized and unrealized gains (losses) on investments
Total from investment operations
Less distributions:
Dividends from net investment income
Dividends from net realized gains
Total distributions
Net asset value, end of year
TOTAL RETURN
SUPPLEMENTAL DATA AND RATIOS:
Net assets, end of year (millions)
Ratio of expenses to average net assets
Ratio of net investment income (loss) to average net assets
Portfolio turnover rate(2)
(1) | Amount is less than $0.01. |
(2) | Portfolio turnover is calculated on the basis of the Fund as a whole. |
The accompanying notes are an integral part of these financial statements.
HENNESSYFUNDS.COM
| FINANCIAL HIGHLIGHTS — INVESTOR CLASS |
| Year Ended October 31, | | |
| 2016 | | | 2015 | | | 2014 | | | 2013 | | | 2012 | | |
| | | | | | | | | | | | | | | |
| $ | 18.36 | | | $ | 20.87 | | | $ | 19.01 | | | $ | 14.16 | | | $ | 11.91 | | |
| | | | | | | | | | | | | | | | | | | | |
| | | | | | | | | | | | | | | | | | | | |
| | 0.07 | | | | 0.01 | | | | 0.00 | (1) | | | (0.03 | ) | | | 0.01 | | |
| | (0.49 | ) | | | (0.40 | ) | | | 2.44 | | | | 4.89 | | | | 2.24 | | |
| | (0.42 | ) | | | (0.39 | ) | | | 2.44 | | | | 4.86 | | | | 2.25 | | |
| | | | | | | | | | | | | | | | | | | | |
| | | | | | | | | | | | | | | | | | | | |
| | (0.02 | ) | | | — | | | | — | | | | (0.01 | ) | | | — | | |
| | (1.69 | ) | | | (2.12 | ) | | | (0.58 | ) | | | — | | | | — | | |
| | (1.71 | ) | | | (2.12 | ) | | | (0.58 | ) | | | (0.01 | ) | | | — | | |
| $ | 16.23 | | | $ | 18.36 | | | $ | 20.87 | | | $ | 19.01 | | | $ | 14.16 | | |
| | | | | | | | | | | | | | | | | | | | |
| | (2.57 | )% | | | (2.57 | )% | | | 13.04 | % | | | 34.37 | % | | | 18.89 | % | |
| | | | | | | | | | | | | | | | | | | | |
| $ | 26.67 | | | $ | 100.73 | | | $ | 98.07 | | | $ | 88.30 | | | $ | 64.66 | | |
| | 1.66 | % | | | 1.57 | % | | | 1.49 | % | | | 1.57 | % | | | 1.57 | % | |
| | 0.16 | % | | | 0.03 | % | | | (0.01 | )% | | | (0.22 | )% | | | 0.09 | % | |
| | 141 | % | | | 74 | % | | | 58 | % | | | 75 | % | | | 93 | % | |
The accompanying notes are an integral part of these financial statements.
| HENNESSY FUNDS | 1-800-966-4354 | |
Financial Statements
For an Institutional Class share outstanding throughout each year
| | | Year Ended | | | Period Ended | |
| | | October 31, 2016 | | | October 31, 2015(1) | |
| PER SHARE DATA: | | | | | | |
| Net asset value, beginning of year | | $ | 18.39 | | | $ | 19.72 | |
| | | | | | | | | |
| Income from investment operations: | | | | | | | | |
| Net investment income | | | 0.02 | | | | 0.01 | |
| Net realized and unrealized losses on investments | | | (0.36 | ) | | | (1.34 | ) |
| Total from investment operations | | | (0.34 | ) | | | (1.33 | ) |
| | | | | | | | | |
| Less distributions: | | | | | | | | |
| Dividends from net investment income | | | (0.09 | ) | | | — | |
| Dividends from net realized gains | | | (1.70 | ) | | | — | |
| Total distributions | | | (1.79 | ) | | | — | |
| Net asset value, end of year | | $ | 16.26 | | | $ | 18.39 | |
| | | | | | | | | |
| TOTAL RETURN | | | (2.14 | )% | | | (6.74 | )%(2) |
| | | | | | | | | |
| SUPPLEMENTAL DATA AND RATIOS: | | | | | | | | |
| Net assets, end of year (millions) | | $ | 0.35 | | | $ | 0.29 | |
| Ratio of expenses to average net assets | | | 1.24 | % | | | 1.19 | %(3) |
| Ratio of net investment income to average net assets | | | 0.52 | % | | | 0.25 | %(3) |
Portfolio turnover rate(4) | | | 141 | % | | | 74 | %(2) |
(1) | Institutional Class shares commenced operations on June 15, 2015. |
(2) | Not annualized. |
(3) | Annualized. |
(4) | Portfolio turnover is calculated on the basis of the Fund as a whole. |
The accompanying notes are an integral part of these financial statements.
HENNESSYFUNDS.COM
| FINANCIAL HIGHLIGHTS — INSTITUTIONAL CLASS/NOTES TO THE FINANCIAL STATEMENTS |
Financial Statements
Notes to the Financial Statements October 31, 2016 |
1). ORGANIZATION
The Hennessy Large Cap Financial Fund (the “Fund”) is a series of Hennessy Funds Trust (the “Trust”), which was organized as a Delaware statutory trust on September 17, 1992. The Fund is an open-end management investment company registered under the Investment Company Act of 1940, as amended. The Fund is a successor to the FBR Large Cap Financial Fund (the “Predecessor FBR Fund”), a series of The FBR Funds, a Delaware statutory trust, pursuant to a reorganization that took place after the close of business on October 26, 2012. Prior to October 26, 2012, the Fund had no investment operations. As a result of the reorganization, holders of Investor Class shares of the Predecessor FBR Fund received Investor Class shares of the Fund (the Investor Class shares of the Fund are the successor to the accounting and performance information of the corresponding shares of the Predecessor FBR Fund). The Fund did not have Institutional Class shares until June 15, 2015. The investment objective of the Fund is capital appreciation. The Fund is a non-diversified fund.
The Fund offers Investor Class and Institutional Class shares. Each class of shares differs principally in its respective administration, 12b-1 distribution and service, shareholder servicing, and transfer agent expenses (there are no sales charges). Each class has identical rights to earnings, assets, and voting privileges, except for class-specific expenses and exclusive rights to vote on matters affecting only an individual class.
As an investment company, the Fund follows the investment company accounting and reporting guidance of the Financial Accounting Standards Board (“FASB”) Accounting Standard Codification Topic 946 “Financial Services—Investment Companies.”
2). SIGNIFICANT ACCOUNTING POLICIES
The following is a summary of significant accounting policies consistently followed by the Fund in the preparation of the financial statements. These policies conform with U.S. generally accepted accounting principles (“GAAP”).
| a). | Investment Valuation – All investments in securities are recorded at their estimated fair value, as described in Note 3. |
| b). | Federal Income Taxes – No provision for federal income taxes or excise taxes has been made since the Fund has elected to be taxed as a “regulated investment company” and intends to distribute substantially all of its taxable income to its shareholders and otherwise comply with the provisions of the Internal Revenue Code of 1986, as amended, applicable to regulated investment companies. Net investment income or loss and realized gains and losses for federal income tax purposes may differ from that reported on the financial statements because of temporary book and tax basis differences. Temporary differences are primarily the result of the treatment of wash sales for tax reporting purposes. The Fund recognizes interest and penalties related to income tax benefits, if any, in the statement of operations as an income tax expense. Distributions from net realized gains for book purposes may include short-term capital gains, which are included as ordinary income to shareholders for tax purposes. |
| | Due to inherent differences in the recognition of income, expenses, and realized gains/losses under GAAP and federal income tax regulations, permanent differences between book and tax basis for reporting for the fiscal year ended October 31, 2016, |
| HENNESSY FUNDS | 1-800-966-4354 | |
have been identified and appropriately reclassified on the Statement of Assets and Liabilities. The adjustments are as follows:
| | Undistributed | Accumulated | | |
| | Net Investment | Net Realized | | |
| | Income/(Loss) | Gain/(Loss) | Paid-in Capital | |
| | $63,584 | $(7,713) | $(55,871) | |
| c). | Accounting for Uncertainty in Income Taxes – The Fund has accounting policies regarding recognition and measurement of tax positions taken or expected to be taken on a tax return. The tax returns of the Fund for the prior three fiscal years are open for examination. The Fund has reviewed all open tax years in major jurisdictions and concluded that there is no impact on the Fund’s net assets and no tax liability resulting from unrecognized tax benefits relating to uncertain income tax positions taken or expected to be taken on a tax return. The Fund’s major tax jurisdictions are U.S. federal and Delaware. |
| d). | Income and Expenses – Dividend income is recognized on the ex-dividend date or as soon as information is available to the Fund. Interest income, which includes the amortization of premium and accretion of discount, is recognized on an accrual basis. The Fund is charged for those expenses that are directly attributable to the portfolio, such as advisory, administration, and certain shareholder service fees. Income, expenses (other than expenses attributable to a specific class), and realized and unrealized gains or losses on investments are allocated to each class of shares based on its respective net assets. |
| e). | Distributions to Shareholders – Dividends from net investment income for the Fund, if any, are declared and paid annually, usually in December. Distributions of net realized capital gains, if any, are declared and paid annually, usually in December. |
| f). | Security Transactions – Investment and shareholder transactions are recorded on the trade date. The Fund determines the gain or loss realized from the investment transactions by comparing the original cost of the security lot sold with the net sale proceeds. Discounts and premiums on securities purchased are accreted/amortized over the life of the respective security. |
| g). | Use of Estimates – The preparation of financial statements in conformity with GAAP requires management to make estimates and assumptions that affect the reported amounts of assets and liabilities and disclosure of contingent assets and liabilities at the date of the financial statements and the reported change in net assets during the reporting period. Actual results could differ from those estimates. |
| h). | Share Valuation – The net asset value (“NAV”) per share of the Fund is calculated by dividing the sum of the value of the securities held by the Fund, plus cash or other assets, minus all liabilities (including estimated accrued expenses) by the total number of shares outstanding for the Fund, rounded to the nearest cent. The Fund’s shares will not be priced on days the New York Stock Exchange is closed for trading. The offering and redemption price per share for the Fund is equal to the Fund’s NAV per share. |
| i). | Foreign Currency – Values of investments denominated in foreign currencies, if any, are converted into U.S. dollars using the spot market rate of exchange at the time of valuation. Purchases and sales of investments and income are translated into U.S. dollars using the spot market rate of exchange prevailing on the respective dates of such transactions. The Fund does not isolate the portion of the results of operations resulting from |
HENNESSYFUNDS.COM
| NOTES TO THE FINANCIAL STATEMENTS |
| | fluctuations in foreign exchange rates on investments from fluctuations resulting from changes in the market prices of securities held. Such fluctuations are included with the net realized and unrealized gain or loss on investments. Foreign investments present additional risks due to currency fluctuations, economic and political factors, lower liquidity, government regulations, differences in accounting standards, and other factors. |
| j). | Forward Contracts – The Fund may enter into forward currency contracts to reduce its exposure to changes in foreign currency exchange rates on its foreign holdings and to lock in the U.S. dollar cost of firm purchase and sale commitments for securities denominated in foreign currencies. A forward currency contract is a commitment to purchase or sell a foreign currency at a future date at a negotiated forward rate. The gain or loss arising from the difference between the U.S. dollar cost of the original contract and the value of the foreign currency in U.S. dollars upon closing of such contract is included in net realized gain or loss from foreign currency transactions. During the fiscal year ended October 31, 2016, the Fund did not enter into any forward contracts. |
| k). | Repurchase Agreements – The Fund may enter into repurchase agreements with member banks or security dealers of the Federal Reserve Board whom the investment advisor deems creditworthy. The repurchase price generally equals the price paid by the Fund plus interest negotiated on the basis of current short-term rates. |
| | Securities pledged as collateral for repurchase agreements are held by the custodian bank until the respective agreements mature. Provisions of the repurchase agreements ensure that the market value of the collateral, including accrued interest thereon, is sufficient to cover the repurchase amount in the event of default of the counterparty. If the counterparty defaults and the value of the collateral declines or if the counterparty enters an insolvency proceeding, realization of the collateral by the Fund may be delayed or limited. During the fiscal year ended October 31, 2016, the Fund did not enter into any repurchase agreements. |
| l). | Derivatives – The Fund may invest in, or enter into, derivatives, such as options, futures contracts, options on futures contracts, and swaps, for a variety of reasons, including to hedge certain risks, to provide a substitute for purchasing or selling particular securities, or to increase potential income gain. Derivatives are financial contracts based on an underlying or notional amount, require no initial investment or an initial net investment that is smaller than would normally be required to have a similar response to changes in market factors, and require or permit net settlement. Derivatives may allow the Fund to increase or decrease the level of risk to which the Fund is exposed more quickly and efficiently than transactions in other types of instruments. The main purpose of utilizing derivative instruments is for hedging purposes. |
| | The Fund follows the financial accounting reporting rules as required by the Derivatives and Hedging Topic of the FASB Accounting Standards Codification. Under such rules, the Fund is required to include enhanced disclosure that enables investors to understand how and why an entity uses derivatives, how derivatives are accounted for, and how derivatives instruments affect an entity’s results of operations and financial position. During the fiscal year ended October 31, 2016, the Fund did not hold any derivative instruments. |
| m). | New Accounting Pronouncements – In May 2015, the FASB issued ASU No. 2015-07 “Disclosure for Investments in Certain Entities that Calculate Net Asset Value per Share (or Its Equivalent).” The amendments in ASU No. 2015-07 remove the requirement to categorize within the fair value hierarchy investments measured at NAV and require the disclosure of sufficient information to reconcile the fair value of the |
| HENNESSY FUNDS | 1-800-966-4354 | |
| | remaining assets categorized within the fair value hierarchy to the financial statements. The amendments in ASU No. 2015-07 are effective for fiscal years beginning after December 15, 2015, and interim periods within those fiscal years. Management has reviewed the requirements and believes the adoption of ASU 2015-07 will not have a material impact on the Fund’s financial statements and related disclosures. |
3). SECURITIES VALUATION
The Fund follows authoritative fair valuation accounting standards that establish an authoritative definition of fair value and set out a hierarchy for measuring fair value. These standards require additional disclosures about the various inputs and valuation techniques used to develop the measurements of fair value and a discussion in changes in valuation techniques and related inputs during the period. These inputs are summarized in the three broad levels listed below:
| | Level 1 – | Unadjusted, quoted prices in active markets for identical instruments that the Fund has the ability to access at the date of measurement. |
| | Level 2 – | Other significant observable inputs (including, but not limited to, quoted prices in active markets for similar instruments, quoted prices in markets that are not active for identical or similar instruments, and model-derived valuations in which all significant inputs and significant value drivers are observable in active markets (such as interest rates, prepayment speeds, credit risk curves, default rates, and similar data)). |
| | Level 3 – | Significant unobservable inputs (including the Fund’s own assumptions about what market participants would use to price the asset or liability based on the best available information) when observable inputs are unavailable. |
Following is a description of the valuation techniques applied to the Fund’s major categories of assets and liabilities measured at fair value on a recurring basis.
Equity Securities – Equity securities, including common stocks, preferred stocks, foreign-issued common stocks, exchange-traded funds, closed-end mutual funds, partnerships, rights, and real estate investment trusts, that are traded on a securities exchange for which a last-quoted sales price is readily available will generally be valued at the last sales price as reported by the primary exchange on which the securities are listed. Securities listed on The NASDAQ Stock Market (“NASDAQ”) will generally be valued at the NASDAQ Official Closing Price, which may differ from the last sales price reported. Securities traded on a securities exchange for which a last-quoted sales price is not readily available will generally be valued at the mean between the bid and ask prices. To the extent these securities are actively traded and valuation adjustments are not applied, they are classified in Level 1 of the fair value hierarchy. Securities traded on foreign exchanges generally are not valued at the same time the Fund calculates its NAV because most foreign markets close well before such time. The earlier close of most foreign markets gives rise to the possibility that significant events, including broad market moves, may have occurred in the interim. In certain circumstances, it may be determined that a security needs to be fair valued because it appears that the value of the security might have been materially affected by events occurring after the close of the market in which the security is principally traded, but before the time the Fund calculates its NAV, such as by a development that affects an entire market or region (e.g., weather-related events) or a potentially global development (e.g., a terrorist attack that may be expected to have an effect on investor expectations worldwide).
Registered Investment Companies – Investments in registered investment companies (e.g., mutual funds) are generally priced at the ending NAV provided by the applicable
HENNESSYFUNDS.COM
| NOTES TO THE FINANCIAL STATEMENTS |
registered investment company’s service agent and will be classified in Level 1 of the fair value hierarchy.
Debt Securities – Debt securities, including corporate bonds, asset-backed securities, mortgage-backed securities, municipal bonds, U.S. Treasuries, and U.S. government agency issues, are generally valued at market on the basis of valuations furnished by an independent pricing service that utilizes both dealer-supplied valuations and formula-based techniques. The pricing service may consider recently executed transactions in securities of the issuer or comparable issuers, market price quotations (where observable), bond spreads, and fundamental data relating to the issuer. In addition, the model may incorporate observable market data, such as reported sales of similar securities, broker quotes, yields, bids, offers, and reference data. Certain securities are valued primarily using dealer quotations. These securities are generally classified in Level 2 of the fair value hierarchy.
Short-Term Securities – Short-term equity investments, including money market funds, are valued in the manner specified above. Short-term debt investments with an original term to maturity of 60 days or less are valued at amortized cost, which approximates fair market value. If the original term to maturity of a short-term debt investment exceeded 60 days, then the values as of the 61st day prior to maturity are amortized. Amortized cost is not used if its use would be inappropriate due to credit or other impairments of the issuer, in which case the security’s fair value would be determined, as described below. Short-term securities are generally classified in Level 1 or Level 2 of the fair market hierarchy depending on the inputs used and market activity levels for specific securities.
The Board of Trustees of the Fund (the “Board”) has adopted fair value pricing procedures that are followed when a price for a security is not readily available or if a significant event has occurred that indicates the closing price of a security no longer represents the true value of that security. Fair value pricing determinations are made in good faith in accordance with these procedures. There are numerous criteria that will be given consideration in determining a fair value of a security, such as the trading volume of a security and markets, the value of other like securities, and news events with direct bearing to a security or markets. Fair value pricing results in an estimated price for a security that reflects the amount the Fund might reasonably expect to receive in a current sale. Depending on the relative significance of the valuation inputs, these securities may be classified in either Level 2 or Level 3 of the fair value hierarchy.
The fair valuation of foreign securities may be determined with the assistance of a pricing service using correlations between the movement of prices of such securities and indices of domestic securities and other appropriate indicators, such as closing market prices of relevant American Depositary Receipts or futures contracts. The effect of using fair value pricing is that the Fund’s NAV will reflect the affected portfolio securities’ value as determined by the Board or its designee instead of being determined by the market. Using a fair value pricing methodology to price foreign securities may result in a value that is different from a foreign security’s most recent closing price and from the prices used by other investment companies to calculate their NAVs and are generally considered Level 2 prices in the fair valuation hierarchy. Because the Fund may invest in foreign securities, the value of the Fund’s portfolio securities may change on days when you will not be able to purchase or redeem your shares.
The Board has delegated day-to-day valuation matters to a Valuation Committee comprised of one or more representatives from Hennessy Advisors, Inc., the Fund’s investment advisor. The function of the Valuation Committee is to value securities where current and reliable market quotations are not readily available. All actions taken by the Valuation Committee are reviewed by the Board.
| HENNESSY FUNDS | 1-800-966-4354 | |
The Fund has performed an analysis of all existing investments to determine the significance and character of all inputs to their fair value determination. Various inputs are used in determining the value of the Fund’s investments. The inputs or methodology used for valuing securities are not necessarily an indication of the risk associated with investing in those securities. Details related to the fair valuation hierarchy of the Fund’s securities as of October 31, 2016, are included in the Fund’s Schedule of Investments.
4). INVESTMENT TRANSACTIONS
Purchases and sales of investment securities (excluding government and short-term investments) for the Fund during the fiscal year ended October 31, 2016, were $92,504,457 and $154,862,811, respectively.
There were no purchases or sales/maturities of long-term U.S. government securities for the Fund during the fiscal year ended October 31, 2016.
The Fund is permitted to purchase or sell securities from or to another fund in the Hennessy Funds family of funds (the “Hennessy Funds”) under specified conditions outlined in procedures adopted by the Board of Trustees. The procedures have been designed to ensure that any purchase or sale of securities by the Fund from or to another Hennessy Fund complies with Rule 17a-7 of the Investment Company Act of 1940. For the fiscal year ended October 31, 2016, the Fund did not engage in purchases and sales of securities pursuant to Rule 17a-7 of the Investment Company Act of 1940.
5). INVESTMENT MANAGEMENT FEE AND OTHER TRANSACTIONS WITH AFFILIATES
Hennessy Advisors, Inc. (the “Advisor”) is the investment advisor of the Fund. The Advisor provides the Fund with investment management services under an Investment Advisory Agreement. The Advisor furnishes all investment advice, office space, facilities, and provides most of the personnel needed by the Fund. As compensation for its services, the Advisor is entitled to a monthly fee from the Fund. The fee is based upon the average daily net assets of the Fund at the annual rate of 0.90%. The net investment advisory fees payable by the Fund as of October 31, 2016, were $20,625.
The Board has approved a Shareholder Servicing Agreement for Investor Class shares of the Fund, effective as of February 28, 2015, which was instituted to compensate the Advisor for the non-investment management services it provides to the Fund. The Shareholder Servicing Agreement provides for a monthly fee paid to the Advisor at an annual rate of 0.10% of the average daily net assets of the Fund attributable to Investor Class shares. Shareholder service fees payable by the Fund as of October 31, 2016, were $2,263.
The Fund has adopted a plan pursuant to Rule 12b-1 under the Investment Company Act of 1940, as amended, that authorizes payments in connection with the distribution of the Fund’s shares at an annual rate of up to 0.25% of the Fund’s average daily net assets attributable to Investor Class shares. Even though the authorized rate is up to 0.25%, the Fund has only used up to 0.15% of its average daily net assets attributable to Investor Class shares for such purpose since March 1, 2015. Amounts paid under the plan may be spent on any activities or expenses primarily intended to result in the sale of shares, including, but not limited to, advertising, shareholder account servicing, the printing and mailing of prospectuses to other than current shareholders, the printing and mailing of sales literature, and compensation for sales and marketing activities or to financial institutions and others, such as dealers and distributors.
The Fund has entered into agreements with various brokers, dealers, and financial intermediaries in connection with the sale of shares of the Fund. The agreements provide for periodic payments by the Fund to the brokers, dealers, and financial
HENNESSYFUNDS.COM
| NOTES TO THE FINANCIAL STATEMENTS |
intermediaries for providing certain shareholder maintenance services (sub-transfer agent expenses). These shareholder services include the pre-processing and quality control of new accounts, shareholder correspondence, answering customer inquiries regarding account status, and facilitating shareholder telephone transactions. Fees paid by the Fund to various brokers, dealers, and financial intermediaries during the fiscal year ended October 31, 2016, were $178,051.
U.S. Bancorp Fund Services, LLC (“USBFS”) provides the Fund with administrative, fund accounting, and transfer agent services, and necessary office equipment. As administrator, USBFS is responsible for activities such as (i) preparing various federal and state regulatory filings, reports, and returns for the Fund, (ii) preparing reports and materials to be supplied to the Board, (iii) monitoring the activities of the Fund’s custodian, transfer agent, and accountants, and (iv) coordinating the preparation and payment of the Fund’s expenses and reviewing the Fund’s expense accruals. Fees paid to USBFS during the fiscal year ended October 31, 2016, were $73,601.
U.S. Bank, N.A., an affiliate of USBFS, serves as the Fund’s custodian. Quasar Distributors, LLC acts as the Fund’s principal underwriter in a continuous public offering of the Fund’s shares. Quasar Distributors, LLC is an affiliate of USBFS and U.S. Bank, N.A.
The officers of the Fund are affiliated with the Advisor. Such officers, with the exception of the Chief Compliance Officer and the Senior Compliance Officer, receive no compensation from the Fund for serving in their respective roles. The Fund, along with the other Hennessy Funds, makes reimbursement payments, on an equal basis, to the Advisor for a portion of the salary and benefits associated with the office of the Chief Compliance Officer and for all of the salary and benefits associated with the office of the Senior Compliance Officer. Such amounts are included on the Statement of Operations.
6). GUARANTEES AND INDEMNIFICATIONS
Under the Hennessy Funds’ organizational documents, their officers and trustees are indemnified by the Hennessy Funds against certain liabilities arising out of the performance of their duties to the Hennessy Funds. Additionally, in the normal course of business, the Hennessy Funds enter into contracts with service providers that contain general indemnification clauses. The Fund’s maximum exposure under these arrangements is unknown as this would involve future claims that may be made against the Fund that have not yet occurred. Currently, the Fund expects the risk of loss to be remote.
7). LINE OF CREDIT
The Fund has an uncommitted line of credit with the other Hennessy Funds in the amount of the lesser of (i) $100,000,000 or (ii) 33.33% of each Hennessy Fund’s net assets, or 30% for the Hennessy Gas Utility Fund and 10% for the Hennessy Balanced Fund, intended to provide short-term financing, if necessary, subject to certain restrictions, in connection with shareholder redemptions. The credit facility is with the Hennessy Funds’ custodian bank, U.S. Bank, N.A. Borrowings under this arrangement bear interest at the bank’s prime rate and are secured by all of the Fund’s assets (as to its own borrowings only). During the fiscal year ended October 31, 2016, the Fund had an outstanding average daily balance and a weighted average interest rate of $347,702 and 3,47%, respectively. The maximum amount outstanding for the Fund during the period was $14,077,000. At October 31, 2016, the Fund did not have any borrowings outstanding under the line of credit.
| HENNESSY FUNDS | 1-800-966-4354 | |
8). FEDERAL TAX INFORMATION
As of October 31, 2016, the components of accumulated earnings (losses) for income tax purposes were as follows:
| Cost of investments for tax purposes | | $ | 25,780,118 | |
| Gross tax unrealized appreciation | | $ | 2,655,508 | |
| Gross tax unrealized depreciation | | | (1,539,270 | ) |
| Net tax unrealized appreciation | | $ | 1,116,238 | |
| Undistributed ordinary income | | $ | 188,556 | |
| Undistributed long-term capital gains | | | — | |
| Total distributable earnings | | $ | 188,556 | |
| Other accumulated loss | | $ | (1,792,283 | ) |
| Total accumulated loss | | $ | (487,489 | ) |
The difference between book-basis unrealized appreciation/depreciation (as shown in the Statement of Assets and Liabilities) and tax-basis unrealized appreciation/depreciation (as shown above) is attributable primarily to wash sales.
At October 31, 2016, the Fund had capital loss carryforwards that expire as follows:
$1,792,283 Indefinite ST
At October 31, 2016, the Fund did not defer, on a tax basis, any late year ordinary losses.
During the fiscal years ended October 31, 2016 and 2015, the tax character of distributions paid by the Fund was as follows
| | | Year Ended | | | Year Ended | |
| | | October 31, 2016 | | | October 31, 2015 | |
Ordinary income(1) | | $ | 114,806 | | | $ | 485,376 | |
| Long-term capital gain | | | 9,736,126 | | | | 9,468,170 | |
| | | $ | 9,850,932 | | | $ | 9,953,546 | |
(1) Ordinary income includes short-term gain or loss.
9). EVENTS SUBSEQUENT TO YEAR END
Management has evaluated the Fund’s related events and transactions that occurred subsequent to October 31, 2016, through the date of issuance of the Fund’s financial statements. Management has determined that there were no subsequent events requiring recognition or disclosure in the financial statements.
HENNESSYFUNDS.COM
| NOTES TO THE FINANCIAL STATEMENTS |
(This Page Intentionally Left Blank.)
| HENNESSY FUNDS | 1-800-966-4354 | |
Report of Independent Registered Public Accounting Firm
To the Board of Trustees of Hennessy Funds Trust
and the Shareholders of the Hennessy Large Cap Financial Fund
Novato, CA
We have audited the accompanying statement of assets and liabilities, including the schedule of investments, of the Hennessy Large Cap Financial Fund (the “Fund”), a series of Hennessy Funds Trust, as of October 31, 2016, and the related statement of operations for the year then ended, the statements of changes in net assets for each of the two years in the period then ended, and the financial highlights for each of the five years in the period then ended. These financial statements and financial highlights are the responsibility of the Fund’s management. Our responsibility is to express an opinion on these financial statements and financial highlights based on our audits.
We conducted our audits in accordance with the standards of the Public Company Accounting Oversight Board (United States). Those standards require that we plan and perform the audits to obtain reasonable assurance about whether the financial statements and financial highlights are free of material misstatement. The Fund is not required to have, nor were we engaged to perform, an audit of its internal control over financial reporting. Our audits included consideration of internal control over financial reporting as a basis for designing audit procedures that are appropriate in the circumstances, but not for the purposes of expressing an opinion on the effectiveness of the Fund’s internal control over financial reporting. Accordingly, we express no such opinion. An audit includes examining, on a test basis, evidence supporting the amounts and disclosures in the financial statements. Our procedures included confirmation of securities owned as of October 31, 2016, by correspondence with the custodian and brokers. An audit also includes assessing the accounting principles used and significant estimates made by management, as well as evaluating the overall financial statement presentation. We believe that our audits provide a reasonable basis for our opinion.
In our opinion, the financial statements and financial highlights referred to above present fairly, in all material respects, the financial position of the Hennessy Large Cap Financial Fund as of October 31, 2016, the results of its operations for the year then ended, the changes in its net assets for each of the two years in the period then ended, and the financial highlights for each of the five years in the period then ended, in conformity with accounting principles generally accepted in the United States of America.
TAIT, WELLER & BAKER LLP
Philadelphia, Pennsylvania
December 22, 2016
HENNESSYFUNDS.COM
| REPORT OF INDEPENDENT REGISTERED PUBLIC ACCOUNTING FIRM/TRUSTEES AND OFFICERS |
Trustees and Officers of the Fund (Unaudited)
The business and affairs of the Fund are managed under the direction of the Board of Trustees of the Trust, and the Board of Trustees elects the Officers of the Trust. Beginning in March 2015, the Board of Trustees has from time to time appointed advisers (“Advisers”) to the Board of Trustees, with the intention of having qualified individuals serve in an advisory capacity in order to garner experience in the mutual fund and asset management industry and be considered as potential Trustees in the future. There are currently three Advisers to the Board of Trustees: Brian Alexander, Doug Franklin, and Claire Knoles. As Advisers, Mr. Alexander, Mr. Franklin, and Ms. Knoles attend meetings of the Board and act as non-voting participants. Information pertaining to the Trustees, Advisers, and the Officers of the Trust is set forth below. The Trustees and Officers serve until their successors are duly elected and qualified or until their earlier death, resignation, or removal. Each of the Trustees oversees 16 Hennessy Funds. Unless otherwise indicated, the address of all persons listed below is 7250 Redwood Boulevard, Suite 200, Novato, CA 94945. The Fund’s Statement of Additional Information includes more information about the persons listed below and is available, without charge, upon request by calling 1-800-966-4354.
| | | | Other |
| | | | Directorships |
| | | | Held Outside |
| Name, (Year of Birth), | | | of Fund |
| and Position Held | Start Date | Principal Occupation(s) | Complex During |
with the Trust | of Service | During Past Five Years | Past Five Years(1) |
| | | |
| Disinterested Trustees and Advisers | | |
| | | | |
| J. Dennis DeSousa | January 1996 | Mr. DeSousa is a real estate investor. | None. |
| (1936) | | | |
| Trustee | | | |
| | | | |
| Robert T. Doyle | January 1996 | Mr. Doyle has been the Sheriff of | None. |
| (1947) | | Marin County, California since 1996. | |
| Trustee | | | |
| | | | |
| Gerald P. Richardson | May 2004 | Mr. Richardson is an independent | None. |
| (1945) | | consultant in the securities industry. | |
| Trustee | | | |
| | | | |
| Brian Alexander | March 2015 | Mr. Alexander has been employed | None. |
| (1981) | | by Sutter Health Novato Community | |
| Adviser to the Board | | Hospital since 2012, first as an | |
| | | Assistant Administrator and then, | |
| | | beginning in 2013, as the Chief | |
| | | Administrative Officer. From 2011 | |
| | | through 2012, Mr. Alexander was | |
| | | employed by Sutter Health West Bay | |
| | | Region as the Regional Director of | |
| | | Strategic Decision Support. Prior to | |
| | | that, in 2011, he served as the | |
| | | Director of Managed Care | |
| | | Contracting and also the Director of | |
| | | Compensation, Benefits, and | |
| | | Compliance for the Rehabilitation | |
| | | Institute of Chicago. | |
| HENNESSY FUNDS | 1-800-966-4354 | |
| | | | Other |
| | | | Directorships |
| | | | Held Outside |
| Name, (Year of Birth), | | | of Fund |
| and Position Held | Start Date | Principal Occupation(s) | Complex During |
with the Trust | of Service | During Past Five Years | Past Five Years(1) |
| | | | |
| Doug Franklin | March 2016 | Mr. Franklin is a retired insurance | None. |
| (1964) | | industry executive. From 1987 | |
| Adviser to the Board | | through 2015, he was employed by | |
| | | the Allianz-Fireman’s Fund Insurance | |
| | | Company in various positions, | |
| | | including as its Chief Actuary and | |
| | | Chief Risk Officer. | |
| | | | |
| Claire Knoles | December 2015 | Ms. Knoles is a founder of Kiosk and | None. |
| (1974) | | has served as its Chief Operating | |
| Adviser to the Board | | Officer since 2004. Kiosk is a full | |
| | | service marketing agency with | |
| | | offices in the San Francisco Bay | |
| | | Area, Toronto, and Liverpool, UK. | |
| | | | |
Interested Trustee(2) | | | |
| | | | |
| Neil J. Hennessy | January 1996 as | Mr. Hennessy has been employed by | Hennessy |
| (1956) | a Trustee and | Hennessy Advisors, Inc. since 1989 | Advisors, Inc. |
| Trustee, Chairman of | June 2008 as | and currently serves as its President, | |
| the Board, Chief | an Officer | Chairman and Chief Executive Officer. | |
| Investment Officer, | | | |
| Portfolio Manager, | | | |
| and President | | | |
| Name, (Year of Birth), | | |
| and Position Held | Start Date | Principal Occupation(s) |
with the Trust | of Service | During Past Five Years |
| | | |
| Officers | | |
| | | |
| Teresa M. Nilsen | January 1996 | Ms. Nilsen has been employed by Hennessy Advisors, Inc. |
| (1966) | | since 1989 and currently serves as its Executive Vice President, |
| Executive Vice President | | Chief Operations Officer, Chief Financial Officer, and Secretary. |
| and Treasurer | | |
| | | |
| Daniel B. Steadman | March 2000 | Mr. Steadman has been employed by Hennessy Advisors, Inc. |
| (1956) | | since 2000 and currently serves as its Executive Vice President |
| Executive Vice President | | and Chief Compliance Officer. |
| and Secretary | | |
| | | |
| Jennifer Cheskiewicz | June 2013 | Ms. Cheskiewicz has been employed by Hennessy Advisors, Inc. |
| (1977) | | as its General Counsel since June 2013. She previously served |
| Senior Vice President and | | as in-house counsel to Carlson Capital, L.P., an SEC-registered |
| Chief Compliance Officer | | investment advisor to several private funds, from |
| | | February 2010 to May 2013. |
| | | |
| Brian Carlson | December 2013 | Mr. Carlson has been employed by Hennessy Advisors, Inc. |
| (1972) | | since December 2013. Mr. Carlson was previously a co-founder |
| Senior Vice President and | | and principal of Trivium Consultants, LLC from February 2011 |
| Head of Distribution | | through November 2013. |
HENNESSYFUNDS.COM
| TRUSTEES AND OFFICERS OF THE FUND |
| Name, (Year of Birth), | | |
| and Position Held | Start Date | Principal Occupation(s) |
with the Trust | of Service | During Past Five Years |
| | | |
| David Ellison | October 2012 | Mr. Ellison has been employed by Hennessy Advisors, Inc. since |
(1958)(3) | | October 2012. He has served as a Portfolio Manager of the |
| Senior Vice President and | | Hennessy Small Cap Financial Fund, the Hennessy Large Cap |
| Portfolio Manager | | Financial Fund, and the Hennessy Technology Fund since |
| | | inception. Prior to that, Mr. Ellison served as Director, CIO and |
| | | President of FBR Fund Advisers, Inc. from December |
| | | 1999 to October 2012. |
| | | |
| Brian Peery | March 2003 as | Mr. Peery has been employed by Hennessy Advisors, Inc. since |
| (1969) | an Officer and | 2002. He has served as a Portfolio Manager of the Hennessy |
| Senior Vice President and | February 2011 | Cornerstone Growth Fund, the Hennessy Cornerstone Mid Cap |
| Portfolio Manager | as a Co-Portfolio | 30 Fund, the Hennessy Cornerstone Large Growth Fund, the |
| | Manager or | Hennessy Cornerstone Value Fund, the Hennessy Total Return |
| | Portfolio Manager | Fund, and the Hennessy Balanced Fund since October 2014. |
| | | He served as Co-Portfolio Manager of the same funds from |
| | | February 2011 through September 2014. Mr. Peery has also |
| | | served as a Portfolio Manager of the Hennessy Gas Utility Fund |
| | | since February 2015. |
| | | |
| Winsor (Skip) Aylesworth | October 2012 | Mr. Aylesworth has been employed by Hennessy Advisors, Inc. |
(1947)(3) | | since October 2012. He has served as a Portfolio Manager of |
| Vice President and | | the Hennessy Gas Utility Fund since 1998 and as a Portfolio |
| Portfolio Manager | | Manager of the Hennessy Technology Fund since inception. |
| | | Prior to that, Mr. Aylesworth served as Executive Vice President |
| | | of FBR Fund Advisers, Inc. from 1999 to October 2012. |
| | | |
| Ryan Kelley | March 2013 | Mr. Kelley has been employed by Hennessy Advisors, Inc. since |
(1972)(4) | | October 2012. He has served as a Portfolio Manager of the |
| Vice President and | | Hennessy Gas Utility Fund, the Hennessy Small Cap Financial |
| Portfolio Manager | | Fund, and the Hennessy Large Cap Financial Fund since |
| | | October 2014. He served as Co-Portfolio Manager of the same |
| | | funds from March 2013 through September 2014, and as a |
| | | Portfolio Analyst for the Hennessy Funds from October 2012 |
| | | through February 2013. Prior to that, Mr. Kelley served as |
| | | Portfolio Manager of FBR Fund Advisers, Inc. from |
| | | January 2008 to October 2012. |
_______________
(1) | Messrs. DeSousa, Doyle, Hennessy, and Richardson previously served on the Board of Directors of Hennessy Mutual Funds, Inc. (“HMFI”), The Hennessy Funds, Inc. (“HFI”), and Hennessy SPARX Funds Trust (“HSFT”). Pursuant to an internal reorganization effective as of February 28, 2014, the series of HFMI, HFI, and HSFT were reorganized into corresponding series of Hennessy Funds Trust that mirrored them. Subsequent to the reorganization, HFMI, HFI, and HSFT were dissolved. |
(2) | Mr. Hennessy is considered an “interested person,” as defined in the Investment Company Act of 1940, as amended, because he is an officer of the Hennessy Funds. |
(3) | The address of these officers is 101 Federal Street, Suite 1900, Boston, MA 02110. |
(4) | The address of this officer is 1340 Environ Way, Suite 305, Chapel Hill, NC 27517. |
| HENNESSY FUNDS | 1-800-966-4354 | |
Expense Example (Unaudited)
October 31, 2016
As a shareholder of the Fund, you incur two types of costs: (1) transaction costs, including sales charges (loads) on purchase payments, reinvested dividends, or other distributions; redemption fees; and exchange fees; and (2) ongoing costs, including management fees; service fees; and other Fund expenses. This Example is intended to help you understand your ongoing costs (in dollars) of investing in the Fund and to compare these costs with the ongoing costs of investing in other mutual funds. The Example is based on an investment of $1,000 invested at the beginning of the period and held for the entire period from May 1, 2016, through October 31, 2016.
Actual Expenses
The first line of the table below under the “Investor Class” and “Institutional Class” headings provides information about actual account values and actual expenses. Although the Fund charges no sales loads or transaction fees, you will be assessed fees for outgoing wire transfers, returned checks and stop payment orders at prevailing rates charged by U.S. Bancorp Fund Services, LLC, the Fund’s transfer agent. If you request that a redemption be made by wire transfer, currently a $15 fee is charged by the Fund’s transfer agent. IRA accounts will be charged a $15 annual maintenance fee. The example below includes, but is not limited to, management fees, shareholder servicing fees, fund accounting, custody, and transfer agent fees. However, the example below does not include portfolio trading commissions and related expenses, and other extraordinary expenses as determined under generally accepted accounting principles. You may use the information in this line, together with the amount you invested, to estimate the expenses that you paid over the period. Simply divide your account value by $1,000 (for example, an $8,600 account value divided by $1,000 = 8.6), then multiply the result by the number in the first line of the table under the “Investor Class” and “Institutional Class” headings in the column entitled “Expenses Paid During Period” to estimate the expenses you paid on your account during this period.
Hypothetical Example for Comparison Purposes
The second line of the table below under the “Investor Class” and “Institutional Class” headings provides information about hypothetical account values and hypothetical expenses based on the Fund’s actual expense ratios and an assumed rate of return of 5% per year before expenses, which is not the Fund’s actual return. The hypothetical account values and expenses may not be used to estimate the actual ending account balance or expenses you paid for the period. You may use this information to compare the ongoing costs of investing in the Fund and other funds. To do so, compare this 5% hypothetical example with the 5% hypothetical examples that appear in the shareholder reports of the other funds. Please note that the expenses shown in the table are meant to highlight your ongoing costs only and do not reflect any transactional costs, such as sales charges (loads), or exchange fees. Therefore, the second line of the table under the “Investor Class” and “Institutional Class” headings is useful in comparing ongoing costs only, and will not help you determine the relative total costs of owning different funds. In addition, if these transactional costs were included, your costs would have been higher.
HENNESSYFUNDS.COM
| | | | Expenses Paid |
| | Beginning | Ending | During Period(1) |
| | Account Value | Account Value | May 1, 2016 – |
| | May 1, 2016 | October 31, 2016 | October 31, 2016 |
| Investor Class | | | |
| Actual | $1,000.00 | $1,039.10 | $8.82 |
| Hypothetical (5% return before expenses) | $1,000.00 | $1,016.49 | $8.72 |
| | | | |
| Institutional Class | | | |
| Actual | $1,000.00 | $1,041.00 | $6.72 |
| Hypothetical (5% return before expenses) | $1,000.00 | $1,018.55 | $6.65 |
(1) | Expenses are equal to the Fund’s annualized expense ratio of 1.72% for Investor Class shares or 1.31% for Institutional Class shares, as applicable, multiplied by the average account value over the period, multiplied by 184/366 days (to reflect one-half year period). |
| HENNESSY FUNDS | 1-800-966-4354 | |
How to Obtain a Copy of the Fund’s
Proxy Voting Policy and Proxy Voting Records
A description of the policies and procedures the Fund uses to determine how to vote proxies relating to portfolio securities is available without charge: (1) by calling 1-800-966-4354; (2) on the Hennessy Funds’ website at hennessyfunds.com/proxy-voting/policy.fs; or (3) on the U.S. Securities and Exchange Commission’s website at www.sec.gov. The Fund’s proxy voting record is available without charge on both the Hennessy Funds’ website at hennessyfunds.com/proxy-voting/vote.fs and the SEC’s website at www.sec.gov no later than August 31 for the prior 12 months ending June 30.
Quarterly Filings on Form N-Q
The Fund files its complete schedule of portfolio holdings with the SEC for the first and third quarters of each fiscal year on Form N-Q. The Fund’s Form N-Q will be available on the SEC’s website at www.sec.gov. The Fund’s Form N-Q may be reviewed and copied at the SEC’s Public Reference Room in Washington, DC and information on the operation of the Public Reference Room may be obtained by calling 1-800-SEC-0330. Information included in the Fund’s N-Q will also be available upon request by calling 1-800-966-4354.
Federal Tax Distribution Information
(Unaudited)
For the fiscal year ended October 31, 2016, certain dividends paid by the Fund may be subject to a maximum tax rate of 23.8%, as provided for by the Jobs and Growth Tax Relief Reconciliation Act of 2003. The percentage of dividends declared from ordinary income designated as qualified dividend income was 100%.
For corporate shareholders, the percent of ordinary income distributions that qualified for the corporate dividends received deduction for the fiscal year ended October 31, 2016, was 100%.
The percentage of taxable ordinary income distributions that are designated as short-term capital gain distributions under Section 871(k)(2)(C) of the Internal Revenue Code of 1986, as amended, for the Fund was 0%.
Householding
To help keep the Fund’s costs as low as possible, we generally deliver a single copy of most financial reports and prospectuses to shareholders who share an address, even if the accounts are registered under different names. This process, known as “householding,” does not apply to account statements. You may, of course, request an individual copy of a prospectus or financial report at any time. If you would like to receive separate mailings, please call the Administrator at 1-800-261-6950 or 1-414-765-4124 and we will begin individual delivery within 30 days of your request. If your account is held through a financial institution or other intermediary, please contact them directly to request individual delivery.
HENNESSYFUNDS.COM
| PROXY VOTING — PRIVACY POLICY |
Privacy Policy
We collect the following non-public personal information about you:
| | • | information we receive from you on or in applications or other forms, correspondence, or conversations, including, but not limited to, your name, address, phone number, social security number, assets, income, and date of birth; and |
| | • | information about your transactions with us, our affiliates, or others, including, but not limited to, your account number and balance, payment history, parties to transactions, cost basis information, and other financial information. |
We do not disclose any non-public personal information about our current or former shareholders to non-affiliated third parties, except as permitted by law. For example, we are permitted by law to disclose all of the information we collect, as described above, to our Transfer Agent to process your transactions. Furthermore, we restrict access to your non-public personal information to those persons who require such information to provide products or services to you. We maintain physical, electronic, and procedural safeguards that comply with federal standards to guard your non-public personal information.
In the event that you hold shares of the Fund through a financial intermediary, including, but not limited to, a broker-dealer, bank or trust company, the privacy policy of your financial intermediary would govern how your non-public personal information would be shared with non-affiliated third parties.
| HENNESSY FUNDS | 1-800-966-4354 | |
For information, questions or assistance, please call
The Hennessy Funds
1-800-966-4354 or 1-415-899-1555
INVESTMENT ADVISOR
Hennessy Advisors, Inc.
7250 Redwood Blvd., Suite 200
Novato, California 94945
ADMINISTRATOR,
TRANSFER AGENT,
DIVIDEND PAYING AGENT &
SHAREHOLDER SERVICING AGENT
U.S. Bancorp Fund Services, LLC
P.O. Box 701
Milwaukee, Wisconsin 53201-0701
CUSTODIAN
U.S. Bank N.A.
Custody Operations
1555 North River Center Dr., Suite 302
Milwaukee, Wisconsin 53212
TRUSTEES
Neil J. Hennessy
Robert T. Doyle
J. Dennis DeSousa
Gerald P. Richardson
COUNSEL
Foley & Lardner LLP
777 East Wisconsin Avenue
Milwaukee, Wisconsin 53202-5306
INDEPENDENT REGISTERED
PUBLIC ACCOUNTING FIRM
Tait, Weller & Baker LLP
1818 Market Street, Suite 2400
Philadelphia, Pennsylvania 19103
DISTRIBUTOR
Quasar Distributors, LLC
615 East Michigan Street
Milwaukee, Wisconsin 53202
hennessyfunds.com | 1-800-966-4354
This report has been prepared for shareholders and may be distributed to
others only if preceded or accompanied by a current prospectus.
ANNUAL REPORT
OCTOBER 31, 2016
HENNESSY TECHNOLOGY FUND
Investor Class HTECX
Institutional Class HTCIX
hennessyfunds.com | 1-800-966-4354
(This Page Intentionally Left Blank.)
Contents
| Letter to Shareholders | 2 |
| Performance Overview | 4 |
| Financial Statements | |
| Schedule of Investments | 7 |
| Statement of Assets and Liabilities | 12 |
| Statement of Operations | 13 |
| Statements of Changes in Net Assets | 15 |
| Financial Highlights | 16 |
| Notes to the Financial Statements | 20 |
| Report of Independent Registered Public Accounting Firm | 30 |
| Trustees and Officers of the Fund | 31 |
| Expense Example | 34 |
| Proxy Voting | 36 |
| Quarterly Filings on Form N-Q | 36 |
| Householding | 36 |
| Privacy Policy | 37 |
| HENNESSY FUNDS | 1-800-966-4354 | |
December 2016
Dear Hennessy Funds Shareholder:
Over the past year investors here in the U.S. and around the world have weathered a great deal of turmoil, especially in the political arena. Foremost, the bitterly divisive and all-consuming U.S. Presidential election, with its unanticipated outcome, is finally behind us. While the equity markets were jittery at first, they now appear more comfortable with the prospect of a Trump presidency and seem to be looking forward to diminished government regulation and intervention.
The Brexit vote in the U.K. cast a shadow over the European Union’s future. There remains uncertainty over the details and timing of the break and the economic consequences for both Britain and Europe, but early signs suggest the impact on growth in Britain will not be as severe as initially feared.
Additionally, uncertainty over whether the Federal Reserve would raise short-term interest rates has hung over the economy for well over a year now. The effects that higher rates could have on growth, the strength of the U.S. Dollar, corporate profits and loan supply and demand seem to have weighed heavily on investors, causing paralysis and money to remain on the sidelines of the market.
Despite all these concerns, U.S. equity markets have pushed higher, with both the Dow Jones Industrial Average and S&P 500 Index posting returns of approximately 5% during the twelve-month period ended October 31, 2016. The U.S. economy has continued to grow at a respectable annual rate of about 2%, and corporate profits have started to move higher. Today, as of mid-December, bond and Treasury yields have risen a bit from record lows just this summer, and the bond market is finishing the year on slightly rocky footing. Bond yields are still very low relative to historical averages, while the prospective PE multiples for the Dow Jones Industrial Average and S&P 500 Index are just above long-term averages at 18.0x and 18.9x, respectively. We believe that equity valuations could go considerably higher and still be at appropriate levels relative to bond yields. And, while we do expect the Fed to raise interest rates in the coming year, we believe that inflation will stay under control, so that short-term interest rates will not have to rise too fast or too far.
As I reflect over the past twelve months, what I realize is that many of the worries this year are not new. For the past several years, American businesses have operated in an environment characterized by highly partisan politics, mounting regulations, uncertainty over interest rates, and a lack of clarity regarding taxes and healthcare costs. Despite all these headwinds, U.S. corporations have been incredibly resilient and found ways to impress investors. If the newly elected administration follows through on campaign promises of reigning in regulation, lowering taxes for corporations and individuals, or reforming healthcare to drive down costs, then companies, which are already lean, should be able to post higher profits. And, that growth should lead to more jobs and a stronger economy, potentially creating a very positive cycle going forward.
With the bull market in U.S. equities entering its ninth year, many believe the economy is due for a recession and the market is due for a downturn. But, the euphoria that usually accompanies a peak in the market is absent. Since the recovery began after the financial crisis, I have found myself pondering the bull run of 1982 to 2000, powered, in part, by a significant increase in valuations. I believe today’s market displays the fundamentals to sustain a similarly strong and lengthy bull market. Meanwhile, companies are largely profitable and many corporate balance sheets are cash-rich, with
HENNESSYFUNDS.COM
relatively little debt. Unemployment is low and real wages are rising, helping to drive consumption. We are hopeful that these factors will provide support for positive market returns in the year to come.
Thank you for your continued confidence and investment in our funds. If you have any questions or would like to speak with us directly, please don’t hesitate to call us at (800) 966-4354.
Best regards,
Neil J. Hennessy
President and Chief Investment Officer
Past performance does not guarantee future results.
Mutual fund investing involves risk. Principal loss is possible.
Opinions expressed are those of Neil Hennessy and are subject to change, are not guaranteed and should not be considered investment advice.
The Dow Jones Industrial Average and S&P 500 Index are unmanaged indices commonly used to measure the performance of U.S. stocks. One cannot invest directly in an index.
PE, or price to earnings, is calculated by dividing a company’s market price per share by its earnings per share.
| HENNESSY FUNDS | 1-800-966-4354 | |
Performance Overview (Unaudited)
CHANGE IN VALUE OF $10,000 INVESTMENT
This graph illustrates the performance of an initial investment of $10,000 made in the Fund ten years ago and assumes the reinvestment of dividends.
AVERAGE ANNUAL TOTAL RETURN FOR PERIODS ENDED OCTOBER 31, 2016
| | One | Five | Ten |
| | Year | Years | Years |
| Hennessy Technology Fund – | | | |
| Investor Class (HTECX) | 2.99% | 7.81% | 4.21% |
| Hennessy Technology Fund – | | | |
Institutional Class (HTCIX)(1) | 3.40% | 8.15% | 4.40% |
| NASDAQ Composite Index | 3.97% | 15.58% | 9.38% |
| S&P 500 Index | 4.51% | 13.57% | 6.70% |
Expense ratios: 3.14% (Investor Class); 2.77% (Institutional Class)
Performance data quoted represents past performance; past performance does not guarantee future results. The investment return and principal value of an investment will fluctuate so that an investor’s shares, when redeemed, may be worth more or less than their original cost. The performance graph and table do not reflect the deduction of taxes that a shareholder would pay on Fund distributions or the redemption of Fund shares. Current performance of the Fund may be lower or higher than the performance quoted. Performance data current to the most recent month end may be obtained by visiting hennessyfunds.com. Performance for periods prior to October 26, 2012 is that of the FBR Technology Fund.
The expense ratios presented are from the most recent prospectus.
(1) | The inception date of Institutional Class shares is March 12, 2010. Performance shown prior to the inception of Institutional Class shares reflects the performance of Investor Class shares and includes expenses that are not applicable to and are higher than those of Institutional Class shares. |
PERFORMANCE NARRATIVE
Portfolio Managers Winsor H. (Skip) Aylesworth and David H. Ellison
Performance:
For the twelve-month period ended October 31, 2016, the Investor Class of the Hennessy Technology Fund returned 2.99%, underperforming the NASDAQ Composite Index and the S&P 500 Index, which returned 3.97% and 4.51%, respectively, for the period.
HENNESSYFUNDS.COM
Sector allocation among the various sub-sectors of technology was important in determining overall performance. The Fund’s investment in large-cap technology stocks and consumer-oriented technology stocks were the largest positive contributors to the Fund’s performance. Healthcare and Biotechnology sectors were the largest detractors from performance over the period.
On an individual stock basis, major positive contributors to the Fund’s performance included Tencent Holdings Ltd., a Chinese internet/gaming site, Facebook, Inc. Class A, the largest domestic social media site, Amazon.com, Inc., an online retailer, and Alibaba Group Holding Ltd., a Chinese internet retailer. We continue to hold all the companies mentioned.
Portfolio Strategy:
The Fund’s investment strategy is based on identifying technology-related stocks with a history of growing revenue, profit and tangible book value. We focus on companies that we believe have strong business models and sustainable competitive advantages, which are difficult characteristics to find sometimes in an industry where innovation moves so quickly. We believe the Fund’s holdings are representative of the Technology sector as a whole. The Fund owns not only large, well-known names, but also a collection of smaller companies that are growing quickly. We think this approach meets our goal of offering a conservative way to invest in a highly volatile area of the market.
Investment Outlook:
The Technology sector has performed well over the past twelve months, and we expect the sector should continue to deliver positive returns to investors in the coming year. Valuations, however, are higher than they were and in an environment of rising interest rates, we do not expect PE multiples to rise further. We expect high-growth areas of the technology industry, particularly software and cyber-security, to continue to post strong earnings growth and for this growth to drive share price appreciation. Hardware companies, however, appear to us be in limbo awaiting the next important product cycle.
We continue to believe the Fund offers investors exposure to companies that are working on innovative solutions to common problems, developing products to increase productivity and bringing new and attractive consumer and industrial products to market. We remain confident and optimistic for the future.
_______________
Opinions expressed are those of the Portfolio Managers as of the date written and are subject to change, are not guaranteed, and should not be considered investment advice or an indication of trading intent.
The NASDAQ Composite Index is a broad-based capitalization-weighted index of all the NASDAQ National Market and Small Cap stocks. The S&P 500 Index is an unmanaged index commonly used to measure the performance of U.S. stocks. One cannot invest directly in an index.
The Fund is non-diversified, meaning it may concentrate its assets in fewer individual holdings than a diversified fund, making it more exposed to individual stock volatility than a diversified fund. Investments are focused in the technology industry; sector funds may be subject to a higher degree of market risk. Investments in foreign securities may involve political, economic and currency risks, greater volatility and differences in accounting methods. The Fund invests in small and medium sized companies, which may have more limited liquidity and greater volatility compared to larger companies. Please see the Fund’s prospectus for a more complete discussion of these and other risks.
Earnings growth is not a measure of the Fund’s future performance.
| HENNESSY FUNDS | 1-800-966-4354 | |
References to specific securities should not be considered a recommendation to buy or sell any security. Fund holdings and sector allocations are subject to change. Please refer to the Schedule of Investments included in this report for additional portfolio information.
Tangible book value is a method of valuing a company by measuring its equity after removing any intangible assets. PE, or price to earnings, is calculated by dividing a company’s market price per share by its earnings per share.
HENNESSYFUNDS.COM
| PERFORMANCE OVERVIEW/SCHEDULE OF INVESTMENTS |
Financial Statements
Schedule of Investments as of October 31, 2016 |
HENNESSY TECHNOLOGY FUND
(% of Net Assets)
| TOP TEN HOLDINGS (EXCLUDING CASH/CASH EQUIVALENTS) | % NET ASSETS |
| | |
| Alibaba Group Holding Ltd. | 4.09% |
| | |
| Alphabet, Inc., Class C | 4.03% |
| | |
| Amazon.com, Inc. | 3.96% |
| | |
| Facebook, Inc. | 3.66% |
| | |
| Tencent Holdings Ltd. | 3.58% |
| | |
| Apple, Inc. | 3.55% |
| | |
| Visa, Inc., Class A | 3.31% |
| | |
| Intel Corp. | 2.97% |
| | |
| Oracle Corp. | 2.93% |
| | |
| Cisco Systems, Inc. | 2.86% |
Note: For presentation purposes, the Fund has grouped some of the industry categories. For purposes of categorizing securities for compliance with section 8(b)(1) of the Investment Company Act of 1940, as amended, the Fund uses more specific industry classifications.
| HENNESSY FUNDS | 1-800-966-4354 | |
| | COMMON STOCKS – 94.07% | | Number | | | | | | % of | |
| | | | of Shares | | | Value | | | Net Assets | |
| | Consumer Discretionary – 9.91% | | | | | | | | | |
| | Amazon.com, Inc. (a) | | | 191 | | | $ | 150,856 | | | | 3.96 | % |
| | Ctrip.com International Ltd. – ADR (a) (b) | | | 835 | | | | 36,865 | | | | 0.97 | % |
| | Etsy, Inc. (a) | | | 2,705 | | | | 35,111 | | | | 0.92 | % |
| | Netflix, Inc. (a) | | | 295 | | | | 36,837 | | | | 0.97 | % |
| | priceline.com, Inc. (a) | | | 34 | | | | 50,124 | | | | 1.31 | % |
| | Tesla Motors, Inc. (a) | | | 180 | | | | 35,591 | | | | 0.93 | % |
| | Wayfair, Inc., Class A (a) | | | 970 | | | | 32,330 | | | | 0.85 | % |
| | | | | | | | | 377,714 | | | | 9.91 | % |
| | Health Care – 11.17% | | | | | | | | | | | | |
| | Alexion Pharmaceuticals, Inc. (a) | | | 287 | | | | 37,454 | | | | 0.98 | % |
| | Amgen, Inc. | | | 529 | | | | 74,674 | | | | 1.96 | % |
| | Biogen, Inc. (a) | | | 155 | | | | 43,428 | | | | 1.14 | % |
| | Celgene Corp. (a) | | | 549 | | | | 56,097 | | | | 1.47 | % |
| | DexCom, Inc. (a) | | | 435 | | | | 34,034 | | | | 0.89 | % |
| | Gilead Sciences, Inc. | | | 943 | | | | 69,433 | | | | 1.82 | % |
| | McKesson Corp. | | | 288 | | | | 36,625 | | | | 0.96 | % |
| | Regeneron Pharmaceuticals, Inc. (a) | | | 98 | | | | 33,812 | | | | 0.89 | % |
| | Thermo Fisher Scientific, Inc. | | | 275 | | | | 40,433 | | | | 1.06 | % |
| | | | | | | | | 425,990 | | | | 11.17 | % |
| | Industrials – 5.33% | | | | | | | | | | | | |
| | 3M Co. | | | 415 | | | | 68,600 | | | | 1.80 | % |
| | Danaher Corp. | | | 486 | | | | 38,175 | | | | 1.00 | % |
| | Fortive Corp. | | | 740 | | | | 37,777 | | | | 0.99 | % |
| | Honeywell International, Inc. | | | 535 | | | | 58,679 | | | | 1.54 | % |
| | | | | | | | | 203,231 | | | | 5.33 | % |
| | Information Technology – 66.75% | | | | | | | | | | | | |
| | Activision Blizzard, Inc. | | | 850 | | | | 36,694 | | | | 0.96 | % |
| | Adobe Systems, Inc. (a) | | | 350 | | | | 37,628 | | | | 0.99 | % |
| | Alibaba Group Holding Ltd. – ADR (a) (b) | | | 1,535 | | | | 156,094 | | | | 4.09 | % |
| | Alphabet, Inc., Class C (a) | | | 196 | | | | 153,770 | | | | 4.03 | % |
| | Apple, Inc. | | | 1,191 | | | | 135,226 | | | | 3.55 | % |
| | Baidu, Inc. – ADR (a) (b) | | | 195 | | | | 34,488 | | | | 0.90 | % |
| | Broadcom Ltd. (b) | | | 276 | | | | 46,997 | | | | 1.23 | % |
| | Cirrus Logic, Inc. (a) | | | 645 | | | | 34,817 | | | | 0.91 | % |
The accompanying notes are an integral part of these financial statements.
HENNESSYFUNDS.COM
| | COMMON STOCKS | | Number | | | | | | % of | |
| | | | of Shares | | | Value | | | Net Assets | |
| | Information Technology (Continued) | | | | | | | | | |
| | Cisco Systems, Inc. | | | 3,555 | | | $ | 109,067 | | | | 2.86 | % |
| | Cognizant Technology Solutions Corp., Class A (a) | | | 675 | | | | 34,661 | | | | 0.91 | % |
| | Criteo SA – ADR (a) (b) | | | 1,065 | | | | 38,500 | | | | 1.01 | % |
| | eBay, Inc. (a) | | | 1,165 | | | | 33,214 | | | | 0.87 | % |
| | Ellie Mae, Inc. (a) | | | 355 | | | | 37,591 | | | | 0.99 | % |
| | Fabrinet (a) (b) | | | 910 | | | | 34,544 | | | | 0.91 | % |
| | Facebook, Inc. (a) | | | 1,065 | | | | 139,504 | | | | 3.66 | % |
| | Fitbit, Inc. (a) | | | 2,575 | | | | 34,144 | | | | 0.90 | % |
| | Infosys Ltd. – ADR (b) | | | 2,310 | | | | 35,251 | | | | 0.92 | % |
| | Intel Corp. | | | 3,245 | | | | 113,153 | | | | 2.97 | % |
| | Jinkosolar Holding Co. Ltd. – ADR (a) (b) | | | 2,366 | | | | 36,460 | | | | 0.96 | % |
| | Kulicke and Soffa Industries, Inc. (a) | | | 2,600 | | | | 34,424 | | | | 0.90 | % |
| | MasterCard, Inc., Class A | | | 775 | | | | 82,940 | | | | 2.18 | % |
| | Microsemi Corp. (a) | | | 900 | | | | 37,917 | | | | 0.99 | % |
| | MKS Instruments, Inc. | | | 695 | | | | 35,063 | | | | 0.92 | % |
| | NetEase, Inc. – ADR (b) | | | 145 | | | | 37,264 | | | | 0.98 | % |
| | New Relic, Inc. (a) | | | 1,010 | | | | 36,815 | | | | 0.97 | % |
| | NXP Semiconductors NV (a) (b) | | | 345 | | | | 34,500 | | | | 0.91 | % |
| | Oracle Corp. | | | 2,910 | | | | 111,802 | | | | 2.93 | % |
| | Palo Alto Networks, Inc. (a) | | | 230 | | | | 35,381 | | | | 0.93 | % |
| | PayPal Holdings, Inc. (a) | | | 892 | | | | 37,161 | | | | 0.97 | % |
| | Proofpoint, Inc. (a) | | | 487 | | | | 38,171 | | | | 1.00 | % |
| | Pure Storage, Inc. (a) | | | 2,635 | | | | 32,516 | | | | 0.85 | % |
| | salesforce.com, Inc. (a) | | | 482 | | | | 36,227 | | | | 0.95 | % |
| | SAP SE – ADR (b) | | | 845 | | | | 74,225 | | | | 1.95 | % |
| | ServiceNow, Inc. (a) | | | 400 | | | | 35,164 | | | | 0.92 | % |
| | Silicon Motion Technology Corp. – ADR (b) | | | 820 | | | | 33,300 | | | | 0.87 | % |
| | Splunk, Inc. (a) | | | 610 | | | | 36,716 | | | | 0.96 | % |
| | Square, Inc., Class A (a) | | | 3,260 | | | | 36,512 | | | | 0.96 | % |
| | SS&C Technologies Holdings, Inc. | | | 1,155 | | | | 36,879 | | | | 0.97 | % |
| | Tencent Holdings Ltd. – ADR (b) | | | 5,150 | | | | 136,630 | | | | 3.58 | % |
| | Texas Instruments, Inc. | | | 690 | | | | 48,887 | | | | 1.28 | % |
| | Visa, Inc., Class A | | | 1,530 | | | | 126,240 | | | | 3.31 | % |
| | VMware, Inc., Class A (a) | | | 505 | | | | 39,693 | | | | 1.04 | % |
The accompanying notes are an integral part of these financial statements.
| HENNESSY FUNDS | 1-800-966-4354 | |
| | COMMON STOCKS | | Number | | | | | | % of | |
| | | | of Shares | | | Value | | | Net Assets | |
| | Information Technology (Continued) | | | | | | | | | |
| | Web.com Group, Inc. (a) | | | 2,075 | | | $ | 33,408 | | | | 0.88 | % |
| | Workday, Inc., Class A (a) | | | 410 | | | | 35,539 | | | | 0.93 | % |
| | | | | | | | | 2,545,177 | | | | 66.75 | % |
| | Telecommunication Services – 0.91% | | | | | | | | | | | | |
| | T- Mobile US, Inc. (a) | | | 695 | | | | 34,562 | | | | 0.91 | % |
| | | | | | | | | | | | | | |
| | Total Common Stocks | | | | | | | | | | | | |
| | (Cost $3,265,953) | | | | | | | 3,586,674 | | | | 94.07 | % |
| | | | | | | | | | | | | | |
| | REITS – 0.94% | | | | | | | | | | | | |
| | | | | | | | | | | | | | |
| | Financials – 0.94% | | | | | | | | | | | | |
| | Equinix, Inc. | | | 100 | | | | 35,728 | | | | 0.94 | % |
| | | | | | | | | | | | | | |
| | Total REITS | | | | | | | | | | | | |
| | (Cost $38,241) | | | | | | | 35,728 | | | | 0.94 | % |
| | | | | | | | | | | | | | |
| | SHORT-TERM INVESTMENTS – 7.44% | | | | | | | | | | | | |
| | | | | | | | | | | | | | |
| | Money Market Funds – 7.44% | | | | | | | | | | | | |
| | Fidelity Government Portfolio, Institutional Class, 0.27% (c) | | | 192,000 | | | | 192,000 | | | | 5.04 | % |
| | The Government & Agency Portfolio, 0.29% (c) | | | 91,721 | | | | 91,721 | | | | 2.40 | % |
| | | | | | | | | 283,721 | | | | 7.44 | % |
| | | | | | | | | | | | | | |
| | Total Short-Term Investments | | | | | | | | | | | | |
| | (Cost $283,721) | | | | | | | 283,721 | | | | 7.44 | % |
| | | | | | | | | | | | | | |
| | Total Investments | | | | | | | | | | | | |
| | (Cost $3,587,915) – 102.45% | | | | | | | 3,906,123 | | | | 102.45 | % |
| | Liabilities in Excess | | | | | | | | | | | | |
| | of Other Assets – (2.45)% | | | | | | | (93,271 | ) | | | (2.45 | )% |
| | | | | | | | | | | | | | |
| | TOTAL NET ASSETS – 100.00% | | | | | | $ | 3,812,852 | | | | 100.00 | % |
Percentages are stated as a percent of net assets.
ADR – American Depositary Receipt
REIT – Real Estate Investment Trust
| (a) | Non-income producing security. |
| (b) | U.S. traded security of a foreign corporation. |
| (c) | The rate listed is the fund’s 7-day yield as of October 31, 2016. |
The accompanying notes are an integral part of these financial statements.
HENNESSYFUNDS.COM
Summary of Fair Value Exposure at October 31, 2016
The following is a summary of the inputs used to value the Fund’s net assets as of October 31, 2016 (see Note 3 in the accompanying notes to the financial statements):
| Common Stocks | | Level 1 | | | Level 2 | | | Level 3 | | | Total | |
| Consumer Discretionary | | $ | 377,714 | | | $ | — | | | $ | — | | | $ | 377,714 | |
| Health Care | | | 425,990 | | | | — | | | | — | | | | 425,990 | |
| Industrials | | | 203,231 | | | | — | | | | — | | | | 203,231 | |
| Information Technology | | | 2,545,177 | | | | — | | | | — | | | | 2,545,177 | |
| Telecommunication Services | | | 34,562 | | | | — | | | | — | | | | 34,562 | |
| Total Common Stocks | | $ | 3,586,674 | | | $ | — | | | $ | — | | | $ | 3,586,674 | |
| REITS | | | | | | | | | | | | | | | | |
| Financials | | $ | 35,728 | | | $ | — | | | $ | — | | | $ | 35,728 | |
| Total REITS | | $ | 35,728 | | | $ | — | | | $ | — | | | $ | 35,728 | |
| Short-Term Investments | | | | | | | | | | | | | | | | |
| Money Market Funds | | $ | 283,721 | | | $ | — | | | $ | — | | | $ | 283,721 | |
| Total Short-Term Investments | | $ | 283,721 | | | $ | — | | | $ | — | | | $ | 283,721 | |
| Total Investments | | $ | 3,906,123 | | | $ | — | | | $ | — | | | $ | 3,906,123 | |
Transfers between levels are recognized at the end of the reporting period. During the year ended October 31, 2016, the Fund recognized no transfers between levels.
The accompanying notes are an integral part of these financial statements.
| HENNESSY FUNDS | 1-800-966-4354 | |
Financial Statements
Statement of Assets and Liabilities as of October 31, 2016 |
| ASSETS: | | | |
| Investments in securities, at value (cost $3,587,915) | | $ | 3,906,123 | |
| Dividends and interest receivable | | | 581 | |
| Receivable for securities sold | | | 147,655 | |
| Prepaid expenses and other assets | | | 14,465 | |
| Total Assets | | | 4,068,824 | |
| | | | | |
| LIABILITIES: | | | | |
| Payable for securities purchased | | | 210,753 | |
| Payable to advisor | | | 2,978 | |
| Payable to administrator | | | 1,013 | |
| Payable to auditor | | | 20,701 | |
| Accrued distribution fees | | | 8,110 | |
| Accrued service fees | | | 252 | |
| Accrued trustees fees | | | 3,902 | |
| Accrued expenses and other payables | | | 8,263 | |
| Total Liabilities | | | 255,972 | |
| NET ASSETS | | $ | 3,812,852 | |
| | | | | |
| NET ASSETS CONSIST OF: | | | | |
| Capital stock | | $ | 3,716,980 | |
| Accumulated net investment loss | | | (104,428 | ) |
| Accumulated net realized loss on investments | | | (117,908 | ) |
| Unrealized net appreciation on investments | | | 318,208 | |
| Total Net Assets | | $ | 3,812,852 | |
| | | | | |
| NET ASSETS | | | | |
| Investor Class: | | | | |
| Shares authorized (no par value) | | Unlimited | |
| Net assets applicable to outstanding Investor Class shares | | $ | 2,908,494 | |
| Shares issued and outstanding | | | 183,844 | |
| Net asset value, offering price and redemption price per share | | $ | 15.82 | |
| | | | | |
| Institutional Class: | | | | |
| Shares authorized (no par value) | | Unlimited | |
| Net assets applicable to outstanding Institutional Class shares | | $ | 904,358 | |
| Shares issued and outstanding | | | 56,153 | |
| Net asset value, offering price and redemption price per share | | $ | 16.11 | |
The accompanying notes are an integral part of these financial statements.
HENNESSYFUNDS.COM
| STATEMENT OF ASSETS AND LIABILITIES/STATEMENT OF OPERATIONS |
Financial Statements
Statement of Operations for the year ended October 31, 2016 |
| INVESTMENT INCOME: | | | |
Dividend income(1) | | $ | 29,950 | |
| Interest income | | | 521 | |
| Total investment income | | | 30,471 | |
| | | | | |
| EXPENSES: | | | | |
| Investment advisory fees (See Note 5) | | | 39,512 | |
| Federal and state registration fees | | | 27,436 | |
| Compliance expense (See Note 5) | | | 23,709 | |
| Audit fees | | | 20,699 | |
| Trustees’ fees and expenses | | | 15,036 | |
| Reports to shareholders | | | 7,740 | |
| Distribution fees – Investor Class (See Note 5) | | | 5,208 | |
| Sub-transfer agent expenses – Investor Class (See Note 5) | | | 4,451 | |
| Sub-transfer agent expenses – Institutional Class (See Note 5) | | | 157 | |
| Administration, fund accounting, custody and transfer agent fees (See Note 5) | | | 4,283 | |
| Service fees – Investor Class (See Note 5) | | | 3,472 | |
| Interest expense (See Note 7) | | | 38 | |
| Other expenses | | | 3,777 | |
| Total expenses | | | 155,518 | |
| NET INVESTMENT LOSS | | $ | (125,047 | ) |
| | | | | |
| REALIZED AND UNREALIZED GAINS: | | | | |
| Net realized gain on investments | | $ | 182,075 | |
| Net change in unrealized appreciation on investments | | | 41,566 | |
| Net gain on investments | | | 223,641 | |
| NET INCREASE IN NET ASSETS RESULTING FROM OPERATIONS | | $ | 98,594 | |
(1) | Net of Foreign taxes withheld and issuance fees of $567. |
The accompanying notes are an integral part of these financial statements.
| HENNESSY FUNDS | 1-800-966-4354 | |
(This Page Intentionally Left Blank.)
HENNESSYFUNDS.COM
| STATEMENTS OF CHANGES IN NET ASSETS |
Financial Statements
| Statements of Changes in Net Assets |
| | | Year Ended | | | Year Ended | |
| | | October 31, 2016 | | | October 31, 2015 | |
| OPERATIONS: | | | | | | |
| Net investment loss | | $ | (125,047 | ) | | $ | (98,868 | ) |
| Net realized gain on investments | | | 182,075 | | | | 422,069 | |
| Net change in unrealized | | | | | | | | |
| appreciation (depreciation) on investments | | | 41,566 | | | | (136,502 | ) |
| Net increase in net assets resulting from operations | | | 98,594 | | | | 186,699 | |
| | | | | | | | | |
| CAPITAL SHARE TRANSACTIONS: | | | | | | | | |
| Proceeds from shares subscribed – Investor Class | | | 247,599 | | | | 406,595 | |
| Proceeds from shares subscribed – Institutional Class | | | 40,176 | | | | 59,079 | |
| Cost of shares redeemed – Investor Class | | | (1,442,265 | ) | | | (1,513,565 | ) |
| Cost of shares redeemed – Institutional Class | | | (117,763 | ) | | | (78,903 | ) |
| Net decrease in net assets derived | | | | | | | | |
| from capital share transactions | | | (1,272,253 | ) | | | (1,126,794 | ) |
| TOTAL DECREASE IN NET ASSETS | | | (1,173,659 | ) | | | (940,095 | ) |
| | | | | | | | | |
| NET ASSETS: | | | | | | | | |
| Beginning of year | | | 4,986,511 | | | | 5,926,606 | |
| End of year | | $ | 3,812,852 | | | $ | 4,986,511 | |
| Undistributed net investment loss, end of year | | $ | (104,428 | ) | | $ | (85,399 | ) |
| | | | | | | | | |
| CHANGES IN SHARES OUTSTANDING: | | | | | | | | |
| Shares sold – Investor Class | | | 16,968 | | | | 26,994 | |
| Shares sold – Institutional Class | | | 2,730 | | | | 3,902 | |
| Shares redeemed – Investor Class | | | (95,956 | ) | | | (100,179 | ) |
| Shares redeemed – Institutional Class | | | (7,566 | ) | | | (5,099 | ) |
| Net decrease in shares outstanding | | | (83,824 | ) | | | (74,382 | ) |
The accompanying notes are an integral part of these financial statements.
| HENNESSY FUNDS | 1-800-966-4354 | |
Financial Statements
For an Investor Class share outstanding throughout each year
PER SHARE DATA:
Net asset value, beginning of year
Income from investment operations:
Net investment loss
Net realized and unrealized gains (losses) on investments
Total from investment operations
Net asset value, end of year
TOTAL RETURN
SUPPLEMENTAL DATA AND RATIOS:
Net assets, end of year (millions)
Ratio of expenses to average net assets:
Before expense reimbursement
After expense reimbursement
Ratio of net investment loss to average net assets:
Before expense reimbursement
After expense reimbursement
Portfolio turnover rate(1)
(1) | Portfolio turnover is calculated on the basis of the Fund as a whole. |
The accompanying notes are an integral part of these financial statements.
HENNESSYFUNDS.COM
| FINANCIAL HIGHLIGHTS — INVESTOR CLASS |
| Year Ended October 31, | | |
| 2016 | | | 2015 | | | 2014 | | | 2013 | | | 2012 | | |
| | | | | | | | | | | | | | | |
| $ | 15.36 | | | $ | 14.86 | | | $ | 13.57 | | | $ | 10.67 | | | $ | 10.86 | | |
| | | | | | | | | | | | | | | | | | | | |
| | | | | | | | | | | | | | | | | | | | |
| | (0.68 | ) | | | (0.38 | ) | | | (0.23 | ) | | | (0.20 | ) | | | (0.15 | ) | |
| | 1.14 | | | | 0.88 | | | | 1.52 | | | | 3.10 | | | | (0.04 | ) | |
| | 0.46 | | | | 0.50 | | | | 1.29 | | | | 2.90 | | | | (0.19 | ) | |
| $ | 15.82 | | | $ | 15.36 | | | $ | 14.86 | | | $ | 13.57 | | | $ | 10.67 | | |
| | | | | | | | | | | | | | | | | | | | |
| | 2.99 | % | | | 3.36 | % | | | 9.51 | % | | | 27.18 | % | | | (1.75 | )% | |
| | | | | | | | | | | | | | | | | | | | |
| | | | | | | | | | | | | | | | | | | | |
| $ | 2.91 | | | $ | 4.04 | | | $ | 4.99 | | | $ | 4.49 | | | $ | 4.44 | | |
| | | | | | | | | | | | | | | | | | | | |
| | 3.61 | % | | | 3.13 | % | | | 2.92 | % | | | 3.04 | % | | | 3.20 | % | |
| | 3.61 | % | | | 2.75 | % | | | 1.95 | % | | | 1.95 | % | | | 1.95 | % | |
| | | | | | | | | | | | | | | | | | | | |
| | (2.92 | )% | | | (2.30 | )% | | | (2.53 | )% | | | (2.36 | )% | | | (2.39 | )% | |
| | (2.92 | )% | | | (1.92 | )% | | | (1.55 | )% | | | (1.27 | )% | | | (1.14 | )% | |
| | 80 | % | | | 163 | % | | | 204 | % | | | 164 | % | | | 138 | % | |
The accompanying notes are an integral part of these financial statements.
| HENNESSY FUNDS | 1-800-966-4354 | |
Financial Statements
For an Institutional Class share outstanding throughout each year
PER SHARE DATA:
Net asset value, beginning of year
Income from investment operations:
Net investment loss
Net realized and unrealized gains (losses) on investments
Total from investment operations
Net asset value, end of year
TOTAL RETURN
SUPPLEMENTAL DATA AND RATIOS:
Net assets, end of year (millions)
Ratio of expenses to average net assets:
Before expense reimbursement
After expense reimbursement
Ratio of net investment loss to average net assets:
Before expense reimbursement
After expense reimbursement
Portfolio turnover rate(1)
(1) | Portfolio turnover is calculated on the basis of the Fund as a whole. |
The accompanying notes are an integral part of these financial statements.
HENNESSYFUNDS.COM
| FINANCIAL HIGHLIGHTS — INSTITUTIONAL CLASS |
| Year Ended October 31, | | |
| 2016 | | | 2015 | | | 2014 | | | 2013 | | | 2012 | | |
| | | | | | | | | | | | | | | |
| $ | 15.58 | | | $ | 15.02 | | | $ | 13.68 | | | $ | 10.73 | | | $ | 10.89 | | |
| | | | | | | | | | | | | | | | | | | | |
| | | | | | | | | | | | | | | | | | | | |
| | (0.43 | ) | | | (0.25 | ) | | | (0.26 | ) | | | (0.12 | ) | | | (0.11 | ) | |
| | 0.96 | | | | 0.81 | | | | 1.60 | | | | 3.07 | | | | (0.05 | ) | |
| | 0.53 | | | | 0.56 | | | | 1.34 | | | | 2.95 | | | | (0.16 | ) | |
| $ | 16.11 | | | $ | 15.58 | | | $ | 15.02 | | | $ | 13.68 | | | $ | 10.73 | | |
| | | | | | | | | | | | | | | | | | | | |
| | 3.40 | % | | | 3.73 | % | | | 9.80 | % | | | 27.49 | % | | | (1.47 | )% | |
| | | | | | | | | | | | | | | | | | | | |
| | | | | | | | | | | | | | | | | | | | |
| $ | 0.90 | | | $ | 0.95 | | | $ | 0.93 | | | $ | 1.19 | | | $ | 0.93 | | |
| | | | | | | | | | | | | | | | | | | | |
| | 3.28 | % | | | 2.76 | % | | | 2.60 | % | | | 2.76 | % | | | 4.11 | % | |
| | 3.28 | % | | | 2.44 | % | | | 1.70 | % | | | 1.70 | % | | | 1.70 | % | |
| | | | | | | | | | | | | | | | | | | | |
| | (2.59 | )% | | | (1.92 | )% | | | (2.23 | )% | | | (2.10 | )% | | | (3.31 | )% | |
| | (2.59 | )% | | | (1.60 | )% | | | (1.33 | )% | | | (1.04 | )% | | | (0.90 | )% | |
| | 80 | % | | | 163 | % | | | 204 | % | | | 164 | % | | | 138 | % | |
The accompanying notes are an integral part of these financial statements.
| HENNESSY FUNDS | 1-800-966-4354 | |
Financial Statements
Notes to the Financial Statements October 31, 2016 |
1). ORGANIZATION
The Hennessy Technology Fund (the “Fund”) is a series of Hennessy Funds Trust (the “Trust”), which was organized as a Delaware statutory trust on September 17, 1992. The Fund is an open-end management investment company registered under the Investment Company Act of 1940, as amended. The Fund is a successor to the FBR Technology Fund (the “Predecessor FBR Fund”), a series of The FBR Funds, a Delaware statutory trust, pursuant to a reorganization that took place after the close of business on October 26, 2012. Prior to October 26, 2012, the Fund had no investment operations. As a result of the reorganization, holders of Investor Class shares of the Predecessor FBR Fund received Investor Class shares of the Fund (the Investor Class shares of the Fund are the successor to the accounting and performance information of the corresponding shares of the Predecessor FBR Fund), and holders of Institutional Class shares of the Predecessor FBR Fund received Institutional Class shares of the Fund (the Institutional Class shares of the Fund are the successor to the accounting and performance information of the corresponding shares of the Predecessor FBR Fund). The investment objective of the Fund is long-term capital appreciation. The Fund is a non-diversified fund.
The Fund offers Investor Class and Institutional Class shares. Each class of shares differs principally in its respective administration, 12b-1 distribution and service, shareholder servicing, and transfer agent expenses (there are no sales charges). Each class has identical rights to earnings, assets, and voting privileges, except for class-specific expenses and exclusive rights to vote on matters affecting only an individual class.
As an investment company, the Fund follows the investment company accounting and reporting guidance of the Financial Accounting Standards Board (“FASB”) Accounting Standard Codification Topic 946 “Financial Services—Investment Companies.”
2). SIGNIFICANT ACCOUNTING POLICIES
The following is a summary of significant accounting policies consistently followed by the Fund in the preparation of the financial statements. These policies conform with U.S. generally accepted accounting principles (“GAAP”).
| a). | Investment Valuation – All investments in securities are recorded at their estimated fair value, as described in Note 3. |
| b). | Federal Income Taxes – No provision for federal income taxes or excise taxes has been made since the Fund has elected to be taxed as a “regulated investment company” and intends to distribute substantially all of its taxable income to its shareholders and otherwise comply with the provisions of the Internal Revenue Code of 1986, as amended, applicable to regulated investment companies. Net investment income or loss and realized gains and losses for federal income tax purposes may differ from that reported on the financial statements because of temporary book and tax basis differences. Temporary differences are primarily the result of the treatment of wash sales for tax reporting purposes. The Fund recognizes interest and penalties related to income tax benefits, if any, in the statement of operations as an income tax expense. Distributions from net realized gains for book purposes may include short-term capital gains, which are included as ordinary income to shareholders for tax purposes. |
HENNESSYFUNDS.COM
| NOTES TO THE FINANCIAL STATEMENTS |
| | Due to inherent differences in the recognition of income, expenses, and realized gains/losses under GAAP and federal income tax regulations, permanent differences between book and tax basis for reporting for the fiscal year ended October 31, 2016, have been identified and appropriately reclassified on the Statement of Assets and Liabilities. The adjustments are as follows: |
| | Undistributed | Accumulated | | |
| | Net Investment | Net Realized | | |
| | Income/(Loss) | Gain/(Loss) | Paid-in Capital | |
| | $106,018 | $— | $(106,018) | |
| c). | Accounting for Uncertainty in Income Taxes – The Fund has accounting policies regarding recognition and measurement of tax positions taken or expected to be taken on a tax return. The tax returns of the Fund for the prior three fiscal years are open for examination. The Fund has reviewed all open tax years in major jurisdictions and concluded that there is no impact on the Fund’s net assets and no tax liability resulting from unrecognized tax benefits relating to uncertain income tax positions taken or expected to be taken on a tax return. The Fund’s major tax jurisdictions are U.S. federal and Delaware. |
| d). | Income and Expenses – Dividend income is recognized on the ex-dividend date or as soon as information is available to the Fund. Interest income, which includes the amortization of premium and accretion of discount, is recognized on an accrual basis. The Fund is charged for those expenses that are directly attributable to the portfolio, such as advisory, administration, and certain shareholder service fees. Income, expenses (other than expenses attributable to a specific class), and realized and unrealized gains or losses on investments are allocated to each class of shares based on its respective net assets. |
| e). | Distributions to Shareholders – Dividends from net investment income for the Fund, if any, are declared and paid annually, usually in December. Distributions of net realized capital gains, if any, are declared and paid annually, usually in December. |
| f). | Security Transactions – Investment and shareholder transactions are recorded on the trade date. The Fund determines the gain or loss realized from the investment transactions by comparing the original cost of the security lot sold with the net sale proceeds. Discounts and premiums on securities purchased are accreted/amortized over the life of the respective security. |
| g). | Use of Estimates – The preparation of financial statements in conformity with GAAP requires management to make estimates and assumptions that affect the reported amounts of assets and liabilities and disclosure of contingent assets and liabilities at the date of the financial statements and the reported change in net assets during the reporting period. Actual results could differ from those estimates. |
| h). | Share Valuation – The net asset value (“NAV”) per share of the Fund is calculated by dividing the sum of the value of the securities held by the Fund, plus cash or other assets, minus all liabilities (including estimated accrued expenses) by the total number of shares outstanding for the Fund, rounded to the nearest cent. The Fund’s shares will not be priced on days the New York Stock Exchange is closed for trading. The offering and redemption price per share for the Fund is equal to the Fund’s NAV per share. |
| i). | Foreign Currency – Values of investments denominated in foreign currencies, if any, are converted into U.S. dollars using the spot market rate of exchange at the time of valuation. Purchases and sales of investments and income are translated into U.S. dollars using the spot market rate of exchange prevailing on the respective dates of |
| HENNESSY FUNDS | 1-800-966-4354 | |
| | such transactions. The Fund does not isolate the portion of the results of operations resulting from fluctuations in foreign exchange rates on investments from fluctuations resulting from changes in the market prices of securities held. Such fluctuations are included with the net realized and unrealized gain or loss on investments. Foreign investments present additional risks due to currency fluctuations, economic and political factors, lower liquidity, government regulations, differences in accounting standards, and other factors. |
| j). | Forward Contracts – The Fund may enter into forward currency contracts to reduce its exposure to changes in foreign currency exchange rates on its foreign holdings and to lock in the U.S. dollar cost of firm purchase and sale commitments for securities denominated in foreign currencies. A forward currency contract is a commitment to purchase or sell a foreign currency at a future date at a negotiated forward rate. The gain or loss arising from the difference between the U.S. dollar cost of the original contract and the value of the foreign currency in U.S. dollars upon closing of such contract is included in net realized gain or loss from foreign currency transactions. During the fiscal year ended October 31, 2016, the Fund did not enter into any forward contracts. |
| k). | Repurchase Agreements – The Fund may enter into repurchase agreements with member banks or security dealers of the Federal Reserve Board whom the investment advisor deems creditworthy. The repurchase price generally equals the price paid by the Fund plus interest negotiated on the basis of current short-term rates. |
| | Securities pledged as collateral for repurchase agreements are held by the custodian bank until the respective agreements mature. Provisions of the repurchase agreements ensure that the market value of the collateral, including accrued interest thereon, is sufficient to cover the repurchase amount in the event of default of the counterparty. If the counterparty defaults and the value of the collateral declines or if the counterparty enters an insolvency proceeding, realization of the collateral by the Fund may be delayed or limited. During the fiscal year ended October 31, 2016, the Fund did not enter into any repurchase agreements. |
| l). | Derivatives – The Fund may invest in, or enter into, derivatives, such as options, futures contracts, options on futures contracts, and swaps, for a variety of reasons, including to hedge certain risks, to provide a substitute for purchasing or selling particular securities, or to increase potential income gain. Derivatives are financial contracts based on an underlying or notional amount, require no initial investment or an initial net investment that is smaller than would normally be required to have a similar response to changes in market factors, and require or permit net settlement. Derivatives may allow the Fund to increase or decrease the level of risk to which the Fund is exposed more quickly and efficiently than transactions in other types of instruments. The main purpose of utilizing derivative instruments is for hedging purposes. |
| | The Fund follows the financial accounting reporting rules as required by the Derivatives and Hedging Topic of the FASB Accounting Standards Codification. Under such rules, the Fund is required to include enhanced disclosure that enables investors to understand how and why an entity uses derivatives, how derivatives are accounted for, and how derivatives instruments affect an entity’s results of operations and financial position. During the fiscal year ended October 31, 2016, the Fund did not hold any derivative instruments. |
| m). | New Accounting Pronouncements – In May 2015, the FASB issued ASU No. 2015-07 “Disclosure for Investments in Certain Entities that Calculate Net Asset Value per Share (or Its Equivalent).” The amendments in ASU No. 2015-07 remove the |
HENNESSYFUNDS.COM
| NOTES TO THE FINANCIAL STATEMENTS |
| | requirement to categorize within the fair value hierarchy investments measured at NAV and require the disclosure of sufficient information to reconcile the fair value of the remaining assets categorized within the fair value hierarchy to the financial statements. The amendments in ASU No. 2015-07 are effective for fiscal years beginning after December 15, 2015, and interim periods within those fiscal years. Management has reviewed the requirements and believes the adoption of ASU 2015-07 will not have a material impact on the Fund’s financial statements and related disclosures. |
3). SECURITIES VALUATION
The Fund follows authoritative fair valuation accounting standards that establish an authoritative definition of fair value and set out a hierarchy for measuring fair value. These standards require additional disclosures about the various inputs and valuation techniques used to develop the measurements of fair value and a discussion in changes in valuation techniques and related inputs during the period. These inputs are summarized in the three broad levels listed below:
| | Level 1 – | Unadjusted, quoted prices in active markets for identical instruments that the Fund has the ability to access at the date of measurement. |
| | Level 2 – | Other significant observable inputs (including, but not limited to, quoted prices in active markets for similar instruments, quoted prices in markets that are not active for identical or similar instruments, and model-derived valuations in which all significant inputs and significant value drivers are observable in active markets (such as interest rates, prepayment speeds, credit risk curves, default rates, and similar data)). |
| | Level 3 – | Significant unobservable inputs (including the Fund’s own assumptions about what market participants would use to price the asset or liability based on the best available information) when observable inputs are unavailable. |
Following is a description of the valuation techniques applied to the Fund’s major categories of assets and liabilities measured at fair value on a recurring basis.
Equity Securities – Equity securities, including common stocks, preferred stocks, foreign-issued common stocks, exchange-traded funds, closed-end mutual funds, partnerships, rights, and real estate investment trusts, that are traded on a securities exchange for which a last-quoted sales price is readily available will generally be valued at the last sales price as reported by the primary exchange on which the securities are listed. Securities listed on The NASDAQ Stock Market (“NASDAQ”) will generally be valued at the NASDAQ Official Closing Price, which may differ from the last sales price reported. Securities traded on a securities exchange for which a last-quoted sales price is not readily available will generally be valued at the mean between the bid and ask prices. To the extent these securities are actively traded and valuation adjustments are not applied, they are classified in Level 1 of the fair value hierarchy. Securities traded on foreign exchanges generally are not valued at the same time the Fund calculates its NAV because most foreign markets close well before such time. The earlier close of most foreign markets gives rise to the possibility that significant events, including broad market moves, may have occurred in the interim. In certain circumstances, it may be determined that a security needs to be fair valued because it appears that the value of the security might have been materially affected by events occurring after the close of the market in which the security is principally traded, but before the time the Fund calculates its NAV, such as by a development that affects an entire market or region (e.g., weather-related events) or a potentially global development (e.g., a terrorist attack that may be expected to have an effect on investor expectations worldwide).
| HENNESSY FUNDS | 1-800-966-4354 | |
Registered Investment Companies – Investments in registered investment companies (e.g., mutual funds) are generally priced at the ending NAV provided by the applicable registered investment company’s service agent and will be classified in Level 1 of the fair value hierarchy.
Debt Securities – Debt securities, including corporate bonds, asset-backed securities, mortgage-backed securities, municipal bonds, U.S. Treasuries, and U.S. government agency issues, are generally valued at market on the basis of valuations furnished by an independent pricing service that utilizes both dealer-supplied valuations and formula-based techniques. The pricing service may consider recently executed transactions in securities of the issuer or comparable issuers, market price quotations (where observable), bond spreads, and fundamental data relating to the issuer. In addition, the model may incorporate observable market data, such as reported sales of similar securities, broker quotes, yields, bids, offers, and reference data. Certain securities are valued primarily using dealer quotations. These securities are generally classified in Level 2 of the fair value hierarchy.
Short-Term Securities – Short-term equity investments, including money market funds, are valued in the manner specified above. Short-term debt investments with an original term to maturity of 60 days or less are valued at amortized cost, which approximates fair market value. If the original term to maturity of a short-term debt investment exceeded 60 days, then the values as of the 61st day prior to maturity are amortized. Amortized cost is not used if its use would be inappropriate due to credit or other impairments of the issuer, in which case the security’s fair value would be determined, as described below. Short-term securities are generally classified in Level 1 or Level 2 of the fair market hierarchy depending on the inputs used and market activity levels for specific securities.
The Board of Trustees of the Fund (the “Board”) has adopted fair value pricing procedures that are followed when a price for a security is not readily available or if a significant event has occurred that indicates the closing price of a security no longer represents the true value of that security. Fair value pricing determinations are made in good faith in accordance with these procedures. There are numerous criteria that will be given consideration in determining a fair value of a security, such as the trading volume of a security and markets, the value of other like securities, and news events with direct bearing to a security or markets. Fair value pricing results in an estimated price for a security that reflects the amount the Fund might reasonably expect to receive in a current sale. Depending on the relative significance of the valuation inputs, these securities may be classified in either Level 2 or Level 3 of the fair value hierarchy.
The fair valuation of foreign securities may be determined with the assistance of a pricing service using correlations between the movement of prices of such securities and indices of domestic securities and other appropriate indicators, such as closing market prices of relevant American Depositary Receipts or futures contracts. The effect of using fair value pricing is that the Fund’s NAV will reflect the affected portfolio securities’ value as determined by the Board or its designee instead of being determined by the market. Using a fair value pricing methodology to price foreign securities may result in a value that is different from a foreign security’s most recent closing price and from the prices used by other investment companies to calculate their NAVs and are generally considered Level 2 prices in the fair valuation hierarchy. Because the Fund may invest in foreign securities, the value of the Fund’s portfolio securities may change on days when you will not be able to purchase or redeem your shares.
The Board has delegated day-to-day valuation matters to a Valuation Committee comprised of one or more representatives from Hennessy Advisors, Inc., the Fund’s investment advisor. The function of the Valuation Committee is to value securities where
HENNESSYFUNDS.COM
| NOTES TO THE FINANCIAL STATEMENTS |
current and reliable market quotations are not readily available. All actions taken by the Valuation Committee are reviewed by the Board.
The Fund has performed an analysis of all existing investments to determine the significance and character of all inputs to their fair value determination. Various inputs are used in determining the value of the Fund’s investments. The inputs or methodology used for valuing securities are not necessarily an indication of the risk associated with investing in those securities. Details related to the fair valuation hierarchy of the Fund’s securities as of October 31, 2016, are included in the Fund’s Schedule of Investments.
4). INVESTMENT TRANSACTIONS
Purchases and sales of investment securities (excluding government and short-term investments) for the Fund during the fiscal year ended October 31, 2016, were $3,290,797 and $4,467,051, respectively.
There were no purchases or sales/maturities of long-term U.S. government securities for the Fund during the fiscal year ended October 31, 2016.
The Fund is permitted to purchase or sell securities from or to another fund in the Hennessy Funds family of funds (the “Hennessy Funds”) under specified conditions outlined in procedures adopted by the Board of Trustees. The procedures have been designed to ensure that any purchase or sale of securities by the Fund from or to another Hennessy Fund complies with Rule 17a-7 of the Investment Company Act of 1940. For the fiscal year ended October 31, 2016, the Fund did not engage in purchases and sales of securities pursuant to Rule 17a-7 of the Investment Company Act of 1940.
5). INVESTMENT MANAGEMENT FEE AND OTHER TRANSACTIONS WITH AFFILIATES
Hennessy Advisors, Inc. (the “Advisor”) is the investment advisor of the Fund. The Advisor provides the Fund with investment management services under an Investment Advisory Agreement. The Advisor furnishes all investment advice, office space, facilities, and provides most of the personnel needed by the Fund. As compensation for its services, the Advisor is entitled to a monthly fee from the Fund. The fee is based upon the average daily net assets of the Fund at the annual rate of 0.90%. The net investment advisory fees payable by the Fund as of October 31, 2016, were $2,978.
In the past, the Advisor had contractually agreed to limit the total annual operating expenses of the Fund to 1.95% and 1.70% of the Fund’s net assets for Investor Class shares and Institutional Class shares of the Fund, respectively (excluding interest, taxes, brokerage commissions, dividend expenses, acquired fund fees and expenses, extraordinary legal expenses, or any other extraordinary expenses and, from and after November 1, 2014, 12b-1 fees). The expense limitation agreement for the Fund expired as of February 28, 2015.
For a period of three years after the year in which the Advisor waived or reimbursed expenses, the Advisor may seek reimbursement from the Fund to the extent that total annual fund operating expenses are less than the expense limitation that was in effect at the time the Advisor waived or reimbursed expenses. As of October 31, 2016, cumulative expenses subject to potential recovery under the aforementioned conditions and year of expiration were as follows:
| | | October 31, | | | October 31, | | | | |
| | | 2017 | | | 2018 | | | Total | |
| Investor Class | | $ | 48,732 | | | $ | 16,551 | | | $ | 65,283 | |
| Institutional Class | | $ | 9,989 | | | $ | 3,036 | | | $ | 13,025 | |
| HENNESSY FUNDS | 1-800-966-4354 | |
The Board has approved a Shareholder Servicing Agreement for Investor Class shares of the Fund, effective as of March 1, 2015, which was instituted to compensate the Advisor for the non-investment management services it provides to the Fund. The Shareholder Servicing Agreement provides for a monthly fee paid to the Advisor at an annual rate of 0.10% of the average daily net assets of the Fund attributable to Investor Class shares. Shareholder service fees payable by the Fund as of October 31, 2016, were $252.
The Fund has adopted a plan pursuant to Rule 12b-1 under the Investment Company Act of 1940, as amended, that authorizes payments in connection with the distribution of the Fund’s shares at an annual rate of up to 0.25% of the Fund’s average daily net assets attributable to Investor Class shares. Even though the authorized rate is up to 0.25%, the Fund has only used up to 0.15% of its average daily net assets attributable to Investor Class shares for such purpose since March 1, 2015. Amounts paid under the plan may be spent on any activities or expenses primarily intended to result in the sale of shares, including, but not limited to, advertising, shareholder account servicing, the printing and mailing of prospectuses to other than current shareholders, the printing and mailing of sales literature, and compensation for sales and marketing activities or to financial institutions and others, such as dealers and distributors.
The Fund has entered into agreements with various brokers, dealers, and financial intermediaries in connection with the sale of shares of the Fund. The agreements provide for periodic payments by the Fund to the brokers, dealers, and financial intermediaries for providing certain shareholder maintenance services (sub-transfer agent expenses). These shareholder services include the pre-processing and quality control of new accounts, shareholder correspondence, answering customer inquiries regarding account status, and facilitating shareholder telephone transactions. Fees paid by the Fund to various brokers, dealers, and financial intermediaries during the fiscal year ended October 31, 2016, were $4,608.
U.S. Bancorp Fund Services, LLC (“USBFS”) provides the Fund with administrative, fund accounting, and transfer agent services, and necessary office equipment. As administrator, USBFS is responsible for activities such as (i) preparing various federal and state regulatory filings, reports, and returns for the Fund, (ii) preparing reports and materials to be supplied to the Board, (iii) monitoring the activities of the Fund’s custodian, transfer agent, and accountants, and (iv) coordinating the preparation and payment of the Fund’s expenses and reviewing the Fund’s expense accruals. Fees paid to USBFS during the fiscal year ended October 31, 2016, were $4,283.
U.S. Bank, N.A., an affiliate of USBFS, serves as the Fund’s custodian. Quasar Distributors, LLC acts as the Fund’s principal underwriter in a continuous public offering of the Fund’s shares. Quasar Distributors, LLC is an affiliate of USBFS and U.S. Bank, N.A.
The officers of the Fund are affiliated with the Advisor. Such officers, with the exception of the Chief Compliance Officer and the Senior Compliance Officer, receive no compensation from the Fund for serving in their respective roles. The Fund, along with the other Hennessy Funds, makes reimbursement payments, on an equal basis, to the Advisor for a portion of the salary and benefits associated with the office of the Chief Compliance Officer and for all of the salary and benefits associated with the office of the Senior Compliance Officer. Such amounts are included on the Statement of Operations.
6). GUARANTEES AND INDEMNIFICATIONS
Under the Hennessy Funds’ organizational documents, their officers and trustees are indemnified by the Hennessy Funds against certain liabilities arising out of the performance of their duties to the Hennessy Funds. Additionally, in the normal course of business, the Hennessy Funds enter into contracts with service providers that contain general
HENNESSYFUNDS.COM
| NOTES TO THE FINANCIAL STATEMENTS |
indemnification clauses. The Fund’s maximum exposure under these arrangements is unknown as this would involve future claims that may be made against the Fund that have not yet occurred. Currently, the Fund expects the risk of loss to be remote.
7). LINE OF CREDIT
The Fund has an uncommitted line of credit with the other Hennessy Funds in the amount of the lesser of (i) $100,000,000 or (ii) 33.33% of each Hennessy Fund’s net assets, or 30% for the Hennessy Gas Utility Fund and 10% for the Hennessy Balanced Fund, intended to provide short-term financing, if necessary, subject to certain restrictions, in connection with shareholder redemptions. The credit facility is with the Hennessy Funds’ custodian bank, U.S. Bank, N.A. Borrowings under this arrangement bear interest at the bank’s prime rate and are secured by all of the Fund’s assets (as to its own borrowings only). During the fiscal year ended October 31, 2016, the Fund had an outstanding average daily balance and a weighted average interest rate of $1,074 and 3.47%, respectively. The maximum amount outstanding for the Fund during the period was $122,000. At October 31, 2016, the Fund did not have any borrowings outstanding under the line of credit.
8). FEDERAL TAX INFORMATION
As of October 31, 2016, the components of accumulated earnings (losses) for income tax purposes were as follows:
| Cost of investments for tax purposes | | $ | 3,641,610 | |
| Gross tax unrealized appreciation | | $ | 500,364 | |
| Gross tax unrealized depreciation | | | (235,851 | ) |
| Net tax unrealized appreciation | | $ | 264,513 | |
| Undistributed ordinary income | | $ | — | |
| Undistributed long-term capital gains | | | — | |
| Total distributable earnings | | $ | — | |
| Other accumulated loss | | $ | (168,641 | ) |
| Total accumulated gain | | $ | 95,872 | |
The difference between book-basis unrealized appreciation/depreciation (as shown in the Statement of Assets and Liabilities) and tax-basis unrealized appreciation/depreciation (as shown above) is attributable primarily to capital loss carryforwards and wash sales.
At October 31, 2016, the Fund had capital loss carryforwards of $64,213 that expire on October 31, 2017.
During the fiscal year ended October 31, 2016, the capital loss carryforwards utilized for the Fund were $212,540.
Capital losses sustained in the fiscal year ended October 31, 2012, and in future taxable years will not expire and may be carried over by the Fund without limitation; however, they will retain the character of the original loss. Furthermore, any loss incurred during those taxable years will be required to be utilized prior to the losses incurred in taxable years prior to 2012. As a result of this ordering rule, pre-enactment capital loss carryforwards may be more likely to expire unused. Under pre-enactment law, capital losses could be carried forward for eight years, and carried forward as short-term capital losses, irrespective of the character of the original loss.
At October 31, 2016, the Fund deferred, on a tax basis, a late year ordinary loss of $104,428.
During the fiscal years ended October 31, 2016 and 2015, the Fund did not pay any distributions.
| HENNESSY FUNDS | 1-800-966-4354 | |
9). EVENTS SUBSEQUENT TO YEAR END
Management has evaluated the Fund’s related events and transactions that occurred subsequent to October 31, 2016, through the date of issuance of the Fund’s financial statements. Other than as disclosed below, management has determined that there were no subsequent events requiring recognition or disclosure in the financial statements.
On December 2, 2016, the Board approved a change to the principal investment strategy of the Fund. The Fund filed a post-effective amendment to its registration statement reflecting such change on December 16, 2016, which is anticipated to become effective on or after February 14, 2017.
HENNESSYFUNDS.COM
| NOTES TO THE FINANCIAL STATEMENTS |
(This Page Intentionally Left Blank.)
| HENNESSY FUNDS | 1-800-966-4354 | |
Report of Independent Registered Public Accounting Firm
To the Board of Trustees of Hennessy Funds Trust
and the Shareholders of the Hennessy Technology Fund
Novato, CA
We have audited the accompanying statement of assets and liabilities, including the schedule of investments, of the Hennessy Technology Fund (the “Fund”), a series of Hennessy Funds Trust, as of October 31, 2016, and the related statement of operations for the year then ended, the statements of changes in net assets for each of the two years in the period then ended, and the financial highlights for each of the five years in the period then ended. These financial statements and financial highlights are the responsibility of the Fund’s management. Our responsibility is to express an opinion on these financial statements and financial highlights based on our audits.
We conducted our audits in accordance with the standards of the Public Company Accounting Oversight Board (United States). Those standards require that we plan and perform the audits to obtain reasonable assurance about whether the financial statements and financial highlights are free of material misstatement. The Fund is not required to have, nor were we engaged to perform, an audit of its internal control over financial reporting. Our audits included consideration of internal control over financial reporting as a basis for designing audit procedures that are appropriate in the circumstances, but not for the purposes of expressing an opinion on the effectiveness of the Fund’s internal control over financial reporting. Accordingly, we express no such opinion. An audit includes examining, on a test basis, evidence supporting the amounts and disclosures in the financial statements. Our procedures included confirmation of securities owned as of October 31, 2016, by correspondence with the custodian and brokers. An audit also includes assessing the accounting principles used and significant estimates made by management, as well as evaluating the overall financial statement presentation. We believe that our audits provide a reasonable basis for our opinion.
In our opinion, the financial statements and financial highlights referred to above present fairly, in all material respects, the financial position of the Hennessy Technology Fund as of October 31, 2016, the results of its operations for the year then ended, the changes in its net assets for each of the two years in the period then ended, and the financial highlights for each of the five years in the period then ended, in conformity with accounting principles generally accepted in the United States of America.
TAIT, WELLER & BAKER LLP
Philadelphia, Pennsylvania
December 22, 2016
HENNESSYFUNDS.COM
| REPORT OF INDEPENDENT REGISTERED PUBLIC ACCOUNTING FIRM/TRUSTEES AND OFFICERS |
Trustees and Officers of the Fund (Unaudited)
The business and affairs of the Fund are managed under the direction of the Board of Trustees of the Trust, and the Board of Trustees elects the Officers of the Trust. Beginning in March 2015, the Board of Trustees has from time to time appointed advisers (“Advisers”) to the Board of Trustees, with the intention of having qualified individuals serve in an advisory capacity in order to garner experience in the mutual fund and asset management industry and be considered as potential Trustees in the future. There are currently three Advisers to the Board of Trustees: Brian Alexander, Doug Franklin, and Claire Knoles. As Advisers, Mr. Alexander, Mr. Franklin, and Ms. Knoles attend meetings of the Board and act as non-voting participants. Information pertaining to the Trustees, Advisers, and the Officers of the Trust is set forth below. The Trustees and Officers serve until their successors are duly elected and qualified or until their earlier death, resignation, or removal. Each of the Trustees oversees 16 Hennessy Funds. Unless otherwise indicated, the address of all persons listed below is 7250 Redwood Boulevard, Suite 200, Novato, CA 94945. The Fund’s Statement of Additional Information includes more information about the persons listed below and is available, without charge, upon request by calling 1-800-966-4354.
| | | | Other |
| | | | Directorships |
| | | | Held Outside |
| Name, (Year of Birth), | | | of Fund |
| and Position Held | Start Date | Principal Occupation(s) | Complex During |
with the Trust | of Service | During Past Five Years | Past Five Years(1) |
| | | |
| Disinterested Trustees and Advisers | | |
| | | | |
| J. Dennis DeSousa | January 1996 | Mr. DeSousa is a real estate investor. | None. |
| (1936) | | | |
| Trustee | | | |
| | | | |
| Robert T. Doyle | January 1996 | Mr. Doyle has been the Sheriff of | None. |
| (1947) | | Marin County, California since 1996. | |
| Trustee | | | |
| | | | |
| Gerald P. Richardson | May 2004 | Mr. Richardson is an independent | None. |
| (1945) | | consultant in the securities industry. | |
| Trustee | | | |
| | | | |
| Brian Alexander | March 2015 | Mr. Alexander has been employed | None. |
| (1981) | | by Sutter Health Novato Community | |
| Adviser to the Board | | Hospital since 2012, first as an | |
| | | Assistant Administrator and then, | |
| | | beginning in 2013, as the Chief | |
| | | Administrative Officer. From 2011 | |
| | | through 2012, Mr. Alexander was | |
| | | employed by Sutter Health West Bay | |
| | | Region as the Regional Director of | |
| | | Strategic Decision Support. Prior to | |
| | | that, in 2011, he served as the | |
| | | Director of Managed Care | |
| | | Contracting and also the Director of | |
| | | Compensation, Benefits, and | |
| | | Compliance for the Rehabilitation | |
| | | Institute of Chicago. | |
| HENNESSY FUNDS | 1-800-966-4354 | |
| | | | Other |
| | | | Directorships |
| | | | Held Outside |
| Name, (Year of Birth), | | | of Fund |
| and Position Held | Start Date | Principal Occupation(s) | Complex During |
with the Trust | of Service | During Past Five Years | Past Five Years(1) |
| | | | |
| Doug Franklin | March 2016 | Mr. Franklin is a retired insurance | None. |
| (1964) | | industry executive. From 1987 | |
| Adviser to the Board | | through 2015, he was employed by | |
| | | the Allianz-Fireman’s Fund Insurance | |
| | | Company in various positions, | |
| | | including as its Chief Actuary and | |
| | | Chief Risk Officer. | |
| | | | |
| Claire Knoles | December 2015 | Ms. Knoles is a founder of Kiosk and | None. |
| (1974) | | has served as its Chief Operating | |
| Adviser to the Board | | Officer since 2004. Kiosk is a full | |
| | | service marketing agency with | |
| | | offices in the San Francisco Bay | |
| | | Area, Toronto, and Liverpool, UK. | |
| | | | |
Interested Trustee(2) | | | |
| | | | |
| Neil J. Hennessy | January 1996 as | Mr. Hennessy has been employed by | Hennessy |
| (1956) | a Trustee and | Hennessy Advisors, Inc. since 1989 | Advisors, Inc. |
| Trustee, Chairman of | June 2008 as | and currently serves as its President, | |
| the Board, Chief | an Officer | Chairman and Chief Executive Officer. | |
| Investment Officer, | | | |
| Portfolio Manager, | | | |
| and President | | | |
| Name, (Year of Birth), | | |
| and Position Held | Start Date | Principal Occupation(s) |
with the Trust | of Service | During Past Five Years |
| | | |
| Officers | | |
| | | |
| Teresa M. Nilsen | January 1996 | Ms. Nilsen has been employed by Hennessy Advisors, Inc. |
| (1966) | | since 1989 and currently serves as its Executive Vice President, |
| Executive Vice President | | Chief Operations Officer, Chief Financial Officer, and Secretary. |
| and Treasurer | | |
| | | |
| Daniel B. Steadman | March 2000 | Mr. Steadman has been employed by Hennessy Advisors, Inc. |
| (1956) | | since 2000 and currently serves as its Executive Vice President |
| Executive Vice President | | and Chief Compliance Officer. |
| and Secretary | | |
| | | |
| Jennifer Cheskiewicz | June 2013 | Ms. Cheskiewicz has been employed by Hennessy Advisors, Inc. |
| (1977) | | as its General Counsel since June 2013. She previously served |
| Senior Vice President and | | as in-house counsel to Carlson Capital, L.P., an SEC-registered |
| Chief Compliance Officer | | investment advisor to several private funds, from |
| | | February 2010 to May 2013. |
| | | |
| Brian Carlson | December 2013 | Mr. Carlson has been employed by Hennessy Advisors, Inc. |
| (1972) | | since December 2013. Mr. Carlson was previously a co-founder |
| Senior Vice President and | | and principal of Trivium Consultants, LLC from February 2011 |
| Head of Distribution | | through November 2013. |
HENNESSYFUNDS.COM
| TRUSTEES AND OFFICERS OF THE FUND |
| Name, (Year of Birth), | | |
| and Position Held | Start Date | Principal Occupation(s) |
with the Trust | of Service | During Past Five Years |
| | | |
| David Ellison | October 2012 | Mr. Ellison has been employed by Hennessy Advisors, Inc. since |
(1958)(3) | | October 2012. He has served as a Portfolio Manager of the |
| Senior Vice President and | | Hennessy Small Cap Financial Fund, the Hennessy Large Cap |
| Portfolio Manager | | Financial Fund, and the Hennessy Technology Fund since |
| | | inception. Prior to that, Mr. Ellison served as Director, CIO and |
| | | President of FBR Fund Advisers, Inc. from December |
| | | 1999 to October 2012. |
| | | |
| Brian Peery | March 2003 as | Mr. Peery has been employed by Hennessy Advisors, Inc. since |
| (1969) | an Officer and | 2002. He has served as a Portfolio Manager of the Hennessy |
| Senior Vice President and | February 2011 | Cornerstone Growth Fund, the Hennessy Cornerstone Mid Cap |
| Portfolio Manager | as a Co-Portfolio | 30 Fund, the Hennessy Cornerstone Large Growth Fund, the |
| | Manager or | Hennessy Cornerstone Value Fund, the Hennessy Total Return |
| | Portfolio Manager | Fund, and the Hennessy Balanced Fund since October 2014. |
| | | He served as Co-Portfolio Manager of the same funds from |
| | | February 2011 through September 2014. Mr. Peery has also |
| | | served as a Portfolio Manager of the Hennessy Gas Utility Fund |
| | | since February 2015. |
| | | |
| Winsor (Skip) Aylesworth | October 2012 | Mr. Aylesworth has been employed by Hennessy Advisors, Inc. |
(1947)(3) | | since October 2012. He has served as a Portfolio Manager of |
| Vice President and | | the Hennessy Gas Utility Fund since 1998 and as a Portfolio |
| Portfolio Manager | | Manager of the Hennessy Technology Fund since inception. |
| | | Prior to that, Mr. Aylesworth served as Executive Vice President |
| | | of FBR Fund Advisers, Inc. from 1999 to October 2012. |
| | | |
| Ryan Kelley | March 2013 | Mr. Kelley has been employed by Hennessy Advisors, Inc. since |
(1972)(4) | | October 2012. He has served as a Portfolio Manager of the |
| Vice President and | | Hennessy Gas Utility Fund, the Hennessy Small Cap Financial |
| Portfolio Manager | | Fund, and the Hennessy Large Cap Financial Fund since |
| | | October 2014. He served as Co-Portfolio Manager of the same |
| | | funds from March 2013 through September 2014, and as a |
| | | Portfolio Analyst for the Hennessy Funds from October 2012 |
| | | through February 2013. Prior to that, Mr. Kelley served as |
| | | Portfolio Manager of FBR Fund Advisers, Inc. from |
| | | January 2008 to October 2012. |
_______________
(1) | Messrs. DeSousa, Doyle, Hennessy, and Richardson previously served on the Board of Directors of Hennessy Mutual Funds, Inc. (“HMFI”), The Hennessy Funds, Inc. (“HFI”), and Hennessy SPARX Funds Trust (“HSFT”). Pursuant to an internal reorganization effective as of February 28, 2014, the series of HFMI, HFI, and HSFT were reorganized into corresponding series of Hennessy Funds Trust that mirrored them. Subsequent to the reorganization, HFMI, HFI, and HSFT were dissolved. |
(2) | Mr. Hennessy is considered an “interested person,” as defined in the Investment Company Act of 1940, as amended, because he is an officer of the Hennessy Funds. |
(3) | The address of these officers is 101 Federal Street, Suite 1900, Boston, MA 02110. |
(4) | The address of this officer is 1340 Environ Way, Suite 305, Chapel Hill, NC 27517. |
| HENNESSY FUNDS | 1-800-966-4354 | |
Expense Example (Unaudited)
October 31, 2016
As a shareholder of the Fund, you incur two types of costs: (1) transaction costs, including sales charges (loads) on purchase payments, reinvested dividends, or other distributions; redemption fees; and exchange fees; and (2) ongoing costs, including management fees; service fees; and other Fund expenses. This Example is intended to help you understand your ongoing costs (in dollars) of investing in the Fund and to compare these costs with the ongoing costs of investing in other mutual funds. The Example is based on an investment of $1,000 invested at the beginning of the period and held for the entire period from May 1, 2016, through October 31, 2016.
Actual Expenses
The first line of the table below under the “Investor Class” and “Institutional Class” headings provides information about actual account values and actual expenses. Although the Fund charges no sales loads or transaction fees, you will be assessed fees for outgoing wire transfers, returned checks and stop payment orders at prevailing rates charged by U.S. Bancorp Fund Services, LLC, the Fund’s transfer agent. If you request that a redemption be made by wire transfer, currently a $15 fee is charged by the Fund’s transfer agent. IRA accounts will be charged a $15 annual maintenance fee. The example below includes, but is not limited to, management fees, shareholder servicing fees, fund accounting, custody, and transfer agent fees. However, the example below does not include portfolio trading commissions and related expenses, and other extraordinary expenses as determined under generally accepted accounting principles. You may use the information in this line, together with the amount you invested, to estimate the expenses that you paid over the period. Simply divide your account value by $1,000 (for example, an $8,600 account value divided by $1,000 = 8.6), then multiply the result by the number in the first line of the table under the “Investor Class” and “Institutional Class” headings in the column entitled “Expenses Paid During Period” to estimate the expenses you paid on your account during this period.
Hypothetical Example for Comparison Purposes
The second line of the table below under the “Investor Class” and “Institutional Class” headings provides information about hypothetical account values and hypothetical expenses based on the Fund’s actual expense ratios and an assumed rate of return of 5% per year before expenses, which is not the Fund’s actual return. The hypothetical account values and expenses may not be used to estimate the actual ending account balance or expenses you paid for the period. You may use this information to compare the ongoing costs of investing in the Fund and other funds. To do so, compare this 5% hypothetical example with the 5% hypothetical examples that appear in the shareholder reports of the other funds. Please note that the expenses shown in the table are meant to highlight your ongoing costs only and do not reflect any transactional costs, such as sales charges (loads), or exchange fees. Therefore, the second line of the table under the “Investor Class” and “Institutional Class” headings is useful in comparing ongoing costs only, and will not help you determine the relative total costs of owning different funds. In addition, if these transactional costs were included, your costs would have been higher.
HENNESSYFUNDS.COM
| | | | Expenses Paid |
| | Beginning | Ending | During Period(1) |
| | Account Value | Account Value | May 1, 2016 – |
| | May 1, 2016 | October 31, 2016 | October 31, 2016 |
| Investor Class | | | |
| Actual | $1,000.00 | $1,086.50 | $19.88 |
| Hypothetical (5% return before expenses) | $1,000.00 | $1,006.08 | $19.11 |
| | | | |
| Institutional Class | | | |
| Actual | $1,000.00 | $1,088.50 | $18.06 |
| Hypothetical (5% return before expenses) | $1,000.00 | $1,007.84 | $17.36 |
(1) | Expenses are equal to the Fund’s annualized expense ratio of 3.79% for Investor Class shares or 3.44% for Institutional Class shares, as applicable, multiplied by the average account value over the period, multiplied by 184/366 days (to reflect one-half year period). |
| HENNESSY FUNDS | 1-800-966-4354 | |
How to Obtain a Copy of the Fund’s
Proxy Voting Policy and Proxy Voting Records
A description of the policies and procedures the Fund uses to determine how to vote proxies relating to portfolio securities is available without charge: (1) by calling 1-800-966-4354; (2) on the Hennessy Funds’ website at hennessyfunds.com/proxy-voting/policy.fs; or (3) on the U.S. Securities and Exchange Commission’s website at www.sec.gov. The Fund’s proxy voting record is available without charge on both the Hennessy Funds’ website at hennessyfunds.com/proxy-voting/vote.fs and the SEC’s website at www.sec.gov no later than August 31 for the prior 12 months ending June 30.
Quarterly Filings on Form N-Q
The Fund files its complete schedule of portfolio holdings with the SEC for the first and third quarters of each fiscal year on Form N-Q. The Fund’s Form N-Q will be available on the SEC’s website at www.sec.gov. The Fund’s Form N-Q may be reviewed and copied at the SEC’s Public Reference Room in Washington, DC and information on the operation of the Public Reference Room may be obtained by calling 1-800-SEC-0330. Information included in the Fund’s N-Q will also be available upon request by calling 1-800-966-4354.
Householding
To help keep the Fund’s costs as low as possible, we generally deliver a single copy of most financial reports and prospectuses to shareholders who share an address, even if the accounts are registered under different names. This process, known as “householding,” does not apply to account statements. You may, of course, request an individual copy of a prospectus or financial report at any time. If you would like to receive separate mailings, please call the Administrator at 1-800-261-6950 or 1-414-765-4124 and we will begin individual delivery within 30 days of your request. If your account is held through a financial institution or other intermediary, please contact them directly to request individual delivery.
HENNESSYFUNDS.COM
| PROXY VOTING — PRIVACY POLICY |
Privacy Policy
We collect the following non-public personal information about you:
| | • | information we receive from you on or in applications or other forms, correspondence, or conversations, including, but not limited to, your name, address, phone number, social security number, assets, income, and date of birth; and |
| | • | information about your transactions with us, our affiliates, or others, including, but not limited to, your account number and balance, payment history, parties to transactions, cost basis information, and other financial information. |
We do not disclose any non-public personal information about our current or former shareholders to non-affiliated third parties, except as permitted by law. For example, we are permitted by law to disclose all of the information we collect, as described above, to our Transfer Agent to process your transactions. Furthermore, we restrict access to your non-public personal information to those persons who require such information to provide products or services to you. We maintain physical, electronic, and procedural safeguards that comply with federal standards to guard your non-public personal information.
In the event that you hold shares of the Fund through a financial intermediary, including, but not limited to, a broker-dealer, bank or trust company, the privacy policy of your financial intermediary would govern how your non-public personal information would be shared with non-affiliated third parties.
| HENNESSY FUNDS | 1-800-966-4354 | |
For information, questions or assistance, please call
The Hennessy Funds
1-800-966-4354 or 1-415-899-1555
INVESTMENT ADVISOR
Hennessy Advisors, Inc.
7250 Redwood Blvd., Suite 200
Novato, California 94945
ADMINISTRATOR,
TRANSFER AGENT,
DIVIDEND PAYING AGENT &
SHAREHOLDER SERVICING AGENT
U.S. Bancorp Fund Services, LLC
P.O. Box 701
Milwaukee, Wisconsin 53201-0701
CUSTODIAN
U.S. Bank N.A.
Custody Operations
1555 North River Center Dr., Suite 302
Milwaukee, Wisconsin 53212
TRUSTEES
Neil J. Hennessy
Robert T. Doyle
J. Dennis DeSousa
Gerald P. Richardson
COUNSEL
Foley & Lardner LLP
777 East Wisconsin Avenue
Milwaukee, Wisconsin 53202-5306
INDEPENDENT REGISTERED
PUBLIC ACCOUNTING FIRM
Tait, Weller & Baker LLP
1818 Market Street, Suite 2400
Philadelphia, Pennsylvania 19103
DISTRIBUTOR
Quasar Distributors, LLC
615 East Michigan Street
Milwaukee, Wisconsin 53202
hennessyfunds.com | 1-800-966-4354
This report has been prepared for shareholders and may be distributed to
others only if preceded or accompanied by a current prospectus.
ANNUAL REPORT
OCTOBER 31, 2016
HENNESSY JAPAN FUND
Investor Class HJPNX
Institutional Class HJPIX
hennessyfunds.com | 1-800-966-4354
(This Page Intentionally Left Blank.)
Contents
| Letter to Shareholders | 2 |
| Performance Overview | 4 |
| Financial Statements | |
| Schedule of Investments | 7 |
| Statement of Assets and Liabilities | 10 |
| Statement of Operations | 11 |
| Statements of Changes in Net Assets | 13 |
| Financial Highlights | 14 |
| Notes to the Financial Statements | 18 |
| Report of Independent Registered Public Accounting Firm | 26 |
| Trustees and Officers of the Fund | 27 |
| Expense Example | 30 |
| Proxy Voting | 32 |
| Quarterly Filings on Form N-Q | 32 |
| Householding | 32 |
| Privacy Policy | 33 |
| HENNESSY FUNDS | 1-800-966-4354 | |
December 2016
Dear Hennessy Funds Shareholder:
During the twelve-month period ended October 31, 2016, the Japanese stock market, as measured by the Tokyo Stock Price Index, declined by just over 10% in yen terms and increased just over 5% in U.S. Dollar terms. The market initially advanced as it rebounded from the decline, which was caused by the sudden drop in Chinese stocks toward the end of the previous period. However, it subsequently dropped sharply in reaction to the strengthening of the yen. The yen rallied significantly during the first half of calendar 2016 as expectations of an interest rate increase in the U.S. faded due to weak macroeconomic statistics. The Japanese market stabilized in the spring despite growing concerns about potential adverse economic effects of the negative interest rate policy adopted by the Bank of Japan (BOJ). In June 2016, however, the stock market fell dramatically once again, this time in reaction to the United Kingdom’s decision to leave the European Union, the so-called “Brexit” vote. Following a quick rebound from this plunge, the market began steadily recovering its lost ground. Investors appeared to feel a sense of relief that the Liberal Democratic Party of Japan did well in upper-house elections, while a revision in the BOJ’s monetary policies was well received. A slight weakening of the yen and some optimism over the likely beneficial impact of a more expansionary fiscal policy added positive momentum to share prices at the end of the period.
With regards to Japan’s macroeconomic situation, we continue to call for the acceleration of structural reforms and an end to increasing dependence on reflationary policies. In our opinion, any additional monetary easing measures should be viewed as short-term solutions to prevent Japan from falling back into temporary recession. Our view is that BOJ Governor Kuroda has already done his part, enlarging the monetary base from 100 trillion yen in early 2013 to 400 trillion yen, or 80% of GDP. Rather than more monetary stimulus, what we believe Japan needs right now is a boost in confidence so that Japanese consumers, corporate leaders and investors can become more forward-looking and feel encouraged to spend more money. It has long been argued that Japan’s potential economic growth rate (now estimated to be around 0 - 0.5%) has come down along with the country’s aging demographics and declining birth rate. In our opinion, this is why structural reforms in the third arrow (recently replaced by Abenomics “2.0”) are so important and why we believe they will be such a critical factor shaping Japan’s economy going forward.
Critics say that the original vision for Abenomics has failed to deliver. However, we disagree with this myopic view and would argue that it is still too early to dismiss hopes of Japan’s long-term turnaround story. As we are all aware, structural reforms generally take a long time to deliver results, and there are a number of initiatives currently in progress that have already started to positively impact the economy. For example, the government drastically cut the corporate income tax rate from 38% to below 30% over the last three years. Moreover, the acceptance of the Stewardship and Corporate Governance Code by institutional investors and publicly-owned companies has allowed for constructive dialogue between the two parties on the more efficient use of capital. There are many more initiatives expected to be introduced by the current government, such as measures to encourage more women and retired seniors to return to the workforce, to promote strategic resource allocation toward the robotics and AI (artificial intelligence) industries and to continue to deregulate the economy overall.
To be clear, we do not believe every one of the government’s new policies will be as effective as expected. Nor do we believe a single policy can solve all the economic problems facing Japan. We believe the new initiatives, working in conjunction with each
HENNESSYFUNDS.COM
other as a collection of reforms, will continue to help the Japanese economy to move forward. On this point, we find it encouraging that the government and the BOJ appear to have become more “business friendly,” perhaps realizing how important the corporate sector is to sustainable long-term growth.
Japan is, in our opinion, enjoying a period of political stability, particularly in comparison with other countries in the developed world. Prime Minister Abe enjoys high approval ratings (well above 50%), and the ruling coalition parties are firmly in place in both the Upper and Lower Houses, making it easier to push through reforms. In terms of the outlook for corporate profits in Japan, the earnings and volumes of Japan’s leading exporters are holding up in the face of sharp appreciation of the yen. Although we urge investors to prepare themselves for a decline in aggregate profits over at least the next twelve months due to negative translation effects on overseas earnings, the extent of the damage, in our opinion, will be much more moderate than previously seen, thanks to radical streamlining of costs by Japanese companies after the 2008 global financial crisis. Furthermore, unlike during the ‘90s, companies’ balance sheets are stronger today with steady cash flows being reinvested into core businesses. We believe these favorable trends bode well for corporate earnings in the longer term.
We remain optimistic about the long-term prospects for Japan and its stock market. Thank you for your continued confidence and investment in our Funds. If you have any questions or would like to speak with us directly, please don’t hesitate to call us at (800) 966-4354.
Sincerely,
 |  |
| Tadahiro Fujimura | Masakazu Takeda |
| Portfolio Manager, | Portfolio Manager, |
| Hennessy Japan Small Cap Fund; | Hennessy Japan Fund; |
| Chief Investment Officer | Fund Manager |
| SPARX Asset Management Co., Ltd. | SPARX Asset Management Co., Ltd. |
SPARX Asset Management Co., Ltd., located in Tokyo, Japan, is the sub-advisor to the Hennessy Japan Fund and the Hennessy Japan Small Cap Fund.
Past performance does not guarantee future results.
Mutual fund investing involves risk. Principal loss is possible.
Opinions expressed are those of Tadahiro Fujimura and Masakazu Takeda and are subject to change, are not guaranteed and should not be considered investment advice.
The Tokyo Stock Price Index (TOPIX) is an unmanaged index commonly used to measure the performance of Japanese stocks. One cannot invest directly in an index.
Cash flow can be used as an indication of a company’s financial strength and represents earnings before depreciation, amortization, and non-cash charges. It is the net amount of cash and cash-equivalents moving into and out of business.
| HENNESSY FUNDS | 1-800-966-4354 | |
Performance Overview (Unaudited)
CHANGE IN VALUE OF $10,000 INVESTMENT
This graph illustrates the performance of an initial investment of $10,000 made in the Fund ten years ago and assumes the reinvestment of dividends.
AVERAGE ANNUAL TOTAL RETURN FOR PERIODS ENDED OCTOBER 31, 2016
| | One | Five | Ten |
| | Year | Years | Years |
| Hennessy Japan Fund – | | | |
| Investor Class (HJPNX) | 15.54% | 14.74% | 4.99% |
| Hennessy Japan Fund – | | | |
| Institutional Class (HJPIX) | 15.89% | 15.03% | 5.18% |
| Russell/Nomura Total | | | |
MarketTM Index | 5.39% | 8.72% | 1.74% |
| Tokyo Price Index (TOPIX) | 5.01% | 8.47% | 1.56% |
Expense ratios: 1.49% (Investor Class); 1.08% (Institutional Class)
Performance data quoted represents past performance; past performance does not guarantee future results. The investment return and principal value of an investment will fluctuate so that an investor’s shares, when redeemed, may be worth more or less than their original cost. The performance graph and table do not reflect the deduction of taxes that a shareholder would pay on Fund distributions or the redemption of Fund shares. Current performance of the Fund may be lower or higher than the performance quoted. Performance data current to the most recent month end may be obtained by visiting hennessyfunds.com.
The expense ratios presented are from the most recent prospectus.
PERFORMANCE NARRATIVE
Portfolio Managers Masakazu Takeda, CFA and CMA*, and Yu Shimizu, CMA*
SPARX Asset Management Co., Ltd. (sub-advisor)
Performance:
For the twelve-month period ended October 31, 2016, the Investor Class of the Hennessy Japan Fund returned 15.54%, outperforming both the Russell/Nomura Total Market™ Index and the Tokyo Stock Price Index (TOPIX), which returned 5.39% and 5.01% for the same period, respectively, in U.S. Dollar terms.
HENNESSYFUNDS.COM
The largest positive contributors to the Fund’s performance among the 33 TOPIX sub-industries were Electric Appliances and Wholesale Trade and Machinery. Conversely, Banks and Transportation Equipment performed negatively over the 12-month period.
The best performing stocks in the Fund during the period included Keyence Corporation, a supplier of factory automation related sensors, Daikin Industries, Ltd., the largest air conditioner manufacturer in the world, and Misumi Group, Inc., a maker and distributor of metal mold components and precision machinery parts. Shares of Keyence increased on continued strong sales growth. Shares of Daikin gained as a result of solid growth of residential-use air conditioning unit sales in the key markets of Japan, Europe, China and the Americas. Lastly, shares of Misumi Group advanced strongly as the company recorded record-high sales and profits for the fifth consecutive year on strength in demand for their products in Japan and China. The Fund continues to hold all of these positions.
As for the laggards, ASICS Corporation, the high performance running shoe maker, Kao Corporation, Japan’s largest manufacturer of home-care products as well as personal-care goods, and Sumitomo Mitsui Financial Group, Inc., one of Japan’s largest banks, were the major detractors to the Fund’s performance during the period. The drop in the ASICS’ share price is attributable to two events: 1) the company’s announcement of a downward revision to fiscal year 2016 earnings guidance due to a slowdown in its U.S. business, and 2) growing concerns over the outlook for its European sales following the U.K. vote to leave the European Union – the so-called “Brexit” vote – which had a surprising outcome and sent global financial markets into a tailspin. Kao declined due to lower forecasted growth in the current fiscal year as a result of stiffer competition in China. Lastly, Sumitomo Mitsui Financial Group’s profits were negatively impacted, along with those of the rest of the financial sector, by the effects of the monetary policy being implemented by the Bank of Japan. The Fund continues to hold all of these positions.
Market Outlook:
In January of this year, the Bank of Japan (BOJ) introduced a new monetary policy framework, including negative interest rates, which elicited a wide range of reactions and varied interpretations from market participants. Some advocates welcomed the renewed commitment by the BOJ to stimulate faster growth and higher inflation, while sceptics expressed concern that the BOJ was running out of policy tools. Our stance continues to call for the acceleration of structural reforms and not increasing dependence on reflationary policies. We believe it is still too early to give up on hopes of Japan’s long-term turnaround story. As we are all aware, structural reforms generally take a long time to deliver results, and there are a number of initiatives currently in progress that have already started to positively impact the economy. For example, the government drastically cut the corporate income tax rate from 38% to below 30%, and the acceptance of the Stewardship and Corporate Governance Code by institutional investors and publicly owned companies has allowed for constructive dialogue between the two parties on the more efficient use of capital. Further, there are many more initiatives expected to be introduced by the current government, such as measures to encourage more women and retired seniors to return to the workforce, to promote strategic resource allocation toward the robotics & AI (artificial intelligence) industries and to continue to deregulate the economy overall. We anticipate that the high-quality, globally-oriented Japanese companies we seek to invest in should benefit strongly from such initiatives.
_______________
* Chartered Member of the Security Analysts Association of Japan
Opinions expressed are those of the Portfolio Managers as of the date written and are subject to change, are not guaranteed, and should not be considered investment advice or an indication of trading intent.
| HENNESSY FUNDS | 1-800-966-4354 | |
The Russell/Nomura Total Market™ Index contains the top 98% of all stocks listed on Japan’s stock exchange and registered on Japan’s OTC market in terms of market capitalization. The Tokyo Price Index (TOPIX) is a market capitalization-weighted index of all companies listed on the First Section of the Tokyo Stock Exchange. One cannot invest directly in an index.
The Fund invests in small and medium capitalized companies, which may have more limited liquidity and greater price volatility than large capitalization companies. The Fund invests in the stocks of companies operating in Japan; single-country funds may be subject to a higher degree of risk. The Fund may experience higher fees due to investments in pooled investment vehicles (including ETFs). Please see the Fund’s prospectus for a more complete discussion of these and other risks.
References to specific securities should not be considered a recommendation to buy or sell any security. Fund holdings and sector allocations are subject to change. Please refer to the Schedule of Investments included in this report for additional portfolio information.
HENNESSYFUNDS.COM
| PERFORMANCE OVERVIEW/SCHEDULE OF INVESTMENTS |
Financial Statements
Schedule of Investments as of October 31, 2016 |
HENNESSY JAPAN FUND
(% of Net Assets)
| TOP TEN HOLDINGS (EXCLUDING CASH/CASH EQUIVALENTS) | % NET ASSETS |
| | |
| Nidec Corp. | 6.76% |
| | |
| Keyence Corp. | 6.52% |
| | |
| Misumi Group, Inc. | 6.33% |
| | |
| Mitsubishi Corp. | 6.24% |
| | |
| Shimano, Inc. | 6.20% |
| | |
| Softbank Group Co. | 6.00% |
| | |
| Terumo Corp. | 5.97% |
| | |
| Unicharm Corp. | 5.82% |
| | |
| Daikin Industries | 5.54% |
| | |
| Asics Corp. | 5.54% |
Note: For presentation purposes, the Fund has grouped some of the industry categories. For purposes of categorizing securities for compliance with Section 8(b)(1) of the Investment Company Act of 1940, as amended, the Fund uses more specific industry classifications.
| HENNESSY FUNDS | 1-800-966-4354 | |
| | COMMON STOCKS – 92.13% | | Number | | | | | | % of | |
| | | | of Shares | | | Value | | | Net Assets | |
| | Consumer Discretionary – 21.37% | | | | | | | | | |
| | Asics Corp. | | | 336,100 | | | $ | 7,185,432 | | | | 5.54 | % |
| | Isuzu Motors, Ltd. | | | 427,600 | | | | 5,298,619 | | | | 4.09 | % |
| | Ryohin Keikaku Co., Ltd. | | | 28,700 | | | | 6,141,203 | | | | 4.74 | % |
| | Shimano, Inc. | | | 46,900 | | | | 8,032,078 | | | | 6.20 | % |
| | Toyota Motor Corp. | | | 17,900 | | | | 1,037,609 | | | | 0.80 | % |
| | | | | | | | | 27,694,941 | | | | 21.37 | % |
| | | | | | | | | | | | | | |
| | Consumer Staples – 12.42% | | | | | | | | | | | | |
| | Kao Corp. | | | 124,700 | | | | 6,427,038 | | | | 4.96 | % |
| | Pigeon Corp. | | | 75,400 | | | | 2,128,197 | | | | 1.64 | % |
| | Unicharm Corp. | | | 316,800 | | | | 7,547,676 | | | | 5.82 | % |
| | | | | | | | | 16,102,911 | | | | 12.42 | % |
| | | | | | | | | | | | | | |
| | Financials – 1.88% | | | | | | | | | | | | |
| | Mizuho Financial Group | | | 306,200 | | | | 517,098 | | | | 0.40 | % |
| | Sumitomo Mitsui Financial Group, Inc. | | | 55,100 | | | | 1,919,331 | | | | 1.48 | % |
| | | | | | | | | 2,436,429 | | | | 1.88 | % |
| | | | | | | | | | | | | | |
| | Health Care – 10.92% | | | | | | | | | | | | |
| | Rohto Pharmaceutical Co., Ltd. | | | 364,400 | | | | 6,407,491 | | | | 4.95 | % |
| | Terumo Corp. | | | 199,700 | | | | 7,740,827 | | | | 5.97 | % |
| | | | | | | | | 14,148,318 | | | | 10.92 | % |
| | | | | | | | | | | | | | |
| | Industrials – 29.32% | | | | | | | | | | | | |
| | Daikin Industries | | | 74,700 | | | | 7,180,090 | | | | 5.54 | % |
| | Kubota Corp. | | | 356,500 | | | | 5,760,363 | | | | 4.45 | % |
| | Misumi Group, Inc. | | | 448,900 | | | | 8,205,791 | | | | 6.33 | % |
| | Mitsubishi Corp. | | | 370,200 | | | | 8,087,424 | | | | 6.24 | % |
| | Nidec Corp. | | | 90,400 | | | | 8,766,740 | | | | 6.76 | % |
| | | | | | | | | 38,000,408 | | | | 29.32 | % |
| | | | | | | | | | | | | | |
| | Information Technology – 6.52% | | | | | | | | | | | | |
| | Keyence Corp. | | | 11,500 | | | | 8,450,367 | | | | 6.52 | % |
| | | | | | | | | | | | | | |
| | Materials – 3.70% | | | | | | | | | | | | |
| | Fuji Seal International, Inc. | | | 116,100 | | | | 4,799,213 | | | | 3.70 | % |
| | | | | | | | | | | | | | |
| | Telecommunication Services – 6.00% | | | | | | | | | | | | |
| | Softbank Group Co. | | | 123,600 | | | | 7,781,131 | | | | 6.00 | % |
| | | | | | | | | | | | | | |
| | Total Common Stocks | | | | | | | | | | | | |
| | (Cost $82,466,490) | | | | | | | 119,413,718 | | | | 92.13 | % |
The accompanying notes are an integral part of these financial statements.
HENNESSYFUNDS.COM
| | SHORT-TERM INVESTMENTS – 7.46% | | Number | | | | | | % of | |
| | | | of Shares | | | Value | | | Net Assets | |
| | Money Market Funds – 7.46% | | | | | | | | | |
| | Fidelity Government Portfolio, Institutional Class, 0.27% (a) | | | 6,424,000 | | | $ | 6,424,000 | | | | 4.96 | % |
| | The Government & Agency Portfolio, Institutional Class, 0.29% (a) | | | 3,248,249 | | | | 3,248,249 | | | | 2.50 | % |
| | | | | | | | | 9,672,249 | | | | 7.46 | % |
| | | | | | | | | | | | | | |
| | Total Short-Term Investments | | | | | | | | | | | | |
| | (Cost $9,672,249) | | | | | | | 9,672,249 | | | | 7.46 | % |
| | | | | | | | | | | | | | |
| | Total Investments | | | | | | | | | | | | |
| | (Cost $92,138,739) – 99.59% | | | | | | | 129,085,967 | | | | 99.59 | % |
| | Other Assets in Excess of Liabilities – 0.41% | | | | | | | 535,595 | | | | 0.41 | % |
| | | | | | | | | | | | | | |
| | TOTAL NET ASSETS – 100.00% | | | | | | $ | 129,621,562 | | | | 100.00 | % |
Percentages are stated as a percent of net assets.
| (a) | The rate listed is the fund's 7-day yield as of October 31, 2016. |
Summary of Fair Value Exposure at October 31, 2016
The following is a summary of the inputs used to value the Fund's net assets as of October 31, 2016 (see Note 3 in the accompanying notes to the financial statements):
| Common Stocks | | Level 1 | | | Level 2 | | | Level 3 | | | Total | |
| Consumer Discretionary | | $ | 27,694,941 | | | $ | — | | | $ | — | | | $ | 27,694,941 | |
| Consumer Staples | | | 16,102,911 | | | | — | | | | — | | | | 16,102,911 | |
| Financials | | | 2,436,429 | | | | — | | | | — | | | | 2,436,429 | |
| Health Care | | | 14,148,318 | | | | — | | | | — | | | | 14,148,318 | |
| Industrials | | | 38,000,408 | | | | — | | | | — | | | | 38,000,408 | |
| Information Technology | | | 8,450,367 | | | | — | | | | — | | | | 8,450,367 | |
| Materials | | | 4,799,213 | | | | — | | | | — | | | | 4,799,213 | |
| Telecommunication Services | | | 7,781,131 | | | | — | | | | — | | | | 7,781,131 | |
| Total Common Stocks | | $ | 119,413,718 | | | $ | — | | | $ | — | | | $ | 119,413,718 | |
| Short-Term Investments | | | | | | | | | | | | | | | | |
| Money Market Funds | | $ | 9,672,249 | | | $ | — | | | $ | — | | | $ | 9,672,249 | |
| Total Short-Term Investments | | $ | 9,672,249 | | | $ | — | | | $ | — | | | $ | 9,672,249 | |
| Total Investments | | $ | 129,085,967 | | | $ | — | | | $ | — | | | $ | 129,085,967 | |
Transfers between levels are recognized at the end of the reporting period. During the year ended October 31, 2016, the Fund recognized significant transfers between Levels 1 and 2.
Transfers between Level 1 and Level 2 relate to the use of fair valuation pricing service. On days when the fair valuation pricing service is used, non-U.S. dollar denominated securities move from a Level 1 to a Level 2 classification. 100% of common stock held at October 31, 2015, were classified as Level 2. Such securities still held at October 31, 2016, were transferred to Level 1. Other than transfers due to the fair value pricing services, no transfers were recognized.
The accompanying notes are an integral part of these financial statements.
| HENNESSY FUNDS | 1-800-966-4354 | |
Financial Statements
Statement of Assets and Liabilities as of October 31, 2016 |
| ASSETS: | | | |
| Investments in securities, at value (cost $92,138,739) | | $ | 129,085,967 | |
| Dividends and interest receivable | | | 503,797 | |
| Receivable for fund shares sold | | | 578,729 | |
| Prepaid expenses and other assets | | | 26,205 | |
| Total Assets | | | 130,194,698 | |
| | | | | |
| LIABILITIES: | | | | |
| Payable for fund shares redeemed | | | 403,915 | |
| Payable to advisor | | | 86,061 | |
| Payable to administrator | | | 20,150 | |
| Payable to auditor | | | 22,881 | |
| Accrued distribution fees | | | 11,007 | |
| Accrued service fees | | | 5,248 | |
| Accrued trustees fees | | | 3,898 | |
| Accrued expenses and other payables | | | 19,976 | |
| Total Liabilities | | | 573,136 | |
| NET ASSETS | | $ | 129,621,562 | |
| | | | | |
| NET ASSETS CONSIST OF: | | | | |
| Capital stock | | $ | 114,656,613 | |
| Accumulated net investment loss | | | (141,042 | ) |
| Accumulated net realized loss on investments | | | (21,822,325 | ) |
| Unrealized net appreciation on investments | | | 36,928,316 | |
| Total Net Assets | | $ | 129,621,562 | |
| | | | | |
| NET ASSETS | | | | |
| Investor Class: | | | | |
| Shares authorized (no par value) | | Unlimited | |
| Net assets applicable to outstanding Investor Class shares | | $ | 61,845,909 | |
| Shares issued and outstanding | | | 2,223,837 | |
| Net asset value, offering price and redemption price per share | | $ | 27.81 | |
| | | | | |
| Institutional Class: | | | | |
| Shares authorized (no par value) | | Unlimited | |
| Net assets applicable to outstanding Institutional Class shares | | $ | 67,775,653 | |
| Shares issued and outstanding | | | 2,381,945 | |
| Net asset value, offering price and redemption price per share | | $ | 28.45 | |
The accompanying notes are an integral part of these financial statements.
HENNESSYFUNDS.COM
| STATEMENT OF ASSETS AND LIABILITIES/STATEMENT OF OPERATIONS |
Financial Statements
Statement of Operations for the year ended October 31, 2016 |
| INVESTMENT INCOME: | | | |
Dividend income(1) | | $ | 1,338,704 | |
| Interest income | | | 11,198 | |
| Total investment income | | | 1,349,902 | |
| | | | | |
| EXPENSES: | | | | |
| Investment advisory fees (See Note 5) | | | 1,039,332 | |
| Sub-transfer agent expenses – Investor Class (See Note 5) | | | 127,857 | |
| Sub-transfer agent expenses – Institutional Class (See Note 5) | | | 49,139 | |
| Administration, fund accounting, custody and transfer agent fees (See Note 5) | | | 116,954 | |
| Service fees – Investor Class (See Note 5) | | | 59,603 | |
| Distribution fees – Investor Class (See Note 5) | | | 58,907 | |
| Federal and state registration fees | | | 42,029 | |
| Compliance expense (See Note 5) | | | 23,709 | |
| Audit fees | | | 23,574 | |
| Reports to shareholders | | | 22,640 | |
| Trustees' fees and expenses | | | 15,486 | |
| Interest expense (See Note 7) | | | 4,285 | |
| Legal fees | | | 803 | |
| Other expenses | | | 14,741 | |
| Total expenses | | | 1,599,059 | |
| NET INVESTMENT LOSS | | $ | (249,157 | ) |
| | | | | |
| REALIZED AND UNREALIZED GAINS: | | | | |
| Net realized gain on investments | | $ | 1,638,917 | |
| Net change in unrealized appreciation on investments | | | 14,734,429 | |
| Net gain on investments | | | 16,373,346 | |
| NET INCREASE IN NET ASSETS RESULTING FROM OPERATIONS | | $ | 16,124,189 | |
(1) | Net of foreign taxes withheld of $148,745. |
The accompanying notes are an integral part of these financial statements.
| HENNESSY FUNDS | 1-800-966-4354 | |
(This Page Intentionally Left Blank.)
HENNESSYFUNDS.COM
| STATEMENTS OF CHANGES IN NET ASSETS |
Financial Statements
| Statements of Changes in Net Assets |
| | | Year Ended | | | Year Ended | |
| | | October 31, 2016 | | | October 31, 2015 | |
| OPERATIONS: | | | | | | |
| Net investment loss | | $ | (249,157 | ) | | $ | (282,380 | ) |
| Net realized gain (loss) on investments | | | 1,638,917 | | | | (1,416,806 | ) |
| Net change in unrealized appreciation on investments | | | 14,734,429 | | | | 8,195,283 | |
| Net increase in net assets resulting from operations | | | 16,124,189 | | | | 6,496,097 | |
| | | | | | | | | |
| CAPITAL SHARE TRANSACTIONS: | | | | | | | | |
| Proceeds from shares subscribed – Investor Class | | | 28,493,995 | | | | 81,988,307 | |
| Proceeds from shares subscribed – Institutional Class | | | 46,172,033 | | | | 51,273,095 | |
| Cost of shares redeemed – Investor Class | | | (36,063,591 | ) | | | (51,758,304 | ) |
| Cost of shares redeemed – Institutional Class | | | (40,793,598 | ) | | | (25,324,220 | ) |
| Net increase (decrease) in net assets derived | | | | | | | | |
| from capital share transactions | | | (2,191,161 | ) | | | 56,178,878 | |
| TOTAL INCREASE IN NET ASSETS | | | 13,933,028 | | | | 62,674,975 | |
| | | | | | | | | |
| NET ASSETS: | | | | | | | | |
| Beginning of year | | | 115,688,534 | | | | 53,013,559 | |
| End of year | | $ | 129,621,562 | | | $ | 115,688,534 | |
| Undistributed net investment loss, end of year | | $ | (141,042 | ) | | $ | (199,598 | ) |
| | | | | | | | | |
| CHANGES IN SHARES OUTSTANDING: | | | | | | | | |
| Shares sold – Investor Class | | | 1,150,149 | | | | 3,548,664 | |
| Shares sold – Institutional Class | | | 1,820,006 | | | | 2,147,233 | |
| Shares redeemed – Investor Class | | | (1,483,205 | ) | | | (2,244,158 | ) |
| Shares redeemed – Institutional Class | | | (1,643,088 | ) | | | (1,104,942 | ) |
| Net increase (decrease) in shares outstanding | | | (156,138 | ) | | | 2,346,797 | |
The accompanying notes are an integral part of these financial statements.
| HENNESSY FUNDS | 1-800-966-4354 | |
Financial Statements
For an Investor Class share outstanding throughout each year
PER SHARE DATA:
Net asset value, beginning of year
Income from investment operations:
Net investment loss
Net realized and unrealized gains on investments
Total from investment operations
Less distributions:
Dividends from net investment income
Dividends from return of capital
Total distributions
Net asset value, end of year
TOTAL RETURN
SUPPLEMENTAL DATA AND RATIOS:
Net assets, end of year (millions)
Ratio of expenses to average net assets
Ratio of net investment loss to average net assets
Portfolio turnover rate(1)
(1) | Portfolio turnover is calculated on the basis of the Fund as a whole. |
The accompanying notes are an integral part of these financial statements.
HENNESSYFUNDS.COM
| FINANCIAL HIGHLIGHTS — INVESTOR CLASS |
| Year Ended October 31, | | |
| 2016 | | | 2015 | | | 2014 | | | 2013 | | | 2012 | | |
| | | | | | | | | | | | | | | |
| $ | 24.07 | | | $ | 21.77 | | | $ | 19.68 | | | $ | 15.40 | | | $ | 13.99 | | |
| | | | | | | | | | | | | | | | | | | | |
| | | | | | | | | | | | | | | | | | | | |
| | (0.11 | ) | | | (0.10 | ) | | | (0.06 | ) | | | (0.04 | ) | | | (0.02 | ) | |
| | 3.85 | | | | 2.40 | | | | 2.15 | | | | 4.33 | | | | 1.43 | | |
| | 3.74 | | | | 2.30 | | | | 2.09 | | | | 4.29 | | | | 1.41 | | |
| | | | | | | | | | | | | | | | | | | | |
| | | | | | | | | | | | | | | | | | | | |
| | — | | | | — | | | | — | | | | — | | | | — | | |
| | — | | | | — | | | | — | | | | (0.01 | ) | | | — | | |
| | — | | | | — | | | | — | | | | (0.01 | ) | | | — | | |
| $ | 27.81 | | | $ | 24.07 | | | $ | 21.77 | | | $ | 19.68 | | | $ | 15.40 | | |
| | | | | | | | | | | | | | | | | | | | |
| | 15.54 | % | | | 10.56 | % | | | 10.62 | % | | | 27.87 | % | | | 10.08 | % | |
| | | | | | | | | | | | | | | | | | | | |
| | | | | | | | | | | | | | | | | | | | |
| $ | 61.85 | | | $ | 61.56 | | | $ | 27.26 | | | $ | 31.32 | | | $ | 10.38 | | |
| | 1.50 | % | | | 1.53 | % | | | 1.70 | % | | | 1.90 | % | | | 2.03 | % | |
| | (0.38 | )% | | | (0.44 | )% | | | (0.18 | )% | | | (0.35 | )% | | | (0.09 | )% | |
| | 5 | % | | | 21 | % | | | 22 | % | | | 6 | % | | | 2 | % | |
The accompanying notes are an integral part of these financial statements.
| HENNESSY FUNDS | 1-800-966-4354 | |
Financial Statements
For an Institutional Class share outstanding throughout each year
PER SHARE DATA:
Net asset value, beginning of year
Income from investment operations:
Net investment income (loss)
Net realized and unrealized gains on investments
Total from investment operations
Less distributions:
Dividends from net investment income
Dividends from return of capital
Total distributions
Net asset value, end of year
TOTAL RETURN
SUPPLEMENTAL DATA AND RATIOS:
Net assets, end of year (millions)
Ratio of expenses to average net assets
Ratio of net investment income (loss) to average net assets
Portfolio turnover rate(1)
(1) | Portfolio turnover is calculated on the basis of the Fund as a whole. |
The accompanying notes are an integral part of these financial statements.
HENNESSYFUNDS.COM
| FINANCIAL HIGHLIGHTS — INSTITUTIONAL CLASS |
| Year Ended October 31, | | |
| 2016 | | | 2015 | | | 2014 | | | 2013 | | | 2012 | | |
| | | | | | | | | | | | | | | |
| $ | 24.55 | | | $ | 22.15 | | | $ | 19.98 | | | $ | 15.60 | | | $ | 14.14 | | |
| | | | | | | | | | | | | | | | | | | | |
| | | | | | | | | | | | | | | | | | | | |
| | (0.01 | ) | | | (0.02 | ) | | | 0.07 | | | | (0.03 | ) | | | 0.02 | | |
| | 3.91 | | | | 2.42 | | | | 2.10 | | | | 4.42 | | | | 1.44 | | |
| | 3.90 | | | | 2.40 | | | | 2.17 | | | | 4.39 | | | | 1.46 | | |
| | | | | | | | | | | | | | | | | | | | |
| | | | | | | | | | | | | | | | | | | | |
| | — | | | | — | | | | — | | | | — | | | | — | | |
| | — | | | | — | | | | — | | | | (0.01 | ) | | | — | | |
| | — | | | | — | | | | — | | | | (0.01 | ) | | | — | | |
| $ | 28.45 | | | $ | 24.55 | | | $ | 22.15 | | | $ | 19.98 | | | $ | 15.60 | | |
| | | | | | | | | | | | | | | | | | | | |
| | 15.89 | % | | | 10.84 | % | | | 10.86 | % | | | 28.19 | % | | | 10.33 | % | |
| | | | | | | | | | | | | | | | | | | | |
| | | | | | | | | | | | | | | | | | | | |
| $ | 67.78 | | | $ | 54.13 | | | $ | 25.75 | | | $ | 9.07 | | | $ | 8.94 | | |
| | 1.17 | % | | | 1.27 | % | | | 1.50 | % | | | 1.66 | % | | | 1.85 | % | |
| | (0.03 | )% | | | (0.08 | )% | | | 0.26 | % | | | (0.20 | )% | | | 0.13 | % | |
| | 5 | % | | | 21 | % | | | 22 | % | | | 6 | % | | | 2 | % | |
The accompanying notes are an integral part of these financial statements.
| HENNESSY FUNDS | 1-800-966-4354 | |
Financial Statements
Notes to the Financial Statements October 31, 2016 |
1). ORGANIZATION
The Hennessy Japan Fund (the “Fund”) is a series of Hennessy Funds Trust (the “Trust”), which was organized as a Delaware statutory trust on September 17, 1992. The Fund is an open-end management investment company registered under the Investment Company Act of 1940, as amended. The Fund is a successor to a fund with the same name (the “Predecessor Fund”) that was a series of Hennessy SPARX Funds Trust, a Massachusetts business trust, pursuant to a reorganization that took place after the close of business on February 28, 2014. Prior to February 28, 2014, the Fund had no investment operations. As a result of the reorganization, holders of Investor Class shares of the Predecessor Fund received Investor Class shares of the Fund (the Investor Class shares of the Fund are the successor to the accounting and performance information of the corresponding shares of the Predecessor Fund), and holders of Institutional Class shares of the Predecessor Fund received Institutional Class shares of the Fund (the Institutional Class shares of the Fund are the successor to the accounting and performance information of the corresponding shares of the Predecessor Fund). The investment objective of the Fund is long-term capital appreciation. The Fund is a diversified fund, but may employ a relatively focused investment strategy and may hold securities of fewer issuers than other diversified funds.
The Fund offers Investor Class and Institutional Class shares. Each class of shares differs principally in its respective administration, 12b-1 distribution and service, shareholder servicing, and transfer agent expenses (there are no sales charges). Each class has identical rights to earnings, assets, and voting privileges, except for class-specific expenses and exclusive rights to vote on matters affecting only an individual class.
As an investment company, the Fund follows the investment company accounting and reporting guidance of the Financial Accounting Standards Board (“FASB”) Accounting Standard Codification Topic 946 “Financial Services—Investment Companies.”
2). SIGNIFICANT ACCOUNTING POLICIES
The following is a summary of significant accounting policies consistently followed by the Fund in the preparation of the financial statements. These policies conform with U.S. generally accepted accounting principles (“GAAP”).
| a). | Investment Valuation – All investments in securities are recorded at their estimated fair value, as described in Note 3. |
| b). | Federal Income Taxes – No provision for federal income taxes or excise taxes has been made since the Fund has elected to be taxed as a “regulated investment company” and intends to distribute substantially all of its taxable income to its shareholders and otherwise comply with the provisions of the Internal Revenue Code of 1986, as amended, applicable to regulated investment companies. Net investment income or loss and realized gains and losses for federal income tax purposes may differ from that reported on the financial statements because of temporary book and tax basis differences. Temporary differences are primarily the result of the treatment of wash sales for tax reporting purposes. The Fund recognizes interest and penalties related to income tax benefits, if any, in the statement of operations as an income tax expense. Distributions from net realized gains for book purposes may include short-term capital gains, which are included as ordinary income to shareholders for tax purposes. |
HENNESSYFUNDS.COM
| NOTES TO THE FINANCIAL STATEMENTS |
| | Due to inherent differences in the recognition of income, expenses, and realized gains/losses under GAAP and federal income tax regulations, permanent differences between book and tax basis for reporting for the fiscal year ended October 31, 2016, have been identified and appropriately reclassified on the Statement of Assets and Liabilities. The adjustments are as follows: |
| | Undistributed | Accumulated | | |
| | Net Investment | Net Realized | | |
| | Income/(Loss) | Gain/(Loss) | Paid-in Capital | |
| | $307,713 | $6,217,542 | $(6,525,255) | |
| c). | Accounting for Uncertainty in Income Taxes – The Fund has accounting policies regarding recognition and measurement of tax positions taken or expected to be taken on a tax return. The tax returns of the Fund for the prior three fiscal years are open for examination. The Fund has reviewed all open tax years in major jurisdictions and concluded that there is no impact on the Fund’s net assets and no tax liability resulting from unrecognized tax benefits relating to uncertain income tax positions taken or expected to be taken on a tax return. The Fund’s major tax jurisdictions are U.S. federal and Delaware. |
| d). | Income and Expenses – Dividend income is recognized on the ex-dividend date or as soon as information is available to the Fund. Interest income, which includes the amortization of premium and accretion of discount, is recognized on an accrual basis. The Fund is charged for those expenses that are directly attributable to the portfolio, such as advisory, administration, and certain shareholder service fees. Income, expenses (other than expenses attributable to a specific class), and realized and unrealized gains or losses on investments are allocated to each class of shares based on its respective net assets. |
| e). | Distributions to Shareholders – Dividends from net investment income for the Fund, if any, are declared and paid annually, usually in December. Distributions of net realized capital gains, if any, are declared and paid annually, usually in December. |
| f). | Security Transactions – Investment and shareholder transactions are recorded on the trade date. The Fund determines the gain or loss realized from the investment transactions by comparing the original cost of the security lot sold with the net sale proceeds. Discounts and premiums on securities purchased are accreted/amortized over the life of the respective security. |
| g). | Use of Estimates – The preparation of financial statements in conformity with GAAP requires management to make estimates and assumptions that affect the reported amounts of assets and liabilities and disclosure of contingent assets and liabilities at the date of the financial statements and the reported change in net assets during the reporting period. Actual results could differ from those estimates. |
| h). | Share Valuation – The net asset value (“NAV”) per share of the Fund is calculated by dividing the sum of the value of the securities held by the Fund, plus cash or other assets, minus all liabilities (including estimated accrued expenses) by the total number of shares outstanding for the Fund, rounded to the nearest cent. The Fund’s shares will not be priced on days the New York Stock Exchange is closed for trading. The offering and redemption price per share for the Fund is equal to the Fund’s NAV per share. |
| i). | Foreign Currency – Values of investments denominated in foreign currencies are converted into U.S. dollars using the spot market rate of exchange at the time of valuation. Purchases and sales of investments and income are translated into U.S. dollars using the spot market rate of exchange prevailing on the respective dates of |
| HENNESSY FUNDS | 1-800-966-4354 | |
| | such transactions. The Fund does not isolate the portion of the results of operations resulting from fluctuations in foreign exchange rates on investments from fluctuations resulting from changes in the market prices of securities held. Such fluctuations are included with the net realized and unrealized gain or loss on investments. Foreign investments present additional risks due to currency fluctuations, economic and political factors, lower liquidity, government regulations, differences in accounting standards, and other factors. |
| j). | Forward Contracts – The Fund may enter into forward currency contracts to reduce its exposure to changes in foreign currency exchange rates on its foreign holdings and to lock in the U.S. dollar cost of firm purchase and sale commitments for securities denominated in foreign currencies. A forward currency contract is a commitment to purchase or sell a foreign currency at a future date at a negotiated forward rate. The gain or loss arising from the difference between the U.S. dollar cost of the original contract and the value of the foreign currency in U.S. dollars upon closing of such contract is included in net realized gain or loss from foreign currency transactions. During the fiscal year ended October 31, 2016, the Fund did not enter into any forward contracts. |
| k). | Repurchase Agreements – The Fund may enter into repurchase agreements with member banks or security dealers of the Federal Reserve Board whom the investment advisor deems creditworthy. The repurchase price generally equals the price paid by the Fund plus interest negotiated on the basis of current short-term rates. |
| | Securities pledged as collateral for repurchase agreements are held by the custodian bank until the respective agreements mature. Provisions of the repurchase agreements ensure that the market value of the collateral, including accrued interest thereon, is sufficient to cover the repurchase amount in the event of default of the counterparty. If the counterparty defaults and the value of the collateral declines or if the counterparty enters an insolvency proceeding, realization of the collateral by the Fund may be delayed or limited. During the fiscal year ended October 31, 2016, the Fund did not enter into any repurchase agreements. |
| l). | Derivatives – The Fund may invest in, or enter into, derivatives, such as options, futures contracts, options on futures contracts, and swaps, for a variety of reasons, including to hedge certain risks, to provide a substitute for purchasing or selling particular securities, or to increase potential income gain. Derivatives are financial contracts based on an underlying or notional amount, require no initial investment or an initial net investment that is smaller than would normally be required to have a similar response to changes in market factors, and require or permit net settlement. Derivatives may allow the Fund to increase or decrease the level of risk to which the Fund is exposed more quickly and efficiently than transactions in other types of instruments. The main purpose of utilizing derivative instruments is for hedging purposes. |
| | The Fund follows the financial accounting reporting rules as required by the Derivatives and Hedging Topic of the FASB Accounting Standards Codification. Under such rules, the Fund is required to include enhanced disclosure that enables investors to understand how and why an entity uses derivatives, how derivatives are accounted for, and how derivatives instruments affect an entity’s results of operations and financial position. During the fiscal year ended October 31, 2016, the Fund did not hold any derivative instruments. |
| m). | New Accounting Pronouncements – In May 2015, the FASB issued ASU No. 2015-07 “Disclosure for Investments in Certain Entities that Calculate Net Asset Value per Share (or Its Equivalent).” The amendments in ASU No. 2015-07 remove the |
HENNESSYFUNDS.COM
| NOTES TO THE FINANCIAL STATEMENTS |
| | requirement to categorize within the fair value hierarchy investments measured at NAV and require the disclosure of sufficient information to reconcile the fair value of the remaining assets categorized within the fair value hierarchy to the financial statements. The amendments in ASU No. 2015-07 are effective for fiscal years beginning after December 15, 2015, and interim periods within those fiscal years. Management has reviewed the requirements and believes the adoption of ASU 2015-07 will not have a material impact on the Fund’s financial statements and related disclosures. |
3). SECURITIES VALUATION
The Fund follows authoritative fair valuation accounting standards that establish an authoritative definition of fair value and set out a hierarchy for measuring fair value. These standards require additional disclosures about the various inputs and valuation techniques used to develop the measurements of fair value and a discussion in changes in valuation techniques and related inputs during the period. These inputs are summarized in the three broad levels listed below:
| | Level 1 – | Unadjusted, quoted prices in active markets for identical instruments that the Fund has the ability to access at the date of measurement. |
| | Level 2 – | Other significant observable inputs (including, but not limited to, quoted prices in active markets for similar instruments, quoted prices in markets that are not active for identical or similar instruments, and model-derived valuations in which all significant inputs and significant value drivers are observable in active markets (such as interest rates, prepayment speeds, credit risk curves, default rates, and similar data)). |
| | Level 3 – | Significant unobservable inputs (including the Fund’s own assumptions about what market participants would use to price the asset or liability based on the best available information) when observable inputs are unavailable. |
Following is a description of the valuation techniques applied to the Fund’s major categories of assets and liabilities measured at fair value on a recurring basis.
Equity Securities – Equity securities, including common stocks, preferred stocks, foreign-issued common stocks, exchange-traded funds, closed-end mutual funds, partnerships, rights, and real estate investment trusts, that are traded on a securities exchange for which a last-quoted sales price is readily available will generally be valued at the last sales price as reported by the primary exchange on which the securities are listed. Securities listed on The NASDAQ Stock Market (“NASDAQ”) will generally be valued at the NASDAQ Official Closing Price, which may differ from the last sales price reported. Securities traded on a securities exchange for which a last-quoted sales price is not readily available will generally be valued at the mean between the bid and ask prices. To the extent these securities are actively traded and valuation adjustments are not applied, they are classified in Level 1 of the fair value hierarchy. Securities traded on foreign exchanges generally are not valued at the same time the Fund calculates its NAV because most foreign markets close well before such time. The earlier close of most foreign markets gives rise to the possibility that significant events, including broad market moves, may have occurred in the interim. In certain circumstances, it may be determined that a security needs to be fair valued because it appears that the value of the security might have been materially affected by events occurring after the close of the market in which the security is principally traded, but before the time the Fund calculates its NAV, such as by a development that affects an entire market or region (e.g., weather-related events) or a potentially global development (e.g., a terrorist attack that may be expected to have an effect on investor expectations worldwide).
| HENNESSY FUNDS | 1-800-966-4354 | |
Registered Investment Companies – Investments in registered investment companies (e.g., mutual funds) are generally priced at the ending NAV provided by the applicable registered investment company’s service agent and will be classified in Level 1 of the fair value hierarchy.
Debt Securities – Debt securities, including corporate bonds, asset-backed securities, mortgage-backed securities, municipal bonds, U.S. Treasuries, and U.S. government agency issues, are generally valued at market on the basis of valuations furnished by an independent pricing service that utilizes both dealer-supplied valuations and formula-based techniques. The pricing service may consider recently executed transactions in securities of the issuer or comparable issuers, market price quotations (where observable), bond spreads, and fundamental data relating to the issuer. In addition, the model may incorporate observable market data, such as reported sales of similar securities, broker quotes, yields, bids, offers, and reference data. Certain securities are valued primarily using dealer quotations. These securities are generally classified in Level 2 of the fair value hierarchy.
Short-Term Securities – Short-term equity investments, including money market funds, are valued in the manner specified above. Short-term debt investments with an original term to maturity of 60 days or less are valued at amortized cost, which approximates fair market value. If the original term to maturity of a short-term debt investment exceeded 60 days, then the values as of the 61st day prior to maturity are amortized. Amortized cost is not used if its use would be inappropriate due to credit or other impairments of the issuer, in which case the security’s fair value would be determined, as described below. Short-term securities are generally classified in Level 1 or Level 2 of the fair market hierarchy depending on the inputs used and market activity levels for specific securities.
The Board of Trustees of the Fund (the “Board”) has adopted fair value pricing procedures that are followed when a price for a security is not readily available or if a significant event has occurred that indicates the closing price of a security no longer represents the true value of that security. Fair value pricing determinations are made in good faith in accordance with these procedures. There are numerous criteria that will be given consideration in determining a fair value of a security, such as the trading volume of a security and markets, the value of other like securities, and news events with direct bearing to a security or markets. Fair value pricing results in an estimated price for a security that reflects the amount the Fund might reasonably expect to receive in a current sale. Depending on the relative significance of the valuation inputs, these securities may be classified in either Level 2 or Level 3 of the fair value hierarchy.
The fair valuation of foreign securities may be determined with the assistance of a pricing service using correlations between the movement of prices of such securities and indices of domestic securities and other appropriate indicators, such as closing market prices of relevant American Depositary Receipts or futures contracts. The effect of using fair value pricing is that the Fund’s NAV will reflect the affected portfolio securities’ value as determined by the Board or its designee instead of being determined by the market. Using a fair value pricing methodology to price foreign securities may result in a value that is different from a foreign security’s most recent closing price and from the prices used by other investment companies to calculate their NAVs and are generally considered Level 2 prices in the fair valuation hierarchy. Because the Fund may invest in foreign securities, the value of the Fund’s portfolio securities may change on days when you will not be able to purchase or redeem your shares.
The Board has delegated day-to-day valuation matters to a Valuation Committee comprised of one or more representatives from Hennessy Advisors, Inc., the Fund’s investment advisor. The function of the Valuation Committee is to value securities where
HENNESSYFUNDS.COM
| NOTES TO THE FINANCIAL STATEMENTS |
current and reliable market quotations are not readily available. All actions taken by the Valuation Committee are reviewed by the Board.
The Fund has performed an analysis of all existing investments to determine the significance and character of all inputs to their fair value determination. Various inputs are used in determining the value of the Fund’s investments. The inputs or methodology used for valuing securities are not necessarily an indication of the risk associated with investing in those securities. Details related to the fair valuation hierarchy of the Fund’s securities as of October 31, 2016, are included in the Fund’s Schedule of Investments.
4). INVESTMENT TRANSACTIONS
Purchases and sales of investment securities (excluding government and short-term investments) for the Fund during the fiscal year ended October 31, 2016, were $5,649,048 and $11,435,819, respectively.
There were no purchases or sales/maturities of long-term U.S. government securities for the Fund during the fiscal year ended October 31, 2016.
The Fund is permitted to purchase or sell securities from or to another fund in the Hennessy Funds family of funds (the “Hennessy Funds”) under specified conditions outlined in procedures adopted by the Board of Trustees. The procedures have been designed to ensure that any purchase or sale of securities by the Fund from or to another Hennessy Fund complies with Rule 17a-7 of the Investment Company Act of 1940. For the fiscal year ended October 31, 2016, the Fund did not engage in purchases and sales of securities pursuant to Rule 17a-7 of the Investment Company Act of 1940.
5). INVESTMENT MANAGEMENT FEE AND OTHER TRANSACTIONS WITH AFFILIATES
Hennessy Advisors, Inc. (the “Advisor”) is the investment advisor of the Fund. The Advisor provides the Fund with investment management services under an Investment Advisory Agreement. The Advisor furnishes all investment advice, office space, facilities, and provides most of the personnel needed by the Fund. As compensation for its services, the Advisor is entitled to a monthly fee from the Fund. The fee is based upon the average daily net assets of the Fund at the annual rate of 1.00% until March 1, 2016, at which time the fee was reduced to an annual rate of 0.80%. The net investment advisory fees payable by the Fund as of October 31, 2016, were $86,061.
The Advisor has delegated the day-to-day management of the Fund to a sub-advisor, SPARX Asset Management Co., Ltd. The Advisor pays the sub-advisor fees from its own assets and these fees are not an additional expense of the Fund. For the most recent fiscal year, the Advisor (not the Fund) paid a sub-advisory fee, based upon the daily net assets of the Fund, at the rate of 0.35%.
The Board has approved a Shareholder Servicing Agreement for Investor Class shares of the Fund, which was instituted to compensate the Advisor for the non-investment management services it provides to the Fund. The Shareholder Servicing Agreement provides for a monthly fee paid to the Advisor at an annual rate of 0.10% of the average daily net assets of the Fund attributable to Investor Class shares. Shareholder service fees payable by the Fund as of October 31, 2016, were $5,248.
The Fund has adopted a plan pursuant to Rule 12b-1 under the Investment Company Act of 1940, as amended, that authorizes payments in connection with the distribution of the Fund’s shares at an annual rate of up to 0.25% of the Fund’s average daily net assets attributable to Investor Class shares. Even though the authorized rate is up to 0.25%, the Fund has only used up to 0.15% of its average daily net assets attributable to Investor Class shares for such purpose since the plan was implemented on
| HENNESSY FUNDS | 1-800-966-4354 | |
March 1, 2016. Amounts paid under the plan may be spent on any activities or expenses primarily intended to result in the sale of shares, including, but not limited to, advertising, shareholder account servicing, the printing and mailing of prospectuses to other than current shareholders, the printing and mailing of sales literature, and compensation for sales and marketing activities or to financial institutions and others, such as dealers and distributors.
The Fund has entered into agreements with various brokers, dealers, and financial intermediaries in connection with the sale of shares of the Fund. The agreements provide for periodic payments by the Fund to the brokers, dealers, and financial intermediaries for providing certain shareholder maintenance services (sub-transfer agent expenses). These shareholder services include the pre-processing and quality control of new accounts, shareholder correspondence, answering customer inquiries regarding account status, and facilitating shareholder telephone transactions. Fees paid by the Fund to various brokers, dealers, and financial intermediaries during the fiscal year ended October 31, 2016, were $176,996.
U.S. Bancorp Fund Services, LLC (“USBFS”) provides the Fund with administrative, fund accounting, and transfer agent services, and necessary office equipment. As administrator, USBFS is responsible for activities such as (i) preparing various federal and state regulatory filings, reports, and returns for the Fund, (ii) preparing reports and materials to be supplied to the Board, (iii) monitoring the activities of the Fund’s custodian, transfer agent, and accountants, and (iv) coordinating the preparation and payment of the Fund’s expenses and reviewing the Fund’s expense accruals. Fees paid to USBFS during the fiscal year ended October 31, 2016, were $116,954.
U.S. Bank, N.A., an affiliate of USBFS, serves as the Fund’s custodian. Quasar Distributors, LLC acts as the Fund’s principal underwriter in a continuous public offering of the Fund’s shares. Quasar Distributors, LLC is an affiliate of USBFS and U.S. Bank, N.A.
The officers of the Fund are affiliated with the Advisor. Such officers, with the exception of the Chief Compliance Officer and the Senior Compliance Officer, receive no compensation from the Fund for serving in their respective roles. The Fund, along with the other Hennessy Funds, makes reimbursement payments, on an equal basis, to the Advisor for a portion of the salary and benefits associated with the office of the Chief Compliance Officer and for all of the salary and benefits associated with the office of the Senior Compliance Officer. Such amounts are included on the Statement of Operations.
6). GUARANTEES AND INDEMNIFICATIONS
Under the Hennessy Funds’ organizational documents, their officers and trustees are indemnified by the Hennessy Funds against certain liabilities arising out of the performance of their duties to the Hennessy Funds. Additionally, in the normal course of business, the Hennessy Funds enter into contracts with service providers that contain general indemnification clauses. The Fund’s maximum exposure under these arrangements is unknown as this would involve future claims that may be made against the Fund that have not yet occurred. Currently, the Fund expects the risk of loss to be remote.
7). LINE OF CREDIT
The Fund has an uncommitted line of credit with the other Hennessy Funds in the amount of the lesser of (i) $100,000,000 or (ii) 33.33% of each Hennessy Fund’s net assets, or 30% for the Hennessy Gas Utility Fund and 10% for the Hennessy Balanced Fund, intended to provide short-term financing, if necessary, subject to certain restrictions, in connection with shareholder redemptions. The credit facility is with the Hennessy Funds’ custodian bank, U.S. Bank, N.A. Borrowings under this arrangement
HENNESSYFUNDS.COM
| NOTES TO THE FINANCIAL STATEMENTS |
bear interest at the bank’s prime rate and are secured by all of the Fund’s assets (as to its own borrowings only). During the fiscal year ended October 31, 2016, the Fund had an outstanding average daily balance and a weighted average interest rate of $120,787 and 3.47%, respectively. The maximum amount outstanding for the Fund during the period was $6,205,000. At October 31, 2016, the Fund did not have any borrowings outstanding under the line of credit.
8). FEDERAL TAX INFORMATION
As of October 31, 2016, the components of accumulated earnings (losses) for income tax purposes were as follows:
| Cost of investments for tax purposes | | $ | 92,280,031 | |
| Gross tax unrealized appreciation | | $ | 37,922,030 | |
| Gross tax unrealized depreciation | | | (1,116,094 | ) |
| Net tax unrealized appreciation | | $ | 36,805,936 | |
| Undistributed ordinary income | | $ | — | |
| Undistributed long-term capital gains | | | — | |
| Total distributable earnings | | $ | — | |
| Other accumulated loss | | $ | (21,840,987 | ) |
| Total accumulated gain | | $ | 14,964,949 | |
The difference between book-basis unrealized appreciation/depreciation (as shown in the Statement of Assets and Liabilities) and tax-basis unrealized appreciation/depreciation (as shown above) is attributable primarily to wash sales.
At October 31, 2016, the Fund had capital loss carryforwards that expire as follows:
| $15,450,664 | October 31, 2017 |
| $ 6,121,138 | October 31, 2018 |
| $ 109,231 | Indefinite ST |
Capital losses sustained in the fiscal year ended October 31, 2012, and in future taxable years will not expire and may be carried over by the Fund without limitation; however, they will retain the character of the original loss. Furthermore, any loss incurred during those taxable years will be required to be utilized prior to the losses incurred in taxable years prior to 2012. As a result of this ordering rule, pre-enactment capital loss carryforwards may be more likely to expire unused. Under pre-enactment law, capital losses could be carried forward for eight years, and carried forward as short-term capital losses, irrespective of the character of the original loss.
At October 31, 2016, the Fund deferred, on a tax basis, a post-December late year ordinary loss deferral of $141,042.
During the fiscal years ended October 31, 2016 and 2015, the Fund did not pay any distributions.
9). EVENTS SUBSEQUENT TO YEAR END
Management has evaluated the Fund’s related events and transactions that occurred subsequent to October 31, 2016, through the date of issuance of the Fund’s financial statements. Management has determined that there were no subsequent events requiring recognition or disclosure in the financial statements.
| HENNESSY FUNDS | 1-800-966-4354 | |
Report of Independent Registered Public Accounting Firm
The Board of Trustees of Hennessy Funds Trust
and Shareholders of the Hennessy Japan Fund:
We have audited the accompanying statement of assets and liabilities of the Hennessy Japan Fund (the Fund), a series of Hennessy Funds Trust, including the schedule of investments, as of October 31, 2016, and the related statement of operations for the year then ended, the statements of changes in net assets for each of the years in the two year period then ended, and the financial highlights for each of the years in the five year period then ended. These financial statements and financial highlights are the responsibility of the Fund’s management. Our responsibility is to express an opinion on these financial statements and financial highlights based on our audits.
We conducted our audits in accordance with the standards of the Public Company Accounting Oversight Board (United States). Those standards require that we plan and perform the audit to obtain reasonable assurance about whether the financial statements and financial highlights are free of material misstatement. An audit includes examining, on a test basis, evidence supporting the amounts and disclosures in the financial statements. Our procedures included confirmation of securities owned as of October 31, 2016, by correspondence with custodians and brokers or by other appropriate auditing procedures. An audit also includes assessing the accounting principles used and significant estimates made by management, as well as evaluating the overall financial statement presentation. We believe that our audits provide a reasonable basis for our opinion.
In our opinion, the financial statements and financial highlights referred to above present fairly, in all material respects, the financial position of the Fund as of October 31, 2016, the results of its operations for the year then ended, the changes in its net assets for each of the years in the two year period then ended, and the financial highlights for each of the years in the five year period then ended, in conformity with U.S. generally accepted accounting principles.
Chicago, Illinois
December 22, 2016
HENNESSYFUNDS.COM
| REPORT OF INDEPENDENT REGISTERED PUBLIC ACCOUNTING FIRM/TRUSTEES AND OFFICERS |
Trustees and Officers of the Fund (Unaudited)
The business and affairs of the Fund are managed under the direction of the Board of Trustees of the Trust, and the Board of Trustees elects the Officers of the Trust. Beginning in March 2015, the Board of Trustees has from time to time appointed advisers (“Advisers “) to the Board of Trustees, with the intention of having qualified individuals serve in an advisory capacity in order to garner experience in the mutual fund and asset management industry and be considered as potential Trustees in the future. There are currently three Advisers to the Board of Trustees: Brian Alexander, Doug Franklin, and Claire Knoles. As Advisers, Mr. Alexander, Mr. Franklin, and Ms. Knoles attend meetings of the Board and act as non-voting participants. Information pertaining to the Trustees, Advisers, and the Officers of the Trust is set forth below. The Trustees and Officers serve until their successors are duly elected and qualified or until their earlier death, resignation, or removal. Each of the Trustees oversees 16 Hennessy Funds. Unless otherwise indicated, the address of all persons listed below is 7250 Redwood Boulevard, Suite 200, Novato, CA 94945. The Fund’s Statement of Additional Information includes more information about the persons listed below and is available, without charge, upon request by calling 1-800-966-4354.
| | | | Other |
| | | | Directorships |
| | | | Held Outside |
| Name, (Year of Birth), | | | of Fund |
| and Position Held | Start Date | Principal Occupation(s) | Complex During |
with the Trust | of Service | During Past Five Years | Past Five Years(1) |
| | | |
| Disinterested Trustees and Advisers | | |
| | | | |
| J. Dennis DeSousa | January 1996 | Mr. DeSousa is a real estate investor. | None. |
| (1936) | | | |
| Trustee | | | |
| | | | |
| Robert T. Doyle | January 1996 | Mr. Doyle has been the Sheriff of | None. |
| (1947) | | Marin County, California since 1996. | |
| Trustee | | | |
| | | | |
| Gerald P. Richardson | May 2004 | Mr. Richardson is an independent | None. |
| (1945) | | consultant in the securities industry. | |
| Trustee | | | |
| | | | |
| Brian Alexander | March 2015 | Mr. Alexander has been employed | None. |
| (1981) | | by Sutter Health Novato Community | |
| Adviser to the Board | | Hospital since 2012, first as an | |
| | | Assistant Administrator and then, | |
| | | beginning in 2013, as the Chief | |
| | | Administrative Officer. From 2011 | |
| | | through 2012, Mr. Alexander was | |
| | | employed by Sutter Health West Bay | |
| | | Region as the Regional Director of | |
| | | Strategic Decision Support. Prior to | |
| | | that, in 2011, he served as the | |
| | | Director of Managed Care | |
| | | Contracting and also the Director of | |
| | | Compensation, Benefits, and | |
| | | Compliance for the Rehabilitation | |
| | | Institute of Chicago. | |
| HENNESSY FUNDS | 1-800-966-4354 | |
| | | | Other |
| | | | Directorships |
| | | | Held Outside |
| Name, (Year of Birth), | | | of Fund |
| and Position Held | Start Date | Principal Occupation(s) | Complex During |
with the Trust | of Service | During Past Five Years | Past Five Years(1) |
| | | | |
| Doug Franklin | March 2016 | Mr. Franklin is a retired insurance | None. |
| (1964) | | industry executive. From 1987 | |
| Adviser to the Board | | through 2015, he was employed by | |
| | | the Allianz-Fireman’s Fund Insurance | |
| | | Company in various positions, | |
| | | including as its Chief Actuary and | |
| | | Chief Risk Officer. | |
| | | | |
| Claire Knoles | December 2015 | Ms. Knoles is a founder of Kiosk and | None. |
| (1974) | | has served as its Chief Operating | |
| Adviser to the Board | | Officer since 2004. Kiosk is a full | |
| | | service marketing agency with | |
| | | offices in the San Francisco Bay | |
| | | Area, Toronto, and Liverpool, UK. | |
| | | | |
Interested Trustee(2) | | | |
| | | | |
| Neil J. Hennessy | January 1996 as | Mr. Hennessy has been employed by | Hennessy |
| (1956) | a Trustee and | Hennessy Advisors, Inc. since 1989 | Advisors, Inc. |
| Trustee, Chairman of | June 2008 as | and currently serves as its President, | |
| the Board, Chief | an Officer | Chairman and Chief Executive Officer. | |
| Investment Officer, | | | |
| Portfolio Manager, | | | |
| and President | | | |
| Name, (Year of Birth), | | |
| and Position Held | Start Date | Principal Occupation(s) |
with the Trust | of Service | During Past Five Years |
| | | |
| Officers | | |
| | | |
| Teresa M. Nilsen | January 1996 | Ms. Nilsen has been employed by Hennessy Advisors, Inc. |
| (1966) | | since 1989 and currently serves as its Executive Vice President, |
| Executive Vice President | | Chief Operations Officer, Chief Financial Officer, and Secretary. |
| and Treasurer | | |
| | | |
| Daniel B. Steadman | March 2000 | Mr. Steadman has been employed by Hennessy Advisors, Inc. |
| (1956) | | since 2000 and currently serves as its Executive Vice President |
| Executive Vice President | | and Chief Compliance Officer. |
| and Secretary | | |
| | | |
| Jennifer Cheskiewicz | June 2013 | Ms. Cheskiewicz has been employed by Hennessy Advisors, Inc. |
| (1977) | | as its General Counsel since June 2013. She previously served |
| Senior Vice President and | | as in-house counsel to Carlson Capital, L.P., an SEC-registered |
| Chief Compliance Officer | | investment advisor to several private funds, from |
| | | February 2010 to May 2013. |
| | | |
| Brian Carlson | December 2013 | Mr. Carlson has been employed by Hennessy Advisors, Inc. |
| (1972) | | since December 2013. Mr. Carlson was previously a co-founder |
| Senior Vice President and | | and principal of Trivium Consultants, LLC from February 2011 |
| Head of Distribution | | through November 2013. |
HENNESSYFUNDS.COM
| TRUSTEES AND OFFICERS OF THE FUND |
| Name, (Year of Birth), | | |
| and Position Held | Start Date | Principal Occupation(s) |
with the Trust | of Service | During Past Five Years |
| | | |
| David Ellison | October 2012 | Mr. Ellison has been employed by Hennessy Advisors, Inc. since |
(1958)(3) | | October 2012. He has served as a Portfolio Manager of the |
| Senior Vice President and | | Hennessy Small Cap Financial Fund, the Hennessy Large Cap |
| Portfolio Manager | | Financial Fund, and the Hennessy Technology Fund since |
| | | inception. Prior to that, Mr. Ellison served as Director, CIO and |
| | | President of FBR Fund Advisers, Inc. from December |
| | | 1999 to October 2012. |
| | | |
| Brian Peery | March 2003 as | Mr. Peery has been employed by Hennessy Advisors, Inc. since |
| (1969) | an Officer and | 2002. He has served as a Portfolio Manager of the Hennessy |
| Senior Vice President and | February 2011 | Cornerstone Growth Fund, the Hennessy Cornerstone Mid Cap |
| Portfolio Manager | as a Co-Portfolio | 30 Fund, the Hennessy Cornerstone Large Growth Fund, the |
| | Manager or | Hennessy Cornerstone Value Fund, the Hennessy Total Return |
| | Portfolio Manager | Fund, and the Hennessy Balanced Fund since October 2014. |
| | | He served as Co-Portfolio Manager of the same funds from |
| | | February 2011 through September 2014. Mr. Peery has also |
| | | served as a Portfolio Manager of the Hennessy Gas Utility Fund |
| | | since February 2015. |
| | | |
| Winsor (Skip) Aylesworth | October 2012 | Mr. Aylesworth has been employed by Hennessy Advisors, Inc. |
(1947)(3) | | since October 2012. He has served as a Portfolio Manager of |
| Vice President and | | the Hennessy Gas Utility Fund since 1998 and as a Portfolio |
| Portfolio Manager | | Manager of the Hennessy Technology Fund since inception. |
| | | Prior to that, Mr. Aylesworth served as Executive Vice President |
| | | of FBR Fund Advisers, Inc. from 1999 to October 2012. |
| | | |
| Ryan Kelley | March 2013 | Mr. Kelley has been employed by Hennessy Advisors, Inc. since |
(1972)(4) | | October 2012. He has served as a Portfolio Manager of the |
| Vice President and | | Hennessy Gas Utility Fund, the Hennessy Small Cap Financial |
| Portfolio Manager | | Fund, and the Hennessy Large Cap Financial Fund since |
| | | October 2014. He served as Co-Portfolio Manager of the same |
| | | funds from March 2013 through September 2014, and as a |
| | | Portfolio Analyst for the Hennessy Funds from October 2012 |
| | | through February 2013. Prior to that, Mr. Kelley served as |
| | | Portfolio Manager of FBR Fund Advisers, Inc. from |
| | | January 2008 to October 2012. |
_______________
(1) | Messrs. DeSousa, Doyle, Hennessy, and Richardson previously served on the Board of Directors of Hennessy Mutual Funds, Inc. (“HMFI”), The Hennessy Funds, Inc. (“HFI”), and Hennessy SPARX Funds Trust (“HSFT”). Pursuant to an internal reorganization effective as of February 28, 2014, the series of HFMI, HFI, and HSFT were reorganized into corresponding series of Hennessy Funds Trust that mirrored them. Subsequent to the reorganization, HFMI, HFI, and HSFT were dissolved. |
(2) | Mr. Hennessy is considered an “interested person,” as defined in the Investment Company Act of 1940, as amended, because he is an officer of the Hennessy Funds. |
(3) | The address of these officers is 101 Federal Street, Suite 1900, Boston, MA 02110. |
(4) | The address of this officer is 1340 Environ Way, Suite 305, Chapel Hill, NC 27517. |
| HENNESSY FUNDS | 1-800-966-4354 | |
Expense Example (Unaudited)
October 31, 2016
As a shareholder of the Fund, you incur two types of costs: (1) transaction costs, including sales charges (loads) on purchase payments, reinvested dividends, or other distributions; redemption fees; and exchange fees; and (2) ongoing costs, including management fees; service fees; and other Fund expenses. This Example is intended to help you understand your ongoing costs (in dollars) of investing in the Fund and to compare these costs with the ongoing costs of investing in other mutual funds. The Example is based on an investment of $1,000 invested at the beginning of the period and held for the entire period from May 1, 2016, through October 31, 2016.
Actual Expenses
The first line of the table below under the “Investor Class” and “Institutional Class” headings provides information about actual account values and actual expenses. Although the Fund charges no sales loads or transaction fees, you will be assessed fees for outgoing wire transfers, returned checks and stop payment orders at prevailing rates charged by U.S. Bancorp Fund Services, LLC, the Fund’s transfer agent. If you request that a redemption be made by wire transfer, currently a $15 fee is charged by the Fund’s transfer agent. IRA accounts will be charged a $15 annual maintenance fee. The example below includes, but is not limited to, management fees, shareholder servicing fees, fund accounting, custody, and transfer agent fees. However, the example below does not include portfolio trading commissions and related expenses, and other extraordinary expenses as determined under generally accepted accounting principles. You may use the information in this line, together with the amount you invested, to estimate the expenses that you paid over the period. Simply divide your account value by $1,000 (for example, an $8,600 account value divided by $1,000 = 8.6), then multiply the result by the number in the first line of the table under the “Investor Class” and “Institutional Class” headings in the column entitled “Expenses Paid During Period” to estimate the expenses you paid on your account during this period.
Hypothetical Example for Comparison Purposes
The second line of the table below under the “Investor Class” and “Institutional Class” headings provides information about hypothetical account values and hypothetical expenses based on the Fund’s actual expense ratios and an assumed rate of return of 5% per year before expenses, which is not the Fund’s actual return. The hypothetical account values and expenses may not be used to estimate the actual ending account balance or expenses you paid for the period. You may use this information to compare the ongoing costs of investing in the Fund and other funds. To do so, compare this 5% hypothetical example with the 5% hypothetical examples that appear in the shareholder reports of the other funds. Please note that the expenses shown in the table are meant to highlight your ongoing costs only and do not reflect any transactional costs, such as sales charges (loads), or exchange fees. Therefore, the second line of the table under the “Investor Class” and “Institutional Class” headings is useful in comparing ongoing costs only, and will not help you determine the relative total costs of owning different funds. In addition, if these transactional costs were included, your costs would have been higher.
HENNESSYFUNDS.COM
| | | | Expenses Paid |
| | Beginning | Ending | During Period(1) |
| | Account Value | Account Value | May 1, 2016 – |
| | May 1, 2016 | October 31, 2016 | October 31, 2016 |
| Investor Class | | | |
| Actual | $1,000.00 | $1,139.80 | $8.01 |
| Hypothetical (5% return before expenses) | $1,000.00 | $1,017.65 | $7.56 |
| | | | |
| Institutional Class | | | |
| Actual | $1,000.00 | $1,141.70 | $5.98 |
| Hypothetical (5% return before expenses) | $1,000.00 | $1,019.56 | $5.63 |
(1) | Expenses are equal to the Fund’s annualized expense ratio of 1.49% for Investor Class shares or 1.11% for Institutional Class shares, as applicable, multiplied by the average account value over the period, multiplied by 184/366 days (to reflect one-half year period). |
| HENNESSY FUNDS | 1-800-966-4354 | |
How to Obtain a Copy of the Fund’s
Proxy Voting Policy and Proxy Voting Records
A description of the policies and procedures the Fund uses to determine how to vote proxies relating to portfolio securities is available without charge: (1) by calling 1-800-966-4354; (2) on the Hennessy Funds’ website at hennessyfunds.com/proxy-voting/policy.fs; or (3) on the U.S. Securities and Exchange Commission’s website at www.sec.gov. The Fund’s proxy voting record is available without charge on both the Hennessy Funds’ website at hennessyfunds.com/proxy-voting/vote.fs and the SEC’s website at www.sec.gov no later than August 31 for the prior 12 months ending June 30.
Quarterly Filings on Form N-Q
The Fund files its complete schedule of portfolio holdings with the SEC for the first and third quarters of each fiscal year on Form N-Q. The Fund’s Form N-Q will be available on the SEC’s website at www.sec.gov. The Fund’s Form N-Q may be reviewed and copied at the SEC’s Public Reference Room in Washington, DC and information on the operation of the Public Reference Room may be obtained by calling 1-800-SEC-0330. Information included in the Fund’s N-Q will also be available upon request by calling 1-800-966-4354.
Householding
To help keep the Fund’s costs as low as possible, we generally deliver a single copy of most financial reports and prospectuses to shareholders who share an address, even if the accounts are registered under different names. This process, known as “householding,” does not apply to account statements. You may, of course, request an individual copy of a prospectus or financial report at any time. If you would like to receive separate mailings, please call the Administrator at 1-800-261-6950 or 1-414-765-4124 and we will begin individual delivery within 30 days of your request. If your account is held through a financial institution or other intermediary, please contact them directly to request individual delivery.
HENNESSYFUNDS.COM
| PROXY VOTING — PRIVACY POLICY |
Privacy Policy
We collect the following non-public personal information about you:
| | • | information we receive from you on or in applications or other forms, correspondence, or conversations, including, but not limited to, your name, address, phone number, social security number, assets, income, and date of birth; and |
| | • | information about your transactions with us, our affiliates, or others, including, but not limited to, your account number and balance, payment history, parties to transactions, cost basis information, and other financial information. |
We do not disclose any non-public personal information about our current or former shareholders to non-affiliated third parties, except as permitted by law. For example, we are permitted by law to disclose all of the information we collect, as described above, to our Transfer Agent to process your transactions. Furthermore, we restrict access to your non-public personal information to those persons who require such information to provide products or services to you. We maintain physical, electronic, and procedural safeguards that comply with federal standards to guard your non-public personal information.
In the event that you hold shares of the Fund through a financial intermediary, including, but not limited to, a broker-dealer, bank or trust company, the privacy policy of your financial intermediary would govern how your non-public personal information would be shared with non-affiliated third parties.
| HENNESSY FUNDS | 1-800-966-4354 | |
For information, questions or assistance, please call
The Hennessy Funds
1-800-966-4354 or 1-415-899-1555
INVESTMENT ADVISOR
Hennessy Advisors, Inc.
7250 Redwood Blvd., Suite 200
Novato, California 94945
ADMINISTRATOR,
TRANSFER AGENT,
DIVIDEND PAYING AGENT &
SHAREHOLDER SERVICING AGENT
U.S. Bancorp Fund Services, LLC
P.O. Box 701
Milwaukee, Wisconsin 53201-0701
CUSTODIAN
U.S. Bank N.A.
Custody Operations
1555 North River Center Dr., Suite 302
Milwaukee, Wisconsin 53212
TRUSTEES
Neil J. Hennessy
Robert T. Doyle
J. Dennis DeSousa
Gerald P. Richardson
COUNSEL
Foley & Lardner LLP
777 East Wisconsin Avenue
Milwaukee, Wisconsin 53202-5306
INDEPENDENT REGISTERED
PUBLIC ACCOUNTING FIRM
KPMG LLP
200 East Randolph Street
Chicago, Illinois 60601
DISTRIBUTOR
Quasar Distributors, LLC
615 East Michigan Street
Milwaukee, Wisconsin 53202
hennessyfunds.com | 1-800-966-4354
This report has been prepared for shareholders and may be distributed to
others only if preceded or accompanied by a current prospectus.
ANNUAL REPORT
OCTOBER 31, 2016
HENNESSY JAPAN SMALL CAP FUND
Investor Class HJPSX
Institutional Class HJSIX
hennessyfunds.com | 1-800-966-4354
(This Page Intentionally Left Blank.)
Contents
| Letter to Shareholders | 2 |
| Performance Overview | 4 |
| Financial Statements | |
| Schedule of Investments | 7 |
| Statement of Assets and Liabilities | 12 |
| Statement of Operations | 13 |
| Statements of Changes in Net Assets | 15 |
| Financial Highlights | 16 |
| Notes to the Financial Statements | 19 |
| Report of Independent Registered Public Accounting Firm | 28 |
| Trustees and Officers of the Fund | 29 |
| Expense Example | 32 |
| Proxy Voting | 34 |
| Quarterly Filings on Form N-Q | 34 |
| Federal Tax Distribution Information | 34 |
| Householding | 35 |
| Privacy Policy | 36 |
| HENNESSY FUNDS | 1-800-966-4354 | |
December 2016
Dear Hennessy Funds Shareholder:
During the twelve-month period ended October 31, 2016, the Japanese stock market, as measured by the Tokyo Stock Price Index, declined by just over 10% in yen terms and increased just over 5% in U.S. Dollar terms. The market initially advanced as it rebounded from the decline, which was caused by the sudden drop in Chinese stocks toward the end of the previous period. However, it subsequently dropped sharply in reaction to the strengthening of the yen. The yen rallied significantly during the first half of calendar 2016 as expectations of an interest rate increase in the U.S. faded due to weak macroeconomic statistics. The Japanese market stabilized in the spring despite growing concerns about potential adverse economic effects of the negative interest rate policy adopted by the Bank of Japan (BOJ). In June 2016, however, the stock market fell dramatically once again, this time in reaction to the United Kingdom’s decision to leave the European Union, the so-called “Brexit” vote. Following a quick rebound from this plunge, the market began steadily recovering its lost ground. Investors appeared to feel a sense of relief that the Liberal Democratic Party of Japan did well in upper-house elections, while a revision in the BOJ’s monetary policies was well received. A slight weakening of the yen and some optimism over the likely beneficial impact of a more expansionary fiscal policy added positive momentum to share prices at the end of the period.
With regards to Japan’s macroeconomic situation, we continue to call for the acceleration of structural reforms and an end to increasing dependence on reflationary policies. In our opinion, any additional monetary easing measures should be viewed as short-term solutions to prevent Japan from falling back into temporary recession. Our view is that BOJ Governor Kuroda has already done his part, enlarging the monetary base from 100 trillion yen in early 2013 to 400 trillion yen, or 80% of GDP. Rather than more monetary stimulus, what we believe Japan needs right now is a boost in confidence so that Japanese consumers, corporate leaders and investors can become more forward-looking and feel encouraged to spend more money. It has long been argued that Japan’s potential economic growth rate (now estimated to be around 0 - 0.5%) has come down along with the country’s aging demographics and declining birth rate. In our opinion, this is why structural reforms in the third arrow (recently replaced by Abenomics “2.0”) are so important and why we believe they will be such a critical factor shaping Japan’s economy going forward.
Critics say that the original vision for Abenomics has failed to deliver. However, we disagree with this myopic view and would argue that it is still too early to dismiss hopes of Japan’s long-term turnaround story. As we are all aware, structural reforms generally take a long time to deliver results, and there are a number of initiatives currently in progress that have already started to positively impact the economy. For example, the government drastically cut the corporate income tax rate from 38% to below 30% over the last three years. Moreover, the acceptance of the Stewardship and Corporate Governance Code by institutional investors and publicly-owned companies has allowed for constructive dialogue between the two parties on the more efficient use of capital. There are many more initiatives expected to be introduced by the current government, such as measures to encourage more women and retired seniors to return to the workforce, to promote strategic resource allocation toward the robotics and AI (artificial intelligence) industries and to continue to deregulate the economy overall.
To be clear, we do not believe every one of the government’s new policies will be as effective as expected. Nor do we believe a single policy can solve all the economic problems facing Japan. We believe the new initiatives, working in conjunction with each
HENNESSYFUNDS.COM
other as a collection of reforms, will continue to help the Japanese economy to move forward. On this point, we find it encouraging that the government and the BOJ appear to have become more “business friendly,” perhaps realizing how important the corporate sector is to sustainable long-term growth.
Japan is, in our opinion, enjoying a period of political stability, particularly in comparison with other countries in the developed world. Prime Minister Abe enjoys high approval ratings (well above 50%), and the ruling coalition parties are firmly in place in both the Upper and Lower Houses, making it easier to push through reforms. In terms of the outlook for corporate profits in Japan, the earnings and volumes of Japan’s leading exporters are holding up in the face of sharp appreciation of the yen. Although we urge investors to prepare themselves for a decline in aggregate profits over at least the next twelve months due to negative translation effects on overseas earnings, the extent of the damage, in our opinion, will be much more moderate than previously seen, thanks to radical streamlining of costs by Japanese companies after the 2008 global financial crisis. Furthermore, unlike during the ‘90s, companies’ balance sheets are stronger today with steady cash flows being reinvested into core businesses. We believe these favorable trends bode well for corporate earnings in the longer term.
We remain optimistic about the long-term prospects for Japan and its stock market. Thank you for your continued confidence and investment in our Funds. If you have any questions or would like to speak with us directly, please don’t hesitate to call us at (800) 966-4354.
Sincerely,
| |
| Tadahiro Fujimura | Masakazu Takeda |
| Portfolio Manager, | Portfolio Manager, |
| Hennessy Japan Small Cap Fund; | Hennessy Japan Fund; |
| Chief Investment Officer | Fund Manager |
| SPARX Asset Management Co., Ltd. | SPARX Asset Management Co., Ltd. |
SPARX Asset Management Co., Ltd., located in Tokyo, Japan, is the sub-advisor to the Hennessy Japan Fund and the Hennessy Japan Small Cap Fund.
Past performance does not guarantee future results.
Mutual fund investing involves risk. Principal loss is possible.
Opinions expressed are those of Tadahiro Fujimura and Masakazu Takeda and are subject to change, are not guaranteed and should not be considered investment advice.
The Tokyo Stock Price Index (TOPIX) is an unmanaged index commonly used to measure the performance of Japanese stocks. One cannot invest directly in an index.
Cash flow can be used as an indication of a company’s financial strength and represents earnings before depreciation, amortization, and non-cash charges. It is the net amount of cash and cash-equivalents moving into and out of business.
| HENNESSY FUNDS | 1-800-966-4354 | |
Performance Overview (Unaudited)
CHANGE IN VALUE OF $10,000 INVESTMENT
This graph illustrates the performance of an initial investment of $10,000 made in the Fund on its inception date and assumes the reinvestment of dividends.
AVERAGE ANNUAL TOTAL RETURN FOR PERIODS ENDED OCTOBER 31, 2016
| | | | Since |
| | One | Five | Inception |
| | Year | Years | (8/31/2007) |
| Hennessy Japan | | | |
| Small Cap Fund (HJPSX) | 13.44% | 15.41% | 8.87% |
| Hennessy Japan Small Cap Fund – | | | |
Institutional Class (HJSIX)(1) | 13.73% | 15.50% | 8.91% |
| Russell/Nomura | | | |
Small CapTM Index | 13.76% | 11.07% | 5.43% |
| Tokyo Price Index (TOPIX) | 5.01% | 8.47% | 1.60% |
Expense ratios: 1.88% (Investor Class); 1.47% (Institutional Class)
Performance data quoted represents past performance; past performance does not guarantee future results. The investment return and principal value of an investment will fluctuate so that an investor’s shares, when redeemed, may be worth more or less than their original cost. The performance graph and table do not reflect the deduction of taxes that a shareholder would pay on Fund distributions or the redemption of Fund shares. Current performance of the Fund may be lower or higher than the performance quoted. Performance data current to the most recent month end may be obtained by visiting hennessyfunds.com.
The expense ratios presented are from the most recent prospectus.
(1) | The inception date of Institutional Class shares is June 15, 2015. Performance shown prior to the inception of Institutional Class shares reflects the performance of Investor Class shares and includes expenses that are not applicable to and are higher than those of Institutional Class shares. |
HENNESSYFUNDS.COM
PERFORMANCE NARRATIVE
Portfolio Managers Tadahiro Fujimura, CFA and CMA*, and Tetsuya Hirano, CMA*
SPARX Asset Management Co., Ltd. (sub-advisor)
Performance:
For the twelve-month period ended October 31, 2016, the Investor Class of the Hennessy Japan Small Cap Fund returned 13.44%, slightly underperforming the Russell/Nomura Small Cap™ Index, which returned 13.76%, but outperforming the Tokyo Stock Price Index (TOPIX), which returned 5.01%, for the same period, in U.S. Dollar terms.
The largest positive contributors to the Fund’s performance among the 33 TOPIX sub-industries were Machinery, Electric Appliances, and Textiles & Apparels. The worst performers were Construction, Glass and Ceramic Products, and Securities & Commodity Futures.
Among the stocks that performed well over the period, TOWA Corporation, which produces semiconductor post-process manufacturing devices, had the greatest positive impact on the Fund’s performance. The company suffered from lackluster orders last year, but this year orders recovered as a result of stronger demand from semiconductor customers and aggressive investment supported by the Chinese government. ELECOM Co., Ltd., which manufactures and sells accessories for smartphones and personal computers, also boosted the Fund’s performance. Despite the slowing growth of demand for smartphones, demand for cases and other accessories remains strong. The launch of Pokémon Go also raised expectations about greater demand for portable chargers. Fujibo Holdings, Inc. also made a positive contribution to performance. The company is considered a textile company, but it reported strong sales of products used in semiconductor manufacturing processes, an area on which the company has been focusing.
As for laggards, medium-sized construction company Nakano Corporation, which performed well last year, was the company with the greatest negative impact on the Fund’s performance this year. The electrical engineering company, Sumitomo Densetsu Co., Ltd., also performed poorly. The market reacted negatively to these stock companies’ weak earnings caused by delays with construction projects due to the slow introduction of economic stimulus measures and a shortage of workers. Finally, Tokai Tokyo Financial Holdings, Inc., a stock we added to the portfolio with expectations for growth through its partnerships with regional banks, also detracted from the Fund’s performance, as investors worried about how weak stock markets overall would affect the company’s business.
Market Outlook:
Although the Bank of Japan announced its new monetary policy framework in January of this year, the Japanese economy still appears to be struggling. The yen remains strong, and Japan’s inflation rate remains close to zero. A couple of exogenous events, a typhoon and an earthquake, also interrupted growth patterns. Nevertheless, we believe there is no need to be overly pessimistic. The labor market is tightening, and it appears an upward trend in real wages has been established. We believe consumer sentiment will improve because we expect fully-fledged economic stimulus measures to be enacted now that the upper house election is over. Even looking at recent corporate results, export volumes dropped only slightly despite the appreciation of the yen. If Asia’s economy recovers, we believe we can expect greater than projected earnings growth for Japanese companies, even under the current strong yen. Small-cap growth stocks appeared to lose stock price momentum this year but we believe small stocks are very undervalued and we expect them to perform well in the future.
| HENNESSY FUNDS | 1-800-966-4354 | |
Overall, our investment strategy remains unchanged. We choose companies based on our fundamental bottom-up research. Compared to last year, we see many more companies, both domestic- and external-demand oriented, that we feel are undervalued. We will continue to search for these undervalued stocks throughout the market, regardless of the industry in which they may operate. We believe the market may be losing interest in high-growth stocks and may start to pay more attention to valuation metrics in the coming quarters. As a result, we will be focusing even more on valuations when selecting companies for the Fund’s portfolio.
_______________
* Chartered Member of the Security Analysts Association of Japan
Opinions expressed are those of the Portfolio Managers as of the date written and are subject to change, are not guaranteed, and should not be considered investment advice or an indication of trading intent.
The Russell/Nomura Small Cap™ Index contains the bottom 15% of the Russell/Nomura Total Market™ Index, which contains the top 98% of all stocks listed on Japan’s stock exchange and registered on Japan’s OTC market in terms of market capitalization. The Tokyo Price Index (TOPIX) is a market capitalization-weighted index of all companies listed on the First Section of the Tokyo Stock Exchange. One cannot invest directly in an index.
The Fund invests in small and medium capitalized companies, which may have more limited liquidity and greater price volatility than large capitalization companies. The Fund invests in the stocks of companies operating in Japan; single-country funds may be subject to a higher degree of risk. The Fund may experience higher fees due to investments in pooled investment vehicles (including ETFs). Please see the Fund’s prospectus for a more complete discussion of these and other risks.
Earnings growth is not a measure of the fund’s future performance.
References to specific securities should not be considered a recommendation to buy or sell any security. Fund holdings and sector allocations are subject to change. Please refer to the Schedule of Investments included in this report for additional portfolio information.
HENNESSYFUNDS.COM
| PERFORMANCE OVERVIEW/SCHEDULE OF INVESTMENTS |
Financial Statements
Schedule of Investments as of October 31, 2016 |
HENNESSY JAPAN SMALL CAP FUND
(% of Net Assets)
| TOP TEN HOLDINGS (EXCLUDING CASH/CASH EQUIVALENTS) | % NET ASSETS |
| | |
| Hanwa Co., Ltd. | 2.44% |
| | |
| DCM Holdings Co., Ltd. | 2.38% |
| | |
| Fujibo Holdings, Inc. | 2.35% |
| | |
| Daihen Corp. | 2.21% |
| | |
| BELLSYSTEM24 Holdings, Inc. | 2.12% |
| | |
| Kito Corp. | 2.10% |
| | |
| Towa Corp. | 2.08% |
| | |
| Kyosan Electric Manufacturing Co., Ltd. | 2.06% |
| | |
| Amano Corp. | 2.03% |
| | |
| Hakudo Co., Ltd. | 2.03% |
Note: For presentation purposes, the Fund has grouped some of the industry categories. For purposes of categorizing securities for compliance with Section 8(b)(1) of the Investment Company Act of 1940, as amended, the Fund uses more specific industry classifications.
| HENNESSY FUNDS | 1-800-966-4354 | |
| | COMMON STOCKS – 93.72% | | Number | | | | | | % of | |
| | | | of Shares | | | Value | | | Net Assets | |
| | Consumer Discretionary – 18.22% | | | | | | | | | |
| | Aeon Fantasy Co. | | | 15,700 | | | $ | 487,303 | | | | 1.64 | % |
| | DCM Holdings Co., Ltd. | | | 80,500 | | | | 706,208 | | | | 2.38 | % |
| | Doshisha Co., Ltd. | | | 24,100 | | | | 499,144 | | | | 1.68 | % |
| | Fujibo Holdings, Inc. | | | 22,000 | | | | 697,530 | | | | 2.35 | % |
| | Hagihara Industries, Inc. | | | 12,500 | | | | 293,578 | | | | 0.99 | % |
| | Honeys Co., Ltd. | | | 40,000 | | | | 471,059 | | | | 1.59 | % |
| | Komeri Co., Ltd. | | | 16,000 | | | | 391,647 | | | | 1.32 | % |
| | Parco Co., Ltd. | | | 51,400 | | | | 476,897 | | | | 1.61 | % |
| | Seiren Co., Ltd. | | | 35,100 | | | | 411,681 | | | | 1.39 | % |
| | Starts Corp., Inc. | | | 24,200 | | | | 450,217 | | | | 1.52 | % |
| | Tasaki & Co., Ltd. | | | 36,600 | | | | 517,572 | | | | 1.75 | % |
| | | | | | | | | 5,402,836 | | | | 18.22 | % |
| | | | | | | | | | | | | | |
| | Consumer Staples – 1.80% | | | | | | | | | | | | |
| | Japan Meat Co., Ltd. | | | 20,800 | | | | 292,949 | | | | 0.99 | % |
| | Yamaya Corp. | | | 16,600 | | | | 241,711 | | | | 0.81 | % |
| | | | | | | | | 534,660 | | | | 1.80 | % |
| | | | | | | | | | | | | | |
| | Financials – 3.13% | | | | | | | | | | | | |
| | INTELLEX Co., Ltd. | | | 63,200 | | | | 435,717 | | | | 1.47 | % |
| | Tokai Tokyo Financial Holdings, Inc. | | | 96,600 | | | | 491,889 | | | | 1.66 | % |
| | | | | | | | | 927,606 | | | | 3.13 | % |
| | | | | | | | | | | | | | |
| | Health Care – 1.35% | | | | | | | | | | | | |
| | Ship Healthcare Holdings, Inc. | | | 13,700 | | | | 401,712 | | | | 1.35 | % |
| | | | | | | | | | | | | | |
| | Industrials – 36.18% | | | | | | | | | | | | |
| | BELLSYSTEM24 Holdings, Inc. | | | 66,800 | | | | 627,424 | | | | 2.12 | % |
| | Benefit One, Inc. | | | 16,600 | | | | 481,205 | | | | 1.62 | % |
| | Daihen Corp. | | | 113,000 | | | | 656,213 | | | | 2.21 | % |
| | Daiichi Jitsugyo, Inc. | | | 77,000 | | | | 427,329 | | | | 1.44 | % |
| | DMG Mori Seiki Co., Ltd. | | | 25,000 | | | | 265,805 | | | | 0.90 | % |
| | Hanwa Co., Ltd. | | | 118,000 | | | | 723,505 | | | | 2.44 | % |
| | Hito Communication, Inc. | | | 18,000 | | | | 263,126 | | | | 0.89 | % |
| | Kanematsu Corp. | | | 223,000 | | | | 367,875 | | | | 1.24 | % |
| | Kito Corp. | | | 65,800 | | | | 624,306 | | | | 2.10 | % |
| | Kitz Corp. | | | 80,800 | | | | 465,369 | | | | 1.57 | % |
| | Kondotec, Inc. | | | 57,100 | | | | 436,676 | | | | 1.47 | % |
The accompanying notes are an integral part of these financial statements.
HENNESSYFUNDS.COM
| | COMMON STOCKS | | Number | | | | | | % of | |
| | | | of Shares | | | Value | | | Net Assets | |
| | Industrials (Continued) | | | | | | | | | |
| | Maeda Kosen Co., Ltd. | | | 25,500 | | | $ | 283,279 | | | | 0.96 | % |
| | Miyaji Engineering Group, Inc. | | | 173,000 | | | | 285,391 | | | | 0.96 | % |
| | Nakano Corp. | | | 88,800 | | | | 361,568 | | | | 1.22 | % |
| | Nihon Trim Co., Ltd. | | | 3,600 | | | | 162,716 | | | | 0.55 | % |
| | Nissei ASB Machine Co., Ltd. | | | 20,600 | | | | 372,045 | | | | 1.25 | % |
| | Nittoku Engineering Co., Ltd. | | | 43,000 | | | | 530,991 | | | | 1.79 | % |
| | Okamura Corp. | | | 51,600 | | | | 507,291 | | | | 1.71 | % |
| | Ryobi, Ltd. | | | 101,000 | | | | 407,390 | | | | 1.37 | % |
| | Sanko Gosei, Ltd. | | | 134,000 | | | | 376,943 | | | | 1.27 | % |
| | Sinfonia Technology Co., Ltd. | | | 80,000 | | | | 147,230 | | | | 0.50 | % |
| | Sumitomo Densetsu Co., Ltd. | | | 27,700 | | | | 307,719 | | | | 1.04 | % |
| | Takeei Corp. | | | 60,000 | | | | 492,038 | | | | 1.66 | % |
| | Tocalo Co., Ltd. | | | 20,300 | | | | 456,445 | | | | 1.54 | % |
| | Tonami Holdings Co., Ltd. | | | 113,000 | | | | 304,939 | | | | 1.03 | % |
| | Toppan Forms Co., Ltd. | | | 39,600 | | | | 394,603 | | | | 1.33 | % |
| | | | | | | | | 10,729,421 | | | | 36.18 | % |
| | | | | | | | | | | | | | |
| | Information Technology – 26.86% | | | | | | | | | | | | |
| | Aichi Tokei Denki Co., Ltd. | | | 15,600 | | | | 476,018 | | | | 1.60 | % |
| | Aiphone Co., Ltd. | | | 26,300 | | | | 463,203 | | | | 1.56 | % |
| | Amano Corp. | | | 32,300 | | | | 602,141 | | | | 2.03 | % |
| | Digital Garage, Inc. | | | 25,400 | | | | 481,261 | | | | 1.62 | % |
| | Elecom Co., Ltd. | | | 28,400 | | | | 581,974 | | | | 1.96 | % |
| | Information Services International – Dentsu, Ltd. | | | 28,100 | | | | 488,474 | | | | 1.65 | % |
| | Itfor, Inc. | | | 82,900 | | | | 485,369 | | | | 1.64 | % |
| | Koa Corp. | | | 63,400 | | | | 584,608 | | | | 1.97 | % |
| | Kyosan Electric Manufacturing Co., Ltd. | | | 164,000 | | | | 609,898 | | | | 2.06 | % |
| | Mimaki Engineering Co., Ltd. | | | 60,000 | | | | 336,416 | | | | 1.13 | % |
| | Nihon Unisys, Ltd. | | | 42,800 | | | | 522,807 | | | | 1.76 | % |
| | Soliton Systems K.K. | | | 52,900 | | | | 583,126 | | | | 1.97 | % |
| | TKC Corp. | | | 15,000 | | | | 444,121 | | | | 1.50 | % |
| | Towa Corp. | | | 53,400 | | | | 616,134 | | | | 2.08 | % |
| | V-cube, Inc. | | | 28,400 | | | | 220,982 | | | | 0.74 | % |
| | Yokowo Co., Ltd. | | | 69,100 | | | | 470,462 | | | | 1.59 | % |
| | | | | | | | | 7,966,994 | | | | 26.86 | % |
The accompanying notes are an integral part of these financial statements.
| HENNESSY FUNDS | 1-800-966-4354 | |
| | COMMON STOCKS | | Number | | | | | | % of | |
| | | | of Shares | | | Value | | | Net Assets | |
| | Materials – 6.18% | | | | | | | | | |
| | Aichi Steel Corp. | | | 11,400 | | | $ | 550,052 | | | | 1.86 | % |
| | Asia Pile Holdings Co. | | | 55,500 | | | | 231,801 | | | | 0.78 | % |
| | Fujikura Kasei Co., Ltd. | | | 74,300 | | | | 448,478 | | | | 1.51 | % |
| | Hakudo Co., Ltd. | | | 52,000 | | | | 600,973 | | | | 2.03 | % |
| | | | | | | | | 1,831,304 | | | | 6.18 | % |
| | | | | | | | | | | | | | |
| | Total Common Stocks | | | | | | | | | | | | |
| | (Cost $23,504,681) | | | | | | | 27,794,533 | | | | 93.72 | % |
| | | | | | | | | | | | | | |
| | SHORT-TERM INVESTMENTS – 5.31% | | | | | | | | | | | | |
| | | | | | | | | | | | | | |
| | Money Market Funds – 5.31% | | | | | | | | | | | | |
| | Fidelity Government Portfolio, Institutional Class, 0.27% (a) | | | 1,466,000 | | | | 1,466,000 | | | | 4.94 | % |
| | The Government & Agency Portfolio, Institutional Class, 0.29% (a) | | | 109,518 | | | | 109,518 | | | | 0.37 | % |
| | | | | | | | | 1,575,518 | | | | 5.31 | % |
| | | | | | | | | | | | | | |
| | Total Short-Term Investments | | | | | | | | | | | | |
| | (Cost $1,575,518) | | | | | | | 1,575,518 | | | | 5.31 | % |
| | | | | | | | | | | | | | |
| | Total Investments | | | | | | | | | | | | |
| | (Cost $25,080,199) – 99.03% | | | | | | | 29,370,051 | | | | 99.03 | % |
| | Other Assets in Excess of Liabilities – 0.97% | | | | | | | 289,024 | | | | 0.97 | % |
| | | | | | | | | | | | | | |
| | TOTAL NET ASSETS – 100.00% | | | | | | $ | 29,659,075 | | | | 100.00 | % |
Percentages are stated as a percent of net assets.
| (a) | The rate listed is the fund’s 7-day yield as of October 31, 2016. |
The accompanying notes are an integral part of these financial statements.
HENNESSYFUNDS.COM
Summary of Fair Value Exposure at October 31, 2016
The following is a summary of the inputs used to value the Fund’s net assets as of October 31, 2016 (see Note 3 in the accompanying notes to the financial statements):
| Common Stocks | | Level 1 | | | Level 2 | | | Level 3 | | | Total | |
| Consumer Discretionary | | $ | 5,402,836 | | | $ | — | | | $ | — | | | $ | 5,402,836 | |
| Consumer Staples | | | 534,660 | | | | — | | | | — | | | | 534,660 | |
| Financials | | | 927,606 | | | | — | | | | — | | | | 927,606 | |
| Health Care | | | 401,712 | | | | — | | | | — | | | | 401,712 | |
| Industrials | | | 10,729,421 | | | | — | | | | — | | | | 10,729,421 | |
| Information Technology | | | 7,966,994 | | | | — | | | | — | | | | 7,966,994 | |
| Materials | | | 1,831,304 | | | | — | | | | — | | | | 1,831,304 | |
| Total Common Stocks | | $ | 27,794,533 | | | $ | — | | | $ | — | | | $ | 27,794,533 | |
| Short-Term Investments | | | | | | | | | | | | | | | | |
| Money Market Funds | | $ | 1,575,518 | | | $ | — | | | $ | — | | | $ | 1,575,518 | |
| Total Short-Term Investments | | $ | 1,575,518 | | | $ | — | | | $ | — | | | $ | 1,575,518 | |
| Total Investments | | $ | 29,370,051 | | | $ | — | | | $ | — | | | $ | 29,370,051 | |
Transfers between levels are recognized at the end of the reporting period. During the year ended October 31, 2016, the Fund recognized significant transfers between Levels 1 and 2.
Transfers between Level 1 and Level 2 relate to the use of fair valuation pricing service. On days when the fair valuation pricing service is used, non-U.S. dollar denominated securities move from a Level 1 to a Level 2 classification. 100% of common stock held at October 31, 2015, were classified as Level 2. Such securities still held at October 31, 2016, were transferred to Level 1. Other than transfers due to the fair value pricing services, no transfers were recognized.
The accompanying notes are an integral part of these financial statements.
| HENNESSY FUNDS | 1-800-966-4354 | |
Financial Statements
Statement of Assets and Liabilities as of October 31, 2016 |
| ASSETS: | | | |
| Investments in securities, at value (cost $25,080,199) | | $ | 29,370,051 | |
| Dividends and interest receivable | | | 225,312 | |
| Receivable for fund shares sold | | | 156,936 | |
| Receivable for securities sold | | | 45,783 | |
| Prepaid expenses and other assets | | | 15,991 | |
| Total Assets | | | 29,814,073 | |
| | | | | |
| LIABILITIES: | | | | |
| Payable for fund shares redeemed | | | 83,761 | |
| Payable to advisor | | | 19,839 | |
| Payable to administrator | | | 5,055 | |
| Payable to auditor | | | 20,780 | |
| Accrued distribution fees | | | 3,672 | |
| Accrued service fees | | | 2,191 | |
| Accrued trustees fees | | | 3,898 | |
| Accrued expenses and other payables | | | 15,802 | |
| Total Liabilities | | | 154,998 | |
| NET ASSETS | | $ | 29,659,075 | |
| | | | | |
| NET ASSETS CONSIST OF: | | | | |
| Capital stock | | $ | 25,186,805 | |
| Accumulated net investment loss | | | 7,575 | |
| Accumulated net realized gain on investments | | | 183,684 | |
| Unrealized net appreciation on investments | | | 4,281,011 | |
| Total Net Assets | | $ | 29,659,075 | |
| | | | | |
| NET ASSETS | | | | |
| Investor Class: | | | | |
| Shares authorized (no par value) | | Unlimited | |
| Net assets applicable to outstanding Investor Class shares | | $ | 26,234,961 | |
| Shares issued and outstanding | | | 2,323,751 | |
| Net asset value, offering price and redemption price per share | | $ | 11.29 | |
| | | | | |
| Institutional Class: | | | | |
| Shares authorized (no par value) | | Unlimited | |
| Net assets applicable to outstanding Institutional Class shares | | $ | 3,424,114 | |
| Shares issued and outstanding | | | 302,159 | |
| Net asset value, offering price and redemption price per share | | $ | 11.33 | |
The accompanying notes are an integral part of these financial statements.
HENNESSYFUNDS.COM
| STATEMENT OF ASSETS AND LIABILITIES/STATEMENT OF OPERATIONS |
Financial Statements
Statement of Operations for the year ended October 31, 2016 |
| INVESTMENT INCOME: | | | |
Dividend income(1) | | $ | 590,950 | |
| Interest income | | | 2,938 | |
| Total investment income | | | 593,888 | |
| | | | | |
| EXPENSES: | | | | |
| Investment advisory fees (See Note 5) | | | 254,407 | |
| Sub-transfer agent expenses – Investor Class (See Note 5) | | | 59,510 | |
| Sub-transfer agent expenses – Institutional Class (See Note 5) | | | 5,511 | |
| Federal and state registration fees | | | 34,637 | |
| Administration, fund accounting, custody and transfer agent fees (See Note 5) | | | 26,692 | |
| Distribution fees – Investor Class (See Note 5) | | | 24,613 | |
| Service fees – Investor Class (See Note 5) | | | 24,237 | |
| Compliance expense (See Note 5) | | | 23,710 | |
| Audit fees | | | 21,473 | |
| Reports to shareholders | | | 15,394 | |
| Trustees’ fees and expenses | | | 15,125 | |
| Legal fees | | | 2,507 | |
| Interest expense (See Note 7) | | | 144 | |
| Other expenses | | | 5,307 | |
| Total expenses | | | 513,267 | |
| NET INVESTMENT INCOME | | $ | 80,621 | |
| | | | | |
| REALIZED AND UNREALIZED GAINS: | | | | |
| Net realized gain on investments | | $ | 284,136 | |
| Net change in unrealized appreciation on investments | | | 3,031,098 | |
| Net gain on investments | | | 3,315,234 | |
| NET INCREASE IN NET ASSETS RESULTING FROM OPERATIONS | | $ | 3,395,855 | |
(1) | Net of foreign taxes withheld of $65,661. |
The accompanying notes are an integral part of these financial statements.
| HENNESSY FUNDS | 1-800-966-4354 | |
(This Page Intentionally Left Blank.)
HENNESSYFUNDS.COM
| STATEMENTS OF CHANGES IN NET ASSETS |
Financial Statements
| Statements of Changes in Net Assets |
| | | Year Ended | | | Year Ended | |
| | | October 31, 2016 | | | October 31, 2015 | |
| OPERATIONS: | | | | | | |
| Net investment income (loss) | | $ | 80,621 | | | $ | (71,370 | ) |
| Net realized gain on investments | | | 284,136 | | | | 980,030 | |
| Net change in unrealized appreciation (depreciation) | | | | | | | | |
| on investments | | | 3,031,098 | | | | (324,113 | ) |
| Net increase in net assets resulting from operations | | | 3,395,855 | | | | 584,547 | |
| | | | | | | | | |
| DISTRIBUTIONS TO SHAREHOLDERS FROM: | | | | | | | | |
| Net realized gains | | | | | | | | |
| Investor Class | | | (821,234 | ) | | | (1,537,113 | ) |
| Institutional Class | | | (94,663 | ) | | | — | |
| Total distributions | | | (915,897 | ) | | | (1,537,113 | ) |
| | | | | | | | | |
| CAPITAL SHARE TRANSACTIONS: | | | | | | | | |
| Proceeds from shares subscribed – Investor Class | | | 11,724,005 | | | | 19,602,053 | |
| Proceeds from shares subscribed – Institutional Class | | | 1,833,391 | | | | 3,944,130 | |
| Dividends reinvested – Investor Class | | | 815,922 | | | | 1,515,157 | |
| Dividends reinvested – Institutional Class | | | 94,664 | | | | — | |
| Cost of shares redeemed – Investor Class | | | (11,136,397 | ) | | | (16,864,362 | ) |
| Cost of shares redeemed – Institutional Class | | | (1,481,809 | ) | | | (1,278,434 | ) |
| Net increase in net assets derived | | | | | | | | |
| from capital share transactions | | | 1,849,776 | | | | 6,918,544 | |
| TOTAL INCREASE IN NET ASSETS | | | 4,329,734 | | | | 5,965,978 | |
| | | | | | | | | |
| NET ASSETS: | | | | | | | | |
| Beginning of year | | | 25,329,341 | | | | 19,363,363 | |
| End of year | | $ | 29,659,075 | | | $ | 25,329,341 | |
| Undistributed net investment | | | | | | | | |
| income (loss), end of year | | $ | 7,575 | | | $ | (81,572 | ) |
| | | | | | | | | |
| CHANGES IN SHARES OUTSTANDING: | | | | | | | | |
| Shares sold – Investor Class | | | 1,125,046 | | | | 1,882,041 | |
| Shares sold – Institutional Class | | | 181,517 | | | | 375,953 | |
| Shares issued to holders as reinvestment | | | | | | | | |
| of dividends – Investor Class | | | 81,186 | | | | 160,845 | |
| Shares issued to holders as reinvestment | | | | | | | | |
| of dividends – Institutional Class | | | 9,401 | | | | — | |
| Shares redeemed – Investor Class | | | (1,087,726 | ) | | | (1,679,167 | ) |
| Shares redeemed – Institutional Class | | | (145,946 | ) | | | (118,766 | ) |
| Net increase in shares outstanding | | | 163,478 | | | | 620,906 | |
The accompanying notes are an integral part of these financial statements.
| HENNESSY FUNDS | 1-800-966-4354 | |
Financial Statements
For an Investor Class share outstanding throughout each year
PER SHARE DATA:
Net asset value, beginning of year
Income from investment operations:
Net investment income (loss)
Net realized and unrealized gains on investments
Total from investment operations
Less distributions:
Dividends from net investment income
Dividends from net realized gains
Total distributions
Net asset value, end of year
TOTAL RETURN
SUPPLEMENTAL DATA AND RATIOS:
Net assets, end of year (millions)
Ratio of expenses to average net assets
Ratio of net investment income (loss) to average net assets
Portfolio turnover rate(1)
(1) | Portfolio turnover is calculated on the basis of the Fund as a whole. |
The accompanying notes are an integral part of these financial statements.
HENNESSYFUNDS.COM
| FINANCIAL HIGHLIGHTS — INVESTOR CLASS |
| Year Ended October 31, | | |
| 2016 | | | 2015 | | | 2014 | | | 2013 | | | 2012 | | |
| | | | | | | | | | | | | | | |
| $ | 10.29 | | | $ | 10.51 | | | $ | 11.70 | | | $ | 10.54 | | | $ | 10.09 | | |
| | | | | | | | | | | | | | | | | | | | |
| | | | | | | | | | | | | | | | | | | | |
| | 0.03 | | | | (0.02 | ) | | | (0.04 | ) | | | 0.06 | | | | (0.68 | ) | |
| | 1.31 | | | | 0.71 | | | | 1.36 | | | | 3.44 | | | | 1.17 | | |
| | 1.34 | | | | 0.69 | | | | 1.32 | | | | 3.50 | | | | 0.49 | | |
| | | | | | | | | | | | | | | | | | | | |
| | | | | | | | | | | | | | | | | | | | |
| | — | | | | — | | | | — | | | | — | | | | (0.04 | ) | |
| | (0.34 | ) | | | (0.91 | ) | | | (2.51 | ) | | | (2.34 | ) | | | — | | |
| | (0.34 | ) | | | (0.91 | ) | | | (2.51 | ) | | | (2.34 | ) | | | (0.04 | ) | |
| $ | 11.29 | | | $ | 10.29 | | | $ | 10.51 | | | $ | 11.70 | | | $ | 10.54 | | |
| | | | | | | | | | | | | | | | | | | | |
| | 13.44 | % | | | 7.37 | % | | | 13.99 | % | | | 40.59 | % | | | 4.91 | % | |
| | | | | | | | | | | | | | | | | | | | |
| | | | | | | | | | | | | | | | | | | | |
| $ | 26.23 | | | $ | 22.68 | | | $ | 19.36 | | | $ | 14.82 | | | $ | 5.11 | | |
| | 1.91 | % | | | 2.12 | % | | | 2.24 | % | | | 2.39 | % | | | 2.33 | % | |
| | 0.25 | % | | | (0.38 | )% | | | (0.39 | )% | | | (0.11 | )% | | | (0.66 | )% | |
| | 22 | % | | | 75 | % | | | 63 | % | | | 141 | % | | | 49 | % | |
The accompanying notes are an integral part of these financial statements.
| HENNESSY FUNDS | 1-800-966-4354 | |
Financial Statements
For an Institutional Class share outstanding throughout each year
| | | Year Ended October 31, | |
| | | 2016 | | | 2015(1) | |
| PER SHARE DATA: | | | | | | |
| Net asset value, beginning of year | | $ | 10.30 | | | $ | 10.89 | |
| | | | | | | | | |
| Income from investment operations: | | | | | | | | |
| Net investment income (loss) | | | 0.06 | | | | (0.01 | ) |
| Net realized and unrealized gains (losses) on investments | | | 1.31 | | | | (0.58 | ) |
| Total from investment operations | | | 1.37 | | | | (0.59 | ) |
| | | | | | | | | |
| Less distributions: | | | | | | | | |
| Dividends from net investment income | | | — | | | | — | |
| Dividends from net realized gains | | | (0.34 | ) | | | — | |
| Total distributions | | | (0.34 | ) | | | — | |
| Net asset value, end of year | | $ | 11.33 | | | $ | 10.30 | |
| | | | | | | | | |
| TOTAL RETURN | | | 13.73 | % | | | (5.42 | )%(2) |
| | | | | | | | | |
| SUPPLEMENTAL DATA AND RATIOS: | | | | | | | | |
| Net assets, end of year (millions) | | $ | 3.42 | | | $ | 2.65 | |
| Ratio of expenses to average net assets | | | 1.63 | % | | | 1.86 | %(3) |
| Ratio of net investment income (loss) to average net assets | | | 0.63 | % | | | (1.04 | )%(3) |
Portfolio turnover rate(4) | | | 22 | % | | | 75 | %(2) |
(1) | The Institutional Class shares commenced operations on June 15, 2015. |
(2) | Not annualized. |
(3) | Annualized. |
(4) | Portfolio turnover is calculated on the basis of the Fund as a whole. |
The accompanying notes are an integral part of these financial statements.
HENNESSYFUNDS.COM
| FINANCIAL HIGHLIGHTS — INSTITUTIONAL CLASS/NOTES TO THE FINANCIAL STATEMENTS |
Financial Statements
Notes to the Financial Statements October 31, 2016 |
1). ORGANIZATION
The Hennessy Japan Small Cap Fund (the “Fund”) is a series of Hennessy Funds Trust (the “Trust”), which was organized as a Delaware statutory trust on September 17, 1992. The Fund is an open-end management investment company registered under the Investment Company Act of 1940, as amended. The Fund is a successor to a fund with the same name (the “Predecessor Fund”) that was a series of Hennessy SPARX Funds Trust, a Massachusetts business trust, pursuant to a reorganization that took place after the close of business on February 28, 2014. Prior to February 28, 2014, the Fund had no investment operations. As a result of the reorganization, holders of Investor Class shares of the Predecessor Fund received Investor Class shares of the Fund (the Investor Class shares of the Fund are the successor to the accounting and performance information of the corresponding shares of the Predecessor Fund). The Fund did not have Institutional Class shares until June 15, 2015. The investment objective of the Fund is long-term capital appreciation. The Fund is a diversified fund.
The Fund offers Investor Class and Institutional Class shares. Each class of shares differs principally in its respective administration, 12b-1 distribution and service, shareholder servicing, and transfer agent expenses and sales charges, if any. Each class has identical rights to earnings, assets, and voting privileges, except for class-specific expenses and exclusive rights to vote on matters affecting only an individual class.
As an investment company, the Fund follows the investment company accounting and reporting guidance of the Financial Accounting Standards Board (“FASB”) Accounting Standard Codification Topic 946 “Financial Services—Investment Companies.”
2). SIGNIFICANT ACCOUNTING POLICIES
The following is a summary of significant accounting policies consistently followed by the Fund in the preparation of the financial statements. These policies conform with U.S. generally accepted accounting principles (“GAAP”).
| a). | Investment Valuation – All investments in securities are recorded at their estimated fair value, as described in Note 3. |
| b). | Federal Income Taxes – No provision for federal income taxes or excise taxes has been made since the Fund has elected to be taxed as a “regulated investment company” and intends to distribute substantially all of its taxable income to its shareholders and otherwise comply with the provisions of the Internal Revenue Code of 1986, as amended, applicable to regulated investment companies. Net investment income or loss and realized gains and losses for federal income tax purposes may differ from that reported on the financial statements because of temporary book and tax basis differences. Temporary differences are primarily the result of the treatment of wash sales for tax reporting purposes. The Fund recognizes interest and penalties related to income tax benefits, if any, in the statement of operations as an income tax expense. Distributions from net realized gains for book purposes may include short-term capital gains, which are included as ordinary income to shareholders for tax purposes. |
| | Due to inherent differences in the recognition of income, expenses, and realized gains/losses under GAAP and federal income tax regulations, permanent differences between book and tax basis for reporting for the fiscal year ended October 31, 2016, |
| HENNESSY FUNDS | 1-800-966-4354 | |
| | have been identified and appropriately reclassified on the Statement of Assets and Liabilities. The adjustments are as follows: |
| | Undistributed | Accumulated | | |
| | Net Investment | Net Realized | | |
| | Income/(Loss) | Gain/(Loss) | Paid-in Capital | |
| | $8,526 | $(8,526) | $— | |
| c). | Accounting for Uncertainty in Income Taxes – The Fund has accounting policies regarding recognition and measurement of tax positions taken or expected to be taken on a tax return. The tax returns of the Fund for the prior three fiscal years are open for examination. The Fund has reviewed all open tax years in major jurisdictions and concluded that there is no impact on the Fund’s net assets and no tax liability resulting from unrecognized tax benefits relating to uncertain income tax positions taken or expected to be taken on a tax return. The Fund’s major tax jurisdictions are U.S. federal and Delaware. |
| d). | Income and Expenses – Dividend income is recognized on the ex-dividend date or as soon as information is available to the Fund. Interest income, which includes the amortization of premium and accretion of discount, is recognized on an accrual basis. The Fund is charged for those expenses that are directly attributable to the portfolio, such as advisory, administration, and certain shareholder service fees. Income, expenses (other than expenses attributable to a specific class), and realized and unrealized gains or losses on investments are allocated to each class of shares based on its respective net assets. |
| e). | Distributions to Shareholders – Dividends from net investment income for the Fund, if any, are declared and paid annually, usually in December. Distributions of net realized capital gains, if any, are declared and paid annually, usually in December. |
| f). | Security Transactions – Investment and shareholder transactions are recorded on the trade date. The Fund determines the gain or loss realized from the investment transactions by comparing the original cost of the security lot sold with the net sale proceeds. Discounts and premiums on securities purchased are accreted/amortized over the life of the respective security. |
| g). | Use of Estimates – The preparation of financial statements in conformity with GAAP requires management to make estimates and assumptions that affect the reported amounts of assets and liabilities and disclosure of contingent assets and liabilities at the date of the financial statements and the reported change in net assets during the reporting period. Actual results could differ from those estimates. |
| h). | Share Valuation – The net asset value (“NAV”) per share of the Fund is calculated by dividing the sum of the value of the securities held by the Fund, plus cash or other assets, minus all liabilities (including estimated accrued expenses) by the total number of shares outstanding for the Fund, rounded to the nearest cent. The Fund’s shares will not be priced on days the New York Stock Exchange is closed for trading. The offering and redemption price per share for the Fund is equal to the Fund’s NAV per share. |
| i). | Foreign Currency – Values of investments denominated in foreign currencies are converted into U.S. dollars using the spot market rate of exchange at the time of valuation. Purchases and sales of investments and income are translated into U.S. dollars using the spot market rate of exchange prevailing on the respective dates of such transactions. The Fund does not isolate the portion of the results of operations resulting from fluctuations in foreign exchange rates on investments from fluctuations resulting from changes in the market prices of securities held. Such fluctuations are included with the net realized and unrealized gain or loss on |
HENNESSYFUNDS.COM
| NOTES TO THE FINANCIAL STATEMENTS |
| | investments. Foreign investments present additional risks due to currency fluctuations, economic and political factors, lower liquidity, government regulations, differences in accounting standards, and other factors. |
| j). | Forward Contracts – The Fund may enter into forward currency contracts to reduce its exposure to changes in foreign currency exchange rates on its foreign holdings and to lock in the U.S. dollar cost of firm purchase and sale commitments for securities denominated in foreign currencies. A forward currency contract is a commitment to purchase or sell a foreign currency at a future date at a negotiated forward rate. The gain or loss arising from the difference between the U.S. dollar cost of the original contract and the value of the foreign currency in U.S. dollars upon closing of such contract is included in net realized gain or loss from foreign currency transactions. During the fiscal year ended October 31, 2016, the Fund did not enter into any forward contracts. |
| k). | Repurchase Agreements – The Fund may enter into repurchase agreements with member banks or security dealers of the Federal Reserve Board whom the investment advisor deems creditworthy. The repurchase price generally equals the price paid by the Fund plus interest negotiated on the basis of current short-term rates. |
| | Securities pledged as collateral for repurchase agreements are held by the custodian bank until the respective agreements mature. Provisions of the repurchase agreements ensure that the market value of the collateral, including accrued interest thereon, is sufficient to cover the repurchase amount in the event of default of the counterparty. If the counterparty defaults and the value of the collateral declines or if the counterparty enters an insolvency proceeding, realization of the collateral by the Fund may be delayed or limited. During the fiscal year ended October 31, 2016, the Fund did not enter into any repurchase agreements. |
| l). | Derivatives – The Fund may invest in, or enter into, derivatives, such as options, futures contracts, options on futures contracts, and swaps, for a variety of reasons, including to hedge certain risks, to provide a substitute for purchasing or selling particular securities, or to increase potential income gain. Derivatives are financial contracts based on an underlying or notional amount, require no initial investment or an initial net investment that is smaller than would normally be required to have a similar response to changes in market factors, and require or permit net settlement. Derivatives may allow the Fund to increase or decrease the level of risk to which the Fund is exposed more quickly and efficiently than transactions in other types of instruments. The main purpose of utilizing derivative instruments is for hedging purposes. |
| | The Fund follows the financial accounting reporting rules as required by the Derivatives and Hedging Topic of the FASB Accounting Standards Codification. Under such rules, the Fund is required to include enhanced disclosure that enables investors to understand how and why an entity uses derivatives, how derivatives are accounted for, and how derivatives instruments affect an entity’s results of operations and financial position. During the fiscal year ended October 31, 2016, the Fund did not hold any derivative instruments. |
| m). | New Accounting Pronouncements – In May 2015, the FASB issued ASU No. 2015-07 “Disclosure for Investments in Certain Entities that Calculate Net Asset Value per Share (or Its Equivalent).” The amendments in ASU No. 2015-07 remove the requirement to categorize within the fair value hierarchy investments measured at NAV and require the disclosure of sufficient information to reconcile the fair value of the remaining assets categorized within the fair value hierarchy to the financial statements. The amendments in ASU No. 2015-07 are effective for fiscal years beginning after |
| HENNESSY FUNDS | 1-800-966-4354 | |
| | December 15, 2015, and interim periods within those fiscal years. Management has reviewed the requirements and believes the adoption of ASU 2015-07 will not have a material impact on the Fund’s financial statements and related disclosures. |
3). SECURITIES VALUATION
The Fund follows authoritative fair valuation accounting standards that establish an authoritative definition of fair value and set out a hierarchy for measuring fair value. These standards require additional disclosures about the various inputs and valuation techniques used to develop the measurements of fair value and a discussion in changes in valuation techniques and related inputs during the period. These inputs are summarized in the three broad levels listed below:
| | Level 1 – | Unadjusted, quoted prices in active markets for identical instruments that the Fund has the ability to access at the date of measurement. |
| | Level 2 – | Other significant observable inputs (including, but not limited to, quoted prices in active markets for similar instruments, quoted prices in markets that are not active for identical or similar instruments, and model-derived valuations in which all significant inputs and significant value drivers are observable in active markets (such as interest rates, prepayment speeds, credit risk curves, default rates, and similar data)). |
| | Level 3 – | Significant unobservable inputs (including the Fund’s own assumptions about what market participants would use to price the asset or liability based on the best available information) when observable inputs are unavailable. |
Following is a description of the valuation techniques applied to the Fund’s major categories of assets and liabilities measured at fair value on a recurring basis.
Equity Securities – Equity securities, including common stocks, preferred stocks, foreign-issued common stocks, exchange-traded funds, closed-end mutual funds, partnerships, rights, and real estate investment trusts, that are traded on a securities exchange for which a last-quoted sales price is readily available will generally be valued at the last sales price as reported by the primary exchange on which the securities are listed. Securities listed on The NASDAQ Stock Market (“NASDAQ”) will generally be valued at the NASDAQ Official Closing Price, which may differ from the last sales price reported. Securities traded on a securities exchange for which a last-quoted sales price is not readily available will generally be valued at the mean between the bid and ask prices. To the extent these securities are actively traded and valuation adjustments are not applied, they are classified in Level 1 of the fair value hierarchy. Securities traded on foreign exchanges generally are not valued at the same time the Fund calculates its NAV because most foreign markets close well before such time. The earlier close of most foreign markets gives rise to the possibility that significant events, including broad market moves, may have occurred in the interim. In certain circumstances, it may be determined that a security needs to be fair valued because it appears that the value of the security might have been materially affected by events occurring after the close of the market in which the security is principally traded, but before the time the Fund calculates its NAV, such as by a development that affects an entire market or region (e.g., weather-related events) or a potentially global development (e.g., a terrorist attack that may be expected to have an effect on investor expectations worldwide).
Registered Investment Companies – Investments in registered investment companies (e.g., mutual funds) are generally priced at the ending NAV provided by the applicable registered investment company’s service agent and will be classified in Level 1 of the fair value hierarchy.
HENNESSYFUNDS.COM
| NOTES TO THE FINANCIAL STATEMENTS |
Debt Securities – Debt securities, including corporate bonds, asset-backed securities, mortgage-backed securities, municipal bonds, U.S. Treasuries, and U.S. government agency issues, are generally valued at market on the basis of valuations furnished by an independent pricing service that utilizes both dealer-supplied valuations and formula-based techniques. The pricing service may consider recently executed transactions in securities of the issuer or comparable issuers, market price quotations (where observable), bond spreads, and fundamental data relating to the issuer. In addition, the model may incorporate observable market data, such as reported sales of similar securities, broker quotes, yields, bids, offers, and reference data. Certain securities are valued primarily using dealer quotations. These securities are generally classified in Level 2 of the fair value hierarchy.
Short-Term Securities – Short-term equity investments, including money market funds, are valued in the manner specified above. Short term debt investments with an original term to maturity of 60 days or less are valued at amortized cost, which approximates fair market value. If the original term to maturity of a short term debt investment exceeded 60 days, then the values as of the 61st day prior to maturity are amortized. Amortized cost is not used if its use would be inappropriate due to credit or other impairments of the issuer, in which case the security’s fair value would be determined, as described below. Short-term securities are generally classified in Level 1 or Level 2 of the fair market hierarchy depending on the inputs used and market activity levels for specific securities.
The Board of Trustees of the Fund (the “Board”) has adopted fair value pricing procedures that are followed when a price for a security is not readily available or if a significant event has occurred that indicates the closing price of a security no longer represents the true value of that security. Fair value pricing determinations are made in good faith in accordance with these procedures. There are numerous criteria that will be given consideration in determining a fair value of a security, such as the trading volume of a security and markets, the value of other like securities, and news events with direct bearing to a security or markets. Fair value pricing results in an estimated price for a security that reflects the amount the Fund might reasonably expect to receive in a current sale. Depending on the relative significance of the valuation inputs, these securities may be classified in either Level 2 or Level 3 of the fair value hierarchy.
The fair valuation of foreign securities may be determined with the assistance of a pricing service using correlations between the movement of prices of such securities and indices of domestic securities and other appropriate indicators, such as closing market prices of relevant American Depositary Receipts or futures contracts. The effect of using fair value pricing is that the Fund’s NAV will reflect the affected portfolio securities’ value as determined by the Board or its designee instead of being determined by the market. Using a fair value pricing methodology to price foreign securities may result in a value that is different from a foreign security’s most recent closing price and from the prices used by other investment companies to calculate their NAVs and are generally considered Level 2 prices in the fair valuation hierarchy. Because the Fund may invest in foreign securities, the value of the Fund’s portfolio securities may change on days when you will not be able to purchase or redeem your shares.
The Board has delegated day-to-day valuation matters to a Valuation Committee comprised of one or more representatives from Hennessy Advisors, Inc., the Fund’s investment advisor. The function of the Valuation Committee is to value securities where current and reliable market quotations are not readily available. All actions taken by the Valuation Committee are reviewed by the Board.
The Fund has performed an analysis of all existing investments to determine the significance and character of all inputs to their fair value determination. Various inputs are used in determining the value of the Fund’s investments. The inputs or methodology
| HENNESSY FUNDS | 1-800-966-4354 | |
used for valuing securities are not necessarily an indication of the risk associated with investing in those securities. Details related to the fair valuation hierarchy of the Fund’s securities as of October 31, 2016, are included in the Fund’s Schedule of Investments.
4). INVESTMENT TRANSACTIONS
Purchases and sales of investment securities (excluding government and short-term investments) for the Fund during the fiscal year ended October 31, 2016, were $7,342,656 and $5,775,798, respectively.
There were no purchases or sales/maturities of long-term U.S. government securities for the Fund during the fiscal year ended October 31, 2016.
The Fund is permitted to purchase or sell securities from or to another fund in the Hennessy Funds family of funds (the “Hennessy Funds”) under specified conditions outlined in procedures adopted by the Board of Trustees. The procedures have been designed to ensure that any purchase or sale of securities by the Fund from or to another Hennessy Fund complies with Rule 17a-7 of the Investment Company Act of 1940. For the fiscal year ended October 31, 2016, the Fund did not engage in purchases and sales of securities pursuant to Rule 17a-7 of the Investment Company Act of 1940.
5). INVESTMENT MANAGEMENT FEE AND OTHER TRANSACTIONS WITH AFFILIATES
Hennessy Advisors, Inc. (the “Advisor”) is the investment advisor of the Fund. The Advisor provides the Fund with investment management services under an Investment Advisory Agreement. The Advisor furnishes all investment advice, office space, facilities, and provides most of the personnel needed by the Fund. As compensation for its services, the Advisor is entitled to a monthly fee from the Fund. The fee is based upon the average daily net assets of the Fund at the annual rate of 1.20% until March 1, 2016, at which time the fee was reduced to an annual rate of 0.80%. The net investment advisory fees payable by the Fund as of October 31, 2016, were $19,839.
The Advisor has delegated the day-to-day management of the Fund to a sub-advisor, SPARX Asset Management Co., Ltd. The Advisor pays the sub-advisor fees from its own assets and these fees are not an additional expense of the Fund. For the most recent fiscal year, the Advisor (not the Fund) paid a sub-advisory fee, based upon the daily net assets of the Fund, at the rate of 0.20%.
The Board has approved a Shareholder Servicing Agreement for Investor Class shares of the Fund, which was instituted to compensate the Advisor for the non-investment management services it provides to the Fund. The Shareholder Servicing Agreement provides for a monthly fee paid to the Advisor at an annual rate of 0.10% of the average daily net assets of the Fund attributable to Investor Class shares. Shareholder service fees payable by the Fund as of October 31, 2016, were $2,191.
The Fund has adopted a plan pursuant to Rule 12b-1 under the Investment Company Act of 1940, as amended, that authorizes payments in connection with the distribution of the Fund’s shares at an annual rate of up to 0.25% of the Fund’s average daily net assets attributable to Investor Class shares. Even though the authorized rate is up to 0.25%, the Fund has only used up to 0.15% of its average daily net assets attributable to Investor Class shares for such purpose since the plan was implemented on March 1, 2016. Amounts paid under the plan may be spent on any activities or expenses primarily intended to result in the sale of shares, including, but not limited to, advertising, shareholder account servicing, the printing and mailing of prospectuses to other than current shareholders, the printing and mailing of sales literature, and compensation for sales and marketing activities or to financial institutions and others, such as dealers and distributors.
HENNESSYFUNDS.COM
| NOTES TO THE FINANCIAL STATEMENTS |
The Fund has entered into agreements with various brokers, dealers, and financial intermediaries in connection with the sale of shares of the Fund. The agreements provide for periodic payments by the Fund to the brokers, dealers, and financial intermediaries for providing certain shareholder maintenance services (sub-transfer agent expenses). These shareholder services include the pre-processing and quality control of new accounts, shareholder correspondence, answering customer inquiries regarding account status, and facilitating shareholder telephone transactions. Fees paid by the Fund to various brokers, dealers, and financial intermediaries during the fiscal year ended October 31, 2016, were $65,021.
U.S. Bancorp Fund Services, LLC (“USBFS”) provides the Fund with administrative, fund accounting, and transfer agent services, and necessary office equipment. As administrator, USBFS is responsible for activities such as (i) preparing various federal and state regulatory filings, reports, and returns for the Fund, (ii) preparing reports and materials to be supplied to the Board, (iii) monitoring the activities of the Fund’s custodian, transfer agent, and accountants, and (iv) coordinating the preparation and payment of the Fund’s expenses and reviewing the Fund’s expense accruals. Fees paid to USBFS during the fiscal year ended October 31, 2016, were $26,692.
U.S. Bank, N.A., an affiliate of USBFS, serves as the Fund’s custodian. Quasar Distributors, LLC acts as the Fund’s principal underwriter in a continuous public offering of the Fund’s shares. Quasar Distributors, LLC is an affiliate of USBFS and U.S. Bank, N.A.
The officers of the Fund are affiliated with the Advisor. Such officers, with the exception of the Chief Compliance Officer and the Senior Compliance Officer, receive no compensation from the Fund for serving in their respective roles. The Fund, along with the other Hennessy Funds, makes reimbursement payments, on an equal basis, to the Advisor for a portion of the salary and benefits associated with the office of the Chief Compliance Officer and for all of the salary and benefits associated with the office of the Senior Compliance Officer. Such amounts are included on the Statement of Operations.
6). GUARANTEES AND INDEMNIFICATIONS
Under the Hennessy Funds’ organizational documents, their officers and trustees are indemnified by the Hennessy Funds against certain liabilities arising out of the performance of their duties to the Hennessy Funds. Additionally, in the normal course of business, the Hennessy Funds enter into contracts with service providers that contain general indemnification clauses. The Fund’s maximum exposure under these arrangements is unknown as this would involve future claims that may be made against the Fund that have not yet occurred. Currently, the Fund expects the risk of loss to be remote.
7). LINE OF CREDIT
The Fund has an uncommitted line of credit with the other Hennessy Funds in the amount of the lesser of (i) $100,000,000 or (ii) 33.33% of each Hennessy Fund’s net assets, or 30% for the Hennessy Gas Utility Fund and 10% for the Hennessy Balanced Fund, intended to provide short-term financing, if necessary, subject to certain restrictions, in connection with shareholder redemptions. The credit facility is with the Hennessy Funds’ custodian bank, U.S. Bank, N.A. Borrowings under this arrangement bear interest at the bank’s prime rate and are secured by all of the Fund’s assets (as to its own borrowings only). During the fiscal year ended October 31, 2016, the Fund had an outstanding average daily balance and a weighted average interest rate of $4,052 and 3.47%, respectively. The maximum amount outstanding for the Fund during the period was $326,000. At October 31, 2016, the Fund did not have any borrowings outstanding under the line of credit.
| HENNESSY FUNDS | 1-800-966-4354 | |
8). FEDERAL TAX INFORMATION
As of October 31, 2016, the components of accumulated earnings (losses) for income tax purposes were as follows:
| Cost of investments for tax purposes | | $ | 25,477,307 | |
| Gross tax unrealized appreciation | | $ | 5,223,148 | |
| Gross tax unrealized depreciation | | | (1,330,404 | ) |
| Net tax unrealized appreciation | | $ | 3,892,744 | |
| Undistributed ordinary income | | $ | 588,367 | |
| Undistributed long-term capital gains | | | — | |
| Total distributable earnings | | $ | 588,367 | |
| Other accumulated loss | | $ | (8,841 | ) |
| Total accumulated gain | | $ | 4,472,270 | |
The difference between book-basis unrealized appreciation/depreciation (as shown in the Statement of Assets and Liabilities) and tax-basis unrealized appreciation/depreciation (as shown above) is attributable primarily to wash sales and passive foreign investment companies.
At October 31, 2016, the Fund had no tax basis capital losses to offset future capital gains.
At October 31, 2016, the Fund did not defer, on a tax basis, any post-December late year ordinary loss deferrals.
During the fiscal years ended October 31, 2016 and 2015, the tax character of distributions paid by the Fund was as follows:
| | | Year Ended | | | Year Ended | |
| | | October 31, 2016 | | | October 31, 2015 | |
Ordinary income(1) | | $ | 3 | | | $ | 362,445 | |
| Long-term capital gain | | | 915,894 | | | | 1,174,668 | |
| | | $ | 915,897 | | | $ | 1,537,113 | |
(1) Ordinary income includes short-term gain or loss.
9). EVENTS SUBSEQUENT TO YEAR END
Management has evaluated the Fund’s related events and transactions that occurred subsequent to October 31, 2016, through the date of issuance of the Fund’s financial statements. Other than as disclosed below, management has determined that there were no subsequent events requiring recognition or disclosure in the financial statements.
On December 7, 2016, capital gains were declared and paid to shareholders of record as of December 6, 2016, as follows:
| | Short-term |
| | Amount Per Share |
| Investor Class | $0.10008 |
| Institutional Class | $0.33984 |
HENNESSYFUNDS.COM
| NOTES TO THE FINANCIAL STATEMENTS |
(This Page Intentionally Left Blank.)
| HENNESSY FUNDS | 1-800-966-4354 | |
Report of Independent Registered Public Accounting Firm
The Board of Trustees of Hennessy Funds Trust
and Shareholders of the Hennessy Japan Small Cap Fund:
We have audited the accompanying statement of assets and liabilities of the Hennessy Japan Small Cap Fund (the Fund), a series of Hennessy Funds Trust, including the schedule of investments, as of October 31, 2016, and the related statement of operations for the year then ended, the statements of changes in net assets for each of the years in the two year period then ended, and the financial highlights for each of the years in the five year period then ended. These financial statements and financial highlights are the responsibility of the Fund’s management. Our responsibility is to express an opinion on these financial statements and financial highlights based on our audits.
We conducted our audits in accordance with the standards of the Public Company Accounting Oversight Board (United States). Those standards require that we plan and perform the audit to obtain reasonable assurance about whether the financial statements and financial highlights are free of material misstatement. An audit includes examining, on a test basis, evidence supporting the amounts and disclosures in the financial statements. Our procedures included confirmation of securities owned as of October 31, 2016, by correspondence with custodians and brokers or by other appropriate auditing procedures. An audit also includes assessing the accounting principles used and significant estimates made by management, as well as evaluating the overall financial statement presentation. We believe that our audits provide a reasonable basis for our opinion.
In our opinion, the financial statements and financial highlights referred to above present fairly, in all material respects, the financial position of the Fund as of October 31, 2016, the results of its operations for the year then ended, the changes in its net assets for each of the years in the two year period then ended, and the financial highlights for each of the years in the five year period then ended, in conformity with U.S. generally accepted accounting principles.
Chicago, Illinois
December 22, 2016
HENNESSYFUNDS.COM
| REPORT OF INDEPENDENT REGISTERED PUBLIC ACCOUNTING FIRM/TRUSTEES AND OFFICERS |
Trustees and Officers of the Fund (Unaudited)
The business and affairs of the Fund are managed under the direction of the Board of Trustees of the Trust, and the Board of Trustees elects the Officers of the Trust. Beginning in March 2015, the Board of Trustees has from time to time appointed advisers (“Advisers “) to the Board of Trustees, with the intention of having qualified individuals serve in an advisory capacity in order to garner experience in the mutual fund and asset management industry and be considered as potential Trustees in the future. There are currently three Advisers to the Board of Trustees: Brian Alexander, Doug Franklin, and Claire Knoles. As Advisers, Mr. Alexander, Mr. Franklin, and Ms. Knoles attend meetings of the Board and act as non-voting participants. Information pertaining to the Trustees, Advisers, and the Officers of the Trust is set forth below. The Trustees and Officers serve until their successors are duly elected and qualified or until their earlier death, resignation, or removal. Each of the Trustees oversees 16 Hennessy Funds. Unless otherwise indicated, the address of all persons listed below is 7250 Redwood Boulevard, Suite 200, Novato, CA 94945. The Fund’s Statement of Additional Information includes more information about the persons listed below and is available, without charge, upon request by calling 1-800-966-4354.
| | | | Other |
| | | | Directorships |
| | | | Held Outside |
| Name, (Year of Birth), | | | of Fund |
| and Position Held | Start Date | Principal Occupation(s) | Complex During |
with the Trust | of Service | During Past Five Years | Past Five Years(1) |
| | | |
| Disinterested Trustees and Advisers | | |
| | | | |
| J. Dennis DeSousa | January 1996 | Mr. DeSousa is a real estate investor. | None. |
| (1936) | | | |
| Trustee | | | |
| | | | |
| Robert T. Doyle | January 1996 | Mr. Doyle has been the Sheriff of | None. |
| (1947) | | Marin County, California since 1996. | |
| Trustee | | | |
| | | | |
| Gerald P. Richardson | May 2004 | Mr. Richardson is an independent | None. |
| (1945) | | consultant in the securities industry. | |
| Trustee | | | |
| | | | |
| Brian Alexander | March 2015 | Mr. Alexander has been employed | None. |
| (1981) | | by Sutter Health Novato Community | |
| Adviser to the Board | | Hospital since 2012, first as an | |
| | | Assistant Administrator and then, | |
| | | beginning in 2013, as the Chief | |
| | | Administrative Officer. From 2011 | |
| | | through 2012, Mr. Alexander was | |
| | | employed by Sutter Health West Bay | |
| | | Region as the Regional Director of | |
| | | Strategic Decision Support. Prior to | |
| | | that, in 2011, he served as the | |
| | | Director of Managed Care | |
| | | Contracting and also the Director of | |
| | | Compensation, Benefits, and | |
| | | Compliance for the Rehabilitation | |
| | | Institute of Chicago. | |
| HENNESSY FUNDS | 1-800-966-4354 | |
| | | | Other |
| | | | Directorships |
| | | | Held Outside |
| Name, (Year of Birth), | | | of Fund |
| and Position Held | Start Date | Principal Occupation(s) | Complex During |
with the Trust | of Service | During Past Five Years | Past Five Years(1) |
| | | |
| Doug Franklin | March 2016 | Mr. Franklin is a retired insurance | None. |
| (1964) | | industry executive. From 1987 | |
| Adviser to the Board | | through 2015, he was employed by | |
| | | the Allianz-Fireman’s Fund Insurance | |
| | | Company in various positions, | |
| | | including as its Chief Actuary and | |
| | | Chief Risk Officer. | |
| | | | |
| Claire Knoles | December 2015 | Ms. Knoles is a founder of Kiosk and | None. |
| (1974) | | has served as its Chief Operating | |
| Adviser to the Board | | Officer since 2004. Kiosk is a full | |
| | | service marketing agency with | |
| | | offices in the San Francisco Bay | |
| | | Area, Toronto, and Liverpool, UK. | |
| | | | |
Interested Trustee(2) | | | |
| | | | |
| Neil J. Hennessy | January 1996 as | Mr. Hennessy has been employed by | Hennessy |
| (1956) | a Trustee and | Hennessy Advisors, Inc. since 1989 | Advisors, Inc. |
| Trustee, Chairman of | June 2008 as | and currently serves as its President, | |
| the Board, Chief | an Officer | Chairman and Chief Executive Officer. | |
| Investment Officer, | | | |
| Portfolio Manager, | | | |
| and President | | | |
| Name, (Year of Birth), | | |
| and Position Held | Start Date | Principal Occupation(s) |
with the Trust | of Service | During Past Five Years |
| | | |
| Officers | | |
| | | |
| Teresa M. Nilsen | January 1996 | Ms. Nilsen has been employed by Hennessy Advisors, Inc. |
| (1966) | | since 1989 and currently serves as its Executive Vice President, |
| Executive Vice President | | Chief Operations Officer, Chief Financial Officer, and Secretary. |
| and Treasurer | | |
| | | |
| Daniel B. Steadman | March 2000 | Mr. Steadman has been employed by Hennessy Advisors, Inc. |
| (1956) | | since 2000 and currently serves as its Executive Vice President |
| Executive Vice President | | and Chief Compliance Officer. |
| and Secretary | | |
| | | |
| Jennifer Cheskiewicz | June 2013 | Ms. Cheskiewicz has been employed by Hennessy Advisors, Inc. |
| (1977) | | as its General Counsel since June 2013. She previously served |
| Senior Vice President and | | as in-house counsel to Carlson Capital, L.P., an SEC-registered |
| Chief Compliance Officer | | investment advisor to several private funds, from |
| | | February 2010 to May 2013. |
| | | |
| Brian Carlson | December 2013 | Mr. Carlson has been employed by Hennessy Advisors, Inc. |
| (1972) | | since December 2013. Mr. Carlson was previously a co-founder |
| Senior Vice President and | | and principal of Trivium Consultants, LLC from February 2011 |
| Head of Distribution | | through November 2013. |
HENNESSYFUNDS.COM
| TRUSTEES AND OFFICERS OF THE FUND |
| Name, (Year of Birth), | | |
| and Position Held | Start Date | Principal Occupation(s) |
with the Trust | of Service | During Past Five Years |
| | | |
| David Ellison | October 2012 | Mr. Ellison has been employed by Hennessy Advisors, Inc. since |
(1958)(3) | | October 2012. He has served as a Portfolio Manager of the |
| Senior Vice President and | | Hennessy Small Cap Financial Fund, the Hennessy Large Cap |
| Portfolio Manager | | Financial Fund, and the Hennessy Technology Fund since |
| | | inception. Prior to that, Mr. Ellison served as Director, CIO and |
| | | President of FBR Fund Advisers, Inc. from December |
| | | 1999 to October 2012. |
| | | |
| Brian Peery | March 2003 as | Mr. Peery has been employed by Hennessy Advisors, Inc. since |
| (1969) | an Officer and | 2002. He has served as a Portfolio Manager of the Hennessy |
| Senior Vice President and | February 2011 | Cornerstone Growth Fund, the Hennessy Cornerstone Mid Cap |
| Portfolio Manager | as a Co-Portfolio | 30 Fund, the Hennessy Cornerstone Large Growth Fund, the |
| | Manager or | Hennessy Cornerstone Value Fund, the Hennessy Total Return |
| | Portfolio Manager | Fund, and the Hennessy Balanced Fund since October 2014. |
| | | He served as Co-Portfolio Manager of the same funds from |
| | | February 2011 through September 2014. Mr. Peery has also |
| | | served as a Portfolio Manager of the Hennessy Gas Utility Fund |
| | | since February 2015. |
| | | |
| Winsor (Skip) Aylesworth | October 2012 | Mr. Aylesworth has been employed by Hennessy Advisors, Inc. |
(1947)(3) | | since October 2012. He has served as a Portfolio Manager of |
| Vice President and | | the Hennessy Gas Utility Fund since 1998 and as a Portfolio |
| Portfolio Manager | | Manager of the Hennessy Technology Fund since inception. |
| | | Prior to that, Mr. Aylesworth served as Executive Vice President |
| | | of FBR Fund Advisers, Inc. from 1999 to October 2012. |
| | | |
| Ryan Kelley | March 2013 | Mr. Kelley has been employed by Hennessy Advisors, Inc. since |
(1972)(4) | | October 2012. He has served as a Portfolio Manager of the |
| Vice President and | | Hennessy Gas Utility Fund, the Hennessy Small Cap Financial |
| Portfolio Manager | | Fund, and the Hennessy Large Cap Financial Fund since |
| | | October 2014. He served as Co-Portfolio Manager of the same |
| | | funds from March 2013 through September 2014, and as a |
| | | Portfolio Analyst for the Hennessy Funds from October 2012 |
| | | through February 2013. Prior to that, Mr. Kelley served as |
| | | Portfolio Manager of FBR Fund Advisers, Inc. from |
| | | January 2008 to October 2012. |
______________
(1) | Messrs. DeSousa, Doyle, Hennessy, and Richardson previously served on the Board of Directors of Hennessy Mutual Funds, Inc. (“HMFI”), The Hennessy Funds, Inc. (“HFI”), and Hennessy SPARX Funds Trust (“HSFT”). Pursuant to an internal reorganization effective as of February 28, 2014, the series of HFMI, HFI, and HSFT were reorganized into corresponding series of Hennessy Funds Trust that mirrored them. Subsequent to the reorganization, HFMI, HFI, and HSFT were dissolved. |
(2) | Mr. Hennessy is considered an “interested person,” as defined in the Investment Company Act of 1940, as amended, because he is an officer of the Hennessy Funds. |
(3) | The address of these officers is 101 Federal Street, Suite 1900, Boston, MA 02110. |
(4) | The address of this officer is 1340 Environ Way, Suite 305, Chapel Hill, NC 27517. |
| HENNESSY FUNDS | 1-800-966-4354 | |
Expense Example (Unaudited)
October 31, 2016
As a shareholder of the Fund, you incur two types of costs: (1) transaction costs, including sales charges (loads) on purchase payments, reinvested dividends, or other distributions; redemption fees; and exchange fees; and (2) ongoing costs, including management fees; service fees; and other Fund expenses. This Example is intended to help you understand your ongoing costs (in dollars) of investing in the Fund and to compare these costs with the ongoing costs of investing in other mutual funds. The Example is based on an investment of $1,000 invested at the beginning of the period and held for the entire period from May 1, 2016, through October 31, 2016.
Actual Expenses
The first line of the table below under the “Investor Class” and “Institutional Class” headings provides information about actual account values and actual expenses. Although the Fund charges no sales loads or transaction fees, you will be assessed fees for outgoing wire transfers, returned checks and stop payment orders at prevailing rates charged by U.S. Bancorp Fund Services, LLC, the Fund’s transfer agent. If you request that a redemption be made by wire transfer, currently a $15 fee is charged by the Fund’s transfer agent. IRA accounts will be charged a $15 annual maintenance fee. The example below includes, but is not limited to, management fees, shareholder servicing fees, fund accounting, custody, and transfer agent fees. However, the example below does not include portfolio trading commissions and related expenses, and other extraordinary expenses as determined under generally accepted accounting principles. You may use the information in this line, together with the amount you invested, to estimate the expenses that you paid over the period. Simply divide your account value by $1,000 (for example, an $8,600 account value divided by $1,000 = 8.6), then multiply the result by the number in the first line of the table under the “Investor Class” and “Institutional Class” headings in the column entitled “Expenses Paid During Period” to estimate the expenses you paid on your account during this period.
Hypothetical Example for Comparison Purposes
The second line of the table below under the “Investor Class” and “Institutional Class” headings provides information about hypothetical account values and hypothetical expenses based on the Fund’s actual expense ratios and an assumed rate of return of 5% per year before expenses, which is not the Fund’s actual return. The hypothetical account values and expenses may not be used to estimate the actual ending account balance or expenses you paid for the period. You may use this information to compare the ongoing costs of investing in the Fund and other funds. To do so, compare this 5% hypothetical example with the 5% hypothetical examples that appear in the shareholder reports of the other funds. Please note that the expenses shown in the table are meant to highlight your ongoing costs only and do not reflect any transactional costs, such as sales charges (loads), or exchange fees. Therefore, the second line of the table under the “Investor Class” and “Institutional Class” headings is useful in comparing ongoing costs only, and will not help you determine the relative total costs of owning different funds. In addition, if these transactional costs were included, your costs would have been higher.
HENNESSYFUNDS.COM
| | | | Expenses Paid |
| | Beginning | Ending | During Period(1) |
| | Account Value | Account Value | May 1, 2016 – |
| | May 1, 2016 | October 31, 2016 | October 31, 2016 |
| Investor Class | | | |
| Actual | $1,000.00 | $1,103.60 | $9.78 |
| Hypothetical (5% return before expenses) | $1,000.00 | $1,015.84 | $9.37 |
| | | | |
| Institutional Class | | | |
| Actual | $1,000.00 | $1,105.40 | $8.10 |
| Hypothetical (5% return before expenses) | $1,000.00 | $1,017.44 | $7.76 |
(1) | Expenses are equal to the Fund’s annualized expense ratio of 1.85% for Investor Class shares or 1.53% for Institutional Class shares, as applicable, multiplied by the average account value over the period, multiplied by 184/366 days (to reflect one-half year period). |
| HENNESSY FUNDS | 1-800-966-4354 | |
How to Obtain a Copy of the Fund’s
Proxy Voting Policy and Proxy Voting Records
A description of the policies and procedures the Fund uses to determine how to vote proxies relating to portfolio securities is available without charge: (1) by calling 1-800-966-4354; (2) on the Hennessy Funds’ website at hennessyfunds.com/proxy-voting/policy.fs; or (3) on the U.S. Securities and Exchange Commission’s website at www.sec.gov. The Fund’s proxy voting record is available without charge on both the Hennessy Funds’ website at hennessyfunds.com/proxy-voting/vote.fs and the SEC’s website at www.sec.gov no later than August 31 for the prior 12 months ending June 30.
Quarterly Filings on Form N-Q
The Fund files its complete schedule of portfolio holdings with the SEC for the first and third quarters of each fiscal year on Form N-Q. The Fund’s Form N-Q will be available on the SEC’s website at www.sec.gov. The Fund’s Form N-Q may be reviewed and copied at the SEC’s Public Reference Room in Washington, DC and information on the operation of the Public Reference Room may be obtained by calling 1-800-SEC-0330. Information included in the Fund’s N-Q will also be available upon request by calling 1-800-966-4354.
Federal Tax Distribution Information
(Unaudited)
For the fiscal year ended October 31, 2016, certain dividends paid by the Fund may be subject to a maximum tax rate of 23.8%, as provided for by the Jobs and Growth Tax Relief Reconciliation Act of 2003. The percentage of dividends declared from ordinary income designated as qualified dividend income was 0%.
For corporate shareholders, the percent of ordinary income distributions that qualified for the corporate dividends received deduction for the fiscal year ended October 31, 2016, was 0%.
The percentage of taxable ordinary income distributions that are designated as short-term capital gain distributions under Section 871(k)(2)(C) of the Internal Revenue Code of 1986, as amended, for the Fund was 0%.
For the year ended October 31, 2016, the Fund earned foreign source income and paid foreign taxes, as noted below, which it intends to pass through to its shareholders pursuant to Section 853 of the Internal Revenue Code.
| | | Gross Foreign | | | Foreign Tax | | |
| | | Income | | | Paid | | |
| Japan | | | 656,621 | | | | 65,662 | | |
| | | | 656,621 | | | | 65,662 | | |
HENNESSYFUNDS.COM
| PROXY VOTING — HOUSEHOLDING |
Householding
To help keep the Fund’s costs as low as possible, we generally deliver a single copy of most financial reports and prospectuses to shareholders who share an address, even if the accounts are registered under different names. This process, known as “householding,” does not apply to account statements. You may, of course, request an individual copy of a prospectus or financial report at any time. If you would like to receive separate mailings, please call the Administrator at 1-800-261-6950 or 1-414-765-4124 and we will begin individual delivery within 30 days of your request. If your account is held through a financial institution or other intermediary, please contact them directly to request individual delivery.
| HENNESSY FUNDS | 1-800-966-4354 | |
Privacy Policy
We collect the following non-public personal information about you:
| | • | information we receive from you on or in applications or other forms, correspondence, or conversations, including, but not limited to, your name, address, phone number, social security number, assets, income, and date of birth; and |
| | • | information about your transactions with us, our affiliates, or others, including, but not limited to, your account number and balance, payment history, parties to transactions, cost basis information, and other financial information. |
We do not disclose any non-public personal information about our current or former shareholders to non-affiliated third parties, except as permitted by law. For example, we are permitted by law to disclose all of the information we collect, as described above, to our Transfer Agent to process your transactions. Furthermore, we restrict access to your non-public personal information to those persons who require such information to provide products or services to you. We maintain physical, electronic, and procedural safeguards that comply with federal standards to guard your non-public personal information.
In the event that you hold shares of the Fund through a financial intermediary, including, but not limited to, a broker-dealer, bank or trust company, the privacy policy of your financial intermediary would govern how your non-public personal information would be shared with non-affiliated third parties.
HENNESSYFUNDS.COM
(This Page Intentionally Left Blank.)
For information, questions or assistance, please call
The Hennessy Funds
1-800-966-4354 or 1-415-899-1555
INVESTMENT ADVISOR
Hennessy Advisors, Inc.
7250 Redwood Blvd., Suite 200
Novato, California 94945
ADMINISTRATOR,
TRANSFER AGENT,
DIVIDEND PAYING AGENT &
SHAREHOLDER SERVICING AGENT
U.S. Bancorp Fund Services, LLC
P.O. Box 701
Milwaukee, Wisconsin 53201-0701
CUSTODIAN
U.S. Bank N.A.
Custody Operations
1555 North River Center Dr., Suite 302
Milwaukee, Wisconsin 53212
TRUSTEES
Neil J. Hennessy
Robert T. Doyle
J. Dennis DeSousa
Gerald P. Richardson
COUNSEL
Foley & Lardner LLP
777 East Wisconsin Avenue
Milwaukee, Wisconsin 53202-5306
INDEPENDENT REGISTERED
PUBLIC ACCOUNTING FIRM
KPMG LLP
200 East Randolph Street
Chicago, Illinois 60601
DISTRIBUTOR
Quasar Distributors, LLC
615 East Michigan Street
Milwaukee, Wisconsin 53202
hennessyfunds.com | 1-800-966-4354
This report has been prepared for shareholders and may be distributed to
others only if preceded or accompanied by a current prospectus.
Item 2. Code of Ethics.
The registrant has adopted a code of ethics that applies to the registrant’s principal executive officer and principal financial officer. In February 2016, the registrant adopted an updated code of ethics to (1) remove the pre‑clearance requirement for transactions in exchange‑traded funds and (2) remove the requirement that access persons either hold all of their investments through an RIA master account of the investment advisor to the registrant’s series, Hennessy Advisors, Inc., or direct their brokers to provide duplicate account statements and transaction confirmations the Compliance Department. The registrant has not granted any waivers from any provisions of the code of ethics during the period covered by this report.
A copy of the registrant’s Code of Ethics is filed herewith, along with an exhibit that shows the portions of the Code of Ethics that were updated, as discussed above.
Item 3. Audit Committee Financial Expert.
The registrant’s board of directors has determined that it does not have an audit committee financial expert serving on its audit committee. At this time, the registrant believes that the financial and business experience provided by each member of the audit committee together offers the registrant adequate oversight for the registrant’s level of financial complexity.
Item 4. Principal Accountant Fees and Services.
The registrant has engaged the principal accountants to the Hennessy Funds, KPMG LLP and Tait, Weller & Baker, LLP, to perform audit services, audit-related services, tax services and other services during the past two fiscal years. “Audit services” refer to performing an audit of the registrant's annual financial statements or services that are normally provided by the accountants in connection with statutory and regulatory filings or engagements for those fiscal years. “Audit-related services” refer to the assurance and related services by the principal accountants that are reasonably related to the performance of the audit. “Tax services” refer to professional services rendered by the principal accountants for tax compliance, tax advice, and tax planning. The following table details the aggregate fees billed or expected to be billed for each of the last two fiscal years for audit fees, audit-related fees, tax fees and other fees by the principal accountants to the Hennessy Funds.
| | FYE 10/31/2016 | FYE 10/31/2015 |
| Audit Fees | $295,600 | $282,500 |
| Audit-Related Fees | - | - |
| Tax Fees | $60,700 | $58,620 |
| All Other Fees | - | - |
The audit committee has adopted pre-approval procedures for audit and non-audit services provided to the registrant. Under the procedures, at any regularly scheduled audit committee meeting, the audit committee may pre-approve any audit, audit-related, tax and other non-audit services to be rendered or that may be rendered by a principal accountant to the registrant and certain non-audit services to be rendered by a principal accountant to the investment advisor to the registrant’s series or such advisor’s affiliates that provide ongoing services to the registrant. The audit committee either specifically pre-approves the services or pre-approves a type of a service. No pre-approval is required for non-audit services that meet the following criteria: (1) the aggregate amount of fees to be paid for all such non-audit services is not more than 5% of the total revenues paid by the registrant to the principal accountant in the fiscal year in which the non-audit services are provided; (2) such services were not recognized by the registrant at the time of the engagement to be non-audit services; and (3) such services are promptly brought to the attention of the audit committee and approved prior to the completion of the audit.
The audit committee must pre-approve a principal accountant’s engagements for non-audit services with the investment advisor to the registrant’s series and such advisor’s affiliates that provide ongoing services to the registrant, if the engagement relates directly to the operations and financial reporting of the registrant, unless the aggregate amount of fees to be paid for all such services provided constitutes no more than 5% of the aggregate revenues paid to the principal accountant by the registrant, the investment advisor and such advisor’s affiliates that provide ongoing services to the registrant, during the fiscal year in which the services are to be provided.
If a service has not been pre-approved at a regularly scheduled audit committee meeting, and if, in the opinion of the Chief Compliance Officer of the registrant, a proposed engagement must commence before the next regularly scheduled audit committee meeting, any member of the audit committee is authorized under the procedures to pre-approve the engagement. The Chief Compliance Officer of the registrant will arrange for this interim review, coordinate with the designated member of the audit committee and provide, with the assistance of the principal accountant, information about the service to be pre-approved for the interim period. Any interim pre-approval decisions are reported (for informational purposes) to the audit committee at its next regularly scheduled meeting.
All of the tax services referenced above were pre-approved in accordance with the pre-approval procedures for audit and non-audit services.
The percentage of fees billed by KPMG LLP applicable to non-audit services pursuant to waiver of pre-approval requirement were as follows:
| | FYE 10/31/2016 | FYE 10/31/2015 |
| Audit-Related Fees | 0% | 0% |
| Tax Fees | 0% | 0% |
| All Other Fees | 0% | 0% |
The percentage of fees billed by Tait, Weller & Baker, LLP applicable to non-audit services pursuant to waiver of pre-approval requirement were as follows:
| | FYE 10/31/2016 | FYE 10/31/2015 |
| Audit-Related Fees | 0% | 0% |
| Tax Fees | 0% | 0% |
| All Other Fees | 0% | 0% |
All of the principal accountants’ hours spent on auditing the registrant’s financial statements were attributed to work performed by full‑time permanent employees of the principal accountants.
In assessing the independence of the registrant’s principal accountants, the registrant’s board of trustees noted that the principal accountants have not provided any audit or non-audit services to the investment advisor to the registrant’s series, Hennessy Advisors, Inc., or any entity controlling, controlled by, or under common control with Hennessy Advisors.
Item 5. Audit Committee of Listed Registrants.
Not applicable to registrants who are not listed issuers (as defined in Rule 10A-3 under the Securities Exchange Act of 1934).
Item 6. Investments.
The Schedules of Investments are included as part of the reports to shareholders filed under Item 1 of this Form.
Item 7. Disclosure of Proxy Voting Policies and Procedures for Closed-End Management Investment Companies.
Not applicable to open-end investment companies.
Item 8. Portfolio Managers of Closed-End Management Investment Companies.
Not applicable to open-end investment companies.
Item 9. Purchases of Equity Securities by Closed‑End Management Investment Company and Affiliated Purchasers.
Not applicable to open-end investment companies.
Item 10. Submission of Matters to a Vote of Security Holders.
Not Applicable.
Item 11. Controls and Procedures.
| (a) | The Registrant’s President and Treasurer have reviewed the Registrant's disclosure controls and procedures (as defined in Rule 30a-3(c) under the Investment Company Act of 1940 (the “Act”)) as of a date within 90 days of the filing of this report, as required by Rule 30a-3(b) under the Act and Rules 13a-15(b) or 15d‑15(b) under the Securities Exchange Act of 1934. Based on their review, such officers have concluded that the disclosure controls and procedures are effective in ensuring that information required to be disclosed in this report is appropriately recorded, processed, summarized and reported and made known to them by others within the Registrant and by the Registrant’s service providers. |
| (b) | There were no changes in the Registrant's internal control over financial reporting (as defined in Rule 30a-3(d) under the Act) that occurred during the second fiscal quarter of the period covered by this report that has materially affected, or is reasonably likely to materially affect, the Registrant's internal control over financial reporting. |
Item 12. Exhibits.
| (a) | (1) Code of ethics, or amendments thereto, that is the subject of the disclosure required by Item 2, to the extent that the registrant intends to satisfy Item 2 requirements through filing of an exhibit. Filed herewith. |
(2) A separate certification for each principal executive and principal financial officer pursuant to Rule 30a‑2(a) under the Act and Section 302 of the Sarbanes-Oxley Act of 2002. Filed herewith.
(3) Any written solicitation to purchase securities under Rule 23c‑1 under the Act sent or given during the period covered by the report by or on behalf of the registrant to 10 or more persons. Not applicable to open-end investment companies.
| (b) | Certifications pursuant to Rule 30a‑2(b) under the Act and Section 906 of the Sarbanes‑Oxley Act of 2002. Furnished herewith. |
SIGNATURES
Pursuant to the requirements of the Securities Exchange Act of 1934 and the Investment Company Act of 1940, the registrant has duly caused this report to be signed on its behalf by the undersigned, thereunto duly authorized.
HENNESSY FUNDS TRUST
(Registrant)
By: /s/Neil J. Hennessy
Neil J. Hennessy
President
Date: January 6, 2017
Pursuant to the requirements of the Securities Exchange Act of 1934 and the Investment Company Act of 1940, this report has been signed below by the following persons on behalf of the registrant and in the capacities and on the dates indicated.
By: /s/Neil J. Hennessy
Neil J. Hennessy, President |
| |
| Date: January 6, 2017 |
By: /s/Teresa M. Nilsen
Teresa M. Nilsen, Treasurer |
| |
| Date: January 6, 2017 |