As filed with the Securities and Exchange Commission on January 8, 2018
UNITED STATES
SECURITIES AND EXCHANGE COMMISSION
Washington, D.C. 20549
FORM N-CSR
CERTIFIED SHAREHOLDER REPORT OF REGISTERED
MANAGEMENT INVESTMENT COMPANIES
Investment Company Act file number (811-07168)
Hennessy Funds Trust
(Exact name of registrant as specified in charter)
7250 Redwood Blvd., Suite 200
Novato, CA 94945
(Address of principal executive offices) (Zip code)
Neil J. Hennessy
7250 Redwood Blvd., Suite 200
Novato, CA 94945
(Name and address of agent for service)
800-966-4354
Registrant’s telephone number, including area code
Date of fiscal year end: October 31, 2017
Date of reporting period: October 31, 2017
Item 1. Reports to Stockholders.
ANNUAL REPORT
OCTOBER 31, 2017
HENNESSY CORNERSTONE
GROWTH FUND
Investor Class HFCGX
Institutional Class HICGX
hennessyfunds.com | 1-800-966-4354
(This Page Intentionally Left Blank.)
Contents
| Letter to Shareholders | | | 2 |
| Performance Overview | | | 4 |
| Financial Statements | | | |
| Schedule of Investments | | | 7 |
| Statement of Assets and Liabilities | | | 12 |
| Statement of Operations | | | 13 |
| Statements of Changes in Net Assets | | | 15 |
| Financial Highlights | | | 16 |
| Notes to the Financial Statements | | | 20 |
| Report of Independent Registered Public Accounting Firm | | | 28 |
| Trustees and Officers of the Fund | | | 29 |
| Expense Example | | | 32 |
| Proxy Voting Policy and Proxy Voting Records | | | 34 |
| Quarterly Schedule of Investments | | | 34 |
| Householding | | | 34 |
| Privacy Policy | | | 35 |
| HENNESSY FUNDS | 1-800-966-4354 | |
December 2017
Dear Hennessy Funds Shareholder:
Over the past year, global equity markets have made strong advances, fueled by continued, broad-based economic growth in most countries and regions, and in spite of a somewhat unsettling geopolitical backdrop.
U.S. stocks performed well in the first year of the new administration in Washington, and, ignoring the debate and the bluster, investors have continued to focus on what concerns them the most – tax reform, deregulation, and the hope of an increase in infrastructure spending. As we move into the final weeks of the calendar year, with the major indices reaching new highs, I find myself envisioning the Dow Jones Industrial Average building momentum toward 30,000.
Over the past 12 months, the U.S. economy has continued to grow at a steady rate of almost 2.5% on an annualized basis, as measured by GDP. Companies have added over 170,000 jobs per month on average over the past year, and the current unemployment rate of 4.1% is the lowest in 17 years. Consumer confidence is high and still rising, and corporate profits are at all-time highs. The Federal Reserve has been increasing interest rates, but at a gradual pace. The bond market has also continued to support the equity market and equity market valuations. Since December of last year, long bond yields have stayed within a narrow band, with the 10-year U.S. Treasury yield hovering in the 2.0% to 2.5% range, and remain low compared to historical averages. In my opinion, long bond yields have stayed low despite three increases in the Federal Funds rate over the last 12 months in part due to persistent low inflation.
Meanwhile, the prospective price-to-earnings multiples for the Dow Jones Industrial Average and S&P 500 Index are just above long-term averages at 19.5x and 19.9x, respectively. I believe these levels of stock valuation, while higher than a year ago, are still very reasonable. At the peak of the technology/dot-com bubble, U.S. equities sold at much higher multiples across the board than they do today, and bond yields were also much higher. In June of 1999, the Dow Jones Industrial Average sold at 28x earnings and the 10-year bond yield was close to 6%. Today, the Dow is selling at under 20x earnings and is offering a 2.2% dividend yield, on par with the yield of the 10-year government bond at 2.4%.
Equity markets in the U.S. have been rising for almost nine years, and financial media reports have speculated that this bull run will come to end, but why? I see no substantial reasons or indicators that a major correction is on the horizon. I remain confident that this bull market has room to run. Overall, investment fundamentals are strong. Corporate earnings are growing at a healthy rate, and companies are generating excess cash flow. Cash continues to build on corporate balance sheets, with $5.2 trillion in cash and short term investments among the S&P 500 Index companies as of October 31, 2017. If our government leaders can pass a meaningful tax reform bill and continue efforts toward regulatory relief, it could be icing on the cake for equities.
There have been, and will likely continue to be, downturns throughout this extended bull market. Since 2010, there have been 18 downturns in the market, 14 of which were between 5% and 10% and four of which were corrections of between 10% and 20%. Yet the market has bounced back following each pullback and then has moved higher. A correction is not the end of the bull market. What might signal that we are at the end of this bull market? Euphoria. And I still see no signs of euphoria in this market. In the past,
I have likened the current bull market to that of 1982-2000, and I am confident in the strength of the market today and believe the economy will continue its slow, but steady, growth into the coming year.
Thank you for your continued confidence and investment in our funds. If you have any questions or would like to speak with us directly, please don’t hesitate to call us at (800) 966-4354.
Best regards,
Neil J. Hennessy
President and Chief Investment Officer
Past performance does not guarantee future results.
Mutual fund investing involves risk. Principal loss is possible.
Opinions expressed are those of Neil Hennessy and are subject to change, are not guaranteed, and should not be considered investment advice.
The Dow Jones Industrial Average and S&P 500 Index are unmanaged indices commonly used to measure the performance of U.S. stocks. One cannot invest directly in an index.
Price to earnings is calculated by dividing a company’s market price per share by its earnings per share. Dividend yield is calculated as the annual dividends paid by a company divided by the price of a share of its stock. Cash flow provides an indication of a company’s financial strength and represents earnings before depreciation, amortization, and non-cash charges.
| HENNESSY FUNDS | 1-800-966-4354 | |
Performance Overview (Unaudited)
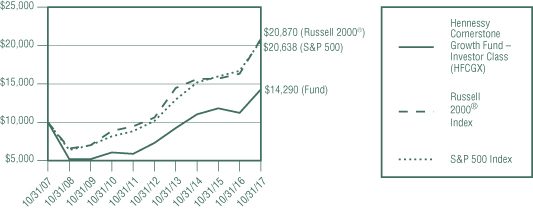
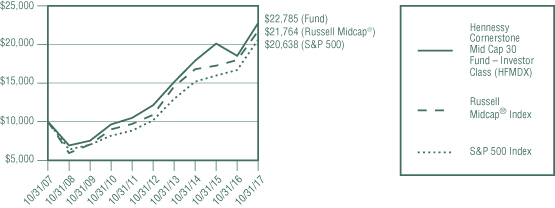
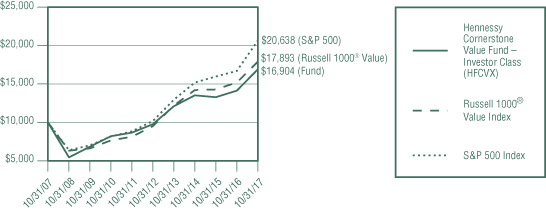
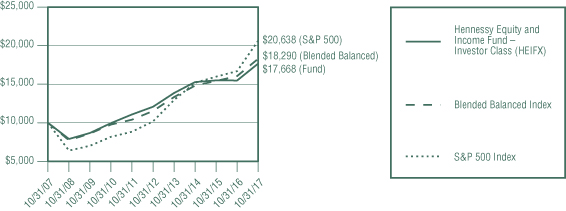
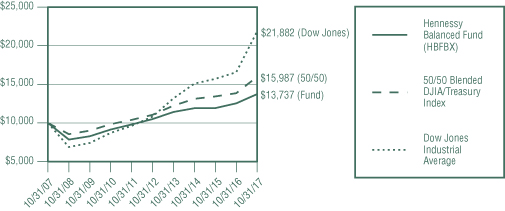
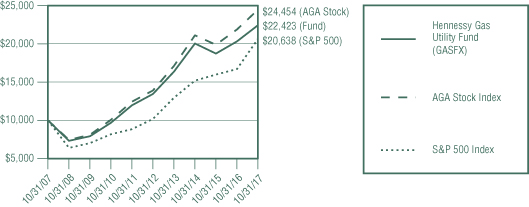
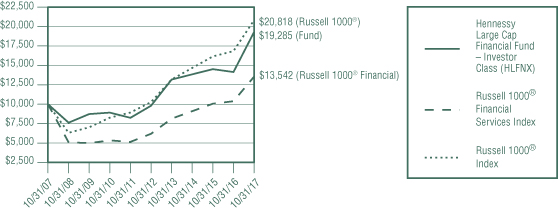
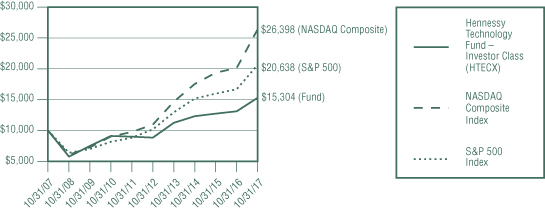
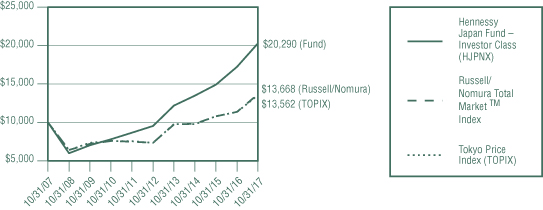
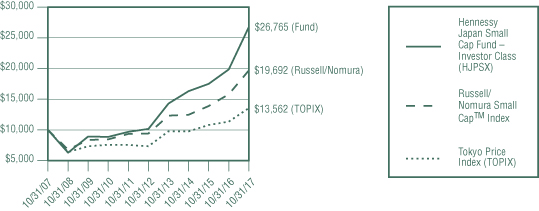
CHANGE IN VALUE OF $10,000 INVESTMENT
This graph illustrates the performance of an initial investment of $10,000 made in the Fund ten years ago and assumes the reinvestment of dividends.
AVERAGE ANNUAL TOTAL RETURN FOR PERIODS ENDED OCTOBER 31, 2017
| | One | Five | Ten |
| | Year | Years | Years |
| Hennessy Cornerstone Growth Fund – | | | |
| Investor Class (HFCGX) | 27.29% | 14.33% | 3.63% |
| Hennessy Cornerstone Growth Fund – | | | |
Institutional Class (HICGX)(1) | 27.70% | 14.66% | 3.94% |
Russell 2000® Index | 27.85% | 14.49% | 7.63% |
| S&P 500 Index | 23.63% | 15.18% | 7.51% |
Expense ratios: 1.33% (Investor Class); 0.99% (Institutional Class)
(1) | The inception date of Institutional Class shares is March 3, 2008. Performance shown prior to the inception of Institutional Class shares reflects the performance of Investor Class shares and includes expenses that are not applicable to, and are higher than, those of Institutional Class shares. |
Performance data quoted represents past performance; past performance does not guarantee future results. The investment return and principal value of an investment will fluctuate so that an investor’s shares, when redeemed, may be worth more or less than their original cost. The performance table does not reflect the deduction of taxes that a shareholder would pay on Fund distributions or the redemption of Fund shares. Current performance of the Fund may be lower or higher than the performance quoted. Performance data current to the most recent month end may be obtained by visiting hennessyfunds.com.
The Russell 2000® Index is an index commonly used to measure the performance of U.S. small-capitalization stocks. The S&P 500 Index is an unmanaged index commonly used to measure the performance of U.S. stocks. One cannot invest directly in an index.
Frank Russell Company (“Russell”) is the source and owner of the trademarks, service marks, and copyrights related to the Russell Indexes. Russell® is a trademark of Frank Russell Company. Neither Russell nor its licensors accept any liability for any errors or omissions in the Russell Indexes or Russell ratings or underlying data and no party may rely on any Russell Indexes or Russell ratings or underlying data contained in this communication. No further distribution of Russell data is permitted without Russell’s
express written consent. Russell does not promote, sponsor, or endorse the content of this communication.
The expense ratios presented are from the most recent prospectus. The expense ratios for the current reporting period are available in the Financial Highlights section of this report.
PERFORMANCE NARRATIVE
Portfolio Managers Neil J. Hennessy, Brian E. Peery, and Ryan C. Kelley
Performance:
For the 12-month period ended October 31, 2017, the Investor Class of the Hennessy Cornerstone Growth Fund returned 27.29%, slightly underperforming the Russell 2000® Index, which returned 27.85%, but outperforming the S&P 500 Index, which returned 23.63%, for the same period.
The Fund’s underperformance relative to its primary benchmark, the Russell 2000® Index, can be attributed primarily to the portfolio’s underweight position in the Health Care sector. On an individual stock basis, Triple-S Management Corp, an independent licensee of Blue Cross/Blue Shield in Puerto Rico, had the biggest negative impact on performance. Investments in the Consumer Discretionary sector performed well, with Scientific Games Corp. and Arcos Dorados Holdings aiding performance significantly. We continue to hold Scientific Games Corp. and Arcos Dorados Holdings in the portfolio, but have sold Triple-S Management Corp.
Portfolio Strategy:
We believe that the Fund’s investment strategy, which seeks companies that are reporting growth in earnings, whose stock prices are showing positive relative strength but that still trade on low price-to-sales ratios, offers investors true “growth at a reasonable price.” Limiting the Fund’s portfolio to 50 stocks produces a relatively concentrated portfolio, where individual stock performance can significantly influence the performance of the portfolio as a whole.
Investment Commentary:
We continue to believe that there are good investment opportunities among small- and mid-cap stocks. Many investors gravitated away from smaller stocks last year as they sought safety in larger, more well-established businesses in a year of much political uncertainty. Many of these smaller companies have purely domestic businesses, which are benefiting from steady, albeit slow, economic growth at home, low inflation, and low energy prices. Smaller companies could also be important beneficiaries of a cut in corporate taxes because many have predominantly domestic operations that offer little scope for sheltering taxes and are paying taxes near their effective rate of 35%. If a reduction in corporate taxes is included in a successful tax reform bill over the next year, we would expect the small- and mid-sized, domestically oriented stocks to react positively. As a result of the tight labor market in the U.S., we are finally starting to see wages rise, leading to better growth in personal incomes. Meanwhile, the economy continues to grow steadily, with GDP growth reported at 3.0% in the third quarter of 2017. Revenue growth for small- and mid-cap companies has been robust over the last 12 months. Overall, we believe current economic conditions provide a good environment for domestically oriented, small- and mid-cap stocks. We remain pleased with the positioning of the portfolio, which remains overweight in cyclical stocks, such as those in the Industrials and Consumer Discretionary sectors, and underweight more defensive
| HENNESSY FUNDS | 1-800-966-4354 | |
sectors, such as Utilities. Relative to the Fund’s benchmarks, the portfolio is also overweight in the Materials sector and underweight in Health Care and Financials.
Opinions expressed are those of the Portfolio Managers as of the date written and are subject to change, are not guaranteed, and should not be considered investment advice or an indication of trading intent. Earnings growth is not representative of the Fund’s future performance.
The Russell 2000® Index is an index commonly used to measure the performance of U.S. small-capitalization stocks. The S&P 500 Index is an unmanaged index commonly used to measure the performance of U.S. stocks. One cannot invest directly in an index.
The Fund invests in small- and medium-capitalization companies, which may have limited liquidity and greater price volatility than large capitalization companies. Investments in foreign securities may involve political, economic and currency risks, greater volatility, and differences in accounting methods. The Fund’s formula-based strategy may cause the Fund to buy or sell securities at times when it may not be advantageous. Please see the Fund’s prospectus for a more complete discussion of these and other risks.
References to specific securities should not be considered a recommendation to buy or sell any security. Fund holdings and sector allocations are subject to change. Please refer to the Schedule of Investments included in this report for additional portfolio information.
Price-to-sales ratio is a tool for calculating a stock’s valuation relative to other companies. It is calculated by dividing a stock’s current price by its revenue per share.
| PERFORMANCE OVERVIEW/SCHEDULE OF INVESTMENTS |
Financial Statements
Schedule of Investments as of October 31, 2017 |
HENNESSY CORNERSTONE GROWTH FUND
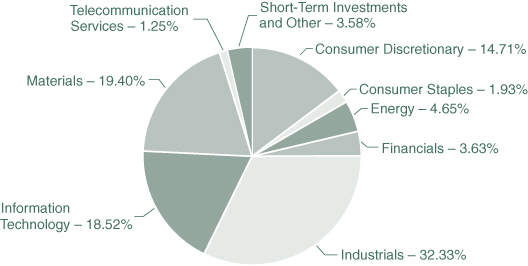
(% of Net Assets)
| TOP TEN HOLDINGS (EXCLUDING CASH/CASH EQUIVALENTS) | | % NET ASSETS |
| KEMET Corp. | | | 5.41 | % |
| Scientific Games Corp., Class A | | | 4.01 | % |
| Extreme Networks, Inc. | | | 3.53 | % |
| Sterling Construction Co., Inc. | | | 3.35 | % |
| Kronos Worldwide, Inc. | | | 3.28 | % |
| Tronox Ltd., Class A | | | 3.10 | % |
| The Chemours Co. | | | 2.98 | % |
| Meritor, Inc. | | | 2.77 | % |
| Arcos Dorados Holdings, Inc., Class A | | | 2.68 | % |
| Columbus Mckinnon Corporation of New York | | | 2.49 | % |
Note: For presentation purposes, the Fund has grouped some of the industry categories. For purposes of categorizing securities for compliance with Section 8(b)(1) of the Investment Company Act of 1940, as amended, the Fund uses more specific industry classifications.
| HENNESSY FUNDS | 1-800-966-4354 | |
| COMMON STOCKS – 94.80% | | Number | | | | | | % of | |
| | | of Shares | | | Value | | | Net Assets | |
| | | | | | | | | | |
| Consumer Discretionary – 14.71% | | | | | | | | | |
| Adtalem Global Education, Inc. | | | 119,400 | | | $ | 4,411,830 | | | | 1.93 | % |
| Arcos Dorados Holdings, Inc., Class A (a)(b) | | | 614,800 | | | | 6,148,000 | | | | 2.68 | % |
| K12, Inc. (a) | | | 211,400 | | | | 3,428,908 | | | | 1.50 | % |
| Scientific Games Corp., Class A (a) | | | 192,700 | | | | 9,172,520 | | | | 4.01 | % |
| Thor Industries, Inc. | | | 35,600 | | | | 4,849,432 | | | | 2.12 | % |
| Winnebago Industries, Inc. | | | 114,900 | | | | 5,647,335 | | | | 2.47 | % |
| | | | | | | | 33,658,025 | | | | 14.71 | % |
| | | | | | | | | | | | | |
| Consumer Staples – 1.93% | | | | | | | | | | | | |
| Central Garden & Pet Co. (a) | | | 115,400 | | | | 4,405,972 | | | | 1.93 | % |
| | | | | | | | | | | | | |
| Energy – 3.03% | | | | | | | | | | | | |
| Cosan Ltd., Class A (b) | | | 432,300 | | | | 3,756,687 | | | | 1.64 | % |
| McDermott International, Inc. (a)(b) | | | 481,100 | | | | 3,184,882 | | | | 1.39 | % |
| | | | | | | | 6,941,569 | | | | 3.03 | % |
| | | | | | | | | | | | | |
| Financials – 3.63% | | | | | | | | | | | | |
| Lincoln National Corp. | | | 54,500 | | | | 4,130,010 | | | | 1.80 | % |
| Unum Group | | | 80,300 | | | | 4,178,812 | | | | 1.83 | % |
| | | | | | | | 8,308,822 | | | | 3.63 | % |
| | | | | | | | | | | | | |
| Industrials – 32.33% | | | | | | | | | | | | |
| ACCO Brands Corp. (a) | | | 300,300 | | | | 3,918,915 | | | | 1.71 | % |
| Columbus McKinnon Corporation of New York | | | 143,900 | | | | 5,692,684 | | | | 2.49 | % |
| DXP Enterprises Inc. (a) | | | 102,600 | | | | 3,290,382 | | | | 1.44 | % |
| Meritor, Inc. (a) | | | 243,900 | | | | 6,343,839 | | | | 2.77 | % |
| Oshkosh Corp. | | | 56,700 | | | | 5,191,452 | | | | 2.27 | % |
| Patrick Industries, Inc. (a) | | | 46,800 | | | | 4,352,400 | | | | 1.90 | % |
| SkyWest, Inc. | | | 108,900 | | | | 5,129,190 | | | | 2.24 | % |
| SPX Corp. (a) | | | 154,900 | | | | 4,537,021 | | | | 1.98 | % |
| Sterling Construction Co., Inc. (a) | | | 429,300 | | | | 7,663,005 | | | | 3.35 | % |
| Titan International, Inc. | | | 291,200 | | | | 2,836,288 | | | | 1.24 | % |
| TriNet Group, Inc. (a) | | | 154,200 | | | | 5,353,824 | | | | 2.34 | % |
| Tutor Perini Corp. (a) | | | 128,700 | | | | 3,629,340 | | | | 1.59 | % |
| Univar, Inc. (a) | | | 130,900 | | | | 3,894,275 | | | | 1.70 | % |
| Veritiv Corp. (a) | | | 69,300 | | | | 2,227,995 | | | | 0.97 | % |
| Willdan Group, Inc. (a) | | | 143,400 | | | | 4,310,604 | | | | 1.88 | % |
| XPO Logistics, Inc. (a) | | | 81,000 | | | | 5,617,350 | | | | 2.46 | % |
| | | | | | | | 73,988,564 | | | | 32.33 | % |
The accompanying notes are an integral part of these financial statements.
| COMMON STOCKS | | Number | | | | | | % of | |
| | | of Shares | | | Value | | | Net Assets | |
| Information Technology – 18.52% | | | | | | | | | |
| Extreme Networks, Inc. (a) | | | 673,600 | | | $ | 8,083,200 | | | | 3.53 | % |
| Hewlett Packard Enterprise Co. | | | 160,600 | | | | 2,235,552 | | | | 0.98 | % |
| Insight Enterprises, Inc. (a) | | | 87,300 | | | | 3,932,865 | | | | 1.72 | % |
| KEMET Corp. (a) | | | 481,700 | | | | 12,374,873 | | | | 5.41 | % |
| Micro Focus International PLC – ADR (a)(b) | | | 22,054 | | | | 770,346 | | | | 0.34 | % |
| NCR Corp. (a) | | | 85,100 | | | | 2,730,859 | | | | 1.19 | % |
| PCM, Inc. (a) | | | 141,600 | | | | 1,989,480 | | | | 0.87 | % |
| Science Applications International Corp. | | | 45,700 | | | | 3,351,638 | | | | 1.46 | % |
| Sierra Wireless, Inc. (a)(b) | | | 154,300 | | | | 3,464,035 | | | | 1.51 | % |
| TTM Technologies , Inc. (a) | | | 219,500 | | | | 3,463,710 | | | | 1.51 | % |
| | | | | | | | 42,396,558 | | | | 18.52 | % |
| | | | | | | | | | | | | |
| Materials – 19.40% | | | | | | | | | | | | |
| AK Steel Holding Corp. (a) | | | 442,200 | | | | 2,029,698 | | | | 0.89 | % |
| Freeport-McMoRan, Inc. (a) | | | 242,700 | | | | 3,392,946 | | | | 1.48 | % |
| Greif, Inc., Class A | | | 66,100 | | | | 3,670,533 | | | | 1.61 | % |
| Kronos Worldwide, Inc. | | | 285,200 | | | | 7,503,612 | | | | 3.28 | % |
| Olympic Steel, Inc. | | | 154,400 | | | | 2,915,072 | | | | 1.27 | % |
| Platform Specialty Products Corp. (a) | | | 301,600 | | | | 3,227,120 | | | | 1.41 | % |
| Steel Dynamics, Inc. | | | 102,700 | | | | 3,821,467 | | | | 1.67 | % |
| The Chemours Co. | | | 120,500 | | | | 6,821,505 | | | | 2.98 | % |
| Trinseo S.A. (b) | | | 55,200 | | | | 3,919,200 | | | | 1.71 | % |
| Tronox Ltd., Class A (b) | | | 267,800 | | | | 7,088,666 | | | | 3.10 | % |
| | | | | | | | 44,389,819 | | | | 19.40 | % |
| | | | | | | | | | | | | |
| Telecommunication Services – 1.25% | | | | | | | | | | | | |
| Sprint Corp. (a) | | | 438,100 | | | | 2,865,174 | | | | 1.25 | % |
| | | | | | | | | | | | | |
| Total Common Stocks | | | | | | | | | | | | |
| (Cost $183,444,310) | | | | | | | 216,954,503 | | | | 94.80 | % |
| | | | | | | | | | | | | |
| PARTNERSHIPS – 1.62% | | | | | | | | | | | | |
| | | | | | | | | | | | | |
| Energy – 1.62% | | | | | | | | | | | | |
| Energy Transfer Equity, L.P. | | | 208,500 | | | | 3,700,875 | | | | 1.62 | % |
| | | | | | | | | | | | | |
| Total Partnerships | | | | | | | | | | | | |
| (Cost $3,841,612) | | | | | | | 3,700,875 | | | | 1.62 | % |
The accompanying notes are an integral part of these financial statements.
| HENNESSY FUNDS | 1-800-966-4354 | |
| RIGHTS – 0.00% | | Number | | | | | | % of | |
| | | of Shares | | | Value | | | Net Assets | |
| Health Care – 0.00% | | | | | | | | | |
| Forest Laboratories, Inc. (a)(c) | | | 5,500 | | | $ | 55 | | | | 0.00 | % |
| | | | | | | | | | | | | |
| Total Rights | | | | | | | | | | | | |
| (Cost $0) | | | | | | | 55 | | | | 0.00 | % |
| | | | | | | | | | | | | |
| SHORT-TERM INVESTMENTS – 3.48% | | | | | | | | | | | | |
| | | | | | | | | | | | | |
| Money Market Funds – 3.48% | | | | | | | | | | | | |
| Fidelity Government Portfolio, Institutional Class, 0.92% (d) | | | 7,973,712 | | | | 7,973,712 | | | | 3.48 | % |
| | | | | | | | | | | | | |
| Total Short-Term Investments | | | | | | | | | | | | |
| (Cost $7,973,712) | | | | | | | 7,973,712 | | | | 3.48 | % |
| | | | | | | | | | | | | |
| Total Investments | | | | | | | | | | | | |
| (Cost $195,259,634) – 99.90% | | | | | | | 228,629,145 | | | | 99.90 | % |
| Other Assets in Excess of Liabilities – 0.10% | | | | | | | 232,043 | | | | 0.10 | % |
TOTAL NET ASSETS – 100.00% | | | | | | $ | 228,861,188 | | | | 100.00 | % |
Percentages are stated as a percent of net assets.
ADR – American Depositary Receipt
| (a) | Non-income producing security. |
| (b) | U.S. traded security of a foreign corporation. |
| (c) | Security is fair valued in good faith. |
| (d) | The rate listed is the fund’s 7-day yield as of October 31, 2017. |
The accompanying notes are an integral part of these financial statements.
Summary of Fair Value Exposure at October 31, 2017
The following is a summary of the inputs used to value the Fund’s net assets as of October 31, 2017 (See Note 3 in the accompanying notes to the financial statements):
| Common Stocks | | Level 1 | | | Level 2 | | | Level 3 | | | Total | |
| Consumer Discretionary | | $ | 33,658,025 | | | $ | — | | | $ | — | | | $ | 33,658,025 | |
| Consumer Staples | | | 4,405,972 | | | | — | | | | — | | | | 4,405,972 | |
| Energy | | | 6,941,569 | | | | — | | | | — | | | | 6,941,569 | |
| Financials | | | 8,308,822 | | | | — | | | | — | | | | 8,308,822 | |
| Industrials | | | 73,988,564 | | | | — | | | | — | | | | 73,988,564 | |
| Information Technology | | | 42,396,558 | | | | — | | | | — | | | | 42,396,558 | |
| Materials | | | 44,389,819 | | | | — | | | | — | | | | 44,389,819 | |
| Telecommunication Services | | | 2,865,174 | | | | — | | | | — | | | | 2,865,174 | |
| Total Common Stocks | | $ | 216,954,503 | | | $ | — | | | $ | — | | | $ | 216,954,503 | |
| Partnerships | | | | | | | | | | | | | | | | |
| Energy | | $ | 3,700,875 | | | $ | — | | | $ | — | | | $ | 3,700,875 | |
| Total Partnerships | | $ | 3,700,875 | | | $ | — | | | $ | — | | | $ | 3,700,875 | |
| Rights | | | | | | | | | | | | | | | | |
| Health Care | | $ | — | | | $ | — | | | $ | 55 | * | | $ | 55 | |
| Total Rights | | $ | — | | | $ | — | | | $ | 55 | | | $ | 55 | |
| Short-Term Investments | | | | | | | | | | | | | | | | |
| Money Market Funds | | $ | 7,973,712 | | | $ | — | | | $ | — | | | $ | 7,973,712 | |
| Total Short-Term Investments | | $ | 7,973,712 | | | $ | — | | | $ | — | | | $ | 7,973,712 | |
| Total Investments | | $ | 228,629,090 | | | $ | — | | | $ | 55 | | | $ | 228,629,145 | |
* Acquired in merger.
Transfers between levels are recognized at the end of the reporting period. During the year ended October 31, 2017, the Fund recognized no transfers between levels.
Level 3 Reconciliation Disclosure
Following is a reconciliation of Level 3 assets for which significant unobservable inputs were used to determine fair value.
| | | Rights | |
| Balance as of October 31, 2016 | | $ | 275 | |
| Accrued discounts/premiums | | | — | |
| Realized gain (loss) | | | — | |
| Change in unrealized depreciation | | | (220 | ) |
| Purchases | | | — | |
| (Sales) | | | — | |
| Transfer in and/or out of Level 3 | | | — | |
| Balance as of October 31, 2017 | | $ | 55 | |
| Change in unrealized depreciation during the period for | | | | |
| Level 3 investments held at October 31, 2017 | | $ | (220 | ) |
The Level 3 investments as of October 31, 2017, represented 0.00% of net assets and did not warrant a disclosure of significant unobservable valuation inputs.
The accompanying notes are an integral part of these financial statements.
| HENNESSY FUNDS | 1-800-966-4354 | |
Financial Statements
Statement of Assets and Liabilities as of October 31, 2017 |
| ASSETS: | | | |
| Investments in securities, at value (cost $195,259,634) | | $ | 228,629,145 | |
| Cash | | | 51,812 | |
| Dividends and interest receivable | | | 53,370 | |
| Receivable for fund shares sold | | | 606,615 | |
| Prepaid expenses and other assets | | | 28,021 | |
| Total Assets | | | 229,368,963 | |
| | | | | |
| LIABILITIES: | | | | |
| Payable for fund shares redeemed | | | 122,545 | |
| Payable to advisor | | | 141,715 | |
| Payable to administrator | | | 35,703 | |
| Payable to auditor | | | 21,303 | |
| Accrued distribution fees | | | 115,091 | |
| Accrued service fees | | | 16,530 | |
| Accrued trustees fees | | | 5,770 | |
| Accrued expenses and other payables | | | 49,118 | |
| Total Liabilities | | | 507,775 | |
| NET ASSETS | | $ | 228,861,188 | |
| | | | | |
| NET ASSETS CONSIST OF: | | | | |
| Capital stock | | $ | 196,290,622 | |
| Accumulated net investment loss | | | (796,849 | ) |
| Accumulated net realized loss on investments | | | (2,096 | ) |
| Unrealized net appreciation on investments | | | 33,369,511 | |
| Total Net Assets | | $ | 228,861,188 | |
| | | | | |
| NET ASSETS | | | | |
| Investor Class: | | | | |
| Shares authorized (no par value) | | Unlimited | |
| Net assets applicable to outstanding Investor Class shares | | $ | 197,216,116 | |
| Shares issued and outstanding | | | 8,163,724 | |
| Net asset value, offering price and redemption price per share | | $ | 24.16 | |
| | | | | |
| Institutional Class: | | | | |
| Shares authorized (no par value) | | Unlimited | |
| Net assets applicable to outstanding Institutional Class shares | | $ | 31,645,072 | |
| Shares issued and outstanding | | | 1,273,574 | |
| Net asset value, offering price and redemption price per share | | $ | 24.85 | |
The accompanying notes are an integral part of these financial statements.
| STATEMENT OF ASSETS AND LIABILITIES/STATEMENT OF OPERATIONS |
Financial Statements
Statement of Operations for the year ended October 31, 2017 |
| INVESTMENT INCOME: | | | |
| Dividend income | | $ | 2,005,944 | |
| Interest income | | | 35,554 | |
| Total investment income | | | 2,041,498 | |
| | | | | |
| EXPENSES: | | | | |
| Investment advisory fees (See Note 5) | | | 1,560,063 | |
| Sub-transfer agent expenses – Investor Class (See Note 5) | | | 273,359 | |
| Sub-transfer agent expenses – Institutional Class (See Note 5) | | | 16,912 | |
| Distribution fees – Investor Class (See Note 5) | | | 277,267 | |
| Administration, fund accounting, custody and transfer agent fees (See Note 5) | | | 201,397 | |
| Service fees – Investor Class (See Note 5) | | | 184,845 | |
| Federal and state registration fees | | | 35,699 | |
| Compliance expense (See Note 5) | | | 28,705 | |
| Audit fees | | | 21,676 | |
| Reports to shareholders | | | 21,550 | |
| Trustees’ fees and expenses | | | 16,980 | |
| Legal fees | | | 1,978 | |
| Other expenses | | | 16,958 | |
| Total expenses | | | 2,657,389 | |
| NET INVESTMENT LOSS | | $ | (615,891 | ) |
| | | | | |
| REALIZED AND UNREALIZED GAINS: | | | | |
| Net realized gain on investments | | $ | 25,408,962 | |
| Net change in unrealized appreciation on investments | | | 26,412,588 | |
| Net gain on investments | | | 51,821,550 | |
| NET INCREASE IN NET ASSETS RESULTING FROM OPERATIONS | | $ | 51,205,659 | |
The accompanying notes are an integral part of these financial statements.
| HENNESSY FUNDS | 1-800-966-4354 | |
(This Page Intentionally Left Blank.)
| STATEMENTS OF CHANGES IN NET ASSETS |
Financial Statements
| Statements of Changes in Net Assets |
| | | Year Ended | | | Year Ended | |
| | | October 31, 2017 | | | October 31, 2016 | |
| OPERATIONS: | | | | | | |
| Net investment loss | | $ | (615,891 | ) | | $ | (346,107 | ) |
| Net realized gain (loss) on investments | | | 25,408,962 | | | | (8,409,990 | ) |
| Net change in unrealized | | | | | | | | |
| appreciation (depreciation) on investments | | | 26,412,588 | | | | (5,945,754 | ) |
| Net increase (decrease) in net assets | | | | | | | | |
| resulting from operations | | | 51,205,659 | | | | (14,701,851 | ) |
| | | | | | | | | |
| DISTRIBUTIONS TO SHAREHOLDERS FROM: | | | | | | | | |
| Net investment income – Investor Class | | | — | | | | (255,352 | ) |
| Net investment income – Institutional Class | | | — | | | | (98,941 | ) |
| Total distributions | | | — | | | | (354,293 | ) |
| | | | | | | | | |
| CAPITAL SHARE TRANSACTIONS: | | | | | | | | |
| Proceeds from shares subscribed – Investor Class | | | 5,154,765 | | | | 23,250,634 | |
| Proceeds from shares subscribed – Institutional Class | | | 6,572,602 | | | | 4,485,262 | |
| Dividends reinvested – Investor Class | | | — | | | | 249,654 | |
| Dividends reinvested – Institutional Class | | | — | | | | 93,766 | |
| Cost of shares redeemed – Investor Class | | | (37,414,723 | ) | | | (74,707,125 | ) |
| Cost of shares redeemed – Institutional Class | | | (7,012,794 | ) | | | (15,664,076 | ) |
| Net decrease in net assets derived | | | | | | | | |
| from capital share transactions | | | (32,700,150 | ) | | | (62,291,885 | ) |
| TOTAL INCREASE (DECREASE) IN NET ASSETS | | | 18,505,509 | | | | (77,348,029 | ) |
| | | | | | | | | |
| NET ASSETS: | | | | | | | | |
| Beginning of year | | | 210,355,679 | | | | 287,703,708 | |
| End of year | | $ | 228,861,188 | | | $ | 210,355,679 | |
| Undistributed net investment loss, end of year | | $ | (796,849 | ) | | $ | (180,958 | ) |
| | | | | | | | | |
| CHANGES IN SHARES OUTSTANDING: | | | | | | | | |
| Shares sold – Investor Class | | | 233,860 | | | | 1,215,295 | |
| Shares sold – Institutional Class | | | 279,691 | | | | 231,105 | |
| Shares issued to holders as reinvestment | | | | | | | | |
| of dividends – Investor Class | | | — | | | | 12,816 | |
| Shares issued to holders as reinvestment | | | | | | | | |
| of dividends – Institutional Class | | | — | | | | 4,710 | |
| Shares redeemed – Investor Class | | | (1,795,884 | ) | | | (3,937,410 | ) |
| Shares redeemed – Institutional Class | | | (328,917 | ) | | | (816,510 | ) |
| Net decrease in shares outstanding | | | (1,611,250 | ) | | | (3,289,994 | ) |
The accompanying notes are an integral part of these financial statements.
| HENNESSY FUNDS | 1-800-966-4354 | |
Financial Statements
For an Investor Class share outstanding throughout each year
PER SHARE DATA:
Net asset value, beginning of year
Income from investment operations:
Net investment income (loss)
Net realized and unrealized gains (losses) on investments
Total from investment operations
Less distributions:
Dividends from net investment income
Total distributions
Net asset value, end of year
TOTAL RETURN
SUPPLEMENTAL DATA AND RATIOS:
Net assets, end of year (millions)
Ratio of expenses to average net assets
Ratio of net investment income (loss) to average net assets
Portfolio turnover rate(1)
(1) | Portfolio turnover is calculated on the basis of the Fund as a whole. |
The accompanying notes are an integral part of these financial statements.
| FINANCIAL HIGHLIGHTS — INVESTOR CLASS |
| Year Ended October 31, | |
| 2017 | | | 2016 | | | 2015 | | | 2014 | | | 2013 | |
| | | | | | | | | | | | | | |
| $ | 18.98 | | | $ | 20.00 | | | $ | 18.68 | | | $ | 15.65 | | | $ | 12.38 | |
| | | | | | | | | | | | | | | | | | | |
| | | | | | | | | | | | | | | | | | | |
| | (0.09 | ) | | | (0.02 | ) | | | 0.06 | | | | (0.04 | ) | | | (0.11 | ) |
| | 5.27 | | | | (0.98 | ) | | | 1.26 | | | | 3.07 | | | | 3.38 | |
| | 5.18 | | | | (1.00 | ) | | | 1.32 | | | | 3.03 | | | | 3.27 | |
| | | | | | | | | | | | | | | | | | | |
| | | | | | | | | | | | | | | | | | | |
| | — | | | | (0.02 | ) | | | — | | | | — | | | | — | |
| | — | | | | (0.02 | ) | | | — | | | | — | | | | — | |
| $ | 24.16 | | | $ | 18.98 | | | $ | 20.00 | | | $ | 18.68 | | | $ | 15.65 | |
| | | | | | | | | | | | | | | | | | | |
| | 27.29 | % | | | (5.00 | )% | | | 7.07 | % | | | 19.36 | % | | | 26.41 | % |
| | | | | | | | | | | | | | | | | | | |
| | | | | | | | | | | | | | | | | | | |
| $ | 197.22 | | | $ | 184.61 | | | $ | 248.74 | | | $ | 227.68 | | | $ | 220.83 | |
| | 1.30 | % | | | 1.32 | % | | | 1.15 | % | | | 1.23 | % | | | 1.29 | % |
| | (0.33 | )% | | | (0.18 | )% | | | 0.30 | % | | | (0.17 | )% | | | (0.26 | )% |
| | 98 | % | | | 97 | % | | | 102 | % | | | 84 | % | | | 105 | % |
The accompanying notes are an integral part of these financial statements.
| HENNESSY FUNDS | 1-800-966-4354 | |
Financial Statements
For an Institutional Class share outstanding throughout each year
PER SHARE DATA:
Net asset value, beginning of year
Income from investment operations:
Net investment income
Net realized and unrealized gains (losses) on investments
Total from investment operations
Less distributions:
Dividends from net investment income
Total distributions
Net asset value, end of year
TOTAL RETURN
SUPPLEMENTAL DATA AND RATIOS:
Net assets, end of year (millions)
Ratio of expenses to average net assets:
Before expense reimbursement
After expense reimbursement
Ratio of net investment income (loss) to average net assets:
Before expense reimbursement
After expense reimbursement
Portfolio turnover rate(1)
(1) | Portfolio turnover is calculated on the basis of the Fund as a whole. |
The accompanying notes are an integral part of these financial statements.
| FINANCIAL HIGHLIGHTS — INSTITUTIONAL CLASS |
| Year Ended October 31, | |
| 2017 | | | 2016 | | | 2015 | | | 2014 | | | 2013 | |
| | | | | | | | | | | | | | |
| $ | 19.46 | | | $ | 20.47 | | | $ | 19.08 | | | $ | 15.94 | | | $ | 12.57 | |
| | | | | | | | | | | | | | | | | | | |
| | | | | | | | | | | | | | | | | | | |
| | 0.01 | | | | 0.17 | | | | 0.03 | | | | 0.06 | | | | 0.01 | |
| | 5.38 | | | | (1.13 | ) | | | 1.36 | | | | 3.08 | | | | 3.36 | |
| | 5.39 | | | | (0.96 | ) | | | 1.39 | | | | 3.14 | | | | 3.37 | |
| | | | | | | | | | | | | | | | | | | |
| | | | | | | | | | | | | | | | | | | |
| | — | | | | (0.05 | ) | | | — | | | | — | | | | — | |
| | — | | | | (0.05 | ) | | | — | | | | — | | | | — | |
| $ | 24.85 | | | $ | 19.46 | | | $ | 20.47 | | | $ | 19.08 | | | $ | 15.94 | |
| | | | | | | | | | | | | | | | | | | |
| | 27.70 | % | | | (4.69 | )% | | | 7.29 | % | | | 19.70 | % | | | 26.81 | % |
| | | | | | | | | | | | | | | | | | | |
| | | | | | | | | | | | | | | | | | | |
| $ | 31.65 | | | $ | 25.74 | | | $ | 38.96 | | | $ | 25.54 | | | $ | 26.23 | |
| | | | | | | | | | | | | | | | | | | |
| | 0.97 | % | | | 0.98 | % | | | 0.99 | % | | | 1.03 | % | | | 1.11 | % |
| | 0.97 | % | | | 0.98 | % | | | 0.99 | % | | | 0.98 | % | | | 0.98 | % |
| | | | | | | | | | | | | | | | | | | |
| | (0.00 | )% | | | 0.14 | % | | | 0.51 | % | | | 0.03 | % | | | (0.01 | %) |
| | (0.00 | )% | | | 0.14 | % | | | 0.51 | % | | | 0.08 | % | | | 0.12 | % |
| | 98 | % | | | 97 | % | | | 102 | % | | | 84 | % | | | 105 | % |
The accompanying notes are an integral part of these financial statements.
| HENNESSY FUNDS | 1-800-966-4354 | |
Financial Statements
Notes to the Financial Statements October 31, 2017 |
1). ORGANIZATION
The Hennessy Cornerstone Growth Fund (the “Fund”) is a series of Hennessy Funds Trust (the “Trust”), which was organized as a Delaware statutory trust on September 17, 1992. The Fund is an open-end management investment company registered under the Investment Company Act of 1940, as amended. The investment objective of the Fund is long-term growth of capital. The Fund is a diversified fund.
The Fund offers Investor Class and Institutional Class shares. Each class of shares differs principally in its respective 12b-1 distribution and service, shareholder servicing, and sub-transfer agent expenses. There are no sales charges. Each class has identical rights to earnings, assets, and voting privileges, except for class-specific expenses and exclusive rights to vote on matters affecting only an individual class.
As an investment company, the Fund follows the investment company accounting and reporting guidance of the Financial Accounting Standards Board (“FASB”) Accounting Standard Codification Topic 946 “Financial Services—Investment Companies.”
2). SIGNIFICANT ACCOUNTING POLICIES
The following is a summary of significant accounting policies consistently followed by the Fund in the preparation of the financial statements. These policies conform to U.S. generally accepted accounting principles (“GAAP”).
| a). | Investment Valuation – All investments in securities are recorded at their estimated fair value, as described in Note 3. |
| | |
| b). | Federal Income Taxes – No provision for federal income taxes or excise taxes has been made because the Fund has elected to be taxed as a “regulated investment company” and intends to distribute substantially all of its taxable income to its shareholders and otherwise comply with the provisions of the Internal Revenue Code of 1986, as amended, applicable to regulated investment companies. Net investment income/loss and realized gains/losses for federal income tax purposes may differ from those reported in the financial statements because of temporary book and tax basis differences. Temporary differences are primarily the result of the treatment of wash sales for tax reporting purposes. The Fund recognizes interest and penalties related to income tax benefits, if any, in the Statement of Operations as an income tax expense. Distributions from net realized gains for book purposes may include short-term capital gains, which are included as ordinary income to shareholders for tax purposes. The Fund may utilize equalization accounting for tax purposes and designate earnings and profits, including net realized gains distributed to shareholders on redemption of shares, as part of the dividends paid deduction for income tax purposes. |
| | Due to inherent differences in the recognition of income, expenses, and realized gains/losses under GAAP and federal income tax regulations, permanent differences between book and tax basis for reporting for fiscal year 2017 have been identified and appropriately reclassified in the Statement of Assets and Liabilities. The adjustments are as follows: |
| | Accumulated | Accumulated | | |
| | Net Investment | Net Realized | | |
| | Loss | Loss on Investments | Capital Stock | |
| | $— | $81,285,880 | $(81,285,880) | |
| NOTES TO THE FINANCIAL STATEMENTS |
| c). | Accounting for Uncertainty in Income Taxes – The Fund has accounting policies regarding recognition and measurement of tax positions taken or expected to be taken on a tax return. The tax returns of the Fund for the prior three fiscal years are open for examination. The Fund has reviewed all open tax years in major jurisdictions and concluded that there is no impact on the Fund’s net assets and no tax liability resulting from unrecognized tax benefits relating to uncertain income tax positions taken or expected to be taken on a tax return. The Fund’s major tax jurisdictions are U.S. federal and Delaware. |
| | |
| d). | Income and Expenses – Dividend income is recognized on the ex-dividend date or as soon as information is available to the Fund. Interest income, which includes the amortization of premium and accretion of discount, is recognized on an accrual basis. The Fund is charged for those expenses that are directly attributable to the portfolio, such as advisory, administration, and certain shareholder service fees. Income, expenses (other than expenses attributable to a specific class), and realized and unrealized gains/losses on investments are allocated to each class of shares based on such class’s net assets. |
| | |
| e). | Distributions to Shareholders – Dividends from net investment income for the Fund, if any, are declared and paid annually, usually in December. Distributions of net realized capital gains, if any, are declared and paid annually, usually in December. |
| | |
| f). | Security Transactions – Investment and shareholder transactions are recorded on the trade date. The Fund determines the realized gain/loss from an investment transaction by comparing the original cost of the security lot sold with the net sale proceeds. Discounts and premiums on securities purchased are accreted/amortized over the life of the respective security. |
| | |
| g). | Use of Estimates – The preparation of financial statements in conformity with GAAP requires management to make estimates and assumptions that affect the reported amounts of assets and liabilities and disclosure of contingent assets and liabilities at the date of the financial statements and the reported change in net assets during the reporting period. Actual results could differ from those estimates. |
| | |
| h). | Share Valuation – The net asset value (“NAV”) per share of the Fund is calculated by dividing (i) the sum of the value of the securities held by the Fund, plus cash or other assets, minus all liabilities (including estimated accrued expenses) by (ii) the total number of shares outstanding for the Fund, rounded to the nearest cent. The Fund’s shares will not be priced on days the New York Stock Exchange is closed for trading. The offering and redemption price per share for the Fund is equal to the Fund’s NAV per share. |
3). SECURITIES VALUATION
The Fund follows authoritative fair valuation accounting standards that establish an authoritative definition of fair value and set out a hierarchy for measuring fair value. These standards require additional disclosures about the various inputs and valuation techniques used to develop the measurements of fair value and a discussion of changes in valuation techniques and related inputs during the period. These inputs are summarized in the three broad levels listed below:
| | Level 1 – | Unadjusted, quoted prices in active markets for identical instruments that the Fund has the ability to access at the date of measurement. |
| | | |
| | Level 2 – | Other significant observable inputs (including, but not limited to, quoted prices in active markets for similar instruments, quoted prices in markets that are not active for identical or similar instruments, and model-derived |
| HENNESSY FUNDS | 1-800-966-4354 | |
| | | valuations in which all significant inputs and significant value drivers are observable in active markets, such as interest rates, prepayment speeds, credit risk curves, default rates, and similar data). |
| | | |
| | Level 3 – | Significant unobservable inputs (including the Fund’s own assumptions about what market participants would use to price the asset or liability based on the best available information) when observable inputs are unavailable. |
Following is a description of the valuation techniques applied to the Fund’s major categories of assets and liabilities measured at fair value on a recurring basis.
| | Equity Securities – Equity securities, including common stocks, preferred stocks, foreign-issued common stocks, exchange-traded funds, closed-end mutual funds, partnerships, rights, and real estate investment trusts, that are traded on a securities exchange for which a last-quoted sales price is readily available will generally be valued at the last sales price as reported by the primary exchange on which the securities are listed. Securities listed on The NASDAQ Stock Market (“NASDAQ”) will generally be valued at the NASDAQ Official Closing Price, which may differ from the last sales price reported. Securities traded on a securities exchange for which a last-quoted sales price is not readily available will generally be valued at the mean between the bid and ask prices. To the extent these securities are actively traded and valuation adjustments are not applied, they are classified in Level 1 of the fair value hierarchy. Securities traded on foreign exchanges generally are not valued at the same time the Fund calculates its NAV because most foreign markets close well before such time. The earlier close of most foreign markets gives rise to the possibility that significant events, including broad market moves, may have occurred in the interim. In certain circumstances, it may be determined that a security needs to be fair valued because it appears that the value of the security might have been materially affected by events occurring after the close of the market in which the security is principally traded, but before the time the Fund calculates its NAV, such as by a development that affects an entire market or region (e.g., weather-related events) or a potentially global development (e.g., a terrorist attack that may be expected to have an effect on investor expectations worldwide). |
| | |
| | Registered Investment Companies – Investments in registered investment companies (e.g., mutual funds) are generally priced at the ending NAV provided by the applicable registered investment company’s service agent and will be classified in Level 1 of the fair value hierarchy. |
| | |
| | Debt Securities – Debt securities, including corporate bonds, asset-backed securities, mortgage-backed securities, municipal bonds, U.S. Treasuries, and U.S. government agency issues, are generally valued at market on the basis of valuations furnished by an independent pricing service that utilizes both dealer-supplied valuations and formula-based techniques. The pricing service may consider recently executed transactions in securities of the issuer or comparable issuers, market price quotations (where observable), bond spreads, and fundamental data relating to the issuer. In addition, the model may incorporate observable market data, such as reported sales of similar securities, broker quotes, yields, bids, offers, and reference data. Certain securities are valued primarily using dealer quotations. These securities are generally classified in Level 2 of the fair value hierarchy. |
| | |
| | Short-Term Securities – Short-term equity investments, including money market funds, are valued in the manner specified above. Short-term debt investments with an original term to maturity of 60 days or less are valued at amortized cost, which approximates fair market value. If the original term to maturity of a short-term debt |
| NOTES TO THE FINANCIAL STATEMENTS |
| | investment exceeded 60 days, then the values as of the 61st day prior to maturity are amortized. Amortized cost is not used if its use would be inappropriate due to credit or other impairments of the issuer, in which case the security’s fair value would be determined, as described below. Short-term securities are generally classified in Level 1 or Level 2 of the fair market hierarchy depending on the inputs used and market activity levels for specific securities. |
The Board of Trustees of the Fund (the “Board”) has adopted fair value pricing procedures that are followed when a price for a security is not readily available or if a significant event has occurred that indicates the closing price of a security no longer represents the true value of that security. Fair value pricing determinations are made in good faith in accordance with these procedures. There are numerous criteria that will be given consideration in determining a fair value of a security, such as the trading volume of a security and markets, the values of other similar securities, and news events with direct bearing on a security or markets. Fair value pricing results in an estimated price for a security that reflects the amount the Fund might reasonably expect to receive in a current sale. Depending on the relative significance of the valuation inputs, these securities may be classified in either Level 2 or Level 3 of the fair value hierarchy.
The fair valuation of foreign securities may be determined with the assistance of a pricing service using correlations between the movement of prices of such securities and indices of domestic securities and other appropriate indicators, such as closing market prices of relevant American Depositary Receipts or futures contracts. The effect of using fair value pricing is that the Fund’s NAV will reflect the affected portfolio securities’ values as determined by the Board or its designee instead of being determined by the market. Using a fair value pricing methodology to price a foreign security may result in a value that is different from the foreign security’s most recent closing price and from the prices used by other investment companies to calculate their NAVs and are generally classified in Level 2 of the fair valuation hierarchy. Because the Fund may invest in foreign securities, the value of the Fund’s portfolio securities may change on days when you will not be able to purchase or redeem your shares.
The Board has delegated day-to-day valuation matters to a Valuation Committee comprised of one or more representatives from Hennessy Advisors, Inc., the Fund’s investment advisor (the “Advisor”). The function of the Valuation Committee is to value securities where current and reliable market quotations are not readily available. All actions taken by the Valuation Committee are reviewed by the Board.
The Fund has performed an analysis of all existing investments to determine the significance and character of all inputs to their fair value determination. Various inputs are used to determine the value of the Fund’s investments. The inputs or methodology used for valuing securities are not necessarily an indication of the risk associated with investing in those securities. Details related to the fair valuation hierarchy of the Fund’s securities as of October 31, 2017, are included in the Schedule of Investments.
4). INVESTMENT TRANSACTIONS
Purchases and sales of investment securities (excluding government and short-term investments) for the Fund during fiscal year 2017 were $202,634,944 and $239,312,566, respectively.
There were no purchases or sales/maturities of long-term U.S. government securities for the Fund during fiscal year 2017.
The Fund is permitted to purchase or sell securities from or to another fund in the Hennessy Funds family of funds (the “Hennessy Funds”) under specified conditions outlined in procedures adopted by the Board. The procedures have been designed to
| HENNESSY FUNDS | 1-800-966-4354 | |
ensure that any purchase or sale of securities by the Fund from or to another Hennessy Fund complies with Rule 17a-7 of the Investment Company Act of 1940, as amended. For fiscal year 2017, the Fund did not engage in purchases or sales of securities pursuant to Rule 17a-7 of the Investment Company Act of 1940, as amended.
5). INVESTMENT MANAGEMENT FEE AND OTHER TRANSACTIONS WITH AFFILIATES
The Advisor provides the Fund with investment management services under an Investment Advisory Agreement. The Advisor provides all investment advice, office space, and facilities, as well as most of the personnel needed by the Fund. As compensation for its services, the Advisor is entitled to a monthly fee from the Fund. The fee is based upon the average daily net assets of the Fund at an annual rate of 0.74%. The net investment advisory fees expensed by the Fund during fiscal year 2017 are included in the Statement of Operations.
In the past, the Advisor had contractually agreed to waive its fees and absorb expenses to the extent that the total annual operating expenses exceeded 0.98% of the Fund’s net assets for Institutional Class shares of the Fund (excluding all federal, state and local taxes, interest, brokerage commissions, acquired fund fees and expenses and other costs incurred in connection with the purchase and sale of securities and extraordinary items). The expense limitation agreement was terminated by the Board as of February 28, 2015.
For a period of three years after the year in which the Advisor waived or reimbursed expenses, the Advisor may seek reimbursement from the Fund to the extent that total annual fund operating expenses are less than the expense limitation that was in effect at the time the Advisor waived or reimbursed expenses. As of October 31, 2017, cumulative expenses subject to potential recovery under the aforementioned conditions were $1,023 for Institutional Class shares, which will expire on October 31, 2018.
The Board has approved a Shareholder Servicing Agreement for Investor Class shares of the Fund, which was instituted to compensate the Advisor for the non-investment management services it provides to the Fund. The Shareholder Servicing Agreement provides for a monthly fee paid to the Advisor at an annual rate of 0.10% of the average daily net assets of the Fund attributable to Investor Class shares. The shareholder service fees expensed by the Fund during fiscal year 2017 are included in the Statement of Operations.
The Fund has adopted a plan pursuant to Rule 12b-1 under the Investment Company Act of 1940, as amended, that authorizes payments in connection with the distribution of the Fund’s shares at an annual rate of up to 0.25% of the Fund’s average daily net assets attributable to Investor Class shares. Even though the authorized rate is up to 0.25%, the Fund is currently only using up to 0.15% of its average daily net assets attributable to Investor Class shares for such purpose. Amounts paid under the plan may be spent on any activities or expenses primarily intended to result in the sale of shares, including, but not limited to, advertising, shareholder account servicing, the printing and mailing of prospectuses to other than current shareholders, the printing and mailing of sales literature, and compensation for sales and marketing activities or to financial institutions and others, such as dealers and distributors. The distribution fees expensed by the Fund during fiscal year 2017 are included in the Statement of Operations.
The Fund has entered into agreements with various brokers, dealers, and financial intermediaries in connection with the sale of shares of the Fund. The agreements provide for periodic payments by the Fund to the brokers, dealers, and financial intermediaries for providing certain shareholder maintenance services (sub-transfer agent expenses). These shareholder services include the pre-processing and quality control of new accounts, shareholder correspondence, answering customer inquiries regarding account status, and
| NOTES TO THE FINANCIAL STATEMENTS |
facilitating shareholder telephone transactions. The sub-transfer agent fees expensed by the Fund during fiscal year 2017 are included in the Statement of Operations.
U.S. Bancorp Fund Services, LLC (“USBFS”) provides the Fund with administrative, fund accounting, and transfer agent services and necessary office equipment. As administrator, USBFS is responsible for activities such as (i) preparing various federal and state regulatory filings, reports, and returns for the Fund, (ii) preparing reports and materials to be supplied to the Board, (iii) monitoring the activities of the Fund’s custodian, transfer agent, and accountants, and (iv) coordinating the preparation and payment of the Fund’s expenses and reviewing the Fund’s expense accruals. U.S. Bank, N.A., an affiliate of USBFS, serves as the Fund’s custodian. The servicing agreements between the Trust, USBFS, and U.S. Bank N.A. contain a fee schedule that is inclusive of administrative, fund accounting, custody, and transfer agent fees. The administrative, fund accounting, custody, and transfer agent fees expensed by the Fund during fiscal year 2017 are included in the Statement of Operations.
Quasar Distributors, LLC acts as the Fund’s principal underwriter in a continuous public offering of the Fund’s shares. Quasar Distributors, LLC is an affiliate of USBFS and U.S. Bank, N.A.
The officers of the Fund are affiliated with the Advisor. Such officers, with the exception of the Chief Compliance Officer and the Senior Compliance Officer, receive no compensation from the Fund for serving in their respective roles. The Fund, along with the other Hennessy Funds, makes reimbursement payments, on an equal basis, to the Advisor for a portion of the salary and benefits associated with the office of the Chief Compliance Officer and for all of the salary and benefits associated with the office of the Senior Compliance Officer. The compliance fees expensed by the Fund during fiscal year 2017 are included in the Statement of Operations.
6). GUARANTEES AND INDEMNIFICATIONS
Under the Hennessy Funds’ organizational documents, their officers and trustees are indemnified by the Hennessy Funds against certain liabilities arising out of the performance of their duties to the Hennessy Funds. Additionally, in the normal course of business, the Hennessy Funds enter into contracts with service providers that contain general indemnification clauses. The Fund’s maximum exposure under these arrangements is unknown as this would involve future claims that may be made against the Fund that have not yet occurred. Currently, the Fund expects the risk of loss to be remote.
7). LINE OF CREDIT
The Fund has an uncommitted line of credit with the other Hennessy Funds in the amount of the lesser of (i) $100,000,000 or (ii) 33.33% of each Hennessy Fund’s net assets, or 30% for the Hennessy Gas Utility Fund and 10% for the Hennessy Balanced Fund, intended to provide short-term financing, if necessary, subject to certain restrictions, in connection with shareholder redemptions. The credit facility is with the Hennessy Funds’ custodian bank, U.S. Bank, N.A. Borrowings under this arrangement bear interest at the bank’s prime rate and are secured by all of the Fund’s assets (as to its own borrowings only). During fiscal year 2017, the Fund did not have any borrowings outstanding under the line of credit.
| HENNESSY FUNDS | 1-800-966-4354 | |
8). FEDERAL TAX INFORMATION
As of October 31, 2017, the components of accumulated earnings (losses) for income tax purposes were as follows:
| | | Investments | |
| Cost of investments for tax purposes | | $ | 195,261,730 | |
| Gross tax unrealized appreciation | | $ | 47,139,153 | |
| Gross tax unrealized depreciation | | | (13,771,738 | ) |
| Net tax unrealized appreciation | | $ | 33,367,415 | |
| Undistributed ordinary income | | $ | — | |
| Undistributed long-term capital gains | | | — | |
| Total distributable earnings | | $ | — | |
| Other accumulated loss | | $ | (796,849 | ) |
| Total accumulated gain | | $ | 32,570,566 | |
The difference between book-basis unrealized appreciation/depreciation (as shown in the Statement of Assets and Liabilities) and tax-basis unrealized appreciation/depreciation (as shown above) is attributable primarily to partnership adjustments.
At October 31, 2017, the Fund had no tax basis capital losses to offset future capital gains.
During fiscal year 2017, the capital losses utilized for the Fund were $25,411,058 and capital losses expired were $81,285,880.
Capital losses sustained in fiscal year 2012 and in future taxable years will not expire and may be carried over by the Fund without limitation; however, they will retain the character of the original loss. Furthermore, any loss incurred during those taxable years will be required to be utilized prior to the losses incurred in taxable years prior to 2012. As a result of this ordering rule, pre-enactment capital loss carryforwards may be more likely to expire unused. Under pre-enactment law, capital losses could be carried forward for eight years, and carried forward as short-term capital losses, irrespective of the character of the original loss.
At October 31, 2017, the Fund deferred, on a tax basis, a late-year ordinary loss of $796,849. Late-year ordinary losses are net ordinary losses incurred after December 31, 2016, but within the taxable year, that are deemed to arise on the first day of the Fund’s next taxable year.
During fiscal years 2017 and 2016, the tax character of distributions paid by the Fund was as follows:
| | | Year Ended | | | Year Ended | |
| | | October 31, 2017 | | | October 31, 2016 | |
Ordinary income(1) | | $ | — | | | $ | 354,293 | |
| Long-term capital gain | | | — | | | | — | |
| | | $ | — | | | $ | 354,293 | |
(1) Ordinary income includes short-term gain/loss.
9). CHANGE IN AUDITOR DISCLOSURE
On September 11, 2017, the Trust, by action of the Audit Committee of the Board and on behalf of the Fund, the Hennessy Cornerstone Mid Cap 30 Fund, the Hennessy Cornerstone Large Growth Fund, the Hennessy Cornerstone Value Fund, the Hennessy Total Return Fund, the Hennessy Balanced Fund, the Hennessy Japan Fund, and the Hennessy Japan Small Cap Fund (collectively, the “Applicable Funds”), dismissed KPMG LLP (“KPMG”) and engaged Tait, Weller & Baker LLP (“Tait Weller”) to serve as the
| NOTES TO THE FINANCIAL STATEMENTS |
independent registered public accounting firm to audit the financial statements of all series of the Trust for fiscal year 2017. Tait Weller previously served as the independent registered public accounting firm for the series of the Trust that are not one of the Applicable Funds.
KPMG’s reports on the financial statements for the Applicable Funds for each of fiscal years 2015 and 2016 contained no adverse opinion or disclaimer of opinion, nor were they qualified or modified as to uncertainty, audit scope, or accounting principles. During fiscal years 2015 and 2016 and the interim period of November 1, 2016, through September 11, 2017 (the “Interim Period”), there were no (i) disagreements with KPMG on any matter of accounting principles or practices, financial statement disclosure, or auditing scope or procedure, which disagreements, if not resolved to the satisfaction of KPMG, would have caused it to make reference to the subject matter of the disagreements in connection with its reports on the Applicable Funds’ financial statements for such years, nor (ii) “reportable events” of the kind described in Item 304(a)(1)(v) of Regulation S-K under the Securities Exchange Act of 1934, as amended.
During fiscal years 2015 and 2016 and the Interim Period, neither the Applicable Funds nor anyone on behalf of the Applicable Funds has consulted Tait Weller on items that concerned (a) the application of accounting principles to a specified transaction, either completed or proposed, or the type of audit opinion that might be rendered on an Applicable Fund’s financial statements, or (b) the subject of a disagreement (as defined in paragraph (a)(1)(iv) of Item 304 of Regulation S-K and related instructions) or reportable events (as described in paragraph (a)(1)(v) of Item 304 of Regulation S-K). The selection of Tait Weller does not reflect any disagreements or dissatisfaction by the Applicable Funds, the Board, or the Audit Committee with the performance of KPMG.
10). EVENTS SUBSEQUENT TO YEAR END
Management has evaluated the Fund’s related events and transactions that occurred subsequent to October 31, 2017, through the date of issuance of the Fund’s financial statements. Management has determined that there were no subsequent events requiring recognition or disclosure in the financial statements.
| HENNESSY FUNDS | 1-800-966-4354 | |
Report of Independent Registered Public
Accounting Firm
To the Board of Trustees of Hennessy Funds Trust
and the Shareholders of the Hennessy Cornerstone Growth Fund
Novato, CA
We have audited the accompanying statement of assets and liabilities, including the schedule of investments, of the Hennessy Cornerstone Growth Fund (the “Fund”), a series of Hennessy Funds Trust as of October 31, 2017, and the related statement of operations, the statement of changes in net assets, and the financial highlights for the year then ended. The statement of changes in net assets for the year ended October 31, 2016 and the financial highlights for each of the four years in the period ended October 31, 2016 have been audited by other auditors, whose report dated December 22, 2016 expressed unqualified opinions on such financial statements and financial highlights. These financial statements and financial highlights are the responsibility of the Fund’s management. Our responsibility is to express an opinion on these financial statements and financial highlights based on our audit.
We conducted our audit in accordance with the standards of the Public Company Accounting Oversight Board (United States). Those standards require that we plan and perform the audit to obtain reasonable assurance about whether the financial statements and financial highlights are free of material misstatement. The Fund is not required to have, nor were we engaged to perform, an audit of the Fund’s internal control over financial reporting. Our audit included consideration of internal control over financial reporting as a basis for designing audit procedures that are appropriate in the circumstances, but not for the purposes of expressing an opinion on the effectiveness of the Fund’s internal control over financial reporting. Accordingly, we express no such opinion. An audit includes examining, on a test basis, evidence supporting the amounts and disclosures in the financial statements. Our procedures included confirmation of securities owned as of October 31, 2017, by correspondence with the custodian. An audit also includes assessing the accounting principles used and significant estimates made by management, as well as evaluating the overall financial statement presentation. We believe that our audit provides a reasonable basis for our opinion.
In our opinion, the financial statements and financial highlights referred to above present fairly, in all material respects, the financial position of the Hennessy Cornerstone Growth Fund as of October 31, 2017, the results of its operations, the changes in its net assets, and the financial highlights for the year then ended, in conformity with accounting principles generally accepted in the United States of America.
TAIT, WELLER & BAKER LLP
Philadelphia, Pennsylvania
December 22, 2017
| REPORT OF INDEPENDENT REGISTERED PUBLIC ACCOUNTING FIRM/TRUSTEES AND OFFICERS |
Trustees and Officers of the Fund (Unaudited)
The business and affairs of the Funds are managed under the direction of the Board of Trustees of the Trust, and the Board of Trustees elects the Officers of the Trust. Beginning in March 2015, the Board of Trustees has from time to time appointed advisers to the Board of Trustees (“Advisers”), with the intention of having qualified individuals serve in an advisory capacity in order to garner experience in the mutual fund and asset management industry and be considered as potential Trustees in the future. There are currently three Advisers to the Board of Trustees: Brian Alexander, Doug Franklin, and Claire Knoles. As Advisers, Mr. Alexander, Mr. Franklin, and Ms. Knoles attend meetings of the Board and act as non-voting participants. Information pertaining to the Trustees, Advisers, and the Officers of the Trust is set forth below. The Trustees and Officers serve until their successors are duly elected and qualified or until their earlier death, resignation, or removal. Each of the Trustees oversees 14 Hennessy Funds. Unless otherwise indicated, the address of all persons listed below is 7250 Redwood Boulevard, Suite 200, Novato, CA 94945. The Fund’s Statement of Additional Information includes more information about the persons listed below and is available, without charge, upon request by calling 1-800-966-4354.
| | | | Other |
| | | | Directorships |
| | | | Held Outside |
| Name, (Year of Birth), | | | of Fund |
| and Position Held | Start Date | Principal Occupation(s) | Complex During |
with the Trust | of Service | During Past Five Years | Past Five Years(1) |
| | | | |
| Disinterested Trustees and Advisers |
| | | | |
| J. Dennis DeSousa | January 1996 | Mr. DeSousa is a real estate investor. | None. |
| (1936) | | | |
| Trustee | | | |
| | | | |
| Robert T. Doyle | January 1996 | Mr. Doyle has been the Sheriff of | None. |
| (1947) | | Marin County, California since 1996. | |
| Trustee | | | |
| | | | |
| Gerald P. Richardson | May 2004 | Mr. Richardson is an independent | None. |
| (1945) | | consultant in the securities industry. | |
| Trustee | | | |
| | | | |
| Brian Alexander | March 2015 | Mr. Alexander has been employed | None. |
| (1981) | | by Sutter Health Novato Community | |
| Adviser to the Board | | Hospital since 2012, first as an | |
| | | Assistant Administrator and then, | |
| | | beginning in 2013, as the Chief | |
| | | Administrative Officer. From 2011 | |
| | | through 2012, Mr. Alexander was | |
| | | employed by Sutter Health West Bay | |
| | | Region as the Regional Director of | |
| | | Strategic Decision Support. | |
| HENNESSY FUNDS | 1-800-966-4354 | |
| | | | Other |
| | | | Directorships |
| | | | Held Outside |
| Name, (Year of Birth), | | | of Fund |
| and Position Held | Start Date | Principal Occupation(s) | Complex During |
with the Trust | of Service | During Past Five Years | Past Five Years(1) |
| | | | |
| Doug Franklin | March 2016 | Mr. Franklin is a retired insurance | None. |
| (1964) | | industry executive. From 1987 | |
| Adviser to the Board | | through 2015, he was employed | |
| | | by Allianz-Fireman’s Fund Insurance | |
| | | Company in various positions, | |
| | | including Chief Actuary and | |
| | | Chief Risk Officer. | |
| | | | |
| Claire Knoles | December 2015 | Ms. Knoles is a founder of Kiosk and | None. |
| (1974) | | has served as its Chief Operating | |
| Adviser to the Board | | Officer since 2004. Kiosk is a full | |
| | | service marketing agency with | |
| | | offices in the San Francisco Bay | |
| | | Area, Toronto, and Liverpool, UK. | |
| | | | |
Interested Trustee(2) | | | |
| | | | |
| Neil J. Hennessy | January 1996 as | Mr. Hennessy has been employed by | Hennessy |
| (1956) | a Trustee and | Hennessy Advisors, Inc. since 1989 | Advisors, Inc. |
| Trustee, Chairman of | June 2008 as | and currently serves as its President, | |
| the Board, Chief | an Officer | Chairman and Chief Executive Officer. | |
| Investment Officer, | | | |
| Portfolio Manager, | | | |
| and President | | | |
| Name, (Year of Birth), | | |
| and Position Held | Start Date | Principal Occupation(s) |
with the Trust | of Service | During Past Five Years |
| | | |
| Officers | | |
| | | |
| Teresa M. Nilsen | January 1996 | Ms. Nilsen has been employed by Hennessy Advisors, Inc. |
| (1966) | | since 1989 and currently serves as its Executive Vice President, |
| Executive Vice President | | Chief Operations Officer, Chief Financial Officer, and Secretary. |
| and Treasurer | | |
| | | |
| Daniel B. Steadman | March 2000 | Mr. Steadman has been employed by Hennessy Advisors, Inc. |
| (1956) | | since 2000 and currently serves as its Executive Vice President |
| Executive Vice President | | and Chief Compliance Officer. |
| and Secretary | | |
| | | |
| Brian Carlson | December 2013 | Mr. Carlson has been employed by Hennessy Advisors, Inc. |
| (1972) | | since December 2013. Mr. Carlson was previously a co-founder |
| Senior Vice President and | | and principal of Trivium Consultants, LLC from February 2011 |
| Head of Distribution | | through November 2013. |
| | | |
| Jennifer Cheskiewicz | June 2013 | Ms. Cheskiewicz has been employed by Hennessy Advisors, Inc. |
| (1977) | | as its General Counsel since June 2013. She previously served |
| Senior Vice President and | | as in-house counsel to Carlson Capital, L.P., an SEC-registered |
| Chief Compliance Officer | | investment advisor to several private funds, from |
| | | February 2010 to May 2013. |
| TRUSTEES AND OFFICERS OF THE FUND |
| Name, (Year of Birth), | | |
| and Position Held | Start Date | Principal Occupation(s) |
with the Trust | of Service | During Past Five Years |
| | | |
| David Ellison | October 2012 | Mr. Ellison has been employed by Hennessy Advisors, Inc. since |
(1958)(3) | | October 2012. He has served as a Portfolio Manager of the |
| Senior Vice President | | Hennessy Small Cap Financial Fund and the Hennessy Large |
| and Portfolio Manager | | Cap Financial Fund since inception. Mr. Ellison also served as a |
| | | Portfolio Manager of the Hennessy Technology Fund from its |
| | | inception until February 2017. Mr. Ellison served as Director, |
| | | CIO and President of FBR Fund Advisers, Inc. from |
| | | December 1999 to October 2012. |
| | | |
| Ryan Kelley | March 2013 | Mr. Kelley has been employed by Hennessy Advisors, Inc. since |
(1972)(4) | | October 2012. He has served as a Portfolio Manager of the |
| Vice President and | | Hennessy Gas Utility Fund, the Hennessy Small Cap Financial |
| Portfolio Manager | | Fund, and the Hennessy Large Cap Financial Fund since |
| | | October 2014. He served as Co-Portfolio Manager of the same |
| | | funds from March 2013 through September 2014, and as a |
| | | Portfolio Analyst for the Hennessy Funds from October 2012 |
| | | through October 2014. Mr. Kelley has also served as a Portfolio |
| | | Manager of the Hennessy Cornerstone Growth Fund, the |
| | | Hennessy Cornerstone Mid Cap 30 Fund, the Hennessy |
| | | Cornerstone Large Growth Fund, and the Hennessy |
| | | Cornerstone Value Fund and as a Co-Portfolio Manager of the |
| | | Hennessy Technology Fund since February 2017. Mr. Kelley |
| | | served as Portfolio Manager of FBR Fund Advisers, Inc. from |
| | | January 2008 to October 2012. |
| | | |
| Brian Peery | March 2003 as | Mr. Peery has been employed by Hennessy Advisors, Inc. since |
| (1969) | an Officer and | 2002. He has served as a Portfolio Manager of the Hennessy |
| Senior Vice President | February 2011 | Cornerstone Growth Fund, the Hennessy Cornerstone Mid Cap |
| and Portfolio Manager | as a Co-Portfolio | 30 Fund, the Hennessy Cornerstone Large Growth Fund, the |
| | Manager or | Hennessy Cornerstone Value Fund, the Hennessy Total Return |
| | Portfolio Manager | Fund, and the Hennessy Balanced Fund since October 2014. |
| | | He served as Co-Portfolio Manager of the same funds from |
| | | February 2011 through September 2014. Mr. Peery has also |
| | | served as a Portfolio Manager of the Hennessy Gas Utility Fund |
| | | since February 2015 and as Lead Portfolio Manager of the |
| | | Hennessy Technology Fund since February 2017. |
| | | |
| Daniel P. Hennessy | December 2016 | Mr. Daniel Hennessy has been employed by Hennessy Advisors, |
| (1990) | | Inc. since 2015. He has served as an Associate Analyst of the |
| Assistant Vice President | | Hennessy Technology Fund since February 2017. He previously |
| and Associate Analyst | | served as a Mutual Fund Specialist at U.S. Bancorp Fund |
| | | Services, LLC from November 2014 to July 2015. Prior to that, |
| | | he attended the University of San Diego, where he earned a |
| | | degree in Political Science. |
(1) | Messrs. DeSousa, Doyle, Hennessy, and Richardson previously served on the Board of Directors of Hennessy Mutual Funds, Inc. (“HMFI”), The Hennessy Funds, Inc. (“HFI”), and Hennessy SPARX Funds Trust (“HSFT”). Pursuant to an internal reorganization effective as of February 28, 2014, the series of HFMI, HFI, and HSFT were reorganized into corresponding series of Hennessy Funds Trust that mirrored them. Subsequent to the reorganization, HFMI, HFI, and HSFT were dissolved. |
(2) | Mr. Hennessy is considered an “interested person,” as defined in the Investment Company Act of 1940, as amended, because he is an officer of the Hennessy Funds. |
(3) | The address of this officer is 101 Federal Street, Suite 1900, Boston, MA 02110. |
(4) | The address of this officer is 1340 Environ Way, Chapel Hill, NC 27517. |
| HENNESSY FUNDS | 1-800-966-4354 | |
Expense Example (Unaudited)
October 31, 2017
As a shareholder of the Fund, you incur two types of costs: (1) transaction costs, including sales charges (loads) on purchase payments, reinvested dividends, or other distributions, redemption fees, and exchange fees; and (2) ongoing costs, including management fees, service fees, and other Fund expenses. This Example is intended to help you understand your ongoing costs (in dollars) of investing in the Fund and to compare these costs with the ongoing costs of investing in other mutual funds. The Example is based on an investment of $1,000 invested at the beginning of the period and held for the entire period from May 1, 2017, through October 31, 2017.
Actual Expenses
The first line of the table below under the “Investor Class” and “Institutional Class” headings provides information about actual account values and actual expenses. Although the Fund charges no sales loads or transaction fees, you will be assessed fees for outgoing wire transfers, returned checks and stop payment orders at prevailing rates charged by U.S. Bancorp Fund Services, LLC, the Fund’s transfer agent. If you request that a redemption be made by wire transfer, currently a $15 fee is charged by the Fund’s transfer agent. IRA accounts will be charged a $15 annual maintenance fee. The example below includes, but is not limited to, management fees, shareholder servicing fees, fund accounting, custody, and transfer agent fees. However, the example below does not include portfolio trading commissions and related expenses, and other extraordinary expenses as determined under generally accepted accounting principles. You may use the information in this line, together with the amount you invested, to estimate the expenses that you paid over the period. Simply divide your account value by $1,000 (for example, an $8,600 account value divided by $1,000 = 8.6), then multiply the result by the number in the first line of the table under the “Investor Class” or “Institutional Class” headings in the column entitled “Expenses Paid During Period” to estimate the expenses you paid on your account during this period.
Hypothetical Example for Comparison Purposes
The second line of the table below under the “Investor Class” and “Institutional Class” headings provides information about hypothetical account values and hypothetical expenses based on the Fund’s actual expense ratios and an assumed rate of return of 5% per year before expenses, which is not the Fund’s actual return. The hypothetical account values and expenses may not be used to estimate the actual ending account balance or expenses you paid for the period. You may use this information to compare the ongoing costs of investing in the Fund and other funds. To do so, compare this 5% hypothetical example with the 5% hypothetical examples that appear in the shareholder reports of the other funds. Please note that the expenses shown in the table are meant to highlight your ongoing costs only and do not reflect any transactional costs, such as sales charges (loads), or exchange fees. Therefore, the second line of the table under the “Investor Class” and “Institutional Class” headings is useful in comparing ongoing costs only, and will not help you determine the relative total costs of owning different funds. In addition, if these transactional costs were included, your costs would have been higher.
| | | | Expenses Paid |
| | Beginning | Ending | During Period(1) |
| | Account Value | Account Value | May 1, 2017 – |
| | May 1, 2017 | October 31, 2017 | October 31, 2017 |
| Investor Class | | | |
| Actual | $1,000.00 | $1,170.00 | $7.00 |
| Hypothetical (5% return before expenses) | $1,000.00 | $1,018.75 | $6.51 |
| | | | |
| Institutional Class | | | |
| Actual | $1,000.00 | $1,171.60 | $5.25 |
| Hypothetical (5% return before expenses) | $1,000.00 | $1,020.37 | $4.89 |
(1) | Expenses are equal to the Fund’s annualized expense ratio of 1.28% for Investor Class shares or 0.96% for Institutional Class shares, as applicable, multiplied by the average account value over the period, multiplied by 184/365 days (to reflect one-half year period). |
| HENNESSY FUNDS | 1-800-966-4354 | |
How to Obtain a Copy of the Fund’s
Proxy Voting Policy and Proxy Voting Records
A description of the policies and procedures the Fund uses to determine how to vote proxies relating to portfolio securities is available without charge: (1) by calling 1-800-966-4354; (2) on the Hennessy Funds’ website at hennessyfunds.com/proxy-voting/policy.fs; or (3) on the U.S. Securities and Exchange Commission’s (the “SEC”) website at www.sec.gov. The Fund’s proxy voting record is available without charge on both the Hennessy Funds’ website at hennessyfunds.com/proxy-voting/vote.fs and the SEC’s website at www.sec.gov no later than August 31 for the prior 12 months ending June 30.
Quarterly Filings on Form N-Q
The Fund files a complete schedule of portfolio holdings with the SEC for the first and third quarters of each fiscal year on Form N-Q. The Fund’s Forms N-Q are made available on the SEC’s website at www.sec.gov. The Fund’s Forms N-Q may be reviewed and copied at the SEC’s Public Reference Room in Washington, DC, and information on the operation of the Public Reference Room may be obtained by calling 1-800-SEC-0330. Information included in the Fund’s Forms N-Q will also be available upon request by calling 1-800-966-4354.
Householding
To help keep the Fund’s costs as low as possible, we generally deliver a single copy of most financial reports and prospectuses to shareholders who share an address, even if the accounts are registered under different names. This process, known as “householding,” does not apply to account statements. You may request an individual copy of a prospectus or financial report at any time. If you would like to receive separate mailings, please call U.S. Bancorp Fund Services, LLC at 1-800-261-6950 or 1-414-765-4124 and we will begin individual delivery within 30 days of your request. If your account is held through a financial institution or other intermediary, please contact them directly to request individual delivery.
| PROXY VOTING — PRIVACY POLICY |
Privacy Policy
We collect the following non-public personal information about you:
| | • | information we receive from you on or in applications or other forms, correspondence, or conversations, including, but not limited to, your name, address, phone number, social security number, assets, income, and date of birth; and |
| | | |
| | • | information about your transactions with us, our affiliates, or others, including, but not limited to, your account number and balance, payment history, parties to transactions, cost basis information, and other financial information. |
We do not disclose any non-public personal information about our current or former shareholders to non-affiliated third parties, except as permitted by law. For example, we are permitted by law to disclose all of the information we collect, as described above, to our Transfer Agent to process your transactions. Furthermore, we restrict access to your non-public personal information to those persons who require such information to provide products or services to you. We maintain physical, electronic, and procedural safeguards that comply with federal standards to guard your non-public personal information.
In the event that you hold shares of the Fund through a financial intermediary, including, but not limited to, a broker-dealer, bank, or trust company, the privacy policy of your financial intermediary would govern how your non-public personal information will be shared with non-affiliated third parties.
| HENNESSY FUNDS | 1-800-966-4354 | |
(This Page Intentionally Left Blank.)
For information, questions or assistance, please call
The Hennessy Funds
1-800-966-4354 or 1-415-899-1555
INVESTMENT ADVISOR
Hennessy Advisors, Inc.
7250 Redwood Boulevard, Suite 200
Novato, California 94945
ADMINISTRATOR,
TRANSFER AGENT,
DIVIDEND PAYING AGENT &
SHAREHOLDER SERVICING AGENT
U.S. Bancorp Fund Services, LLC
P.O. Box 701
Milwaukee, Wisconsin 53201-0701
CUSTODIAN
U.S. Bank N.A.
Custody Operations
1555 North River Center Drive, Suite 302
Milwaukee, Wisconsin 53212
TRUSTEES
Neil J. Hennessy
Robert T. Doyle
J. Dennis DeSousa
Gerald P. Richardson
COUNSEL
Foley & Lardner LLP
777 East Wisconsin Avenue
Milwaukee, Wisconsin 53202-5306
INDEPENDENT REGISTERED
PUBLIC ACCOUNTING FIRM
Tait, Weller & Baker LLP
1818 Market Street, Suite 2400
Philadelphia, Pennsylvania 19103
DISTRIBUTOR
Quasar Distributors, LLC
777 East Wisconsin Avenue
Milwaukee, Wisconsin 53202
hennessyfunds.com | 1-800-966-4354
This report has been prepared for shareholders and may be distributed to
others only if preceded or accompanied by a current prospectus.
ANNUAL REPORT
OCTOBER 31, 2017
HENNESSY FOCUS FUND
Investor Class HFCSX
Institutional Class HFCIX
hennessyfunds.com | 1-800-966-4354
(This Page Intentionally Left Blank.)
Contents
| Letter to Shareholders | | | 2 | |
| Performance Overview | | | 4 | |
| Financial Statements | | | | |
| Schedule of Investments | | | 8 | |
| Statement of Assets and Liabilities | | | 12 | |
| Statement of Operations | | | 13 | |
| Statements of Changes in Net Assets | | | 15 | |
| Financial Highlights | | | 16 | |
| Notes to the Financial Statements | | | 20 | |
| Report of Independent Registered Public Accounting Firm | | | 27 | |
| Trustees and Officers of the Fund | | | 28 | |
| Expense Example | | | 32 | |
| Proxy Voting Policy and Proxy Voting Records | | | 34 | |
| Quarterly Schedule of Investments | | | 34 | |
| Householding | | | 34 | |
| Privacy Policy | | | 35 | |
| HENNESSY FUNDS | 1-800-966-4354 | |
December 2017
Dear Hennessy Funds Shareholder:
Over the past year, global equity markets have made strong advances, fueled by continued, broad-based economic growth in most countries and regions, and in spite of a somewhat unsettling geopolitical backdrop.
U.S. stocks performed well in the first year of the new administration in Washington, and, ignoring the debate and the bluster, investors have continued to focus on what concerns them the most – tax reform, deregulation, and the hope of an increase in infrastructure spending. As we move into the final weeks of the calendar year, with the major indices reaching new highs, I find myself envisioning the Dow Jones Industrial Average building momentum toward 30,000.
Over the past 12 months, the U.S. economy has continued to grow at a steady rate of almost 2.5% on an annualized basis, as measured by GDP. Companies have added over 170,000 jobs per month on average over the past year, and the current unemployment rate of 4.1% is the lowest in 17 years. Consumer confidence is high and still rising, and corporate profits are at all-time highs. The Federal Reserve has been increasing interest rates, but at a gradual pace. The bond market has also continued to support the equity market and equity market valuations. Since December of last year, long bond yields have stayed within a narrow band, with the 10-year U.S. Treasury yield hovering in the 2.0% to 2.5% range, and remain low compared to historical averages. In my opinion, long bond yields have stayed low despite three increases in the Federal Funds rate over the last 12 months in part due to persistent low inflation.
Meanwhile, the prospective price-to-earnings multiples for the Dow Jones Industrial Average and S&P 500 Index are just above long-term averages at 19.5x and 19.9x, respectively. I believe these levels of stock valuation, while higher than a year ago, are still very reasonable. At the peak of the technology/dot-com bubble, U.S. equities sold at much higher multiples across the board than they do today, and bond yields were also much higher. In June of 1999, the Dow Jones Industrial Average sold at 28x earnings and the 10-year bond yield was close to 6%. Today, the Dow is selling at under 20x earnings and is offering a 2.2% dividend yield, on par with the yield of the 10-year government bond at 2.4%.
Equity markets in the U.S. have been rising for almost nine years, and financial media reports have speculated that this bull run will come to end, but why? I see no substantial reasons or indicators that a major correction is on the horizon. I remain confident that this bull market has room to run. Overall, investment fundamentals are strong. Corporate earnings are growing at a healthy rate, and companies are generating excess cash flow. Cash continues to build on corporate balance sheets, with $5.2 trillion in cash and short term investments among the S&P 500 Index companies as of October 31, 2017. If our government leaders can pass a meaningful tax reform bill and continue efforts toward regulatory relief, it could be icing on the cake for equities.
There have been, and will likely continue to be, downturns throughout this extended bull market. Since 2010, there have been 18 downturns in the market, 14 of which were between 5% and 10% and four of which were corrections of between 10% and 20%. Yet the market has bounced back following each pullback and then has moved higher. A correction is not the end of the bull market. What might signal that we are at the end of this bull market? Euphoria. And I still see no signs of euphoria in this market. In the past,
I have likened the current bull market to that of 1982-2000, and I am confident in the strength of the market today and believe the economy will continue its slow, but steady, growth into the coming year.
Thank you for your continued confidence and investment in our funds. If you have any questions or would like to speak with us directly, please don’t hesitate to call us at (800) 966-4354.
Best regards,
Neil J. Hennessy
President and Chief Investment Officer
Past performance does not guarantee future results.
Mutual fund investing involves risk. Principal loss is possible.
Opinions expressed are those of Neil Hennessy and are subject to change, are not guaranteed, and should not be considered investment advice.
The Dow Jones Industrial Average and S&P 500 Index are unmanaged indices commonly used to measure the performance of U.S. stocks. One cannot invest directly in an index.
Price to earnings is calculated by dividing a company’s market price per share by its earnings per share. Dividend yield is calculated as the annual dividends paid by a company divided by the price of a share of its stock. Cash flow provides an indication of a company’s financial strength and represents earnings before depreciation, amortization, and non-cash charges.
| HENNESSY FUNDS | 1-800-966-4354 | |
Performance Overview (Unaudited)
CHANGE IN VALUE OF $10,000 INVESTMENT
This graph illustrates the performance of an initial investment of $10,000 made in the Fund ten years ago and assumes the reinvestment of dividends.
AVERAGE ANNUAL TOTAL RETURN FOR PERIODS ENDED OCTOBER 31, 2017
| | One | Five | Ten |
| | Year | Years | Years |
| Hennessy Focus Fund – | | | |
| Investor Class (HFCSX) | 20.23% | 14.43% | 9.16% |
| Hennessy Focus Fund – | | | |
Institutional Class (HFCIX)(1) | 20.69% | 14.82% | 9.51% |
Russell 3000® Index | 23.98% | 15.12% | 7.61% |
Russell Mid Cap® Growth Index | 26.25% | 15.34% | 8.23% |
Expense ratios: 1.50% (Investor Class); 1.13% (Institutional Class)
(1) | The inception date of Institutional Class shares is May 30, 2008. Performance shown prior to the inception of Institutional Class shares reflects the performance of Investor Class shares and includes expenses that are higher than those of Institutional Class shares. |
Performance data quoted represents past performance; past performance does not guarantee future results. The investment return and principal value of an investment will fluctuate so that an investor’s shares, when redeemed, may be worth more or less than their original cost. The performance table does not reflect the deduction of taxes that a shareholder would pay on Fund distributions or the redemption of Fund shares. Current performance of the Fund may be lower or higher than the performance quoted. Performance data current to the most recent month end may be obtained by visiting hennessyfunds.com. Performance for periods prior to October 26, 2012, is that of the FBR Focus Fund.
The Russell 3000® Index is an unmanaged index commonly used to measure the performance of U.S. stocks. The Russell Midcap® Growth Index is an unmanaged index commonly used to measure the performance of U.S. medium-capitalization growth stocks. One cannot invest directly in an index.
Frank Russell Company (“Russell”) is the source and owner of the trademarks, service marks, and copyrights related to the Russell Indexes. Russell® is a trademark of Frank Russell Company. Neither Russell nor its licensors accept any liability for any errors or omissions in the Russell Indexes or Russell ratings or underlying data and no party may rely on any Russell Indexes or Russell ratings or underlying data contained in this
communication. No further distribution of Russell data is permitted without Russell’s express written consent. Russell does not promote, sponsor, or endorse the content of this communication.
The expense ratios presented are from the most recent prospectus. The expense ratios for the current reporting period are available in the Financial Highlights section of this report.
PERFORMANCE NARRATIVE
Portfolio Managers Brian E. Macauley, CFA, David S. Rainey, CFA, and Ira M. Rothberg, CFA
Broad Run Investment Management, LLC (sub-advisor)
Performance:
For the 12-month period ended October 31, 2017, the Investor Class of the Hennessy Focus Fund returned 20.23%, underperforming both the Russell 3000® Index and the Russell Midcap® Growth Index, which returned 23.98% and 26.25%, for the same period, respectively.
Leading contributors to the Fund’s performance were CarMax, Inc., American Tower Corp., and Encore Capital Group, Inc., all of which the Fund continues to hold. Each of these companies produced attractive financial results over the 12-month period, which helped drive appreciation in their stock prices. Leading detractors from the Fund’s performance were O’Reilly Automotive, Inc., World Fuel Services Corporation, and TransDigm Group, Inc. The Fund continues to hold O’Reilly Automotive, Inc., and World Fuel Services Corporation.
We invest with a long-term time horizon and encourage shareholders to do the same. Despite the discussion of 12-month results referenced above, we encourage fellow shareholders to also evaluate the Fund’s performance over five- and 10-year periods since shorter time periods can be influenced by many transitory issues unrelated to the growth in the intrinsic value of the Fund’s holdings.
Portfolio Strategy and Investment Commentary:
In the Fund, we target “compounders” – businesses trading at reasonable valuations that have the competitive position, management, and growth to potentially create outsized value for an extended period of time. We believe that our criteria-driven, fundamental research, applied with a long-term investment horizon, allows us to identify these opportunities. We continue to have a positive outlook for the Fund because we believe its holdings are predominately a collection of “compounders” that should grow their earnings at attractive rates for a long time to come.
To further your understanding of what the Fund owns and why, we will use this letter to describe our thinking behind Markel Corporation (MKL), the Fund’s second largest holding at the end of the period. We have a long history with Markel and believe it measures up very well against the investment criteria that guide our search for “compounders.”
Markel is a property and casualty insurance company managed with a very purposeful strategy to compound long-term value per share on an after-tax basis. In recent years, some in the financial press have begun referring to Markel as a “baby-Berkshire Hathaway”1 – a complimentary and reasonably appropriate comparison in our view – because of the companies’ similar management philosophies and business mixes.
Insurance companies can be thought of as having two lines of business: insurance underwriting and investing. Insurance underwriting, the core function of an insurer, involves making contractual commitments to customers to pay insurance claims of
| HENNESSY FUNDS | 1-800-966-4354 | |
uncertain magnitude in the future in exchange for fixed premium payments today. Since there is a lag between when premium payments are collected and when loss payments are made, capital or “float” accumulates and is available for the insurance company to invest for its own benefit.
In general, insurance is a lousy business: regulated and capital intensive with low customer switching costs and few barriers to entry. As a result, over the last 30 years, the industry as a whole has produced a return on equity of only about 8%. The allure of investable float, combined with the estimating required to set insurance pricing, is an unstable mixture that leads to aggressive competition and dismal economic returns. However, Markel, like our other businesses that operate in competitive, capital-intensive industries (e.g., NVR and CarMax), takes a very different approach from most in its industry, which has enabled it to generate attractive growth and returns.
In insurance underwriting, Markel mostly focuses on niche and specialty segments of the insurance market, rather than the much larger but more commoditized standard commercial and personal lines categories. Markel provides coverage for more than 100 unique risk categories including equine, antique cars, bars and taverns, and summer camps, among others. It requires specialized knowledge to price these policies accurately, and often also requires unique distribution to reach the customer, resulting in reduced competition and more opportunity for profitable business.
In addition, Markel has worked diligently to establish and maintain a culture of underwriting discipline. Insurance markets are cyclical, so employees on the front lines making decisions need to write business when pricing is sufficient, and curtail writing business when it is not. Much like the stock market, most of the time it is not obvious if pricing is good or bad, and it takes experience and judgment to make the right decisions. To incentivize the right behavior, Markel compensates its underwriters based upon the actual performance of their book of business over time (usually three to six years depending upon the line of insurance), rather than on short-term production volumes like many other insurers do. This compensation system, along with other cultural values, helps attract team-oriented people, repel short-term thinkers, and perpetuate the solid underwriting culture.
The combination of Markel’s selective market focus and disciplined underwriting culture has made the company a top-tier insurance underwriter. The “combined ratio” is a financial metric measuring success in underwriting insurance. A combined ratio below 100 is a profitable insurance operation, while a ratio above 100 is an unprofitable operation. The table below illustrates just how successful Markel has been at underwriting insurance over the last three decades, on an absolute basis, and relative to the overall industry.
| | 1986-1995 | 1996-2005 | 2006-2015 |
| Markel Combined Ratio | 90.2 | 99.7^ | 94.6 |
| P&C Industry Combined Ratio | 108.4 | 105.5 | 100.2 |
| ^ | Broad Run estimate of combined ratio adjusted for reserve strengthening in 2000 and 2001 related to the Terra Nova acquisition. |
In investing, relative to other insurers, Markel makes a substantially higher allocation to equities and lower allocation to fixed income. Markel’s target equity allocation (as a percentage of shareholders’ equity) is 50-80%, many times higher than its peers. Markel is willing to accept higher volatility in equities in exchange for higher expected long-term returns. This approach has been quite successful, with equities outperforming fixed income
over time, and Markel’s public equity portfolio outperforming the overall equity market by about 2.5% annualized over the last 27 years (11.8% vs. 9.3% for the S&P 500 Index).
Since 2005, the company has broadened its investments in equities to include buying private businesses. There are advantages to Markel in owning private businesses rather than public equities, including elimination of double taxation of dividends and control/oversight of the investee’s capital allocation. For business sellers, Markel has a unique value proposition compared to traditional strategic or financial buyers, offering the preservation of operational autonomy, job security for employees, and a long-term stable home. Markel’s private equity investment results have been good, and as an asset class now compose about one-fifth of its overall equity portfolio. We believe that the purchase of private businesses provides an additional and beneficial capital allocation option to management and suspect that its importance will continue to grow over time.
Given the nature of Markel’s business, we believe that the annual change in book value per share is a good proxy for its annual change in intrinsic value. Over the last 20 years, Markel’s book value per share compounded at 13% annualized.
We believe that the same forces that drove Markel’s growth in the past are present today. If Markel can continue to generate superior underwriting results, produce solid investment returns, and make opportunistic acquisitions, we believe book value per share can compound at a low-teens rate over the next decade. If it achieves these results, we believe that it can at least maintain its current valuation (1.7x book value as of October 31, 2017), and its share price can appreciate in line with its growth in book value per share. Viewed another way, if Markel can increase book value per share 13% per year on average, at its current 1.7x book value multiple, the shares are trading at the equivalent of a 13x multiple of owner earnings. For these reasons, we believe Markel remains an underappreciated compounder.
1 | Dow Jones Newswires and Al Lewis. “Lewis: Baby Berkshire growing up right.” The Denver Post. June 14, 2013. http://www.denverpost.com/2013/06/04/lewis-babyberkshire-growing-up-right. |
Opinions expressed are those of the Portfolio Managers as of the date written and are subject to change, are not guaranteed, and should not be considered investment advice or an indication of trading intent. Earnings growth is not representative of the Fund’s future performance.
The Russell 3000® Index is an unmanaged index commonly used to measure the performance of U.S. stocks. The Russell Midcap® Growth Index is an unmanaged index commonly used to measure the performance of U.S. medium-capitalization growth stocks. The S&P 500 Index is an unmanaged index commonly used to measure the performance of U.S. stocks. One cannot invest directly in an index.
The Fund is non-diversified, meaning it may concentrate its assets in fewer individual holdings than a diversified fund, making it more exposed to individual stock volatility than a diversified fund. The Fund invests in small- and medium-capitalization companies, which involves additional risks such as limited liquidity and greater volatility. Investments in foreign securities involve greater volatility and political, economic, and currency risk and differences in accounting methods. Please see the Fund’s prospectus for a more complete discussion of these and other risks.
References to specific securities should not be considered a recommendation to buy or sell any security. Fund holdings and sector allocations are subject to change. Please refer to the Schedule of Investments included in this report for additional portfolio information.
Return on equity measures a corporation’s profitability by showing how much profit a company generates with the money shareholders have invested. Book value is the net asset value of a company, calculated by total assets minus total liabilities.
| HENNESSY FUNDS | 1-800-966-4354 | |
Financial Statements
Schedule of Investments as of October 31, 2017 |
HENNESSY FOCUS FUND
(% of Net Assets)
| TOP TEN HOLDINGS (EXCLUDING CASH/CASH EQUIVALENTS) | | % NET ASSETS |
| American Tower Corp., Class A | | | 11.28 | % |
| Markel Corp. | | | 8.56 | % |
| CarMax, Inc. | | | 8.14 | % |
| Brookfield Asset Management, Inc. | | | 6.97 | % |
| The Charles Schwab Corp. | | | 6.61 | % |
| O’Reilly Automotive, Inc. | | | 6.51 | % |
| Aon PLC | | | 6.19 | % |
| Hexcel Corp. | | | 5.76 | % |
| American Woodmark Corp. | | | 4.41 | % |
| Gaming and Leisure Properties, Inc. | | | 4.18 | % |
Note: For presentation purposes, the Fund has grouped some of the industry categories. For purposes of categorizing securities for compliance with section 8(b)(1) of the Investment Company Act of 1940, as amended, the Fund uses more specific industry classifications.
| COMMON STOCKS – 71.13% | | Number | | | | | | % of | |
| | | of Shares | | | Value | | | Net Assets | |
| Consumer Discretionary – 23.54% | | | | | | | | | |
| CarMax, Inc. (a) | | | 2,962,712 | | | $ | 222,499,671 | | | | 8.14 | % |
| NVR, Inc. (a) | | | 33,974 | | | | 111,481,264 | | | | 4.08 | % |
| O’Reilly Automotive, Inc. (a) | | | 842,815 | | | | 177,791,824 | | | | 6.51 | % |
| Penn National Gaming, Inc. (a) | | | 1,197,772 | | | | 31,249,872 | | | | 1.14 | % |
| Twenty First Century Fox, Inc. | | | 3,837,592 | | | | 100,353,031 | | | | 3.67 | % |
| | | | | | | | 643,375,662 | | | | 23.54 | % |
| | | | | | | | | | | | | |
| Energy – 0.86% | | | | | | | | | | | | |
| World Fuel Services Corp. | | | 851,106 | | | | 23,660,747 | | | | 0.86 | % |
| | | | | | | | | | | | | |
| Financials – 26.28% | | | | | | | | | | | | |
| Aon PLC (b) | | | 1,179,036 | | | | 169,109,133 | | | | 6.19 | % |
| Diamond Hill Investment Group, Inc. | | | 34,496 | | | | 7,310,737 | | | | 0.27 | % |
| Encore Capital Group, Inc. (a)(d) | | | 2,258,784 | | | | 104,920,517 | | | | 3.84 | % |
| Markel Corp. (a) | | | 215,672 | | | | 233,853,149 | | | | 8.56 | % |
| Marlin Business Services Corp. (d) | | | 1,010,273 | | | | 22,124,979 | | | | 0.81 | % |
| The Charles Schwab Corp. | | | 4,029,065 | | | | 180,663,275 | | | | 6.61 | % |
| | | | | | | | 717,981,790 | | | | 26.28 | % |
| | | | | | | | | | | | | |
| Health Care – 1.61% | | | | | | | | | | | | |
| Henry Schein, Inc. (a) | | | 558,796 | | | | 43,921,366 | | | | 1.61 | % |
| | | | | | | | | | | | | |
| Industrials – 12.21% | | | | | | | | | | | | |
| American Woodmark Corp. (a)(d) | | | 1,248,361 | | | | 120,591,673 | | | | 4.41 | % |
| Ametek, Inc. | | | 459,822 | | | | 31,033,387 | | | | 1.14 | % |
| Hexcel Corp. | | | 2,592,037 | | | | 157,310,725 | | | | 5.76 | % |
| Mistras Group, Inc. (a) | | | 1,171,870 | | | | 24,620,989 | | | | 0.90 | % |
| | | | | | | | 333,556,774 | | | | 12.21 | % |
| | | | | | | | | | | | | |
| Information Technology – 6.63% | | | | | | | | | | | | |
| Alphabet, Inc., Class A (a) | | | 68,984 | | | | 71,263,231 | | | | 2.61 | % |
| Alphabet, Inc., Class C (a) | | | 108,017 | | | | 109,814,403 | | | | 4.02 | % |
| | | | | | | | 181,077,634 | | | | 6.63 | % |
| Total Common Stocks | | | | | | | | | | | | |
| (Cost $948,321,804) | | | | | | | 1,943,573,973 | | | | 71.13 | % |
The accompanying notes are an integral part of these financial statements.
| HENNESSY FUNDS | 1-800-966-4354 | |
| REITS – 22.43% | | Number | | | | | | % of | |
| | | of Shares | | | Value | | | Net Assets | |
| Financials – 22.43% | | | | | | | | | |
| American Tower Corp., Class A | | | 2,145,080 | | | $ | 308,183,644 | | | | 11.28 | % |
| Brookfield Asset Management, Inc. (b) | | | 4,543,328 | | | | 190,547,176 | | | | 6.97 | % |
| Gaming and Leisure Properties, Inc. | | | 3,122,341 | | | | 114,090,340 | | | | 4.18 | % |
| | | | | | | | 612,821,160 | | | | 22.43 | % |
| Total REITS | | | | | | | | | | | | |
| (Cost $324,372,476) | | | | | | | 612,821,160 | | | | 22.43 | % |
| | | | | | | | | | | | | |
| SHORT-TERM INVESTMENTS – 6.41% | | | | | | | | | | | | |
| | | | | | | | | | | | | |
| Money Market Funds – 6.41% | | | | | | | | | | | | |
| Fidelity Government Portfolio, Institutional Class, 0.92% (c) | | | 136,870,000 | | | | 136,870,000 | | | | 5.01 | % |
| The Government & Agency Portfolio, Institutional Class, 0.95% (c) | | | 38,291,798 | | | | 38,291,798 | | | | 1.40 | % |
| | | | | | | | 175,161,798 | | | | 6.41 | % |
| Total Short-Term Investments | | | | | | | | | | | | |
| (Cost $175,161,798) | | | | | | | 175,161,798 | | | | 6.41 | % |
| | | | | | | | | | | | | |
| Total Investments | | | | | | | | | | | | |
| (Cost $1,447,856,078) – 99.97% | | | | | | | 2,731,556,931 | | | | 99.97 | % |
| Other Assets in Excess of Liabilities – 0.03% | | | | | | | 764,359 | | | | 0.03 | % |
TOTAL NET ASSETS – 100.00% | | | | | | $ | 2,732,321,290 | | | | 100.00 | % |
Percentages are stated as a percent of net assets.
REIT – Real Estate Investment Trust
| (a) | Non-income producing security. |
| (b) | U.S. traded security of a foreign corporation. |
| (c) | The rate listed is the fund’s 7-day yield as of October 31, 2017. |
| (d) | Investment represents five percent or more of the outstanding voting securities of the issuer, and is or was an affiliate of the Hennessy Focus Fund, as defined in the Investment Company Act of 1940, as amended, at or during the year ended October 31, 2017. Details of transactions with these affiliated companies for the year ended October 31, 2017, are as follows: |
| | | | American | | | Encore Capital | | | Marlin Business | |
| | Issuer | | Woodmark Corp. | | | Group, Inc. | | | Services Corp. | |
| | Beginning Cost | | $ | 51,892,778 | | | $ | 73,525,403 | | | $ | 15,865,289 | |
| | Purchase Cost | | $ | 3,061,006 | | | $ | — | | | $ | — | |
| | Sales Cost | | $ | — | | | $ | — | | | $ | — | |
| | Ending Cost | | $ | 54,953,784 | | | $ | 73,525,403 | | | $ | 15,865,289 | |
| | Dividend Income | | $ | — | | | $ | — | | | $ | 562,753 | |
| | Net Change in | | | | | | | | | | | | |
| | Unrealized Appreciation | | $ | 27,160,101 | | | $ | 60,083,655 | | | $ | 4,445,202 | |
| | Realized Gain/Loss | | $ | — | | | $ | — | | | $ | — | |
| | Shares | | | 1,248,361 | | | | 2,258,784 | | | | 1,010,273 | |
| | Market Value | | $ | 120,591,673 | | | $ | 104,920,517 | | | $ | 22,124,979 | |
The accompanying notes are an integral part of these financial statements.
Summary of Fair Value Exposure at October 31, 2017
The following is a summary of the inputs used to value the Fund’s net assets as of October 31, 2017 (see Note 3 in the accompanying notes to the financial statements):
| Common Stocks | | Level 1 | | | Level 2 | | | Level 3 | | | Total | |
| Consumer Discretionary | | $ | 643,375,662 | | | $ | — | | | $ | — | | | $ | 643,375,662 | |
| Energy | | | 23,660,747 | | | | — | | | | — | | | | 23,660,747 | |
| Financials | | | 717,981,790 | | | | — | | | | — | | | | 717,981,790 | |
| Health Care | | | 43,921,366 | | | | — | | | | — | | | | 43,921,366 | |
| Industrials | | | 333,556,774 | | | | — | | | | — | | | | 333,556,774 | |
| Information Technology | | | 181,077,634 | | | | — | | | | — | | | | 181,077,634 | |
| Total Common Stocks | | $ | 1,943,573,973 | | | $ | — | | | $ | — | | | $ | 1,943,573,973 | |
| REITS | | | | | | | | | | | | | | | | |
| Financials | | $ | 612,821,160 | | | $ | — | | | $ | — | | | $ | 612,821,160 | |
| Total REITS | | $ | 612,821,160 | | | $ | — | | | $ | — | | | $ | 612,821,160 | |
| Short-Term Investments | | | | | | | | | | | | | | | | |
| Money Market Funds | | $ | 175,161,798 | | | $ | — | | | $ | — | | | $ | 175,161,798 | |
| Total Short-Term Investments | | $ | 175,161,798 | | | $ | — | | | $ | — | | | $ | 175,161,798 | |
| Total Investments | | $ | 2,731,556,931 | | | $ | — | | | $ | — | | | $ | 2,731,556,931 | |
Transfers between levels are recognized at the end of the reporting period. During the year ended October 31, 2017, the Fund recognized no transfers between levels.
The accompanying notes are an integral part of these financial statements.
| HENNESSY FUNDS | 1-800-966-4354 | |
Financial Statements
Statement of Assets and Liabilities as of October 31, 2017 |
| ASSETS: | | | |
| Investments in unaffiliated securities, at value (cost $1,303,511,602) | | $ | 2,483,919,762 | |
| Investments in affiliated securities, at value (cost $144,344,476) | | | 247,637,169 | |
| Total investments in securities, at value (cost $1,447,856,078) | | | 2,731,556,931 | |
| Dividends and interest receivable | | | 947,005 | |
| Receivable for fund shares sold | | | 3,081,523 | |
| Receivable for securities sold | | | 1,670,661 | |
| Prepaid expenses and other assets | | | 89,299 | |
| Total Assets | | | 2,737,345,419 | |
| | | | | |
| LIABILITIES: | | | | |
| Payable for fund shares redeemed | | | 1,576,388 | |
| Payable to advisor | | | 2,088,188 | |
| Payable to administrator | | | 430,110 | |
| Payable to auditor | | | 20,698 | |
| Accrued distribution fees | | | 223,449 | |
| Accrued service fees | | | 142,566 | |
| Accrued trustees fees | | | 5,578 | |
| Accrued expenses and other payables | | | 537,152 | |
| Total Liabilities | | | 5,024,129 | |
| NET ASSETS | | $ | 2,732,321,290 | |
| | | | | |
| NET ASSETS CONSIST OF: | | | | |
| Capital stock | | $ | 1,458,503,720 | |
| Accumulated net investment loss | | | (10,054,323 | ) |
| Accumulated net realized gain on investments | | | 171,040 | |
| Unrealized net appreciation on investments | | | 1,283,700,853 | |
| Total Net Assets | | $ | 2,732,321,290 | |
| | | | | |
| NET ASSETS | | | | |
| Investor Class: | | | | |
| Shares authorized (no par value) | | Unlimited | |
| Net assets applicable to outstanding Investor Class shares | | $ | 1,675,002,058 | |
| Shares issued and outstanding | | | 19,724,559 | |
| Net asset value, offering price and redemption price per share | | $ | 84.92 | |
| | | | | |
| Institutional Class: | | | | |
| Shares authorized (no par value) | | Unlimited | |
| Net assets applicable to outstanding Institutional Class shares | | $ | 1,057,319,232 | |
| Shares issued and outstanding | | | 12,139,262 | |
| Net asset value, offering price and redemption price per share | | $ | 87.10 | |
The accompanying notes are an integral part of these financial statements.
| STATEMENT OF ASSETS AND LIABILITIES/STATEMENT OF OPERATIONS |
Financial Statements
Statement of Operations for the year ended October 31, 2017 |
| INVESTMENT INCOME: | | | |
Dividend income from unaffiliated securities(1) | | $ | 22,854,745 | |
| Dividend income from affiliated securities | | | 565,753 | |
| Interest income | | | 1,524,577 | |
| Total investment income | | | 24,945,075 | |
| | | | | |
| EXPENSES: | | | | |
| Investment advisory fees (See Note 5) | | | 23,176,744 | |
| Sub-transfer agent expenses – Investor Class (See Note 5) | | | 3,525,493 | |
| Sub-transfer agent expenses – Institutional Class (See Note 5) | | | 757,847 | |
| Distribution fees – Investor Class (See Note 5) | | | 2,489,651 | |
| Administration, fund accounting, custody and transfer agent fees (See Note 5) | | | 2,458,888 | |
| Service fees – Investor Class (See Note 5) | | | 1,659,768 | |
| Reports to shareholders | | | 167,006 | |
| Federal and state registration fees | | | 87,945 | |
| Compliance expense (See Note 5) | | | 28,705 | |
| Trustees’ fees and expenses | | | 24,462 | |
| Legal fees | | | 23,373 | |
| Audit fees | | | 20,699 | |
| Other expenses | | | 159,980 | |
| Total expenses | | | 34,580,561 | |
| NET INVESTMENT LOSS | | $ | (9,635,486 | ) |
| | | | | |
| REALIZED AND UNREALIZED GAINS: | | | | |
| Net realized gain on: | | | | |
| Unaffiliated investments | | $ | 6,262,037 | |
| Affiliated investments | | | — | |
| Net change in unrealized appreciation on: | | | | |
| Unaffiliated investments | | | 386,216,032 | |
| Affiliated investments | | | 91,688,958 | |
| Net gain on investments | | | 484,167,027 | |
| NET INCREASE IN NET ASSETS RESULTING FROM OPERATIONS | | $ | 474,531,541 | |
(1) | Net of foreign taxes withheld of $440,469. |
The accompanying notes are an integral part of these financial statements.
| HENNESSY FUNDS | 1-800-966-4354 | |
(This Page Intentionally Left Blank.)
| STATEMENTS OF CHANGES IN NET ASSETS |
Financial Statements
| Statements of Changes in Net Assets |
| | Year Ended | | | Year Ended | |
| | | October 31, 2017 | | | October 31, 2016 | |
| OPERATIONS: | | | | | | |
| Net investment loss | | $ | (9,635,486 | ) | | $ | (12,447,242 | ) |
| Net realized gain (loss) on investments | | | 6,262,037 | | | | (5,426,283 | ) |
| Net change in unrealized appreciation on investments | | | 477,904,990 | | | | (13,249,337 | ) |
| Net increase (decrease) in net | | | | | | | | |
| assets resulting from operations | | | 474,531,541 | | | | (31,122,862 | ) |
| | | | | | | | | |
| DISTRIBUTIONS TO SHAREHOLDERS FROM: | | | | | | | | |
| Net realized gains – Investor Class | | | — | | | | (3,251,490 | ) |
| Net realized gains – Institutional Class | | | — | | | | (1,083,008 | ) |
| Total distributions | | | — | | | | (4,334,498 | ) |
| | | | | | | | | |
| CAPITAL SHARE TRANSACTIONS: | | | | | | | | |
| Proceeds from shares subscribed – Investor Class | | | 192,418,104 | | | | 443,753,342 | |
| Proceeds from shares subscribed – Institutional Class | | | 329,777,433 | | | | 408,969,650 | |
| Dividends reinvested – Investor Class | | | — | | | | 3,188,245 | |
| Dividends reinvested – Institutional Class | | | — | | | | 867,516 | |
| Cost of shares redeemed – Investor Class | | | (448,768,404 | ) | | | (402,722,784 | ) |
| Cost of shares redeemed – Institutional Class | | | (208,168,872 | ) | | | (161,483,885 | ) |
| Net increase (decrease) in net assets derived | | | | | | | | |
| from capital share transactions | | | (134,741,739 | ) | | | 292,572,084 | |
| TOTAL INCREASE IN NET ASSETS | | | 339,789,802 | | | | 257,114,724 | |
| | | | | | | | | |
| NET ASSETS: | | | | | | | | |
| Beginning of year | | | 2,392,531,488 | | | | 2,135,416,764 | |
| End of year | | $ | 2,732,321,290 | | | $ | 2,392,531,488 | |
| Undistributed net investment loss, end of year | | $ | (10,054,323 | ) | | $ | (10,118,034 | ) |
| | | | | | | | | |
| CHANGES IN SHARES OUTSTANDING: | | | | | | | | |
| Shares sold – Investor Class | | | 2,500,539 | | | | 6,346,130 | |
| Shares sold – Institutional Class | | | 4,162,013 | | | | 5,766,791 | |
| Shares issued to holders as reinvestment | | | | | | | | |
| of dividends – Investor Class | | | — | | | | 45,333 | |
| Shares issued to holders as reinvestment | | | | | | | | |
| of dividends – Institutional Class | | | — | | | | 12,111 | |
| Shares redeemed – Investor Class | | | (5,805,953 | ) | | | (5,815,084 | ) |
| Shares redeemed – Institutional Class | | | (2,633,695 | ) | | | (2,269,086 | ) |
| Net increase (decrease) in shares outstanding | | | (1,777,096 | ) | | | 4,086,195 | |
The accompanying notes are an integral part of these financial statements.
| HENNESSY FUNDS | 1-800-966-4354 | |
Financial Statements
For an Investor Class share outstanding throughout each year
PER SHARE DATA:
Net asset value, beginning of year
Income from investment operations:
Net investment income (loss)
Net realized and unrealized gains (losses) on investments
Total from investment operations
Less distributions:
Dividends from net investment income
Dividends from net realized gains
Total distributions
Paid-in capital from redemption fees
Net asset value, end of year
TOTAL RETURN
SUPPLEMENTAL DATA AND RATIOS:
Net assets, end of year (millions)
Ratio of expenses to average net assets
Ratio of net investment income (loss) to average net assets
Portfolio turnover rate(2)
(1) | Amount is less than $0.01. |
(2) | Portfolio turnover is calculated on the basis of the Fund as a whole. |
The accompanying notes are an integral part of these financial statements.
| FINANCIAL HIGHLIGHTS — INVESTOR CLASS |
| Year Ended October 31, | |
| 2017 | | | 2016 | | | 2015 | | | 2014 | | | 2013 | |
| | | | | | | | | | | | | | |
| $ | 70.63 | | | $ | 71.94 | | | $ | 69.46 | | | $ | 63.58 | | | $ | 51.78 | |
| | | | | | | | | | | | | | | | | | | |
| | | | | | | | | | | | | | | | | | | |
| | (0.51 | ) | | | (0.45 | ) | | | (0.33 | ) | | | 0.27 | | | | (0.32 | ) |
| | 14.80 | | | | (0.72 | ) | | | 8.07 | | | | 6.68 | | | | 16.44 | |
| | 14.29 | | | | (1.17 | ) | | | 7.74 | | | | 6.95 | | | | 16.12 | |
| | | | | | | | | | | | | | | | | | | |
| | | | | | | | | | | | | | | | | | | |
| | — | | | | — | | | | (0.02 | ) | | | — | | | | — | |
| | — | | | | (0.14 | ) | | | (5.24 | ) | | | (1.07 | ) | | | (4.32 | ) |
| | — | | | | (0.14 | ) | | | (5.26 | ) | | | (1.07 | ) | | | (4.32 | ) |
| | — | | | | — | | | | — | | | | 0.00 | (1) | | | 0.00 | (1) |
| $ | 84.92 | | | $ | 70.63 | | | $ | 71.94 | | | $ | 69.46 | | | $ | 63.58 | |
| | | | | | | | | | | | | | | | | | | |
| | 20.23 | % | | | (1.63 | )% | | | 11.83 | % | | | 11.05 | % | | | 33.54 | % |
| | | | | | | | | | | | | | | | | | | |
| | | | | | | | | | | | | | | | | | | |
| $ | 1,675.00 | | | $ | 1,626.71 | | | $ | 1,615.36 | | | $ | 1,213.03 | | | $ | 1,139.85 | |
| | 1.48 | % | | | 1.47 | % | | | 1.46 | % | | | 1.41 | % | | | 1.43 | % |
| | (0.51 | )% | | | (0.65 | )% | | | (0.55 | )% | | | 0.41 | % | | | (0.85 | )% |
| | 5 | % | | | 2 | % | | | 4 | % | | | 18 | % | | | 4 | % |
The accompanying notes are an integral part of these financial statements.
| HENNESSY FUNDS | 1-800-966-4354 | |
Financial Statements
For an Institutional Class share outstanding throughout each year
PER SHARE DATA:
Net asset value, beginning of year
Income from investment operations:
Net investment income (loss)
Net realized and unrealized gains (losses) on investments
Total from investment operations
Less distributions:
Dividends from net investment income
Dividends from net realized gains
Total distributions
Net asset value, end of year
TOTAL RETURN
SUPPLEMENTAL DATA AND RATIOS:
Net assets, end of year (millions)
Ratio of expenses to average net assets
Ratio of net investment income (loss) to average net assets
Portfolio turnover rate(1)
(1) | Portfolio turnover is calculated on the basis of the Fund as a whole. |
The accompanying notes are an integral part of these financial statements.
| FINANCIAL HIGHLIGHTS — INSTITUTIONAL CLASS |
| Year Ended October 31, | |
| 2017 | | | 2016 | | | 2015 | | | 2014 | | | 2013 | |
| | | | | | | | | | | | | | |
| $ | 72.17 | | | $ | 73.24 | | | $ | 70.50 | | | $ | 64.32 | | | $ | 52.19 | |
| | | | | | | | | | | | | | | | | | | |
| | | | | | | | | | | | | | | | | | | |
| | (0.11 | ) | | | (0.14 | ) | | | (0.08 | ) | | | 0.35 | | | | (0.13 | ) |
| | 15.04 | | | | (0.79 | ) | | | 8.19 | | | | 6.90 | | | | 16.58 | |
| | 14.93 | | | | (0.93 | ) | | | 8.11 | | | | 7.25 | | | | 16.45 | |
| | | | | | | | | | | | | | | | | | | |
| | | | | | | | | | | | | | | | | | | |
| | — | | | | — | | | | (0.05 | ) | | | — | | | | — | |
| | — | | | | (0.14 | ) | | | (5.32 | ) | | | (1.07 | ) | | | (4.32 | ) |
| | — | | | | (0.14 | ) | | | (5.37 | ) | | | (1.07 | ) | | | (4.32 | ) |
| $ | 87.10 | | | $ | 72.17 | | | $ | 73.24 | | | $ | 70.50 | | | $ | 64.32 | |
| | | | | | | | | | | | | | | | | | | |
| | 20.69 | % | | | (1.27 | )% | | | 12.23 | % | | | 11.40 | % | | | 33.94 | % |
| | | | | | | | | | | | | | | | | | | |
| | | | | | | | | | | | | | | | | | | |
| $ | 1,057.32 | | | $ | 765.82 | | | $ | 520.06 | | | $ | 283.31 | | | $ | 179.89 | |
| | 1.10 | % | | | 1.10 | % | | | 1.11 | % | | | 1.10 | % | | | 1.13 | % |
| | (0.13 | )% | | | (0.28 | )% | | | (0.19 | )% | | | 0.59 | % | | | (0.52 | )% |
| | 5 | % | | | 2 | % | | | 4 | % | | | 18 | % | | | 4 | % |
The accompanying notes are an integral part of these financial statements.
| HENNESSY FUNDS | 1-800-966-4354 | |
Financial Statements
Notes to the Financial Statements October 31, 2017 |
1). ORGANIZATION
The Hennessy Focus Fund (the “Fund”) is a series of Hennessy Funds Trust (the “Trust”), which was organized as a Delaware statutory trust on September 17, 1992. The Fund is an open-end management investment company registered under the Investment Company Act of 1940, as amended. The investment objective of the Fund is capital appreciation. The Fund is a non-diversified fund.
The Fund offers Investor Class and Institutional Class shares. Each class of shares differs principally in its respective 12b-1 distribution and service, shareholder servicing, and sub-transfer agent expenses. There are no sales charges. Each class has identical rights to earnings, assets, and voting privileges, except for class-specific expenses and exclusive rights to vote on matters affecting only an individual class.
As an investment company, the Fund follows the investment company accounting and reporting guidance of the Financial Accounting Standards Board (“FASB”) Accounting Standard Codification Topic 946 “Financial Services—Investment Companies.”
2). SIGNIFICANT ACCOUNTING POLICIES
The following is a summary of significant accounting policies consistently followed by the Fund in the preparation of the financial statements. These policies conform to U.S. generally accepted accounting principles (“GAAP”).
| a). | Investment Valuation – All investments in securities are recorded at their estimated fair value, as described in Note 3. |
| | |
| b). | Federal Income Taxes – No provision for federal income taxes or excise taxes has been made because the Fund has elected to be taxed as a “regulated investment company” and intends to distribute substantially all of its taxable income to its shareholders and otherwise comply with the provisions of the Internal Revenue Code of 1986, as amended, applicable to regulated investment companies. Net investment income/loss and realized gains/losses for federal income tax purposes may differ from those reported in the financial statements because of temporary book and tax basis differences. Temporary differences are primarily the result of the treatment of wash sales for tax reporting purposes. The Fund recognizes interest and penalties related to income tax benefits, if any, in the Statement of Operations as an income tax expense. Distributions from net realized gains for book purposes may include short-term capital gains, which are included as ordinary income to shareholders for tax purposes. The Fund may utilize equalization accounting for tax purposes and designate earnings and profits, including net realized gains distributed to shareholders on redemption of shares, as part of the dividends paid deduction for income tax purposes. |
| | Due to inherent differences in the recognition of income, expenses, and realized gains/losses under GAAP and federal income tax regulations, permanent differences between book and tax basis for reporting for fiscal year 2017 have been identified and appropriately reclassified in the Statement of Assets and Liabilities. The adjustments are as follows: |
| | Accumulated | Accumulated | | |
| | Net Investment | Net Realized | | |
| | Loss | Gain on Investments | Capital Stock | |
| | $9,699,197 | $— | $(9,699,197) | |
| NOTES TO THE FINANCIAL STATEMENTS |
| c). | Accounting for Uncertainty in Income Taxes – The Fund has accounting policies regarding recognition and measurement of tax positions taken or expected to be taken on a tax return. The tax returns of the Fund for the prior three fiscal years are open for examination. The Fund has reviewed all open tax years in major jurisdictions and concluded that there is no impact on the Fund’s net assets and no tax liability resulting from unrecognized tax benefits relating to uncertain income tax positions taken or expected to be taken on a tax return. The Fund’s major tax jurisdictions are U.S. federal and Delaware. |
| | |
| d). | Income and Expenses – Dividend income is recognized on the ex-dividend date or as soon as information is available to the Fund. Interest income, which includes the amortization of premium and accretion of discount, is recognized on an accrual basis. The Fund is charged for those expenses that are directly attributable to the portfolio, such as advisory, administration, and certain shareholder service fees. Income, expenses (other than expenses attributable to a specific class), and realized and unrealized gains/losses on investments are allocated to each class of shares based on such class’s net assets. |
| | |
| e). | Distributions to Shareholders – Dividends from net investment income for the Fund, if any, are declared and paid annually, usually in December. Distributions of net realized capital gains, if any, are declared and paid annually, usually in December. |
| | |
| f). | Security Transactions – Investment and shareholder transactions are recorded on the trade date. The Fund determines the realized gain/loss from an investment transaction by comparing the original cost of the security lot sold with the net sale proceeds. Discounts and premiums on securities purchased are accreted/amortized over the life of the respective security. |
| | |
| g). | Use of Estimates – The preparation of financial statements in conformity with GAAP requires management to make estimates and assumptions that affect the reported amounts of assets and liabilities and disclosure of contingent assets and liabilities at the date of the financial statements and the reported change in net assets during the reporting period. Actual results could differ from those estimates. |
| | |
| h). | Share Valuation – The net asset value (“NAV”) per share of the Fund is calculated by dividing (i) the sum of the value of the securities held by the Fund, plus cash or other assets, minus all liabilities (including estimated accrued expenses) by (ii) the total number of shares outstanding for the Fund, rounded to the nearest cent. The Fund’s shares will not be priced on days the New York Stock Exchange is closed for trading. The offering and redemption price per share for the Fund is equal to the Fund’s NAV per share. |
3). SECURITIES VALUATION
The Fund follows authoritative fair valuation accounting standards that establish an authoritative definition of fair value and set out a hierarchy for measuring fair value. These standards require additional disclosures about the various inputs and valuation techniques used to develop the measurements of fair value and a discussion of changes in valuation techniques and related inputs during the period. These inputs are summarized in the three broad levels listed below:
| | Level 1 – | Unadjusted, quoted prices in active markets for identical instruments that the Fund has the ability to access at the date of measurement. |
| | | |
| | Level 2 – | Other significant observable inputs (including, but not limited to, quoted prices in active markets for similar instruments, quoted prices in markets that are not active for identical or similar instruments, and model-derived |
| HENNESSY FUNDS | 1-800-966-4354 | |
| | | valuations in which all significant inputs and significant value drivers are observable in active markets, such as interest rates, prepayment speeds, credit risk curves, default rates, and similar data). |
| | | |
| | Level 3 – | Significant unobservable inputs (including the Fund’s own assumptions about what market participants would use to price the asset or liability based on the best available information) when observable inputs are unavailable. |
Following is a description of the valuation techniques applied to the Fund’s major categories of assets and liabilities measured at fair value on a recurring basis.
| | Equity Securities – Equity securities, including common stocks, preferred stocks, foreign-issued common stocks, exchange-traded funds, closed-end mutual funds, partnerships, rights, and real estate investment trusts, that are traded on a securities exchange for which a last-quoted sales price is readily available will generally be valued at the last sales price as reported by the primary exchange on which the securities are listed. Securities listed on The NASDAQ Stock Market (“NASDAQ”) will generally be valued at the NASDAQ Official Closing Price, which may differ from the last sales price reported. Securities traded on a securities exchange for which a last-quoted sales price is not readily available will generally be valued at the mean between the bid and ask prices. To the extent these securities are actively traded and valuation adjustments are not applied, they are classified in Level 1 of the fair value hierarchy. Securities traded on foreign exchanges generally are not valued at the same time the Fund calculates its NAV because most foreign markets close well before such time. The earlier close of most foreign markets gives rise to the possibility that significant events, including broad market moves, may have occurred in the interim. In certain circumstances, it may be determined that a security needs to be fair valued because it appears that the value of the security might have been materially affected by events occurring after the close of the market in which the security is principally traded, but before the time the Fund calculates its NAV, such as by a development that affects an entire market or region (e.g., weather-related events) or a potentially global development (e.g., a terrorist attack that may be expected to have an effect on investor expectations worldwide). |
| | |
| | Registered Investment Companies – Investments in registered investment companies (e.g., mutual funds) are generally priced at the ending NAV provided by the applicable registered investment company’s service agent and will be classified in Level 1 of the fair value hierarchy. |
| | |
| | Debt Securities – Debt securities, including corporate bonds, asset-backed securities, mortgage-backed securities, municipal bonds, U.S. Treasuries, and U.S. government agency issues, are generally valued at market on the basis of valuations furnished by an independent pricing service that utilizes both dealer-supplied valuations and formula-based techniques. The pricing service may consider recently executed transactions in securities of the issuer or comparable issuers, market price quotations (where observable), bond spreads, and fundamental data relating to the issuer. In addition, the model may incorporate observable market data, such as reported sales of similar securities, broker quotes, yields, bids, offers, and reference data. Certain securities are valued primarily using dealer quotations. These securities are generally classified in Level 2 of the fair value hierarchy. |
| | |
| | Short-Term Securities – Short-term equity investments, including money market funds, are valued in the manner specified above. Short-term debt investments with an original term to maturity of 60 days or less are valued at amortized cost, which approximates fair market value. If the original term to maturity of a short-term debt |
| NOTES TO THE FINANCIAL STATEMENTS |
| | investment exceeded 60 days, then the values as of the 61st day prior to maturity are amortized. Amortized cost is not used if its use would be inappropriate due to credit or other impairments of the issuer, in which case the security’s fair value would be determined, as described below. Short-term securities are generally classified in Level 1 or Level 2 of the fair market hierarchy depending on the inputs used and market activity levels for specific securities. |
The Board of Trustees of the Fund (the “Board”) has adopted fair value pricing procedures that are followed when a price for a security is not readily available or if a significant event has occurred that indicates the closing price of a security no longer represents the true value of that security. Fair value pricing determinations are made in good faith in accordance with these procedures. There are numerous criteria that will be given consideration in determining a fair value of a security, such as the trading volume of a security and markets, the values of other similar securities, and news events with direct bearing on a security or markets. Fair value pricing results in an estimated price for a security that reflects the amount the Fund might reasonably expect to receive in a current sale. Depending on the relative significance of the valuation inputs, these securities may be classified in either Level 2 or Level 3 of the fair value hierarchy.
The fair valuation of foreign securities may be determined with the assistance of a pricing service using correlations between the movement of prices of such securities and indices of domestic securities and other appropriate indicators, such as closing market prices of relevant American Depositary Receipts or futures contracts. The effect of using fair value pricing is that the Fund’s NAV will reflect the affected portfolio securities’ values as determined by the Board or its designee instead of being determined by the market. Using a fair value pricing methodology to price a foreign security may result in a value that is different from the foreign security’s most recent closing price and from the prices used by other investment companies to calculate their NAVs and are generally classified in Level 2 of the fair valuation hierarchy. Because the Fund may invest in foreign securities, the value of the Fund’s portfolio securities may change on days when you will not be able to purchase or redeem your shares.
The Board has delegated day-to-day valuation matters to a Valuation Committee comprised of one or more representatives from Hennessy Advisors, Inc., the Fund’s investment advisor (the “Advisor”). The function of the Valuation Committee is to value securities where current and reliable market quotations are not readily available. All actions taken by the Valuation Committee are reviewed by the Board.
The Fund has performed an analysis of all existing investments to determine the significance and character of all inputs to their fair value determination. Various inputs are used to determine the value of the Fund’s investments. The inputs or methodology used for valuing securities are not necessarily an indication of the risk associated with investing in those securities. Details related to the fair valuation hierarchy of the Fund’s securities as of October 31, 2017, are included in the Schedule of Investments.
4). INVESTMENT TRANSACTIONS
Purchases and sales of investment securities (excluding government and short-term investments) for the Fund during fiscal year 2017 were $143,830,698 and $106,749,898, respectively.
There were no purchases or sales/maturities of long-term U.S. government securities for the Fund during fiscal year 2017.
The Fund is permitted to purchase or sell securities from or to another fund in the Hennessy Funds family of funds (the “Hennessy Funds”) under specified conditions outlined in procedures adopted by the Board. The procedures have been designed to
| HENNESSY FUNDS | 1-800-966-4354 | |
ensure that any purchase or sale of securities by the Fund from or to another Hennessy Fund complies with Rule 17a-7 of the Investment Company Act of 1940, as amended. For fiscal year 2017, the Fund did not engage in purchases or sales of securities pursuant to Rule 17a-7 of the Investment Company Act of 1940, as amended.
5). INVESTMENT MANAGEMENT FEE AND OTHER TRANSACTIONS WITH AFFILIATES
The Advisor provides the Fund with investment management services under an Investment Advisory Agreement. The Advisor provides all investment advice, office space, and facilities, as well as most of the personnel needed by the Fund. As compensation for its services, the Advisor is entitled to a monthly fee from the Fund. The fee is based upon the average daily net assets of the Fund at an annual rate of 0.90%. The net investment advisory fees expensed by the Fund during fiscal year 2017 are included in the Statement of Operations.
The Advisor has delegated the day-to-day management of the Fund to a sub-advisor, Broad Run Investment Management, LLC. The Advisor pays the sub-advisory fees from its own assets, and these fees are not an additional expense of the Fund. For the most recent fiscal year, the Advisor (not the Fund) paid a sub-advisory fee, based upon the daily net assets of the Fund, at a rate of 0.29%.
The Board has approved a Shareholder Servicing Agreement for Investor Class shares of the Fund, which was instituted to compensate the Advisor for the non-investment management services it provides to the Fund. The Shareholder Servicing Agreement provides for a monthly fee paid to the Advisor at an annual rate of 0.10% of the average daily net assets of the Fund attributable to Investor Class shares. The shareholder service fees expensed by the Fund during fiscal year 2017 are included in the Statement of Operations.
The Fund has adopted a plan pursuant to Rule 12b-1 under the Investment Company Act of 1940, as amended, that authorizes payments in connection with the distribution of the Fund’s shares at an annual rate of up to 0.25% of the Fund’s average daily net assets attributable to Investor Class shares. Even though the authorized rate is up to 0.25%, the Fund is currently only using up to 0.15% of its average daily net assets attributable to Investor Class shares for such purpose. Amounts paid under the plan may be spent on any activities or expenses primarily intended to result in the sale of shares, including, but not limited to, advertising, shareholder account servicing, the printing and mailing of prospectuses to other than current shareholders, the printing and mailing of sales literature, and compensation for sales and marketing activities or to financial institutions and others, such as dealers and distributors. The distribution fees expensed by the Fund during fiscal year 2017 are included in the Statement of Operations.
The Fund has entered into agreements with various brokers, dealers, and financial intermediaries in connection with the sale of shares of the Fund. The agreements provide for periodic payments by the Fund to the brokers, dealers, and financial intermediaries for providing certain shareholder maintenance services (sub-transfer agent expenses). These shareholder services include the pre-processing and quality control of new accounts, shareholder correspondence, answering customer inquiries regarding account status, and facilitating shareholder telephone transactions. The sub-transfer agent fees expensed by the Fund during fiscal year 2017 are included in the Statement of Operations.
U.S. Bancorp Fund Services, LLC (“USBFS”) provides the Fund with administrative, fund accounting, and transfer agent services and necessary office equipment. As administrator, USBFS is responsible for activities such as (i) preparing various federal and state regulatory filings, reports, and returns for the Fund, (ii) preparing reports and materials to be supplied to the Board, (iii) monitoring the activities of the Fund’s custodian, transfer agent, and accountants, and (iv) coordinating the preparation and
| NOTES TO THE FINANCIAL STATEMENTS |
payment of the Fund’s expenses and reviewing the Fund’s expense accruals. U.S. Bank, N.A., an affiliate of USBFS, serves as the Fund’s custodian. The servicing agreements between the Trust, USBFS, and U.S. Bank N.A. contain a fee schedule that is inclusive of administrative, fund accounting, custody, and transfer agent fees. The administrative, fund accounting, custody, and transfer agent fees expensed by the Fund during fiscal year 2017 are included in the Statement of Operations.
Quasar Distributors, LLC acts as the Fund’s principal underwriter in a continuous public offering of the Fund’s shares. Quasar Distributors, LLC is an affiliate of USBFS and U.S. Bank, N.A.
The officers of the Fund are affiliated with the Advisor. Such officers, with the exception of the Chief Compliance Officer and the Senior Compliance Officer, receive no compensation from the Fund for serving in their respective roles. The Fund, along with the other Hennessy Funds, makes reimbursement payments, on an equal basis, to the Advisor for a portion of the salary and benefits associated with the office of the Chief Compliance Officer and for all of the salary and benefits associated with the office of the Senior Compliance Officer. The compliance fees expensed by the Fund during fiscal year 2017 are included in the Statement of Operations.
6). GUARANTEES AND INDEMNIFICATIONS
Under the Hennessy Funds’ organizational documents, their officers and trustees are indemnified by the Hennessy Funds against certain liabilities arising out of the performance of their duties to the Hennessy Funds. Additionally, in the normal course of business, the Hennessy Funds enter into contracts with service providers that contain general indemnification clauses. The Fund’s maximum exposure under these arrangements is unknown as this would involve future claims that may be made against the Fund that have not yet occurred. Currently, the Fund expects the risk of loss to be remote.
7). LINE OF CREDIT
The Fund has an uncommitted line of credit with the other Hennessy Funds in the amount of the lesser of (i) $100,000,000 or (ii) 33.33% of each Hennessy Fund’s net assets, or 30% for the Hennessy Gas Utility Fund and 10% for the Hennessy Balanced Fund, intended to provide short-term financing, if necessary, subject to certain restrictions, in connection with shareholder redemptions. The credit facility is with the Hennessy Funds’ custodian bank, U.S. Bank, N.A. Borrowings under this arrangement bear interest at the bank’s prime rate and are secured by all of the Fund’s assets (as to its own borrowings only). During fiscal year 2017, the Fund did not have any borrowings outstanding under the line of credit.
8). FEDERAL TAX INFORMATION
As of October 31, 2017, the components of accumulated earnings (losses) for income tax purposes were as follows:
| | | Investments | |
| Cost of investments for tax purposes | | $ | 1,447,856,078 | |
| Gross tax unrealized appreciation | | $ | 1,307,230,638 | |
| Gross tax unrealized depreciation | | | (23,529,785 | ) |
| Net tax unrealized appreciation | | $ | 1,283,700,853 | |
| Undistributed ordinary income | | $ | — | |
| Undistributed long-term capital gains | | | 171,040 | |
| Total distributable earnings | | $ | 171,040 | |
| Other accumulated loss | | $ | (10,054,323 | ) |
| Total accumulated gain | | $ | 1,273,817,570 | |
| HENNESSY FUNDS | 1-800-966-4354 | |
At October 31, 2017, the Fund had no tax basis capital losses to offset future capital gains.
During fiscal year 2017, the capital losses utilized for the Fund were $6,090,997.
At October 31, 2017, the Fund deferred, on a tax basis, a late-year ordinary loss of $10,054,323. Late-year ordinary losses are net ordinary losses incurred after December 31, 2016, but within the taxable year, that are deemed to arise on the first day of the Fund’s next taxable year.
During fiscal years 2017 and 2016, the tax character of distributions paid by the Fund was as follows:
| | | Year Ended | | | Year Ended | |
| | | October 31, 2017 | | | October 31, 2016 | |
Ordinary income(1) | | $ | — | | | $ | — | |
| Long-term capital gain | | | — | | | | 4,334,498 | |
| | | $ | — | | | $ | 4,334,498 | |
(1) Ordinary income includes short-term gain/loss.
9). EVENTS SUBSEQUENT TO YEAR END
Management has evaluated the Fund’s related events and transactions that occurred subsequent to October 31, 2017, through the date of issuance of the Fund’s financial statements. Other than as disclosed below, management has determined that there were no subsequent events requiring recognition or disclosure in the financial statements.
On December 7, 2017, capital gains were declared and paid to shareholders of record on December 6, 2017, as follows:
| | Long-term |
| Investor Class | $0.00534 |
| Institutional Class | $0.00549 |
| NOTES/REPORT OF INDEPENDENT REGISTERED PUBLIC ACCOUNTING FIRM |
Report of Independent Registered Public
Accounting Firm
To the Board of Trustees of Hennessy Funds Trust
and the Shareholders of the Hennessy Focus Fund
Novato, CA
We have audited the accompanying statement of assets and liabilities, including the schedule of investments, of the Hennessy Focus Fund (the “Fund”), a series of Hennessy Funds Trust (the “Trust”) as of October 31, 2017, and the related statement of operations for the year then ended, the statements of changes in net assets for each of the two years in the period then ended, and the financial highlights for each of the five years in the period then ended. These financial statements and financial highlights are the responsibility of the Fund’s management. Our responsibility is to express an opinion on these financial statements and financial highlights based on our audits.
We conducted our audits in accordance with the standards of the Public Company Accounting Oversight Board (United States). Those standards require that we plan and perform the audits to obtain reasonable assurance about whether the financial statements and financial highlights are free of material misstatement. The Fund is not required to have, nor were we engaged to perform, an audit of its internal control over financial reporting. Our audits included consideration of internal control over financial reporting as a basis for designing audit procedures that are appropriate in the circumstances, but not for the purposes of expressing an opinion on the effectiveness of the Fund’s internal control over financial reporting. Accordingly, we express no such opinion. An audit includes examining, on a test basis, evidence supporting the amounts and disclosures in the financial statements. Our procedures included confirmation of securities owned as of October 31, 2017, by correspondence with the custodian. An audit also includes assessing the accounting principles used and significant estimates made by management, as well as evaluating the overall financial statement presentation. We believe that our audits provide a reasonable basis for our opinion.
In our opinion, the financial statements and financial highlights referred to above present fairly, in all material respects, the financial position of the Hennessy Focus Fund as of October 31, 2017, the results of its operations for the year then ended, the changes in its net assets for each of the two years in the period then ended, and the financial highlights for each of the five years in the period then ended, in conformity with accounting principles generally accepted in the United States of America.
TAIT, WELLER & BAKER LLP
Philadelphia, Pennsylvania
December 22, 2017
| HENNESSY FUNDS | 1-800-966-4354 | |
Trustees and Officers of the Fund (Unaudited)
The business and affairs of the Funds are managed under the direction of the Board of Trustees of the Trust, and the Board of Trustees elects the Officers of the Trust. Beginning in March 2015, the Board of Trustees has from time to time appointed advisers to the Board of Trustees (“Advisers”), with the intention of having qualified individuals serve in an advisory capacity in order to garner experience in the mutual fund and asset management industry and be considered as potential Trustees in the future. There are currently three Advisers to the Board of Trustees: Brian Alexander, Doug Franklin, and Claire Knoles. As Advisers, Mr. Alexander, Mr. Franklin, and Ms. Knoles attend meetings of the Board and act as non-voting participants. Information pertaining to the Trustees, Advisers, and the Officers of the Trust is set forth below. The Trustees and Officers serve until their successors are duly elected and qualified or until their earlier death, resignation, or removal. Each of the Trustees oversees 14 Hennessy Funds. Unless otherwise indicated, the address of all persons listed below is 7250 Redwood Boulevard, Suite 200, Novato, CA 94945. The Fund’s Statement of Additional Information includes more information about the persons listed below and is available, without charge, upon request by calling 1-800-966-4354.
| | | | Other |
| | | | Directorships |
| | | | Held Outside |
| Name, (Year of Birth), | | | of Fund |
| and Position Held | Start Date | Principal Occupation(s) | Complex During |
with the Trust | of Service | During Past Five Years | Past Five Years(1) |
| |
| Disinterested Trustees and Advisers |
| | | | |
| J. Dennis DeSousa | January 1996 | Mr. DeSousa is a real estate investor. | None. |
| (1936) | | | |
| Trustee | | | |
| | | | |
| Robert T. Doyle | January 1996 | Mr. Doyle has been the Sheriff of | None. |
| (1947) | | Marin County, California since 1996. | |
| Trustee | | | |
| | | | |
| Gerald P. Richardson | May 2004 | Mr. Richardson is an independent | None. |
| (1945) | | consultant in the securities industry. | |
| Trustee | | | |
| | | | |
| Brian Alexander | March 2015 | Mr. Alexander has been employed | None. |
| (1981) | | by Sutter Health Novato Community | |
| Adviser to the Board | | Hospital since 2012, first as an | |
| | | Assistant Administrator and then, | |
| | | beginning in 2013, as the Chief | |
| | | Administrative Officer. From 2011 | |
| | | through 2012, Mr. Alexander was | |
| | | employed by Sutter Health West Bay | |
| | | Region as the Regional Director of | |
| | | Strategic Decision Support. | |
| TRUSTEES AND OFFICERS OF THE FUND |
| | | | Other |
| | | | Directorships |
| | | | Held Outside |
| Name, (Year of Birth), | | | of Fund |
| and Position Held | Start Date | Principal Occupation(s) | Complex During |
with the Trust | of Service | During Past Five Years | Past Five Years(1) |
| | | | |
| Doug Franklin | March 2016 | Mr. Franklin is a retired insurance | None. |
| (1964) | | industry executive. From 1987 | |
| Adviser to the Board | | through 2015, he was employed | |
| | | by Allianz-Fireman’s Fund Insurance | |
| | | Company in various positions, | |
| | | including Chief Actuary and | |
| | | Chief Risk Officer. | |
| | | | |
| Claire Knoles | December 2015 | Ms. Knoles is a founder of Kiosk and | None. |
| (1974) | | has served as its Chief Operating | |
| Adviser to the Board | | Officer since 2004. Kiosk is a full | |
| | | service marketing agency with | |
| | | offices in the San Francisco Bay | |
| | | Area, Toronto, and Liverpool, UK. | |
| | | | |
Interested Trustee(2) | | | |
| | | | |
| Neil J. Hennessy | January 1996 as | Mr. Hennessy has been employed by | Hennessy |
| (1956) | a Trustee and | Hennessy Advisors, Inc. since 1989 | Advisors, Inc. |
| Trustee, Chairman of | June 2008 as | and currently serves as its President, | |
| the Board, Chief | an Officer | Chairman and Chief Executive Officer. | |
| Investment Officer, | | | |
| Portfolio Manager, | | | |
| and President | | | |
| Name, (Year of Birth), | | |
| and Position Held | Start Date | Principal Occupation(s) |
with the Trust | of Service | During Past Five Years |
| | | |
| Officers | | |
| | | |
| Teresa M. Nilsen | January 1996 | Ms. Nilsen has been employed by Hennessy Advisors, Inc. |
| (1966) | | since 1989 and currently serves as its Executive Vice President, |
| Executive Vice President | | Chief Operations Officer, Chief Financial Officer, and Secretary. |
| and Treasurer | | |
| | | |
| Daniel B. Steadman | March 2000 | Mr. Steadman has been employed by Hennessy Advisors, Inc. |
| (1956) | | since 2000 and currently serves as its Executive Vice President |
| Executive Vice President | | and Chief Compliance Officer. |
| and Secretary | | |
| | | |
| Brian Carlson | December 2013 | Mr. Carlson has been employed by Hennessy Advisors, Inc. |
| (1972) | | since December 2013. Mr. Carlson was previously a co-founder |
| Senior Vice President and | | and principal of Trivium Consultants, LLC from February 2011 |
| Head of Distribution | | through November 2013. |
| | | |
| Jennifer Cheskiewicz | June 2013 | Ms. Cheskiewicz has been employed by Hennessy Advisors, Inc. |
| (1977) | | as its General Counsel since June 2013. She previously served |
| Senior Vice President and | | as in-house counsel to Carlson Capital, L.P., an SEC-registered |
| Chief Compliance Officer | | investment advisor to several private funds, from |
| | | February 2010 to May 2013. |
| HENNESSY FUNDS | 1-800-966-4354 | |
| Name, (Year of Birth), | | |
| and Position Held | Start Date | Principal Occupation(s) |
with the Trust | of Service | During Past Five Years |
| | | |
| David Ellison | October 2012 | Mr. Ellison has been employed by Hennessy Advisors, Inc. since |
(1958)(3) | | October 2012. He has served as a Portfolio Manager of the |
| Senior Vice President | | Hennessy Small Cap Financial Fund and the Hennessy Large |
| and Portfolio Manager | | Cap Financial Fund since inception. Mr. Ellison also served as a |
| | | Portfolio Manager of the Hennessy Technology Fund from its |
| | | inception until February 2017. Mr. Ellison served as Director, |
| | | CIO and President of FBR Fund Advisers, Inc. from |
| | | December 1999 to October 2012. |
| | | |
| Ryan Kelley | March 2013 | Mr. Kelley has been employed by Hennessy Advisors, Inc. since |
(1972)(4) | | October 2012. He has served as a Portfolio Manager of the |
| Vice President and | | Hennessy Gas Utility Fund, the Hennessy Small Cap Financial |
| Portfolio Manager | | Fund, and the Hennessy Large Cap Financial Fund since |
| | | October 2014. He served as Co-Portfolio Manager of the same |
| | | funds from March 2013 through September 2014, and as a |
| | | Portfolio Analyst for the Hennessy Funds from October 2012 |
| | | through October 2014. Mr. Kelley has also served as a Portfolio |
| | | Manager of the Hennessy Cornerstone Growth Fund, the |
| | | Hennessy Cornerstone Mid Cap 30 Fund, the Hennessy |
| | | Cornerstone Large Growth Fund, and the Hennessy |
| | | Cornerstone Value Fund and as a Co-Portfolio Manager of the |
| | | Hennessy Technology Fund since February 2017. Mr. Kelley |
| | | served as Portfolio Manager of FBR Fund Advisers, Inc. from |
| | | January 2008 to October 2012. |
| | | |
| Brian Peery | March 2003 as | Mr. Peery has been employed by Hennessy Advisors, Inc. since |
| (1969) | an Officer and | 2002. He has served as a Portfolio Manager of the Hennessy |
| Senior Vice President | February 2011 | Cornerstone Growth Fund, the Hennessy Cornerstone Mid Cap |
| and Portfolio Manager | as a Co-Portfolio | 30 Fund, the Hennessy Cornerstone Large Growth Fund, the |
| | Manager or | Hennessy Cornerstone Value Fund, the Hennessy Total Return |
| | Portfolio Manager | Fund, and the Hennessy Balanced Fund since October 2014. |
| | | He served as Co-Portfolio Manager of the same funds from |
| | | February 2011 through September 2014. Mr. Peery has also |
| | | served as a Portfolio Manager of the Hennessy Gas Utility Fund |
| | | since February 2015 and as Lead Portfolio Manager of the |
| | | Hennessy Technology Fund since February 2017. |
| | | |
| Daniel P. Hennessy | December 2016 | Mr. Daniel Hennessy has been employed by Hennessy Advisors, |
| (1990) | | Inc. since 2015. He has served as an Associate Analyst of the |
| Assistant Vice President | | Hennessy Technology Fund since February 2017. He previously |
| and Associate Analyst | | served as a Mutual Fund Specialist at U.S. Bancorp Fund |
| | | Services, LLC from November 2014 to July 2015. Prior to that, |
| | | he attended the University of San Diego, where he earned a |
| | | degree in Political Science. |
(1) | Messrs. DeSousa, Doyle, Hennessy, and Richardson previously served on the Board of Directors of Hennessy Mutual Funds, Inc. (“HMFI”), The Hennessy Funds, Inc. (“HFI”), and Hennessy SPARX Funds Trust (“HSFT”). Pursuant to an internal reorganization effective as of February 28, 2014, the series of HFMI, HFI, and HSFT were reorganized into corresponding series of Hennessy Funds Trust that mirrored them. Subsequent to the reorganization, HFMI, HFI, and HSFT were dissolved. |
(2) | Mr. Hennessy is considered an “interested person,” as defined in the Investment Company Act of 1940, as amended, because he is an officer of the Hennessy Funds. |
(3) | The address of this officer is 101 Federal Street, Suite 1900, Boston, MA 02110. |
(4) | The address of this officer is 1340 Environ Way, Chapel Hill, NC 27517. |
| TRUSTEES AND OFFICERS OF THE FUND |
(This Page Intentionally Left Blank.)
| HENNESSY FUNDS | 1-800-966-4354 | |
Expense Example (Unaudited)
October 31, 2017
As a shareholder of the Fund, you incur two types of costs: (1) transaction costs, including sales charges (loads) on purchase payments, reinvested dividends, or other distributions, redemption fees, and exchange fees; and (2) ongoing costs, including management fees, service fees, and other Fund expenses. This Example is intended to help you understand your ongoing costs (in dollars) of investing in the Fund and to compare these costs with the ongoing costs of investing in other mutual funds. The Example is based on an investment of $1,000 invested at the beginning of the period and held for the entire period from May 1, 2017, through October 31, 2017.
Actual Expenses
The first line of the table below under the “Investor Class” and “Institutional Class” headings provides information about actual account values and actual expenses. Although the Fund charges no sales loads or transaction fees, you will be assessed fees for outgoing wire transfers, returned checks and stop payment orders at prevailing rates charged by U.S. Bancorp Fund Services, LLC, the Fund’s transfer agent. If you request that a redemption be made by wire transfer, currently a $15 fee is charged by the Fund’s transfer agent. IRA accounts will be charged a $15 annual maintenance fee. The example below includes, but is not limited to, management fees, shareholder servicing fees, fund accounting, custody, and transfer agent fees. However, the example below does not include portfolio trading commissions and related expenses, and other extraordinary expenses as determined under generally accepted accounting principles. You may use the information in this line, together with the amount you invested, to estimate the expenses that you paid over the period. Simply divide your account value by $1,000 (for example, an $8,600 account value divided by $1,000 = 8.6), then multiply the result by the number in the first line of the table under the “Investor Class” or “Institutional Class” headings in the column entitled “Expenses Paid During Period” to estimate the expenses you paid on your account during this period.
Hypothetical Example for Comparison Purposes
The second line of the table below under the “Investor Class” and “Institutional Class” headings provides information about hypothetical account values and hypothetical expenses based on the Fund’s actual expense ratios and an assumed rate of return of 5% per year before expenses, which is not the Fund’s actual return. The hypothetical account values and expenses may not be used to estimate the actual ending account balance or expenses you paid for the period. You may use this information to compare the ongoing costs of investing in the Fund and other funds. To do so, compare this 5% hypothetical example with the 5% hypothetical examples that appear in the shareholder reports of the other funds. Please note that the expenses shown in the table are meant to highlight your ongoing costs only and do not reflect any transactional costs, such as sales charges (loads), or exchange fees. Therefore, the second line of the table under the “Investor Class” and “Institutional Class” headings is useful in comparing ongoing costs only, and will not help you determine the relative total costs of owning different funds. In addition, if these transactional costs were included, your costs would have been higher.
| | | | | | | | | Expenses Paid | |
| | | Beginning | | | Ending | | | During Period(1) | |
| | | Account Value | | | Account Value | | | May 1, 2017 – | |
| | | May 1, 2017 | | | October 31, 2017 | | | October 31, 2017 | |
| Investor Class | | | | | | | | | |
| Actual | | $ | 1,000.00 | | | $ | 1,097.70 | | | $ | 7.72 | |
| Hypothetical (5% return before expenses) | | $ | 1,000.00 | | | $ | 1,017.85 | | | $ | 7.43 | |
| | | | | | | | | | | | | |
| Institutional Class | | | | | | | | | | | | |
| Actual | | $ | 1,000.00 | | | $ | 1,099.70 | | | $ | 5.82 | |
| Hypothetical (5% return before expenses) | | $ | 1,000.00 | | | $ | 1,019.66 | | | $ | 5.60 | |
(1) | Expenses are equal to the Fund’s annualized expense ratio of 1.46% for Investor Class shares or 1.10% for Institutional Class shares, as applicable, multiplied by the average account value over the period, multiplied by 184/365 days (to reflect one-half year period). |
| HENNESSY FUNDS | 1-800-966-4354 | |
How to Obtain a Copy of the Fund’s
Proxy Voting Policy and Proxy Voting Records
A description of the policies and procedures the Fund uses to determine how to vote proxies relating to portfolio securities is available without charge: (1) by calling 1-800-966-4354; (2) on the Hennessy Funds’ website at hennessyfunds.com/proxy-voting/policy.fs; or (3) on the U.S. Securities and Exchange Commission’s (the “SEC”) website at www.sec.gov. The Fund’s proxy voting record is available without charge on both the Hennessy Funds’ website at hennessyfunds.com/proxy-voting/vote.fs and the SEC’s website at www.sec.gov no later than August 31 for the prior 12 months ending June 30.
Quarterly Filings on Form N-Q
The Fund files a complete schedule of portfolio holdings with the SEC for the first and third quarters of each fiscal year on Form N-Q. The Fund’s Forms N-Q are made available on the SEC’s website at www.sec.gov. The Fund’s Forms N-Q may be reviewed and copied at the SEC’s Public Reference Room in Washington, DC, and information on the operation of the Public Reference Room may be obtained by calling 1-800-SEC-0330. Information included in the Fund’s Forms N-Q will also be available upon request by calling 1-800-966-4354.
Householding
To help keep the Fund’s costs as low as possible, we generally deliver a single copy of most financial reports and prospectuses to shareholders who share an address, even if the accounts are registered under different names. This process, known as “householding,” does not apply to account statements. You may request an individual copy of a prospectus or financial report at any time. If you would like to receive separate mailings, please call U.S. Bancorp Fund Services, LLC at 1-800-261-6950 or 1-414-765-4124 and we will begin individual delivery within 30 days of your request. If your account is held through a financial institution or other intermediary, please contact them directly to request individual delivery.
| PROXY VOTING — PRIVACY POLICY |
Privacy Policy
We collect the following non-public personal information about you:
| | • | information we receive from you on or in applications or other forms, correspondence, or conversations, including, but not limited to, your name, address, phone number, social security number, assets, income, and date of birth; and |
| | • | information about your transactions with us, our affiliates, or others, including, but not limited to, your account number and balance, payment history, parties to transactions, cost basis information, and other financial information. |
We do not disclose any non-public personal information about our current or former shareholders to non-affiliated third parties, except as permitted by law. For example, we are permitted by law to disclose all of the information we collect, as described above, to our Transfer Agent to process your transactions. Furthermore, we restrict access to your non-public personal information to those persons who require such information to provide products or services to you. We maintain physical, electronic, and procedural safeguards that comply with federal standards to guard your non-public personal information.
In the event that you hold shares of the Fund through a financial intermediary, including, but not limited to, a broker-dealer, bank, or trust company, the privacy policy of your financial intermediary would govern how your non-public personal information will be shared with non-affiliated third parties.
| HENNESSY FUNDS | 1-800-966-4354 | |
(This Page Intentionally Left Blank.)
For information, questions or assistance, please call
The Hennessy Funds
1-800-966-4354 or 1-415-899-1555
INVESTMENT ADVISOR
Hennessy Advisors, Inc.
7250 Redwood Boulevard, Suite 200
Novato, California 94945
ADMINISTRATOR,
TRANSFER AGENT,
DIVIDEND PAYING AGENT &
SHAREHOLDER SERVICING AGENT
U.S. Bancorp Fund Services, LLC
P.O. Box 701
Milwaukee, Wisconsin 53201-0701
CUSTODIAN
U.S. Bank N.A.
Custody Operations
1555 North River Center Drive, Suite 302
Milwaukee, Wisconsin 53212
TRUSTEES
Neil J. Hennessy
Robert T. Doyle
J. Dennis DeSousa
Gerald P. Richardson
COUNSEL
Foley & Lardner LLP
777 East Wisconsin Avenue
Milwaukee, Wisconsin 53202-5306
INDEPENDENT REGISTERED
PUBLIC ACCOUNTING FIRM
Tait, Weller & Baker LLP
1818 Market Street, Suite 2400
Philadelphia, Pennsylvania 19103
DISTRIBUTOR
Quasar Distributors, LLC
777 East Wisconsin Avenue
Milwaukee, Wisconsin 53202
hennessyfunds.com | 1-800-966-4354
This report has been prepared for shareholders and may be distributed to
others only if preceded or accompanied by a current prospectus.
ANNUAL REPORT
OCTOBER 31, 2017
HENNESSY CORNERSTONE
MID CAP 30 FUND
Investor Class HFMDX
Institutional Class HIMDX
hennessyfunds.com | 1-800-966-4354
(This Page Intentionally Left Blank.)
Contents
| Letter to Shareholders | 2 |
| Performance Overview | 4 |
| Financial Statements | |
| Schedule of Investments | 7 |
| Statement of Assets and Liabilities | 11 |
| Statement of Operations | 12 |
| Statements of Changes in Net Assets | 13 |
| Financial Highlights | 14 |
| Notes to the Financial Statements | 18 |
| Report of Independent Registered Public Accounting Firm | 26 |
| Trustees and Officers of the Fund | 27 |
| Expense Example | 30 |
| Proxy Voting Policy and Proxy Voting Records | 32 |
| Quarterly Schedule of Investments | 32 |
| Federal Tax Distribution Information | 32 |
| Householding | 32 |
| Privacy Policy | 33 |
| HENNESSY FUNDS | 1-800-966-4354 | |
December 2017
Dear Hennessy Funds Shareholder:
Over the past year, global equity markets have made strong advances, fueled by continued, broad-based economic growth in most countries and regions, and in spite of a somewhat unsettling geopolitical backdrop.
U.S. stocks performed well in the first year of the new administration in Washington, and, ignoring the debate and the bluster, investors have continued to focus on what concerns them the most – tax reform, deregulation, and the hope of an increase in infrastructure spending. As we move into the final weeks of the calendar year, with the major indices reaching new highs, I find myself envisioning the Dow Jones Industrial Average building momentum toward 30,000.
Over the past 12 months, the U.S. economy has continued to grow at a steady rate of almost 2.5% on an annualized basis, as measured by GDP. Companies have added over 170,000 jobs per month on average over the past year, and the current unemployment rate of 4.1% is the lowest in 17 years. Consumer confidence is high and still rising, and corporate profits are at all-time highs. The Federal Reserve has been increasing interest rates, but at a gradual pace. The bond market has also continued to support the equity market and equity market valuations. Since December of last year, long bond yields have stayed within a narrow band, with the 10-year U.S. Treasury yield hovering in the 2.0% to 2.5% range, and remain low compared to historical averages. In my opinion, long bond yields have stayed low despite three increases in the Federal Funds rate over the last 12 months in part due to persistent low inflation.
Meanwhile, the prospective price-to-earnings multiples for the Dow Jones Industrial Average and S&P 500 Index are just above long-term averages at 19.5x and 19.9x, respectively. I believe these levels of stock valuation, while higher than a year ago, are still very reasonable. At the peak of the technology/dot-com bubble, U.S. equities sold at much higher multiples across the board than they do today, and bond yields were also much higher. In June of 1999, the Dow Jones Industrial Average sold at 28x earnings and the 10-year bond yield was close to 6%. Today, the Dow is selling at under 20x earnings and is offering a 2.2% dividend yield, on par with the yield of the 10-year government bond at 2.4%.
Equity markets in the U.S. have been rising for almost nine years, and financial media reports have speculated that this bull run will come to end, but why? I see no substantial reasons or indicators that a major correction is on the horizon. I remain confident that this bull market has room to run. Overall, investment fundamentals are strong. Corporate earnings are growing at a healthy rate, and companies are generating excess cash flow. Cash continues to build on corporate balance sheets, with $5.2 trillion in cash and short term investments among the S&P 500 Index companies as of October 31, 2017. If our government leaders can pass a meaningful tax reform bill and continue efforts toward regulatory relief, it could be icing on the cake for equities.
There have been, and will likely continue to be, downturns throughout this extended bull market. Since 2010, there have been 18 downturns in the market, 14 of which were between 5% and 10% and four of which were corrections of between 10% and 20%. Yet the market has bounced back following each pullback and then has moved higher. A correction is not the end of the bull market. What might signal that we are at the end of this bull market? Euphoria. And I still see no signs of euphoria in this market. In the past,
I have likened the current bull market to that of 1982-2000, and I am confident in the strength of the market today and believe the economy will continue its slow, but steady, growth into the coming year.
Thank you for your continued confidence and investment in our funds. If you have any questions or would like to speak with us directly, please don’t hesitate to call us at (800) 966-4354.
Best regards,
Neil J. Hennessy
President and Chief Investment Officer
Past performance does not guarantee future results.
Mutual fund investing involves risk. Principal loss is possible.
Opinions expressed are those of Neil Hennessy and are subject to change, are not guaranteed, and should not be considered investment advice.
The Dow Jones Industrial Average and S&P 500 Index are unmanaged indices commonly used to measure the performance of U.S. stocks. One cannot invest directly in an index.
Price to earnings is calculated by dividing a company’s market price per share by its earnings per share. Dividend yield is calculated as the annual dividends paid by a company divided by the price of a share of its stock. Cash flow provides an indication of a company’s financial strength and represents earnings before depreciation, amortization, and non-cash charges.
| HENNESSY FUNDS | 1-800-966-4354 | |
Performance Overview (Unaudited)
CHANGE IN VALUE OF $10,000 INVESTMENT
This graph illustrates the performance of an initial investment of $10,000 made in the Fund ten years ago and assumes the reinvestment of dividends.
AVERAGE ANNUAL TOTAL RETURN FOR PERIODS ENDED OCTOBER 31, 2017
| | One | Five | Ten |
| | Year | Years | Years |
| Hennessy Cornerstone Mid Cap 30 Fund – | | | |
| Investor Class (HFMDX) | 23.02% | 13.44% | 8.58% |
| Hennessy Cornerstone Mid Cap 30 Fund – | | | |
Institutional Class (HIMDX)(1) | 23.47% | 13.79% | 8.95% |
Russell Midcap® Index | 21.09% | 14.87% | 8.09% |
| S&P 500 Index | 23.63% | 15.18% | 7.51% |
Expense ratios: 1.35% (Investor Class); 0.97% (Institutional Class)
(1) | The inception date of Institutional Class shares is March 3, 2008. Performance shown prior to the inception of Institutional Class shares reflects the performance of Investor Class shares and includes expenses that are not applicable to, and are higher than, those of Institutional Class shares. |
Performance data quoted represents past performance; past performance does not guarantee future results. The investment return and principal value of an investment will fluctuate so that an investor’s shares, when redeemed, may be worth more or less than their original cost. The performance table does not reflect the deduction of taxes that a shareholder would pay on Fund distributions or the redemption of Fund shares. Current performance of the Fund may be lower or higher than the performance quoted. Performance data current to the most recent month end may be obtained by visiting hennessyfunds.com.
The Russell Midcap® Index is an index commonly used to measure the performance of U.S. medium-capitalization stocks. The S&P 500 Index is an unmanaged index commonly used to measure the performance of U.S. stocks. One cannot invest directly in an index.
Frank Russell Company (“Russell”) is the source and owner of the trademarks, service marks, and copyrights related to the Russell Indexes. Russell® is a trademark of Frank Russell Company. Neither Russell nor its licensors accept any liability for any errors or omissions in the Russell Indexes or Russell ratings or underlying data and no party may rely on any Russell Indexes or Russell ratings or underlying data contained in this communication. No further distribution of Russell data is permitted without Russell’s
express written consent. Russell does not promote, sponsor, or endorse the content of this communication.
The expense ratios presented are from the most recent prospectus. The expense ratios for the current reporting period are available in the Financial Highlights section of this report.
PERFORMANCE NARRATIVE
Portfolio Managers Neil J. Hennessy, Brian E. Peery, and Ryan C. Kelley
Performance:
For the 12-month period ended October 31, 2017, the Investor Class of the Hennessy Cornerstone Mid Cap 30 Fund returned 23.02%, outperforming the Russell Midcap® Index, which returned 21.09%, but slightly underperforming the S&P 500 Index, which returned 23.63%, for the same period.
The Fund’s outperformance relative to its primary benchmark index, the Russell Midcap® Index, was due to stock selection and an overweight position in the Industrials sector. The Brink’s Company, Navistar International, and Kennametal, Inc., each contributed significantly to the Fund’s relative outperformance over the period. Price weakness in three other investments, NCR Corporation, Foot Locker, Inc., and Brinker Intl., were among the largest negative contributors to Fund performance. The Fund no longer holds any of the companies mentioned with the exception of The Brink’s Company.
Portfolio Strategy:
The Fund seeks long-term growth of capital by investing in 30 mid-cap growth-oriented companies, screening for undervalued stocks with above-average growth potential. The Fund employs a strict price-to-sales ratio limit of 1.5, resulting in the Fund investing in what we deem to be reasonably valued stocks. We believe that limiting the Fund to 30 stocks produces a relatively concentrated portfolio, where individual stock performance can influence the performance of the portfolio as a whole, while at the same time providing what we consider to be ample diversification.
Investment Commentary:
We continue to believe that there are good investment opportunities among mid-cap stocks. Many investors gravitated away from smaller stocks last year as they sought safety in larger, more well-established businesses in a year of much political uncertainty. Many of these smaller companies have purely domestic businesses, which are benefiting from steady, albeit slow, economic growth at home, low inflation, and low energy prices. Smaller companies could also be the primary beneficiaries of a cut in corporate taxes because many have predominantly domestic operations, which offer little scope for sheltering taxes, and are paying taxes near their effective rate of 35%. If a reduction in corporate taxes is included in a successful tax reform bill over the next year, we would expect the mid-sized, domestically oriented stocks to react positively. As a result of the tight labor market in the United States, we are finally starting to see wages rise, leading to better growth in personal incomes. Meanwhile, the economy continues to grow steadily, with GDP growth reported at 3.0% in the third quarter of 2017. Revenue growth for smaller companies has been robust over the last 12 months. Overall, we believe current economic conditions provide a good environment for domestically oriented, mid-cap stocks. We remain pleased with the positioning of the portfolio, which remains
| HENNESSY FUNDS | 1-800-966-4354 | |
overweight in cyclical stocks, such as those in the Industrials and Consumer Discretionary sectors, and underweight in more defensive sectors like Utilities.
Opinions expressed are those of the Portfolio Managers as of the date written and are subject to change, are not guaranteed, and should not be considered investment advice or an indication of trading intent.
The Russell Midcap® Index is an index commonly used to measure the performance of U.S. medium-capitalization stocks. The S&P 500 Index is an unmanaged index commonly used to measure the performance of U.S. stocks. One cannot invest directly in an index.
The Fund invests in small- and medium-capitalization companies, which may have limited liquidity and greater price volatility than large-capitalization companies. The Fund’s formula-based strategy may cause the Fund to buy or sell securities at times when it may not be advantageous. Please see the Fund’s prospectus for a more complete discussion of these and other risks.
References to specific securities should not be considered a recommendation to buy or sell any security. Fund holdings and sector allocations are subject to change. Please refer to the Schedule of Investments included in this report for additional portfolio information.
Diversification does not assure a profit or protect against loss in a declining market. Price-to-sales ratio is a tool for calculating a stock’s valuation relative to other companies. It is calculated by dividing a company’s market price per share by its revenue per share.
| PERFORMANCE OVERVIEW/SCHEDULE OF INVESTMENTS |
Financial Statements
Schedule of Investments as of October 31, 2017 |
HENNESSY CORNERSTONE MID CAP 30 FUND
(% of Net Assets)
| TOP TEN HOLDINGS (EXCLUDING CASH/CASH EQUIVALENTS) | | % NET ASSETS |
| The Brink’s Co. | | | 5.34 | % |
| Navistar International Corp. | | | 5.26 | % |
| ON Semiconductor Corp. | | | 5.06 | % |
| WellCare Health Plans, Inc. | | | 4.83 | % |
| Thor Industries, Inc. | | | 4.76 | % |
| CDW Corporation of Delaware | | | 4.32 | % |
| Kennametal, Inc. | | | 4.27 | % |
| Unum Group | | | 4.08 | % |
| CACI International, Inc., Class A | | | 4.07 | % |
| Packaging Corporation of America | | | 3.91 | % |
Note: For presentation purposes, the Fund has grouped some of the industry categories. For purposes of categorizing securities for compliance with Section 8(b)(1) of the Investment Company Act of 1940, as amended, the Fund uses more specific industry classifications.
| HENNESSY FUNDS | 1-800-966-4354 | |
| COMMON STOCKS – 98.76% | | Number | | | | | | % of | |
| | | of Shares | | | Value | | | Net Assets | |
| Consumer Discretionary – 18.65% | | | | | | | | | |
| Aramark | | | 723,500 | | | $ | 31,609,715 | | | | 3.26 | % |
| Brinker International, Inc. | | | 547,000 | | | | 16,803,840 | | | | 1.73 | % |
| Foot Locker, Inc. | | | 403,400 | | | | 12,134,272 | | | | 1.25 | % |
| PVH Corp. | | | 251,800 | | | | 31,930,758 | | | | 3.29 | % |
| The Cheesecake Factory, Inc. | | | 506,400 | | | | 22,656,336 | | | | 2.33 | % |
| Thor Industries, Inc. | | | 339,600 | | | | 46,260,312 | | | | 4.76 | % |
| Urban Outfitters, Inc. (a) | | | 805,200 | | | | 19,743,504 | | | | 2.03 | % |
| | | | | | | | 181,138,737 | | | | 18.65 | % |
| | | | | | | | | | | | | |
| Financials – 4.08% | | | | | | | | | | | | |
| Unum Group | | | 760,900 | | | | 39,597,236 | | | | 4.08 | % |
| | | | | | | | | | | | | |
| Health Care – 4.83% | | | | | | | | | | | | |
| WellCare Health Plans, Inc. (a) | | | 237,300 | | | | 46,923,702 | | | | 4.83 | % |
| | | | | | | | | | | | | |
| Industrials – 25.51% | | | | | | | | | | | | |
| Crane Co. | | | 396,000 | | | | 32,915,520 | | | | 3.39 | % |
| EMCOR Group, Inc. | | | 445,500 | | | | 35,867,205 | | | | 3.69 | % |
| Kennametal, Inc. | | | 951,400 | | | | 41,528,610 | | | | 4.27 | % |
| Navistar International Corp. (a) | | | 1,207,868 | | | | 51,104,895 | | | | 5.26 | % |
| The Brink’s Co. | | | 681,065 | | | | 51,829,046 | | | | 5.34 | % |
| UniFirst Corp. | | | 219,831 | | | | 34,623,383 | | | | 3.56 | % |
| | | | | | | | 247,868,659 | | | | 25.51 | % |
| | | | | | | | | | | | | |
| Information Technology – 29.20% | | | | | | | | | | | | |
| CACI International, Inc., Class A (a) | | | 275,269 | | | | 39,569,919 | | | | 4.07 | % |
| CDW Corporation of Delaware | | | 599,700 | | | | 41,979,000 | | | | 4.32 | % |
| NCR Corp. (a) | | | 768,500 | | | | 24,661,165 | | | | 2.54 | % |
| ON Semiconductor Corp. (a) | | | 2,308,000 | | | | 49,206,560 | | | | 5.06 | % |
| Sanmina Corp. (a) | | | 974,163 | | | | 31,879,484 | | | | 3.28 | % |
| Science Applications International Corp. | | | 390,900 | | | | 28,668,606 | | | | 2.95 | % |
| SYNNEX Corp. | | | 262,700 | | | | 35,432,976 | | | | 3.65 | % |
| TTM Technologies , Inc. (a) | | | 2,048,300 | | | | 32,322,174 | | | | 3.33 | % |
| | | | | | | | 283,719,884 | | | | 29.20 | % |
| | | | | | | | | | | | | |
| Materials – 13.60% | | | | | | | | | | | | |
| Berry Plastics Group, Inc. (a) | | | 615,700 | | | | 36,603,365 | | | | 3.77 | % |
| Cabot Corp. | | | 516,589 | | | | 31,491,266 | | | | 3.24 | % |
| Packaging Corporation of America | | | 326,500 | | | | 37,962,155 | | | | 3.91 | % |
The accompanying notes are an integral part of these financial statements.
| COMMON STOCKS | | Number | | | | | | % of | |
| | | of Shares | | | Value | | | Net Assets | |
| Materials (Continued) | | | | | | | | | |
| Worthington Industries, Inc. | | | 573,100 | | | $ | 26,076,050 | | | | 2.68 | % |
| | | | | | | | 132,132,836 | | | | 13.60 | % |
| | | | | | | | | | | | | |
| Utilities – 2.89% | | | | | | | | | | | | |
| MDU Resources Group, Inc. | | | 1,027,700 | | | | 28,107,595 | | | | 2.89 | % |
| | | | | | | | | | | | | |
| Total Common Stocks | | | | | | | | | | | | |
| (Cost $780,221,626) | | | | | | | 959,488,649 | | | | 98.76 | % |
| | | | | | | | | | | | | |
| SHORT-TERM INVESTMENTS – 0.84% | | | | | | | | | | | | |
| | | | | | | | | | | | | |
| Money Market Funds – 0.84% | | | | | | | | | | | | |
| Fidelity Government Portfolio, Institutional Class, 0.92% (b) | | | 8,209,214 | | | | 8,209,214 | | | | 0.84 | % |
| | | | | | | | | | | | | |
| Total Short-Term Investments | | | | | | | | | | | | |
| (Cost $8,209,214) | | | | | | | 8,209,214 | | | | 0.84 | % |
| | | | | | | | | | | | | |
| Total Investments | | | | | | | | | | | | |
| (Cost $788,430,840) – 99.60% | | | | | | | 967,697,863 | | | | 99.60 | % |
| Other Assets in Excess of Liabilities – 0.40% | | | | | | | 3,846,692 | | | | 0.40 | % |
TOTAL NET ASSETS – 100.00% | | | | | | $ | 971,544,555 | | | | 100.00 | % |
Percentages are stated as a percent of net assets.
| (a) | Non-income producing security. |
| (b) | The rate listed is the fund’s 7-day yield as of October 31, 2017. |
The accompanying notes are an integral part of these financial statements.
| HENNESSY FUNDS | 1-800-966-4354 | |
Summary of Fair Value Exposure at October 31, 2017
The following is a summary of the inputs used to value the Fund’s net assets as of October 31, 2017 (See Note 3 in the accompanying notes to the financial statements):
| Common Stocks | | Level 1 | | | Level 2 | | | Level 3 | | | Total | |
| Consumer Discretionary | | $ | 181,138,737 | | | $ | — | | | $ | — | | | $ | 181,138,737 | |
| Financials | | | 39,597,236 | | | | — | | | | — | | | | 39,597,236 | |
| Health Care | | | 46,923,702 | | | | — | | | | — | | | | 46,923,702 | |
| Industrials | | | 247,868,659 | | | | — | | | | — | | | | 247,868,659 | |
| Information Technology | | | 283,719,884 | | | | — | | | | — | | | | 283,719,884 | |
| Materials | | | 132,132,836 | | | | — | | | | — | | | | 132,132,836 | |
| Utilities | | | 28,107,595 | | | | — | | | | — | | | | 28,107,595 | |
| Total Common Stocks | | $ | 959,488,649 | | | $ | — | | | $ | — | | | $ | 959,488,649 | |
| Short-Term Investments | | | | | | | | | | | | | | | | |
| Money Market Funds | | $ | 8,209,214 | | | $ | — | | | $ | — | | | $ | 8,209,214 | |
| Total Short-Term Investments | | $ | 8,209,214 | | | $ | — | | | $ | — | | | $ | 8,209,214 | |
| Total Investments | | $ | 967,697,863 | | | $ | — | | | $ | — | | | $ | 967,697,863 | |
Transfers between levels are recognized at the end of the reporting period. During the year ended October 31, 2017, the Fund recognized no transfers between levels.
The accompanying notes are an integral part of these financial statements.
| SCHEDULE OF INVESTMENTS/STATEMENT OF ASSETS AND LIABILITIES |
Financial Statements
Statement of Assets and Liabilities as of October 31, 2017 |
| ASSETS: | | | |
| Investments in securities, at value (cost $788,430,840) | | $ | 967,697,863 | |
| Cash | | | 29 | |
| Dividends and interest receivable | | | 314,685 | |
| Receivable for fund shares sold | | | 5,672,180 | |
| Prepaid expenses and other assets | | | 26,956 | |
| Total Assets | | | 973,711,713 | |
| | | | | |
| LIABILITIES: | | | | |
| Payable for fund shares redeemed | | | 1,046,508 | |
| Payable to advisor | | | 610,720 | |
| Payable to administrator | | | 164,572 | |
| Payable to auditor | | | 21,305 | |
| Accrued distribution fees | | | 56,477 | |
| Accrued service fees | | | 30,029 | |
| Accrued trustees fees | | | 5,571 | |
| Accrued expenses and other payables | | | 231,976 | |
| Total Liabilities | | | 2,167,158 | |
| NET ASSETS | | $ | 971,544,555 | |
| | | | | |
| NET ASSETS CONSIST OF: | | | | |
| Capital stock | | $ | 633,887,455 | |
| Accumulated net investment loss | | | (1,118,367 | ) |
| Accumulated net realized gain on investments | | | 159,508,444 | |
| Unrealized net appreciation on investments | | | 179,267,023 | |
| Total Net Assets | | $ | 971,544,555 | |
| | | | | |
| NET ASSETS | | | | |
| Investor Class: | | | | |
| Shares authorized (no par value) | | Unlimited | |
| Net assets applicable to outstanding Investor Class shares | | $ | 351,164,062 | |
| Shares issued and outstanding | | | 15,633,332 | |
| Net asset value, offering price and redemption price per share | | $ | 22.46 | |
| | | | | |
| Institutional Class: | | | | |
| Shares authorized (no par value) | | Unlimited | |
| Net assets applicable to outstanding Institutional Class shares | | $ | 620,380,493 | |
| Shares issued and outstanding | | | 26,894,629 | |
| Net asset value, offering price and redemption price per share | | $ | 23.07 | |
The accompanying notes are an integral part of these financial statements.
| HENNESSY FUNDS | 1-800-966-4354 | |
Financial Statements
Statement of Operations for the year ended October 31, 2017 |
| INVESTMENT INCOME: | | | |
| Dividend income | | $ | 10,738,949 | |
| Interest income | | | 121,493 | |
| Total investment income | | | 10,860,442 | |
| | | | | |
| EXPENSES: | | | | |
| Investment advisory fees (See Note 5) | | | 7,978,811 | |
| Sub-transfer agent expenses – Investor Class (See Note 5) | | | 871,683 | |
| Sub-transfer agent expenses – Institutional Class (See Note 5) | | | 641,222 | |
| Administration, fund accounting, custody and transfer agent fees (See Note 5) | | | 1,030,427 | |
| Distribution fees – Investor Class (See Note 5) | | | 607,703 | |
| Service fees – Investor Class (See Note 5) | | | 405,135 | |
| Federal and state registration fees | | | 87,374 | |
| Reports to shareholders | | | 86,520 | |
| Interest expense (See Note 7) | | | 41,328 | |
| Compliance expense (See Note 5) | | | 28,706 | |
| Audit fees | | | 26,479 | |
| Trustees’ fees and expenses | | | 19,816 | |
| Legal fees | | | 16,562 | |
| Other expenses | | | 76,322 | |
| Total expenses | | | 11,918,088 | |
| NET INVESTMENT LOSS | | $ | (1,057,646 | ) |
| | | | | |
| REALIZED AND UNREALIZED GAINS (LOSSES): | | | | |
| Net realized gain on investments | | $ | 245,505,242 | |
| Net change in unrealized appreciation on investments | | | (15,162,353 | ) |
| Net gain on investments | | | 230,342,889 | |
| NET INCREASE IN NET ASSETS RESULTING FROM OPERATIONS | | $ | 229,285,243 | |
The accompanying notes are an integral part of these financial statements.
| STATEMENT OF OPERATIONS/STATEMENTS OF CHANGES IN NET ASSETS |
Financial Statements
| Statements of Changes in Net Assets |
| | | Year Ended | | | Year Ended | |
| | | October 31, 2017 | | | October 31, 2016 | |
| OPERATIONS: | | | | | | |
| Net investment loss | | $ | (1,057,646 | ) | | $ | (1,224,225 | ) |
| Net realized gain on investments | | | 245,505,242 | | | | 5,942,875 | |
| Net change in unrealized depreciation on investments | | | (15,162,353 | ) | | | (104,787,882 | ) |
| Net increase (decrease) in net | | | | | | | | |
| assets resulting from operations | | | 229,285,243 | | | | (100,069,232 | ) |
| | | | | | | | | |
| DISTRIBUTIONS TO SHAREHOLDERS FROM: | | | | | | | | |
| Net investment income | | | | | | | | |
| Investor Class | | | — | | | | (983,702 | ) |
| Institutional Class | | | — | | | | (1,004,373 | ) |
| Net realized gains | | | | | | | | |
| Investor Class | | | (3,088,473 | ) | | | (5,450,291 | ) |
| Institutional Class | | | (4,766,317 | ) | | | (2,201,769 | ) |
| Total distributions | | | (7,854,790 | ) | | | (9,640,135 | ) |
| | | | | | | | | |
| CAPITAL SHARE TRANSACTIONS: | | | | | | | | |
| Proceeds from shares issued in the Reorganization – | | | | | | | | |
| Institutional Class (See Note 10) | | | — | | | | 434,529,979 | |
| Proceeds from shares subscribed – Investor Class | | | 37,287,639 | | | | 281,456,239 | |
| Proceeds from shares subscribed – Institutional Class | | | 90,659,855 | | | | 340,887,989 | |
| Dividends reinvested – Investor Class | | | 3,040,512 | | | | 6,357,569 | |
| Dividends reinvested – Institutional Class | | | 4,572,946 | | | | 2,729,983 | |
| Cost of shares redeemed – Investor Class | | | (257,782,079 | ) | | | (500,557,212 | ) |
| Cost of shares redeemed – Institutional Class | | | (367,781,422 | ) | | | (287,519,806 | ) |
| Net increase (decrease) in net assets derived | | | | | | | | |
| from capital share transactions | | | (490,002,549 | ) | | | 277,884,741 | |
| TOTAL INCREASE (DECREASE) IN NET ASSETS | | | (268,572,096 | ) | | | 168,175,374 | |
| | | | | | | | | |
| NET ASSETS: | | | | | | | | |
| Beginning of year | | | 1,240,116,651 | | | | 1,071,941,277 | |
| End of year | | $ | 971,544,555 | | | $ | 1,240,116,651 | |
| Undistributed net investment loss, end of year | | $ | (1,118,367 | ) | | $ | (1,670,147 | ) |
| | | | | | | | | |
| CHANGES IN SHARES OUTSTANDING: | | | | | | | | |
| Shares issued in the Reorganization – Institutional Class | | | — | | | | 22,309,002 | |
| Shares sold – Investor Class | | | 1,844,085 | | | | 15,025,505 | |
| Shares sold – Institutional Class | | | 4,348,038 | | | | 17,897,465 | |
| Shares issued to holders as reinvestment | | | | | | | | |
| of dividends – Investor Class | | | 149,705 | | | | 332,871 | |
| Shares issued to holders as reinvestment | | | | | | | | |
| of dividends – Institutional Class | | | 220,065 | | | | 140,179 | |
| Shares redeemed – Investor Class | | | (12,769,278 | ) | | | (27,012,121 | ) |
| Shares redeemed – Institutional Class | | | (17,841,055 | ) | | | (15,071,054 | ) |
| Net increase (decrease) in shares outstanding | | | (24,048,440 | ) | | | 13,621,847 | |
The accompanying notes are an integral part of these financial statements.
| HENNESSY FUNDS | 1-800-966-4354 | |
Financial Statements
For an Investor Class share outstanding throughout each year
PER SHARE DATA:
Net asset value, beginning of year
Income from investment operations:
Net investment income (loss)
Net realized and unrealized gains (losses) on investments
Total from investment operations
Less distributions:
Dividends from net investment income
Dividends from net realized gains
Total distributions
Net asset value, end of year
TOTAL RETURN
SUPPLEMENTAL DATA AND RATIOS:
Net assets, end of year (millions)
Ratio of expenses to average net assets
Ratio of net investment income (loss) to average net assets
Portfolio turnover rate(1)
(1) | Portfolio turnover is calculated on the basis of the Fund as a whole. |
The accompanying notes are an integral part of these financial statements.
| FINANCIAL HIGHLIGHTS — INVESTOR CLASS |
| Year Ended October 31, | | |
| 2017 | | | 2016 | | | 2015 | | | 2014 | | | 2013 | | |
| | | | | | | | | | | | | | | |
| $ | 18.37 | | | $ | 20.12 | | | $ | 19.00 | | | $ | 17.32 | | | $ | 14.06 | | |
| | | | | | | | | | | | | | | | | | | | |
| | | | | | | | | | | | | | | | | | | | |
| | (0.15 | ) | | | (0.07 | ) | | | 0.10 | | | | (0.05 | ) | | | 0.09 | | |
| | 4.36 | | | | (1.51 | ) | | | 2.16 | | | | 3.04 | | | | 3.35 | | |
| | 4.21 | | | | (1.58 | ) | | | 2.26 | | | | 2.99 | | | | 3.44 | | |
| | | | | | | | | | | | | | | | | | | | |
| | | | | | | | | | | | | | | | | | | | |
| | — | | | | (0.03 | ) | | | — | | | | (0.05 | ) | | | (0.18 | ) | |
| | (0.12 | ) | | | (0.14 | ) | | | (1.14 | ) | | | (1.26 | ) | | | — | | |
| | (0.12 | ) | | | (0.17 | ) | | | (1.14 | ) | | | (1.31 | ) | | | (0.18 | ) | |
| $ | 22.46 | | | $ | 18.37 | | | $ | 20.12 | | | $ | 19.00 | | | $ | 17.32 | | |
| | | | | | | | | | | | | | | | | | | | |
| | 23.02 | % | | | (7.89 | )% | | | 12.35 | % | | | 18.25 | % | | | 24.78 | % | |
| | | | | | | | | | | | | | | | | | | | |
| | | | | | | | | | | | | | | | | | | | |
| $ | 351.16 | | | $ | 485.15 | | | $ | 765.90 | | | $ | 258.17 | | | $ | 159.45 | | |
| | 1.34 | % | | | 1.35 | % | | | 1.17 | % | | | 1.25 | % | | | 1.31 | % | |
| | (0.33 | )% | | | (0.24 | )% | | | 0.27 | % | | | (0.47 | )% | | | 0.51 | % | |
| | 106 | % | | | 108 | % | | | 5 | % | | | 132 | % | | | 212 | % | |
The accompanying notes are an integral part of these financial statements.
| HENNESSY FUNDS | 1-800-966-4354 | |
Financial Statements
For an Institutional Class share outstanding throughout each year
PER SHARE DATA:
Net asset value, beginning of year
Income from investment operations:
Net investment income (loss)
Net realized and unrealized gains (losses) on investments
Total from investment operations
Less distributions:
Dividends from net investment income
Dividends from net realized gains
Total distributions
Net asset value, end of year
TOTAL RETURN
SUPPLEMENTAL DATA AND RATIOS:
Net assets, end of year (millions)
Ratio of expenses to average net assets:
Before reimbursement
After reimbursement
Ratio of net investment income to average net assets:
Before reimbursement
After reimbursement
Portfolio turnover rate(2)
(1) | Amount is less than $0.01. |
(2) | Portfolio turnover is calculated on the basis of the Fund as a whole. |
The accompanying notes are an integral part of these financial statements.
| FINANCIAL HIGHLIGHTS — INSTITUTIONAL CLASS |
| Year Ended October 31, | | |
| 2017 | | | 2016 | | | 2015 | | | 2014 | | | 2013 | | |
| | | | | | | | | | | | | | | |
| $ | 18.80 | | | $ | 20.55 | | | $ | 19.36 | | | $ | 17.62 | | | $ | 14.31 | | |
| | | | | | | | | | | | | | | | | | | | |
| | | | | | | | | | | | | | | | | | | | |
| | 0.02 | | | | 0.00 | (1) | | | (0.03 | ) | | | (0.08 | ) | | | 0.14 | | |
| | 4.38 | | | | (1.54 | ) | | | 2.38 | | | | 3.17 | | | | 3.41 | | |
| | 4.40 | | | | (1.54 | ) | | | 2.35 | | | | 3.09 | | | | 3.55 | | |
| | | | | | | | | | | | | | | | | | | | |
| | | | | | | | | | | | | | | | | | | | |
| | — | | | | (0.06 | ) | | | — | | | | (0.09 | ) | | | (0.24 | ) | |
| | (0.13 | ) | | | (0.15 | ) | | | (1.16 | ) | | | (1.26 | ) | | | — | | |
| | (0.13 | ) | | | (0.21 | ) | | | (1.16 | ) | | | (1.35 | ) | | | (0.24 | ) | |
| $ | 23.07 | | | $ | 18.80 | | | $ | 20.55 | | | $ | 19.36 | | | $ | 17.62 | | |
| | | | | | | | | | | | | | | | | | | | |
| | 23.47 | % | | | (7.53 | )% | | | 12.62 | % | | | 18.57 | % | | | 25.15 | % | |
| | | | | | | | | | | | | | | | | | | | |
| | | | | | | | | | | | | | | | | | | | |
| $ | 620.38 | | | $ | 754.97 | | | $ | 306.04 | | | $ | 75.53 | | | $ | 51.19 | | |
| | | | | | | | | | | | | | | | | | | | |
| | 0.97 | % | | | 0.97 | % | | | 0.96 | % | | | 1.07 | % | | | 1.11 | % | |
| | 0.97 | % | | | 0.97 | % | | | 0.96 | % | | | 0.98 | % | | | 0.98 | % | |
| | | | | | | | | | | | | | | | | | | | |
| | 0.04 | % | | | 0.07 | % | | | 0.41 | % | | | (0.29 | )% | | | 0.71 | % | |
| | 0.04 | % | | | 0.07 | % | | | 0.41 | % | | | (0.20 | )% | | | 0.84 | % | |
| | 106 | % | | | 108 | % | | | 5 | % | | | 132 | % | | | 212 | % | |
The accompanying notes are an integral part of these financial statements.
| HENNESSY FUNDS | 1-800-966-4354 | |
Financial Statements
Notes to the Financial Statements October 31, 2017 |
1). ORGANIZATION
The Hennessy Cornerstone Mid Cap 30 Fund (the “Fund”) is a series of Hennessy Funds Trust (the “Trust”), which was organized as a Delaware statutory trust on September 17, 1992. The Fund is an open-end management investment company registered under the Investment Company Act of 1940, as amended. The investment objective of the Fund is long-term growth of capital. The Fund is a diversified fund.
The Fund offers Investor Class and Institutional Class shares. Each class of shares differs principally in its respective 12b-1 distribution and service, shareholder servicing, and sub-transfer agent expenses. There are no sales charges. Each class has identical rights to earnings, assets, and voting privileges, except for class-specific expenses and exclusive rights to vote on matters affecting only an individual class.
As an investment company, the Fund follows the investment company accounting and reporting guidance of the Financial Accounting Standards Board (“FASB”) Accounting Standard Codification Topic 946 “Financial Services—Investment Companies.”
2). SIGNIFICANT ACCOUNTING POLICIES
The following is a summary of significant accounting policies consistently followed by the Fund in the preparation of the financial statements. These policies conform to U.S. generally accepted accounting principles (“GAAP”).
| a). | Investment Valuation – All investments in securities are recorded at their estimated fair value, as described in Note 3. |
| b). | Federal Income Taxes – No provision for federal income taxes or excise taxes has been made because the Fund has elected to be taxed as a “regulated investment company” and intends to distribute substantially all of its taxable income to its shareholders and otherwise comply with the provisions of the Internal Revenue Code of 1986, as amended, applicable to regulated investment companies. Net investment income/loss and realized gains/losses for federal income tax purposes may differ from those reported in the financial statements because of temporary book and tax basis differences. Temporary differences are primarily the result of the treatment of wash sales for tax reporting purposes. The Fund recognizes interest and penalties related to income tax benefits, if any, in the Statement of Operations as an income tax expense. Distributions from net realized gains for book purposes may include short-term capital gains, which are included as ordinary income to shareholders for tax purposes. The Fund may utilize equalization accounting for tax purposes and designate earnings and profits, including net realized gains distributed to shareholders on redemption of shares, as part of the dividends paid deduction for income tax purposes. |
| | Due to inherent differences in the recognition of income, expenses, and realized gains/losses under GAAP and federal income tax regulations, permanent differences between book and tax basis for reporting for fiscal year 2017 have been identified and appropriately reclassified in the Statement of Assets and Liabilities. The adjustments are as follows: |
| | Accumulated | Accumulated | | |
| | Net Investment | Net Realized | | |
| | Loss | Gain on Investments | Capital Stock | |
| | $1,609,426 | $(82,843,463) | $81,234,037 | |
| NOTES TO THE FINANCIAL STATEMENTS |
| c). | Accounting for Uncertainty in Income Taxes – The Fund has accounting policies regarding recognition and measurement of tax positions taken or expected to be taken on a tax return. The tax returns of the Fund for the prior three fiscal years are open for examination. The Fund has reviewed all open tax years in major jurisdictions and concluded that there is no impact on the Fund’s net assets and no tax liability resulting from unrecognized tax benefits relating to uncertain income tax positions taken or expected to be taken on a tax return. The Fund’s major tax jurisdictions are U.S. federal and Delaware. |
| d). | Income and Expenses – Dividend income is recognized on the ex-dividend date or as soon as information is available to the Fund. Interest income, which includes the amortization of premium and accretion of discount, is recognized on an accrual basis. The Fund is charged for those expenses that are directly attributable to the portfolio, such as advisory, administration, and certain shareholder service fees. Income, expenses (other than expenses attributable to a specific class), and realized and unrealized gains/losses on investments are allocated to each class of shares based on such class’s net assets. |
| e). | Distributions to Shareholders – Dividends from net investment income for the Fund, if any, are declared and paid annually, usually in December. Distributions of net realized capital gains, if any, are declared and paid annually, usually in December. |
| f). | Security Transactions – Investment and shareholder transactions are recorded on the trade date. The Fund determines the realized gain/loss from an investment transaction by comparing the original cost of the security lot sold with the net sale proceeds. Discounts and premiums on securities purchased are accreted/amortized over the life of the respective security. |
| g). | Use of Estimates – The preparation of financial statements in conformity with GAAP requires management to make estimates and assumptions that affect the reported amounts of assets and liabilities and disclosure of contingent assets and liabilities at the date of the financial statements and the reported change in net assets during the reporting period. Actual results could differ from those estimates. |
| h). | Share Valuation – The net asset value (“NAV”) per share of the Fund is calculated by dividing (i) the sum of the value of the securities held by the Fund, plus cash or other assets, minus all liabilities (including estimated accrued expenses) by (ii) the total number of shares outstanding for the Fund, rounded to the nearest cent. The Fund’s shares will not be priced on days the New York Stock Exchange is closed for trading. The offering and redemption price per share for the Fund is equal to the Fund’s NAV per share. |
3). SECURITIES VALUATION
The Fund follows authoritative fair valuation accounting standards that establish an authoritative definition of fair value and set out a hierarchy for measuring fair value. These standards require additional disclosures about the various inputs and valuation techniques used to develop the measurements of fair value and a discussion of changes in valuation techniques and related inputs during the period. These inputs are summarized in the three broad levels listed below:
| | Level 1 – | Unadjusted, quoted prices in active markets for identical instruments that the Fund has the ability to access at the date of measurement. |
| | Level 2 – | Other significant observable inputs (including, but not limited to, quoted prices in active markets for similar instruments, quoted prices in markets that are not active for identical or similar instruments, and model-derived |
| HENNESSY FUNDS | 1-800-966-4354 | |
| | | valuations in which all significant inputs and significant value drivers are observable in active markets, such as interest rates, prepayment speeds, credit risk curves, default rates, and similar data). |
| | Level 3 – | Significant unobservable inputs (including the Fund’s own assumptions about what market participants would use to price the asset or liability based on the best available information) when observable inputs are unavailable. |
Following is a description of the valuation techniques applied to the Fund’s major categories of assets and liabilities measured at fair value on a recurring basis.
| | Equity Securities – Equity securities, including common stocks, preferred stocks, exchange-traded funds, closed-end mutual funds, partnerships, rights, and real estate investment trusts, that are traded on a securities exchange for which a last-quoted sales price is readily available will generally be valued at the last sales price as reported by the primary exchange on which the securities are listed. Securities listed on The NASDAQ Stock Market (“NASDAQ”) will generally be valued at the NASDAQ Official Closing Price, which may differ from the last sales price reported. Securities traded on a securities exchange for which a last-quoted sales price is not readily available will generally be valued at the mean between the bid and ask prices. To the extent these securities are actively traded and valuation adjustments are not applied, they are classified in Level 1 of the fair value hierarchy. |
| | Registered Investment Companies – Investments in registered investment companies (e.g., mutual funds) are generally priced at the ending NAV provided by the applicable registered investment company’s service agent and will be classified in Level 1 of the fair value hierarchy. |
| | Debt Securities – Debt securities, including corporate bonds, asset-backed securities, mortgage-backed securities, municipal bonds, U.S. Treasuries, and U.S. government agency issues, are generally valued at market on the basis of valuations furnished by an independent pricing service that utilizes both dealer-supplied valuations and formula-based techniques. The pricing service may consider recently executed transactions in securities of the issuer or comparable issuers, market price quotations (where observable), bond spreads, and fundamental data relating to the issuer. In addition, the model may incorporate observable market data, such as reported sales of similar securities, broker quotes, yields, bids, offers, and reference data. Certain securities are valued primarily using dealer quotations. These securities are generally classified in Level 2 of the fair value hierarchy. |
| | Short-Term Securities – Short-term equity investments, including money market funds, are valued in the manner specified above. Short-term debt investments with an original term to maturity of 60 days or less are valued at amortized cost, which approximates fair market value. If the original term to maturity of a short-term debt investment exceeded 60 days, then the values as of the 61st day prior to maturity are amortized. Amortized cost is not used if its use would be inappropriate due to credit or other impairments of the issuer, in which case the security’s fair value would be determined, as described below. Short-term securities are generally classified in Level 1 or Level 2 of the fair market hierarchy depending on the inputs used and market activity levels for specific securities. |
| The Board of Trustees of the Fund (the “Board”) has adopted fair value pricing procedures that are followed when a price for a security is not readily available or if a significant event has occurred that indicates the closing price of a security no longer represents the true value of that security. Fair value pricing determinations are made in good faith in accordance with these procedures. There are numerous criteria that will be |
| NOTES TO THE FINANCIAL STATEMENTS |
given consideration in determining a fair value of a security, such as the trading volume of a security and markets, the values of other similar securities, and news events with direct bearing on a security or markets. Fair value pricing results in an estimated price for a security that reflects the amount the Fund might reasonably expect to receive in a current sale. Depending on the relative significance of the valuation inputs, these securities may be classified in either Level 2 or Level 3 of the fair value hierarchy.
The Board has delegated day-to-day valuation matters to a Valuation Committee comprised of one or more representatives from Hennessy Advisors, Inc., the Fund’s investment advisor (the “Advisor”). The function of the Valuation Committee is to value securities where current and reliable market quotations are not readily available. All actions taken by the Valuation Committee are reviewed by the Board.
The Fund has performed an analysis of all existing investments to determine the significance and character of all inputs to their fair value determination. Various inputs are used to determine the value of the Fund’s investments. The inputs or methodology used for valuing securities are not necessarily an indication of the risk associated with investing in those securities. Details related to the fair valuation hierarchy of the Fund’s securities as of October 31, 2017, are included in the Schedule of Investments.
4). INVESTMENT TRANSACTIONS
Purchases and sales of investment securities (excluding government and short-term investments) for the Fund during fiscal year 2017 were $1,122,583,742 and $1,629,990,593, respectively.
There were no purchases or sales/maturities of long-term U.S. government securities for the Fund during fiscal year 2017.
The Fund is permitted to purchase or sell securities from or to another fund in the Hennessy Funds family of funds (the “Hennessy Funds”) under specified conditions outlined in procedures adopted by the Board. The procedures have been designed to ensure that any purchase or sale of securities by the Fund from or to another Hennessy Fund complies with Rule 17a-7 of the Investment Company Act of 1940, as amended. For fiscal year 2017, the Fund did not engage in purchases or sales of securities pursuant to Rule 17a-7 of the Investment Company Act of 1940, as amended.
5). INVESTMENT MANAGEMENT FEE AND OTHER TRANSACTIONS WITH AFFILIATES
The Advisor provides the Fund with investment management services under an Investment Advisory Agreement. The Advisor provides all investment advice, office space, and facilities, as well as most of the personnel needed by the Fund. As compensation for its services, the Advisor is entitled to a monthly fee from the Fund. The fee is based upon the average daily net assets of the Fund at an annual rate of 0.74%. The net investment advisory fees expensed by the Fund during fiscal year 2017 are included in the Statement of Operations.
The Board has approved a Shareholder Servicing Agreement for Investor Class shares of the Fund, which was instituted to compensate the Advisor for the non-investment management services it provides to the Fund. The Shareholder Servicing Agreement provides for a monthly fee paid to the Advisor at an annual rate of 0.10% of the average daily net assets of the Fund attributable to Investor Class shares. The shareholder service fees expensed by the Fund during fiscal year 2017 are included in the Statement of Operations.
The Fund has adopted a plan pursuant to Rule 12b-1 under the Investment Company Act of 1940, as amended, that authorizes payments in connection with the distribution of the Fund’s shares at an annual rate of up to 0.25% of the Fund’s average daily net assets attributable to Investor Class shares. Even though the authorized rate is
| HENNESSY FUNDS | 1-800-966-4354 | |
up to 0.25%, the Fund is currently only using up to 0.15% of its average daily net assets attributable to Investor Class shares for such purpose. Amounts paid under the plan may be spent on any activities or expenses primarily intended to result in the sale of shares, including, but not limited to, advertising, shareholder account servicing, the printing and mailing of prospectuses to other than current shareholders, the printing and mailing of sales literature, and compensation for sales and marketing activities or to financial institutions and others, such as dealers and distributors. The distribution fees expensed by the Fund during fiscal year 2017 are included in the Statement of Operations.
The Fund has entered into agreements with various brokers, dealers, and financial intermediaries in connection with the sale of shares of the Fund. The agreements provide for periodic payments by the Fund to the brokers, dealers, and financial intermediaries for providing certain shareholder maintenance services (sub-transfer agent expenses). These shareholder services include the pre-processing and quality control of new accounts, shareholder correspondence, answering customer inquiries regarding account status, and facilitating shareholder telephone transactions. The sub-transfer agent fees expensed by the Fund during fiscal year 2017 are included in the Statement of Operations.
U.S. Bancorp Fund Services, LLC (“USBFS”) provides the Fund with administrative, fund accounting, and transfer agent services and necessary office equipment. As administrator, USBFS is responsible for activities such as (i) preparing various federal and state regulatory filings, reports, and returns for the Fund, (ii) preparing reports and materials to be supplied to the Board, (iii) monitoring the activities of the Fund’s custodian, transfer agent, and accountants, and (iv) coordinating the preparation and payment of the Fund’s expenses and reviewing the Fund’s expense accruals. U.S. Bank, N.A., an affiliate of USBFS, serves as the Fund’s custodian. The servicing agreements between the Trust, USBFS, and U.S. Bank N.A. contain a fee schedule that is inclusive of administrative, fund accounting, custody, and transfer agent fees. The administrative, fund accounting, custody, and transfer agent fees expensed by the Fund during fiscal year 2017 are included in the Statement of Operations.
Quasar Distributors, LLC acts as the Fund’s principal underwriter in a continuous public offering of the Fund’s shares. Quasar Distributors, LLC is an affiliate of USBFS and U.S. Bank, N.A.
The officers of the Fund are affiliated with the Advisor. Such officers, with the exception of the Chief Compliance Officer and the Senior Compliance Officer, receive no compensation from the Fund for serving in their respective roles. The Fund, along with the other Hennessy Funds, makes reimbursement payments, on an equal basis, to the Advisor for a portion of the salary and benefits associated with the office of the Chief Compliance Officer and for all of the salary and benefits associated with the office of the Senior Compliance Officer. The compliance fees expensed by the Fund during fiscal year 2017 are included in the Statement of Operations.
6). GUARANTEES AND INDEMNIFICATIONS
Under the Hennessy Funds’ organizational documents, their officers and trustees are indemnified by the Hennessy Funds against certain liabilities arising out of the performance of their duties to the Hennessy Funds. Additionally, in the normal course of business, the Hennessy Funds enter into contracts with service providers that contain general indemnification clauses. The Fund’s maximum exposure under these arrangements is unknown as this would involve future claims that may be made against the Fund that have not yet occurred. Currently, the Fund expects the risk of loss to be remote.
| NOTES TO THE FINANCIAL STATEMENTS |
7). LINE OF CREDIT
The Fund has an uncommitted line of credit with the other Hennessy Funds in the amount of the lesser of (i) $100,000,000 or (ii) 33.33% of each Hennessy Fund’s net assets, or 30% for the Hennessy Gas Utility Fund and 10% for the Hennessy Balanced Fund, intended to provide short-term financing, if necessary, subject to certain restrictions, in connection with shareholder redemptions. The credit facility is with the Hennessy Funds’ custodian bank, U.S. Bank, N.A. Borrowings under this arrangement bear interest at the bank’s prime rate and are secured by all of the Fund’s assets (as to its own borrowings only). During fiscal year 2017, the Fund had an outstanding average daily balance and a weighted average interest rate of $1,137,926 and 3.97%, respectively. The interest expensed by the Fund during fiscal year 2017 is included in the Statement of Operations. The maximum amount outstanding for the Fund during the period was $46,091,000. At October 31, 2017, the Fund did not have any borrowings outstanding under the line of credit.
8). FEDERAL TAX INFORMATION
As of October 31, 2017, the components of accumulated earnings (losses) for income tax purposes were as follows:
| | | | Investments | |
| | Cost of investments for tax purposes | | $ | 791,238,690 | |
| | Gross tax unrealized appreciation | | $ | 227,861,188 | |
| | Gross tax unrealized depreciation | | | (51,402,015 | ) |
| | Net tax unrealized appreciation | | $ | 176,459,173 | |
| | Undistributed ordinary income | | $ | — | |
| | Undistributed long-term capital gains | | | 162,316,294 | |
| | Total distributable earnings | | $ | 162,316,294 | |
| | Other accumulated loss | | $ | (1,118,367 | ) |
| | Total accumulated gain | | $ | 337,657,100 | |
The difference between book-basis unrealized appreciation/depreciation (as shown in the Statement of Assets and Liabilities) and tax-basis unrealized appreciation/depreciation (as shown above) is attributable primarily to wash sales.
At October 31, 2017, the Fund had no tax basis capital losses to offset future capital gains.
At October 31, 2017, the Fund deferred, on a tax basis, a late-year ordinary loss of $1,118,367. Late-year ordinary losses are net ordinary losses incurred after December 31, 2016, but within the taxable year, that are deemed to arise on the first day of the Fund’s next taxable year.
During fiscal years 2017 and 2016, the tax character of distributions paid by the Fund was as follows:
| | | | Year Ended | | | Year Ended | |
| | | | October 31, 2017 | | | October 31, 2016 | |
| | Ordinary income(1) | | $ | — | | | $ | 8,894,689 | |
| | Long-term capital gain | | | 7,854,790 | | | | 745,446 | |
| | | | $ | 7,854,790 | | | $ | 9,640,135 | |
(1) Ordinary income includes short-term gain/loss.
9). CHANGE IN AUDITOR DISCLOSURE
On September 11, 2017, the Trust, by action of the Audit Committee of the Board and on behalf of the Fund, the Hennessy Cornerstone Growth Fund, the Hennessy Cornerstone Large Growth Fund, the Hennessy Cornerstone Value Fund, the Hennessy Total Return
| HENNESSY FUNDS | 1-800-966-4354 | |
Fund, the Hennessy Balanced Fund, the Hennessy Japan Fund, and the Hennessy Japan Small Cap Fund (collectively, the “Applicable Funds”), dismissed KPMG LLP (“KPMG”) and engaged Tait, Weller & Baker LLP (“Tait Weller”) to serve as the independent registered public accounting firm to audit the financial statements of all series of the Trust for fiscal year 2017. Tait Weller previously served as the independent registered public accounting firm for the series of the Trust that are not one of the Applicable Funds.
KPMG’s reports on the financial statements for the Applicable Funds for each of fiscal years 2015 and 2016 contained no adverse opinion or disclaimer of opinion, nor were they qualified or modified as to uncertainty, audit scope, or accounting principles. During fiscal years 2015 and 2016 and the interim period of November 1, 2016, through September 11, 2017 (the “Interim Period”), there were no (i) disagreements with KPMG on any matter of accounting principles or practices, financial statement disclosure, or auditing scope or procedure, which disagreements, if not resolved to the satisfaction of KPMG, would have caused it to make reference to the subject matter of the disagreements in connection with its reports on the Applicable Funds’ financial statements for such years, nor (ii) “reportable events” of the kind described in Item 304(a)(1)(v) of Regulation S-K under the Securities Exchange Act of 1934, as amended.
During fiscal years 2015 and 2016 and the Interim Period, neither the Applicable Funds nor anyone on behalf of the Applicable Funds has consulted Tait Weller on items that concerned (a) the application of accounting principles to a specified transaction, either completed or proposed, or the type of audit opinion that might be rendered on an Applicable Fund’s financial statements, or (b) the subject of a disagreement (as defined in paragraph (a)(1)(iv) of Item 304 of Regulation S-K and related instructions) or reportable events (as described in paragraph (a)(1)(v) of Item 304 of Regulation S-K). The selection of Tait Weller does not reflect any disagreements or dissatisfaction by the Applicable Funds, the Board, or the Audit Committee with the performance of KPMG.
10). AGREEMENT AND PLAN OF REORGANIZATION – THE WESTPORT FUNDS
On September 19, 2016, shareholders of the Westport Fund and the Westport Select Cap Fund approved an Agreement and Plan of Reorganization between the Trust, on behalf of the Fund, and The Westport Funds, a Delaware statutory trust, on behalf of the Westport Fund and the Westport Select Cap Fund. The Agreement and Plan of Reorganization provided for the transfer of all of the assets of the Westport Fund and the Westport Select Cap Fund to the Fund and the assumption of the liabilities (other than any excluded liabilities) of the Westport Fund and the Westport Select Cap Fund by the Fund. Each of the Westport Fund, the Westport Select Cap Fund, and the Fund have substantially similar investment objectives. The following tables illustrate the specifics of the reorganization of the Westport Fund and the Westport Select Cap Fund into the Fund:
| | Shares Issued | Westport | Shares Issued | Hennessy | | |
| | to Shareholders | Select Cap | to Shareholders | Mid Cap 30 | | |
| Westport Fund | of Westport | Fund | of Westport | Fund | Combined | Tax Status |
Net Assets | Fund | Net Assets | Select Cap Fund | Net Assets | Net Assets | of Transfer |
$327,593,695(1) | 16,818,829 | $106,936,284(2) | 5,490,173 | $944,525,090 | $1,379,055,069 | Non-taxable |
(1) | Includes accumulated realized losses and unrealized appreciation in the amounts of $24,482,976 and $179,647,207, respectively. |
(2) | Includes accumulated realized losses and unrealized appreciation in the amounts of $49,229,674 and $77,980,073, respectively. |
| NOTES TO THE FINANCIAL STATEMENTS |
Assuming the reorganization had been completed on November 1, 2015, the beginning of the annual reporting period of the Fund, the pro forma results of operation (unaudited) for the 2016 fiscal year, would have been as follows:
| | Net investment loss | | $ | (3,630,389 | ) |
| | Net realized gain on investments | | $ | 187,733,108 | |
| | Net change in unrealized appreciation on investments | | $ | 5,795,235 | |
| | Net increase in net assets resulting from operations | | $ | 189,897,954 | |
Because the Fund has been managed as a single integrated portfolio since the reorganization was completed, it is not practicable to separate the amounts of revenue and earnings of the Westport Fund and the Westport Select Cap Fund that have been included in the Fund’s Statement of Operations since September 23, 2016, the date the reorganization was completed.
11). EVENTS SUBSEQUENT TO YEAR END
Management has evaluated the Fund’s related events and transactions that occurred subsequent to October 31, 2017, through the date of issuance of the Fund’s financial statements. Other than as disclosed below, management has determined that there were no subsequent events requiring recognition or disclosure in the financial statements.
On December 7, 2017, capital gains were declared and paid to shareholders of record on December 6, 2017, as follows:
| | | Long-term | |
| | Investor Class | $3.66211 | |
| | Institutional Class | $3.77322 | |
On November 16, 2017, shareholders of the Rainier Mid Cap Equity Fund approved an Agreement and Plan of Reorganization between the Trust, on behalf of the Fund, and Rainier Investment Management Mutual Funds, a Delaware statutory trust, on behalf of the Rainier Mid Cap Equity Fund. The Agreement and Plan of Reorganization provided for the transfer of all of the assets of the Rainier Mid Cap Equity Fund to the Fund and the assumption of the liabilities (other than any excluded liabilities) of the Rainier Mid Cap Equity Fund by the Fund. The Rainier Mid Cap Equity Fund and the Fund have substantially similar investment objectives. The reorganization was effective as of December 1, 2017.
On December 26, 2017, shareholders of the Rainier Small/Mid Cap Equity Fund approved an Agreement and Plan of Reorganization between the Trust, on behalf of the Fund, and Rainier Investment Management Mutual Funds, a Delaware statutory trust, on behalf of the Rainier Small/Mid Cap Equity Fund. The Agreement and Plan of Reorganization provided for the transfer of all of the assets of the Rainier Small/Mid Cap Equity Fund to the Fund and the assumption of the liabilities (other than any excluded liabilities) of the Rainier Small/Mid Cap Equity Fund by the Fund. The Rainier Small/Mid Cap Equity Fund and the Fund have substantially similar investment objectives. The reorganization is expected to be effective in January 2018.
| HENNESSY FUNDS | 1-800-966-4354 | |
Report of Independent Registered Public
Accounting Firm
To the Board of Trustees of Hennessy Funds Trust
and the Shareholders of the Hennessy Cornerstone Mid Cap 30 Fund
Novato, CA
We have audited the accompanying statement of assets and liabilities, including the schedule of investments, of the Hennessy Cornerstone Mid Cap 30 Fund (the “Fund”), a series of Hennessy Funds Trust as of October 31, 2017, and the related statement of operations, the statement of changes in net assets, and the financial highlights for the year then ended. The statement of changes in net assets for the year ended October 31, 2016 and the financial highlights for each of the four years in the period ended October 31, 2016 have been audited by other auditors, whose report dated December 22, 2016 expressed unqualified opinions on such financial statements and financial highlights. These financial statements and financial highlights are the responsibility of the Fund’s management. Our responsibility is to express an opinion on these financial statements and financial highlights based on our audit.
We conducted our audit in accordance with the standards of the Public Company Accounting Oversight Board (United States). Those standards require that we plan and perform the audit to obtain reasonable assurance about whether the financial statements and financial highlights are free of material misstatement. The Fund is not required to have, nor were we engaged to perform, an audit of the Fund’s internal control over financial reporting. Our audit included consideration of internal control over financial reporting as a basis for designing audit procedures that are appropriate in the circumstances, but not for the purposes of expressing an opinion on the effectiveness of the Fund’s internal control over financial reporting. Accordingly, we express no such opinion. An audit includes examining, on a test basis, evidence supporting the amounts and disclosures in the financial statements. Our procedures included confirmation of securities owned as of October 31, 2017, by correspondence with the custodian. An audit also includes assessing the accounting principles used and significant estimates made by management, as well as evaluating the overall financial statement presentation. We believe that our audit provides a reasonable basis for our opinion.
In our opinion, the financial statements and financial highlights referred to above present fairly, in all material respects, the financial position of the Hennessy Cornerstone Mid Cap 30 Fund as of October 31, 2017, the results of its operations, the changes in its net assets, and the financial highlights for the year then ended, in conformity with accounting principles generally accepted in the United States of America.
TAIT, WELLER & BAKER LLP
Philadelphia, Pennsylvania
December 22, 2017
| REPORT OF INDEPENDENT REGISTERED PUBLIC ACCOUNTING FIRM/TRUSTEES AND OFFICERS |
Trustees and Officers of the Fund (Unaudited)
The business and affairs of the Funds are managed under the direction of the Board of Trustees of the Trust, and the Board of Trustees elects the Officers of the Trust. Beginning in March 2015, the Board of Trustees has from time to time appointed advisers to the Board of Trustees (“Advisers”), with the intention of having qualified individuals serve in an advisory capacity in order to garner experience in the mutual fund and asset management industry and be considered as potential Trustees in the future. There are currently three Advisers to the Board of Trustees: Brian Alexander, Doug Franklin, and Claire Knoles. As Advisers, Mr. Alexander, Mr. Franklin, and Ms. Knoles attend meetings of the Board and act as non-voting participants. Information pertaining to the Trustees, Advisers, and the Officers of the Trust is set forth below. The Trustees and Officers serve until their successors are duly elected and qualified or until their earlier death, resignation, or removal. Each of the Trustees oversees 14 Hennessy Funds. Unless otherwise indicated, the address of all persons listed below is 7250 Redwood Boulevard, Suite 200, Novato, CA 94945. The Fund’s Statement of Additional Information includes more information about the persons listed below and is available, without charge, upon request by calling 1-800-966-4354.
| | | | Other |
| | | | Directorships |
| | | | Held Outside |
| Name, (Year of Birth), | | | of Fund |
| and Position Held | Start Date | Principal Occupation(s) | Complex During |
with the Trust | of Service | During Past Five Years | Past Five Years(1) |
| | | |
| Disinterested Trustees and Advisers | | |
| | | | |
| J. Dennis DeSousa | January 1996 | Mr. DeSousa is a real estate investor. | None. |
| (1936) | | | |
| Trustee | | | |
| | | | |
| Robert T. Doyle | January 1996 | Mr. Doyle has been the Sheriff of | None. |
| (1947) | | Marin County, California since 1996. | |
| Trustee | | | |
| | | | |
| Gerald P. Richardson | May 2004 | Mr. Richardson is an independent | None. |
| (1945) | | consultant in the securities industry. | |
| Trustee | | | |
| | | | |
| Brian Alexander | March 2015 | Mr. Alexander has been employed | None. |
| (1981) | | by Sutter Health Novato Community | |
| Adviser to the Board | | Hospital since 2012, first as an | |
| | | Assistant Administrator and then, | |
| | | beginning in 2013, as the Chief | |
| | | Administrative Officer. From 2011 | |
| | | through 2012, Mr. Alexander was | |
| | | employed by Sutter Health West Bay | |
| | | Region as the Regional Director of | |
| | | Strategic Decision Support. | |
| HENNESSY FUNDS | 1-800-966-4354 | |
| | | | Other |
| | | | Directorships |
| | | | Held Outside |
| Name, (Year of Birth), | | | of Fund |
| and Position Held | Start Date | Principal Occupation(s) | Complex During |
with the Trust | of Service | During Past Five Years | Past Five Years(1) |
| | | | |
| Doug Franklin | March 2016 | Mr. Franklin is a retired insurance | None. |
| (1964) | | industry executive. From 1987 | |
| Adviser to the Board | | through 2015, he was employed | |
| | | by Allianz-Fireman’s Fund Insurance | |
| | | Company in various positions, | |
| | | including Chief Actuary and | |
| | | Chief Risk Officer. | |
| | | | |
| Claire Knoles | December 2015 | Ms. Knoles is a founder of Kiosk and | None. |
| (1974) | | has served as its Chief Operating | |
| Adviser to the Board | | Officer since 2004. Kiosk is a full | |
| | | service marketing agency with | |
| | | offices in the San Francisco Bay | |
| | | Area, Toronto, and Liverpool, UK. | |
| | | | |
Interested Trustee(2) | | | |
| | | | |
| Neil J. Hennessy | January 1996 as | Mr. Hennessy has been employed by | Hennessy |
| (1956) | a Trustee and | Hennessy Advisors, Inc. since 1989 | Advisors, Inc. |
| Trustee, Chairman of | June 2008 as | and currently serves as its President, | |
| the Board, Chief | an Officer | Chairman and Chief Executive Officer. | |
| Investment Officer, | | | |
| Portfolio Manager, | | | |
| and President | | | |
| Name, (Year of Birth), | | |
| and Position Held | Start Date | Principal Occupation(s) |
with the Trust | of Service | During Past Five Years |
| | | |
| Officers | | |
| | | |
| Teresa M. Nilsen | January 1996 | Ms. Nilsen has been employed by Hennessy Advisors, Inc. |
| (1966) | | since 1989 and currently serves as its Executive Vice President, |
| Executive Vice President | | Chief Operations Officer, Chief Financial Officer, and Secretary. |
| and Treasurer | | |
| | | |
| Daniel B. Steadman | March 2000 | Mr. Steadman has been employed by Hennessy Advisors, Inc. |
| (1956) | | since 2000 and currently serves as its Executive Vice President |
| Executive Vice President | | and Chief Compliance Officer. |
| and Secretary | | |
| | | |
| Brian Carlson | December 2013 | Mr. Carlson has been employed by Hennessy Advisors, Inc. |
| (1972) | | since December 2013. Mr. Carlson was previously a co-founder |
| Senior Vice President and | | and principal of Trivium Consultants, LLC from February 2011 |
| Head of Distribution | | through November 2013. |
| | | |
| Jennifer Cheskiewicz | June 2013 | Ms. Cheskiewicz has been employed by Hennessy Advisors, Inc. |
| (1977) | | as its General Counsel since June 2013. She previously served |
| Senior Vice President and | | as in-house counsel to Carlson Capital, L.P., an SEC-registered |
| Chief Compliance Officer | | investment advisor to several private funds, from |
| | | February 2010 to May 2013. |
| TRUSTEES AND OFFICERS OF THE FUND |
| Name, (Year of Birth), | | |
| and Position Held | Start Date | Principal Occupation(s) |
with the Trust | of Service | During Past Five Years |
| | | |
| David Ellison | October 2012 | Mr. Ellison has been employed by Hennessy Advisors, Inc. since |
(1958)(3) | | October 2012. He has served as a Portfolio Manager of the |
| Senior Vice President | | Hennessy Small Cap Financial Fund and the Hennessy Large |
| and Portfolio Manager | | Cap Financial Fund since inception. Mr. Ellison also served as a |
| | | Portfolio Manager of the Hennessy Technology Fund from its |
| | | inception until February 2017. Mr. Ellison served as Director, |
| | | CIO and President of FBR Fund Advisers, Inc. from |
| | | December 1999 to October 2012. |
| | | |
| Ryan Kelley | March 2013 | Mr. Kelley has been employed by Hennessy Advisors, Inc. since |
(1972)(4) | | October 2012. He has served as a Portfolio Manager of the |
| Vice President and | | Hennessy Gas Utility Fund, the Hennessy Small Cap Financial |
| Portfolio Manager | | Fund, and the Hennessy Large Cap Financial Fund since |
| | | October 2014. He served as Co-Portfolio Manager of the same |
| | | funds from March 2013 through September 2014, and as a |
| | | Portfolio Analyst for the Hennessy Funds from October 2012 |
| | | through October 2014. Mr. Kelley has also served as a Portfolio |
| | | Manager of the Hennessy Cornerstone Growth Fund, the |
| | | Hennessy Cornerstone Mid Cap 30 Fund, the Hennessy |
| | | Cornerstone Large Growth Fund, and the Hennessy |
| | | Cornerstone Value Fund and as a Co-Portfolio Manager of the |
| | | Hennessy Technology Fund since February 2017. Mr. Kelley |
| | | served as Portfolio Manager of FBR Fund Advisers, Inc. from |
| | | January 2008 to October 2012. |
| | | |
| Brian Peery | March 2003 as | Mr. Peery has been employed by Hennessy Advisors, Inc. since |
| (1969) | an Officer and | 2002. He has served as a Portfolio Manager of the Hennessy |
| Senior Vice President | February 2011 | Cornerstone Growth Fund, the Hennessy Cornerstone Mid Cap |
| and Portfolio Manager | as a Co-Portfolio | 30 Fund, the Hennessy Cornerstone Large Growth Fund, the |
| | Manager or | Hennessy Cornerstone Value Fund, the Hennessy Total Return |
| | Portfolio Manager | Fund, and the Hennessy Balanced Fund since October 2014. |
| | | He served as Co-Portfolio Manager of the same funds from |
| | | February 2011 through September 2014. Mr. Peery has also |
| | | served as a Portfolio Manager of the Hennessy Gas Utility Fund |
| | | since February 2015 and as Lead Portfolio Manager of the |
| | | Hennessy Technology Fund since February 2017. |
| | | |
| Daniel P. Hennessy | December 2016 | Mr. Daniel Hennessy has been employed by Hennessy Advisors, |
| (1990) | | Inc. since 2015. He has served as an Associate Analyst of the |
| Assistant Vice President | | Hennessy Technology Fund since February 2017. He previously |
| and Associate Analyst | | served as a Mutual Fund Specialist at U.S. Bancorp Fund |
| | | Services, LLC from November 2014 to July 2015. Prior to that, |
| | | he attended the University of San Diego, where he earned a |
| | | degree in Political Science. |
_____________
(1) | Messrs. DeSousa, Doyle, Hennessy, and Richardson previously served on the Board of Directors of Hennessy Mutual Funds, Inc. (“HMFI”), The Hennessy Funds, Inc. (“HFI”), and Hennessy SPARX Funds Trust (“HSFT”). Pursuant to an internal reorganization effective as of February 28, 2014, the series of HFMI, HFI, and HSFT were reorganized into corresponding series of Hennessy Funds Trust that mirrored them. Subsequent to the reorganization, HFMI, HFI, and HSFT were dissolved. |
(2) | Mr. Hennessy is considered an “interested person,” as defined in the Investment Company Act of 1940, as amended, because he is an officer of the Hennessy Funds. |
(3) | The address of this officer is 101 Federal Street, Suite 1900, Boston, MA 02110. |
(4) | The address of this officer is 1340 Environ Way, Chapel Hill, NC 27517. |
| HENNESSY FUNDS | 1-800-966-4354 | |
Expense Example (Unaudited)
October 31, 2017
As a shareholder of the Fund, you incur two types of costs: (1) transaction costs, including sales charges (loads) on purchase payments, reinvested dividends, or other distributions, redemption fees, and exchange fees; and (2) ongoing costs, including management fees, service fees, and other Fund expenses. This Example is intended to help you understand your ongoing costs (in dollars) of investing in the Fund and to compare these costs with the ongoing costs of investing in other mutual funds. The Example is based on an investment of $1,000 invested at the beginning of the period and held for the entire period from May 1, 2017, through October 31, 2017.
Actual Expenses
The first line of the table below under the “Investor Class” and “Institutional Class” headings provides information about actual account values and actual expenses. Although the Fund charges no sales loads or transaction fees, you will be assessed fees for outgoing wire transfers, returned checks and stop payment orders at prevailing rates charged by U.S. Bancorp Fund Services, LLC, the Fund’s transfer agent. If you request that a redemption be made by wire transfer, currently a $15 fee is charged by the Fund’s transfer agent. IRA accounts will be charged a $15 annual maintenance fee. The example below includes, but is not limited to, management fees, shareholder servicing fees, fund accounting, custody, and transfer agent fees. However, the example below does not include portfolio trading commissions and related expenses, and other extraordinary expenses as determined under generally accepted accounting principles. You may use the information in this line, together with the amount you invested, to estimate the expenses that you paid over the period. Simply divide your account value by $1,000 (for example, an $8,600 account value divided by $1,000 = 8.6), then multiply the result by the number in the first line of the table under the “Investor Class” or “Institutional Class” headings in the column entitled “Expenses Paid During Period” to estimate the expenses you paid on your account during this period.
Hypothetical Example for Comparison Purposes
The second line of the table below under the “Investor Class” and “Institutional Class” headings provides information about hypothetical account values and hypothetical expenses based on the Fund’s actual expense ratios and an assumed rate of return of 5% per year before expenses, which is not the Fund’s actual return. The hypothetical account values and expenses may not be used to estimate the actual ending account balance or expenses you paid for the period. You may use this information to compare the ongoing costs of investing in the Fund and other funds. To do so, compare this 5% hypothetical example with the 5% hypothetical examples that appear in the shareholder reports of the other funds. Please note that the expenses shown in the table are meant to highlight your ongoing costs only and do not reflect any transactional costs, such as sales charges (loads), or exchange fees. Therefore, the second line of the table under the “Investor Class” and “Institutional Class” headings is useful in comparing ongoing costs only, and will not help you determine the relative total costs of owning different funds. In addition, if these transactional costs were included, your costs would have been higher.
| | | | | | | | | Expenses Paid | |
| | | Beginning | | | Ending | | | During Period(1) | |
| | | Account Value | | | Account Value | | | May 1, 2017 – | |
| | | May 1, 2017 | | | October 31, 2017 | | | October 31, 2017 | |
| Investor Class | | | | | | | | | |
| Actual | | $ | 1,000.00 | | | $ | 1,096.70 | | | $ | 7.03 | |
| Hypothetical (5% return before expenses) | | $ | 1,000.00 | | | $ | 1,018.50 | | | $ | 6.77 | |
| | | | | | | | | | | | | |
| Institutional Class | | | | | | | | | | | | |
| Actual | | $ | 1,000.00 | | | $ | 1,099.10 | | | $ | 5.08 | |
| Hypothetical (5% return before expenses) | | $ | 1,000.00 | | | $ | 1,020.37 | | | $ | 4.89 | |
(1) | Expenses are equal to the Fund’s annualized expense ratio of 1.33% for Investor Class shares or 0.96% for Institutional Class shares, as applicable, multiplied by the average account value over the period, multiplied by 184/365 days (to reflect one-half year period). |
| HENNESSY FUNDS | 1-800-966-4354 | |
How to Obtain a Copy of the Fund’s
Proxy Voting Policy and Proxy Voting Records
A description of the policies and procedures the Fund uses to determine how to vote proxies relating to portfolio securities is available without charge: (1) by calling 1-800-966-4354; (2) on the Hennessy Funds’ website at hennessyfunds.com/proxy-voting/policy.fs; or (3) on the U.S. Securities and Exchange Commission’s (the “SEC”) website at www.sec.gov. The Fund’s proxy voting record is available without charge on both the Hennessy Funds’ website at hennessyfunds.com/proxy-voting/vote.fs and the SEC’s website at www.sec.gov no later than August 31 for the prior 12 months ending June 30.
Quarterly Filings on Form N-Q
The Fund files a complete schedule of portfolio holdings with the SEC for the first and third quarters of each fiscal year on Form N-Q. The Fund’s Forms N-Q are made available on the SEC’s website at www.sec.gov. The Fund’s Forms N-Q may be reviewed and copied at the SEC’s Public Reference Room in Washington, DC, and information on the operation of the Public Reference Room may be obtained by calling 1-800-SEC-0330. Information included in the Fund’s Forms N-Q will also be available upon request by calling 1-800-966-4354.
Federal Tax Distribution Information
(Unaudited)
For fiscal year 2017, certain dividends paid by the Fund may be subject to a maximum tax rate of 23.8%, as provided for by the Jobs and Growth Tax Relief Reconciliation Act of 2003. The percentage of dividends declared from ordinary income designated as qualified dividend income was 0.00%.
For corporate shareholders, the percent of ordinary income distributions that qualified for the corporate dividends received deduction for fiscal year 2017 was 0.00%.
The percentage of taxable ordinary income distributions that are designated as short-term capital gain distributions under Section 871(k)(2)(C) of the Internal Revenue Code of 1986, as amended, for the Fund was 0.00%.
Householding
To help keep the Fund’s costs as low as possible, we generally deliver a single copy of most financial reports and prospectuses to shareholders who share an address, even if the accounts are registered under different names. This process, known as “householding,” does not apply to account statements. You may request an individual copy of a prospectus or financial report at any time. If you would like to receive separate mailings, please call U.S. Bancorp Fund Services, LLC at 1-800-261-6950 or 1-414-765-4124 and we will begin individual delivery within 30 days of your request. If your account is held through a financial institution or other intermediary, please contact them directly to request individual delivery.
| PROXY VOTING — PRIVACY POLICY |
Privacy Policy
We collect the following non-public personal information about you:
| | • | information we receive from you on or in applications or other forms, correspondence, or conversations, including, but not limited to, your name, address, phone number, social security number, assets, income, and date of birth; and |
| | • | information about your transactions with us, our affiliates, or others, including, but not limited to, your account number and balance, payment history, parties to transactions, cost basis information, and other financial information. |
We do not disclose any non-public personal information about our current or former shareholders to non-affiliated third parties, except as permitted by law. For example, we are permitted by law to disclose all of the information we collect, as described above, to our Transfer Agent to process your transactions. Furthermore, we restrict access to your non-public personal information to those persons who require such information to provide products or services to you. We maintain physical, electronic, and procedural safeguards that comply with federal standards to guard your non-public personal information.
In the event that you hold shares of the Fund through a financial intermediary, including, but not limited to, a broker-dealer, bank, or trust company, the privacy policy of your financial intermediary would govern how your non-public personal information will be shared with non-affiliated third parties.
| HENNESSY FUNDS | 1-800-966-4354 | |
For information, questions or assistance, please call
The Hennessy Funds
1-800-966-4354 or 1-415-899-1555
INVESTMENT ADVISOR
Hennessy Advisors, Inc.
7250 Redwood Boulevard, Suite 200
Novato, California 94945
ADMINISTRATOR,
TRANSFER AGENT,
DIVIDEND PAYING AGENT &
SHAREHOLDER SERVICING AGENT
U.S. Bancorp Fund Services, LLC
P.O. Box 701
Milwaukee, Wisconsin 53201-0701
CUSTODIAN
U.S. Bank N.A.
Custody Operations
1555 North River Center Drive, Suite 302
Milwaukee, Wisconsin 53212
TRUSTEES
Neil J. Hennessy
Robert T. Doyle
J. Dennis DeSousa
Gerald P. Richardson
COUNSEL
Foley & Lardner LLP
777 East Wisconsin Avenue
Milwaukee, Wisconsin 53202-5306
INDEPENDENT REGISTERED
PUBLIC ACCOUNTING FIRM
Tait, Weller & Baker LLP
1818 Market Street, Suite 2400
Philadelphia, Pennsylvania 19103
DISTRIBUTOR
Quasar Distributors, LLC
777 East Wisconsin Avenue
Milwaukee, Wisconsin 53202
hennessyfunds.com | 1-800-966-4354
This report has been prepared for shareholders and may be distributed to
others only if preceded or accompanied by a current prospectus.
ANNUAL REPORT
OCTOBER 31, 2017
HENNESSY CORNERSTONE
LARGE GROWTH FUND
Investor Class HFLGX
Institutional Class HILGX
hennessyfunds.com | 1-800-966-4354
��
(This Page Intentionally Left Blank.)
Contents
| Letter to Shareholders | | | 2 |
| Performance Overview | | | 4 |
| Financial Statements | | | |
| Schedule of Investments | | | 7 |
| Statement of Assets and Liabilities | | | 11 |
| Statement of Operations | | | 12 |
| Statements of Changes in Net Assets | | | 13 |
| Financial Highlights | | | 14 |
| Notes to the Financial Statements | | | 18 |
| Report of Independent Registered Public Accounting Firm | | | 26 |
| Trustees and Officers of the Fund | | | 27 |
| Expense Example | | | 30 |
| Proxy Voting Policy and Proxy Voting Records | | | 32 |
| Quarterly Schedule of Investments | | | 32 |
| Federal Tax Distribution Information | | | 32 |
| Householding | | | 32 |
| Privacy Policy | | | 33 |
| HENNESSY FUNDS | 1-800-966-4354 | |
December 2017
Dear Hennessy Funds Shareholder:
Over the past year, global equity markets have made strong advances, fueled by continued, broad-based economic growth in most countries and regions, and in spite of a somewhat unsettling geopolitical backdrop.
U.S. stocks performed well in the first year of the new administration in Washington, and, ignoring the debate and the bluster, investors have continued to focus on what concerns them the most – tax reform, deregulation, and the hope of an increase in infrastructure spending. As we move into the final weeks of the calendar year, with the major indices reaching new highs, I find myself envisioning the Dow Jones Industrial Average building momentum toward 30,000.
Over the past 12 months, the U.S. economy has continued to grow at a steady rate of almost 2.5% on an annualized basis, as measured by GDP. Companies have added over 170,000 jobs per month on average over the past year, and the current unemployment rate of 4.1% is the lowest in 17 years. Consumer confidence is high and still rising, and corporate profits are at all-time highs. The Federal Reserve has been increasing interest rates, but at a gradual pace. The bond market has also continued to support the equity market and equity market valuations. Since December of last year, long bond yields have stayed within a narrow band, with the 10-year U.S. Treasury yield hovering in the 2.0% to 2.5% range, and remain low compared to historical averages. In my opinion, long bond yields have stayed low despite three increases in the Federal Funds rate over the last 12 months in part due to persistent low inflation.
Meanwhile, the prospective price-to-earnings multiples for the Dow Jones Industrial Average and S&P 500 Index are just above long-term averages at 19.5x and 19.9x, respectively. I believe these levels of stock valuation, while higher than a year ago, are still very reasonable. At the peak of the technology/dot-com bubble, U.S. equities sold at much higher multiples across the board than they do today, and bond yields were also much higher. In June of 1999, the Dow Jones Industrial Average sold at 28x earnings and the 10-year bond yield was close to 6%. Today, the Dow is selling at under 20x earnings and is offering a 2.2% dividend yield, on par with the yield of the 10-year government bond at 2.4%.
Equity markets in the U.S. have been rising for almost nine years, and financial media reports have speculated that this bull run will come to end, but why? I see no substantial reasons or indicators that a major correction is on the horizon. I remain confident that this bull market has room to run. Overall, investment fundamentals are strong. Corporate earnings are growing at a healthy rate, and companies are generating excess cash flow. Cash continues to build on corporate balance sheets, with $5.2 trillion in cash and short term investments among the S&P 500 Index companies as of October 31, 2017. If our government leaders can pass a meaningful tax reform bill and continue efforts toward regulatory relief, it could be icing on the cake for equities.
There have been, and will likely continue to be, downturns throughout this extended bull market. Since 2010, there have been 18 downturns in the market, 14 of which were between 5% and 10% and four of which were corrections of between 10% and 20%. Yet the market has bounced back following each pullback and then has moved higher. A correction is not the end of the bull market. What might signal that we are at the end of this bull market? Euphoria. And I still see no signs of euphoria in this market. In the past,
I have likened the current bull market to that of 1982-2000, and I am confident in the strength of the market today and believe the economy will continue its slow, but steady, growth into the coming year.
Thank you for your continued confidence and investment in our funds. If you have any questions or would like to speak with us directly, please don’t hesitate to call us at (800) 966-4354.
Best regards,
Neil J. Hennessy
President and Chief Investment Officer
Past performance does not guarantee future results.
Mutual fund investing involves risk. Principal loss is possible.
Opinions expressed are those of Neil Hennessy and are subject to change, are not guaranteed, and should not be considered investment advice.
The Dow Jones Industrial Average and S&P 500 Index are unmanaged indices commonly used to measure the performance of U.S. stocks. One cannot invest directly in an index.
Price to earnings is calculated by dividing a company’s market price per share by its earnings per share. Dividend yield is calculated as the annual dividends paid by a company divided by the price of a share of its stock. Cash flow provides an indication of a company’s financial strength and represents earnings before depreciation, amortization, and non-cash charges.
| HENNESSY FUNDS | 1-800-966-4354 | |
Performance Overview (Unaudited)
CHANGE IN VALUE OF $10,000 INVESTMENT
This graph illustrates the performance of an initial investment of $10,000 made in the Fund on its inception date and assumes the reinvestment of dividends.
AVERAGE ANNUAL TOTAL RETURN FOR PERIODS ENDED OCTOBER 31, 2017
| | | | Since |
| | One | Five | Inception |
| | Year | Years | (3/20/09) |
| Hennessy Cornerstone Large Growth Fund – | | | |
| Investor Class (HFLGX) | 15.70% | 12.66% | 16.37% |
| Hennessy Cornerstone Large Growth Fund – | | | |
| Institutional Class (HILGX) | 16.00% | 12.90% | 16.66% |
Russell 1000® Index | 23.67% | 15.18% | 17.69% |
| S&P 500 Index | 23.63% | 15.18% | 17.52% |
Expense ratios: 1.26% (Investor Class); 1.02% (Institutional Class)
Performance data quoted represents past performance; past performance does not guarantee future results. The investment return and principal value of an investment will fluctuate so that an investor’s shares, when redeemed, may be worth more or less than their original cost. The performance table does not reflect the deduction of taxes that a shareholder would pay on Fund distributions or the redemption of Fund shares. Current performance of the Fund may be lower or higher than the performance quoted. Performance data current to the most recent month end may be obtained by visiting hennessyfunds.com.
The Russell 1000® Index is commonly used to measure the performance of large capitalization U.S. stocks. The S&P 500 Index is an unmanaged index commonly used to measure the performance of U.S. stocks. One cannot invest directly in an index.
Frank Russell Company (“Russell”) is the source and owner of the trademarks, service marks, and copyrights related to the Russell Indexes. Russell® is a trademark of Frank Russell Company. Neither Russell nor its licensors accept any liability for any errors or omissions in the Russell Indexes or Russell ratings or underlying data and no party may rely on any Russell Indexes or Russell ratings or underlying data contained in this communication. No further distribution of Russell data is permitted without Russell’s express written consent. Russell does not promote, sponsor, or endorse the content of this communication.
The expense ratios presented are from the most recent prospectus. The expense ratios for the current reporting period are available in the Financial Highlights section of this report.
PERFORMANCE NARRATIVE
Portfolio Managers Neil J. Hennessy, Brian E. Peery, and Ryan C. Kelley
Performance:
For the 12-month period ended October 31, 2017, the Investor Class of the Hennessy Cornerstone Large Growth Fund returned 15.70%, underperforming both the Russell 1000® Index and the S&P 500 Index, which returned 23.67% and 23.63% for the same period, respectively.
On a sector basis, the Fund’s overweight position in the Industrials sector aided overall performance, as did its underweight positions in the Energy and Consumer Staples sectors. However, these positive contributions were offset by the Fund’s overweight position in the Retailing industry group, including Foot Locker, Inc. and Nordstrom, Inc., which hurt the Fund’s relative performance. Many retailers are struggling with slow growth in demand and increased competition from internet shopping. Industrial stocks in the portfolio, which include Rockwell Collins, Inc., Cummins, Inc., and Deere & Company, aided the portfolio’s overall performance. The Fund continues to hold the stocks mentioned with the exception of Rockwell Collins, Inc.
Portfolio Strategy:
The Fund’s investment strategy is based on identifying large and well-established companies that trade at below-average price-to-cash flow ratios. The Fund also seeks to invest only in what it deems to be higher-quality businesses, and thus, focuses on companies with high returns on total capital.
Investment Commentary:
We continue to believe that there are good investment opportunities among large-cap stocks. While we believe higher interest rates may lead to an even stronger U.S. Dollar and difficulties for exporters, large-cap companies with more domestically focused businesses are benefiting from steady economic growth at home, low inflation, and low energy prices. Consumer debt levels are reasonable, wage growth is finally starting to accelerate, and revenue growth for larger companies has resumed. Overall, we believe current economic conditions provide a good environment for large-cap, growth-orientated stocks. We remain pleased with the positioning of the portfolio. Relative to the Fund’s benchmarks, the portfolio remains overweight in both the Consumer Discretionary and Industrial sectors, and we think that these areas of the market offer great potential over the next 12 months.
Opinions expressed are those of the Portfolio Managers as of the date written and are subject to change, are not guaranteed, and should not be considered investment advice or an indication of trading intent.
The Russell 1000® Index is commonly used to measure the performance of large-capitalization U.S. stocks. The S&P 500 Index is an unmanaged index commonly used to measure the performance of U.S. stocks. One cannot invest directly in an index.
The Fund may invest in medium-capitalization companies, which may have more limited liquidity and greater price volatility than large-capitalization companies. The Fund’s formula-based strategy may cause the Fund to buy or sell securities at times when it may not be advantageous. Please see the Fund’s prospectus for a more complete discussion of these and other risks.
| HENNESSY FUNDS | 1-800-966-4354 | |
References to specific securities should not be considered a recommendation to buy or sell any security. Fund holdings and sector allocations are subject to change. Please refer to the Schedule of Investments included in this report for additional portfolio information.
Price-to-cash flow ratio is a stock valuation measure calculated by dividing a company’s cash flow per share into its current stock price. Return on capital is a ratio measuring the profitability of a firm expressed as a percentage of funds acquired from investors and lenders.
| PERFORMANCE OVERVIEW/SCHEDULE OF INVESTMENTS |
Financial Statements
Schedule of Investments as of October 31, 2017 |
HENNESSY CORNERSTONE LARGE GROWTH FUND
(% of Net Assets)
| TOP TEN HOLDINGS (EXCLUDING CASH/CASH EQUIVALENTS) | | % NET ASSETS |
| AbbVie, Inc. | | | 2.90 | % |
| VF Corp. | | | 2.76 | % |
| HP, Inc. | | | 2.70 | % |
| T. Rowe Price Group, Inc. | | | 2.67 | % |
| Varian Medical Systems, Inc. | | | 2.56 | % |
| Ameriprise Financial, Inc. | | | 2.50 | % |
| Apple, Inc. | | | 2.50 | % |
| Best Buy Co., Inc. | | | 2.48 | % |
| Lear Corp. | | | 2.45 | % |
| KLA-Tencor Corp. | | | 2.44 | % |
Note: For presentation purposes, the Fund has grouped some of the industry categories. For purposes of categorizing securities for compliance with Section 8(b)(1) of the Investment Company Act of 1940, as amended, the Fund uses more specific industry classifications.
| HENNESSY FUNDS | 1-800-966-4354 | |
| COMMON STOCKS – 97.41% | | Number | | | | | | % of | |
| | | of Shares | | | Value | | | Net Assets | |
| Consumer Discretionary – 33.99% | | | | | | | | | |
| AutoZone, Inc. (a) | | | 2,700 | | | $ | 1,591,650 | | | | 1.53 | % |
| Best Buy Co., Inc. | | | 46,100 | | | | 2,580,678 | | | | 2.48 | % |
| CBS Corp., Class B | | | 31,800 | | | | 1,784,616 | | | | 1.72 | % |
| Darden Restaurants, Inc. | | | 27,500 | | | | 2,262,425 | | | | 2.18 | % |
| Dollar General Corp. | | | 26,900 | | | | 2,174,596 | | | | 2.09 | % |
| Foot Locker, Inc. | | | 29,000 | | | | 872,320 | | | | 0.84 | % |
| Harley-Davidson, Inc. | | | 35,600 | | | | 1,685,304 | | | | 1.62 | % |
| L Brands, Inc. | | | 34,500 | | | | 1,484,880 | | | | 1.43 | % |
| Lear Corp. | | | 14,500 | | | | 2,546,055 | | | | 2.45 | % |
| Nordstrom, Inc. | | | 45,400 | | | | 1,800,110 | | | | 1.73 | % |
| Omnicom Group, Inc. | | | 23,800 | | | | 1,599,122 | | | | 1.54 | % |
| Tapestry, Inc. | | | 54,000 | | | | 2,211,300 | | | | 2.13 | % |
| Target Corp. | | | 31,200 | | | | 1,842,048 | | | | 1.77 | % |
| The Gap, Inc. | | | 86,700 | | | | 2,253,333 | | | | 2.17 | % |
| The Interpublic Group of Companies, Inc. | | | 87,700 | | | | 1,688,225 | | | | 1.63 | % |
| The Walt Disney Co. | | | 18,500 | | | | 1,809,485 | | | | 1.74 | % |
| VF Corp. | | | 41,200 | | | | 2,869,580 | | | | 2.76 | % |
| Yum! Brands, Inc. | | | 30,400 | | | | 2,263,280 | | | | 2.18 | % |
| | | | | | | | 35,319,007 | | | | 33.99 | % |
| | | | | | | | | | | | | |
| Consumer Staples – 1.23% | | | | | | | | | | | | |
| The Kroger Co. | | | 61,600 | | | | 1,275,120 | | | | 1.23 | % |
| | | | | | | | | | | | | |
| Financials – 5.17% | | | | | | | | | | | | |
| Ameriprise Financial, Inc. | | | 16,600 | | | | 2,598,564 | | | | 2.50 | % |
| T. Rowe Price Group, Inc. | | | 29,900 | | | | 2,777,710 | | | | 2.67 | % |
| | | | | | | | 5,376,274 | | | | 5.17 | % |
| | | | | | | | | | | | | |
| Health Care – 16.76% | | | | | | | | | | | | |
| AbbVie, Inc. | | | 33,400 | | | | 3,014,350 | | | | 2.90 | % |
| AmerisourceBergen Corp. | | | 22,200 | | | | 1,708,290 | | | | 1.64 | % |
| Biogen, Inc. (a) | | | 7,500 | | | | 2,337,450 | | | | 2.25 | % |
| Cardinal Health, Inc. | | | 26,000 | | | | 1,609,400 | | | | 1.55 | % |
| Gilead Sciences, Inc. | | | 30,300 | | | | 2,271,288 | | | | 2.18 | % |
| HCA Holdings, Inc. (a) | | | 24,400 | | | | 1,845,860 | | | | 1.78 | % |
| McKesson Corp. | | | 14,300 | | | | 1,971,684 | | | | 1.90 | % |
| Varian Medical Systems, Inc. (a) | | | 25,500 | | | | 2,656,845 | | | | 2.56 | % |
| | | | | | | | 17,415,167 | | | | 16.76 | % |
The accompanying notes are an integral part of these financial statements.
| COMMON STOCKS | | Number | | | | | | % of | |
| | | of Shares | | | Value | | | Net Assets | |
| Industrials – 22.39% | | | | | | | | | |
| Alaska Air Group, Inc. | | | 20,800 | | | $ | 1,373,424 | | | | 1.32 | % |
| American Airlines Group, Inc. | | | 44,900 | | | | 2,102,218 | | | | 2.02 | % |
| Cummins, Inc. | | | 13,900 | | | | 2,458,632 | | | | 2.37 | % |
| Deere & Co. | | | 18,700 | | | | 2,484,856 | | | | 2.39 | % |
| Delta Air Lines, Inc. | | | 42,000 | | | | 2,101,260 | | | | 2.02 | % |
| J.B. Hunt Transport Services, Inc. | | | 20,600 | | | | 2,191,634 | | | | 2.11 | % |
| Lockheed Martin Corp. | | | 7,900 | | | | 2,434,464 | | | | 2.34 | % |
| Southwest Airlines Co. | | | 38,200 | | | | 2,057,452 | | | | 1.98 | % |
| Union Pacific Corp. | | | 18,800 | | | | 2,176,852 | | | | 2.10 | % |
| United Continental Holdings, Inc. (a) | | | 28,200 | | | | 1,649,136 | | | | 1.59 | % |
| United Parcel Service, Inc., Class B | | | 19,000 | | | | 2,233,070 | | | | 2.15 | % |
| | | | | | | | 23,262,998 | | | | 22.39 | % |
| | | | | | | | | | | | | |
| Information Technology – 13.71% | | | | | | | | | | | | |
| Apple, Inc. | | | 15,350 | | | | 2,594,764 | | | | 2.50 | % |
| HP, Inc. | | | 130,400 | | | | 2,810,120 | | | | 2.70 | % |
| International Business Machines Corp. | | | 11,500 | | | | 1,771,690 | | | | 1.71 | % |
| KLA-Tencor Corp. | | | 23,300 | | | | 2,537,137 | | | | 2.44 | % |
| Skyworks Solutions, Inc. | | | 22,100 | | | | 2,516,306 | | | | 2.42 | % |
| The Western Union Co. | | | 101,500 | | | | 2,015,790 | | | | 1.94 | % |
| | | | | | | | 14,245,807 | | | | 13.71 | % |
| | | | | | | | | | | | | |
| Materials – 2.24% | | | | | | | | | | | | |
| Air Products and Chemicals, Inc. | | | 14,600 | | | | 2,327,678 | | | | 2.24 | % |
| | | | | | | | | | | | | |
| Telecommunication Services – 1.92% | | | | | | | | | | | | |
| Verizon Communications, Inc. | | | 41,800 | | | | 2,000,966 | | | | 1.92 | % |
| | | | | | | | | | | | | |
| Total Common Stocks | | | | | | | | | | | | |
| (Cost $90,475,967) | | | | | | | 101,223,017 | | | | 97.41 | % |
The accompanying notes are an integral part of these financial statements.
| HENNESSY FUNDS | 1-800-966-4354 | |
| SHORT-TERM INVESTMENTS – 2.97% | | Number | | | | | | % of | |
| | | of Shares | | | Value | | | Net Assets | |
| Money Market Funds – 2.97% | | | | | | | | | |
| Fidelity Government Portfolio, Institutional Class, 0.92% (b) | | | 3,085,041 | | | $ | 3,085,041 | | | | 2.97 | % |
| | | | | | | | | | | | | |
| Total Short-Term Investments | | | | | | | | | | | | |
| (Cost $3,085,041) | | | | | | | 3,085,041 | | | | 2.97 | % |
| | | | | | | | | | | | | |
| Total Investments | | | | | | | | | | | | |
| (Cost $93,561,008) – 100.38% | | | | | | | 104,308,058 | | | | 100.38 | % |
| Liabilities in Excess of Other Assets – (0.38)% | | | | | | | (393,640 | ) | | | (0.38 | )% |
TOTAL NET ASSETS – 100.00% | | | | | | $ | 103,914,418 | | | | 100.00 | % |
Percentages are stated as a percent of net assets.
| (a) | Non-income producing security. |
| (b) | The rate listed is the fund’s 7-day yield as of October 31, 2017. |
Summary of Fair Value Exposure at October 31, 2017
The following is a summary of the inputs used to value the Fund’s net assets as of October 31, 2017 (See Note 3 in the accompanying notes to the financial statements):
| Common Stocks | | Level 1 | | | Level 2 | | | Level 3 | | | Total | |
| Consumer Discretionary | | $ | 35,319,007 | | | $ | — | | | $ | — | | | $ | 35,319,007 | |
| Consumer Staples | | | 1,275,120 | | | | — | | | | — | | | | 1,275,120 | |
| Financials | | | 5,376,274 | | | | — | | | | — | | | | 5,376,274 | |
| Health Care | | | 17,415,167 | | | | — | | | | — | | | | 17,415,167 | |
| Industrials | | | 23,262,998 | | | | — | | | | — | | | | 23,262,998 | |
| Information Technology | | | 14,245,807 | | | | — | | | | — | | | | 14,245,807 | |
| Materials | | | 2,327,678 | | | | — | | | | — | | | | 2,327,678 | |
| Telecommunication Services | | | 2,000,966 | | | | — | | | | — | | | | 2,000,966 | |
| Total Common Stocks | | $ | 101,223,017 | | | $ | — | | | $ | — | | | $ | 101,223,017 | |
| Short-Term Investments | | | | | | | | | | | | | | | | |
| Money Market Funds | | $ | 3,085,041 | | | $ | — | | | $ | — | | | $ | 3,085,041 | |
| Total Short-Term Investments | | $ | 3,085,041 | | | $ | — | | | $ | — | | | $ | 3,085,041 | |
| Total Investments | | $ | 104,308,058 | | | $ | — | | | $ | — | | | $ | 104,308,058 | |
Transfers between levels are recognized at the end of the reporting period. During the year ended October 31, 2017, the Fund recognized no transfers between levels.
The accompanying notes are an integral part of these financial statements.
| SCHEDULE OF INVESTMENTS/STATEMENT OF ASSETS AND LIABILITIES |
Financial Statements
Statement of Assets and Liabilities as of October 31, 2017 |
| ASSETS: | | | |
| Investments in securities, at value (cost $93,561,008) | | $ | 104,308,058 | |
| Dividends and interest receivable | | | 91,286 | |
| Receivable for fund shares sold | | | 21,060 | |
| Prepaid expenses and other assets | | | 15,069 | |
| Total Assets | | | 104,435,473 | |
| | | | | |
| LIABILITIES: | | | | |
| Payable for fund shares redeemed | | | 225,007 | |
| Payable to advisor | | | 66,719 | |
| Payable to administrator | | | 17,014 | |
| Payable to auditor | | | 21,316 | |
| Accrued distribution fees | | | 159,056 | |
| Accrued service fees | | | 7,940 | |
| Accrued trustees fees | | | 5,578 | |
| Accrued expenses and other payables | | | 18,425 | |
| Total Liabilities | | | 521,055 | |
| NET ASSETS | | $ | 103,914,418 | |
| | | | | |
| NET ASSETS CONSIST OF: | | | | |
| Capital stock | | $ | 86,592,347 | |
| Accumulated net investment income | | | 1,052,238 | |
| Accumulated net realized gain on investments | | | 5,522,783 | |
| Unrealized net appreciation on investments | | | 10,747,050 | |
| Total Net Assets | | $ | 103,914,418 | |
| | | | | |
| NET ASSETS | | | | |
| Investor Class: | | | | |
| Shares authorized (no par value) | | Unlimited | |
| Net assets applicable to outstanding Investor Class shares | | $ | 91,740,027 | |
| Shares issued and outstanding | | | 7,805,612 | |
| Net asset value, offering price and redemption price per share | | $ | 11.75 | |
| | | | | |
| Institutional Class: | | | | |
| Shares authorized (no par value) | | Unlimited | |
| Net assets applicable to outstanding Institutional Class shares | | $ | 12,174,391 | |
| Shares issued and outstanding | | | 1,025,714 | |
| Net asset value, offering price and redemption price per share | | $ | 11.87 | |
The accompanying notes are an integral part of these financial statements.
| HENNESSY FUNDS | 1-800-966-4354 | |
Financial Statements
Statement of Operations for the year ended October 31, 2017 |
| INVESTMENT INCOME: | | | |
| Dividend income | | $ | 2,329,687 | |
| Interest income | | | 26,691 | |
| Total investment income | | | 2,356,378 | |
| | | | | |
| EXPENSES: | | | | |
| Investment advisory fees (See Note 5) | | | 793,062 | |
| Distribution fees – Investor Class (See Note 5) | | | 141,583 | |
| Administration, fund accounting, custody and transfer agent fees (See Note 5) | | | 102,360 | |
| Service fees – Investor Class (See Note 5) | | | 94,389 | |
| Sub-transfer agent expenses – Investor Class (See Note 5) | | | 43,629 | |
| Sub-transfer agent expenses – Institutional Class (See Note 5) | | | 5,915 | |
| Federal and state registration fees | | | 33,949 | |
| Compliance expense (See Note 5) | | | 28,705 | |
| Audit fees | | | 21,276 | |
| Trustees’ fees and expenses | | | 16,402 | |
| Reports to shareholders | | | 12,433 | |
| Legal fees | | | 616 | |
| Interest expense (See Note 7) | | | 287 | |
| Other expenses | | | 9,534 | |
| Total expenses | | | 1,304,140 | |
| NET INVESTMENT INCOME | | $ | 1,052,238 | |
| | | | | |
| REALIZED AND UNREALIZED GAINS: | | | | |
| Net realized gain on investments | | $ | 10,781,271 | |
| Net change in unrealized appreciation on investments | | | 3,606,256 | |
| Net gain on investments | | | 14,387,527 | |
| NET INCREASE IN NET ASSETS RESULTING FROM OPERATIONS | | $ | 15,439,765 | |
The accompanying notes are an integral part of these financial statements.
| STATEMENT OF OPERATIONS/STATEMENTS OF CHANGES IN NET ASSETS |
Financial Statements
| Statements of Changes in Net Assets |
| | | Year Ended | | | Year Ended | |
| | | October 31, 2017 | | | October 31, 2016 | |
| OPERATIONS: | | | | | | |
| Net investment income | | $ | 1,052,238 | | | $ | 1,258,574 | |
| Net realized gain (loss) on investments | | | 10,781,271 | | | | (4,660,170 | ) |
| Net change in unrealized appreciation on investments | | | 3,606,256 | | | | 5,641,171 | |
| Net increase in net assets resulting from operations | | | 15,439,765 | | | | 2,239,575 | |
| | | | | | | | | |
| DISTRIBUTIONS TO SHAREHOLDERS FROM: | | | | | | | | |
| Net investment income | | | | | | | | |
| Investor Class | | | (1,086,070 | ) | | | (1,432,337 | ) |
| Institutional Class | | | (172,457 | ) | | | (220,462 | ) |
| Net realized gains | | | | | | | | |
| Investor Class | | | — | | | | (19,800,250 | ) |
| Institutional Class | | | — | | | | (2,853,456 | ) |
| Total distributions | | | (1,258,527 | ) | | | (24,306,505 | ) |
| | | | | | | | | |
| CAPITAL SHARE TRANSACTIONS: | | | | | | | | |
| Proceeds from shares subscribed – Investor Class | | | 6,295,964 | | | | 3,720,536 | |
| Proceeds from shares subscribed – Institutional Class | | | 772,639 | | | | 414,799 | |
| Dividends reinvested – Investor Class | | | 1,010,431 | | | | 20,149,648 | |
| Dividends reinvested – Institutional Class | | | 169,405 | | | | 2,974,276 | |
| Cost of shares redeemed – Investor Class | | | (15,757,878 | ) | | | (15,493,334 | ) |
| Cost of shares redeemed – Institutional Class | | | (2,723,788 | ) | | | (2,192,433 | ) |
| Net increase (decrease) in net assets derived | | | | | | | | |
| from capital share transactions | | | (10,233,227 | ) | | | 9,573,492 | |
| TOTAL INCREASE (DECREASE) IN NET ASSETS | | | 3,948,011 | | | | (12,493,438 | ) |
| | | | | | | | | |
| NET ASSETS: | | | | | | | | |
| Beginning of year | | | 99,966,407 | | | | 112,459,845 | |
| End of year | | $ | 103,914,418 | | | $ | 99,966,407 | |
| Undistributed net investment income, end of year | | $ | 1,052,238 | | | $ | 1,258,527 | |
| | | | | | | | | |
| CHANGES IN SHARES OUTSTANDING: | | | | | | | | |
| Shares sold – Investor Class | | | 565,507 | | | | 366,149 | |
| Shares sold – Institutional Class | | | 68,027 | | | | 40,906 | |
| Shares issued to holders as reinvestment | | | | | | | | |
| of dividends – Investor Class | | | 92,025 | | | | 2,044,705 | |
| Shares issued to holders as reinvestment | | | | | | | | |
| of dividends – Institutional Class | | | 15,303 | | | | 299,398 | |
| Shares redeemed – Investor Class | | | (1,394,127 | ) | | | (1,461,302 | ) |
| Shares redeemed – Institutional Class | | | (238,017 | ) | | | (214,449 | ) |
| Net increase (decrease) in shares outstanding | | | (891,282 | ) | | | 1,075,407 | |
The accompanying notes are an integral part of these financial statements.
| HENNESSY FUNDS | 1-800-966-4354 | |
Financial Statements
For an Investor Class share outstanding throughout each year
PER SHARE DATA:
Net asset value, beginning of year
Income from investment operations:
Net investment income
Net realized and unrealized gains on investments
Total from investment operations
Less distributions:
Dividends from net investment income
Dividends from net realized gains
Total distributions
Net asset value, end of year
TOTAL RETURN
SUPPLEMENTAL DATA AND RATIOS:
Net assets, end of year (millions)
Ratio of expenses to average net assets
Ratio of net investment income to average net assets
Portfolio turnover rate(1)
(1) | Portfolio turnover is calculated on the basis of the Fund as a whole. |
The accompanying notes are an integral part of these financial statements.
| FINANCIAL HIGHLIGHTS — INVESTOR CLASS |
| Year Ended October 31, | |
| 2017 | | | 2016 | | | 2015 | | | 2014 | | | 2013 | |
| | | | | | | | | | | | | | |
| $ | 10.27 | | | $ | 12.99 | | | $ | 15.16 | | | $ | 13.56 | | | $ | 10.77 | |
| | | | | | | | | | | | | | | | | | | |
| | | | | | | | | | | | | | | | | | | |
| | 0.11 | | | | 0.09 | | | | 0.17 | | | | 0.15 | | | | 0.14 | |
| | 1.49 | | | | 0.08 | | | | 0.04 | | | | 2.28 | | | | 2.77 | |
| | 1.60 | | | | 0.17 | | | | 0.21 | | | | 2.43 | | | | 2.91 | |
| | | | | | | | | | | | | | | | | | | |
| | | | | | | | | | | | | | | | | | | |
| | (0.12 | ) | | | (0.16 | ) | | | (0.14 | ) | | | (0.15 | ) | | | (0.10 | ) |
| | — | | | | (2.73 | ) | | | (2.24 | ) | | | (0.68 | ) | | | (0.02 | ) |
| | (0.12 | ) | | | (2.89 | ) | | | (2.38 | ) | | | (0.83 | ) | | | (0.12 | ) |
| $ | 11.75 | | | $ | 10.27 | | | $ | 12.99 | | | $ | 15.16 | | | $ | 13.56 | |
| | | | | | | | | | | | | | | | | | | |
| | 15.70 | % | | | 2.63 | % | | | 1.11 | % | | | 18.73 | % | | | 27.32 | % |
| | | | | | | | | | | | | | | | | | | |
| | | | | | | | | | | | | | | | | | | |
| $ | 91.74 | | | $ | 87.73 | | | $ | 98.64 | | | $ | 105.51 | | | $ | 88.77 | |
| | 1.25 | % | | | 1.25 | % | | | 1.09 | % | | | 1.15 | % | | | 1.19 | % |
| | 0.95 | % | | | 1.22 | % | | | 1.37 | % | | | 1.12 | % | | | 1.10 | % |
| | 65 | % | | | 53 | % | | | 79 | % | | | 57 | % | | | 73 | % |
The accompanying notes are an integral part of these financial statements.
| HENNESSY FUNDS | 1-800-966-4354 | |
Financial Statements
For an Institutional Class share outstanding throughout each year
PER SHARE DATA:
Net asset value, beginning of year
Income from investment operations:
Net investment income
Net realized and unrealized gains on investments
Total from investment operations
Less distributions:
Dividends from net investment income
Dividends from net realized gains
Total distributions
Net asset value, end of year
TOTAL RETURN
SUPPLEMENTAL DATA AND RATIOS:
Net assets, end of year (millions)
Ratio of expenses to average net assets:
Before expense reimbursement
After expense reimbursement
Ratio of net investment income to average net assets:
Before expense reimbursement
After expense reimbursement
Portfolio turnover rate(1)
(1) | Portfolio turnover is calculated on the basis of the Fund as a whole. |
The accompanying notes are an integral part of these financial statements.
| FINANCIAL HIGHLIGHTS — INSTITUTIONAL CLASS |
| Year Ended October 31, | |
| 2017 | | | 2016 | | | 2015 | | | 2014 | | | 2013 | |
| | | | | | | | | | | | | | |
| $ | 10.37 | | | $ | 13.10 | | | $ | 15.30 | | | $ | 13.68 | | | $ | 10.85 | |
| | | | | | | | | | | | | | | | | | | |
| | | | | | | | | | | | | | | | | | | |
| | 0.13 | | | | 0.13 | | | | 0.20 | | | | 0.17 | | | | 0.09 | |
| | 1.52 | | | | 0.07 | | | | 0.02 | | | | 2.30 | | | | 2.88 | |
| | 1.65 | | | | 0.20 | | | | 0.22 | | | | 2.47 | | | | 2.97 | |
| | | | | | | | | | | | | | | | | | | |
| | | | | | | | | | | | | | | | | | | |
| | (0.15 | ) | | | (0.17 | ) | | | (0.16 | ) | | | (0.17 | ) | | | (0.12 | ) |
| | — | | | | (2.76 | ) | | | (2.26 | ) | | | (0.68 | ) | | | (0.02 | ) |
| | (0.15 | ) | | | (2.93 | ) | | | (2.42 | ) | | | (0.85 | ) | | | (0.14 | ) |
| $ | 11.87 | | | $ | 10.37 | | | $ | 13.10 | | | $ | 15.30 | | | $ | 13.68 | |
| | | | | | | | | | | | | | | | | | | |
| | 16.00 | % | | | 2.92 | % | | | 1.19 | % | | | 18.96 | % | | | 27.63 | % |
| | | | | | | | | | | | | | | | | | | |
| | | | | | | | | | | | | | | | | | | |
| $ | 12.17 | | | $ | 12.24 | | | $ | 13.82 | | | $ | 14.88 | | | $ | 16.19 | |
| | | | | | | | | | | | | | | | | | | |
| | 1.00 | % | | | 1.01 | % | | | 0.99 | % | | | 1.06 | % | | | 1.10 | % |
| | 1.00 | % | | | 1.01 | % | | | 0.99 | % | | | 0.98 | % | | | 0.98 | % |
| | | | | | | | | | | | | | | | | | | |
| | 1.20 | % | | | 1.47 | % | | | 1.47 | % | | | 1.21 | % | | | 1.38 | % |
| | 1.20 | % | | | 1.47 | % | | | 1.47 | % | | | 1.30 | % | | | 1.50 | % |
| | 65 | % | | | 53 | % | | | 79 | % | | | 57 | % | | | 73 | % |
The accompanying notes are an integral part of these financial statements.
| HENNESSY FUNDS | 1-800-966-4354 | |
Financial Statements
Notes to the Financial Statements October 31, 2017 |
1). ORGANIZATION
The Hennessy Cornerstone Large Growth Fund (the “Fund”) is a series of Hennessy Funds Trust (the “Trust”), which was organized as a Delaware statutory trust on September 17, 1992. The Fund is an open-end management investment company registered under the Investment Company Act of 1940, as amended. The investment objective of the Fund is long-term growth of capital. The Fund is a diversified fund.
The Fund offers Investor Class and Institutional Class shares. Each class of shares differs principally in its respective 12b-1 distribution and service, shareholder servicing, and sub-transfer agent expenses. There are no sales charges. Each class has identical rights to earnings, assets, and voting privileges, except for class-specific expenses and exclusive rights to vote on matters affecting only an individual class.
As an investment company, the Fund follows the investment company accounting and reporting guidance of the Financial Accounting Standards Board (“FASB”) Accounting Standard Codification Topic 946 “Financial Services—Investment Companies.”
2). SIGNIFICANT ACCOUNTING POLICIES
The following is a summary of significant accounting policies consistently followed by the Fund in the preparation of the financial statements. These policies conform to U.S. generally accepted accounting principles (“GAAP”).
| a). | Investment Valuation – All investments in securities are recorded at their estimated fair value, as described in Note 3. |
| | |
| b). | Federal Income Taxes – No provision for federal income taxes or excise taxes has been made because the Fund has elected to be taxed as a “regulated investment company” and intends to distribute substantially all of its taxable income to its shareholders and otherwise comply with the provisions of the Internal Revenue Code of 1986, as amended, applicable to regulated investment companies. Net investment income/loss and realized gains/losses for federal income tax purposes may differ from those reported in the financial statements because of temporary book and tax basis differences. Temporary differences are primarily the result of the treatment of wash sales for tax reporting purposes. The Fund recognizes interest and penalties related to income tax benefits, if any, in the Statement of Operations as an income tax expense. Distributions from net realized gains for book purposes may include short-term capital gains, which are included as ordinary income to shareholders for tax purposes. The Fund may utilize equalization accounting for tax purposes and designate earnings and profits, including net realized gains distributed to shareholders on redemption of shares, as part of the dividends paid deduction for income tax purposes. |
| | Due to inherent differences in the recognition of income, expenses, and realized gains/losses under GAAP and federal income tax regulations, permanent differences between book and tax basis for reporting for fiscal year 2017 have been identified and appropriately reclassified in the Statement of Assets and Liabilities. The adjustments are as follows: |
| | Accumulated | Accumulated | | |
| | Net Investment | Net Realized | | |
| | Income | Gain on Investments | Capital Stock | |
| | $ — | $(570,865) | $570,865 | |
| NOTES TO THE FINANCIAL STATEMENTS |
| c). | Accounting for Uncertainty in Income Taxes – The Fund has accounting policies regarding recognition and measurement of tax positions taken or expected to be taken on a tax return. The tax returns of the Fund for the prior three fiscal years are open for examination. The Fund has reviewed all open tax years in major jurisdictions and concluded that there is no impact on the Fund’s net assets and no tax liability resulting from unrecognized tax benefits relating to uncertain income tax positions taken or expected to be taken on a tax return. The Fund’s major tax jurisdictions are U.S. federal and Delaware. |
| | |
| d). | Income and Expenses – Dividend income is recognized on the ex-dividend date or as soon as information is available to the Fund. Interest income, which includes the amortization of premium and accretion of discount, is recognized on an accrual basis. The Fund is charged for those expenses that are directly attributable to the portfolio, such as advisory, administration, and certain shareholder service fees. Income, expenses (other than expenses attributable to a specific class), and realized and unrealized gains/losses on investments are allocated to each class of shares based on such class’s net assets. |
| | |
| e). | Distributions to Shareholders – Dividends from net investment income for the Fund, if any, are declared and paid annually, usually in December. Distributions of net realized capital gains, if any, are declared and paid annually, usually in December. |
| | |
| f). | Security Transactions – Investment and shareholder transactions are recorded on the trade date. The Fund determines the realized gain/loss from an investment transaction by comparing the original cost of the security lot sold with the net sale proceeds. Discounts and premiums on securities purchased are accreted/amortized over the life of the respective security. |
| | |
| g). | Use of Estimates – The preparation of financial statements in conformity with GAAP requires management to make estimates and assumptions that affect the reported amounts of assets and liabilities and disclosure of contingent assets and liabilities at the date of the financial statements and the reported change in net assets during the reporting period. Actual results could differ from those estimates. |
| | |
| h). | Share Valuation – The net asset value (“NAV”) per share of the Fund is calculated by dividing (i) the sum of the value of the securities held by the Fund, plus cash or other assets, minus all liabilities (including estimated accrued expenses) by (ii) the total number of shares outstanding for the Fund, rounded to the nearest cent. The Fund’s shares will not be priced on days the New York Stock Exchange is closed for trading. The offering and redemption price per share for the Fund is equal to the Fund’s NAV per share. |
3). SECURITIES VALUATION
The Fund follows authoritative fair valuation accounting standards that establish an authoritative definition of fair value and set out a hierarchy for measuring fair value. These standards require additional disclosures about the various inputs and valuation techniques used to develop the measurements of fair value and a discussion of changes in valuation techniques and related inputs during the period. These inputs are summarized in the three broad levels listed below:
| | Level 1 – | Unadjusted, quoted prices in active markets for identical instruments that the Fund has the ability to access at the date of measurement. |
| | | |
| | Level 2 – | Other significant observable inputs (including, but not limited to, quoted prices in active markets for similar instruments, quoted prices in markets that are not active for identical or similar instruments, and model-derived |
| HENNESSY FUNDS | 1-800-966-4354 | |
| | | valuations in which all significant inputs and significant value drivers are observable in active markets, such as interest rates, prepayment speeds, credit risk curves, default rates, and similar data). |
| | | |
| | Level 3 – | Significant unobservable inputs (including the Fund’s own assumptions about what market participants would use to price the asset or liability based on the best available information) when observable inputs are unavailable. |
Following is a description of the valuation techniques applied to the Fund’s major categories of assets and liabilities measured at fair value on a recurring basis.
| | Equity Securities – Equity securities, including common stocks, preferred stocks, exchange-traded funds, closed-end mutual funds, partnerships, rights, and real estate investment trusts, that are traded on a securities exchange for which a last-quoted sales price is readily available will generally be valued at the last sales price as reported by the primary exchange on which the securities are listed. Securities listed on The NASDAQ Stock Market (“NASDAQ”) will generally be valued at the NASDAQ Official Closing Price, which may differ from the last sales price reported. Securities traded on a securities exchange for which a last-quoted sales price is not readily available will generally be valued at the mean between the bid and ask prices. To the extent these securities are actively traded and valuation adjustments are not applied, they are classified in Level 1 of the fair value hierarchy. |
| | |
| | Registered Investment Companies – Investments in registered investment companies (e.g., mutual funds) are generally priced at the ending NAV provided by the applicable registered investment company’s service agent and will be classified in Level 1 of the fair value hierarchy. |
| | |
| | Debt Securities – Debt securities, including corporate bonds, asset-backed securities, mortgage-backed securities, municipal bonds, U.S. Treasuries, and U.S. government agency issues, are generally valued at market on the basis of valuations furnished by an independent pricing service that utilizes both dealer-supplied valuations and formula-based techniques. The pricing service may consider recently executed transactions in securities of the issuer or comparable issuers, market price quotations (where observable), bond spreads, and fundamental data relating to the issuer. In addition, the model may incorporate observable market data, such as reported sales of similar securities, broker quotes, yields, bids, offers, and reference data. Certain securities are valued primarily using dealer quotations. These securities are generally classified in Level 2 of the fair value hierarchy. |
| | |
| | Short-Term Securities – Short-term equity investments, including money market funds, are valued in the manner specified above. Short-term debt investments with an original term to maturity of 60 days or less are valued at amortized cost, which approximates fair market value. If the original term to maturity of a short-term debt investment exceeded 60 days, then the values as of the 61st day prior to maturity are amortized. Amortized cost is not used if its use would be inappropriate due to credit or other impairments of the issuer, in which case the security’s fair value would be determined, as described below. Short-term securities are generally classified in Level 1 or Level 2 of the fair market hierarchy depending on the inputs used and market activity levels for specific securities. |
The Board of Trustees of the Fund (the “Board”) has adopted fair value pricing procedures that are followed when a price for a security is not readily available or if a significant event has occurred that indicates the closing price of a security no longer represents the true value of that security. Fair value pricing determinations are made in good faith in accordance with these procedures. There are numerous criteria that will be
| NOTES TO THE FINANCIAL STATEMENTS |
given consideration in determining a fair value of a security, such as the trading volume of a security and markets, the values of other similar securities, and news events with direct bearing on a security or markets. Fair value pricing results in an estimated price for a security that reflects the amount the Fund might reasonably expect to receive in a current sale. Depending on the relative significance of the valuation inputs, these securities may be classified in either Level 2 or Level 3 of the fair value hierarchy.
The Board has delegated day-to-day valuation matters to a Valuation Committee comprised of one or more representatives from Hennessy Advisors, Inc., the Fund’s investment advisor (the “Advisor”). The function of the Valuation Committee is to value securities where current and reliable market quotations are not readily available. All actions taken by the Valuation Committee are reviewed by the Board.
The Fund has performed an analysis of all existing investments to determine the significance and character of all inputs to their fair value determination. Various inputs are used to determine the value of the Fund’s investments. The inputs or methodology used for valuing securities are not necessarily an indication of the risk associated with investing in those securities. Details related to the fair valuation hierarchy of the Fund’s securities as of October 31, 2017, are included in the Schedule of Investments.
4). INVESTMENT TRANSACTIONS
Purchases and sales of investment securities (excluding government and short-term investments) for the Fund during fiscal year 2017 were $66,642,568 and $78,804,879, respectively.
There were no purchases or sales/maturities of long-term U.S. government securities for the Fund during fiscal year 2017.
The Fund is permitted to purchase or sell securities from or to another fund in the Hennessy Funds family of funds (the “Hennessy Funds”) under specified conditions outlined in procedures adopted by the Board. The procedures have been designed to ensure that any purchase or sale of securities by the Fund from or to another Hennessy Fund complies with Rule 17a-7 of the Investment Company Act of 1940, as amended. For fiscal year 2017, the Fund did not engage in purchases or sales of securities pursuant to Rule 17a-7 of the Investment Company Act of 1940, as amended.
5). INVESTMENT MANAGEMENT FEE AND OTHER TRANSACTIONS WITH AFFILIATES
The Advisor provides the Fund with investment management services under an Investment Advisory Agreement. The Advisor provides all investment advice, office space, and facilities, as well as most of the personnel needed by the Fund. As compensation for its services, the Advisor is entitled to a monthly fee from the Fund. The fee is based upon the average daily net assets of the Fund at an annual rate of 0.74%. The net investment advisory fees expensed by the Fund during fiscal year 2017 are included in the Statement of Operations.
In the past, the Advisor had contractually agreed to waive its fees and absorb expenses to the extent that the total annual operating expenses exceeded 0.98% of the Fund’s net assets for Institutional Class shares of the Fund (excluding all federal, state and local taxes, interest, brokerage commissions, acquired fund fees and expenses and other costs incurred in connection with the purchase and sale of securities and extraordinary items). The expense limitation agreement was terminated by the Board as of February 28, 2015.
For a period of three years after the year in which the Advisor waived or reimbursed expenses, the Advisor may seek reimbursement from the Fund to the extent that total annual fund operating expenses are less than the expense limitation that was in effect at the time the Advisor waived or reimbursed expenses. As of October 31, 2017, cumulative
| HENNESSY FUNDS | 1-800-966-4354 | |
expenses subject to potential recovery under the aforementioned conditions were $238 for Institutional Class shares, which will expire on October 31, 2018.
The Board has approved a Shareholder Servicing Agreement for Investor Class shares of the Fund, which was instituted to compensate the Advisor for the non-investment management services it provides to the Fund. The Shareholder Servicing Agreement provides for a monthly fee paid to the Advisor at an annual rate of 0.10% of the average daily net assets of the Fund attributable to Investor Class shares. The shareholder service fees expensed by the Fund during fiscal year 2017 are included in the Statement of Operations.
The Fund has adopted a plan pursuant to Rule 12b-1 under the Investment Company Act of 1940, as amended, that authorizes payments in connection with the distribution of the Fund’s shares at an annual rate of up to 0.25% of the Fund’s average daily net assets attributable to Investor Class shares. Even though the authorized rate is up to 0.25%, the Fund is currently only using up to 0.15% of its average daily net assets attributable to Investor Class shares for such purpose. Amounts paid under the plan may be spent on any activities or expenses primarily intended to result in the sale of shares, including, but not limited to, advertising, shareholder account servicing, the printing and mailing of prospectuses to other than current shareholders, the printing and mailing of sales literature, and compensation for sales and marketing activities or to financial institutions and others, such as dealers and distributors. The distribution fees expensed by the Fund during fiscal year 2017 are included in the Statement of Operations.
The Fund has entered into agreements with various brokers, dealers, and financial intermediaries in connection with the sale of shares of the Fund. The agreements provide for periodic payments by the Fund to the brokers, dealers, and financial intermediaries for providing certain shareholder maintenance services (sub-transfer agent expenses). These shareholder services include the pre-processing and quality control of new accounts, shareholder correspondence, answering customer inquiries regarding account status, and facilitating shareholder telephone transactions. The sub-transfer agent fees expensed by the Fund during fiscal year 2017 are included in the Statement of Operations.
U.S. Bancorp Fund Services, LLC (“USBFS”) provides the Fund with administrative, fund accounting, and transfer agent services and necessary office equipment. As administrator, USBFS is responsible for activities such as (i) preparing various federal and state regulatory filings, reports, and returns for the Fund, (ii) preparing reports and materials to be supplied to the Board, (iii) monitoring the activities of the Fund’s custodian, transfer agent, and accountants, and (iv) coordinating the preparation and payment of the Fund’s expenses and reviewing the Fund’s expense accruals. U.S. Bank, N.A., an affiliate of USBFS, serves as the Fund’s custodian. The servicing agreements between the Trust, USBFS, and U.S. Bank N.A. contain a fee schedule that is inclusive of administrative, fund accounting, custody, and transfer agent fees. The administrative, fund accounting, custody, and transfer agent fees expensed by the Fund during fiscal year 2017 are included in the Statement of Operations.
Quasar Distributors, LLC acts as the Fund’s principal underwriter in a continuous public offering of the Fund’s shares. Quasar Distributors, LLC is an affiliate of USBFS and U.S. Bank, N.A.
The officers of the Fund are affiliated with the Advisor. Such officers, with the exception of the Chief Compliance Officer and the Senior Compliance Officer, receive no compensation from the Fund for serving in their respective roles. The Fund, along with the other Hennessy Funds, makes reimbursement payments, on an equal basis, to the Advisor for a portion of the salary and benefits associated with the office of the Chief Compliance Officer and for all of the salary and benefits associated with the office of the
| NOTES TO THE FINANCIAL STATEMENTS |
Senior Compliance Officer. The compliance fees expensed by the Fund during fiscal year 2017 are included in the Statement of Operations.
6). GUARANTEES AND INDEMNIFICATIONS
Under the Hennessy Funds’ organizational documents, their officers and trustees are indemnified by the Hennessy Funds against certain liabilities arising out of the performance of their duties to the Hennessy Funds. Additionally, in the normal course of business, the Hennessy Funds enter into contracts with service providers that contain general indemnification clauses. The Fund’s maximum exposure under these arrangements is unknown as this would involve future claims that may be made against the Fund that have not yet occurred. Currently, the Fund expects the risk of loss to be remote.
7). LINE OF CREDIT
The Fund has an uncommitted line of credit with the other Hennessy Funds in the amount of the lesser of (i) $100,000,000 or (ii) 33.33% of each Hennessy Fund’s net assets, or 30% for the Hennessy Gas Utility Fund and 10% for the Hennessy Balanced Fund, intended to provide short-term financing, if necessary, subject to certain restrictions, in connection with shareholder redemptions. The credit facility is with the Hennessy Funds’ custodian bank, U.S. Bank, N.A. Borrowings under this arrangement bear interest at the bank’s prime rate and are secured by all of the Fund’s assets (as to its own borrowings only). During fiscal year 2017, the Fund had an outstanding average daily balance and a weighted average interest rate of $7,085 and 3.97%, respectively. The interest expensed by the Fund during fiscal year 2017 is included in the Statement of Operations. The maximum amount outstanding for the Fund during the period was $589,000. At October 31, 2017, the Fund did not have any borrowings outstanding under the line of credit.
8). FEDERAL TAX INFORMATION
As of October 31, 2017, the components of accumulated earnings (losses) for income tax purposes were as follows:
| | | Investments | |
| Cost of investments for tax purposes | | $ | 93,561,008 | |
| Gross tax unrealized appreciation | | $ | 17,983,371 | |
| Gross tax unrealized depreciation | | | (7,236,321 | ) |
| Net tax unrealized appreciation | | $ | 10,747,050 | |
| Undistributed ordinary income | | $ | 1,275,496 | |
| Undistributed long-term capital gains | | | 5,299,525 | |
| Total distributable earnings | | $ | 6,575,021 | |
| Other accumulated gain | | $ | — | |
| Total accumulated gain | | $ | 17,322,071 | |
At October 31, 2017, the Fund had no tax basis capital losses to offset future capital gains.
During fiscal year 2017, the capital losses utilized for the Fund were $4,683,932.
Capital losses sustained in fiscal year 2012 and in future taxable years will not expire and may be carried over by the Fund without limitation; however, they will retain the character of the original loss. Furthermore, any loss incurred during those taxable years will be required to be utilized prior to the losses incurred in taxable years prior to 2012. As a result of this ordering rule, pre-enactment capital loss carryforwards may be more likely to expire unused. Under pre-enactment law, capital losses could be carried forward for eight years, and carried forward as short-term capital losses, irrespective of the character of the original loss.
| HENNESSY FUNDS | 1-800-966-4354 | |
At October 31, 2017, the Fund did not defer, on a tax basis, any late-year ordinary losses. Late-year ordinary losses are net ordinary losses incurred after December 31, 2016, but within the taxable year, that are deemed to arise on the first day of the Fund’s next taxable year.
During fiscal years 2017 and 2016, the tax character of distributions paid by the Fund was as follows:
| | | Year Ended | | | Year Ended | |
| | | October 31, 2017 | | | October 31, 2016 | |
Ordinary income(1) | | $ | 1,258,527 | | | $ | 1,652,846 | |
| Long-term capital gain | | | — | | | | 22,653,659 | |
| | | $ | 1,258,527 | | | $ | 24,306,505 | |
(1) Ordinary income includes short-term gain/loss.
9). CHANGE IN AUDITOR DISCLOSURE
On September 11, 2017, the Trust, by action of the Audit Committee of the Board and on behalf of the Fund, the Hennessy Cornerstone Growth Fund, the Hennessy Cornerstone Mid Cap 30 Fund, the Hennessy Cornerstone Value Fund, the Hennessy Total Return Fund, the Hennessy Balanced Fund, the Hennessy Japan Fund, and the Hennessy Japan Small Cap Fund (collectively, the “Applicable Funds”), dismissed KPMG LLP (“KPMG”) and engaged Tait, Weller & Baker LLP (“Tait Weller”) to serve as the independent registered public accounting firm to audit the financial statements of all series of the Trust for fiscal year 2017. Tait Weller previously served as the independent registered public accounting firm for the series of the Trust that are not one of the Applicable Funds.
KPMG’s reports on the financial statements for the Applicable Funds for each of fiscal years 2015 and 2016 contained no adverse opinion or disclaimer of opinion, nor were they qualified or modified as to uncertainty, audit scope, or accounting principles. During fiscal years 2015 and 2016 and the interim period of November 1, 2016, through September 11, 2017 (the “Interim Period”), there were no (i) disagreements with KPMG on any matter of accounting principles or practices, financial statement disclosure, or auditing scope or procedure, which disagreements, if not resolved to the satisfaction of KPMG, would have caused it to make reference to the subject matter of the disagreements in connection with its reports on the Applicable Funds’ financial statements for such years, nor (ii) “reportable events” of the kind described in Item 304(a)(1)(v) of Regulation S-K under the Securities Exchange Act of 1934, as amended.
During fiscal years 2015 and 2016 and the Interim Period, neither the Applicable Funds nor anyone on behalf of the Applicable Funds has consulted Tait Weller on items that concerned (a) the application of accounting principles to a specified transaction, either completed or proposed, or the type of audit opinion that might be rendered on an Applicable Fund’s financial statements, or (b) the subject of a disagreement (as defined in paragraph (a)(1)(iv) of Item 304 of Regulation S-K and related instructions) or reportable events (as described in paragraph (a)(1)(v) of Item 304 of Regulation S-K). The selection of Tait Weller does not reflect any disagreements or dissatisfaction by the Applicable Funds, the Board, or the Audit Committee with the performance of KPMG.
| NOTES TO THE FINANCIAL STATEMENTS |
10). EVENTS SUBSEQUENT TO YEAR END
Management has evaluated the Fund’s related events and transactions that occurred subsequent to October 31, 2017, through the date of issuance of the Fund’s financial statements. Other than as disclosed below, management has determined that there were no subsequent events requiring recognition or disclosure in the financial statements.
On December 7, 2017, capital gains were declared and paid to shareholders of record on December 6, 2017, as follows:
| | Long-term | Short-term |
| Investor Class | $0.40932 | $0.01724 |
| Institutional Class | $0.41414 | $0.01747 |
On November 16, 2017, shareholders of the Rainier Large Cap Equity Fund approved an Agreement and Plan of Reorganization between the Trust, on behalf of the Fund, and Rainier Investment Management Mutual Funds, a Delaware statutory trust, on behalf of the Rainier Large Cap Equity Fund. The Agreement and Plan of Reorganization provided for the transfer of all of the assets of the Rainier Large Cap Equity Fund to the Fund and the assumption of the liabilities (other than any excluded liabilities) of the Rainier Large Cap Equity Fund by the Fund. The Rainier Large Cap Equity Fund and the Fund have substantially similar investment objectives. The reorganization was effective as of December 1, 2017.
| HENNESSY FUNDS | 1-800-966-4354 | |
Report of Independent Registered Public
Accounting Firm
To the Board of Trustees of Hennessy Funds Trust
and the Shareholders of the Hennessy Cornerstone Large Growth Fund
Novato, CA
We have audited the accompanying statement of assets and liabilities, including the schedule of investments, of the Hennessy Cornerstone Large Growth Fund (the “Fund”), a series of Hennessy Funds Trust as of October 31, 2017, and the related statement of operations, the statement of changes in net assets, and the financial highlights for the year then ended. The statement of changes in net assets for the year ended October 31, 2016 and the financial highlights for each of the four years in the period ended October 31, 2016 have been audited by other auditors, whose report dated December 22, 2016 expressed unqualified opinions on such financial statements and financial highlights. These financial statements and financial highlights are the responsibility of the Fund’s management. Our responsibility is to express an opinion on these financial statements and financial highlights based on our audit.
We conducted our audit in accordance with the standards of the Public Company Accounting Oversight Board (United States). Those standards require that we plan and perform the audit to obtain reasonable assurance about whether the financial statements and financial highlights are free of material misstatement. The Fund is not required to have, nor were we engaged to perform, an audit of the Fund’s internal control over financial reporting. Our audit included consideration of internal control over financial reporting as a basis for designing audit procedures that are appropriate in the circumstances, but not for the purposes of expressing an opinion on the effectiveness of the Fund’s internal control over financial reporting. Accordingly, we express no such opinion. An audit includes examining, on a test basis, evidence supporting the amounts and disclosures in the financial statements. Our procedures included confirmation of securities owned as of October 31, 2017, by correspondence with the custodian. An audit also includes assessing the accounting principles used and significant estimates made by management, as well as evaluating the overall financial statement presentation. We believe that our audit provides a reasonable basis for our opinion.
In our opinion, the financial statements and financial highlights referred to above present fairly, in all material respects, the financial position of the Hennessy Cornerstone Large Growth Fund as of October 31, 2017, the results of its operations, the changes in its net assets, and the financial highlights for the year then ended, in conformity with accounting principles generally accepted in the United States of America.
TAIT, WELLER & BAKER LLP
Philadelphia, Pennsylvania
December 22, 2017
| REPORT OF INDEPENDENT REGISTERED PUBLIC ACCOUNTING FIRM/TRUSTEES AND OFFICERS |
Trustees and Officers of the Fund (Unaudited)
The business and affairs of the Funds are managed under the direction of the Board of Trustees of the Trust, and the Board of Trustees elects the Officers of the Trust. Beginning in March 2015, the Board of Trustees has from time to time appointed advisers to the Board of Trustees (“Advisers”), with the intention of having qualified individuals serve in an advisory capacity in order to garner experience in the mutual fund and asset management industry and be considered as potential Trustees in the future. There are currently three Advisers to the Board of Trustees: Brian Alexander, Doug Franklin, and Claire Knoles. As Advisers, Mr. Alexander, Mr. Franklin, and Ms. Knoles attend meetings of the Board and act as non-voting participants. Information pertaining to the Trustees, Advisers, and the Officers of the Trust is set forth below. The Trustees and Officers serve until their successors are duly elected and qualified or until their earlier death, resignation, or removal. Each of the Trustees oversees 14 Hennessy Funds. Unless otherwise indicated, the address of all persons listed below is 7250 Redwood Boulevard, Suite 200, Novato, CA 94945. The Fund’s Statement of Additional Information includes more information about the persons listed below and is available, without charge, upon request by calling 1-800-966-4354.
| | | | Other |
| | | | Directorships |
| | | | Held Outside |
| Name, (Year of Birth), | | | of Fund |
| and Position Held | Start Date | Principal Occupation(s) | Complex During |
with the Trust | of Service | During Past Five Years | Past Five Years(1) |
| |
| Disinterested Trustees and Advisers |
| | | | |
| J. Dennis DeSousa | January 1996 | Mr. DeSousa is a real estate investor. | None. |
| (1936) | | | |
| Trustee | | | |
| | | | |
| Robert T. Doyle | January 1996 | Mr. Doyle has been the Sheriff of | None. |
| (1947) | | Marin County, California since 1996. | |
| Trustee | | | |
| | | | |
| Gerald P. Richardson | May 2004 | Mr. Richardson is an independent | None. |
| (1945) | | consultant in the securities industry. | |
| Trustee | | | |
| | | | |
| Brian Alexander | March 2015 | Mr. Alexander has been employed | None. |
| (1981) | | by Sutter Health Novato Community | |
| Adviser to the Board | | Hospital since 2012, first as an | |
| | | Assistant Administrator and then, | |
| | | beginning in 2013, as the Chief | |
| | | Administrative Officer. From 2011 | |
| | | through 2012, Mr. Alexander was | |
| | | employed by Sutter Health West Bay | |
| | | Region as the Regional Director of | |
| | | Strategic Decision Support. | |
| HENNESSY FUNDS | 1-800-966-4354 | |
| | | | Other |
| | | | Directorships |
| | | | Held Outside |
| Name, (Year of Birth), | | | of Fund |
| and Position Held | Start Date | Principal Occupation(s) | Complex During |
with the Trust | of Service | During Past Five Years | Past Five Years(1) |
| | | | |
| Doug Franklin | March 2016 | Mr. Franklin is a retired insurance | None. |
| (1964) | | industry executive. From 1987 | |
| Adviser to the Board | | through 2015, he was employed | |
| | | by Allianz-Fireman’s Fund Insurance | |
| | | Company in various positions, | |
| | | including Chief Actuary and | |
| | | Chief Risk Officer. | |
| | | | |
| Claire Knoles | December 2015 | Ms. Knoles is a founder of Kiosk and | None. |
| (1974) | | has served as its Chief Operating | |
| Adviser to the Board | | Officer since 2004. Kiosk is a full | |
| | | service marketing agency with | |
| | | offices in the San Francisco Bay | |
| | | Area, Toronto, and Liverpool, UK. | |
| | | | |
Interested Trustee(2) | | | |
| | | | |
| Neil J. Hennessy | January 1996 as | Mr. Hennessy has been employed by | Hennessy |
| (1956) | a Trustee and | Hennessy Advisors, Inc. since 1989 | Advisors, Inc. |
| Trustee, Chairman of | June 2008 as | and currently serves as its President, | |
| the Board, Chief | an Officer | Chairman and Chief Executive Officer. | |
| Investment Officer, | | | |
| Portfolio Manager, | | | |
| and President | | | |
| Name, (Year of Birth), | | |
| and Position Held | Start Date | Principal Occupation(s) |
with the Trust | of Service | During Past Five Years |
| | | |
| Officers | | |
| | | |
| Teresa M. Nilsen | January 1996 | Ms. Nilsen has been employed by Hennessy Advisors, Inc. |
| (1966) | | since 1989 and currently serves as its Executive Vice President, |
| Executive Vice President | | Chief Operations Officer, Chief Financial Officer, and Secretary. |
| and Treasurer | | |
| | | |
| Daniel B. Steadman | March 2000 | Mr. Steadman has been employed by Hennessy Advisors, Inc. |
| (1956) | | since 2000 and currently serves as its Executive Vice President |
| Executive Vice President | | and Chief Compliance Officer. |
| and Secretary | | |
| | | |
| Brian Carlson | December 2013 | Mr. Carlson has been employed by Hennessy Advisors, Inc. |
| (1972) | | since December 2013. Mr. Carlson was previously a co-founder |
| Senior Vice President and | | and principal of Trivium Consultants, LLC from February 2011 |
| Head of Distribution | | through November 2013. |
| | | |
| Jennifer Cheskiewicz | June 2013 | Ms. Cheskiewicz has been employed by Hennessy Advisors, Inc. |
| (1977) | | as its General Counsel since June 2013. She previously served |
| Senior Vice President and | | as in-house counsel to Carlson Capital, L.P., an SEC-registered |
| Chief Compliance Officer | | investment advisor to several private funds, from |
| | | February 2010 to May 2013. |
| TRUSTEES AND OFFICERS OF THE FUND |
| Name, (Year of Birth), | | |
| and Position Held | Start Date | Principal Occupation(s) |
with the Trust | of Service | During Past Five Years |
| | | |
| David Ellison | October 2012 | Mr. Ellison has been employed by Hennessy Advisors, Inc. since |
(1958)(3) | | October 2012. He has served as a Portfolio Manager of the |
| Senior Vice President | | Hennessy Small Cap Financial Fund and the Hennessy Large |
| and Portfolio Manager | | Cap Financial Fund since inception. Mr. Ellison also served as a |
| | | Portfolio Manager of the Hennessy Technology Fund from its |
| | | inception until February 2017. Mr. Ellison served as Director, |
| | | CIO and President of FBR Fund Advisers, Inc. from |
| | | December 1999 to October 2012. |
| | | |
| Ryan Kelley | March 2013 | Mr. Kelley has been employed by Hennessy Advisors, Inc. since |
(1972)(4) | | October 2012. He has served as a Portfolio Manager of the |
| Vice President and | | Hennessy Gas Utility Fund, the Hennessy Small Cap Financial |
| Portfolio Manager | | Fund, and the Hennessy Large Cap Financial Fund since |
| | | October 2014. He served as Co-Portfolio Manager of the same |
| | | funds from March 2013 through September 2014, and as a |
| | | Portfolio Analyst for the Hennessy Funds from October 2012 |
| | | through October 2014. Mr. Kelley has also served as a Portfolio |
| | | Manager of the Hennessy Cornerstone Growth Fund, the |
| | | Hennessy Cornerstone Mid Cap 30 Fund, the Hennessy |
| | | Cornerstone Large Growth Fund, and the Hennessy |
| | | Cornerstone Value Fund and as a Co-Portfolio Manager of the |
| | | Hennessy Technology Fund since February 2017. Mr. Kelley |
| | | served as Portfolio Manager of FBR Fund Advisers, Inc. from |
| | | January 2008 to October 2012. |
| | | |
| Brian Peery | March 2003 as | Mr. Peery has been employed by Hennessy Advisors, Inc. since |
| (1969) | an Officer and | 2002. He has served as a Portfolio Manager of the Hennessy |
| Senior Vice President | February 2011 | Cornerstone Growth Fund, the Hennessy Cornerstone Mid Cap |
| and Portfolio Manager | as a Co-Portfolio | 30 Fund, the Hennessy Cornerstone Large Growth Fund, the |
| | Manager or | Hennessy Cornerstone Value Fund, the Hennessy Total Return |
| | Portfolio Manager | Fund, and the Hennessy Balanced Fund since October 2014. |
| | | He served as Co-Portfolio Manager of the same funds from |
| | | February 2011 through September 2014. Mr. Peery has also |
| | | served as a Portfolio Manager of the Hennessy Gas Utility Fund |
| | | since February 2015 and as Lead Portfolio Manager of the |
| | | Hennessy Technology Fund since February 2017. |
| | | |
| Daniel P. Hennessy | December 2016 | Mr. Daniel Hennessy has been employed by Hennessy Advisors, |
| (1990) | | Inc. since 2015. He has served as an Associate Analyst of the |
| Assistant Vice President | | Hennessy Technology Fund since February 2017. He previously |
| and Associate Analyst | | served as a Mutual Fund Specialist at U.S. Bancorp Fund |
| | | Services, LLC from November 2014 to July 2015. Prior to that, |
| | | he attended the University of San Diego, where he earned a |
| | | degree in Political Science. |
_______________
(1) | Messrs. DeSousa, Doyle, Hennessy, and Richardson previously served on the Board of Directors of Hennessy Mutual Funds, Inc. (“HMFI”), The Hennessy Funds, Inc. (“HFI”), and Hennessy SPARX Funds Trust (“HSFT”). Pursuant to an internal reorganization effective as of February 28, 2014, the series of HFMI, HFI, and HSFT were reorganized into corresponding series of Hennessy Funds Trust that mirrored them. Subsequent to the reorganization, HFMI, HFI, and HSFT were dissolved. |
(2) | Mr. Hennessy is considered an “interested person,” as defined in the Investment Company Act of 1940, as amended, because he is an officer of the Hennessy Funds. |
(3) | The address of this officer is 101 Federal Street, Suite 1900, Boston, MA 02110. |
(4) | The address of this officer is 1340 Environ Way, Chapel Hill, NC 27517. |
| HENNESSY FUNDS | 1-800-966-4354 | |
Expense Example (Unaudited)
October 31, 2017
As a shareholder of the Fund, you incur two types of costs: (1) transaction costs, including sales charges (loads) on purchase payments, reinvested dividends, or other distributions, redemption fees, and exchange fees; and (2) ongoing costs, including management fees, service fees, and other Fund expenses. This Example is intended to help you understand your ongoing costs (in dollars) of investing in the Fund and to compare these costs with the ongoing costs of investing in other mutual funds. The Example is based on an investment of $1,000 invested at the beginning of the period and held for the entire period from May 1, 2017, through October 31, 2017.
Actual Expenses
The first line of the table below under the “Investor Class” and “Institutional Class” headings provides information about actual account values and actual expenses. Although the Fund charges no sales loads or transaction fees, you will be assessed fees for outgoing wire transfers, returned checks and stop payment orders at prevailing rates charged by U.S. Bancorp Fund Services, LLC, the Fund’s transfer agent. If you request that a redemption be made by wire transfer, currently a $15 fee is charged by the Fund’s transfer agent. IRA accounts will be charged a $15 annual maintenance fee. The example below includes, but is not limited to, management fees, shareholder servicing fees, fund accounting, custody, and transfer agent fees. However, the example below does not include portfolio trading commissions and related expenses, and other extraordinary expenses as determined under generally accepted accounting principles. You may use the information in this line, together with the amount you invested, to estimate the expenses that you paid over the period. Simply divide your account value by $1,000 (for example, an $8,600 account value divided by $1,000 = 8.6), then multiply the result by the number in the first line of the table under the “Investor Class” or “Institutional Class” headings in the column entitled “Expenses Paid During Period” to estimate the expenses you paid on your account during this period.
Hypothetical Example for Comparison Purposes
The second line of the table below under the “Investor Class” and “Institutional Class” headings provides information about hypothetical account values and hypothetical expenses based on the Fund’s actual expense ratios and an assumed rate of return of 5% per year before expenses, which is not the Fund’s actual return. The hypothetical account values and expenses may not be used to estimate the actual ending account balance or expenses you paid for the period. You may use this information to compare the ongoing costs of investing in the Fund and other funds. To do so, compare this 5% hypothetical example with the 5% hypothetical examples that appear in the shareholder reports of the other funds. Please note that the expenses shown in the table are meant to highlight your ongoing costs only and do not reflect any transactional costs, such as sales charges (loads), or exchange fees. Therefore, the second line of the table under the “Investor Class” and “Institutional Class” headings is useful in comparing ongoing costs only, and will not help you determine the relative total costs of owning different funds. In addition, if these transactional costs were included, your costs would have been higher.
| | | | Expenses Paid |
| | Beginning | Ending | During Period(1) |
| | Account Value | Account Value | May 1, 2017 – |
| | May 1, 2017 | October 31, 2017 | October 31, 2017 |
| Investor Class | | | |
| Actual | $1,000.00 | $1,035.20 | $6.41 |
| Hypothetical (5% return before expenses) | $1,000.00 | $1,018.90 | $6.36 |
| | | | |
| Institutional Class | | | |
| Actual | $1,000.00 | $1,036.70 | $5.13 |
| Hypothetical (5% return before expenses) | $1,000.00 | $1,020.16 | $5.09 |
(1) | Expenses are equal to the Fund’s annualized expense ratio of 1.25% for Investor Class shares or 1.00% for Institutional Class shares, as applicable, multiplied by the average account value over the period, multiplied by 184/365 days (to reflect one-half year period). |
| HENNESSY FUNDS | 1-800-966-4354 | |
How to Obtain a Copy of the Fund’s
Proxy Voting Policy and Proxy Voting Records
A description of the policies and procedures the Fund uses to determine how to vote proxies relating to portfolio securities is available without charge: (1) by calling 1-800-966-4354; (2) on the Hennessy Funds’ website at hennessyfunds.com/proxy-voting/policy.fs; or (3) on the U.S. Securities and Exchange Commission’s (the “SEC”) website at www.sec.gov. The Fund’s proxy voting record is available without charge on both the Hennessy Funds’ website at hennessyfunds.com/proxy-voting/vote.fs and the SEC’s website at www.sec.gov no later than August 31 for the prior 12 months ending June 30.
Quarterly Filings on Form N-Q
The Fund files a complete schedule of portfolio holdings with the SEC for the first and third quarters of each fiscal year on Form N-Q. The Fund’s Forms N-Q are made available on the SEC’s website at www.sec.gov. The Fund’s Forms N-Q may be reviewed and copied at the SEC’s Public Reference Room in Washington, DC, and information on the operation of the Public Reference Room may be obtained by calling 1-800-SEC-0330. Information included in the Fund’s Forms N-Q will also be available upon request by calling 1-800-966-4354.
Federal Tax Distribution Information
(Unaudited)
For fiscal year 2017, certain dividends paid by the Fund may be subject to a maximum tax rate of 23.8%, as provided for by the Jobs and Growth Tax Relief Reconciliation Act of 2003. The percentage of dividends declared from ordinary income designated as qualified dividend income was 100.00%.
For corporate shareholders, the percent of ordinary income distributions that qualified for the corporate dividends received deduction for fiscal year 2017 was 100.00%.
The percentage of taxable ordinary income distributions that are designated as short-term capital gain distributions under Section 871(k)(2)(C) of the Internal Revenue Code of 1986, as amended, for the Fund was 0.00%.
Householding
To help keep the Fund’s costs as low as possible, we generally deliver a single copy of most financial reports and prospectuses to shareholders who share an address, even if the accounts are registered under different names. This process, known as “householding,” does not apply to account statements. You may request an individual copy of a prospectus or financial report at any time. If you would like to receive separate mailings, please call U.S. Bancorp Fund Services, LLC at 1-800-261-6950 or 1-414-765-4124 and we will begin individual delivery within 30 days of your request. If your account is held through a financial institution or other intermediary, please contact them directly to request individual delivery.
| PROXY VOTING — PRIVACY POLICY |
Privacy Policy
We collect the following non-public personal information about you:
| | • | information we receive from you on or in applications or other forms, correspondence, or conversations, including, but not limited to, your name, address, phone number, social security number, assets, income, and date of birth; and |
| | | |
| | • | information about your transactions with us, our affiliates, or others, including, but not limited to, your account number and balance, payment history, parties to transactions, cost basis information, and other financial information. |
We do not disclose any non-public personal information about our current or former shareholders to non-affiliated third parties, except as permitted by law. For example, we are permitted by law to disclose all of the information we collect, as described above, to our Transfer Agent to process your transactions. Furthermore, we restrict access to your non-public personal information to those persons who require such information to provide products or services to you. We maintain physical, electronic, and procedural safeguards that comply with federal standards to guard your non-public personal information.
In the event that you hold shares of the Fund through a financial intermediary, including, but not limited to, a broker-dealer, bank, or trust company, the privacy policy of your financial intermediary would govern how your non-public personal information will be shared with non-affiliated third parties.
| HENNESSY FUNDS | 1-800-966-4354 | |
For information, questions or assistance, please call
The Hennessy Funds
1-800-966-4354 or 1-415-899-1555
INVESTMENT ADVISOR
Hennessy Advisors, Inc.
7250 Redwood Boulevard, Suite 200
Novato, California 94945
ADMINISTRATOR,
TRANSFER AGENT,
DIVIDEND PAYING AGENT &
SHAREHOLDER SERVICING AGENT
U.S. Bancorp Fund Services, LLC
P.O. Box 701
Milwaukee, Wisconsin 53201-0701
CUSTODIAN
U.S. Bank N.A.
Custody Operations
1555 North River Center Drive, Suite 302
Milwaukee, Wisconsin 53212
TRUSTEES
Neil J. Hennessy
Robert T. Doyle
J. Dennis DeSousa
Gerald P. Richardson
COUNSEL
Foley & Lardner LLP
777 East Wisconsin Avenue
Milwaukee, Wisconsin 53202-5306
INDEPENDENT REGISTERED
PUBLIC ACCOUNTING FIRM
Tait, Weller & Baker LLP
1818 Market Street, Suite 2400
Philadelphia, Pennsylvania 19103
DISTRIBUTOR
Quasar Distributors, LLC
777 East Wisconsin Avenue
Milwaukee, Wisconsin 53202
hennessyfunds.com | 1-800-966-4354
This report has been prepared for shareholders and may be distributed to
others only if preceded or accompanied by a current prospectus.
ANNUAL REPORT
OCTOBER 31, 2017
HENNESSY CORNERSTONE
VALUE FUND
Investor Class HFCVX
Institutional Class HICVX
hennessyfunds.com | 1-800-966-4354
(This Page Intentionally Left Blank.)
Contents
| Letter to Shareholders | | | 2 |
| Performance Overview | | | 4 |
| Financial Statements | | | |
| Schedule of Investments | | | 7 |
| Statement of Assets and Liabilities | | | 11 |
| Statement of Operations | | | 12 |
| Statements of Changes in Net Assets | | | 13 |
| Financial Highlights | | | 14 |
| Notes to the Financial Statements | | | 18 |
| Report of Independent Registered Public Accounting Firm | | | 26 |
| Trustees and Officers of the Fund | | | 27 |
| Expense Example | | | 30 |
| Proxy Voting Policy and Proxy Voting Records | | | 32 |
| Quarterly Schedule of Investments | | | 32 |
| Federal Tax Distribution Information | | | 32 |
| Householding | | | 32 |
| Privacy Policy | | | 33 |
| HENNESSY FUNDS | 1-800-966-4354 | |
December 2017
Dear Hennessy Funds Shareholder:
Over the past year, global equity markets have made strong advances, fueled by continued, broad-based economic growth in most countries and regions, and in spite of a somewhat unsettling geopolitical backdrop.
U.S. stocks performed well in the first year of the new administration in Washington, and, ignoring the debate and the bluster, investors have continued to focus on what concerns them the most – tax reform, deregulation, and the hope of an increase in infrastructure spending. As we move into the final weeks of the calendar year, with the major indices reaching new highs, I find myself envisioning the Dow Jones Industrial Average building momentum toward 30,000.
Over the past 12 months, the U.S. economy has continued to grow at a steady rate of almost 2.5% on an annualized basis, as measured by GDP. Companies have added over 170,000 jobs per month on average over the past year, and the current unemployment rate of 4.1% is the lowest in 17 years. Consumer confidence is high and still rising, and corporate profits are at all-time highs. The Federal Reserve has been increasing interest rates, but at a gradual pace. The bond market has also continued to support the equity market and equity market valuations. Since December of last year, long bond yields have stayed within a narrow band, with the 10-year U.S. Treasury yield hovering in the 2.0% to 2.5% range, and remain low compared to historical averages. In my opinion, long bond yields have stayed low despite three increases in the Federal Funds rate over the last 12 months in part due to persistent low inflation.
Meanwhile, the prospective price-to-earnings multiples for the Dow Jones Industrial Average and S&P 500 Index are just above long-term averages at 19.5x and 19.9x, respectively. I believe these levels of stock valuation, while higher than a year ago, are still very reasonable. At the peak of the technology/dot-com bubble, U.S. equities sold at much higher multiples across the board than they do today, and bond yields were also much higher. In June of 1999, the Dow Jones Industrial Average sold at 28x earnings and the 10-year bond yield was close to 6%. Today, the Dow is selling at under 20x earnings and is offering a 2.2% dividend yield, on par with the yield of the 10-year government bond at 2.4%.
Equity markets in the U.S. have been rising for almost nine years, and financial media reports have speculated that this bull run will come to end, but why? I see no substantial reasons or indicators that a major correction is on the horizon. I remain confident that this bull market has room to run. Overall, investment fundamentals are strong. Corporate earnings are growing at a healthy rate, and companies are generating excess cash flow. Cash continues to build on corporate balance sheets, with $5.2 trillion in cash and short term investments among the S&P 500 Index companies as of October 31, 2017. If our government leaders can pass a meaningful tax reform bill and continue efforts toward regulatory relief, it could be icing on the cake for equities.
There have been, and will likely continue to be, downturns throughout this extended bull market. Since 2010, there have been 18 downturns in the market, 14 of which were between 5% and 10% and four of which were corrections of between 10% and 20%. Yet the market has bounced back following each pullback and then has moved higher. A correction is not the end of the bull market. What might signal that we are at the end of this bull market? Euphoria. And I still see no signs of euphoria in this market. In the past,
I have likened the current bull market to that of 1982-2000, and I am confident in the strength of the market today and believe the economy will continue its slow, but steady, growth into the coming year.
Thank you for your continued confidence and investment in our funds. If you have any questions or would like to speak with us directly, please don’t hesitate to call us at (800) 966-4354.
Best regards,
Neil J. Hennessy
President and Chief Investment Officer
Past performance does not guarantee future results.
Mutual fund investing involves risk. Principal loss is possible.
Opinions expressed are those of Neil Hennessy and are subject to change, are not guaranteed, and should not be considered investment advice.
The Dow Jones Industrial Average and S&P 500 Index are unmanaged indices commonly used to measure the performance of U.S. stocks. One cannot invest directly in an index.
Price to earnings is calculated by dividing a company’s market price per share by its earnings per share. Dividend yield is calculated as the annual dividends paid by a company divided by the price of a share of its stock. Cash flow provides an indication of a company’s financial strength and represents earnings before depreciation, amortization, and non-cash charges.
| HENNESSY FUNDS | 1-800-966-4354 | |
Performance Overview (Unaudited)
CHANGE IN VALUE OF $10,000 INVESTMENT
This graph illustrates the performance of an initial investment of $10,000 made in the Fund ten years ago and assumes the reinvestment of dividends.
AVERAGE ANNUAL TOTAL RETURN FOR PERIODS ENDED OCTOBER 31, 2017
| | One | Five | Ten |
| | Year | Years | Years |
| Hennessy Cornerstone Value Fund – | | | |
| Investor Class (HFCVX) | 19.63% | 11.58% | 5.39% |
| Hennessy Cornerstone Value Fund – | | | |
Institutional Class (HICVX)(1) | 19.95% | 11.80% | 5.64% |
Russell 1000® Value Index | 17.78% | 13.48% | 5.99% |
| S&P 500 Index | 23.63% | 15.18% | 7.51% |
Expense ratios: 1.22% (Investor Class); 0.95% (Institutional Class)
(1) | The inception date of Institutional Class shares is March 3, 2008. Performance shown prior to the inception of Institutional Class shares reflects the performance of Investor Class shares and includes expenses that are not applicable to, and are higher than, those of Institutional Class shares. |
Performance data quoted represents past performance; past performance does not guarantee future results. The investment return and principal value of an investment will fluctuate so that an investor’s shares, when redeemed, may be worth more or less than their original cost. The performance table does not reflect the deduction of taxes that a shareholder would pay on Fund distributions or the redemption of Fund shares. Current performance of the Fund may be lower or higher than the performance quoted. Performance data current to the most recent month end may be obtained by visiting hennessyfunds.com.
The Russell 1000® Value Index is an unmanaged index commonly used to measure the performance of U.S. large-capitalization value stocks. The S&P 500 Index is an unmanaged index commonly used to measure the performance of U.S. stocks. One cannot invest directly in an index.
Frank Russell Company (“Russell”) is the source and owner of the trademarks, service marks, and copyrights related to the Russell Indexes. Russell® is a trademark of Frank Russell Company. Neither Russell nor its licensors accept any liability for any errors or omissions in the Russell Indexes or Russell ratings or underlying data and no party may rely on any Russell Indexes or Russell ratings or underlying data contained in this communication. No further distribution of Russell data is permitted without Russell’s
express written consent. Russell does not promote, sponsor, or endorse the content of this communication.
The expense ratios presented are from the most recent prospectus. The expense ratios for the current reporting period are available in the Financial Highlights section of this report.
PERFORMANCE NARRATIVE
Portfolio Managers Neil J. Hennessy, Brian E. Peery, and Ryan C. Kelley
Performance:
For the 12-month period ended October 31, 2017, the Investor Class of the Hennessy Cornerstone Value Fund returned 19.63%, outperforming the Russell 1000® Value Index, which returned 17.78%, but underperforming the S&P 500 Index, which returned 23.63%, for the same period.
The Fund outperformed its primary benchmark, the Russell 1000® Value Index, as a result of stock selection. Specifically, three Energy-sector stocks, Royal Dutch Shell, BP PLC, and Valero Energy Corp., all performed well as oil prices started increasing in the later part of the year. However, the Fund’s investments in the Information Technology sector, principally Qualcomm, Inc. and International Business Systems Corp., hurt overall performance. Sector allocation as a whole detracted from performance. The Fund’s overweight position in Materials and underweight positions in Health Care and Utilities each contributed positively to sector-related performance. Offsetting these gains was the Fund’s overweight position in the Telecommunications Services sector. The Fund continues to hold the stocks mentioned with the exception of Qualcomm, Inc. and BP PLC.
Portfolio Strategy:
The Fund’s investment strategy is to identify large, widely-held stocks with strong operating cash flow. The Fund then selects the stocks it believes are best able to maintain a relatively high dividend yield. Limiting the Fund’s portfolio to 50 stocks produces a relatively concentrated portfolio, where individual stock performance can influence the performance of the portfolio as a whole. We believe the Fund is an attractive vehicle which seeks to provide both income and capital appreciation while investing in large, well-funded, well-managed companies with attractive dividend yields.
Investment Commentary:
The overall performance of large, dividend-paying stocks this year has been impressive, and these stocks have outperformed most other segments of the market. While there is some concern that after such a long period of outperformance valuations may becoming stretched, we are still finding that some of what we believe to be the highest quality companies in the U.S. are trading at attractive valuations. Going into next year, we think large-cap Industrial, Materials, Energy, and Consumer stocks should continue to perform well, and we believe the Fund is well-positioned for the current environment.
Opinions expressed are those of the Portfolio Managers as of the date written and are subject to change, are not guaranteed, and should not be considered investment advice or an indication of trading intent.
The Russell 1000® Value Index is an unmanaged index commonly used to measure the performance of U.S. large-capitalization value stocks. The S&P 500 is an unmanaged index commonly used to measure the performance of U.S. stocks. One cannot invest directly in an index.
The Fund may invest in medium-capitalization companies, which may have more limited liquidity and greater price volatility than large-capitalization companies. Investments in foreign securities
| HENNESSY FUNDS | 1-800-966-4354 | |
may involve political, economic, and currency risks, greater volatility and differences in accounting methods. The Fund’s formula-based strategy may cause the Fund to buy or sell securities at times when it may not be advantageous. Please see the Fund’s prospectus for a more complete discussion of these and other risks.
References to specific securities should not be considered a recommendation to buy or sell any security. Fund holdings and sector allocations are subject to change. Please refer to the Schedule of Investments included in this report for additional portfolio information.
Operating cash flow is a measure of the amount of cash generated by a company’s normal business operations. Dividend yield is calculated as the annual dividends paid by a company divided by the price of a share of their stock.
| PERFORMANCE OVERVIEW/SCHEDULE OF INVESTMENTS |
Financial Statements
Schedule of Investments as of October 31, 2017 |
HENNESSY CORNERSTONE VALUE FUND
(% of Net Assets)
| TOP TEN HOLDINGS (EXCLUDING CASH/CASH EQUIVALENTS) | % NET ASSETS |
| The Boeing Co. | 2.63% |
| AbbVie, Inc. | 2.63% |
| Caterpillar, Inc. | 2.57% |
| VF Corp. | 2.37% |
| HP, Inc. | 2.21% |
| Royal Dutch Shell PLC – ADR | 2.20% |
| Las Vegas Sands Corp. | 2.20% |
| BP PLC – ADR | 2.19% |
| HSBC Holdings PLC – ADR | 2.17% |
| Valero Energy Corp. | 2.14% |
Note: For presentation purposes, the Fund has grouped some of the industry categories. For purposes of categorizing securities for compliance with Section 8(b)(1) of the Investment Company Act of 1940, as amended, the Fund uses more specific industry classifications.
| HENNESSY FUNDS | 1-800-966-4354 | |
| COMMON STOCKS – 97.42% | | Number | | | | | | % of | |
| | | of Shares | | | Value | | | Net Assets | |
| Consumer Discretionary – 12.04% | | | | | | | | | |
| Ford Motor Co. | | | 418,045 | | | $ | 5,129,412 | | | | 1.78 | % |
| General Motors Co. | | | 141,300 | | | | 6,073,074 | | | | 2.11 | % |
| Las Vegas Sands Corp. | | | 99,900 | | | | 6,331,662 | | | | 2.20 | % |
| Target Corp. | | | 78,400 | | | | 4,628,736 | | | | 1.60 | % |
| Thomson Reuters Corp. (b) | | | 122,100 | | | | 5,719,164 | | | | 1.98 | % |
| VF Corp. | | | 98,200 | | | | 6,839,630 | | | | 2.37 | % |
| | | | | | | | 34,721,678 | | | | 12.04 | % |
| | | | | | | | | | | | | |
| Consumer Staples – 6.83% | | | | | | | | | | | | |
| Altria Group, Inc. | | | 70,000 | | | | 4,495,400 | | | | 1.56 | % |
| General Mills, Inc. | | | 84,900 | | | | 4,408,008 | | | | 1.53 | % |
| Philip Morris International, Inc. | | | 48,400 | | | | 5,064,576 | | | | 1.75 | % |
| The Coca-Cola Co. | | | 124,800 | | | | 5,738,304 | | | | 1.99 | % |
| | | | | | | | 19,706,288 | | | | 6.83 | % |
| | | | | | | | | | | | | |
| Energy – 20.26% | | | | | | | | | | | | |
| BP PLC – ADR (b) | | | 155,600 | | | | 6,328,252 | | | | 2.19 | % |
| Chevron Corp. | | | 47,375 | | | | 5,490,289 | | | | 1.90 | % |
| Exxon Mobil Corp. | | | 64,310 | | | | 5,360,239 | | | | 1.86 | % |
| Occidental Petroleum Corp. | | | 80,360 | | | | 5,188,845 | | | | 1.80 | % |
| Phillips 66 | | | 66,800 | | | | 6,084,144 | | | | 2.11 | % |
| Royal Dutch Shell PLC – ADR (b) | | | 100,800 | | | | 6,353,424 | | | | 2.20 | % |
| Statoil ASA – ADR (b) | | | 299,400 | | | | 6,080,814 | | | | 2.11 | % |
| Suncor Energy, Inc. (b) | | | 165,500 | | | | 5,620,380 | | | | 1.95 | % |
| Total S.A. – ADR (b) | | | 103,700 | | | | 5,778,164 | | | | 2.00 | % |
| Valero Energy Corp. | | | 78,115 | | | | 6,162,492 | | | | 2.14 | % |
| | | | | | | | 58,447,043 | | | | 20.26 | % |
| | | | | | | | | | | | | |
| Financials – 13.77% | | | | | | | | | | | | |
| Bank of Montreal (b) | | | 68,200 | | | | 5,224,802 | | | | 1.81 | % |
| Bank of Nova Scotia (b) | | | 85,000 | | | | 5,484,200 | | | | 1.90 | % |
| Brighthouse Financial, Inc. (a) | | | 9,027 | | | | 561,299 | | | | 0.19 | % |
| HSBC Holdings PLC – ADR (b) | | | 128,200 | | | | 6,252,314 | | | | 2.17 | % |
| Manulife Financial Corp. (b) | | | 286,400 | | | | 5,756,640 | | | | 2.00 | % |
| MetLife, Inc. | | | 99,300 | | | | 5,320,494 | | | | 1.84 | % |
| Royal Bank of Canada (b) | | | 70,700 | | | | 5,525,205 | | | | 1.92 | % |
| Toronto-Dominion Bank (b) | | | 98,600 | | | | 5,605,410 | | | | 1.94 | % |
| | | | | | | | 39,730,364 | | | | 13.77 | % |
The accompanying notes are an integral part of these financial statements.
| COMMON STOCKS | | Number | | | | | | % of | |
| | | of Shares | | | Value | | | Net Assets | |
| Health Care – 8.89% | | | | | | | | | |
| AbbVie, Inc. | | | 84,000 | | | $ | 7,581,000 | | | | 2.63 | % |
| AstraZeneca PLC – ADR (b) | | | 177,600 | | | | 6,127,200 | | | | 2.12 | % |
| GlaxoSmithKline PLC – ADR (b) | | | 125,400 | | | | 4,568,322 | | | | 1.58 | % |
| Pfizer, Inc. | | | 152,100 | | | | 5,332,626 | | | | 1.85 | % |
| Teva Pharmaceutical Industries Ltd. – ADR (b) | | | 147,300 | | | | 2,032,740 | | | | 0.71 | % |
| | | | | | | | 25,641,888 | | | | 8.89 | % |
| | | | | | | | | | | | | |
| Industrials – 12.33% | | | | | | | | | | | | |
| Caterpillar, Inc. | | | 54,600 | | | | 7,414,680 | | | | 2.57 | % |
| Eaton Corp. PLC (b) | | | 72,000 | | | | 5,761,440 | | | | 2.00 | % |
| Emerson Electric Co. | | | 86,200 | | | | 5,556,452 | | | | 1.92 | % |
| General Electric Co. | | | 172,634 | | | | 3,480,301 | | | | 1.21 | % |
| The Boeing Co. | | | 29,400 | | | | 7,584,612 | | | | 2.63 | % |
| United Parcel Service, Inc., Class B | | | 49,100 | | | | 5,770,723 | | | | 2.00 | % |
| | | | | | | | 35,568,208 | | | | 12.33 | % |
| | | | | | | | | | | | | |
| Information Technology – 7.15% | | | | | | | | | | | | |
| Cisco Systems, Inc. | | | 151,910 | | | | 5,187,727 | | | | 1.80 | % |
| HP, Inc. | | | 295,300 | | | | 6,363,715 | | | | 2.21 | % |
| International Business Machines Corp. | | | 28,700 | | | | 4,421,522 | | | | 1.53 | % |
| QUALCOMM, Inc. | | | 91,100 | | | | 4,647,011 | | | | 1.61 | % |
| | | | | | | | 20,619,975 | | | | 7.15 | % |
| | | | | | | | | | | | | |
| Materials – 6.07% | | | | | | | | | | | | |
| International Paper Co. | | | 99,100 | | | | 5,675,457 | | | | 1.97 | % |
| LyondellBasell Industries NV (b) | | | 56,400 | | | | 5,839,092 | | | | 2.02 | % |
| Rio Tinto PLC – ADR (b) | | | 125,000 | | | | 5,991,250 | | | | 2.08 | % |
| | | | | | | | 17,505,799 | | | | 6.07 | % |
| | | | | | | | | | | | | |
| Telecommunication Services – 10.08% | | | | | | | | | | | | |
| AT&T, Inc. | | | 123,060 | | | | 4,140,969 | | | | 1.44 | % |
| BCE, Inc. (b) | | | 117,400 | | | | 5,419,184 | | | | 1.88 | % |
| CenturyLink, Inc. | | | 212,100 | | | | 4,027,779 | | | | 1.40 | % |
| China Mobile Ltd. – ADR (b) | | | 92,800 | | | | 4,681,760 | | | | 1.62 | % |
| Verizon Communications, Inc. | | | 103,000 | | | | 4,930,610 | | | | 1.71 | % |
| Vodafone Group PLC – ADR (b) | | | 202,600 | | | | 5,871,348 | | | | 2.03 | % |
| | | | | | | | 29,071,650 | | | | 10.08 | % |
| Total Common Stocks | | | | | | | | | | | | |
| (Cost $242,598,043) | | | | | | | 281,012,893 | | | | 97.42 | % |
The accompanying notes are an integral part of these financial statements.
| HENNESSY FUNDS | 1-800-966-4354 | |
| SHORT-TERM INVESTMENTS – 2.70% | | Number | | | | | | % of | |
| | | of Shares | | | Value | | | Net Assets | |
| Money Market Funds – 2.70% | | | | | | | | | |
| Fidelity Government Portfolio, Institutional Class, 0.92% (c) | | | 7,803,499 | | | $ | 7,803,499 | | | | 2.70 | % |
| | | | | | | | | | | | | |
| Total Short-Term Investments | | | | | | | | | | | | |
| (Cost $7,803,499) | | | | | | | 7,803,499 | | | | 2.70 | % |
| | | | | | | | | | | | | |
| Total Investments | | | | | | | | | | | | |
| (Cost $250,401,542) – 100.12% | | | | | | | 288,816,392 | | | | 100.12 | % |
| Liabilities in Excess of Other Assets – (0.12)% | | | | | | | (349,640 | ) | | | (0.12 | )% |
TOTAL NET ASSETS – 100.00% | | | | | | $ | 288,466,752 | | | | 100.00 | % |
Percentages are stated as a percent of net assets.
ADR – American Depositary Receipt
| (a) | Non-income producing security. |
| (b) | U.S. traded security of a foreign corporation. |
| (c) | The rate listed is the fund’s 7-day yield as of October 31, 2017. |
Summary of Fair Value Exposure at October 31, 2017
The following is a summary of the inputs used to value the Fund’s net assets as of October 31, 2017 (See Note 3 in the accompanying notes to the financial statements):
| Common Stocks | | Level 1 | | | Level 2 | | | Level 3 | | | Total | |
| Consumer Discretionary | | $ | 34,721,678 | | | $ | — | | | $ | — | | | $ | 34,721,678 | |
| Consumer Staples | | | 19,706,288 | | | | — | | | | — | | | | 19,706,288 | |
| Energy | | | 58,447,043 | | | | — | | | | — | | | | 58,447,043 | |
| Financials | | | 39,730,364 | | | | — | | | | — | | | | 39,730,364 | |
| Health Care | | | 25,641,888 | | | | — | | | | — | | | | 25,641,888 | |
| Industrials | | | 35,568,208 | | | | — | | | | — | | | | 35,568,208 | |
| Information Technology | | | 20,619,975 | | | | — | | | | — | | | | 20,619,975 | |
| Materials | | | 17,505,799 | | | | — | | | | — | | | | 17,505,799 | |
| Telecommunication Services | | | 29,071,650 | | | | — | | | | — | | | | 29,071,650 | |
| Total Common Stocks | | $ | 281,012,893 | | | $ | — | | | $ | — | | | $ | 281,012,893 | |
| Short-Term Investments | | | | | | | | | | | | | | | | |
| Money Market Funds | | $ | 7,803,499 | | | $ | — | | | $ | — | | | $ | 7,803,499 | |
| Total Short-Term Investments | | $ | 7,803,499 | | | $ | — | | | $ | — | | | $ | 7,803,499 | |
| Total Investments | | $ | 288,816,392 | | | $ | — | | | $ | — | | | $ | 288,816,392 | |
Transfers between levels are recognized at the end of the reporting period. During the year ended October 31, 2017, the Fund recognized no transfers between levels.
The accompanying notes are an integral part of these financial statements.
| SCHEDULE OF INVESTMENTS/STATEMENT OF ASSETS AND LIABILITIES |
Financial Statements
Statement of Assets and Liabilities as of October 31, 2017 |
| ASSETS: | | | |
| Investments in securities, at value (cost $250,401,542) | | $ | 288,816,392 | |
| Dividends and interest receivable | | | 539,142 | |
| Receivable for fund shares sold | | | 46,591 | |
| Prepaid expenses and other assets | | | 23,944 | |
| Total Assets | | | 289,426,069 | |
| | | | | |
| LIABILITIES: | | | | |
| Payable for fund shares redeemed | | | 199,108 | |
| Payable to advisor | | | 182,699 | |
| Payable to administrator | | | 46,482 | |
| Payable to auditor | | | 21,316 | |
| Accrued distribution fees | | | 433,383 | |
| Accrued service fees | | | 24,060 | |
| Accrued trustees fees | | | 5,571 | |
| Accrued expenses and other payables | | | 46,698 | |
| Total Liabilities | | | 959,317 | |
| NET ASSETS | | $ | 288,466,752 | |
| | | | | |
| NET ASSETS CONSIST OF: | | | | |
| Capital stock | | $ | 211,771,511 | |
| Accumulated net investment income | | | 4,980,270 | |
| Accumulated net realized gain on investments | | | 33,297,188 | |
| Unrealized net appreciation on investments | | | 38,417,783 | |
| Total Net Assets | | $ | 288,466,752 | |
| | | | | |
| NET ASSETS | | | | |
| Investor Class: | | | | |
| Shares authorized (no par value) | | Unlimited | |
| Net assets applicable to outstanding Investor Class shares | | $ | 281,069,453 | |
| Shares issued and outstanding | | | 13,086,652 | |
| Net asset value, offering price and redemption price per share | | $ | 21.48 | |
| | | | | |
| Institutional Class: | | | | |
| Shares authorized (no par value) | | Unlimited | |
| Net assets applicable to outstanding Institutional Class shares | | $ | 7,397,299 | |
| Shares issued and outstanding | | | 343,773 | |
| Net asset value, offering price and redemption price per share | | $ | 21.52 | |
The accompanying notes are an integral part of these financial statements.
| HENNESSY FUNDS | 1-800-966-4354 | |
Financial Statements
Statement of Operations for the year ended October 31, 2017 |
| INVESTMENT INCOME: | | | |
Dividend income(1) | | $ | 8,269,169 | |
| Interest income | | | 46,776 | |
| Total investment income | | | 8,315,945 | |
| | | | | |
| EXPENSES: | | | | |
| Investment advisory fees (See Note 5) | | | 1,722,795 | |
| Distribution fees – Investor Class (See Note 5) | | | 341,600 | |
| Service fees – Investor Class (See Note 5) | | | 227,734 | |
| Administration, fund accounting, custody and transfer agent fees (See Note 5) | | | 221,845 | |
| Sub-transfer agent expenses – Investor Class (See Note 5) | | | 159,413 | |
| Sub-transfer agent expenses – Institutional Class (See Note 5) | | | 3,843 | |
| Federal and state registration fees | | | 33,960 | |
| Compliance expense (See Note 5) | | | 26,787 | |
| Reports to shareholders | | | 24,105 | |
| Audit fees | | | 22,080 | |
| Trustees’ fees and expenses | | | 16,955 | |
| Legal fees | | | 500 | |
| Other expenses | | | 15,860 | |
| Total expenses | | | 2,817,477 | |
| NET INVESTMENT INCOME | | $ | 5,498,468 | |
| | | | | |
| REALIZED AND UNREALIZED GAINS (LOSSES): | | | | |
| Net realized gain on investments | | $ | 40,317,512 | |
| Net change in unrealized appreciation on investments | | | (11,111,810 | ) |
| Net gain on investments | | | 29,205,702 | |
| NET INCREASE IN NET ASSETS RESULTING FROM OPERATIONS | | $ | 34,704,170 | |
(1) | Net of foreign taxes withheld and issuance fees of $359,395. |
The accompanying notes are an integral part of these financial statements.
| STATEMENT OF OPERATIONS/STATEMENTS OF CHANGES IN NET ASSETS |
Financial Statements
| Statements of Changes in Net Assets |
| | | Year Ended | | | Year Ended | |
| | | October 31, 2017 | | | October 31, 2016 | |
| OPERATIONS: | | | | | | |
| Net investment income | | $ | 5,498,468 | | | $ | 2,958,133 | |
| Net realized gain on investments | | | 40,317,512 | | | | 1,221,525 | |
| Net change in unrealized appreciation on investments | | | (11,111,810 | ) | | | 3,724,830 | |
| Net increase in net assets resulting from operations | | | 34,704,170 | | | | 7,904,488 | |
| | | | | | | | | |
| DISTRIBUTIONS TO SHAREHOLDERS FROM: | | | | | | | | |
| Net investment income – Investor Class | | | (2,916,316 | ) | | | (3,068,445 | ) |
| Net investment income – Institutional Class | | | (52,044 | ) | | | (41,663 | ) |
| Total distributions | | | (2,968,360 | ) | | | (3,110,108 | ) |
| | | | | | | | | |
| CAPITAL SHARE TRANSACTIONS: | | | | | | | | |
| Proceeds from shares issued in the Reorganization – | | | | | | | | |
| Investor Class (See Note 10) | | | 141,680,285 | | | | — | |
| Proceeds from shares issued in the Reorganization – | | | | | | | | |
| Institutional Class (See Note 10) | | | 3,258,094 | | | | — | |
| Proceeds from shares subscribed – Investor Class | | | 2,341,233 | | | | 1,543,678 | |
| Proceeds from shares subscribed – Institutional Class | | | 2,547,752 | | | | 427,866 | |
| Dividends reinvested – Investor Class | | | 2,640,562 | | | | 2,748,595 | |
| Dividends reinvested – Institutional Class | | | 33,704 | | | | 26,592 | |
| Cost of shares redeemed – Investor Class | | | (23,154,846 | ) | | | (12,330,203 | ) |
| Cost of shares redeemed – Institutional Class | | | (1,029,188 | ) | | | (410,243 | ) |
| Net increase (decrease) in net assets derived | | | | | | | | |
| from capital share transactions | | | 128,317,596 | | | | (7,993,715 | ) |
| TOTAL INCREASE (DECREASE) IN NET ASSETS | | | 160,053,406 | | | | (3,199,335 | ) |
| | | | | | | | | |
| NET ASSETS: | | | | | | | | |
| Beginning of year | | | 128,413,346 | | | | 131,612,681 | |
| End of year | | $ | 288,466,752 | | | $ | 128,413,346 | |
| Undistributed net investment income, end of year | | $ | 4,980,270 | | | $ | 2,433,078 | |
| | | | | | | | | |
| CHANGES IN SHARES OUTSTANDING: | | | | | | | | |
| Shares issued in the Reorganization – Investor Class | | | 7,092,199 | | | | — | |
| Shares issued in the Reorganization – Institutional Class | | | 163,058 | | | | — | |
| Shares sold – Investor Class | | | 118,558 | | | | 88,366 | |
| Shares sold – Institutional Class | | | 127,648 | | | | 24,407 | |
| Shares issued to holders as reinvestment | | | | | | | | |
| of dividends – Investor Class | | | 138,105 | | | | 162,543 | |
| Shares issued to holders as reinvestment | | | | | | | | |
| of dividends – Institutional Class | | | 1,763 | | | | 1,573 | |
| Shares redeemed – Investor Class | | | (1,154,302 | ) | | | (701,433 | ) |
| Shares redeemed – Institutional Class | | | (50,925 | ) | | | (22,974 | ) |
| Net increase (decrease) in shares outstanding | | | 6,436,104 | | | | (447,518 | ) |
The accompanying notes are an integral part of these financial statements.
| HENNESSY FUNDS | 1-800-966-4354 | |
Financial Statements
For an Investor Class share outstanding throughout each year
PER SHARE DATA:
Net asset value, beginning of year
Income from investment operations:
Net investment income
Net realized and unrealized gains (losses) on investments
Total from investment operations
Less distributions:
Dividends from net investment income
Total distributions
Net asset value, end of year
TOTAL RETURN
SUPPLEMENTAL DATA AND RATIOS:
Net assets, end of year (millions)
Ratio of expenses to average net assets
Ratio of net investment income to average net assets
Portfolio turnover rate(1)
(1) | Portfolio turnover is calculated on the basis of the Fund as a whole. |
The accompanying notes are an integral part of these financial statements.
| FINANCIAL HIGHLIGHTS — INVESTOR CLASS |
| Year Ended October 31, | |
| 2017 | | | 2016 | | | 2015 | | | 2014 | | | 2013 | |
| | | | | | | | | | | | | | |
| $ | 18.36 | | | $ | 17.69 | | | $ | 18.41 | | | $ | 16.90 | | | $ | 14.02 | |
| | | | | | | | | | | | | | | | | | | |
| | | | | | | | | | | | | | | | | | | |
| | 0.45 | | | | 0.43 | | | | 0.44 | | | | 0.39 | | | | 0.42 | |
| | 3.10 | | | | 0.67 | | | | (0.75 | ) | | | 1.55 | | | | 2.84 | |
| | 3.55 | | | | 1.10 | | | | (0.31 | ) | | | 1.94 | | | | 3.26 | |
| | | | | | | | | | | | | | | | | | | |
| | | | | | | | | | | | | | | | | | | |
| | (0.43 | ) | | | (0.43 | ) | | | (0.41 | ) | | | (0.43 | ) | | | (0.38 | ) |
| | (0.43 | ) | | | (0.43 | ) | | | (0.41 | ) | | | (0.43 | ) | | | (0.38 | ) |
| $ | 21.48 | | | $ | 18.36 | | | $ | 17.69 | | | $ | 18.41 | | | $ | 16.90 | |
| | | | | | | | | | | | | | | | | | | |
| | 19.63 | % | | | 6.41 | % | | | (1.77 | )% | | | 11.69 | % | | | 23.84 | % |
| | | | | | | | | | | | | | | | | | | |
| | | | | | | | | | | | | | | | | | | |
| $ | 281.07 | | | $ | 126.53 | | | $ | 129.86 | | | $ | 145.04 | | | $ | 138.94 | |
| | 1.22 | % | | | 1.25 | % | | | 1.10 | % | | | 1.17 | % | | | 1.22 | % |
| | 2.36 | % | | | 2.33 | % | | | 2.32 | % | | | 2.18 | % | | | 2.60 | % |
| | 72 | % | | | 36 | % | | | 46 | % | | | 34 | % | | | 41 | % |
The accompanying notes are an integral part of these financial statements.
| HENNESSY FUNDS | 1-800-966-4354 | |
Financial Statements
For an Institutional Class share outstanding throughout each year
PER SHARE DATA:
Net asset value, beginning of year
Income from investment operations:
Net investment income
Net realized and unrealized gains (losses) on investments
Total from investment operations
Less distributions:
Dividends from net investment income
Total distributions
Net asset value, end of year
TOTAL RETURN
SUPPLEMENTAL DATA AND RATIOS:
Net assets, end of year (millions)
Ratio of expenses to average net assets:
Before expense reimbursement
After expense reimbursement
Ratio of net investment income to average net assets:
Before expense reimbursement
After expense reimbursement
Portfolio turnover rate(1)
(1) | Portfolio turnover is calculated on the basis of the Fund as a whole. |
The accompanying notes are an integral part of these financial statements.
| FINANCIAL HIGHLIGHTS — INSTITUTIONAL CLASS |
| Year Ended October 31, | |
| 2017 | | | 2016 | | | 2015 | | | 2014 | | | 2013 | |
| | | | | | | | | | | | | | |
| $ | 18.40 | | | $ | 17.67 | | | $ | 18.41 | | | $ | 16.92 | | | $ | 14.04 | |
| | | | | | | | | | | | | | | | | | | |
| | | | | | | | | | | | | | | | | | | |
| | 0.43 | | | | 0.48 | | | | 0.53 | | | | 0.59 | | | | 0.50 | |
| | 3.18 | | | | 0.67 | | | | (0.83 | ) | | | 1.37 | | | | 2.80 | |
| | 3.61 | | | | 1.15 | | | | (0.30 | ) | | | 1.96 | | | | 3.30 | |
| | | | | | | | | | | | | | | | | | | |
| | | | | | | | | | | | | | | | | | | |
| | (0.49 | ) | | | (0.42 | ) | | | (0.44 | ) | | | (0.47 | ) | | | (0.42 | ) |
| | (0.49 | ) | | | (0.42 | ) | | | (0.44 | ) | | | (0.47 | ) | | | (0.42 | ) |
| $ | 21.52 | | | $ | 18.40 | | | $ | 17.67 | | | $ | 18.41 | | | $ | 16.92 | |
| | | | | | | | | | | | | | | | | | | |
| | 19.95 | % | | | 6.72 | % | | | (1.72 | )% | | | 11.82 | % | | | 24.13 | % |
| | | | | | | | | | | | | | | | | | | |
| | | | | | | | | | | | | | | | | | | |
| $ | 7.40 | | | $ | 1.88 | | | $ | 1.75 | | | $ | 10.65 | | | $ | 4.09 | |
| | | | | | | | | | | | | | | | | | | |
| | 0.97 | % | | | 0.95 | % | | | 1.00 | % | | | 1.03 | % | | | 1.10 | % |
| | 0.97 | % | | | 0.95 | % | | | 1.00 | % | | | 0.98 | % | | | 0.98 | % |
| | | | | | | | | | | | | | | | | | | |
| | 2.60 | % | | | 2.63 | % | | | 2.43 | % | | | 2.30 | % | | | 2.64 | % |
| | 2.60 | % | | | 2.63 | % | | | 2.43 | % | | | 2.35 | % | | | 2.76 | % |
| | 72 | % | | | 36 | % | | | 46 | % | | | 34 | % | | | 41 | % |
The accompanying notes are an integral part of these financial statements.
| HENNESSY FUNDS | 1-800-966-4354 | |
Financial Statements
Notes to the Financial Statements October 31, 2017 |
1). ORGANIZATION
The Hennessy Cornerstone Value Fund (the “Fund”) is a series of Hennessy Funds Trust (the “Trust”), which was organized as a Delaware statutory trust on September 17, 1992. The Fund is an open-end management investment company registered under the Investment Company Act of 1940, as amended. The investment objective of the Fund is total return, consisting of capital appreciation and current income. The Fund is a diversified fund.
The Fund offers Investor Class and Institutional Class shares. Each class of shares differs principally in its respective 12b-1 distribution and service, shareholder servicing, and sub-transfer agent expenses. There are no sales charges. Each class has identical rights to earnings, assets, and voting privileges, except for class-specific expenses and exclusive rights to vote on matters affecting only an individual class.
As an investment company, the Fund follows the investment company accounting and reporting guidance of the Financial Accounting Standards Board (“FASB”) Accounting Standard Codification Topic 946 “Financial Services—Investment Companies.”
2). SIGNIFICANT ACCOUNTING POLICIES
The following is a summary of significant accounting policies consistently followed by the Fund in the preparation of the financial statements. These policies conform to U.S. generally accepted accounting principles (“GAAP”).
| a). | Investment Valuation – All investments in securities are recorded at their estimated fair value, as described in Note 3. |
| | |
| b). | Federal Income Taxes – No provision for federal income taxes or excise taxes has been made because the Fund has elected to be taxed as a “regulated investment company” and intends to distribute substantially all of its taxable income to its shareholders and otherwise comply with the provisions of the Internal Revenue Code of 1986, as amended, applicable to regulated investment companies. Net investment income/loss and realized gains/losses for federal income tax purposes may differ from those reported in the financial statements because of temporary book and tax basis differences. Temporary differences are primarily the result of the treatment of wash sales for tax reporting purposes. The Fund recognizes interest and penalties related to income tax benefits, if any, in the Statement of Operations as an income tax expense. Distributions from net realized gains for book purposes may include short-term capital gains, which are included as ordinary income to shareholders for tax purposes. The Fund may utilize equalization accounting for tax purposes and designate earnings and profits, including net realized gains distributed to shareholders on redemption of shares, as part of the dividends paid deduction for income tax purposes. |
| | Due to inherent differences in the recognition of income, expenses, and realized gains/losses under GAAP and federal income tax regulations, permanent differences between book and tax basis for reporting for fiscal year 2017 have been identified and appropriately reclassified in the Statement of Assets and Liabilities. The adjustments are as follows: |
| | Accumulated | Accumulated | | |
| | Net Investment | Net Realized | | |
| | Income | Gain on Investments | Capital Stock | |
| | $17,084 | $(2,243,636) | $2,226,552 | |
| NOTES TO THE FINANCIAL STATEMENTS |
| c). | Accounting for Uncertainty in Income Taxes – The Fund has accounting policies regarding recognition and measurement of tax positions taken or expected to be taken on a tax return. The tax returns of the Fund for the prior three fiscal years are open for examination. The Fund has reviewed all open tax years in major jurisdictions and concluded that there is no impact on the Fund’s net assets and no tax liability resulting from unrecognized tax benefits relating to uncertain income tax positions taken or expected to be taken on a tax return. The Fund’s major tax jurisdictions are U.S. federal and Delaware. |
| | |
| d). | Income and Expenses – Dividend income is recognized on the ex-dividend date or as soon as information is available to the Fund. Interest income, which includes the amortization of premium and accretion of discount, is recognized on an accrual basis. The Fund is charged for those expenses that are directly attributable to the portfolio, such as advisory, administration, and certain shareholder service fees. Income, expenses (other than expenses attributable to a specific class), and realized and unrealized gains/losses on investments are allocated to each class of shares based on such class’s net assets. |
| e). | Distributions to Shareholders – Dividends from net investment income for the Fund, if any, are declared and paid annually, usually in December. Distributions of net realized capital gains, if any, are declared and paid annually, usually in December. |
| | |
| f). | Security Transactions – Investment and shareholder transactions are recorded on the trade date. The Fund determines the realized gain/loss from an investment transaction by comparing the original cost of the security lot sold with the net sale proceeds. Discounts and premiums on securities purchased are accreted/amortized over the life of the respective security. |
| | |
| g). | Use of Estimates – The preparation of financial statements in conformity with GAAP requires management to make estimates and assumptions that affect the reported amounts of assets and liabilities and disclosure of contingent assets and liabilities at the date of the financial statements and the reported change in net assets during the reporting period. Actual results could differ from those estimates. |
| | |
| h). | Share Valuation – The net asset value (“NAV”) per share of the Fund is calculated by dividing (i) the sum of the value of the securities held by the Fund, plus cash or other assets, minus all liabilities (including estimated accrued expenses) by (ii) the total number of shares outstanding for the Fund, rounded to the nearest cent. The Fund’s shares will not be priced on days the New York Stock Exchange is closed for trading. The offering and redemption price per share for the Fund is equal to the Fund’s NAV per share. |
3). SECURITIES VALUATION
The Fund follows authoritative fair valuation accounting standards that establish an authoritative definition of fair value and set out a hierarchy for measuring fair value. These standards require additional disclosures about the various inputs and valuation techniques used to develop the measurements of fair value and a discussion of changes in valuation techniques and related inputs during the period. These inputs are summarized in the three broad levels listed below:
| | Level 1 – | Unadjusted, quoted prices in active markets for identical instruments that the Fund has the ability to access at the date of measurement. |
| | | |
| | Level 2 – | Other significant observable inputs (including, but not limited to, quoted prices in active markets for similar instruments, quoted prices in markets that are not active for identical or similar instruments, and model-derived |
| HENNESSY FUNDS | 1-800-966-4354 | |
| | | valuations in which all significant inputs and significant value drivers are observable in active markets, such as interest rates, prepayment speeds, credit risk curves, default rates, and similar data). |
| | | |
| | Level 3 – | Significant unobservable inputs (including the Fund’s own assumptions about what market participants would use to price the asset or liability based on the best available information) when observable inputs are unavailable. |
Following is a description of the valuation techniques applied to the Fund’s major categories of assets and liabilities measured at fair value on a recurring basis.
| | Equity Securities – Equity securities, including common stocks, preferred stocks, foreign-issued common stocks, exchange-traded funds, closed-end mutual funds, partnerships, rights, and real estate investment trusts, that are traded on a securities exchange for which a last-quoted sales price is readily available will generally be valued at the last sales price as reported by the primary exchange on which the securities are listed. Securities listed on The NASDAQ Stock Market (“NASDAQ”) will generally be valued at the NASDAQ Official Closing Price, which may differ from the last sales price reported. Securities traded on a securities exchange for which a last-quoted sales price is not readily available will generally be valued at the mean between the bid and ask prices. To the extent these securities are actively traded and valuation adjustments are not applied, they are classified in Level 1 of the fair value hierarchy. Securities traded on foreign exchanges generally are not valued at the same time the Fund calculates its NAV because most foreign markets close well before such time. The earlier close of most foreign markets gives rise to the possibility that significant events, including broad market moves, may have occurred in the interim. In certain circumstances, it may be determined that a security needs to be fair valued because it appears that the value of the security might have been materially affected by events occurring after the close of the market in which the security is principally traded, but before the time the Fund calculates its NAV, such as by a development that affects an entire market or region (e.g., weather-related events) or a potentially global development (e.g., a terrorist attack that may be expected to have an effect on investor expectations worldwide). |
| | |
| | Registered Investment Companies – Investments in registered investment companies (e.g., mutual funds) are generally priced at the ending NAV provided by the applicable registered investment company’s service agent and will be classified in Level 1 of the fair value hierarchy. |
| | |
| | Debt Securities – Debt securities, including corporate bonds, asset-backed securities, mortgage-backed securities, municipal bonds, U.S. Treasuries, and U.S. government agency issues, are generally valued at market on the basis of valuations furnished by an independent pricing service that utilizes both dealer-supplied valuations and formula-based techniques. The pricing service may consider recently executed transactions in securities of the issuer or comparable issuers, market price quotations (where observable), bond spreads, and fundamental data relating to the issuer. In addition, the model may incorporate observable market data, such as reported sales of similar securities, broker quotes, yields, bids, offers, and reference data. Certain securities are valued primarily using dealer quotations. These securities are generally classified in Level 2 of the fair value hierarchy. |
| | |
| | Short-Term Securities – Short-term equity investments, including money market funds, are valued in the manner specified above. Short-term debt investments with an original term to maturity of 60 days or less are valued at amortized cost, which approximates fair market value. If the original term to maturity of a short-term debt investment exceeded 60 days, then the values as of the 61st day prior to maturity are |
| NOTES TO THE FINANCIAL STATEMENTS |
| | amortized. Amortized cost is not used if its use would be inappropriate due to credit or other impairments of the issuer, in which case the security’s fair value would be determined, as described below. Short-term securities are generally classified in Level 1 or Level 2 of the fair market hierarchy depending on the inputs used and market activity levels for specific securities. |
The Board of Trustees of the Fund (the “Board”) has adopted fair value pricing procedures that are followed when a price for a security is not readily available or if a significant event has occurred that indicates the closing price of a security no longer represents the true value of that security. Fair value pricing determinations are made in good faith in accordance with these procedures. There are numerous criteria that will be given consideration in determining a fair value of a security, such as the trading volume of a security and markets, the values of other similar securities, and news events with direct bearing on a security or markets. Fair value pricing results in an estimated price for a security that reflects the amount the Fund might reasonably expect to receive in a current sale. Depending on the relative significance of the valuation inputs, these securities may be classified in either Level 2 or Level 3 of the fair value hierarchy.
The fair valuation of foreign securities may be determined with the assistance of a pricing service using correlations between the movement of prices of such securities and indices of domestic securities and other appropriate indicators, such as closing market prices of relevant American Depositary Receipts or futures contracts. The effect of using fair value pricing is that the Fund’s NAV will reflect the affected portfolio securities’ values as determined by the Board or its designee instead of being determined by the market. Using a fair value pricing methodology to price a foreign security may result in a value that is different from the foreign security’s most recent closing price and from the prices used by other investment companies to calculate their NAVs and are generally classified in Level 2 of the fair valuation hierarchy. Because the Fund may invest in foreign securities, the value of the Fund’s portfolio securities may change on days when you will not be able to purchase or redeem your shares.
The Board has delegated day-to-day valuation matters to a Valuation Committee comprised of one or more representatives from Hennessy Advisors, Inc., the Fund’s investment advisor (the “Advisor”). The function of the Valuation Committee is to value securities where current and reliable market quotations are not readily available. All actions taken by the Valuation Committee are reviewed by the Board.
The Fund has performed an analysis of all existing investments to determine the significance and character of all inputs to their fair value determination. Various inputs are used to determine the value of the Fund’s investments. The inputs or methodology used for valuing securities are not necessarily an indication of the risk associated with investing in those securities. Details related to the fair valuation hierarchy of the Fund’s securities as of October 31, 2017, are included in the Schedule of Investments.
4). INVESTMENT TRANSACTIONS
Purchases and sales of investment securities (excluding government and short-term investments) for the Fund during fiscal year 2017 were $164,644,482 and $179,963,161, respectively.
There were no purchases or sales/maturities of long-term U.S. government securities for the Fund during fiscal year 2017.
The Fund is permitted to purchase or sell securities from or to another fund in the Hennessy Funds family of funds (the “Hennessy Funds”) under specified conditions outlined in procedures adopted by the Board. The procedures have been designed to ensure that any purchase or sale of securities by the Fund from or to another Hennessy
| HENNESSY FUNDS | 1-800-966-4354 | |
Fund complies with Rule 17a-7 of the Investment Company Act of 1940, as amended. For fiscal year 2017, the Fund did not engage in purchases or sales of securities pursuant to Rule 17a-7 of the Investment Company Act of 1940, as amended.
5). INVESTMENT MANAGEMENT FEE AND OTHER TRANSACTIONS WITH AFFILIATES
The Advisor provides the Fund with investment management services under an Investment Advisory Agreement. The Advisor provides all investment advice, office space, and facilities, as well as most of the personnel needed by the Fund. As compensation for its services, the Advisor is entitled to a monthly fee from the Fund. The fee is based upon the average daily net assets of the Fund at an annual rate of 0.74%. The net investment advisory fees expensed by the Fund during fiscal year 2017 are included in the Statement of Operations.
The Board has approved a Shareholder Servicing Agreement for Investor Class shares of the Fund, which was instituted to compensate the Advisor for the non-investment management services it provides to the Fund. The Shareholder Servicing Agreement provides for a monthly fee paid to the Advisor at an annual rate of 0.10% of the average daily net assets of the Fund attributable to Investor Class shares. The shareholder service fees expensed by the Fund during fiscal year 2017 are included in the Statement of Operations.
The Fund has adopted a plan pursuant to Rule 12b-1 under the Investment Company Act of 1940, as amended, that authorizes payments in connection with the distribution of the Fund’s shares at an annual rate of up to 0.25% of the Fund’s average daily net assets attributable to Investor Class shares. Even though the authorized rate is up to 0.25%, the Fund is currently only using up to 0.15% of its average daily net assets attributable to Investor Class shares for such purpose. Amounts paid under the plan may be spent on any activities or expenses primarily intended to result in the sale of shares, including, but not limited to, advertising, shareholder account servicing, the printing and mailing of prospectuses to other than current shareholders, the printing and mailing of sales literature, and compensation for sales and marketing activities or to financial institutions and others, such as dealers and distributors. The distribution fees expensed by the Fund during fiscal year 2017 are included in the Statement of Operations.
The Fund has entered into agreements with various brokers, dealers, and financial intermediaries in connection with the sale of shares of the Fund. The agreements provide for periodic payments by the Fund to the brokers, dealers, and financial intermediaries for providing certain shareholder maintenance services (sub-transfer agent expenses). These shareholder services include the pre-processing and quality control of new accounts, shareholder correspondence, answering customer inquiries regarding account status, and facilitating shareholder telephone transactions. The sub-transfer agent fees expensed by the Fund during fiscal year 2017 are included in the Statement of Operations.
U.S. Bancorp Fund Services, LLC (“USBFS”) provides the Fund with administrative, fund accounting, and transfer agent services and necessary office equipment. As administrator, USBFS is responsible for activities such as (i) preparing various federal and state regulatory filings, reports, and returns for the Fund, (ii) preparing reports and materials to be supplied to the Board, (iii) monitoring the activities of the Fund’s custodian, transfer agent, and accountants, and (iv) coordinating the preparation and payment of the Fund’s expenses and reviewing the Fund’s expense accruals. U.S. Bank, N.A., an affiliate of USBFS, serves as the Fund’s custodian. The servicing agreements between the Trust, USBFS, and U.S. Bank N.A. contain a fee schedule that is inclusive of administrative, fund accounting, custody, and transfer agent fees. The administrative, fund accounting, custody, and transfer agent fees expensed by the Fund during fiscal year 2017 are included in the Statement of Operations.
| NOTES TO THE FINANCIAL STATEMENTS |
Quasar Distributors, LLC acts as the Fund’s principal underwriter in a continuous public offering of the Fund’s shares. Quasar Distributors, LLC is an affiliate of USBFS and U.S. Bank, N.A.
The officers of the Fund are affiliated with the Advisor. Such officers, with the exception of the Chief Compliance Officer and the Senior Compliance Officer, receive no compensation from the Fund for serving in their respective roles. The Fund, along with the other Hennessy Funds, makes reimbursement payments, on an equal basis, to the Advisor for a portion of the salary and benefits associated with the office of the Chief Compliance Officer and for all of the salary and benefits associated with the office of the Senior Compliance Officer. The compliance fees expensed by the Fund during fiscal year 2017 are included in the Statement of Operations.
6). GUARANTEES AND INDEMNIFICATIONS
Under the Hennessy Funds’ organizational documents, their officers and trustees are indemnified by the Hennessy Funds against certain liabilities arising out of the performance of their duties to the Hennessy Funds. Additionally, in the normal course of business, the Hennessy Funds enter into contracts with service providers that contain general indemnification clauses. The Fund’s maximum exposure under these arrangements is unknown as this would involve future claims that may be made against the Fund that have not yet occurred. Currently, the Fund expects the risk of loss to be remote.
7). LINE OF CREDIT
The Fund has an uncommitted line of credit with the other Hennessy Funds in the amount of the lesser of (i) $100,000,000 or (ii) 33.33% of each Hennessy Fund’s net assets, or 30% for the Hennessy Gas Utility Fund and 10% for the Hennessy Balanced Fund, intended to provide short-term financing, if necessary, subject to certain restrictions, in connection with shareholder redemptions. The credit facility is with the Hennessy Funds’ custodian bank, U.S. Bank, N.A. Borrowings under this arrangement bear interest at the bank’s prime rate and are secured by all of the Fund’s assets (as to its own borrowings only). During fiscal year 2017, the Fund did not have any borrowings outstanding under the line of credit.
8). FEDERAL TAX INFORMATION
As of October 31, 2017, the components of accumulated earnings (losses) for income tax purposes were as follows:
| | | Investments | |
| Cost of investments for tax purposes | | $ | 250,803,731 | |
| Gross tax unrealized appreciation | | $ | 47,828,641 | |
| Gross tax unrealized depreciation | | | (9,815,980 | ) |
| Net tax unrealized appreciation | | $ | 38,012,661 | |
| Undistributed ordinary income | | $ | 7,619,693 | |
| Undistributed long-term capital gains | | | 31,059,954 | |
| Total distributable earnings | | $ | 38,679,647 | |
| Other accumulated gain | | $ | 2,933 | |
| Total accumulated gain | | $ | 76,695,241 | |
The difference between book-basis unrealized appreciation/depreciation (as shown in the Statement of Assets and Liabilities) and tax-basis unrealized appreciation/depreciation (as shown above) is attributable primarily to wash sales.
At October 31, 2017, the Fund had no tax basis capital losses to offset future capital gains.
During fiscal year 2017, the capital losses utilized for the Fund were $2,900,273.
| HENNESSY FUNDS | 1-800-966-4354 | |
Capital losses sustained in fiscal year 2012 and in future taxable years will not expire and may be carried over by the Fund without limitation; however, they will retain the character of the original loss. Furthermore, any loss incurred during those taxable years will be required to be utilized prior to the losses incurred in taxable years prior to 2012. As a result of this ordering rule, pre-enactment capital loss carryforwards may be more likely to expire unused. Under pre-enactment law, capital losses could be carried forward for eight years, and carried forward as short-term capital losses, irrespective of the character of the original loss.
At October 31, 2017, the Fund did not defer, on a tax basis, any late-year ordinary losses. Late-year ordinary losses are net ordinary losses incurred after December 31, 2016, but within the taxable year, that are deemed to arise on the first day of the Fund’s next taxable year.
During fiscal years 2017 and 2016, the tax character of distributions paid by the Fund was as follows:
| | | Year Ended | | | Year Ended | |
| | | October 31, 2017 | | | October 31, 2016 | |
Ordinary income(1) | | $ | 2,968,360 | | | $ | 3,110,108 | |
| Long-term capital gain | | | — | | | | — | |
| | | $ | 2,968,360 | | | $ | 3,110,108 | |
(1) Ordinary income includes short-term gain/loss.
9). CHANGE IN AUDITOR DISCLOSURE
On September 11, 2017, the Trust, by action of the Audit Committee of the Board and on behalf of the Fund, the Hennessy Cornerstone Growth Fund, the Hennessy Cornerstone Mid Cap 30 Fund, the Hennessy Cornerstone Large Growth Fund, the Hennessy Total Return Fund, the Hennessy Balanced Fund, the Hennessy Japan Fund, and the Hennessy Japan Small Cap Fund (collectively, the “Applicable Funds”), dismissed KPMG LLP (“KPMG”) and engaged Tait, Weller & Baker LLP (“Tait Weller”) to serve as the independent registered public accounting firm to audit the financial statements of all series of the Trust for fiscal year 2017. Tait Weller previously served as the independent registered public accounting firm for the series of the Trust that are not one of the Applicable Funds.
KPMG’s reports on the financial statements of the Applicable Fund’s for each of fiscal years 2015 and 2016 contained no adverse opinion or disclaimer of opinion, nor were they qualified or modified as to uncertainty, audit scope, or accounting principles. During fiscal years 2015 and 2016 and the interim period of November 1, 2016, through September 11, 2017 (the “Interim Period”), there were no (i) disagreements with KPMG on any matter of accounting principles or practices, financial statement disclosure, or auditing scope or procedure, which disagreements, if not resolved to the satisfaction of KPMG, would have caused it to make reference to the subject matter of the disagreements in connection with its reports on the Applicable Funds’ financial statements for such years, nor (ii) “reportable events” of the kind described in Item 304(a)(1)(v) of Regulation S-K under the Securities Exchange Act of 1934, as amended.
During fiscal years 2015 and 2016 and the Interim Period, neither the Applicable Funds nor anyone on behalf of the Applicable Funds has consulted Tait Weller on items that concerned (a) the application of accounting principles to a specified transaction, either completed or proposed, or the type of audit opinion that might be rendered on an Applicable Fund’s financial statements, or (b) the subject of a disagreement (as defined in paragraph (a)(1)(iv) of Item 304 of Regulation S-K and related instructions) or reportable events (as described in paragraph (a)(1)(v) of Item 304 of Regulation S-K). The selection
| NOTES TO THE FINANCIAL STATEMENTS |
of Tait Weller does not reflect any disagreements or dissatisfaction by the Applicable Funds, the Board, or the Audit Committee with the performance of KPMG.
10). AGREEMENT AND PLAN OF REORGANIZATION
On December 27, 2016, the Board of the Trust approved and declared advisable the reorganization of the Hennessy Large Value Fund (the “Large Value Fund”) into the Fund. The purpose of the reorganization was to combine two funds within the Trust with similar investment objectives and strategies. The reorganization provided for the transfer of assets of the Large Value Fund to the Fund and the assumption of the liabilities of the Large Value Fund by the Fund. Following the reorganization, the Fund held the assets of the Large Value Fund until the Fund rebalanced its portfolio in the winter, pursuant to its customary procedures. The reorganization was effective as of the close of business on February 27, 2017. The following tables illustrate the specifics of the Fund’s reorganization:
| | Shares Issued | | | |
| | to Shareholders | Cornerstone | | |
| Large Value Fund | of Large Value | Value Fund | Combined | Tax Status |
Net Assets | Fund | Net Assets | Net Assets | of Transfer |
$144,938,380(1) | 7,255,257 | $138,339,221 | $283,277,601 | Non-taxable |
(1) | Includes accumulated realized losses and unrealized appreciation in the amounts of $(1,561,193) and $34,112,735, respectively. |
Assuming the reorganization had been completed on November 1, 2016, the beginning of the annual reporting period of the Fund, the pro forma results of operation (unaudited) for fiscal year 2017 would have been as follows:
| Net investment income | | $ | 6,090,397 | |
| Net realized gain on investments | | $ | 41,027,748 | |
| Net change in unrealized appreciation on investments | | $ | 5,413,160 | |
| Net increase in net assets resulting from operations | | $ | 52,531,305 | |
Because the Fund has been managed as a single integrated portfolio since the reorganization was completed, it is not practicable to separate the amounts of revenue and earnings of the Large Value Fund and the Fund that have been included in the Fund’s Statement of Operations since February 27, 2017.
11). EVENTS SUBSEQUENT TO YEAR END
Management has evaluated the Fund’s related events and transactions that occurred subsequent to October 31, 2017, through the date of issuance of the Fund’s financial statements. Other than as disclosed below, management has determined that there were no subsequent events requiring recognition or disclosure in the financial statements.
On December 7, 2017, capital gains were declared and paid to shareholders of record on December 6, 2017, as follows:
| | | Long-term | | | Short-term | |
| Investor Class | | $ | 2.33230 | | | $ | 0.19820 | |
| Institutional Class | | $ | 2.33695 | | | $ | 0.19859 | |
| HENNESSY FUNDS | 1-800-966-4354 | |
Report of Independent Registered Public
Accounting Firm
To the Board of Trustees of Hennessy Funds Trust
and the Shareholders of the Hennessy Cornerstone Value Fund
Novato, CA
We have audited the accompanying statement of assets and liabilities, including the schedule of investments, of the Hennessy Cornerstone Value Fund (the “Fund”), a series of Hennessy Funds Trust as of October 31, 2017, and the related statement of operations, the statement of changes in net assets, and the financial highlights for the year then ended. The statement of changes in net assets for the year ended October 31, 2016 and the financial highlights for each of the four years in the period ended October 31, 2016 have been audited by other auditors, whose report dated December 22, 2016 expressed unqualified opinions on such financial statements and financial highlights. These financial statements and financial highlights are the responsibility of the Fund’s management. Our responsibility is to express an opinion on these financial statements and financial highlights based on our audit.
We conducted our audit in accordance with the standards of the Public Company Accounting Oversight Board (United States). Those standards require that we plan and perform the audit to obtain reasonable assurance about whether the financial statements and financial highlights are free of material misstatement. The Fund is not required to have, nor were we engaged to perform, an audit of the Fund’s internal control over financial reporting. Our audit included consideration of internal control over financial reporting as a basis for designing audit procedures that are appropriate in the circumstances, but not for the purposes of expressing an opinion on the effectiveness of the Fund’s internal control over financial reporting. Accordingly, we express no such opinion. An audit includes examining, on a test basis, evidence supporting the amounts and disclosures in the financial statements. Our procedures included confirmation of securities owned as of October 31, 2017, by correspondence with the custodian. An audit also includes assessing the accounting principles used and significant estimates made by management, as well as evaluating the overall financial statement presentation. We believe that our audit provides a reasonable basis for our opinion.
In our opinion, the financial statements and financial highlights referred to above present fairly, in all material respects, the financial position of the Hennessy Cornerstone Value Fund as of October 31, 2017, the results of its operations, the changes in its net assets, and the financial highlights for the year then ended, in conformity with accounting principles generally accepted in the United States of America.
TAIT, WELLER & BAKER LLP
Philadelphia, Pennsylvania
December 22, 2017
| REPORT OF INDEPENDENT REGISTERED PUBLIC ACCOUNTING FIRM/TRUSTEES AND OFFICERS |
Trustees and Officers of the Fund (Unaudited)
The business and affairs of the Funds are managed under the direction of the Board of Trustees of the Trust, and the Board of Trustees elects the Officers of the Trust. Beginning in March 2015, the Board of Trustees has from time to time appointed advisers to the Board of Trustees (“Advisers”), with the intention of having qualified individuals serve in an advisory capacity in order to garner experience in the mutual fund and asset management industry and be considered as potential Trustees in the future. There are currently three Advisers to the Board of Trustees: Brian Alexander, Doug Franklin, and Claire Knoles. As Advisers, Mr. Alexander, Mr. Franklin, and Ms. Knoles attend meetings of the Board and act as non-voting participants. Information pertaining to the Trustees, Advisers, and the Officers of the Trust is set forth below. The Trustees and Officers serve until their successors are duly elected and qualified or until their earlier death, resignation, or removal. Each of the Trustees oversees 14 Hennessy Funds. Unless otherwise indicated, the address of all persons listed below is 7250 Redwood Boulevard, Suite 200, Novato, CA 94945. The Fund’s Statement of Additional Information includes more information about the persons listed below and is available, without charge, upon request by calling 1-800-966-4354.
| | | | Other |
| | | | Directorships |
| | | | Held Outside |
| Name, (Year of Birth), | | | of Fund |
| and Position Held | Start Date | Principal Occupation(s) | Complex During |
with the Trust | of Service | During Past Five Years | Past Five Years(1) |
| | | | |
| Disinterested Trustees and Advisers |
| | | | |
| J. Dennis DeSousa | January 1996 | Mr. DeSousa is a real estate investor. | None. |
| (1936) | | | |
| Trustee | | | |
| | | | |
| Robert T. Doyle | January 1996 | Mr. Doyle has been the Sheriff of | None. |
| (1947) | | Marin County, California since 1996. | |
| Trustee | | | |
| | | | |
| Gerald P. Richardson | May 2004 | Mr. Richardson is an independent | None. |
| (1945) | | consultant in the securities industry. | |
| Trustee | | | |
| | | | |
| Brian Alexander | March 2015 | Mr. Alexander has been employed | None. |
| (1981) | | by Sutter Health Novato Community | |
| Adviser to the Board | | Hospital since 2012, first as an | |
| | | Assistant Administrator and then, | |
| | | beginning in 2013, as the Chief | |
| | | Administrative Officer. From 2011 | |
| | | through 2012, Mr. Alexander was | |
| | | employed by Sutter Health West Bay | |
| | | Region as the Regional Director of | |
| | | Strategic Decision Support. | |
| HENNESSY FUNDS | 1-800-966-4354 | |
| | | | Other |
| | | | Directorships |
| | | | Held Outside |
| Name, (Year of Birth), | | | of Fund |
| and Position Held | Start Date | Principal Occupation(s) | Complex During |
with the Trust | of Service | During Past Five Years | Past Five Years(1) |
| | | | |
| Doug Franklin | March 2016 | Mr. Franklin is a retired insurance | None. |
| (1964) | | industry executive. From 1987 | |
| Adviser to the Board | | through 2015, he was employed | |
| | | by Allianz-Fireman’s Fund Insurance | |
| | | Company in various positions, | |
| | | including Chief Actuary and | |
| | | Chief Risk Officer. | |
| | | | |
| Claire Knoles | December 2015 | Ms. Knoles is a founder of Kiosk and | None. |
| (1974) | | has served as its Chief Operating | |
| Adviser to the Board | | Officer since 2004. Kiosk is a full | |
| | | service marketing agency with | |
| | | offices in the San Francisco Bay | |
| | | Area, Toronto, and Liverpool, UK. | |
| | | | |
Interested Trustee(2) | | | |
| | | | |
| Neil J. Hennessy | January 1996 as | Mr. Hennessy has been employed by | Hennessy |
| (1956) | a Trustee and | Hennessy Advisors, Inc. since 1989 | Advisors, Inc. |
| Trustee, Chairman of | June 2008 as | and currently serves as its President, | |
| the Board, Chief | an Officer | Chairman and Chief Executive Officer. | |
| Investment Officer, | | | |
| Portfolio Manager, | | | |
| and President | | | |
| Name, (Year of Birth), | | |
| and Position Held | Start Date | Principal Occupation(s) |
with the Trust | of Service | During Past Five Years |
| | | |
| Officers | | |
| | | |
| Teresa M. Nilsen | January 1996 | Ms. Nilsen has been employed by Hennessy Advisors, Inc. |
| (1966) | | since 1989 and currently serves as its Executive Vice President, |
| Executive Vice President | | Chief Operations Officer, Chief Financial Officer, and Secretary. |
| and Treasurer | | |
| | | |
| Daniel B. Steadman | March 2000 | Mr. Steadman has been employed by Hennessy Advisors, Inc. |
| (1956) | | since 2000 and currently serves as its Executive Vice President |
| Executive Vice President | | and Chief Compliance Officer. |
| and Secretary | | |
| | | |
| Brian Carlson | December 2013 | Mr. Carlson has been employed by Hennessy Advisors, Inc. |
| (1972) | | since December 2013. Mr. Carlson was previously a co-founder |
| Senior Vice President and | | and principal of Trivium Consultants, LLC from February 2011 |
| Head of Distribution | | through November 2013. |
| | | |
| Jennifer Cheskiewicz | June 2013 | Ms. Cheskiewicz has been employed by Hennessy Advisors, Inc. |
| (1977) | | as its General Counsel since June 2013. She previously served |
| Senior Vice President and | | as in-house counsel to Carlson Capital, L.P., an SEC-registered |
| Chief Compliance Officer | | investment advisor to several private funds, from |
| | | February 2010 to May 2013. |
| TRUSTEES AND OFFICERS OF THE FUND |
| Name, (Year of Birth), | | |
| and Position Held | Start Date | Principal Occupation(s) |
with the Trust | of Service | During Past Five Years |
| | | |
| David Ellison | October 2012 | Mr. Ellison has been employed by Hennessy Advisors, Inc. since |
(1958)(3) | | October 2012. He has served as a Portfolio Manager of the |
| Senior Vice President | | Hennessy Small Cap Financial Fund and the Hennessy Large |
| and Portfolio Manager | | Cap Financial Fund since inception. Mr. Ellison also served as a |
| | | Portfolio Manager of the Hennessy Technology Fund from its |
| | | inception until February 2017. Mr. Ellison served as Director, |
| | | CIO and President of FBR Fund Advisers, Inc. from |
| | | December 1999 to October 2012. |
| | | |
| Ryan Kelley | March 2013 | Mr. Kelley has been employed by Hennessy Advisors, Inc. since |
(1972)(4) | | October 2012. He has served as a Portfolio Manager of the |
| Vice President and | | Hennessy Gas Utility Fund, the Hennessy Small Cap Financial |
| Portfolio Manager | | Fund, and the Hennessy Large Cap Financial Fund since |
| | | October 2014. He served as Co-Portfolio Manager of the same |
| | | funds from March 2013 through September 2014, and as a |
| | | Portfolio Analyst for the Hennessy Funds from October 2012 |
| | | through October 2014. Mr. Kelley has also served as a Portfolio |
| | | Manager of the Hennessy Cornerstone Growth Fund, the |
| | | Hennessy Cornerstone Mid Cap 30 Fund, the Hennessy |
| | | Cornerstone Large Growth Fund, and the Hennessy |
| | | Cornerstone Value Fund and as a Co-Portfolio Manager of the |
| | | Hennessy Technology Fund since February 2017. Mr. Kelley |
| | | served as Portfolio Manager of FBR Fund Advisers, Inc. from |
| | | January 2008 to October 2012. |
| | | |
| Brian Peery | March 2003 as | Mr. Peery has been employed by Hennessy Advisors, Inc. since |
| (1969) | an Officer and | 2002. He has served as a Portfolio Manager of the Hennessy |
| Senior Vice President | February 2011 | Cornerstone Growth Fund, the Hennessy Cornerstone Mid Cap |
| and Portfolio Manager | as a Co-Portfolio | 30 Fund, the Hennessy Cornerstone Large Growth Fund, the |
| | Manager or | Hennessy Cornerstone Value Fund, the Hennessy Total Return |
| | Portfolio Manager | Fund, and the Hennessy Balanced Fund since October 2014. |
| | | He served as Co-Portfolio Manager of the same funds from |
| | | February 2011 through September 2014. Mr. Peery has also |
| | | served as a Portfolio Manager of the Hennessy Gas Utility Fund |
| | | since February 2015 and as Lead Portfolio Manager of the |
| | | Hennessy Technology Fund since February 2017. |
| | | |
| Daniel P. Hennessy | December 2016 | Mr. Daniel Hennessy has been employed by Hennessy Advisors, |
| (1990) | | Inc. since 2015. He has served as an Associate Analyst of the |
| Assistant Vice President | | Hennessy Technology Fund since February 2017. He previously |
| and Associate Analyst | | served as a Mutual Fund Specialist at U.S. Bancorp Fund |
| | | Services, LLC from November 2014 to July 2015. Prior to that, |
| | | he attended the University of San Diego, where he earned a |
| | | degree in Political Science. |
(1) | Messrs. DeSousa, Doyle, Hennessy, and Richardson previously served on the Board of Directors of Hennessy Mutual Funds, Inc. (“HMFI”), The Hennessy Funds, Inc. (“HFI”), and Hennessy SPARX Funds Trust (“HSFT”). Pursuant to an internal reorganization effective as of February 28, 2014, the series of HFMI, HFI, and HSFT were reorganized into corresponding series of Hennessy Funds Trust that mirrored them. Subsequent to the reorganization, HFMI, HFI, and HSFT were dissolved. |
(2) | Mr. Hennessy is considered an “interested person,” as defined in the Investment Company Act of 1940, as amended, because he is an officer of the Hennessy Funds. |
(3) | The address of this officer is 101 Federal Street, Suite 1900, Boston, MA 02110. |
(4) | The address of this officer is 1340 Environ Way, Chapel Hill, NC 27517. |
| HENNESSY FUNDS | 1-800-966-4354 | |
Expense Example (Unaudited)
October 31, 2017
As a shareholder of the Fund, you incur two types of costs: (1) transaction costs, including sales charges (loads) on purchase payments, reinvested dividends, or other distributions, redemption fees, and exchange fees; and (2) ongoing costs, including management fees, service fees, and other Fund expenses. This Example is intended to help you understand your ongoing costs (in dollars) of investing in the Fund and to compare these costs with the ongoing costs of investing in other mutual funds. The Example is based on an investment of $1,000 invested at the beginning of the period and held for the entire period from May 1, 2017, through October 31, 2017.
Actual Expenses
The first line of the table below under the “Investor Class” and “Institutional Class” headings provides information about actual account values and actual expenses. Although the Fund charges no sales loads or transaction fees, you will be assessed fees for outgoing wire transfers, returned checks and stop payment orders at prevailing rates charged by U.S. Bancorp Fund Services, LLC, the Fund’s transfer agent. If you request that a redemption be made by wire transfer, currently a $15 fee is charged by the Fund’s transfer agent. IRA accounts will be charged a $15 annual maintenance fee. The example below includes, but is not limited to, management fees, shareholder servicing fees, fund accounting, custody, and transfer agent fees. However, the example below does not include portfolio trading commissions and related expenses, and other extraordinary expenses as determined under generally accepted accounting principles. You may use the information in this line, together with the amount you invested, to estimate the expenses that you paid over the period. Simply divide your account value by $1,000 (for example, an $8,600 account value divided by $1,000 = 8.6), then multiply the result by the number in the first line of the table under the “Investor Class” or “Institutional Class” headings in the column entitled “Expenses Paid During Period” to estimate the expenses you paid on your account during this period.
Hypothetical Example for Comparison Purposes
The second line of the table below under the “Investor Class” and “Institutional Class” headings provides information about hypothetical account values and hypothetical expenses based on the Fund’s actual expense ratios and an assumed rate of return of 5% per year before expenses, which is not the Fund’s actual return. The hypothetical account values and expenses may not be used to estimate the actual ending account balance or expenses you paid for the period. You may use this information to compare the ongoing costs of investing in the Fund and other funds. To do so, compare this 5% hypothetical example with the 5% hypothetical examples that appear in the shareholder reports of the other funds. Please note that the expenses shown in the table are meant to highlight your ongoing costs only and do not reflect any transactional costs, such as sales charges (loads), or exchange fees. Therefore, the second line of the table under the “Investor Class” and “Institutional Class” headings is useful in comparing ongoing costs only, and will not help you determine the relative total costs of owning different funds. In addition, if these transactional costs were included, your costs would have been higher.
| | | | Expenses Paid |
| | Beginning | Ending | During Period(1) |
| | Account Value | Account Value | May 1, 2017 – |
| | May 1, 2017 | October 31, 2017 | October 31, 2017 |
| Investor Class | | | |
| Actual | $1,000.00 | $1,088.10 | $6.37 |
| Hypothetical (5% return before expenses) | $1,000.00 | $1,019.11 | $6.16 |
| | | | |
| Institutional Class | | | |
| Actual | $1,000.00 | $1,089.60 | $5.16 |
| Hypothetical (5% return before expenses) | $1,000.00 | $1,020.27 | $4.99 |
(1) | Expenses are equal to the Fund’s annualized expense ratio of 1.21% for Investor Class shares or 0.98% for Institutional Class shares, as applicable, multiplied by the average account value over the period, multiplied by 184/365 days (to reflect one-half year period). |
| HENNESSY FUNDS | 1-800-966-4354 | |
How to Obtain a Copy of the Fund’s
Proxy Voting Policy and Proxy Voting Records
A description of the policies and procedures the Fund uses to determine how to vote proxies relating to portfolio securities is available without charge: (1) by calling 1-800-966-4354; (2) on the Hennessy Funds’ website at hennessyfunds.com/proxy-voting/policy.fs; or (3) on the U.S. Securities and Exchange Commission’s (the “SEC”) website at www.sec.gov. The Fund’s proxy voting record is available without charge on both the Hennessy Funds’ website at hennessyfunds.com/proxy-voting/vote.fs and the SEC’s website at www.sec.gov no later than August 31 for the prior 12 months ending June 30.
Quarterly Filings on Form N-Q
The Fund files a complete schedule of portfolio holdings with the SEC for the first and third quarters of each fiscal year on Form N-Q. The Fund’s Forms N-Q are made available on the SEC’s website at www.sec.gov. The Fund’s Forms N-Q may be reviewed and copied at the SEC’s Public Reference Room in Washington, DC, and information on the operation of the Public Reference Room may be obtained by calling 1-800-SEC-0330. Information included in the Fund’s Forms N-Q will also be available upon request by calling 1-800-966-4354.
Federal Tax Distribution Information
(Unaudited)
For fiscal year 2017, certain dividends paid by the Fund may be subject to a maximum tax rate of 23.8%, as provided for by the Jobs and Growth Tax Relief Reconciliation Act of 2003. The percentage of dividends declared from ordinary income designated as qualified dividend income was 100.00%.
For corporate shareholders, the percent of ordinary income distributions that qualified for the corporate dividends received deduction for fiscal year 2017 was 94.30%.
The percentage of taxable ordinary income distributions that are designated as short-term capital gain distributions under Section 871(k)(2)(C) of the Internal Revenue Code of 1986, as amended, for the Fund was 0.00%.
Householding
To help keep the Fund’s costs as low as possible, we generally deliver a single copy of most financial reports and prospectuses to shareholders who share an address, even if the accounts are registered under different names. This process, known as “householding,” does not apply to account statements. You may request an individual copy of a prospectus or financial report at any time. If you would like to receive separate mailings, please call U.S. Bancorp Fund Services, LLC at 1-800-261-6950 or 1-414-765-4124 and we will begin individual delivery within 30 days of your request. If your account is held through a financial institution or other intermediary, please contact them directly to request individual delivery.
| PROXY VOTING — PRIVACY POLICY |
Privacy Policy
We collect the following non-public personal information about you:
| | • | information we receive from you on or in applications or other forms, correspondence, or conversations, including, but not limited to, your name, address, phone number, social security number, assets, income, and date of birth; and |
| | | |
| | • | information about your transactions with us, our affiliates, or others, including, but not limited to, your account number and balance, payment history, parties to transactions, cost basis information, and other financial information. |
We do not disclose any non-public personal information about our current or former shareholders to non-affiliated third parties, except as permitted by law. For example, we are permitted by law to disclose all of the information we collect, as described above, to our Transfer Agent to process your transactions. Furthermore, we restrict access to your non-public personal information to those persons who require such information to provide products or services to you. We maintain physical, electronic, and procedural safeguards that comply with federal standards to guard your non-public personal information.
In the event that you hold shares of the Fund through a financial intermediary, including, but not limited to, a broker-dealer, bank, or trust company, the privacy policy of your financial intermediary would govern how your non-public personal information will be shared with non-affiliated third parties.
| HENNESSY FUNDS | 1-800-966-4354 | |
For information, questions or assistance, please call
The Hennessy Funds
1-800-966-4354 or 1-415-899-1555
INVESTMENT ADVISOR
Hennessy Advisors, Inc.
7250 Redwood Boulevard, Suite 200
Novato, California 94945
ADMINISTRATOR,
TRANSFER AGENT,
DIVIDEND PAYING AGENT &
SHAREHOLDER SERVICING AGENT
U.S. Bancorp Fund Services, LLC
P.O. Box 701
Milwaukee, Wisconsin 53201-0701
CUSTODIAN
U.S. Bank N.A.
Custody Operations
1555 North River Center Drive, Suite 302
Milwaukee, Wisconsin 53212
TRUSTEES
Neil J. Hennessy
Robert T. Doyle
J. Dennis DeSousa
Gerald P. Richardson
COUNSEL
Foley & Lardner LLP
777 East Wisconsin Avenue
Milwaukee, Wisconsin 53202-5306
INDEPENDENT REGISTERED
PUBLIC ACCOUNTING FIRM
Tait, Weller & Baker LLP
1818 Market Street, Suite 2400
Philadelphia, Pennsylvania 19103
DISTRIBUTOR
Quasar Distributors, LLC
777 East Wisconsin Avenue
Milwaukee, Wisconsin 53202
hennessyfunds.com | 1-800-966-4354
This report has been prepared for shareholders and may be distributed to
others only if preceded or accompanied by a current prospectus.
ANNUAL REPORT
OCTOBER 31, 2017
HENNESSY TOTAL RETURN FUND
Investor Class HDOGX
hennessyfunds.com | 1-800-966-4354
(This Page Intentionally Left Blank.)
Contents
| Letter to Shareholders | | | 2 |
| Performance Overview | | | 4 |
| Financial Statements | | | |
| Schedule of Investments | | | 6 |
| Statement of Assets and Liabilities | | | 10 |
| Statement of Operations | | | 11 |
| Statements of Changes in Net Assets | | | 12 |
| Statement of Cash Flows | | | 13 |
| Financial Highlights | | | 14 |
| Notes to the Financial Statements | | | 16 |
| Report of Independent Registered Public Accounting Firm | | | 25 |
| Trustees and Officers of the Fund | | | 26 |
| Expense Example | | | 30 |
| Proxy Voting Policy and Proxy Voting Records | | | 32 |
| Quarterly Schedule of Investments | | | 32 |
| Federal Tax Distribution Information | | | 32 |
| Householding | | | 32 |
| Privacy Policy | | | 33 |
| HENNESSY FUNDS | 1-800-966-4354 | |
December 2017
Dear Hennessy Funds Shareholder:
Over the past year, global equity markets have made strong advances, fueled by continued, broad-based economic growth in most countries and regions, and in spite of a somewhat unsettling geopolitical backdrop.
U.S. stocks performed well in the first year of the new administration in Washington, and, ignoring the debate and the bluster, investors have continued to focus on what concerns them the most – tax reform, deregulation, and the hope of an increase in infrastructure spending. As we move into the final weeks of the calendar year, with the major indices reaching new highs, I find myself envisioning the Dow Jones Industrial Average building momentum toward 30,000.
Over the past 12 months, the U.S. economy has continued to grow at a steady rate of almost 2.5% on an annualized basis, as measured by GDP. Companies have added over 170,000 jobs per month on average over the past year, and the current unemployment rate of 4.1% is the lowest in 17 years. Consumer confidence is high and still rising, and corporate profits are at all-time highs. The Federal Reserve has been increasing interest rates, but at a gradual pace. The bond market has also continued to support the equity market and equity market valuations. Since December of last year, long bond yields have stayed within a narrow band, with the 10-year U.S. Treasury yield hovering in the 2.0% to 2.5% range, and remain low compared to historical averages. In my opinion, long bond yields have stayed low despite three increases in the Federal Funds rate over the last 12 months in part due to persistent low inflation.
Meanwhile, the prospective price-to-earnings multiples for the Dow Jones Industrial Average and S&P 500 Index are just above long-term averages at 19.5x and 19.9x, respectively. I believe these levels of stock valuation, while higher than a year ago, are still very reasonable. At the peak of the technology/dot-com bubble, U.S. equities sold at much higher multiples across the board than they do today, and bond yields were also much higher. In June of 1999, the Dow Jones Industrial Average sold at 28x earnings and the 10-year bond yield was close to 6%. Today, the Dow is selling at under 20x earnings and is offering a 2.2% dividend yield, on par with the yield of the 10-year government bond at 2.4%.
Equity markets in the U.S. have been rising for almost nine years, and financial media reports have speculated that this bull run will come to end, but why? I see no substantial reasons or indicators that a major correction is on the horizon. I remain confident that this bull market has room to run. Overall, investment fundamentals are strong. Corporate earnings are growing at a healthy rate, and companies are generating excess cash flow. Cash continues to build on corporate balance sheets, with $5.2 trillion in cash and short term investments among the S&P 500 Index companies as of October 31, 2017. If our government leaders can pass a meaningful tax reform bill and continue efforts toward regulatory relief, it could be icing on the cake for equities.
There have been, and will likely continue to be, downturns throughout this extended bull market. Since 2010, there have been 18 downturns in the market, 14 of which were between 5% and 10% and four of which were corrections of between 10% and 20%. Yet the market has bounced back following each pullback and then has moved higher. A correction is not the end of the bull market. What might signal that we are at the end of this bull market? Euphoria. And I still see no signs of euphoria in this market. In the past,
I have likened the current bull market to that of 1982-2000, and I am confident in the strength of the market today and believe the economy will continue its slow, but steady, growth into the coming year.
Thank you for your continued confidence and investment in our funds. If you have any questions or would like to speak with us directly, please don’t hesitate to call us at (800) 966-4354.
Best regards,
Neil J. Hennessy
President and Chief Investment Officer
Past performance does not guarantee future results.
Mutual fund investing involves risk. Principal loss is possible.
Opinions expressed are those of Neil Hennessy and are subject to change, are not guaranteed, and should not be considered investment advice.
The Dow Jones Industrial Average and S&P 500 Index are unmanaged indices commonly used to measure the performance of U.S. stocks. One cannot invest directly in an index.
Price to earnings is calculated by dividing a company’s market price per share by its earnings per share. Dividend yield is calculated as the annual dividends paid by a company divided by the price of a share of its stock. Cash flow provides an indication of a company’s financial strength and represents earnings before depreciation, amortization, and non-cash charges.
| HENNESSY FUNDS | 1-800-966-4354 | |
Performance Overview (Unaudited)
CHANGE IN VALUE OF $10,000 INVESTMENT
This graph illustrates the performance of an initial investment of $10,000 made in the Fund ten years ago and assumes the reinvestment of dividends.
AVERAGE ANNUAL TOTAL RETURN FOR PERIODS ENDED OCTOBER 31, 2017
| | One | Five | Ten |
| | Year | Years | Years |
| Hennessy Total Return Fund (HDOGX) | 12.56% | 8.83% | 4.44% |
| 75/25 Blended DJIA/Treasury Index | 23.54% | 11.32% | 6.38% |
| Dow Jones Industrial Average | 32.07% | 15.12% | 8.15% |
Expense ratio: 1.45%
Performance data quoted represents past performance; past performance does not guarantee future results. The investment return and principal value of an investment will fluctuate so that an investor’s shares, when redeemed, may be worth more or less than their original cost. The performance table does not reflect the deduction of taxes that a shareholder would pay on Fund distributions or the redemption of Fund shares. Current performance of the Fund may be lower or higher than the performance quoted. Performance data current to the most recent month end may be obtained by visiting hennessyfunds.com.
The 75/25 Blended DJIA/Treasury Index consists of 75% common stocks represented by the Dow Jones Industrial Average and 25% short-duration Treasury securities represented by the ICE BofAML U.S. 3-Month Treasury Bill Index. The Dow Jones Industrial Average is an unmanaged index commonly used to measure the performance of U.S. stocks. The ICE BofAML U.S. 3-Month Treasury Bill Index is an unmanaged index of Treasury securities maturing in 90 days. One cannot invest directly in an index.
The expense ratio presented is from the most recent prospectus. The expense ratio for the current reporting period is available in the Financial Highlights section of this report.
PERFORMANCE NARRATIVE
Portfolio Managers Neil J. Hennessy and Brian E. Peery
Performance:
For the 12-month period ended October 31, 2017, the Hennessy Total Return Fund returned 12.56%, underperforming both the 75/25 Blended DJIA/Treasury Index* and the Dow Jones Industrial Average, which returned 23.54% and 32.07% for the same period, respectively.
The Fund underperformed its primary benchmark, the 75/25 Blended DJIA/Treasury Index, as a result of both sector allocation and stock selection. Some of the largest contributors to the Fund’s relative underperformance were the notable absences of Apple and Microsoft from the portfolio, as both stocks performed well over the period. Additionally the Fund’s overweight position in Cisco Systems Inc. hurt performance. An overweight position in the Consumer Discretionary sector helped performance, but its contribution was offset by overweight positions in Energy and Telecommunication Services, which hurt the Fund’s relative performance.
Portfolio Strategy:
The Fund invests approximately 75% of its assets in the “Dogs of the Dow,” the 10 highest dividend-yielding Dow stocks, and 25% of its assets in U.S. Treasuries. As a result of this “blended” strategy, the Fund may be expected to underperform equities in periods when markets rise and outperform in periods when markets fall. The Fund is designed to allow investors to gain exposure to the equity market while maintaining a percentage of their investment in fixed income securities. We believe the Fund is well positioned for the more conservative investor, as the equity portion of the portfolio is invested in what we would deem to be high-quality companies, each with a historically high dividend yield, and the balance of the Fund is invested in low-risk, short-duration U.S. Treasuries.
Investment Commentary:
We believe the balance between risk and reward afforded by the Fund’s stock selection and asset allocation policies provides conservative investors with a compelling way to participate in the market longer term while maintaining a lower risk profile. With investments in all but three of the market sectors, we believe the Fund is well diversified. We believe the Fund’s holdings, stocks that offer higher dividend yields and trade on lower valuations than the DJIA as a whole, will continue to participate in a rising market. Should the market experience a correction, we would expect our more defensive holding to perform well relative to the market. The relatively short duration of the 25% weighting of U.S. Treasuries in the portfolio (all less than one year) may allow us the ability to roll into higher-yielding Treasuries in the event yields rise.
| * | The 75/25 Blended DJIA/Treasury Index consists of 75% common stocks represented by the Dow Jones Industrial Average and 25% short-duration Treasury securities represented by the ICE BofA Merrill Lynch U.S. 3-Month Treasury Bill Index. |
Opinions expressed are those of the Portfolio Managers as of the date written and are subject to change, are not guaranteed, and should not be considered investment advice or an indication of trading intent.
The Dow Jones Industrial Average is an unmanaged index commonly used to measure the performance of U.S. stocks. The ICE BofA Merrill Lynch U.S. 3-Month Treasury Bill Index is an unmanaged index of Treasury securities maturing in three months. One cannot invest directly in an index.
The Fund is non-diversified, meaning it may concentrate its assets in fewer individual holdings than a diversified fund, making it more exposed to individual stock volatility than a diversified fund. The Fund’s formula-based strategy may cause the Fund to buy or sell securities at times when it may not be advantageous. Please see the Fund’s prospectus for a more complete discussion of these and other risks.
References to specific securities should not be considered a recommendation to buy or sell any security. Fund holdings and sector allocations are subject to change. Please refer to the Schedule of Investments included in this report for additional portfolio information.
Duration is a measure of the sensitivity of the price (the value of principal) of a fixed-income investment to a change in interest rates and is expressed as a number of years. Dividend yield is calculated as the annual dividends paid by a company divided by its market price per share.
| HENNESSY FUNDS | 1-800-966-4354 | |
Financial Statements
Schedule of Investments as of October 31, 2017 |
HENNESSY TOTAL RETURN FUND
(% of Net Assets)
| TOP TEN HOLDINGS | | % NET ASSETS |
| U.S. Treasury Bill, 0.995%, 11/16/2017 | | | 23.14 | % |
| U.S. Treasury Bill, 1.045%, 12/21/2017 | | | 23.12 | % |
| U.S. Treasury Bill, 1.090%, 01/18/2018 | | | 23.10 | % |
| Cisco Systems, Inc. | | | 7.01 | % |
| Pfizer, Inc. | | | 6.79 | % |
| Chevron Corp. | | | 6.75 | % |
| The Coca-Cola Co. | | | 6.67 | % |
| International Business Machines Corp. | | | 6.64 | % |
| Exxon Mobil Corp. | | | 6.63 | % |
| Verizon Communications, Inc. | | | 6.53 | % |
Note: For presentation purposes, the Fund has grouped some of the industry categories. For purposes of categorizing securities for compliance with Section 8(b)(1) of the Investment Company Act of 1940, as amended, the Fund uses more specific industry classifications.
| COMMON STOCKS – 68.65% | | Number | | | | | | % of | |
| | | of Shares | | | Value | | | Net Assets | |
| Consumer Discretionary – 1.24% | | | | | | | | | |
| McDonald’s Corp. | | | 5,800 | | | $ | 968,078 | | | | 1.24 | % |
| | | | | | | | | | | | | |
| Consumer Staples – 13.13% | | | | | | | | | | | | |
| The Coca-Cola Co. | | | 112,800 | | | | 5,186,544 | | | | 6.67 | % |
| The Procter & Gamble Co. | | | 58,200 | | | | 5,024,988 | | | | 6.46 | % |
| | | | | | | | 10,211,532 | | | | 13.13 | % |
| | | | | | | | | | | | | |
| Energy – 13.38% | | | | | | | | | | | | |
| Chevron Corp. | | | 45,300 | | | | 5,249,817 | | | | 6.75 | % |
| Exxon Mobil Corp. | | | 61,800 | | | | 5,151,030 | | | | 6.63 | % |
| | | | | | | | 10,400,847 | | | | 13.38 | % |
| | | | | | | | | | | | | |
| Health Care – 8.61% | | | | | | | | | | | | |
| Merck & Co., Inc. | | | 25,700 | | | | 1,415,813 | | | | 1.82 | % |
| Pfizer, Inc. | | | 150,500 | | | | 5,276,530 | | | | 6.79 | % |
| | | | | | | | 6,692,343 | | | | 8.61 | % |
| | | | | | | | | | | | | |
| Industrials – 8.85% | | | | | | | | | | | | |
| Caterpillar, Inc. | | | 17,200 | | | | 2,335,760 | | | | 3.00 | % |
| General Electric Co. | | | 154,000 | | | | 3,104,640 | | | | 3.99 | % |
| The Boeing Co. | | | 5,600 | | | | 1,444,688 | | | | 1.86 | % |
| | | | | | | | 6,885,088 | | | | 8.85 | % |
| | | | | | | | | | | | | |
| Information Technology – 16.91% | | | | | | | | | | | | |
| Cisco Systems, Inc. | | | 159,700 | | | | 5,453,755 | | | | 7.01 | % |
| Intel Corp. | | | 55,700 | | | | 2,533,793 | | | | 3.26 | % |
| International Business Machines Corp. | | | 33,500 | | | | 5,161,010 | | | | 6.64 | % |
| | | | | | | | 13,148,558 | | | | 16.91 | % |
| | | | | | | | | | | | | |
| Telecommunication Services – 6.53% | | | | | | | | | | | | |
| Verizon Communications, Inc. | | | 106,000 | | | | 5,074,220 | | | | 6.53 | % |
| | | | | | | | | | | | | |
| Total Common Stocks | | | | | | | | | | | | |
| (Cost $48,634,762) | | | | | | | 53,380,666 | | | | 68.65 | % |
The accompanying notes are an integral part of these financial statements.
| HENNESSY FUNDS | 1-800-966-4354 | |
| SHORT-TERM INVESTMENTS – 73.18% | | Number of Shares/ | | | | | | % of | |
| | | Par Amount | | | Value | | | Net Assets | |
| Money Market Funds – 3.82% | | | | | | | | | |
| Fidelity Government Portfolio, Institutional Class, 0.92% (a) | | | 2,971,734 | | | $ | 2,971,734 | | | | 3.82 | % |
| | | | | | | | | | | | | |
| U.S. Treasury Bills (c) – 69.36% | | | | | | | | | | | | |
| 0.995%, 11/16/2017 (b) | | | 18,000,000 | | | | 17,992,688 | | | | 23.14 | % |
| 1.045%, 12/21/2017 (b) | | | 18,000,000 | | | | 17,975,000 | | | | 23.12 | % |
| 1.090%, 01/18/2017 (b) | | | 18,000,000 | | | | 17,957,882 | | | | 23.10 | % |
| | | | | | | | 53,925,570 | | | | 69.36 | % |
| Total Short-Term Investments | | | | | | | | | | | | |
| (Cost $56,898,374) | | | | | | | 56,897,304 | | | | 73.18 | % |
| | | | | | | | | | | | | |
| Total Investments | | | | | | | | | | | | |
| (Cost $105,533,136) – 141.83% | | | | | | | 110,277,970 | | | | 141.83 | % |
| Liabilities in Excess of Other Assets – (41.83)% | | | | | | | (32,525,070 | ) | | | (41.83 | )% |
TOTAL NET ASSETS – 100.00% | | | | | | $ | 77,752,900 | | | | 100.00 | % |
Percentages are stated as a percent of net assets.
| (a) | The rate listed is the fund’s 7-day yield as of October 31, 2017. |
| (b) | The rate listed is discount rate at issue. |
| (c) | Collateral or partial collateral for securities sold subject to repurchase. |
The accompanying notes are an integral part of these financial statements.
Summary of Fair Value Exposure at October 31, 2017
The following is a summary of the inputs used to value the Fund’s net assets as of October 31, 2017 (See Note 3 in the accompanying notes to the financial statements):
| Common Stocks | | Level 1 | | | Level 2 | | | Level 3 | | | Total | |
| Consumer Discretionary | | $ | 968,078 | | | $ | — | | | $ | — | | | $ | 968,078 | |
| Consumer Staples | | | 10,211,532 | | | | — | | | | — | | | | 10,211,532 | |
| Energy | | | 10,400,847 | | | | — | | | | — | | | | 10,400,847 | |
| Health Care | | | 6,692,343 | | | | — | | | | — | | | | 6,692,343 | |
| Industrials | | | 6,885,088 | | | | — | | | | — | | | | 6,885,088 | |
| Information Technology | | | 13,148,558 | | | | — | | | | — | | | | 13,148,558 | |
| Telecommunication Services | | | 5,074,220 | | | | — | | | | — | | | | 5,074,220 | |
| Total Common Stocks | | $ | 53,380,666 | | | $ | — | | | $ | — | | | $ | 53,380,666 | |
| Short-Term Investments | | | | | | | | | | | | | | | | |
| Money Market Funds | | $ | 2,971,734 | | | $ | — | | | $ | — | | | $ | 2,971,734 | |
| U.S. Treasury Bills | | | — | | | | 53,925,570 | | | | — | | | | 53,925,570 | |
| Total Short-Term Investments | | $ | 2,971,734 | | | $ | 53,925,570 | | | $ | — | | | $ | 56,897,304 | |
| Total Investments | | $ | 56,352,400 | | | $ | 53,925,570 | | | $ | — | | | $ | 110,277,970 | |
Transfers between levels are recognized at the end of the reporting period. During the year ended October 31, 2017, the Fund recognized no transfers between levels.
Schedule of Reverse Repurchase Agreements
| | | | | | Principal | Maturity | | Maturity | |
| | Face Value | | Counterparty | Rate | Trade Date | Date | | Amount | |
| | $ | 10,794,000 | | Jefferies LLC | 1.250% | 8/18/17 | 11/16/17 | | $ | 10,827,731 | |
| | | 10,794,000 | | Jefferies LLC | 1.250% | 9/22/17 | 12/21/17 | | | 10,827,731 | |
| | | 10,794,000 | | Jefferies LLC | 1.350% | 10/20/17 | 1/18/18 | | | 10,830,430 | |
| | $ | 32,382,000 | | | | | | | $ | 32,485,892 | |
As of October 31, 2017, the fair value of securities held as collateral for reverse repurchase agreements was $35,950,380 as noted on the Schedule of Investments.
Reverse repurchase agreements are carried at face value; hence, they are not included in the fair valuation hierarchy. The face value of the reverse repurchase agreements at October 31, 2017, was $32,382,000. Due to the short-term nature of the reverse repurchase agreements, face value approximates fair value. The face value plus interest due at maturity is equal to $32,485,892.
The accompanying notes are an integral part of these financial statements.
| HENNESSY FUNDS | 1-800-966-4354 | |
Financial Statements
Statement of Assets and Liabilities as of October 31, 2017 |
| ASSETS: | | | |
| Investments in securities, at value (cost $105,533,136) | | $ | 110,277,970 | |
| Dividends and interest receivable | | | 119,094 | |
| Receivable for fund shares sold | | | 5,730 | |
| Prepaid expenses and other assets | | | 12,975 | |
| Total Assets | | | 110,415,769 | |
| | | | | |
| LIABILITIES: | | | | |
| Payable for fund shares redeemed | | | 79,181 | |
| Payable to advisor | | | 40,232 | |
| Payable to administrator | | | 13,129 | |
| Payable to auditor | | | 21,305 | |
| Accrued distribution fees | | | 62,536 | |
| Accrued service fees | | | 6,705 | |
| Reverse repurchase agreements | | | 32,382,000 | |
| Accrued interest payable | | | 38,862 | |
| Accrued trustees fees | | | 5,572 | |
| Accrued expenses and other payables | | | 13,347 | |
| Total Liabilities | | | 32,662,869 | |
| NET ASSETS | | $ | 77,752,900 | |
| | | | | |
| NET ASSETS CONSIST OF: | | | | |
| Capital stock | | $ | 65,079,509 | |
| Accumulated net investment income | | | 112,796 | |
| Accumulated net realized gain on investments | | | 7,815,761 | |
| Unrealized net appreciation on investments | | | 4,744,834 | |
| Total Net Assets | | $ | 77,752,900 | |
| | | | | |
| NET ASSETS | | | | |
| Investor Class: | | | | |
| Shares authorized (no par value) | | Unlimited | |
| Net assets applicable to outstanding Investor Class shares | | $ | 77,752,900 | |
| Shares issued and outstanding | | | 5,304,372 | |
| Net asset value, offering price and redemption price per share | | $ | 14.66 | |
The accompanying notes are an integral part of these financial statements.
| STATEMENT OF ASSETS AND LIABILITIES/STATEMENT OF OPERATIONS |
Financial Statements
Statement of Operations for the year ended October 31, 2017 |
| INVESTMENT INCOME: | | | |
| Dividend income | | $ | 2,123,733 | |
| Interest income | | | 411,344 | |
| Total investment income | | | 2,535,077 | |
| | | | | |
| EXPENSES: | | | | |
| Investment advisory fees (See Note 5) | | | 516,270 | |
| Interest expense (See Notes 7 and 9) | | | 356,629 | |
| Distribution fees – Investor Class (See Note 5) | | | 129,067 | |
| Service fees – Investor Class (See Note 5) | | | 86,045 | |
| Sub-transfer agent expenses – Investor Class (See Note 5) | | | 84,544 | |
| Administration, fund accounting, custody and transfer agent fees (See Note 5) | | | 82,221 | |
| Compliance expense (See Note 5) | | | 28,705 | |
| Audit fees | | | 21,300 | |
| Trustees’ fees and expenses | | | 16,348 | |
| Reports to shareholders | | | 13,717 | |
| Federal and state registration fees | | | 5,119 | |
| Other expenses | | | 7,763 | |
| Total expenses | | | 1,347,728 | |
| NET INVESTMENT INCOME | | $ | 1,187,349 | |
| | | | | |
| REALIZED AND UNREALIZED GAINS: | | | | |
| Net realized gain on investments | | $ | 8,689,833 | |
| Net change in unrealized appreciation on investments | | | 49,360 | |
| Net gain on investments | | | 8,739,193 | |
| NET INCREASE IN NET ASSETS RESULTING FROM OPERATIONS | | $ | 9,926,542 | |
The accompanying notes are an integral part of these financial statements.
| HENNESSY FUNDS | 1-800-966-4354 | |
Financial Satements
| Statements of Changes in Net Assets |
| | | Year Ended | | | Year Ended | |
| | | October 31, 2017 | | | October 31, 2016 | |
| OPERATIONS: | | | | | | |
| Net investment income | | $ | 1,187,349 | | | $ | 917,219 | |
| Net realized gain on investments | | | 8,689,833 | | | | 4,429,880 | |
| Net change in unrealized appreciation | | | | | | | | |
| (depreciation) on investments | | | 49,360 | | | | (36,877 | ) |
| Net increase in net assets resulting from operations | | | 9,926,542 | | | | 5,310,222 | |
| | | | | | | | | |
| DISTRIBUTIONS TO SHAREHOLDERS FROM: | | | | | | | | |
| Net investment income – Investor Class | | | (1,171,215 | ) | | | (921,292 | ) |
| Net realized gains – Investor Class | | | (4,428,807 | ) | | | (5,932,910 | ) |
| Total distributions | | | (5,600,022 | ) | | | (6,854,202 | ) |
| | | | | | | | | |
| CAPITAL SHARE TRANSACTIONS: | | | | | | | | |
| Proceeds from shares subscribed – Investor Class | | | 17,437,144 | | | | 25,999,315 | |
| Dividends reinvested – Investor Class | | | 5,335,208 | | | | 6,430,792 | |
| Cost of shares redeemed – Investor Class | | | (33,215,945 | ) | | | (16,432,231 | ) |
| Net increase (decrease) in net assets derived | | | | | | | | |
| from capital share transactions | | | (10,443,593 | ) | | | 15,997,876 | |
| TOTAL INCREASE (DECREASE) IN NET ASSETS | | | (6,117,073 | ) | | | 14,453,896 | |
| | | | | | | | | |
| NET ASSETS: | | | | | | | | |
| Beginning of year | | | 83,869,973 | | | | 69,416,077 | |
| End of year | | $ | 77,752,900 | | | $ | 83,869,973 | |
| Undistributed net investment income, end of year | | $ | 112,796 | | | $ | 96,662 | |
| | | | | | | | | |
| CHANGES IN SHARES OUTSTANDING: | | | | | | | | |
| Shares sold – Investor Class | | | 1,237,906 | | | | 1,870,317 | |
| Shares issued to holders as reinvestment | | | | | | | | |
| of dividends – Investor Class | | | 387,386 | | | | 498,039 | |
| Shares redeemed – Investor Class | | | (2,382,169 | ) | | | (1,198,857 | ) |
| Net increase (decrease) in shares outstanding | | | (756,877 | ) | | | 1,169,499 | |
The accompanying notes are an integral part of these financial statements.
| STATEMENTS OF CHANGES IN NET ASSETS/STATEMENT OF CASH FLOWS |
Financial Statements
Statement of Cash Flows for the year ended October 31, 2017 |
| Cash flows from operating activities: | | | |
| Net increase in net assets from operations | | $ | 9,926,542 | |
| Adjustments to reconcile net increase in net assets from | | | | |
| operations to net cash provided by operating activities: | | | | |
| Payments to purchase securities | | | (21,415,781 | ) |
| Proceeds from sale of securities | | | 33,423,878 | |
| Sale of short-term investments, net | | | 4,225,309 | |
| Proceeds from securities litigation | | | 7,589 | |
| Realized gain on investments in securities | | | (8,689,833 | ) |
| Net accretion of discount on securities | | | (392,563 | ) |
| Change in unrealized appreciation on investments in securities | | | (49,360 | ) |
| (Increases) decreases in operating assets: | | | | |
| Decrease in dividends and interest receivable | | | 37,753 | |
| Decrease in receivable for securities sold | | | 2,553,727 | |
| Increase in prepaid expenses and other assets | | | (2,748 | ) |
| Increases (decreases) in operating liabilities: | | | | |
| Decrease in payable to advisor | | | (4,840 | ) |
| Decrease in payable to administrator | | | (1,887 | ) |
| Decrease in accrued distribution fees | | | (2,150 | ) |
| Decrease in accrued service fees | | | (807 | ) |
| Increase in accrued interest payable | | | 8,325 | |
| Decrease in accrued audit fees | | | (1,076 | ) |
| Increase in accrued trustee fees | | | 1,674 | |
| Decrease in other accrued expenses and payables | | | (24,758 | ) |
| Net cash used in operating activities | | | 19,598,994 | |
| | | | | |
| Cash flows from financing activities: | | | | |
| Increase in reverse repurchase agreements | | | (3,598,000 | ) |
| Proceeds from shares sold | | | 17,482,923 | |
| Payment on shares redeemed | | | (33,219,103 | ) |
| Distributions paid in cash, net of reinvestments | | | (264,814 | ) |
| Net cash provided by financing activities | | | (19,598,994 | ) |
| Net increase in cash | | | — | |
| | | | | |
| Cash: | | | | |
| Beginning balance | | | — | |
| Ending balance | | $ | — | |
| | | | | |
| Supplemental information: | | | | |
| Non-cash financing activities not included herein consists | | | | |
| of dividend reinvestment of dividends and distributions | | $ | 5,335,208 | |
| | | | | |
| Cash paid for interest | | $ | 348,304 | |
The accompanying notes are an integral part of these financial statements.
| HENNESSY FUNDS | 1-800-966-4354 | |
Financial Statements
For an Investor Class share outstanding throughout each year
PER SHARE DATA:
Net asset value, beginning of year
Income from investment operations:
Net investment income
Net realized and unrealized gains (losses) on investments
Total from investment operations
Less distributions:
Dividends from net investment income
Dividends from net realized gains
Total distributions
Net asset value, end of year
TOTAL RETURN
SUPPLEMENTAL DATA AND RATIOS:
Net assets, end of year (millions)
Gross ratio of expenses, including interest expense, to average net assets
Ratio of net investment income to average net assets
Portfolio turnover rate
The accompanying notes are an integral part of these financial statements.
| FINANCIAL HIGHLIGHTS — INVESTOR CLASS |
| Year Ended October 31, | | |
| 2017 | | | 2016 | | | 2015 | | | 2014 | | | 2013 | | |
| | | | | | | | | | | | | | | |
| $ | 13.84 | | | $ | 14.19 | | | $ | 15.27 | | | $ | 14.30 | | | $ | 12.64 | | |
| | | | | | | | | | | | | | | | | | | | |
| | | | | | | | | | | | | | | | | | | | |
| | 0.20 | | | | 0.16 | | | | 0.20 | | | | 0.20 | | | | 0.16 | | |
| | 1.48 | | | | 0.88 | | | | (0.02 | ) | | | 0.96 | | | | 1.66 | | |
| | 1.68 | | | | 1.04 | | | | 0.18 | | | | 1.16 | | | | 1.82 | | |
| | | | | | | | | | | | | | | | | | | | |
| | | | | | | | | | | | | | | | | | | | |
| | (0.20 | ) | | | (0.16 | ) | | | (0.20 | ) | | | (0.19 | ) | | | (0.16 | ) | |
| | (0.66 | ) | | | (1.23 | ) | | | (1.06 | ) | | | — | | | | — | | |
| | (0.86 | ) | | | (1.39 | ) | | | (1.26 | ) | | | (0.19 | ) | | | (0.16 | ) | |
| $ | 14.66 | | | $ | 13.84 | | | $ | 14.19 | | | $ | 15.27 | | | $ | 14.30 | | |
| | | | | | | | | | | | | | | | | | | | |
| | 12.56 | % | | | 8.20 | % | | | 1.22 | % | | | 8.15 | % | | | 14.49 | % | |
| | | | | | | | | | | | | | | | | | | | |
| | | | | | | | | | | | | | | | | | | | |
| $ | 77.75 | | | $ | 83.87 | | | $ | 69.42 | | | $ | 83.89 | | | $ | 90.24 | | |
| | 1.57 | % | | | 1.44 | % | | | 1.28 | % | | | 1.34 | % | | | 1.37 | % | |
| | 1.38 | % | | | 1.22 | % | | | 1.40 | % | | | 1.31 | % | | | 1.16 | % | |
| | 36 | % | | | 44 | % | | | 27 | % | | | 23 | % | | | 31 | % | |
The accompanying notes are an integral part of these financial statements.
| HENNESSY FUNDS | 1-800-966-4354 | |
Financial Statements
Notes to the Financial Statements October 31, 2017 |
1). ORGANIZATION
The Hennessy Total Return Fund (the “Fund”) is a series of Hennessy Funds Trust (the “Trust”), which was organized as a Delaware statutory trust on September 17, 1992. The Fund is an open-end management investment company registered under the Investment Company Act of 1940, as amended. The investment objective of the Fund is total return, consisting of capital appreciation and current income. The Fund is a non-diversified fund and offers Investor Class shares.
As an investment company, the Fund follows the investment company accounting and reporting guidance of the Financial Accounting Standards Board (“FASB”) Accounting Standard Codification Topic 946 “Financial Services—Investment Companies.”
2). SIGNIFICANT ACCOUNTING POLICIES
The following is a summary of significant accounting policies consistently followed by the Fund in the preparation of the financial statements. These policies conform to U.S. generally accepted accounting principles (“GAAP”).
| a). | Investment Valuation – All investments in securities are recorded at their estimated fair value, as described in Note 3. |
| b). | Federal Income Taxes – No provision for federal income taxes or excise taxes has been made because the Fund has elected to be taxed as a “regulated investment company” and intends to distribute substantially all of its taxable income to its shareholders and otherwise comply with the provisions of the Internal Revenue Code of 1986, as amended, applicable to regulated investment companies. Net investment income/loss and realized gains/losses for federal income tax purposes may differ from those reported in the financial statements because of temporary book and tax basis differences. Temporary differences are primarily the result of the treatment of wash sales for tax reporting purposes. The Fund recognizes interest and penalties related to income tax benefits, if any, in the Statement of Operations as an income tax expense. Distributions from net realized gains for book purposes may include short-term capital gains, which are included as ordinary income to shareholders for tax purposes. The Fund may utilize equalization accounting for tax purposes and designate earnings and profits, including net realized gains distributed to shareholders on redemption of shares, as part of the dividends paid deduction for income tax purposes. |
| | Due to inherent differences in the recognition of income, expenses, and realized gains/losses under GAAP and federal income tax regulations, permanent differences between book and tax basis for reporting for fiscal year 2017 have been identified and appropriately reclassified in the Statement of Assets and Liabilities. The adjustments are as follows: |
| | Accumulated | Accumulated | | |
| | Net Investment | Net Realized | | |
| | Income | Gain on Investments | Capital Stock | |
| | $ — | $(771,317) | $771,317 | |
| c). | Accounting for Uncertainty in Income Taxes – The Fund has accounting policies regarding recognition and measurement of tax positions taken or expected to be taken on a tax return. The tax returns of the Fund for the prior three fiscal years are |
| NOTES TO THE FINANCIAL STATEMENTS |
| | open for examination. The Fund has reviewed all open tax years in major jurisdictions and concluded that there is no impact on the Fund’s net assets and no tax liability resulting from unrecognized tax benefits relating to uncertain income tax positions taken or expected to be taken on a tax return. The Fund’s major tax jurisdictions are U.S. federal and Delaware. |
| d). | Income and Expenses – Dividend income is recognized on the ex-dividend date or as soon as information is available to the Fund. Interest income, which includes the amortization of premium and accretion of discount, is recognized on an accrual basis. The Fund is charged for those expenses that are directly attributable to the portfolio, such as advisory, administration, and certain shareholder service fees. |
| e). | Distributions to Shareholders – Dividends from net investment income for the Fund, if any, are declared and paid at the end of each calendar quarter. Distributions of net realized capital gains, if any, are declared and paid annually, usually in December. |
| f). | Security Transactions – Investment and shareholder transactions are recorded on the trade date. The Fund determines the realized gain/loss from an investment transaction by comparing the original cost of the security lot sold with the net sale proceeds. Discounts and premiums on securities purchased are accreted/amortized over the life of the respective security. |
| g). | Use of Estimates – The preparation of financial statements in conformity with GAAP requires management to make estimates and assumptions that affect the reported amounts of assets and liabilities and disclosure of contingent assets and liabilities at the date of the financial statements and the reported change in net assets during the reporting period. Actual results could differ from those estimates. |
| h). | Share Valuation – The net asset value (“NAV”) per share of the Fund is calculated by dividing (i) the sum of the value of the securities held by the Fund, plus cash or other assets, minus all liabilities (including estimated accrued expenses) by (ii) the total number of shares outstanding for the Fund, rounded to the nearest cent. The Fund’s shares will not be priced on days the New York Stock Exchange is closed for trading. The offering and redemption price per share for the Fund is equal to the Fund’s NAV per share. |
| i). | Derivatives – The Fund may invest in, or enter into, derivatives, such as options, futures contracts, options on futures contracts, and swaps, for a variety of reasons, including to hedge certain risks, provide a substitute for purchasing or selling particular securities, or increase potential income gain. Derivatives are financial contracts based on an underlying or notional amount, require no initial investment or an initial net investment that is smaller than would normally be required to have a similar response to changes in market factors, and require or permit net settlement. Derivatives may allow the Fund to increase or decrease the level of risk to which the Fund is exposed more quickly and efficiently than transactions in other types of instruments. The main reason for utilizing derivative instruments is for hedging purposes. |
| | The Fund follows the financial accounting reporting rules as required by the Derivatives and Hedging Topic of the FASB Accounting Standards Codification. Under such rules, the Fund is required to include enhanced disclosure that enables investors to understand how and why an entity uses derivatives, how derivatives are accounted for, and how derivatives instruments affect an entity’s results of operations and financial position. During fiscal year 2017, the Fund did not hold any derivative instruments. |
| j). | Repurchase and Reverse Repurchase Agreements – The Fund may enter into repurchase agreements and reverse repurchase agreements with member banks or security dealers of the Federal Reserve Board whom the investment advisor deems |
| HENNESSY FUNDS | 1-800-966-4354 | |
| | creditworthy. Transactions involving repurchase agreements and reverse repurchase agreements are treated as collateralized financing transactions and are recorded at their contracted resell or repurchase amounts, which approximates fair value. Interest on repurchase agreements and reverse repurchase agreements is included in interest receivable and interest payable, respectively. |
| | In connection with repurchase agreements, securities pledged as collateral are held by the custodian bank until the respective agreements mature. Provisions of the repurchase agreements ensure that the market value of the collateral, including accrued interest thereon, is sufficient to cover the repurchase amount in the event of default of the counterparty. If the counterparty defaults and the fair value of the collateral declines, or if the counterparty enters an insolvency proceeding, realization of the collateral by the Fund may be delayed or limited. |
| | At October 31, 2017, securities with a fair value of $35,950,380, which are included in investments in securities in the Statement of Assets and Liabilities, were pledged to collateralize reverse repurchase agreements. |
| k). | Offsetting Assets and Liabilities – The Fund follows the financial reporting rules regarding offsetting assets and liabilities and related netting arrangements to enable users of its financial statements to understand the effect of those arrangements on its financial position. Reverse repurchase transactions are entered into by the Fund under Master Repurchase Agreements (“MRAs”) that permit the Fund, under certain circumstances, including an event of default (such as bankruptcy or insolvency), to offset payables under the MRA with collateral held with the counterparty and create one single net payment from the Fund. Upon a bankruptcy or insolvency of the MRA counterparty, the Fund is considered an unsecured creditor with respect to excess collateral and, as such, the return of excess collateral may be delayed. In the event the buyer of securities under an MRA files for bankruptcy or becomes insolvent, the Fund’s use of the proceeds of the MRA may be restricted while the other party, or its trustee or receiver, determines whether or not to enforce the Fund’s obligation to repurchase the securities. For additional information regarding the offsetting of assets and liabilities at October 31, 2017, please refer to the table in Note 9. |
3). SECURITIES VALUATION
The Fund follows authoritative fair valuation accounting standards that establish an authoritative definition of fair value and set out a hierarchy for measuring fair value. These standards require additional disclosures about the various inputs and valuation techniques used to develop the measurements of fair value and a discussion of changes in valuation techniques and related inputs during the period. These inputs are summarized in the three broad levels listed below:
| | Level 1 – | Unadjusted, quoted prices in active markets for identical instruments that the Fund has the ability to access at the date of measurement. |
| | | |
| | Level 2 – | Other significant observable inputs (including, but not limited to, quoted prices in active markets for similar instruments, quoted prices in markets that are not active for identical or similar instruments, and model-derived valuations in which all significant inputs and significant value drivers are observable in active markets, such as interest rates, prepayment speeds, credit risk curves, default rates, and similar data). |
| | | |
| | Level 3 – | Significant unobservable inputs (including the Fund’s own assumptions about what market participants would use to price the asset or liability based on the best available information) when observable inputs are unavailable. |
| NOTES TO THE FINANCIAL STATEMENTS |
Following is a description of the valuation techniques applied to the Fund’s major categories of assets and liabilities measured at fair value on a recurring basis.
| | Equity Securities – Equity securities, including common stocks, preferred stocks, exchange-traded funds, closed-end mutual funds, partnerships, rights, and real estate investment trusts, that are traded on a securities exchange for which a last-quoted sales price is readily available will generally be valued at the last sales price as reported by the primary exchange on which the securities are listed. Securities listed on The NASDAQ Stock Market (“NASDAQ”) will generally be valued at the NASDAQ Official Closing Price, which may differ from the last sales price reported. Securities traded on a securities exchange for which a last-quoted sales price is not readily available will generally be valued at the mean between the bid and ask prices. To the extent these securities are actively traded and valuation adjustments are not applied, they are classified in Level 1 of the fair value hierarchy. |
| | Registered Investment Companies – Investments in registered investment companies (e.g., mutual funds) are generally priced at the ending NAV provided by the applicable registered investment company’s service agent and will be classified in Level 1 of the fair value hierarchy. |
| | Debt Securities – Debt securities, including corporate bonds, asset-backed securities, mortgage-backed securities, municipal bonds, U.S. Treasuries, and U.S. government agency issues, are generally valued at market on the basis of valuations furnished by an independent pricing service that utilizes both dealer-supplied valuations and formula-based techniques. The pricing service may consider recently executed transactions in securities of the issuer or comparable issuers, market price quotations (where observable), bond spreads, and fundamental data relating to the issuer. In addition, the model may incorporate observable market data, such as reported sales of similar securities, broker quotes, yields, bids, offers, and reference data. Certain securities are valued primarily using dealer quotations. These securities are generally classified in Level 2 of the fair value hierarchy. |
| | Short-Term Securities – Short-term equity investments, including money market funds, are valued in the manner specified above. Short-term debt investments with an original term to maturity of 60 days or less are valued at amortized cost, which approximates fair market value. If the original term to maturity of a short-term debt investment exceeded 60 days, then the values as of the 61st day prior to maturity are amortized. Amortized cost is not used if its use would be inappropriate due to credit or other impairments of the issuer, in which case the security’s fair value would be determined, as described below. Short-term securities are generally classified in Level 1 or Level 2 of the fair market hierarchy depending on the inputs used and market activity levels for specific securities. |
The Board of Trustees of the Fund (the “Board”) has adopted fair value pricing procedures that are followed when a price for a security is not readily available or if a significant event has occurred that indicates the closing price of a security no longer represents the true value of that security. Fair value pricing determinations are made in good faith in accordance with these procedures. There are numerous criteria that will be given consideration in determining a fair value of a security, such as the trading volume of a security and markets, the values of other similar securities, and news events with direct bearing on a security or markets. Fair value pricing results in an estimated price for a security that reflects the amount the Fund might reasonably expect to receive in a current sale. Depending on the relative significance of the valuation inputs, these securities may be classified in either Level 2 or Level 3 of the fair value hierarchy.
| HENNESSY FUNDS | 1-800-966-4354 | |
The Board has delegated day-to-day valuation matters to a Valuation Committee comprised of one or more representatives from Hennessy Advisors, Inc., the Fund’s investment advisor (the “Advisor”). The function of the Valuation Committee is to value securities where current and reliable market quotations are not readily available. All actions taken by the Valuation Committee are reviewed by the Board.
The Fund has performed an analysis of all existing investments to determine the significance and character of all inputs to their fair value determination. Various inputs are used to determine the value of the Fund’s investments. The inputs or methodology used for valuing securities are not necessarily an indication of the risk associated with investing in those securities. Details related to the fair valuation hierarchy of the Fund’s securities as of October 31, 2017, are included in the Schedule of Investments.
4). INVESTMENT TRANSACTIONS
Purchases and sales of investment securities (excluding government and short-term investments) for the Fund during fiscal year 2017 were $21,415,781 and $33,423,878, respectively.
There were no purchases or sales/maturities of long-term U.S. government securities for the Fund during fiscal year 2017.
The Fund is permitted to purchase or sell securities from or to another fund in the Hennessy Funds family of funds (the “Hennessy Funds”) under specified conditions outlined in procedures adopted by the Board. The procedures have been designed to ensure that any purchase or sale of securities by the Fund from or to another Hennessy Fund complies with Rule 17a-7 of the Investment Company Act of 1940, as amended. For fiscal year 2017, the Fund did not engage in purchases or sales of securities pursuant to Rule 17a-7 of the Investment Company Act of 1940, as amended.
5). INVESTMENT MANAGEMENT FEE AND OTHER TRANSACTIONS WITH AFFILIATES
The Advisor provides the Fund with investment management services under an Investment Advisory Agreement. The Advisor provides all investment advice, office space, and facilities, as well as most of the personnel needed by the Fund. As compensation for its services, the Advisor is entitled to a monthly fee from the Fund. The fee is based upon the average daily net assets of the Fund at an annual rate of 0.60%. The net investment advisory fees expensed by the Fund during fiscal year 2017 are included in the Statement of Operations.
The Board has approved a Shareholder Servicing Agreement for the Fund, which was instituted to compensate the Advisor for the non-investment management services it provides to the Fund. The Shareholder Servicing Agreement provides for a monthly fee paid to the Advisor at an annual rate of 0.10% of the average daily net assets of the Fund. The shareholder service fees expensed by the Fund during fiscal year 2017 are included in the Statement of Operations.
The Fund has adopted a plan pursuant to Rule 12b-1 under the Investment Company Act of 1940, as amended, that authorizes payments in connection with the distribution of the Fund’s shares at an annual rate of up to 0.25% of the Fund’s average daily net assets. Even though the authorized rate is up to 0.25%, the Fund is currently only using up to 0.15% of its average daily net assets for such purpose. Amounts paid under the plan may be spent on any activities or expenses primarily intended to result in the sale of shares, including, but not limited to, advertising, shareholder account servicing, the printing and mailing of prospectuses to other than current shareholders, the printing and mailing of sales literature, and compensation for sales and marketing activities or to financial institutions and others, such as dealers and distributors. The
| NOTES TO THE FINANCIAL STATEMENTS |
distribution fees expensed by the Fund during fiscal year 2017 are included in the Statement of Operations.
The Fund has entered into agreements with various brokers, dealers, and financial intermediaries in connection with the sale of shares of the Fund. The agreements provide for periodic payments by the Fund to the brokers, dealers, and financial intermediaries for providing certain shareholder maintenance services (sub-transfer agent expenses). These shareholder services include the pre-processing and quality control of new accounts, shareholder correspondence, answering customer inquiries regarding account status, and facilitating shareholder telephone transactions. The sub-transfer agent fees expensed by the Fund during fiscal year 2017 are included in the Statement of Operations.
U.S. Bancorp Fund Services, LLC (“USBFS”) provides the Fund with administrative, fund accounting, and transfer agent services and necessary office equipment. As administrator, USBFS is responsible for activities such as (i) preparing various federal and state regulatory filings, reports, and returns for the Fund, (ii) preparing reports and materials to be supplied to the Board, (iii) monitoring the activities of the Fund’s custodian, transfer agent, and accountants, and (iv) coordinating the preparation and payment of the Fund’s expenses and reviewing the Fund’s expense accruals. U.S. Bank, N.A., an affiliate of USBFS, serves as the Fund’s custodian. The servicing agreements between the Trust, USBFS, and U.S. Bank N.A. contain a fee schedule that is inclusive of administrative, fund accounting, custody, and transfer agent fees. The administrative, fund accounting, custody, and transfer agent fees expensed by the Fund during fiscal year 2017 are included in the Statement of Operations.
Quasar Distributors, LLC acts as the Fund’s principal underwriter in a continuous public offering of the Fund’s shares. Quasar Distributors, LLC is an affiliate of USBFS and U.S. Bank, N.A.
The officers of the Fund are affiliated with the Advisor. Such officers, with the exception of the Chief Compliance Officer and the Senior Compliance Officer, receive no compensation from the Fund for serving in their respective roles. The Fund, along with the other Hennessy Funds, makes reimbursement payments, on an equal basis, to the Advisor for a portion of the salary and benefits associated with the office of the Chief Compliance Officer and for all of the salary and benefits associated with the office of the Senior Compliance Officer. The compliance fees expensed by the Fund during fiscal year 2017 are included in the Statement of Operations.
6). GUARANTEES AND INDEMNIFICATIONS
Under the Hennessy Funds’ organizational documents, their officers and trustees are indemnified by the Hennessy Funds against certain liabilities arising out of the performance of their duties to the Hennessy Funds. Additionally, in the normal course of business, the Hennessy Funds enter into contracts with service providers that contain general indemnification clauses. The Fund’s maximum exposure under these arrangements is unknown as this would involve future claims that may be made against the Fund that have not yet occurred. Currently, the Fund expects the risk of loss to be remote.
7). LINE OF CREDIT
The Fund has an uncommitted line of credit with the other Hennessy Funds in the amount of the lesser of (i) $100,000,000 or (ii) 33.33% of each Hennessy Fund’s net assets, or 30% for the Hennessy Gas Utility Fund and 10% for the Hennessy Balanced Fund, intended to provide short-term financing, if necessary, subject to certain restrictions, in connection with shareholder redemptions. The credit facility is with the Hennessy Funds’ custodian bank, U.S. Bank, N.A. Borrowings under this arrangement bear interest at the bank’s prime
| HENNESSY FUNDS | 1-800-966-4354 | |
rate and are secured by all of the Fund’s assets (as to its own borrowings only). During fiscal year 2017, the Fund had an outstanding average daily balance and a weighted average interest rate of $90,414 and 3.97%, respectively. The interest expensed by the Fund under the line of credit during fiscal year 2017 was $3,480, and is included as a component of interest expense in the Statement of Operations. The maximum amount outstanding for the Fund during the period was $4,373,000. At October 31, 2017, the Fund did not have any borrowings outstanding under the line of credit.
8). FEDERAL TAX INFORMATION
As of October 31, 2017, the components of accumulated earnings (losses) for income tax purposes were as follows:
| | | Investments | |
| Cost of investments for tax purposes | | $ | 105,665,206 | |
| Gross tax unrealized appreciation | | $ | 6,050,237 | |
| Gross tax unrealized depreciation | | | (1,437,473 | ) |
| Net tax unrealized appreciation | | $ | 4,612,764 | |
| Undistributed ordinary income | | $ | 805,355 | |
| Undistributed long-term capital gains | | | 7,255,272 | |
| Total distributable earnings | | $ | 8,060,627 | |
| Other accumulated gain | | $ | — | |
| Total accumulated gain | | $ | 12,673,391 | |
The difference between book-basis unrealized appreciation/depreciation (as shown in the Statement of Assets and Liabilities) and tax-basis unrealized appreciation/depreciation (as shown above) is attributable primarily to wash sales.
At October 31, 2017, the Fund had no tax basis capital losses to offset future capital gains.
At October 31, 2017, the Fund did not defer, on a tax basis, any late-year ordinary losses. Late-year ordinary losses are net ordinary losses incurred after December 31, 2016, but within the taxable year, that are deemed to arise on the first day of the Fund’s next taxable year.
During fiscal years 2017 and 2016, the tax character of distributions paid by the Fund was as follows:
| | | Year Ended | | | Year Ended | |
| | | October 31, 2017 | | | October 31, 2016 | |
Ordinary income(1) | | $ | 1,216,622 | | | $ | 1,010,164 | |
| Long-term capital gain | | | 4,383,400 | | | | 5,844,038 | |
| | | $ | 5,600,022 | | | $ | 6,854,202 | |
(1) Ordinary income includes short-term gain/loss.
9). REVERSE REPURCHASE AGREEMENTS
The Fund may enter into reverse repurchase agreements with the same parties with whom it may enter into repurchase agreements. Under a reverse repurchase agreement, the Fund sells securities and agrees to repurchase them at a mutually agreed-upon date and price. Reverse repurchase agreements are regarded as a form of secured borrowing by the Fund. Securities sold under reverse repurchase agreements are reflected as a liability in the Statement of Assets and Liabilities. Interest payments made under reverse repurchase agreements were $353,159, and are recorded as a component of interest expense in the Statement of Operations.
| NOTES TO THE FINANCIAL STATEMENTS |
For fiscal year 2017, the average daily balance and average interest rate in effect for reverse repurchase agreements were $35,181,540 and 1.003%, respectively. Below is information about the scheduled maturity date, amount, and interest rate for outstanding reverse repurchase agreements as of October 31, 2017:
| | Maturity Date | Amount | Interest Rate | |
| | November 16, 2017 | $10,794,000 | 1.25% | |
| | December 21, 2017 | $10,794,000 | 1.25% | |
| | January 18, 2018 | $10,794,000 | 1.35% | |
Outstanding reverse repurchase agreements at October 31, 2017, were equal to 41.65% of the Fund’s net assets.
Below is information about instruments and transactions eligible for offset in the Statement of Assets and Liabilities, on both a gross and net basis, as well as instruments and transactions subject to an agreement similar to a master netting arrangement:
| | | Gross | Net | | | |
| | | Amounts | Amounts | | | |
| | | Offset | Presented | Gross Amounts Not | |
| | | in the | in the | Offset in the Statement | |
| | Gross | Statement | Statement | of Assets and Liabilities | |
| | Amounts of | of | of | | Collateral | |
| | Recognized | Assets and | Assets and | Financial | Pledged | Net |
Description | Liabilities | Liabilities | Liabilities | Instruments | (Received) | Amount |
| Reverse | | | | | | |
| Repurchase | | | | | | |
| Agreements | $32,382,000 | $ — | $32,382,000 | $32,382,000 | $ — | $ — |
| | $32,382,000 | $ — | $32,382,000 | $32,382,000 | $ — | $ — |
For additional information, please refer to the “Offsetting Assets and Liabilities” section in Note 2.
10). CHANGE IN AUDITOR DISCLOSURE
On September 11, 2017, the Trust, by action of the Audit Committee of the Board and on behalf of the Fund, the Hennessy Cornerstone Growth Fund, the Hennessy Cornerstone Mid Cap 30 Fund, the Hennessy Cornerstone Large Growth Fund, the Hennessy Cornerstone Value Fund, the Hennessy Balanced Fund, the Hennessy Japan Fund, and the Hennessy Japan Small Cap Fund (collectively, the “Applicable Funds”), dismissed KPMG LLP (“KPMG”) and engaged Tait, Weller & Baker LLP (“Tait Weller”) to serve as the independent registered public accounting firm to audit the financial statements of all series of the Trust for fiscal year 2017. Tait Weller previously served as the independent registered public accounting firm for the series of the Trust that are not one of the Applicable Funds.
KPMG’s reports on the financial statements for the Applicable Funds for each of fiscal years 2015 and 2016 contained no adverse opinion or disclaimer of opinion, nor were they qualified or modified as to uncertainty, audit scope, or accounting principles. During fiscal years 2015 and 2016 and the interim period of November 1, 2016, through September 11, 2017 (the “Interim Period”), there were no (i) disagreements with KPMG on any matter of accounting principles or practices, financial statement disclosure, or auditing scope or procedure, which disagreements, if not resolved to the satisfaction of KPMG, would have caused it to make reference to the subject matter of the disagreements in connection with its reports on the Applicable Fund’s financial statements for such years, nor (ii) “reportable events” of the kind described in Item 304(a)(1)(v) of Regulation S-K under the Securities Exchange Act of 1934, as amended.
| HENNESSY FUNDS | 1-800-966-4354 | |
During fiscal years 2015 and 2016 and the Interim Period, neither the Applicable Funds nor anyone on behalf of the Applicable Funds has consulted Tait Weller on items that concerned (a) the application of accounting principles to a specified transaction, either completed or proposed, or the type of audit opinion that might be rendered on an Applicable Fund’s financial statements, or (b) the subject of a disagreement (as defined in paragraph (a)(1)(iv) of Item 304 of Regulation S-K and related instructions) or reportable events (as described in paragraph (a)(1)(v) of Item 304 of Regulation S-K). The selection of Tait Weller does not reflect any disagreements or dissatisfaction by the Applicable Funds, the Board, or the Audit Committee with the performance of KPMG.
11). EVENTS SUBSEQUENT TO YEAR END
Management has evaluated the Fund’s related events and transactions that occurred subsequent to October 31, 2017, through the date of issuance of the Fund’s financial statements. Other than as disclosed below, management has determined that there were no subsequent events requiring recognition or disclosure in the financial statements.
On December 7, 2017, capital gains were declared and paid to shareholders of record on December 6, 2017, as follows:
| | Long-term | Short-term |
| Investor Class | $1.38773 | $0.13247 |
| NOTES/REPORT OF INDEPENDENT REGISTERED PUBLIC ACCOUNTING FIRM |
Report of Independent Registered Public
Accounting Firm
To the Board of Trustees of Hennessy Funds Trust
and the Shareholders of the Hennessy Total Return Fund
Novato, CA
We have audited the accompanying statement of assets and liabilities, including the schedule of investments, of the Hennessy Total Return Fund (the “Fund”), a series of Hennessy Funds Trust as of October 31, 2017, and the related statement of operations, the statement of changes in net assets, the statement of cash flows, and the financial highlights for the year then ended. The statement of changes in net assets for the year ended October 31, 2016 and the financial highlights for each of the four years in the period ended October 31, 2016 have been audited by other auditors, whose report dated December 22, 2016 expressed unqualified opinions on such financial statements and financial highlights. These financial statements and financial highlights are the responsibility of the Fund’s management. Our responsibility is to express an opinion on these financial statements and financial highlights based on our audit.
We conducted our audit in accordance with the standards of the Public Company Accounting Oversight Board (United States). Those standards require that we plan and perform the audit to obtain reasonable assurance about whether the financial statements and financial highlights are free of material misstatement. The Fund is not required to have, nor were we engaged to perform, an audit of the Fund’s internal control over financial reporting. Our audit included consideration of internal control over financial reporting as a basis for designing audit procedures that are appropriate in the circumstances, but not for the purposes of expressing an opinion on the effectiveness of the Fund’s internal control over financial reporting. Accordingly, we express no such opinion. An audit includes examining, on a test basis, evidence supporting the amounts and disclosures in the financial statements. Our procedures included confirmation of securities owned as of October 31, 2017, by correspondence with the custodian and broker. An audit also includes assessing the accounting principles used and significant estimates made by management, as well as evaluating the overall financial statement presentation. We believe that our audit provides a reasonable basis for our opinion.
In our opinion, the financial statements and financial highlights referred to above present fairly, in all material respects, the financial position of the Hennessy Total Return Fund as of October 31, 2017, the results of its operations and cash flows, the changes in its net assets, and the financial highlights for the year then ended, in conformity with accounting principles generally accepted in the United States of America.
TAIT, WELLER & BAKER LLP
Philadelphia, Pennsylvania
December 22, 2017
| HENNESSY FUNDS | 1-800-966-4354 | |
Trustees and Officers of the Fund (Unaudited)
The business and affairs of the Funds are managed under the direction of the Board of Trustees of the Trust, and the Board of Trustees elects the Officers of the Trust. Beginning in March 2015, the Board of Trustees has from time to time appointed advisers to the Board of Trustees (“Advisers”), with the intention of having qualified individuals serve in an advisory capacity in order to garner experience in the mutual fund and asset management industry and be considered as potential Trustees in the future. There are currently three Advisers to the Board of Trustees: Brian Alexander, Doug Franklin, and Claire Knoles. As Advisers, Mr. Alexander, Mr. Franklin, and Ms. Knoles attend meetings of the Board and act as non-voting participants. Information pertaining to the Trustees, Advisers, and the Officers of the Trust is set forth below. The Trustees and Officers serve until their successors are duly elected and qualified or until their earlier death, resignation, or removal. Each of the Trustees oversees 14 Hennessy Funds. Unless otherwise indicated, the address of all persons listed below is 7250 Redwood Boulevard, Suite 200, Novato, CA 94945. The Fund’s Statement of Additional Information includes more information about the persons listed below and is available, without charge, upon request by calling 1-800-966-4354.
| | | | Other |
| | | | Directorships |
| | | | Held Outside |
| Name, (Year of Birth), | | | of Fund |
| and Position Held | Start Date | Principal Occupation(s) | Complex During |
with the Trust | of Service | During Past Five Years | Past Five Years(1) |
| | | |
| Disinterested Trustees and Advisers | | |
| | | | |
| J. Dennis DeSousa | January 1996 | Mr. DeSousa is a real estate investor. | None. |
| (1936) | | | |
| Trustee | | | |
| | | | |
| Robert T. Doyle | January 1996 | Mr. Doyle has been the Sheriff of | None. |
| (1947) | | Marin County, California since 1996. | |
| Trustee | | | |
| | | | |
| Gerald P. Richardson | May 2004 | Mr. Richardson is an independent | None. |
| (1945) | | consultant in the securities industry. | |
| Trustee | | | |
| | | | |
| Brian Alexander | March 2015 | Mr. Alexander has been employed | None. |
| (1981) | | by Sutter Health Novato Community | |
| Adviser to the Board | | Hospital since 2012, first as an | |
| | | Assistant Administrator and then, | |
| | | beginning in 2013, as the Chief | |
| | | Administrative Officer. From 2011 | |
| | | through 2012, Mr. Alexander was | |
| | | employed by Sutter Health West Bay | |
| | | Region as the Regional Director of | |
| | | Strategic Decision Support. | |
| TRUSTEES AND OFFICERS OF THE FUND |
| | | | Other |
| | | | Directorships |
| | | | Held Outside |
| Name, (Year of Birth), | | | of Fund |
| and Position Held | Start Date | Principal Occupation(s) | Complex During |
with the Trust | of Service | During Past Five Years | Past Five Years(1) |
| | | | |
| Doug Franklin | March 2016 | Mr. Franklin is a retired insurance | None. |
| (1964) | | industry executive. From 1987 | |
| Adviser to the Board | | through 2015, he was employed | |
| | | by Allianz-Fireman’s Fund Insurance | |
| | | Company in various positions, | |
| | | including Chief Actuary and | |
| | | Chief Risk Officer. | |
| | | | |
| Claire Knoles | December 2015 | Ms. Knoles is a founder of Kiosk and | None. |
| (1974) | | has served as its Chief Operating | |
| Adviser to the Board | | Officer since 2004. Kiosk is a full | |
| | | service marketing agency with | |
| | | offices in the San Francisco Bay | |
| | | Area, Toronto, and Liverpool, UK. | |
| | | | |
Interested Trustee(2) | | | |
| | | | |
| Neil J. Hennessy | January 1996 as | Mr. Hennessy has been employed by | Hennessy |
| (1956) | a Trustee and | Hennessy Advisors, Inc. since 1989 | Advisors, Inc. |
| Trustee, Chairman of | June 2008 as | and currently serves as its President, | |
| the Board, Chief | an Officer | Chairman and Chief Executive Officer. | |
| Investment Officer, | | | |
| Portfolio Manager, | | | |
| and President | | | |
| Name, (Year of Birth), | | |
| and Position Held | Start Date | Principal Occupation(s) |
with the Trust | of Service | During Past Five Years |
| | | |
| Officers | | |
| | | |
| Teresa M. Nilsen | January 1996 | Ms. Nilsen has been employed by Hennessy Advisors, Inc. |
| (1966) | | since 1989 and currently serves as its Executive Vice President, |
| Executive Vice President | | Chief Operations Officer, Chief Financial Officer, and Secretary. |
| and Treasurer | | |
| | | |
| Daniel B. Steadman | March 2000 | Mr. Steadman has been employed by Hennessy Advisors, Inc. |
| (1956) | | since 2000 and currently serves as its Executive Vice President |
| Executive Vice President | | and Chief Compliance Officer. |
| and Secretary | | |
| | | |
| Brian Carlson | December 2013 | Mr. Carlson has been employed by Hennessy Advisors, Inc. |
| (1972) | | since December 2013. Mr. Carlson was previously a co-founder |
| Senior Vice President and | | and principal of Trivium Consultants, LLC from February 2011 |
| Head of Distribution | | through November 2013. |
| | | |
| Jennifer Cheskiewicz | June 2013 | Ms. Cheskiewicz has been employed by Hennessy Advisors, Inc. |
| (1977) | | as its General Counsel since June 2013. She previously served |
| Senior Vice President and | | as in-house counsel to Carlson Capital, L.P., an SEC-registered |
| Chief Compliance Officer | | investment advisor to several private funds, from |
| | | February 2010 to May 2013. |
| HENNESSY FUNDS | 1-800-966-4354 | |
| Name, (Year of Birth), | | |
| and Position Held | Start Date | Principal Occupation(s) |
with the Trust | of Service | During Past Five Years |
| | | |
| David Ellison | October 2012 | Mr. Ellison has been employed by Hennessy Advisors, Inc. since |
(1958)(3) | | October 2012. He has served as a Portfolio Manager of the |
| Senior Vice President | | Hennessy Small Cap Financial Fund and the Hennessy Large |
| and Portfolio Manager | | Cap Financial Fund since inception. Mr. Ellison also served as a |
| | | Portfolio Manager of the Hennessy Technology Fund from its |
| | | inception until February 2017. Mr. Ellison served as Director, |
| | | CIO and President of FBR Fund Advisers, Inc. from |
| | | December 1999 to October 2012. |
| | | |
| Ryan Kelley | March 2013 | Mr. Kelley has been employed by Hennessy Advisors, Inc. since |
(1972)(4) | | October 2012. He has served as a Portfolio Manager of the |
| Vice President and | | Hennessy Gas Utility Fund, the Hennessy Small Cap Financial |
| Portfolio Manager | | Fund, and the Hennessy Large Cap Financial Fund since |
| | | October 2014. He served as Co-Portfolio Manager of the same |
| | | funds from March 2013 through September 2014, and as a |
| | | Portfolio Analyst for the Hennessy Funds from October 2012 |
| | | through October 2014. Mr. Kelley has also served as a Portfolio |
| | | Manager of the Hennessy Cornerstone Growth Fund, the |
| | | Hennessy Cornerstone Mid Cap 30 Fund, the Hennessy |
| | | Cornerstone Large Growth Fund, and the Hennessy |
| | | Cornerstone Value Fund and as a Co-Portfolio Manager of the |
| | | Hennessy Technology Fund since February 2017. Mr. Kelley |
| | | served as Portfolio Manager of FBR Fund Advisers, Inc. from |
| | | January 2008 to October 2012. |
| | | |
| Brian Peery | March 2003 as | Mr. Peery has been employed by Hennessy Advisors, Inc. since |
| (1969) | an Officer and | 2002. He has served as a Portfolio Manager of the Hennessy |
| Senior Vice President | February 2011 | Cornerstone Growth Fund, the Hennessy Cornerstone Mid Cap |
| and Portfolio Manager | as a Co-Portfolio | 30 Fund, the Hennessy Cornerstone Large Growth Fund, the |
| | Manager or | Hennessy Cornerstone Value Fund, the Hennessy Total Return |
| | Portfolio Manager | Fund, and the Hennessy Balanced Fund since October 2014. |
| | | He served as Co-Portfolio Manager of the same funds from |
| | | February 2011 through September 2014. Mr. Peery has also |
| | | served as a Portfolio Manager of the Hennessy Gas Utility Fund |
| | | since February 2015 and as Lead Portfolio Manager of the |
| | | Hennessy Technology Fund since February 2017. |
| | | |
| Daniel P. Hennessy | December 2016 | Mr. Daniel Hennessy has been employed by Hennessy Advisors, |
| (1990) | | Inc. since 2015. He has served as an Associate Analyst of the |
| Assistant Vice President | | Hennessy Technology Fund since February 2017. He previously |
| and Associate Analyst | | served as a Mutual Fund Specialist at U.S. Bancorp Fund |
| | | Services, LLC from November 2014 to July 2015. Prior to that, |
| | | he attended the University of San Diego, where he earned a |
| | | degree in Political Science. |
_______________
(1) | Messrs. DeSousa, Doyle, Hennessy, and Richardson previously served on the Board of Directors of Hennessy Mutual Funds, Inc. (“HMFI”), The Hennessy Funds, Inc. (“HFI”), and Hennessy SPARX Funds Trust (“HSFT”). Pursuant to an internal reorganization effective as of February 28, 2014, the series of HFMI, HFI, and HSFT were reorganized into corresponding series of Hennessy Funds Trust that mirrored them. Subsequent to the reorganization, HFMI, HFI, and HSFT were dissolved. |
(2) | Mr. Hennessy is considered an “interested person,” as defined in the Investment Company Act of 1940, as amended, because he is an officer of the Hennessy Funds. |
(3) | The address of this officer is 101 Federal Street, Suite 1900, Boston, MA 02110. |
(4) | The address of this officer is 1340 Environ Way, Chapel Hill, NC 27517. |
| TRUSTEES AND OFFICERS OF THE FUND |
(This Page Intentionally Left Blank.)
| HENNESSY FUNDS | 1-800-966-4354 | |
Expense Example (Unaudited)
October 31, 2017
As a shareholder of the Fund, you incur two types of costs: (1) transaction costs, including sales charges (loads) on purchase payments, reinvested dividends, or other distributions, redemption fees, and exchange fees; and (2) ongoing costs, including management fees, service fees, and other Fund expenses. This Example is intended to help you understand your ongoing costs (in dollars) of investing in the Fund and to compare these costs with the ongoing costs of investing in other mutual funds. The Example is based on an investment of $1,000 invested at the beginning of the period and held for the entire period from May 1, 2017, through October 31, 2017.
Actual Expenses
The first line of the table below provides information about actual account values and actual expenses. Although the Fund charges no sales loads or transaction fees, you will be assessed fees for outgoing wire transfers, returned checks and stop payment orders at prevailing rates charged by U.S. Bancorp Fund Services, LLC, the Fund’s transfer agent. If you request that a redemption be made by wire transfer, currently a $15 fee is charged by the Fund’s transfer agent. IRA accounts will be charged a $15 annual maintenance fee. The example below includes, but is not limited to, management fees, shareholder servicing fees, fund accounting, custody, and transfer agent fees. However, the example below does not include portfolio trading commissions and related expenses, and other extraordinary expenses as determined under generally accepted accounting principles. You may use the information in this line, together with the amount you invested, to estimate the expenses that you paid over the period. Simply divide your account value by $1,000 (for example, an $8,600 account value divided by $1,000 = 8.6), then multiply the result by the number in the first line of the table under the heading entitled “Expenses Paid During Period” to estimate the expenses you paid on your account during this period.
Hypothetical Example for Comparison Purposes
The second line of the table below provides information about hypothetical account values and hypothetical expenses based on the Fund’s actual expense ratio and an assumed rate of return of 5% per year before expenses, which is not the Fund’s actual return. The hypothetical account values and expenses may not be used to estimate the actual ending account balance or expenses you paid for the period. You may use this information to compare the ongoing costs of investing in the Fund and other funds. To do so, compare this 5% hypothetical example with the 5% hypothetical examples that appear in the shareholder reports of the other funds. Please note that the expenses shown in the table are meant to highlight your ongoing costs only and do not reflect any transactional costs, such as sales charges (loads), or exchange fees. Therefore, the second line of the table is useful in comparing ongoing costs only, and will not help you determine the relative total costs of owning different funds. In addition, if these transactional costs were included, your costs would have been higher.
| | | | Expenses Paid |
| | Beginning | Ending | During Period(1) |
| | Account Value | Account Value | May 1, 2017 – |
| | May 1, 2017 | October 31, 2017 | October 31, 2017 |
| Investor Class | | | |
| Actual | $1,000.00 | $1,060.50 | $8.52 |
| Hypothetical (5% return before expenses) | $1,000.00 | $1,016.94 | $8.34 |
(1) | Expenses are equal to the Fund’s annualized expense ratio of 1.64%, multiplied by the average account value over the period, multiplied by 184/365 days (to reflect one-half year period). |
| HENNESSY FUNDS | 1-800-966-4354 | |
How to Obtain a Copy of the Fund’s
Proxy Voting Policy and Proxy Voting Records
A description of the policies and procedures the Fund uses to determine how to vote proxies relating to portfolio securities is available without charge: (1) by calling 1-800-966-4354; (2) on the Hennessy Funds’ website at hennessyfunds.com/proxy-voting/policy.fs; or (3) on the U.S. Securities and Exchange Commission’s (the “SEC”) website at www.sec.gov. The Fund’s proxy voting record is available without charge on both the Hennessy Funds’ website at hennessyfunds.com/proxy-voting/vote.fs and the SEC’s website at www.sec.gov no later than August 31 for the prior 12 months ending June 30.
Quarterly Filings on Form N-Q
The Fund files a complete schedule of portfolio holdings with the SEC for the first and third quarters of each fiscal year on Form N-Q. The Fund’s Forms N-Q are made available on the SEC’s website at www.sec.gov. The Fund’s Forms N-Q may be reviewed and copied at the SEC’s Public Reference Room in Washington, DC, and information on the operation of the Public Reference Room may be obtained by calling 1-800-SEC-0330. Information included in the Fund’s Forms N-Q will also be available upon request by calling 1-800-966-4354.
Federal Tax Distribution Information
(Unaudited)
For fiscal year 2017, certain dividends paid by the Fund may be subject to a maximum tax rate of 23.8%, as provided for by the Jobs and Growth Tax Relief Reconciliation Act of 2003. The percentage of dividends declared from ordinary income designated as qualified dividend income was 100.00%.
For corporate shareholders, the percent of ordinary income distributions that qualified for the corporate dividends received deduction for fiscal year 2017 was 100.00%.
The percentage of taxable ordinary income distributions that are designated as short-term capital gain distributions under Section 871(k)(2)(C) of the Internal Revenue Code of 1986, as amended, for the Fund was 3.73%.
Householding
To help keep the Fund’s costs as low as possible, we generally deliver a single copy of most financial reports and prospectuses to shareholders who share an address, even if the accounts are registered under different names. This process, known as “householding,” does not apply to account statements. You may request an individual copy of a prospectus or financial report at any time. If you would like to receive separate mailings, please call U.S. Bancorp Fund Services, LLC at 1-800-261-6950 or 1-414-765-4124 and we will begin individual delivery within 30 days of your request. If your account is held through a financial institution or other intermediary, please contact them directly to request individual delivery.
| PROXY VOTING — PRIVACY POLICY |
Privacy Policy
We collect the following non-public personal information about you:
| | • | information we receive from you on or in applications or other forms, correspondence, or conversations, including, but not limited to, your name, address, phone number, social security number, assets, income, and date of birth; and |
| | • | information about your transactions with us, our affiliates, or others, including, but not limited to, your account number and balance, payment history, parties to transactions, cost basis information, and other financial information. |
We do not disclose any non-public personal information about our current or former shareholders to non-affiliated third parties, except as permitted by law. For example, we are permitted by law to disclose all of the information we collect, as described above, to our Transfer Agent to process your transactions. Furthermore, we restrict access to your non-public personal information to those persons who require such information to provide products or services to you. We maintain physical, electronic, and procedural safeguards that comply with federal standards to guard your non-public personal information.
In the event that you hold shares of the Fund through a financial intermediary, including, but not limited to, a broker-dealer, bank, or trust company, the privacy policy of your financial intermediary would govern how your non-public personal information will be shared with non-affiliated third parties.
| HENNESSY FUNDS | 1-800-966-4354 | |
For information, questions or assistance, please call
The Hennessy Funds
1-800-966-4354 or 1-415-899-1555
INVESTMENT ADVISOR
Hennessy Advisors, Inc.
7250 Redwood Boulevard, Suite 200
Novato, California 94945
ADMINISTRATOR,
TRANSFER AGENT,
DIVIDEND PAYING AGENT &
SHAREHOLDER SERVICING AGENT
U.S. Bancorp Fund Services, LLC
P.O. Box 701
Milwaukee, Wisconsin 53201-0701
CUSTODIAN
U.S. Bank N.A.
Custody Operations
1555 North River Center Drive, Suite 302
Milwaukee, Wisconsin 53212
TRUSTEES
Neil J. Hennessy
Robert T. Doyle
J. Dennis DeSousa
Gerald P. Richardson
COUNSEL
Foley & Lardner LLP
777 East Wisconsin Avenue
Milwaukee, Wisconsin 53202-5306
INDEPENDENT REGISTERED
PUBLIC ACCOUNTING FIRM
Tait, Weller & Baker LLP
1818 Market Street, Suite 2400
Philadelphia, Pennsylvania 19103
DISTRIBUTOR
Quasar Distributors, LLC
777 East Wisconsin Avenue
Milwaukee, Wisconsin 53202
hennessyfunds.com | 1-800-966-4354
This report has been prepared for shareholders and may be distributed to
others only if preceded or accompanied by a current prospectus.
ANNUAL REPORT
OCTOBER 31, 2017
HENNESSY EQUITY AND
INCOME FUND
Investor Class HEIFX
Institutional Class HEIIX
hennessyfunds.com | 1-800-966-4354
(This Page Intentionally Left Blank.)
Contents
| Letter to Shareholders | 2 |
| Performance Overview | 4 |
| Financial Statements | |
| Schedule of Investments | 8 |
| Statement of Assets and Liabilities | 19 |
| Statement of Operations | 20 |
| Statements of Changes in Net Assets | 21 |
| Financial Highlights | 22 |
| Notes to the Financial Statements | 26 |
| Report of Independent Registered Public Accounting Firm | 33 |
| Trustees and Officers of the Fund | 34 |
| Expense Example | 38 |
| Proxy Voting Policy and Proxy Voting Records | 40 |
| Quarterly Schedule of Investments | 40 |
| Federal Tax Distribution Information | 40 |
| Householding | 40 |
| Privacy Policy | 41 |
| HENNESSY FUNDS | 1-800-966-4354 | |
December 2017
Dear Hennessy Funds Shareholder:
Over the past year, global equity markets have made strong advances, fueled by continued, broad-based economic growth in most countries and regions, and in spite of a somewhat unsettling geopolitical backdrop.
U.S. stocks performed well in the first year of the new administration in Washington, and, ignoring the debate and the bluster, investors have continued to focus on what concerns them the most – tax reform, deregulation, and the hope of an increase in infrastructure spending. As we move into the final weeks of the calendar year, with the major indices reaching new highs, I find myself envisioning the Dow Jones Industrial Average building momentum toward 30,000.
Over the past 12 months, the U.S. economy has continued to grow at a steady rate of almost 2.5% on an annualized basis, as measured by GDP. Companies have added over 170,000 jobs per month on average over the past year, and the current unemployment rate of 4.1% is the lowest in 17 years. Consumer confidence is high and still rising, and corporate profits are at all-time highs. The Federal Reserve has been increasing interest rates, but at a gradual pace. The bond market has also continued to support the equity market and equity market valuations. Since December of last year, long bond yields have stayed within a narrow band, with the 10-year U.S. Treasury yield hovering in the 2.0% to 2.5% range, and remain low compared to historical averages. In my opinion, long bond yields have stayed low despite three increases in the Federal Funds rate over the last 12 months in part due to persistent low inflation.
Meanwhile, the prospective price-to-earnings multiples for the Dow Jones Industrial Average and S&P 500 Index are just above long-term averages at 19.5x and 19.9x, respectively. I believe these levels of stock valuation, while higher than a year ago, are still very reasonable. At the peak of the technology/dot-com bubble, U.S. equities sold at much higher multiples across the board than they do today, and bond yields were also much higher. In June of 1999, the Dow Jones Industrial Average sold at 28x earnings and the 10-year bond yield was close to 6%. Today, the Dow is selling at under 20x earnings and is offering a 2.2% dividend yield, on par with the yield of the 10-year government bond at 2.4%.
Equity markets in the U.S. have been rising for almost nine years, and financial media reports have speculated that this bull run will come to end, but why? I see no substantial reasons or indicators that a major correction is on the horizon. I remain confident that this bull market has room to run. Overall, investment fundamentals are strong. Corporate earnings are growing at a healthy rate, and companies are generating excess cash flow. Cash continues to build on corporate balance sheets, with $5.2 trillion in cash and short term investments among the S&P 500 Index companies as of October 31, 2017. If our government leaders can pass a meaningful tax reform bill and continue efforts toward regulatory relief, it could be icing on the cake for equities.
There have been, and will likely continue to be, downturns throughout this extended bull market. Since 2010, there have been 18 downturns in the market, 14 of which were between 5% and 10% and four of which were corrections of between 10% and 20%. Yet the market has bounced back following each pullback and then has moved higher. A correction is not the end of the bull market. What might signal that we are at the end of this bull market? Euphoria. And I still see no signs of euphoria in this market. In the past,
I have likened the current bull market to that of 1982-2000, and I am confident in the strength of the market today and believe the economy will continue its slow, but steady, growth into the coming year.
Thank you for your continued confidence and investment in our funds. If you have any questions or would like to speak with us directly, please don’t hesitate to call us at (800) 966-4354.
Best regards,
Neil J. Hennessy
President and Chief Investment Officer
Past performance does not guarantee future results.
Mutual fund investing involves risk. Principal loss is possible.
Opinions expressed are those of Neil Hennessy and are subject to change, are not guaranteed, and should not be considered investment advice.
The Dow Jones Industrial Average and S&P 500 Index are unmanaged indices commonly used to measure the performance of U.S. stocks. One cannot invest directly in an index.
Price to earnings is calculated by dividing a company’s market price per share by its earnings per share. Dividend yield is calculated as the annual dividends paid by a company divided by the price of a share of its stock. Cash flow provides an indication of a company’s financial strength and represents earnings before depreciation, amortization, and non-cash charges.
| HENNESSY FUNDS | 1-800-966-4354 | |
Performance Overview (Unaudited)
CHANGE IN VALUE OF $10,000 INVESTMENT
This graph illustrates the performance of an initial investment of $10,000 made in the Fund ten years ago and assumes the reinvestment of dividends.
AVERAGE ANNUAL TOTAL RETURN FOR PERIODS ENDED OCTOBER 31, 2017
| | One | Five | Ten |
| | Year | Years | Years |
| Hennessy Equity and Income Fund – | | | |
| Investor Class (HEIFX) | 14.16% | 7.91% | 5.86% |
| Hennessy Equity and Income Fund – | | | |
| Institutional Class (HEIIX) | 14.60% | 8.27% | 6.16% |
| Blended Balanced Index | 13.95% | 9.68% | 6.22% |
| S&P 500 Index | 23.63% | 15.18% | 7.51% |
Expense ratios: 1.48% (Investor Class); 1.08% (Institutional Class)
Performance data quoted represents past performance; past performance does not guarantee future results. The investment return and principal value of an investment will fluctuate so that an investor’s shares, when redeemed, may be worth more or less than their original cost. The performance table does not reflect the deduction of taxes that a shareholder would pay on Fund distributions or the redemption of Fund shares. Current performance of the Fund may be lower or higher than the performance quoted. Performance data current to the most recent month end may be obtained by visiting hennessyfunds.com. Performance for the period from March 12, 2010, to October 26, 2012, is that of the FBR Balanced Fund and for the periods prior to March 12, 2010, is that of the AFBA 5 Star Balanced Fund.
The Blended Balanced Index consists of 60% common stocks represented by the S&P 500 Index and 40% bonds represented by the Bloomberg Barclays Capital Intermediate U.S. Government/Credit Index. The S&P 500 Index is an unmanaged index commonly used to measure the performance of U.S. stocks. The Bloomberg Barclays Capital Intermediate U.S. Government/Credit Index is an unmanaged index commonly used to measure the performance of U.S. bonds. One cannot invest directly in an index.
The expense ratios presented are from the most recent prospectus. The expense ratios for the current reporting period are available in the Financial Highlights section of this report.
PERFORMANCE NARRATIVE
Portfolio Managers for Equity Allocation: Stephen M. Goddard, CFA (Lead Portfolio Manager), Jonathan T. Moody, CFA, J. Brian Campbell, CFA, and Mark E. DeVaul, CFA, CPA
The London Company of Virginia, LLC (sub-advisor)
Portfolio Managers for Fixed Income Allocation: Gary B. Cloud, CFA, and Peter G. Greig, CFA
Financial Counselors, Inc. (sub-advisor)
Performance:
For the 12-month period ended October 31, 2017, the Investor Class of the Hennessy Equity and Income Fund returned 14.16%, outperforming the Blended Balanced Index*, which returned 13.95%, but underperforming the S&P 500 Index, which returned 23.63%, for the same period.
Equities: Sector allocation was the primary factor that contributed to the solid performance of the equity allocation of the portfolio, while stock selection had a neutral impact. At the sector level, an overweight position in Financials and underweight positions in Energy and Real Estate added to relative performance. These positive contributions were partially offset by the negative impact of an underweight position in Information Technology and an overweight position in Consumer Discretionary.
On an individual stock level, the top contributors to performance of the equity allocation of the Fund for the 12-month period were Progressive Corporation, CarMax, Inc., Deere & Company, Norfolk Southern Corporation, and Carnival Corporation. The top detractors from performance were O’Reilly Automotive, Inc., Altria Group, Inc., NewMarket Corporation, Edgewell Personal Care Company, and Alleghany Corporation. All of the stocks mentioned are still owned in the portfolio with the exception of Edgewell Personal Care Company.
Fixed Income: The overweight position in investment grade corporate credit was the largest positive contributor to performance of the fixed income allocation of the Fund over the 12-month period. Issue selection drove most of this performance. The income and aging from these higher-yielding investment grade securities exceeded the amount represented in the benchmark. The Fund’s slight exposure to preferred stocks and high-yield credit securities, or junk bonds, was another positive factor aiding performance. Effective duration was the largest detractor from overall performance compared to the benchmark. Portfolio convexity and volatility were neutral contributors to overall performance.
Portfolio Strategy:
The Fund seeks a balanced portfolio of approximately 60% equities and 40% fixed income, with the goal of maintaining broad market exposure with lower volatility. Our bottom-up equity selection strategy seeks companies with strong returns on capital and the flexibility to enhance shareholder value by using their balance sheets. The fixed income allocation of the portfolio focuses on high-quality domestic corporate, agency, and government bonds.
Investment Commentary:
Equities: The U.S. economy continues to expand at a moderate pace with relatively low inflation. Going forward, we continue to be optimistic about the economy and believe the U.S. consumer will continue to drive moderate growth. A strong labor market with rising wages along with solid housing data should benefit consumers. Meanwhile, the inflation outlook remains subdued with recent reported numbers still coming in under the Federal Reserve’s target level of 2%.
We believe the Federal Reserve is likely to raise the federal funds rate again in December and will continue its balance sheet normalization process. We do not expect a
| HENNESSY FUNDS | 1-800-966-4354 | |
large or immediate change in long-term rates as a result of these policy changes, but over time the reversal of quantitative easing could lead to a steepening of the yield curve.
A solid economy, low inflation, and relatively low interest rates usually create a positive environment for stocks. Looking ahead, we believe this holds true today, but there are always risks. Potential risks include relatively high valuations for stocks using traditional metrics, geopolitical turmoil, excessive government stimulus, or the Federal Reserve tightening monetary policy too aggressively. We believe the risks and rewards are somewhat balanced as they relate to stocks overall, but we remain cautious and focused on limiting downside in each holding. Fortunately, we are still finding high conviction investment ideas with which to populate the portfolio.
The low interest rates and relatively high equity risk premiums present in the current environment enable companies to increase shareholder value by adjusting their capital structures. We expect investors to reward companies that wisely deploy capital by paying higher dividends, making share repurchases at attractive prices, and engaging in M&A transactions. We believe our more conservative portfolio is well positioned for a moderate growth environment that rewards strong capital allocation.
Fixed Income: We believe the Federal Reserve is very likely to raise the federal funds rate in December, as the implied probability today is over 95%. What will happen in 2018 and 2019 on the rate front is very uncertain, as the Fed has indicated five or six quarter-point rate hikes over that time horizon and the marketplace has only priced in two or three. Core CPI and Personal Consumption Expenditure (PCE) have undershot Fed targets over the last five years, and we believe they will continue to do so.
One major change over the last 12 months has been the shape of the U.S. yield curve. The 10-Year Treasury yield minus the 2-Year Treasury yield has plummeted to around 0.67%, after reaching 1.35% upon the surprise Presidential election. A flatter yield curve generally portends slower economic growth and softer inflation, so the new Fed Chairman will have to navigate this development very carefully. Our view of future inflation and average hourly wage increases suggests that the Fed could make a policy error if it follows through on what we view as an overly aggressive estimated rate path.
As we look forward, prospects for economic growth seem steady with an upward bias. Geopolitical risks are clearly present, but the markets seem to be taking developments in their stride. The credit markets are strong, and investors continue to allocate capital to high quality debt issuers, which represent an important portion of the Fund’s fixed income investments. Default rates on investment grade credit and high yield bonds are very low, and we expect they will stay low during 2018. We believe that some level of tax reform or tax cut is likely at the end of 2017 or sometime in 2018 and that the world’s central bankers will continue with their highly accommodative monetary stance. Loose monetary policy should mitigate some of the upward trajectory in short-term rates globally and be supportive of risk assets generally.
_______________
| * | The Blended Balanced Index consists of 60% common stocks represented by the S&P 500 Index and 40% bonds represented by the Bloomberg Barclays Capital Intermediate U.S. Government/Credit Index. |
Opinions expressed are those of the Portfolio Managers as of the date written and are subject to change, are not guaranteed, and should not be considered investment advice or an indication of trading intent.
The S&P 500 Index is an unmanaged index commonly used to measure the performance of U.S. stocks. The Bloomberg Barclays Capital Intermediate U.S. Government/Credit Index is an unmanaged index commonly used to measure the performance of U.S. bonds. One cannot invest directly in an index.
Investments in debt securities typically decrease in value when interest rates rise. The risk is greater for longer-term debt securities. Investments by the Fund in lower-rated and non-rated securities presents a greater risk of loss to principal and interest than higher-rated securities. Investments in Asset-Backed and Mortgage-Backed securities include additional risks that investors should be aware of including credit risk, prepayment risk, possible illiquidity and default, as well as increased susceptibility to adverse economic developments. Investments in foreign securities may involve political, economic and currency risks, greater volatility and differences in accounting methods. The Fund may experience higher fees due to investments in pooled investment vehicles (including ETFs). Please see the Fund’s prospectus for a more complete discussion of these and other risks.
References to specific securities should not be considered a recommendation to buy or sell any security. Fund holdings and sector allocations are subject to change. Please refer to the Schedule of Investments included in this report for additional portfolio information.
Convexity is used as a risk-management tool, and helps to measure and manage the amount of market risk to which a portfolio of bonds is exposed. Convexity is a measure of the curvature in the relationship between bond prices and bond yields that demonstrates how the duration of a bond changes as the interest rate changes. For example, negative convexity means that a bond’s price falls more than its duration when market yields rise. Duration is a measure of the sensitivity of the price (the value of principal) of a fixed-income investment to a change in interest rates and is expressed as a number of years. Return on capital is a ratio measuring the profitability of a firm expressed as a percentage of funds acquired from investors and lenders. Yield curve is a line that plots the interest rates, at a set point in time, of bonds having equal credit quality, but differing maturity dates. Investment grade is a rating that indicates that a municipal or corporate bond has a relatively low risk of default.
| HENNESSY FUNDS | 1-800-966-4354 | |
Financial Statements
Schedule of Investments as of October 31, 2017 |
HENNESSY EQUITY AND INCOME FUND
(% of Net Assets)
| TOP TEN HOLDINGS (EXCLUDING CASH/CASH EQUIVALENTS) | | % NET ASSETS |
| Berkshire Hathaway, Inc., Class B | | | 4.56 | % |
| Apple, Inc. | | | 3.43 | % |
| Carnival Corp. | | | 3.10 | % |
| Dollar Tree, Inc. | | | 2.91 | % |
| CarMax, Inc. | | | 2.89 | % |
| The Progressive Corp. | | | 2.80 | % |
| Visa, Inc., Class A | | | 2.75 | % |
| General Dynamics Corp. | | | 2.70 | % |
| BlackRock, Inc. | | | 2.59 | % |
| Alphabet, Inc., Class C | | | 2.37 | % |
Note: For presentation purposes, the Fund has grouped some of the industry categories. For purposes of categorizing securities for compliance with section 8(b)(1) of the Investment Company Act of 1940, as amended, the Fund uses more specific industry classifications.
| COMMON STOCKS – 61.81% | | Number | | | | | | % of | |
| | | of Shares | | | Value | | | Net Assets | |
| Consumer Discretionary – 13.35% | | | | | | | | | |
| CarMax, Inc. (a) | | | 102,509 | | | $ | 7,698,426 | | | | 2.89 | % |
| Carnival Corp. (b) | | | 124,120 | | | | 8,240,327 | | | | 3.10 | % |
| Dollar Tree, Inc. (a) | | | 84,830 | | | | 7,740,737 | | | | 2.91 | % |
| Lowe’s Companies, Inc. | | | 47,616 | | | | 3,806,899 | | | | 1.43 | % |
| NIKE, Inc., Class B | | | 82,330 | | | | 4,527,327 | | | | 1.70 | % |
| O’Reilly Automotive, Inc. (a) | | | 16,600 | | | | 3,501,770 | | | | 1.32 | % |
| | | | | | | | 35,515,486 | | | | 13.35 | % |
| | | | | | | | | | | | | |
| Consumer Staples – 3.37% | | | | | | | | | | | | |
| Altria Group, Inc. | | | 89,097 | | | | 5,721,809 | | | | 2.15 | % |
| The Coca-Cola Co. | | | 70,581 | | | | 3,245,315 | | | | 1.22 | % |
| | | | | | | | 8,967,124 | | | | 3.37 | % |
| | | | | | | | | | | | | |
| Energy – 1.44% | | | | | | | | | | | | |
| Chevron Corp. | | | 33,031 | | | | 3,827,963 | | | | 1.44 | % |
| | | | | | | | | | | | | |
| Financials – 15.26% | | | | | | | | | | | | |
| Alleghany Corp. (a) | | | 9,320 | | | | 5,277,170 | | | | 1.98 | % |
| Bank of America Corp. | | | 105,319 | | | | 2,884,687 | | | | 1.08 | % |
| Berkshire Hathaway, Inc., Class B (a) | | | 64,859 | | | | 12,124,742 | | | | 4.56 | % |
| BlackRock, Inc. | | | 14,608 | | | | 6,877,885 | | | | 2.59 | % |
| The Progressive Corp. | | | 153,120 | | | | 7,449,288 | | | | 2.80 | % |
| Wells Fargo & Co. | | | 106,803 | | | | 5,995,920 | | | | 2.25 | % |
| | | | | | | | 40,609,692 | | | | 15.26 | % |
| | | | | | | | | | | | | |
| Health Care – 5.41% | | | | | | | | | | | | |
| Alexion Pharmaceuticals, Inc. (a) | | | 40,250 | | | | 4,816,315 | | | | 1.81 | % |
| Bristol-Myers Squibb Co. | | | 62,553 | | | | 3,857,018 | | | | 1.45 | % |
| Eli Lilly & Co. | | | 69,860 | | | | 5,724,328 | | | | 2.15 | % |
| | | | | | | | 14,397,661 | | | | 5.41 | % |
| | | | | | | | | | | | | |
| Industrials – 9.99% | | | | | | | | | | | | |
| Deere & Co. | | | 46,110 | | | | 6,127,097 | | | | 2.30 | % |
| FedEx Corp. | | | 17,038 | | | | 3,847,351 | | | | 1.45 | % |
| General Dynamics Corp. | | | 35,440 | | | | 7,193,611 | | | | 2.70 | % |
| Norfolk Southern Corp. | | | 47,480 | | | | 6,239,821 | | | | 2.35 | % |
| Southwest Airlines Co. | | | 58,720 | | | | 3,162,659 | | | | 1.19 | % |
| | | | | | | | 26,570,539 | | | | 9.99 | % |
The accompanying notes are an integral part of these financial statements.
| HENNESSY FUNDS | 1-800-966-4354 | |
| COMMON STOCKS | | Number | | | | | | % of | |
| | | of Shares | | | Value | | | Net Assets | |
| Information Technology – 10.11% | | | | | | | | | |
| Alphabet, Inc., Class C (a) | | | 6,200 | | | $ | 6,303,168 | | | | 2.37 | % |
| Apple, Inc. | | | 53,930 | | | | 9,116,327 | | | | 3.43 | % |
| Cisco Systems, Inc. | | | 122,026 | | | | 4,167,188 | | | | 1.56 | % |
| Visa, Inc., Class A | | | 66,516 | | | | 7,315,430 | | | | 2.75 | % |
| | | | | | | | 26,902,113 | | | | 10.11 | % |
| | | | | | | | | | | | | |
| Materials – 1.90% | | | | | | | | | | | | |
| NewMarket Corp. | | | 12,630 | | | | 5,056,926 | | | | 1.90 | % |
| | | | | | | | | | | | | |
| Telecommunication Services – 0.98% | | | | | | | | | | | | |
| Verizon Communications, Inc. | | | 54,148 | | | | 2,592,065 | | | | 0.98 | % |
| | | | | | | | | | | | | |
| Total Common Stocks | | | | | | | | | | | | |
| (Cost $129,113,029) | | | | | | | 164,439,569 | | | | 61.81 | % |
| | | | | | | | | | | | | |
| PREFERRED STOCKS – 1.90% | | | | | | | | | | | | |
| | | | | | | | | | | | | |
| Consumer Staples – 0.08% | | | | | | | | | | | | |
| CHS, Inc., Series 4, 7.500%, Perpetual | | | 7,380 | | | | 211,437 | | | | 0.08 | % |
| | | | | | | | | | | | | |
| Financials – 1.69% | | | | | | | | | | | | |
| Aegon N.V., 6.375%, Perpetual (b) | | | 4,050 | | | | 104,895 | | | | 0.04 | % |
| Axis Capital Holdings Ltd., Series E, 5.500%, Perpetual (b) | | | 2,700 | | | | 68,391 | | | | 0.03 | % |
| Banc of California, Inc., Series E, 7.000%, Perpetual | | | 4,065 | | | | 113,942 | | | | 0.04 | % |
| Bank of America Corp. | | | | | | | | | | | | |
| Series CC, 6.200%, Perpetual | | | 2,440 | | | | 65,392 | | | | 0.02 | % |
| Series EE, 6.000%, Perpetual | | | 3,710 | | | | 98,055 | | | | 0.04 | % |
| BB&T Corp. | | | | | | | | | | | | |
| 5.625%, Perpetual | | | 4,575 | | | | 122,381 | | | | 0.05 | % |
| Series F, 5.200%, Perpetual | | | 4,800 | | | | 121,104 | | | | 0.04 | % |
| Capital One Financial Corp. | | | | | | | | | | | | |
| Series H, 6.000%, Perpetual | | | 4,675 | | | | 124,495 | | | | 0.05 | % |
| Series F, 6.200%, Perpetual | | | 4,610 | | | | 124,562 | | | | 0.05 | % |
| Citigroup, Inc. | | | | | | | | | | | | |
| Series C, 5.800%, Perpetual | | | 3,935 | | | | 100,264 | | | | 0.04 | % |
| Series S, 6.300%, Perpetual | | | 3,855 | | | | 104,355 | | | | 0.04 | % |
| Fannie Mae Preferred, Series S, 8.250%, Perpetual (a) | | | 10,600 | | | | 72,186 | | | | 0.03 | % |
| Fifth Third Bancorp, Series I, 6.625% to 12/31/2023 then | | | | | | | | | | | | |
| 3 Month LIBOR USD + 3.710%, Perpetual (f) | | | 1,300 | | | | 37,037 | | | | 0.01 | % |
| First Republic Bank | | | | | | | | | | | | |
| Series F, 5.700%, Perpetual | | | 3,465 | | | | 92,065 | | | | 0.03 | % |
| Series G, 5.500%, Perpetual | | | 3,610 | | | | 92,921 | | | | 0.03 | % |
The accompanying notes are an integral part of these financial statements.
| PREFERRED STOCKS | | Number | | | | | | % of | |
| | | of Shares | | | Value | | | Net Assets | |
| Financials (Continued) | | | | | | | | | |
| Huntington Bancshares, Inc., Series D, 6.250%, Perpetual | | | 6,290 | | | $ | 174,610 | | | | 0.06 | % |
| IBERIABANK Corp., Series B, 6.625% to 08/01/2025 then | | | | | | | | | | | | |
| 3 Month LIBOR USD + 4.262%, Perpetual (f) | | | 1,920 | | | | 53,645 | | | | 0.02 | % |
| ING Groep N.V., 6.125%, Perpetual (b) | | | 2,055 | | | | 52,814 | | | | 0.02 | % |
| JPMorgan Chase & Co., Series BB, 6.150%, Perpetual | | | 9,030 | | | | 243,991 | | | | 0.09 | % |
| Legg Mason, Inc. | | | | | | | | | | | | |
| 5.450%, 09/15/2056 | | | 2,295 | | | | 57,720 | | | | 0.02 | % |
| 6.375%, 03/15/2056 | | | 2,051 | | | | 54,823 | | | | 0.02 | % |
| Morgan Stanley, Series I, 6.375% to 10/15/2024 then | | | | | | | | | | | | |
| 3 Month LIBOR USD + 3.708%, Perpetual (f) | | | 7,585 | | | | 212,380 | | | | 0.08 | % |
| National General Holdings Corp., Series C, 7.500%, Perpetual | | | 2,795 | | | | 70,937 | | | | 0.03 | % |
| Northern Trust Corp., Series C, 5.850%, Perpetual | | | 4,775 | | | | 126,681 | | | | 0.05 | % |
| PNC Financial Services Group, Inc., Series Q, 5.375%, Perpetual | | | 7,355 | | | | 187,920 | | | | 0.07 | % |
| Regions Financial Corp. | | | | | | | | | | | | |
| Series A, 6.375%, Perpetual | | | 4,590 | | | | 116,586 | | | | 0.04 | % |
| Series B, 6.375% to 09/15/2024 then | | | | | | | | | | | | |
| 3 Month LIBOR USD + 3.536%, Perpetual (f) | | | 4,355 | | | | 123,464 | | | | 0.05 | % |
| State Street Corp. | | | | | | | | | | | | |
| Series E, 6.000%, Perpetual | | | 4,585 | | | | 123,474 | | | | 0.05 | % |
| Series D, 5.900% to 03/15/2024 then | | | | | | | | | | | | |
| 3 Month LIBOR USD + 3.108%, Perpetual (f) | | | 4,465 | | | | 123,725 | | | | 0.05 | % |
| SunTrust Banks, Inc., Series E, 5.875%, Perpetual | | | 5,605 | | | | 143,432 | | | | 0.05 | % |
| TCF Financial Corp., Series C, 5.700%, Perpetual (a) | | | 2,220 | | | | 57,054 | | | | 0.02 | % |
| The Allstate Corp., Series E, 6.625%, Perpetual | | | 8,935 | | | | 239,726 | | | | 0.09 | % |
| The Charles Schwab Corp. | | | | | | | | | | | | |
| Series D, 5.950%, Perpetual | | | 4,625 | | | | 126,725 | | | | 0.05 | % |
| Series C, 6.000%, Perpetual | | | 4,575 | | | | 125,401 | | | | 0.05 | % |
| The Goldman Sachs Group, Inc. | | | | | | | | | | | | |
| Series N, 6.300%, Perpetual | | | 2,755 | | | | 75,239 | | | | 0.03 | % |
| Series K, 6.375% to 05/10/2024 then | | | | | | | | | | | | |
| 3 Month LIBOR USD + 3.550%, Perpetual (f) | | | 2,715 | | | | 77,975 | | | | 0.03 | % |
| U.S. Bancorp, Series F, 6.500% to 01/15/2022 then | | | | | | | | | | | | |
| 3 Month LIBOR USD + 4.447%, Perpetual (d)(f) | | | 3,240 | | | | 93,247 | | | | 0.03 | % |
| Validus Holdings Ltd., Series A, 5.875%, Perpetual (b) | | | 5,700 | | | | 146,376 | | | | 0.05 | % |
| Wells Fargo & Co. | | | | | | | | | | | | |
| Series V, 6.000%, Perpetual | | | 4,610 | | | | 121,704 | | | | 0.05 | % |
| Series X, 5.500%, Perpetual | | | 5,045 | | | | 128,194 | | | | 0.05 | % |
| | | | | | | | 4,499,888 | | | | 1.69 | % |
| | | | | | | | | | | | | |
| Telecommunication Services – 0.05% | | | | | | | | | | | | |
| AT&T, Inc., 5.350%, 11/01/2066 (a) | | | 5,300 | | | | 135,521 | | | | 0.05 | % |
The accompanying notes are an integral part of these financial statements.
| HENNESSY FUNDS | 1-800-966-4354 | |
| PREFERRED STOCKS | | Number of Shares/ | | | | | | % of | |
| | | Par Amount | | | Value | | | Net Assets | |
| Utilities – 0.08% | | | | | | | | | |
| DTE Energy Co., Series F, 6.000%, 12/15/2076 | | | 4,115 | | | $ | 112,339 | | | | 0.04 | % |
| The Southern Co., 6.250%, 10/15/2075 | | | 4,025 | | | | 108,595 | | | | 0.04 | % |
| | | | | | | | 220,934 | | | | 0.08 | % |
| Total Preferred Stocks | | | | | | | | | | | | |
| (Cost $5,090,083) | | | | | | | 5,067,780 | | | | 1.90 | % |
| | | | | | | | | | | | | |
| REITS – 0.46% | | | | | | | | | | | | |
| | | | | | | | | | | | | |
| Financials – 0.46% | | | | | | | | | | | | |
| Apollo Commercial Real Estate Finance, Inc. | | | 9,050 | | | | 163,533 | | | | 0.06 | % |
| Chimera Investment Corp. | | | 7,950 | | | | 145,485 | | | | 0.05 | % |
| Chimera Investment Corp. | | | | | | | | | | | | |
| Series A, 8.000%, Perpetual | | | 4,925 | | | | 127,804 | | | | 0.05 | % |
| Series B, 8.000% to 03/30/2024 then | | | | | | | | | | | | |
| 3 Month LIBOR USD + 5.791%, Perpetual (f) | | | 2,665 | | | | 68,890 | | | | 0.03 | % |
| Monmouth Real Estate Investment Corp., Series C, 6.125%, Perpetual | | | 4,505 | | | | 113,481 | | | | 0.04 | % |
| Public Storage, Series B, 5.400%, Perpetual | | | 3,275 | | | | 84,626 | | | | 0.03 | % |
| Starwood Property Trust, Inc. | | | 6,775 | | | | 145,730 | | | | 0.06 | % |
| Two Harbors Investment Corp. | | | 15,150 | | | | 148,470 | | | | 0.06 | % |
| Two Harbors Investment Corp., Series B, 7.625% to 07/27/2027 then | | | | | | | | | | | | |
| 3 Month LIBOR USD + 5.352%, Perpetual (f) | | | 8,105 | | | | 215,269 | | | | 0.08 | % |
| | | | | | | | 1,213,288 | | | | 0.46 | % |
| Total REITS | | | | | | | | | | | | |
| (Cost $1,151,350) | | | | | | | 1,213,288 | | | | 0.46 | % |
| | | | | | | | | | | | | |
| CORPORATE BONDS – 24.37% | | | | | | | | | | | | |
| | | | | | | | | | | | | |
| Consumer Staples – 1.27% | | | | | | | | | | | | |
| Anheuser-Busch InBev Worldwide, Inc., 7.750%, 01/15/2019 | | | 150,000 | | | | 160,331 | | | | 0.06 | % |
| CVS Health Corp. | | | | | | | | | | | | |
| 1.900%, 07/20/2018 | | | 1,300,000 | | | | 1,301,954 | | | | 0.49 | % |
| 2.250%, 12/05/2018 | | | 500,000 | | | | 501,645 | | | | 0.19 | % |
| 4.125%, 05/15/2021 | | | 1,000,000 | | | | 1,050,335 | | | | 0.39 | % |
| Wal-Mart Stores, Inc., 5.000%, 10/25/2040 | | | 300,000 | | | | 366,437 | | | | 0.14 | % |
| | | | | | | | 3,380,702 | | | | 1.27 | % |
| | | | | | | | | | | | | |
| Energy – 1.75% | | | | | | | | | | | | |
| Canadian Natural Resources Ltd., 3.900%, 02/01/2025 (b) | | | 1,000,000 | | | | 1,033,944 | | | | 0.39 | % |
| Encana Corp., 3.900%, 11/15/2021 (b) | | | 1,600,000 | | | | 1,657,683 | | | | 0.62 | % |
The accompanying notes are an integral part of these financial statements.
| CORPORATE BONDS | | Par | | | | | | % of | |
| | | Amount | | | Value | | | Net Assets | |
| Energy (Continued) | | | | | | | | | |
| Husky Energy, Inc., 4.000%, 04/15/2024 (b) | | | 750,000 | | | $ | 782,294 | | | | 0.29 | % |
| National Oilwell Varco, Inc., 2.600%, 12/01/2022 | | | 1,200,000 | | | | 1,183,797 | | | | 0.45 | % |
| | | | | | | | 4,657,718 | | | | 1.75 | % |
| | | | | | | | | | | | | |
| Financials – 13.11% | | | | | | | | | | | | |
| American International Group, Inc. | | | | | | | | | | | | |
| 4.125%, 02/15/2024 | | | 1,000,000 | | | | 1,065,116 | | | | 0.40 | % |
| 4.875%, 06/01/2022 | | | 1,000,000 | | | | 1,096,067 | | | | 0.41 | % |
| Associates Corporation of North America, 6.950%, 11/01/2018 | | | 300,000 | | | | 314,646 | | | | 0.12 | % |
| BB&T Corp., 2.300%, 10/15/2018 | | | 1,000,000 | | | | 1,005,601 | | | | 0.38 | % |
| Boston Properties, Inc., 5.875%, 10/15/2019 | | | 700,000 | | | | 745,939 | | | | 0.28 | % |
| Capital One Financial Corp., 4.750%, 07/15/2021 | | | 1,500,000 | | | | 1,618,211 | | | | 0.61 | % |
| Capital One NA, 2.250%, 09/13/2021 | | | 500,000 | | | | 493,290 | | | | 0.18 | % |
| Comerica, Inc., 2.125%, 05/23/2019 | | | 500,000 | | | | 500,441 | | | | 0.19 | % |
| Diamond 1 Finance Corp. / Diamond 2 Finance Corp., | | | | | | | | | | | | |
| 5.450%, 06/15/2023 (e) | | | 1,220,000 | | | | 1,338,390 | | | | 0.50 | % |
| Discover Financial Services, 5.200%, 04/27/2022 | | | 900,000 | | | | 980,855 | | | | 0.37 | % |
| Fifth Third Bancorp, 2.375%, 04/25/2019 | | | 1,775,000 | | | | 1,786,155 | | | | 0.67 | % |
| First Niagara Financial Group, Inc., 6.750%, 03/19/2020 | | | 590,000 | | | | 652,032 | | | | 0.24 | % |
| Ford Motor Co., 7.450%, 07/16/2031 | | | 1,000,000 | | | | 1,301,914 | | | | 0.49 | % |
| General Electric Capital Corp., 6.000%, 08/07/2019 | | | 610,000 | | | | 654,333 | | | | 0.24 | % |
| JPMorgan Chase & Co., 2.700%, 05/18/2023 | | | 1,000,000 | | | | 999,016 | | | | 0.37 | % |
| KeyCorp | | | | | | | | | | | | |
| 2.300%, 12/13/2018 | | | 2,600,000 | | | | 2,611,867 | | | | 0.98 | % |
| 5.100%, 03/24/2021 | | | 950,000 | | | | 1,035,605 | | | | 0.39 | % |
| Lincoln National Corp., 6.250%, 02/15/2020 | | | 780,000 | | | | 848,900 | | | | 0.32 | % |
| Merrill Lynch & Company, Inc., 6.875%, 04/25/2018 | | | 955,000 | | | | 978,329 | | | | 0.37 | % |
| MetLife, Inc., Series A, 6.817%, 08/15/2018 | | | 100,000 | | | | 103,972 | | | | 0.04 | % |
| Morgan Stanley, 5.500%, 07/28/2021 | | | 2,333,000 | | | | 2,579,824 | | | | 0.97 | % |
| Qwest Capital Funding, Inc., 6.500%, 11/15/2018 | | | 700,000 | | | | 735,000 | | | | 0.28 | % |
| Raymond James Financial, Inc. | | | | | | | | | | | | |
| 3.625%, 09/15/2026 | | | 1,500,000 | | | | 1,517,390 | | | | 0.57 | % |
| 5.625%, 04/01/2024 | | | 700,000 | | | | 799,920 | | | | 0.30 | % |
| Royal Bank of Canada, 2.200%, 07/27/2018 (b) | | | 1,000,000 | | | | 1,004,326 | | | | 0.38 | % |
| Synchrony Financial, 3.750%, 08/15/2021 | | | 1,200,000 | | | | 1,242,346 | | | | 0.47 | % |
| Synovus Financial Corp., 3.125%, 11/01/2022 | | | 1,300,000 | | | | 1,301,079 | | | | 0.49 | % |
| The Goldman Sachs Group, Inc. | | | | | | | | | | | | |
| 5.375%, 03/15/2020 | | | 1,100,000 | | | | 1,178,028 | | | | 0.44 | % |
| 6.000%, 06/15/2020 | | | 1,500,000 | | | | 1,641,234 | | | | 0.62 | % |
The accompanying notes are an integral part of these financial statements.
| HENNESSY FUNDS | 1-800-966-4354 | |
| CORPORATE BONDS | | Par | | | | | | % of | |
| | | Amount | | | Value | | | Net Assets | |
| Financials (Continued) | | | | | | | | | |
| The Toronto-Dominion Bank, 2.125%, 07/02/2019 (b) | | | 1,500,000 | | | $ | 1,507,378 | | | | 0.57 | % |
| Westpac Banking Corp., 4.875%, 11/19/2019 (b) | | | 450,000 | | | | 476,396 | | | | 0.18 | % |
| Willis North America, Inc., 3.600%, 05/15/2024 | | | 750,000 | | | | 770,298 | | | | 0.29 | % |
| | | | | | | | 34,883,898 | | | | 13.11 | % |
| | | | | | | | | | | | | |
| Health Care – 2.99% | | | | | | | | | | | | |
| Agilent Technologies, Inc., 5.000%, 07/15/2020 | | | 650,000 | | | | 696,324 | | | | 0.26 | % |
| Amgen, Inc. | | | | | | | | | | | | |
| 3.450%, 10/01/2020 | | | 1,000,000 | | | | 1,036,585 | | | | 0.39 | % |
| 3.625%, 05/22/2024 | | | 1,500,000 | | | | 1,567,273 | | | | 0.59 | % |
| Celgene Corp. | | | | | | | | | | | | |
| 2.300%, 08/15/2018 | | | 1,000,000 | | | | 1,004,383 | | | | 0.38 | % |
| 3.625%, 05/15/2024 | | | 1,600,000 | | | | 1,652,816 | | | | 0.62 | % |
| Express Scripts Holding Co., 3.500%, 06/15/2024 | | | 700,000 | | | | 709,295 | | | | 0.27 | % |
| Zoetis, Inc., 3.250%, 02/01/2023 | | | 1,250,000 | | | | 1,287,227 | | | | 0.48 | % |
| | | | | | | | 7,953,903 | | | | 2.99 | % |
| | | | | | | | | | | | | |
| Information Technology – 0.85% | | | | | | | | | | | | |
| Apple, Inc., 4.500%, 02/23/2036 | | | 250,000 | | | | 285,434 | | | | 0.11 | % |
| Corning, Inc. | | | | | | | | | | | | |
| 6.625%, 05/15/2019 | | | 695,000 | | | | 742,307 | | | | 0.28 | % |
| 6.850%, 03/01/2029 | | | 275,000 | | | | 347,216 | | | | 0.13 | % |
| Juniper Networks, Inc., 4.600%, 03/15/2021 | | | 600,000 | | | | 638,221 | | | | 0.24 | % |
| Oracle Corp., 2.650%, 07/15/2026 | | | 250,000 | | | | 245,582 | | | | 0.09 | % |
| | | | | | | | 2,258,760 | | | | 0.85 | % |
| | | | | | | | | | | | | |
| Materials – 2.34% | | | | | | | | | | | | |
| AngloGold Ashanti Holdings PLC, 5.125%, 08/01/2022 (b) | | | 1,000,000 | | | | 1,053,750 | | | | 0.40 | % |
| Goldcorp, Inc. (b) | | | | | | | | | | | | |
| 2.125%, 03/15/2018 | | | 1,250,000 | | | | 1,251,201 | | | | 0.47 | % |
| 3.625%, 06/09/2021 | | | 750,000 | | | | 777,704 | | | | 0.29 | % |
| Newmont Mining Corp., 3.500%, 03/15/2022 | | | 1,000,000 | | | | 1,033,334 | | | | 0.39 | % |
| Rio Tinto Finance USA Ltd., 3.750%, 06/15/2025 (b) | | | 1,000,000 | | | | 1,057,028 | | | | 0.40 | % |
| The Dow Chemical Co., 4.250%, 11/15/2020 | | | 1,000,000 | | | | 1,049,926 | | | | 0.39 | % |
| | | | | | | | 6,222,943 | | | | 2.34 | % |
| | | | | | | | | | | | | |
| Telecommunication Services – 2.06% | | | | | | | | | | | | |
| AT&T, Inc. | | | | | | | | | | | | |
| 3.000%, 02/15/2022 | | | 1,000,000 | | | | 1,012,565 | | | | 0.38 | % |
| 5.350%, 09/01/2040 | | | 200,000 | | | | 207,604 | | | | 0.08 | % |
| 5.800%, 02/15/2019 | | | 800,000 | | | | 838,804 | | | | 0.31 | % |
| Deutsche Telekom AG, 6.000%, 07/08/2019 (b) | | | 1,160,000 | | | | 1,237,418 | | | | 0.46 | % |
The accompanying notes are an integral part of these financial statements.
| CORPORATE BONDS | | Par | | | | | | % of | |
| | | Amount | | | Value | | | Net Assets | |
| Telecommunication Services (Continued) | | | | | | | | | |
| Verizon Communications, Inc., 2.450%, 11/01/2022 | | | 1,200,000 | | | $ | 1,192,716 | | | | 0.45 | % |
| Vodafone Group PLC, 1.500%, 02/19/2018 (b) | | | 1,000,000 | | | | 999,602 | | | | 0.38 | % |
| | | | | | | | 5,488,709 | | | | 2.06 | % |
| Total Corporate Bonds | | | | | | | | | | | | |
| (Cost $63,389,050) | | | | | | | 64,846,633 | | | | 24.37 | % |
| | | | | | | | | | | | | |
| MORTGAGE BACKED SECURITIES – 5.61% | | | | | | | | | | | | |
| Federal Home Loan Mortgage Corp. | | | | | | | | | | | | |
| 1.500%, 10/15/2042 | | | 123,371 | | | | 121,063 | | | | 0.05 | % |
| 2.000%, 10/27/2023 (g) | | | 1,200,000 | | | | 1,195,035 | | | | 0.45 | % |
| 2.000%, 10/15/2043 | | | 116,654 | | | | 114,580 | | | | 0.04 | % |
| 2.500%, 08/15/2040 | | | 377,390 | | | | 378,544 | | | | 0.14 | % |
| 2.750%, 01/15/2041 | | | 92,899 | | | | 93,170 | | | | 0.03 | % |
| 3.000%, 05/01/2042 | | | 1,011,322 | | | | 1,018,028 | | | | 0.38 | % |
| 3.000%, 05/15/2043 | | | 358,622 | | | | 364,553 | | | | 0.14 | % |
| 3.000%, 09/01/2042 | | | 2,016,243 | | | | 2,029,820 | | | | 0.76 | % |
| 3.000%, 09/15/2039 | | | 367,461 | | | | 367,755 | | | | 0.14 | % |
| 5.000%, 05/01/2020 | | | 31,305 | | | | 32,108 | | | | 0.01 | % |
| 5.500%, 04/01/2037 | | | 88,655 | | | | 99,856 | | | | 0.04 | % |
| Federal National Mortgage Association | | | | | | | | | | | | |
| 1.250%, 06/25/2043 | | | 195,271 | | | | 182,381 | | | | 0.07 | % |
| 1.500%, 08/10/2021 | | | 1,000,000 | | | | 978,846 | | | | 0.37 | % |
| 1.500%, 03/30/2026 (g) | | | 1,200,000 | | | | 1,196,946 | | | | 0.45 | % |
| 1.500%, 04/18/2028 (g) | | | 1,000,000 | | | | 990,920 | | | | 0.37 | % |
| 2.000%, 11/25/2040 | | | 173,706 | | | | 171,704 | | | | 0.07 | % |
| 2.000%, 11/25/2041 | | | 140,773 | | | | 137,979 | | | | 0.05 | % |
| 2.250%, 03/25/2039 | | | 138,018 | | | | 138,045 | | | | 0.05 | % |
| 3.000%, 10/01/2043 | | | 2,880,417 | | | | 2,897,965 | | | | 1.09 | % |
| 3.500%, 01/01/2042 | | | 566,515 | | | | 585,190 | | | | 0.22 | % |
| 4.000%, 10/01/2041 | | | 692,379 | | | | 730,095 | | | | 0.27 | % |
| 4.000%, 12/01/2041 | | | 592,127 | | | | 624,289 | | | | 0.24 | % |
| 4.500%, 08/01/2020 | | | 33,251 | | | | 33,996 | | | | 0.01 | % |
| 6.000%, 10/01/2037 | | | 132,446 | | | | 150,056 | | | | 0.06 | % |
| Government National Mortgage Association, 1.750%, 02/16/2043 | | | 303,137 | | | | 295,677 | | | | 0.11 | % |
| | | | | | | | | | | | | |
| Total Mortgage Backed Securities | | | | | | | | | | | | |
| (Cost $14,928,285) | | | | | | | 14,928,601 | | | | 5.61 | % |
| | | | | | | | | | | | | |
| U.S. TREASURY OBLIGATIONS – 2.49% | | | | | | | | | | | | |
| | | | | | | | | | | | | |
| U.S. Treasury Bonds – 0.57% | | | | | | | | | | | | |
| U.S. Treasury Bonds, 3.625%, 02/15/2044 | | | 1,325,000 | | | | 1,518,264 | | | | 0.57 | % |
The accompanying notes are an integral part of these financial statements.
| HENNESSY FUNDS | 1-800-966-4354 | |
| U.S. TREASURY OBLIGATIONS | | Par | | | | | | % of | |
| | | Amount | | | Value | | | Net Assets | |
| U.S. Treasury Notes – 1.92% | | | | | | | | | |
| U.S. Treasury Notes | | | | | | | | | |
| 1.375%, 01/15/2020 | | | 1,000,000 | | | $ | 994,414 | | | | 0.37 | % |
| 1.625%, 02/15/2026 | | | 1,200,000 | | | | 1,137,351 | | | | 0.43 | % |
| 1.875%, 01/31/2022 | | | 1,500,000 | | | | 1,496,338 | | | | 0.56 | % |
| 2.250%, 02/15/2027 | | | 1,500,000 | | | | 1,485,762 | | | | 0.56 | % |
| | | | | | | | 5,113,865 | | | | 1.92 | % |
| Total U.S. Treasury Obligations | | | | | | | | | | | | |
| (Cost $6,694,729) | | | | | | | 6,632,129 | | | | 2.49 | % |
| | | | | | | | | | | | | |
| U.S. GOVERNMENT AGENCY ISSUES – 0.75% | | | | | | | | | | | | |
| | | | | | | | | | | | | |
| Finance and Insurance – 0.75% | | | | | | | | | | | | |
| Federal Home Loan Banks | | | | | | | | | | | | |
| 1.250%, 10/17/2031 (g) | | | 1,250,000 | | | | 1,212,277 | | | | 0.46 | % |
| 2.750%, 07/11/2031 | | | 800,000 | | | | 772,541 | | | | 0.29 | % |
| | | | | | | | 1,984,818 | | | | 0.75 | % |
| Total U.S. Government Agency Issues | | | | | | | | | | | | |
| (Cost $2,006,439) | | | | | | | 1,984,818 | | | | 0.75 | % |
| | | | | | | | | | | | | |
| INVESTMENT COMPANIES (EXCLUDING | | | | | | | | | | | | |
| MONEY MARKET FUNDS) – 1.11% | | | | | | | | | | | | |
| Apollo Investment Corp. | | | 24,425 | | | | 144,596 | | | | 0.06 | % |
| Ares Capital Corp. | | | 9,500 | | | | 152,760 | | | | 0.06 | % |
| FS Investment Corp. | | | 19,150 | | | | 150,327 | | | | 0.06 | % |
| Gladstone Capital Corp. | | | 15,750 | | | | 153,405 | | | | 0.06 | % |
| Guggenheim Credit Allocation Fund | | | 34,000 | | | | 769,420 | | | | 0.29 | % |
| Hercules Capital, Inc. | | | 13,000 | | | | 162,110 | | | | 0.06 | % |
| Main Street Capital Corp. | | | 3,975 | | | | 159,676 | | | | 0.06 | % |
| Monroe Capital Corp. | | | 10,250 | | | | 149,650 | | | | 0.05 | % |
| New Mountain Finance Corp. | | | 10,675 | | | | 149,984 | | | | 0.06 | % |
| SPDR Barclays Capital High Yield Bond | | | 1,000 | | | | 37,240 | | | | 0.01 | % |
| SPDR Barclays Short Term High Yield | | | 4,000 | | | | 111,680 | | | | 0.04 | % |
| TPG Specialty Lending, Inc. | | | 7,525 | | | | 153,811 | | | | 0.06 | % |
| Triangle Capital Corp. | | | 10,000 | | | | 123,100 | | | | 0.04 | % |
| Vanguard High-Yield Corporate Fund | | | 89,820 | | | | 536,226 | | | | 0.20 | % |
| | | | | | | | | | | | | |
| Total Investment Companies (Excluding | | | | | | | | | | | | |
| Money Market Funds) | | | | | | | | | | | | |
| (Cost $3,015,283) | | | | | | | 2,953,985 | | | | 1.11 | % |
The accompanying notes are an integral part of these financial statements.
| SHORT-TERM INVESTMENTS – 1.76% | | Number | | | | | | % of | |
| | | of Shares | | | Value | | | Net Assets | |
| Money Market Funds – 1.76% | | | | | | | | | |
| Fidelity Government Portfolio, Institutional Class, 0.92% (c) | | | 4,695,401 | | | $ | 4,695,401 | | | | 1.76 | % |
| | | | | | | | | | | | | |
| Total Short-Term Investments | | | | | | | | | | | | |
| (Cost $4,695,401) | | | | | | | 4,695,401 | | | | 1.76 | % |
| | | | | | | | | | | | | |
| Total Investments | | | | | | | | | | | | |
| (Cost $230,083,649) – 100.26% | | | | | | | 266,762,204 | | | | 100.26 | % |
| Liabilities in Excess of Other Assets – (0.26)% | | | | | | | (698,847 | ) | | | (0.26 | )% |
TOTAL NET ASSETS – 100.00% | | | | | | $ | 266,063,357 | | | | 100.00 | % |
Percentages are stated as a percent of net assets.
REIT – Real Estate Investment Trust
| (a) | Non-income producing security. |
| (b) | U.S. traded security of a foreign corporation. |
| (c) | The rate listed is the fund’s 7-day yield as of October 31, 2017. |
| (d) | Investment in affiliated security. Quasar Distributors, LLC, which serves as the Fund’s distributor, is a subsidiary of U.S. Bancorp. Details of transactions with this affiliated company for the year ended October 31, 2017, are as follows: |
| | Issuer | | U.S. Bancorp | | |
| | Beginning Cost | | $ | 114,807 | | |
| | Purchase Cost | | $ | 93,213 | | |
| | Sales Cost | | $ | (114,807 | ) | |
| | Ending Cost | | $ | 93,213 | | |
| | Dividend Income | | $ | 5,146 | | |
| | Net Change in | | | | | |
| | Unrealized Appreciation | | $ | (892 | ) | |
| | Realized Loss | | $ | (3,207 | ) | |
| | Shares | | | 3,240 | | |
| | Market Value | | $ | 93,247 | | |
| (e) | Rule 144A security. The Fund’s Advisor has deemed this security to be liquid based upon procedures approved by the Board of Trustees. As of October 31, 2017, the market value of this security totaled $1,338,390, which represents 0.50% of net assets. |
| (f) | Variable rate security; rate disclosed is the current rate as of October 31, 2017. |
| (g) | Step-up bond; rate disclosed is the current rate as of October 31, 2017. |
The accompanying notes are an integral part of these financial statements.
| HENNESSY FUNDS | 1-800-966-4354 | |
Summary of Fair Value Exposure at October 31, 2017
The following is a summary of the inputs used to value the Fund’s net assets as of October 31, 2017 (see Note 3 in the accompanying notes to the financial statements):
| Common Stocks | | Level 1 | | | Level 2 | | | Level 3 | | | Total | |
| Consumer Discretionary | | $ | 35,515,486 | | | $ | — | | | $ | — | | | $ | 35,515,486 | |
| Consumer Staples | | | 8,967,124 | | | | — | | | | — | | | | 8,967,124 | |
| Energy | | | 3,827,963 | | | | — | | | | — | | | | 3,827,963 | |
| Financials | | | 40,609,692 | | | | — | | | | — | | | | 40,609,692 | |
| Health Care | | | 14,397,661 | | | | — | | | | — | | | | 14,397,661 | |
| Industrials | | | 26,570,539 | | | | — | | | | — | | | | 26,570,539 | |
| Information Technology | | | 26,902,113 | | | | — | | | | — | | | | 26,902,113 | |
| Materials | | | 5,056,926 | | | | — | | | | — | | | | 5,056,926 | |
| Telecommunication Services | | | 2,592,065 | | | | — | | | | — | | | | 2,592,065 | |
| Total Common Stocks | | $ | 164,439,569 | | | $ | — | | | $ | — | | | $ | 164,439,569 | |
| Preferred Stocks | | | | | | | | | | | | | | | | |
| Consumer Staples | | $ | 211,437 | | | $ | — | | | $ | — | | | $ | 211,437 | |
| Financials | | | 4,499,888 | | | | — | | | | — | | | | 4,499,888 | |
| Telecommunication Services | | | 135,521 | | | | — | | | | — | | | | 135,521 | |
| Utilities | | | 220,934 | | | | — | | | | — | | | | 220,934 | |
| Total Preferred Stocks | | $ | 5,067,780 | | | $ | — | | | $ | — | | | $ | 5,067,780 | |
| REITS | | | | | | | | | | | | | | | | |
| Financials | | $ | 1,213,288 | | | $ | — | | | $ | — | | | $ | 1,213,288 | |
| Total REITS | | $ | 1,213,288 | | | $ | — | | | $ | — | | | $ | 1,213,288 | |
| Corporate Bonds | | | | | | | | | | | | | | | | |
| Consumer Staples | | $ | — | | | $ | 3,380,702 | | | $ | — | | | $ | 3,380,702 | |
| Energy | | | — | | | | 4,657,718 | | | | — | | | | 4,657,718 | |
| Financials | | | — | | | | 34,883,898 | | | | — | | | | 34,883,898 | |
| Health Care | | | — | | | | 7,953,903 | | | | — | | | | 7,953,903 | |
| Information Technology | | | — | | | | 2,258,760 | | | | — | | | | 2,258,760 | |
| Materials | | | — | | | | 6,222,943 | | | | — | | | | 6,222,943 | |
| Telecommunication Services | | | — | | | | 5,488,709 | | | | — | | | | 5,488,709 | |
| Total Corporate Bonds | | $ | — | | | $ | 64,846,633 | | | $ | — | | | $ | 64,846,633 | |
| Mortgage Backed Securities | | $ | — | | | $ | 14,928,601 | | | $ | — | | | $ | 14,928,601 | |
| U.S. Treasury Obligations | | | | | | | | | | | | | | | | |
| U.S. Treasury Bonds | | $ | — | | | $ | 1,518,264 | | | $ | — | | | $ | 1,518,264 | |
| U.S. Treasury Notes | | | — | | | | 5,113,865 | | | | — | | | | 5,113,865 | |
| Total U.S. Treasury Obligations | | $ | — | | | $ | 6,632,129 | | | $ | — | | | $ | 6,632,129 | |
| U.S. Government Agency Issues | | $ | — | | | $ | 1,984,818 | | | $ | — | | | $ | 1,984,818 | |
| Investment Companies (Excluding | | | | | | | | | | | | | | | | |
| Money Market Funds) | | $ | 2,953,985 | | | $ | — | | | $ | — | | | $ | 2,953,985 | |
| Short-Term Investments | | | | | | | | | | | | | | | | |
| Money Market Funds | | $ | 4,695,401 | | | $ | — | | | $ | — | | | $ | 4,695,401 | |
| Total Short-Term Investments | | $ | 4,695,401 | | | $ | — | | | $ | — | | | $ | 4,695,401 | |
| Total Investments | | $ | 178,370,023 | | | $ | 88,392,181 | | | $ | — | | | $ | 266,762,204 | |
Transfers between levels are recognized at the end of the reporting period. During the year ended October 31, 2017, the Fund recognized no transfers between levels.
The accompanying notes are an integral part of these financial statements.
| SCHEDULE OF INVESTMENTS/STATEMENT OF ASSETS AND LIABILITIES |
Financial Statements
Statement of Assets and Liabilities as of October 31, 2017 |
| ASSETS: | | | |
| Investments in unaffiliated securities, at value (cost $229,990,436) | | $ | 266,668,957 | |
| Investments in affiliated securities, at value (cost $93,213) | | | 93,247 | |
| Total Investments in securities, at value (cost $230,083,649) | | | 266,762,204 | |
| Dividends and interest receivable | | | 885,297 | |
| Receivable for fund shares sold | | | 96,156 | |
| Receivable for securities sold | | | 307,620 | |
| Prepaid expenses and other assets | | | 24,646 | |
| Total Assets | | | 268,075,923 | |
| | | | | |
| LIABILITIES: | | | | |
| Payable for securities purchased | | | 1,300,754 | |
| Payable for fund shares redeemed | | | 341,802 | |
| Payable to advisor | | | 182,607 | |
| Payable to administrator | | | 46,282 | |
| Payable to auditor | | | 20,697 | |
| Accrued distribution fees | | | 24,582 | |
| Accrued service fees | | | 13,389 | |
| Accrued trustees fees | | | 5,572 | |
| Accrued expenses and other payables | | | 76,881 | |
| Total Liabilities | | | 2,012,566 | |
| NET ASSETS | | $ | 266,063,357 | |
| | | | | |
| NET ASSETS CONSIST OF: | | | | |
| Capital stock | | $ | 215,876,411 | |
| Accumulated net investment income | | | 103,437 | |
| Accumulated net realized gain on investments | | | 13,404,954 | |
| Unrealized net appreciation on investments | | | 36,678,555 | |
| Total Net Assets | | $ | 266,063,357 | |
| | | | | |
| NET ASSETS | | | | |
| Investor Class: | | | | |
| Shares authorized (no par value) | | Unlimited | |
| Net assets applicable to outstanding Investor Class shares | | $ | 155,328,073 | |
| Shares issued and outstanding | | | 9,565,337 | |
| Net asset value, offering price and redemption price per share | | $ | 16.24 | |
| | | | | |
| Institutional Class: | | | | |
| Shares authorized (no par value) | | Unlimited | |
| Net assets applicable to outstanding Institutional Class shares | | $ | 110,735,284 | |
| Shares issued and outstanding | | | 7,220,704 | |
| Net asset value, offering price and redemption price per share | | $ | 15.34 | |
The accompanying notes are an integral part of these financial statements.
| HENNESSY FUNDS | 1-800-966-4354 | |
Financial Statements
Statement of Operations for the year ended October 31, 2017 |
| INVESTMENT INCOME: | | | |
| Dividend income from unaffiliated securities | | $ | 3,556,928 | |
| Dividend income from affiliated securities | | | 5,146 | |
| Interest income | | | 2,866,501 | |
| Total investment income | | | 6,428,575 | |
| | | | | |
| EXPENSES: | | | | |
| Investment advisory fees (See Note 5) | | | 2,333,910 | |
| Sub-transfer agent expenses – Investor Class (See Note 5) | | | 392,383 | |
| Sub-transfer agent expenses – Institutional Class (See Note 5) | | | 106,752 | |
| Administration, fund accounting, custody and transfer agent fees (See Note 5) | | | 278,754 | |
| Distribution fees – Investor Class (See Note 5) | | | 264,451 | |
| Service fees – Investor Class (See Note 5) | | | 176,301 | |
| Federal and state registration fees | | | 41,428 | |
| Compliance expense (See Note 5) | | | 28,705 | |
| Reports to shareholders | | | 28,399 | |
| Audit fees | | | 20,699 | |
| Trustees’ fees and expenses | | | 17,044 | |
| Legal fees | | | 3,001 | |
| Interest expense (See Note 7) | | | 2,820 | |
| Other expenses | | | 25,023 | |
| Total expenses | | | 3,719,670 | |
| NET INVESTMENT INCOME | | $ | 2,708,905 | |
| | | | | |
| REALIZED AND UNREALIZED GAINS (LOSSES): | | | | |
| Net realized gain (loss) on: | | | | |
| Unaffiliated investments | | $ | 18,197,100 | |
| Affiliated investments | | | (3,207 | ) |
| Net change in unrealized appreciation on: | | | | |
| Unaffiliated investments | | | 19,387,963 | |
| Affiliated investments | | | (892 | ) |
| Net gain on investments | | | 37,580,964 | |
| NET INCREASE IN NET ASSETS RESULTING FROM OPERATIONS | | $ | 40,289,869 | |
The accompanying notes are an integral part of these financial statements.
| STATEMENT OF OPERATIONS/STATEMENTS OF CHANGES IN NET ASSETS |
Financial Statements
| Statements of Changes in Net Assets |
| | | Year Ended | | | Year Ended | |
| | | October 31, 2017 | | | October 31, 2016 | |
| OPERATIONS: | | | | | | |
| Net investment income | | $ | 2,708,905 | | | $ | 3,914,804 | |
| Net realized gain on investments | | | 18,193,893 | | | | 26,643,967 | |
| Net change in unrealized appreciation on investments | | | 19,387,071 | | | | (30,923,043 | ) |
| Net increase (decrease) in net assets | | | | | | | | |
| resulting from operations | | | 40,289,869 | | | | (364,272 | ) |
| | | | | | | | | |
| DISTRIBUTIONS TO SHAREHOLDERS FROM: | | | | | | | | |
| Net investment income – Investor Class | | | (1,353,800 | ) | | | (2,087,209 | ) |
| Net investment income – Institutional Class | | | (1,431,025 | ) | | | (1,972,744 | ) |
| Net realized gains – Investor Class | | | (16,086,706 | ) | | | (6,952,737 | ) |
| Net realized gains – Institutional Class | | | (10,462,912 | ) | | | (3,988,610 | ) |
| Total distributions | | | (29,334,443 | ) | | | (15,001,300 | ) |
| | | | | | | | | |
| CAPITAL SHARE TRANSACTIONS: | | | | | | | | |
| Proceeds from shares subscribed – Investor Class | | | 8,054,934 | | | | 30,705,146 | |
| Proceeds from shares subscribed – Institutional Class | | | 20,836,993 | | | | 27,173,057 | |
| Dividends reinvested – Investor Class | | | 17,017,145 | | | | 8,885,747 | |
| Dividends reinvested – Institutional Class | | | 9,255,346 | | | | 4,372,535 | |
| Cost of shares redeemed – Investor Class | | | (78,489,456 | ) | | | (120,741,346 | ) |
| Cost of shares redeemed – Institutional Class | | | (53,524,682 | ) | | | (64,754,302 | ) |
| Net decrease in net assets derived | | | | | | | | |
| from capital share transactions | | | (76,849,720 | ) | | | (114,359,163 | ) |
| TOTAL DECREASE IN NET ASSETS | | | (65,894,294 | ) | | | (129,724,735 | ) |
| | | | | | | | | |
| NET ASSETS: | | | | | | | | |
| Beginning of year | | | 331,957,651 | | | | 461,682,386 | |
| End of year | | $ | 266,063,357 | | | $ | 331,957,651 | |
| Undistributed net investment income, end of year | | $ | 103,437 | | | $ | 129,004 | |
| | | | | | | | | |
| CHANGES IN SHARES OUTSTANDING: | | | | | | | | |
| Shares sold – Investor Class | | | 516,776 | | | | 1,962,156 | |
| Shares sold – Institutional Class | | | 1,415,138 | | | | 1,843,177 | |
| Shares issued to holders as reinvestment | | | | | | | | |
| of dividends – Investor Class | | | 1,128,293 | | | | 567,440 | |
| Shares issued to holders as reinvestment | | | | | | | | |
| of dividends – Institutional Class | | | 648,210 | | | | 294,768 | |
| Shares redeemed – Investor Class | | | (5,022,332 | ) | | | (7,724,036 | ) |
| Shares redeemed – Institutional Class | | | (3,644,868 | ) | | | (4,386,391 | ) |
| Net decrease in shares outstanding | | | (4,958,783 | ) | | | (7,442,886 | ) |
The accompanying notes are an integral part of these financial statements.
| HENNESSY FUNDS | 1-800-966-4354 | |
Financial Statements
For an Investor Class share outstanding throughout each year
PER SHARE DATA:
Net asset value, beginning of year
Income from investment operations:
Net investment income
Net realized and unrealized gains (losses) on investments
Total from investment operations
Less distributions:
Dividends from net investment income
Dividends from net realized gains
Total distributions
Net asset value, end of year
TOTAL RETURN
SUPPLEMENTAL DATA AND RATIOS:
Net assets, end of period (millions)
Ratio of expenses to average net assets:
Before expense reimbursement
After expense reimbursement
Ratio of net investment income to average net assets:
Before expense reimbursement
After expense reimbursement
Portfolio turnover rate(1)
(1) | Portfolio turnover is calculated on the basis of the Fund as a whole. |
The accompanying notes are an integral part of these financial statements.
| FINANCIAL HIGHLIGHTS — INVESTOR CLASS |
| Year Ended October 31, | | |
| 2017 | | | 2016 | | | 2015 | | | 2014 | | | 2013 | | |
| | | | | | | | | | | | | | | |
| $ | 15.61 | | | $ | 16.15 | | | $ | 16.68 | | | $ | 15.77 | | | $ | 13.96 | | |
| | | | | | | | | | | | | | | | | | | | |
| | | | | | | | | | | | | | | | | | | | |
| | 0.14 | | | | 0.14 | | | | 0.13 | | | | 0.16 | | | | 0.23 | | |
| | 1.95 | | | | (0.16 | ) | | | 0.11 | | | | 1.41 | | | | 1.81 | | |
| | 2.09 | | | | (0.02 | ) | | | 0.24 | | | | 1.57 | | | | 2.04 | | |
| | | | | | | | | | | | | | | | | | | | |
| | | | | | | | | | | | | | | | | | | | |
| | (0.12 | ) | | | (0.13 | ) | | | (0.13 | ) | | | (0.16 | ) | | | (0.23 | ) | |
| | (1.34 | ) | | | (0.39 | ) | | | (0.64 | ) | | | (0.50 | ) | | | — | | |
| | (1.46 | ) | | | (0.52 | ) | | | (0.77 | ) | | | (0.66 | ) | | | (0.23 | ) | |
| $ | 16.24 | | | $ | 15.61 | | | $ | 16.15 | | | $ | 16.68 | | | $ | 15.77 | | |
| | | | | | | | | | | | | | | | | | | | |
| | 14.16 | % | | | (0.12 | )% | | | 1.43 | % | | | 10.28 | % | | | 14.72 | % | |
| | | | | | | | | | | | | | | | | | | | |
| | | | | | | | | | | | | | | | | | | | |
| $ | 155.33 | | | $ | 202.04 | | | $ | 292.84 | | | $ | 284.45 | | | $ | 233.25 | | |
| | | | | | | | | | | | | | | | | | | | |
| | 1.43 | % | | | 1.43 | % | | | 1.38 | % | | | 1.33 | % | | | 1.36 | % | |
| | 1.43 | % | | | 1.43 | % | | | 1.38 | % | | | 1.33 | % | | | 1.33 | % | |
| | | | | | | | | | | | | | | | | | | | |
| | 0.78 | % | | | 0.84 | % | | | 0.83 | % | | | 1.01 | % | | | 1.51 | % | |
| | 0.78 | % | | | 0.84 | % | | | 0.83 | % | | | 1.01 | % | | | 1.54 | % | |
| | 15 | % | | | 24 | % | | | 39 | % | | | 28 | % | | | 52 | % | |
The accompanying notes are an integral part of these financial statements.
| HENNESSY FUNDS | 1-800-966-4354 | |
Financial Statements
For an Institutional Class share outstanding throughout each year
PER SHARE DATA:
Net asset value, beginning of year
Income from investment operations:
Net investment income
Net realized and unrealized gains (losses) on investments
Total from investment operations
Less distributions:
Dividends from net investment income
Dividends from net realized gains
Total distributions
Net asset value, end of year
TOTAL RETURN
SUPPLEMENTAL DATA AND RATIOS:
Net assets, end of year (millions)
Ratio of expenses to average net assets
Ratio of net investment income to average net assets
Portfolio turnover rate(1)
(1) | Portfolio turnover is calculated on the basis of the Fund as a whole. |
The accompanying notes are an integral part of these financial statements.
| FINANCIAL HIGHLIGHTS — INSTITUTIONAL CLASS |
| Year Ended October 31, | | |
| 2017 | | | 2016 | | | 2015 | | | 2014 | | | 2013 | | |
| | | | | | | | | | | | | | | |
| $ | 14.76 | | | $ | 15.28 | | | $ | 15.80 | | | $ | 14.97 | | | $ | 13.29 | | |
| | | | | | | | | | | | | | | | | | | | |
| | | | | | | | | | | | | | | | | | | | |
| | 0.16 | | | | 0.18 | | | | 0.19 | | | | 0.20 | | | | 0.25 | | |
| | 1.87 | | | | (0.13 | ) | | | 0.09 | | | | 1.33 | | | | 1.72 | | |
| | 2.03 | | | | 0.05 | | | | 0.28 | | | | 1.53 | | | | 1.97 | | |
| | | | | | | | | | | | | | | | | | | | |
| | | | | | | | | | | | | | | | | | | | |
| | (0.18 | ) | | | (0.20 | ) | | | (0.19 | ) | | | (0.20 | ) | | | (0.29 | ) | |
| | (1.27 | ) | | | (0.37 | ) | | | (0.61 | ) | | | (0.50 | ) | | | — | | |
| | (1.45 | ) | | | (0.57 | ) | | | (0.80 | ) | | | (0.70 | ) | | | (0.29 | ) | |
| $ | 15.34 | | | $ | 14.76 | | | $ | 15.28 | | | $ | 15.80 | | | $ | 14.97 | | |
| | | | | | | | | | | | | | | | | | | | |
| | 14.60 | % | | | 0.30 | % | | | 1.75 | % | | | 10.60 | % | | | 14.99 | % | |
| | | | | | | | | | | | | | | | | | | | |
| | | | | | | | | | | | | | | | | | | | |
| $ | 110.74 | | | $ | 129.91 | | | $ | 168.84 | | | $ | 102.10 | | | $ | 85.12 | | |
| | 1.05 | % | | | 1.03 | % | | | 1.04 | % | | | 1.05 | % | | | 1.06 | % | |
| | 1.16 | % | | | 1.23 | % | | | 1.18 | % | | | 1.29 | % | | | 1.95 | % | |
| | 15 | % | | | 24 | % | | | 39 | % | | | 28 | % | | | 52 | % | |
The accompanying notes are an integral part of these financial statements.
| HENNESSY FUNDS | 1-800-966-4354 | |
Financial Statements
Notes to the Financial Statements October 31, 2017 |
1). ORGANIZATION
The Hennessy Equity and Income Fund (the “Fund”) is a series of Hennessy Funds Trust (the “Trust”), which was organized as a Delaware statutory trust on September 17, 1992. The Fund is an open-end management investment company registered under the Investment Company Act of 1940, as amended. The investment objective of the Fund is long-term capital growth and current income. The Fund is a diversified fund.
The Fund offers Investor Class and Institutional Class shares. Each class of shares differs principally in its respective 12b-1 distribution and service, shareholder servicing, and sub-transfer agent expenses. There are no sales charges. Each class has identical rights to earnings, assets, and voting privileges, except for class-specific expenses and exclusive rights to vote on matters affecting only an individual class.
As an investment company, the Fund follows the investment company accounting and reporting guidance of the Financial Accounting Standards Board (“FASB”) Accounting Standard Codification Topic 946 “Financial Services—Investment Companies.”
2). SIGNIFICANT ACCOUNTING POLICIES
The following is a summary of significant accounting policies consistently followed by the Fund in the preparation of the financial statements. These policies conform to U.S. generally accepted accounting principles (“GAAP”).
| a). | Investment Valuation – All investments in securities are recorded at their estimated fair value, as described in Note 3. |
| b). | Federal Income Taxes – No provision for federal income taxes or excise taxes has been made because the Fund has elected to be taxed as a “regulated investment company” and intends to distribute substantially all of its taxable income to its shareholders and otherwise comply with the provisions of the Internal Revenue Code of 1986, as amended, applicable to regulated investment companies. Net investment income/loss and realized gains/losses for federal income tax purposes may differ from those reported in the financial statements because of temporary book and tax basis differences. Temporary differences are primarily the result of the treatment of wash sales for tax reporting purposes. The Fund recognizes interest and penalties related to income tax benefits, if any, in the Statement of Operations as an income tax expense. Distributions from net realized gains for book purposes may include short-term capital gains, which are included as ordinary income to shareholders for tax purposes. The Fund may utilize equalization accounting for tax purposes and designate earnings and profits, including net realized gains distributed to shareholders on redemption of shares, as part of the dividends paid deduction for income tax purposes. |
| | Due to inherent differences in the recognition of income, expenses, and realized gains/losses under GAAP and federal income tax regulations, permanent differences between book and tax basis for reporting for fiscal year 2017 have been identified and appropriately reclassified in the Statement of Assets and Liabilities. The adjustments are as follows: |
| | Accumulated | Accumulated | | |
| | Net Investment | Net Realized | | |
| | Income | Gain on Investments | Capital Stock | |
| | $50,353 | $(4,730,910) | $4,680,557 | |
| NOTES TO THE FINANCIAL STATEMENTS |
| c). | Accounting for Uncertainty in Income Taxes – The Fund has accounting policies regarding recognition and measurement of tax positions taken or expected to be taken on a tax return. The tax returns of the Fund for the prior three fiscal years are open for examination. The Fund has reviewed all open tax years in major jurisdictions and concluded that there is no impact on the Fund’s net assets and no tax liability resulting from unrecognized tax benefits relating to uncertain income tax positions taken or expected to be taken on a tax return. The Fund’s major tax jurisdictions are U.S. federal and Delaware. |
| d). | Income and Expenses – Dividend income is recognized on the ex-dividend date or as soon as information is available to the Fund. Interest income, which includes the amortization of premium and accretion of discount, is recognized on an accrual basis. The Fund is charged for those expenses that are directly attributable to the portfolio, such as advisory, administration, and certain shareholder service fees. Income, expenses (other than expenses attributable to a specific class), and realized and unrealized gains/losses on investments are allocated to each class of shares based on such class’s net assets. |
| e). | Distributions to Shareholders – Dividends from net investment income for the Fund, if any, are declared and paid at the end of each calendar quarter. Distributions of net realized capital gains, if any, are declared and paid annually, usually in December. |
| f). | Security Transactions – Investment and shareholder transactions are recorded on the trade date. The Fund determines the realized gain/loss from an investment transaction by comparing the original cost of the security lot sold with the net sale proceeds. Discounts and premiums on securities purchased are accreted/amortized over the life of the respective security. |
| g). | Use of Estimates – The preparation of financial statements in conformity with GAAP requires management to make estimates and assumptions that affect the reported amounts of assets and liabilities and disclosure of contingent assets and liabilities at the date of the financial statements and the reported change in net assets during the reporting period. Actual results could differ from those estimates. |
| h). | Share Valuation – The net asset value (“NAV”) per share of the Fund is calculated by dividing (i) the sum of the value of the securities held by the Fund, plus cash or other assets, minus all liabilities (including estimated accrued expenses) by (ii) the total number of shares outstanding for the Fund, rounded to the nearest cent. The Fund’s shares will not be priced on days the New York Stock Exchange is closed for trading. The offering and redemption price per share for the Fund is equal to the Fund’s NAV per share. |
3). SECURITIES VALUATION
The Fund follows authoritative fair valuation accounting standards that establish an authoritative definition of fair value and set out a hierarchy for measuring fair value. These standards require additional disclosures about the various inputs and valuation techniques used to develop the measurements of fair value and a discussion of changes in valuation techniques and related inputs during the period. These inputs are summarized in the three broad levels listed below:
| | Level 1 – | Unadjusted, quoted prices in active markets for identical instruments that the Fund has the ability to access at the date of measurement. |
| | | |
| | Level 2 – | Other significant observable inputs (including, but not limited to, quoted prices in active markets for similar instruments, quoted prices in markets that are not active for identical or similar instruments, and model-derived |
| HENNESSY FUNDS | 1-800-966-4354 | |
| | | valuations in which all significant inputs and significant value drivers are observable in active markets, such as interest rates, prepayment speeds, credit risk curves, default rates, and similar data). |
| | Level 3 – | Significant unobservable inputs (including the Fund’s own assumptions about what market participants would use to price the asset or liability based on the best available information) when observable inputs are unavailable. |
Following is a description of the valuation techniques applied to the Fund’s major categories of assets and liabilities measured at fair value on a recurring basis.
| | Equity Securities – Equity securities, including common stocks, preferred stocks, foreign-issued common stocks, exchange-traded funds, closed-end mutual funds, partnerships, rights, and real estate investment trusts, that are traded on a securities exchange for which a last-quoted sales price is readily available will generally be valued at the last sales price as reported by the primary exchange on which the securities are listed. Securities listed on The NASDAQ Stock Market (“NASDAQ”) will generally be valued at the NASDAQ Official Closing Price, which may differ from the last sales price reported. Securities traded on a securities exchange for which a last-quoted sales price is not readily available will generally be valued at the mean between the bid and ask prices. To the extent these securities are actively traded and valuation adjustments are not applied, they are classified in Level 1 of the fair value hierarchy. Securities traded on foreign exchanges generally are not valued at the same time the Fund calculates its NAV because most foreign markets close well before such time. The earlier close of most foreign markets gives rise to the possibility that significant events, including broad market moves, may have occurred in the interim. In certain circumstances, it may be determined that a security needs to be fair valued because it appears that the value of the security might have been materially affected by events occurring after the close of the market in which the security is principally traded, but before the time the Fund calculates its NAV, such as by a development that affects an entire market or region (e.g., weather-related events) or a potentially global development (e.g., a terrorist attack that may be expected to have an effect on investor expectations worldwide). |
| | Registered Investment Companies – Investments in registered investment companies (e.g., mutual funds) are generally priced at the ending NAV provided by the applicable registered investment company’s service agent and will be classified in Level 1 of the fair value hierarchy. |
| | Debt Securities – Debt securities, including corporate bonds, asset-backed securities, mortgage-backed securities, municipal bonds, U.S. Treasuries, and U.S. government agency issues, are generally valued at market on the basis of valuations furnished by an independent pricing service that utilizes both dealer-supplied valuations and formula-based techniques. The pricing service may consider recently executed transactions in securities of the issuer or comparable issuers, market price quotations (where observable), bond spreads, and fundamental data relating to the issuer. In addition, the model may incorporate observable market data, such as reported sales of similar securities, broker quotes, yields, bids, offers, and reference data. Certain securities are valued primarily using dealer quotations. These securities are generally classified in Level 2 of the fair value hierarchy. |
| | Short-Term Securities – Short-term equity investments, including money market funds, are valued in the manner specified above. Short-term debt investments with an original term to maturity of 60 days or less are valued at amortized cost, which approximates fair market value. If the original term to maturity of a short-term debt |
| NOTES TO THE FINANCIAL STATEMENTS |
| | investment exceeded 60 days, then the values as of the 61st day prior to maturity are amortized. Amortized cost is not used if its use would be inappropriate due to credit or other impairments of the issuer, in which case the security’s fair value would be determined, as described below. Short-term securities are generally classified in Level 1 or Level 2 of the fair market hierarchy depending on the inputs used and market activity levels for specific securities. |
The Board of Trustees of the Fund (the “Board”) has adopted fair value pricing procedures that are followed when a price for a security is not readily available or if a significant event has occurred that indicates the closing price of a security no longer represents the true value of that security. Fair value pricing determinations are made in good faith in accordance with these procedures. There are numerous criteria that will be given consideration in determining a fair value of a security, such as the trading volume of a security and markets, the values of other similar securities, and news events with direct bearing on a security or markets. Fair value pricing results in an estimated price for a security that reflects the amount the Fund might reasonably expect to receive in a current sale. Depending on the relative significance of the valuation inputs, these securities may be classified in either Level 2 or Level 3 of the fair value hierarchy.
The fair valuation of foreign securities may be determined with the assistance of a pricing service using correlations between the movement of prices of such securities and indices of domestic securities and other appropriate indicators, such as closing market prices of relevant American Depositary Receipts or futures contracts. The effect of using fair value pricing is that the Fund’s NAV will reflect the affected portfolio securities’ values as determined by the Board or its designee instead of being determined by the market. Using a fair value pricing methodology to price a foreign security may result in a value that is different from the foreign security’s most recent closing price and from the prices used by other investment companies to calculate their NAVs and are generally classified in Level 2 of the fair valuation hierarchy. Because the Fund may invest in foreign securities, the value of the Fund’s portfolio securities may change on days when you will not be able to purchase or redeem your shares.
The Board has delegated day-to-day valuation matters to a Valuation Committee comprised of one or more representatives from Hennessy Advisors, Inc., the Fund’s investment advisor (the “Advisor”). The function of the Valuation Committee is to value securities where current and reliable market quotations are not readily available. All actions taken by the Valuation Committee are reviewed by the Board.
The Fund has performed an analysis of all existing investments to determine the significance and character of all inputs to their fair value determination. Various inputs are used to determine the value of the Fund’s investments. The inputs or methodology used for valuing securities are not necessarily an indication of the risk associated with investing in those securities. Details related to the fair valuation hierarchy of the Fund’s securities as of October 31, 2017, are included in the Schedule of Investments.
4). INVESTMENT TRANSACTIONS
Purchases and sales of investment securities (excluding government and short-term investments) for the Fund during fiscal year 2017 were $27,518,180 and $125,531,426, respectively.
Purchases and sales/maturities of long-term U.S. government securities for the Fund during fiscal year 2017 were $15,078,565 and $19,862,766, respectively.
| HENNESSY FUNDS | 1-800-966-4354 | |
The Fund is permitted to purchase or sell securities from or to another fund in the Hennessy Funds family of funds (the “Hennessy Funds”) under specified conditions outlined in procedures adopted by the Board. The procedures have been designed to ensure that any purchase or sale of securities by the Fund from or to another Hennessy Fund complies with Rule 17a-7 of the Investment Company Act of 1940, as amended. For fiscal year 2017, the Fund did not engage in purchases or sales of securities pursuant to Rule 17a-7 of the Investment Company Act of 1940, as amended.
5). INVESTMENT MANAGEMENT FEE AND OTHER TRANSACTIONS WITH AFFILIATES
The Advisor provides the Fund with investment management services under an Investment Advisory Agreement. The Advisor provides all investment advice, office space, and facilities, as well as most of the personnel needed by the Fund. As compensation for its services, the Advisor is entitled to a monthly fee from the Fund. The fee is based upon the average daily net assets of the Fund at an annual rate of 0.80%. The net investment advisory fees expensed by the Fund during fiscal year 2017 are included in the Statement of Operations.
The Advisor has delegated the day-to-day management of the equity allocation of the Fund to The London Company of Virginia, LLC and the day-to-day management of the fixed income allocation of the Fund to Financial Counselors, Inc. The Advisor pays the sub-advisory fees from its own assets, and these fees are not an additional expense of the Fund. For the most recent fiscal year, the Advisor (not the Fund) paid a sub-advisory fee, based upon the daily net assets of the Fund, at a rate of 0.33% for the equity allocation and 0.27% for the fixed income allocation.
The Board has approved a Shareholder Servicing Agreement for Investor Class shares of the Fund, which was instituted to compensate the Advisor for the non-investment management services it provides to the Fund. The Shareholder Servicing Agreement provides for a monthly fee paid to the Advisor at an annual rate of 0.10% of the average daily net assets of the Fund attributable to Investor Class shares. The shareholder service fees expensed by the Fund during fiscal year 2017 are included in the Statement of Operations.
The Fund has adopted a plan pursuant to Rule 12b-1 under the Investment Company Act of 1940, as amended, that authorizes payments in connection with the distribution of the Fund’s shares at an annual rate of up to 0.25% of the Fund’s average daily net assets attributable to Investor Class shares. Even though the authorized rate is up to 0.25%, the Fund is currently only using up to 0.15% of its average daily net assets attributable to Investor Class shares for such purpose. Amounts paid under the plan may be spent on any activities or expenses primarily intended to result in the sale of shares, including, but not limited to, advertising, shareholder account servicing, the printing and mailing of prospectuses to other than current shareholders, the printing and mailing of sales literature, and compensation for sales and marketing activities or to financial institutions and others, such as dealers and distributors. The distribution fees expensed by the Fund during fiscal year 2017 are included in the Statement of Operations.
The Fund has entered into agreements with various brokers, dealers, and financial intermediaries in connection with the sale of shares of the Fund. The agreements provide for periodic payments by the Fund to the brokers, dealers, and financial intermediaries for providing certain shareholder maintenance services (sub-transfer agent expenses). These shareholder services include the pre-processing and quality control of new accounts, shareholder correspondence, answering customer inquiries regarding account status, and facilitating shareholder telephone transactions. The sub-transfer agent fees expensed by the Fund during fiscal year 2017 are included in the Statement of Operations.
| NOTES TO THE FINANCIAL STATEMENTS |
U.S. Bancorp Fund Services, LLC (“USBFS”) provides the Fund with administrative, fund accounting, and transfer agent services and necessary office equipment. As administrator, USBFS is responsible for activities such as (i) preparing various federal and state regulatory filings, reports, and returns for the Fund, (ii) preparing reports and materials to be supplied to the Board, (iii) monitoring the activities of the Fund’s custodian, transfer agent, and accountants, and (iv) coordinating the preparation and payment of the Fund’s expenses and reviewing the Fund’s expense accruals. U.S. Bank, N.A., an affiliate of USBFS, serves as the Fund’s custodian. The servicing agreements between the Trust, USBFS, and U.S. Bank N.A. contain a fee schedule that is inclusive of administrative, fund accounting, custody, and transfer agent fees. The administrative, fund accounting, custody, and transfer agent fees expensed by the Fund during fiscal year 2017 are included in the Statement of Operations.
Quasar Distributors, LLC acts as the Fund’s principal underwriter in a continuous public offering of the Fund’s shares. Quasar Distributors, LLC is an affiliate of USBFS and U.S. Bank, N.A.
The officers of the Fund are affiliated with the Advisor. Such officers, with the exception of the Chief Compliance Officer and the Senior Compliance Officer, receive no compensation from the Fund for serving in their respective roles. The Fund, along with the other Hennessy Funds, makes reimbursement payments, on an equal basis, to the Advisor for a portion of the salary and benefits associated with the office of the Chief Compliance Officer and for all of the salary and benefits associated with the office of the Senior Compliance Officer. The compliance fees expensed by the Fund during fiscal year 2017 are included in the Statement of Operations.
6). GUARANTEES AND INDEMNIFICATIONS
Under the Hennessy Funds’ organizational documents, their officers and trustees are indemnified by the Hennessy Funds against certain liabilities arising out of the performance of their duties to the Hennessy Funds. Additionally, in the normal course of business, the Hennessy Funds enter into contracts with service providers that contain general indemnification clauses. The Fund’s maximum exposure under these arrangements is unknown as this would involve future claims that may be made against the Fund that have not yet occurred. Currently, the Fund expects the risk of loss to be remote.
7). LINE OF CREDIT
The Fund has an uncommitted line of credit with the other Hennessy Funds in the amount of the lesser of (i) $100,000,000 or (ii) 33.33% of each Hennessy Fund’s net assets, or 30% for the Hennessy Gas Utility Fund and 10% for the Hennessy Balanced Fund, intended to provide short-term financing, if necessary, subject to certain restrictions, in connection with shareholder redemptions. The credit facility is with the Hennessy Funds’ custodian bank, U.S. Bank, N.A. Borrowings under this arrangement bear interest at the bank’s prime rate and are secured by all of the Fund’s assets (as to its own borrowings only). During fiscal year 2017, the Fund had an outstanding average daily balance and a weighted average interest rate of $78,701 and 3.97%, respectively. The interest expensed by the Fund during fiscal year 2017 is included in the Statement of Operations. The maximum amount outstanding for the Fund during the period was $3,495,000. At October 31, 2017, the Fund did not have any borrowings outstanding under the line of credit.
| HENNESSY FUNDS | 1-800-966-4354 | |
8). FEDERAL TAX INFORMATION
As of October 31, 2017, the components of accumulated earnings (losses) for income tax purposes were as follows:
| | | Investments | |
| Cost of investments for tax purposes | | $ | 230,094,090 | |
| Gross tax unrealized appreciation | | $ | 39,103,812 | |
| Gross tax unrealized depreciation | | | (2,435,698 | ) |
| Net tax unrealized appreciation | | $ | 36,668,114 | |
| Undistributed ordinary income | | $ | 103,437 | |
| Undistributed long-term capital gains | | | 13,415,395 | |
| Total distributable earnings | | $ | 13,518,832 | |
| Other accumulated gain | | $ | — | |
| Total accumulated gain | | $ | 50,186,946 | |
The difference between book-basis unrealized appreciation/depreciation (as shown in the Statement of Assets and Liabilities) and tax-basis unrealized appreciation/depreciation (as shown above) is attributable primarily to wash sales.
At October 31, 2017, the Fund had no tax basis capital losses to offset future capital gains.
At October 31, 2017, the Fund did not defer, on a tax basis, any late-year ordinary losses. Late-year ordinary losses are net ordinary losses incurred after December 31, 2016, but within the taxable year, that are deemed to arise on the first day of the Fund’s next taxable year.
During fiscal years 2017 and 2016, the tax character of distributions paid by the Fund was as follows:
| | | Year Ended | | | Year Ended | |
| | | October 31, 2017 | | | October 31, 2016 | |
Ordinary income(1) | | $ | 2,761,400 | | | $ | 4,059,953 | |
| Long-term capital gain | | | 26,573,043 | | | | 10,941,347 | |
| | | $ | 29,334,443 | | | $ | 15,001,300 | |
(1) Ordinary income includes short-term gain/loss.
9). EVENTS SUBSEQUENT TO YEAR END
Management has evaluated the Fund’s related events and transactions that occurred subsequent to October 31, 2017, through the date of issuance of the Fund’s financial statements. Other than as disclosed below, management has determined that there were no subsequent events requiring recognition or disclosure in the financial statements.
On December 7, 2017, capital gains were declared and paid to shareholders of record on December 6, 2017, as follows:
| | Long-term |
| Investor Class | $0.83721 |
| Institutional Class | $0.79119 |
| NOTES/REPORT OF INDEPENDENT REGISTERED PUBLIC ACCOUNTING FIRM |
Report of Independent Registered Public
Accounting Firm
To the Board of Trustees of Hennessy Funds Trust
and the Shareholders of the Hennessy Equity and Income Fund
Novato, CA
We have audited the accompanying statement of assets and liabilities, including the schedule of investments, of the Hennessy Equity and Income Fund (the “Fund”), a series of Hennessy Funds Trust as of October 31, 2017, and the related statement of operations for the year then ended, the statements of changes in net assets for each of the two years in the period then ended and the financial highlights for each of the five years in the period then ended. These financial statements and financial highlights are the responsibility of the Fund’s management. Our responsibility is to express an opinion on these financial statements and financial highlights based on our audits.
We conducted our audits in accordance with the standards of the Public Company Accounting Oversight Board (United States). Those standards require that we plan and perform the audits to obtain reasonable assurance about whether the financial statements and financial highlights are free of material misstatement. The Fund is not required to have, nor were we engaged to perform, an audit of the Fund’s internal control over financial reporting. Our audits included consideration of internal control over financial reporting as a basis for designing audit procedures that are appropriate in the circumstances, but not for the purposes of expressing an opinion on the effectiveness of the Fund’s internal control over financial reporting. Accordingly, we express no such opinion. An audit includes examining, on a test basis, evidence supporting the amounts and disclosures in the financial statements. Our procedures included confirmation of securities owned as of October 31, 2017, by correspondence with the custodian and brokers. An audit also includes assessing the accounting principles used and significant estimates made by management, as well as evaluating the overall financial statement presentation. We believe that our audits provide a reasonable basis for our opinion.
In our opinion, the financial statements and financial highlights referred to above present fairly, in all material respects, the financial position of the Hennessy Equity and Income Fund as of October 31, 2017, the results of its operations for the year then ended, the changes in its net assets for each of the two years in the period then ended, and the financial highlights for each of the five years in the period then ended, in conformity with accounting principles generally accepted in the United States of America.
TAIT, WELLER & BAKER LLP
Philadelphia, Pennsylvania
December 22, 2017
| HENNESSY FUNDS | 1-800-966-4354 | |
Trustees and Officers of the Fund (Unaudited)
The business and affairs of the Funds are managed under the direction of the Board of Trustees of the Trust, and the Board of Trustees elects the Officers of the Trust. Beginning in March 2015, the Board of Trustees has from time to time appointed advisers to the Board of Trustees (“Advisers”), with the intention of having qualified individuals serve in an advisory capacity in order to garner experience in the mutual fund and asset management industry and be considered as potential Trustees in the future. There are currently three Advisers to the Board of Trustees: Brian Alexander, Doug Franklin, and Claire Knoles. As Advisers, Mr. Alexander, Mr. Franklin, and Ms. Knoles attend meetings of the Board and act as non-voting participants. Information pertaining to the Trustees, Advisers, and the Officers of the Trust is set forth below. The Trustees and Officers serve until their successors are duly elected and qualified or until their earlier death, resignation, or removal. Each of the Trustees oversees 14 Hennessy Funds. Unless otherwise indicated, the address of all persons listed below is 7250 Redwood Boulevard, Suite 200, Novato, CA 94945. The Fund’s Statement of Additional Information includes more information about the persons listed below and is available, without charge, upon request by calling 1-800-966-4354.
| | | | Other |
| | | | Directorships |
| | | | Held Outside |
| Name, (Year of Birth), | | | of Fund |
| and Position Held | Start Date | Principal Occupation(s) | Complex During |
with the Trust | of Service | During Past Five Years | Past Five Years(1) |
| | | |
| Disinterested Trustees and Advisers | | |
| | | | |
| J. Dennis DeSousa | January 1996 | Mr. DeSousa is a real estate investor. | None. |
| (1936) | | | |
| Trustee | | | |
| | | | |
| Robert T. Doyle | January 1996 | Mr. Doyle has been the Sheriff of | None. |
| (1947) | | Marin County, California since 1996. | |
| Trustee | | | |
| | | | |
| Gerald P. Richardson | May 2004 | Mr. Richardson is an independent | None. |
| (1945) | | consultant in the securities industry. | |
| Trustee | | | |
| | | | |
| Brian Alexander | March 2015 | Mr. Alexander has been employed | None. |
| (1981) | | by Sutter Health Novato Community | |
| Adviser to the Board | | Hospital since 2012, first as an | |
| | | Assistant Administrator and then, | |
| | | beginning in 2013, as the Chief | |
| | | Administrative Officer. From 2011 | |
| | | through 2012, Mr. Alexander was | |
| | | employed by Sutter Health West Bay | |
| | | Region as the Regional Director of | |
| | | Strategic Decision Support. | |
| TRUSTEES AND OFFICERS OF THE FUND |
| | | | Other |
| | | | Directorships |
| | | | Held Outside |
| Name, (Year of Birth), | | | of Fund |
| and Position Held | Start Date | Principal Occupation(s) | Complex During |
with the Trust | of Service | During Past Five Years | Past Five Years(1) |
| | | | |
| Doug Franklin | March 2016 | Mr. Franklin is a retired insurance | None. |
| (1964) | | industry executive. From 1987 | |
| Adviser to the Board | | through 2015, he was employed | |
| | | by Allianz-Fireman’s Fund Insurance | |
| | | Company in various positions, | |
| | | including Chief Actuary and | |
| | | Chief Risk Officer. | |
| | | | |
| Claire Knoles | December 2015 | Ms. Knoles is a founder of Kiosk and | None. |
| (1974) | | has served as its Chief Operating | |
| Adviser to the Board | | Officer since 2004. Kiosk is a full | |
| | | service marketing agency with | |
| | | offices in the San Francisco Bay | |
| | | Area, Toronto, and Liverpool, UK. | |
| | | | |
Interested Trustee(2) | | | |
| | | | |
| Neil J. Hennessy | January 1996 as | Mr. Hennessy has been employed by | Hennessy |
| (1956) | a Trustee and | Hennessy Advisors, Inc. since 1989 | Advisors, Inc. |
| Trustee, Chairman of | June 2008 as | and currently serves as its President, | |
| the Board, Chief | an Officer | Chairman and Chief Executive Officer. | |
| Investment Officer, | | | |
| Portfolio Manager, | | | |
| and President | | | |
| Name, (Year of Birth), | | |
| and Position Held | Start Date | Principal Occupation(s) |
with the Trust | of Service | During Past Five Years |
| | | |
| Officers | | |
| | | |
| Teresa M. Nilsen | January 1996 | Ms. Nilsen has been employed by Hennessy Advisors, Inc. |
| (1966) | | since 1989 and currently serves as its Executive Vice President, |
| Executive Vice President | | Chief Operations Officer, Chief Financial Officer, and Secretary. |
| and Treasurer | | |
| | | |
| Daniel B. Steadman | March 2000 | Mr. Steadman has been employed by Hennessy Advisors, Inc. |
| (1956) | | since 2000 and currently serves as its Executive Vice President |
| Executive Vice President | | and Chief Compliance Officer. |
| and Secretary | | |
| | | |
| Brian Carlson | December 2013 | Mr. Carlson has been employed by Hennessy Advisors, Inc. |
| (1972) | | since December 2013. Mr. Carlson was previously a co-founder |
| Senior Vice President and | | and principal of Trivium Consultants, LLC from February 2011 |
| Head of Distribution | | through November 2013. |
| | | |
| Jennifer Cheskiewicz | June 2013 | Ms. Cheskiewicz has been employed by Hennessy Advisors, Inc. |
| (1977) | | as its General Counsel since June 2013. She previously served |
| Senior Vice President and | | as in-house counsel to Carlson Capital, L.P., an SEC-registered |
| Chief Compliance Officer | | investment advisor to several private funds, from |
| | | February 2010 to May 2013. |
| HENNESSY FUNDS | 1-800-966-4354 | |
| Name, (Year of Birth), | | |
| and Position Held | Start Date | Principal Occupation(s) |
with the Trust | of Service | During Past Five Years |
| | | |
| David Ellison | October 2012 | Mr. Ellison has been employed by Hennessy Advisors, Inc. since |
(1958)(3) | | October 2012. He has served as a Portfolio Manager of the |
| Senior Vice President | | Hennessy Small Cap Financial Fund and the Hennessy Large |
| and Portfolio Manager | | Cap Financial Fund since inception. Mr. Ellison also served as a |
| | | Portfolio Manager of the Hennessy Technology Fund from its |
| | | inception until February 2017. Mr. Ellison served as Director, |
| | | CIO and President of FBR Fund Advisers, Inc. from |
| | | December 1999 to October 2012. |
| | | |
| Ryan Kelley | March 2013 | Mr. Kelley has been employed by Hennessy Advisors, Inc. since |
(1972)(4) | | October 2012. He has served as a Portfolio Manager of the |
| Vice President and | | Hennessy Gas Utility Fund, the Hennessy Small Cap Financial |
| Portfolio Manager | | Fund, and the Hennessy Large Cap Financial Fund since |
| | | October 2014. He served as Co-Portfolio Manager of the same |
| | | funds from March 2013 through September 2014, and as a |
| | | Portfolio Analyst for the Hennessy Funds from October 2012 |
| | | through October 2014. Mr. Kelley has also served as a Portfolio |
| | | Manager of the Hennessy Cornerstone Growth Fund, the |
| | | Hennessy Cornerstone Mid Cap 30 Fund, the Hennessy |
| | | Cornerstone Large Growth Fund, and the Hennessy |
| | | Cornerstone Value Fund and as a Co-Portfolio Manager of the |
| | | Hennessy Technology Fund since February 2017. Mr. Kelley |
| | | served as Portfolio Manager of FBR Fund Advisers, Inc. from |
| | | January 2008 to October 2012. |
| | | |
| Brian Peery | March 2003 as | Mr. Peery has been employed by Hennessy Advisors, Inc. since |
| (1969) | an Officer and | 2002. He has served as a Portfolio Manager of the Hennessy |
| Senior Vice President | February 2011 | Cornerstone Growth Fund, the Hennessy Cornerstone Mid Cap |
| and Portfolio Manager | as a Co-Portfolio | 30 Fund, the Hennessy Cornerstone Large Growth Fund, the |
| | Manager or | Hennessy Cornerstone Value Fund, the Hennessy Total Return |
| | Portfolio Manager | Fund, and the Hennessy Balanced Fund since October 2014. |
| | | He served as Co-Portfolio Manager of the same funds from |
| | | February 2011 through September 2014. Mr. Peery has also |
| | | served as a Portfolio Manager of the Hennessy Gas Utility Fund |
| | | since February 2015 and as Lead Portfolio Manager of the |
| | | Hennessy Technology Fund since February 2017. |
| | | |
| Daniel P. Hennessy | December 2016 | Mr. Daniel Hennessy has been employed by Hennessy Advisors, |
| (1990) | | Inc. since 2015. He has served as an Associate Analyst of the |
| Assistant Vice President | | Hennessy Technology Fund since February 2017. He previously |
| and Associate Analyst | | served as a Mutual Fund Specialist at U.S. Bancorp Fund |
| | | Services, LLC from November 2014 to July 2015. Prior to that, |
| | | he attended the University of San Diego, where he earned a |
| | | degree in Political Science. |
_______________
(1) | Messrs. DeSousa, Doyle, Hennessy, and Richardson previously served on the Board of Directors of Hennessy Mutual Funds, Inc. (“HMFI”), The Hennessy Funds, Inc. (“HFI”), and Hennessy SPARX Funds Trust (“HSFT”). Pursuant to an internal reorganization effective as of February 28, 2014, the series of HFMI, HFI, and HSFT were reorganized into corresponding series of Hennessy Funds Trust that mirrored them. Subsequent to the reorganization, HFMI, HFI, and HSFT were dissolved. |
(2) | Mr. Hennessy is considered an “interested person,” as defined in the Investment Company Act of 1940, as amended, because he is an officer of the Hennessy Funds. |
(3) | The address of this officer is 101 Federal Street, Suite 1900, Boston, MA 02110. |
(4) | The address of this officer is 1340 Environ Way, Chapel Hill, NC 27517. |
| TRUSTEES AND OFFICERS OF THE FUND |
(This Page Intentionally Left Blank.)
| HENNESSY FUNDS | 1-800-966-4354 | |
Expense Example (Unaudited)
October 31, 2017
As a shareholder of the Fund, you incur two types of costs: (1) transaction costs, including sales charges (loads) on purchase payments, reinvested dividends, or other distributions, redemption fees, and exchange fees; and (2) ongoing costs, including management fees, service fees, and other Fund expenses. This Example is intended to help you understand your ongoing costs (in dollars) of investing in the Fund and to compare these costs with the ongoing costs of investing in other mutual funds. The Example is based on an investment of $1,000 invested at the beginning of the period and held for the entire period from May 1, 2017, through October 31, 2017.
Actual Expenses
The first line of the table below under the “Investor Class” and “Institutional Class” headings provides information about actual account values and actual expenses. Although the Fund charges no sales loads or transaction fees, you will be assessed fees for outgoing wire transfers, returned checks and stop payment orders at prevailing rates charged by U.S. Bancorp Fund Services, LLC, the Fund’s transfer agent. If you request that a redemption be made by wire transfer, currently a $15 fee is charged by the Fund’s transfer agent. IRA accounts will be charged a $15 annual maintenance fee. The example below includes, but is not limited to, management fees, shareholder servicing fees, fund accounting, custody, and transfer agent fees. However, the example below does not include portfolio trading commissions and related expenses, and other extraordinary expenses as determined under generally accepted accounting principles. You may use the information in this line, together with the amount you invested, to estimate the expenses that you paid over the period. Simply divide your account value by $1,000 (for example, an $8,600 account value divided by $1,000 = 8.6), then multiply the result by the number in the first line of the table under the “Investor Class” or “Institutional Class” headings in the column entitled “Expenses Paid During Period” to estimate the expenses you paid on your account during this period.
Hypothetical Example for Comparison Purposes
The second line of the table below under the “Investor Class” and “Institutional Class” headings provides information about hypothetical account values and hypothetical expenses based on the Fund’s actual expense ratios and an assumed rate of return of 5% per year before expenses, which is not the Fund’s actual return. The hypothetical account values and expenses may not be used to estimate the actual ending account balance or expenses you paid for the period. You may use this information to compare the ongoing costs of investing in the Fund and other funds. To do so, compare this 5% hypothetical example with the 5% hypothetical examples that appear in the shareholder reports of the other funds. Please note that the expenses shown in the table are meant to highlight your ongoing costs only and do not reflect any transactional costs, such as sales charges (loads), or exchange fees. Therefore, the second line of the table under the “Investor Class” and “Institutional Class” headings is useful in comparing ongoing costs only, and will not help you determine the relative total costs of owning different funds. In addition, if these transactional costs were included, your costs would have been higher.
| | | | Expenses Paid |
| | Beginning | Ending | During Period(1) |
| | Account Value | Account Value | May 1, 2017 – |
| | May 1, 2017 | October 31, 2017 | October 31, 2017 |
| Investor Class | | | |
| Actual | $1,000.00 | $1,048.70 | $7.33 |
| Hypothetical (5% return before expenses) | $1,000.00 | $1,018.05 | $7.22 |
| | | | |
| Institutional Class | | | |
| Actual | $1,000.00 | $1,051.00 | $5.38 |
| Hypothetical (5% return before expenses) | $1,000.00 | $1,019.96 | $5.30 |
(1) | Expenses are equal to the Fund’s annualized expense ratio of 1.42% for Investor Class shares or 1.04% for Institutional Class shares, as applicable, multiplied by the average account value over the period, multiplied by 184/365 days (to reflect one-half year period). |
| HENNESSY FUNDS | 1-800-966-4354 | |
How to Obtain a Copy of the Fund’s
Proxy Voting Policy and Proxy Voting Records
A description of the policies and procedures the Fund uses to determine how to vote proxies relating to portfolio securities is available without charge: (1) by calling 1-800-966-4354; (2) on the Hennessy Funds’ website at hennessyfunds.com/proxy-voting/policy.fs; or (3) on the U.S. Securities and Exchange Commission’s (the “SEC”) website at www.sec.gov. The Fund’s proxy voting record is available without charge on both the Hennessy Funds’ website at hennessyfunds.com/proxy-voting/vote.fs and the SEC’s website at www.sec.gov no later than August 31 for the prior 12 months ending June 30.
Quarterly Filings on Form N-Q
The Fund files a complete schedule of portfolio holdings with the SEC for the first and third quarters of each fiscal year on Form N-Q. The Fund’s Forms N-Q are made available on the SEC’s website at www.sec.gov. The Fund’s Forms N-Q may be reviewed and copied at the SEC’s Public Reference Room in Washington, DC, and information on the operation of the Public Reference Room may be obtained by calling 1-800-SEC-0330. Information included in the Fund’s Forms N-Q will also be available upon request by calling 1-800-966-4354.
Federal Tax Distribution Information
(Unaudited)
For fiscal year 2017, certain dividends paid by the Fund may be subject to a maximum tax rate of 23.8%, as provided for by the Jobs and Growth Tax Relief Reconciliation Act of 2003. The percentage of dividends declared from ordinary income designated as qualified dividend income was 100.00%.
For corporate shareholders, the percent of ordinary income distributions that qualified for the corporate dividends received deduction for fiscal year 2017 was 100.00%.
The percentage of taxable ordinary income distributions that are designated as short-term capital gain distributions under Section 871(k)(2)(C) of the Internal Revenue Code of 1986, as amended, for the Fund was 0.00%.
Householding
To help keep the Fund’s costs as low as possible, we generally deliver a single copy of most financial reports and prospectuses to shareholders who share an address, even if the accounts are registered under different names. This process, known as “householding,” does not apply to account statements. You may request an individual copy of a prospectus or financial report at any time. If you would like to receive separate mailings, please call U.S. Bancorp Fund Services, LLC at 1-800-261-6950 or 1-414-765-4124 and we will begin individual delivery within 30 days of your request. If your account is held through a financial institution or other intermediary, please contact them directly to request individual delivery.
| PROXY VOTING — PRIVACY POLICY |
Privacy Policy
We collect the following non-public personal information about you:
| | • | information we receive from you on or in applications or other forms, correspondence, or conversations, including, but not limited to, your name, address, phone number, social security number, assets, income, and date of birth; and |
| | • | information about your transactions with us, our affiliates, or others, including, but not limited to, your account number and balance, payment history, parties to transactions, cost basis information, and other financial information. |
We do not disclose any non-public personal information about our current or former shareholders to non-affiliated third parties, except as permitted by law. For example, we are permitted by law to disclose all of the information we collect, as described above, to our Transfer Agent to process your transactions. Furthermore, we restrict access to your non-public personal information to those persons who require such information to provide products or services to you. We maintain physical, electronic, and procedural safeguards that comply with federal standards to guard your non-public personal information.
In the event that you hold shares of the Fund through a financial intermediary, including, but not limited to, a broker-dealer, bank, or trust company, the privacy policy of your financial intermediary would govern how your non-public personal information will be shared with non-affiliated third parties.
| HENNESSY FUNDS | 1-800-966-4354 | |
For information, questions or assistance, please call
The Hennessy Funds
1-800-966-4354 or 1-415-899-1555
INVESTMENT ADVISOR
Hennessy Advisors, Inc.
7250 Redwood Boulevard, Suite 200
Novato, California 94945
ADMINISTRATOR,
TRANSFER AGENT,
DIVIDEND PAYING AGENT &
SHAREHOLDER SERVICING AGENT
U.S. Bancorp Fund Services, LLC
P.O. Box 701
Milwaukee, Wisconsin 53201-0701
CUSTODIAN
U.S. Bank N.A.
Custody Operations
1555 North River Center Drive, Suite 302
Milwaukee, Wisconsin 53212
TRUSTEES
Neil J. Hennessy
Robert T. Doyle
J. Dennis DeSousa
Gerald P. Richardson
COUNSEL
Foley & Lardner LLP
777 East Wisconsin Avenue
Milwaukee, Wisconsin 53202-5306
INDEPENDENT REGISTERED
PUBLIC ACCOUNTING FIRM
Tait, Weller & Baker LLP
1818 Market Street, Suite 2400
Philadelphia, Pennsylvania 19103
DISTRIBUTOR
Quasar Distributors, LLC
777 East Wisconsin Avenue
Milwaukee, Wisconsin 53202
hennessyfunds.com | 1-800-966-4354
This report has been prepared for shareholders and may be distributed to
others only if preceded or accompanied by a current prospectus.
ANNUAL REPORT
OCTOBER 31, 2017
HENNESSY BALANCED
FUND
Investor Class HBFBX
hennessyfunds.com | 1-800-966-4354
(This Page Intentionally Left Blank.)
Contents
| Letter to Shareholders | 2 |
| Performance Overview | 4 |
| Financial Statements | |
| Schedule of Investments | 6 |
| Statement of Assets and Liabilities | 9 |
| Statement of Operations | 10 |
| Statements of Changes in Net Assets | 11 |
| Financial Highlights | 12 |
| Notes to the Financial Statements | 14 |
| Report of Independent Registered Public Accounting Firm | 21 |
| Trustees and Officers of the Fund | 22 |
| Expense Example | 26 |
| Proxy Voting Policy and Proxy Voting Records | 28 |
| Quarterly Schedule of Investments | 28 |
| Federal Tax Distribution Information | 28 |
| Householding | 28 |
| Privacy Policy | 29 |
| HENNESSY FUNDS | 1-800-966-4354 | |
December 2017
Dear Hennessy Funds Shareholder:
Over the past year, global equity markets have made strong advances, fueled by continued, broad-based economic growth in most countries and regions, and in spite of a somewhat unsettling geopolitical backdrop.
U.S. stocks performed well in the first year of the new administration in Washington, and, ignoring the debate and the bluster, investors have continued to focus on what concerns them the most – tax reform, deregulation, and the hope of an increase in infrastructure spending. As we move into the final weeks of the calendar year, with the major indices reaching new highs, I find myself envisioning the Dow Jones Industrial Average building momentum toward 30,000.
Over the past 12 months, the U.S. economy has continued to grow at a steady rate of almost 2.5% on an annualized basis, as measured by GDP. Companies have added over 170,000 jobs per month on average over the past year, and the current unemployment rate of 4.1% is the lowest in 17 years. Consumer confidence is high and still rising, and corporate profits are at all-time highs. The Federal Reserve has been increasing interest rates, but at a gradual pace. The bond market has also continued to support the equity market and equity market valuations. Since December of last year, long bond yields have stayed within a narrow band, with the 10-year U.S. Treasury yield hovering in the 2.0% to 2.5% range, and remain low compared to historical averages. In my opinion, long bond yields have stayed low despite three increases in the Federal Funds rate over the last 12 months in part due to persistent low inflation.
Meanwhile, the prospective price-to-earnings multiples for the Dow Jones Industrial Average and S&P 500 Index are just above long-term averages at 19.5x and 19.9x, respectively. I believe these levels of stock valuation, while higher than a year ago, are still very reasonable. At the peak of the technology/dot-com bubble, U.S. equities sold at much higher multiples across the board than they do today, and bond yields were also much higher. In June of 1999, the Dow Jones Industrial Average sold at 28x earnings and the 10-year bond yield was close to 6%. Today, the Dow is selling at under 20x earnings and is offering a 2.2% dividend yield, on par with the yield of the 10-year government bond at 2.4%.
Equity markets in the U.S. have been rising for almost nine years, and financial media reports have speculated that this bull run will come to end, but why? I see no substantial reasons or indicators that a major correction is on the horizon. I remain confident that this bull market has room to run. Overall, investment fundamentals are strong. Corporate earnings are growing at a healthy rate, and companies are generating excess cash flow. Cash continues to build on corporate balance sheets, with $5.2 trillion in cash and short term investments among the S&P 500 Index companies as of October 31, 2017. If our government leaders can pass a meaningful tax reform bill and continue efforts toward regulatory relief, it could be icing on the cake for equities.
There have been, and will likely continue to be, downturns throughout this extended bull market. Since 2010, there have been 18 downturns in the market, 14 of which were between 5% and 10% and four of which were corrections of between 10% and 20%. Yet the market has bounced back following each pullback and then has moved higher. A correction is not the end of the bull market. What might signal that we are at the end of this bull market? Euphoria. And I still see no signs of euphoria in this market. In the past,
I have likened the current bull market to that of 1982-2000, and I am confident in the strength of the market today and believe the economy will continue its slow, but steady, growth into the coming year.
Thank you for your continued confidence and investment in our funds. If you have any questions or would like to speak with us directly, please don’t hesitate to call us at (800) 966-4354.
Best regards,
Neil J. Hennessy
President and Chief Investment Officer
Past performance does not guarantee future results.
Mutual fund investing involves risk. Principal loss is possible.
Opinions expressed are those of Neil Hennessy and are subject to change, are not guaranteed, and should not be considered investment advice.
The Dow Jones Industrial Average and S&P 500 Index are unmanaged indices commonly used to measure the performance of U.S. stocks. One cannot invest directly in an index.
Price to earnings is calculated by dividing a company’s market price per share by its earnings per share. Dividend yield is calculated as the annual dividends paid by a company divided by the price of a share of its stock. Cash flow provides an indication of a company’s financial strength and represents earnings before depreciation, amortization, and non-cash charges.
| HENNESSY FUNDS | 1-800-966-4354 | |
Performance Overview (Unaudited)
CHANGE IN VALUE OF $10,000 INVESTMENT
This graph illustrates the performance of an initial investment of $10,000 made in the Fund ten years ago and assumes the reinvestment of dividends.
AVERAGE ANNUAL TOTAL RETURN FOR PERIODS ENDED OCTOBER 31, 2017
| | One | Five | Ten |
| | Year | Years | Years |
| Hennessy Balanced Fund (HBFBX) | 9.56% | 5.52% | 3.23% |
| 50/50 Blended DJIA/Treasury Index | 15.41% | 7.66% | 4.80% |
| Dow Jones Industrial Average | 32.07% | 15.12% | 8.15% |
Expense ratio: 1.69%
Performance data quoted represents past performance; past performance does not guarantee future results. The investment return and principal value of an investment will fluctuate so that an investor’s shares, when redeemed, may be worth more or less than their original cost. The performance table does not reflect the deduction of taxes that a shareholder would pay on Fund distributions or the redemption of Fund shares. Current performance of the Fund may be lower or higher than the performance quoted. Performance data current to the most recent month end may be obtained by visiting hennessyfunds.com.
The 50/50 Blended DJIA/Treasury Index consists of 50% common stocks represented by the Dow Jones Industrial Average and 50% short-duration Treasury securities represented by the ICE BofAML 1-Year U.S. Treasury Note Index. The Dow Jones Industrial Average is an unmanaged index commonly used to measure the performance of U.S. stocks. The ICE BofAML 1-Year U.S. Treasury Note Index is an unmanaged index comprised of Treasury securities maturing in approximately one year. One cannot invest directly in an index.
The expense ratio presented is from the most recent prospectus. The expense ratio for the current reporting period is available in the Financial Highlights section of this report.
PERFORMANCE NARRATIVE
Portfolio Managers Neil J. Hennessy and Brian E. Peery
Performance:
For the 12-month period ended October 31, 2017, the Hennessy Balanced Fund returned 9.56%, underperforming both the 50/50 Blended DJIA/Treasury Index* and the Dow Jones Industrial Average, which returned 15.41% and 32.07% for the same period, respectively.
The Fund underperformed its primary benchmark, the 50/50 Blended DJIA/Treasury Index, as a result of both sector allocation and stock selection. Two of the largest contributors to the Fund’s relative underperformance were the notable absences of Apple and Microsoft from the portfolio, as both stocks performed well over the period. An overweight position in the Consumer Discretionary sector helped performance, but its positive contribution was more than offset by overweight positions in the Information Technology and Energy sectors, which hurt the Fund’s relative performance.
Portfolio Strategy:
The Fund invests approximately 50% of its assets in the “Dogs of the Dow,” the 10 highest dividend-yielding Dow stocks, and 50% of its assets in U.S. Treasuries. As a result of this “balanced” strategy, the Fund may be expected to underperform equities in periods when markets rise and outperform in periods when markets fall. The Fund is designed to allow investors to gain some exposure to the equity market while maintaining a significant share of their investment in fixed income securities. We believe the Fund is well positioned for the more conservative investor, as the equity portion of the portfolio is invested in what we would deem to be high-quality companies, each with a historically high dividend yield, and the balance of the Fund is invested in low-risk, short-duration U.S. Treasuries.
Investment Commentary:
We believe the balance between risk and reward afforded by the Fund’s stock selection and asset allocation policies provides conservative investors with a compelling way to participate in the market longer term while maintaining a lower risk profile. The Fund is well diversified, with investments in all but three of the market sectors. We believe the Fund’s holdings, stocks that offer higher dividend yields and trade on lower valuations than the DJIA as a whole, will continue to participate in a rising market. Should the market experience a correction, we would expect our more defensive holding to perform well relative to the market. The relatively short duration of the 25% weighting of U.S. Treasuries in the portfolio (all less than one year) may give us the ability to roll into higher-yielding Treasuries in the event yields rise.
_______________
| * | The 50/50 Blended DJIA/Treasury Index consists of 50% common stocks represented by the Dow Jones Industrial Average and 50% short duration Treasury securities represented by the ICE BofA Merrill Lynch 1-Year U.S. Treasury Note Index. |
Opinions expressed are those of the Portfolio Managers as of the date written and are subject to change, are not guaranteed, and should not be considered investment advice or an indication of trading intent.
The S&P 500 Index and Dow Jones Industrial Average are unmanaged indices commonly used to measure the performance of U.S. stocks. The ICE BofA Merrill Lynch 1-Year U.S. Treasury Note Index is an unmanaged index comprised of Treasury securities maturing in approximately one year. One cannot invest directly in an index.
The Fund is non-diversified, meaning it may concentrate its assets in fewer individual holdings than a diversified fund, making it more exposed to individual stock volatility than a diversified fund. The Fund’s formula-based strategy may cause the Fund to buy or sell securities at times when it may not be advantageous. Please see the Fund’s prospectus for a more complete discussion of these and other risks.
References to specific securities should not be considered a recommendation to buy or sell any security. Fund holdings and sector allocations are subject to change. Please refer to the Schedule of Investments included in this report for additional portfolio information.
Dividend yield is calculated as the annual dividends paid by a company divided by its market price per share. Duration is a measure of the sensitivity of the price (the value of principal) of a fixed-income investment to a change in interest rates and is expressed as a number of years.
| HENNESSY FUNDS | 1-800-966-4354 | |
Financial Statements
Schedule of Investments as of October 31, 2017 |
HENNESSY BALANCED FUND
(% of Net Assets)
| TOP TEN HOLDINGS | | % NET ASSETS |
| U.S. Treasury Bill, 1.130%, 02/01/2018 | | | 16.29 | % |
| U.S. Treasury Bill, 1.050%, 01/04/2018 | | | 8.16 | % |
| U.S. Treasury Bill, 1.145%, 05/24/2018 | | | 8.11 | % |
| U.S. Treasury Bill, 1.215%, 06/21/2018 | | | 8.10 | % |
| Verizon Communications, Inc. | | | 5.09 | % |
| Exxon Mobil Corp. | | | 5.07 | % |
| Cisco Systems, Inc. | | | 5.06 | % |
| International Business Machines Corp. | | | 5.04 | % |
| Pfizer, Inc. | | | 5.03 | % |
| The Coca-Cola Co. | | | 4.88 | % |
Note: For presentation purposes, the Fund has grouped some of the industry categories. For purposes of categorizing securities for compliance with Section 8(b)(1) of the Investment Company Act of 1940, as amended, the Fund uses more specific industry classifications.
| COMMON STOCKS – 51.69% | | Number | | | | | | % of | |
| | | of Shares | | | Value | | | Net Assets | |
| Consumer Discretionary – 0.34% | | | | | | | | | |
| McDonald’s Corp. | | | 250 | | | $ | 41,728 | | | | 0.34 | % |
| | | | | | | | | | | | | |
| Consumer Staples – 7.81% | | | | | | | | | | | | |
| The Coca-Cola Co. | | | 13,000 | | | | 597,740 | | | | 4.88 | % |
| The Procter & Gamble Co. | | | 4,150 | | | | 358,311 | | | | 2.93 | % |
| | | | | | | | 956,051 | | | | 7.81 | % |
| | | | | | | | | | | | | |
| Energy – 9.95% | | | | | | | | | | | | |
| Chevron Corp. | | | 5,150 | | | | 596,833 | | | | 4.88 | % |
| Exxon Mobil Corp. | | | 7,450 | | | | 620,958 | | | | 5.07 | % |
| | | | | | | | 1,217,791 | | | | 9.95 | % |
| | | | | | | | | | | | | |
| Health Care – 5.03% | | | | | | | | | | | | |
| Pfizer, Inc. | | | 17,550 | | | | 615,303 | | | | 5.03 | % |
| | | | | | | | | | | | | |
| Industrials – 10.25% | | | | | | | | | | | | |
| Caterpillar, Inc. | | | 2,600 | | | | 353,080 | | | | 2.88 | % |
| General Electric Co. | | | 23,600 | | | | 475,776 | | | | 3.89 | % |
| The Boeing Co. | | | 1,650 | | | | 425,667 | | | | 3.48 | % |
| | | | | | | | 1,254,523 | | | | 10.25 | % |
| | | | | | | | | | | | | |
| Information Technology – 13.22% | | | | | | | | | | | | |
| Cisco Systems, Inc. | | | 18,150 | | | | 619,822 | | | | 5.06 | % |
| Intel Corp. | | | 8,400 | | | | 382,116 | | | | 3.12 | % |
| International Business Machines Corp. | | | 4,000 | | | | 616,240 | | | | 5.04 | % |
| | | | | | | | 1,618,178 | | | | 13.22 | % |
| | | | | | | | | | | | | |
| Telecommunication Services – 5.09% | | | | | | | | | | | | |
| Verizon Communications, Inc. | | | 13,000 | | | | 622,310 | | | | 5.09 | % |
| | | | | | | | | | | | | |
| Total Common Stocks | | | | | | | | | | | | |
| (Cost $5,551,875) | | | | | | | 6,325,884 | | | | 51.69 | % |
The accompanying notes are an integral part of these financial statements.
| HENNESSY FUNDS | 1-800-966-4354 | |
| SHORT-TERM INVESTMENTS – 48.86% | | Number of Shares/ | | | | | | % of | |
| | | Par Amount | | | Value | | | Net Assets | |
| Money Market Funds – 4.15% | | | | | | | | | |
| Fidelity Government Portfolio, Institutional Class, 0.92% (a) | | | 508,516 | | | $ | 508,516 | | | | 4.15 | % |
| | | | | | | | | | | | | |
| U.S. Treasury Bills – 44.71% | | | | | | | | | | | | |
| 1.050%, 01/04/2018 (b) | | | 1,000,000 | | | | 998,158 | | | | 8.16 | % |
| 1.130%, 02/01/2018 (b) | | | 2,000,000 | | | | 1,994,225 | | | | 16.29 | % |
| 1.145%, 05/24/2018 (b) | | | 1,000,000 | | | | 992,959 | | | | 8.11 | % |
| 1.215%, 06/21/2018 (b) | | | 1,000,000 | | | | 991,630 | | | | 8.10 | % |
| 1.190%, 07/19/2018 (b) | | | 500,000 | | | | 495,242 | | | | 4.05 | % |
| | | | | | | | 5,472,214 | | | | 44.71 | % |
| Total Short-Term Investments | | | | | | | | | | | | |
| (Cost $5,984,185) | | | | | | | 5,980,730 | | | | 48.86 | % |
| | | | | | | | | | | | | |
| Total Investments | | | | | | | | | | | | |
| (Cost $11,536,060) – 100.55% | | | | | | | 12,306,614 | | | | 100.55 | % |
| Liabilities in Excess of Other Assets – (0.55)% | | | | | | | (67,665 | ) | | | (0.55 | )% |
TOTAL NET ASSETS – 100.00% | | | | | | $ | 12,238,949 | | | | 100.00 | % |
Percentages are stated as a percent of net assets.
| (a) | The rate listed is the fund’s 7-day yield as of October 31, 2017. |
| (b) | The rate listed is discount rate at issue. |
Summary of Fair Value Exposure at October 31, 2017
The following is a summary of the inputs used to value the Fund’s net assets as of October 31, 2017 (See Note 3 in the accompanying notes to the financial statements):
| Common Stocks | | Level 1 | | | Level 2 | | | Level 3 | | | Total | |
| Consumer Discretionary | | $ | 41,728 | | | $ | — | | | $ | — | | | $ | 41,728 | |
| Consumer Staples | | | 956,051 | | | | — | | | | — | | | | 956,051 | |
| Energy | | | 1,217,791 | | | | — | | | | — | | | | 1,217,791 | |
| Health Care | | | 615,303 | | | | — | | | | — | | | | 615,303 | |
| Industrials | | | 1,254,523 | | | | — | | | | — | | | | 1,254,523 | |
| Information Technology | | | 1,618,178 | | | | — | | | | — | | | | 1,618,178 | |
| Telecommunication Services | | | 622,310 | | | | — | | | | — | | | | 622,310 | |
| Total Common Stocks | | $ | 6,325,884 | | | $ | — | | | $ | — | | | $ | 6,325,884 | |
| Short-Term Investments | | | | | | | | | | | | | | | | |
| Money Market Funds | | $ | 508,516 | | | $ | — | | | $ | — | | | $ | 508,516 | |
| U.S. Treasury Bills | | | — | | | | 5,472,214 | | | | — | | | | 5,472,214 | |
| Total Short-Term Investments | | $ | 508,516 | | | $ | 5,472,214 | | | $ | — | | | $ | 5,980,730 | |
| Total Investments | | $ | 6,834,400 | | | $ | 5,472,214 | | | $ | — | | | $ | 12,306,614 | |
Transfers between levels are recognized at the end of the reporting period. During the year ended October 31, 2017, the Fund recognized no transfers between levels.
The accompanying notes are an integral part of these financial statements.
| SCHEDULE OF INVESTMENTS/STATEMENT OF ASSETS AND LIABILITIES |
Financial Statements
Statement of Assets and Liabilities as of October 31, 2017 |
| ASSETS: | | | |
| Investments in securities, at value (cost $11,536,060) | | $ | 12,306,614 | |
| Dividends and interest receivable | | | 12,913 | |
| Prepaid expenses and other assets | | | 7,701 | |
| Total Assets | | | 12,327,228 | |
| | | | | |
| LIABILITIES: | | | | |
| Payable for fund shares redeemed | | | 752 | |
| Payable to advisor | | | 6,236 | |
| Payable to administrator | | | 1,851 | |
| Payable to auditor | | | 21,268 | |
| Accrued distribution fees | | | 42,052 | |
| Accrued service fees | | | 1,039 | |
| Accrued trustees fees | | | 4,832 | |
| Accrued expenses and other payables | | | 10,249 | |
| Total Liabilities | | | 88,279 | |
| NET ASSETS | | $ | 12,238,949 | |
| | | | | |
| NET ASSETS CONSIST OF: | | | | |
| Capital stock | | $ | 10,628,397 | |
| Accumulated net investment income | | | 6,569 | |
| Accumulated net realized gain on investments | | | 833,429 | |
| Unrealized net appreciation on investments | | | 770,554 | |
| Total Net Assets | | $ | 12,238,949 | |
| | | | | |
| NET ASSETS | | | | |
| Investor Class: | | | | |
| Shares authorized (no par value) | | Unlimited | |
| Net assets applicable to outstanding Investor Class shares | | $ | 12,238,949 | |
| Shares issued and outstanding | | | 950,163 | |
| Net asset value, offering price and redemption price per share | | $ | 12.88 | |
The accompanying notes are an integral part of these financial statements.
| HENNESSY FUNDS | 1-800-966-4354 | |
Financial Statements
Statement of Operations for the year ended October 31, 2017 |
| INVESTMENT INCOME: | | | |
| Dividend income | | $ | 229,732 | |
| Interest income | | | 45,457 | |
| Total investment income | | | 275,189 | |
| | | | | |
| EXPENSES: | | | | |
| Investment advisory fees (See Note 5) | | | 72,656 | |
| Compliance expense (See Note 5) | | | 28,701 | |
| Audit fees | | | 21,875 | |
| Federal and state registration fees | | | 21,650 | |
| Distribution fees – Investor Class (See Note 5) | | | 18,164 | |
| Trustees’ fees and expenses | | | 15,327 | |
| Service fees – Investor Class (See Note 5) | | | 12,109 | |
| Administration, fund accounting, custody and transfer agent fees (See Note 5) | | | 11,566 | |
| Sub-transfer agent expenses – Investor Class (See Note 5) | | | 7,995 | |
| Reports to shareholders | | | 6,507 | |
| Other expenses | | | 3,881 | |
| Total expenses | | | 220,431 | |
| NET INVESTMENT INCOME | | $ | 54,758 | |
| | | | | |
| REALIZED AND UNREALIZED GAINS: | | | | |
| Net realized gain on investments | | $ | 900,400 | |
| Net change in unrealized appreciation on investments | | | 149,079 | |
| Net gain on investments | | | 1,049,479 | |
| NET INCREASE IN NET ASSETS RESULTING FROM OPERATIONS | | $ | 1,104,237 | |
The accompanying notes are an integral part of these financial statements.
| STATEMENT OF OPERATIONS/STATEMENTS OF CHANGES IN NET ASSETS |
Financial Statements
| Statements of Changes in Net Assets |
| | | Year Ended | | | Year Ended | |
| | | October 31, 2017 | | | October 31, 2016 | |
| OPERATIONS: | | | | | | |
| Net investment income | | $ | 54,758 | | | $ | 46,618 | |
| Net realized gain on investments | | | 900,400 | | | | 843,528 | |
| Net change in unrealized appreciation on investments | | | 149,079 | | | | 21,866 | |
| Net increase in net assets resulting from operations | | | 1,104,237 | | | | 912,012 | |
| | | | | | | | | |
| DISTRIBUTIONS TO SHAREHOLDERS FROM: | | | | | | | | |
| Net investment income – Investor Class | | | (48,189 | ) | | | (50,622 | ) |
| Net realized gains – Investor Class | | | (845,247 | ) | | | (254,142 | ) |
| Total distributions | | | (893,436 | ) | | | (304,764 | ) |
| | | | | | | | | |
| CAPITAL SHARE TRANSACTIONS: | | | | | | | | |
| Proceeds from shares subscribed – Investor Class | | | 991,429 | | | | 6,936,800 | |
| Dividends reinvested – Investor Class | | | 877,425 | | | | 299,526 | |
| Cost of shares redeemed – Investor Class | | | (1,920,997 | ) | | | (7,390,889 | ) |
| Net decrease in net assets derived | | | | | | | | |
| from capital share transactions | | | (52,143 | ) | | | (154,563 | ) |
| TOTAL INCREASE IN NET ASSETS | | | 158,658 | | | | 452,685 | |
| | | | | | | | | |
| NET ASSETS: | | | | | | | | |
| Beginning of year | | | 12,080,291 | | | | 11,627,606 | |
| End of year | | $ | 12,238,949 | | | $ | 12,080,291 | |
| Undistributed net investment income, end of year | | $ | 6,569 | | | $ | — | |
| | | | | | | | | |
| CHANGES IN SHARES OUTSTANDING: | | | | | | | | |
| Shares sold – Investor Class | | | 79,582 | | | | 574,534 | |
| Shares issued to holders as reinvestment | | | | | | | | |
| of dividends – Investor Class | | | 72,055 | | | | 24,799 | |
| Shares redeemed – Investor Class | | | (154,177 | ) | | | (586,933 | ) |
| Net increase (decrease) in shares outstanding | | | (2,540 | ) | | | 12,400 | |
The accompanying notes are an integral part of these financial statements.
| HENNESSY FUNDS | 1-800-966-4354 | |
Financial Statements
For an Investor Class share outstanding throughout each year
PER SHARE DATA:
Net asset value, beginning of year
Income from investment operations:
Net investment income
Net realized and unrealized gains (losses) on investments
Total from investment operations
Less distributions:
Dividends from net investment income
Dividends from net realized gains
Total distributions
Net asset value, end of year
TOTAL RETURN
SUPPLEMENTAL DATA AND RATIOS:
Net assets, end of year (millions)
Ratio of expenses to average net assets
Ratio of net investment income to average net assets
Portfolio turnover rate
The accompanying notes are an integral part of these financial statements.
| FINANCIAL HIGHLIGHTS — INVESTOR CLASS |
| Year Ended October 31, | | |
| 2017 | | | 2016 | | | 2015 | | | 2014 | | | 2013 | | |
| | | | | | | | | | | | | | | |
| $ | 12.68 | | | $ | 12.37 | | | $ | 12.98 | | | $ | 12.90 | | | $ | 11.88 | | |
| | | | | | | | | | | | | | | | | | | | |
| | | | | | | | | | | | | | | | | | | | |
| | 0.06 | | | | 0.04 | | | | 0.03 | | | | 0.02 | | | | 0.02 | | |
| | 1.09 | | | | 0.58 | | | | (0.01 | ) | | | 0.51 | | | | 1.02 | | |
| | 1.15 | | | | 0.62 | | | | 0.02 | | | | 0.53 | | | | 1.04 | | |
| | | | | | | | | | | | | | | | | | | | |
| | | | | | | | | | | | | | | | | | | | |
| | (0.05 | ) | | | (0.04 | ) | | | (0.03 | ) | | | (0.01 | ) | | | (0.02 | ) | |
| | (0.90 | ) | | | (0.27 | ) | | | (0.60 | ) | | | (0.44 | ) | | | — | | |
| | (0.95 | ) | | | (0.31 | ) | | | (0.63 | ) | | | (0.45 | ) | | | (0.02 | ) | |
| $ | 12.88 | | | $ | 12.68 | | | $ | 12.37 | | | $ | 12.98 | | | $ | 12.90 | | |
| | | | | | | | | | | | | | | | | | | | |
| | 9.56 | % | | | 5.20 | % | | | 0.11 | % | | | 4.26 | % | | | 8.77 | % | |
| | | | | | | | | | | | | | | | | | | | |
| | | | | | | | | | | | | | | | | | | | |
| $ | 12.24 | | | $ | 12.08 | | | $ | 11.63 | | | $ | 12.54 | | | $ | 12.21 | | |
| | 1.82 | % | | | 1.68 | % | | | 1.68 | % | | | 1.75 | % | | | 1.75 | % | |
| | 0.45 | % | | | 0.33 | % | | | 0.20 | % | | | 0.17 | % | | | 0.14 | % | |
| | 31 | % | | | 51 | % | | | 34 | % | | | 23 | % | | | 22 | % | |
The accompanying notes are an integral part of these financial statements.
| HENNESSY FUNDS | 1-800-966-4354 | |
Financial Statements
Notes to the Financial Statements October 31, 2017 |
1). ORGANIZATION
The Hennessy Balanced Fund (the “Fund”) is a series of Hennessy Funds Trust (the “Trust”), which was organized as a Delaware statutory trust on September 17, 1992. The Fund is an open-end management investment company registered under the Investment Company Act of 1940, as amended. The investment objective of the Fund is a combination of capital appreciation and current income. The Fund is a non-diversified fund and offers Investor Class shares.
As an investment company, the Fund follows the investment company accounting and reporting guidance of the Financial Accounting Standards Board (“FASB”) Accounting Standard Codification Topic 946 “Financial Services—Investment Companies.”
2). SIGNIFICANT ACCOUNTING POLICIES
The following is a summary of significant accounting policies consistently followed by the Fund in the preparation of the financial statements. These policies conform to U.S. generally accepted accounting principles (“GAAP”).
| a). | Investment Valuation – All investments in securities are recorded at their estimated fair value, as described in Note 3. |
| b). | Federal Income Taxes – No provision for federal income taxes or excise taxes has been made because the Fund has elected to be taxed as a “regulated investment company” and intends to distribute substantially all of its taxable income to its shareholders and otherwise comply with the provisions of the Internal Revenue Code of 1986, as amended, applicable to regulated investment companies. Net investment income/loss and realized gains/losses for federal income tax purposes may differ from those reported in the financial statements because of temporary book and tax basis differences. Temporary differences are primarily the result of the treatment of wash sales for tax reporting purposes. The Fund recognizes interest and penalties related to income tax benefits, if any, in the Statement of Operations as an income tax expense. Distributions from net realized gains for book purposes may include short-term capital gains, which are included as ordinary income to shareholders for tax purposes. The Fund may utilize equalization accounting for tax purposes and designate earnings and profits, including net realized gains distributed to shareholders on redemption of shares, as part of the dividends paid deduction for income tax purposes. |
| | Due to inherent differences in the recognition of income, expenses, and realized gains/losses under GAAP and federal income tax regulations, permanent differences between book and tax basis for reporting for fiscal year 2017 have been identified and appropriately reclassified in the Statement of Assets and Liabilities. The adjustments are as follows: |
| | Accumulated | Accumulated | | |
| | Net Investment | Net Realized | | |
| | Income | Gain on Investments | Capital Stock | |
| | $ — | $(50,832) | $50,832 | |
| c). | Accounting for Uncertainty in Income Taxes – The Fund has accounting policies regarding recognition and measurement of tax positions taken or expected to be taken on a tax return. The tax returns of the Fund for the prior three fiscal years are |
| NOTES TO THE FINANCIAL STATEMENTS |
| | open for examination. The Fund has reviewed all open tax years in major jurisdictions and concluded that there is no impact on the Fund’s net assets and no tax liability resulting from unrecognized tax benefits relating to uncertain income tax positions taken or expected to be taken on a tax return. The Fund’s major tax jurisdictions are U.S. federal and Delaware. |
| d). | Income and Expenses – Dividend income is recognized on the ex-dividend date or as soon as information is available to the Fund. Interest income, which includes the amortization of premium and accretion of discount, is recognized on an accrual basis. The Fund is charged for those expenses that are directly attributable to the portfolio, such as advisory, administration, and certain shareholder service fees. |
| e). | Distributions to Shareholders – Dividends from net investment income for the Fund, if any, are declared and paid at the end of each calendar quarter. Distributions of net realized capital gains, if any, are declared and paid annually, usually in December. |
| f). | Security Transactions – Investment and shareholder transactions are recorded on the trade date. The Fund determines the gain/loss realized from an investment transaction by comparing the original cost of the security lot sold with the net sale proceeds. Discounts and premiums on securities purchased are accreted or amortized over the life of the respective security. |
| g). | Use of Estimates – The preparation of financial statements in conformity with GAAP requires management to make estimates and assumptions that affect the reported amounts of assets and liabilities and disclosure of contingent assets and liabilities at the date of the financial statements and the reported change in net assets during the reporting period. Actual results could differ from those estimates. |
| h). | Share Valuation – The net asset value (“NAV”) per share of the Fund is calculated by dividing (i) the sum of the value of the securities held by the Fund, plus cash or other assets, minus all liabilities (including estimated accrued expenses) by (ii) the total number of shares outstanding for the Fund, rounded to the nearest cent. The Fund’s shares will not be priced on days the New York Stock Exchange is closed for trading. The offering and redemption price per share for the Fund is equal to the Fund’s NAV per share. |
3). SECURITIES VALUATION
The Fund follows authoritative fair valuation accounting standards that establish an authoritative definition of fair value and set out a hierarchy for measuring fair value. These standards require additional disclosures about the various inputs and valuation techniques used to develop the measurements of fair value and a discussion of changes in valuation techniques and related inputs during the period. These inputs are summarized in the three broad levels listed below:
| | Level 1 – | Unadjusted, quoted prices in active markets for identical instruments that the Fund has the ability to access at the date of measurement. |
| | Level 2 – | Other significant observable inputs (including, but not limited to, quoted prices in active markets for similar instruments, quoted prices in markets that are not active for identical or similar instruments, and model-derived valuations in which all significant inputs and significant value drivers are observable in active markets, such as interest rates, prepayment speeds, credit risk curves, default rates, and similar data). |
| | Level 3 – | Significant unobservable inputs (including the Fund’s own assumptions about what market participants would use to price the asset or liability based on the best available information) when observable inputs are unavailable. |
| HENNESSY FUNDS | 1-800-966-4354 | |
Following is a description of the valuation techniques applied to the Fund’s major categories of assets and liabilities measured at fair value on a recurring basis.
| | Equity Securities – Equity securities, including common stocks, preferred stocks, exchange-traded funds, closed-end mutual funds, partnerships, rights, and real estate investment trusts, that are traded on a securities exchange for which a last-quoted sales price is readily available will generally be valued at the last sales price as reported by the primary exchange on which the securities are listed. Securities listed on The NASDAQ Stock Market (“NASDAQ”) will generally be valued at the NASDAQ Official Closing Price, which may differ from the last sales price reported. Securities traded on a securities exchange for which a last-quoted sales price is not readily available will generally be valued at the mean between the bid and ask prices. To the extent these securities are actively traded and valuation adjustments are not applied, they are classified in Level 1 of the fair value hierarchy. |
| | Registered Investment Companies – Investments in registered investment companies (e.g., mutual funds) are generally priced at the ending NAV provided by the applicable registered investment company’s service agent and will be classified in Level 1 of the fair value hierarchy. |
| | Debt Securities – Debt securities, including corporate bonds, asset-backed securities, mortgage-backed securities, municipal bonds, U.S. Treasuries, and U.S. government agency issues, are generally valued at market on the basis of valuations furnished by an independent pricing service that utilizes both dealer-supplied valuations and formula-based techniques. The pricing service may consider recently executed transactions in securities of the issuer or comparable issuers, market price quotations (where observable), bond spreads, and fundamental data relating to the issuer. In addition, the model may incorporate observable market data, such as reported sales of similar securities, broker quotes, yields, bids, offers, and reference data. Certain securities are valued primarily using dealer quotations. These securities are generally classified in Level 2 of the fair value hierarchy. |
| | Short-Term Securities – Short-term equity investments, including money market funds, are valued in the manner specified above. Short-term debt investments with an original term to maturity of 60 days or less are valued at amortized cost, which approximates fair market value. If the original term to maturity of a short-term debt investment exceeded 60 days, then the values as of the 61st day prior to maturity are amortized. Amortized cost is not used if its use would be inappropriate due to credit or other impairments of the issuer, in which case the security’s fair value would be determined, as described below. Short-term securities are generally classified in Level 1 or Level 2 of the fair market hierarchy depending on the inputs used and market activity levels for specific securities. |
The Board of Trustees of the Fund (the “Board”) has adopted fair value pricing procedures that are followed when a price for a security is not readily available or if a significant event has occurred that indicates the closing price of a security no longer represents the true value of that security. Fair value pricing determinations are made in good faith in accordance with these procedures. There are numerous criteria that will be given consideration in determining a fair value of a security, such as the trading volume of a security and markets, the values of other similar securities, and news events with direct bearing on a security or markets. Fair value pricing results in an estimated price for a security that reflects the amount the Fund might reasonably expect to receive in a current sale. Depending on the relative significance of the valuation inputs, these securities may be classified in either Level 2 or Level 3 of the fair value hierarchy.
| NOTES TO THE FINANCIAL STATEMENTS |
The Board has delegated day-to-day valuation matters to a Valuation Committee comprised of one or more representatives from Hennessy Advisors, Inc., the Fund’s investment advisor (the “Advisor”). The function of the Valuation Committee is to value securities where current and reliable market quotations are not readily available. All actions taken by the Valuation Committee are reviewed by the Board.
The Fund has performed an analysis of all existing investments to determine the significance and character of all inputs to their fair value determination. Various inputs are used to determine the value of the Fund’s investments. The inputs or methodology used for valuing securities are not necessarily an indication of the risk associated with investing in those securities. Details related to the fair valuation hierarchy of the Fund’s securities as of October 31, 2017, are included in the Schedule of Investments.
4). INVESTMENT TRANSACTIONS
Purchases and sales of investment securities (excluding government and short-term investments) for the Fund during fiscal year 2017 were $1,951,788 and $3,095,153, respectively.
There were no purchases or sales/maturities of long-term U.S. government securities for the Fund during fiscal year 2017.
The Fund is permitted to purchase or sell securities from or to another fund in the Hennessy Funds family of funds (the “Hennessy Funds”) under specified conditions outlined in procedures adopted by the Board. The procedures have been designed to ensure that any purchase or sale of securities by the Fund from or to another Hennessy Fund complies with Rule 17a-7 of the Investment Company Act of 1940, as amended. For fiscal year 2017, the Fund did not engage in purchases or sales of securities pursuant to Rule 17a-7 of the Investment Company Act of 1940, as amended.
5). INVESTMENT MANAGEMENT FEE AND OTHER TRANSACTIONS WITH AFFILIATES
The Advisor provides the Fund with investment management services under an Investment Advisory Agreement. The Advisor provides all investment advice, office space, and facilities, as well as most of the personnel needed by the Fund. As compensation for its services, the Advisor is entitled to a monthly fee from the Fund. The fee is based upon the average daily net assets of the Fund at an annual rate of 0.60%. The net investment advisory fees expensed by the Fund during fiscal year 2017 are included in the Statement of Operations.
The Board has approved a Shareholder Servicing Agreement for the Fund, which was instituted to compensate the Advisor for the non-investment management services it provides to the Fund. The Shareholder Servicing Agreement provides for a monthly fee paid to the Advisor at an annual rate of 0.10% of the average daily net assets of the Fund. The shareholder service fees expensed by the Fund during fiscal year 2017 are included in the Statement of Operations.
The Fund has adopted a plan pursuant to Rule 12b-1 under the Investment Company Act of 1940, as amended, that authorizes payments in connection with the distribution of the Fund’s shares at an annual rate of up to 0.25% of the Fund’s average daily net assets. Even though the authorized rate is up to 0.25%, the Fund is currently only using up to 0.15% of its average daily net assets for such purpose. Amounts paid under the plan may be spent on any activities or expenses primarily intended to result in the sale of shares, including, but not limited to, advertising, shareholder account servicing, the printing and mailing of prospectuses to other than current shareholders, the printing and mailing of sales literature, and compensation for sales and marketing activities or to financial institutions and others, such as dealers and distributors. The distribution fees expensed by the Fund during fiscal year 2017 are included in the Statement of Operations.
| HENNESSY FUNDS | 1-800-966-4354 | |
The Fund has entered into agreements with various brokers, dealers, and financial intermediaries in connection with the sale of shares of the Fund. The agreements provide for periodic payments by the Fund to the brokers, dealers, and financial intermediaries for providing certain shareholder maintenance services (sub-transfer agent expenses). These shareholder services include the pre-processing and quality control of new accounts, shareholder correspondence, answering customer inquiries regarding account status, and facilitating shareholder telephone transactions. The sub-transfer agent fees expensed by the Fund during fiscal year 2017 are included in the Statement of Operations.
U.S. Bancorp Fund Services, LLC (“USBFS”) provides the Fund with administrative, fund accounting, and transfer agent services and necessary office equipment. As administrator, USBFS is responsible for activities such as (i) preparing various federal and state regulatory filings, reports, and returns for the Fund, (ii) preparing reports and materials to be supplied to the Board, (iii) monitoring the activities of the Fund’s custodian, transfer agent, and accountants, and (iv) coordinating the preparation and payment of the Fund’s expenses and reviewing the Fund’s expense accruals. U.S. Bank, N.A., an affiliate of USBFS, serves as the Fund’s custodian. The servicing agreements between the Trust, USBFS, and U.S. Bank N.A. contain a fee schedule that is inclusive of administrative, fund accounting, custody, and transfer agent fees. The administrative, fund accounting, custody, and transfer agent fees expensed by the Fund during fiscal year 2017 are included in the Statement of Operations.
Quasar Distributors, LLC acts as the Fund’s principal underwriter in a continuous public offering of the Fund’s shares. Quasar Distributors, LLC is an affiliate of USBFS and U.S. Bank, N.A.
The officers of the Fund are affiliated with the Advisor. Such officers, with the exception of the Chief Compliance Officer and the Senior Compliance Officer, receive no compensation from the Fund for serving in their respective roles. The Fund, along with the other Hennessy Funds, makes reimbursement payments, on an equal basis, to the Advisor for a portion of the salary and benefits associated with the office of the Chief Compliance Officer and for all of the salary and benefits associated with the office of the Senior Compliance Officer. The compliance fees expensed by the Fund during fiscal year 2017 are included in the Statement of Operations.
6). GUARANTEES AND INDEMNIFICATIONS
Under the Hennessy Funds’ organizational documents, their officers and trustees are indemnified by the Hennessy Funds against certain liabilities arising out of the performance of their duties to the Hennessy Funds. Additionally, in the normal course of business, the Hennessy Funds enter into contracts with service providers that contain general indemnification clauses. The Fund’s maximum exposure under these arrangements is unknown as this would involve future claims that may be made against the Fund that have not yet occurred. Currently, the Fund expects the risk of loss to be remote.
7). LINE OF CREDIT
The Fund has an uncommitted line of credit with the other Hennessy Funds in the amount of the lesser of (i) $100,000,000 or (ii) 33.33% of each Hennessy Fund’s net assets, or 30% for the Hennessy Gas Utility Fund and 10% for the Fund, intended to provide short-term financing, if necessary, subject to certain restrictions, in connection with shareholder redemptions. The credit facility is with the Hennessy Funds’ custodian bank, U.S. Bank, N.A. Borrowings under this arrangement bear interest at the bank’s prime rate and are secured by all of the Fund’s assets (as to its own borrowings only). During fiscal year 2017, the Fund did not have any borrowings outstanding under the line of credit.
| NOTES TO THE FINANCIAL STATEMENTS |
8). FEDERAL TAX INFORMATION
As of October 31, 2017, the components of accumulated earnings (losses) for income tax purposes were as follows:
| | | Investments | |
| Cost of investments for tax purposes | | $ | 11,552,368 | |
| Gross tax unrealized appreciation | | $ | 980,319 | |
| Gross tax unrealized depreciation | | | (226,073 | ) |
| Net tax unrealized appreciation | | $ | 754,246 | |
| Undistributed ordinary income | | $ | 68,742 | |
| Undistributed long-term capital gains | | | 787,564 | |
| Total distributable earnings | | $ | 856,306 | |
| Other accumulated gain | | $ | — | |
| Total accumulated gain | | $ | 1,610,552 | |
The difference between book-basis unrealized appreciation/depreciation (as shown in the Statement of Assets and Liabilities) and tax-basis unrealized appreciation/depreciation (as shown above) is attributable primarily to wash sales.
At October 31, 2017, the Fund had no tax basis capital losses to offset future capital gains.
At October 31, 2017, the Fund did not defer, on a tax basis, any late-year ordinary losses. Late-year ordinary losses are net ordinary losses incurred after December 31, 2016, but within the taxable year, that are deemed to arise on the first day of the Fund’s next taxable year.
During fiscal years 2017 and 2016, the tax character of distributions paid by the Fund was as follows:
| | | Year Ended | | | Year Ended | |
| | | October 31, 2017 | | | October 31, 2016 | |
Ordinary income(1) | | $ | 91,227 | | | $ | 66,296 | |
| Long-term capital gain | | | 802,209 | | | | 238,468 | |
| | | $ | 893,436 | | | $ | 304,764 | |
(1) Ordinary income includes short-term gain/loss.
9). CHANGE IN AUDITOR DISCLOSURE
On September 11, 2017, the Trust, by action of the Audit Committee of the Board and on behalf of the Fund, the Hennessy Cornerstone Growth Fund, the Hennessy Cornerstone Mid Cap 30 Fund, the Hennessy Cornerstone Large Growth Fund, the Hennessy Cornerstone Value Fund, the Hennessy Total Return Fund, the Hennessy Japan Fund, and the Hennessy Japan Small Cap Fund (collectively, the “Applicable Funds”), dismissed KPMG LLP (“KPMG”) and engaged Tait, Weller & Baker LLP (“Tait Weller”) to serve as the independent registered public accounting firm to audit the financial statements of all series of the Trust for fiscal year 2017. Tait Weller previously served as the independent registered public accounting firm for the series of the Trust that are not one of the Applicable Funds.
KPMG’s reports on the financial statements for the Applicable Funds for each of fiscal years 2015 and 2016 contained no adverse opinion or disclaimer of opinion, nor were they qualified or modified as to uncertainty, audit scope, or accounting principles. During fiscal years 2015 and 2016 and the interim period of November 1, 2016, through September 11, 2017 (the “Interim Period”), there were no (i) disagreements with KPMG on any matter of accounting principles or practices, financial statement disclosure, or auditing scope or procedure, which disagreements, if not resolved to the satisfaction of
| HENNESSY FUNDS | 1-800-966-4354 | |
KPMG, would have caused it to make reference to the subject matter of the disagreements in connection with its reports on the Applicable Funds’ financial statements for such years, nor (ii) “reportable events” of the kind described in Item 304(a)(1)(v) of Regulation S-K under the Securities Exchange Act of 1934, as amended.
During fiscal years 2015 and 2016 and the Interim Period, neither the Applicable Funds nor anyone on behalf of the Applicable Funds has consulted Tait Weller on items that concerned (a) the application of accounting principles to a specified transaction, either completed or proposed, or the type of audit opinion that might be rendered on an Applicable Fund’s financial statements, or (b) the subject of a disagreement (as defined in paragraph (a)(1)(iv) of Item 304 of Regulation S-K and related instructions) or reportable events (as described in paragraph (a)(1)(v) of Item 304 of Regulation S-K). The selection of Tait Weller does not reflect any disagreements or dissatisfaction by the Applicable Funds, the Board, or the Audit Committee with the performance of KPMG.
10). EVENTS SUBSEQUENT TO YEAR END
Management has evaluated the Fund’s related events and transactions that occurred subsequent to October 31, 2017, through the date of issuance of the Fund’s financial statements. Other than as disclosed below, management has determined that there were no subsequent events requiring recognition or disclosure in the financial statements.
On December 7, 2017, capital gains were declared and paid to shareholders of record on December 6, 2017, as follows:
| | Long-term | Short-term |
| Investor Class | $0.81507 | $0.06435 |
| NOTES/REPORT OF INDEPENDENT REGISTERED PUBLIC ACCOUNTING FIRM |
Report of Independent Registered Public
Accounting Firm
To the Board of Trustees of Hennessy Funds Trust
and the Shareholders of the Hennessy Balanced Fund
Novato, CA
We have audited the accompanying statement of assets and liabilities, including the schedule of investments, of the Hennessy Balanced Fund (the “Fund”), a series of Hennessy Funds Trust as of October 31, 2017, and the related statement of operations, the statement of changes in net assets, and the financial highlights for the year then ended. The statement of changes in net assets for the year ended October 31, 2016 and the financial highlights for each of the four years in the period ended October 31, 2016 have been audited by other auditors, whose report dated December 22, 2016 expressed unqualified opinions on such financial statements and financial highlights. These financial statements and financial highlights are the responsibility of the Fund’s management. Our responsibility is to express an opinion on these financial statements and financial highlights based on our audit.
We conducted our audit in accordance with the standards of the Public Company Accounting Oversight Board (United States). Those standards require that we plan and perform the audit to obtain reasonable assurance about whether the financial statements and financial highlights are free of material misstatement. The Fund is not required to have, nor were we engaged to perform, an audit of the Fund’s internal control over financial reporting. Our audit included consideration of internal control over financial reporting as a basis for designing audit procedures that are appropriate in the circumstances, but not for the purposes of expressing an opinion on the effectiveness of the Fund’s internal control over financial reporting. Accordingly, we express no such opinion. An audit includes examining, on a test basis, evidence supporting the amounts and disclosures in the financial statements. Our procedures included confirmation of securities owned as of October 31, 2017, by correspondence with the custodian. An audit also includes assessing the accounting principles used and significant estimates made by management, as well as evaluating the overall financial statement presentation. We believe that our audit provides a reasonable basis for our opinion.
In our opinion, the financial statements and financial highlights referred to above present fairly, in all material respects, the financial position of the Hennessy Balanced Fund as of October 31, 2017, the results of its operations, the changes in its net assets, and the financial highlights for the year then ended, in conformity with accounting principles generally accepted in the United States of America.
TAIT, WELLER & BAKER LLP
Philadelphia, Pennsylvania
December 22, 2017
| HENNESSY FUNDS | 1-800-966-4354 | |
Trustees and Officers of the Fund (Unaudited)
The business and affairs of the Funds are managed under the direction of the Board of Trustees of the Trust, and the Board of Trustees elects the Officers of the Trust. Beginning in March 2015, the Board of Trustees has from time to time appointed advisers to the Board of Trustees (“Advisers”), with the intention of having qualified individuals serve in an advisory capacity in order to garner experience in the mutual fund and asset management industry and be considered as potential Trustees in the future. There are currently three Advisers to the Board of Trustees: Brian Alexander, Doug Franklin, and Claire Knoles. As Advisers, Mr. Alexander, Mr. Franklin, and Ms. Knoles attend meetings of the Board and act as non-voting participants. Information pertaining to the Trustees, Advisers, and the Officers of the Trust is set forth below. The Trustees and Officers serve until their successors are duly elected and qualified or until their earlier death, resignation, or removal. Each of the Trustees oversees 14 Hennessy Funds. Unless otherwise indicated, the address of all persons listed below is 7250 Redwood Boulevard, Suite 200, Novato, CA 94945. The Fund’s Statement of Additional Information includes more information about the persons listed below and is available, without charge, upon request by calling 1-800-966-4354.
| | | | Other |
| | | | Directorships |
| | | | Held Outside |
| Name, (Year of Birth), | | | of Fund |
| and Position Held | Start Date | Principal Occupation(s) | Complex During |
with the Trust | of Service | During Past Five Years | Past Five Years(1) |
| | | |
| Disinterested Trustees and Advisers | | |
| | | | |
| J. Dennis DeSousa | January 1996 | Mr. DeSousa is a real estate investor. | None. |
| (1936) | | | |
| Trustee | | | |
| | | | |
| Robert T. Doyle | January 1996 | Mr. Doyle has been the Sheriff of | None. |
| (1947) | | Marin County, California since 1996. | |
| Trustee | | | |
| | | | |
| Gerald P. Richardson | May 2004 | Mr. Richardson is an independent | None. |
| (1945) | | consultant in the securities industry. | |
| Trustee | | | |
| | | | |
| Brian Alexander | March 2015 | Mr. Alexander has been employed | None. |
| (1981) | | by Sutter Health Novato Community | |
| Adviser to the Board | | Hospital since 2012, first as an | |
| | | Assistant Administrator and then, | |
| | | beginning in 2013, as the Chief | |
| | | Administrative Officer. From 2011 | |
| | | through 2012, Mr. Alexander was | |
| | | employed by Sutter Health West Bay | |
| | | Region as the Regional Director of | |
| | | Strategic Decision Support. | |
| TRUSTEES AND OFFICERS OF THE FUND |
| | | | Other |
| | | | Directorships |
| | | | Held Outside |
| Name, (Year of Birth), | | | of Fund |
| and Position Held | Start Date | Principal Occupation(s) | Complex During |
with the Trust | of Service | During Past Five Years | Past Five Years(1) |
| | | | |
| Doug Franklin | March 2016 | Mr. Franklin is a retired insurance | None. |
| (1964) | | industry executive. From 1987 | |
| Adviser to the Board | | through 2015, he was employed | |
| | | by Allianz-Fireman’s Fund Insurance | |
| | | Company in various positions, | |
| | | including Chief Actuary and | |
| | | Chief Risk Officer. | |
| | | | |
| Claire Knoles | December 2015 | Ms. Knoles is a founder of Kiosk and | None. |
| (1974) | | has served as its Chief Operating | |
| Adviser to the Board | | Officer since 2004. Kiosk is a full | |
| | | service marketing agency with | |
| | | offices in the San Francisco Bay | |
| | | Area, Toronto, and Liverpool, UK. | |
| | | | |
Interested Trustee(2) | | | |
| | | | |
| Neil J. Hennessy | January 1996 as | Mr. Hennessy has been employed by | Hennessy |
| (1956) | a Trustee and | Hennessy Advisors, Inc. since 1989 | Advisors, Inc. |
| Trustee, Chairman of | June 2008 as | and currently serves as its President, | |
| the Board, Chief | an Officer | Chairman and Chief Executive Officer. | |
| Investment Officer, | | | |
| Portfolio Manager, | | | |
| and President | | | |
| Name, (Year of Birth), | | |
| and Position Held | Start Date | Principal Occupation(s) |
with the Trust | of Service | During Past Five Years |
| | | |
| Officers | | |
| | | |
| Teresa M. Nilsen | January 1996 | Ms. Nilsen has been employed by Hennessy Advisors, Inc. |
| (1966) | | since 1989 and currently serves as its Executive Vice President, |
| Executive Vice President | | Chief Operations Officer, Chief Financial Officer, and Secretary. |
| and Treasurer | | |
| | | |
| Daniel B. Steadman | March 2000 | Mr. Steadman has been employed by Hennessy Advisors, Inc. |
| (1956) | | since 2000 and currently serves as its Executive Vice President |
| Executive Vice President | | and Chief Compliance Officer. |
| and Secretary | | |
| | | |
| Brian Carlson | December 2013 | Mr. Carlson has been employed by Hennessy Advisors, Inc. |
| (1972) | | since December 2013. Mr. Carlson was previously a co-founder |
| Senior Vice President and | | and principal of Trivium Consultants, LLC from February 2011 |
| Head of Distribution | | through November 2013. |
| | | |
| Jennifer Cheskiewicz | June 2013 | Ms. Cheskiewicz has been employed by Hennessy Advisors, Inc. |
| (1977) | | as its General Counsel since June 2013. She previously served |
| Senior Vice President and | | as in-house counsel to Carlson Capital, L.P., an SEC-registered |
| Chief Compliance Officer | | investment advisor to several private funds, from |
| | | February 2010 to May 2013. |
| HENNESSY FUNDS | 1-800-966-4354 | |
| Name, (Year of Birth), | | |
| and Position Held | Start Date | Principal Occupation(s) |
with the Trust | of Service | During Past Five Years |
| | | |
| David Ellison | October 2012 | Mr. Ellison has been employed by Hennessy Advisors, Inc. since |
(1958)(3) | | October 2012. He has served as a Portfolio Manager of the |
| Senior Vice President | | Hennessy Small Cap Financial Fund and the Hennessy Large |
| and Portfolio Manager | | Cap Financial Fund since inception. Mr. Ellison also served as a |
| | | Portfolio Manager of the Hennessy Technology Fund from its |
| | | inception until February 2017. Mr. Ellison served as Director, |
| | | CIO and President of FBR Fund Advisers, Inc. from |
| | | December 1999 to October 2012. |
| | | |
| Ryan Kelley | March 2013 | Mr. Kelley has been employed by Hennessy Advisors, Inc. since |
(1972)(4) | | October 2012. He has served as a Portfolio Manager of the |
| Vice President and | | Hennessy Gas Utility Fund, the Hennessy Small Cap Financial |
| Portfolio Manager | | Fund, and the Hennessy Large Cap Financial Fund since |
| | | October 2014. He served as Co-Portfolio Manager of the same |
| | | funds from March 2013 through September 2014, and as a |
| | | Portfolio Analyst for the Hennessy Funds from October 2012 |
| | | through October 2014. Mr. Kelley has also served as a Portfolio |
| | | Manager of the Hennessy Cornerstone Growth Fund, the |
| | | Hennessy Cornerstone Mid Cap 30 Fund, the Hennessy |
| | | Cornerstone Large Growth Fund, and the Hennessy |
| | | Cornerstone Value Fund and as a Co-Portfolio Manager of the |
| | | Hennessy Technology Fund since February 2017. Mr. Kelley |
| | | served as Portfolio Manager of FBR Fund Advisers, Inc. from |
| | | January 2008 to October 2012. |
| | | |
| Brian Peery | March 2003 as | Mr. Peery has been employed by Hennessy Advisors, Inc. since |
| (1969) | an Officer and | 2002. He has served as a Portfolio Manager of the Hennessy |
| Senior Vice President | February 2011 | Cornerstone Growth Fund, the Hennessy Cornerstone Mid Cap |
| and Portfolio Manager | as a Co-Portfolio | 30 Fund, the Hennessy Cornerstone Large Growth Fund, the |
| | Manager or | Hennessy Cornerstone Value Fund, the Hennessy Total Return |
| | Portfolio Manager | Fund, and the Hennessy Balanced Fund since October 2014. |
| | | He served as Co-Portfolio Manager of the same funds from |
| | | February 2011 through September 2014. Mr. Peery has also |
| | | served as a Portfolio Manager of the Hennessy Gas Utility Fund |
| | | since February 2015 and as Lead Portfolio Manager of the |
| | | Hennessy Technology Fund since February 2017. |
| | | |
| Daniel P. Hennessy | December 2016 | Mr. Daniel Hennessy has been employed by Hennessy Advisors, |
| (1990) | | Inc. since 2015. He has served as an Associate Analyst of the |
| Assistant Vice President | | Hennessy Technology Fund since February 2017. He previously |
| and Associate Analyst | | served as a Mutual Fund Specialist at U.S. Bancorp Fund |
| | | Services, LLC from November 2014 to July 2015. Prior to that, |
| | | he attended the University of San Diego, where he earned a |
| | | degree in Political Science. |
_______________
(1) | Messrs. DeSousa, Doyle, Hennessy, and Richardson previously served on the Board of Directors of Hennessy Mutual Funds, Inc. (“HMFI”), The Hennessy Funds, Inc. (“HFI”), and Hennessy SPARX Funds Trust (“HSFT”). Pursuant to an internal reorganization effective as of February 28, 2014, the series of HFMI, HFI, and HSFT were reorganized into corresponding series of Hennessy Funds Trust that mirrored them. Subsequent to the reorganization, HFMI, HFI, and HSFT were dissolved. |
(2) | Mr. Hennessy is considered an “interested person,” as defined in the Investment Company Act of 1940, as amended, because he is an officer of the Hennessy Funds. |
(3) | The address of this officer is 101 Federal Street, Suite 1900, Boston, MA 02110. |
(4) | The address of this officer is 1340 Environ Way, Chapel Hill, NC 27517. |
| TRUSTEES AND OFFICERS OF THE FUND |
(This Page Intentionally Left Blank.)
| HENNESSY FUNDS | 1-800-966-4354 | |
Expense Example (Unaudited)
October 31, 2017
As a shareholder of the Fund, you incur two types of costs: (1) transaction costs, including sales charges (loads) on purchase payments, reinvested dividends, or other distributions, redemption fees, and exchange fees; and (2) ongoing costs, including management fees, service fees, and other Fund expenses. This Example is intended to help you understand your ongoing costs (in dollars) of investing in the Fund and to compare these costs with the ongoing costs of investing in other mutual funds. The Example is based on an investment of $1,000 invested at the beginning of the period and held for the entire period from May 1, 2017, through October 31, 2017.
Actual Expenses
The first line of the table below provides information about actual account values and actual expenses. Although the Fund charges no sales loads or transaction fees, you will be assessed fees for outgoing wire transfers, returned checks and stop payment orders at prevailing rates charged by U.S. Bancorp Fund Services, LLC, the Fund’s transfer agent. If you request that a redemption be made by wire transfer, currently a $15 fee is charged by the Fund’s transfer agent. IRA accounts will be charged a $15 annual maintenance fee. The example below includes, but is not limited to, management fees, shareholder servicing fees, fund accounting, custody, and transfer agent fees. However, the example below does not include portfolio trading commissions and related expenses, and other extraordinary expenses as determined under generally accepted accounting principles. You may use the information in this line, together with the amount you invested, to estimate the expenses that you paid over the period. Simply divide your account value by $1,000 (for example, an $8,600 account value divided by $1,000 = 8.6), then multiply the result by the number in the first line of the table under the heading entitled “Expenses Paid During Period” to estimate the expenses you paid on your account during this period.
Hypothetical Example for Comparison Purposes
The second line of the table below provides information about hypothetical account values and hypothetical expenses based on the Fund’s actual expense ratio and an assumed rate of return of 5% per year before expenses, which is not the Fund’s actual return. The hypothetical account values and expenses may not be used to estimate the actual ending account balance or expenses you paid for the period. You may use this information to compare the ongoing costs of investing in the Fund and other funds. To do so, compare this 5% hypothetical example with the 5% hypothetical examples that appear in the shareholder reports of the other funds. Please note that the expenses shown in the table are meant to highlight your ongoing costs only and do not reflect any transactional costs, such as sales charges (loads), or exchange fees. Therefore, the second line of the table is useful in comparing ongoing costs only, and will not help you determine the relative total costs of owning different funds. In addition, if these transactional costs were included, your costs would have been higher.
| | | | Expenses Paid |
| | Beginning | Ending | During Period(1) |
| | Account Value | Account Value | May 1, 2017 – |
| | May 1, 2017 | October 31, 2017 | October 31, 2017 |
| Investor Class | | | |
| Actual | $1,000.00 | $1,042.60 | $9.37 |
| Hypothetical (5% return before expenses) | $1,000.00 | $1,016.03 | $9.25 |
(1) | Expenses are equal to the Fund’s annualized expense ratio of 1.82% multiplied by the average account value over the period, multiplied by 184/365 days (to reflect one-half year period). |
| HENNESSY FUNDS | 1-800-966-4354 | |
How to Obtain a Copy of the Fund’s
Proxy Voting Policy and Proxy Voting Records
A description of the policies and procedures the Fund uses to determine how to vote proxies relating to portfolio securities is available without charge: (1) by calling 1-800-966-4354; (2) on the Hennessy Funds’ website at hennessyfunds.com/proxy-voting/policy.fs; or (3) on the U.S. Securities and Exchange Commission’s (the “SEC”) website at www.sec.gov. The Fund’s proxy voting record is available without charge on both the Hennessy Funds’ website at hennessyfunds.com/proxy-voting/vote.fs and the SEC’s website at www.sec.gov no later than August 31 for the prior 12 months ending June 30.
Quarterly Filings on Form N-Q
The Fund files a complete schedule of portfolio holdings with the SEC for the first and third quarters of each fiscal year on Form N-Q. The Fund’s Forms N-Q are made available on the SEC’s website at www.sec.gov. The Fund’s Forms N-Q may be reviewed and copied at the SEC’s Public Reference Room in Washington, DC, and information on the operation of the Public Reference Room may be obtained by calling 1-800-SEC-0330. Information included in the Fund’s Forms N-Q will also be available upon request by calling 1-800-966-4354.
Federal Tax Distribution Information
(Unaudited)
For fiscal year 2017, certain dividends paid by the Fund may be subject to a maximum tax rate of 23.8%, as provided for by the Jobs and Growth Tax Relief Reconciliation Act of 2003. The percentage of dividends declared from ordinary income designated as qualified dividend income was 100.00%.
For corporate shareholders, the percent of ordinary income distributions that qualified for the corporate dividends received deduction for fiscal year 2017 was 100.00%.
The percentage of taxable ordinary income distributions that are designated as short-term capital gain distributions under Section 871(k)(2)(C) of the Internal Revenue Code of 1986, as amended, for the Fund was 47.18%.
Householding
To help keep the Fund’s costs as low as possible, we generally deliver a single copy of most financial reports and prospectuses to shareholders who share an address, even if the accounts are registered under different names. This process, known as “householding,” does not apply to account statements. You may request an individual copy of a prospectus or financial report at any time. If you would like to receive separate mailings, please call U.S. Bancorp Fund Services, LLC at 1-800-261-6950 or 1-414-765-4124 and we will begin individual delivery within 30 days of your request. If your account is held through a financial institution or other intermediary, please contact them directly to request individual delivery.
| PROXY VOTING — PRIVACY POLICY |
Privacy Policy
We collect the following non-public personal information about you:
| | • | information we receive from you on or in applications or other forms, correspondence, or conversations, including, but not limited to, your name, address, phone number, social security number, assets, income, and date of birth; and |
| | • | information about your transactions with us, our affiliates, or others, including, but not limited to, your account number and balance, payment history, parties to transactions, cost basis information, and other financial information. |
We do not disclose any non-public personal information about our current or former shareholders to non-affiliated third parties, except as permitted by law. For example, we are permitted by law to disclose all of the information we collect, as described above, to our Transfer Agent to process your transactions. Furthermore, we restrict access to your non-public personal information to those persons who require such information to provide products or services to you. We maintain physical, electronic, and procedural safeguards that comply with federal standards to guard your non-public personal information.
In the event that you hold shares of the Fund through a financial intermediary, including, but not limited to, a broker-dealer, bank, or trust company, the privacy policy of your financial intermediary would govern how your non-public personal information will be shared with non-affiliated third parties.
| HENNESSY FUNDS | 1-800-966-4354 | |
For information, questions or assistance, please call
The Hennessy Funds
1-800-966-4354 or 1-415-899-1555
INVESTMENT ADVISOR
Hennessy Advisors, Inc.
7250 Redwood Boulevard, Suite 200
Novato, California 94945
ADMINISTRATOR,
TRANSFER AGENT,
DIVIDEND PAYING AGENT &
SHAREHOLDER SERVICING AGENT
U.S. Bancorp Fund Services, LLC
P.O. Box 701
Milwaukee, Wisconsin 53201-0701
CUSTODIAN
U.S. Bank N.A.
Custody Operations
1555 North River Center Drive, Suite 302
Milwaukee, Wisconsin 53212
TRUSTEES
Neil J. Hennessy
Robert T. Doyle
J. Dennis DeSousa
Gerald P. Richardson
COUNSEL
Foley & Lardner LLP
777 East Wisconsin Avenue
Milwaukee, Wisconsin 53202-5306
INDEPENDENT REGISTERED
PUBLIC ACCOUNTING FIRM
Tait, Weller & Baker LLP
1818 Market Street, Suite 2400
Philadelphia, Pennsylvania 19103
DISTRIBUTOR
Quasar Distributors, LLC
777 East Wisconsin Avenue
Milwaukee, Wisconsin 53202
hennessyfunds.com | 1-800-966-4354
This report has been prepared for shareholders and may be distributed to
others only if preceded or accompanied by a current prospectus.
ANNUAL REPORT
OCTOBER 31, 2017
HENNESSY GAS UTILITY FUND
Investor Class GASFX
Institutional Class HGASX
hennessyfunds.com | 1-800-966-4354
(This Page Intentionally Left Blank.)
Contents
| Letter to Shareholders | 2 |
| Performance Overview | 4 |
| Financial Statements | |
| Schedule of Investments | 7 |
| Statement of Assets and Liabilities | 11 |
| Statement of Operations | 12 |
| Statements of Changes in Net Assets | 13 |
| Financial Highlights | 14 |
| Notes to the Financial Statements | 17 |
| Report of Independent Registered Public Accounting Firm | 25 |
| Trustees and Officers of the Fund | 26 |
| Expense Example | 30 |
| Proxy Voting Policy and Proxy Voting Records | 32 |
| Quarterly Schedule of Investments | 32 |
| Federal Tax Distribution Information | 32 |
| Householding | 32 |
| Privacy Policy | 33 |
| HENNESSY FUNDS | 1-800-966-4354 | |
December 2017
Dear Hennessy Funds Shareholder:
Over the past year, global equity markets have made strong advances, fueled by continued, broad-based economic growth in most countries and regions, and in spite of a somewhat unsettling geopolitical backdrop.
U.S. stocks performed well in the first year of the new administration in Washington, and, ignoring the debate and the bluster, investors have continued to focus on what concerns them the most – tax reform, deregulation, and the hope of an increase in infrastructure spending. As we move into the final weeks of the calendar year, with the major indices reaching new highs, I find myself envisioning the Dow Jones Industrial Average building momentum toward 30,000.
Over the past 12 months, the U.S. economy has continued to grow at a steady rate of almost 2.5% on an annualized basis, as measured by GDP. Companies have added over 170,000 jobs per month on average over the past year, and the current unemployment rate of 4.1% is the lowest in 17 years. Consumer confidence is high and still rising, and corporate profits are at all-time highs. The Federal Reserve has been increasing interest rates, but at a gradual pace. The bond market has also continued to support the equity market and equity market valuations. Since December of last year, long bond yields have stayed within a narrow band, with the 10-year U.S. Treasury yield hovering in the 2.0% to 2.5% range, and remain low compared to historical averages. In my opinion, long bond yields have stayed low despite three increases in the Federal Funds rate over the last 12 months in part due to persistent low inflation.
Meanwhile, the prospective price-to-earnings multiples for the Dow Jones Industrial Average and S&P 500 Index are just above long-term averages at 19.5x and 19.9x, respectively. I believe these levels of stock valuation, while higher than a year ago, are still very reasonable. At the peak of the technology/dot-com bubble, U.S. equities sold at much higher multiples across the board than they do today, and bond yields were also much higher. In June of 1999, the Dow Jones Industrial Average sold at 28x earnings and the 10-year bond yield was close to 6%. Today, the Dow is selling at under 20x earnings and is offering a 2.2% dividend yield, on par with the yield of the 10-year government bond at 2.4%.
Equity markets in the U.S. have been rising for almost nine years, and financial media reports have speculated that this bull run will come to end, but why? I see no substantial reasons or indicators that a major correction is on the horizon. I remain confident that this bull market has room to run. Overall, investment fundamentals are strong. Corporate earnings are growing at a healthy rate, and companies are generating excess cash flow. Cash continues to build on corporate balance sheets, with $5.2 trillion in cash and short term investments among the S&P 500 Index companies as of October 31, 2017. If our government leaders can pass a meaningful tax reform bill and continue efforts toward regulatory relief, it could be icing on the cake for equities.
There have been, and will likely continue to be, downturns throughout this extended bull market. Since 2010, there have been 18 downturns in the market, 14 of which were between 5% and 10% and four of which were corrections of between 10% and 20%. Yet the market has bounced back following each pullback and then has moved higher. A correction is not the end of the bull market. What might signal that we are at the end of this bull market? Euphoria. And I still see no signs of euphoria in this market. In the past,
I have likened the current bull market to that of 1982-2000, and I am confident in the strength of the market today and believe the economy will continue its slow, but steady, growth into the coming year.
Thank you for your continued confidence and investment in our funds. If you have any questions or would like to speak with us directly, please don’t hesitate to call us at (800) 966-4354.
Best regards,
Neil J. Hennessy
President and Chief Investment Officer
Past performance does not guarantee future results.
Mutual fund investing involves risk. Principal loss is possible.
Opinions expressed are those of Neil Hennessy and are subject to change, are not guaranteed, and should not be considered investment advice.
The Dow Jones Industrial Average and S&P 500 Index are unmanaged indices commonly used to measure the performance of U.S. stocks. One cannot invest directly in an index.
Price to earnings is calculated by dividing a company’s market price per share by its earnings per share. Dividend yield is calculated as the annual dividends paid by a company divided by the price of a share of its stock. Cash flow provides an indication of a company’s financial strength and represents earnings before depreciation, amortization, and non-cash charges.
| HENNESSY FUNDS | 1-800-966-4354 | |
Performance Overview (Unaudited)
CHANGE IN VALUE OF $10,000 INVESTMENT
This graph illustrates the performance of an initial investment of $10,000 made in the Fund ten years ago and assumes the reinvestment of dividends.
AVERAGE ANNUAL TOTAL RETURN FOR PERIODS ENDED OCTOBER 31, 2017
| | One | Five | Ten |
| | Year | Years | Years |
| Hennessy Gas Utility Fund – | | | |
| Investor Class (GASFX) | 10.39% | 10.78% | 8.41% |
| Hennessy Gas Utility Fund – | | | |
Institutional Class (HGASX)(1) | 10.63% | 10.83% | 8.43% |
| AGA Stock Index | 11.82% | 11.96% | 9.35% |
| S&P 500 Index | 23.63% | 15.18% | 7.51% |
Expense ratios: 1.01% (Investor Class); 0.64% (Institutional Class)
(1) | The inception date of Institutional Class shares is March 1, 2017. Performance shown prior to the inception of Institutional Class shares reflects the performance of Investor Class shares and includes expenses that are not applicable to, and are higher than, those of Institutional Class shares. |
Performance data quoted represents past performance; past performance does not guarantee future results. The investment return and principal value of an investment will fluctuate so that an investor’s shares, when redeemed, may be worth more or less than their original cost. The performance table does not reflect the deduction of taxes that a shareholder would pay on Fund distributions or the redemption of Fund shares. Current performance of the Fund may be lower or higher than the performance quoted. Performance data current to the most recent month end may be obtained by visiting hennessyfunds.com. Performance for periods prior to October 26, 2012, is that of the FBR Gas Utility Index Fund.
The AGA Stock Index is a market capitalization-weighted index, adjusted monthly, consisting of member companies of the AGA. Performance for the AGA Stock Index is provided monthly by the American Gas Association. The S&P 500 Index is an unmanaged index commonly used to measure the performance of U.S. stocks. One cannot invest directly in an index.
The expense ratios presented are from the most recent prospectus. The expense ratios for the current reporting period are available in the Financial Highlights section of this report.
PERFORMANCE NARRATIVE
Portfolio Managers Ryan C. Kelley and Brian E. Peery
Performance:
For the 12-month period ended October 31, 2017, the Investor Class of the Hennessy Gas Utility Fund returned 10.39%, underperforming both the AGA Stock Index* and the S&P 500 Index, which returned 11.82% and 23.63% for the same period, respectively.
The Fund slightly underperformed its primary benchmark index, the AGA Stock Index, due to Fund expenses, the timing of cash flows, trading costs, and the impact of cash positions. The Fund also underperformed the broader domestic equity market, as represented by the S&P 500 Index, as a result of investor rotation out of Utilities and Energy companies and into less defensive sectors such as Technology. Among the sub-industries of the Fund, Gas Utilities performed the best, while midstream companies involved in the distribution of natural gas via major transmission pipelines generally detracted from performance. Merger and acquisition activity continued, although at a reduced rate from the prior fiscal year, with the number of completed acquisitions in the Fund’s portfolio dropping from seven to four.
On an individual company basis, major contributors to Fund performance included Cheniere Energy, Inc., Atmos Energy Corporation, and Sempra Energy, while major detractors included Plains GP Holdings LP, Enbridge, Inc., and Kinder Morgan, Inc. Three holdings were added to the Fund this year, including Fortis, Inc., Tellurian, Inc., and Algonquin Power & Utilities Corporation, which became a holding company after it acquired The Empire District Electric Company. The Fund continues to own all of the mentioned companies, except for The Empire District Electric Company. Four companies are no longer in the Fund due to acquisitions, including Spectra Energy Corporation, Gas Natural, Inc., Delta Natural Gas Company, Inc., and The Empire District Electric Company.
Portfolio Strategy:
The Fund’s objective is to maintain a high correlation with the AGA Stock Index. The Fund seeks to achieve this goal by owning all of the companies in the AGA Stock Index in substantially the same proportion as they appear in the AGA Stock Index. The AGA Stock Index is comprised of publicly traded members of the American Gas Association (AGA), a national trade association of natural gas distribution companies, and is generally rebalanced monthly. The investment thesis of the Fund is that competitive and stable pricing, abundant domestic supply, and new sources and uses of natural gas should lead to long-term, steady growth in demand and drive growth in natural gas distribution, which, in turn, should drive long-term growth in earnings of the companies in the Fund. In addition, we believe that natural gas’s position as the cleanest of the fossil fuels should also increase demand, particularly for electricity generation.
Investment Commentary:
Despite the underperformance versus the broader equity market this year, we believe the thesis of the Fund remains firmly intact. The supply and demand drivers of growth in natural gas volumes remain in place, and we believe the Fund presents investors with an attractive, total return product offering both income and long-term capital appreciation potential.
_______________
| * | The AGA Stock Index is a market capitalization-weighted index, consisting of member companies of the American Gas Association. Performance for the AGA Stock Index is provided monthly by the American Gas Association. |
| HENNESSY FUNDS | 1-800-966-4354 | |
Opinions expressed are those of the Portfolio Managers as of the date written and are subject to change, are not guaranteed, and should not be considered investment advice or an indication of trading intent.
The S&P 500 Index is an unmanaged index commonly used to measure the performance of U.S. stocks. One cannot invest directly in an index.
The Fund is non-diversified, meaning it may concentrate its assets in fewer individual holdings than a diversified fund, making it more exposed to individual stock volatility than a diversified fund. Investments in foreign securities may involve political, economic and currency risks, greater volatility, and differences in accounting methods. Investments are focused in the natural gas distribution and transmission industry; sector funds may be subject to a higher degree of market risk. Please see the Fund’s prospectus for a more complete discussion of these and other risks.
References to specific securities should not be considered a recommendation to buy or sell any security. Fund holdings and sector allocations are subject to change. Please refer to the Schedule of Investments included in this report for additional portfolio information.
Cash flow provides an indication of a company’s financial strength and represents earnings before depreciation, amortization, and non-cash charges. Correlation measures the degree to which the fund’s performance is related to benchmark index. A high correlation to its benchmark is generally considered to be favorable for the fund if its investment thesis closely follows the benchmark.
Earnings growth is not a measure of the Fund’s future performance.
| PERFORMANCE OVERVIEW/SCHEDULE OF INVESTMENTS |
Financial Statements
Schedule of Investments as of October 31, 2017 |
HENNESSY GAS UTILITY FUND
(% of Net Assets)
| TOP TEN HOLDINGS (EXCLUDING CASH/CASH EQUIVALENTS) | % NET ASSETS |
| Cheniere Energy, Inc. | 5.02% |
| Sempra Energy | 5.01% |
| Atmos Energy Corp. | 5.00% |
| Dominion Resources, Inc. | 4.97% |
| TransCanada Corp. | 4.76% |
| National Grid PLC – ADR | 4.74% |
| Kinder Morgan, Inc. | 4.71% |
| Enbridge, Inc. | 4.68% |
| PG&E Corp. | 4.05% |
| The Southern Co. | 3.51% |
Note: For presentation purposes, the Fund has grouped some of the industry categories. For purposes of categorizing securities for compliance with section 8(b)(1) of the Investment Company Act of 1940, as amended, the Fund uses more specific industry classifications.
| HENNESSY FUNDS | 1-800-966-4354 | |
| COMMON STOCKS – 98.35% | | Number | | | | | | % of | |
| | | of Shares | | | Value | | | Net Assets | |
| Energy – 20.87% | | | | | | | | | |
| Cheniere Energy, Inc. (a) | | | 1,493,417 | | | $ | 69,802,311 | | | | 5.02 | % |
| Enbridge, Inc. (b) | | | 1,693,765 | | | | 65,142,202 | | | | 4.68 | % |
| EQT Corp. | | | 230,482 | | | | 14,414,344 | | | | 1.04 | % |
| Kinder Morgan, Inc. | | | 3,619,101 | | | | 65,541,919 | | | | 4.71 | % |
| Tellurian, Inc. (a) | | | 856,190 | | | | 9,221,166 | | | | 0.66 | % |
| TransCanada Corp. (b) | | | 1,394,853 | | | | 66,227,621 | | | | 4.76 | % |
| | | | | | | | 290,349,563 | | | | 20.87 | % |
| | | | | | | | | | | | | |
| Financials – 0.58% | | | | | | | | | | | | |
| Berkshire Hathaway, Inc., Class A (a) | | | 29 | | | | 8,133,630 | | | | 0.58 | % |
| | | | | | | | | | | | | |
| Utilities – 76.90% | | | | | | | | | | | | |
| Algonquin Power & Utilities Corp. (b) | | | 411,664 | | | | 4,400,688 | | | | 0.32 | % |
| ALLETE, Inc. | | | 2,175 | | | | 170,411 | | | | 0.01 | % |
| Alliant Energy Corp. | | | 147,508 | | | | 6,381,196 | | | | 0.46 | % |
| Ameren Corp. | | | 165,240 | | | | 10,243,228 | | | | 0.74 | % |
| Atmos Energy Corp. | | | 797,086 | | | | 69,537,783 | | | | 5.00 | % |
| Avangrid, Inc. | | | 90,200 | | | | 4,666,046 | | | | 0.33 | % |
| Avista Corp. | | | 98,572 | | | | 5,149,401 | | | | 0.37 | % |
| Black Hills Corp. | | | 215,947 | | | | 14,092,701 | | | | 1.01 | % |
| Centerpoint Energy, Inc. | | | 936,028 | | | | 27,687,708 | | | | 1.99 | % |
| Chesapeake Utilities Corp. | | | 93,158 | | | | 7,503,877 | | | | 0.54 | % |
| CMS Energy Corp. | | | 652,498 | | | | 31,561,328 | | | | 2.27 | % |
| Consolidated Edison, Inc. | | | 410,436 | | | | 35,318,018 | | | | 2.54 | % |
| Corning Natural Gas Holding Corp. | | | 18,849 | | | | 356,254 | | | | 0.02 | % |
| Dominion Resources, Inc. | | | 851,796 | | | | 69,114,727 | | | | 4.97 | % |
| DTE Energy Co. | | | 311,104 | | | | 34,364,548 | | | | 2.47 | % |
| Duke Energy Corp. | | | 441,287 | | | | 38,970,055 | | | | 2.80 | % |
| Entergy Corp. | | | 11,960 | | | | 1,031,670 | | | | 0.07 | % |
| Eversource Energy | | | 253,875 | | | | 15,902,730 | | | | 1.14 | % |
| Exelon Corp. | | | 376,631 | | | | 15,144,333 | | | | 1.09 | % |
| Fortis, Inc. (b) | | | 520,776 | | | | 19,180,180 | | | | 1.38 | % |
| MDU Resources Group, Inc. | | | 638,407 | | | | 17,460,431 | | | | 1.25 | % |
| MGE Energy, Inc. | | | 48,179 | | | | 3,182,223 | | | | 0.23 | % |
| National Fuel Gas Co. | | | 433,424 | | | | 25,160,263 | | | | 1.81 | % |
| National Grid PLC – ADR (b) | | | 1,080,345 | | | | 65,955,044 | | | | 4.74 | % |
The accompanying notes are an integral part of these financial statements.
| COMMON STOCKS | | Number | | | | | | % of | |
| | | of Shares | | | Value | | | Net Assets | |
| Utilities (Continued) | | | | | | | | | |
| New Jersey Resources Corp. | | | 454,334 | | | $ | 20,195,146 | | | | 1.45 | % |
| NiSource, Inc. | | | 1,491,781 | | | | 39,338,265 | | | | 2.83 | % |
| Northwest Natural Gas Co. | | | 224,303 | | | | 14,882,504 | | | | 1.07 | % |
| NorthWestern Corp. | | | 81,398 | | | | 4,825,273 | | | | 0.35 | % |
| ONE Gas, Inc. | | | 398,675 | | | | 30,690,002 | | | | 2.21 | % |
| PG&E Corp. | | | 974,349 | | | | 56,288,142 | | | | 4.05 | % |
| PPL Corp. | | | 480,819 | | | | 18,059,562 | | | | 1.30 | % |
| Public Service Enterprise Group, Inc. | | | 646,890 | | | | 31,826,988 | | | | 2.29 | % |
| RGC Resources, Inc. | | | 57,949 | | | | 1,685,736 | | | | 0.12 | % |
| SCANA Corp. | | | 177,466 | | | | 7,655,883 | | | | 0.55 | % |
| Sempra Energy | | | 593,840 | | | | 69,776,200 | | | | 5.01 | % |
| South Jersey Industries, Inc. | | | 416,671 | | | | 14,154,314 | | | | 1.02 | % |
| Southwest Gas Holdings, Inc. | | | 332,217 | | | | 27,371,359 | | | | 1.97 | % |
| Spire, Inc. | | | 312,691 | | | | 24,686,954 | | | | 1.77 | % |
| The Southern Co. | | | 935,200 | | | | 48,817,440 | | | | 3.51 | % |
| UGI Corp. | | | 343,752 | | | | 16,451,971 | | | | 1.18 | % |
| Unitil Corp. | | | 63,498 | | | | 3,301,896 | | | | 0.24 | % |
| Vectren Corp. | | | 342,628 | | | | 23,346,672 | | | | 1.68 | % |
| WEC Energy Group, Inc. | | | 678,740 | | | | 45,740,289 | | | | 3.29 | % |
| WGL Holdings, Inc. | | | 305,842 | | | | 26,210,659 | | | | 1.88 | % |
| Xcel Energy, Inc. | | | 445,399 | | | | 22,056,159 | | | | 1.58 | % |
| | | | | | | | 1,069,896,257 | | | | 76.90 | % |
| Total Common Stocks | | | | | | | | | | | | |
| (Cost $824,276,449) | | | | | | | 1,368,379,450 | | | | 98.35 | % |
| | | | | | | | | | | | | |
| PARTNERSHIPS – 0.97% | | | | | | | | | | | | |
| | | | | | | | | | | | | |
| Energy – 0.97% | | | | | | | | | | | | |
| Plains GP Holdings L.P., Class A | | | 660,755 | | | | 13,479,402 | | | | 0.97 | % |
| | | | | | | | | | | | | |
| Total Partnerships | | | | | | | | | | | | |
| (Cost $19,632,611) | | | | | | | 13,479,402 | | | | 0.97 | % |
The accompanying notes are an integral part of these financial statements.
| HENNESSY FUNDS | 1-800-966-4354 | |
| SHORT-TERM INVESTMENTS – 0.40% | | Number | | | | | | % of | |
| | | of Shares | | | Value | | | Net Assets | |
| Money Market Funds – 0.40% | | | | | | | | | |
| Fidelity Government Portfolio, Institutional Class, 0.92% (c) | | | 5,568,889 | | | $ | 5,568,889 | | | | 0.40 | % |
| | | | | | | | | | | | | |
| Total Short-Term Investments | | | | | | | | | | | | |
| (Cost $5,568,889) | | | | | | | 5,568,889 | | | | 0.40 | % |
| | | | | | | | | | | | | |
| Total Investments | | | | | | | | | | | | |
| (Cost $849,477,949) – 99.72% | | | | | | | 1,387,427,741 | | | | 99.72 | % |
| Other Assets in Excess of Liabilities – 0.28% | | | | | | | 3,893,791 | | | | 0.28 | % |
TOTAL NET ASSETS – 100.00% | | | | | | $ | 1,391,321,532 | | | | 100.00 | % |
Percentages are stated as a percent of net assets.
ADR – American Depositary Receipt
| (a) | Non-income producing security. |
| (b) | U.S. traded security of a foreign corporation. |
| (c) | The rate listed is the fund’s 7-day yield as of October 31, 2017. |
Summary of Fair Value Exposure at October 31, 2017
The following is a summary of the inputs used to value the Fund’s net assets as of October 31, 2017 (see Note 3 in the accompanying notes to the financial statements):
| Common Stocks | | Level 1 | | | Level 2 | | | Level 3 | | | Total | |
| Energy | | $ | 290,349,563 | | | $ | — | | | $ | — | | | $ | 290,349,563 | |
| Financials | | | 8,133,630 | | | | — | | | | — | | | | 8,133,630 | |
| Utilities | | | 1,069,896,257 | | | | — | | | | — | | | | 1,069,896,257 | |
| Total Common Stocks | | $ | 1,368,379,450 | | | $ | — | | | $ | — | | | $ | 1,368,379,450 | |
| Partnerships | | | | | | | | | | | | | | | | |
| Energy | | $ | 13,479,402 | | | $ | — | | | $ | — | | | $ | 13,479,402 | |
| Total Partnerships | | $ | 13,479,402 | | | $ | — | | | $ | — | | | $ | 13,479,402 | |
| Short-Term Investments | | | | | | | | | | | | | | | | |
| Money Market Funds | | $ | 5,568,889 | | | $ | — | | | $ | — | | | $ | 5,568,889 | |
| Total Short-Term Investments | | $ | 5,568,889 | | | $ | — | | | $ | — | | | $ | 5,568,889 | |
| Total Investments | | $ | 1,387,427,741 | | | $ | — | | | $ | — | | | $ | 1,387,427,741 | |
Transfers between levels are recognized at the end of the reporting period. During the year ended October 31, 2017, the Fund recognized no transfers between levels.
The accompanying notes are an integral part of these financial statements.
| SCHEDULE OF INVESTMENTS/STATEMENT OF ASSETS AND LIABILITIES |
Financial Statements
Statement of Assets and Liabilities as of October 31, 2017 |
| ASSETS: | | | |
| Investments in securities, at value (cost $849,477,949) | | $ | 1,387,427,741 | |
| Dividends and interest receivable | | | 1,062,416 | |
| Receivable for fund shares sold | | | 534,011 | |
| Receivable for securities sold | | | 5,190,090 | |
| Return of capital receivable | | | 198,227 | |
| Prepaid expenses and other assets | | | 47,411 | |
| Total Assets | | | 1,394,459,896 | |
| | | | | |
| LIABILITIES: | | | | |
| Payable for fund shares redeemed | | | 1,559,905 | |
| Payable to advisor | | | 475,495 | |
| Payable to administrator | | | 230,255 | |
| Payable to auditor | | | 20,697 | |
| Accrued distribution fees | | | 404,077 | |
| Accrued service fees | | | 112,350 | |
| Accrued trustees fees | | | 5,579 | |
| Accrued expenses and other payables | | | 330,006 | |
| Total Liabilities | | | 3,138,364 | |
| NET ASSETS | | $ | 1,391,321,532 | |
| | | | | |
| NET ASSETS CONSIST OF: | | | | |
| Capital stock | | $ | 931,471,585 | |
| Accumulated net realized loss on investments | | | (78,103,496 | ) |
| Unrealized net appreciation on investments | | | 537,953,443 | |
| Total Net Assets | | $ | 1,391,321,532 | |
| | | | | |
| NET ASSETS | | | | |
| Investor Class: | | | | |
| Shares authorized (no par value) | | Unlimited | |
| Net assets applicable to outstanding Investor Class shares | | $ | 1,306,697,381 | |
| Shares issued and outstanding | | | 43,059,579 | |
| Net asset value, offering price and redemption price per share | | $ | 30.35 | |
| | | | | |
| Institutional Class: | | | | |
| Shares authorized (no par value) | | Unlimited | |
| Net assets applicable to outstanding Institutional Class shares | | $ | 84,624,151 | |
| Shares issued and outstanding | | | 2,791,301 | |
| Net asset value, offering price and redemption price per share | | $ | 30.32 | |
The accompanying notes are an integral part of these financial statements.
| HENNESSY FUNDS | 1-800-966-4354 | |
Financial Statements
Statement of Operations for the year ended October 31, 2017 |
| INVESTMENT INCOME: | | | |
Dividend income(1) | | $ | 47,951,870 | |
| Interest income | | | 37,203 | |
| Total investment income | | | 47,989,073 | |
| | | | | |
| EXPENSES: | | | | |
| Investment advisory fees (See Note 5) | | | 5,750,174 | |
| Sub-transfer agent expenses – Investor Class (See Note 5) | | | 2,793,527 | |
| Sub-transfer agent expenses – Institutional Class (See Note 5) | | | 10,850 | |
| Distribution fees – Investor Class (See Note 5) | | | 2,136,021 | |
| Service fees – Investor Class (See Note 5) | | | 1,423,982 | |
| Administration, fund accounting, custody and transfer agent fees (See Note 5) | | | 1,372,847 | |
| Reports to shareholders | | | 118,167 | |
| Federal and state registration fees | | | 55,636 | |
| Legal fees | | | 30,485 | |
| Compliance expense (See Note 5) | | | 28,705 | |
| Trustees’ fees and expenses | | | 20,844 | |
| Audit fees | | | 20,699 | |
| Interest expense (See Note 5) | | | 5,048 | |
| Other expenses | | | 668,743 | |
| Total expenses | | | 14,435,728 | |
| NET INVESTMENT INCOME | | $ | 33,553,345 | |
| | | | | |
| REALIZED AND UNREALIZED GAINS: | | | | |
| Net realized gain on investments | | $ | 11,936,515 | |
| Net change in unrealized appreciation on investments | | | 96,396,614 | |
| Net gain on investments | | | 108,333,129 | |
| NET INCREASE IN NET ASSETS RESULTING FROM OPERATIONS | | $ | 141,886,474 | |
(1) | Net of foreign taxes withheld and issuance fees of $1,064,969. |
The accompanying notes are an integral part of these financial statements.
| STATEMENT OF OPERATIONS/STATEMENTS OF CHANGES IN NET ASSETS |
Financial Statements
| Statements of Changes in Net Assets |
| | | Year Ended | | | Year Ended | |
| | | October 31, 2017 | | | October 31, 2016 | |
| OPERATIONS: | | | | | | |
| Net investment income | | $ | 33,553,345 | | | $ | 32,778,106 | |
| Net realized gain (loss) on investments | | | 11,936,515 | | | | (19,582,660 | ) |
| Net change in unrealized appreciation on investments | | | 96,396,614 | | | | 87,366,505 | |
| Net increase in net assets resulting from operations | | | 141,886,474 | | | | 100,561,951 | |
| | | | | | | | | |
| DISTRIBUTIONS TO SHAREHOLDERS FROM: | | | | | | | | |
| Net investment income – Investor Class | | | (34,370,968 | ) | | | (36,851,113 | ) |
| Net investment income – Institutional Class | | | (376,747 | ) | | | — | |
| Net realized gains – Investor Class | | | (19,805,380 | ) | | | (35,850,694 | ) |
| Net realized gains – Institutional Class | | | — | | | | — | |
| Total distributions | | | (54,553,095 | ) | | | (72,701,807 | ) |
| | | | | | | | | |
| CAPITAL SHARE TRANSACTIONS: | | | | | | | | |
| Proceeds from shares subscribed – Investor Class | | | 119,194,987 | | | | 168,313,204 | |
| Proceeds from shares subscribed – Institutional Class | | | 86,926,934 | | | | — | |
| Dividends reinvested – Investor Class | | | 51,110,167 | | | | 68,537,893 | |
| Dividends reinvested – Institutional Class | | | 280,823 | | | | — | |
| Cost of shares redeemed – Investor Class | | | (405,814,851 | ) | | | (458,991,855 | ) |
| Cost of shares redeemed – Institutional Class | | | (2,635,338 | ) | | | — | |
| Net decrease in net assets derived | | | | | | | | |
| from capital share transactions | | | (150,937,278 | ) | | | (222,140,758 | ) |
| TOTAL DECREASE IN NET ASSETS | | | (63,603,899 | ) | | | (194,280,614 | ) |
| | | | | | | | | |
| NET ASSETS: | | | | | | | | |
| Beginning of year | | | 1,454,925,431 | | | | 1,649,206,045 | |
| End of year | | $ | 1,391,321,532 | | | $ | 1,454,925,431 | |
| Undistributed net investment loss, end of year | | $ | — | | | $ | — | |
| | | | | | | | | |
| CHANGES IN SHARES OUTSTANDING: | | | | | | | | |
| Shares sold – Investor Class | | | 4,053,758 | | | | 6,213,940 | |
| Shares sold – Institutional Class | | | 2,868,864 | | | | — | |
| Shares issued to holders as reinvestment | | | | | | | | |
| of dividends – Investor Class | | | 1,768,098 | | | | 2,666,176 | |
| Shares issued to holders as reinvestment | | | | | | | | |
| of dividends – Institutional Class | | | 9,411 | | | | — | |
| Shares redeemed – Investor Class | | | (13,691,570 | ) | | | (17,517,095 | ) |
| Shares redeemed – Institutional Class | | | (86,974 | ) | | | — | |
| Net decrease in shares outstanding | | | (5,078,413 | ) | | | (8,636,979 | ) |
The accompanying notes are an integral part of these financial statements.
| HENNESSY FUNDS | 1-800-966-4354 | |
Financial Statements
For an Investor Class share outstanding throughout each year
PER SHARE DATA:
Net asset value, beginning of year
Income from investment operations:
Net investment income
Net realized and unrealized gains (losses) on investments
Total from investment operations
Less distributions:
Dividends from net investment income
Dividends from net realized gains
Total distributions
Paid-in capital from redemption fees
Net asset value, end of year
TOTAL RETURN
SUPPLEMENTAL DATA AND RATIOS:
Net assets, end of year (millions)
Ratio of expenses to average net assets
Ratio of net investment income to average net assets
Portfolio turnover rate(2)
(1) | Amount is less than $0.01. |
(2) | Portfolio turnover is calculated on the basis of the Fund as a whole. |
The accompanying notes are an integral part of these financial statements.
| FINANCIAL HIGHLIGHTS — INVESTOR CLASS |
| Year Ended October 31, | | |
| 2017 | | | 2016 | | | 2015 | | | 2014 | | | 2013 | | |
| | | | | | | | | | | | | | | |
| $ | 28.57 | | | $ | 27.69 | | | $ | 31.30 | | | $ | 26.69 | | | $ | 23.05 | | |
| | | | | | | | | | | | | | | | | | | | |
| | | | | | | | | | | | | | | | | | | | |
| | 0.70 | | | | 0.62 | | | | 0.69 | | | | 0.62 | | | | 0.62 | | |
| | 2.20 | | | | 1.58 | | | | (2.69 | ) | | | 5.18 | | | | 4.18 | | |
| | 2.90 | | | | 2.20 | | | | (2.00 | ) | | | 5.80 | | | | 4.80 | | |
| | | | | | | | | | | | | | | | | | | | |
| | | | | | | | | | | | | | | | | | | | |
| | (0.72 | ) | | | (0.69 | ) | | | (0.70 | ) | | | (0.59 | ) | | | (0.61 | ) | |
| | (0.40 | ) | | | (0.63 | ) | | | (0.91 | ) | | | (0.60 | ) | | | (0.55 | ) | |
| | (1.12 | ) | | | (1.32 | ) | | | (1.61 | ) | | | (1.19 | ) | | | (1.16 | ) | |
| | — | | | | — | | | | — | | | | 0.00 | (1) | | | 0.00 | (1) | |
| $ | 30.35 | | | $ | 28.57 | | | $ | 27.69 | | | $ | 31.30 | | | $ | 26.69 | | |
| | | | | | | | | | | | | | | | | | | | |
| | 10.39 | % | | | 8.52 | % | | | (6.59 | )% | | | 22.49 | % | | | 21.70 | % | |
| | | | | | | | | | | | | | | | | | | | |
| | | | | | | | | | | | | | | | | | | | |
| $ | 1,306.70 | | | $ | 1,454.93 | | | $ | 1,649.21 | | | $ | 2,254.98 | | | $ | 1,182.79 | | |
| | 1.01 | % | | | 1.01 | % | | | 0.93 | % | | | 0.77 | % | | | 0.80 | % | |
| | 2.34 | % | | | 2.25 | % | | | 2.33 | % | | | 2.26 | % | | | 2.56 | % | |
| | 18 | % | | | 38 | % | | | 37 | % | | | 20 | % | | | 18 | % | |
The accompanying notes are an integral part of these financial statements.
| HENNESSY FUNDS | 1-800-966-4354 | |
Financial Statements
For an Institutional Class share outstanding throughout the period
| | | Period Ended | |
| | | October 31, 2017(1) | |
| PER SHARE DATA: | | | |
| Net asset value, beginning of period | | $ | 29.68 | |
| | | | | |
| Income from investment operations: | | | | |
| Net investment income | | | 0.62 | |
| Net realized and unrealized gains on investments | | | 0.72 | |
| Total from investment operations | | | 1.34 | |
| | | | | |
| Less distributions: | | | | |
| Dividends from net investment income | | | (0.70 | ) |
| Dividends from net realized gains | | | — | |
| Total distributions | | | (0.70 | ) |
| Net asset value, end of period | | $ | 30.32 | |
| | | | | |
| TOTAL RETURN | | | 4.56 | %(2)(3) |
| | | | | |
| SUPPLEMENTAL DATA AND RATIOS: | | | | |
| Net assets, end of period (millions) | | $ | 84.62 | |
| Ratio of expenses to average net assets | | | 0.64 | %(4) |
| Ratio of net investment income to average net assets | | | 1.23 | %(4) |
Portfolio turnover rate(5) | | | 18 | %(2) |
(1) | The Institutional Class shares commenced operations on March 1, 2017. |
(2) | Not annualized. |
(3) | Actual return from inception date of March 1, 2017, to the year end of October 31, 2017. |
(4) | Annualized. |
(5) | Portfolio turnover is calculated on the basis of the Fund as a whole. |
The accompanying notes are an integral part of these financial statements.
| FINANCIAL HIGHLIGHTS — INSTITUTIONAL CLASS/NOTES TO THE FINANCIAL STATEMENTS |
Financial Statements
Notes to the Financial Statements October 31, 2017 |
1). ORGANIZATION
The Hennessy Gas Utility Fund (the “Fund”) is a series of Hennessy Funds Trust (the “Trust”), which was organized as a Delaware statutory trust on September 17, 1992. The Fund is an open-end management investment company registered under the Investment Company Act of 1940, as amended. The Fund did not have Institutional Class shares until March 1, 2017. The investment objective of the Fund is income and capital appreciation. The Fund is a non-diversified fund.
The Fund offers Investor Class and Institutional Class shares. Each class of shares differs principally in its respective 12b-1 distribution and service, shareholder servicing, and sub-transfer agent expenses. There are no sales charges. Each class has identical rights to earnings, assets, and voting privileges, except for class-specific expenses and exclusive rights to vote on matters affecting only an individual class.
As an investment company, the Fund follows the investment company accounting and reporting guidance of the Financial Accounting Standards Board (“FASB”) Accounting Standard Codification Topic 946 “Financial Services—Investment Companies.”
2). SIGNIFICANT ACCOUNTING POLICIES
The following is a summary of significant accounting policies consistently followed by the Fund in the preparation of the financial statements. These policies conform to U.S. generally accepted accounting principles (“GAAP”).
| a). | Investment Valuation – All investments in securities are recorded at their estimated fair value, as described in Note 3. |
| b). | Federal Income Taxes – No provision for federal income taxes or excise taxes has been made because the Fund has elected to be taxed as a “regulated investment company” and intends to distribute substantially all of its taxable income to its shareholders and otherwise comply with the provisions of the Internal Revenue Code of 1986, as amended, applicable to regulated investment companies. Net investment income/loss and realized gains/losses for federal income tax purposes may differ from those reported in the financial statements because of temporary book and tax basis differences. Temporary differences are primarily the result of the treatment of wash sales for tax reporting purposes. The Fund recognizes interest and penalties related to income tax benefits, if any, in the Statement of Operations as an income tax expense. Distributions from net realized gains for book purposes may include short-term capital gains, which are included as ordinary income to shareholders for tax purposes. The Fund may utilize equalization accounting for tax purposes and designate earnings and profits, including net realized gains distributed to shareholders on redemption of shares, as part of the dividends paid deduction for income tax purposes. |
| HENNESSY FUNDS | 1-800-966-4354 | |
| | Due to inherent differences in the recognition of income, expenses, and realized gains/losses under GAAP and federal income tax regulations, permanent differences between book and tax basis for reporting for fiscal year 2017 have been identified and appropriately reclassified in the Statement of Assets and Liabilities. The adjustments are as follows: |
| | Accumulated | Accumulated | | |
| | Net Investment | Net Realized | | |
| | Loss | Loss on Investments | Capital Stock | |
| | $1,194,370 | $(3,223,100) | $2,028,730 | |
| c). | Accounting for Uncertainty in Income Taxes – The Fund has accounting policies regarding recognition and measurement of tax positions taken or expected to be taken on a tax return. The tax returns of the Fund for the prior three fiscal years are open for examination. The Fund has reviewed all open tax years in major jurisdictions and concluded that there is no impact on the Fund’s net assets and no tax liability resulting from unrecognized tax benefits relating to uncertain income tax positions taken or expected to be taken on a tax return. The Fund’s major tax jurisdictions are U.S. federal and Delaware. |
| d). | Income and Expenses – Dividend income is recognized on the ex-dividend date or as soon as information is available to the Fund. Interest income, which includes the amortization of premium and accretion of discount, is recognized on an accrual basis. The Fund is charged for those expenses that are directly attributable to the portfolio, such as advisory, administration, and certain shareholder service fees. Income, expenses (other than expenses attributable to a specific class), and realized and unrealized gains/losses on investments are allocated to each class of shares based on such class’s net assets. |
| e). | Distributions to Shareholders – Dividends from net investment income for the Fund, if any, are declared and paid at the end of each calendar quarter. Distributions of net realized capital gains, if any, are declared and paid annually, usually in December. |
| f). | Security Transactions – Investment and shareholder transactions are recorded on the trade date. The Fund determines the realized gain/loss from an investment transaction by comparing the original cost of the security lot sold with the net sale proceeds. Discounts and premiums on securities purchased are accreted/amortized over the life of the respective security. |
| g). | Use of Estimates – The preparation of financial statements in conformity with GAAP requires management to make estimates and assumptions that affect the reported amounts of assets and liabilities and disclosure of contingent assets and liabilities at the date of the financial statements and the reported change in net assets during the reporting period. Actual results could differ from those estimates. |
| h). | Share Valuation – The net asset value (“NAV”) per share of the Fund is calculated by dividing (i) the sum of the value of the securities held by the Fund, plus cash or other assets, minus all liabilities (including estimated accrued expenses) by (ii) the total number of shares outstanding for the Fund, rounded to the nearest cent. The Fund’s shares will not be priced on days the New York Stock Exchange is closed for trading. The offering and redemption price per share for the Fund is equal to the Fund’s NAV per share. |
3). SECURITIES VALUATION
The Fund follows authoritative fair valuation accounting standards that establish an authoritative definition of fair value and set out a hierarchy for measuring fair value.
| NOTES TO THE FINANCIAL STATEMENTS |
These standards require additional disclosures about the various inputs and valuation techniques used to develop the measurements of fair value and a discussion of changes in valuation techniques and related inputs during the period. These inputs are summarized in the three broad levels listed below:
| | Level 1 – | Unadjusted, quoted prices in active markets for identical instruments that the Fund has the ability to access at the date of measurement. |
| | Level 2 – | Other significant observable inputs (including, but not limited to, quoted prices in active markets for similar instruments, quoted prices in markets that are not active for identical or similar instruments, and model-derived valuations in which all significant inputs and significant value drivers are observable in active markets, such as interest rates, prepayment speeds, credit risk curves, default rates, and similar data). |
| | Level 3 – | Significant unobservable inputs (including the Fund’s own assumptions about what market participants would use to price the asset or liability based on the best available information) when observable inputs are unavailable. |
Following is a description of the valuation techniques applied to the Fund’s major categories of assets and liabilities measured at fair value on a recurring basis.
| | Equity Securities – Equity securities, including common stocks, preferred stocks, foreign-issued common stocks, exchange-traded funds, closed-end mutual funds, partnerships, rights, and real estate investment trusts, that are traded on a securities exchange for which a last-quoted sales price is readily available will generally be valued at the last sales price as reported by the primary exchange on which the securities are listed. Securities listed on The NASDAQ Stock Market (“NASDAQ”) will generally be valued at the NASDAQ Official Closing Price, which may differ from the last sales price reported. Securities traded on a securities exchange for which a last-quoted sales price is not readily available will generally be valued at the mean between the bid and ask prices. To the extent these securities are actively traded and valuation adjustments are not applied, they are classified in Level 1 of the fair value hierarchy. Securities traded on foreign exchanges generally are not valued at the same time the Fund calculates its NAV because most foreign markets close well before such time. The earlier close of most foreign markets gives rise to the possibility that significant events, including broad market moves, may have occurred in the interim. In certain circumstances, it may be determined that a security needs to be fair valued because it appears that the value of the security might have been materially affected by events occurring after the close of the market in which the security is principally traded, but before the time the Fund calculates its NAV, such as by a development that affects an entire market or region (e.g., weather-related events) or a potentially global development (e.g., a terrorist attack that may be expected to have an effect on investor expectations worldwide). |
| | Registered Investment Companies – Investments in registered investment companies (e.g., mutual funds) are generally priced at the ending NAV provided by the applicable registered investment company’s service agent and will be classified in Level 1 of the fair value hierarchy. |
| | Debt Securities – Debt securities, including corporate bonds, asset-backed securities, mortgage-backed securities, municipal bonds, U.S. Treasuries, and U.S. government agency issues, are generally valued at market on the basis of valuations furnished by an independent pricing service that utilizes both dealer-supplied valuations and formula-based techniques. The pricing service may consider recently executed transactions in securities of the issuer or comparable issuers, market price quotations |
| HENNESSY FUNDS | 1-800-966-4354 | |
| | (where observable), bond spreads, and fundamental data relating to the issuer. In addition, the model may incorporate observable market data, such as reported sales of similar securities, broker quotes, yields, bids, offers, and reference data. Certain securities are valued primarily using dealer quotations. These securities are generally classified in Level 2 of the fair value hierarchy. |
| | Short-Term Securities – Short-term equity investments, including money market funds, are valued in the manner specified above. Short-term debt investments with an original term to maturity of 60 days or less are valued at amortized cost, which approximates fair market value. If the original term to maturity of a short-term debt investment exceeded 60 days, then the values as of the 61st day prior to maturity are amortized. Amortized cost is not used if its use would be inappropriate due to credit or other impairments of the issuer, in which case the security’s fair value would be determined, as described below. Short-term securities are generally classified in Level 1 or Level 2 of the fair market hierarchy depending on the inputs used and market activity levels for specific securities. |
The Board of Trustees of the Fund (the “Board”) has adopted fair value pricing procedures that are followed when a price for a security is not readily available or if a significant event has occurred that indicates the closing price of a security no longer represents the true value of that security. Fair value pricing determinations are made in good faith in accordance with these procedures. There are numerous criteria that will be given consideration in determining a fair value of a security, such as the trading volume of a security and markets, the values of other similar securities, and news events with direct bearing on a security or markets. Fair value pricing results in an estimated price for a security that reflects the amount the Fund might reasonably expect to receive in a current sale. Depending on the relative significance of the valuation inputs, these securities may be classified in either Level 2 or Level 3 of the fair value hierarchy.
The fair valuation of foreign securities may be determined with the assistance of a pricing service using correlations between the movement of prices of such securities and indices of domestic securities and other appropriate indicators, such as closing market prices of relevant American Depositary Receipts or futures contracts. The effect of using fair value pricing is that the Fund’s NAV will reflect the affected portfolio securities’ values as determined by the Board or its designee instead of being determined by the market. Using a fair value pricing methodology to price a foreign security may result in a value that is different from the foreign security’s most recent closing price and from the prices used by other investment companies to calculate their NAVs and are generally classified in Level 2 of the fair valuation hierarchy. Because the Fund may invest in foreign securities, the value of the Fund’s portfolio securities may change on days when you will not be able to purchase or redeem your shares.
The Board has delegated day-to-day valuation matters to a Valuation Committee comprised of one or more representatives from Hennessy Advisors, Inc., the Fund’s investment advisor (the “Advisor”). The function of the Valuation Committee is to value securities where current and reliable market quotations are not readily available. All actions taken by the Valuation Committee are reviewed by the Board.
The Fund has performed an analysis of all existing investments to determine the significance and character of all inputs to their fair value determination. Various inputs are used to determine the value of the Fund’s investments. The inputs or methodology used for valuing securities are not necessarily an indication of the risk associated with investing in those securities. Details related to the fair valuation hierarchy of the Fund’s securities as of October 31, 2017, are included in the Schedule of Investments.
| NOTES TO THE FINANCIAL STATEMENTS |
4). INVESTMENT TRANSACTIONS
Purchases and sales of investment securities (excluding government and short-term investments) for the Fund during fiscal year 2017 were $258,576,220 and $425,173,091, respectively.
There were no purchases or sales/maturities of long-term U.S. government securities for the Fund during fiscal year 2017.
The Fund is permitted to purchase or sell securities from or to another fund in the Hennessy Funds family of funds (the “Hennessy Funds”) under specified conditions outlined in procedures adopted by the Board. The procedures have been designed to ensure that any purchase or sale of securities by the Fund from or to another Hennessy Fund complies with Rule 17a-7 of the Investment Company Act of 1940, as amended. For fiscal year 2017, the Fund did not engage in purchases or sales of securities pursuant to Rule 17a-7 of the Investment Company Act of 1940, as amended.
5). INVESTMENT MANAGEMENT FEE AND OTHER TRANSACTIONS WITH AFFILIATES
The Advisor provides the Fund with investment management services under an Investment Advisory Agreement. The Advisor provides all investment advice, office space, and facilities, as well as most of the personnel needed by the Fund. As compensation for its services, the Advisor is entitled to a monthly fee from the Fund. The fee is based upon the average daily net assets of the Fund at an annual rate of 0.40%. The net investment advisory fees expensed by the Fund during fiscal year 2017 are included in the Statement of Operations.
The Board has approved a Shareholder Servicing Agreement for Investor Class shares of the Fund, which was instituted to compensate the Advisor for the non-investment management services it provides to the Fund. The Shareholder Servicing Agreement provides for a monthly fee paid to the Advisor at an annual rate of 0.10% of the average daily net assets of the Fund attributable to Investor Class shares. The shareholder service fees expensed by the Fund during fiscal year 2017 are included in the Statement of Operations.
The Fund has adopted a plan pursuant to Rule 12b-1 under the Investment Company Act of 1940, as amended, that authorizes payments in connection with the distribution of the Fund’s shares at an annual rate of up to 0.25% of the Fund’s average daily net assets attributable to Investor Class shares. Even though the authorized rate is up to 0.25%, the Fund is currently only using up to 0.15% of its average daily net assets attributable to Investor Class shares for such purpose. Amounts paid under the plan may be spent on any activities or expenses primarily intended to result in the sale of shares, including, but not limited to, advertising, shareholder account servicing, the printing and mailing of prospectuses to other than current shareholders, the printing and mailing of sales literature, and compensation for sales and marketing activities or to financial institutions and others, such as dealers and distributors. The distribution fees expensed by the Fund during fiscal year 2017 are included in the Statement of Operations.
The Fund has entered into agreements with various brokers, dealers, and financial intermediaries in connection with the sale of shares of the Fund. The agreements provide for periodic payments by the Fund to the brokers, dealers, and financial intermediaries for providing certain shareholder maintenance services (sub-transfer agent expenses). These shareholder services include the pre-processing and quality control of new accounts, shareholder correspondence, answering customer inquiries regarding account status, and facilitating shareholder telephone transactions. The sub-transfer agent fees expensed by the Fund during fiscal year 2017 are included in the Statement of Operations.
| HENNESSY FUNDS | 1-800-966-4354 | |
The Fund has entered into an Administrative Services Agreement among the Fund, the Advisor, and the American Gas Association (“AGA”), pursuant to which the AGA provides administrative services to the Fund. These administrative services include overseeing the calculation of the AGA Stock Index. ScottMadden, Inc. (successor-in-interest to Sussex Economic Advisors, LLC) performs the actual computations required to produce the AGA Stock Index and receives a fee for such calculations pursuant to a contractual arrangement with AGA. AGA does not furnish other securities advice to the Fund or the Advisor or make recommendations regarding the purchase or sale of securities by the Fund. Under the terms of the Administrative Services Agreement, which has been approved by the Board, AGA provides the Fund with current information regarding the common stock composition of the AGA Stock Index at least monthly. In addition, upon request, AGA provides the Fund and the Advisor with information on the natural gas industry. The Fund pays AGA a fee at an annual rate of 0.04% of the average daily net assets of the Fund.
U.S. Bancorp Fund Services, LLC (“USBFS”) provides the Fund with administrative, fund accounting, and transfer agent services and necessary office equipment. As administrator, USBFS is responsible for activities such as (i) preparing various federal and state regulatory filings, reports, and returns for the Fund, (ii) preparing reports and materials to be supplied to the Board, (iii) monitoring the activities of the Fund’s custodian, transfer agent, and accountants, and (iv) coordinating the preparation and payment of the Fund’s expenses and reviewing the Fund’s expense accruals. U.S. Bank, N.A., an affiliate of USBFS, serves as the Fund’s custodian. The servicing agreements between the Trust, USBFS, and U.S. Bank N.A. contain a fee schedule that is inclusive of administrative, fund accounting, custody, and transfer agent fees. The administrative, fund accounting, custody, and transfer agent fees expensed by the Fund during fiscal year 2017 are included in the Statement of Operations.
Quasar Distributors, LLC acts as the Fund’s principal underwriter in a continuous public offering of the Fund’s shares. Quasar Distributors, LLC is an affiliate of USBFS and U.S. Bank, N.A.
The officers of the Fund are affiliated with the Advisor. Such officers, with the exception of the Chief Compliance Officer and the Senior Compliance Officer, receive no compensation from the Fund for serving in their respective roles. The Fund, along with the other Hennessy Funds, makes reimbursement payments, on an equal basis, to the Advisor for a portion of the salary and benefits associated with the office of the Chief Compliance Officer and for all of the salary and benefits associated with the office of the Senior Compliance Officer. The compliance fees expensed by the Fund during fiscal year 2017 are included in the Statement of Operations.
6). GUARANTEES AND INDEMNIFICATIONS
Under the Hennessy Funds’ organizational documents, their officers and trustees are indemnified by the Hennessy Funds against certain liabilities arising out of the performance of their duties to the Hennessy Funds. Additionally, in the normal course of business, the Hennessy Funds enter into contracts with service providers that contain general indemnification clauses. The Fund’s maximum exposure under these arrangements is unknown as this would involve future claims that may be made against the Fund that have not yet occurred. Currently, the Fund expects the risk of loss to be remote.
| NOTES TO THE FINANCIAL STATEMENTS |
7). LINE OF CREDIT
The Fund has an uncommitted line of credit with the other Hennessy Funds in the amount of the lesser of (i) $100,000,000 or (ii) 33.33% of each Hennessy Fund’s net assets, or 30% for the Fund and 10% for the Hennessy Balanced Fund, intended to provide short-term financing, if necessary, subject to certain restrictions, in connection with shareholder redemptions. The credit facility is with the Hennessy Funds’ custodian bank, U.S. Bank, N.A. Borrowings under this arrangement bear interest at the bank’s prime rate and are secured by all of the Fund’s assets (as to its own borrowings only). During fiscal year 2017, the Fund had an outstanding average daily balance and a weighted average interest rate of $138,079 and 3.97%, respectively. The interest expensed by the Fund during fiscal year 2017 is included in the Statement of Operations. The maximum amount outstanding for the Fund during the period was $3,952,000. At October 31, 2017, the Fund did not have any borrowings outstanding under the line of credit.
8). FEDERAL TAX INFORMATION
As of October 31, 2017, the components of accumulated earnings (losses) for income tax purposes were as follows:
| | | Investments | |
| Cost of investments for tax purposes | | $ | 934,660,895 | |
| Gross tax unrealized appreciation | | $ | 550,811,731 | |
| Gross tax unrealized depreciation | | | (98,044,885 | ) |
| Net tax unrealized appreciation | | $ | 452,766,846 | |
| Undistributed ordinary income | | $ | 2,936,439 | |
| Undistributed long-term capital gains | | | 4,143,011 | |
| Total distributable earnings | | $ | 7,079,450 | |
| Other accumulated gain | | $ | 3,651 | |
| Total accumulated gain | | $ | 459,849,947 | |
The difference between book-basis unrealized appreciation/depreciation (as shown in the Statement of Assets and Liabilities) and tax-basis unrealized appreciation/depreciation (as shown above) is attributable primarily to wash sales.
At October 31, 2017, the Fund had no tax basis capital losses to offset future capital gains.
At October 31, 2017, the Fund did not defer, on a tax basis, any late-year ordinary losses. Late-year ordinary losses are net ordinary losses incurred after December 31, 2016, but within the taxable year, that are deemed to arise on the first day of the Fund’s next taxable year.
During fiscal years 2017 and 2016, the tax character of distributions paid by the Fund was as follows:
| | | Year Ended | | | Year Ended | |
| | | October 31, 2017 | | | October 31, 2016 | |
Ordinary income(1) | | $ | 34,747,715 | | | $ | 36,851,113 | |
| Long-term capital gain | | | 19,805,380 | | | | 35,850,694 | |
| | | $ | 54,553,095 | | | $ | 72,701,807 | |
(1) Ordinary income includes short-term gain/loss.
| HENNESSY FUNDS | 1-800-966-4354 | |
9). EVENTS SUBSEQUENT TO YEAR END
Management has evaluated the Fund’s related events and transactions that occurred subsequent to October 31, 2017, through the date of issuance of the Fund’s financial statements. Other than as disclosed below, management has determined that there were no subsequent events requiring recognition or disclosure in the financial statements.
On December 7, 2017, capital gains were declared and paid to shareholders of record on December 6, 2017, as follows:
| | Long-term | Short-term |
| Investor Class | $0.09201 | $0.06521 |
| Institutional Class | $0.09188 | $0.06514 |
In connection with his planned retirement, Winsor (Skip) H. Aylesworth stepped down as a Portfolio Manager of the Fund as of November 30, 2017. Mr. Aylesworth will remain an employee of the Advisor until January 15, 2018, to continue to work with Ryan C. Kelley and Brian E. Peery and ensure a smooth transition. Mr. Kelley has served as a Portfolio Manager or Co-Portfolio Manager of the Fund since March 2013, and Mr. Peery has served as a Portfolio Manager of the Fund since February 2015.
| NOTES/REPORT OF INDEPENDENT REGISTERED PUBLIC ACCOUNTING FIRM |
Report of Independent Registered Public
Accounting Firm
To the Board of Trustees of Hennessy Funds Trust
and the Shareholders of the Hennessy Gas Utility Fund
Novato, CA
We have audited the accompanying statement of assets and liabilities, including the schedule of investments, of the Hennessy Gas Utility Fund (the “Fund”), a series of Hennessy Funds Trust (the “Trust”) as of October 31, 2017, and the related statement of operations for the year then ended, the statements of changes in net assets for each of the two years in the period then ended, and the financial highlights for each of the five years in the period then ended. These financial statements and financial highlights are the responsibility of the Fund’s management. Our responsibility is to express an opinion on these financial statements and financial highlights based on our audits.
We conducted our audits in accordance with the standards of the Public Company Accounting Oversight Board (United States). Those standards require that we plan and perform the audits to obtain reasonable assurance about whether the financial statements and financial highlights are free of material misstatement. The Fund is not required to have, nor were we engaged to perform, an audit of its internal control over financial reporting. Our audits included consideration of internal control over financial reporting as a basis for designing audit procedures that are appropriate in the circumstances, but not for the purposes of expressing an opinion on the effectiveness of the Fund’s internal control over financial reporting. Accordingly, we express no such opinion. An audit includes examining, on a test basis, evidence supporting the amounts and disclosures in the financial statements. Our procedures included confirmation of securities owned as of October 31, 2017, by correspondence with the custodian. An audit also includes assessing the accounting principles used and significant estimates made by management, as well as evaluating the overall financial statement presentation. We believe that our audits provide a reasonable basis for our opinion.
In our opinion, the financial statements and financial highlights referred to above present fairly, in all material respects, the financial position of the Hennessy Gas Utility Fund as of October 31, 2017, the results of its operations for the year then ended, the changes in its net assets for each of the two years in the period then ended, and the financial highlights for each of the five years in the period then ended, in conformity with accounting principles generally accepted in the United States of America.
TAIT, WELLER & BAKER LLP
Philadelphia, Pennsylvania
December 22, 2017
| HENNESSY FUNDS | 1-800-966-4354 | |
Trustees and Officers of the Fund (Unaudited)
The business and affairs of the Funds are managed under the direction of the Board of Trustees of the Trust, and the Board of Trustees elects the Officers of the Trust. Beginning in March 2015, the Board of Trustees has from time to time appointed advisers to the Board of Trustees (“Advisers”), with the intention of having qualified individuals serve in an advisory capacity in order to garner experience in the mutual fund and asset management industry and be considered as potential Trustees in the future. There are currently three Advisers to the Board of Trustees: Brian Alexander, Doug Franklin, and Claire Knoles. As Advisers, Mr. Alexander, Mr. Franklin, and Ms. Knoles attend meetings of the Board and act as non-voting participants. Information pertaining to the Trustees, Advisers, and the Officers of the Trust is set forth below. The Trustees and Officers serve until their successors are duly elected and qualified or until their earlier death, resignation, or removal. Each of the Trustees oversees 14 Hennessy Funds. Unless otherwise indicated, the address of all persons listed below is 7250 Redwood Boulevard, Suite 200, Novato, CA 94945. The Fund’s Statement of Additional Information includes more information about the persons listed below and is available, without charge, upon request by calling 1-800-966-4354.
| | | | Other |
| | | | Directorships |
| | | | Held Outside |
| Name, (Year of Birth), | | | of Fund |
| and Position Held | Start Date | Principal Occupation(s) | Complex During |
with the Trust | of Service | During Past Five Years | Past Five Years(1) |
| | | |
| Disinterested Trustees and Advisers | | |
| | | | |
| J. Dennis DeSousa | January 1996 | Mr. DeSousa is a real estate investor. | None. |
| (1936) | | | |
| Trustee | | | |
| | | | |
| Robert T. Doyle | January 1996 | Mr. Doyle has been the Sheriff of | None. |
| (1947) | | Marin County, California since 1996. | |
| Trustee | | | |
| | | | |
| Gerald P. Richardson | May 2004 | Mr. Richardson is an independent | None. |
| (1945) | | consultant in the securities industry. | |
| Trustee | | | |
| | | | |
| Brian Alexander | March 2015 | Mr. Alexander has been employed | None. |
| (1981) | | by Sutter Health Novato Community | |
| Adviser to the Board | | Hospital since 2012, first as an | |
| | | Assistant Administrator and then, | |
| | | beginning in 2013, as the Chief | |
| | | Administrative Officer. From 2011 | |
| | | through 2012, Mr. Alexander was | |
| | | employed by Sutter Health West Bay | |
| | | Region as the Regional Director of | |
| | | Strategic Decision Support. | |
| TRUSTEES AND OFFICERS OF THE FUND |
| | | | Other |
| | | | Directorships |
| | | | Held Outside |
| Name, (Year of Birth), | | | of Fund |
| and Position Held | Start Date | Principal Occupation(s) | Complex During |
with the Trust | of Service | During Past Five Years | Past Five Years(1) |
| | | | |
| Doug Franklin | March 2016 | Mr. Franklin is a retired insurance | None. |
| (1964) | | industry executive. From 1987 | |
| Adviser to the Board | | through 2015, he was employed | |
| | | by Allianz-Fireman’s Fund Insurance | |
| | | Company in various positions, | |
| | | including Chief Actuary and | |
| | | Chief Risk Officer. | |
| | | | |
| Claire Knoles | December 2015 | Ms. Knoles is a founder of Kiosk and | None. |
| (1974) | | has served as its Chief Operating | |
| Adviser to the Board | | Officer since 2004. Kiosk is a full | |
| | | service marketing agency with | |
| | | offices in the San Francisco Bay | |
| | | Area, Toronto, and Liverpool, UK. | |
| | | | |
Interested Trustee(2) | | | |
| | | | |
| Neil J. Hennessy | January 1996 as | Mr. Hennessy has been employed by | Hennessy |
| (1956) | a Trustee and | Hennessy Advisors, Inc. since 1989 | Advisors, Inc. |
| Trustee, Chairman of | June 2008 as | and currently serves as its President, | |
| the Board, Chief | an Officer | Chairman and Chief Executive Officer. | |
| Investment Officer, | | | |
| Portfolio Manager, | | | |
| and President | | | |
| Name, (Year of Birth), | | |
| and Position Held | Start Date | Principal Occupation(s) |
with the Trust | of Service | During Past Five Years |
| | | |
| Officers | | |
| | | |
| Teresa M. Nilsen | January 1996 | Ms. Nilsen has been employed by Hennessy Advisors, Inc. |
| (1966) | | since 1989 and currently serves as its Executive Vice President, |
| Executive Vice President | | Chief Operations Officer, Chief Financial Officer, and Secretary. |
| and Treasurer | | |
| | | |
| Daniel B. Steadman | March 2000 | Mr. Steadman has been employed by Hennessy Advisors, Inc. |
| (1956) | | since 2000 and currently serves as its Executive Vice President |
| Executive Vice President | | and Chief Compliance Officer. |
| and Secretary | | |
| | | |
| Brian Carlson | December 2013 | Mr. Carlson has been employed by Hennessy Advisors, Inc. |
| (1972) | | since December 2013. Mr. Carlson was previously a co-founder |
| Senior Vice President and | | and principal of Trivium Consultants, LLC from February 2011 |
| Head of Distribution | | through November 2013. |
| | | |
| Jennifer Cheskiewicz | June 2013 | Ms. Cheskiewicz has been employed by Hennessy Advisors, Inc. |
| (1977) | | as its General Counsel since June 2013. She previously served |
| Senior Vice President and | | as in-house counsel to Carlson Capital, L.P., an SEC-registered |
| Chief Compliance Officer | | investment advisor to several private funds, from |
| | | February 2010 to May 2013. |
| HENNESSY FUNDS | 1-800-966-4354 | |
| Name, (Year of Birth), | | |
| and Position Held | Start Date | Principal Occupation(s) |
with the Trust | of Service | During Past Five Years |
| | | |
| David Ellison | October 2012 | Mr. Ellison has been employed by Hennessy Advisors, Inc. since |
(1958)(3) | | October 2012. He has served as a Portfolio Manager of the |
| Senior Vice President | | Hennessy Small Cap Financial Fund and the Hennessy Large |
| and Portfolio Manager | | Cap Financial Fund since inception. Mr. Ellison also served as a |
| | | Portfolio Manager of the Hennessy Technology Fund from its |
| | | inception until February 2017. Mr. Ellison served as Director, |
| | | CIO and President of FBR Fund Advisers, Inc. from |
| | | December 1999 to October 2012. |
| | | |
| Ryan Kelley | March 2013 | Mr. Kelley has been employed by Hennessy Advisors, Inc. since |
(1972)(4) | | October 2012. He has served as a Portfolio Manager of the |
| Vice President and | | Hennessy Gas Utility Fund, the Hennessy Small Cap Financial |
| Portfolio Manager | | Fund, and the Hennessy Large Cap Financial Fund since |
| | | October 2014. He served as Co-Portfolio Manager of the same |
| | | funds from March 2013 through September 2014, and as a |
| | | Portfolio Analyst for the Hennessy Funds from October 2012 |
| | | through October 2014. Mr. Kelley has also served as a Portfolio |
| | | Manager of the Hennessy Cornerstone Growth Fund, the |
| | | Hennessy Cornerstone Mid Cap 30 Fund, the Hennessy |
| | | Cornerstone Large Growth Fund, and the Hennessy |
| | | Cornerstone Value Fund and as a Co-Portfolio Manager of the |
| | | Hennessy Technology Fund since February 2017. Mr. Kelley |
| | | served as Portfolio Manager of FBR Fund Advisers, Inc. from |
| | | January 2008 to October 2012. |
| | | |
| Brian Peery | March 2003 as | Mr. Peery has been employed by Hennessy Advisors, Inc. since |
| (1969) | an Officer and | 2002. He has served as a Portfolio Manager of the Hennessy |
| Senior Vice President | February 2011 | Cornerstone Growth Fund, the Hennessy Cornerstone Mid Cap |
| and Portfolio Manager | as a Co-Portfolio | 30 Fund, the Hennessy Cornerstone Large Growth Fund, the |
| | Manager or | Hennessy Cornerstone Value Fund, the Hennessy Total Return |
| | Portfolio Manager | Fund, and the Hennessy Balanced Fund since October 2014. |
| | | He served as Co-Portfolio Manager of the same funds from |
| | | February 2011 through September 2014. Mr. Peery has also |
| | | served as a Portfolio Manager of the Hennessy Gas Utility Fund |
| | | since February 2015 and as Lead Portfolio Manager of the |
| | | Hennessy Technology Fund since February 2017. |
| | | |
| Daniel P. Hennessy | December 2016 | Mr. Daniel Hennessy has been employed by Hennessy Advisors, |
| (1990) | | Inc. since 2015. He has served as an Associate Analyst of the |
| Assistant Vice President | | Hennessy Technology Fund since February 2017. He previously |
| and Associate Analyst | | served as a Mutual Fund Specialist at U.S. Bancorp Fund |
| | | Services, LLC from November 2014 to July 2015. Prior to that, |
| | | he attended the University of San Diego, where he earned a |
| | | degree in Political Science. |
_______________
(1) | Messrs. DeSousa, Doyle, Hennessy, and Richardson previously served on the Board of Directors of Hennessy Mutual Funds, Inc. (“HMFI”), The Hennessy Funds, Inc. (“HFI”), and Hennessy SPARX Funds Trust (“HSFT”). Pursuant to an internal reorganization effective as of February 28, 2014, the series of HFMI, HFI, and HSFT were reorganized into corresponding series of Hennessy Funds Trust that mirrored them. Subsequent to the reorganization, HFMI, HFI, and HSFT were dissolved. |
(2) | Mr. Hennessy is considered an “interested person,” as defined in the Investment Company Act of 1940, as amended, because he is an officer of the Hennessy Funds. |
(3) | The address of this officer is 101 Federal Street, Suite 1900, Boston, MA 02110. |
(4) | The address of this officer is 1340 Environ Way, Chapel Hill, NC 27517. |
| TRUSTEES AND OFFICERS OF THE FUND |
(This Page Intentionally Left Blank.)
| HENNESSY FUNDS | 1-800-966-4354 | |
Expense Example (Unaudited)
October 31, 2017
As a shareholder of the Fund, you incur two types of costs: (1) transaction costs, including sales charges (loads) on purchase payments, reinvested dividends, or other distributions, redemption fees, and exchange fees; and (2) ongoing costs, including management fees, service fees, and other Fund expenses. This Example is intended to help you understand your ongoing costs (in dollars) of investing in the Fund and to compare these costs with the ongoing costs of investing in other mutual funds. The Example is based on an investment of $1,000 invested at the beginning of the period and held for the entire period from May 1, 2017, through October 31, 2017.
Actual Expenses
The first line of the table below under the “Investor Class” and “Institutional Class” headings provides information about actual account values and actual expenses. Although the Fund charges no sales loads or transaction fees, you will be assessed fees for outgoing wire transfers, returned checks and stop payment orders at prevailing rates charged by U.S. Bancorp Fund Services, LLC, the Fund’s transfer agent. If you request that a redemption be made by wire transfer, currently a $15 fee is charged by the Fund’s transfer agent. IRA accounts will be charged a $15 annual maintenance fee. The example below includes, but is not limited to, management fees, shareholder servicing fees, fund accounting, custody, and transfer agent fees. However, the example below does not include portfolio trading commissions and related expenses, and other extraordinary expenses as determined under generally accepted accounting principles. You may use the information in this line, together with the amount you invested, to estimate the expenses that you paid over the period. Simply divide your account value by $1,000 (for example, an $8,600 account value divided by $1,000 = 8.6), then multiply the result by the number in the first line of the table under the “Investor Class” or “Institutional Class” headings in the column entitled “Expenses Paid During Period” to estimate the expenses you paid on your account during this period.
Hypothetical Example for Comparison Purposes
The second line of the table below under the “Investor Class” and “Institutional Class” headings provides information about hypothetical account values and hypothetical expenses based on the Fund’s actual expense ratios and an assumed rate of return of 5% per year before expenses, which is not the Fund’s actual return. The hypothetical account values and expenses may not be used to estimate the actual ending account balance or expenses you paid for the period. You may use this information to compare the ongoing costs of investing in the Fund and other funds. To do so, compare this 5% hypothetical example with the 5% hypothetical examples that appear in the shareholder reports of the other funds. Please note that the expenses shown in the table are meant to highlight your ongoing costs only and do not reflect any transactional costs, such as sales charges (loads), or exchange fees. Therefore, the second line of the table under the “Investor Class” and “Institutional Class” headings is useful in comparing ongoing costs only, and will not help you determine the relative total costs of owning different funds. In addition, if these transactional costs were included, your costs would have been higher.
| | | | Expenses Paid |
| | Beginning | Ending | During Period(1) |
| | Account Value | Account Value | May 1, 2017 – |
| | May 1, 2017 | October 31, 2017 | October 31, 2017 |
| Investor Class | | | |
| Actual | $1,000.00 | $1,033.80 | $5.13 |
| Hypothetical (5% return before expenses) | $1,000.00 | $1,020.16 | $5.09 |
| | | | |
| Institutional Class | | | |
| Actual | $1,000.00 | $1,035.70 | $3.34 |
| Hypothetical (5% return before expenses) | $1,000.00 | $1,021.93 | $3.31 |
(1) | Expenses are equal to the Fund’s annualized expense ratio of 1.00% for Investor Class shares or 0.65% for Institutional Class shares, as applicable, multiplied by the average account value over the period, multiplied by 184/365 days (to reflect one-half year period). |
| HENNESSY FUNDS | 1-800-966-4354 | |
How to Obtain a Copy of the Fund’s
Proxy Voting Policy and Proxy Voting Records
A description of the policies and procedures the Fund uses to determine how to vote proxies relating to portfolio securities is available without charge: (1) by calling 1-800-966-4354; (2) on the Hennessy Funds’ website at hennessyfunds.com/proxy-voting/policy.fs; or (3) on the U.S. Securities and Exchange Commission’s (the “SEC”) website at www.sec.gov. The Fund’s proxy voting record is available without charge on both the Hennessy Funds’ website at hennessyfunds.com/proxy-voting/vote.fs and the SEC’s website at www.sec.gov no later than August 31 for the prior 12 months ending June 30.
Quarterly Filings on Form N-Q
The Fund files a complete schedule of portfolio holdings with the SEC for the first and third quarters of each fiscal year on Form N-Q. The Fund’s Forms N-Q are made available on the SEC’s website at www.sec.gov. The Fund’s Forms N-Q may be reviewed and copied at the SEC’s Public Reference Room in Washington, DC, and information on the operation of the Public Reference Room may be obtained by calling 1-800-SEC-0330. Information included in the Fund’s Forms N-Q will also be available upon request by calling 1-800-966-4354.
Federal Tax Distribution Information
(Unaudited)
For fiscal year 2017, certain dividends paid by the Fund may be subject to a maximum tax rate of 23.8%, as provided for by the Jobs and Growth Tax Relief Reconciliation Act of 2003. The percentage of dividends declared from ordinary income designated as qualified dividend income was 100.00%.
For corporate shareholders, the percent of ordinary income distributions that qualified for the corporate dividends received deduction for fiscal year 2017 was 100.00%.
The percentage of taxable ordinary income distributions that are designated as short-term capital gain distributions under Section 871(k)(2)(C) of the Internal Revenue Code of 1986, as amended, for the Fund was 0.00%.
Householding
To help keep the Fund’s costs as low as possible, we generally deliver a single copy of most financial reports and prospectuses to shareholders who share an address, even if the accounts are registered under different names. This process, known as “householding,” does not apply to account statements. You may request an individual copy of a prospectus or financial report at any time. If you would like to receive separate mailings, please call U.S. Bancorp Fund Services, LLC at 1-800-261-6950 or 1-414-765-4124 and we will begin individual delivery within 30 days of your request. If your account is held through a financial institution or other intermediary, please contact them directly to request individual delivery.
| PROXY VOTING — PRIVACY POLICY |
Privacy Policy
We collect the following non-public personal information about you:
| | • | information we receive from you on or in applications or other forms, correspondence, or conversations, including, but not limited to, your name, address, phone number, social security number, assets, income, and date of birth; and |
| | • | information about your transactions with us, our affiliates, or others, including, but not limited to, your account number and balance, payment history, parties to transactions, cost basis information, and other financial information. |
We do not disclose any non-public personal information about our current or former shareholders to non-affiliated third parties, except as permitted by law. For example, we are permitted by law to disclose all of the information we collect, as described above, to our Transfer Agent to process your transactions. Furthermore, we restrict access to your non-public personal information to those persons who require such information to provide products or services to you. We maintain physical, electronic, and procedural safeguards that comply with federal standards to guard your non-public personal information.
In the event that you hold shares of the Fund through a financial intermediary, including, but not limited to, a broker-dealer, bank, or trust company, the privacy policy of your financial intermediary would govern how your non-public personal information will be shared with non-affiliated third parties.
| HENNESSY FUNDS | 1-800-966-4354 | |
For information, questions or assistance, please call
The Hennessy Funds
1-800-966-4354 or 1-415-899-1555
INVESTMENT ADVISOR
Hennessy Advisors, Inc.
7250 Redwood Boulevard, Suite 200
Novato, California 94945
ADMINISTRATOR,
TRANSFER AGENT,
DIVIDEND PAYING AGENT &
SHAREHOLDER SERVICING AGENT
U.S. Bancorp Fund Services, LLC
P.O. Box 701
Milwaukee, Wisconsin 53201-0701
CUSTODIAN
U.S. Bank N.A.
Custody Operations
1555 North River Center Drive, Suite 302
Milwaukee, Wisconsin 53212
TRUSTEES
Neil J. Hennessy
Robert T. Doyle
J. Dennis DeSousa
Gerald P. Richardson
COUNSEL
Foley & Lardner LLP
777 East Wisconsin Avenue
Milwaukee, Wisconsin 53202-5306
INDEPENDENT REGISTERED
PUBLIC ACCOUNTING FIRM
Tait, Weller & Baker LLP
1818 Market Street, Suite 2400
Philadelphia, Pennsylvania 19103
DISTRIBUTOR
Quasar Distributors, LLC
777 East Wisconsin Avenue
Milwaukee, Wisconsin 53202
hennessyfunds.com | 1-800-966-4354
This report has been prepared for shareholders and may be distributed to
others only if preceded or accompanied by a current prospectus.
ANNUAL REPORT
OCTOBER 31, 2017
HENNESSY SMALL CAP
FINANCIAL FUND
Investor Class HSFNX
Institutional Class HISFX
hennessyfunds.com | 1-800-966-4354
(This Page Intentionally Left Blank.)
Contents
| Letter to Shareholders | 2 |
| Performance Overview | 4 |
| Financial Statements | |
| Schedule of Investments | 7 |
| Statement of Assets and Liabilities | 10 |
| Statement of Operations | 11 |
| Statements of Changes in Net Assets | 13 |
| Financial Highlights | 14 |
| Notes to the Financial Statements | 18 |
| Report of Independent Registered Public Accounting Firm | 25 |
| Trustees and Officers of the Fund | 26 |
| Expense Example | 30 |
| Proxy Voting Policy and Proxy Voting Records | 32 |
| Quarterly Schedule of Investments | 32 |
| Federal Tax Distribution Information | 32 |
| Householding | 32 |
| Privacy Policy | 33 |
| HENNESSY FUNDS | 1-800-966-4354 | |
December 2017
Dear Hennessy Funds Shareholder:
Over the past year, global equity markets have made strong advances, fueled by continued, broad-based economic growth in most countries and regions, and in spite of a somewhat unsettling geopolitical backdrop.
U.S. stocks performed well in the first year of the new administration in Washington, and, ignoring the debate and the bluster, investors have continued to focus on what concerns them the most – tax reform, deregulation, and the hope of an increase in infrastructure spending. As we move into the final weeks of the calendar year, with the major indices reaching new highs, I find myself envisioning the Dow Jones Industrial Average building momentum toward 30,000.
Over the past 12 months, the U.S. economy has continued to grow at a steady rate of almost 2.5% on an annualized basis, as measured by GDP. Companies have added over 170,000 jobs per month on average over the past year, and the current unemployment rate of 4.1% is the lowest in 17 years. Consumer confidence is high and still rising, and corporate profits are at all-time highs. The Federal Reserve has been increasing interest rates, but at a gradual pace. The bond market has also continued to support the equity market and equity market valuations. Since December of last year, long bond yields have stayed within a narrow band, with the 10-year U.S. Treasury yield hovering in the 2.0% to 2.5% range, and remain low compared to historical averages. In my opinion, long bond yields have stayed low despite three increases in the Federal Funds rate over the last 12 months in part due to persistent low inflation.
Meanwhile, the prospective price-to-earnings multiples for the Dow Jones Industrial Average and S&P 500 Index are just above long-term averages at 19.5x and 19.9x, respectively. I believe these levels of stock valuation, while higher than a year ago, are still very reasonable. At the peak of the technology/dot-com bubble, U.S. equities sold at much higher multiples across the board than they do today, and bond yields were also much higher. In June of 1999, the Dow Jones Industrial Average sold at 28x earnings and the 10-year bond yield was close to 6%. Today, the Dow is selling at under 20x earnings and is offering a 2.2% dividend yield, on par with the yield of the 10-year government bond at 2.4%.
Equity markets in the U.S. have been rising for almost nine years, and financial media reports have speculated that this bull run will come to end, but why? I see no substantial reasons or indicators that a major correction is on the horizon. I remain confident that this bull market has room to run. Overall, investment fundamentals are strong. Corporate earnings are growing at a healthy rate, and companies are generating excess cash flow. Cash continues to build on corporate balance sheets, with $5.2 trillion in cash and short term investments among the S&P 500 Index companies as of October 31, 2017. If our government leaders can pass a meaningful tax reform bill and continue efforts toward regulatory relief, it could be icing on the cake for equities.
There have been, and will likely continue to be, downturns throughout this extended bull market. Since 2010, there have been 18 downturns in the market, 14 of which were between 5% and 10% and four of which were corrections of between 10% and 20%. Yet the market has bounced back following each pullback and then has moved higher. A correction is not the end of the bull market. What might signal that we are at the end of this bull market? Euphoria. And I still see no signs of euphoria in this market. In the past,
I have likened the current bull market to that of 1982-2000, and I am confident in the strength of the market today and believe the economy will continue its slow, but steady, growth into the coming year.
Thank you for your continued confidence and investment in our funds. If you have any questions or would like to speak with us directly, please don’t hesitate to call us at (800) 966-4354.
Best regards,
Neil J. Hennessy
President and Chief Investment Officer
Past performance does not guarantee future results.
Mutual fund investing involves risk. Principal loss is possible.
Opinions expressed are those of Neil Hennessy and are subject to change, are not guaranteed, and should not be considered investment advice.
The Dow Jones Industrial Average and S&P 500 Index are unmanaged indices commonly used to measure the performance of U.S. stocks. One cannot invest directly in an index.
Price to earnings is calculated by dividing a company’s market price per share by its earnings per share. Dividend yield is calculated as the annual dividends paid by a company divided by the price of a share of its stock. Cash flow provides an indication of a company’s financial strength and represents earnings before depreciation, amortization, and non-cash charges.
| HENNESSY FUNDS | 1-800-966-4354 | |
Performance Overview (Unaudited)
CHANGE IN VALUE OF $10,000 INVESTMENT
This graph illustrates the performance of an initial investment of $10,000 made in the Fund ten years ago and assumes the reinvestment of dividends.
AVERAGE ANNUAL TOTAL RETURN FOR PERIODS ENDED OCTOBER 31, 2017
| | One | Five | Ten |
| | Year | Years | Years |
| Hennessy Small Cap Financial Fund – | | | |
| Investor Class (HSFNX) | 25.03% | 14.97% | 9.65% |
| Hennessy Small Cap Financial Fund – | | | |
Institutional Class (HISFX)(1) | 25.56% | 15.38% | 9.95% |
Russell 2000® Financial Services Index | 25.59% | 15.35% | 6.87% |
Russell 2000® Index | 27.85% | 14.49% | 7.63% |
Expense ratios: 1.55% (Investor Class); 1.18% (Institutional Class)
(1) | The inception date of Institutional Class shares is May 30, 2008. Performance shown prior to the inception of Institutional Class shares reflects the performance of Investor Class shares and includes expenses that are not applicable to, and are higher than, those of Institutional Class shares. |
Performance data quoted represents past performance; past performance does not guarantee future results. The investment return and principal value of an investment will fluctuate so that an investor’s shares, when redeemed, may be worth more or less than their original cost. The performance table does not reflect the deduction of taxes that a shareholder would pay on Fund distributions or the redemption of Fund shares. Current performance of the Fund may be lower or higher than the performance quoted. Performance data current to the most recent month end may be obtained by visiting hennessyfunds.com. Performance for periods prior to October 26, 2012, is that of the FBR Small Cap Financial Fund.
The Russell 2000® Financial Services Index is an unmanaged index commonly used to measure the performance of U.S. small-capitalization financial sector stocks. The Russell 2000® Index is an unmanaged index commonly used to measure the performance of U.S. small-capitalization stocks. One cannot invest directly in an index.
Frank Russell Company (“Russell”) is the source and owner of the trademarks, service marks, and copyrights related to the Russell Indexes. Russell® is a trademark of Frank Russell Company. Neither Russell nor its licensors accept any liability for any errors or omissions in the Russell Indexes or Russell ratings or underlying data and no party may rely on any Russell Indexes or Russell ratings or underlying data contained in this
communication. No further distribution of Russell data is permitted without Russell’s express written consent. Russell does not promote, sponsor, or endorse the content of this communication.
The expense ratios presented are from the most recent prospectus. The expense ratios for the current reporting period are available in the Financial Highlights section of this report.
PERFORMANCE NARRATIVE
Portfolio Managers David H. Ellison and Ryan C. Kelley
Performance:
For the 12-month period ended October 31, 2017, the Investor Class of the Hennessy Small Cap Financial Fund returned 25.03%, underperforming both the Russell 2000® Financial Services Index and the Russell 2000® Index, which returned 25.59% and 27.85% for the same period, respectively.
In a year of strong performance in the broader domestic equity market, both the Fund and its benchmark indices posted strong returns. The Fund performed essentially in line with its primary benchmark, the Russell 2000® Index. Positive contributors to the Fund’s performance during the period included Hingham Institution for Savings, Flushing Financial Corporation, and Independent Bank Corporation. Companies which most negatively affected the Fund’s performance during the period were Meta Financial Group, Inc., IBERIABANK Corporation, and F.N.B. Corporation. The Fund continues to hold all of the companies mentioned.
Portfolio Strategy:
Generally, the Fund tilts its investments more heavily toward community and regional banks, thrifts and, at times, mortgage finance companies. Within these preferred sub-industries, we seek companies that we believe have high-quality management teams, uncomplicated business models, and sustainable earnings growth opportunities. We also try to identify companies that we expect will do well in the current environment, which is characterized by low, but rising, interest rates and competitive loan markets. We are less interested in companies that appear to promise an increase in profitability when interest rates rise, loan demand increases, or pricing becomes more favorable, as the timing of these macro industry dynamics is difficult to predict. In addition, we own certain companies whose operations have performed poorly in the past but whose management teams have restructuring plans in place aimed at improving profitability.
Investment Commentary:
We believe that the Financials sector as a whole has recovered well from the financial crisis of 2007 and 2008 and continues to prosper. Industry fundamentals are in excellent shape and measures of liquidity, capital, credit, loan loss reserves, book value growth and earnings have shown steady improvement over the last few years. We believe the regional banks and thrifts that comprise the bulk of the Fund’s investments are well positioned to see net interest margins rise as the Federal Reserve gradually increases short-term interest rates. With the U.S. economy growing steadily, we expect loan demand to continue to rise, helping to drive earnings growth in the coming year. We also expect to see continued consolidation in this sector, which should offer additional opportunities for higher profitability as a result of greater market power and economies of scale. Finally, we believe any progress on tax reform, infrastructure spending, regulatory reform, or pro-growth policies out of Washington will be a positive for the group.
| HENNESSY FUNDS | 1-800-966-4354 | |
We continue to have a positive outlook for the Fund. We believe the condition of the financial system in the U.S. today is stronger than it has been in quite some time. With improving fundamentals and increased merger activity in the sector, the outlook for small-cap financial stocks appears bright.
_______________
Opinions expressed are those of the Portfolio Managers as of the date written and are subject to change, are not guaranteed, and should not be considered investment advice or an indication of trading intent.
The Russell 2000® Financial Services Index is an unmanaged index commonly used to measure the performance of U.S. small-capitalization Financial sector stocks. The Russell 2000® Index is an unmanaged index commonly used to measure the performance of U.S. small-capitalization stocks. One cannot invest directly in an index.
The Fund is non-diversified, meaning it may concentrate its assets in fewer individual holdings than a diversified fund, making it more exposed to individual stock volatility than a diversified fund. Investments are focused in the Financial Services industry; sector funds may be subject to a higher degree of market risk. The Fund invests in smaller companies, which may have more limited liquidity and greater volatility compared to larger companies. Please see the Fund’s prospectus for a more complete discussion of these and other risks.
References to specific securities should not be considered a recommendation to buy or sell any security. Fund holdings and sector allocations are subject to change. Please refer to the Schedule of Investments included in this report for additional portfolio information.
Earnings growth is not a measure of the Fund’s future performance. Book value is the net asset value of a company, calculated by total assets minus liabilities.
| PERFORMANCE OVERVIEW/SCHEDULE OF INVESTMENTS |
Financial Statements
Schedule of Investments as of October 31, 2017 |
HENNESSY SMALL CAP FINANCIAL FUND
(% of Net Assets)
| TOP TEN HOLDINGS (EXCLUDING CASH/CASH EQUIVALENTS) | % NET ASSETS |
| Hingham Institution for Savings | 4.59% |
| Brookline Bancorp, Inc. | 4.43% |
| Banc of California, Inc. | 4.42% |
| Opus Bank | 4.28% |
| Flushing Financial Corp. | 4.06% |
| FCB Financial Holdings, Inc., Class A | 3.70% |
| IBERIABANK Corp. | 3.69% |
| Washington Federal, Inc. | 3.65% |
| OceanFirst Financial Corp. | 3.57% |
| Dime Community Bancshares, Inc. | 3.48% |
Note: For presentation purposes, the Fund has grouped some of the industry categories. For purposes of categorizing securities for compliance with section 8(b)(1) of the Investment Company Act of 1940, as amended, the Fund uses more specific industry classifications.
| HENNESSY FUNDS | 1-800-966-4354 | |
| COMMON STOCKS – 96.70% | | Number | | | | | | % of | |
| | | of Shares | | | Value | | | Net Assets | |
| Financials – 95.59% | | | | | | | | | |
| Banc of California, Inc. | | | 445,000 | | | $ | 9,367,250 | | | | 4.42 | % |
| BankUnited, Inc. | | | 170,000 | | | | 5,924,500 | | | | 2.79 | % |
| Banner Corp. | | | 115,000 | | | | 6,591,800 | | | | 3.11 | % |
| Beneficial Bancorp, Inc. | | | 216,500 | | | | 3,572,250 | | | | 1.69 | % |
| BofI Holding, Inc. (a) | | | 65,000 | | | | 1,748,500 | | | | 0.82 | % |
| Brookline Bancorp, Inc. | | | 610,000 | | | | 9,394,000 | | | | 4.43 | % |
| Capstar Financial Holdings, Inc. (a) | | | 320,000 | | | | 6,460,800 | | | | 3.05 | % |
| Clifton Bancorp, Inc. | | | 180,000 | | | | 3,065,400 | | | | 1.45 | % |
| ConnectOne Bancorp, Inc. | | | 250,000 | | | | 6,712,500 | | | | 3.17 | % |
| Dime Community Bancshares, Inc. | | | 335,000 | | | | 7,386,750 | | | | 3.48 | % |
| Eagle Bancorp, Inc. (a) | | | 110,000 | | | | 7,331,500 | | | | 3.46 | % |
| F.N.B. Corp. | | | 120,000 | | | | 1,618,800 | | | | 0.76 | % |
| FCB Financial Holdings, Inc., Class A (a) | | | 168,000 | | | | 7,845,600 | | | | 3.70 | % |
| First BanCorp. (a)(b) | | | 455,000 | | | | 2,343,250 | | | | 1.11 | % |
| First Connecticut Bancorp, Inc. | | | 183,000 | | | | 4,831,200 | | | | 2.28 | % |
| Flushing Financial Corp. | | | 287,000 | | | | 8,604,260 | | | | 4.06 | % |
| Green Bancorp, Inc. (a) | | | 270,000 | | | | 5,980,500 | | | | 2.82 | % |
| Guaranty Bancshares, Inc. | | | 55,000 | | | | 1,577,400 | | | | 0.74 | % |
| Hingham Institution for Savings | | | 50,000 | | | | 9,735,000 | | | | 4.59 | % |
| Hope Bancorp, Inc. | | | 140,000 | | | | 2,583,000 | | | | 1.22 | % |
| IBERIABANK Corp. | | | 106,000 | | | | 7,817,500 | | | | 3.69 | % |
| Independent Bank Corp. | | | 77,500 | | | | 5,587,750 | | | | 2.64 | % |
| Kearny Financial Corp. of Maryland | | | 320,000 | | | | 4,816,000 | | | | 2.27 | % |
| Meridian Bancorp, Inc. | | | 358,000 | | | | 7,052,600 | | | | 3.33 | % |
| Meta Financial Group, Inc. | | | 40,000 | | | | 3,490,000 | | | | 1.65 | % |
| Midland States Bancorp, Inc. | | | 98,000 | | | | 3,180,100 | | | | 1.50 | % |
| OceanFirst Financial Corp. | | | 273,000 | | | | 7,575,750 | | | | 3.57 | % |
| Opus Bank (a) | | | 350,000 | | | | 9,065,000 | | | | 4.28 | % |
| PacWest Bancorp | | | 103,000 | | | | 4,976,960 | | | | 2.35 | % |
| Provident Financial Services, Inc. | | | 158,000 | | | | 4,297,600 | | | | 2.03 | % |
| Sterling Bancorp | | | 225,500 | | | | 5,648,775 | | | | 2.66 | % |
| Texas Capital Bancshares, Inc. (a) | | | 12,000 | | | | 1,032,600 | | | | 0.49 | % |
| United Financial Bancorp, Inc. | | | 220,000 | | | | 4,028,200 | | | | 1.90 | % |
| Washington Federal, Inc. | | | 222,500 | | | | 7,743,000 | | | | 3.65 | % |
The accompanying notes are an integral part of these financial statements.
| COMMON STOCKS | | Number | | | | | | % of | |
| | | of Shares | | | Value | | | Net Assets | |
| Financials (Continued) | | | | | | | | | |
| Western Alliance Bancorp (a) | | | 50,000 | | | $ | 2,790,000 | | | | 1.32 | % |
| Wintrust Financial Corp. | | | 50,000 | | | | 4,064,500 | | | | 1.92 | % |
| WSFS Financial Corp. | | | 20,000 | | | | 994,000 | | | | 0.47 | % |
| Xenith Bankshares, Inc. (a) | | | 180,000 | | | | 5,756,400 | | | | 2.72 | % |
| | | | | | | | 202,590,995 | | | | 95.59 | % |
| | | | | | | | | | | | | |
| Information Technology – 1.11% | | | | | | | | | | | | |
| Q2 Holdings, Inc. (a) | | | 55,000 | | | | 2,340,250 | | | | 1.11 | % |
| | | | | | | | | | | | | |
| Total Common Stocks | | | | | | | | | | | | |
| (Cost $164,518,818) | | | | | | | 204,931,245 | | | | 96.70 | % |
| | | | | | | | | | | | | |
| SHORT-TERM INVESTMENTS – 3.64% | | | | | | | | | | | | |
| | | | | | | | | | | | | |
| Money Market Funds – 3.64% | | | | | | | | | | | | |
| Fidelity Government Portfolio, Institutional Class, 0.92% (c) | | | 7,720,014 | | | | 7,720,014 | | | | 3.64 | % |
| | | | | | | | | | | | | |
| Total Short-Term Investments | | | | | | | | | | | | |
| (Cost $7,720,014) | | | | | | | 7,720,014 | | | | 3.64 | % |
| | | | | | | | | | | | | |
| Total Investments | | | | | | | | | | | | |
| (Cost $172,238,832) – 100.34% | | | | | | | 212,651,259 | | | | 100.34 | % |
| Liabilities in Excess of Other Assets – (0.34)% | | | | | | | (718,292 | ) | | | (0.34 | )% |
TOTAL NET ASSETS – 100.00% | | | | | | $ | 211,932,967 | | | | 100.00 | % |
Percentages are stated as a percent of net assets.
| (a) | Non-income producing security. |
| (b) | U.S. traded security of a foreign corporation. |
| (c) | The rate listed is the fund’s 7-day yield as of October 31, 2017. |
Summary of Fair Value Exposure at October 31, 2017
The following is a summary of the inputs used to value the Fund’s net assets as of October 31, 2017 (see Note 3 in the accompanying notes to the financial statements):
| Common Stocks | | Level 1 | | | Level 2 | | | Level 3 | | | Total | |
| Financials | | $ | 202,590,995 | | | $ | — | | | $ | — | | | $ | 202,590,995 | |
| Information Technology | | | 2,340,250 | | | | — | | | | — | | | | 2,340,250 | |
| Total Common Stocks | | $ | 204,931,245 | | | $ | — | | | $ | — | | | $ | 204,931,245 | |
| Short-Term Investments | | | | | | | | | | | | | | | | |
| Money Market Funds | | $ | 7,720,014 | | | $ | — | | | $ | — | | | $ | 7,720,014 | |
| Total Short-Term Investments | | $ | 7,720,014 | | | $ | — | | | $ | — | | | $ | 7,720,014 | |
| Total Investments | | $ | 212,651,259 | | | $ | — | | | $ | — | | | $ | 212,651,259 | |
Transfers between levels are recognized at the end of the reporting period. During the year ended October 31, 2017, the Fund recognized no transfers between levels.
The accompanying notes are an integral part of these financial statements.
| HENNESSY FUNDS | 1-800-966-4354 | |
Financial Statements
Statement of Assets and Liabilities as of October 31, 2017 |
| ASSETS: | | | |
| Investments in securities, at value (cost $172,238,832) | | $ | 212,651,259 | |
| Dividends and interest receivable | | | 82,366 | |
| Receivable for fund shares sold | | | 162,315 | |
| Receivable for securities sold | | | 294,627 | |
| Prepaid expenses and other assets | | | 23,966 | |
| Total Assets | | | 213,214,533 | |
| | | | | |
| LIABILITIES: | | | | |
| Payable for securities purchased | | | 841,640 | |
| Payable for fund shares redeemed | | | 135,820 | |
| Payable to advisor | | | 163,090 | |
| Payable to administrator | | | 32,579 | |
| Payable to auditor | | | 20,699 | |
| Accrued distribution fees | | | 26,913 | |
| Accrued service fees | | | 14,869 | |
| Accrued trustees fees | | | 5,578 | |
| Accrued expenses and other payables | | | 40,378 | |
| Total Liabilities | | | 1,281,566 | |
| NET ASSETS | | $ | 211,932,967 | |
| | | | | |
| NET ASSETS CONSIST OF: | | | | |
| Capital stock | | $ | 157,208,596 | |
| Accumulated net realized gain on investments | | | 14,311,944 | |
| Unrealized net appreciation on investments | | | 40,412,427 | |
| Total Net Assets | | $ | 211,932,967 | |
| | | | | |
| NET ASSETS | | | | |
| Investor Class: | | | | |
| Shares authorized (no par value) | | Unlimited | |
| Net assets applicable to outstanding Investor Class shares | | $ | 174,011,582 | |
| Shares issued and outstanding | | | 6,687,119 | |
| Net asset value, offering price and redemption price per share | | $ | 26.02 | |
| | | | | |
| Institutional Class: | | | | |
| Shares authorized (no par value) | | Unlimited | |
| Net assets applicable to outstanding Institutional Class shares | | $ | 37,921,385 | |
| Shares issued and outstanding | | | 2,416,956 | |
| Net asset value, offering price and redemption price per share | | $ | 15.69 | |
The accompanying notes are an integral part of these financial statements.
| STATEMENT OF ASSETS AND LIABILITIES/STATEMENT OF OPERATIONS |
Financial Statements
Statement of Operations for the year ended October 31, 2017 |
| INVESTMENT INCOME: | | | |
| Dividend income | | $ | 3,124,960 | |
| Interest income | | | 85,859 | |
| Total investment income | | | 3,210,819 | |
| | | | | |
| EXPENSES: | | | | |
| Investment advisory fees (See Note 5) | | | 1,984,769 | |
| Sub-transfer agent expenses – Investor Class (See Note 5) | | | 378,721 | |
| Sub-transfer agent expenses – Institutional Class (See Note 5) | | | 30,240 | |
| Distribution fees – Investor Class (See Note 5) | | | 274,289 | |
| Administration, fund accounting, custody and transfer agent fees (See Note 5) | | | 210,567 | |
| Service fees – Investor Class (See Note 5) | | | 182,859 | |
| Federal and state registration fees | | | 45,127 | |
| Compliance expense (See Note 5) | | | 28,705 | |
| Reports to shareholders | | | 23,981 | |
| Audit fees | | | 20,699 | |
| Trustees’ fees and expenses | | | 16,848 | |
| Legal fees | | | 2,000 | |
| Other expenses | | | 15,366 | |
| Total expenses | | | 3,214,171 | |
| NET INVESTMENT LOSS | | $ | (3,352 | ) |
| | | | | |
| REALIZED AND UNREALIZED GAINS: | | | | |
| Net realized gain on investments | | $ | 19,986,888 | |
| Net change in unrealized appreciation on investments | | | 17,014,799 | |
| Net gain on investments | | | 37,001,687 | |
| NET INCREASE IN NET ASSETS RESULTING FROM OPERATIONS | | $ | 36,998,335 | |
The accompanying notes are an integral part of these financial statements.
| HENNESSY FUNDS | 1-800-966-4354 | |
(This Page Intentionally Left Blank.)
| STATEMENTS OF CHANGES IN NET ASSETS |
Financial Statements
| Statements of Changes in Net Assets |
| | | Year Ended | | | Year Ended | |
| | | October 31, 2017 | | | October 31, 2016 | |
| OPERATIONS: | | | | | | |
| Net investment income (loss) | | $ | (3,352 | ) | | $ | 853,628 | |
| Net realized gain on investments | | | 19,986,888 | | | | 22,692,434 | |
| Net change in unrealized appreciation on investments | | | 17,014,799 | | | | (20,515,915 | ) |
| Net increase in net assets resulting from operations | | | 36,998,335 | | | | 3,030,147 | |
| | | | | | | | | |
| DISTRIBUTIONS TO SHAREHOLDERS FROM: | | | | | | | | |
| Net investment income – Investor Class | | | (483,756 | ) | | | (267,832 | ) |
| Net investment income – Institutional Class | | | (414,103 | ) | | | (92,618 | ) |
| Net realized gains – Investor Class | | | (19,796,278 | ) | | | (15,913,393 | ) |
| Net realized gains – Institutional Class | | | (3,118,417 | ) | | | (2,010,713 | ) |
| Total distributions | | | (23,812,554 | ) | | | (18,284,556 | ) |
| | | | | | | | | |
| CAPITAL SHARE TRANSACTIONS: | | | | | | | | |
| Proceeds from shares subscribed – Investor Class | | | 100,903,651 | | | | 45,732,345 | |
| Proceeds from shares subscribed – Institutional Class | | | 35,239,059 | | | | 13,512,825 | |
| Dividends reinvested – Investor Class | | | 19,917,344 | | | | 15,949,973 | |
| Dividends reinvested – Institutional Class | | | 3,189,710 | | | | 1,873,063 | |
| Cost of shares redeemed – Investor Class | | | (90,350,351 | ) | | | (134,605,880 | ) |
| Cost of shares redeemed – Institutional Class | | | (23,511,159 | ) | | | (18,295,342 | ) |
| Net increase (decrease) in net assets derived | | | | | | | | |
| from capital share transactions | | | 45,388,254 | | | | (75,833,016 | ) |
| TOTAL INCREASE (DECREASE) IN NET ASSETS | | | 58,574,035 | | | | (91,087,425 | ) |
| | | | | | | | | |
| NET ASSETS: | | | | | | | | |
| Beginning of year | | | 153,358,932 | | | | 244,446,357 | |
| End of year | | $ | 211,932,967 | | | $ | 153,358,932 | |
| Undistributed net investment | | | | | | | | |
| income (loss), end of year | | $ | — | | | $ | 492,304 | |
| | | | | | | | | |
| CHANGES IN SHARES OUTSTANDING: | | | | | | | | |
| Shares sold – Investor Class | | | 3,914,617 | | | | 1,969,658 | |
| Shares sold – Institutional Class | | | 2,297,508 | | | | 966,693 | |
| Shares issued to holders as reinvestment | | | | | | | | |
| of dividends – Investor Class | | | 782,880 | | | | 712,600 | |
| Shares issued to holders as reinvestment | | | | | | | | |
| of dividends – Institutional Class | | | 206,594 | | | | 138,299 | |
| Shares redeemed – Investor Class | | | (3,635,991 | ) | | | (6,232,464 | ) |
| Shares redeemed – Institutional Class | | | (1,581,565 | ) | | | (1,412,772 | ) |
| Net increase (decrease) in shares outstanding | | | 1,984,043 | | | | (3,857,986 | ) |
The accompanying notes are an integral part of these financial statements.
| HENNESSY FUNDS | 1-800-966-4354 | |
Financial Statements
For an Investor Class share outstanding throughout each year
PER SHARE DATA:
Net asset value, beginning of year
Income from investment operations:
Net investment income (loss)
Net realized and unrealized gains on investments
Total from investment operations
Less distributions:
Dividends from net investment income
Dividends from net realized gains
Total distributions
Paid-in capital from redemption fees
Net asset value, end of year
TOTAL RETURN
SUPPLEMENTAL DATA AND RATIOS:
Net assets, end of year (millions)
Ratio of expenses to average net assets
Ratio of net investment income (loss) to average net assets
Portfolio turnover rate(3)
(1) | Calculated based on average shares outstanding method. |
(2) | Amount is less than $0.01. |
(3) | Portfolio turnover is calculated on the basis of the Fund as a whole. |
The accompanying notes are an integral part of these financial statements.
| FINANCIAL HIGHLIGHTS — INVESTOR CLASS |
| Year Ended October 31, | | |
| 2017 | | | 2016 | | | 2015 | | | 2014 | | | 2013 | | |
| | | | | | | | | | | | | | | |
| $ | 23.48 | | | $ | 23.81 | | | $ | 24.13 | | | $ | 25.40 | | | $ | 19.54 | | |
| | | | | | | | | | | | | | | | | | | | |
| | | | | | | | | | | | | | | | | | | | |
| | (0.04 | ) | | | 0.10 | | | | 0.03 | (1) | | | (0.10 | ) | | | 0.10 | | |
| | 5.83 | | | | 1.20 | | | | 2.99 | | | | 0.49 | | | | 5.88 | | |
| | 5.79 | | | | 1.30 | | | | 3.02 | | | | 0.39 | | | | 5.98 | | |
| | | | | | | | | | | | | | | | | | | | |
| | | | | | | | | | | | | | | | | | | | |
| | (0.06 | ) | | | (0.03 | ) | | | — | | | | (0.06 | ) | | | (0.12 | ) | |
| | (3.19 | ) | | | (1.60 | ) | | | (3.34 | ) | | | (1.60 | ) | | | — | | |
| | (3.25 | ) | | | (1.63 | ) | | | (3.34 | ) | | | (1.66 | ) | | | (0.12 | ) | |
| | — | | | | — | | | | — | | | | 0.00 | (2) | | | 0.00 | (2) | |
| $ | 26.02 | | | $ | 23.48 | | | $ | 23.81 | | | $ | 24.13 | | | $ | 25.40 | | |
| | | | | | | | | | | | | | | | | | | | |
| | 25.03 | % | | | 5.80 | % | | | 14.51 | % | | | 1.40 | % | | | 30.80 | % | |
| | | | | | | | | | | | | | | | | | | | |
| | | | | | | | | | | | | | | | | | | | |
| $ | 174.01 | | | $ | 132.09 | | | $ | 218.50 | | | $ | 193.09 | | | $ | 243.42 | | |
| | 1.52 | % | | | 1.54 | % | | | 1.50 | % | | | 1.44 | % | | | 1.46 | % | |
| | (0.06 | )% | | | 0.38 | % | | | 0.17 | % | | | (0.36 | )% | | | 0.48 | % | |
| | 46 | % | | | 46 | % | | | 49 | % | | | 47 | % | | | 57 | % | |
The accompanying notes are an integral part of these financial statements.
| HENNESSY FUNDS | 1-800-966-4354 | |
Financial Statements
For an Institutional Class share outstanding throughout each year
PER SHARE DATA:
Net asset value, beginning of year
Income from investment operations:
Net investment income (loss)
Net realized and unrealized gains on investments
Total from investment operations
Less distributions:
Dividends from net investment income
Dividends from net realized gains
Total distributions
Net asset value, end of year
TOTAL RETURN
SUPPLEMENTAL DATA AND RATIOS:
Net assets, end of year (millions)
Ratio of expenses to average net assets
Ratio of net investment income (loss) to average net assets
Portfolio turnover rate(2)
(1) | Calculated based on average shares outstanding method. |
(2) | Portfolio turnover is calculated on the basis of the Fund as a whole. |
The accompanying notes are an integral part of these financial statements.
| FINANCIAL HIGHLIGHTS — INSTITUTIONAL CLASS |
| Year Ended October 31, | | |
| 2017 | | | 2016 | | | 2015 | | | 2014 | | | 2013 | | |
| | | | | | | | | | | | | | | |
| $ | 14.23 | | | $ | 14.39 | | | $ | 14.53 | | | $ | 15.96 | | | $ | 12.34 | | |
| | | | | | | | | | | | | | | | | | | | |
| | | | | | | | | | | | | | | | | | | | |
| | 0.02 | | | | 0.09 | | | | 0.06 | (1) | | | (0.09 | ) | | | 0.14 | | |
| | 3.56 | | | | 0.75 | | | | 1.81 | | | | 0.40 | | | | 3.66 | | |
| | 3.58 | | | | 0.84 | | | | 1.87 | | | | 0.31 | | | | 3.80 | | |
| | | | | | | | | | | | | | | | | | | | |
| | | | | | | | | | | | | | | | | | | | |
| | (0.17 | ) | | | (0.04 | ) | | | — | | | | (0.14 | ) | | | (0.18 | ) | |
| | (1.95 | ) | | | (0.96 | ) | | | (2.01 | ) | | | (1.60 | ) | | | — | | |
| | (2.12 | ) | | | (1.00 | ) | | | (2.01 | ) | | | (1.74 | ) | | | (0.18 | ) | |
| $ | 15.69 | | | $ | 14.23 | | | $ | 14.39 | | | $ | 14.53 | | | $ | 15.96 | | |
| | | | | | | | | | | | | | | | | | | | |
| | 25.56 | % | | | 6.22 | % | | | 14.91 | % | | | 1.70 | % | | | 31.18 | % | |
| | | | | | | | | | | | | | | | | | | | |
| | | | | | | | | | | | | | | | | | | | |
| $ | 37.92 | | | $ | 21.27 | | | $ | 25.94 | | | $ | 42.23 | | | $ | 68.80 | | |
| | 1.15 | % | | | 1.17 | % | | | 1.17 | % | | | 1.12 | % | | | 1.15 | % | |
| | 0.30 | % | | | 0.72 | % | | | 0.48 | % | | | (0.04 | )% | | | 0.74 | % | |
| | 46 | % | | | 46 | % | | | 49 | % | | | 47 | % | | | 57 | % | |
The accompanying notes are an integral part of these financial statements.
| HENNESSY FUNDS | 1-800-966-4354 | |
Financial Statements
Notes to the Financial Statements October 31, 2017 |
1). ORGANIZATION
The Hennessy Small Cap Financial Fund (the “Fund”) is a series of Hennessy Funds Trust (the “Trust”), which was organized as a Delaware statutory trust on September 17, 1992. The Fund is an open-end management investment company registered under the Investment Company Act of 1940, as amended. The investment objective of the Fund is capital appreciation. The Fund is a non-diversified fund.
The Fund offers Investor Class and Institutional Class shares. Each class of shares differs principally in its respective 12b-1 distribution and service, shareholder servicing, and sub-transfer agent expenses. There are no sales charges. Each class has identical rights to earnings, assets, and voting privileges, except for class-specific expenses and exclusive rights to vote on matters affecting only an individual class.
As an investment company, the Fund follows the investment company accounting and reporting guidance of the Financial Accounting Standards Board (“FASB”) Accounting Standard Codification Topic 946 “Financial Services—Investment Companies.”
2). SIGNIFICANT ACCOUNTING POLICIES
The following is a summary of significant accounting policies consistently followed by the Fund in the preparation of the financial statements. These policies conform to U.S. generally accepted accounting principles (“GAAP”).
| a). | Investment Valuation – All investments in securities are recorded at their estimated fair value, as described in Note 3. |
| b). | Federal Income Taxes – No provision for federal income taxes or excise taxes has been made because the Fund has elected to be taxed as a “regulated investment company” and intends to distribute substantially all of its taxable income to its shareholders and otherwise comply with the provisions of the Internal Revenue Code of 1986, as amended, applicable to regulated investment companies. Net investment income/loss and realized gains/losses for federal income tax purposes may differ from those reported in the financial statements because of temporary book and tax basis differences. Temporary differences are primarily the result of the treatment of wash sales for tax reporting purposes. The Fund recognizes interest and penalties related to income tax benefits, if any, in the Statement of Operations as an income tax expense. Distributions from net realized gains for book purposes may include short-term capital gains, which are included as ordinary income to shareholders for tax purposes. The Fund may utilize equalization accounting for tax purposes and designate earnings and profits, including net realized gains distributed to shareholders on redemption of shares, as part of the dividends paid deduction for income tax purposes. |
| | Due to inherent differences in the recognition of income, expenses, and realized gains/losses under GAAP and federal income tax regulations, permanent differences between book and tax basis for reporting for fiscal year 2017 have been identified and appropriately reclassified in the Statement of Assets and Liabilities. The adjustments are as follows: |
| | Accumulated | Accumulated | | |
| | Net Investment | Net Realized | | |
| | Loss | Gain on Investments | Capital Stock | |
| | $408,907 | $(4,842,062) | $4,433,155 | |
| NOTES TO THE FINANCIAL STATEMENTS |
| c). | Accounting for Uncertainty in Income Taxes – The Fund has accounting policies regarding recognition and measurement of tax positions taken or expected to be taken on a tax return. The tax returns of the Fund for the prior three fiscal years are open for examination. The Fund has reviewed all open tax years in major jurisdictions and concluded that there is no impact on the Fund’s net assets and no tax liability resulting from unrecognized tax benefits relating to uncertain income tax positions taken or expected to be taken on a tax return. The Fund’s major tax jurisdictions are U.S. federal and Delaware. |
| d). | Income and Expenses – Dividend income is recognized on the ex-dividend date or as soon as information is available to the Fund. Interest income, which includes the amortization of premium and accretion of discount, is recognized on an accrual basis. The Fund is charged for those expenses that are directly attributable to the portfolio, such as advisory, administration, and certain shareholder service fees. Income, expenses (other than expenses attributable to a specific class), and realized and unrealized gains/losses on investments are allocated to each class of shares based on such class’s net assets. |
| e). | Distributions to Shareholders – Dividends from net investment income for the Fund, if any, are declared and paid annually, usually in December. Distributions of net realized capital gains, if any, are declared and paid annually, usually in December. |
| f). | Security Transactions – Investment and shareholder transactions are recorded on the trade date. The Fund determines the realized gain/loss from an investment transaction by comparing the original cost of the security lot sold with the net sale proceeds. Discounts and premiums on securities purchased are accreted or amortized over the life of the respective security. |
| g). | Use of Estimates – The preparation of financial statements in conformity with GAAP requires management to make estimates and assumptions that affect the reported amounts of assets and liabilities and disclosure of contingent assets and liabilities at the date of the financial statements and the reported change in net assets during the reporting period. Actual results could differ from those estimates. |
| h). | Share Valuation – The net asset value (“NAV”) per share of the Fund is calculated by dividing (i) the sum of the value of the securities held by the Fund, plus cash or other assets, minus all liabilities (including estimated accrued expenses) by (ii) the total number of shares outstanding for the Fund, rounded to the nearest cent. The Fund’s shares will not be priced on days the New York Stock Exchange is closed for trading. The offering and redemption price per share for the Fund is equal to the Fund’s NAV per share. |
3). SECURITIES VALUATION
The Fund follows authoritative fair valuation accounting standards that establish an authoritative definition of fair value and set out a hierarchy for measuring fair value. These standards require additional disclosures about the various inputs and valuation techniques used to develop the measurements of fair value and a discussion of changes in valuation techniques and related inputs during the period. These inputs are summarized in the three broad levels listed below:
| | Level 1 – | Unadjusted, quoted prices in active markets for identical instruments that the Fund has the ability to access at the date of measurement. |
| | Level 2 – | Other significant observable inputs (including, but not limited to, quoted prices in active markets for similar instruments, quoted prices in markets that are not active for identical or similar instruments, and model-derived |
| HENNESSY FUNDS | 1-800-966-4354 | |
| | | valuations in which all significant inputs and significant value drivers are observable in active markets, such as interest rates, prepayment speeds, credit risk curves, default rates, and similar data). |
| | Level 3 – | Significant unobservable inputs (including the Fund’s own assumptions about what market participants would use to price the asset or liability based on the best available information) when observable inputs are unavailable. |
Following is a description of the valuation techniques applied to the Fund’s major categories of assets and liabilities measured at fair value on a recurring basis.
| | Equity Securities – Equity securities, including common stocks, preferred stocks, foreign-issued common stocks, exchange-traded funds, closed-end mutual funds, partnerships, rights, and real estate investment trusts, that are traded on a securities exchange for which a last-quoted sales price is readily available will generally be valued at the last sales price as reported by the primary exchange on which the securities are listed. Securities listed on The NASDAQ Stock Market (“NASDAQ”) will generally be valued at the NASDAQ Official Closing Price, which may differ from the last sales price reported. Securities traded on a securities exchange for which a last-quoted sales price is not readily available will generally be valued at the mean between the bid and ask prices. To the extent these securities are actively traded and valuation adjustments are not applied, they are classified in Level 1 of the fair value hierarchy. Securities traded on foreign exchanges generally are not valued at the same time the Fund calculates its NAV because most foreign markets close well before such time. The earlier close of most foreign markets gives rise to the possibility that significant events, including broad market moves, may have occurred in the interim. In certain circumstances, it may be determined that a security needs to be fair valued because it appears that the value of the security might have been materially affected by events occurring after the close of the market in which the security is principally traded, but before the time the Fund calculates its NAV, such as by a development that affects an entire market or region (e.g., weather-related events) or a potentially global development (e.g., a terrorist attack that may be expected to have an effect on investor expectations worldwide). |
| | Registered Investment Companies – Investments in registered investment companies (e.g., mutual funds) are generally priced at the ending NAV provided by the applicable registered investment company’s service agent and will be classified in Level 1 of the fair value hierarchy. |
| | Debt Securities – Debt securities, including corporate bonds, asset-backed securities, mortgage-backed securities, municipal bonds, U.S. Treasuries, and U.S. government agency issues, are generally valued at market on the basis of valuations furnished by an independent pricing service that utilizes both dealer-supplied valuations and formula-based techniques. The pricing service may consider recently executed transactions in securities of the issuer or comparable issuers, market price quotations (where observable), bond spreads, and fundamental data relating to the issuer. In addition, the model may incorporate observable market data, such as reported sales of similar securities, broker quotes, yields, bids, offers, and reference data. Certain securities are valued primarily using dealer quotations. These securities are generally classified in Level 2 of the fair value hierarchy. |
| | Short-Term Securities – Short-term equity investments, including money market funds, are valued in the manner specified above. Short-term debt investments with an original term to maturity of 60 days or less are valued at amortized cost, which approximates fair market value. If the original term to maturity of a short-term debt investment exceeded 60 days, then the values as of the 61st day prior to maturity are |
| NOTES TO THE FINANCIAL STATEMENTS |
| | amortized. Amortized cost is not used if its use would be inappropriate due to credit or other impairments of the issuer, in which case the security’s fair value would be determined, as described below. Short-term securities are generally classified in Level 1 or Level 2 of the fair market hierarchy depending on the inputs used and market activity levels for specific securities. |
The Board of Trustees of the Fund (the “Board”) has adopted fair value pricing procedures that are followed when a price for a security is not readily available or if a significant event has occurred that indicates the closing price of a security no longer represents the true value of that security. Fair value pricing determinations are made in good faith in accordance with these procedures. There are numerous criteria that will be given consideration in determining a fair value of a security, such as the trading volume of a security and markets, the values of other similar securities, and news events with direct bearing on a security or markets. Fair value pricing results in an estimated price for a security that reflects the amount the Fund might reasonably expect to receive in a current sale. Depending on the relative significance of the valuation inputs, these securities may be classified in either Level 2 or Level 3 of the fair value hierarchy.
The fair valuation of foreign securities may be determined with the assistance of a pricing service using correlations between the movement of prices of such securities and indices of domestic securities and other appropriate indicators, such as closing market prices of relevant American Depositary Receipts or futures contracts. The effect of using fair value pricing is that the Fund’s NAV will reflect the affected portfolio securities’ values as determined by the Board or its designee instead of being determined by the market. Using a fair value pricing methodology to price a foreign security may result in a value that is different from the foreign security’s most recent closing price and from the prices used by other investment companies to calculate their NAVs and are generally classified in Level 2 of the fair valuation hierarchy. Because the Fund may invest in foreign securities, the value of the Fund’s portfolio securities may change on days when you will not be able to purchase or redeem your shares.
The Board has delegated day-to-day valuation matters to a Valuation Committee comprised of one or more representatives from Hennessy Advisors, Inc., the Fund’s investment advisor (the “Advisor”). The function of the Valuation Committee is to value securities where current and reliable market quotations are not readily available. All actions taken by the Valuation Committee are reviewed by the Board.
The Fund has performed an analysis of all existing investments to determine the significance and character of all inputs to their fair value determination. Various inputs are used to determine the value of the Fund’s investments. The inputs or methodology used for valuing securities are not necessarily an indication of the risk associated with investing in those securities. Details related to the fair valuation hierarchy of the Fund’s securities as of October 31, 2017, are included in the Schedule of Investments.
4). INVESTMENT TRANSACTIONS
Purchases and sales of investment securities (excluding government and short-term investments) for the Fund during fiscal year 2017 were $119,367,608 and $93,324,698, respectively.
There were no purchases or sales/maturities of long-term U.S. government securities for the Fund during fiscal year 2017.
The Fund is permitted to purchase or sell securities from or to another fund in the Hennessy Funds family of funds (the “Hennessy Funds”) under specified conditions outlined in procedures adopted by the Board. The procedures have been designed to ensure that any purchase or sale of securities by the Fund from or to another Hennessy
| HENNESSY FUNDS | 1-800-966-4354 | |
Fund complies with Rule 17a-7 of the Investment Company Act of 1940, as amended. For fiscal year 2017, the Fund did not engage in purchases or sales of securities pursuant to Rule 17a-7 of the Investment Company Act of 1940, as amended.
5). INVESTMENT MANAGEMENT FEE AND OTHER TRANSACTIONS WITH AFFILIATES
The Advisor provides the Fund with investment management services under an Investment Advisory Agreement. The Advisor provides all investment advice, office space, and facilities, as well as most of the personnel needed by the Fund. As compensation for its services, the Advisor is entitled to a monthly fee from the Fund. The fee is based upon the average daily net assets of the Fund at an annual rate of 0.90%. The net investment advisory fees expensed by the Fund during fiscal year 2017 are included in the Statement of Operations.
The Board has approved a Shareholder Servicing Agreement for Investor Class shares of the Fund, which was instituted to compensate the Advisor for the non-investment management services it provides to the Fund. The Shareholder Servicing Agreement provides for a monthly fee paid to the Advisor at an annual rate of 0.10% of the average daily net assets of the Fund attributable to Investor Class shares. The shareholder service fees expensed by the Fund during fiscal year 2017 are included in the Statement of Operations.
The Fund has adopted a plan pursuant to Rule 12b-1 under the Investment Company Act of 1940, as amended, that authorizes payments in connection with the distribution of the Fund’s shares at an annual rate of up to 0.25% of the Fund’s average daily net assets attributable to Investor Class shares. Even though the authorized rate is up to 0.25%, the Fund is currently only using up to 0.15% of its average daily net assets attributable to Investor Class shares for such purpose. Amounts paid under the plan may be spent on any activities or expenses primarily intended to result in the sale of shares, including, but not limited to, advertising, shareholder account servicing, the printing and mailing of prospectuses to other than current shareholders, the printing and mailing of sales literature, and compensation for sales and marketing activities or to financial institutions and others, such as dealers and distributors. The distribution fees expensed by the Fund during fiscal year 2017 are included in the Statement of Operations.
The Fund has entered into agreements with various brokers, dealers, and financial intermediaries in connection with the sale of shares of the Fund. The agreements provide for periodic payments by the Fund to the brokers, dealers, and financial intermediaries for providing certain shareholder maintenance services (sub-transfer agent expenses). These shareholder services include the pre-processing and quality control of new accounts, shareholder correspondence, answering customer inquiries regarding account status, and facilitating shareholder telephone transactions. The sub-transfer agent fees expensed by the Fund during fiscal year 2017 are included in the Statement of Operations.
U.S. Bancorp Fund Services, LLC (“USBFS”) provides the Fund with administrative, fund accounting, and transfer agent services and necessary office equipment. As administrator, USBFS is responsible for activities such as (i) preparing various federal and state regulatory filings, reports, and returns for the Fund, (ii) preparing reports and materials to be supplied to the Board, (iii) monitoring the activities of the Fund’s custodian, transfer agent, and accountants, and (iv) coordinating the preparation and payment of the Fund’s expenses and reviewing the Fund’s expense accruals. U.S. Bank, N.A., an affiliate of USBFS, serves as the Fund’s custodian. The servicing agreements between the Trust, USBFS, and U.S. Bank N.A. contain a fee schedule that is inclusive of administrative, fund accounting, custody, and transfer agent fees. The administrative, fund accounting, custody, and transfer agent fees expensed by the Fund during fiscal year 2017 are included in the Statement of Operations.
| NOTES TO THE FINANCIAL STATEMENTS |
Quasar Distributors, LLC acts as the Fund’s principal underwriter in a continuous public offering of the Fund’s shares. Quasar Distributors, LLC is an affiliate of USBFS and U.S. Bank, N.A.
The officers of the Fund are affiliated with the Advisor. Such officers, with the exception of the Chief Compliance Officer and the Senior Compliance Officer, receive no compensation from the Fund for serving in their respective roles. The Fund, along with the other Hennessy Funds, makes reimbursement payments, on an equal basis, to the Advisor for a portion of the salary and benefits associated with the office of the Chief Compliance Officer and for all of the salary and benefits associated with the office of the Senior Compliance Officer. The compliance fees expensed by the Fund during fiscal year 2017 are included in the Statement of Operations.
6). GUARANTEES AND INDEMNIFICATIONS
Under the Hennessy Funds’ organizational documents, their officers and trustees are indemnified by the Hennessy Funds against certain liabilities arising out of the performance of their duties to the Hennessy Funds. Additionally, in the normal course of business, the Hennessy Funds enter into contracts with service providers that contain general indemnification clauses. The Fund’s maximum exposure under these arrangements is unknown as this would involve future claims that may be made against the Fund that have not yet occurred. Currently, the Fund expects the risk of loss to be remote.
7). LINE OF CREDIT
The Fund has an uncommitted line of credit with the other Hennessy Funds in the amount of the lesser of (i) $100,000,000 or (ii) 33.33% of each Hennessy Fund’s net assets, or 30% for the Hennessy Gas Utility Fund and 10% for the Hennessy Balanced Fund, intended to provide short-term financing, if necessary, subject to certain restrictions, in connection with shareholder redemptions. The credit facility is with the Hennessy Funds’ custodian bank, U.S. Bank, N.A. Borrowings under this arrangement bear interest at the bank’s prime rate and are secured by all of the Fund’s assets (as to its own borrowings only). During fiscal year 2017, the Fund did not have any borrowings outstanding under the line of credit.
8). FEDERAL TAX INFORMATION
As of October 31, 2017, the components of accumulated earnings (losses) for income tax purposes were as follows:
| | | Investments | |
| Cost of investments for tax purposes | | $ | 172,961,243 | |
| Gross tax unrealized appreciation | | $ | 43,775,010 | |
| Gross tax unrealized depreciation | | | (4,084,994 | ) |
| Net tax unrealized appreciation | | $ | 39,690,016 | |
| Undistributed ordinary income | | $ | 1,303,242 | |
| Undistributed long-term capital gains | | | 13,731,113 | |
| Total distributable earnings | | $ | 15,034,355 | |
| Other accumulated gain | | $ | — | |
| Total accumulated gain | | $ | 54,724,371 | |
The difference between book-basis unrealized appreciation/depreciation (as shown in the Statement of Assets and Liabilities) and tax-basis unrealized appreciation/depreciation (as shown above) is attributable primarily to wash sales.
At October 31, 2017, the Fund had no tax basis capital losses to offset future capital gains.
| HENNESSY FUNDS | 1-800-966-4354 | |
At October 31, 2017, the Fund did not defer, on a tax basis, any late-year ordinary losses. Late-year ordinary losses are net ordinary losses incurred after December 31, 2016, but within the taxable year, that are deemed to arise on the first day of the Fund’s next taxable year.
During fiscal years 2017 and 2016, the tax character of distributions paid by the Fund was as follows:
| | | Year Ended | | | Year Ended | |
| | | October 31, 2017 | | | October 31, 2016 | |
Ordinary income(1) | | $ | 897,859 | | | $ | 2,097,406 | |
| Long-term capital gain | | | 22,914,695 | | | | 16,187,150 | |
| | | $ | 23,812,554 | | | $ | 18,284,556 | |
(1) Ordinary income includes short-term gain/loss.
9). EVENTS SUBSEQUENT TO YEAR END
Management has evaluated the Fund’s related events and transactions that occurred subsequent to October 31, 2017, through the date of issuance of the Fund’s financial statements. Other than as disclosed below, management has determined that there were no subsequent events requiring recognition or disclosure in the financial statements.
On December 7, 2017, capital gains were declared and paid to shareholders of record on December 6, 2017, as follows:
| | Long-term | Short-term |
| Investor Class | $1.80632 | $0.16690 |
| Institutional Class | $1.08807 | $0.10053 |
| NOTES/REPORT OF INDEPENDENT REGISTERED PUBLIC ACCOUNTING FIRM |
Report of Independent Registered Public
Accounting Firm
To the Board of Trustees of Hennessy Funds Trust
and the Shareholders of the Hennessy Small Cap Financial Fund
Novato, CA
We have audited the accompanying statement of assets and liabilities, including the schedule of investments, of the Hennessy Small Cap Financial Fund (the “Fund”), a series of Hennessy Funds Trust (the “Trust”) as of October 31, 2017, and the related statement of operations for the year then ended, the statements of changes in net assets for each of the two years in the period then ended, and the financial highlights for each of the five years in the period then ended. These financial statements and financial highlights are the responsibility of the Fund’s management. Our responsibility is to express an opinion on these financial statements and financial highlights based on our audits.
We conducted our audits in accordance with the standards of the Public Company Accounting Oversight Board (United States). Those standards require that we plan and perform the audits to obtain reasonable assurance about whether the financial statements and financial highlights are free of material misstatement. The Fund is not required to have, nor were we engaged to perform, an audit of its internal control over financial reporting. Our audits included consideration of internal control over financial reporting as a basis for designing audit procedures that are appropriate in the circumstances, but not for the purposes of expressing an opinion on the effectiveness of the Fund’s internal control over financial reporting. Accordingly, we express no such opinion. An audit includes examining, on a test basis, evidence supporting the amounts and disclosures in the financial statements. Our procedures included confirmation of securities owned as of October 31, 2017, by correspondence with the custodian and brokers. An audit also includes assessing the accounting principles used and significant estimates made by management, as well as evaluating the overall financial statement presentation. We believe that our audits provide a reasonable basis for our opinion.
In our opinion, the financial statements and financial highlights referred to above present fairly, in all material respects, the financial position of the Hennessy Small Cap Financial Fund as of October 31, 2017, the results of its operations for the year then ended, the changes in its net assets for each of the two years in the period then ended, and the financial highlights for each of the five years in the period then ended, in conformity with accounting principles generally accepted in the United States of America.
TAIT, WELLER & BAKER LLP
Philadelphia, Pennsylvania
December 22, 2017
| HENNESSY FUNDS | 1-800-966-4354 | |
Trustees and Officers of the Fund (Unaudited)
The business and affairs of the Funds are managed under the direction of the Board of Trustees of the Trust, and the Board of Trustees elects the Officers of the Trust. Beginning in March 2015, the Board of Trustees has from time to time appointed advisers to the Board of Trustees (“Advisers”), with the intention of having qualified individuals serve in an advisory capacity in order to garner experience in the mutual fund and asset management industry and be considered as potential Trustees in the future. There are currently three Advisers to the Board of Trustees: Brian Alexander, Doug Franklin, and Claire Knoles. As Advisers, Mr. Alexander, Mr. Franklin, and Ms. Knoles attend meetings of the Board and act as non-voting participants. Information pertaining to the Trustees, Advisers, and the Officers of the Trust is set forth below. The Trustees and Officers serve until their successors are duly elected and qualified or until their earlier death, resignation, or removal. Each of the Trustees oversees 14 Hennessy Funds. Unless otherwise indicated, the address of all persons listed below is 7250 Redwood Boulevard, Suite 200, Novato, CA 94945. The Fund’s Statement of Additional Information includes more information about the persons listed below and is available, without charge, upon request by calling 1-800-966-4354.
| | | | Other |
| | | | Directorships |
| | | | Held Outside |
| Name, (Year of Birth), | | | of Fund |
| and Position Held | Start Date | Principal Occupation(s) | Complex During |
with the Trust | of Service | During Past Five Years | Past Five Years(1) |
| | | |
| Disinterested Trustees and Advisers | | |
| | | | |
| J. Dennis DeSousa | January 1996 | Mr. DeSousa is a real estate investor. | None. |
| (1936) | | | |
| Trustee | | | |
| | | | |
| Robert T. Doyle | January 1996 | Mr. Doyle has been the Sheriff of | None. |
| (1947) | | Marin County, California since 1996. | |
| Trustee | | | |
| | | | |
| Gerald P. Richardson | May 2004 | Mr. Richardson is an independent | None. |
| (1945) | | consultant in the securities industry. | |
| Trustee | | | |
| | | | |
| Brian Alexander | March 2015 | Mr. Alexander has been employed | None. |
| (1981) | | by Sutter Health Novato Community | |
| Adviser to the Board | | Hospital since 2012, first as an | |
| | | Assistant Administrator and then, | |
| | | beginning in 2013, as the Chief | |
| | | Administrative Officer. From 2011 | |
| | | through 2012, Mr. Alexander was | |
| | | employed by Sutter Health West Bay | |
| | | Region as the Regional Director of | |
| | | Strategic Decision Support. | |
| TRUSTEES AND OFFICERS OF THE FUND |
| | | | Other |
| | | | Directorships |
| | | | Held Outside |
| Name, (Year of Birth), | | | of Fund |
| and Position Held | Start Date | Principal Occupation(s) | Complex During |
with the Trust | of Service | During Past Five Years | Past Five Years(1) |
| | | | |
| Doug Franklin | March 2016 | Mr. Franklin is a retired insurance | None. |
| (1964) | | industry executive. From 1987 | |
| Adviser to the Board | | through 2015, he was employed | |
| | | by Allianz-Fireman’s Fund Insurance | |
| | | Company in various positions, | |
| | | including Chief Actuary and | |
| | | Chief Risk Officer. | |
| | | | |
| Claire Knoles | December 2015 | Ms. Knoles is a founder of Kiosk and | None. |
| (1974) | | has served as its Chief Operating | |
| Adviser to the Board | | Officer since 2004. Kiosk is a full | |
| | | service marketing agency with | |
| | | offices in the San Francisco Bay | |
| | | Area, Toronto, and Liverpool, UK. | |
| | | | |
Interested Trustee(2) | | | |
| | | | |
| Neil J. Hennessy | January 1996 as | Mr. Hennessy has been employed by | Hennessy |
| (1956) | a Trustee and | Hennessy Advisors, Inc. since 1989 | Advisors, Inc. |
| Trustee, Chairman of | June 2008 as | and currently serves as its President, | |
| the Board, Chief | an Officer | Chairman and Chief Executive Officer. | |
| Investment Officer, | | | |
| Portfolio Manager, | | | |
| and President | | | |
| Name, (Year of Birth), | | |
| and Position Held | Start Date | Principal Occupation(s) |
with the Trust | of Service | During Past Five Years |
| | | |
| Officers | | |
| | | |
| Teresa M. Nilsen | January 1996 | Ms. Nilsen has been employed by Hennessy Advisors, Inc. |
| (1966) | | since 1989 and currently serves as its Executive Vice President, |
| Executive Vice President | | Chief Operations Officer, Chief Financial Officer, and Secretary. |
| and Treasurer | | |
| | | |
| Daniel B. Steadman | March 2000 | Mr. Steadman has been employed by Hennessy Advisors, Inc. |
| (1956) | | since 2000 and currently serves as its Executive Vice President |
| Executive Vice President | | and Chief Compliance Officer. |
| and Secretary | | |
| | | |
| Brian Carlson | December 2013 | Mr. Carlson has been employed by Hennessy Advisors, Inc. |
| (1972) | | since December 2013. Mr. Carlson was previously a co-founder |
| Senior Vice President and | | and principal of Trivium Consultants, LLC from February 2011 |
| Head of Distribution | | through November 2013. |
| | | |
| Jennifer Cheskiewicz | June 2013 | Ms. Cheskiewicz has been employed by Hennessy Advisors, Inc. |
| (1977) | | as its General Counsel since June 2013. She previously served |
| Senior Vice President and | | as in-house counsel to Carlson Capital, L.P., an SEC-registered |
| Chief Compliance Officer | | investment advisor to several private funds, from |
| | | February 2010 to May 2013. |
| HENNESSY FUNDS | 1-800-966-4354 | |
| Name, (Year of Birth), | | |
| and Position Held | Start Date | Principal Occupation(s) |
with the Trust | of Service | During Past Five Years |
| | | |
| David Ellison | October 2012 | Mr. Ellison has been employed by Hennessy Advisors, Inc. since |
(1958)(3) | | October 2012. He has served as a Portfolio Manager of the |
| Senior Vice President | | Hennessy Small Cap Financial Fund and the Hennessy Large |
| and Portfolio Manager | | Cap Financial Fund since inception. Mr. Ellison also served as a |
| | | Portfolio Manager of the Hennessy Technology Fund from its |
| | | inception until February 2017. Mr. Ellison served as Director, |
| | | CIO and President of FBR Fund Advisers, Inc. from |
| | | December 1999 to October 2012. |
| | | |
| Ryan Kelley | March 2013 | Mr. Kelley has been employed by Hennessy Advisors, Inc. since |
(1972)(4) | | October 2012. He has served as a Portfolio Manager of the |
| Vice President and | | Hennessy Gas Utility Fund, the Hennessy Small Cap Financial |
| Portfolio Manager | | Fund, and the Hennessy Large Cap Financial Fund since |
| | | October 2014. He served as Co-Portfolio Manager of the same |
| | | funds from March 2013 through September 2014, and as a |
| | | Portfolio Analyst for the Hennessy Funds from October 2012 |
| | | through October 2014. Mr. Kelley has also served as a Portfolio |
| | | Manager of the Hennessy Cornerstone Growth Fund, the |
| | | Hennessy Cornerstone Mid Cap 30 Fund, the Hennessy |
| | | Cornerstone Large Growth Fund, and the Hennessy |
| | | Cornerstone Value Fund and as a Co-Portfolio Manager of the |
| | | Hennessy Technology Fund since February 2017. Mr. Kelley |
| | | served as Portfolio Manager of FBR Fund Advisers, Inc. from |
| | | January 2008 to October 2012. |
| | | |
| Brian Peery | March 2003 as | Mr. Peery has been employed by Hennessy Advisors, Inc. since |
| (1969) | an Officer and | 2002. He has served as a Portfolio Manager of the Hennessy |
| Senior Vice President | February 2011 | Cornerstone Growth Fund, the Hennessy Cornerstone Mid Cap |
| and Portfolio Manager | as a Co-Portfolio | 30 Fund, the Hennessy Cornerstone Large Growth Fund, the |
| | Manager or | Hennessy Cornerstone Value Fund, the Hennessy Total Return |
| | Portfolio Manager | Fund, and the Hennessy Balanced Fund since October 2014. |
| | | He served as Co-Portfolio Manager of the same funds from |
| | | February 2011 through September 2014. Mr. Peery has also |
| | | served as a Portfolio Manager of the Hennessy Gas Utility Fund |
| | | since February 2015 and as Lead Portfolio Manager of the |
| | | Hennessy Technology Fund since February 2017. |
| | | |
| Daniel P. Hennessy | December 2016 | Mr. Daniel Hennessy has been employed by Hennessy Advisors, |
| (1990) | | Inc. since 2015. He has served as an Associate Analyst of the |
| Assistant Vice President | | Hennessy Technology Fund since February 2017. He previously |
| and Associate Analyst | | served as a Mutual Fund Specialist at U.S. Bancorp Fund |
| | | Services, LLC from November 2014 to July 2015. Prior to that, |
| | | he attended the University of San Diego, where he earned a |
| | | degree in Political Science. |
_______________
(1) | Messrs. DeSousa, Doyle, Hennessy, and Richardson previously served on the Board of Directors of Hennessy Mutual Funds, Inc. (“HMFI”), The Hennessy Funds, Inc. (“HFI”), and Hennessy SPARX Funds Trust (“HSFT”). Pursuant to an internal reorganization effective as of February 28, 2014, the series of HFMI, HFI, and HSFT were reorganized into corresponding series of Hennessy Funds Trust that mirrored them. Subsequent to the reorganization, HFMI, HFI, and HSFT were dissolved. |
(2) | Mr. Hennessy is considered an “interested person,” as defined in the Investment Company Act of 1940, as amended, because he is an officer of the Hennessy Funds. |
(3) | The address of this officer is 101 Federal Street, Suite 1900, Boston, MA 02110. |
(4) | The address of this officer is 1340 Environ Way, Chapel Hill, NC 27517. |
| TRUSTEES AND OFFICERS OF THE FUND |
(This Page Intentionally Left Blank.)
| HENNESSY FUNDS | 1-800-966-4354 | |
Expense Example (Unaudited)
October 31, 2017
As a shareholder of the Fund, you incur two types of costs: (1) transaction costs, including sales charges (loads) on purchase payments, reinvested dividends, or other distributions, redemption fees, and exchange fees; and (2) ongoing costs, including management fees, service fees, and other Fund expenses. This Example is intended to help you understand your ongoing costs (in dollars) of investing in the Fund and to compare these costs with the ongoing costs of investing in other mutual funds. The Example is based on an investment of $1,000 invested at the beginning of the period and held for the entire period from May 1, 2017, through October 31, 2017.
Actual Expenses
The first line of the table below under the “Investor Class” and “Institutional Class” headings provides information about actual account values and actual expenses. Although the Fund charges no sales loads or transaction fees, you will be assessed fees for outgoing wire transfers, returned checks and stop payment orders at prevailing rates charged by U.S. Bancorp Fund Services, LLC, the Fund’s transfer agent. If you request that a redemption be made by wire transfer, currently a $15 fee is charged by the Fund’s transfer agent. IRA accounts will be charged a $15 annual maintenance fee. The example below includes, but is not limited to, management fees, shareholder servicing fees, fund accounting, custody, and transfer agent fees. However, the example below does not include portfolio trading commissions and related expenses, and other extraordinary expenses as determined under generally accepted accounting principles. You may use the information in this line, together with the amount you invested, to estimate the expenses that you paid over the period. Simply divide your account value by $1,000 (for example, an $8,600 account value divided by $1,000 = 8.6), then multiply the result by the number in the first line of the table under the “Investor Class” or “Institutional Class” headings in the column entitled “Expenses Paid During Period” to estimate the expenses you paid on your account during this period.
Hypothetical Example for Comparison Purposes
The second line of the table below under the “Investor Class” and “Institutional Class” headings provides information about hypothetical account values and hypothetical expenses based on the Fund’s actual expense ratios and an assumed rate of return of 5% per year before expenses, which is not the Fund’s actual return. The hypothetical account values and expenses may not be used to estimate the actual ending account balance or expenses you paid for the period. You may use this information to compare the ongoing costs of investing in the Fund and other funds. To do so, compare this 5% hypothetical example with the 5% hypothetical examples that appear in the shareholder reports of the other funds. Please note that the expenses shown in the table are meant to highlight your ongoing costs only and do not reflect any transactional costs, such as sales charges (loads), or exchange fees. Therefore, the second line of the table under the “Investor Class” and “Institutional Class” headings is useful in comparing ongoing costs only, and will not help you determine the relative total costs of owning different funds. In addition, if these transactional costs were included, your costs would have been higher.
| | | | Expenses Paid |
| | Beginning | Ending | During Period(1) |
| | Account Value | Account Value | May 1, 2017 – |
| | May 1, 2017 | October 31, 2017 | October 31, 2017 |
| Investor Class | | | |
| Actual | $1,000.00 | $1,057.30 | $7.99 |
| Hypothetical (5% return before expenses) | $1,000.00 | $1,017.44 | $7.83 |
| | | | |
| Institutional Class | | | |
| Actual | $1,000.00 | $1,059.40 | $5.97 |
| Hypothetical (5% return before expenses) | $1,000.00 | $1,019.41 | $5.85 |
(1) | Expenses are equal to the Fund’s annualized expense ratio of 1.54% for Investor Class shares or 1.15% for Institutional Class shares, as applicable, multiplied by the average account value over the period, multiplied by 184/365 days (to reflect one-half year period). |
| HENNESSY FUNDS | 1-800-966-4354 | |
How to Obtain a Copy of the Fund’s
Proxy Voting Policy and Proxy Voting Records
A description of the policies and procedures the Fund uses to determine how to vote proxies relating to portfolio securities is available without charge: (1) by calling 1-800-966-4354; (2) on the Hennessy Funds’ website at hennessyfunds.com/proxy-voting/policy.fs; or (3) on the U.S. Securities and Exchange Commission’s (the “SEC”) website at www.sec.gov. The Fund’s proxy voting record is available without charge on both the Hennessy Funds’ website at hennessyfunds.com/proxy-voting/vote.fs and the SEC’s website at www.sec.gov no later than August 31 for the prior 12 months ending June 30.
Quarterly Filings on Form N-Q
The Fund files a complete schedule of portfolio holdings with the SEC for the first and third quarters of each fiscal year on Form N-Q. The Fund’s Forms N-Q are made available on the SEC’s website at www.sec.gov. The Fund’s Forms N-Q may be reviewed and copied at the SEC’s Public Reference Room in Washington, DC, and information on the operation of the Public Reference Room may be obtained by calling 1-800-SEC-0330. Information included in the Fund’s Forms N-Q will also be available upon request by calling 1-800-966-4354.
Federal Tax Distribution Information
(Unaudited)
For fiscal year 2017, certain dividends paid by the Fund may be subject to a maximum tax rate of 23.8%, as provided for by the Jobs and Growth Tax Relief Reconciliation Act of 2003. The percentage of dividends declared from ordinary income designated as qualified dividend income was 100.00%.
For corporate shareholders, the percent of ordinary income distributions that qualified for the corporate dividends received deduction for fiscal year 2017 was 100.00%.
The percentage of taxable ordinary income distributions that are designated as short-term capital gain distributions under Section 871(k)(2)(C) of the Internal Revenue Code of 1986, as amended, for the Fund was 0.00%.
Householding
To help keep the Fund’s costs as low as possible, we generally deliver a single copy of most financial reports and prospectuses to shareholders who share an address, even if the accounts are registered under different names. This process, known as “householding,” does not apply to account statements. You may request an individual copy of a prospectus or financial report at any time. If you would like to receive separate mailings, please call U.S. Bancorp Fund Services, LLC at 1-800-261-6950 or 1-414-765-4124 and we will begin individual delivery within 30 days of your request. If your account is held through a financial institution or other intermediary, please contact them directly to request individual delivery.
| PROXY VOTING — PRIVACY POLICY |
Privacy Policy
We collect the following non-public personal information about you:
| | • | information we receive from you on or in applications or other forms, correspondence, or conversations, including, but not limited to, your name, address, phone number, social security number, assets, income, and date of birth; and |
| | • | information about your transactions with us, our affiliates, or others, including, but not limited to, your account number and balance, payment history, parties to transactions, cost basis information, and other financial information. |
We do not disclose any non-public personal information about our current or former shareholders to non-affiliated third parties, except as permitted by law. For example, we are permitted by law to disclose all of the information we collect, as described above, to our Transfer Agent to process your transactions. Furthermore, we restrict access to your non-public personal information to those persons who require such information to provide products or services to you. We maintain physical, electronic, and procedural safeguards that comply with federal standards to guard your non-public personal information.
In the event that you hold shares of the Fund through a financial intermediary, including, but not limited to, a broker-dealer, bank, or trust company, the privacy policy of your financial intermediary would govern how your non-public personal information will be shared with non-affiliated third parties.
| HENNESSY FUNDS | 1-800-966-4354 | |
For information, questions or assistance, please call
The Hennessy Funds
1-800-966-4354 or 1-415-899-1555
INVESTMENT ADVISOR
Hennessy Advisors, Inc.
7250 Redwood Boulevard, Suite 200
Novato, California 94945
ADMINISTRATOR,
TRANSFER AGENT,
DIVIDEND PAYING AGENT &
SHAREHOLDER SERVICING AGENT
U.S. Bancorp Fund Services, LLC
P.O. Box 701
Milwaukee, Wisconsin 53201-0701
CUSTODIAN
U.S. Bank N.A.
Custody Operations
1555 North River Center Drive, Suite 302
Milwaukee, Wisconsin 53212
TRUSTEES
Neil J. Hennessy
Robert T. Doyle
J. Dennis DeSousa
Gerald P. Richardson
COUNSEL
Foley & Lardner LLP
777 East Wisconsin Avenue
Milwaukee, Wisconsin 53202-5306
INDEPENDENT REGISTERED
PUBLIC ACCOUNTING FIRM
Tait, Weller & Baker LLP
1818 Market Street, Suite 2400
Philadelphia, Pennsylvania 19103
DISTRIBUTOR
Quasar Distributors, LLC
777 East Wisconsin Avenue
Milwaukee, Wisconsin 53202
hennessyfunds.com | 1-800-966-4354
This report has been prepared for shareholders and may be distributed to
others only if preceded or accompanied by a current prospectus.
ANNUAL REPORT
OCTOBER 31, 2017
HENNESSY LARGE CAP
FINANCIAL FUND
Investor Class HLFNX
Institutional Class HILFX
hennessyfunds.com | 1-800-966-4354
(This Page Intentionally Left Blank.)
Contents
| Letter to Shareholders | 2 |
| Performance Overview | 4 |
| Financial Statements | |
| Schedule of Investments | 7 |
| Statement of Assets and Liabilities | 10 |
| Statement of Operations | 11 |
| Statements of Changes in Net Assets | 13 |
| Financial Highlights | 14 |
| Notes to the Financial Statements | 17 |
| Report of Independent Registered Public Accounting Firm | 24 |
| Trustees and Officers of the Fund | 25 |
| Expense Example | 28 |
| Proxy Voting Policy and Proxy Voting Records | 30 |
| Quarterly Schedule of Investments | 30 |
| Federal Tax Distribution Information | 30 |
| Householding | 30 |
| Privacy Policy | 31 |
| HENNESSY FUNDS | 1-800-966-4354 | |
December 2017
Dear Hennessy Funds Shareholder:
Over the past year, global equity markets have made strong advances, fueled by continued, broad-based economic growth in most countries and regions, and in spite of a somewhat unsettling geopolitical backdrop.
U.S. stocks performed well in the first year of the new administration in Washington, and, ignoring the debate and the bluster, investors have continued to focus on what concerns them the most – tax reform, deregulation, and the hope of an increase in infrastructure spending. As we move into the final weeks of the calendar year, with the major indices reaching new highs, I find myself envisioning the Dow Jones Industrial Average building momentum toward 30,000.
Over the past 12 months, the U.S. economy has continued to grow at a steady rate of almost 2.5% on an annualized basis, as measured by GDP. Companies have added over 170,000 jobs per month on average over the past year, and the current unemployment rate of 4.1% is the lowest in 17 years. Consumer confidence is high and still rising, and corporate profits are at all-time highs. The Federal Reserve has been increasing interest rates, but at a gradual pace. The bond market has also continued to support the equity market and equity market valuations. Since December of last year, long bond yields have stayed within a narrow band, with the 10-year U.S. Treasury yield hovering in the 2.0% to 2.5% range, and remain low compared to historical averages. In my opinion, long bond yields have stayed low despite three increases in the Federal Funds rate over the last 12 months in part due to persistent low inflation.
Meanwhile, the prospective price-to-earnings multiples for the Dow Jones Industrial Average and S&P 500 Index are just above long-term averages at 19.5x and 19.9x, respectively. I believe these levels of stock valuation, while higher than a year ago, are still very reasonable. At the peak of the technology/dot-com bubble, U.S. equities sold at much higher multiples across the board than they do today, and bond yields were also much higher. In June of 1999, the Dow Jones Industrial Average sold at 28x earnings and the 10-year bond yield was close to 6%. Today, the Dow is selling at under 20x earnings and is offering a 2.2% dividend yield, on par with the yield of the 10-year government bond at 2.4%.
Equity markets in the U.S. have been rising for almost nine years, and financial media reports have speculated that this bull run will come to end, but why? I see no substantial reasons or indicators that a major correction is on the horizon. I remain confident that this bull market has room to run. Overall, investment fundamentals are strong. Corporate earnings are growing at a healthy rate, and companies are generating excess cash flow. Cash continues to build on corporate balance sheets, with $5.2 trillion in cash and short term investments among the S&P 500 Index companies as of October 31, 2017. If our government leaders can pass a meaningful tax reform bill and continue efforts toward regulatory relief, it could be icing on the cake for equities.
There have been, and will likely continue to be, downturns throughout this extended bull market. Since 2010, there have been 18 downturns in the market, 14 of which were between 5% and 10% and four of which were corrections of between 10% and 20%. Yet the market has bounced back following each pullback and then has moved higher. A correction is not the end of the bull market. What might signal that we are at the end of this bull market? Euphoria. And I still see no signs of euphoria in this market. In the past,
I have likened the current bull market to that of 1982-2000, and I am confident in the strength of the market today and believe the economy will continue its slow, but steady, growth into the coming year.
Thank you for your continued confidence and investment in our funds. If you have any questions or would like to speak with us directly, please don’t hesitate to call us at (800) 966-4354.
Best regards,
Neil J. Hennessy
President and Chief Investment Officer
Past performance does not guarantee future results.
Mutual fund investing involves risk. Principal loss is possible.
Opinions expressed are those of Neil Hennessy and are subject to change, are not guaranteed, and should not be considered investment advice.
The Dow Jones Industrial Average and S&P 500 Index are unmanaged indices commonly used to measure the performance of U.S. stocks. One cannot invest directly in an index.
Price to earnings is calculated by dividing a company’s market price per share by its earnings per share. Dividend yield is calculated as the annual dividends paid by a company divided by the price of a share of its stock. Cash flow provides an indication of a company’s financial strength and represents earnings before depreciation, amortization, and non-cash charges.
| HENNESSY FUNDS | 1-800-966-4354 | |
Performance Overview (Unaudited)
CHANGE IN VALUE OF $10,000 INVESTMENT
This graph illustrates the performance of an initial investment of $10,000 made in the Fund ten years ago and assumes the reinvestment of dividends.
AVERAGE ANNUAL TOTAL RETURN FOR PERIODS ENDED OCTOBER 31, 2017
| | One | Five | Ten |
| | Year | Years | Years |
| Hennessy Large Cap Financial Fund – | | | |
| Investor Class (HLFNX) | 36.41% | 14.49% | 6.79% |
| Hennessy Large Cap Financial Fund – | | | |
Institutional Class (HILFX)(1) | 36.92% | 14.71% | 6.89% |
Russell 1000® Financial Services Index | 30.42% | 16.94% | 3.08% |
Russell 1000® Index | 23.67% | 15.18% | 7.61% |
Expense ratios: 1.68% (Investor Class); 1.23% (Institutional Class)
(1) | The inception date of Institutional Class shares is June 15, 2015. Performance shown prior to the inception of Institutional Class shares reflects the performance of Investor Class shares and includes expenses that are not applicable to, and are higher than, those of Institutional Class shares. |
Performance data quoted represents past performance; past performance does not guarantee future results. The investment return and principal value of an investment will fluctuate so that an investor’s shares, when redeemed, may be worth more or less than their original cost. The performance table does not reflect the deduction of taxes that a shareholder would pay on Fund distributions or the redemption of Fund shares. Current performance of the Fund may be lower or higher than the performance quoted. Performance data current to the most recent month end may be obtained by visiting hennessyfunds.com. Performance for periods prior to October 26, 2012, is that of the FBR Large Cap Financial Fund.
The Russell 1000® Financial Services Index is an unmanaged index commonly used to measure the performance of large-capitalization financial sector stocks. The Russell 1000® Index is an unmanaged index commonly used to measure the performance of U.S. stocks. One cannot invest directly in an index.
Frank Russell Company (“Russell”) is the source and owner of the trademarks, service marks, and copyrights related to the Russell Indexes. Russell® is a trademark of Frank Russell Company. Neither Russell nor its licensors accept any liability for any errors or omissions in the Russell Indexes or Russell ratings or underlying data and no party may rely on any Russell Indexes or Russell ratings or underlying data contained in this
communication. No further distribution of Russell data is permitted without Russell’s express written consent. Russell does not promote, sponsor, or endorse the content of this communication.
The expense ratios presented are from the most recent prospectus. The expense ratios for the current reporting period are available in the Financial Highlights section of this report.
PERFORMANCE NARRATIVE
Portfolio Managers David H. Ellison and Ryan C. Kelley
Performance:
For the 12-month period ended October 31, 2017, the Investor Class of the Hennessy Large Cap Financial Fund returned 36.41%, outperforming the Russell 1000® Financial Services Index and the Russell 1000® Index, which returned 30.42% and 23.67% for the same period, respectively.
In a year of strong performance in the broader domestic equity market, both the Fund and its primary benchmark index posted strong returns. The Fund’s outperformance versus its primary benchmark, the Russell 1000® Financial Services Index, was principally due to the Fund’s overweight positions in U.S. and multinational banks and electronic payment processors. Large-cap financial stocks have performed well since the Presidential election in November 2016, as expectations of tax reform, regulatory relief, steady economic growth and rising interest rates have focused positive investor attention on this group.
Positive contributors to the Fund’s performance during the year included PayPal Holdings, Inc., Bank of America Corporation, and PNC Financial Services Group, Inc. Companies which most negatively affected the Fund’s performance during the period included Assured Guaranty Ltd., Ventas, Inc. and Zions Bancorporation. The Fund continues to hold the companies mentioned, with the exception of Ventas, Inc.
Portfolio Strategy:
Traditionally, the Fund tilts its investments more heavily toward regional banks and diversified global banks, and to a lesser degree toward non-bank companies such as insurance companies, real estate companies, and asset managers. However, we have increased our exposure to electronic payment companies over the last year. We believe that growth in the electronic payment industry will continue as the use of mobile payment methods spreads. In general, we seek financial companies that we believe have high-quality management teams, less complex business models, and the prospect of sustainable earnings growth over time. We also try to identify companies that we expect will do well in the current environment, which is characterized by low, but rising, interest rates, competitive loan markets, and growing competition from electronic payment platforms. We are less interested in focusing solely on companies that appear to promise an increase in profitability when interest rates rise, loan demand increases, or pricing becomes more favorable, as the timing of these macro industry dynamics is difficult to predict.
Investment Commentary:
We believe that the financial industry as a whole has recovered well from the Financial Crisis of 2007 and 2008 and continues to prosper. Larger financial companies in the U.S. are highly profitable, and we believe large banks are well positioned to see net interest margins rise as the Federal Reserve gradually increases short-term interest rates. Management teams generally continue to focus on improving the efficiency of their operations and paring their cost bases, and earnings growth has been robust across the
| HENNESSY FUNDS | 1-800-966-4354 | |
financial industry this year. We continue to see improvement in many bank industry metrics, including liquidity, capital, credit, loan loss reserves, book value growth, and cost ratios. We expect short-term interest rates to continue to rise and anticipate that their upward movement will continue to improve bank lending and investing spreads, enhancing profitability still further.
We continue to have a positive outlook for the Fund. We believe the condition of the financial system in the U.S. today is stronger than it has been in quite some time and that the outlook for stocks in the Financials sector appears bright.
_______________
Opinions expressed are those of the Portfolio Managers as of the date written and are subject to change, are not guaranteed, and should not be considered investment advice or an indication of trading intent.
The Russell 1000® Financial Services Index is an unmanaged index commonly used to measure the performance of large-capitalization Financial sector stocks. The Russell 1000® Index is an unmanaged index commonly used to measure the performance of U.S. stocks. One cannot invest directly in an index.
The Fund is non-diversified, meaning it may concentrate its assets in fewer individual holdings than a diversified fund, making it more exposed to individual stock volatility than a diversified fund. Investments are focused in the Financial Services industry; sector funds may be subject to a higher degree of market risk. The Fund invests in medium-sized companies, which may have limited liquidity and greater volatility compared to larger companies. Please see the Fund’s prospectus for a more complete discussion of these and other risks.
References to specific securities should not be considered a recommendation to buy or sell any security. Fund holdings and sector allocations are subject to change. Please refer to the Schedule of Investments included in this report for additional portfolio information.
Book value is the net asset value of a company, calculated by total assets minus liabilities. Spread is the difference between the average yield a financial institution receives from loans and other interest-accruing activities and the average rate it pays on deposits and borrowings. The net interest rate spread is a key determinant of a financial institution’s profitability. Earnings growth is not a measure of the Fund’s future performance.
| PERFORMANCE OVERVIEW/SCHEDULE OF INVESTMENTS |
Financial Statements
Schedule of Investments as of October 31, 2017 |
HENNESSY LARGE CAP FINANCIAL FUND
(% of Net Assets)
| TOP TEN HOLDINGS (EXCLUDING CASH/CASH EQUIVALENTS) | % NET ASSETS |
| MasterCard, Inc., Class A | 5.55% |
| PayPal Holdings, Inc. | 5.53% |
| Bank of America Corp. | 5.37% |
| Visa, Inc., Class A | 5.30% |
| Berkshire Hathaway, Inc., Class B | 5.23% |
| Citigroup, Inc. | 5.14% |
| JPMorgan Chase & Co. | 5.01% |
| Moody’s Corp. | 4.87% |
| Morgan Stanley | 4.82% |
| Global Payments, Inc. | 4.68% |
Note: For presentation purposes, the Fund has grouped some of the industry categories. For purposes of categorizing securities for compliance with section 8(b)(1) of the Investment Company Act of 1940, as amended, the Fund uses more specific industry classifications.
| HENNESSY FUNDS | 1-800-966-4354 | |
| COMMON STOCKS – 98.92% | | Number | | | | | | % of | |
| | | of Shares | | | Value | | | Net Assets | |
| Financials – 74.44% | | | | | | | | | |
| American Express Co. | | | 15,000 | | | $ | 1,432,800 | | | | 4.45 | % |
| Assured Guaranty Ltd. (b) | | | 15,000 | | | | 556,500 | | | | 1.73 | % |
| Bank of America Corp. | | | 63,000 | | | | 1,725,570 | | | | 5.37 | % |
| Berkshire Hathaway, Inc., Class B (a) | | | 9,000 | | | | 1,682,460 | | | | 5.23 | % |
| Capital One Financial Corp. | | | 7,000 | | | | 645,260 | | | | 2.01 | % |
| Citigroup, Inc. | | | 22,500 | | | | 1,653,750 | | | | 5.14 | % |
| Citizens Financial Group, Inc. | | | 20,000 | | | | 760,200 | | | | 2.36 | % |
| Comerica, Inc. | | | 5,000 | | | | 392,850 | | | | 1.22 | % |
| East West Bancorp, Inc. | | | 12,000 | | | | 718,080 | | | | 2.23 | % |
| Fifth Third Bancorp | | | 35,000 | | | | 1,011,500 | | | | 3.15 | % |
| First Republic Bank | | | 8,000 | | | | 779,200 | | | | 2.42 | % |
| JPMorgan Chase & Co. | | | 16,000 | | | | 1,609,760 | | | | 5.01 | % |
| Moody’s Corp. | | | 11,000 | | | | 1,566,510 | | | | 4.87 | % |
| Morgan Stanley | | | 31,000 | | | | 1,550,000 | | | | 4.82 | % |
| Signature Bank (a) | | | 7,000 | | | | 910,070 | | | | 2.83 | % |
| SunTrust Banks, Inc. | | | 16,000 | | | | 963,360 | | | | 3.00 | % |
| The Charles Schwab Corp. | | | 31,000 | | | | 1,390,040 | | | | 4.32 | % |
| The Goldman Sachs Group, Inc. | | | 6,000 | | | | 1,454,880 | | | | 4.52 | % |
| The PNC Financial Services Group, Inc. | | | 9,500 | | | | 1,299,505 | | | | 4.04 | % |
| U.S. Bancorp (d) | | | 17,000 | | | | 924,460 | | | | 2.87 | % |
| Wells Fargo & Co. | | | 13,000 | | | | 729,820 | | | | 2.27 | % |
| Zions Bancorporation | | | 4,000 | | | | 185,840 | | | | 0.58 | % |
| | | | | | | | 23,942,415 | | | | 74.44 | % |
| | | | | | | | | | | | | |
| Information Technology – 24.48% | | | | | | | | | | | | |
| Global Payments, Inc. | | | 14,500 | | | | 1,507,275 | | | | 4.68 | % |
| MasterCard, Inc., Class A | | | 12,000 | | | | 1,785,240 | | | | 5.55 | % |
| PayPal Holdings, Inc. (a) | | | 24,500 | | | | 1,777,720 | | | | 5.53 | % |
| Square, Inc., Class A (a) | | | 16,000 | | | | 595,040 | | | | 1.85 | % |
| Total System Services, Inc. | | | 7,000 | | | | 504,350 | | | | 1.57 | % |
| Visa, Inc., Class A | | | 15,500 | | | | 1,704,690 | | | | 5.30 | % |
| | | | | | | | 7,874,315 | | | | 24.48 | % |
| Total Common Stocks | | | | | | | | | | | | |
| (Cost $24,557,763) | | | | | | | 31,816,730 | | | | 98.92 | % |
The accompanying notes are an integral part of these financial statements.
| SHORT-TERM INVESTMENTS – 1.07% | | Number | | | | | | % of | |
| | | of Shares | | | Value | | | Net Assets | |
| Money Market Funds – 1.07% | | | | | | | | | |
| Fidelity Government Portfolio, Institutional Class, 0.92% (c) | | | 344,073 | | | $ | 344,073 | | | | 1.07 | % |
| | | | | | | | | | | | | |
| Total Short-Term Investments | | | | | | | | | | | | |
| (Cost $344,073) | | | | | | | 344,073 | | | | 1.07 | % |
| | | | | | | | | | | | | |
| Total Investments | | | | | | | | | | | | |
| (Cost $24,901,836) – 99.99% | | | | | | | 32,160,803 | | | | 99.99 | % |
| Other Assets in Excess of Liabilities – 0.01% | | | | | | | 2,554 | | | | 0.01 | % |
TOTAL NET ASSETS – 100.00% | | | | | | $ | 32,163,357 | | | | 100.00 | % |
Percentages are stated as a percent of net assets.
| (a) | Non-income producing security. |
| (b) | U.S. traded security of a foreign corporation. |
| (c) | The rate listed is the fund’s 7-day yield as of October 31, 2017. |
| (d) | Investment in affiliated security. Quasar Distributors, LLC, which serves as the Fund’s distributor, is a subsidiary of U.S. Bancorp. Details of transactions with this affiliated company for the year ended October 31, 2017, are as follows: |
| | Issuer | | U.S. Bancorp | |
| | Beginning Cost | | $ | 751,400 | |
| | Purchase Cost | | $ | 632,641 | |
| | Sales Cost | | $ | (545,921 | ) |
| | Ending Cost | | $ | 838,120 | |
| | Dividend Income | | $ | 18,840 | |
| | Net Change in | | | | |
| | Unrealized Appreciation | | $ | 32,060 | |
| | Realized Gain | | $ | 132,555 | |
| | Shares | | | 17,000 | |
| | Market Value | | $ | 924,460 | |
Summary of Fair Value Exposure at October 31, 2017
The following is a summary of the inputs used to value the Fund’s net assets as of October 31, 2017 (see Note 3 in the accompanying notes to the financial statements):
| Common Stocks | | Level 1 | | | Level 2 | | | Level 3 | | | Total | |
| Financials | | $ | 23,942,415 | | | $ | — | | | $ | — | | | $ | 23,942,415 | |
| Information Technology | | | 7,874,315 | | | | — | | | | — | | | | 7,874,315 | |
| Total Common Stocks | | $ | 31,816,730 | | | $ | — | | | $ | — | | | $ | 31,816,730 | |
| Short-Term Investments | | | | | | | | | | | | | | | | |
| Money Market Funds | | $ | 344,073 | | | $ | — | | | $ | — | | | $ | 344,073 | |
| Total Short-Term Investments | | $ | 344,073 | | | $ | — | | | $ | — | | | $ | 344,073 | |
| Total Investments | | $ | 32,160,803 | | | $ | — | | | $ | — | | | $ | 32,160,803 | |
Transfers between levels are recognized at the end of the reporting period. During the year ended October 31, 2017, the Fund recognized no transfers between levels.
The accompanying notes are an integral part of these financial statements.
| HENNESSY FUNDS | 1-800-966-4354 | |
Financial Statements
Statement of Assets and Liabilities as of October 31, 2017 |
| ASSETS: | | | |
| Investments in unaffiliated securities, at value (cost $24,063,716) | | $ | 31,236,343 | |
| Investments in affiliated securities, at value (cost $838,120) | | | 924,460 | |
| Total Investments in securities, at value (cost $24,901,836) | | | 32,160,803 | |
| Dividends and interest receivable | | | 30,765 | |
| Receivable for fund shares sold | | | 37,802 | |
| Prepaid expenses and other assets | | | 16,063 | |
| Total Assets | | | 32,245,433 | |
| | | | | |
| LIABILITIES: | | | | |
| Payable for fund shares redeemed | | | 1,897 | |
| Payable to advisor | | | 24,179 | |
| Payable to administrator | | | 4,877 | |
| Payable to auditor | | | 20,699 | |
| Accrued distribution fees | | | 4,305 | |
| Accrued service fees | | | 2,219 | |
| Accrued interest payable | | | 91 | |
| Accrued trustees fees | | | 5,579 | |
| Accrued expenses and other payables | | | 18,230 | |
| Total Liabilities | | | 82,076 | |
| NET ASSETS | | $ | 32,163,357 | |
| | | | | |
| NET ASSETS CONSIST OF: | | | | |
| Capital stock | | $ | 23,982,221 | |
| Accumulated net investment loss | | | (114,001 | ) |
| Accumulated net realized gain on investments | | | 1,036,170 | |
| Unrealized net appreciation on investments | | | 7,258,967 | |
| Total Net Assets | | $ | 32,163,357 | |
| | | | | |
| NET ASSETS | | | | |
| Investor Class: | | | | |
| Shares authorized (no par value) | | Unlimited | |
| Net assets applicable to outstanding Investor Class shares | | $ | 26,331,446 | |
| Shares issued and outstanding | | | 1,196,060 | |
| Net asset value, offering price and redemption price per share | | $ | 22.02 | |
| | | | | |
| Institutional Class: | | | | |
| Shares authorized (no par value) | | Unlimited | |
| Net assets applicable to outstanding Institutional Class shares | | $ | 5,831,911 | |
| Shares issued and outstanding | | | 266,201 | |
| Net asset value, offering price and redemption price per share | | $ | 21.91 | |
The accompanying notes are an integral part of these financial statements.
| STATEMENT OF ASSETS AND LIABILITIES/STATEMENT OF OPERATIONS |
Financial Statements
Statement of Operations for the year ended October 31, 2017 |
| INVESTMENT INCOME: | | | |
| Dividend income from unaffiliated securities | | $ | 393,815 | |
| Dividend income from affiliated securities | | | 18,840 | |
| Interest income | | | 8,102 | |
| Total investment income | | | 420,757 | |
| | | | | |
| EXPENSES: | | | | |
| Investment advisory fees (See Note 5) | | | 271,191 | |
| Sub-transfer agent expenses – Investor Class (See Note 5) | | | 47,315 | |
| Sub-transfer agent expenses – Institutional Class (See Note 5) | | | 3,340 | |
| Distribution fees – Investor Class (See Note 5) | | | 40,551 | |
| Federal and state registration fees | | | 36,702 | |
| Administration, fund accounting, custody and transfer agent fees (See Note 5) | | | 28,777 | |
| Compliance expense (See Note 5) | | | 28,705 | |
| Service fees – Investor Class (See Note 5) | | | 27,034 | |
| Audit fees | | | 20,699 | |
| Trustees’ fees and expenses | | | 16,136 | |
| Reports to shareholders | | | 7,303 | |
| Interest expense (See Note 7) | | | 2,150 | |
| Legal fees | | | 622 | |
| Other expenses | | | 6,569 | |
| Total expenses | | | 537,094 | |
| NET INVESTMENT LOSS | | $ | (116,337 | ) |
| | | | | |
| REALIZED AND UNREALIZED GAINS: | | | | |
| Net realized gain on: | | | | |
| Unaffiliated investments | | $ | 4,326,670 | |
| Affiliated investments | | | 132,555 | |
| Net change in unrealized appreciation on: | | | | |
| Unaffiliated investments | | | 4,693,017 | |
| Affiliated investments | | | 32,060 | |
| Net gain on investments | | | 9,184,302 | |
| NET INCREASE IN NET ASSETS RESULTING FROM OPERATIONS | | $ | 9,067,965 | |
The accompanying notes are an integral part of these financial statements.
| HENNESSY FUNDS | 1-800-966-4354 | |
(This Page Intentionally Left Blank.)
| STATEMENTS OF CHANGES IN NET ASSETS |
Financial Statements
| Statements of Changes in Net Assets |
| | | Year Ended | | | Year Ended | |
| | | October 31, 2017 | | | October 31, 2016 | |
| OPERATIONS: | | | | | | |
| Net investment income (loss) | | $ | (116,337 | ) | | $ | 124,972 | |
| Net realized gain (loss) on investments | | | 4,459,225 | | | | (3,033,040 | ) |
| Net change in unrealized appreciation on investments | | | 4,725,077 | | | | (2,828,079 | ) |
| Net increase (decrease) in net | | | | | | | | |
| assets resulting from operations | | | 9,067,965 | | | | (5,736,147 | ) |
| | | | | | | | | |
| DISTRIBUTIONS TO SHAREHOLDERS FROM: | | | | | | | | |
| Net investment income | | | | | | | | |
| Investor Class | | | (158,906 | ) | | | (132,180 | ) |
| Institutional Class | | | (29,650 | ) | | | (3,703 | ) |
| Net realized gains | | | | | | | | |
| Investor Class | | | — | | | | (9,653,373 | ) |
| Institutional Class | | | — | | | | (61,676 | ) |
| Total distributions | | | (188,556 | ) | | | (9,850,932 | ) |
| | | | | | | | | |
| CAPITAL SHARE TRANSACTIONS: | | | | | | | | |
| Proceeds from shares subscribed – Investor Class | | | 5,666,734 | | | | 87,222,461 | |
| Proceeds from shares subscribed – Institutional Class | | | 5,259,686 | | | | 415,907 | |
| Dividends reinvested – Investor Class | | | 154,596 | | | | 9,523,602 | |
| Dividends reinvested – Institutional Class | | | 29,650 | | | | 65,379 | |
| Cost of shares redeemed – Investor Class | | | (14,389,624 | ) | | | (155,323,687 | ) |
| Cost of shares redeemed – Institutional Class | | | (458,597 | ) | | | (319,893 | ) |
| Net decrease in net assets derived | | | | | | | | |
| from capital share transactions | | | (3,737,555 | ) | | | (58,416,231 | ) |
| TOTAL INCREASE (DECREASE) IN NET ASSETS | | | 5,141,854 | | | | (74,003,310 | ) |
| | | | | | | | | |
| NET ASSETS: | | | | | | | | |
| Beginning of year | | | 27,021,503 | | | | 101,024,813 | |
| End of year | | $ | 32,163,357 | | | $ | 27,021,503 | |
| Undistributed net investment | | | | | | | | |
| income (loss), end of year | | $ | (114,001 | ) | | $ | 188,556 | |
| | | | | | | | | |
| CHANGES IN SHARES OUTSTANDING: | | | | | | | | |
| Shares sold – Investor Class | | | 289,553 | | | | 5,612,390 | |
| Shares sold – Institutional Class | | | 265,747 | | | | 22,100 | |
| Shares issued to holders as reinvestment | | | | | | | | |
| of dividends – Investor Class | | | 8,027 | | | | 567,448 | |
| Shares issued to holders as reinvestment | | | | | | | | |
| of dividends – Institutional Class | | | 1,551 | | | | 3,885 | |
| Shares redeemed – Investor Class | | | (745,488 | ) | | | (10,022,406 | ) |
| Shares redeemed – Institutional Class | | | (22,449 | ) | | | (20,446 | ) |
| Net decrease in shares outstanding | | | (203,059 | ) | | | (3,837,029 | ) |
The accompanying notes are an integral part of these financial statements.
| HENNESSY FUNDS | 1-800-966-4354 | |
Financial Statements
For an Investor Class share outstanding throughout each year
PER SHARE DATA:
Net asset value, beginning of year
Income from investment operations:
Net investment income (loss)
Net realized and unrealized gains (losses) on investments
Total from investment operations
Less distributions:
Dividends from net investment income
Dividends from net realized gains
Total distributions
Net asset value, end of year
TOTAL RETURN
SUPPLEMENTAL DATA AND RATIOS:
Net assets, end of year (millions)
Ratio of expenses to average net assets
Ratio of net investment income (loss) to average net assets
Portfolio turnover rate(2)
(1) | Amount is less than $0.01. |
(2) | Portfolio turnover is calculated on the basis of the Fund as a whole. |
The accompanying notes are an integral part of these financial statements.
| FINANCIAL HIGHLIGHTS — INVESTOR CLASS |
| Year Ended October 31, | | |
| 2017 | | | 2016 | | | 2015 | | | 2014 | | | 2013 | | |
| | | | | | | | | | | | | | | |
| $ | 16.23 | | | $ | 18.36 | | | $ | 20.87 | | | $ | 19.01 | | | $ | 14.16 | | |
| | | | | | | | | | | | | | | | | | | | |
| | | | | | | | | | | | | | | | | | | | |
| | (0.08 | ) | | | 0.07 | | | | 0.01 | | | | 0.00 | (1) | | | (0.03 | ) | |
| | 5.97 | | | | (0.49 | ) | | | (0.40 | ) | | | 2.44 | | | | 4.89 | | |
| | 5.89 | | | | (0.42 | ) | | | (0.39 | ) | | | 2.44 | | | | 4.86 | | |
| | | | | | | | | | | | | | | | | | | | |
| | | | | | | | | | | | | | | | | | | | |
| | (0.10 | ) | | | (0.02 | ) | | | — | | | | — | | | | (0.01 | ) | |
| | — | | | | (1.69 | ) | | | (2.12 | ) | | | (0.58 | ) | | | — | | |
| | (0.10 | ) | | | (1.71 | ) | | | (2.12 | ) | | | (0.58 | ) | | | (0.01 | ) | |
| $ | 22.02 | | | $ | 16.23 | | | $ | 18.36 | | | $ | 20.87 | | | $ | 19.01 | | |
| | | | | | | | | | | | | | | | | | | | |
| | 36.41 | % | | | (2.57 | )% | | | (2.57 | )% | | | 13.04 | % | | | 34.37 | % | |
| | | | | | | | | | | | | | | | | | | | |
| | | | | | | | | | | | | | | | | | | | |
| $ | 26.33 | | | $ | 26.67 | | | $ | 100.73 | | | $ | 98.07 | | | $ | 88.30 | | |
| | 1.81 | % | | | 1.66 | % | | | 1.57 | % | | | 1.49 | % | | | 1.57 | % | |
| | (0.41 | )% | | | 0.16 | % | | | 0.03 | % | | | (0.01 | )% | | | (0.22 | )% | |
| | 76 | % | | | 141 | % | | | 74 | % | | | 58 | % | | | 75 | % | |
The accompanying notes are an integral part of these financial statements.
| HENNESSY FUNDS | 1-800-966-4354 | |
Financial Statements
For an Institutional Class share outstanding throughout each period
| | | | | | | | | Period Ended | |
| | | Year Ended October 31, | | | October 31, | |
| | | 2017 | | | 2016 | | | 2015(1) | |
| PER SHARE DATA: | | | | | | | | | |
| Net asset value, beginning of period | | $ | 16.26 | | | $ | 18.39 | | | $ | 19.72 | |
| | | | | | | | | | | | | |
| Income from investment operations: | | | | | | | | | | | | |
| Net investment income (loss) | | | 0.18 | | | | 0.02 | | | | 0.01 | |
| Net realized and unrealized | | | | | | | | | | | | |
| gains (losses) on investments | | | 5.78 | | | | (0.36 | ) | | | (1.34 | ) |
| Total from investment operations | | | 5.96 | | | | (0.34 | ) | | | (1.33 | ) |
| | | | | | | | | | | | | |
| Less distributions: | | | | | | | | | | | | |
| Dividends from net investment income | | | (0.31 | ) | | | (0.09 | ) | | | — | |
| Dividends from net realized gains | | | — | | | | (1.70 | ) | | | — | |
| Total distributions | | | (0.31 | ) | | | (1.79 | ) | | | — | |
| Net asset value, end of period | | $ | 21.91 | | | $ | 16.26 | | | $ | 18.39 | |
| | | | | | | | | | | | | |
| TOTAL RETURN | | | 36.92 | % | | | (2.14 | )% | | | (6.74 | )%(2) |
| | | | | | | | | | | | | |
| SUPPLEMENTAL DATA AND RATIOS: | | | | | | | | | | | | |
| Net assets, end of period (millions) | | $ | 5.83 | | | $ | 0.35 | | | $ | 0.29 | |
| Ratio of expenses to average net assets | | | 1.50 | % | | | 1.24 | % | | | 1.19 | %(3) |
| Ratio of net investment income (loss) | | | | | | | | | | | | |
| to average net assets | | | (0.17 | )% | | | 0.52 | % | | | 0.25 | %(3) |
Portfolio turnover rate(4) | | | 76 | % | | | 141 | % | | | 74 | %(2) |
(1) | Institutional Class shares commenced operations on June 15, 2015. |
(2) | Not annualized. |
(3) | Annualized. |
(4) | Portfolio turnover is calculated on the basis of the Fund as a whole. |
The accompanying notes are an integral part of these financial statements.
| FINANCIAL HIGHLIGHTS — INSTITUTIONAL CLASS/NOTES TO THE FINANCIAL STATEMENTS |
Financial Statements
Notes to the Financial Statements October 31, 2017 |
1). ORGANIZATION
The Hennessy Large Cap Financial Fund (the “Fund”) is a series of Hennessy Funds Trust (the “Trust”), which was organized as a Delaware statutory trust on September 17, 1992. The Fund is an open-end management investment company registered under the Investment Company Act of 1940, as amended. The Fund did not have Institutional Class shares until June 15, 2015. The investment objective of the Fund is capital appreciation. The Fund is a non-diversified fund.
The Fund offers Investor Class and Institutional Class shares. Each class of shares differs principally in its respective 12b-1 distribution and service, shareholder servicing, and sub-transfer agent expenses. There are no sales charges. Each class has identical rights to earnings, assets, and voting privileges, except for class-specific expenses and exclusive rights to vote on matters affecting only an individual class.
As an investment company, the Fund follows the investment company accounting and reporting guidance of the Financial Accounting Standards Board (“FASB”) Accounting Standard Codification Topic 946 “Financial Services—Investment Companies.”
2). SIGNIFICANT ACCOUNTING POLICIES
The following is a summary of significant accounting policies consistently followed by the Fund in the preparation of the financial statements. These policies conform to U.S. generally accepted accounting principles (“GAAP”).
| a). | Investment Valuation – All investments in securities are recorded at their estimated fair value, as described in Note 3. |
| b). | Federal Income Taxes – No provision for federal income taxes or excise taxes has been made because the Fund has elected to be taxed as a “regulated investment company” and intends to distribute substantially all of its taxable income to its shareholders and otherwise comply with the provisions of the Internal Revenue Code of 1986, as amended, applicable to regulated investment companies. Net investment income/loss and realized gains/losses for federal income tax purposes may differ from those reported in the financial statements because of temporary book and tax basis differences. Temporary differences are primarily the result of the treatment of wash sales for tax reporting purposes. The Fund recognizes interest and penalties related to income tax benefits, if any, in the Statement of Operations as an income tax expense. Distributions from net realized gains for book purposes may include short-term capital gains, which are included as ordinary income to shareholders for tax purposes. The Fund may utilize equalization accounting for tax purposes and designate earnings and profits, including net realized gains distributed to shareholders on redemption of shares, as part of the dividends paid deduction for income tax purposes. |
| | Due to inherent differences in the recognition of income, expenses, and realized gains/losses under GAAP and federal income tax regulations, permanent differences between book and tax basis for reporting for fiscal year 2017 have been identified and appropriately reclassified in the Statement of Assets and Liabilities. The adjustments are as follows: |
| HENNESSY FUNDS | 1-800-966-4354 | |
| | Accumulated | Accumulated | | |
| | Net Investment | Net Realized | | |
| | Loss | Gain on Investments | Capital Stock | |
| | $2,336 | $(213,120) | $210,784 | |
| c). | Accounting for Uncertainty in Income Taxes – The Fund has accounting policies regarding recognition and measurement of tax positions taken or expected to be taken on a tax return. The tax returns of the Fund for the prior three fiscal years are open for examination. The Fund has reviewed all open tax years in major jurisdictions and concluded that there is no impact on the Fund’s net assets and no tax liability resulting from unrecognized tax benefits relating to uncertain income tax positions taken or expected to be taken on a tax return. The Fund’s major tax jurisdictions are U.S. federal and Delaware. |
| d). | Income and Expenses – Dividend income is recognized on the ex-dividend date or as soon as information is available to the Fund. Interest income, which includes the amortization of premium and accretion of discount, is recognized on an accrual basis. The Fund is charged for those expenses that are directly attributable to the portfolio, such as advisory, administration, and certain shareholder service fees. Income, expenses (other than expenses attributable to a specific class), and realized and unrealized gains/losses on investments are allocated to each class of shares based on such class’s net assets. |
| e). | Distributions to Shareholders – Dividends from net investment income for the Fund, if any, are declared and paid annually, usually in December. Distributions of net realized capital gains, if any, are declared and paid annually, usually in December. |
| f). | Security Transactions – Investment and shareholder transactions are recorded on the trade date. The Fund determines the realized gain/loss from an investment transaction by comparing the original cost of the security lot sold with the net sale proceeds. Discounts and premiums on securities purchased are accreted/amortized over the life of the respective security. |
| g). | Use of Estimates – The preparation of financial statements in conformity with GAAP requires management to make estimates and assumptions that affect the reported amounts of assets and liabilities and disclosure of contingent assets and liabilities at the date of the financial statements and the reported change in net assets during the reporting period. Actual results could differ from those estimates. |
| h). | Share Valuation – The net asset value (“NAV”) per share of the Fund is calculated by dividing (i) the sum of the value of the securities held by the Fund, plus cash or other assets, minus all liabilities (including estimated accrued expenses) by (ii) the total number of shares outstanding for the Fund, rounded to the nearest cent. The Fund’s shares will not be priced on days the New York Stock Exchange is closed for trading. The offering and redemption price per share for the Fund is equal to the Fund’s NAV per share. |
3). SECURITIES VALUATION
The Fund follows authoritative fair valuation accounting standards that establish an authoritative definition of fair value and set out a hierarchy for measuring fair value. These standards require additional disclosures about the various inputs and valuation techniques used to develop the measurements of fair value and a discussion of changes in valuation techniques and related inputs during the period. These inputs are summarized in the three broad levels listed below:
| NOTES TO THE FINANCIAL STATEMENTS |
| | Level 1 – | Unadjusted, quoted prices in active markets for identical instruments that the Fund has the ability to access at the date of measurement. |
| | Level 2 – | Other significant observable inputs (including, but not limited to, quoted prices in active markets for similar instruments, quoted prices in markets that are not active for identical or similar instruments, and model-derived valuations in which all significant inputs and significant value drivers are observable in active markets, such as interest rates, prepayment speeds, credit risk curves, default rates, and similar data). |
| | Level 3 – | Significant unobservable inputs (including the Fund’s own assumptions about what market participants would use to price the asset or liability based on the best available information) when observable inputs are unavailable. |
Following is a description of the valuation techniques applied to the Fund’s major categories of assets and liabilities measured at fair value on a recurring basis.
| | Equity Securities – Equity securities, including common stocks, preferred stocks, foreign-issued common stocks, exchange-traded funds, closed-end mutual funds, partnerships, rights, and real estate investment trusts, that are traded on a securities exchange for which a last-quoted sales price is readily available will generally be valued at the last sales price as reported by the primary exchange on which the securities are listed. Securities listed on The NASDAQ Stock Market (“NASDAQ”) will generally be valued at the NASDAQ Official Closing Price, which may differ from the last sales price reported. Securities traded on a securities exchange for which a last-quoted sales price is not readily available will generally be valued at the mean between the bid and ask prices. To the extent these securities are actively traded and valuation adjustments are not applied, they are classified in Level 1 of the fair value hierarchy. Securities traded on foreign exchanges generally are not valued at the same time the Fund calculates its NAV because most foreign markets close well before such time. The earlier close of most foreign markets gives rise to the possibility that significant events, including broad market moves, may have occurred in the interim. In certain circumstances, it may be determined that a security needs to be fair valued because it appears that the value of the security might have been materially affected by events occurring after the close of the market in which the security is principally traded, but before the time the Fund calculates its NAV, such as by a development that affects an entire market or region (e.g., weather-related events) or a potentially global development (e.g., a terrorist attack that may be expected to have an effect on investor expectations worldwide). |
| | Registered Investment Companies – Investments in registered investment companies (e.g., mutual funds) are generally priced at the ending NAV provided by the applicable registered investment company’s service agent and will be classified in Level 1 of the fair value hierarchy. |
| | Debt Securities – Debt securities, including corporate bonds, asset-backed securities, mortgage-backed securities, municipal bonds, U.S. Treasuries, and U.S. government agency issues, are generally valued at market on the basis of valuations furnished by an independent pricing service that utilizes both dealer-supplied valuations and formula-based techniques. The pricing service may consider recently executed transactions in securities of the issuer or comparable issuers, market price quotations (where observable), bond spreads, and fundamental data relating to the issuer. In addition, the model may incorporate observable market data, such as reported sales of similar securities, broker quotes, yields, bids, offers, and reference data. Certain securities are valued primarily using dealer quotations. These securities are generally classified in Level 2 of the fair value hierarchy. |
| HENNESSY FUNDS | 1-800-966-4354 | |
| | Short-Term Securities – Short-term equity investments, including money market funds, are valued in the manner specified above. Short-term debt investments with an original term to maturity of 60 days or less are valued at amortized cost, which approximates fair market value. If the original term to maturity of a short-term debt investment exceeded 60 days, then the values as of the 61st day prior to maturity are amortized. Amortized cost is not used if its use would be inappropriate due to credit or other impairments of the issuer, in which case the security’s fair value would be determined, as described below. Short-term securities are generally classified in Level 1 or Level 2 of the fair market hierarchy depending on the inputs used and market activity levels for specific securities. |
The Board of Trustees of the Fund (the “Board”) has adopted fair value pricing procedures that are followed when a price for a security is not readily available or if a significant event has occurred that indicates the closing price of a security no longer represents the true value of that security. Fair value pricing determinations are made in good faith in accordance with these procedures. There are numerous criteria that will be given consideration in determining a fair value of a security, such as the trading volume of a security and markets, the values of other similar securities, and news events with direct bearing on a security or markets. Fair value pricing results in an estimated price for a security that reflects the amount the Fund might reasonably expect to receive in a current sale. Depending on the relative significance of the valuation inputs, these securities may be classified in either Level 2 or Level 3 of the fair value hierarchy.
The fair valuation of foreign securities may be determined with the assistance of a pricing service using correlations between the movement of prices of such securities and indices of domestic securities and other appropriate indicators, such as closing market prices of relevant American Depositary Receipts or futures contracts. The effect of using fair value pricing is that the Fund’s NAV will reflect the affected portfolio securities’ values as determined by the Board or its designee instead of being determined by the market. Using a fair value pricing methodology to price a foreign security may result in a value that is different from the foreign security’s most recent closing price and from the prices used by other investment companies to calculate their NAVs and are generally classified in Level 2 of the fair valuation hierarchy. Because the Fund may invest in foreign securities, the value of the Fund’s portfolio securities may change on days when you will not be able to purchase or redeem your shares.
The Board has delegated day-to-day valuation matters to a Valuation Committee comprised of one or more representatives from Hennessy Advisors, Inc., the Fund’s investment advisor (the “Advisor”). The function of the Valuation Committee is to value securities where current and reliable market quotations are not readily available. All actions taken by the Valuation Committee are reviewed by the Board.
The Fund has performed an analysis of all existing investments to determine the significance and character of all inputs to their fair value determination. Various inputs are used to determine the value of the Fund’s investments. The inputs or methodology used for valuing securities are not necessarily an indication of the risk associated with investing in those securities. Details related to the fair valuation hierarchy of the Fund’s securities as of October 31, 2017, are included in the Schedule of Investments.
4). INVESTMENT TRANSACTIONS
Purchases and sales of investment securities (excluding government and short-term investments) for the Fund during fiscal year 2017 were $21,862,285 and $24,822,454, respectively.
| NOTES TO THE FINANCIAL STATEMENTS |
There were no purchases or sales/maturities of long-term U.S. government securities for the Fund during fiscal year 2017.
The Fund is permitted to purchase or sell securities from or to another fund in the Hennessy Funds family of funds (the “Hennessy Funds”) under specified conditions outlined in procedures adopted by the Board. The procedures have been designed to ensure that any purchase or sale of securities by the Fund from or to another Hennessy Fund complies with Rule 17a-7 of the Investment Company Act of 1940, as amended. For fiscal year 2017, the Fund did not engage in purchases or sales of securities pursuant to Rule 17a-7 of the Investment Company Act of 1940, as amended.
5). INVESTMENT MANAGEMENT FEE AND OTHER TRANSACTIONS WITH AFFILIATES
The Advisor provides the Fund with investment management services under an Investment Advisory Agreement. The Advisor provides all investment advice, office space, and facilities, as well as most of the personnel needed by the Fund. As compensation for its services, the Advisor is entitled to a monthly fee from the Fund. The fee is based upon the average daily net assets of the Fund at an annual rate of 0.90%. The net investment advisory fees expensed by the Fund during fiscal year 2017 are included in the Statement of Operations.
The Board has approved a Shareholder Servicing Agreement for Investor Class shares of the Fund, which was instituted to compensate the Advisor for the non-investment management services it provides to the Fund. The Shareholder Servicing Agreement provides for a monthly fee paid to the Advisor at an annual rate of 0.10% of the average daily net assets of the Fund attributable to Investor Class shares. The shareholder service fees expensed by the Fund during fiscal year 2017 are included in the Statement of Operations.
The Fund has adopted a plan pursuant to Rule 12b-1 under the Investment Company Act of 1940, as amended, that authorizes payments in connection with the distribution of the Fund’s shares at an annual rate of up to 0.25% of the Fund’s average daily net assets attributable to Investor Class shares. Even though the authorized rate is up to 0.25%, the Fund is currently only using up to 0.15% of its average daily net assets attributable to Investor Class shares for such purpose. Amounts paid under the plan may be spent on any activities or expenses primarily intended to result in the sale of shares, including, but not limited to, advertising, shareholder account servicing, the printing and mailing of prospectuses to other than current shareholders, the printing and mailing of sales literature, and compensation for sales and marketing activities or to financial institutions and others, such as dealers and distributors. The distribution fees expensed by the Fund during fiscal year 2017 are included in the Statement of Operations.
The Fund has entered into agreements with various brokers, dealers, and financial intermediaries in connection with the sale of shares of the Fund. The agreements provide for periodic payments by the Fund to the brokers, dealers, and financial intermediaries for providing certain shareholder maintenance services (sub-transfer agent expenses). These shareholder services include the pre-processing and quality control of new accounts, shareholder correspondence, answering customer inquiries regarding account status, and facilitating shareholder telephone transactions. The sub-transfer agent fees expensed by the Fund during fiscal year 2017 are included in the Statement of Operations.
U.S. Bancorp Fund Services, LLC (“USBFS”) provides the Fund with administrative, fund accounting, and transfer agent services and necessary office equipment. As administrator, USBFS is responsible for activities such as (i) preparing various federal and state regulatory filings, reports, and returns for the Fund, (ii) preparing reports and materials to be supplied to the Board, (iii) monitoring the activities of the Fund’s
| HENNESSY FUNDS | 1-800-966-4354 | |
custodian, transfer agent, and accountants, and (iv) coordinating the preparation and payment of the Fund’s expenses and reviewing the Fund’s expense accruals. U.S. Bank, N.A., an affiliate of USBFS, serves as the Fund’s custodian. The servicing agreements between the Trust, USBFS, and U.S. Bank N.A. contain a fee schedule that is inclusive of administrative, fund accounting, custody, and transfer agent fees. The administrative, fund accounting, custody, and transfer agent fees expensed by the Fund during fiscal year 2017 are included in the Statement of Operations.
Quasar Distributors, LLC acts as the Fund’s principal underwriter in a continuous public offering of the Fund’s shares. Quasar Distributors, LLC is an affiliate of USBFS and U.S. Bank, N.A.
The officers of the Fund are affiliated with the Advisor. Such officers, with the exception of the Chief Compliance Officer and the Senior Compliance Officer, receive no compensation from the Fund for serving in their respective roles. The Fund, along with the other Hennessy Funds, makes reimbursement payments, on an equal basis, to the Advisor for a portion of the salary and benefits associated with the office of the Chief Compliance Officer and for all of the salary and benefits associated with the office of the Senior Compliance Officer. The compliance fees expensed by the Fund during fiscal year 2017 are included in the Statement of Operations.
6). GUARANTEES AND INDEMNIFICATIONS
Under the Hennessy Funds’ organizational documents, their officers and trustees are indemnified by the Hennessy Funds against certain liabilities arising out of the performance of their duties to the Hennessy Funds. Additionally, in the normal course of business, the Hennessy Funds enter into contracts with service providers that contain general indemnification clauses. The Fund’s maximum exposure under these arrangements is unknown as this would involve future claims that may be made against the Fund that have not yet occurred. Currently, the Fund expects the risk of loss to be remote.
7). LINE OF CREDIT
The Fund has an uncommitted line of credit with the other Hennessy Funds in the amount of the lesser of (i) $100,000,000 or (ii) 33.33% of each Hennessy Fund’s net assets, or 30% for the Hennessy Gas Utility Fund and 10% for the Hennessy Balanced Fund, intended to provide short-term financing, if necessary, subject to certain restrictions, in connection with shareholder redemptions. The credit facility is with the Hennessy Funds’ custodian bank, U.S. Bank, N.A. Borrowings under this arrangement bear interest at the bank’s prime rate and are secured by all of the Fund’s assets (as to its own borrowings only). During fiscal year 2017, the Fund had an outstanding average daily balance and a weighted average interest rate of $10,734 and 3.97%, respectively. The interest expensed by the Fund during fiscal year 2017 is included in the Statement of Operations. The maximum amount outstanding for the Fund during the period was $779,000. At October 31, 2017, the Fund did not have any borrowings outstanding under the line of credit.
| NOTES TO THE FINANCIAL STATEMENTS |
8). FEDERAL TAX INFORMATION
As of October 31, 2017, the components of accumulated earnings (losses) for income tax purposes were as follows:
| | | Investments | |
| Cost of investments for tax purposes | | $ | 25,381,152 | |
| Gross tax unrealized appreciation | | $ | 7,376,803 | |
| Gross tax unrealized depreciation | | | (597,152 | ) |
| Net tax unrealized appreciation | | $ | 6,779,651 | |
| Undistributed ordinary income | | $ | — | |
| Undistributed long-term capital gains | | | 1,515,486 | |
| Total distributable earnings | | $ | 1,515,486 | |
| Other accumulated loss | | $ | (114,001 | ) |
| Total accumulated gain | | $ | 8,181,136 | |
The difference between book-basis unrealized appreciation/depreciation (as shown in the Statement of Assets and Liabilities) and tax-basis unrealized appreciation/depreciation (as shown above) is attributable primarily to wash sales.
At October 31, 2017, the Fund had no tax basis capital losses to offset future capital gains.
During fiscal year 2017, the capital losses utilized for the Fund were $1,792,283.
At October 31, 2017, the Fund deferred, on a tax basis, a late-year ordinary loss of $114,001. Late-year ordinary losses are net ordinary losses incurred after December 31, 2016, but within the taxable year, that are deemed to arise on the first day of the Fund’s next taxable year.
During fiscal years 2017 and 2016, the tax character of distributions paid by the Fund was as follows:
| | | Year Ended | | | Year Ended | |
| | | October 31, 2017 | | | October 31, 2016 | |
Ordinary income(1) | | $ | 187,217 | | | $ | 114,806 | |
| Long-term capital gain | | | 1,339 | | | | 9,736,126 | |
| | | $ | 188,556 | | | $ | 9,850,932 | |
| | (1) | Ordinary income includes short-term gain/loss. |
9). EVENTS SUBSEQUENT TO YEAR END
Management has evaluated the Fund’s related events and transactions that occurred subsequent to October 31, 2017, through the date of issuance of the Fund’s financial statements. Other than as disclosed below, management has determined that there were no subsequent events requiring recognition or disclosure in the financial statements.
On December 7, 2017, capital gains were declared and paid to shareholders of record on December 6, 2017, as follows:
| | | Long-term |
| | Investor Class | $1.00493 |
| | Institutional Class | $1.00418 |
| HENNESSY FUNDS | 1-800-966-4354 | |
Report of Independent Registered Public
Accounting Firm
To the Board of Trustees of Hennessy Funds Trust
and the Shareholders of the Hennessy Large Cap Financial Fund
Novato, CA
We have audited the accompanying statement of assets and liabilities, including the schedule of investments, of the Hennessy Large Cap Financial Fund (the “Fund”), a series of Hennessy Funds Trust (the “Trust”) as of October 31, 2017, and the related statement of operations for the year then ended, the statements of changes in net assets for each of the two years in the period then ended, and the financial highlights for each of the five years in the period then ended. These financial statements and financial highlights are the responsibility of the Fund’s management. Our responsibility is to express an opinion on these financial statements and financial highlights based on our audits.
We conducted our audits in accordance with the standards of the Public Company Accounting Oversight Board (United States). Those standards require that we plan and perform the audits to obtain reasonable assurance about whether the financial statements and financial highlights are free of material misstatement. The Fund is not required to have, nor were we engaged to perform, an audit of its internal control over financial reporting. Our audits included consideration of internal control over financial reporting as a basis for designing audit procedures that are appropriate in the circumstances, but not for the purposes of expressing an opinion on the effectiveness of the Fund’s internal control over financial reporting. Accordingly, we express no such opinion. An audit includes examining, on a test basis, evidence supporting the amounts and disclosures in the financial statements. Our procedures included confirmation of securities owned as of October 31, 2017, by correspondence with the custodian. An audit also includes assessing the accounting principles used and significant estimates made by management, as well as evaluating the overall financial statement presentation. We believe that our audits provide a reasonable basis for our opinion.
In our opinion, the financial statements and financial highlights referred to above present fairly, in all material respects, the financial position of the Hennessy Large Cap Financial Fund as of October 31, 2017, the results of its operations for the year then ended, the changes in its net assets for each of the two years in the period then ended, and the financial highlights for each of the five years in the period then ended, in conformity with accounting principles generally accepted in the United States of America.
TAIT, WELLER & BAKER LLP
Philadelphia, Pennsylvania
December 22, 2017
| REPORT OF INDEPENDENT REGISTERED PUBLIC ACCOUNTING FIRM/TRUSTEES AND OFFICERS |
Trustees and Officers of the Fund (Unaudited)
The business and affairs of the Funds are managed under the direction of the Board of Trustees of the Trust, and the Board of Trustees elects the Officers of the Trust. Beginning in March 2015, the Board of Trustees has from time to time appointed advisers to the Board of Trustees (“Advisers”), with the intention of having qualified individuals serve in an advisory capacity in order to garner experience in the mutual fund and asset management industry and be considered as potential Trustees in the future. There are currently three Advisers to the Board of Trustees: Brian Alexander, Doug Franklin, and Claire Knoles. As Advisers, Mr. Alexander, Mr. Franklin, and Ms. Knoles attend meetings of the Board and act as non-voting participants. Information pertaining to the Trustees, Advisers, and the Officers of the Trust is set forth below. The Trustees and Officers serve until their successors are duly elected and qualified or until their earlier death, resignation, or removal. Each of the Trustees oversees 14 Hennessy Funds. Unless otherwise indicated, the address of all persons listed below is 7250 Redwood Boulevard, Suite 200, Novato, CA 94945. The Fund’s Statement of Additional Information includes more information about the persons listed below and is available, without charge, upon request by calling 1-800-966-4354.
| | | | Other |
| | | | Directorships |
| | | | Held Outside |
| Name, (Year of Birth), | | | of Fund |
| and Position Held | Start Date | Principal Occupation(s) | Complex During |
with the Trust | of Service | During Past Five Years | Past Five Years(1) |
| |
| Disinterested Trustees and Advisers |
| | | | |
| J. Dennis DeSousa | January 1996 | Mr. DeSousa is a real estate investor. | None. |
| (1936) | | | |
| Trustee | | | |
| | | | |
| Robert T. Doyle | January 1996 | Mr. Doyle has been the Sheriff of | None. |
| (1947) | | Marin County, California since 1996. | |
| Trustee | | | |
| | | | |
| Gerald P. Richardson | May 2004 | Mr. Richardson is an independent | None. |
| (1945) | | consultant in the securities industry. | |
| Trustee | | | |
| | | | |
| Brian Alexander | March 2015 | Mr. Alexander has been employed | None. |
| (1981) | | by Sutter Health Novato Community | |
| Adviser to the Board | | Hospital since 2012, first as an | |
| | | Assistant Administrator and then, | |
| | | beginning in 2013, as the Chief | |
| | | Administrative Officer. From 2011 | |
| | | through 2012, Mr. Alexander was | |
| | | employed by Sutter Health West Bay | |
| | | Region as the Regional Director of | |
| | | Strategic Decision Support. | |
| HENNESSY FUNDS | 1-800-966-4354 | |
| | | | Other |
| | | | Directorships |
| | | | Held Outside |
| Name, (Year of Birth), | | | of Fund |
| and Position Held | Start Date | Principal Occupation(s) | Complex During |
with the Trust | of Service | During Past Five Years | Past Five Years(1) |
| | | | |
| Doug Franklin | March 2016 | Mr. Franklin is a retired insurance | None. |
| (1964) | | industry executive. From 1987 | |
| Adviser to the Board | | through 2015, he was employed | |
| | | by Allianz-Fireman’s Fund Insurance | |
| | | Company in various positions, | |
| | | including Chief Actuary and | |
| | | Chief Risk Officer. | |
| | | | |
| Claire Knoles | December 2015 | Ms. Knoles is a founder of Kiosk and | None. |
| (1974) | | has served as its Chief Operating | |
| Adviser to the Board | | Officer since 2004. Kiosk is a full | |
| | | service marketing agency with | |
| | | offices in the San Francisco Bay | |
| | | Area, Toronto, and Liverpool, UK. | |
| | | | |
Interested Trustee(2) | | | |
| | | | |
| Neil J. Hennessy | January 1996 as | Mr. Hennessy has been employed by | Hennessy |
| (1956) | a Trustee and | Hennessy Advisors, Inc. since 1989 | Advisors, Inc. |
| Trustee, Chairman of | June 2008 as | and currently serves as its President, | |
| the Board, Chief | an Officer | Chairman and Chief Executive Officer. | |
| Investment Officer, | | | |
| Portfolio Manager, | | | |
| and President | | | |
| Name, (Year of Birth), | | |
| and Position Held | Start Date | Principal Occupation(s) |
with the Trust | of Service | During Past Five Years |
| | | |
| Officers | | |
| | | |
| Teresa M. Nilsen | January 1996 | Ms. Nilsen has been employed by Hennessy Advisors, Inc. |
| (1966) | | since 1989 and currently serves as its Executive Vice President, |
| Executive Vice President | | Chief Operations Officer, Chief Financial Officer, and Secretary. |
| and Treasurer | | |
| | | |
| Daniel B. Steadman | March 2000 | Mr. Steadman has been employed by Hennessy Advisors, Inc. |
| (1956) | | since 2000 and currently serves as its Executive Vice President |
| Executive Vice President | | and Chief Compliance Officer. |
| and Secretary | | |
| | | |
| Brian Carlson | December 2013 | Mr. Carlson has been employed by Hennessy Advisors, Inc. |
| (1972) | | since December 2013. Mr. Carlson was previously a co-founder |
| Senior Vice President and | | and principal of Trivium Consultants, LLC from February 2011 |
| Head of Distribution | | through November 2013. |
| | | |
| Jennifer Cheskiewicz | June 2013 | Ms. Cheskiewicz has been employed by Hennessy Advisors, Inc. |
| (1977) | | as its General Counsel since June 2013. She previously served |
| Senior Vice President and | | as in-house counsel to Carlson Capital, L.P., an SEC-registered |
| Chief Compliance Officer | | investment advisor to several private funds, from |
| | | February 2010 to May 2013. |
| TRUSTEES AND OFFICERS OF THE FUND |
| Name, (Year of Birth), | | |
| and Position Held | Start Date | Principal Occupation(s) |
with the Trust | of Service | During Past Five Years |
| | | |
| David Ellison | October 2012 | Mr. Ellison has been employed by Hennessy Advisors, Inc. since |
(1958)(3) | | October 2012. He has served as a Portfolio Manager of the |
| Senior Vice President | | Hennessy Small Cap Financial Fund and the Hennessy Large |
| and Portfolio Manager | | Cap Financial Fund since inception. Mr. Ellison also served as a |
| | | Portfolio Manager of the Hennessy Technology Fund from its |
| | | inception until February 2017. Mr. Ellison served as Director, |
| | | CIO and President of FBR Fund Advisers, Inc. from |
| | | December 1999 to October 2012. |
| | | |
| Ryan Kelley | March 2013 | Mr. Kelley has been employed by Hennessy Advisors, Inc. since |
(1972)(4) | | October 2012. He has served as a Portfolio Manager of the |
| Vice President and | | Hennessy Gas Utility Fund, the Hennessy Small Cap Financial |
| Portfolio Manager | | Fund, and the Hennessy Large Cap Financial Fund since |
| | | October 2014. He served as Co-Portfolio Manager of the same |
| | | funds from March 2013 through September 2014, and as a |
| | | Portfolio Analyst for the Hennessy Funds from October 2012 |
| | | through October 2014. Mr. Kelley has also served as a Portfolio |
| | | Manager of the Hennessy Cornerstone Growth Fund, the |
| | | Hennessy Cornerstone Mid Cap 30 Fund, the Hennessy |
| | | Cornerstone Large Growth Fund, and the Hennessy |
| | | Cornerstone Value Fund and as a Co-Portfolio Manager of the |
| | | Hennessy Technology Fund since February 2017. Mr. Kelley |
| | | served as Portfolio Manager of FBR Fund Advisers, Inc. from |
| | | January 2008 to October 2012. |
| | | |
| Brian Peery | March 2003 as | Mr. Peery has been employed by Hennessy Advisors, Inc. since |
| (1969) | an Officer and | 2002. He has served as a Portfolio Manager of the Hennessy |
| Senior Vice President | February 2011 | Cornerstone Growth Fund, the Hennessy Cornerstone Mid Cap |
| and Portfolio Manager | as a Co-Portfolio | 30 Fund, the Hennessy Cornerstone Large Growth Fund, the |
| | Manager or | Hennessy Cornerstone Value Fund, the Hennessy Total Return |
| | Portfolio Manager | Fund, and the Hennessy Balanced Fund since October 2014. |
| | | He served as Co-Portfolio Manager of the same funds from |
| | | February 2011 through September 2014. Mr. Peery has also |
| | | served as a Portfolio Manager of the Hennessy Gas Utility Fund |
| | | since February 2015 and as Lead Portfolio Manager of the |
| | | Hennessy Technology Fund since February 2017. |
| | | |
| Daniel P. Hennessy | December 2016 | Mr. Daniel Hennessy has been employed by Hennessy Advisors, |
| (1990) | | Inc. since 2015. He has served as an Associate Analyst of the |
| Assistant Vice President | | Hennessy Technology Fund since February 2017. He previously |
| and Associate Analyst | | served as a Mutual Fund Specialist at U.S. Bancorp Fund |
| | | Services, LLC from November 2014 to July 2015. Prior to that, |
| | | he attended the University of San Diego, where he earned a |
| | | degree in Political Science. |
_______________
(1) | Messrs. DeSousa, Doyle, Hennessy, and Richardson previously served on the Board of Directors of Hennessy Mutual Funds, Inc. (“HMFI”), The Hennessy Funds, Inc. (“HFI”), and Hennessy SPARX Funds Trust (“HSFT”). Pursuant to an internal reorganization effective as of February 28, 2014, the series of HFMI, HFI, and HSFT were reorganized into corresponding series of Hennessy Funds Trust that mirrored them. Subsequent to the reorganization, HFMI, HFI, and HSFT were dissolved. |
(2) | Mr. Hennessy is considered an “interested person,” as defined in the Investment Company Act of 1940, as amended, because he is an officer of the Hennessy Funds. |
(3) | The address of this officer is 101 Federal Street, Suite 1900, Boston, MA 02110. |
(4) | The address of this officer is 1340 Environ Way, Chapel Hill, NC 27517. |
| HENNESSY FUNDS | 1-800-966-4354 | |
Expense Example (Unaudited)
October 31, 2017
As a shareholder of the Fund, you incur two types of costs: (1) transaction costs, including sales charges (loads) on purchase payments, reinvested dividends, or other distributions, redemption fees, and exchange fees; and (2) ongoing costs, including management fees, service fees, and other Fund expenses. This Example is intended to help you understand your ongoing costs (in dollars) of investing in the Fund and to compare these costs with the ongoing costs of investing in other mutual funds. The Example is based on an investment of $1,000 invested at the beginning of the period and held for the entire period from May 1, 2017, through October 31, 2017.
Actual Expenses
The first line of the table below under the “Investor Class” and “Institutional Class” headings provides information about actual account values and actual expenses. Although the Fund charges no sales loads or transaction fees, you will be assessed fees for outgoing wire transfers, returned checks and stop payment orders at prevailing rates charged by U.S. Bancorp Fund Services, LLC, the Fund’s transfer agent. If you request that a redemption be made by wire transfer, currently a $15 fee is charged by the Fund’s transfer agent. IRA accounts will be charged a $15 annual maintenance fee. The example below includes, but is not limited to, management fees, shareholder servicing fees, fund accounting, custody, and transfer agent fees. However, the example below does not include portfolio trading commissions and related expenses, and other extraordinary expenses as determined under generally accepted accounting principles. You may use the information in this line, together with the amount you invested, to estimate the expenses that you paid over the period. Simply divide your account value by $1,000 (for example, an $8,600 account value divided by $1,000 = 8.6), then multiply the result by the number in the first line of the table under the “Investor Class” or “Institutional Class” headings in the column entitled “Expenses Paid During Period” to estimate the expenses you paid on your account during this period.
Hypothetical Example for Comparison Purposes
The second line of the table below under the “Investor Class” and “Institutional Class” headings provides information about hypothetical account values and hypothetical expenses based on the Fund’s actual expense ratios and an assumed rate of return of 5% per year before expenses, which is not the Fund’s actual return. The hypothetical account values and expenses may not be used to estimate the actual ending account balance or expenses you paid for the period. You may use this information to compare the ongoing costs of investing in the Fund and other funds. To do so, compare this 5% hypothetical example with the 5% hypothetical examples that appear in the shareholder reports of the other funds. Please note that the expenses shown in the table are meant to highlight your ongoing costs only and do not reflect any transactional costs, such as sales charges (loads), or exchange fees. Therefore, the second line of the table under the “Investor Class” and “Institutional Class” headings is useful in comparing ongoing costs only, and will not help you determine the relative total costs of owning different funds. In addition, if these transactional costs were included, your costs would have been higher.
| | | | Expenses Paid |
| | Beginning | Ending | During Period(1) |
| | Account Value | Account Value | May 1, 2017 – |
| | May 1, 2017 | October 31, 2017 | October 31, 2017 |
| Investor Class | | | |
| Actual | $1,000.00 | $1,148.10 | $9.58 |
| Hypothetical (5% return before expenses) | $1,000.00 | $1,016.28 | $9.00 |
| | | | |
| Institutional Class | | | |
| Actual | $1,000.00 | $1,149.50 | $8.34 |
| Hypothetical (5% return before expenses) | $1,000.00 | $1,017.44 | $7.83 |
(1) | Expenses are equal to the Fund’s annualized expense ratio of 1.77% for Investor Class shares or 1.54% for Institutional Class shares, as applicable, multiplied by the average account value over the period, multiplied by 184/365 days (to reflect one-half year period). |
| HENNESSY FUNDS | 1-800-966-4354 | |
How to Obtain a Copy of the Fund’s
Proxy Voting Policy and Proxy Voting Records
A description of the policies and procedures the Fund uses to determine how to vote proxies relating to portfolio securities is available without charge: (1) by calling 1-800-966-4354; (2) on the Hennessy Funds’ website at hennessyfunds.com/proxy-voting/policy.fs; or (3) on the U.S. Securities and Exchange Commission’s (the “SEC”) website at www.sec.gov. The Fund’s proxy voting record is available without charge on both the Hennessy Funds’ website at hennessyfunds.com/proxy-voting/vote.fs and the SEC’s website at www.sec.gov no later than August 31 for the prior 12 months ending June 30.
Quarterly Filings on Form N-Q
The Fund files a complete schedule of portfolio holdings with the SEC for the first and third quarters of each fiscal year on Form N-Q. The Fund’s Forms N-Q are made available on the SEC’s website at www.sec.gov. The Fund’s Forms N-Q may be reviewed and copied at the SEC’s Public Reference Room in Washington, DC, and information on the operation of the Public Reference Room may be obtained by calling 1-800-SEC-0330. Information included in the Fund’s Forms N-Q will also be available upon request by calling 1-800-966-4354.
Federal Tax Distribution Information
(Unaudited)
For fiscal year 2017, certain dividends paid by the Fund may be subject to a maximum tax rate of 23.8%, as provided for by the Jobs and Growth Tax Relief Reconciliation Act of 2003. The percentage of dividends declared from ordinary income designated as qualified dividend income was 100.00%.
For corporate shareholders, the percent of ordinary income distributions that qualified for the corporate dividends received deduction for fiscal year 2017 was 100.00%.
The percentage of taxable ordinary income distributions that are designated as short-term capital gain distributions under Section 871(k)(2)(C) of the Internal Revenue Code of 1986, as amended, for the Fund was 0.00%.
Householding
To help keep the Fund’s costs as low as possible, we generally deliver a single copy of most financial reports and prospectuses to shareholders who share an address, even if the accounts are registered under different names. This process, known as “householding,” does not apply to account statements. You may request an individual copy of a prospectus or financial report at any time. If you would like to receive separate mailings, please call U.S. Bancorp Fund Services, LLC at 1-800-261-6950 or 1-414-765-4124 and we will begin individual delivery within 30 days of your request. If your account is held through a financial institution or other intermediary, please contact them directly to request individual delivery.
| PROXY VOTING — PRIVACY POLICY |
Privacy Policy
We collect the following non-public personal information about you:
| | • | information we receive from you on or in applications or other forms, correspondence, or conversations, including, but not limited to, your name, address, phone number, social security number, assets, income, and date of birth; and |
| | • | information about your transactions with us, our affiliates, or others, including, but not limited to, your account number and balance, payment history, parties to transactions, cost basis information, and other financial information. |
We do not disclose any non-public personal information about our current or former shareholders to non-affiliated third parties, except as permitted by law. For example, we are permitted by law to disclose all of the information we collect, as described above, to our Transfer Agent to process your transactions. Furthermore, we restrict access to your non-public personal information to those persons who require such information to provide products or services to you. We maintain physical, electronic, and procedural safeguards that comply with federal standards to guard your non-public personal information.
In the event that you hold shares of the Fund through a financial intermediary, including, but not limited to, a broker-dealer, bank, or trust company, the privacy policy of your financial intermediary would govern how your non-public personal information will be shared with non-affiliated third parties.
| HENNESSY FUNDS | 1-800-966-4354 | |
(This Page Intentionally Left Blank.)
For information, questions or assistance, please call
The Hennessy Funds
1-800-966-4354 or 1-415-899-1555
INVESTMENT ADVISOR
Hennessy Advisors, Inc.
7250 Redwood Boulevard, Suite 200
Novato, California 94945
ADMINISTRATOR,
TRANSFER AGENT,
DIVIDEND PAYING AGENT &
SHAREHOLDER SERVICING AGENT
U.S. Bancorp Fund Services, LLC
P.O. Box 701
Milwaukee, Wisconsin 53201-0701
CUSTODIAN
U.S. Bank N.A.
Custody Operations
1555 North River Center Drive, Suite 302
Milwaukee, Wisconsin 53212
TRUSTEES
Neil J. Hennessy
Robert T. Doyle
J. Dennis DeSousa
Gerald P. Richardson
COUNSEL
Foley & Lardner LLP
777 East Wisconsin Avenue
Milwaukee, Wisconsin 53202-5306
INDEPENDENT REGISTERED
PUBLIC ACCOUNTING FIRM
Tait, Weller & Baker LLP
1818 Market Street, Suite 2400
Philadelphia, Pennsylvania 19103
DISTRIBUTOR
Quasar Distributors, LLC
777 East Wisconsin Avenue
Milwaukee, Wisconsin 53202
hennessyfunds.com | 1-800-966-4354
This report has been prepared for shareholders and may be distributed to
others only if preceded or accompanied by a current prospectus.
ANNUAL REPORT
OCTOBER 31, 2017
HENNESSY TECHNOLOGY FUND
Investor Class HTECX
Institutional Class HTCIX
hennessyfunds.com | 1-800-966-4354
(This Page Intentionally Left Blank.)
Contents
| Letter to Shareholders | | 2 |
| Performance Overview | | 4 |
| Financial Statements | | |
| Schedule of Investments | | 7 |
| Statement of Assets and Liabilities | | 11 |
| Statement of Operations | | 12 |
| Statements of Changes in Net Assets | | 13 |
| Financial Highlights | | 14 |
| Notes to the Financial Statements | | 18 |
| Report of Independent Registered Public Accounting Firm | | 25 |
| Trustees and Officers of the Fund | | 26 |
| Expense Example | | 30 |
| Proxy Voting Policy and Proxy Voting Records | | 32 |
| Quarterly Schedule of Investments | | 32 |
| Householding | | 32 |
| Privacy Policy | | 33 |
| HENNESSY FUNDS | 1-800-966-4354 | |
December 2017
Dear Hennessy Funds Shareholder:
Over the past year, global equity markets have made strong advances, fueled by continued, broad-based economic growth in most countries and regions, and in spite of a somewhat unsettling geopolitical backdrop.
U.S. stocks performed well in the first year of the new administration in Washington, and, ignoring the debate and the bluster, investors have continued to focus on what concerns them the most – tax reform, deregulation, and the hope of an increase in infrastructure spending. As we move into the final weeks of the calendar year, with the major indices reaching new highs, I find myself envisioning the Dow Jones Industrial Average building momentum toward 30,000.
Over the past 12 months, the U.S. economy has continued to grow at a steady rate of almost 2.5% on an annualized basis, as measured by GDP. Companies have added over 170,000 jobs per month on average over the past year, and the current unemployment rate of 4.1% is the lowest in 17 years. Consumer confidence is high and still rising, and corporate profits are at all-time highs. The Federal Reserve has been increasing interest rates, but at a gradual pace. The bond market has also continued to support the equity market and equity market valuations. Since December of last year, long bond yields have stayed within a narrow band, with the 10-year U.S. Treasury yield hovering in the 2.0% to 2.5% range, and remain low compared to historical averages. In my opinion, long bond yields have stayed low despite three increases in the Federal Funds rate over the last 12 months in part due to persistent low inflation.
Meanwhile, the prospective price-to-earnings multiples for the Dow Jones Industrial Average and S&P 500 Index are just above long-term averages at 19.5x and 19.9x, respectively. I believe these levels of stock valuation, while higher than a year ago, are still very reasonable. At the peak of the technology/dot-com bubble, U.S. equities sold at much higher multiples across the board than they do today, and bond yields were also much higher. In June of 1999, the Dow Jones Industrial Average sold at 28x earnings and the 10-year bond yield was close to 6%. Today, the Dow is selling at under 20x earnings and is offering a 2.2% dividend yield, on par with the yield of the 10-year government bond at 2.4%.
Equity markets in the U.S. have been rising for almost nine years, and financial media reports have speculated that this bull run will come to end, but why? I see no substantial reasons or indicators that a major correction is on the horizon. I remain confident that this bull market has room to run. Overall, investment fundamentals are strong. Corporate earnings are growing at a healthy rate, and companies are generating excess cash flow. Cash continues to build on corporate balance sheets, with $5.2 trillion in cash and short term investments among the S&P 500 Index companies as of October 31, 2017. If our government leaders can pass a meaningful tax reform bill and continue efforts toward regulatory relief, it could be icing on the cake for equities.
There have been, and will likely continue to be, downturns throughout this extended bull market. Since 2010, there have been 18 downturns in the market, 14 of which were between 5% and 10% and four of which were corrections of between 10% and 20%. Yet the market has bounced back following each pullback and then has moved higher. A correction is not the end of the bull market. What might signal that we are at the end of this bull market? Euphoria. And I still see no signs of euphoria in this market. In the past,
I have likened the current bull market to that of 1982-2000, and I am confident in the strength of the market today and believe the economy will continue its slow, but steady, growth into the coming year.
Thank you for your continued confidence and investment in our funds. If you have any questions or would like to speak with us directly, please don’t hesitate to call us at (800) 966-4354.
Best regards,
Neil J. Hennessy
President and Chief Investment Officer
Past performance does not guarantee future results.
Mutual fund investing involves risk. Principal loss is possible.
Opinions expressed are those of Neil Hennessy and are subject to change, are not guaranteed, and should not be considered investment advice.
The Dow Jones Industrial Average and S&P 500 Index are unmanaged indices commonly used to measure the performance of U.S. stocks. One cannot invest directly in an index.
Price to earnings is calculated by dividing a company’s market price per share by its earnings per share. Dividend yield is calculated as the annual dividends paid by a company divided by the price of a share of its stock. Cash flow provides an indication of a company’s financial strength and represents earnings before depreciation, amortization, and non-cash charges.
| HENNESSY FUNDS | 1-800-966-4354 | |
Performance Overview (Unaudited)
CHANGE IN VALUE OF $10,000 INVESTMENT
This graph illustrates the performance of an initial investment of $10,000 made in the Fund ten years ago and assumes the reinvestment of dividends.
AVERAGE ANNUAL TOTAL RETURN FOR PERIODS ENDED OCTOBER 31, 2017
| | One | Five | Ten |
| | Year | Years | Years |
| Hennessy Technology Fund – | | | |
| Investor Class (HTECX) | 16.69% | 11.59% | 4.35% |
| Hennessy Technology Fund – | | | |
Institutional Class (HTCIX)(1) | 17.01% | 11.93% | 4.57% |
| NASDAQ Composite Index | 31.13% | 19.21% | 10.19% |
| S&P 500 Index | 23.63% | 15.18% | 7.51% |
| Expense ratios: | Gross 3.46%, Net 1.24%(2) (Investor Class); |
| | Gross 3.12%, Net 0.99%(2) (Institutional Class) |
(1) | The inception date of Institutional Class shares is March 12, 2010. Performance shown prior to the inception of Institutional Class shares reflects the performance of Investor Class shares and includes expenses that are not applicable to, and are higher than, those of Institutional Class shares. |
(2) | The Fund’s investment advisor has contractually agreed to limit expenses until February 28, 2018. |
Performance data quoted represents past performance; past performance does not guarantee future results. The investment return and principal value of an investment will fluctuate so that an investor’s shares, when redeemed, may be worth more or less than their original cost. The performance table does not reflect the deduction of taxes that a shareholder would pay on Fund distributions or the redemption of Fund shares. Current performance of the Fund may be lower or higher than the performance quoted. Performance data current to the most recent month end may be obtained by visiting hennessyfunds.com. Performance for periods prior to October 26, 2012, is that of the FBR Technology Fund.
The NASDAQ Composite Index is a broad-based capitalization-weighted index of all the NASDAQ National Market and Small Cap stocks. The S&P 500 Index is an unmanaged index commonly used to measure the performance of U.S. stocks. One cannot invest directly in an index.
The expense ratios presented are from the most recent prospectus. The expense ratios for the current reporting period are available in the Financial Highlights section of this report.
PERFORMANCE NARRATIVE
Portfolio Managers Brian E. Peery (Lead Portfolio Manager) and Ryan C. Kelley (Co-Portfolio Manager)
Performance:
For the 12-month period ended October 31, 2017, the Investor Class of the Hennessy Technology Fund returned 16.69%, underperforming the NASDAQ Composite Index and the S&P 500 Index, which returned 31.13% and 23.63%, respectively, for the period.
The Fund’s investments in consumer-oriented technology stocks in the Consumer Discretionary sector contributed positively to the Fund’s performance, while our allocation to the Industrials sector was a significant detractor from performance over the period. As a result of the investment strategy modification discussed below, the Fund no longer holds Industrial sector stocks, but continues to hold Consumer Discretionary sector stocks.
On an individual stock basis, major positive contributors to the Fund’s performance included Yirendai Ltd., a Chinese consumer finance business, Red Hat, Inc., a software developer, Dexcom, Inc., a medical device company, Paycom Software, Inc., an employment software solutions company, and Match Group, Inc., an online dating service. The Fund’s underweight position in several widely held, large-cap technology companies, primarily Microsoft Corp., Apple, Inc., Alphabet, Inc., and Facebook, Inc., that performed well over the period negatively affected the Fund’s relative performance. The Fund continues to hold Yirendai, Red Hat, Paycom Software, Match Group and Apple.
Portfolio Strategy:
The Fund modified its investment strategy in February 2017. The Fund’s modified investment strategy is based on identifying technology-related stocks that have sector-leading cash flows and profits and that we believe have the ability to sustain profitability. The Fund seeks out companies that have historically delivered returns in excess of the cost of capital and that have relatively low debt on their balance sheets, strong cash flows, and attractive relative valuations. The Fund owns not only large, well-known companies, but also a collection of smaller companies that are growing quickly. The Fund now concentrates its investments in the Technology sector and no longer holds Health Care sector stocks. We think this modified investment strategy meets our goal of offering investors a conservative way to invest in a highly volatile area of the market.
Investment Commentary:
The Technology sector has performed well over the past 12 months, and we expect the sector to continue to deliver positive returns to investors in the coming year. Equity valuations, however, are higher than they were, and in an environment of rising interest rates, some richly valued stocks could be vulnerable to a correction. Despite high valuations in some areas, we believe the sector can continue to perform well, and we think there is still exceptional growth opportunity in the stocks we own. We expect high-growth areas of the Technology sector, particularly software and cybersecurity, to continue to post strong earnings growth and for this growth to drive share price appreciation.
We continue to believe the Fund offers investors exposure to companies that are working on innovative solutions to common problems, developing products to increase productivity, and bringing new and attractive consumer and industrial products to market.
_______________
Opinions expressed are those of the Portfolio Managers as of the date written and are subject to change, are not guaranteed, and should not be considered investment advice or an indication of trading intent.
| HENNESSY FUNDS | 1-800-966-4354 | |
The NASDAQ Composite Index is a broad-based capitalization-weighted index of all the NASDAQ National Market and Small Cap stocks. The S&P 500 Index is an unmanaged index commonly used to measure the performance of U.S. stocks. One cannot invest directly in an index.
The Fund is non-diversified, meaning it may concentrate its assets in fewer individual holdings than a diversified fund, making it more exposed to individual stock volatility than a diversified fund. Investments are focused in the Technology sector; sector funds may be subject to a higher degree of market risk. Investments in foreign securities may involve political, economic, and currency risks, greater volatility and differences in accounting methods. The Fund invests in small- and medium-sized companies, which may have more limited liquidity and greater volatility compared to larger companies. Please see the Fund’s prospectus for a more complete discussion of these and other risks.
References to specific securities should not be considered a recommendation to buy or sell any security. Fund holdings and sector allocations are subject to change. Please refer to the Schedule of Investments included in this report for additional portfolio information.
Cash flow provides an indication of a company’s financial strength and represents earnings before depreciation, amortization, and non-cash charges.
Earnings growth is not a measure of the Fund’s future performance.
| PERFORMANCE OVERVIEW/SCHEDULE OF INVESTMENTS |
Financial Statements
Schedule of Investments as of October 31, 2017 |
HENNESSY TECHNOLOGY FUND
(% of Net Assets)
| TOP TEN HOLDINGS (EXCLUDING CASH/CASH EQUIVALENTS) | % NET ASSETS |
| Semiconductor Manufacturing International Corp. – ADR | 2.15% |
| Ichor Holdings, Ltd. | 1.88% |
| Shutterstock, Inc. | 1.83% |
| Amazon.com, Inc. | 1.80% |
| Paycom Software, Inc. | 1.74% |
| Applied Materials, Inc. | 1.72% |
| Paylocity Holding Corp. | 1.69% |
| Science Applications International Corp. | 1.69% |
| Everi Holdings, Inc. | 1.69% |
| Red Hat, Inc. | 1.69% |
Note: For presentation purposes, the Fund has grouped some of the industry categories. For purposes of categorizing securities for compliance with section 8(b)(1) of the Investment Company Act of 1940, as amended, the Fund uses more specific industry classifications.
| HENNESSY FUNDS | 1-800-966-4354 | |
| COMMON STOCKS – 95.69% | | Number | | | | | | % of | |
| | | of Shares | | | Value | | | Net Assets | |
| Consumer Discretionary – 4.59% | | | | | | | | | |
| Amazon.com, Inc. (a) | | | 72 | | | $ | 79,580 | | | | 1.80 | % |
| FTD Companies, Inc. (a) | | | 5,250 | | | | 56,700 | | | | 1.28 | % |
| Wayfair, Inc., Class A (a) | | | 952 | | | | 66,545 | | | | 1.51 | % |
| | | | | | | | 202,825 | | | | 4.59 | % |
| | | | | | | | | | | | | |
| Information Technology – 91.10% | | | | | | | | | | | | |
| Accenture PLC, Class A (b) | | | 514 | | | | 73,173 | | | | 1.66 | % |
| Advanced Semiconductor Engineering, Inc. – ADR (b) | | | 11,267 | | | | 69,405 | | | | 1.57 | % |
| Applied Materials, Inc. | | | 1,347 | | | | 76,011 | | | | 1.72 | % |
| Automatic Data Processing, Inc. | | | 624 | | | | 72,546 | | | | 1.64 | % |
| Booz Allen Hamilton Holding Corp. | | | 1,829 | | | | 69,118 | | | | 1.57 | % |
| Cadence Design Systems, Inc. (a) | | | 1,727 | | | | 74,537 | | | | 1.69 | % |
| Carbonite, Inc. (a) | | | 3,138 | | | | 71,233 | | | | 1.61 | % |
| Cars.com, Inc. (a) | | | 2,479 | | | | 59,050 | | | | 1.34 | % |
| CDK Global, Inc. | | | 1,082 | | | | 68,772 | | | | 1.56 | % |
| CDW Corp. of Delaware | | | 997 | | | | 69,790 | | | | 1.58 | % |
| Celestica, Inc. (a)(b) | | | 5,482 | | | | 55,094 | | | | 1.25 | % |
| CommerceHub, Inc., Series A (a) | | | 3,008 | | | | 67,169 | | | | 1.52 | % |
| Convergys Corp. | | | 2,684 | | | | 69,059 | | | | 1.56 | % |
| CSRA, Inc. | | | 2,174 | | | | 69,546 | | | | 1.58 | % |
| eBay, Inc. (a) | | | 1,798 | | | | 67,677 | | | | 1.53 | % |
| EchoStar Corp., Class A (a) | | | 1,222 | | | | 68,371 | | | | 1.55 | % |
| Everi Holdings, Inc. (a) | | | 9,004 | | | | 74,643 | | | | 1.69 | % |
| Everspin Technologies, Inc. (a) | | | 4,442 | | | | 45,708 | | | | 1.04 | % |
| EVERTEC, Inc. (b) | | | 4,485 | | | | 67,275 | | | | 1.52 | % |
| Extreme Networks, Inc. (a) | | | 5,526 | | | | 66,312 | | | | 1.50 | % |
| Fiserv, Inc. (a) | | | 541 | | | | 70,022 | | | | 1.59 | % |
| Fortinet, Inc. (a) | | | 1,885 | | | | 74,288 | | | | 1.68 | % |
| Hackett Group, Inc. | | | 4,549 | | | | 70,237 | | | | 1.59 | % |
| Hewlett Packard Enterprise Co. | | | 4,697 | | | | 65,382 | | | | 1.48 | % |
| Hortonworks, Inc. (a) | | | 4,121 | | | | 68,038 | | | | 1.54 | % |
| Ichor Holdings, Ltd. (a)(b) | | | 2,654 | | | | 82,778 | | | | 1.88 | % |
| International Business Machines Corp. | | | 475 | | | | 73,178 | | | | 1.66 | % |
| Intuit, Inc. | | | 487 | | | | 73,547 | | | | 1.67 | % |
| JA Solar Holdings Company, Ltd. – ADR (a)(b) | | | 9,232 | | | | 68,778 | | | | 1.56 | % |
The accompanying notes are an integral part of these financial statements.
| COMMON STOCKS | | Number | | | | | | % of | |
| | | of Shares | | | Value | | | Net Assets | |
| Information Technology (Continued) | | | | | | | | | |
| Jabil Circuit, Inc. | | | 2,331 | | | $ | 65,921 | | | | 1.49 | % |
| Jack Henry & Associates, Inc. | | | 669 | | | | 73,677 | | | | 1.67 | % |
| JinkoSolar Holding Company Ltd. – ADR (a)(b) | | | 2,755 | | | | 73,366 | | | | 1.66 | % |
| KLA-Tencor Corp. | | | 675 | | | | 73,501 | | | | 1.66 | % |
| LG Display Co., Ltd. – ADR (a)(b) | | | 5,078 | | | | 65,963 | | | | 1.49 | % |
| Manhattan Associates, Inc. (a) | | | 1,526 | | | | 63,878 | | | | 1.45 | % |
| MasterCard, Inc., Class A | | | 489 | | | | 72,748 | | | | 1.65 | % |
| Match Group, Inc. (a) | | | 2,759 | | | | 73,776 | | | | 1.67 | % |
| MercadoLibre, Inc. | | | 264 | | | | 63,442 | | | | 1.44 | % |
| Mimecast Ltd. (a)(b) | | | 2,337 | | | | 74,293 | | | | 1.68 | % |
| Palo Alto Networks, Inc. (a) | | | 483 | | | | 71,098 | | | | 1.61 | % |
| Paychex, Inc. | | | 1,110 | | | | 70,807 | | | | 1.60 | % |
| Paycom Software, Inc. (a) | | | 934 | | | | 76,775 | | | | 1.74 | % |
| Paylocity Holding Corp. (a) | | | 1,401 | | | | 74,827 | | | | 1.69 | % |
| Pegasystems, Inc. | | | 1,180 | | | | 68,794 | | | | 1.56 | % |
| PROS Holdings, Inc. (a) | | | 2,867 | | | | 64,765 | | | | 1.47 | % |
| Red Hat, Inc. (a) | | | 617 | | | | 74,552 | | | | 1.69 | % |
| Rosetta Stone, Inc. (a) | | | 6,802 | | | | 69,176 | | | | 1.57 | % |
| Science Applications International Corp. | | | 1,018 | | | | 74,660 | | | | 1.69 | % |
| Semiconductor Manufacturing International Corp. – ADR (a)(b) | | | 12,525 | | | | 95,065 | | | | 2.15 | % |
| ServiceNow, Inc. (a) | | | 589 | | | | 74,432 | | | | 1.69 | % |
| Shutterstock, Inc. (a) | | | 2,068 | | | | 80,631 | | | | 1.83 | % |
| Synaptics, Inc. (a) | | | 1,817 | | | | 67,447 | | | | 1.53 | % |
| The Ultimate Software Group, Inc. (a) | | | 365 | | | | 73,945 | | | | 1.68 | % |
| The Western Union Co. | | | 3,581 | | | | 71,119 | | | | 1.61 | % |
| Tower Semiconductor Ltd. (a)(b) | | | 2,219 | | | | 73,360 | | | | 1.66 | % |
| Workiva, Inc. (a) | | | 3,160 | | | | 70,626 | | | | 1.60 | % |
| Yirendai Ltd. – ADR (b) | | | 1,564 | | | | 67,862 | | | | 1.54 | % |
| | | | | | | | 4,021,243 | | | | 91.10 | % |
| Total Common Stocks | | | | | | | | | | | | |
| (Cost $3,874,007) | | | | | | | 4,224,068 | | | | 95.69 | % |
The accompanying notes are an integral part of these financial statements.
| HENNESSY FUNDS | 1-800-966-4354 | |
| SHORT-TERM INVESTMENTS – 4.68% | | Number | | | | | | % of | |
| | | of Shares | | | Value | | | Net Assets | |
| Money Market Funds – 4.68% | | | | | | | | | |
| Fidelity Government Portfolio, Institutional Class, 0.92% (c) | | | 206,374 | | | $ | 206,374 | | | | 4.68 | % |
| | | | | | | | | | | | | |
| Total Short-Term Investments | | | | | | | | | | | | |
| (Cost $206,374) | | | | | | | 206,374 | | | | 4.68 | % |
| | | | | | | | | | | | | |
| Total Investments | | | | | | | | | | | | |
| (Cost $4,080,381) – 100.37% | | | | | | | 4,430,442 | | | | 100.37 | % |
| Liabilities in Excess of Other Assets – (0.37)% | | | | | | | (16,345 | ) | | | (0.37 | )% |
TOTAL NET ASSETS – 100.00% | | | | | | $ | 4,414,097 | | | | 100.00 | % |
Percentages are stated as a percent of net assets.
ADR – American Depositary Receipt
| (a) | Non-income producing security. |
| (b) | U.S. traded security of a foreign corporation. |
| (c) | The rate listed is the fund’s 7-day yield as of October 31, 2017. |
Summary of Fair Value Exposure at October 31, 2017
The following is a summary of the inputs used to value the Fund’s net assets as of October 31, 2017 (see Note 3 in the accompanying notes to the financial statements):
| Common Stocks | | Level 1 | | | Level 2 | | | Level 3 | | | Total | |
| Consumer Discretionary | | $ | 202,825 | | | $ | — | | | $ | — | | | $ | 202,825 | |
| Information Technology | | | 4,021,243 | | | | — | | | | — | | | | 4,021,243 | |
| Total Common Stocks | | $ | 4,224,068 | | | $ | — | | | $ | — | | | $ | 4,224,068 | |
| Short-Term Investments | | | | | | | | | | | | | | | | |
| Money Market Funds | | $ | 206,374 | | | $ | — | | | $ | — | | | $ | 206,374 | |
| Total Short-Term Investments | | $ | 206,374 | | | $ | — | | | $ | — | | | $ | 206,374 | |
| Total Investments | | $ | 4,430,442 | | | $ | — | | | $ | — | | | $ | 4,430,442 | |
Transfers between levels are recognized at the end of the reporting period. During the year ended October 31, 2017, the Fund recognized no transfers between levels.
| SCHEDULE OF INVESTMENTS/STATEMENT OF ASSETS AND LIABILITIES |
Financial Statements
Statement of Assets and Liabilities as of October 31, 2017 |
| ASSETS: | | | |
| Investments in securities, at value (cost $4,080,381) | | $ | 4,430,442 | |
| Dividends and interest receivable | | | 1,771 | |
| Receivable for fund shares sold | | | 700 | |
| Prepaid expenses and other assets | | | 15,888 | |
| Due from Advisor | | | 7,262 | |
| Total Assets | | | 4,456,063 | |
| | | | | |
| LIABILITIES: | | | | |
| Payable to administrator | | | 1,050 | |
| Payable to auditor | | | 20,700 | |
| Accrued distribution fees | | | 7,047 | |
| Accrued service fees | | | 271 | |
| Accrued trustees fees | | | 5,579 | |
| Accrued expenses and other payables | | | 7,319 | |
| Total Liabilities | | | 41,966 | |
| NET ASSETS | | $ | 4,414,097 | |
| | | | | |
| NET ASSETS CONSIST OF: | | | | |
| Capital stock | | $ | 3,714,224 | |
| Accumulated net investment loss | | | (22,185 | ) |
| Accumulated net realized gain on investments | | | 371,997 | |
| Unrealized net appreciation on investments | | | 350,061 | |
| Total Net Assets | | $ | 4,414,097 | |
| | | | | |
| NET ASSETS | | | | |
| Investor Class: | | | | |
| Shares authorized (no par value) | | Unlimited | |
| Net assets applicable to outstanding Investor Class shares | | $ | 3,197,581 | |
| Shares issued and outstanding | | | 173,217 | |
| Net asset value, offering price and redemption price per share | | $ | 18.46 | |
| | | | | |
| Institutional Class: | | | | |
| Shares authorized (no par value) | | Unlimited | |
| Net assets applicable to outstanding Institutional Class shares | | $ | 1,216,516 | |
| Shares issued and outstanding | | | 64,539 | |
| Net asset value, offering price and redemption price per share | | $ | 18.85 | |
The accompanying notes are an integral part of these financial statements.
| HENNESSY FUNDS | 1-800-966-4354 | |
Financial Statements
Statement of Operations for the year ended October 31, 2017 |
| INVESTMENT INCOME: | | | |
Dividend income(1) | | $ | 38,240 | |
| Interest income | | | 1,349 | |
| Total investment income | | | 39,589 | |
| | | | | |
| EXPENSES: | | | | |
| Investment advisory fees (See Note 5) | | | 31,408 | |
| Federal and state registration fees | | | 30,927 | |
| Compliance expense (See Note 5) | | | 28,705 | |
| Audit fees | | | 20,699 | |
| Trustees’ fees and expenses | | | 16,042 | |
| Reports to shareholders | | | 8,054 | |
| Sub-transfer agent expenses – Investor Class (See Note 5) | | | 5,090 | |
| Legal fees | | | 5,067 | |
| Distribution fees – Investor Class (See Note 5) | | | 4,373 | |
| Administration, fund accounting, custody and transfer agent fees (See Note 5) | | | 3,796 | |
| Service fees – Investor Class (See Note 5) | | | 2,915 | |
| Interest expense (See Note 7) | | | 8 | |
| Other expenses | | | 3,776 | |
| Total expenses before reimbursement by advisor | | | 160,860 | |
| Expense reimbursement by advisor – Investor Class (See Note 5) | | | (58,612 | ) |
| Expense reimbursement by advisor – Institutional Class (See Note 5) | | | (20,906 | ) |
| Net expenses | | | 81,342 | |
| NET INVESTMENT LOSS | | $ | (41,753 | ) |
| | | | | |
| REALIZED AND UNREALIZED GAINS: | | | | |
| Net realized gain on investments | | $ | 632,539 | |
| Net change in unrealized appreciation on investments | | | 31,853 | |
| Net gain on investments | | | 664,392 | |
| NET INCREASE IN NET ASSETS RESULTING FROM OPERATIONS | | $ | 622,639 | |
(1) Net of foreign taxes withheld and issuance fees of $2,345.
The accompanying notes are an integral part of these financial statements.
| STATEMENT OF OPERATIONS/STATEMENTS OF CHANGES IN NET ASSETS |
Financial Statements
| Statements of Changes in Net Assets |
| | | Year Ended | | | Year Ended | |
| | | October 31, 2017 | | | October 31, 2016 | |
| OPERATIONS: | | | | | | |
| Net investment loss | | $ | (41,753 | ) | | $ | (125,047 | ) |
| Net realized gain on investments | | | 632,539 | | | | 182,075 | |
| Net change in unrealized appreciation on investments | | | 31,853 | | | | 41,566 | |
| Net increase in net assets resulting from operations | | | 622,639 | | | | 98,594 | |
| | | | | | | | | |
| CAPITAL SHARE TRANSACTIONS: | | | | | | | | |
| Proceeds from shares subscribed – Investor Class | | | 422,345 | | | | 247,599 | |
| Proceeds from shares subscribed – Institutional Class | | | 218,028 | | | | 40,176 | |
| Cost of shares redeemed – Investor Class | | | (587,405 | ) | | | (1,442,265 | ) |
| Cost of shares redeemed – Institutional Class | | | (74,362 | ) | | | (117,763 | ) |
| Net decrease in net assets derived | | | | | | | | |
| from capital share transactions | | | (21,394 | ) | | | (1,272,253 | ) |
| TOTAL INCREASE (DECREASE) IN NET ASSETS | | | 601,245 | | | | (1,173,659 | ) |
| | | | | | | | | |
| NET ASSETS: | | | | | | | | |
| Beginning of year | | | 3,812,852 | | | | 4,986,511 | |
| End of year | | $ | 4,414,097 | | | $ | 3,812,852 | |
| Undistributed net investment loss, end of year | | $ | (22,185 | ) | | $ | (104,428 | ) |
| | | | | | | | | |
| CHANGES IN SHARES OUTSTANDING: | | | | | | | | |
| Shares sold – Investor Class | | | 24,507 | | | | 16,968 | |
| Shares sold – Institutional Class | | | 12,743 | | | | 2,730 | |
| Shares redeemed – Investor Class | | | (35,133 | ) | | | (95,956 | ) |
| Shares redeemed – Institutional Class | | | (4,356 | ) | | | (7,566 | ) |
| Net decrease in shares outstanding | | | (2,239 | ) | | | (83,824 | ) |
The accompanying notes are an integral part of these financial statements.
| HENNESSY FUNDS | 1-800-966-4354 | |
Financial Statements
For an Investor Class share outstanding throughout each year
PER SHARE DATA:
Net asset value, beginning of year
Income from investment operations:
Net investment loss
Net realized and unrealized gains on investments
Total from investment operations
Net asset value, end of year
TOTAL RETURN
SUPPLEMENTAL DATA AND RATIOS:
Net assets, end of year (millions)
Ratio of expenses to average net assets:
Before expense reimbursement
After expense reimbursement
Ratio of net investment income to average net assets:
Before expense reimbursement
After expense reimbursement
Portfolio turnover rate(2)
(1) | The Fund’s current expense limitation agreement, which became effective on February 28, 2017, was in effect for eight months of the year ended October 31, 2017. The Fund previously had an expense limitation agreement in effect from October 26, 2012, to February 28, 2015. |
(2) | Portfolio turnover is calculated on the basis of the Fund as a whole. |
The accompanying notes are an integral part of these financial statements.
| FINANCIAL HIGHLIGHTS — INVESTOR CLASS |
| Year Ended October 31, | | |
| 2017 | | | 2016 | | | 2015 | | | 2014 | | | 2013 | | |
| | | | | | | | | | | | | | | |
| $ | 15.82 | | | $ | 15.36 | | | $ | 14.86 | | | $ | 13.57 | | | $ | 10.67 | | |
| | | | | | | | | | | | | | | | | | | | |
| | | | | | | | | | | | | | | | | | | | |
| | (0.23 | ) | | | (0.68 | ) | | | (0.38 | ) | | | (0.23 | ) | | | (0.20 | ) | |
| | 2.87 | | | | 1.14 | | | | 0.88 | | | | 1.52 | | | | 3.10 | | |
| | 2.64 | | | | 0.46 | | | | 0.50 | | | | 1.29 | | | | 2.90 | | |
| $ | 18.46 | | | $ | 15.82 | | | $ | 15.36 | | | $ | 14.86 | | | $ | 13.57 | | |
| | | | | | | | | | | | | | | | | | | | |
| | 16.69 | % | | | 2.99 | % | | | 3.36 | % | | | 9.51 | % | | | 27.18 | % | |
| | | | | | | | | | | | | | | | | | | | |
| | | | | | | | | | | | | | | | | | | | |
| $ | 3.20 | | | $ | 2.91 | | | $ | 4.04 | | | $ | 4.99 | | | $ | 4.49 | | |
| | | | | | | | | | | | | | | | | | | | |
| | 4.16 | % | | | 3.61 | % | | | 3.13 | % | | | 2.92 | % | | | 3.04 | % | |
| | 2.15 | %(1) | | | 3.61 | % | | | 2.75 | % | | | 1.95 | % | | | 1.95 | % | |
| | | | | | | | | | | | | | | | | | | | |
| | (3.16 | )% | | | (2.92 | )% | | | (2.30 | )% | | | (2.53 | )% | | | (2.36 | )% | |
| | (1.15 | )%(1) | | | (2.92 | )% | | | (1.92 | )% | | | (1.55 | )% | | | (1.27 | )% | |
| | 267 | % | | | 80 | % | | | 163 | % | | | 204 | % | | | 164 | % | |
The accompanying notes are an integral part of these financial statements.
| HENNESSY FUNDS | 1-800-966-4354 | |
Financial Statements
For an Institutional Class share outstanding throughout each year
PER SHARE DATA:
Net asset value, beginning of year
Income from investment operations:
Net investment loss
Net realized and unrealized gains on investments
Total from investment operations
Net asset value, end of year
TOTAL RETURN
SUPPLEMENTAL DATA AND RATIOS:
Net assets, end of year (millions)
Ratio of expenses to average net assets:
Before expense reimbursement
After expense reimbursement
Ratio of net investment income to average net assets:
Before expense reimbursement
After expense reimbursement
Portfolio turnover rate(2)
(1) | The Fund’s current expense limitation agreement, which became effective on February 28, 2017, was in effect for eight months of the year ended October 31, 2017. The Fund previously had an expense limitation agreement in effect from October 26, 2012, to February 28, 2015. |
(2) | Portfolio turnover is calculated on the basis of the Fund as a whole. |
The accompanying notes are an integral part of these financial statements.
| FINANCIAL HIGHLIGHTS — INSTITUTIONAL CLASS |
| Year Ended October 31, | | |
| 2017 | | | 2016 | | | 2015 | | | 2014 | | | 2013 | | |
| | | | | | | | | | | | | | | |
| $ | 16.11 | | | $ | 15.58 | | | $ | 15.02 | | | $ | 13.68 | | | $ | 10.73 | | |
| | | | | | | | | | | | | | | | | | | | |
| | | | | | | | | | | | | | | | | | | | |
| | (0.12 | ) | | | (0.43 | ) | | | (0.25 | ) | | | (0.26 | ) | | | (0.12 | ) | |
| | 2.86 | | | | 0.96 | | | | 0.81 | | | | 1.60 | | | | 3.07 | | |
| | 2.74 | | | | 0.53 | | | | 0.56 | | | | 1.34 | | | | 2.95 | | |
| $ | 18.85 | | | $ | 16.11 | | | $ | 15.58 | | | $ | 15.02 | | | $ | 13.68 | | |
| | | | | | | | | | | | | | | | | | | | |
| | 17.01 | % | | | 3.40 | % | | | 3.73 | % | | | 9.80 | % | | | 27.49 | % | |
| | | | | | | | | | | | | | | | | | | | |
| | | | | | | | | | | | | | | | | | | | |
| $ | 1.22 | | | $ | 0.90 | | | $ | 0.95 | | | $ | 0.93 | | | $ | 1.19 | | |
| | | | | | | | | | | | | | | | | | | | |
| | 3.74 | % | | | 3.28 | % | | | 2.76 | % | | | 2.60 | % | | | 2.76 | % | |
| | 1.77 | %(1) | | | 3.28 | % | | | 2.44 | % | | | 1.70 | % | | | 1.70 | % | |
| | | | | | | | | | | | | | | | | | | | |
| | (2.74 | )% | | | (2.59 | )% | | | (1.92 | )% | | | (2.23 | )% | | | (2.10 | )% | |
| | (0.77 | )%(1) | | | (2.59 | )% | | | (1.60 | )% | | | (1.33 | )% | | | (1.04 | )% | |
| | 267 | % | | | 80 | % | | | 163 | % | | | 204 | % | | | 164 | % | |
The accompanying notes are an integral part of these financial statements.
| HENNESSY FUNDS | 1-800-966-4354 | |
Financial Statements
Notes to the Financial Statements October 31, 2017 |
1). ORGANIZATION
The Hennessy Technology Fund (the “Fund”) is a series of Hennessy Funds Trust (the “Trust”), which was organized as a Delaware statutory trust on September 17, 1992. The Fund is an open-end management investment company registered under the Investment Company Act of 1940, as amended. The investment objective of the Fund is long-term capital appreciation. The Fund is a non-diversified fund.
The Fund offers Investor Class and Institutional Class shares. Each class of shares differs principally in its respective 12b-1 distribution and service, shareholder servicing, and sub-transfer agent expenses. There are no sales charges. Each class has identical rights to earnings, assets, and voting privileges, except for class-specific expenses and exclusive rights to vote on matters affecting only an individual class.
As an investment company, the Fund follows the investment company accounting and reporting guidance of the Financial Accounting Standards Board (“FASB”) Accounting Standard Codification Topic 946 “Financial Services—Investment Companies.”
2). SIGNIFICANT ACCOUNTING POLICIES
The following is a summary of significant accounting policies consistently followed by the Fund in the preparation of the financial statements. These policies conform to U.S. generally accepted accounting principles (“GAAP”).
| a). | Investment Valuation – All investments in securities are recorded at their estimated fair value, as described in Note 3. |
| | |
| b). | Federal Income Taxes – No provision for federal income taxes or excise taxes has been made because the Fund has elected to be taxed as a “regulated investment company” and intends to distribute substantially all of its taxable income to its shareholders and otherwise comply with the provisions of the Internal Revenue Code of 1986, as amended, applicable to regulated investment companies. Net investment income/loss and realized gains/losses for federal income tax purposes may differ from those reported in the financial statements because of temporary book and tax basis differences. Temporary differences are primarily the result of the treatment of wash sales for tax reporting purposes. The Fund recognizes interest and penalties related to income tax benefits, if any, in the Statement of Operations as an income tax expense. Distributions from net realized gains for book purposes may include short-term capital gains, which are included as ordinary income to shareholders for tax purposes. The Fund may utilize equalization accounting for tax purposes and designate earnings and profits, including net realized gains distributed to shareholders on redemption of shares, as part of the dividends paid deduction for income tax purposes. |
| | |
| | Due to inherent differences in the recognition of income, expenses, and realized gains/losses under GAAP and federal income tax regulations, permanent differences between book and tax basis for reporting for fiscal year 2017 have been identified and appropriately reclassified in the Statement of Assets and Liabilities. The adjustments are as follows: |
| | Accumulated | Accumulated | | |
| | Net Investment | Net Realized | | |
| | Loss | Gain on Investments | Capital Stock | |
| | $123,996 | $(142,634) | $18,638 | |
| NOTES TO THE FINANCIAL STATEMENTS |
| c). | Accounting for Uncertainty in Income Taxes – The Fund has accounting policies regarding recognition and measurement of tax positions taken or expected to be taken on a tax return. The tax returns of the Fund for the prior three fiscal years are open for examination. The Fund has reviewed all open tax years in major jurisdictions and concluded that there is no impact on the Fund’s net assets and no tax liability resulting from unrecognized tax benefits relating to uncertain income tax positions taken or expected to be taken on a tax return. The Fund’s major tax jurisdictions are U.S. federal and Delaware. |
| | |
| d). | Income and Expenses – Dividend income is recognized on the ex-dividend date or as soon as information is available to the Fund. Interest income, which includes the amortization of premium and accretion of discount, is recognized on an accrual basis. The Fund is charged for those expenses that are directly attributable to the portfolio, such as advisory, administration, and certain shareholder service fees. Income, expenses (other than expenses attributable to a specific class), and realized and unrealized gains/losses on investments are allocated to each class of shares based on such class’s net assets. |
| | |
| e). | Distributions to Shareholders – Dividends from net investment income for the Fund, if any, are declared and paid annually, usually in December. Distributions of net realized capital gains, if any, are declared and paid annually, usually in December. |
| f). | Security Transactions – Investment and shareholder transactions are recorded on the trade date. The Fund determines the realized gain/loss from an investment transaction by comparing the original cost of the security lot sold with the net sale proceeds. Discounts and premiums on securities purchased are accreted/amortized over the life of the respective security. |
| | |
| g). | Use of Estimates – The preparation of financial statements in conformity with GAAP requires management to make estimates and assumptions that affect the reported amounts of assets and liabilities and disclosure of contingent assets and liabilities at the date of the financial statements and the reported change in net assets during the reporting period. Actual results could differ from those estimates. |
| | |
| h). | Share Valuation – The net asset value (“NAV”) per share of the Fund is calculated by dividing (i) the sum of the value of the securities held by the Fund, plus cash or other assets, minus all liabilities (including estimated accrued expenses) by (ii) the total number of shares outstanding for the Fund, rounded to the nearest cent. The Fund’s shares will not be priced on days the New York Stock Exchange is closed for trading. The offering and redemption price per share for the Fund is equal to the Fund’s NAV per share. |
3). SECURITIES VALUATION
The Fund follows authoritative fair valuation accounting standards that establish an authoritative definition of fair value and set out a hierarchy for measuring fair value. These standards require additional disclosures about the various inputs and valuation techniques used to develop the measurements of fair value and a discussion of changes in valuation techniques and related inputs during the period. These inputs are summarized in the three broad levels listed below:
| | Level 1 – | Unadjusted, quoted prices in active markets for identical instruments that the Fund has the ability to access at the date of measurement. |
| | | |
| | Level 2 – | Other significant observable inputs (including, but not limited to, quoted prices in active markets for similar instruments, quoted prices in markets that are not active for identical or similar instruments, and model-derived valuations in which all significant inputs and significant value drivers are |
| HENNESSY FUNDS | 1-800-966-4354 | |
| | | observable in active markets, such as interest rates, prepayment speeds, credit risk curves, default rates, and similar data). |
| | | |
| | Level 3 – | Significant unobservable inputs (including the Fund’s own assumptions about what market participants would use to price the asset or liability based on the best available information) when observable inputs are unavailable. |
Following is a description of the valuation techniques applied to the Fund’s major categories of assets and liabilities measured at fair value on a recurring basis.
| | Equity Securities – Equity securities, including common stocks, preferred stocks, foreign-issued common stocks, exchange-traded funds, closed-end mutual funds, partnerships, rights, and real estate investment trusts, that are traded on a securities exchange for which a last-quoted sales price is readily available will generally be valued at the last sales price as reported by the primary exchange on which the securities are listed. Securities listed on The NASDAQ Stock Market (“NASDAQ”) will generally be valued at the NASDAQ Official Closing Price, which may differ from the last sales price reported. Securities traded on a securities exchange for which a last-quoted sales price is not readily available will generally be valued at the mean between the bid and ask prices. To the extent these securities are actively traded and valuation adjustments are not applied, they are classified in Level 1 of the fair value hierarchy. Securities traded on foreign exchanges generally are not valued at the same time the Fund calculates its NAV because most foreign markets close well before such time. The earlier close of most foreign markets gives rise to the possibility that significant events, including broad market moves, may have occurred in the interim. In certain circumstances, it may be determined that a security needs to be fair valued because it appears that the value of the security might have been materially affected by events occurring after the close of the market in which the security is principally traded, but before the time the Fund calculates its NAV, such as by a development that affects an entire market or region (e.g., weather-related events) or a potentially global development (e.g., a terrorist attack that may be expected to have an effect on investor expectations worldwide). |
| | |
| | Registered Investment Companies – Investments in registered investment companies (e.g., mutual funds) are generally priced at the ending NAV provided by the applicable registered investment company’s service agent and will be classified in Level 1 of the fair value hierarchy. |
| | |
| | Debt Securities – Debt securities, including corporate bonds, asset-backed securities, mortgage-backed securities, municipal bonds, U.S. Treasuries, and U.S. government agency issues, are generally valued at market on the basis of valuations furnished by an independent pricing service that utilizes both dealer-supplied valuations and formula-based techniques. The pricing service may consider recently executed transactions in securities of the issuer or comparable issuers, market price quotations (where observable), bond spreads, and fundamental data relating to the issuer. In addition, the model may incorporate observable market data, such as reported sales of similar securities, broker quotes, yields, bids, offers, and reference data. Certain securities are valued primarily using dealer quotations. These securities are generally classified in Level 2 of the fair value hierarchy. |
| | |
| | Short-Term Securities – Short-term equity investments, including money market funds, are valued in the manner specified above. Short-term debt investments with an original term to maturity of 60 days or less are valued at amortized cost, which approximates fair market value. If the original term to maturity of a short-term debt investment exceeded 60 days, then the values as of the 61st day prior to maturity are amortized. Amortized cost is not used if its use would be inappropriate due to credit |
| NOTES TO THE FINANCIAL STATEMENTS |
| | or other impairments of the issuer, in which case the security’s fair value would be determined, as described below. Short-term securities are generally classified in Level 1 or Level 2 of the fair market hierarchy depending on the inputs used and market activity levels for specific securities. |
The Board of Trustees of the Fund (the “Board”) has adopted fair value pricing procedures that are followed when a price for a security is not readily available or if a significant event has occurred that indicates the closing price of a security no longer represents the true value of that security. Fair value pricing determinations are made in good faith in accordance with these procedures. There are numerous criteria that will be given consideration in determining a fair value of a security, such as the trading volume of a security and markets, the values of other similar securities, and news events with direct bearing on a security or markets. Fair value pricing results in an estimated price for a security that reflects the amount the Fund might reasonably expect to receive in a current sale. Depending on the relative significance of the valuation inputs, these securities may be classified in either Level 2 or Level 3 of the fair value hierarchy.
The fair valuation of foreign securities may be determined with the assistance of a pricing service using correlations between the movement of prices of such securities and indices of domestic securities and other appropriate indicators, such as closing market prices of relevant American Depositary Receipts or futures contracts. The effect of using fair value pricing is that the Fund’s NAV will reflect the affected portfolio securities’ values as determined by the Board or its designee instead of being determined by the market. Using a fair value pricing methodology to price a foreign security may result in a value that is different from the foreign security’s most recent closing price and from the prices used by other investment companies to calculate their NAVs and are generally classified in Level 2 of the fair valuation hierarchy. Because the Fund may invest in foreign securities, the value of the Fund’s portfolio securities may change on days when you will not be able to purchase or redeem your shares.
The Board has delegated day-to-day valuation matters to a Valuation Committee comprised of one or more representatives from Hennessy Advisors, Inc., the Fund’s investment advisor (the “Advisor”). The function of the Valuation Committee is to value securities where current and reliable market quotations are not readily available. All actions taken by the Valuation Committee are reviewed by the Board.
The Fund has performed an analysis of all existing investments to determine the significance and character of all inputs to their fair value determination. Various inputs are used to determine the value of the Fund’s investments. The inputs or methodology used for valuing securities are not necessarily an indication of the risk associated with investing in those securities. Details related to the fair valuation hierarchy of the Fund’s securities as of October 31, 2017, are included in the Schedule of Investments.
4). INVESTMENT TRANSACTIONS
Purchases and sales of investment securities (excluding government and short-term investments) for the Fund during fiscal year 2017 were $10,067,071 and $10,129,377, respectively.
There were no purchases or sales/maturities of long-term U.S. government securities for the Fund during fiscal year 2017.
The Fund is permitted to purchase or sell securities from or to another fund in the Hennessy Funds family of funds (the “Hennessy Funds”) under specified conditions outlined in procedures adopted by the Board. The procedures have been designed to ensure that any purchase or sale of securities by the Fund from or to another Hennessy Fund complies with Rule 17a-7 of the Investment Company Act of 1940, as amended.
| HENNESSY FUNDS | 1-800-966-4354 | |
For fiscal year 2017, the Fund did not engage in purchases or sales of securities pursuant to Rule 17a-7 of the Investment Company Act of 1940, as amended.
5). INVESTMENT MANAGEMENT FEE AND OTHER TRANSACTIONS WITH AFFILIATES
The Advisor provides the Fund with investment management services under an Investment Advisory Agreement. The Advisor provides all investment advice, office space, and facilities, as well as most of the personnel needed by the Fund. As compensation for its services, the Advisor is entitled to a monthly fee from the Fund. The fee is based upon the average daily net assets of the Fund at an annual rate of 0.74%, effective as of February 28, 2017. Prior to that date, including in fiscal year 2017 during the period from November 1, 2016, to February 28, 2017, the annual rate was 0.90%. The net investment advisory fees expensed by the Fund during fiscal year 2017 are included in the Statement of Operations.
The Advisor has contractually agreed to limit total annual operating expenses to 0.98% of the Fund’s net assets for both Investor Class shares and Institutional Class shares (excluding all federal, state, and local taxes, interest, brokerage commissions, 12b-1 fees, shareholder servicing fees payable to the Advisor, acquired fund fees and expenses and other costs incurred in connection with the purchase and sale of securities, and extraordinary items) through February 28, 2018. In addition, in the past, the Advisor had contractually agreed to limit the total annual operating expenses to 1.95% and 1.70% of the Fund’s net assets for Investor Class shares and Institutional Class shares, respectively (excluding interest, taxes, brokerage commissions, dividend expenses, acquired fund fees and expenses, extraordinary legal expenses, any other extraordinary expenses, and, from and after November 1, 2014, 12b-1 fees). This prior expense limitation agreement for the Fund expired as of February 28, 2015.
For a period of three years after the year in which the Advisor waived or reimbursed expenses, the Advisor may seek reimbursement from the Fund to the extent that total annual fund operating expenses are less than the expense limitation that was in effect at the time the Advisor waived or reimbursed expenses. As of October 31, 2017, cumulative expenses subject to potential recovery under the aforementioned conditions and year of expiration were as follows:
| | | October 31, | | | October 31, | | | | |
| | | 2018 | | | 2020 | | | Total | |
| Investor Class | | $ | 16,551 | | | $ | 58,612 | | | $ | 75,163 | |
| Institutional Class | | $ | 3,036 | | | $ | 20,906 | | | $ | 23,942 | |
The Board has approved a Shareholder Servicing Agreement for Investor Class shares of the Fund, which was instituted to compensate the Advisor for the non-investment management services it provides to the Fund. The Shareholder Servicing Agreement provides for a monthly fee paid to the Advisor at an annual rate of 0.10% of the average daily net assets of the Fund attributable to Investor Class shares. The shareholder service fees expensed by the Fund during fiscal year 2017 are included in the Statement of Operations.
The Fund has adopted a plan pursuant to Rule 12b-1 under the Investment Company Act of 1940, as amended, that authorizes payments in connection with the distribution of the Fund’s shares at an annual rate of up to 0.25% of the Fund’s average daily net assets attributable to Investor Class shares. Even though the authorized rate is up to 0.25%, the Fund is currently only using up to 0.15% of its average daily net assets attributable to Investor Class shares for such purpose. Amounts paid under the plan may be spent on any activities or expenses primarily intended to result in the sale of shares, including, but not limited to, advertising, shareholder account servicing, the printing and mailing of prospectuses to other than current shareholders, the printing and mailing of
| NOTES TO THE FINANCIAL STATEMENTS |
sales literature, and compensation for sales and marketing activities or to financial institutions and others, such as dealers and distributors. The distribution fees expensed by the Fund during fiscal year 2017 are included in the Statement of Operations.
The Fund has entered into agreements with various brokers, dealers, and financial intermediaries in connection with the sale of shares of the Fund. The agreements provide for periodic payments by the Fund to the brokers, dealers, and financial intermediaries for providing certain shareholder maintenance services (sub-transfer agent expenses). These shareholder services include the pre-processing and quality control of new accounts, shareholder correspondence, answering customer inquiries regarding account status, and facilitating shareholder telephone transactions. The sub-transfer agent fees expensed by the Fund during fiscal year 2017 are included in the Statement of Operations.
U.S. Bancorp Fund Services, LLC (“USBFS”) provides the Fund with administrative, fund accounting, and transfer agent services and necessary office equipment. As administrator, USBFS is responsible for activities such as (i) preparing various federal and state regulatory filings, reports, and returns for the Fund, (ii) preparing reports and materials to be supplied to the Board, (iii) monitoring the activities of the Fund’s custodian, transfer agent, and accountants, and (iv) coordinating the preparation and payment of the Fund’s expenses and reviewing the Fund’s expense accruals. U.S. Bank, N.A., an affiliate of USBFS, serves as the Fund’s custodian. The servicing agreements between the Trust, USBFS, and U.S. Bank N.A. contain a fee schedule that is inclusive of administrative, fund accounting, custody, and transfer agent fees. The administrative, fund accounting, custody, and transfer agent fees expensed by the Fund during fiscal year 2017 are included in the Statement of Operations.
Quasar Distributors, LLC acts as the Fund’s principal underwriter in a continuous public offering of the Fund’s shares. Quasar Distributors, LLC is an affiliate of USBFS and U.S. Bank, N.A.
The officers of the Fund are affiliated with the Advisor. Such officers, with the exception of the Chief Compliance Officer and the Senior Compliance Officer, receive no compensation from the Fund for serving in their respective roles. The Fund, along with the other Hennessy Funds, makes reimbursement payments, on an equal basis, to the Advisor for a portion of the salary and benefits associated with the office of the Chief Compliance Officer and for all of the salary and benefits associated with the office of the Senior Compliance Officer. The compliance fees expensed by the Fund during fiscal year 2017 are included in the Statement of Operations.
6). GUARANTEES AND INDEMNIFICATIONS
Under the Hennessy Funds’ organizational documents, their officers and trustees are indemnified by the Hennessy Funds against certain liabilities arising out of the performance of their duties to the Hennessy Funds. Additionally, in the normal course of business, the Hennessy Funds enter into contracts with service providers that contain general indemnification clauses. The Fund’s maximum exposure under these arrangements is unknown as this would involve future claims that may be made against the Fund that have not yet occurred. Currently, the Fund expects the risk of loss to be remote.
7). LINE OF CREDIT
The Fund has an uncommitted line of credit with the other Hennessy Funds in the amount of the lesser of (i) $100,000,000 or (ii) 33.33% of each Hennessy Fund’s net assets, or 30% for the Hennessy Gas Utility Fund and 10% for the Hennessy Balanced Fund, intended to provide short-term financing, if necessary, subject to certain restrictions, in connection with shareholder redemptions. The credit facility is with the Hennessy Funds’ custodian
| HENNESSY FUNDS | 1-800-966-4354 | |
bank, U.S. Bank, N.A. Borrowings under this arrangement bear interest at the bank’s prime rate and are secured by all of the Fund’s assets (as to its own borrowings only). During fiscal year 2017, the Fund had an outstanding average daily balance and a weighted average interest rate of $219 and 3.97%, respectively. The interest expensed by the Fund during fiscal year 2017 is included in the Statement of Operations. The maximum amount outstanding for the Fund during the period was $80,000. At October 31, 2017, the Fund did not have any borrowings outstanding under the line of credit.
8). FEDERAL TAX INFORMATION
As of October 31, 2017, the components of accumulated earnings (losses) for income tax purposes were as follows:
| | | Investments | |
| Cost of investments for tax purposes | | $ | 4,099,812 | |
| Gross tax unrealized appreciation | | $ | 533,548 | |
| Gross tax unrealized depreciation | | | (202,918 | ) |
| Net tax unrealized appreciation | | $ | 330,630 | |
| Undistributed ordinary income | | $ | — | |
| Undistributed long-term capital gains | | | 391,428 | |
| Total distributable earnings | | $ | 391,428 | |
| Other accumulated loss | | $ | (22,185 | ) |
| Total accumulated gain | | $ | 699,873 | |
The difference between book-basis unrealized appreciation/depreciation (as shown in the Statement of Assets and Liabilities) and tax-basis unrealized appreciation/depreciation (as shown above) is attributable primarily to wash sales.
At October 31, 2017, the Fund had no tax basis capital losses to offset future capital gains.
During fiscal year 2017, the capital losses utilized for the Fund were $64,213.
Capital losses sustained in fiscal year 2012 and in future taxable years will not expire and may be carried over by the Fund without limitation; however, they will retain the character of the original loss. Furthermore, any loss incurred during those taxable years will be required to be utilized prior to the losses incurred in taxable years prior to 2012. As a result of this ordering rule, pre-enactment capital loss carryforwards may be more likely to expire unused. Under pre-enactment law, capital losses could be carried forward for eight years, and carried forward as short-term capital losses, irrespective of the character of the original loss.
At October 31, 2017, the Fund deferred, on a tax basis, a late-year ordinary loss of $22,185. Late-year ordinary losses are net ordinary losses incurred after December 31, 2016, but within the taxable year, that are deemed to arise on the first day of the Fund’s next taxable year.
During fiscal years 2017 and 2016, the Fund did not pay any distributions.
9). EVENTS SUBSEQUENT TO YEAR END
Management has evaluated the Fund’s related events and transactions that occurred subsequent to October 31, 2017, through the date of issuance of the Fund’s financial statements. Other than as disclosed below, management has determined that there were no subsequent events requiring recognition or disclosure in the financial statements.
On December 7, 2017, capital gains were declared and paid to shareholders of record on December 6, 2017, as follows:
| | | Long-term |
| | Investor Class | $1.63413 |
| | Institutional Class | $1.66909 |
| NOTES/REPORT OF INDEPENDENT REGISTERED PUBLIC ACCOUNTING FIRM |
Report of Independent Registered Public
Accounting Firm
To the Board of Trustees of Hennessy Funds Trust
and the Shareholders of the Hennessy Technology Fund
Novato, CA
We have audited the accompanying statement of assets and liabilities, including the schedule of investments, of the Hennessy Technology Fund (the “Fund”), a series of Hennessy Funds Trust (the “Trust”) as of October 31, 2017, and the related statement of operations for the year then ended, the statements of changes in net assets for each of the two years in the period then ended, and the financial highlights for each of the five years in the period then ended. These financial statements and financial highlights are the responsibility of the Fund’s management. Our responsibility is to express an opinion on these financial statements and financial highlights based on our audits.
We conducted our audits in accordance with the standards of the Public Company Accounting Oversight Board (United States). Those standards require that we plan and perform the audits to obtain reasonable assurance about whether the financial statements and financial highlights are free of material misstatement. The Fund is not required to have, nor were we engaged to perform, an audit of its internal control over financial reporting. Our audits included consideration of internal control over financial reporting as a basis for designing audit procedures that are appropriate in the circumstances, but not for the purposes of expressing an opinion on the effectiveness of the Fund’s internal control over financial reporting. Accordingly, we express no such opinion. An audit includes examining, on a test basis, evidence supporting the amounts and disclosures in the financial statements. Our procedures included confirmation of securities owned as of October 31, 2017, by correspondence with the custodian. An audit also includes assessing the accounting principles used and significant estimates made by management, as well as evaluating the overall financial statement presentation. We believe that our audits provide a reasonable basis for our opinion.
In our opinion, the financial statements and financial highlights referred to above present fairly, in all material respects, the financial position of the Hennessy Technology Fund as of October 31, 2017, the results of its operations for the year then ended, the changes in its net assets for each of the two years in the period then ended, and the financial highlights for each of the five years in the period then ended, in conformity with accounting principles generally accepted in the United States of America.
TAIT, WELLER & BAKER LLP
Philadelphia, Pennsylvania
December 22, 2017
| HENNESSY FUNDS | 1-800-966-4354 | |
Trustees and Officers of the Fund (Unaudited)
The business and affairs of the Funds are managed under the direction of the Board of Trustees of the Trust, and the Board of Trustees elects the Officers of the Trust. Beginning in March 2015, the Board of Trustees has from time to time appointed advisers to the Board of Trustees (“Advisers”), with the intention of having qualified individuals serve in an advisory capacity in order to garner experience in the mutual fund and asset management industry and be considered as potential Trustees in the future. There are currently three Advisers to the Board of Trustees: Brian Alexander, Doug Franklin, and Claire Knoles. As Advisers, Mr. Alexander, Mr. Franklin, and Ms. Knoles attend meetings of the Board and act as non-voting participants. Information pertaining to the Trustees, Advisers, and the Officers of the Trust is set forth below. The Trustees and Officers serve until their successors are duly elected and qualified or until their earlier death, resignation, or removal. Each of the Trustees oversees 14 Hennessy Funds. Unless otherwise indicated, the address of all persons listed below is 7250 Redwood Boulevard, Suite 200, Novato, CA 94945. The Fund’s Statement of Additional Information includes more information about the persons listed below and is available, without charge, upon request by calling 1-800-966-4354.
| | | | Other |
| | | | Directorships |
| | | | Held Outside |
| Name, (Year of Birth), | | | of Fund |
| and Position Held | Start Date | Principal Occupation(s) | Complex During |
with the Trust | of Service | During Past Five Years | Past Five Years(1) |
| | | |
| Disinterested Trustees and Advisers | | |
| | | | |
| J. Dennis DeSousa | January 1996 | Mr. DeSousa is a real estate investor. | None. |
| (1936) | | | |
| Trustee | | | |
| | | | |
| Robert T. Doyle | January 1996 | Mr. Doyle has been the Sheriff of | None. |
| (1947) | | Marin County, California since 1996. | |
| Trustee | | | |
| | | | |
| Gerald P. Richardson | May 2004 | Mr. Richardson is an independent | None. |
| (1945) | | consultant in the securities industry. | |
| Trustee | | | |
| | | | |
| Brian Alexander | March 2015 | Mr. Alexander has been employed | None. |
| (1981) | | by Sutter Health Novato Community | |
| Adviser to the Board | | Hospital since 2012, first as an | |
| | | Assistant Administrator and then, | |
| | | beginning in 2013, as the Chief | |
| | | Administrative Officer. From 2011 | |
| | | through 2012, Mr. Alexander was | |
| | | employed by Sutter Health West Bay | |
| | | Region as the Regional Director of | |
| | | Strategic Decision Support. | |
| TRUSTEES AND OFFICERS OF THE FUND |
| | | | Other |
| | | | Directorships |
| | | | Held Outside |
| Name, (Year of Birth), | | | of Fund |
| and Position Held | Start Date | Principal Occupation(s) | Complex During |
with the Trust | of Service | During Past Five Years | Past Five Years(1) |
| | | | |
| Doug Franklin | March 2016 | Mr. Franklin is a retired insurance | None. |
| (1964) | | industry executive. From 1987 | |
| Adviser to the Board | | through 2015, he was employed | |
| | | by Allianz-Fireman’s Fund Insurance | |
| | | Company in various positions, | |
| | | including Chief Actuary and | |
| | | Chief Risk Officer. | |
| | | | |
| Claire Knoles | December 2015 | Ms. Knoles is a founder of Kiosk and | None. |
| (1974) | | has served as its Chief Operating | |
| Adviser to the Board | | Officer since 2004. Kiosk is a full | |
| | | service marketing agency with | |
| | | offices in the San Francisco Bay | |
| | | Area, Toronto, and Liverpool, UK. | |
Interested Trustee(2) | | | |
| | | | |
| Neil J. Hennessy | January 1996 as | Mr. Hennessy has been employed by | Hennessy |
| (1956) | a Trustee and | Hennessy Advisors, Inc. since 1989 | Advisors, Inc. |
| Trustee, Chairman of | June 2008 as | and currently serves as its President, | |
| the Board, Chief | an Officer | Chairman and Chief Executive Officer. | |
| Investment Officer, | | | |
| Portfolio Manager, | | | |
| and President | | | |
| Name, (Year of Birth), | | |
| and Position Held | Start Date | Principal Occupation(s) |
with the Trust | of Service | During Past Five Years |
| | | |
| Officers | | |
| | | |
| Teresa M. Nilsen | January 1996 | Ms. Nilsen has been employed by Hennessy Advisors, Inc. |
| (1966) | | since 1989 and currently serves as its Executive Vice President, |
| Executive Vice President | | Chief Operations Officer, Chief Financial Officer, and Secretary. |
| and Treasurer | | |
| | | |
| Daniel B. Steadman | March 2000 | Mr. Steadman has been employed by Hennessy Advisors, Inc. |
| (1956) | | since 2000 and currently serves as its Executive Vice President |
| Executive Vice President | | and Chief Compliance Officer. |
| and Secretary | | |
| | | |
| Brian Carlson | December 2013 | Mr. Carlson has been employed by Hennessy Advisors, Inc. |
| (1972) | | since December 2013. Mr. Carlson was previously a co-founder |
| Senior Vice President and | | and principal of Trivium Consultants, LLC from February 2011 |
| Head of Distribution | | through November 2013. |
| | | |
| Jennifer Cheskiewicz | June 2013 | Ms. Cheskiewicz has been employed by Hennessy Advisors, Inc. |
| (1977) | | as its General Counsel since June 2013. She previously served |
| Senior Vice President and | | as in-house counsel to Carlson Capital, L.P., an SEC-registered |
| Chief Compliance Officer | | investment advisor to several private funds, from |
| | | February 2010 to May 2013. |
| HENNESSY FUNDS | 1-800-966-4354 | |
| Name, (Year of Birth), | | |
| and Position Held | Start Date | Principal Occupation(s) |
with the Trust | of Service | During Past Five Years |
| | | |
| David Ellison | October 2012 | Mr. Ellison has been employed by Hennessy Advisors, Inc. since |
(1958)(3) | | October 2012. He has served as a Portfolio Manager of the |
| Senior Vice President | | Hennessy Small Cap Financial Fund and the Hennessy Large |
| and Portfolio Manager | | Cap Financial Fund since inception. Mr. Ellison also served as a |
| | | Portfolio Manager of the Hennessy Technology Fund from its |
| | | inception until February 2017. Mr. Ellison served as Director, |
| | | CIO and President of FBR Fund Advisers, Inc. from |
| | | December 1999 to October 2012. |
| | | |
| Ryan Kelley | March 2013 | Mr. Kelley has been employed by Hennessy Advisors, Inc. since |
(1972)(4) | | October 2012. He has served as a Portfolio Manager of the |
| Vice President and | | Hennessy Gas Utility Fund, the Hennessy Small Cap Financial |
| Portfolio Manager | | Fund, and the Hennessy Large Cap Financial Fund since |
| | | October 2014. He served as Co-Portfolio Manager of the same |
| | | funds from March 2013 through September 2014, and as a |
| | | Portfolio Analyst for the Hennessy Funds from October 2012 |
| | | through October 2014. Mr. Kelley has also served as a Portfolio |
| | | Manager of the Hennessy Cornerstone Growth Fund, the |
| | | Hennessy Cornerstone Mid Cap 30 Fund, the Hennessy |
| | | Cornerstone Large Growth Fund, and the Hennessy |
| | | Cornerstone Value Fund and as a Co-Portfolio Manager of the |
| | | Hennessy Technology Fund since February 2017. Mr. Kelley |
| | | served as Portfolio Manager of FBR Fund Advisers, Inc. from |
| | | January 2008 to October 2012. |
| | | |
| Brian Peery | March 2003 as | Mr. Peery has been employed by Hennessy Advisors, Inc. since |
| (1969) | an Officer and | 2002. He has served as a Portfolio Manager of the Hennessy |
| Senior Vice President | February 2011 | Cornerstone Growth Fund, the Hennessy Cornerstone Mid Cap |
| and Portfolio Manager | as a Co-Portfolio | 30 Fund, the Hennessy Cornerstone Large Growth Fund, the |
| | Manager or | Hennessy Cornerstone Value Fund, the Hennessy Total Return |
| | Portfolio Manager | Fund, and the Hennessy Balanced Fund since October 2014. |
| | | He served as Co-Portfolio Manager of the same funds from |
| | | February 2011 through September 2014. Mr. Peery has also |
| | | served as a Portfolio Manager of the Hennessy Gas Utility Fund |
| | | since February 2015 and as Lead Portfolio Manager of the |
| | | Hennessy Technology Fund since February 2017. |
| | | |
| Daniel P. Hennessy | December 2016 | Mr. Daniel Hennessy has been employed by Hennessy Advisors, |
| (1990) | | Inc. since 2015. He has served as an Associate Analyst of the |
| Assistant Vice President | | Hennessy Technology Fund since February 2017. He previously |
| and Associate Analyst | | served as a Mutual Fund Specialist at U.S. Bancorp Fund |
| | | Services, LLC from November 2014 to July 2015. Prior to that, |
| | | he attended the University of San Diego, where he earned a |
| | | degree in Political Science. |
_______________
(1) | Messrs. DeSousa, Doyle, Hennessy, and Richardson previously served on the Board of Directors of Hennessy Mutual Funds, Inc. (“HMFI”), The Hennessy Funds, Inc. (“HFI”), and Hennessy SPARX Funds Trust (“HSFT”). Pursuant to an internal reorganization effective as of February 28, 2014, the series of HFMI, HFI, and HSFT were reorganized into corresponding series of Hennessy Funds Trust that mirrored them. Subsequent to the reorganization, HFMI, HFI, and HSFT were dissolved. |
(2) | Mr. Hennessy is considered an “interested person,” as defined in the Investment Company Act of 1940, as amended, because he is an officer of the Hennessy Funds. |
(3) | The address of this officer is 101 Federal Street, Suite 1900, Boston, MA 02110. |
(4) | The address of this officer is 1340 Environ Way, Chapel Hill, NC 27517. |
| TRUSTEES AND OFFICERS OF THE FUND |
(This Page Intentionally Left Blank.)
| HENNESSY FUNDS | 1-800-966-4354 | |
Expense Example (Unaudited)
October 31, 2017
As a shareholder of the Fund, you incur two types of costs: (1) transaction costs, including sales charges (loads) on purchase payments, reinvested dividends, or other distributions, redemption fees, and exchange fees; and (2) ongoing costs, including management fees, service fees, and other Fund expenses. This Example is intended to help you understand your ongoing costs (in dollars) of investing in the Fund and to compare these costs with the ongoing costs of investing in other mutual funds. The Example is based on an investment of $1,000 invested at the beginning of the period and held for the entire period from May 1, 2017, through October 31, 2017.
Actual Expenses
The first line of the table below under the “Investor Class” and “Institutional Class” headings provides information about actual account values and actual expenses. Although the Fund charges no sales loads or transaction fees, you will be assessed fees for outgoing wire transfers, returned checks and stop payment orders at prevailing rates charged by U.S. Bancorp Fund Services, LLC, the Fund’s transfer agent. If you request that a redemption be made by wire transfer, currently a $15 fee is charged by the Fund’s transfer agent. IRA accounts will be charged a $15 annual maintenance fee. The example below includes, but is not limited to, management fees, shareholder servicing fees, fund accounting, custody, and transfer agent fees. However, the example below does not include portfolio trading commissions and related expenses, and other extraordinary expenses as determined under generally accepted accounting principles. You may use the information in this line, together with the amount you invested, to estimate the expenses that you paid over the period. Simply divide your account value by $1,000 (for example, an $8,600 account value divided by $1,000 = 8.6), then multiply the result by the number in the first line of the table under the “Investor Class” or “Institutional Class” headings in the column entitled “Expenses Paid During Period” to estimate the expenses you paid on your account during this period.
Hypothetical Example for Comparison Purposes
The second line of the table below under the “Investor Class” and “Institutional Class” headings provides information about hypothetical account values and hypothetical expenses based on the Fund’s actual expense ratios and an assumed rate of return of 5% per year before expenses, which is not the Fund’s actual return. The hypothetical account values and expenses may not be used to estimate the actual ending account balance or expenses you paid for the period. You may use this information to compare the ongoing costs of investing in the Fund and other funds. To do so, compare this 5% hypothetical example with the 5% hypothetical examples that appear in the shareholder reports of the other funds. Please note that the expenses shown in the table are meant to highlight your ongoing costs only and do not reflect any transactional costs, such as sales charges (loads), or exchange fees. Therefore, the second line of the table under the “Investor Class” and “Institutional Class” headings is useful in comparing ongoing costs only, and will not help you determine the relative total costs of owning different funds. In addition, if these transactional costs were included, your costs would have been higher.
| | | | Expenses Paid |
| | Beginning | Ending | During Period(1) |
| | Account Value | Account Value | May 1, 2017 – |
| | May 1, 2017 | October 31, 2017 | October 31, 2017 |
| Investor Class | | | |
| Actual | $1,000.00 | $1,102.70 | $6.52 |
| Hypothetical (5% return before expenses) | $1,000.00 | $1,019.00 | $6.26 |
| | | | |
| Institutional Class | | | |
| Actual | $1,000.00 | $1,104.30 | $5.20 |
| Hypothetical (5% return before expenses) | $1,000.00 | $1,020.27 | $4.99 |
(1) | Expenses are equal to the Fund’s annualized expense ratio of 1.23% for Investor Class shares or 0.98% for Institutional Class shares, as applicable, multiplied by the average account value over the period, multiplied by 184/365 days (to reflect one-half year period). |
| HENNESSY FUNDS | 1-800-966-4354 | |
How to Obtain a Copy of the Fund’s
Proxy Voting Policy and Proxy Voting Records
A description of the policies and procedures the Fund uses to determine how to vote proxies relating to portfolio securities is available without charge: (1) by calling 1-800-966-4354; (2) on the Hennessy Funds’ website at hennessyfunds.com/proxy-voting/policy.fs; or (3) on the U.S. Securities and Exchange Commission’s (the “SEC”) website at www.sec.gov. The Fund’s proxy voting record is available without charge on both the Hennessy Funds’ website at hennessyfunds.com/proxy-voting/vote.fs and the SEC’s website at www.sec.gov no later than August 31 for the prior 12 months ending June 30.
Quarterly Filings on Form N-Q
The Fund files a complete schedule of portfolio holdings with the SEC for the first and third quarters of each fiscal year on Form N-Q. The Fund’s Forms N-Q are made available on the SEC’s website at www.sec.gov. The Fund’s Forms N-Q may be reviewed and copied at the SEC’s Public Reference Room in Washington, DC, and information on the operation of the Public Reference Room may be obtained by calling 1-800-SEC-0330. Information included in the Fund’s Forms N-Q will also be available upon request by calling 1-800-966-4354.
Householding
To help keep the Fund’s costs as low as possible, we generally deliver a single copy of most financial reports and prospectuses to shareholders who share an address, even if the accounts are registered under different names. This process, known as “householding,” does not apply to account statements. You may request an individual copy of a prospectus or financial report at any time. If you would like to receive separate mailings, please call U.S. Bancorp Fund Services, LLC at 1-800-261-6950 or 1-414-765-4124 and we will begin individual delivery within 30 days of your request. If your account is held through a financial institution or other intermediary, please contact them directly to request individual delivery.
| PROXY VOTING — PRIVACY POLICY |
Privacy Policy
We collect the following non-public personal information about you:
| | • | information we receive from you on or in applications or other forms, correspondence, or conversations, including, but not limited to, your name, address, phone number, social security number, assets, income, and date of birth; and |
| | • | information about your transactions with us, our affiliates, or others, including, but not limited to, your account number and balance, payment history, parties to transactions, cost basis information, and other financial information. |
We do not disclose any non-public personal information about our current or former shareholders to non-affiliated third parties, except as permitted by law. For example, we are permitted by law to disclose all of the information we collect, as described above, to our Transfer Agent to process your transactions. Furthermore, we restrict access to your non-public personal information to those persons who require such information to provide products or services to you. We maintain physical, electronic, and procedural safeguards that comply with federal standards to guard your non-public personal information.
In the event that you hold shares of the Fund through a financial intermediary, including, but not limited to, a broker-dealer, bank, or trust company, the privacy policy of your financial intermediary would govern how your non-public personal information will be shared with non-affiliated third parties.
| HENNESSY FUNDS | 1-800-966-4354 | |
For information, questions or assistance, please call
The Hennessy Funds
1-800-966-4354 or 1-415-899-1555
INVESTMENT ADVISOR
Hennessy Advisors, Inc.
7250 Redwood Boulevard, Suite 200
Novato, California 94945
ADMINISTRATOR,
TRANSFER AGENT,
DIVIDEND PAYING AGENT &
SHAREHOLDER SERVICING AGENT
U.S. Bancorp Fund Services, LLC
P.O. Box 701
Milwaukee, Wisconsin 53201-0701
CUSTODIAN
U.S. Bank N.A.
Custody Operations
1555 North River Center Drive, Suite 302
Milwaukee, Wisconsin 53212
TRUSTEES
Neil J. Hennessy
Robert T. Doyle
J. Dennis DeSousa
Gerald P. Richardson
COUNSEL
Foley & Lardner LLP
777 East Wisconsin Avenue
Milwaukee, Wisconsin 53202-5306
INDEPENDENT REGISTERED
PUBLIC ACCOUNTING FIRM
Tait, Weller & Baker LLP
1818 Market Street, Suite 2400
Philadelphia, Pennsylvania 19103
DISTRIBUTOR
Quasar Distributors, LLC
777 East Wisconsin Avenue
Milwaukee, Wisconsin 53202
hennessyfunds.com | 1-800-966-4354
This report has been prepared for shareholders and may be distributed to
others only if preceded or accompanied by a current prospectus.
ANNUAL REPORT
OCTOBER 31, 2017
HENNESSY JAPAN FUND
Investor Class HJPNX
Institutional Class HJPIX
hennessyfunds.com | 1-800-966-4354
(This Page Intentionally Left Blank.)
Contents
| Letter to Shareholders | | | 2 |
| Performance Overview | | | 4 |
| Financial Statements | | | |
| Schedule of Investments | | | 7 |
| Statement of Assets and Liabilities | | | 11 |
| Statement of Operations | | | 12 |
| Statements of Changes in Net Assets | | | 13 |
| Financial Highlights | | | 14 |
| Notes to the Financial Statements | | | 18 |
| Report of Independent Registered Public Accounting Firm | | | 26 |
| Trustees and Officers of the Fund | | | 27 |
| Expense Example | | | 30 |
| Proxy Voting Policy and Proxy Voting Records | | | 32 |
| Quarterly Schedule of Investments | | | 32 |
| Householding | | | 32 |
| Privacy Policy | | | 33 |
| HENNESSY FUNDS | 1-800-966-4354 | |
December 2017
Dear Hennessy Funds Shareholder:
During the 12-month period ended October 31, 2017, the Japanese stock market, as measured by the Tokyo Stock Price Index (TOPIX), increased over 19% in U.S. dollar terms.
Although there was a large decline in the Japanese market on the day after the U.S. presidential election in November 2016, the market rebounded over the next several days and gained ground steadily thereafter, spurred by two factors. First, the yen continued to weaken against the U.S. dollar, as a result of expectations for higher interest rates in the U.S. The weak currency encouraged investors to bid up the stock prices of export-oriented Japanese companies in anticipation of higher earnings. Second, market participants raised their expectations for economic growth in the U.S., hoping that President-elect Trump would loosen fiscal policy and jump-start government spending, thereby providing a boost to economic growth globally, which would benefit Japan.
The start of 2017 saw minor ebbs and flows in the Japanese stock market. Although the U.S. market continued to rally and provide support for Japanese equities, the Japanese stock market moved sideways for a period as investors became concerned that the exchange rate, which had stalled at 115 yen to one U.S. dollar, would weaken no further. Over the summer months, the Japanese stock market continued to fluctuate, rising when the yen was weak and falling when the yen rallied.
The landslide victory in the Lower House for the incumbent Liberal Democratic Party on October 22, 2017, provided a catalyst for investors, securing a stable political back drop for equities and giving Prime Minister Abe an even stronger mandate to continue with his economic reforms. Japanese equities rallied enthusiastically on the news and continued to rise through the end of the period, buoyed also by strong corporate profits growth and confirmation from the Federal Reserve in the U.S. that the central bank would continue with a policy of very gradual monetary tightening.
With stocks trading at 15x 2017 earnings, Japan remains an attractive market for global investors. Over the past five years, corporate earnings per share and the TOPIX have both risen by about 120%. In other words, even though the Japanese market has risen, it has not seen any multiple expansion over this time period and is no more expensive today relative to earnings than it was five years ago. In the third calendar quarter, Japan’s GDP grew for the 10th straight quarter, completing the longest stretch of growth since 2006. Such growth was the result of stronger personal consumption (despite the geopolitical concerns over North Korea) and higher capital spending. With Prime Minister Abe’s Liberal Democratic Party landslide victory in the Lower House election in October, we expect business-friendly and pro-growth policies to continue, keeping the economy improving. We believe Japan continues to move in the right direction with a pro-growth central bank and a reform-minded government implementing structural reforms.
While Japan continues to enjoy political stability and a sound corporate profits growth environment, we would like to reiterate our call for an acceleration in structural reforms to raise Japan’s potential economic growth rate. We believe these reforms have the power to raise consumer and business confidence so that economic actors can become more forward-looking and possibly prompted to spend money that, in turn, could produce a welcome increase in inflationary pressures. On this point, we find it encouraging that the government and the Bank of Japan have been, and we expect them to continue to be, mindful of the priorities of the business community in the pursuit of sustainable, long-term growth.
We remain optimistic about the long-term prospects for Japan and its stock market. Thank you for your continued confidence and investment in our Funds.
Sincerely,
| | |
 |  |
| | |
| Tadahiro Fujimura | Masakazu Takeda |
| Portfolio Manager, | Portfolio Manager, |
| Hennessy Japan Small Cap Fund; | Hennessy Japan Fund; |
| Chief Investment Officer | Fund Manager |
| SPARX Asset Management Co., Ltd. | SPARX Asset Management Co., Ltd. |
SPARX Asset Management Co., Ltd., located in Tokyo, Japan, is the sub-advisor to the Hennessy Japan Fund and the Hennessy Japan Small Cap Fund.
Past performance does not guarantee future results.
Mutual fund investing involves risk. Principal loss is possible.
Opinions expressed are those of Tadahiro Fujimura and Masakazu Takeda and are subject to change, are not guaranteed and should not be considered investment advice.
The Tokyo Stock Price Index (TOPIX) is an unmanaged index commonly used to measure the performance of Japanese stocks. One cannot invest directly in an index.
Earnings per share is the portion of a company’s profit allocated to each outstanding share of common stock. It serves as an indicator of a company’s profitability.
| HENNESSY FUNDS | 1-800-966-4354 | |
Performance Overview (Unaudited)
CHANGE IN VALUE OF $10,000 INVESTMENT
This graph illustrates the performance of an initial investment of $10,000 made in the Fund ten years ago and assumes the reinvestment of dividends.
AVERAGE ANNUAL TOTAL RETURN FOR PERIODS ENDED OCTOBER 31, 2017
| | One | Five | Ten |
| | Year | Years | Years |
| Hennessy Japan Fund – | | | |
| Investor Class (HJPNX) | 17.76% | 16.30% | 7.33% |
| Hennessy Japan Fund – | | | |
| Institutional Class (HJPIX) | 18.24% | 16.63% | 7.56% |
Russell/Nomura Total MarketTM Index | 20.18% | 13.21% | 3.17% |
| Tokyo Price Index (TOPIX) | 19.47% | 13.06% | 3.09% |
Expense ratios: 1.49% (Investor Class); 1.11% (Institutional Class)
Performance data quoted represents past performance; past performance does not guarantee future results. The investment return and principal value of an investment will fluctuate so that an investor’s shares, when redeemed, may be worth more or less than their original cost. The performance table does not reflect the deduction of taxes that a shareholder would pay on Fund distributions or the redemption of Fund shares. Current performance of the Fund may be lower or higher than the performance quoted. Performance data current to the most recent month end may be obtained by visiting hennessyfunds.com.
The Russell/Nomura Total Market™ Index contains the top 98% of all stocks listed on Japan’s stock exchange and registered on Japan’s OTC market in terms of market capitalization. The Tokyo Price Index (TOPIX) is a market capitalization-weighted index of all companies listed on the First Section of the Tokyo Stock Exchange. One cannot invest directly in an index.
Frank Russell Company (“Russell”) is the source and owner of the trademarks, service marks, and copyrights related to the Russell Indexes. Russell® is a trademark of Frank Russell Company. Neither Russell nor its licensors accept any liability for any errors or omissions in the Russell Indexes or Russell ratings or underlying data and no party may rely on any Russell Indexes or Russell ratings or underlying data contained in this communication. No further distribution of Russell data is permitted without Russell’s express written consent. Russell does not promote, sponsor, or endorse the content of this communication.
The expense ratios presented are from the most recent prospectus. The expense ratios for the current reporting period are available in the Financial Highlights section of this report.
PERFORMANCE NARRATIVE
Portfolio Managers Masakazu Takeda, CFA and CMA*, and Yu Shimizu, CMA*
SPARX Asset Management Co., Ltd. (sub-advisor)
Performance:
For the 12-month period ended October 31, 2017, the Investor Class of the Hennessy Japan Fund returned 17.76%, underperforming both the Russell/Nomura Total Market™ Index and the Tokyo Stock Price Index (TOPIX), which returned 20.18% and 19.47% respectively for the same period, in U.S. Dollar terms.
The largest positive contributors to the Fund’s performance among the 33 TOPIX sub-industries were shares in Electric Appliances, Wholesale Trade, and Services businesses. No sub-industry negatively impacted the Fund’s performance over the 12-month period.
Among the strongest performing stocks in the Fund during the period were Recruit Holdings Co., Ltd., Japan’s unique print & online media giant specializing in the classified advertising business as well as the provision of HR services, Fuji Seal International, Inc., the world’s leading shrink wrap label manufacturer, and MISUMI Group, Inc., a maker and distributor of metal mold components and precision machinery parts. Shares of Recruit increased on continued strong performance of its business operations, especially its U.S. subsidiary, Indeed, Inc. Shares of Fuji Seal made gains, driven by solid growth in sales. Lastly, shares of MISUMI Group advanced on strong sales and profits growth from both its made-to-order business and its third-party distribution business, the combination of which has created durable barriers to entry for the company as a whole. The Fund continues to hold all of the companies mentioned.
As for the laggards, ASICS Corporation, the high performance running shoe maker, SHIMANO, Inc., the largest global bicycle parts manufacturer, and Unicharm Corporation, Japan’s baby and feminine care products maker, were the major detractors to the Fund’s performance. The fall in ASICS is attributable to weakening demand for its products in western markets. Shares of SHIMANO suffered after the company revised down its full-year earnings projections on weaker-than-expected demand growth in Europe and China, along with raw material cost increases. We believe Unicharm, a major exporter to Asian countries, has been lagging as a result of the recent weakness of Asian currencies relative to the yen. The Fund continues to hold all of the companies mentioned.
Portfolio Strategy:
The Fund seeks long-term capital appreciation by investing in securities of Japanese companies regardless of market capitalization. We screen for companies that we believe have strong businesses and management, and are trading at an attractive price. Through in-depth and rigorous analysis and on-site research, we identify stocks with a “value gap.” The portfolio is limited to our best ideas and maintains a concentrated number of holdings.
Investment Commentary:
Over the period, some stocks in the Fund have continuously lagged the broader market, and we have been an opportunistic buyer of these stocks. As we manage the Fund with a long-term perspective, in any given year there are likely to be both strong performers and weak performers in the portfolio. With our typical low-turnover approach, we rarely sever ties with underperformers unless the businesses are on the verge of losing their
| HENNESSY FUNDS | 1-800-966-4354 | |
competitive advantages. Instead, we try to ignore the crowd and slowly add to these positions while gradually taking profits in the Fund’s best performers. We believe this policy of trimming winners and adding to underperformers has the potential to reduce investment risk for the Fund. On occasion, we may buy an underperforming stock for a period of two to three years.
Generally speaking, we believe consensus opinion tends to be a moderately good predictor of both a company’s near-term performance and short-term movements in its stock price. Nevertheless, it tends to be a poor predictor of a company’s performance longer term. We believe contrarian investing can produce successful investment results over the long term. We have been buying shares in the Fund’s laggards because we believe these stocks will recover and perform better in the future. The poorly performing stocks we are buying share certain business characteristics. First, we believe their products and services have a low probability of being exposed to rapid technological change or shifts in consumption trends, which could render their products and services obsolete. Second, they already have a large global customer base that is likely to drive faster demand growth than businesses exposed only to Japan’s domestic market and its demographic headwinds. Third, they have demonstrated the ability to generate consistent cash flows, even during an earnings downtrend. As a result, their financial condition is unlikely to deteriorate significantly even if a recovery in profitability takes longer than initially expected.
As patient proponents of this long-term, contrarian investment strategy, we are willing to wait several years before witnessing a recovery in a company’s business and a revival in its share price. This investment approach naturally leads to low turnover for the Fund. In contrast, many professional investors are impatient and are unwilling to tolerate poor investment results for even just a few months, which leads to higher turnover in their funds. We believe our patience, and more importantly, that of our clients, gives us an indispensable edge in beating the market over the long term.
* Chartered Member of the Security Analysts Association of Japan
Opinions expressed are those of the Portfolio Managers as of the date written and are subject to change, are not guaranteed, and should not be considered investment advice or an indication of trading intent.
The Russell/Nomura Total Market™ Index contains the top 98% of all stocks listed on Japan’s stock exchange and registered on Japan’s OTC market in terms of market capitalization. The Tokyo Price Index (TOPIX) is a market capitalization-weighted index of all companies listed on the First Section of the Tokyo Stock Exchange. One cannot invest directly in an index.
The Fund invests in small- and medium-capitalization companies, which may have more limited liquidity and greater price volatility than large-capitalization companies. The Fund invests in the stocks of companies operating in Japan; single-country funds may be subject to a higher degree of risk. The Fund may experience higher fees due to investments in pooled investment vehicles (including ETFs).
References to specific securities should not be considered a recommendation to buy or sell any security. Fund holdings and sector allocations are subject to change. Please refer to the Schedule of Investments included in this report for additional portfolio information.
Cash flow refers to the net amount of cash and cash equivalents moving into and out of a company.
| PERFORMANCE OVERVIEW/SCHEDULE OF INVESTMENTS |
Financial Statements
Schedule of Investments as of October 31, 2017 |
HENNESSY JAPAN FUND
(% of Net Assets)
| TOP TEN HOLDINGS (EXCLUDING CASH/CASH EQUIVALENTS) | | % NET ASSETS |
| Recruit Holdings Co., Ltd. | | | 5.86 | % |
| Nidec Corp. | | | 5.21 | % |
| Misumi Group, Inc. | | | 5.13 | % |
| Daikin Industries | | | 4.88 | % |
| Keyence Corp. | | | 4.88 | % |
| Softbank Group Co. | | | 4.86 | % |
| Sumitomo Mitsui Financial Group, Inc. | | | 4.85 | % |
| Mitsubishi Corp. | | | 4.83 | % |
| Fast Retailing Co., Ltd. | | | 4.83 | % |
| Terumo Corp. | | | 4.75 | % |
Note: For presentation purposes, the Fund has grouped some of the industry categories. For purposes of categorizing securities for compliance with Section 8(b)(1) of the Investment Company Act of 1940, as amended, the Fund uses more specific industry classifications.
| HENNESSY FUNDS | 1-800-966-4354 | |
| COMMON STOCKS – 95.56% | | Number | | | | | | % of | |
| | | of Shares | | | Value | | | Net Assets | |
| Consumer Discretionary – 22.06% | | | | | | | | | |
| Asics Corp. | | | 801,700 | | | $ | 12,255,881 | | | | 4.68 | % |
| Fast Retailing Co., Ltd. | | | 37,800 | | | | 12,646,942 | | | | 4.83 | % |
| Isuzu Motors, Ltd. | | | 438,900 | | | | 6,410,313 | | | | 2.45 | % |
| Ryohin Keikaku Co., Ltd. | | | 29,600 | | | | 8,731,913 | | | | 3.33 | % |
| Shimano, Inc. | | | 89,100 | | | | 12,192,561 | | | | 4.66 | % |
| Toyota Motor Corp. | | | 89,100 | | | | 5,526,524 | | | | 2.11 | % |
| | | | | | | | 57,764,134 | | | | 22.06 | % |
| | | | | | | | | | | | | |
| Consumer Staples – 14.93% | | | | | | | | | | | | |
| Japan Tobacco, Inc. | | | 368,200 | | | | 12,187,494 | | | | 4.66 | % |
| Kao Corp. | | | 196,800 | | | | 11,893,637 | | | | 4.54 | % |
| Pigeon Corp. | | | 75,400 | | | | 2,675,788 | | | | 1.02 | % |
| Unicharm Corp. | | | 542,200 | �� | | | 12,338,169 | | | | 4.71 | % |
| | | | | | | | 39,095,088 | | | | 14.93 | % |
| | | | | | | | | | | | | |
| Financials – 5.94% | | | | | | | | | | | | |
| Mizuho Financial Group | | | 1,573,200 | | | | 2,858,317 | | | | 1.09 | % |
| Sumitomo Mitsui Financial Group, Inc. | | | 316,500 | | | | 12,679,855 | | | | 4.85 | % |
| | | | | | | | 15,538,172 | | | | 5.94 | % |
| | | | | | | | | | | | | |
| Health Care – 9.49% | | | | | | | | | | | | |
| Rohto Pharmaceutical Co., Ltd. | | | 537,700 | | | | 12,411,545 | | | | 4.74 | % |
| Terumo Corp. | | | 298,600 | | | | 12,442,751 | | | | 4.75 | % |
| | | | | | | | 24,854,296 | | | | 9.49 | % |
| | | | | | | | | | | | | |
| Industrials – 30.49% | | | | | | | | | | | | |
| Daikin Industries | | | 115,700 | | | | 12,786,108 | | | | 4.88 | % |
| Kubota Corp. | | | 636,900 | | | | 11,983,588 | | | | 4.58 | % |
| Misumi Group, Inc. | | | 490,600 | | | | 13,441,239 | | | | 5.13 | % |
| Mitsubishi Corp. | | | 540,400 | | | | 12,655,057 | | | | 4.83 | % |
| Nidec Corp. | | | 102,500 | | | | 13,630,749 | | | | 5.21 | % |
| Recruit Holdings Co., Ltd. | | | 626,100 | | | | 15,350,502 | | | | 5.86 | % |
| | | | | | | | 79,847,243 | | | | 30.49 | % |
| | | | | | | | | | | | | |
| Information Technology – 4.88% | | | | | | | | | | | | |
| Keyence Corp. | | | 23,000 | | | | 12,770,174 | | | | 4.88 | % |
| | | | | | | | | | | | | |
| Materials – 2.91% | | | | | | | | | | | | |
| Fuji Seal International, Inc. | | | 232,200 | | | | 7,620,450 | | | | 2.91 | % |
The accompanying notes are an integral part of these financial statements.
| COMMON STOCKS | | Number | | | | | | % of | |
| | | of Shares | | | Value | | | Net Assets | |
| Telecommunication Services – 4.86% | | | | | | | | | |
| Softbank Group Co. | | | 143,700 | | | $ | 12,735,009 | | | | 4.86 | % |
| | | | | | | | | | | | | |
| Total Common Stocks | | | | | | | | | | | | |
| (Cost $177,105,504) | | | | | | | 250,224,566 | | | | 95.56 | % |
| | | | | | | | | | | | | |
| SHORT-TERM INVESTMENTS – 4.34% | | | | | | | | | | | | |
| | | | | | | | | | | | | |
| Money Market Funds – 4.34% | | | | | | | | | | | | |
| Fidelity Government Portfolio, Institutional Class, 0.92% (a) | | | 11,374,965 | | | | 11,374,965 | | | | 4.34 | % |
| | | | | | | | | | | | | |
| Total Short-Term Investments | | | | | | | | | | | | |
| (Cost $11,374,965) | | | | | | | 11,374,965 | | | | 4.34 | % |
| | | | | | | | | | | | | |
| Total Investments | | | | | | | | | | | | |
| (Cost $188,480,469) – 99.90% | | | | | | | 261,599,531 | | | | 99.90 | % |
| Other Assets in Excess of Liabilities – 0.10% | | | | | | | 265,813 | | | | 0.10 | % |
TOTAL NET ASSETS – 100.00% | | | | | | $ | 261,865,344 | | | | 100.00 | % |
Percentages are stated as a percent of net assets.
| (a) | The rate listed is the fund’s 7-day yield as of October 31, 2017. |
The accompanying notes are an integral part of these financial statements.
| HENNESSY FUNDS | 1-800-966-4354 | |
Summary of Fair Value Exposure at October 31, 2017
The following is a summary of the inputs used to value the Fund’s net assets as of October 31, 2017 (See Note 3 in the accompanying notes to the financial statements):
| Common Stocks | | Level 1 | | | Level 2 | | | Level 3 | | | Total | |
| Consumer Discretionary | | $ | — | | | $ | 57,764,134 | | | $ | — | | | $ | 57,764,134 | |
| Consumer Staples | | | — | | | | 39,095,088 | | | | — | | | | 39,095,088 | |
| Financials | | | — | | | | 15,538,172 | | | | — | | | | 15,538,172 | |
| Health Care | | | — | | | | 24,854,296 | | | | — | | | | 24,854,296 | |
| Industrials | | | — | | | | 79,847,243 | | | | — | | | | 79,847,243 | |
| Information Technology | | | — | | | | 12,770,174 | | | | — | | | | 12,770,174 | |
| Materials | | | — | | | | 7,620,450 | | | | — | | | | 7,620,450 | |
| Telecommunication Services | | | — | | | | 12,735,009 | | | | — | | | | 12,735,009 | |
| Total Common Stocks | | $ | — | | | $ | 250,224,566 | | | $ | — | | | $ | 250,224,566 | |
| Short-Term Investments | | | | | | | | | | | | | | | | |
| Money Market Funds | | $ | 11,374,965 | | | $ | — | | | $ | — | | | $ | 11,374,965 | |
| Total Short-Term Investments | | $ | 11,374,965 | | | $ | — | | | $ | — | | | $ | 11,374,965 | |
| Total Investments | | $ | 11,374,965 | | | $ | 250,224,566 | | | $ | — | | | $ | 261,599,531 | |
Transfers between levels are recognized at the end of the reporting period. During the year ended October 31, 2017, the Fund recognized significant transfers between Levels 1 and 2.
Transfers between Level 1 and Level 2 relate to the use of fair valuation pricing service. On days when the fair valuation pricing service is used, non-U.S. dollar denominated securities move from a Level 1 to a Level 2 classification. 100% of common stocks held at October 31, 2016, were classified as Level 1. Such securities still held at October 31, 2017, were transferred to Level 2. Other than transfers due to the fair value pricing services, no transfers were recognized.
The accompanying notes are an integral part of these financial statements.
| SCHEDULE OF INVESTMENTS/STATEMENT OF ASSETS AND LIABILITIES |
Financial Statements
Statement of Assets and Liabilities as of October 31, 2017 |
| ASSETS: | | | |
| Investments in securities, at value (cost $188,480,469) | | $ | 261,599,531 | |
| Dividends and interest receivable | | | 985,048 | |
| Receivable for fund shares sold | | | 1,167,406 | |
| Prepaid expenses and other assets | | | 31,543 | |
| Total Assets | | | 263,783,528 | |
| | | | | |
| LIABILITIES: | | | | |
| Payable for securities purchased | | | 1,555,683 | |
| Payable for fund shares redeemed | | | 62,518 | |
| Payable to advisor | | | 170,259 | |
| Payable to administrator | | | 38,603 | |
| Payable to auditor | | | 21,305 | |
| Accrued distribution fees | | | 13,134 | |
| Accrued service fees | | | 6,924 | |
| Accrued trustees fees | | | 4,833 | |
| Accrued expenses and other payables | | | 44,925 | |
| Total Liabilities | | | 1,918,184 | |
| NET ASSETS | | $ | 261,865,344 | |
| | | | | |
| NET ASSETS CONSIST OF: | | | | |
| Capital stock | | $ | 195,134,730 | |
| Accumulated net realized loss on investments | | | (6,371,579 | ) |
| Unrealized net appreciation on investments | | | 73,102,193 | |
| Total Net Assets | | $ | 261,865,344 | |
| | | | | |
| NET ASSETS | | | | |
| Investor Class: | | | | |
| Shares authorized (no par value) | | Unlimited | |
| Net assets applicable to outstanding Investor Class shares | | $ | 84,441,863 | |
| Shares issued and outstanding | | | 2,578,410 | |
| Net asset value, offering price and redemption price per share | | $ | 32.75 | |
| | | | | |
| Institutional Class: | | | | |
| Shares authorized (no par value) | | Unlimited | |
| Net assets applicable to outstanding Institutional Class shares | | $ | 177,423,481 | |
| Shares issued and outstanding | | | 5,273,522 | |
| Net asset value, offering price and redemption price per share | | $ | 33.64 | |
The accompanying notes are an integral part of these financial statements.
| HENNESSY FUNDS | 1-800-966-4354 | |
Financial Statements
Statement of Operations for the year ended October 31, 2017 |
| INVESTMENT INCOME: | | | |
Dividend income(1) | | $ | 2,426,073 | |
| Interest income | | | 86,066 | |
| Total investment income | | | 2,512,139 | |
| | | | | |
| EXPENSES: | | | | |
| Investment advisory fees (See Note 5) | | | 1,511,561 | |
| Sub-transfer agent expenses – Investor Class (See Note 5) | | | 173,284 | |
| Sub-transfer agent expenses – Institutional Class (See Note 5) | | | 96,364 | |
| Administration, fund accounting, custody and transfer agent fees (See Note 5) | | | 180,177 | |
| Distribution fees – Investor Class (See Note 5) | | | 108,632 | |
| Service fees – Investor Class (See Note 5) | | | 72,422 | |
| Federal and state registration fees | | | 35,983 | |
| Compliance expense (See Note 5) | | | 28,705 | |
| Audit fees | | | 21,316 | |
| Reports to shareholders | | | 20,566 | |
| Trustees’ fees and expenses | | | 15,821 | |
| Legal fees | | | 1,650 | |
| Other expenses | | | 12,129 | |
| Total expenses | | | 2,278,610 | |
| NET INVESTMENT INCOME | | $ | 233,529 | |
| | | | | |
| REALIZED AND UNREALIZED GAINS (LOSSES): | | | | |
| Net realized loss on investments | | $ | (281,051 | ) |
| Net change in unrealized appreciation on investments | | | 36,173,877 | |
| Net gain on investments | | | 35,892,826 | |
| NET INCREASE IN NET ASSETS RESULTING FROM OPERATIONS | | $ | 36,126,355 | |
(1) | Net of foreign taxes withheld of $269,138. |
The accompanying notes are an integral part of these financial statements.
| STATEMENT OF OPERATIONS/STATEMENTS OF CHANGES IN NET ASSETS |
Financial Statements
| Statements of Changes in Net Assets |
| | | Year Ended | | | Year Ended | |
| | | October 31, 2017 | | | October 31, 2016 | |
| OPERATIONS: | | | | | | |
| Net investment income (loss) | | $ | 233,529 | | | $ | (249,157 | ) |
| Net realized gain (loss) on investments | | | (281,051 | ) | | | 1,638,917 | |
| Net change in unrealized appreciation on investments | | | 36,173,877 | | | | 14,734,429 | |
| Net increase in net assets resulting from operations | | | 36,126,355 | | | | 16,124,189 | |
| | | | | | | | | |
| CAPITAL SHARE TRANSACTIONS: | | | | | | | | |
| Proceeds from shares subscribed – Investor Class | | | 48,195,357 | | | | 28,493,995 | |
| Proceeds from shares subscribed – Institutional Class | | | 115,058,173 | | | | 46,172,033 | |
| Cost of shares redeemed – Investor Class | | | (38,068,126 | ) | | | (36,063,591 | ) |
| Cost of shares redeemed – Institutional Class | | | (29,067,977 | ) | | | (40,793,598 | ) |
| Net increase (decrease) in net assets derived | | | | | | | | |
| from capital share transactions | | | 96,117,427 | | | | (2,191,161 | ) |
| TOTAL INCREASE IN NET ASSETS | | | 132,243,782 | | | | 13,933,028 | |
| | | | | | | | | |
| NET ASSETS: | | | | | | | | |
| Beginning of year | | | 129,621,562 | | | | 115,688,534 | |
| End of year | | $ | 261,865,344 | | | $ | 129,621,562 | |
| Undistributed net investment | | | | | | | | |
| income (loss), end of year | | $ | — | | | $ | (141,042 | ) |
| | | | | | | | | |
| CHANGES IN SHARES OUTSTANDING: | | | | | | | | |
| Shares sold – Investor Class | | | 1,683,845 | | | | 1,150,149 | |
| Shares sold – Institutional Class | | | 3,882,507 | | | | 1,820,006 | |
| Shares redeemed – Investor Class | | | (1,329,272 | ) | | | (1,483,205 | ) |
| Shares redeemed – Institutional Class | | | (990,930 | ) | | | (1,643,088 | ) |
| Net increase (decrease) in shares outstanding | | | 3,246,150 | | | | (156,138 | ) |
The accompanying notes are an integral part of these financial statements.
| HENNESSY FUNDS | 1-800-966-4354 | |
Financial Statements
For an Investor Class share outstanding throughout each year
PER SHARE DATA:
Net asset value, beginning of year
Income from investment operations:
Net investment loss
Net realized and unrealized gains on investments
Total from investment operations
Less distributions:
Dividends from net investment income
Dividends from return of capital
Total distributions
Net asset value, end of year
TOTAL RETURN
SUPPLEMENTAL DATA AND RATIOS:
Net assets, end of year (millions)
Ratio of expenses to average net assets
Ratio of net investment loss to average net assets
Portfolio turnover rate(1)
| (1) | Portfolio turnover is calculated on the basis of the Fund as a whole. |
The accompanying notes are an integral part of these financial statements.
| FINANCIAL HIGHLIGHTS — INVESTOR CLASS |
| Year Ended October 31, | |
| 2017 | | | 2016 | | | 2015 | | | 2014 | | | 2013 | |
| | | | | | | | | | | | | | |
| $ | 27.81 | | | $ | 24.07 | | | $ | 21.77 | | | $ | 19.68 | | | $ | 15.40 | |
| | | | | | | | | | | | | | | | | | | |
| | | | | | | | | | | | | | | | | | | |
| | (0.03 | ) | | | (0.11 | ) | | | (0.10 | ) | | | (0.06 | ) | | | (0.04 | ) |
| | 4.97 | | | | 3.85 | | | | 2.40 | | | | 2.15 | | | | 4.33 | |
| | 4.94 | | | | 3.74 | | | | 2.30 | | | | 2.09 | | | | 4.29 | |
| | | | | | | | | | | | | | | | | | | |
| | | | | | | | | | | | | | | | | | | |
| | — | | | | — | | | | — | | | | — | | | | — | |
| | — | | | | — | | | | — | | | | — | | | | (0.01 | ) |
| | — | | | | — | | | | — | | | | — | | | | (0.01 | ) |
| $ | 32.75 | | | $ | 27.81 | | | $ | 24.07 | | | $ | 21.77 | | | $ | 19.68 | |
| | | | | | | | | | | | | | | | | | | |
| | 17.76 | % | | | 15.54 | % | | | 10.56 | % | | | 10.62 | % | | | 27.87 | % |
| | | | | | | | | | | | | | | | | | | |
| | | | | | | | | | | | | | | | | | | |
| $ | 84.44 | | | $ | 61.85 | | | $ | 61.56 | | | $ | 27.26 | | | $ | 31.32 | |
| | 1.46 | % | | | 1.50 | % | | | 1.53 | % | | | 1.70 | % | | | 1.90 | % |
| | (0.15 | )% | | | (0.38 | )% | | | (0.44 | )% | | | (0.18 | )% | | | (0.35 | )% |
| | 0 | % | | | 5 | % | | | 21 | % | | | 22 | % | | | 6 | % |
The accompanying notes are an integral part of these financial statements.
| HENNESSY FUNDS | 1-800-966-4354 | |
Financial Statements
For an Institutional Class share outstanding throughout each year
PER SHARE DATA:
Net asset value, beginning of year
Income from investment operations:
Net investment income (loss)
Net realized and unrealized gains on investments
Total from investment operations
Less distributions:
Dividends from net investment income
Dividends from return of capital
Total distributions
Net asset value, end of year
TOTAL RETURN
SUPPLEMENTAL DATA AND RATIOS:
Net assets, end of year (millions)
Ratio of expenses to average net assets
Ratio of net investment income (loss) to average net assets
Portfolio turnover rate(1)
| (1) | Portfolio turnover is calculated on the basis of the Fund as a whole. |
The accompanying notes are an integral part of these financial statements.
| FINANCIAL HIGHLIGHTS — INSTITUTIONAL CLASS |
| Year Ended October 31, | |
| 2017 | | | 2016 | | | 2015 | | | 2014 | | | 2013 | |
| | | | | | | | | | | | | | |
| $ | 28.45 | | | $ | 24.55 | | | $ | 22.15 | | | $ | 19.98 | | | $ | 15.60 | |
| | | | | | | | | | | | | | | | | | | |
| | | | | | | | | | | | | | | | | | | |
| | 0.03 | | | | (0.01 | ) | | | (0.02 | ) | | | 0.07 | | | | (0.03 | ) |
| | 5.16 | | | | 3.91 | | | | 2.42 | | | | 2.10 | | | | 4.42 | |
| | 5.19 | | | | 3.90 | | | | 2.40 | | | | 2.17 | | | | 4.39 | |
| | | | | | | | | | | | | | | | | | | |
| | | | | | | | | | | | | | | | | | | |
| | — | | | | — | | | | — | | | | — | | | | — | |
| | — | | | | — | | | | — | | | | — | | | | (0.01 | ) |
| | — | | | | — | | | | — | | | | — | | | | (0.01 | ) |
| $ | 33.64 | | | $ | 28.45 | | | $ | 24.55 | | | $ | 22.15 | | | $ | 19.98 | |
| | | | | | | | | | | | | | | | | | | |
| | 18.24 | % | | | 15.89 | % | | | 10.84 | % | | | 10.86 | % | | | 28.19 | % |
| | | | | | | | | | | | | | | | | | | |
| | | | | | | | | | | | | | | | | | | |
| $ | 177.42 | | | $ | 67.78 | | | $ | 54.13 | | | $ | 25.75 | | | $ | 9.07 | |
| | 1.05 | % | | | 1.17 | % | | | 1.27 | % | | | 1.50 | % | | | 1.66 | % |
| | 0.30 | % | | | (0.03 | )% | | | (0.08 | )% | | | 0.26 | % | | | (0.20 | )% |
| | 0 | % | | | 5 | % | | | 21 | % | | | 22 | % | | | 6 | % |
The accompanying notes are an integral part of these financial statements.
| HENNESSY FUNDS | 1-800-966-4354 | |
Financial Statements
Notes to the Financial Statements October 31, 2017 |
1). ORGANIZATION
The Hennessy Japan Fund (the “Fund”) is a series of Hennessy Funds Trust (the “Trust”), which was organized as a Delaware statutory trust on September 17, 1992. The Fund is an open-end management investment company registered under the Investment Company Act of 1940, as amended. The investment objective of the Fund is long-term capital appreciation. The Fund is a diversified fund, but may employ a relatively focused investment strategy and may hold securities of fewer issuers than other diversified funds.
The Fund offers Investor Class and Institutional Class shares. Each class of shares differs principally in its respective 12b-1 distribution and service, shareholder servicing, and sub-transfer agent expenses. There are no sales charges. Each class has identical rights to earnings, assets, and voting privileges, except for class-specific expenses and exclusive rights to vote on matters affecting only an individual class.
As an investment company, the Fund follows the investment company accounting and reporting guidance of the Financial Accounting Standards Board (“FASB”) Accounting Standard Codification Topic 946 “Financial Services—Investment Companies.”
2). SIGNIFICANT ACCOUNTING POLICIES
The following is a summary of significant accounting policies consistently followed by the Fund in the preparation of the financial statements. These policies conform to U.S. generally accepted accounting principles (“GAAP”).
| a). | Investment Valuation – All investments in securities are recorded at their estimated fair value, as described in Note 3. |
| | |
| b). | Federal Income Taxes – No provision for federal income taxes or excise taxes has been made because the Fund has elected to be taxed as a “regulated investment company” and intends to distribute substantially all of its taxable income to its shareholders and otherwise comply with the provisions of the Internal Revenue Code of 1986, as amended, applicable to regulated investment companies. Net investment income/loss and realized gains/losses for federal income tax purposes may differ from those reported in the financial statements because of temporary book and tax basis differences. Temporary differences are primarily the result of the treatment of wash sales for tax reporting purposes. The Fund recognizes interest and penalties related to income tax benefits, if any, in the Statement of Operations as an income tax expense. Distributions from net realized gains for book purposes may include short-term capital gains, which are included as ordinary income to shareholders for tax purposes. The Fund may utilize equalization accounting for tax purposes and designate earnings and profits, including net realized gains distributed to shareholders on redemption of shares, as part of the dividends paid deduction for income tax purposes. |
| | Due to inherent differences in the recognition of income, expenses, and realized gains/losses under GAAP and federal income tax regulations, permanent differences between book and tax basis for reporting for fiscal year 2017 have been identified and appropriately reclassified in the Statement of Assets and Liabilities. The adjustments are as follows: |
| | Accumulated | Accumulated | | |
| | Net Investment | Net Realized | | |
| | Income | Loss on Investments | Capital Stock | |
| | $(92,487) | $15,731,797 | $(15,639,310) | |
| NOTES TO THE FINANCIAL STATEMENTS |
| c). | Accounting for Uncertainty in Income Taxes – The Fund has accounting policies regarding recognition and measurement of tax positions taken or expected to be taken on a tax return. The tax returns of the Fund for the prior three fiscal years are open for examination. The Fund has reviewed all open tax years in major jurisdictions and concluded that there is no impact on the Fund’s net assets and no tax liability resulting from unrecognized tax benefits relating to uncertain income tax positions taken or expected to be taken on a tax return. The Fund’s major tax jurisdictions are U.S. federal and Delaware. |
| | |
| d). | Income and Expenses – Dividend income is recognized on the ex-dividend date or as soon as information is available to the Fund. Interest income, which includes the amortization of premium and accretion of discount, is recognized on an accrual basis. The Fund is charged for those expenses that are directly attributable to the portfolio, such as advisory, administration, and certain shareholder service fees. Income, expenses (other than expenses attributable to a specific class), and realized and unrealized gains/losses on investments are allocated to each class of shares based on such class’s net assets. |
| | |
| e). | Distributions to Shareholders – Dividends from net investment income for the Fund, if any, are declared and paid annually, usually in December. Distributions of net realized capital gains, if any, are declared and paid annually, usually in December. |
| | |
| f). | Security Transactions – Investment and shareholder transactions are recorded on the trade date. The Fund determines the realized gain/loss from an investment transaction by comparing the original cost of the security lot sold with the net sale proceeds. Discounts and premiums on securities purchased are accreted/amortized over the life of the respective security. |
| | |
| g). | Use of Estimates – The preparation of financial statements in conformity with GAAP requires management to make estimates and assumptions that affect the reported amounts of assets and liabilities and disclosure of contingent assets and liabilities at the date of the financial statements and the reported change in net assets during the reporting period. Actual results could differ from those estimates. |
| | |
| h). | Share Valuation – The net asset value (“NAV”) per share of the Fund is calculated by dividing (i) the sum of the value of the securities held by the Fund, plus cash or other assets, minus all liabilities (including estimated accrued expenses) by (ii) the total number of shares outstanding for the Fund, rounded to the nearest cent. The Fund’s shares will not be priced on days the New York Stock Exchange is closed for trading. The offering and redemption price per share for the Fund is equal to the Fund’s NAV per share. |
| | |
| i). | Foreign Currency – Values of investments denominated in foreign currencies are converted into U.S. dollars using the spot market rate of exchange at the time of valuation. Purchases and sales of investments and income are translated into U.S. dollars using the spot market rate of exchange prevailing on the respective dates of such transactions. The Fund does not isolate the portion of the results of operations resulting from fluctuations in foreign exchange rates on investments from fluctuations resulting from changes in the market prices of securities held. Such fluctuations are included with the net realized and unrealized gain/loss on investments. Foreign investments present additional risks due to currency fluctuations, economic and political factors, lower liquidity, government regulations, differences in accounting standards, and other factors. |
| HENNESSY FUNDS | 1-800-966-4354 | |
3). SECURITIES VALUATION
The Fund follows authoritative fair valuation accounting standards that establish an authoritative definition of fair value and set out a hierarchy for measuring fair value. These standards require additional disclosures about the various inputs and valuation techniques used to develop the measurements of fair value and a discussion of changes in valuation techniques and related inputs during the period. These inputs are summarized in the three broad levels listed below:
| | Level 1 – | Unadjusted, quoted prices in active markets for identical instruments that the Fund has the ability to access at the date of measurement. |
| | | |
| | Level 2 – | Other significant observable inputs (including, but not limited to, quoted prices in active markets for similar instruments, quoted prices in markets that are not active for identical or similar instruments, and model-derived valuations in which all significant inputs and significant value drivers are observable in active markets, such as interest rates, prepayment speeds, credit risk curves, default rates, and similar data). |
| | | |
| | Level 3 – | Significant unobservable inputs (including the Fund’s own assumptions about what market participants would use to price the asset or liability based on the best available information) when observable inputs are unavailable. |
Following is a description of the valuation techniques applied to the Fund’s major categories of assets and liabilities measured at fair value on a recurring basis.
| | Equity Securities – Equity securities, including common stocks, preferred stocks, foreign-issued common stocks, exchange-traded funds, closed-end mutual funds, partnerships, rights, and real estate investment trusts, that are traded on a securities exchange for which a last-quoted sales price is readily available will generally be valued at the last sales price as reported by the primary exchange on which the securities are listed. Securities listed on The NASDAQ Stock Market (“NASDAQ”) will generally be valued at the NASDAQ Official Closing Price, which may differ from the last sales price reported. Securities traded on a securities exchange for which a last-quoted sales price is not readily available will generally be valued at the mean between the bid and ask prices. To the extent these securities are actively traded and valuation adjustments are not applied, they are classified in Level 1 of the fair value hierarchy. Securities traded on foreign exchanges generally are not valued at the same time the Fund calculates its NAV because most foreign markets close well before such time. The earlier close of most foreign markets gives rise to the possibility that significant events, including broad market moves, may have occurred in the interim. In certain circumstances, it may be determined that a security needs to be fair valued because it appears that the value of the security might have been materially affected by events occurring after the close of the market in which the security is principally traded, but before the time the Fund calculates its NAV, such as by a development that affects an entire market or region (e.g., weather-related events) or a potentially global development (e.g., a terrorist attack that may be expected to have an effect on investor expectations worldwide). |
| | |
| | Registered Investment Companies – Investments in registered investment companies (e.g., mutual funds) are generally priced at the ending NAV provided by the applicable registered investment company’s service agent and will be classified in Level 1 of the fair value hierarchy. |
| | |
| | Debt Securities – Debt securities, including corporate bonds, asset-backed securities, mortgage-backed securities, municipal bonds, U.S. Treasuries, and U.S. government agency issues, are generally valued at market on the basis of valuations furnished by |
| NOTES TO THE FINANCIAL STATEMENTS |
| | an independent pricing service that utilizes both dealer-supplied valuations and formula-based techniques. The pricing service may consider recently executed transactions in securities of the issuer or comparable issuers, market price quotations (where observable), bond spreads, and fundamental data relating to the issuer. In addition, the model may incorporate observable market data, such as reported sales of similar securities, broker quotes, yields, bids, offers, and reference data. Certain securities are valued primarily using dealer quotations. These securities are generally classified in Level 2 of the fair value hierarchy. |
| | |
| | Short-Term Securities – Short-term equity investments, including money market funds, are valued in the manner specified above. Short-term debt investments with an original term to maturity of 60 days or less are valued at amortized cost, which approximates fair market value. If the original term to maturity of a short-term debt investment exceeded 60 days, then the values as of the 61st day prior to maturity are amortized. Amortized cost is not used if its use would be inappropriate due to credit or other impairments of the issuer, in which case the security’s fair value would be determined, as described below. Short-term securities are generally classified in Level 1 or Level 2 of the fair market hierarchy depending on the inputs used and market activity levels for specific securities. |
The Board of Trustees of the Fund (the “Board”) has adopted fair value pricing procedures that are followed when a price for a security is not readily available or if a significant event has occurred that indicates the closing price of a security no longer represents the true value of that security. Fair value pricing determinations are made in good faith in accordance with these procedures. There are numerous criteria that will be given consideration in determining a fair value of a security, such as the trading volume of a security and markets, the values of other similar securities, and news events with direct bearing on a security or markets. Fair value pricing results in an estimated price for a security that reflects the amount the Fund might reasonably expect to receive in a current sale. Depending on the relative significance of the valuation inputs, these securities may be classified in either Level 2 or Level 3 of the fair value hierarchy.
The fair valuation of foreign securities may be determined with the assistance of a pricing service using correlations between the movement of prices of such securities and indices of domestic securities and other appropriate indicators, such as closing market prices of relevant American Depositary Receipts or futures contracts. The effect of using fair value pricing is that the Fund’s NAV will reflect the affected portfolio securities’ values as determined by the Board or its designee instead of being determined by the market. Using a fair value pricing methodology to price a foreign security may result in a value that is different from the foreign security’s most recent closing price and from the prices used by other investment companies to calculate their NAVs and are generally classified in Level 2 of the fair valuation hierarchy. Because the Fund may invest in foreign securities, the value of the Fund’s portfolio securities may change on days when you will not be able to purchase or redeem your shares.
The Board has delegated day-to-day valuation matters to a Valuation Committee comprised of one or more representatives from Hennessy Advisors, Inc., the Fund’s investment advisor (the “Advisor”). The function of the Valuation Committee is to value securities where current and reliable market quotations are not readily available. All actions taken by the Valuation Committee are reviewed by the Board.
The Fund has performed an analysis of all existing investments to determine the significance and character of all inputs to their fair value determination. Various inputs are used to determine the value of the Fund’s investments. The inputs or methodology
| HENNESSY FUNDS | 1-800-966-4354 | |
used for valuing securities are not necessarily an indication of the risk associated with investing in those securities. Details related to the fair valuation hierarchy of the Fund’s securities as of October 31, 2017, are included in the Schedule of Investments.
4). INVESTMENT TRANSACTIONS
Purchases and sales of investment securities (excluding government and short-term investments) for the Fund during fiscal year 2017 were $94,639,014 and $0, respectively.
There were no purchases or sales/maturities of long-term U.S. government securities for the Fund during fiscal year 2017.
The Fund is permitted to purchase or sell securities from or to another fund in the Hennessy Funds family of funds (the “Hennessy Funds”) under specified conditions outlined in procedures adopted by the Board. The procedures have been designed to ensure that any purchase or sale of securities by the Fund from or to another Hennessy Fund complies with Rule 17a-7 of the Investment Company Act of 1940, as amended. For fiscal year 2017, the Fund did not engage in purchases or sales of securities pursuant to Rule 17a-7 of the Investment Company Act of 1940, as amended.
5). INVESTMENT MANAGEMENT FEE AND OTHER TRANSACTIONS WITH AFFILIATES
The Advisor provides the Fund with investment management services under an Investment Advisory Agreement. The Advisor provides all investment advice, office space, and facilities, as well as most of the personnel needed by the Fund. As compensation for its services, the Advisor is entitled to a monthly fee from the Fund. The fee is based upon the average daily net assets of the Fund at an annual rate of 0.80%, effective as of March 1, 2016. Prior to that date, the annual rate was 1.00%. The net investment advisory fees expensed by the Fund during fiscal year 2017 are included in the Statement of Operations.
The Advisor has delegated the day-to-day management of the Fund to a sub-advisor, SPARX Asset Management Co., Ltd. The Advisor pays the sub-advisory fees from its own assets, and these fees are not an additional expense of the Fund. For the most recent fiscal year, the Advisor (not the Fund) paid a sub-advisory fee, based upon the daily net assets of the Fund, at a rate of 0.35%.
The Board has approved a Shareholder Servicing Agreement for Investor Class shares of the Fund, which was instituted to compensate the Advisor for the non-investment management services it provides to the Fund. The Shareholder Servicing Agreement provides for a monthly fee paid to the Advisor at an annual rate of 0.10% of the average daily net assets of the Fund attributable to Investor Class shares. The shareholder service fees expensed by the Fund during fiscal year 2017 are included in the Statement of Operations.
The Fund has adopted a plan pursuant to Rule 12b-1 under the Investment Company Act of 1940, as amended, that authorizes payments in connection with the distribution of the Fund’s shares at an annual rate of up to 0.25% of the Fund’s average daily net assets attributable to Investor Class shares. Even though the authorized rate is up to 0.25%, the Fund is currently only using up to 0.15% of its average daily net assets attributable to Investor Class shares for such purpose. Amounts paid under the plan may be spent on any activities or expenses primarily intended to result in the sale of shares, including, but not limited to, advertising, shareholder account servicing, the printing and mailing of prospectuses to other than current shareholders, the printing and mailing of sales literature, and compensation for sales and marketing activities or to financial institutions and others, such as dealers and distributors. The distribution fees expensed by the Fund during fiscal year 2017 are included in the Statement of Operations.
| NOTES TO THE FINANCIAL STATEMENTS |
The Fund has entered into agreements with various brokers, dealers, and financial intermediaries in connection with the sale of shares of the Fund. The agreements provide for periodic payments by the Fund to the brokers, dealers, and financial intermediaries for providing certain shareholder maintenance services (sub-transfer agent expenses). These shareholder services include the pre-processing and quality control of new accounts, shareholder correspondence, answering customer inquiries regarding account status, and facilitating shareholder telephone transactions. The sub-transfer agent fees expensed by the Fund during fiscal year 2017 are included in the Statement of Operations.
U.S. Bancorp Fund Services, LLC (“USBFS”) provides the Fund with administrative, fund accounting, and transfer agent services and necessary office equipment. As administrator, USBFS is responsible for activities such as (i) preparing various federal and state regulatory filings, reports, and returns for the Fund, (ii) preparing reports and materials to be supplied to the Board, (iii) monitoring the activities of the Fund’s custodian, transfer agent, and accountants, and (iv) coordinating the preparation and payment of the Fund’s expenses and reviewing the Fund’s expense accruals. U.S. Bank, N.A., an affiliate of USBFS, serves as the Fund’s custodian. The servicing agreements between the Trust, USBFS, and U.S. Bank N.A. contain a fee schedule that is inclusive of administrative, fund accounting, custody, and transfer agent fees. The administrative, fund accounting, custody, and transfer agent fees expensed by the Fund during fiscal year 2017 are included in the Statement of Operations.
Quasar Distributors, LLC acts as the Fund’s principal underwriter in a continuous public offering of the Fund’s shares. Quasar Distributors, LLC is an affiliate of USBFS and U.S. Bank, N.A.
The officers of the Fund are affiliated with the Advisor. Such officers, with the exception of the Chief Compliance Officer and the Senior Compliance Officer, receive no compensation from the Fund for serving in their respective roles. The Fund, along with the other Hennessy Funds, makes reimbursement payments, on an equal basis, to the Advisor for a portion of the salary and benefits associated with the office of the Chief Compliance Officer and for all of the salary and benefits associated with the office of the Senior Compliance Officer. The compliance fees expensed by the Fund during fiscal year 2017 are included in the Statement of Operations.
6). GUARANTEES AND INDEMNIFICATIONS
Under the Hennessy Funds’ organizational documents, their officers and trustees are indemnified by the Hennessy Funds against certain liabilities arising out of the performance of their duties to the Hennessy Funds. Additionally, in the normal course of business, the Hennessy Funds enter into contracts with service providers that contain general indemnification clauses. The Fund’s maximum exposure under these arrangements is unknown as this would involve future claims that may be made against the Fund that have not yet occurred. Currently, the Fund expects the risk of loss to be remote.
7). LINE OF CREDIT
The Fund has an uncommitted line of credit with the other Hennessy Funds in the amount of the lesser of (i) $100,000,000 or (ii) 33.33% of each Hennessy Fund’s net assets, or 30% for the Hennessy Gas Utility Fund and 10% for the Hennessy Balanced Fund, intended to provide short-term financing, if necessary, subject to certain restrictions, in connection with shareholder redemptions. The credit facility is with the Hennessy Funds’ custodian bank, U.S. Bank, N.A. Borrowings under this arrangement bear interest at the bank’s prime rate and are secured by all of the Fund’s assets (as to its own borrowings only). During fiscal year 2017, the Fund did not have any borrowings outstanding under the line of credit.
| HENNESSY FUNDS | 1-800-966-4354 | |
8). FEDERAL TAX INFORMATION
As of October 31, 2017, the components of accumulated earnings (losses) for income tax purposes were as follows:
| | | Investments | |
| Cost of investments for tax purposes | | $ | 188,621,761 | |
| Gross tax unrealized appreciation | | $ | 76,695,159 | |
| Gross tax unrealized depreciation | | | (3,717,389 | ) |
| Net tax unrealized appreciation | | $ | 72,977,770 | |
| Undistributed ordinary income | | $ | — | |
| Undistributed long-term capital gains | | | — | |
| Total distributable earnings | | $ | — | |
| Other accumulated loss | | $ | (6,247,156 | ) |
| Total accumulated gain | | $ | 66,730,614 | |
The difference between book-basis unrealized appreciation/depreciation (as shown in the Statement of Assets and Liabilities) and tax-basis unrealized appreciation/depreciation (as shown above) is attributable primarily to wash sales.
At October 31, 2017, the Fund had capital loss carryforwards that expire as follows:
| | $ | 6,121,138 | | | October 31, 2018 |
| | $ | 109,149 | | | Unlimited Short-Term |
Capital losses sustained in fiscal year 2012 and in future taxable years will not expire and may be carried over by the Fund without limitation; however, they will retain the character of the original loss. Furthermore, any loss incurred during those taxable years will be required to be utilized prior to the losses incurred in taxable years prior to 2012. As a result of this ordering rule, pre-enactment capital loss carryforwards may be more likely to expire unused. Under pre-enactment law, capital losses could be carried forward for eight years, and carried forward as short-term capital losses, irrespective of the character of the original loss.
At October 31, 2017, the Fund did not defer, on a tax basis, any late-year ordinary losses. Late-year ordinary losses are net ordinary losses incurred after December 31, 2016, but within the taxable year, that are deemed to arise on the first day of the Fund’s next taxable year.
During fiscal years 2017 and 2016, the Fund did not pay any distributions.
9). CHANGE IN AUDITOR DISCLOSURE
On September 11, 2017, the Trust, by action of the Audit Committee of the Board and on behalf of the Fund, the Hennessy Cornerstone Growth Fund, the Hennessy Cornerstone Mid Cap 30 Fund, the Hennessy Cornerstone Large Growth Fund, the Hennessy Cornerstone Value Fund, the Hennessy Total Return Fund, the Hennessy Balanced Fund, and the Hennessy Japan Small Cap Fund (collectively, the “Applicable Funds”), dismissed KPMG LLP (“KPMG”) and engaged Tait, Weller & Baker LLP (“Tait Weller”) to serve as the independent registered public accounting firm to audit the financial statements of all series of the Trust for fiscal year 2017. Tait Weller previously served as the independent registered public accounting firm for the series of the Trust that are not one of the Applicable Funds.
KPMG’s reports on the financial statements for the Applicable Funds for each of fiscal years 2015 and 2016 contained no adverse opinion or disclaimer of opinion, nor were they qualified or modified as to uncertainty, audit scope, or accounting principles. During fiscal years 2015 and 2016 and the interim period of November 1, 2016, through September 11, 2017 (the “Interim Period”), there were no (i) disagreements with KPMG
| NOTES TO THE FINANCIAL STATEMENTS |
on any matter of accounting principles or practices, financial statement disclosure, or auditing scope or procedure, which disagreements, if not resolved to the satisfaction of KPMG, would have caused it to make reference to the subject matter of the disagreements in connection with its reports on the Applicable Funds’ financial statements for such years, nor (ii) “reportable events” of the kind described in Item 304(a)(1)(v) of Regulation S-K under the Securities Exchange Act of 1934, as amended.
During fiscal years 2015 and 2016 and the Interim Period, neither the Applicable Funds nor anyone on behalf of the Applicable Funds has consulted Tait Weller on items that concerned (a) the application of accounting principles to a specified transaction, either completed or proposed, or the type of audit opinion that might be rendered on an Applicable Fund’s financial statements, or (b) the subject of a disagreement (as defined in paragraph (a)(1)(iv) of Item 304 of Regulation S-K and related instructions) or reportable events (as described in paragraph (a)(1)(v) of Item 304 of Regulation S-K). The selection of Tait Weller does not reflect any disagreements or dissatisfaction by the Applicable Funds, the Board, or the Audit Committee with the performance of KPMG.
10). EVENTS SUBSEQUENT TO YEAR END
Management has evaluated the Fund’s related events and transactions that occurred subsequent to October 31, 2017, through the date of issuance of the Fund’s financial statements. Management has determined that there were no subsequent events requiring recognition or disclosure in the financial statements.
| HENNESSY FUNDS | 1-800-966-4354 | |
Report of Independent Registered Public Accounting Firm
To the Board of Trustees of Hennessy Funds Trust
and the Shareholders of the Hennessy Japan Fund
Novato, CA
We have audited the accompanying statement of assets and liabilities, including the schedule of investments, of the Hennessy Japan Fund (the “Fund”), a series of Hennessy Funds Trust as of October 31, 2017, and the related statement of operations, the statement of changes in net assets, and the financial highlights for the year then ended. The statement of changes in net assets for the year ended October 31, 2016 and the financial highlights for each of the four years in the period ended October 31, 2016 have been audited by other auditors, whose report dated December 22, 2016 expressed unqualified opinions on such financial statements and financial highlights. These financial statements and financial highlights are the responsibility of the Fund’s management. Our responsibility is to express an opinion on these financial statements and financial highlights based on our audit.
We conducted our audit in accordance with the standards of the Public Company Accounting Oversight Board (United States). Those standards require that we plan and perform the audit to obtain reasonable assurance about whether the financial statements and financial highlights are free of material misstatement. The Fund is not required to have, nor were we engaged to perform, an audit of the Fund’s internal control over financial reporting. Our audit included consideration of internal control over financial reporting as a basis for designing audit procedures that are appropriate in the circumstances, but not for the purposes of expressing an opinion on the effectiveness of the Fund’s internal control over financial reporting. Accordingly, we express no such opinion. An audit includes examining, on a test basis, evidence supporting the amounts and disclosures in the financial statements. Our procedures included confirmation of securities owned as of October 31, 2017, by correspondence with the custodian and brokers, or other appropriate auditing procedures where replies from brokers were not received. An audit also includes assessing the accounting principles used and significant estimates made by management, as well as evaluating the overall financial statement presentation. We believe that our audit provides a reasonable basis for our opinion.
In our opinion, the financial statements and financial highlights referred to above present fairly, in all material respects, the financial position of the Hennessy Japan Fund as of October 31, 2017, the results of its operations, the changes in its net assets, and the financial highlights for the year then ended, in conformity with accounting principles generally accepted in the United States of America.
TAIT, WELLER & BAKER LLP
Philadelphia, Pennsylvania
December 22, 2017
| REPORT OF INDEPENDENT REGISTERED PUBLIC ACCOUNTING FIRM/TRUSTEES AND OFFICERS |
Trustees and Officers of the Fund (Unaudited)
The business and affairs of the Funds are managed under the direction of the Board of Trustees of the Trust, and the Board of Trustees elects the Officers of the Trust. Beginning in March 2015, the Board of Trustees has from time to time appointed advisers to the Board of Trustees (“Advisers”), with the intention of having qualified individuals serve in an advisory capacity in order to garner experience in the mutual fund and asset management industry and be considered as potential Trustees in the future. There are currently three Advisers to the Board of Trustees: Brian Alexander, Doug Franklin, and Claire Knoles. As Advisers, Mr. Alexander, Mr. Franklin, and Ms. Knoles attend meetings of the Board and act as non-voting participants. Information pertaining to the Trustees, Advisers, and the Officers of the Trust is set forth below. The Trustees and Officers serve until their successors are duly elected and qualified or until their earlier death, resignation, or removal. Each of the Trustees oversees 14 Hennessy Funds. Unless otherwise indicated, the address of all persons listed below is 7250 Redwood Boulevard, Suite 200, Novato, CA 94945. The Fund’s Statement of Additional Information includes more information about the persons listed below and is available, without charge, upon request by calling 1-800-966-4354.
| | | | Other |
| | | | Directorships |
| | | | Held Outside |
| Name, (Year of Birth), | | | of Fund |
| and Position Held | Start Date | Principal Occupation(s) | Complex During |
with the Trust | of Service | During Past Five Years | Past Five Years(1) |
| |
| Disinterested Trustees and Advisers |
| | | | |
| J. Dennis DeSousa | January 1996 | Mr. DeSousa is a real estate investor. | None. |
| (1936) | | | |
| Trustee | | | |
| | | | |
| Robert T. Doyle | January 1996 | Mr. Doyle has been the Sheriff of | None. |
| (1947) | | Marin County, California since 1996. | |
| Trustee | | | |
| | | | |
| Gerald P. Richardson | May 2004 | Mr. Richardson is an independent | None. |
| (1945) | | consultant in the securities industry. | |
| Trustee | | | |
| | | | |
| Brian Alexander | March 2015 | Mr. Alexander has been employed | None. |
| (1981) | | by Sutter Health Novato Community | |
| Adviser to the Board | | Hospital since 2012, first as an | |
| | | Assistant Administrator and then, | |
| | | beginning in 2013, as the Chief | |
| | | Administrative Officer. From 2011 | |
| | | through 2012, Mr. Alexander was | |
| | | employed by Sutter Health West Bay | |
| | | Region as the Regional Director of | |
| | | Strategic Decision Support. | |
| HENNESSY FUNDS | 1-800-966-4354 | |
| | | | Other |
| | | | Directorships |
| | | | Held Outside |
| Name, (Year of Birth), | | | of Fund |
| and Position Held | Start Date | Principal Occupation(s) | Complex During |
with the Trust | of Service | During Past Five Years | Past Five Years(1) |
| | | | |
| Doug Franklin | March 2016 | Mr. Franklin is a retired insurance | None. |
| (1964) | | industry executive. From 1987 | |
| Adviser to the Board | | through 2015, he was employed | |
| | | by Allianz-Fireman’s Fund Insurance | |
| | | Company in various positions, | |
| | | including Chief Actuary and | |
| | | Chief Risk Officer. | |
| | | | |
| Claire Knoles | December 2015 | Ms. Knoles is a founder of Kiosk and | None. |
| (1974) | | has served as its Chief Operating | |
| Adviser to the Board | | Officer since 2004. Kiosk is a full | |
| | | service marketing agency with | |
| | | offices in the San Francisco Bay | |
| | | Area, Toronto, and Liverpool, UK. | |
| | | | |
Interested Trustee(2) | | | |
| | | | |
| Neil J. Hennessy | January 1996 as | Mr. Hennessy has been employed by | Hennessy |
| (1956) | a Trustee and | Hennessy Advisors, Inc. since 1989 | Advisors, Inc. |
| Trustee, Chairman of | June 2008 as | and currently serves as its President, | |
| the Board, Chief | an Officer | Chairman and Chief Executive Officer. | |
| Investment Officer, | | | |
| Portfolio Manager, | | | |
| and President | | | |
| Name, (Year of Birth), | | |
| and Position Held | Start Date | Principal Occupation(s) |
with the Trust | of Service | During Past Five Years |
| | | |
| Officers | | |
| | | |
| Teresa M. Nilsen | January 1996 | Ms. Nilsen has been employed by Hennessy Advisors, Inc. |
| (1966) | | since 1989 and currently serves as its Executive Vice President, |
| Executive Vice President | | Chief Operations Officer, Chief Financial Officer, and Secretary. |
| and Treasurer | | |
| | | |
| | | |
| Daniel B. Steadman | March 2000 | Mr. Steadman has been employed by Hennessy Advisors, Inc. |
| (1956) | | since 2000 and currently serves as its Executive Vice President |
| Executive Vice President | | and Chief Compliance Officer. |
| and Secretary | | |
| | | |
| | | |
| Brian Carlson | December 2013 | Mr. Carlson has been employed by Hennessy Advisors, Inc. |
| (1972) | | since December 2013. Mr. Carlson was previously a co-founder |
| Senior Vice President and | | and principal of Trivium Consultants, LLC from February 2011 |
| Head of Distribution | | through November 2013. |
| | | |
| | | |
| Jennifer Cheskiewicz | June 2013 | Ms. Cheskiewicz has been employed by Hennessy Advisors, Inc. |
| (1977) | | as its General Counsel since June 2013. She previously served |
| Senior Vice President and | | as in-house counsel to Carlson Capital, L.P., an SEC-registered |
| Chief Compliance Officer | | investment advisor to several private funds, from |
| | | February 2010 to May 2013. |
| TRUSTEES AND OFFICERS OF THE FUND |
| Name, (Year of Birth), | | |
| and Position Held | Start Date | Principal Occupation(s) |
with the Trust | of Service | During Past Five Years |
| | | |
| David Ellison | October 2012 | Mr. Ellison has been employed by Hennessy Advisors, Inc. since |
(1958)(3) | | October 2012. He has served as a Portfolio Manager of the |
| Senior Vice President | | Hennessy Small Cap Financial Fund and the Hennessy Large |
| and Portfolio Manager | | Cap Financial Fund since inception. Mr. Ellison also served as a |
| | | Portfolio Manager of the Hennessy Technology Fund from its |
| | | inception until February 2017. Mr. Ellison served as Director, |
| | | CIO and President of FBR Fund Advisers, Inc. from |
| | | December 1999 to October 2012. |
| | | |
| Ryan Kelley | March 2013 | Mr. Kelley has been employed by Hennessy Advisors, Inc. since |
(1972)(4) | | October 2012. He has served as a Portfolio Manager of the |
| Vice President and | | Hennessy Gas Utility Fund, the Hennessy Small Cap Financial |
| Portfolio Manager | | Fund, and the Hennessy Large Cap Financial Fund since |
| | | October 2014. He served as Co-Portfolio Manager of the same |
| | | funds from March 2013 through September 2014, and as a |
| | | Portfolio Analyst for the Hennessy Funds from October 2012 |
| | | through October 2014. Mr. Kelley has also served as a Portfolio |
| | | Manager of the Hennessy Cornerstone Growth Fund, the |
| | | Hennessy Cornerstone Mid Cap 30 Fund, the Hennessy |
| | | Cornerstone Large Growth Fund, and the Hennessy |
| | | Cornerstone Value Fund and as a Co-Portfolio Manager of the |
| | | Hennessy Technology Fund since February 2017. Mr. Kelley |
| | | served as Portfolio Manager of FBR Fund Advisers, Inc. from |
| | | January 2008 to October 2012. |
| | | |
| Brian Peery | March 2003 as | Mr. Peery has been employed by Hennessy Advisors, Inc. since |
| (1969) | an Officer and | 2002. He has served as a Portfolio Manager of the Hennessy |
| Senior Vice President | February 2011 | Cornerstone Growth Fund, the Hennessy Cornerstone Mid Cap |
| and Portfolio Manager | as a Co-Portfolio | 30 Fund, the Hennessy Cornerstone Large Growth Fund, the |
| | Manager or | Hennessy Cornerstone Value Fund, the Hennessy Total Return |
| | Portfolio Manager | Fund, and the Hennessy Balanced Fund since October 2014. |
| | | He served as Co-Portfolio Manager of the same funds from |
| | | February 2011 through September 2014. Mr. Peery has also |
| | | served as a Portfolio Manager of the Hennessy Gas Utility Fund |
| | | since February 2015 and as Lead Portfolio Manager of the |
| | | Hennessy Technology Fund since February 2017. |
| | | |
| Daniel P. Hennessy | December 2016 | Mr. Daniel Hennessy has been employed by Hennessy Advisors, |
| (1990) | | Inc. since 2015. He has served as an Associate Analyst of the |
| Assistant Vice President | | Hennessy Technology Fund since February 2017. He previously |
| and Associate Analyst | | served as a Mutual Fund Specialist at U.S. Bancorp Fund |
| | | Services, LLC from November 2014 to July 2015. Prior to that, |
| | | he attended the University of San Diego, where he earned a |
| | | degree in Political Science. |
(1) | Messrs. DeSousa, Doyle, Hennessy, and Richardson previously served on the Board of Directors of Hennessy Mutual Funds, Inc. (“HMFI”), The Hennessy Funds, Inc. (“HFI”), and Hennessy SPARX Funds Trust (“HSFT”). Pursuant to an internal reorganization effective as of February 28, 2014, the series of HFMI, HFI, and HSFT were reorganized into corresponding series of Hennessy Funds Trust that mirrored them. Subsequent to the reorganization, HFMI, HFI, and HSFT were dissolved. |
(2) | Mr. Hennessy is considered an “interested person,” as defined in the Investment Company Act of 1940, as amended, because he is an officer of the Hennessy Funds. |
(3) | The address of this officer is 101 Federal Street, Suite 1900, Boston, MA 02110. |
(4) | The address of this officer is 1340 Environ Way, Chapel Hill, NC 27517. |
| HENNESSY FUNDS | 1-800-966-4354 | |
Expense Example (Unaudited)
October 31, 2017
As a shareholder of the Fund, you incur two types of costs: (1) transaction costs, including sales charges (loads) on purchase payments, reinvested dividends, or other distributions, redemption fees, and exchange fees; and (2) ongoing costs, including management fees, service fees, and other Fund expenses. This Example is intended to help you understand your ongoing costs (in dollars) of investing in the Fund and to compare these costs with the ongoing costs of investing in other mutual funds. The Example is based on an investment of $1,000 invested at the beginning of the period and held for the entire period from May 1, 2017, through October 31, 2017.
Actual Expenses
The first line of the table below under the “Investor Class” and “Institutional Class” headings provides information about actual account values and actual expenses. Although the Fund charges no sales loads or transaction fees, you will be assessed fees for outgoing wire transfers, returned checks and stop payment orders at prevailing rates charged by U.S. Bancorp Fund Services, LLC, the Fund’s transfer agent. If you request that a redemption be made by wire transfer, currently a $15 fee is charged by the Fund’s transfer agent. IRA accounts will be charged a $15 annual maintenance fee. The example below includes, but is not limited to, management fees, shareholder servicing fees, fund accounting, custody, and transfer agent fees. However, the example below does not include portfolio trading commissions and related expenses, and other extraordinary expenses as determined under generally accepted accounting principles. You may use the information in this line, together with the amount you invested, to estimate the expenses that you paid over the period. Simply divide your account value by $1,000 (for example, an $8,600 account value divided by $1,000 = 8.6), then multiply the result by the number in the first line of the table under the “Investor Class” or “Institutional Class” headings in the column entitled “Expenses Paid During Period” to estimate the expenses you paid on your account during this period.
Hypothetical Example for Comparison Purposes
The second line of the table below under the “Investor Class” and “Institutional Class” headings provides information about hypothetical account values and hypothetical expenses based on the Fund’s actual expense ratios and an assumed rate of return of 5% per year before expenses, which is not the Fund’s actual return. The hypothetical account values and expenses may not be used to estimate the actual ending account balance or expenses you paid for the period. You may use this information to compare the ongoing costs of investing in the Fund and other funds. To do so, compare this 5% hypothetical example with the 5% hypothetical examples that appear in the shareholder reports of the other funds. Please note that the expenses shown in the table are meant to highlight your ongoing costs only and do not reflect any transactional costs, such as sales charges (loads), or exchange fees. Therefore, the second line of the table under the “Investor Class” and “Institutional Class” headings is useful in comparing ongoing costs only, and will not help you determine the relative total costs of owning different funds. In addition, if these transactional costs were included, your costs would have been higher.
| | | | | | | | | Expenses Paid | |
| | | Beginning | | | Ending | | | During Period(1) | |
| | | Account Value | | | Account Value | | | May 1, 2017 – | |
| | | May 1, 2017 | | | October 31, 2017 | | | October 31, 2017 | |
| | | | | | | | | | |
| Investor Class | | | | | | | | | |
| Actual | | $ | 1,000.00 | | | $ | 1,152.80 | | | $ | 7.92 | |
| Hypothetical (5% return before expenses) | | $ | 1,000.00 | | | $ | 1,017.85 | | | $ | 7.43 | |
| | | | | | | | | | | | | |
| Institutional Class | | | | | | | | | | | | |
| Actual | | $ | 1,000.00 | | | $ | 1,154.80 | | | $ | 5.70 | |
| Hypothetical (5% return before expenses) | | $ | 1,000.00 | | | $ | 1,019.91 | | | $ | 5.35 | |
(1) | Expenses are equal to the Fund’s annualized expense ratio of 1.46% for Investor Class shares or 1.05% for Institutional Class shares, as applicable, multiplied by the average account value over the period, multiplied by 184/365 days (to reflect one-half year period). |
| HENNESSY FUNDS | 1-800-966-4354 | |
How to Obtain a Copy of the Fund’s
Proxy Voting Policy and Proxy Voting Records
A description of the policies and procedures the Fund uses to determine how to vote proxies relating to portfolio securities is available without charge: (1) by calling 1-800-966-4354; (2) on the Hennessy Funds’ website at hennessyfunds.com/proxy-voting/policy.fs; or (3) on the U.S. Securities and Exchange Commission’s (the “SEC”) website at www.sec.gov. The Fund’s proxy voting record is available without charge on both the Hennessy Funds’ website at hennessyfunds.com/proxy-voting/vote.fs and the SEC’s website at www.sec.gov no later than August 31 for the prior 12 months ending June 30.
Quarterly Filings on Form N-Q
The Fund files a complete schedule of portfolio holdings with the SEC for the first and third quarters of each fiscal year on Form N-Q. The Fund’s Forms N-Q are made available on the SEC’s website at www.sec.gov. The Fund’s Forms N-Q may be reviewed and copied at the SEC’s Public Reference Room in Washington, DC, and information on the operation of the Public Reference Room may be obtained by calling 1-800-SEC-0330. Information included in the Fund’s Forms N-Q will also be available upon request by calling 1-800-966-4354.
Householding
To help keep the Fund’s costs as low as possible, we generally deliver a single copy of most financial reports and prospectuses to shareholders who share an address, even if the accounts are registered under different names. This process, known as “householding,” does not apply to account statements. You may request an individual copy of a prospectus or financial report at any time. If you would like to receive separate mailings, please call U.S. Bancorp Fund Services, LLC at 1-800-261-6950 or 1-414-765-4124 and we will begin individual delivery within 30 days of your request. If your account is held through a financial institution or other intermediary, please contact them directly to request individual delivery.
| PROXY VOTING — PRIVACY POLICY |
Privacy Policy
We collect the following non-public personal information about you:
| | • | information we receive from you on or in applications or other forms, correspondence, or conversations, including, but not limited to, your name, address, phone number, social security number, assets, income, and date of birth; and |
| | | |
| | • | information about your transactions with us, our affiliates, or others, including, but not limited to, your account number and balance, payment history, parties to transactions, cost basis information, and other financial information. |
We do not disclose any non-public personal information about our current or former shareholders to non-affiliated third parties, except as permitted by law. For example, we are permitted by law to disclose all of the information we collect, as described above, to our Transfer Agent to process your transactions. Furthermore, we restrict access to your non-public personal information to those persons who require such information to provide products or services to you. We maintain physical, electronic, and procedural safeguards that comply with federal standards to guard your non-public personal information.
In the event that you hold shares of the Fund through a financial intermediary, including, but not limited to, a broker-dealer, bank, or trust company, the privacy policy of your financial intermediary would govern how your non-public personal information will be shared with non-affiliated third parties.
| HENNESSY FUNDS | 1-800-966-4354 | |
For information, questions or assistance, please call
The Hennessy Funds
1-800-966-4354 or 1-415-899-1555
INVESTMENT ADVISOR
Hennessy Advisors, Inc.
7250 Redwood Boulevard, Suite 200
Novato, California 94945
ADMINISTRATOR,
TRANSFER AGENT,
DIVIDEND PAYING AGENT &
SHAREHOLDER SERVICING AGENT
U.S. Bancorp Fund Services, LLC
P.O. Box 701
Milwaukee, Wisconsin 53201-0701
CUSTODIAN
U.S. Bank N.A.
Custody Operations
1555 North River Center Drive, Suite 302
Milwaukee, Wisconsin 53212
TRUSTEES
Neil J. Hennessy
Robert T. Doyle
J. Dennis DeSousa
Gerald P. Richardson
COUNSEL
Foley & Lardner LLP
777 East Wisconsin Avenue
Milwaukee, Wisconsin 53202-5306
INDEPENDENT REGISTERED
PUBLIC ACCOUNTING FIRM
Tait, Weller & Baker LLP
1818 Market Street, Suite 2400
Philadelphia, Pennsylvania 19103
DISTRIBUTOR
Quasar Distributors, LLC
777 East Wisconsin Avenue
Milwaukee, Wisconsin 53202
hennessyfunds.com | 1-800-966-4354
This report has been prepared for shareholders and may be distributed to
others only if preceded or accompanied by a current prospectus.
ANNUAL REPORT
OCTOBER 31, 2017
HENNESSY JAPAN SMALL CAP FUND
Investor Class HJPSX
Institutional Class HJSIX
hennessyfunds.com | 1-800-966-4354
(This Page Intentionally Left Blank.)
Contents
| Letter to Shareholders | | | 2 |
| Performance Overview | | | 4 |
| Financial Statements | | | |
| Schedule of Investments | | | 7 |
| Statement of Assets and Liabilities | | | 12 |
| Statement of Operations | | | 13 |
| Statements of Changes in Net Assets | | | 15 |
| Financial Highlights | | | 16 |
| Notes to the Financial Statements | | | 19 |
| Report of Independent Registered Public Accounting Firm | | | 27 |
| Trustees and Officers of the Fund | | | 28 |
| Expense Example | | | 32 |
| Proxy Voting Policy and Proxy Voting Records | | | 34 |
| Quarterly Schedule of Investments | | | 34 |
| Federal Tax Distribution Information | | | 34 |
| Householding | | | 34 |
| Privacy Policy | | | 35 |
| HENNESSY FUNDS | 1-800-966-4354 | |
December 2017
Dear Hennessy Funds Shareholder:
During the 12-month period ended October 31, 2017, the Japanese stock market, as measured by the Tokyo Stock Price Index (TOPIX), increased over 19% in U.S. dollar terms.
Although there was a large decline in the Japanese market on the day after the U.S. presidential election in November 2016, the market rebounded over the next several days and gained ground steadily thereafter, spurred by two factors. First, the yen continued to weaken against the U.S. dollar, as a result of expectations for higher interest rates in the U.S. The weak currency encouraged investors to bid up the stock prices of export-oriented Japanese companies in anticipation of higher earnings. Second, market participants raised their expectations for economic growth in the U.S., hoping that President-elect Trump would loosen fiscal policy and jump-start government spending, thereby providing a boost to economic growth globally, which would benefit Japan.
The start of 2017 saw minor ebbs and flows in the Japanese stock market. Although the U.S. market continued to rally and provide support for Japanese equities, the Japanese stock market moved sideways for a period as investors became concerned that the exchange rate, which had stalled at 115 yen to one U.S. dollar, would weaken no further. Over the summer months, the Japanese stock market continued to fluctuate, rising when the yen was weak and falling when the yen rallied.
The landslide victory in the Lower House for the incumbent Liberal Democratic Party on October 22, 2017, provided a catalyst for investors, securing a stable political back drop for equities and giving Prime Minister Abe an even stronger mandate to continue with his economic reforms. Japanese equities rallied enthusiastically on the news and continued to rise through the end of the period, buoyed also by strong corporate profits growth and confirmation from the Federal Reserve in the U.S. that the central bank would continue with a policy of very gradual monetary tightening.
With stocks trading at 15x 2017 earnings, Japan remains an attractive market for global investors. Over the past five years, corporate earnings per share and the TOPIX have both risen by about 120%. In other words, even though the Japanese market has risen, it has not seen any multiple expansion over this time period and is no more expensive today relative to earnings than it was five years ago. In the third calendar quarter, Japan’s GDP grew for the 10th straight quarter, completing the longest stretch of growth since 2006. Such growth was the result of stronger personal consumption (despite the geopolitical concerns over North Korea) and higher capital spending. With Prime Minister Abe’s Liberal Democratic Party landslide victory in the Lower House election in October, we expect business-friendly and pro-growth policies to continue, keeping the economy improving. We believe Japan continues to move in the right direction with a pro-growth central bank and a reform-minded government implementing structural reforms.
While Japan continues to enjoy political stability and a sound corporate profits growth environment, we would like to reiterate our call for an acceleration in structural reforms to raise Japan’s potential economic growth rate. We believe these reforms have the power to raise consumer and business confidence so that economic actors can become more forward-looking and possibly prompted to spend money that, in turn, could produce a welcome increase in inflationary pressures. On this point, we find it encouraging that the government and the Bank of Japan have been, and we expect them to continue to be, mindful of the priorities of the business community in the pursuit of sustainable, long-term growth.
We remain optimistic about the long-term prospects for Japan and its stock market. Thank you for your continued confidence and investment in our Funds.
Sincerely,
| | |
| | |
| Tadahiro Fujimura | Masakazu Takeda |
| Portfolio Manager, | Portfolio Manager, |
| Hennessy Japan Small Cap Fund; | Hennessy Japan Fund; |
| Chief Investment Officer | Fund Manager |
| SPARX Asset Management Co., Ltd. | SPARX Asset Management Co., Ltd. |
SPARX Asset Management Co., Ltd., located in Tokyo, Japan, is the sub-advisor to the Hennessy Japan Fund and the Hennessy Japan Small Cap Fund.
Past performance does not guarantee future results.
Mutual fund investing involves risk. Principal loss is possible.
Opinions expressed are those of Tadahiro Fujimura and Masakazu Takeda and are subject to change, are not guaranteed and should not be considered investment advice.
The Tokyo Stock Price Index (TOPIX) is an unmanaged index commonly used to measure the performance of Japanese stocks. One cannot invest directly in an index.
Earnings per share is the portion of a company’s profit allocated to each outstanding share of common stock. It serves as an indicator of a company’s profitability.
| HENNESSY FUNDS | 1-800-966-4354 | |
Performance Overview (Unaudited)
CHANGE IN VALUE OF $10,000 INVESTMENT
This graph illustrates the performance of an initial investment of $10,000 made in the Fund ten years ago and assumes the reinvestment of dividends.
AVERAGE ANNUAL TOTAL RETURN FOR PERIODS ENDED OCTOBER 31, 2017
| | One | Five | Ten |
| | Year | Years | Years |
| Hennessy Japan Small Cap Fund – | | | |
| Investor Class (HJPSX) | 34.82% | 21.35% | 10.35% |
| Hennessy Japan Small Cap Fund – | | | |
Institutional Class (HJSIX)(1) | 35.17% | 21.50% | 10.41% |
Russell/Nomura Small CapTM Index | 24.61% | 15.88% | 7.01% |
| Tokyo Price Index (TOPIX) | 19.47% | 13.06% | 3.09% |
Expense ratios: 1.84% (Investor Class); 1.51% (Institutional Class)
(1) | The inception date of Institutional Class shares is June 15, 2015. Performance shown prior to the inception of Institutional Class shares reflects the performance of Investor Class shares and includes expenses that are not applicable to, and are higher than, those of Institutional Class shares. |
Performance data quoted represents past performance; past performance does not guarantee future results. The investment return and principal value of an investment will fluctuate so that an investor’s shares, when redeemed, may be worth more or less than their original cost. The performance table does not reflect the deduction of taxes that a shareholder would pay on Fund distributions or the redemption of Fund shares. Current performance of the Fund may be lower or higher than the performance quoted. Performance data current to the most recent month end may be obtained by visiting hennessyfunds.com.
The Russell/Nomura Small Cap™ Index contains the bottom 15% of the Russell/Nomura Total Market™ Index, which contains the top 98% of all stocks listed on Japan’s stock exchange and registered on Japan’s OTC market in terms of market capitalization. The Tokyo Price Index (TOPIX) is a market capitalization-weighted index of all companies listed on the First Section of the Tokyo Stock Exchange. One cannot invest directly in an index.
Frank Russell Company (“Russell”) is the source and owner of the trademarks, service marks, and copyrights related to the Russell Indexes. Russell® is a trademark of Frank Russell Company. Neither Russell nor its licensors accept any liability for any errors or omissions in the Russell Indexes or Russell ratings or underlying data and no party may rely on any Russell Indexes or Russell ratings or underlying data contained in this
communication. No further distribution of Russell data is permitted without Russell’s express written consent. Russell does not promote, sponsor, or endorse the content of this communication.
The expense ratios presented are from the most recent prospectus. The expense ratios for the current reporting period are available in the Financial Highlights section of this report.
PERFORMANCE NARRATIVE
Portfolio Managers Tadahiro Fujimura, CFA and CMA*, and Tetsuya Hirano, CMA*
SPARX Asset Management Co., Ltd. (sub-advisor)
Performance:
For the 12-month period ended October 31, 2017, the Investor Class of the Hennessy Japan Small Cap Fund returned 34.82%, outperforming both the Russell/Nomura Small Cap™ Index and the Tokyo Stock Price Index (TOPIX), which returned 24.61% and 19.47% for the same period, respectively, in U.S. Dollar terms.
The largest positive contributors to the Fund’s performance among the 33 TOPIX sub-industries were Machinery and Electric Appliances. Over the period, Machinery companies performed well due to strong demand for automation products used to improve factory productivity. In the latter half of the period, Electric Appliances companies contributed most to the positive performance of the Fund, driven by demand for semiconductors. The Fund’s strategy of avoiding investments in banks also contributed positively to the Fund’s performance. The worst performing sector was Insurance.
Among the stocks that performed well over the period, Nittoku Engineering Co., Ltd., which produces automatic winding machines, had the greatest positive impact on the Fund’s performance. Strong demand for products used in electric vehicles, such as coil-forming machines, was one of the main drivers of the company’s good performance. Another positive contributor to Fund performance was KOA Corporation, which produces resistors. Demand from customers producing in-vehicle parts and electric appliances such as air conditioners remained strong, which supported an improvement in the company’s profitability. Nissei ASB Machine Co., Ltd., the world’s second largest manufacturer of machines that produce plastic bottles, was another positive contributor. Favorable changes in several developing countries, including India, helped increase sales volumes.
As for laggards, Adastria Co., Ltd., a women’s apparel retailer, was the worst performer this year. Sales in Japan were below market expectations due to some unusual weather events. Additionally, due to stiff competition, the company’s operations in China also disappointed investors. Toyo Denki Seizo K.K., an electrical equipment producer for drive trains and automobile testing equipment, also detracted from performance. Orders had been strong, but its earnings were impacted by a delay in the opening of a new factory and worsening profitability. Press Kogyo Co., Ltd., a producer of auto components, also performed poorly as earnings were impacted by the slower than expected recovery in profitability of the company’s operations in Thailand. The Fund continues to hold all companies mentioned expect for Adastria and Press Kogyo.
Portfolio Strategy:
The Fund seeks long-term capital appreciation by investing in securities of smaller Japanese companies, defined as those with market capitalizations in the bottom 15% of all Japanese companies. It screens for small-caps that we believe have strong businesses and management, and are trading at an attractive price. Through in-depth and rigorous
| HENNESSY FUNDS | 1-800-966-4354 | |
analysis and on-site research, we identify stocks with a “value gap.” The portfolio is limited to our best ideas and is unconfined to benchmarks.
Investment Commentary:
Some investors have already started to express concern over the possibility of a correction in the Japanese stock market, which closed at its highest level in the last 20 years on November 9, 2017. However, when we consider Japan’s performance, especially over a longer time frame, the Japanese stock market’s recent rally looks less troubling. The Japanese market has been supported recently by strong fundamental factors, such as the good performance of the U.S. stock market, robust corporate profits growth, a weaker yen, and a stable situation politically. Moreover, since the 1990s, the Japanese stock market has lagged behind other developed countries’ markets significantly, due, in part, to the problem of persistent deflation. We believe the recent rally is only the start of a recovery in performance for the Japanese stock market, and that at the current level, the market has not fully priced in the improvement in the inflationary environment or the other economic and regulatory achievements of the recent past. Moreover, the PE multiple of the market remains consistent with its near-term historical averages and well below its long-term historical averages. Considering the growth potential for Japanese companies, we believe the market remains attractive going forward. Small caps outperformed large caps this past year, but they remain attractive due to their higher growth potential.
Our investment strategy remains unchanged. We invest in companies based on our fundamental bottom-up approach. In the current environment, we believe smaller and newer companies have more opportunities to grow than companies in more established industries. We intend to focus our investments to take advantage of structural changes brought about by technological innovation, an aging society, and other economic and social developments.
* Chartered Member of the Security Analysts Association of Japan
Opinions expressed are those of the Portfolio Managers as of the date written and are subject to change, are not guaranteed, and should not be considered investment advice or an indication of trading intent.
The Russell/Nomura Small Cap™ Index contains the bottom 15% of the Russell/Nomura Total Market™ Index, which contains the top 98% of all stocks listed on Japan’s stock exchange and registered on Japan’s OTC market in terms of market capitalization. The Tokyo Price Index (TOPIX) is a market capitalization-weighted index of all companies listed on the First Section of the Tokyo Stock Exchange. One cannot invest directly in an index.
The Fund invests in small- and medium-capitalization companies, which may have more limited liquidity and greater price volatility than large-capitalization companies. The Fund invests in the stocks of companies operating in Japan; single-country funds may be subject to a higher degree of risk. The Fund may experience higher fees due to investments in pooled investment vehicles (including ETFs). Please see the Fund’s prospectus for a more complete discussion of these and other risks.
References to specific securities should not be considered a recommendation to buy or sell any security. Fund holdings and sector allocations are subject to change. Please refer to the Schedule of Investments included in this report for additional portfolio information.
| PERFORMANCE OVERVIEW/SCHEDULE OF INVESTMENTS |
Financial Statements
Schedule of Investments as of October 31, 2017 |
HENNESSY JAPAN SMALL CAP FUND
(% of Net Assets)
| TOP TEN HOLDINGS (EXCLUDING CASH/CASH EQUIVALENTS) | | % NET ASSETS |
| MIRAIT Holdings Corp. | | | 2.01 | % |
| LINTEC Corp. | | | 1.95 | % |
| Hanwa Co., Ltd. | | | 1.94 | % |
| Mimaki Engineering Co., Ltd. | | | 1.92 | % |
| Nippon Koei Co., Ltd. | | | 1.90 | % |
| Sanko Gosei, Ltd. | | | 1.90 | % |
| Nihon Unisys, Ltd. | | | 1.88 | % |
| BELLSYSTEM24 Holdings, Inc. | | | 1.87 | % |
| Asia Pile Holdings Co. | | | 1.86 | % |
| Hamakyorex Co., Ltd. | | | 1.86 | % |
Note: For presentation purposes, the Fund has grouped some of the industry categories. For purposes of categorizing securities for compliance with Section 8(b)(1) of the Investment Company Act of 1940, as amended, the Fund uses more specific industry classifications.
| HENNESSY FUNDS | 1-800-966-4354 | |
| COMMON STOCKS – 90.69% | | Number | | | | | | % of | |
| | | of Shares | | | Value | | | Net Assets | |
| Consumer Discretionary – 16.73% | | | | | | | | | |
| Adastria Co., Ltd. | | | 39,000 | | | $ | 850,060 | | | | 0.86 | % |
| Aeon Fantasy Co. | | | 21,900 | | | | 859,939 | | | | 0.87 | % |
| DCM Holdings Co., Ltd. | | | 192,500 | | | | 1,768,435 | | | | 1.79 | % |
| Doshisha Co., Ltd. | | | 81,400 | | | | 1,788,757 | | | | 1.82 | % |
| Foster Electric Co., Ltd. | | | 74,200 | | | | 1,741,571 | | | | 1.77 | % |
| Hiramatsu, Inc. | | | 255,100 | | | | 1,405,986 | | | | 1.43 | % |
| Honeys Co., Ltd. | | | 123,100 | | | | 1,302,725 | | | | 1.32 | % |
| Nippon Seiki Co., Ltd. | | | 65,000 | | | | 1,506,248 | | | | 1.53 | % |
| Pacific Industrial Co., Ltd. | | | 72,700 | | | | 945,306 | | | | 0.96 | % |
| Seiren Co., Ltd. | | | 79,800 | | | | 1,392,798 | | | | 1.41 | % |
| Starts Corp., Inc. | | | 66,500 | | | | 1,803,552 | | | | 1.83 | % |
| Sun Corp. | | | 165,500 | | | | 1,127,110 | | | | 1.14 | % |
| | | | | | | | 16,492,487 | | | | 16.73 | % |
| | | | | | | | | | | | | |
| Financials – 2.47% | | | | | | | | | | | | |
| AEON Financial Service Co., Ltd. | | | 61,600 | | | | 1,322,951 | | | | 1.34 | % |
| INTELLEX Co., Ltd. | | | 59,700 | | | | 525,389 | | | | 0.54 | % |
| Lifenet Insurance Co. | | | 165,100 | | | | 583,057 | | | | 0.59 | % |
| | | | | | | | 2,431,397 | | | | 2.47 | % |
| | | | | | | | | | | | | |
| Health Care – 3.34% | | | | | | | | | | | | |
| JEOL Ltd. | | | 302,000 | | | | 1,599,747 | | | | 1.62 | % |
| Ship Healthcare Holdings, Inc. | | | 54,200 | | | | 1,694,937 | | | | 1.72 | % |
| | | | | | | | 3,294,684 | | | | 3.34 | % |
| | | | | | | | | | | | | |
| Industrials – 43.24% | | | | | | | | | | | | |
| BELLSYSTEM24 Holdings, Inc. | | | 168,600 | | | | 1,845,079 | | | | 1.87 | % |
| Benefit One, Inc. | | | 70,600 | | | | 1,356,325 | | | | 1.38 | % |
| Bunka Shutter Co., Ltd. | | | 169,500 | | | | 1,444,462 | | | | 1.47 | % |
| Daihen Corp. | | | 157,000 | | | | 1,414,714 | | | | 1.43 | % |
| Fuji Machine Manufacturing Co., Ltd. | | | 83,600 | | | | 1,594,554 | | | | 1.62 | % |
| Hamakyorex Co., Ltd. | | | 65,300 | | | | 1,832,413 | | | | 1.86 | % |
| Hanwa Co., Ltd. | | | 50,300 | | | | 1,909,130 | | | | 1.94 | % |
| Hito Communication, Inc. | | | 97,400 | | | | 1,719,931 | | | | 1.74 | % |
| Kanematsu Corp. | | | 139,100 | | | | 1,829,931 | | | | 1.86 | % |
| Kito Corp. | | | 134,300 | | | | 1,724,867 | | | | 1.75 | % |
| Kondotec, Inc. | | | 147,100 | | | | 1,561,963 | | | | 1.58 | % |
The accompanying notes are an integral part of these financial statements.
| COMMON STOCKS | | Number | | | | | | % of | |
| | | of Shares | | | Value | | | Net Assets | |
| Industrials (Continued) | | | | | | | | | |
| Maeda Kosen Co., Ltd. | | | 78,900 | | | $ | 1,369,702 | | | | 1.39 | % |
| MIRAIT Holdings Corp. | | | 151,300 | | | | 1,977,132 | | | | 2.01 | % |
| Nippon Koei Co., Ltd. | | | 51,000 | | | | 1,873,211 | | | | 1.90 | % |
| Nippon Yusoki Co., Ltd. | | | 165,700 | | | | 1,217,660 | | | | 1.24 | % |
| Nissei ASB Machine Co., Ltd. | | | 35,600 | | | | 1,581,979 | | | | 1.60 | % |
| Nittoku Engineering Co., Ltd. | | | 38,400 | | | | 1,476,981 | | | | 1.50 | % |
| Okamura Corp. | | | 159,400 | | | | 1,788,210 | | | | 1.81 | % |
| Sanko Gosei, Ltd. | | | 376,100 | | | | 1,872,876 | | | | 1.90 | % |
| Sato Holdings Corp. | | | 52,700 | | | | 1,282,286 | | | | 1.30 | % |
| SBS Holdings, Inc. | | | 206,400 | | | | 1,630,797 | | | | 1.65 | % |
| Shibuya Corp. | | | 33,800 | | | | 1,297,514 | | | | 1.32 | % |
| Takeei Corp. | | | 117,200 | | | | 1,182,262 | | | | 1.20 | % |
| Takuma Co., Ltd. | | | 113,400 | | | | 1,395,040 | | | | 1.42 | % |
| Tocalo Co., Ltd. | | | 32,800 | | | | 1,323,544 | | | | 1.34 | % |
| Tonami Holdings Co., Ltd. | | | 35,700 | | | | 1,778,749 | | | | 1.80 | % |
| Toyo Denki Seizo KK | | | 75,700 | | | | 1,344,279 | | | | 1.36 | % |
| | | | | | | | 42,625,591 | | | | 43.24 | % |
| | | | | | | | | | | | | |
| Information Technology – 15.28% | | | | | | | | | | | | |
| Aichi Tokei Denki Co., Ltd. | | | 18,200 | | | | 653,719 | | | | 0.66 | % |
| Digital Garage, Inc. | | | 81,900 | | | | 1,760,537 | | | | 1.79 | % |
| Elecom Co., Ltd. | | | 67,600 | | | | 1,354,613 | | | | 1.37 | % |
| Information Services International – Dentsu, Ltd. | | | 18,600 | | | | 413,885 | | | | 0.42 | % |
| Kakaku.com., Inc. | | | 63,500 | | | | 871,920 | | | | 0.88 | % |
| Koa Corp. | | | 62,800 | | | | 1,310,347 | | | | 1.33 | % |
| Kyosan Electric Manufacturing Co., Ltd. | | | 164,000 | | | | 937,955 | | | | 0.95 | % |
| Mimaki Engineering Co., Ltd. | | | 227,600 | | | | 1,891,182 | | | | 1.92 | % |
| NEC Networks & System Integration Corp. | | | 71,500 | | | | 1,781,807 | | | | 1.81 | % |
| Nihon Unisys, Ltd. | | | 111,700 | | | | 1,850,231 | | | | 1.88 | % |
| Suzuki Co., Ltd. | | | 52,400 | | | | 475,547 | | | | 0.48 | % |
| UMC Electronics Co., Ltd. | | | 42,100 | | | | 894,425 | | | | 0.91 | % |
| V-cube, Inc. | | | 68,900 | | | | 400,129 | | | | 0.41 | % |
| Yokowo Co., Ltd. | | | 35,400 | | | | 462,175 | | | | 0.47 | % |
| | | | | | | | 15,058,472 | | | | 15.28 | % |
The accompanying notes are an integral part of these financial statements.
| HENNESSY FUNDS | 1-800-966-4354 | |
| COMMON STOCKS | | Number | | | | | | % of | |
| | | of Shares | | | Value | | | Net Assets | |
| Materials – 9.63% | | | | | | | | | |
| Asia Pile Holdings Co. | | | 324,500 | | | $ | 1,836,625 | | | | 1.86 | % |
| Hakudo Co., Ltd. | | | 77,700 | | | | 1,548,836 | | | | 1.57 | % |
| LINTEC Corp. | | | 69,000 | | | | 1,917,638 | | | | 1.95 | % |
| MEC Co., Ltd. | | | 101,300 | | | | 1,630,185 | | | | 1.65 | % |
| Riken Technos Corp. | | | 205,500 | | | | 1,265,774 | | | | 1.29 | % |
| Toyo Kohan Co., Ltd. | | | 302,500 | | | | 1,293,421 | | | | 1.31 | % |
| | | | | | | | 9,492,479 | | | | 9.63 | % |
| Total Common Stocks | | | | | | | | | | | | |
| (Cost $71,995,279) | | | | | | | 89,395,110 | | | | 90.69 | % |
| | | | | | | | | | | | | |
| SHORT-TERM INVESTMENTS – 8.99% | | | | | | | | | | | | |
| | | | | | | | | | | | | |
| Money Market Funds – 8.99% | | | | | | | | | | | | |
| Fidelity Government Portfolio, Institutional Class, 0.92% (a) | | | 4,731,000 | | | | 4,731,000 | | | | 4.80 | % |
| The Government & Agency Portfolio, Institutional Class, 0.95% (a) | | | 4,127,213 | | | | 4,127,213 | | | | 4.19 | % |
| | | | | | | | 8,858,213 | | | | 8.99 | % |
| Total Short-Term Investments | | | | | | | | | | | | |
| (Cost $8,858,213) | | | | | | | 8,858,213 | | | | 8.99 | % |
| | | | | | | | | | | | | |
| Total Investments | | | | | | | | | | | | |
| (Cost $80,853,492) – 99.68% | | | | | | | 98,253,323 | | | | 99.68 | % |
| Other Assets in Excess of Liabilities – 0.32% | | | | | | | 318,609 | | | | 0.32 | % |
TOTAL NET ASSETS – 100.00% | | | | | | $ | 98,571,932 | | | | 100.00 | % |
Percentages are stated as a percent of net assets.
| (a) | The rate listed is the fund’s 7-day yield as of October 31, 2017. |
The accompanying notes are an integral part of these financial statements.
Summary of Fair Value Exposure at October 31, 2017
The following is a summary of the inputs used to value the Fund’s net assets as of October 31, 2017 (See Note 3 in the accompanying notes to the financial statements):
| Common Stocks | | Level 1 | | | Level 2 | | | Level 3 | | | Total | |
| Consumer Discretionary | | $ | — | | | $ | 16,492,487 | | | $ | — | | | $ | 16,492,487 | |
| Financials | | | — | | | | 2,431,397 | | | | — | | | | 2,431,397 | |
| Health Care | | | — | | | | 3,294,684 | | | | — | | | | 3,294,684 | |
| Industrials | | | — | | | | 42,625,591 | | | | — | | | | 42,625,591 | |
| Information Technology | | | — | | | | 15,058,472 | | | | — | | | | 15,058,472 | |
| Materials | | | — | | | | 9,492,479 | | | | — | | | | 9,492,479 | |
| Total Common Stocks | | $ | — | | | $ | 89,395,110 | | | $ | — | | | $ | 89,395,110 | |
| Short-Term Investments | | | | | | | | | | | | | | | | |
| Money Market Funds | | $ | 8,858,213 | | | $ | — | | | $ | — | | | $ | 8,858,213 | |
| Total Short-Term Investments | | $ | 8,858,213 | | | $ | — | | | $ | — | | | $ | 8,858,213 | |
| Total Investments | | $ | 8,858,213 | | | $ | 89,395,110 | | | $ | — | | | $ | 98,253,323 | |
Transfers between levels are recognized at the end of the reporting period. During the year ended October 31, 2017, the Fund recognized significant transfers between Levels 1 and 2.
Transfers between Level 1 and Level 2 relate to the use of fair valuation pricing service. On days when the fair valuation pricing service is used, non-U.S. dollar denominated securities move from a Level 1 to a Level 2 classification. 100% of common stocks held at October 31, 2016, were classified as Level 1. Such securities still held at October 31, 2017, were transferred to Level 2. Other than transfers due to the fair value pricing services, no transfers were recognized.
The accompanying notes are an integral part of these financial statements.
| HENNESSY FUNDS | 1-800-966-4354 | |
Financial Statements
Statement of Assets and Liabilities as of October 31, 2017 |
| ASSETS: | | | |
| Investments in securities, at value (cost $80,853,492) | | $ | 98,253,323 | |
| Dividends and interest receivable | | | 460,231 | |
| Receivable for fund shares sold | | | 3,258,407 | |
| Receivable for securities sold | | | 286,107 | |
| Prepaid expenses and other assets | | | 20,818 | |
| Total Assets | | | 102,278,886 | |
| | | | | |
| LIABILITIES: | | | | |
| Payable for securities purchased | | | 3,522,429 | |
| Payable for fund shares redeemed | | | 46,587 | |
| Payable to advisor | | | 60,766 | |
| Payable to administrator | | | 13,809 | |
| Payable to auditor | | | 21,269 | |
| Accrued distribution fees | | | 10,782 | |
| Accrued service fees | | | 5,443 | |
| Accrued trustees fees | | | 5,571 | |
| Accrued expenses and other payables | | | 20,298 | |
| Total Liabilities | | | 3,706,954 | |
| NET ASSETS | | $ | 98,571,932 | |
| | | | | |
| NET ASSETS CONSIST OF: | | | | |
| Capital stock | | $ | 79,122,704 | |
| Accumulated net investment loss | | | (37,056 | ) |
| Accumulated net realized gain on investments | | | 2,093,327 | |
| Unrealized net appreciation on investments | | | 17,392,957 | |
| Total Net Assets | | $ | 98,571,932 | |
| | | | | |
| NET ASSETS | | | | |
| Investor Class: | | | | |
| Shares authorized (no par value) | | Unlimited | |
| Net assets applicable to outstanding Investor Class shares | | $ | 69,862,612 | |
| Shares issued and outstanding | | | 4,683,424 | |
| Net asset value, offering price and redemption price per share | | $ | 14.92 | |
| | | | | |
| Institutional Class: | | | | |
| Shares authorized (no par value) | | Unlimited | |
| Net assets applicable to outstanding Institutional Class shares | | $ | 28,709,320 | |
| Shares issued and outstanding | | | 1,949,805 | |
| Net asset value, offering price and redemption price per share | | $ | 14.72 | |
The accompanying notes are an integral part of these financial statements.
| STATEMENT OF ASSETS AND LIABILITIES/STATEMENT OF OPERATIONS |
Financial Statements
Statement of Operations for the year ended October 31, 2017 |
| INVESTMENT INCOME: | | | |
Dividend income(1) | | $ | 928,313 | |
| Interest income | | | 33,510 | |
| Total investment income | | | 961,823 | |
| | | | | |
| EXPENSES: | | | | |
| Investment advisory fees (See Note 5) | | | 409,461 | |
| Sub-transfer agent expenses – Investor Class (See Note 5) | | | 100,044 | |
| Sub-transfer agent expenses – Institutional Class (See Note 5) | | | 7,866 | |
| Distribution fees – Investor Class (See Note 5) | | | 64,948 | |
| Administration, fund accounting, custody and transfer agent fees (See Note 5) | | | 48,772 | |
| Service fees – Investor Class (See Note 5) | | | 43,299 | |
| Federal and state registration fees | | | 31,204 | |
| Compliance expense (See Note 5) | | | 28,705 | |
| Audit fees | | | 21,213 | |
| Trustees’ fees and expenses | | | 16,131 | |
| Reports to shareholders | | | 10,595 | |
| Interest expense (See Note 7) | | | 106 | |
| Other expenses | | | 5,466 | |
| Total expenses | | | 787,810 | |
| NET INVESTMENT INCOME | | $ | 174,013 | |
| | | | | |
| REALIZED AND UNREALIZED GAINS: | | | | |
| Net realized gain on investments | | $ | 2,713,582 | |
| Net change in unrealized appreciation on investments | | | 13,111,946 | |
| Net gain on investments | | | 15,825,528 | |
| NET INCREASE IN NET ASSETS RESULTING FROM OPERATIONS | | $ | 15,999,541 | |
(1) | Net of foreign taxes withheld of $103,013. |
The accompanying notes are an integral part of these financial statements.
| HENNESSY FUNDS | 1-800-966-4354 | |
(This Page Intentionally Left Blank.)
| STATEMENTS OF CHANGES IN NET ASSETS |
Financial Statements
| Statements of Changes in Net Assets |
| | | Year Ended | | | Year Ended | |
| | | October 31, 2017 | | | October 31, 2016 | |
| OPERATIONS: | | | | | | |
| Net investment income | | $ | 174,013 | | | $ | 80,621 | |
| Net realized gain on investments | | | 2,713,582 | | | | 284,136 | |
| Net change in unrealized appreciation on investments | | | 13,111,946 | | | | 3,031,098 | |
| Net increase in net assets resulting from operations | | | 15,999,541 | | | | 3,395,855 | |
| | | | | | | | | |
| DISTRIBUTIONS TO SHAREHOLDERS FROM: | | | | | | | | |
| Net investment income – Investor Class | | | (307,249 | ) | | | — | |
| Net investment income – Institutional Class | | | (7,754 | ) | | | — | |
| Net realized gains – Investor Class | | | (243,524 | ) | | | (821,234 | ) |
| Net realized gains – Institutional Class | | | (29,850 | ) | | | (94,663 | ) |
| Total distributions | | | (588,377 | ) | | | (915,897 | ) |
| | | | | | | | | |
| CAPITAL SHARE TRANSACTIONS: | | | | | | | | |
| Proceeds from shares subscribed – Investor Class | | | 49,025,671 | | | | 11,724,005 | |
| Proceeds from shares subscribed – Institutional Class | | | 27,290,706 | | | | 1,833,391 | |
| Dividends reinvested – Investor Class | | | 545,989 | | | | 815,922 | |
| Dividends reinvested – Institutional Class | | | 37,604 | | | | 94,664 | |
| Cost of shares redeemed – Investor Class | | | (18,881,862 | ) | | | (11,136,397 | ) |
| Cost of shares redeemed – Institutional Class | | | (4,516,415 | ) | | | (1,481,809 | ) |
| Net increase in net assets derived | | | | | | | | |
| from capital share transactions | | | 53,501,693 | | | | 1,849,776 | |
| TOTAL INCREASE IN NET ASSETS | | | 68,912,857 | | | | 4,329,734 | |
| | | | | | | | | |
| NET ASSETS: | | | | | | | | |
| Beginning of year | | | 29,659,075 | | | | 25,329,341 | |
| End of year | | $ | 98,571,932 | | | $ | 29,659,075 | |
| Undistributed net investment | | | | | | | | |
| income (loss), end of year | | $ | (37,056 | ) | | $ | 7,575 | |
| | | | | | | | | |
| CHANGES IN SHARES OUTSTANDING: | | | | | | | | |
| Shares sold – Investor Class | | | 3,750,829 | | | | 1,125,046 | |
| Shares sold – Institutional Class | | | 2,024,977 | | | | 181,517 | |
| Shares issued to holders as reinvestment | | | | | | | | |
| of dividends – Investor Class | | | 49,783 | | | | 81,186 | |
| Shares issued to holders as reinvestment | | | | | | | | |
| of dividends – Institutional Class | | | 3,468 | | | | 9,401 | |
| Shares redeemed – Investor Class | | | (1,440,939 | ) | | | (1,087,726 | ) |
| Shares redeemed – Institutional Class | | | (380,799 | ) | | | (145,946 | ) |
| Net increase in shares outstanding | | | 4,007,319 | | | | 163,478 | |
The accompanying notes are an integral part of these financial statements.
| HENNESSY FUNDS | 1-800-966-4354 | |
Financial Statements
For an Investor Class share outstanding throughout each year
PER SHARE DATA:
Net asset value, beginning of year
Income from investment operations:
Net investment income (loss)
Net realized and unrealized gains on investments
Total from investment operations
Less distributions:
Dividends from net investment income
Dividends from net realized gains
Total distributions
Net asset value, end of year
TOTAL RETURN
SUPPLEMENTAL DATA AND RATIOS:
Net assets, end of year (millions)
Ratio of expenses to average net assets
Ratio of net investment income (loss) to average net assets
Portfolio turnover rate(1)
(1) | Portfolio turnover is calculated on the basis of the Fund as a whole. |
The accompanying notes are an integral part of these financial statements.
| FINANCIAL HIGHLIGHTS — INVESTOR CLASS |
| Year Ended October 31, | |
| 2017 | | | 2016 | | | 2015 | | | 2014 | | | 2013 | |
| | | | | | | | | | | | | | |
| $ | 11.29 | | | $ | 10.29 | | | $ | 10.51 | | | $ | 11.70 | | | $ | 10.54 | |
| | | | | | | | | | | | | | | | | | | |
| | | | | | | | | | | | | | | | | | | |
| | 0.08 | | | | 0.03 | | | | (0.02 | ) | | | (0.04 | ) | | | 0.06 | |
| | 3.77 | | | | 1.31 | | | | 0.71 | | | | 1.36 | | | | 3.44 | |
| | 3.85 | | | | 1.34 | | | | 0.69 | | | | 1.32 | | | | 3.50 | |
| | | | | | | | | | | | | | | | | | | |
| | | | | | | | | | | | | | | | | | | |
| | (0.12 | ) | | | — | | | | — | | | | — | | | | — | |
| | (0.10 | ) | | | (0.34 | ) | | | (0.91 | ) | | | (2.51 | ) | | | (2.34 | ) |
| | (0.22 | ) | | | (0.34 | ) | | | (0.91 | ) | | | (2.51 | ) | | | (2.34 | ) |
| $ | 14.92 | | | $ | 11.29 | | | $ | 10.29 | | | $ | 10.51 | | | $ | 11.70 | |
| | | | | | | | | | | | | | | | | | | |
| | 34.82 | % | | | 13.44 | % | | | 7.37 | % | | | 13.99 | % | | | 40.59 | % |
| | | | | | | | | | | | | | | | | | | |
| | | | | | | | | | | | | | | | | | | |
| $ | 69.86 | | | $ | 26.23 | | | $ | 22.68 | | | $ | 19.36 | | | $ | 14.82 | |
| | 1.60 | % | | | 1.91 | % | | | 2.12 | % | | | 2.24 | % | | | 2.39 | % |
| | 0.26 | % | | | 0.25 | % | | | (0.38 | )% | | | (0.39 | )% | | | (0.11 | )% |
| | 41 | % | | | 22 | % | | | 75 | % | | | 63 | % | | | 141 | % |
The accompanying notes are an integral part of these financial statements.
| HENNESSY FUNDS | 1-800-966-4354 | |
Financial Statements
For an Institutional Class share outstanding throughout each period
| | | | | | Period Ended | |
| | | Year Ended October 31, | | | October 31, | |
| | | 2017 | | | 2016 | | | 2015(1) | |
| PER SHARE DATA: | | | | | | | | | |
| Net asset value, beginning of period | | $ | 11.33 | | | $ | 10.30 | | | $ | 10.89 | |
| | | | | | | | | | | | | |
| Income from investment operations: | | | | | | | | | | | | |
| Net investment income (loss) | | | 0.05 | | | | 0.06 | | | | (0.01 | ) |
| Net realized and unrealized | | | | | | | | | | | | |
| gains (losses) on investments | | | 3.78 | | | | 1.31 | | | | (0.58 | ) |
| Total from investment operations | | | 3.83 | | | | 1.37 | | | | (0.59 | ) |
| | | | | | | | | | | | | |
| Less distributions: | | | | | | | | | | | | |
| Dividends from net investment income | | | (0.10 | ) | | | — | | | | — | |
| Dividends from net realized gains | | | (0.34 | ) | | | (0.34 | ) | | | — | |
| Total distributions | | | (0.44 | ) | | | (0.34 | ) | | | — | |
| Net asset value, end of period | | $ | 14.72 | | | $ | 11.33 | | | $ | 10.30 | |
| | | | | | | | | | | | | |
| TOTAL RETURN | | | 35.17 | % | | | 13.73 | % | | | (5.42 | )%(2) |
| | | | | | | | | | | | | |
| SUPPLEMENTAL DATA AND RATIOS: | | | | | | | | | | | | |
| Net assets, end of period (millions) | | $ | 28.71 | | | $ | 3.42 | | | $ | 2.65 | |
| Ratio of expenses to average net assets | | | 1.19 | % | | | 1.63 | % | | | 1.86 | %(3) |
| Ratio of net investment income (loss) | | | | | | | | | | | | |
| to average net assets | | | 0.80 | % | | | 0.63 | % | | | (1.04 | )%(3) |
Portfolio turnover rate(4) | | | 41 | % | | | 22 | % | | | 75 | %(2) |
(1) | The Institutional Class shares commenced operations on June 15, 2015. |
(2) | Not annualized. |
(3) | Annualized. |
(4) | Portfolio turnover is calculated on the basis of the Fund as a whole. |
The accompanying notes are an integral part of these financial statements.
| FINANCIAL HIGHLIGHTS — INSTITUTIONAL CLASS/NOTES TO THE FINANCIAL STATEMENTS |
Financial Statements
Notes to the Financial Statements October 31, 2017 |
1). ORGANIZATION
The Hennessy Japan Small Cap Fund (the “Fund”) is a series of Hennessy Funds Trust (the “Trust”), which was organized as a Delaware statutory trust on September 17, 1992. The Fund is an open-end management investment company registered under the Investment Company Act of 1940, as amended. The Fund did not have Institutional Class shares until June 15, 2015. The investment objective of the Fund is long-term capital appreciation. The Fund is a diversified fund.
The Fund offers Investor Class and Institutional Class shares. Each class of shares differs principally in its respective 12b-1 distribution and service, shareholder servicing, and sub-transfer agent expenses. There are no sales charges. Each class has identical rights to earnings, assets, and voting privileges, except for class-specific expenses and exclusive rights to vote on matters affecting only an individual class.
As an investment company, the Fund follows the investment company accounting and reporting guidance of the Financial Accounting Standards Board (“FASB”) Accounting Standard Codification Topic 946 “Financial Services—Investment Companies.”
2). SIGNIFICANT ACCOUNTING POLICIES
The following is a summary of significant accounting policies consistently followed by the Fund in the preparation of the financial statements. These policies conform to U.S. generally accepted accounting principles (“GAAP”).
| a). | Investment Valuation – All investments in securities are recorded at their estimated fair value, as described in Note 3. |
| | |
| b). | Federal Income Taxes – No provision for federal income taxes or excise taxes has been made because the Fund has elected to be taxed as a “regulated investment company” and intends to distribute substantially all of its taxable income to its shareholders and otherwise comply with the provisions of the Internal Revenue Code of 1986, as amended, applicable to regulated investment companies. Net investment income/loss and realized gains/losses for federal income tax purposes may differ from those reported in the financial statements because of temporary book and tax basis differences. Temporary differences are primarily the result of the treatment of wash sales for tax reporting purposes. The Fund recognizes interest and penalties related to income tax benefits, if any, in the Statement of Operations as an income tax expense. Distributions from net realized gains for book purposes may include short-term capital gains, which are included as ordinary income to shareholders for tax purposes. The Fund may utilize equalization accounting for tax purposes and designate earnings and profits, including net realized gains distributed to shareholders on redemption of shares, as part of the dividends paid deduction for income tax purposes. |
| | Due to inherent differences in the recognition of income, expenses, and realized gains/losses under GAAP and federal income tax regulations, permanent differences between book and tax basis for reporting for fiscal year 2017 have been identified and appropriately reclassified in the Statement of Assets and Liabilities. The adjustments are as follows: |
| | Accumulated | Accumulated | | |
| | Net Investment | Net Realized | | |
| | Loss | Gain on Investments | Capital Stock | |
| | $96,359 | $(530,565) | $434,206 | |
| HENNESSY FUNDS | 1-800-966-4354 | |
| c). | Accounting for Uncertainty in Income Taxes – The Fund has accounting policies regarding recognition and measurement of tax positions taken or expected to be taken on a tax return. The tax returns of the Fund for the prior three fiscal years are open for examination. The Fund has reviewed all open tax years in major jurisdictions and concluded that there is no impact on the Fund’s net assets and no tax liability resulting from unrecognized tax benefits relating to uncertain income tax positions taken or expected to be taken on a tax return. The Fund’s major tax jurisdictions are U.S. federal and Delaware. |
| | |
| d). | Income and Expenses – Dividend income is recognized on the ex-dividend date or as soon as information is available to the Fund. Interest income, which includes the amortization of premium and accretion of discount, is recognized on an accrual basis. The Fund is charged for those expenses that are directly attributable to the portfolio, such as advisory, administration, and certain shareholder service fees. Income, expenses (other than expenses attributable to a specific class), and realized and unrealized gains/losses on investments are allocated to each class of shares based on such class’s net assets. |
| | |
| e). | Distributions to Shareholders – Dividends from net investment income for the Fund, if any, are declared and paid annually, usually in December. Distributions of net realized capital gains, if any, are declared and paid annually, usually in December. |
| | |
| f). | Security Transactions – Investment and shareholder transactions are recorded on the trade date. The Fund determines the realized gain/loss realized from an investment transaction by comparing the original cost of the security lot sold with the net sale proceeds. Discounts and premiums on securities purchased are accreted/amortized over the life of the respective security. |
| | |
| g). | Use of Estimates – The preparation of financial statements in conformity with GAAP requires management to make estimates and assumptions that affect the reported amounts of assets and liabilities and disclosure of contingent assets and liabilities at the date of the financial statements and the reported change in net assets during the reporting period. Actual results could differ from those estimates. |
| | |
| h). | Share Valuation – The net asset value (“NAV”) per share of the Fund is calculated by dividing (i) the sum of the value of the securities held by the Fund, plus cash or other assets, minus all liabilities (including estimated accrued expenses) by (ii) the total number of shares outstanding for the Fund, rounded to the nearest cent. The Fund’s shares will not be priced on days the New York Stock Exchange is closed for trading. The offering and redemption price per share for the Fund is equal to the Fund’s NAV per share. |
| | |
| i). | Foreign Currency – Values of investments denominated in foreign currencies are converted into U.S. dollars using the spot market rate of exchange at the time of valuation. Purchases and sales of investments and income are translated into U.S. dollars using the spot market rate of exchange prevailing on the respective dates of such transactions. The Fund does not isolate the portion of the results of operations resulting from fluctuations in foreign exchange rates on investments from fluctuations resulting from changes in the market prices of securities held. Such fluctuations are included with the net realized and unrealized gain/loss on investments. Foreign investments present additional risks due to currency fluctuations, economic and political factors, lower liquidity, government regulations, differences in accounting standards, and other factors. |
| NOTES TO THE FINANCIAL STATEMENTS |
3). SECURITIES VALUATION
The Fund follows authoritative fair valuation accounting standards that establish an authoritative definition of fair value and set out a hierarchy for measuring fair value. These standards require additional disclosures about the various inputs and valuation techniques used to develop the measurements of fair value and a discussion of changes in valuation techniques and related inputs during the period. These inputs are summarized in the three broad levels listed below:
| | Level 1 – | Unadjusted, quoted prices in active markets for identical instruments that the Fund has the ability to access at the date of measurement. |
| | | �� |
| | Level 2 – | Other significant observable inputs (including, but not limited to, quoted prices in active markets for similar instruments, quoted prices in markets that are not active for identical or similar instruments, and model-derived valuations in which all significant inputs and significant value drivers are observable in active markets, such as interest rates, prepayment speeds, credit risk curves, default rates, and similar data). |
| | | |
| | Level 3 – | Significant unobservable inputs (including the Fund’s own assumptions about what market participants would use to price the asset or liability based on the best available information) when observable inputs are unavailable. |
Following is a description of the valuation techniques applied to the Fund’s major categories of assets and liabilities measured at fair value on a recurring basis.
| | Equity Securities – Equity securities, including common stocks, preferred stocks, foreign-issued common stocks, exchange-traded funds, closed-end mutual funds, partnerships, rights, and real estate investment trusts, that are traded on a securities exchange for which a last-quoted sales price is readily available will generally be valued at the last sales price as reported by the primary exchange on which the securities are listed. Securities listed on The NASDAQ Stock Market (“NASDAQ”) will generally be valued at the NASDAQ Official Closing Price, which may differ from the last sales price reported. Securities traded on a securities exchange for which a last-quoted sales price is not readily available will generally be valued at the mean between the bid and ask prices. To the extent these securities are actively traded and valuation adjustments are not applied, they are classified in Level 1 of the fair value hierarchy. Securities traded on foreign exchanges generally are not valued at the same time the Fund calculates its NAV because most foreign markets close well before such time. The earlier close of most foreign markets gives rise to the possibility that significant events, including broad market moves, may have occurred in the interim. In certain circumstances, it may be determined that a security needs to be fair valued because it appears that the value of the security might have been materially affected by events occurring after the close of the market in which the security is principally traded, but before the time the Fund calculates its NAV, such as by a development that affects an entire market or region (e.g., weather-related events) or a potentially global development (e.g., a terrorist attack that may be expected to have an effect on investor expectations worldwide). |
| | |
| | Registered Investment Companies – Investments in registered investment companies (e.g., mutual funds) are generally priced at the ending NAV provided by the applicable registered investment company’s service agent and will be classified in Level 1 of the fair value hierarchy. |
| | |
| | Debt Securities – Debt securities, including corporate bonds, asset-backed securities, mortgage-backed securities, municipal bonds, U.S. Treasuries, and U.S. government agency issues, are generally valued at market on the basis of valuations furnished by |
| HENNESSY FUNDS | 1-800-966-4354 | |
| | an independent pricing service that utilizes both dealer-supplied valuations and formula-based techniques. The pricing service may consider recently executed transactions in securities of the issuer or comparable issuers, market price quotations (where observable), bond spreads, and fundamental data relating to the issuer. In addition, the model may incorporate observable market data, such as reported sales of similar securities, broker quotes, yields, bids, offers, and reference data. Certain securities are valued primarily using dealer quotations. These securities are generally classified in Level 2 of the fair value hierarchy. |
| | |
| | Short-Term Securities – Short-term equity investments, including money market funds, are valued in the manner specified above. Short-term debt investments with an original term to maturity of 60 days or less are valued at amortized cost, which approximates fair market value. If the original term to maturity of a short-term debt investment exceeded 60 days, then the values as of the 61st day prior to maturity are amortized. Amortized cost is not used if its use would be inappropriate due to credit or other impairments of the issuer, in which case the security’s fair value would be determined, as described below. Short-term securities are generally classified in Level 1 or Level 2 of the fair market hierarchy depending on the inputs used and market activity levels for specific securities. |
The Board of Trustees of the Fund (the “Board”) has adopted fair value pricing procedures that are followed when a price for a security is not readily available or if a significant event has occurred that indicates the closing price of a security no longer represents the true value of that security. Fair value pricing determinations are made in good faith in accordance with these procedures. There are numerous criteria that will be given consideration in determining a fair value of a security, such as the trading volume of a security and markets, the values of other similar securities, and news events with direct bearing on a security or markets. Fair value pricing results in an estimated price for a security that reflects the amount the Fund might reasonably expect to receive in a current sale. Depending on the relative significance of the valuation inputs, these securities may be classified in either Level 2 or Level 3 of the fair value hierarchy.
The fair valuation of foreign securities may be determined with the assistance of a pricing service using correlations between the movement of prices of such securities and indices of domestic securities and other appropriate indicators, such as closing market prices of relevant American Depositary Receipts or futures contracts. The effect of using fair value pricing is that the Fund’s NAV will reflect the affected portfolio securities’ values as determined by the Board or its designee instead of being determined by the market. Using a fair value pricing methodology to price a foreign security may result in a value that is different from the foreign security’s most recent closing price and from the prices used by other investment companies to calculate their NAVs and are generally classified in Level 2 of the fair valuation hierarchy. Because the Fund may invest in foreign securities, the value of the Fund’s portfolio securities may change on days when you will not be able to purchase or redeem your shares.
The Board has delegated day-to-day valuation matters to a Valuation Committee comprised of one or more representatives from Hennessy Advisors, Inc., the Fund’s investment advisor (the “Advisor”). The function of the Valuation Committee is to value securities where current and reliable market quotations are not readily available. All actions taken by the Valuation Committee are reviewed by the Board.
The Fund has performed an analysis of all existing investments to determine the significance and character of all inputs to their fair value determination. Various inputs are used to determine the value of the Fund’s investments. The inputs or methodology
| NOTES TO THE FINANCIAL STATEMENTS |
used for valuing securities are not necessarily an indication of the risk associated with investing in those securities. Details related to the fair valuation hierarchy of the Fund’s securities as of October 31, 2017, are included in the Schedule of Investments.
4). INVESTMENT TRANSACTIONS
Purchases and sales of investment securities (excluding government and short-term investments) for the Fund during fiscal year 2017 were $65,244,764 and $19,629,490, respectively.
There were no purchases or sales/maturities of long-term U.S. government securities for the Fund during fiscal year 2017.
The Fund is permitted to purchase or sell securities from or to another fund in the Hennessy Funds family of funds (the “Hennessy Funds”) under specified conditions outlined in procedures adopted by the Board. The procedures have been designed to ensure that any purchase or sale of securities by the Fund from or to another Hennessy Fund complies with Rule 17a-7 of the Investment Company Act of 1940, as amended. For fiscal year 2017, the Fund did not engage in purchases or sales of securities pursuant to Rule 17a-7 of the Investment Company Act of 1940, as amended.
5). INVESTMENT MANAGEMENT FEE AND OTHER TRANSACTIONS WITH AFFILIATES
The Advisor provides the Fund with investment management services under an Investment Advisory Agreement. The Advisor provides all investment advice, office space, and facilities, as well as most of the personnel needed by the Fund. As compensation for its services, the Advisor is entitled to a monthly fee from the Fund. The fee is based upon the average daily net assets of the Fund at an annual rate of 0.80%, effective as of March 1, 2016. Prior to that date, the annual rate was 1.20%. The net investment advisory fees expensed by the Fund during fiscal year 2017 are included in the Statement of Operations.
The Advisor has delegated the day-to-day management of the Fund to a sub-advisor, SPARX Asset Management Co., Ltd. The Advisor pays the sub-advisory fees from its own assets, and these fees are not an additional expense of the Fund. For the most recent fiscal year, the Advisor (not the Fund) paid a sub-advisory fee, based upon the daily net assets of the Fund, at a rate of 0.20%.
The Board has approved a Shareholder Servicing Agreement for Investor Class shares of the Fund, which was instituted to compensate the Advisor for the non-investment management services it provides to the Fund. The Shareholder Servicing Agreement provides for a monthly fee paid to the Advisor at an annual rate of 0.10% of the average daily net assets of the Fund attributable to Investor Class shares. The shareholder service fees expensed by the Fund during fiscal year 2017 are included in the Statement of Operations.
The Fund has adopted a plan pursuant to Rule 12b-1 under the Investment Company Act of 1940, as amended, that authorizes payments in connection with the distribution of the Fund’s shares at an annual rate of up to 0.25% of the Fund’s average daily net assets attributable to Investor Class shares. Even though the authorized rate is up to 0.25%, the Fund is currently only using up to 0.15% of its average daily net assets attributable to Investor Class shares for such purpose. Amounts paid under the plan may be spent on any activities or expenses primarily intended to result in the sale of shares, including, but not limited to, advertising, shareholder account servicing, the printing and mailing of prospectuses to other than current shareholders, the printing and mailing of sales literature, and compensation for sales and marketing activities or to financial institutions and others, such as dealers and distributors. The distribution fees expensed by the Fund during fiscal year 2017 are included in the Statement of Operations.
| HENNESSY FUNDS | 1-800-966-4354 | |
The Fund has entered into agreements with various brokers, dealers, and financial intermediaries in connection with the sale of shares of the Fund. The agreements provide for periodic payments by the Fund to the brokers, dealers, and financial intermediaries for providing certain shareholder maintenance services (sub-transfer agent expenses). These shareholder services include the pre-processing and quality control of new accounts, shareholder correspondence, answering customer inquiries regarding account status, and facilitating shareholder telephone transactions. The sub-transfer agent fees expensed by the Fund during fiscal year 2017 are included in the Statement of Operations.
U.S. Bancorp Fund Services, LLC (“USBFS”) provides the Fund with administrative, fund accounting, and transfer agent services and necessary office equipment. As administrator, USBFS is responsible for activities such as (i) preparing various federal and state regulatory filings, reports, and returns for the Fund, (ii) preparing reports and materials to be supplied to the Board, (iii) monitoring the activities of the Fund’s custodian, transfer agent, and accountants, and (iv) coordinating the preparation and payment of the Fund’s expenses and reviewing the Fund’s expense accruals. U.S. Bank, N.A., an affiliate of USBFS, serves as the Fund’s custodian. The servicing agreements between the Trust, USBFS, and U.S. Bank N.A. contain a fee schedule that is inclusive of administrative, fund accounting, custody, and transfer agent fees. The administrative, fund accounting, custody, and transfer agent fees expensed by the Fund during fiscal year 2017 are included in the Statement of Operations.
Quasar Distributors, LLC acts as the Fund’s principal underwriter in a continuous public offering of the Fund’s shares. Quasar Distributors, LLC is an affiliate of USBFS and U.S. Bank, N.A.
The officers of the Fund are affiliated with the Advisor. Such officers, with the exception of the Chief Compliance Officer and the Senior Compliance Officer, receive no compensation from the Fund for serving in their respective roles. The Fund, along with the other Hennessy Funds, makes reimbursement payments, on an equal basis, to the Advisor for a portion of the salary and benefits associated with the office of the Chief Compliance Officer and for all of the salary and benefits associated with the office of the Senior Compliance Officer. The compliance fees expensed by the Fund during fiscal year 2017 are included in the Statement of Operations.
6). GUARANTEES AND INDEMNIFICATIONS
Under the Hennessy Funds’ organizational documents, their officers and trustees are indemnified by the Hennessy Funds against certain liabilities arising out of the performance of their duties to the Hennessy Funds. Additionally, in the normal course of business, the Hennessy Funds enter into contracts with service providers that contain general indemnification clauses. The Fund’s maximum exposure under these arrangements is unknown as this would involve future claims that may be made against the Fund that have not yet occurred. Currently, the Fund expects the risk of loss to be remote.
7). LINE OF CREDIT
The Fund has an uncommitted line of credit with the other Hennessy Funds in the amount of the lesser of (i) $100,000,000 or (ii) 33.33% of each Hennessy Fund’s net assets, or 30% for the Hennessy Gas Utility Fund and 10% for the Hennessy Balanced Fund, intended to provide short-term financing, if necessary, subject to certain restrictions, in connection with shareholder redemptions. The credit facility is with the Hennessy Funds’ custodian bank, U.S. Bank, N.A. Borrowings under this arrangement bear interest at the bank’s prime rate and are secured by all of the Fund’s assets (as to its own borrowings only). During fiscal year 2017, the Fund had an outstanding average daily balance and a weighted
| NOTES TO THE FINANCIAL STATEMENTS |
average interest rate of $2,986 and 3.97%, respectively. The interest expensed by the Fund during fiscal year 2017 is included in the Statement of Operations. The maximum amount outstanding for the Fund during the period was $644,000. At October 31, 2017, the Fund did not have any borrowings outstanding under the line of credit.
8). FEDERAL TAX INFORMATION
As of October 31, 2017, the components of accumulated earnings (losses) for income tax purposes were as follows:
| | | Investments | |
| Cost of investments for tax purposes | | $ | 81,687,609 | |
| Gross tax unrealized appreciation | | $ | 18,126,715 | |
| Gross tax unrealized depreciation | | | (1,561,001 | ) |
| Net tax unrealized appreciation | | $ | 16,565,714 | |
| Undistributed ordinary income | | $ | 583,714 | |
| Undistributed long-term capital gains | | | 2,306,674 | |
| Total distributable earnings | | $ | 2,890,388 | |
| Other accumulated loss | | $ | (6,874 | ) |
| Total accumulated gain | | $ | 19,449,228 | |
The difference between book-basis unrealized appreciation/depreciation (as shown in the Statement of Assets and Liabilities) and tax-basis unrealized appreciation/depreciation (as shown above) is attributable primarily to wash sales and passive foreign investment companies.
At October 31, 2017, the Fund had no tax basis capital losses to offset future capital gains.
At October 31, 2017, the Fund did not defer, on a tax basis, any late-year ordinary losses. Late-year ordinary losses are net ordinary losses incurred after December 31, 2016, but within the taxable year, that are deemed to arise on the first day of the Fund’s next taxable year.
During fiscal years 2017 and 2016, the tax character of distributions paid by the Fund was as follows:
| | | Year Ended | | | Year Ended | |
| | | October 31, 2017 | | | October 31, 2016 | |
Ordinary income(1) | | $ | 588,377 | | | $ | 3 | |
| Long-term capital gain | | | — | | | | 915,894 | |
| | | $ | 588,377 | | | $ | 915,897 | |
| | (1) | Ordinary income includes short-term gain/loss. |
9). CHANGE IN AUDITOR DISCLOSURE
On September 11, 2017, the Trust, by action of the Audit Committee of the Board and on behalf of the Fund, the Hennessy Cornerstone Growth Fund, the Hennessy Cornerstone Mid Cap 30 Fund, the Hennessy Cornerstone Large Growth Fund, the Hennessy Cornerstone Value Fund, the Hennessy Total Return Fund, the Hennessy Balanced Fund, and the Hennessy Japan Fund (collectively, the “Applicable Funds”), dismissed KPMG LLP (“KPMG”) and engaged Tait, Weller & Baker LLP (“Tait Weller”) to serve as the independent registered public accounting firm to audit the financial statements of all series of the Trust for fiscal year 2017. Tait Weller previously served as the independent registered public accounting firm for the series of the Trust that are not one of the Applicable Funds.
| HENNESSY FUNDS | 1-800-966-4354 | |
KPMG’s reports on the financial statements for the Applicable Funds for each of fiscal years 2015 and 2016 contained no adverse opinion or disclaimer of opinion, nor were they qualified or modified as to uncertainty, audit scope, or accounting principles. During fiscal years 2015 and 2016 and the interim period of November 1, 2016, through September 11, 2017 (the “Interim Period”), there were no (i) disagreements with KPMG on any matter of accounting principles or practices, financial statement disclosure, or auditing scope or procedure, which disagreements, if not resolved to the satisfaction of KPMG, would have caused it to make reference to the subject matter of the disagreements in connection with its reports on the Applicable Funds’ financial statements for such years, nor (ii) “reportable events” of the kind described in Item 304(a)(1)(v) of Regulation S-K under the Securities Exchange Act of 1934, as amended.
During fiscal years 2015 and 2016 and the Interim Period, neither the Applicable Funds nor anyone on behalf of the Applicable Funds has consulted Tait Weller on items that concerned (a) the application of accounting principles to a specified transaction, either completed or proposed, or the type of audit opinion that might be rendered on an Applicable Fund’s financial statements, or (b) the subject of a disagreement (as defined in paragraph (a)(1)(iv) of Item 304 of Regulation S-K and related instructions) or reportable events (as described in paragraph (a)(1)(v) of Item 304 of Regulation S-K). The selection of Tait Weller does not reflect any disagreements or dissatisfaction by the Applicable Funds, the Board, or the Audit Committee with the performance of KPMG.
10). EVENTS SUBSEQUENT TO YEAR END
Management has evaluated the Fund’s related events and transactions that occurred subsequent to October 31, 2017, through the date of issuance of the Fund’s financial statements. Other than as disclosed below, management has determined that there were no subsequent events requiring recognition or disclosure in the financial statements.
On December 7, 2017, capital gains were declared and paid to shareholders of record on December 6, 2017, as follows:
| | | Long-term | |
| Investor Class | | $ | 0.27962 | |
| Institutional Class | | $ | .027518 | |
| NOTES/REPORT OF INDEPENDENT REGISTERED PUBLIC ACCOUNTING FIRM |
Report of Independent Registered Public Accounting Firm
To the Board of Trustees of Hennessy Funds Trust
and the Shareholders of the Hennessy Japan Small Cap Fund
Novato, CA
We have audited the accompanying statement of assets and liabilities, including the schedule of investments, of the Hennessy Japan Small Cap Fund (the “Fund”), a series of Hennessy Funds Trust as of October 31, 2017, and the related statement of operations, the statement of changes in net assets, and the financial highlights for the year then ended. The statement of changes in net assets for the year ended October 31, 2016 and the financial highlights for each of the four years in the period ended October 31, 2016 have been audited by other auditors, whose report dated December 22, 2016 expressed unqualified opinions on such financial statements and financial highlights. These financial statements and financial highlights are the responsibility of the Fund’s management. Our responsibility is to express an opinion on these financial statements and financial highlights based on our audit.
We conducted our audit in accordance with the standards of the Public Company Accounting Oversight Board (United States). Those standards require that we plan and perform the audit to obtain reasonable assurance about whether the financial statements and financial highlights are free of material misstatement. The Fund is not required to have, nor were we engaged to perform, an audit of the Fund’s internal control over financial reporting. Our audit included consideration of internal control over financial reporting as a basis for designing audit procedures that are appropriate in the circumstances, but not for the purposes of expressing an opinion on the effectiveness of the Fund’s internal control over financial reporting. Accordingly, we express no such opinion. An audit includes examining, on a test basis, evidence supporting the amounts and disclosures in the financial statements. Our procedures included confirmation of securities owned as of October 31, 2017, by correspondence with the custodian and brokers, or other appropriate auditing procedures where replies from brokers were not received. An audit also includes assessing the accounting principles used and significant estimates made by management, as well as evaluating the overall financial statement presentation. We believe that our audit provides a reasonable basis for our opinion.
In our opinion, the financial statements and financial highlights referred to above present fairly, in all material respects, the financial position of the Hennessy Japan Small Cap Fund as of October 31, 2017, the results of its operations, the changes in its net assets, and the financial highlights for the year then ended, in conformity with accounting principles generally accepted in the United States of America.
TAIT, WELLER & BAKER LLP
Philadelphia, Pennsylvania
December 22, 2017
| HENNESSY FUNDS | 1-800-966-4354 | |
Trustees and Officers of the Fund (Unaudited)
The business and affairs of the Funds are managed under the direction of the Board of Trustees of the Trust, and the Board of Trustees elects the Officers of the Trust. Beginning in March 2015, the Board of Trustees has from time to time appointed advisers to the Board of Trustees (“Advisers”), with the intention of having qualified individuals serve in an advisory capacity in order to garner experience in the mutual fund and asset management industry and be considered as potential Trustees in the future. There are currently three Advisers to the Board of Trustees: Brian Alexander, Doug Franklin, and Claire Knoles. As Advisers, Mr. Alexander, Mr. Franklin, and Ms. Knoles attend meetings of the Board and act as non-voting participants. Information pertaining to the Trustees, Advisers, and the Officers of the Trust is set forth below. The Trustees and Officers serve until their successors are duly elected and qualified or until their earlier death, resignation, or removal. Each of the Trustees oversees 14 Hennessy Funds. Unless otherwise indicated, the address of all persons listed below is 7250 Redwood Boulevard, Suite 200, Novato, CA 94945. The Fund’s Statement of Additional Information includes more information about the persons listed below and is available, without charge, upon request by calling 1-800-966-4354.
| | | | Other |
| | | | Directorships |
| | | | Held Outside |
| Name, (Year of Birth), | | | of Fund |
| and Position Held | Start Date | Principal Occupation(s) | Complex During |
with the Trust | of Service | During Past Five Years | Past Five Years(1) |
| |
| Disinterested Trustees and Advisers |
| | | | |
| J. Dennis DeSousa | January 1996 | Mr. DeSousa is a real estate investor. | None. |
| (1936) | | | |
| Trustee | | | |
| | | | |
| Robert T. Doyle | January 1996 | Mr. Doyle has been the Sheriff of | None. |
| (1947) | | Marin County, California since 1996. | |
| Trustee | | | |
| | | | |
| Gerald P. Richardson | May 2004 | Mr. Richardson is an independent | None. |
| (1945) | | consultant in the securities industry. | |
| Trustee | | | |
| | | | |
| Brian Alexander | March 2015 | Mr. Alexander has been employed | None. |
| (1981) | | by Sutter Health Novato Community | |
| Adviser to the Board | | Hospital since 2012, first as an | |
| | | Assistant Administrator and then, | |
| | | beginning in 2013, as the Chief | |
| | | Administrative Officer. From 2011 | |
| | | through 2012, Mr. Alexander was | |
| | | employed by Sutter Health West Bay | |
| | | Region as the Regional Director of | |
| | | Strategic Decision Support. | |
| TRUSTEES AND OFFICERS OF THE FUND |
| | | | Other |
| | | | Directorships |
| | | | Held Outside |
| Name, (Year of Birth), | | | of Fund |
| and Position Held | Start Date | Principal Occupation(s) | Complex During |
with the Trust | of Service | During Past Five Years | Past Five Years(1) |
| | | | |
| Doug Franklin | March 2016 | Mr. Franklin is a retired insurance | None. |
| (1964) | | industry executive. From 1987 | |
| Adviser to the Board | | through 2015, he was employed | |
| | | by Allianz-Fireman’s Fund Insurance | |
| | | Company in various positions, | |
| | | including Chief Actuary and | |
| | | Chief Risk Officer. | |
| | | | |
| Claire Knoles | December 2015 | Ms. Knoles is a founder of Kiosk and | None. |
| (1974) | | has served as its Chief Operating | |
| Adviser to the Board | | Officer since 2004. Kiosk is a full | |
| | | service marketing agency with | |
| | | offices in the San Francisco Bay | |
| | | Area, Toronto, and Liverpool, UK. | |
| | | | |
Interested Trustee(2) | | | |
| | | | |
| Neil J. Hennessy | January 1996 as | Mr. Hennessy has been employed by | Hennessy |
| (1956) | a Trustee and | Hennessy Advisors, Inc. since 1989 | Advisors, Inc. |
| Trustee, Chairman of | June 2008 as | and currently serves as its President, | |
| the Board, Chief | an Officer | Chairman and Chief Executive Officer. | |
| Investment Officer, | | | |
| Portfolio Manager, | | | |
| and President | | | |
| Name, (Year of Birth), | | |
| and Position Held | Start Date | Principal Occupation(s) |
with the Trust | of Service | During Past Five Years |
| | | |
| Officers | | |
| | | |
| Teresa M. Nilsen | January 1996 | Ms. Nilsen has been employed by Hennessy Advisors, Inc. |
| (1966) | | since 1989 and currently serves as its Executive Vice President, |
| Executive Vice President | | Chief Operations Officer, Chief Financial Officer, and Secretary. |
| and Treasurer | | |
| | | |
| Daniel B. Steadman | March 2000 | Mr. Steadman has been employed by Hennessy Advisors, Inc. |
| (1956) | | since 2000 and currently serves as its Executive Vice President |
| Executive Vice President | | and Chief Compliance Officer. |
| and Secretary | | |
| | | |
| Brian Carlson | December 2013 | Mr. Carlson has been employed by Hennessy Advisors, Inc. |
| (1972) | | since December 2013. Mr. Carlson was previously a co-founder |
| Senior Vice President and | | and principal of Trivium Consultants, LLC from February 2011 |
| Head of Distribution | | through November 2013. |
| | | |
| Jennifer Cheskiewicz | June 2013 | Ms. Cheskiewicz has been employed by Hennessy Advisors, Inc. |
| (1977) | | as its General Counsel since June 2013. She previously served |
| Senior Vice President and | | as in-house counsel to Carlson Capital, L.P., an SEC-registered |
| Chief Compliance Officer | | investment advisor to several private funds, from |
| | | February 2010 to May 2013. |
| HENNESSY FUNDS | 1-800-966-4354 | |
| Name, (Year of Birth), | | |
| and Position Held | Start Date | Principal Occupation(s) |
with the Trust | of Service | During Past Five Years |
| | | |
| David Ellison | October 2012 | Mr. Ellison has been employed by Hennessy Advisors, Inc. since |
(1958)(3) | | October 2012. He has served as a Portfolio Manager of the |
| Senior Vice President | | Hennessy Small Cap Financial Fund and the Hennessy Large |
| and Portfolio Manager | | Cap Financial Fund since inception. Mr. Ellison also served as a |
| | | Portfolio Manager of the Hennessy Technology Fund from its |
| | | inception until February 2017. Mr. Ellison served as Director, |
| | | CIO and President of FBR Fund Advisers, Inc. from |
| | | December 1999 to October 2012. |
| | | |
| Ryan Kelley | March 2013 | Mr. Kelley has been employed by Hennessy Advisors, Inc. since |
(1972)(4) | | October 2012. He has served as a Portfolio Manager of the |
| Vice President and | | Hennessy Gas Utility Fund, the Hennessy Small Cap Financial |
| Portfolio Manager | | Fund, and the Hennessy Large Cap Financial Fund since |
| | | October 2014. He served as Co-Portfolio Manager of the same |
| | | funds from March 2013 through September 2014, and as a |
| | | Portfolio Analyst for the Hennessy Funds from October 2012 |
| | | through October 2014. Mr. Kelley has also served as a Portfolio |
| | | Manager of the Hennessy Cornerstone Growth Fund, the |
| | | Hennessy Cornerstone Mid Cap 30 Fund, the Hennessy |
| | | Cornerstone Large Growth Fund, and the Hennessy |
| | | Cornerstone Value Fund and as a Co-Portfolio Manager of the |
| | | Hennessy Technology Fund since February 2017. Mr. Kelley |
| | | served as Portfolio Manager of FBR Fund Advisers, Inc. from |
| | | January 2008 to October 2012. |
| | | |
| Brian Peery | March 2003 as | Mr. Peery has been employed by Hennessy Advisors, Inc. since |
| (1969) | an Officer and | 2002. He has served as a Portfolio Manager of the Hennessy |
| Senior Vice President | February 2011 | Cornerstone Growth Fund, the Hennessy Cornerstone Mid Cap |
| and Portfolio Manager | as a Co-Portfolio | 30 Fund, the Hennessy Cornerstone Large Growth Fund, the |
| | Manager or | Hennessy Cornerstone Value Fund, the Hennessy Total Return |
| | Portfolio Manager | Fund, and the Hennessy Balanced Fund since October 2014. |
| | | He served as Co-Portfolio Manager of the same funds from |
| | | February 2011 through September 2014. Mr. Peery has also |
| | | served as a Portfolio Manager of the Hennessy Gas Utility Fund |
| | | since February 2015 and as Lead Portfolio Manager of the |
| | | Hennessy Technology Fund since February 2017. |
| | | |
| Daniel P. Hennessy | December 2016 | Mr. Daniel Hennessy has been employed by Hennessy Advisors, |
| (1990) | | Inc. since 2015. He has served as an Associate Analyst of the |
| Assistant Vice President | | Hennessy Technology Fund since February 2017. He previously |
| and Associate Analyst | | served as a Mutual Fund Specialist at U.S. Bancorp Fund |
| | | Services, LLC from November 2014 to July 2015. Prior to that, |
| | | he attended the University of San Diego, where he earned a |
| | | degree in Political Science. |
(1) | Messrs. DeSousa, Doyle, Hennessy, and Richardson previously served on the Board of Directors of Hennessy Mutual Funds, Inc. (“HMFI”), The Hennessy Funds, Inc. (“HFI”), and Hennessy SPARX Funds Trust (“HSFT”). Pursuant to an internal reorganization effective as of February 28, 2014, the series of HFMI, HFI, and HSFT were reorganized into corresponding series of Hennessy Funds Trust that mirrored them. Subsequent to the reorganization, HFMI, HFI, and HSFT were dissolved. |
(2) | Mr. Hennessy is considered an “interested person,” as defined in the Investment Company Act of 1940, as amended, because he is an officer of the Hennessy Funds. |
(3) | The address of this officer is 101 Federal Street, Suite 1900, Boston, MA 02110. |
(4) | The address of this officer is 1340 Environ Way, Chapel Hill, NC 27517. |
| TRUSTEES AND OFFICERS OF THE FUND |
(This Page Intentionally Left Blank.)
| HENNESSY FUNDS | 1-800-966-4354 | |
Expense Example (Unaudited)
October 31, 2017
As a shareholder of the Fund, you incur two types of costs: (1) transaction costs, including sales charges (loads) on purchase payments, reinvested dividends, or other distributions, redemption fees, and exchange fees; and (2) ongoing costs, including management fees, service fees, and other Fund expenses. This Example is intended to help you understand your ongoing costs (in dollars) of investing in the Fund and to compare these costs with the ongoing costs of investing in other mutual funds. The Example is based on an investment of $1,000 invested at the beginning of the period and held for the entire period from May 1, 2017, through October 31, 2017.
Actual Expenses
The first line of the table below under the “Investor Class” and “Institutional Class” headings provides information about actual account values and actual expenses. Although the Fund charges no sales loads or transaction fees, you will be assessed fees for outgoing wire transfers, returned checks and stop payment orders at prevailing rates charged by U.S. Bancorp Fund Services, LLC, the Fund’s transfer agent. If you request that a redemption be made by wire transfer, currently a $15 fee is charged by the Fund’s transfer agent. IRA accounts will be charged a $15 annual maintenance fee. The example below includes, but is not limited to, management fees, shareholder servicing fees, fund accounting, custody, and transfer agent fees. However, the example below does not include portfolio trading commissions and related expenses, and other extraordinary expenses as determined under generally accepted accounting principles. You may use the information in this line, together with the amount you invested, to estimate the expenses that you paid over the period. Simply divide your account value by $1,000 (for example, an $8,600 account value divided by $1,000 = 8.6), then multiply the result by the number in the first line of the table under the “Investor Class” or “Institutional Class” headings in the column entitled “Expenses Paid During Period” to estimate the expenses you paid on your account during this period.
Hypothetical Example for Comparison Purposes
The second line of the table below under the “Investor Class” and “Institutional Class” headings provides information about hypothetical account values and hypothetical expenses based on the Fund’s actual expense ratios and an assumed rate of return of 5% per year before expenses, which is not the Fund’s actual return. The hypothetical account values and expenses may not be used to estimate the actual ending account balance or expenses you paid for the period. You may use this information to compare the ongoing costs of investing in the Fund and other funds. To do so, compare this 5% hypothetical example with the 5% hypothetical examples that appear in the shareholder reports of the other funds. Please note that the expenses shown in the table are meant to highlight your ongoing costs only and do not reflect any transactional costs, such as sales charges (loads), or exchange fees. Therefore, the second line of the table under the “Investor Class” and “Institutional Class” headings is useful in comparing ongoing costs only, and will not help you determine the relative total costs of owning different funds. In addition, if these transactional costs were included, your costs would have been higher.
| | | | Expenses Paid |
| | Beginning | Ending | During Period(1) |
| | Account Value | Account Value | May 1, 2017 – |
| | May 1, 2017 | October 31, 2017 | October 31, 2017 |
| Investor Class | | | |
| Actual | $1,000.00 | $1,190.70 | $8.56 |
| Hypothetical (5% return before expenses) | $1,000.00 | $1,017.39 | $7.88 |
| | | | |
| Institutional Class | | | |
| Actual | $1,000.00 | $1,192.90 | $6.41 |
| Hypothetical (5% return before expenses) | $1,000.00 | $1,019.36 | $5.90 |
(1) | Expenses are equal to the Fund’s annualized expense ratio of 1.55% for Investor Class shares or 1.16% for Institutional Class shares, as applicable, multiplied by the average account value over the period, multiplied by 184/365 days (to reflect one-half year period). |
| HENNESSY FUNDS | 1-800-966-4354 | |
How to Obtain a Copy of the Fund’s
Proxy Voting Policy and Proxy Voting Records
A description of the policies and procedures the Fund uses to determine how to vote proxies relating to portfolio securities is available without charge: (1) by calling 1-800-966-4354; (2) on the Hennessy Funds’ website at hennessyfunds.com/proxy-voting/policy.fs; or (3) on the U.S. Securities and Exchange Commission’s (the “SEC”) website at www.sec.gov. The Fund’s proxy voting record is available without charge on both the Hennessy Funds’ website at hennessyfunds.com/proxy-voting/vote.fs and the SEC’s website at www.sec.gov no later than August 31 for the prior 12 months ending June 30.
Quarterly Filings on Form N-Q
The Fund files a complete schedule of portfolio holdings with the SEC for the first and third quarters of each fiscal year on Form N-Q. The Fund’s Forms N-Q are made available on the SEC’s website at www.sec.gov. The Fund’s Forms N-Q may be reviewed and copied at the SEC’s Public Reference Room in Washington, DC, and information on the operation of the Public Reference Room may be obtained by calling 1-800-SEC-0330. Information included in the Fund’s Forms N-Q will also be available upon request by calling 1-800-966-4354.
Federal Tax Distribution Information
(Unaudited)
For fiscal year 2017, certain dividends paid by the Fund may be subject to a maximum tax rate of 23.8%, as provided for by the Jobs and Growth Tax Relief Reconciliation Act of 2003. The percentage of dividends declared from ordinary income designated as qualified dividend income was 100.00%.
For corporate shareholders, the percent of ordinary income distributions that qualified for the corporate dividends received deduction for fiscal year 2017 was 0.00%.
The percentage of taxable ordinary income distributions that are designated as short-term capital gain distributions under Section 871(k)(2)(C) of the Internal Revenue Code of 1986, as amended, for the Fund was 46.46%.
For the year ended October 31, 2017, the Fund earned foreign source income and paid foreign taxes, as noted below, which it intends to pass through to its shareholders pursuant to Section 853 of the Internal Revenue Code.
| | Gross Foreign Income | | Foreign Tax Paid | |
| Japan | | $ | 1,032,516 | | | | $ | 103,013 | | |
Householding
To help keep the Fund’s costs as low as possible, we generally deliver a single copy of most financial reports and prospectuses to shareholders who share an address, even if the accounts are registered under different names. This process, known as “householding,” does not apply to account statements. You may request an individual copy of a prospectus or financial report at any time. If you would like to receive separate mailings, please call U.S. Bancorp Fund Services, LLC at 1-800-261-6950 or 1-414-765-4124 and we will begin individual delivery within 30 days of your request. If your account is held through a financial institution or other intermediary, please contact them directly to request individual delivery.
| PROXY VOTING — PRIVACY POLICY |
Privacy Policy
We collect the following non-public personal information about you:
| | • | information we receive from you on or in applications or other forms, correspondence, or conversations, including, but not limited to, your name, address, phone number, social security number, assets, income, and date of birth; and |
| | | |
| | • | information about your transactions with us, our affiliates, or others, including, but not limited to, your account number and balance, payment history, parties to transactions, cost basis information, and other financial information. |
We do not disclose any non-public personal information about our current or former shareholders to non-affiliated third parties, except as permitted by law. For example, we are permitted by law to disclose all of the information we collect, as described above, to our Transfer Agent to process your transactions. Furthermore, we restrict access to your non-public personal information to those persons who require such information to provide products or services to you. We maintain physical, electronic, and procedural safeguards that comply with federal standards to guard your non-public personal information.
In the event that you hold shares of the Fund through a financial intermediary, including, but not limited to, a broker-dealer, bank, or trust company, the privacy policy of your financial intermediary would govern how your non-public personal information will be shared with non-affiliated third parties.
| HENNESSY FUNDS | 1-800-966-4354 | |
(This Page Intentionally Left Blank.)
For information, questions or assistance, please call
The Hennessy Funds
1-800-966-4354 or 1-415-899-1555
INVESTMENT ADVISOR
Hennessy Advisors, Inc.
7250 Redwood Boulevard, Suite 200
Novato, California 94945
ADMINISTRATOR,
TRANSFER AGENT,
DIVIDEND PAYING AGENT &
SHAREHOLDER SERVICING AGENT
U.S. Bancorp Fund Services, LLC
P.O. Box 701
Milwaukee, Wisconsin 53201-0701
CUSTODIAN
U.S. Bank N.A.
Custody Operations
1555 North River Center Drive, Suite 302
Milwaukee, Wisconsin 53212
TRUSTEES
Neil J. Hennessy
Robert T. Doyle
J. Dennis DeSousa
Gerald P. Richardson
COUNSEL
Foley & Lardner LLP
777 East Wisconsin Avenue
Milwaukee, Wisconsin 53202-5306
INDEPENDENT REGISTERED
PUBLIC ACCOUNTING FIRM
Tait, Weller & Baker LLP
1818 Market Street, Suite 2400
Philadelphia, Pennsylvania 19103
DISTRIBUTOR
Quasar Distributors, LLC
777 East Wisconsin Avenue
Milwaukee, Wisconsin 53202
hennessyfunds.com | 1-800-966-4354
This report has been prepared for shareholders and may be distributed to
others only if preceded or accompanied by a current prospectus.
Item 2. Code of Ethics.
The registrant has adopted a code of ethics that applies to the registrant’s principal executive officer and principal financial officer. The registrant amended its code of ethics in January 2017 and again in June 2017 to (i) permit the Chief Compliance Officers of the registrant and the investment adviser to the series of the registrant to jointly update the pre‑clearance process from time to time without amending the code of ethics, (ii) changing the blackout period from five to seven calendar days, and (iii) making the short‑swing profits provision applicable to all access persons. The registrant has not granted any waivers from any provisions of the code of ethics during the period covered by this report.
A copy of the registrant’s Code of Ethics is filed herewith, along with an exhibit that shows the portions of the Code of Ethics that were updated, as discussed above.
Item 3. Audit Committee Financial Expert.
The registrant’s board of directors has determined that it does not have an audit committee financial expert serving on its audit committee. At this time, the registrant believes that the financial and business experience provided by each member of the audit committee together offers the registrant adequate oversight for the registrant’s level of financial complexity.
Item 4. Principal Accountant Fees and Services.
The registrant has engaged the principal accountants to the Hennessy Funds to perform audit services, audit-related services, tax services and other services during the past two fiscal years. “Audit services” refer to performing an audit of the registrant's annual financial statements or services that are normally provided by the accountants in connection with statutory and regulatory filings or engagements for those fiscal years. “Audit-related services” refer to the assurance and related services by the principal accountants that are reasonably related to the performance of the audit. “Tax services” refer to professional services rendered by the principal accountants for tax compliance, tax advice, and tax planning. The following table details the aggregate fees billed or expected to be billed for each of the last two fiscal years for audit fees, audit-related fees, tax fees and other fees by the principal accountants to the Hennessy Funds.
| | FYE 10/31/2017 | FYE 10/31/2016 |
| Audit Fees | $249,200 | $295,600 |
| Audit-Related Fees | - | - |
| Tax Fees | $49,000 | $60,700 |
| All Other Fees | - | - |
The audit committee has adopted pre-approval procedures for audit and non-audit services provided to the registrant. Under the procedures, at any regularly scheduled audit committee meeting, the audit committee may pre-approve any audit, audit-related, tax and other non-audit services to be rendered or that may be rendered by a principal accountant to the registrant and certain non-audit services to be rendered by a principal accountant to the investment advisor to the registrant’s series or such advisor’s affiliates that provide ongoing services to the registrant. The audit committee either specifically pre-approves the services or pre-approves a type of a service. No pre-approval is required for non-audit services that meet the following criteria: (1) the aggregate amount of fees to be paid for all such non-audit services is not more than 5% of the total revenues paid by the registrant to the principal accountant in the fiscal year in which the non-audit services are provided; (2) such services were not recognized by the registrant at the time of the engagement to be non-audit services; and (3) such services are promptly brought to the attention of the audit committee and approved prior to the completion of the audit.
The audit committee must pre-approve a principal accountant’s engagements for non-audit services with the investment advisor to the registrant’s series and such advisor’s affiliates that provide ongoing services to the registrant, if the engagement relates directly to the operations and financial reporting of the registrant, unless the aggregate amount of fees to be paid for all such services provided constitutes no more than 5% of the aggregate revenues paid to the principal accountant by the registrant, the investment advisor and such advisor’s affiliates that provide ongoing services to the registrant, during the fiscal year in which the services are to be provided.
If a service has not been pre-approved at a regularly scheduled audit committee meeting, and if, in the opinion of the Chief Compliance Officer of the registrant, a proposed engagement must commence before the next regularly scheduled audit committee meeting, any member of the audit committee is authorized under the procedures to pre-approve the engagement. The Chief Compliance Officer of the registrant will arrange for this interim review, coordinate with the designated member of the audit committee and provide, with the assistance of the principal accountant, information about the service to be pre-approved for the interim period. Any interim pre-approval decisions are reported (for informational purposes) to the audit committee at its next regularly scheduled meeting.
All of the tax services referenced above were pre-approved in accordance with the pre-approval procedures for audit and non-audit services.
The percentage of fees billed by the previous independent registered public accounting firm applicable to non-audit services pursuant to waiver of pre-approval requirement were as follows:
| | FYE 10/31/2017 | FYE 10/31/2016 |
| Audit-Related Fees | 0% | 0% |
| Tax Fees | 0% | 0% |
| All Other Fees | 0% | 0% |
The percentage of fees billed by Tait, Weller & Baker, LLP applicable to non-audit services pursuant to waiver of pre-approval requirement were as follows:
| | FYE 10/31/2017 | FYE 10/31/2016 |
| Audit-Related Fees | 0% | 0% |
| Tax Fees | 0% | 0% |
| All Other Fees | 0% | 0% |
All of the principal accountants’ hours spent on auditing the registrant’s financial statements were attributed to work performed by full‑time permanent employees of the principal accountants.
In assessing the independence of the registrant’s principal accountants, the registrant’s board of trustees noted that the principal accountants have not provided any audit or non-audit services to the investment advisor to the registrant’s series, Hennessy Advisors, Inc., or any entity controlling, controlled by, or under common control with Hennessy Advisors, Inc.
Item 5. Audit Committee of Listed Registrants.
Not applicable to registrants who are not listed issuers (as defined in Rule 10A-3 under the Securities Exchange Act of 1934).
Item 6. Investments.
The Schedules of Investments are included as part of the reports to shareholders filed under Item 1 of this Form.
Item 7. Disclosure of Proxy Voting Policies and Procedures for Closed-End Management Investment Companies.
Not applicable to open-end investment companies.
Item 8. Portfolio Managers of Closed-End Management Investment Companies.
Not applicable to open-end investment companies.
Item 9. Purchases of Equity Securities by Closed‑End Management Investment Company and Affiliated Purchasers.
Not applicable to open-end investment companies.
Item 10. Submission of Matters to a Vote of Security Holders.
Not Applicable.
Item 11. Controls and Procedures.
| (a) | The Registrant’s President and Treasurer have reviewed the Registrant's disclosure controls and procedures (as defined in Rule 30a-3(c) under the Investment Company Act of 1940 (the “Act”)) as of a date within 90 days of the filing of this report, as required by Rule 30a-3(b) under the Act and Rules 13a-15(b) or 15d‑15(b) under the Securities Exchange Act of 1934. Based on their review, such officers have concluded that the disclosure controls and procedures are effective in ensuring that information required to be disclosed in this report is appropriately recorded, processed, summarized and reported and made known to them by others within the Registrant and by the Registrant’s service providers. |
| (b) | There were no changes in the Registrant's internal control over financial reporting (as defined in Rule 30a-3(d) under the Act) that occurred during the second fiscal quarter of the period covered by this report that has materially affected, or is reasonably likely to materially affect, the Registrant's internal control over financial reporting. |
Item 12. Disclosure of Securities Lending Activities for Closed-End Management Investment Companies.
Not applicable to open-end investment companies.
Item 13. Exhibits.
| (a) | (1) Code of ethics, or amendments thereto, that is the subject of the disclosure required by Item 2, to the extent that the registrant intends to satisfy Item 2 requirements through filing of an exhibit. Filed herewith. |
(2) A separate certification for each principal executive and principal financial officer pursuant to Rule 30a‑2(a) under the Act and Section 302 of the Sarbanes-Oxley Act of 2002. Filed herewith.
(3) Any written solicitation to purchase securities under Rule 23c‑1 under the Act sent or given during the period covered by the report by or on behalf of the registrant to 10 or more persons. Not applicable to open-end investment companies.
(4) Change in the registrant’s independent public accountant. Provide the information called for by Item 4 of Form 8-K under the Exchange Act (17 CFR 249.308). Unless specified by Item 4, or related to and necessary for a complete understanding of information not previously disclosed, the information should relate to events occurring during the reporting period. Disclosure for this item not yet required.
| (b) | Certifications pursuant to Rule 30a‑2(b) under the Act and Section 906 of the Sarbanes‑Oxley Act of 2002. Furnished herewith. |
SIGNATURES
Pursuant to the requirements of the Securities Exchange Act of 1934 and the Investment Company Act of 1940, the registrant has duly caused this report to be signed on its behalf by the undersigned, thereunto duly authorized.
HENNESSY FUNDS TRUST
(Registrant)
By: /s/ Neil J. Hennessy
Neil J. Hennessy
President
Date: January 8, 2018
Pursuant to the requirements of the Securities Exchange Act of 1934 and the Investment Company Act of 1940, this report has been signed below by the following persons on behalf of the registrant and in the capacities and on the dates indicated.
| |
By: /s/ Neil J. Hennessy
Neil J. Hennessy, President |
| |
| Date: January 8, 2018 |
| |
By: /s/ Teresa M. Nilsen
Teresa M. Nilsen, Treasurer |
| |
| Date: January 8, 2018 |