ANNUAL REPORT
OCTOBER 31, 2015
HENNESSY CORNERSTONE
GROWTH FUND
Investor Class HFCGX
Institutional Class HICGX
| hennessyfunds.com | 1-800-966-4354 |
(This Page Intentionally Left Blank.)
Contents
| Letter to Shareholders | 2 |
| Performance Overview | 4 |
| Financial Statements | |
| Schedule of Investments | 7 |
| Statement of Assets and Liabilities | 12 |
| Statement of Operations | 13 |
| Statements of Changes in Net Assets | 15 |
| Financial Highlights | 16 |
| Notes to the Financial Statements | 20 |
| Report of Independent Registered Public Accounting Firm | 28 |
| Trustees and Officers of the Fund | 29 |
| Expense Example | 32 |
| Proxy Voting | 34 |
| Quarterly Filings on Form N-Q | 34 |
| Householding | 34 |
| Matters Submitted to a Shareholder Vote | 34 |
| Privacy Policy | 35 |
| HENNESSY FUNDS | 1-800-966-4354 | |
December 2015
Dear Hennessy Funds Shareholder:
As I look back over the year, I am reminded that the U.S. economy has come a long way since the depths of the recession in 2009. The economy has been expanding steadily for almost six years, the unemployment rate has halved, the housing market has been recovering and capital expenditures have been growing. The financial markets have performed well too, driven largely by strong corporate earnings growth, especially in the early years. The U.S. market, as measured by the S&P 500 Index, has roughly tripled since the bull market began in 2009, and the Index’s earnings per share have increased 260% over this same time period. For the year ended October 31, 2015, the U.S. equity market performed reasonably well, with the S&P 500 posting another advance of 5.2%. However, behind this headline number, the market experienced a great deal of volatility as investors reacted to falling energy prices, a rise in the U.S. Dollar, pressure on export earnings growth, slower growth in China and, most significantly, the likelihood of a rise in the Fed Funds rate for the first time in nearly a decade – the featured topic of conversation around every office water cooler in the financial world this year.
Investors, reporters and friends often ask me “What’s next?” The market has been in a volatile, sideways correction for over a year now, and throughout this period of volatility, I have consistently advised investors to continue to focus on the long-term fundamentals of the market.
In my view, the fundamentals of the market are in good shape. Despite a stronger U.S. Dollar and its impact on export growth, the economy is still growing steadily. Inflation remains low, so we expect the Federal Reserve, once it does begin to raise short-term interest rates, will not likely raise them by very much. New jobs are being created at what I believe is a healthy rate, and average hourly wages are rising in response to a tighter labor market. Higher wages and lower gasoline prices are helping to keep consumer confidence positive.
Notwithstanding what I view as a relatively solid economic environment, however, I think investor sentiment remains restrained. The same factors that contributed to the market volatility this past year are still troubling investors today: the slowdown in the Chinese economy, slower earnings growth here in the U.S., and, of course, the prospect of rising interest rates. As a result of these investor worries, I do not see any solid enthusiasm for the market – no euphoria. Universal optimism about the market often coincides with a peak in stock prices and this absence of euphoria is yet another reason I feel bullish. And finally, I do not believe stocks are expensive. The Dow Jones Industrial Average and the S&P 500 Index have forward PE (price-to-earnings) ratios of approximately 16x and 17x, respectively, close to long-term averages. In my view, these fundamentals taken together signal a continuation of the bull market that began six years ago.
A final positive note: I still do not believe that investors have fully returned to investing in U.S. equities. Assets in domestic equity funds have now reached parity with fixed income/money market funds, with $6.2 trillion in each. I believe that fixed income investments will continue to trickle into equities, which should have a positive effect on the market.
Thank you for your continued confidence and investment in our products. If you have any questions or would like to speak with us directly, please don’t hesitate to call us at (800) 966-4354.
Best regards,
Neil J. Hennessy
President and Chief Investment Officer
Past performance does not guarantee future results.
Mutual fund investing involves risk. Principal loss is possible.
Opinions expressed are those of Neil Hennessy and are subject to change, are not guaranteed and should not be considered investment advice.
The Dow Jones Industrial Average and the S&P 500 Index are unmanaged indices commonly used to measure the performance of U.S. stocks. One cannot invest directly in an index.
Price to earnings (“PE”) is the market price per share divided by earnings per share. Earnings per share is the portion of a company’s profit allocated to each outstanding share of common stock. It serves as an indicator of a company’s profitability.
| HENNESSY FUNDS | 1-800-966-4354 | |
Performance Overview (Unaudited)
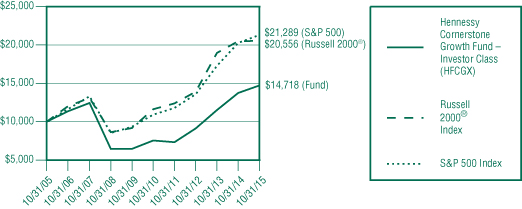
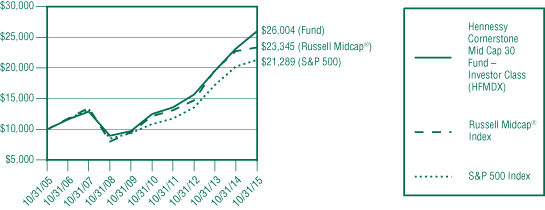
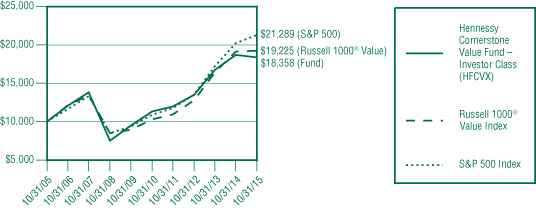
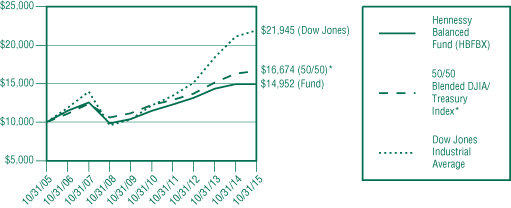
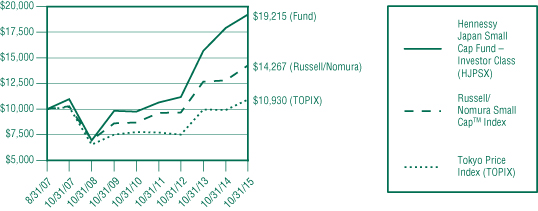
CHANGE IN VALUE OF $10,000 INVESTMENT
This graph illustrates the performance of an initial investment of $10,000 made in the Fund ten years ago and assumes the reinvestment of dividends.
AVERAGE ANNUAL TOTAL RETURN FOR PERIODS ENDED OCTOBER 31, 2015
| | One | Five | Ten |
| | Year | Years | Years |
| Hennessy Cornerstone Growth Fund – | | | |
| Investor Class (HFCGX) | 7.07% | 14.24% | 3.94% |
| Hennessy Cornerstone Growth Fund – | | | |
Institutional Class (HICGX)(1) | 7.29% | 14.57% | 4.18% |
Russell 2000® Index | 0.34% | 12.06% | 7.47% |
| S&P 500 Index | 5.20% | 14.33% | 7.85% |
Expense ratios from most recent prospectus: 1.15% (Investor Class); 0.95% (Institutional Class). As set forth in the Supplement to the Prospectus dated October 7, 2015, a 12b-1 fee of 0.15% was instituted on Investor Class shares effective as of November 1, 2015, and is not included in the Investor Class expense ratio.
Performance data quoted represents past performance; past performance does not guarantee future results. The investment return and principal value of an investment will fluctuate so that an investor’s shares, when redeemed, may be worth more or less than their original cost. The performance graph and table do not reflect the deduction of taxes that a shareholder would pay on Fund distributions or the redemption of Fund shares. Current performance of the Fund may be lower or higher than the performance quoted. Performance data current to the most recent month end may be obtained by visiting hennessyfunds.com.
(1) | The inception date of Institutional Class shares is March 3, 2008. Performance shown prior to the inception of Institutional Class shares reflects the performance of Investor Class shares and includes expenses that are not applicable to and are higher than those of Institutional Class shares. |
PERFORMANCE NARRATIVE
Portfolio Managers Neil Hennessy and Brian Peery
Performance:
For the twelve-month period ended October 31, 2015, the Investor Class of the Hennessy Cornerstone Growth Fund returned 7.07%, outperforming the Russell 2000® Index and the S&P 500 Index, which returned 0.34% and 5.20% for the same period, respectively.
We are very pleased with the overall performance of the Fund during the twelve-month period ended October 31, 2015. The Fund’s relative outperformance was primarily due to strong returns from individual stocks in the Healthcare, Industrials, Financials and Materials sectors. Our investments in Airlines performed well, especially JetBlue Airways Corp. and Southwest Airlines Corp. Other issuers that contributed significantly to the Fund’s performance were Amedisys, Inc., a provider of alternate-site healthcare services, Universal Insurance Holdings, a homeowner insurer, American Woodmark Corp., a manufacturer of kitchen cabinets, and U.S. Concrete, Inc., a concrete supplier. The Fund’s overweight position in Consumer Discretionary stocks and underweight position in Energy also aided relative returns over the period. The Fund continues to hold JetBlue, Amedisys, American Woodmark and U.S. Concrete.
Portfolio Strategy:
We believe that the Fund’s investment strategy, which seeks companies that are reporting growth in earnings, whose stock prices are showing positive relative strength but that still trade on low price to sales ratios, offers investors true “growth at a reasonable price.” Limiting the Fund’s portfolio to 50 stocks produces a relatively concentrated portfolio, where individual stock performance can influence the performance of the portfolio as a whole. This “growth at a reasonable price” stock selection approach has served us well, and we believe wholeheartedly in utilizing this methodology when investing.
Market Outlook:
Over the twelve-month period ended October 31, 2015, U.S. equities, as measured by the S&P 500 Index, advanced by just over 5%. Notwithstanding this modest rise, the year was marked by a great deal of volatility, especially during the second half of the period when uncertainty regarding the timing and magnitude of a rise in short-term interest rates being contemplated by the Federal Reserve dominated investor thinking. Earnings growth, too, caused anxiety for investors. Lower energy prices impacted many companies in the Energy sector, and the higher U.S. Dollar and slower growth abroad affected exporters. Many companies saw their sales and earnings growth slow.
In the end, however, confidence in continued economic growth was strong enough to offset investor concerns, with the market staging a dramatic rally in October, the final month of the Fund’s fiscal year. We believe the basic fundamentals of the market are attractive, and we continue to be optimistic about the possibility of further market advances over the course of the next year. The economy is growing slowly but steadily. Inflation is low, so we expect that the Fed, once they do start to raise rates, will not raise them by very much. The labor market has continued to recover over the last 12 months, and consumer confidence appears buoyant. Most importantly, we do not believe stocks are expensive. The Dow Jones Industrial Average and the S&P 500 have forward PE ratios of approximately 16x and 17x, respectively, close to long-term averages. Corporate balance sheets appear to be in excellent shape, and while executives have shown some reluctance to increase capital spending beyond maintenance levels this cycle, we believe companies will eventually start investing for expansion. This spending could, in turn, help drive share prices higher through an acceleration in sales and earnings growth.
Investment Outlook:
We are confident that there are good investment opportunities in the small and mid-cap space. While we believe higher interest rates may lead to an even stronger U.S. Dollar and difficulties for exporters, many small and mid-cap companies have purely domestic businesses, which are benefiting from steady economic growth at home, low inflation and low energy prices. With consumer debt levels falling and wage growth finally starting to accelerate, we are expecting a fairly good holiday season for consumer-based companies
| HENNESSY FUNDS | 1-800-966-4354 | |
and stronger demand for their products and services next year. However, we recognize that despite low gas prices, consumers and especially younger consumers, seem to prefer spending less and saving more, in contrast to previous generations. Going into the new fiscal year, we are pleased with the positioning of the portfolio, which includes a large number of companies that are domestically focused and that we believe are reasonably valued and may be poised for growth. Relative to the Fund’s benchmarks, the portfolio is overweight in both the Consumer Discretionary and Industrial sectors, and we think that these areas of the market offer great growth potential now and into 2016.
Opinions expressed are those of the Portfolio Managers as of the date written and are subject to change, are not guaranteed, and should not be considered investment advice or an indication of trading intent.
The Russell 2000® Index is an index commonly used to measure the performance of U.S. small-capitalization stocks. The S&P 500 Index and Dow Jones Industrial Average are unmanaged indices commonly used to measure the performance of U.S. stocks. One cannot invest directly in an index.
The Fund invests in small and medium capitalized companies, which may have limited liquidity and greater price volatility than large capitalization companies. Investments in foreign securities may involve political, economic and currency risks, greater volatility and differences in accounting methods. The Fund’s formula-based strategy may cause the Fund to buy or sell securities at times when it may not be advantageous.
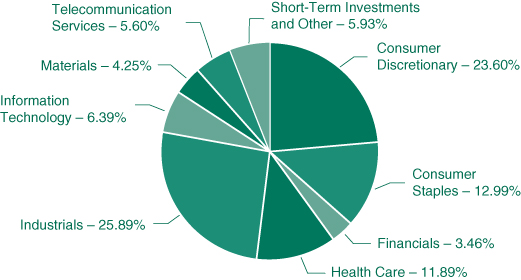
References to specific securities should not be considered a recommendation to buy or sell any security. Fund holdings and sector allocations are subject to change. Please refer to the Schedule of Investments included in this report for additional portfolio information.
Earnings growth is not a measure of the Fund’s future performance. Price to sales ratio is a tool for calculating a stock’s valuation relative to other companies. It is calculated by dividing a stock’s current price by its revenue per share. PE, or price to earnings, is calculated by dividing a company’s market price per share by its earnings per share.
Financial Statements
Schedule of Investments as of October 31, 2015 |
HENNESSY CORNERSTONE GROWTH FUND
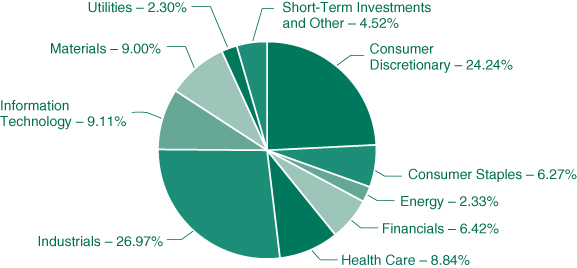
(% of Net Assets)
| TOP TEN HOLDINGS (EXCLUDING CASH/CASH EQUIVALENTS) | % NET ASSETS |
| U.S. Concrete, Inc. | 3.55% |
| American Woodmark Corp. | 3.11% |
| JetBlue Airways Corp. | 2.81% |
| Skechers USA, Inc. | 2.68% |
| Amedisys, Inc. | 2.59% |
| AmTrust Financial Services, Inc. | 2.50% |
| Tesoro Corp. | 2.33% |
| CDW Corp. | 2.33% |
| Ingles Markets, Inc. | 2.31% |
| Core-Mark Holding Co., Inc. | 2.30% |
Note: For presentation purposes, the Fund has grouped some of the industry categories. For purposes of categorizing securities for compliance with Section 8(b)(1) of the Investment Company Act of 1940, as amended, the Fund uses more specific industry classifications.
| HENNESSY FUNDS | 1-800-966-4354 | |
| COMMON STOCKS – 95.48% | | Number | | | | | | % of | |
| | | of Shares | | | Value | | | Net Assets | |
| Consumer Discretionary – 24.24% | | | | | | | | | |
| 1-800-Flowers.com, Inc. (a) | | | 478,000 | | | $ | 4,746,540 | | | | 1.65 | % |
| Asbury Automotive Group, Inc. (a) | | | 73,100 | | | | 5,789,520 | | | | 2.01 | % |
| CarMax, Inc. (a) | | | 83,700 | | | | 4,939,137 | | | | 1.72 | % |
| Core-Mark Holding Co., Inc. | | | 81,444 | | | | 6,620,583 | | | | 2.30 | % |
| Cracker Barrel Old Country Store, Inc. | | | 38,100 | | | | 5,237,226 | | | | 1.82 | % |
| G-III Apparel Group, Ltd. (a) | | | 107,000 | | | | 5,894,630 | | | | 2.05 | % |
| Lear Corp. | | | 51,600 | | | | 6,453,096 | | | | 2.24 | % |
| Lowes Companies, Inc. | | | 76,600 | | | | 5,655,378 | | | | 1.97 | % |
| Murphy USA, Inc. (a) | | | 80,300 | | | | 4,928,011 | | | | 1.71 | % |
| Skechers USA, Inc. (a) | | | 247,500 | | | | 7,722,000 | | | | 2.68 | % |
| Staples, Inc. | | | 342,700 | | | | 4,451,673 | | | | 1.55 | % |
| TravelCenters of America, LLC (a) | | | 407,300 | | | | 4,692,096 | | | | 1.63 | % |
| Zumiez, Inc. (a) | | | 149,300 | | | | 2,609,764 | | | | 0.91 | % |
| | | | | | | | 69,739,654 | | | | 24.24 | % |
| | | | | | | | | | | | | |
| Consumer Staples – 6.27% | | | | | | | | | | | | |
| CVS Health Corp. | | | 55,100 | | | | 5,442,778 | | | | 1.89 | % |
| Ingles Markets, Inc. | | | 132,800 | | | | 6,632,032 | | | | 2.31 | % |
| Kroger Co. | | | 157,600 | | | | 5,957,280 | | | | 2.07 | % |
| | | | | | | | 18,032,090 | | | | 6.27 | % |
| | | | | | | | | | | | | |
| Energy – 2.33% | | | | | | | | | | | | |
| Tesoro Corp. | | | 62,700 | | | | 6,704,511 | | | | 2.33 | % |
| | | | | | | | | | | | | |
| Financials – 6.42% | | | | | | | | | | | | |
| AmTrust Financial Services, Inc. | | | 105,400 | | | | 7,190,388 | | | | 2.50 | % |
| Erie Indemnity Co. | | | 62,240 | | | | 5,443,510 | | | | 1.89 | % |
| Jones Lang Lasalle, Inc. | | | 35,000 | | | | 5,834,850 | | | | 2.03 | % |
| | | | | | | | 18,468,748 | | | | 6.42 | % |
| | | | | | | | | | | | | |
| Health Care – 8.84% | | | | | | | | | | | | |
| Aetna, Inc. | | | 57,300 | | | | 6,576,894 | | | | 2.28 | % |
| Amedisys, Inc. (a) | | | 188,100 | | | | 7,444,998 | | | | 2.59 | % |
| HCA Holdings, Inc. (a) | | | 80,300 | | | | 5,523,837 | | | | 1.92 | % |
| UnitedHealth Group, Inc. | | | 50,000 | | | | 5,889,000 | | | | 2.05 | % |
| | | | | | | | 25,434,729 | | | | 8.84 | % |
The accompanying notes are an integral part of these financial statements.
| COMMON STOCKS | | Number | | | | | | % of | |
| | | of Shares | | | Value | | | Net Assets | |
| Industrials – 26.97% | | | | | | | | | |
| American Woodmark Corp. (a) | | | 123,100 | | | $ | 8,949,370 | | | | 3.11 | % |
| Atlas Air Worldwide Holdings, Inc. (a) | | | 123,900 | | | | 5,109,636 | | | | 1.78 | % |
| Covenant Transportation Group, Inc. (a) | | | 179,200 | | | | 3,458,560 | | | | 1.20 | % |
| HNI Corp. | | | 111,700 | | | | 4,796,398 | | | | 1.67 | % |
| Huntington Ingalls Industries, Inc. | | | 40,100 | | | | 4,809,594 | | | | 1.67 | % |
| JetBlue Airways Corp. (a) | | | 325,300 | | | | 8,080,452 | | | | 2.81 | % |
| Lydall, Inc. (a) | | | 177,200 | | | | 6,065,556 | | | | 2.11 | % |
| Multi-Color Corp. | | | 82,600 | | | | 6,429,584 | | | | 2.23 | % |
| Northrop Grumman Corp. | | | 33,800 | | | | 6,345,950 | | | | 2.21 | % |
| Patrick Industries, Inc. (a) | | | 149,100 | | | | 6,050,478 | | | | 2.10 | % |
| Republic Airways Holdings, Inc. (a) | | | 445,200 | | | | 2,564,352 | | | | 0.89 | % |
| Spirit AeroSystems Holdings, Inc., Class A (a) | | | 114,800 | | | | 6,054,552 | | | | 2.10 | % |
| United Continental Holdings, Inc. (a) | | | 83,000 | | | | 5,005,730 | | | | 1.74 | % |
| West Corp. | | | 163,200 | | | | 3,885,792 | | | | 1.35 | % |
| | | | | | | | 77,606,004 | | | | 26.97 | % |
| | | | | | | | | | | | | |
| Information Technology – 9.11% | | | | | | | | | | | | |
| CDW Corp. | | | 150,000 | | | | 6,703,500 | | | | 2.33 | % |
| ePlus, Inc. (a) | | | 69,900 | | | | 5,900,958 | | | | 2.05 | % |
| Science Applications International Corp. | | | 105,000 | | | | 4,815,300 | | | | 1.67 | % |
| Super Micro Computer, Inc. (a) | | | 142,000 | | | | 4,005,820 | | | | 1.39 | % |
| Tower Semiconductor Ltd. (a)(b) | | | 359,100 | | | | 4,797,576 | | | | 1.67 | % |
| | | | | | | | 26,223,154 | | | | 9.11 | % |
| | | | | | | | | | | | | |
| Materials – 9.00% | | | | | | | | | | | | |
| Ball Corp. | | | 79,000 | | | | 5,411,500 | | | | 1.88 | % |
| Mercer International, Inc. | | | 404,400 | | | | 4,367,520 | | | | 1.52 | % |
| Sealed Air Corp. | | | 119,900 | | | | 5,889,488 | | | | 2.05 | % |
| U.S. Concrete, Inc. (a) | | | 184,100 | | | | 10,210,186 | | | | 3.55 | % |
| | | | | | | | 25,878,694 | | | | 9.00 | % |
| | | | | | | | | | | | | |
| Utilities – 2.30% | | | | | | | | | | | | |
| WGL Holdings, Inc. | | | 106,300 | | | | 6,615,049 | | | | 2.30 | % |
| | | | | | | | | | | | | |
| Total Common Stocks | | | | | | | | | | | | |
| (Cost $261,800,231) | | | | | | | 274,702,633 | | | | 95.48 | % |
The accompanying notes are an integral part of these financial statements.
| HENNESSY FUNDS | 1-800-966-4354 | |
| RIGHTS – 0.00% | | Number | | | | | | % of | |
| | | of Shares | | | Value | | | Net Assets | |
| Health Care – 0.00% | | | | | | | | | |
| Forest Laboratories, Inc. (a)(c) | | | 5,500 | | | $ | 275 | | | | 0.00 | % |
| | | | | | | | | | | | | |
| Total Rights | | | | | | | | | | | | |
| (Cost $0) | | | | | | | 275 | | | | 0.00 | % |
| | | | | | | | | | | | | |
| SHORT-TERM INVESTMENTS – 4.51% | | | | | | | | | | | | |
| | | | | | | | | | | | | |
| Money Market Funds – 4.51% | | | | | | | | | | | | |
| Fidelity Government Portfolio – | | | | | | | | | | | | |
| Institutional Class, 0.01% (d) | | | 12,979,280 | | | | 12,979,280 | | | | 4.51 | % |
| | | | | | | | | | | | | |
| Total Short-Term Investments | | | | | | | | | | | | |
| (Cost $12,979,280) | | | | | | | 12,979,280 | | | | 4.51 | % |
| | | | | | | | | | | | | |
| Total Investments | | | | | | | | | | | | |
| (Cost $274,779,511) – 99.99% | | | | | | | 287,682,188 | | | | 99.99 | % |
| Other Assets in | | | | | | | | | | | | |
| Excess of Liabilities – 0.01% | | | | | | | 21,520 | | | | 0.01 | % |
TOTAL NET ASSETS – 100.00% | | | | | | $ | 287,703,708 | | | | 100.00 | % |
Percentages are stated as a percent of net assets.
| (a) | Non-income producing security. |
| (b) | U.S. traded security of a foreign corporation. |
| (c) | Security is fair valued in good faith. |
| (d) | The rate listed is the fund’s 7-day yield as of October 31, 2015. |
The accompanying notes are an integral part of these financial statements.
Summary of Fair Value Exposure at October 31, 2015
The following is a summary of the inputs used to value the Fund’s net assets as of October 31, 2015 (see Note 3 in the accompanying notes to the financial statements):
| Common Stocks | | Level 1 | | | Level 2 | | | Level 3 | | | Total | |
| Consumer Discretionary | | $ | 69,739,654 | | | $ | — | | | $ | — | | | $ | 69,739,654 | |
| Consumer Staples | | | 18,032,090 | | | | — | | | | — | | | | 18,032,090 | |
| Energy | | | 6,704,511 | | | | — | | | | — | | | | 6,704,511 | |
| Financials | | | 18,468,748 | | | | — | | | | — | | | | 18,468,748 | |
| Health Care | | | 25,434,729 | | | | — | | | | — | | | | 25,434,729 | |
| Industrials | | | 77,606,004 | | | | — | | | | — | | | | 77,606,004 | |
| Information Technology | | | 26,223,154 | | | | — | | | | — | | | | 26,223,154 | |
| Materials | | | 25,878,694 | | | | — | | | | — | | | | 25,878,694 | |
| Utilities | | | 6,615,049 | | | | — | | | | — | | | | 6,615,049 | |
| Total Common Stocks | | $ | 274,702,633 | | | $ | — | | | $ | — | | | $ | 274,702,633 | |
| Rights | | | | | | | | | | | | | | | | |
| Health Care | | $ | — | | | $ | — | | | $ | 275 | | | $ | 275 | |
| Total Rights | | $ | — | | | $ | — | | | $ | 275 | * | | $ | 275 | |
| Short-Term Investments | | | | | | | | | | | | | | | | |
| Money Market Funds | | $ | 12,979,280 | | | $ | — | | | $ | — | | | $ | 12,979,280 | |
| Total Short-Term Investments | | $ | 12,979,280 | | | $ | — | | | $ | — | | | $ | 12,979,280 | |
| Total Investments | | $ | 287,681,913 | | | $ | — | | | $ | 275 | | | $ | 287,682,188 | |
* Acquired in merger.
Transfers between levels are recognized at the end of the reporting period. During the year ended October 31, 2015, the Fund recognized no transfers between levels.
Level 3 Reconciliation Disclosure
Following is a reconciliation of Level 3 assets for which significant unobservable inputs were used to determine fair value.
| | | Rights | |
| Balance as of October 31, 2014 | | $ | 5,225 | |
| Accrued discounts/premiums | | | — | |
| Realized gain (loss) | | | — | |
| Change in unrealized appreciation (depreciation) | | | (4,950 | ) |
| Purchases | | | — | |
| (Sales) | | | — | |
| Transfer in and/or out of Level 3 | | | — | |
| Balance as of October 31, 2015 | | $ | 275 | |
| | | | | |
| Change in unrealized appreciation/depreciation during the period for | | | | |
| Level 3 investments held at October 31, 2015 | | $ | (4,950 | ) |
The Level 3 investments as of October 31, 2015 represented 0.00% of net assets and did not warrant a disclosure of significant unobservable valuation inputs.
The accompanying notes are an integral part of these financial statements.
| HENNESSY FUNDS | 1-800-966-4354 | |
Financial Statements
Statement of Assets and Liabilities as of October 31, 2015 |
| ASSETS: | | | |
| Investments in securities, at value (cost $274,779,511) | | $ | 287,682,188 | |
| Dividends and interest receivable | | | 131,903 | |
| Receivable for fund shares sold | | | 719,568 | |
| Prepaid expenses and other assets | | | 24,231 | |
| Total Assets | | | 288,557,890 | |
| | | | | |
| LIABILITIES: | | | | |
| Payable for fund shares redeemed | | | 497,256 | |
| Payable to advisor | | | 177,968 | |
| Payable to administrator | | | 46,463 | |
| Payable to auditor | | | 26,600 | |
| Accrued service fees | | | 20,815 | |
| Accrued interest payable | | | 157 | |
| Accrued trustees fees | | | 2,402 | |
| Accrued expenses and other payables | | | 82,521 | |
| Total Liabilities | | | 854,182 | |
| NET ASSETS | | $ | 287,703,708 | |
| | | | | |
| NET ASSETS CONSIST OF: | | | | |
| Capital stock | | $ | 373,773,900 | |
| Accumulated net investment income | | | 354,293 | |
| Accumulated net realized loss on investments | | | (99,327,162 | ) |
| Unrealized net appreciation on investments | | | 12,902,677 | |
| Total Net Assets | | $ | 287,703,708 | |
| | | | | |
| NET ASSETS | | | | |
| Investor Class: | | | | |
| Shares authorized (no par value) | | Unlimited | |
| Net assets applicable to outstanding Investor Class shares | | $ | 248,743,705 | |
| Shares issued and outstanding | | | 12,435,047 | |
| Net asset value, offering price and redemption price per share | | $ | 20.00 | |
| | | | | |
| Institutional Class: | | | | |
| Shares authorized (no par value) | | Unlimited | |
| Net assets applicable to outstanding Institutional Class shares | | $ | 38,960,003 | |
| Shares issued and outstanding | | | 1,903,495 | |
| Net asset value, offering price and redemption price per share | | $ | 20.47 | |
The accompanying notes are an integral part of these financial statements.
Financial Statements
Statement of Operations for the year ended October 31, 2015 |
| INVESTMENT INCOME: | | | |
Dividend income(1) | | $ | 4,120,593 | |
| Interest income | | | 1,134 | |
| Total investment income | | | 4,121,727 | |
| | | | | |
| EXPENSES: | | | | |
| Investment advisory fees (See Note 5) | | | 2,092,508 | |
| Sub-transfer agent expenses – Investor Class (See Note 5) | | | 394,949 | |
| Sub-transfer agent expenses – Institutional Class (See Note 5) | | | 39,274 | |
| Administration, fund accounting, custody and transfer agent fees (See Note 5) | | | 275,654 | |
| Service fees – Investor Class (See Note 5) | | | 244,729 | |
| Federal and state registration fees | | | 35,326 | |
| Reports to shareholders | | | 27,731 | |
| Audit fees | | | 27,525 | |
| Compliance expense | | | 22,186 | |
| Trustees’ fees and expenses | | | 12,260 | |
| Legal fees | | | 3,944 | |
| Interest expense (See Note 6) | | | 705 | |
| Other expenses | | | 19,514 | |
| Total expenses before reimbursement by advisor | | | 3,196,305 | |
| Expense reimbursement by advisor – Institutional Class (See Note 5) | | | (1,023 | ) |
| Net expenses | | | 3,195,282 | |
| NET INVESTMENT INCOME | | $ | 926,445 | |
| | | | | |
| REALIZED AND UNREALIZED GAINS (LOSSES): | | | | |
| Net realized gain on investments | | $ | 50,172,808 | |
| Net change in unrealized depreciation on investments | | | (32,171,870 | ) |
| Net gain on investments | | | 18,000,938 | |
| NET INCREASE IN NET ASSETS RESULTING FROM OPERATIONS | | $ | 18,927,383 | |
(1) | Net of foreign taxes withheld of $10,040. |
The accompanying notes are an integral part of these financial statements.
| HENNESSY FUNDS | 1-800-966-4354 | |
(This Page Intentionally Left Blank.)
Financial Statements
| Statements of Changes in Net Assets |
| | | Year Ended | | | Year Ended | |
| | | October 31, 2015 | | | October 31, 2014 | |
| OPERATIONS: | | | | | | |
| Net investment income (loss) | | $ | 926,445 | | | $ | (356,732 | ) |
| Net realized gain on investments | | | 50,172,808 | | | | 44,803,198 | |
| Net change in unrealized depreciation on investments | | | (32,171,870 | ) | | | (404,454 | ) |
| Net increase in net assets resulting from operations | | | 18,927,383 | | | | 44,042,012 | |
| | | | | | | | | |
| CAPITAL SHARE TRANSACTIONS: | | | | | | | | |
| Proceeds from shares subscribed – Investor Class | | | 52,930,420 | | | | 13,584,680 | |
| Proceeds from shares subscribed – Institutional Class | | | 31,992,911 | | | | 2,181,382 | |
| Cost of shares redeemed – Investor Class | | | (48,171,421 | ) | | | (46,133,939 | )(1) |
| Cost of shares redeemed – Institutional Class | | | (21,201,209 | ) | | | (7,504,821 | )(1) |
| Net increase (decrease) in net assets derived | | | | | | | | |
| from capital share transactions | | | 15,550,701 | | | | (37,872,698 | ) |
| TOTAL INCREASE IN NET ASSETS | | | 34,478,084 | | | | 6,169,314 | |
| | | | | | | | | |
| NET ASSETS: | | | | | | | | |
| Beginning of year | | | 253,225,624 | | | | 247,056,310 | |
| End of year | | $ | 287,703,708 | | | $ | 253,225,624 | |
| Undistributed net investment | | | | | | | | |
| income (loss), end of year | | $ | 354,293 | | | $ | (994,593 | ) |
| | | | | | | | | |
| CHANGES IN SHARES OUTSTANDING: | | | | | | | | |
| Shares sold – Investor Class | | | 2,691,286 | | | | 780,130 | |
| Shares sold – Institutional Class | | | 1,609,045 | | | | 122,952 | |
| Shares redeemed – Investor Class | | | (2,447,997 | ) | | | (2,701,648 | ) |
| Shares redeemed – Institutional Class | | | (1,044,452 | ) | | | (429,220 | ) |
| Net increase (decrease) in shares outstanding | | | 807,882 | | | | (2,227,786 | ) |
(1) | Net of redemption fees of $34 and $46 for the Investor Class and Institutional Class shares, respectively, related to redemption fees imposed by the FBR Small Cap Fund (which was reorganized into the Fund) during a prior year but not received until the year ended October 31, 2014. |
The accompanying notes are an integral part of these financial statements.
| HENNESSY FUNDS | 1-800-966-4354 | |
Financial Statements
For an Investor Class share outstanding throughout each year
PER SHARE DATA:
Net asset value, beginning of year
Income from investment operations:
Net investment income (loss)
Net realized and unrealized gains (losses) on investments
Total from investment operations
Net asset value, end of year
TOTAL RETURN
SUPPLEMENTAL DATA AND RATIOS:
Net assets, end of year (millions)
Ratio of expenses to average net assets
Ratio of net investment income (loss) to average net assets
Portfolio turnover rate(1)
(1) | Portfolio turnover is calculated on the basis of the Fund as a whole. |
The accompanying notes are an integral part of these financial statements.
| Year Ended October 31, | |
| 2015 | | | 2014 | | | 2013 | | | 2012 | | | 2011 | |
| | | | | | | | | | | | | |
| $ | 18.68 | | | $ | 15.65 | | | $ | 12.38 | | | $ | 9.97 | | | $ | 10.28 | |
| | | | | | | | | | | | | | | | | | | |
| | | | | | | | | | | | | | | | | | | |
| | 0.06 | | | | (0.04 | ) | | | (0.11 | ) | | | (0.07 | ) | | | (0.08 | ) |
| | 1.26 | | | | 3.07 | | | | 3.38 | | | | 2.48 | | | | (0.23 | ) |
| | 1.32 | | | | 3.03 | | | | 3.27 | | | | 2.41 | | | | (0.31 | ) |
| | | | | | | | | | | | | | | | | | | |
| $ | 20.00 | | | $ | 18.68 | | | $ | 15.65 | | | $ | 12.38 | | | $ | 9.97 | |
| | | | | | | | | | | | | | | | | | | |
| | 7.07 | % | | | 19.36 | % | | | 26.41 | % | | | 24.17 | % | | | (3.02 | )% |
| | | | | | | | | | | | | | | | | | | |
| | | | | | | | | | | | | | | | | | | |
| $ | 248.74 | | | $ | 227.68 | | | $ | 220.83 | | | $ | 265.60 | | | $ | 184.40 | |
| | 1.15 | % | | | 1.23 | % | | | 1.29 | % | | | 1.34 | % | | | 1.33 | % |
| | 0.30 | % | | | (0.17 | )% | | | (0.26 | )% | | | (0.66 | )% | | | (0.78 | )% |
| | 102 | % | | | 84 | % | | | 105 | % | | | 90 | % | | | 106 | % |
The accompanying notes are an integral part of these financial statements.
| HENNESSY FUNDS | 1-800-966-4354 | |
Financial Statements
For an Institutional Class share outstanding throughout each year
PER SHARE DATA:
Net asset value, beginning of year
Income from investment operations:
Net investment income (loss)
Net realized and unrealized gains (losses) on investments
Total from investment operations
Net asset value, end of year
TOTAL RETURN
SUPPLEMENTAL DATA AND RATIOS:
Net assets, end of year (millions)
Ratio of expenses to average net assets:
Before expense reimbursement
After expense reimbursement
Ratio of net investment income (loss) to average net assets:
Before expense reimbursement
After expense reimbursement
Portfolio turnover rate(1)
(1) | Portfolio turnover is calculated on the basis of the Fund as a whole. |
The accompanying notes are an integral part of these financial statements.
| Year Ended October 31, | |
| 2015 | | | 2014 | | | 2013 | | | 2012 | | | 2011 | |
| | | | | | | | | | | | | |
| $ | 19.08 | | | $ | 15.94 | | | $ | 12.57 | | | $ | 10.09 | | | $ | 10.37 | |
| | | | | | | | | | | | | | | | | | | |
| | | | | | | | | | | | | | | | | | | |
| | 0.03 | | | | 0.06 | | | | 0.01 | | | | (0.04 | ) | | | (0.05 | ) |
| | 1.36 | | | | 3.08 | | | | 3.36 | | | | 2.52 | | | | (0.23 | ) |
| | 1.39 | | | | 3.14 | | | | 3.37 | | | | 2.48 | | | | (0.28 | ) |
| | | | | | | | | | | | | | | | | | | |
| $ | 20.47 | | | $ | 19.08 | | | $ | 15.94 | | | $ | 12.57 | | | $ | 10.09 | |
| | | | | | | | | | | | | | | | | | | |
| | 7.29 | % | | | 19.70 | % | | | 26.81 | % | | | 24.58 | % | | | (2.70 | )% |
| | | | | | | | | | | | | | | | | | | |
| | | | | | | | | | | | | | | | | | | |
| $ | 38.96 | | | $ | 25.54 | | | $ | 26.23 | | | $ | 37.11 | | | $ | 2.53 | |
| | | | | | | | | | | | | | | | | | | |
| | 0.99 | % | | | 1.03 | % | | | 1.11 | % | | | 1.11 | % | | | 1.09 | % |
| | 0.99 | % | | | 0.98 | % | | | 0.98 | % | | | 0.98 | % | | | 0.98 | % |
| | | | | | | | | | | | | | | | | | | |
| | 0.51 | % | | | 0.03 | % | | | (0.01 | )% | | | (0.51 | )% | | | (0.55 | )% |
| | 0.51 | % | | | 0.08 | % | | | 0.12 | % | | | (0.38 | )% | | | (0.44 | )% |
| | 102 | % | | | 84 | % | | | 105 | % | | | 90 | % | | | 106 | % |
The accompanying notes are an integral part of these financial statements.
| HENNESSY FUNDS | 1-800-966-4354 | |
Financial Statements
Notes to the Financial Statements October 31, 2015 |
1). ORGANIZATION
The Hennessy Cornerstone Growth Fund (the “Fund”) is a series of Hennessy Funds Trust (the “Trust”), which was organized as a Delaware statutory trust on September 17, 1992. The Fund is an open-end management investment company registered under the Investment Company Act of 1940, as amended. The Fund is a successor to a fund with the same name (the “Predecessor Fund”) that was a series of Hennessy Mutual Funds, Inc., a Maryland corporation, pursuant to a reorganization that took place after the close of business on February 28, 2014. Prior to February 28, 2014, the Fund had no investment operations. As a result of the reorganization, holders of the Investor Class shares of the Predecessor Fund received Investor Class shares of the Fund (the Investor Class shares of the Fund are the successor to the accounting and performance information of the Predecessor Fund), and holders of the Institutional Class shares of the Predecessor Fund received Institutional Class shares of the Fund (the Institutional Class shares of the Fund are the successor to the accounting and performance information of the Predecessor Fund). The investment objective of the Fund is long-term growth of capital. The Fund is a diversified fund.
The Fund offers Investor Class and Institutional Class shares. Each class of shares differs principally in its respective administration, shareholder servicing, and transfer agent expenses and sales charges, if any. Each class has identical rights to earnings, assets, and voting privileges, except for class-specific expenses and exclusive rights to vote on matters affecting only an individual class.
As an investment company, the Fund follows the investment company accounting and reporting guidance of the Financial Accounting Standards Board (“FASB”) Accounting Standard Codification Topic 946 “Financial Services—Investment Companies.”
2). SIGNIFICANT ACCOUNTING POLICIES
The following is a summary of significant accounting policies consistently followed by the Fund in the preparation of the financial statements. These policies are in conformity with U.S. generally accepted accounting principles (“GAAP”).
| a). | Investment Valuation – All investments in securities are recorded at their estimated fair value, as described in Note 3. |
| | |
| b). | Federal Income Taxes – Provision for federal income taxes or excise taxes has not been made since the Fund has elected to be taxed as a “regulated investment company” and intends to distribute substantially all of its taxable income to its shareholders and otherwise comply with the provisions of the Internal Revenue Code of 1986, as amended, applicable to regulated investment companies. Net investment income or loss and realized gains and losses for federal income tax purposes may differ from that reported on the financial statements because of temporary book and tax basis differences. Temporary differences are primarily the result of the treatment of wash sales for tax reporting purposes. The Fund recognizes interest and penalties related to income tax benefits, if any, in the statement of operations as an income tax expense. Distributions from net realized gains for book purposes may include short-term capital gains, which are included as ordinary income to shareholders for tax purposes. |
| | Due to inherent differences in the recognition of income, expenses, and realized gains/losses under GAAP and federal income tax regulations, permanent differences between book and tax basis reporting for the 2015 fiscal year have been identified and appropriately reclassified on the Statement of Assets and Liabilities. The adjustments are as follows: |
| Undistributed | Accumulated | |
| Net Investment | Net Realized | |
Income/(Loss) | Gain/(Loss) | Paid-in Capital |
| $422,441 | $(416,821) | $(5,620) |
| c). | Income and Expenses – Dividend income is recognized on the ex-dividend date or as soon as information is available to the Fund. Interest income, which includes the amortization of premium and accretion of discount, is recognized on an accrual basis. The Fund is charged for those expenses that are directly attributable to the portfolio, such as advisory, administration, and certain shareholder service fees. Income, expenses (other than expenses attributable to a specific class), and realized and unrealized gains or losses on investments are allocated to each class of shares based on its respective net assets. |
| | |
| d). | Distributions to Shareholders – Dividends from net investment income for the Fund, if any, are declared and paid annually, usually in December. Distributions of net realized capital gains, if any, are declared and paid annually, usually in December. |
| | |
| e). | Security Transactions – Investment and shareholder transactions are recorded on the trade date. The Fund determines the gain or loss realized from the investment transactions by comparing the original cost of the security lot sold with the net sale proceeds. Discounts and premiums on securities purchased are accreted/amortized over the life of the respective security. |
| | |
| f). | Use of Estimates – The preparation of financial statements in conformity with GAAP requires management to make estimates and assumptions that affect the reported amounts of assets and liabilities and disclosure of contingent assets and liabilities at the date of the financial statements and the reported change in net assets during the reporting period. Actual results could differ from those estimates. |
| | |
| g). | Share Valuation – The net asset value (“NAV”) per share of the Fund is calculated by dividing the sum of the value of the securities held by the Fund, plus cash or other assets, minus all liabilities (including estimated accrued expenses) by the total number of shares outstanding for the Fund, rounded to the nearest cent. The Fund’s shares will not be priced on days the New York Stock Exchange is closed for trading. The offering and redemption price per share for the Fund is equal to the Fund’s NAV per share. |
| | |
| h). | Foreign Currency – Values of investments denominated in foreign currencies, if any, are converted into U.S. dollars using the spot market rate of exchange at the time of valuation. Purchases and sales of investments and income are translated into U.S. dollars using the spot market rate of exchange prevailing on the respective dates of such transactions. The Fund does not isolate the portion of the results of operations resulting from fluctuations in foreign exchange rates on investments from fluctuations resulting from changes in the market prices of securities held. Such fluctuations are included with the net realized and unrealized gain or loss on investments. Foreign investments present additional risks due to currency fluctuations, economic and political factors, lower liquidity, government regulations, differences in accounting standards, and other factors. |
| HENNESSY FUNDS | 1-800-966-4354 | |
| i). | Forward Contracts – The Fund may enter into forward currency contracts to reduce its exposure to changes in foreign currency exchange rates on its foreign holdings and to lock in the U.S. dollar cost of firm purchase and sale commitments for securities denominated in foreign currencies. A forward currency contract is a commitment to purchase or sell a foreign currency at a future date at a negotiated forward rate. The gain or loss arising from the difference between the U.S. dollar cost of the original contract and the value of the foreign currency in U.S. dollars upon closing of such contract is included in net realized gain or loss from foreign currency transactions. During the fiscal year ended October 31, 2015, the Fund did not enter into any forward contracts. |
| | |
| j). | Repurchase Agreements – The Fund may enter into repurchase agreements with member banks or security dealers of the Federal Reserve Board whom the investment advisor deems creditworthy. The repurchase price generally equals the price paid by the Fund plus interest negotiated on the basis of current short-term rates. |
| | |
| | Securities pledged as collateral for repurchase agreements are held by the custodian bank until the respective agreements mature. Provisions of the repurchase agreements ensure that the market value of the collateral, including accrued interest thereon, is sufficient to cover the repurchase amount in the event of default of the counterparty. If the counterparty defaults and the value of the collateral declines or if the counterparty enters an insolvency proceeding, realization of the collateral by the Fund may be delayed or limited. |
| | |
| k). | Accounting for Uncertainty in Income Taxes – The Fund has accounting policies regarding recognition and measurement of tax positions taken or expected to be taken on a tax return. The tax returns of the Fund for the prior three fiscal years are open for examination. The Fund has reviewed all open tax years in major jurisdictions and concluded that there is no impact on the Fund’s net assets and no tax liability resulting from unrecognized tax benefits relating to uncertain income tax positions taken or expected to be taken on a tax return. The Fund’s major tax jurisdictions are U.S. federal and Delaware. |
| | |
| l). | New Accounting Pronouncements – In June 2014, the FASB issued Accounting Standards Update (“ASU”) No. 2014-11 “Repurchase-to Maturity Transactions, Repurchase Financings, and Disclosures.” The amendments in this ASU require an entity to modify accounting for repurchase-to-maturity transactions and repurchase financing arrangements, as well as modify required disclosures for repurchase agreements, securities lending transactions, and repurchase-to-maturity transactions that are accounted for as secured borrowings. The guidance is effective for fiscal years beginning on or after December 15, 2014, and for interim periods within those fiscal years. Management is currently evaluating the impact these changes will have on the Fund’s financial statement disclosures. |
| | |
| | In May 2015, the FASB issued ASU No. 2015-07 “Disclosure for Investments in Certain Entities that Calculate Net Asset Value per Share (or Its Equivalent).” The amendments in ASU No. 2015-07 remove the requirement to categorize within the fair value hierarchy investments measured at NAV and require the disclosure of sufficient information to reconcile the fair value of the remaining assets categorized within the fair value hierarchy to the financial statements. The amendments in ASU No. 2015-07 are effective for fiscal years beginning after December 15, 2015, and interim periods within those fiscal years. Management has reviewed the requirements and believes the adoption of ASU 2015-07 will not have a material impact on the Fund’s financial statements and related disclosures. |
3). SECURITIES VALUATION
The Fund follows authoritative fair valuation accounting standards that establish an authoritative definition of fair value and set out a hierarchy for measuring fair value. These standards require additional disclosures about the various inputs and valuation techniques used to develop the measurements of fair value and a discussion in changes in valuation techniques and related inputs during the period. These inputs are summarized in the three broad levels listed below:
| | Level 1 – | Quoted unadjusted prices for identical instruments in active markets to which the Fund has access at the date of measurement. |
| | | |
| | Level 2 – | Quoted prices for similar instruments in active markets; quoted prices for identical or similar instruments in markets that are not active; and model-derived valuations in which all significant inputs and significant value drivers are observable in active markets. Level 2 inputs are those in markets for which there are few transactions, the prices are not current, the prices are fair value adjusted due to post-market close subsequent events (foreign markets), little public information exists, or instances where prices vary substantially over time or among brokered market makers. These inputs may also include interest rates, prepayment speeds, credit risk curves, default rates, and similar data. |
| | | |
| | Level 3 – | Model-derived valuations in which one or more significant inputs or significant value drivers are unobservable. Unobservable inputs are those inputs that reflect the Fund’s own assumptions about what market participants would use to price the asset or liability based on the best available information. |
Following is a description of the valuation techniques applied to the Fund’s major categories of assets and liabilities measured at fair value on a recurring basis.
Equity Securities – Equity securities, including common stocks, preferred stocks, foreign-issued common stocks, exchange-traded funds, closed-end mutual funds, partnerships, rights, and real estate investment trusts, that are traded on a securities exchange for which a last-quoted sales price is readily available will generally be valued at the last sales price as reported by the primary exchange on which the securities are listed. Securities listed on The NASDAQ Stock Market (“NASDAQ”) will generally be valued at the NASDAQ Official Closing Price, which may differ from the last sales price reported. Securities traded on a securities exchange for which a last-quoted sales price is not readily available will generally be valued at the mean between the bid and ask prices. To the extent these securities are actively traded and valuation adjustments are not applied, they are classified in Level 1 of the fair value hierarchy. Securities traded on foreign exchanges generally are not valued at the same time the Fund calculates its NAV because most foreign markets close well before such time. The earlier close of most foreign markets gives rise to the possibility that significant events, including broad market moves, may have occurred in the interim. In certain circumstances, it may be determined that a security needs to be fair valued because it appears that the value of the security might have been materially affected by events occurring after the close of the market in which the security is principally traded, but before the time the Fund calculates its NAV, such as by a development that affects an entire market or region (e.g., weather-related events) or a potentially global development (e.g., a terrorist attack that may be expected to have an effect on investor expectations worldwide).
| HENNESSY FUNDS | 1-800-966-4354 | |
Registered Investment Companies – Investments in registered investment companies (e.g., mutual funds) are generally priced at the ending NAV provided by the applicable registered investment company’s service agent and will be classified in Level 1 of the fair value hierarchy.
Debt Securities – Debt securities, including corporate bonds, asset-backed securities, mortgage-backed securities, municipal bonds, U.S. Treasuries, and U.S. government agency issues, are generally valued at market on the basis of valuations furnished by an independent pricing service that utilizes both dealer-supplied valuations and formula-based techniques. The pricing service may consider recently executed transactions in securities of the issuer or comparable issuers, market price quotations (where observable), bond spreads, and fundamental data relating to the issuer. In addition, the model may incorporate market observable data such as reported sales of similar securities, broker quotes, yields, bids, offers, and reference data. Certain securities are valued principally using dealer quotations. These securities are generally classified in Level 2 of the fair value hierarchy.
Short-Term Securities – Short-term equity investments, including money market funds, are valued in the manner specified above. Short-term debt investments are generally valued at amortized cost, which approximates fair market value, if their original term to maturity was 60 days or less, or by amortizing the values as of the 61st day prior to maturity, if their original term to maturity exceeded 60 days. Amortized cost is not used if its use would be inappropriate due to credit or other impairments of the issuer, in which case the security’s fair value would be determined, as described below. Short-term securities are generally classified in Level 1 or Level 2 of the fair market hierarchy depending on the inputs used and market activity levels for specific securities.
The Board of Trustees of the Fund (the “Board”) has adopted fair value pricing procedures that are followed when a price for a security is not readily available or if a significant event has occurred that indicates the closing price of a security no longer represents the true value of that security. Fair value pricing determinations are made in good faith in accordance with these procedures. There are numerous criteria that will be given consideration in determining a fair value of a security. Some of these criteria are trading volume of a security and markets, the value of other like securities, and news events with direct bearing to a security or markets. Fair value pricing results in an estimated price for a security that reflects the amount the Fund might reasonably expect to receive in a current sale. Depending on the relative significance of the valuation inputs, these securities may be classified in either Level 2 or Level 3 of the fair value hierarchy.
The fair valuation of foreign securities may be determined with the assistance of a pricing service using correlations between the movement of prices of such securities and indices of domestic securities and other appropriate indicators, such as closing market prices of relevant American Depositary Receipts or futures contracts. The effect of using fair value pricing is that the Fund’s NAV will reflect the affected portfolio securities’ value as determined in the judgment of the Board or its designee instead of being determined by the market. Using a fair value pricing methodology to price foreign securities may result in a value that is different from a foreign security’s most recent closing price and from the prices used by other investment companies to calculate their NAVs and are generally considered Level 2 prices in the fair valuation hierarchy. Because the Fund may invest in foreign securities, the value of the Fund’s portfolio securities may change on days when you will not be able to purchase or redeem your shares.
The Board has delegated day-to-day valuation matters to a Valuation Committee comprised of one or more representatives from Hennessy Advisors, Inc., the Fund’s
investment advisor. The function of the Valuation Committee is to value securities where current and reliable market quotations are not readily available. All actions taken by the Valuation Committee are reviewed by the Board.
The Fund has performed an analysis of all existing investments to determine the significance and character of all inputs to their fair value determination. Various inputs are used in determining the value of the Fund’s investments. The inputs or methodology used for valuing securities are not necessarily an indication of the risk associated with investing in those securities. Details related to the fair valuation hierarchy of the Fund’s securities as of October 31, 2015 are included in the Fund’s Schedule of Investments.
4). INVESTMENT TRANSACTIONS
Purchases and sales of investment securities (excluding government and short-term investments) for the Fund during the fiscal year ended October 31, 2015 were $292,206,813 and $277,789,536, respectively.
There were no purchases or sales/maturities of long-term U.S. Government Securities for the Fund during the fiscal year ended October 31, 2015.
5). INVESTMENT MANAGEMENT FEE AND OTHER TRANSACTIONS WITH AFFILIATES
Hennessy Advisors, Inc. (the “Advisor”) is the investment advisor of the Fund. The Advisor provides the Fund with investment management services under an Investment Advisory Agreement. The Advisor furnishes all investment advice, office space, facilities, and provides most of the personnel needed by the Fund. As compensation for its services, the Advisor is entitled to a monthly fee from the Fund. The fee is based upon the average daily net assets of the Fund at the annual rate of 0.74%. The net investment advisory fees payable by the Fund as of October 31, 2015 were $177,968.
In the past, the Advisor has agreed to waive its fees and absorb expenses to the extent that the total annual operating expenses (excluding all federal, state and local taxes, interest, brokerage commissions, acquired fund fees and expenses and other costs incurred in connection with the purchase and sale of securities and extraordinary items) exceeded 0.98% of the Fund’s net assets for the Institutional Class shares of the Fund. The expense limitation agreement for the Institutional Class shares could only be terminated by the Board and was terminated by the Board as of February 28, 2015.
For a period of three years after the year in which the Advisor waived or reimbursed expenses, the Advisor may seek reimbursement from the Fund to the extent that total annual fund operating expenses are less than the expense limitation that was in effect at the time the Advisor waived or reimbursed expenses. The Advisor waived or reimbursed expenses of $1,023 for the Fund during the fiscal year ended October 31, 2015. As of October 31, 2015, cumulative expenses subject to potential recovery under the aforementioned conditions were $1,023 for Institutional Class shares, which will expire on October 31, 2018.
The Board has approved a Shareholder Servicing Agreement for the Investor Class shares of the Fund, which was instituted to compensate the Advisor for the non-investment management services it provides to the Fund. The Shareholder Servicing Agreement provides for a monthly fee paid to the Advisor at an annual rate of 0.10% of the average daily net assets of the Fund attributable to Investor Class shares. Shareholder service fees payable by the Fund as of October 31, 2015 were $20,815.
The Fund has entered into agreements with various brokers, dealers, and financial intermediaries in connection with the sale of shares of the Fund. The agreements provide for periodic payments by the Fund to the brokers, dealers, and financial
| HENNESSY FUNDS | 1-800-966-4354 | |
intermediaries for providing certain shareholder maintenance services (sub-transfer agent expenses). These shareholder services include the pre-processing and quality control of new accounts, shareholder correspondence, answering customer inquiries regarding account status, and facilitating shareholder telephone transactions. Fees paid by the Fund to various brokers, dealers, and financial intermediaries during the fiscal year ended October 31, 2015 were $434,223.
U.S. Bancorp Fund Services, LLC (“USBFS”) provides the Fund with administrative, fund accounting, and transfer agent services, including all regulatory reporting, and necessary office equipment and personnel. As administrator, USBFS is responsible for activities such as (i) preparing various federal and state regulatory filings, reports, and returns for the Fund, (ii) preparing reports and materials to be supplied to the Board, (iii) monitoring the activities of the Fund’s custodian, transfer agent, and accountants, and (iv) coordinating the preparation and payment of the Fund’s expenses and reviewing the Fund’s expense accruals. Fees paid to USBFS during the fiscal year ended October 31, 2015 were $275,654.
U.S. Bank, N.A., an affiliate of USBFS, serves as the Fund’s custodian. Quasar Distributors, LLC acts as the Fund’s principal underwriter in a continuous public offering of the Fund’s shares. Quasar Distributors, LLC is an affiliate of USBFS and U.S. Bank, N.A.
6). LINE OF CREDIT
The Fund has an uncommitted line of credit with the other funds in the Hennessy Funds family of funds (the “Hennessy Funds”) in the amount of the lesser of (i) $100,000,000 or (ii) 33.33% of each Hennessy Fund’s net assets, or 30% for the Hennessy Gas Utility Fund and 10% for the Hennessy Balanced Fund, intended to provide short-term financing, if necessary, subject to certain restrictions, in connection with shareholder redemptions. The credit facility is with the Hennessy Funds’ custodian bank, U.S. Bank, N.A. Borrowings under this arrangement bear interest at the bank’s prime rate and are secured by all of the Fund’s assets (as to its own borrowings only). During the fiscal year ended October 31, 2015, the Fund had an outstanding average daily balance and a weighted average interest rate of $21,381 and 3.25%, respectively. The maximum amount outstanding for the Fund during the period was $2,702,000. At October 31, 2015, the Fund did not have any borrowings outstanding under the line of credit.
7). FEDERAL TAX INFORMATION
As of October 31, 2015, the components of accumulated earnings (losses) for income tax purposes were as follows:
| Cost of investments for tax purposes | | $ | 275,123,133 | |
| Gross tax unrealized appreciation | | $ | 33,988,871 | |
| Gross tax unrealized depreciation | | | (21,429,816 | ) |
| Net tax unrealized appreciation | | $ | 12,559,055 | |
| Undistributed ordinary income | | $ | 354,293 | |
| Undistributed long-term capital gains | | | — | |
| Total distributable earnings | | $ | 354,293 | |
| Other accumulated loss | | $ | (98,983,540 | ) |
| Total accumulated loss | | $ | (86,070,192 | ) |
The difference between book-basis and tax-basis unrealized appreciation is attributable primarily to wash sales and partnership adjustments.
At October 31, 2015, the Fund had capital loss carryforwards that expire as follows:
| | $ | 1,040,214 | | 10/31/16 | |
| | $ | 97,943,326 | | 10/31/17 | |
During the fiscal year ended October 31, 2015, the capital loss carry forwards utilized for the Fund were $50,871,792.
Capital losses sustained in the fiscal year ended October 31, 2012 and in future taxable years will not expire and may be carried over by the Fund without limitation; however, they will retain the character of the original loss. Furthermore, any loss incurred during those taxable years will be required to be utilized prior to the losses incurred in taxable years prior to 2012. As a result of this ordering rule, pre-enactment capital loss carryforwards may be more likely to expire unused. Under pre-enactment law, capital losses could be carried forward for eight years, and carried forward as short-term capital losses, irrespective of the character of the original loss.
At October 31, 2015, the Fund did not defer, on a tax basis, any post-December late year ordinary loss deferrals.
The Fund did not pay any distributions during fiscal year 2015 or fiscal year 2014.
8). EVENTS SUBSEQUENT TO YEAR END
Management has evaluated the Fund’s related events and transactions that occurred subsequent to October 31, 2015, through the date of issuance of the Fund’s financial statements. Other than as disclosed below, management has determined that there were no subsequent events requiring recognition or disclosure in the financial statements.
Effective November 1, 2015, the Fund adopted a plan pursuant to Rule 12b-1 under the Investment Company Act of 1940, as amended, that authorizes payments in connection with the distribution of the Fund’s shares at an annual rate of up to 0.25% of the Fund’s average daily net assets attributable to Investor Class shares. Even though the authorized rate is up to 0.25%, the Fund has only used 0.15% of its average daily net assets attributable to Investor Class shares for such purpose since the plan was implemented on November 1, 2015. Amounts paid under the plan may be spent on any activities or expenses primarily intended to result in the sale of shares, including but not limited to, advertising, compensation for sales and marketing activities or to financial institutions and others, such as dealers and distributors, shareholder account servicing, the printing and mailing of prospectuses to other than current shareholders, and the printing and mailing of sales literature.
| HENNESSY FUNDS | 1-800-966-4354 | |
Report of Independent Registered Public Accounting Firm
The Board of Trustees of Hennessy Funds Trust
and the Shareholders of the Hennessy Cornerstone Growth Fund:
We have audited the accompanying statement of assets and liabilities of Hennessy Cornerstone Growth Fund (the Fund), a series of Hennessy Funds Trust, including the schedule of investments, as of October 31, 2015, and the related statement of operations for the year then ended, the statements of changes in net assets for each of the years in the two-year period then ended, and the financial highlights for each of the years in the five-year period then ended. These financial statements and financial highlights are the responsibility of the Fund’s management. Our responsibility is to express an opinion on these financial statements and financial highlights based on our audits.
We conducted our audits in accordance with the standards of the Public Company Accounting Oversight Board (United States). Those standards require that we plan and perform the audit to obtain reasonable assurance about whether the financial statements and financial highlights are free of material misstatement. An audit includes examining, on a test basis, evidence supporting the amounts and disclosures in the financial statements. Our procedures included confirmation of investments owned as of October 31, 2015, by correspondence with the custodian and brokers or by other appropriate auditing procedures. An audit also includes assessing the accounting principles used and significant estimates made by management, as well as evaluating the overall financial statement presentation. We believe that our audits provide a reasonable basis for our opinion.
In our opinion, the financial statements and financial highlights referred to above present fairly, in all material respects, the financial position of the Fund as of October 31, 2015, and the results of its operations for the year then ended, the changes in its net assets for each of the years in the two-year period then ended, and the financial highlights for each of the years in the five-year period then ended, in conformity with U.S. generally accepted accounting principles.
Milwaukee, Wisconsin
December 23, 2015
Trustees and Officers of the Fund (Unaudited)
The business and affairs of the Fund are managed under the direction of the Board of Trustees of the Trust, and the Board of Trustees elects the Officers of the Trust. Information pertaining to the Trustees and the Officers of the Trust is set forth below. Such persons serve until their successors are duly elected and qualified or until their earlier death, resignation, or removal. Each of the Trustees oversees 16 Hennessy Funds. Unless otherwise indicated, the address of all persons listed below is 7250 Redwood Boulevard, Suite 200, Novato, CA 94945. The Fund’s Statement of Additional Information includes more information about the persons listed below and is available, without charge, upon request by calling 1-800-966-4354.
| | | | Other |
| | | | Directorships |
| Name, Year of Birth, | | | (During Past |
| and Position Held | Length of | Principal Occupation(s) | Five Years) |
with the Trust | Time Served | During Past Five Years | Held by Trustee(1) |
| | | | |
| Disinterested Trustees | | | |
| | | | |
| J. Dennis DeSousa (1936) | Since January | Mr. DeSousa is a real estate investor. | Hennessy SPARX |
| Trustee | 1996 for the | | Funds Trust; |
| | Hennessy Funds | | Hennessy Mutual |
| | | | Funds, Inc.; and |
| | | | The Hennessy |
| | | | Funds, Inc. |
| | | | |
| Robert T. Doyle (1947) | Since January | Mr. Doyle has been the Sheriff of | Hennessy SPARX |
| Trustee | 1996 for the | Marin County, California since 1996. | Funds Trust; |
| | Hennessy Funds | | Hennessy Mutual |
| | | | Funds, Inc.; and |
| | | | The Hennessy |
| | | | Funds, Inc. |
| | | | |
| Gerald P. Richardson (1945) | Since May | Mr. Richardson is an independent | Hennessy SPARX |
| Trustee | 2004 for the | consultant in the securities industry. | Funds Trust; |
| | Hennessy Funds | | Hennessy Mutual |
| | | | Funds, Inc.; and |
| | | | The Hennessy |
| | | | Funds, Inc. |
| | | | |
Interested Trustee(2) | | | |
| | | | |
| Neil J. Hennessy (1956) | Since January | Mr. Hennessy has been employed by | Hennessy Advisors, |
| Trustee, Chairman of | 1996 as a Trustee | Hennessy Advisors, Inc., the Funds’ | Inc.; Hennessy |
| the Board, Chief | for the Hennessy | investment advisor, since 1989. | SPARX Funds Trust; |
| Investment Officer, | Funds and since | He currently serves as President, | Hennessy Mutual |
| Portfolio Manager, | June 2008 as | Chairman and Chief Executive Officer | Funds, Inc.; and |
| and President | an Officer of the | of Hennessy Advisors, Inc. | The Hennessy |
| | Hennessy Funds | | Funds, Inc. |
| HENNESSY FUNDS | 1-800-966-4354 | |
| Name, Year of Birth, | | |
| and Position Held | Length of | Principal Occupation(s) |
with the Trust | Time Served | During Past Five Years |
| | | |
| Officers | | |
| | | |
| Teresa M. Nilsen (1966) | Since January | Ms. Nilsen has been employed by Hennessy Advisors, Inc., |
| Executive Vice President | 1996 for the | the Funds’ investment advisor, since 1989. She currently |
| and Treasurer | Hennessy Funds | serves as Executive Vice President, Chief Operations Officer, |
| | | Chief Financial Officer, and Secretary of Hennessy Advisors, Inc. |
| | | |
| Daniel B. Steadman (1956) | Since March | Mr. Steadman has been employed by Hennessy Advisors, Inc., |
| Executive Vice President | 2000 for the | the Funds’ investment advisor, since 2000. He currently serves |
| and Secretary | Hennessy Funds | as Executive Vice President and Chief Compliance Officer of |
| | | Hennessy Advisors, Inc. |
| | | |
| Jennifer Cheskiewicz (1977) | Since June | Ms. Cheskiewicz has been employed by Hennessy Advisors, |
| Senior Vice President and | 2013 for the | Inc., the Funds’ investment advisor, since June 2013. She |
| Chief Compliance Officer | Hennessy Funds | currently serves as General Counsel of Hennessy Advisors, Inc. |
| | | |
| | | She previously served as in-house counsel to Carlson Capital, |
| | | L.P., an SEC-registered investment advisor to several private |
| | | funds from February 2010 to May 2013. |
| | | |
| Brian Carlson (1972) | Since December | Mr. Carlson has been employed by Hennessy Advisors, Inc., the |
| Senior Vice President and | 2013 for the | Funds’ investment advisor, since December 2013. |
| Head of Distribution | Hennessy Funds | |
| | Mr. Carlson was previously a co-founder and principal of |
| | | Trivium Consultants, LLC from February 2011 through |
| | | November 2013. |
| | | |
David Ellison (1958)(3) | Since October | Mr. Ellison has served as a Portfolio Manager of the Hennessy |
| Senior Vice President and | 2012 for the | Small Cap Financial Fund, the Hennessy Large Cap Financial |
| Portfolio Manager | Hennessy Funds | Fund, and the Hennessy Technology Fund since inception. |
| | | |
| | | Mr. Ellison previously served as Director, CIO and President of |
| | | FBR Fund Advisers, Inc. from December 1999 to October 2012. |
| | | |
| Brian Peery (1969) | Since March | Mr. Peery has served as a Portfolio Manager of the Hennessy |
| Senior Vice President and | 2003 as an | Cornerstone Growth Fund, the Hennessy Cornerstone Mid Cap |
| Portfolio Manager | Officer of the | 30 Fund, the Hennessy Cornerstone Large Growth Fund, the |
| | Hennessy Funds | Hennessy Cornerstone Value Fund, the Hennessy Total Return |
| | and since | Fund, and the Hennessy Balanced Fund since October 2014. |
| | February 2011 | From February 2011 through September 2014, he served as |
| | as a Co-Portfolio | Co-Portfolio Manager of the same funds. Mr. Peery has also |
| | Manager or | served as a Portfolio Manager of the Hennessy Gas Utility Fund |
| | Portfolio Manager | since February 2015. |
| | for the | |
| | Hennessy Funds | Mr. Peery has been employed by Hennessy Advisors, Inc., the |
| | | Funds’ investment advisor, since 2002. |
| | | |
| Winsor (Skip) Aylesworth | Since October | Mr. Aylesworth has served as a Portfolio Manager of the |
(1947)(3) | 2012 for the | Hennessy Gas Utility Fund since 1998 and as a Portfolio |
| Vice President and | Hennessy Funds | Manager of the Hennessy Technology Fund since inception. |
| Portfolio Manager | | |
| | | Mr. Aylesworth previously served as Executive Vice President |
| | | of The FBR Funds from 1999 to October 2012. |
| Name, Year of Birth, | | |
| and Position Held | Length of | Principal Occupation(s) |
with the Trust | Time Served | During Past Five Years |
| | | |
Ryan Kelley (1972)(4) | Since March | Mr. Kelley has served as a Portfolio Manager of the Hennessy |
| Vice President and | 2013 for the | Gas Utility Fund, the Hennessy Small Cap Financial Fund, and |
| Portfolio Manager | Hennessy Funds | the Hennessy Large Cap Financial Fund since October 2014. |
| | | From March 2013 through September 2014, he served as a |
| | | Co-Portfolio Manager of the same funds. Prior to that, |
| | | he was a Portfolio Analyst of the Hennessy Funds. |
(1) | Pursuant to an internal reorganization, the series of Hennessy Mutual Funds, Inc. (“HMFI”), The Hennessy Funds, Inc. (“HFI”), and Hennessy SPARX Funds Trust (“HSFT”) were reorganized into series of Hennessy Funds Trust on February 28, 2014, which mirrored the corresponding series of HFMI, HFI, and HSFT. Subsequent to the reorganization, HFMI, HFI, and HSFT were dissolved. |
(2) | Mr. Hennessy is considered an “interested person,” as defined in the Investment Company Act of 1940, as amended, because he is an officer of the Hennessy Funds. |
(3) | The address of these officers is 101 Federal Street, Suite 1900, Boston, MA 02110. |
(4) | The address of this officer is 1340 Environ Way, Chapel Hill, NC 27517. |
| HENNESSY FUNDS | 1-800-966-4354 | |
Expense Example (Unaudited)
October 31, 2015
As a shareholder of the Fund, you incur two types of costs: (1) transaction costs, including sales charges (loads) on purchase payments, reinvested dividends, or other distributions; redemption fees; and exchange fees; and (2) ongoing costs, including management fees; service fees; and other Fund expenses. This Example is intended to help you understand your ongoing costs (in dollars) of investing in the Fund and to compare these costs with the ongoing costs of investing in other mutual funds. The Example is based on an investment of $1,000 invested at the beginning of the period and held for the entire period from May 1, 2015 through October 31, 2015.
Actual Expenses
The first line of the table below under the “Investor Class” and “Institutional Class” headings provides information about actual account values and actual expenses. Although the Fund charges no sales loads or transaction fees, you will be assessed fees for outgoing wire transfers, returned checks and stop payment orders at prevailing rates charged by U.S. Bancorp Fund Services, LLC, the Fund’s transfer agent. If you request that a redemption be made by wire transfer, currently a $15.00 fee is charged by the Fund’s transfer agent. IRA accounts will be charged a $15.00 annual maintenance fee. The example below includes, but is not limited to, management fees, shareholder servicing fees, fund accounting, custody, and transfer agent fees. However, the example below does not include portfolio trading commissions and related expenses, and other extraordinary expenses as determined under generally accepted accounting principles. You may use the information in this line, together with the amount you invested, to estimate the expenses that you paid over the period. Simply divide your account value by $1,000 (for example, an $8,600 account value divided by $1,000 = 8.6), then multiply the result by the number in the first line of the table under the “Investor Class” and “Institutional Class” headings in the column entitled “Expenses Paid During Period” to estimate the expenses you paid on your account during this period.
Hypothetical Example for Comparison Purposes
The second line of the table below under the “Investor Class” and “Institutional Class” headings provides information about hypothetical account values and hypothetical expenses based on the Fund’s actual expense ratios and an assumed rate of return of 5% per year before expenses, which is not the Fund’s actual return. The hypothetical account values and expenses may not be used to estimate the actual ending account balance or expenses you paid for the period. You may use this information to compare the ongoing costs of investing in the Fund and other funds. To do so, compare this 5% hypothetical example with the 5% hypothetical examples that appear in the shareholder reports of the other funds. Please note that the expenses shown in the table are meant to highlight your ongoing costs only and do not reflect any transactional costs, such as sales charges (loads), or exchange fees. Therefore, the second line of the table under the “Investor Class” and “Institutional Class” headings is useful in comparing ongoing costs only, and will not help you determine the relative total costs of owning different funds. In addition, if these transactional costs were included, your costs would have been higher.
| | | | Expenses Paid |
| | Beginning | Ending | During Period(1) |
| | Account Value | Account Value | May 1, 2015 – |
| | May 1, 2015 | October 31, 2015 | October 31, 2015 |
| Investor Class | | | |
| Actual | $1,000.00 | $1,033.10 | $5.94 |
| Hypothetical (5% return before expenses) | $1,000.00 | $1,019.36 | $5.90 |
| | | | |
| Institutional Class | | | |
| Actual | $1,000.00 | $1,033.80 | $5.18 |
| Hypothetical (5% return before expenses) | $1,000.00 | $1,020.11 | $5.14 |
(1) | Expenses are equal to the Fund’s annualized expense ratio of 1.16% for Investor Class shares or 1.01% for Institutional Class shares, as applicable, multiplied by the average account value over the period, multiplied by 184/365 days (to reflect one-half year period). |
| HENNESSY FUNDS | 1-800-966-4354 | |
How to Obtain a Copy of the Fund’s
Proxy Voting Policy and Proxy Voting Records
A description of the policies and procedures the Fund uses to determine how to vote proxies relating to portfolio securities is available without charge: (1) by calling 1-800-966-4354; (2) on the Hennessy Funds’ website at hennessyfunds.com/proxy-voting/policy.fs; or (3) on the U.S. Securities and Exchange Commission’s website at www.sec.gov. The Fund’s proxy voting record is available without charge on both the Hennessy Funds’ website at hennessyfunds.com/proxy-voting/policy.fs and the SEC’s website at www.sec.gov no later than August 31 for the prior 12 months ending June 30.
Quarterly Filings on Form N-Q
The Fund files its complete schedule of portfolio holdings with the SEC for the first and third quarters of each fiscal year on Form N-Q. The Fund’s Form N-Q will be available on the SEC’s website at www.sec.gov. The Fund’s Form N-Q may be reviewed and copied at the SEC’s Public Reference Room in Washington, DC and information on the operation of the Public Reference Room may be obtained by calling 1-800-SEC-0330. Information included in the Fund’s N-Q will also be available upon request by calling 1-800-966-4354.
Householding
To help keep the Fund’s costs as low as possible, we generally deliver a single copy of most financial reports and prospectuses to shareholders who share an address, even if the accounts are registered under different names. This process, known as “householding,” does not apply to account statements. You may, of course, request an individual copy of a prospectus or financial report at any time. If you would like to receive separate mailings, please call the Administrator at 1-800-261-6950 or 1-414-765-4124 and we will begin individual delivery within 30 days of your request. If your account is held through a financial institution or other intermediary, please contact them directly to request individual delivery.
Matters Submitted to a Shareholder Vote
A special meeting of shareholders of the Investor Class shares of the Fund was held on October 2, 2015, and the following matters were approved by the Fund’s voting Investor Class shares:
| | | | | Broker |
| | For | Against | Abstain | Nonvotes |
| To approve a distribution | | | | |
| (Rule 12b-1) plan for the | | | | |
| Investor Class shares of the Fund | 4,841,306.719 | 1,091,568.514 | 197,931.286 | 223,031.000 |
Privacy Policy
We collect the following non-public personal information about you:
| | • | information we receive from you on or in applications or other forms, correspondence, or conversations, including, but not limited to, your name, address, phone number, social security number, assets, income, and date of birth; and |
| | • | information about your transactions with us, our affiliates, or others, including, but not limited to, your account number and balance, payment history, parties to transactions, cost basis information, and other financial information. |
We do not disclose any non-public personal information about our current or former shareholders to nonaffiliated third parties, except as permitted by law. For example, we are permitted by law to disclose all of the information we collect, as described above, to our Transfer Agent to process your transactions. Furthermore, we restrict access to your non-public personal information to those persons who require such information to provide products or services to you. We maintain physical, electronic, and procedural safeguards that comply with federal standards to guard your non-public personal information.
In the event that you hold shares of the Fund through a financial intermediary, including, but not limited to, a broker-dealer, bank or trust company, the privacy policy of your financial intermediary would govern how your non-public personal information would be shared with nonaffiliated third parties.
| HENNESSY FUNDS | 1-800-966-4354 | |
(This Page Intentionally Left Blank.)
(This Page Intentionally Left Blank.)
For information, questions or assistance, please call
The Hennessy Funds
1-800-966-4354 or 1-415-899-1555
INVESTMENT ADVISOR
Hennessy Advisors, Inc.
7250 Redwood Blvd., Suite 200
Novato, California 94945
ADMINISTRATOR,
TRANSFER AGENT,
DIVIDEND PAYING AGENT &
SHAREHOLDER SERVICING AGENT
U.S. Bancorp Fund Services, LLC
P.O. Box 701
Milwaukee, Wisconsin 53201-0701
CUSTODIAN
U.S. Bank N.A.
Custody Operations
1555 North River Center Dr., Suite 302
Milwaukee, Wisconsin 53212
TRUSTEES
Neil J. Hennessy
Robert T. Doyle
J. Dennis DeSousa
Gerald P. Richardson
COUNSEL
Foley & Lardner LLP
777 East Wisconsin Avenue
Milwaukee, Wisconsin 53202-5306
INDEPENDENT REGISTERED
PUBLIC ACCOUNTING FIRM
KPMG LLP
777 East Wisconsin Avenue
Milwaukee, Wisconsin 53202-5306
DISTRIBUTOR
Quasar Distributors, LLC
615 East Michigan Street
Milwaukee, Wisconsin 53202

| hennessyfunds.com | 1-800-966-4354 |
This report has been prepared for shareholders and may be distributed to
others only if preceded or accompanied by a current prospectus.
ANNUAL REPORT
OCTOBER 31, 2015
HENNESSY FOCUS FUND
Investor Class HFCSX
Institutional Class HFCIX
| hennessyfunds.com | 1-800-966-4354 |
(This Page Intentionally Left Blank.)
Contents
| Letter to Shareholders | 2 |
| Performance Overview | 4 |
| Financial Statements | |
| Schedule of Investments | 7 |
| Statement of Assets and Liabilities | 11 |
| Statement of Operations | 12 |
| Statements of Changes in Net Assets | 13 |
| Financial Highlights | 14 |
| Notes to the Financial Statements | 18 |
| Report of Independent Registered Public Accounting Firm | 26 |
| Trustees and Officers of the Fund | 27 |
| Expense Example | 30 |
| Proxy Voting | 32 |
| Quarterly Filings on Form N-Q | 32 |
| Federal Tax Distribution Information | 32 |
| Householding | 32 |
| Privacy Policy | 33 |
| HENNESSY FUNDS | 1-800-966-4354 | |
December 2015
Dear Hennessy Funds Shareholder:
As I look back over the year, I am reminded that the U.S. economy has come a long way since the depths of the recession in 2009. The economy has been expanding steadily for almost six years, the unemployment rate has halved, the housing market has been recovering and capital expenditures have been growing. The financial markets have performed well too, driven largely by strong corporate earnings growth, especially in the early years. The U.S. market, as measured by the S&P 500 Index, has roughly tripled since the bull market began in 2009, and the Index’s earnings per share have increased 260% over this same time period. For the year ended October 31, 2015, the U.S. equity market performed reasonably well, with the S&P 500 posting another advance of 5.2%. However, behind this headline number, the market experienced a great deal of volatility as investors reacted to falling energy prices, a rise in the U.S. Dollar, pressure on export earnings growth, slower growth in China and, most significantly, the likelihood of a rise in the Fed Funds rate for the first time in nearly a decade – the featured topic of conversation around every office water cooler in the financial world this year.
Investors, reporters and friends often ask me “What’s next?” The market has been in a volatile, sideways correction for over a year now, and throughout this period of volatility, I have consistently advised investors to continue to focus on the long-term fundamentals of the market.
In my view, the fundamentals of the market are in good shape. Despite a stronger U.S. Dollar and its impact on export growth, the economy is still growing steadily. Inflation remains low, so we expect the Federal Reserve, once it does begin to raise short-term interest rates, will not likely raise them by very much. New jobs are being created at what I believe is a healthy rate, and average hourly wages are rising in response to a tighter labor market. Higher wages and lower gasoline prices are helping to keep consumer confidence positive.
Notwithstanding what I view as a relatively solid economic environment, however, I think investor sentiment remains restrained. The same factors that contributed to the market volatility this past year are still troubling investors today: the slowdown in the Chinese economy, slower earnings growth here in the U.S., and, of course, the prospect of rising interest rates. As a result of these investor worries, I do not see any solid enthusiasm for the market – no euphoria. Universal optimism about the market often coincides with a peak in stock prices and this absence of euphoria is yet another reason I feel bullish. And finally, I do not believe stocks are expensive. The Dow Jones Industrial Average and the S&P 500 Index have forward PE (price-to-earnings) ratios of approximately 16x and 17x, respectively, close to long-term averages. In my view, these fundamentals taken together signal a continuation of the bull market that began six years ago.
A final positive note: I still do not believe that investors have fully returned to investing in U.S. equities. Assets in domestic equity funds have now reached parity with fixed income/money market funds, with $6.2 trillion in each. I believe that fixed income investments will continue to trickle into equities, which should have a positive effect on the market.
Thank you for your continued confidence and investment in our products. If you have any questions or would like to speak with us directly, please don’t hesitate to call us at (800) 966-4354.
Best regards,
Neil J. Hennessy
President and Chief Investment Officer
Past performance does not guarantee future results.
Mutual fund investing involves risk. Principal loss is possible.
Opinions expressed are those of Neil Hennessy and are subject to change, are not guaranteed and should not be considered investment advice.
The Dow Jones Industrial Average and the S&P 500 Index are unmanaged indices commonly used to measure the performance of U.S. stocks. One cannot invest directly in an index.
Price to earnings (“PE”) is the market price per share divided by earnings per share. Earnings per share is the portion of a company’s profit allocated to each outstanding share of common stock. It serves as an indicator of a company’s profitability.
| HENNESSY FUNDS | 1-800-966-4354 | |
Performance Overview (Unaudited)
CHANGE IN VALUE OF $10,000 INVESTMENT
This graph illustrates the performance of an initial investment of $10,000 made in the Fund ten years ago and assumes the reinvestment of dividends.
AVERAGE ANNUAL TOTAL RETURN FOR PERIODS ENDED OCTOBER 31, 2015
| | One | Five | Ten |
| | Year | Years | Years |
| Hennessy Focus Fund – | | | |
| Investor Class (HFCSX) | 11.83% | 15.86% | 11.53% |
| Hennessy Focus Fund – | | | |
Institutional Class (HFCIX)(1) | 12.23% | 16.19% | 11.81% |
Russell 3000® Index | 4.49% | 14.14% | 7.94% |
Russell Mid Cap® Growth Index | 4.94% | 14.10% | 9.08% |
Expense ratios: 1.46% (Investor Class); 1.10% (Institutional Class)
Performance data quoted represents past performance; past performance does not guarantee future results. The investment return and principal value of an investment will fluctuate so that an investor’s shares, when redeemed, may be worth more or less than their original cost. The performance graph and table do not reflect the deduction of taxes that a shareholder would pay on Fund distributions or the redemption of Fund shares. Current performance of the Fund may be lower or higher than the performance quoted. Performance data current to the most recent month end may be obtained by visiting hennessyfunds.com. Performance for periods prior to October 26, 2012 is that of the FBR Focus Fund.
The expense ratios presented are from the most recent prospectus.
(1) | The inception date of Institutional Class shares is May 30, 2008. Performance shown prior to the inception of Institutional Class shares reflects the performance of Investor Class shares and includes expenses that are not applicable to and are higher than those of Institutional Class shares. |
PERFORMANCE NARRATIVE
Portfolio Managers Brian Macauley, CFA, David Rainey, CFA, and Ira Rothberg, CFA
Broad Run Investment Management, LLC (sub-advisor)
Performance:
For the twelve-month period ended October 31, 2015, the Investor Class of the Hennessy Focus Fund returned 11.83%, outperforming the Russell 3000® Index and the Russell
Midcap® Growth Index, which returned 4.49% and 4.94% for the same period, respectively.
Leading contributors to the Fund’s performance were O’Reilly Automotive, Inc., Markel Corporation and American Woodmark Corporation, all of which the Fund continues to hold. Each of these companies produced attractive financial results over the period, which helped drive appreciation in their stock prices. Leading detractors from the Fund’s performance were Twenty-First Century Fox, Inc., Encore Capital Group, Inc., and Roadrunner Transportation Systems, Inc. We believe that these businesses are likely to provide compelling forward returns, so the Fund continues to hold these investments.
We invest with a long-term time horizon and encourage shareholders to do the same. Despite the discussion of one-year results referenced above, we encourage fellow shareholders to also evaluate the Fund’s performance over five- and ten-year periods since shorter time periods can be influenced by many transitory issues unrelated to the growth in intrinsic value of the Fund’s holdings.
Investment Outlook:
We continue to have a positive long-term outlook for the Fund. The Fund’s holdings are predominately a collection of what we believe to be high quality, secular growth businesses trading at reasonable valuations. Our expectation is that on average the Fund will own these businesses for five years or longer. Over this long-term time horizon, we believe that the Fund’s returns will likely be determined primarily by the growth in earnings power of these businesses.
During the first half of the year, we established a position in Hexcel Corporation, as we discussed in the April 30, 2015 Semi-Annual Report. During the second half of the year, we substantially added to it and several other positions as market volatility produced more attractive valuation levels. We did not eliminate any positions from the Fund during the year. Recall that with our low turnover investment strategy, it is not unusual to have periods of limited portfolio turnover. This low level of turnover is consistent with our long-held belief that the best way to build wealth in the stock market is to own a carefully selected portfolio of undervalued, high quality, secular growth businesses, and to hold these businesses long-term as they compound their earnings over time. We are pleased with the collection of businesses that you own through the Fund and believe that they are growing their earnings power and intrinsic value at attractive rates. We continue to search the market, looking for what we believe to be better alternatives to what you own today through the Fund, and will act when such opportunities arise.
While our long-term approach makes great sense to us, it is by no means conventional. We believe that the majority of our investment peers operate with a one- or two-year investment horizon, as compared to our five- to ten-year horizon. If your investment horizon is short-term, your research effort is likely to focus on predicting a company’s short-term fundamental performance relative to consensus expectations. You likely look to develop an “edge” that gives you better insight into short-term sales trends, margins, and/or stock catalysts. Instead, with our long-term investment horizon, we conduct our research with an eye toward understanding the opportunity for a business over the next decade. We focus on evaluating those factors that we believe have the most impact on a company’s investment results over the long-term: the quality of the business, its growth potential, management quality, exposure to catastrophic “tail risks,” and valuation.
Of these factors, we believe that management quality, and especially management’s capital allocation skill, are under-analyzed and under-appreciated by most investors. We postulate that this is a direct result of the short-term investment horizons of most market participants. In the short-term, capital allocation decisions typically have little impact on a
| HENNESSY FUNDS | 1-800-966-4354 | |
stock price or business fundamentals, but like compound interest, these decisions accumulate to be of significant importance over time. Consider a new CEO hired to run a 100-year-old business. If that business earns a 12% return on equity (ROE) today, and that ROE can be sustained, then in six years time the firm’s equity base will have doubled. In just six years, the CEO will be responsible for investing 50% of all equity capital ever invested in a century old business. Over time, there is significant power to create – or destroy – shareholder value based upon what is done with a firm’s profits and balance sheet.
Recognizing this, we look to invest in companies with management teams skilled at both operations and capital allocation, motivated with proper economic incentives, and possessing a long-term mindset. Assessing management quality is part art and part science. As a starting point, we review the historical financial record compiled by the management team, including trends in margins, returns on equity, and returns on capital, and how these metrics compare to other companies within their industry. As we dig deeper, we analyze what we identify to be the important capital allocation decisions the team has made in the past. For example, have they made large acquisitions or share repurchases, and how did those decisions turn out? As we read about the business, we stay attuned to how management discusses acquisitions, share repurchases, capital expenditures, dividends, and use of the balance sheet. When we meet with management, we query them about their capital allocation framework and how they think about creating long-term value. And of course, we evaluate their economic incentives, looking for a strong alignment of interest with the long-term equity holder.
In our experience, the most effective management teams have an unclouded view that their responsibility is to maximize long-term value per share. They understand the full set of capital allocation options in front of them, and are willing to move quickly and in size when they see an unusual opportunity. They recognize that there is a cost to acting today rather than waiting to see what opportunities are presented tomorrow, and have the internal political capital to forego short-term profits in favor of pursuing much larger, but longer-term opportunities. Unsurprisingly, we often find these characteristics in companies still run by the founder or founding family and in businesses with high insider ownership.
While we cannot know with certainty how a management team will perform in the future, and even the best management teams can stumble, we believe emphasizing management quality in our process is one factor that helps tilt the odds in our favor.
Opinions expressed are those of the Portfolio Managers as of the date written and are subject to change, are not guaranteed, and should not be considered investment advice or an indication of trading intent.
The Russell 3000® Index is an unmanaged index commonly used to measure the performance of U.S. stocks. The Russell Midcap® Growth Index is an unmanaged index commonly used to measure the performance of U.S. medium-capitalization growth stocks. One cannot invest directly in an index.
The Fund is non-diversified, meaning it may concentrate its assets in fewer individual holdings than a diversified fund, making it more exposed to individual stock volatility than a diversified fund. The Fund invests in small and medium capitalized companies, which involves additional risks such as limited liquidity and greater volatility. Investments in foreign securities involve greater volatility and political, economic and currency risk and differences in accounting methods.
References to specific securities should not be considered a recommendation to buy or sell any security. Fund holdings and sector allocations are subject to change. Please refer to the Schedule of Investments included in this report for additional portfolio information.
Return on equity is the amount of net income returned as a percentage of a shareholder’s equity. Return on capital is a profitability ratio, which measures the return that an investment generates for stockholders.
Financial Statements
Schedule of Investments as of October 31, 2015 |
HENNESSY FOCUS FUND
(% of Net Assets)
| TOP TEN HOLDINGS (EXCLUDING CASH/CASH EQUIVALENTS) | % NET ASSETS |
| O’Reilly Automotive, Inc. | 10.90% |
| American Tower Corp., Class A | 9.69% |
| Markel Corp. | 8.77% |
| Brookfield Asset Management, Inc. | 6.82% |
| CarMax, Inc. | 6.42% |
| Aon PLC | 4.47% |
| The Charles Schwab Corp. | 4.30% |
| Encore Capital Group, Inc. | 4.24% |
| Twenty First Century Fox, Inc. | 3.82% |
| Alphabet, Inc. | 3.60% |
Note: For presentation purposes, the Fund has grouped some of the industry categories. For purposes of categorizing securities for compliance with Section 8(b)(1) of the Investment Company Act of 1940, as amended, the Fund uses more specific industry classifications.
| HENNESSY FUNDS | 1-800-966-4354 | |
| COMMON STOCKS – 71.70% | | Number | | | | | | % of | |
| | | of Shares | | | Value | | | Net Assets | |
| Consumer Discretionary – 23.56% | | | | | | | | | |
| CarMax, Inc. (a) | | | 2,321,682 | | | $ | 137,002,455 | | | | 6.42 | % |
| Dick’s Sporting Goods, Inc. | | | 678,460 | | | | 30,225,393 | | | | 1.42 | % |
| O’Reilly Automotive, Inc. (a) | | | 842,815 | | | | 232,836,072 | | | | 10.90 | % |
| Penn National Gaming, Inc. (a) | | | 1,197,772 | | | | 21,392,208 | | | | 1.00 | % |
| Twenty First Century Fox, Inc. | | | 2,657,204 | | | | 81,549,590 | | | | 3.82 | % |
| | | | | | | | 503,005,718 | | | | 23.56 | % |
| | | | | | | | | | | | | |
| Energy – 2.76% | | | | | | | | | | | | |
| World Fuel Services Corp. | | | 1,325,143 | | | | 58,915,858 | | | | 2.76 | % |
| | | | | | | | | | | | | |
| Financials – 30.85% | | | | | | | | | | | | |
| Aon PLC (b) | | | 1,023,717 | | | | 95,523,033 | | | | 4.47 | % |
| Brookfield Asset Management, Inc. (b) | | | 4,163,349 | | | | 145,592,315 | | | | 6.82 | % |
| Diamond Hill Investment Group, Inc. | | | 151,439 | | | | 30,295,372 | | | | 1.42 | % |
| Encore Capital Group, Inc. (a)(d) | | | 2,223,280 | | | | 90,487,496 | | | | 4.24 | % |
| Markel Corp. (a) | | | 215,672 | | | | 187,203,296 | | | | 8.77 | % |
| Marlin Business Services Corp. (d) | | | 1,010,273 | | | | 17,841,421 | | | | 0.83 | % |
| The Charles Schwab Corp. | | | 3,010,873 | | | | 91,891,844 | | | | 4.30 | % |
| | | | | | | | 658,834,777 | | | | 30.85 | % |
| | | | | | | | | | | | | |
| Health Care – 1.55% | | | | | | | | | | | | |
| Henry Schein, Inc. (a) | | | 218,484 | | | | 33,146,208 | | | | 1.55 | % |
| | | | | | | | | | | | | |
| Industrials – 7.00% | | | | | | | | | | | | |
| American Woodmark Corp. (a)(d) | | | 915,708 | | | | 66,571,972 | | | | 3.12 | % |
| Hexcel Corp. | | | 1,245,414 | | | | 57,687,576 | | | | 2.70 | % |
| Mistras Group, Inc. (a) | | | 846,695 | | | | 16,019,469 | | | | 0.75 | % |
| Roadrunner Transportation Systems, Inc. (a) | | | 869,200 | | | | 9,248,288 | | | | 0.43 | % |
| | | | | | | | 149,527,305 | | | | 7.00 | % |
| | | | | | | | | | | | | |
| Information Technology – 5.98% | | | | | | | | | | | | |
| Alphabet, Inc., Class A (a) | | | 68,984 | | | | 50,868,112 | | | | 2.38 | % |
| Alphabet, Inc. (a) | | | 108,017 | | | | 76,779,564 | | | | 3.60 | % |
| | | | | | | | 127,647,676 | | | | 5.98 | % |
| | | | | | | | | | | | | |
| Total Common Stocks | | | | | | | | | | | | |
| (Cost $843,384,030) | | | | | | | 1,531,077,542 | | | | 71.70 | % |
The accompanying notes are an integral part of these financial statements.
| REITS – 13.13% | | Number | | | | | | % of | |
| | | of Shares | | | Value | | | Net Assets | |
| Financials – 13.13% | | | | | | | | | |
| American Tower Corp., Class A | | | 2,025,087 | | | $ | 207,024,644 | | | | 9.69 | % |
| Gaming & Leisure Properties, Inc. | | | 2,514,958 | | | | 73,361,325 | | | | 3.44 | % |
| | | | | | | | | | | | | |
| Total REITS | | | | | | | | | | | | |
| (Cost $149,034,281) | | | | | | | 280,385,969 | | | | 13.13 | % |
| | | | | | | | | | | | | |
| SHORT-TERM INVESTMENTS – 13.42% | | | | | | | | | | | | |
| | | | | | | | | | | | | |
| Money Market Funds – 13.42% | | | | | | | | | | | | |
| Federated Government Obligations Fund – Class I, 0.01% (c) | | | 106,112,000 | | | | 106,112,000 | | | | 4.97 | % |
| Federated Treasury Obligations Fund, 0.01% (c) | | | 74,301,215 | | | | 74,301,215 | | | | 3.48 | % |
| Fidelity Government Portfolio – Institutional Class, 0.01% (c) | | | 106,112,000 | | | | 106,112,000 | | | | 4.97 | % |
| | | | | | | | | | | | | |
| | | | | | | | 286,525,215 | | | | 13.42 | % |
| | | | | | | | | | | | | |
| Total Short-Term Investments | | | | | | | | | | | | |
| (Cost $286,525,215) | | | | | | | 286,525,215 | | | | 13.42 | % |
| | | | | | | | | | | | | |
| Total Investments | | | | | | | | | | | | |
| (Cost $1,278,943,526) – 98.25% | | | | | | | 2,097,988,726 | | | | 98.25 | % |
| | | | | | | | | | | | | |
| Other Assets in | | | | | | | | | | | | |
| Excess of Liabilities – 1.75% | | | | | | | 37,428,038 | | | | 1.75 | % |
| | | | | | | | | | | | | |
TOTAL NET ASSETS – 100.00% | | | | | | $ | 2,135,416,764 | | | | 100.00 | % |
Percentages are stated as a percent of net assets.
REIT – Real Estate Investment Trust
| (a) | Non-income producing security. |
| (b) | U.S. traded security of a foreign corporation. |
| (c) | The rate listed is the fund’s 7-day yield as of October 31, 2015. |
| (d) | Investment represents five percent or more of the outstanding voting securities of the issuer, and is or was an affiliate of the Hennessy Focus Fund, as defined in the Investment Company Act of 1940, as amended, at or during the year ended October 31, 2015. Details of transactions with these affiliated companies for the year ended October 31, 2015, are as follows: |
| | | | American | | | Encore Capital | | | Marlin Business | |
| | Issuer | | Woodmark Corp. | | | Group, Inc. | | | Services Corp. | |
| | Beginning Cost | | $ | 26,381,501 | | | $ | 49,017,320 | | | $ | 8,114,638 | |
| | Purchase Cost | | $ | 6,044,459 | | | $ | 23,775,625 | | | $ | 7,750,651 | |
| | Sales Cost | | | — | | | | — | | | | — | |
| | Ending Cost | | $ | 32,425,960 | | | $ | 72,792,945 | | | $ | 15,865,289 | |
| | Dividend Income | | | — | | | | — | | | $ | 2,420,859 | |
| | Shares | | | 915,708 | | | | 2,223,280 | | | | 1,010,273 | |
| | Market Value | | $ | 66,571,972 | | | $ | 90,487,496 | | | $ | 17,841,421 | |
The accompanying notes are an integral part of these financial statements.
| HENNESSY FUNDS | 1-800-966-4354 | |
Summary of Fair Value Exposure at October 31, 2015
The following is a summary of the inputs used to value the Fund’s net assets as of October 31, 2015 (see Note 3 in the accompanying notes to the financial statements):
| Common Stocks | | Level 1 | | | Level 2 | | | Level 3 | | | Total | |
| Consumer Discretionary | | $ | 503,005,718 | | | $ | — | | | $ | — | | | $ | 503,005,718 | |
| Energy | | | 58,915,858 | | | | — | | | | — | | | | 58,915,858 | |
| Financials | | | 658,834,777 | | | | — | | | | — | | | | 658,834,777 | |
| Health Care | | | 33,146,208 | | | | — | | | | — | | | | 33,146,208 | |
| Industrials | | | 149,527,305 | | | | — | | | | — | | | | 149,527,305 | |
| Information Technology | | | 127,647,676 | | | | — | | | | — | | | | 127,647,676 | |
| Total Common Stocks | | $ | 1,531,077,542 | | | $ | — | | | $ | — | | | $ | 1,531,077,542 | |
| REITS | | | | | | | | | | | | | | | | |
| Financials | | $ | 280,385,969 | | | $ | — | | | $ | — | | | $ | 280,385,969 | |
| Total REITS | | $ | 280,385,969 | | | $ | — | | | $ | — | | | $ | 280,385,969 | |
| Short-Term Investments | | | | | | | | | | | | | | | | |
| Money Market Funds | | $ | 286,525,215 | | | $ | — | | | $ | — | | | $ | 286,525,215 | |
| Total Short-Term Investments | | $ | 286,525,215 | | | $ | — | | | $ | — | | | $ | 286,525,215 | |
| Total Investments | | $ | 2,097,988,726 | | | $ | — | | | $ | — | | | $ | 2,097,988,726 | |
Transfers between levels are recognized at the end of the reporting period. During the year ended October 31, 2015, the Fund recognized no transfers between levels.
The accompanying notes are an integral part of these financial statements.
Financial Statements
Statement of Assets and Liabilities as of October 31, 2015 |
| ASSETS: | | | |
| Investments in securities, at value (cost $1,157,859,332) | | $ | 1,923,087,837 | |
| Investments in affiliated securities, at value (cost $121,084,194) | | | 174,900,889 | |
| Total investments in securities (cost $1,278,943,526) | | | 2,097,988,726 | |
| Dividends and interest receivable | | | 406,070 | |
| Receivable for fund shares sold | | | 15,285,630 | |
| Receivable for securities sold | | | 24,963,093 | |
| Prepaid expenses and other assets | | | 80,631 | |
| Total Assets | | | 2,138,724,150 | |
| | | | | |
| LIABILITIES: | | | | |
| Payable for fund shares redeemed | | | 586,896 | |
| Payable to advisor | | | 1,544,508 | |
| Payable to administrator | | | 320,856 | |
| Payable to auditor | | | 20,300 | |
| Accrued distribution fees | | | 286,203 | |
| Accrued service fees | | | 130,481 | |
| Accrued trustees fees | | | 2,400 | |
| Accrued expenses and other payables | | | 415,742 | |
| Total Liabilities | | | 3,307,386 | |
| NET ASSETS | | $ | 2,135,416,764 | |
| | | | | |
| NET ASSETS CONSIST OF: | | | | |
| Capital stock | | $ | 1,320,650,425 | |
| Accumulated net investment loss | | | (8,330,095 | ) |
| Accumulated net realized gain on investments | | | 4,051,234 | |
| Unrealized net appreciation on investments | | | 819,045,200 | |
| Total Net Assets | | $ | 2,135,416,764 | |
| | | | | |
| NET ASSETS | | | | |
| Investor Class: | | | | |
| Shares authorized (no par value) | | Unlimited | |
| Net assets applicable to outstanding Investor Class shares | | $ | 1,615,358,715 | |
| Shares issued and outstanding | | | 22,453,594 | |
| Net asset value, offering price and redemption price per share | | $ | 71.94 | |
| | | | | |
| Institutional Class: | | | | |
| Shares authorized (no par value) | | Unlimited | |
| Net assets applicable to outstanding Institutional Class shares | | $ | 520,058,049 | |
| Shares issued and outstanding | | | 7,101,128 | |
| Net asset value, offering price and redemption price per share | | $ | 73.24 | |
The accompanying notes are an integral part of these financial statements.
| HENNESSY FUNDS | 1-800-966-4354 | |
Financial Statements
Statement of Operations for the year ended October 31, 2015 |
| INVESTMENT INCOME: | | | |
Dividend income from unaffiliated securities(1) | | $ | 13,528,831 | |
| Dividend income from affiliated securities | | | 2,420,859 | |
| Interest income | | | 20,786 | |
| Total investment income | | | 15,970,476 | |
| | | | | |
| EXPENSES: | | | | |
| Investment advisory fees (See Note 5) | | | 15,806,285 | |
| Sub-transfer agent expenses – Investor Class (See Note 5) | | | 2,624,437 | |
| Sub-transfer agent expenses – Institutional Class (See Note 5) | | | 336,345 | |
| Distribution fees – Investor Class (See Note 5) | | | 2,490,942 | |
| Administration, fund accounting, custody and transfer agent fees (See Note 5) | | | 1,730,741 | |
| Service fees – Investor Class (See Note 5) | | | 968,177 | |
| Reports to shareholders | | | 94,723 | |
| Federal and state registration fees | | | 65,440 | |
| Compliance expense | | | 22,186 | |
| Legal fees | | | 20,998 | |
| Audit fees | | | 20,896 | |
| Trustees’ fees and expenses | | | 16,899 | |
| Other expenses | | | 94,758 | |
| Total expenses | | | 24,292,827 | |
| NET INVESTMENT LOSS | | $ | (8,322,351 | ) |
| | | | | |
| REALIZED AND UNREALIZED GAINS: | | | | |
| Net realized gain on investments | | $ | 4,582,644 | |
| Net change in unrealized appreciation on investments | | | 189,175,587 | |
| Net gain on investments | | | 193,758,231 | |
| NET INCREASE IN NET ASSETS RESULTING FROM OPERATIONS | | $ | 185,435,880 | |
(1) | Net of foreign taxes withheld of $211,025. |
The accompanying notes are an integral part of these financial statements.
Financial Statements
| Statements of Changes in Net Assets |
| | | Year Ended | | | Year Ended | |
| | | October 31, 2015 | | | October 31, 2014 | |
| OPERATIONS: | | | | | | |
| Net investment income (loss) | | $ | (8,322,351 | ) | | $ | 6,395,821 | |
| Net realized gain on investments | | | 4,582,644 | | | | 114,548,203 | |
| Net change in unrealized appreciation on investments | | | 189,175,587 | | | | 28,663,773 | |
| Net increase in net assets resulting from operations | | | 185,435,880 | | | | 149,607,797 | |
| | | | | | | | | |
| DISTRIBUTIONS TO SHAREHOLDERS FROM: | | | | | | | | |
| Net investment income | | | | | | | | |
| Investor Class | | | (320,240 | ) | | | — | |
| Institutional Class | | | (218,677 | ) | | | — | |
| Net realized gains | | | | | | | | |
| Investor Class | | | (91,635,474 | ) | | | (19,269,073 | ) |
| Institutional Class | | | (21,665,079 | ) | | | (3,177,442 | ) |
| Total distributions | | | (113,839,470 | ) | | | (22,446,515 | ) |
| | | | | | | | | |
| CAPITAL SHARE TRANSACTIONS: | | | | | | | | |
| Proceeds from shares subscribed – Investor Class | | | 523,376,866 | | | | 274,855,822 | |
| Proceeds from shares subscribed – Institutional Class | | | 279,633,599 | | | | 157,637,486 | |
| Dividends reinvested – Investor Class | | | 90,396,629 | | | | 18,773,429 | |
| Dividends reinvested – Institutional Class | | | 16,054,210 | | | | 2,406,086 | |
| Cost of shares redeemed – Investor Class | | | (266,214,310 | ) | | | (324,511,295 | )(1) |
| Cost of shares redeemed – Institutional Class | | | (75,766,873 | ) | | | (79,720,304 | ) |
| Net increase in net assets | | | | | | | | |
| derived from capital share transactions | | | 567,480,121 | | | | 49,441,224 | |
| TOTAL INCREASE IN NET ASSETS | | | 639,076,531 | | | | 176,602,506 | |
| | | | | | | | | |
| NET ASSETS: | | | | | | | | |
| Beginning of year | | | 1,496,340,233 | | | | 1,319,737,727 | |
| End of year | | $ | 2,135,416,764 | | | $ | 1,496,340,233 | |
| Accumulated net investment loss, end of year | | $ | (8,330,095 | ) | | $ | — | |
| | | | | | | | | |
| CHANGES IN SHARES OUTSTANDING: | | | | | | | | |
| Shares sold – Investor Class | | | 7,439,297 | | | | 4,221,654 | |
| Shares sold – Institutional Class | | | 3,920,855 | | | | 2,388,952 | |
| Shares issued to holders as reinvestment | | | | | | | | |
| of dividends – Investor Class | | | 1,371,829 | | | | 291,422 | |
| Shares issued to holders as reinvestment | | | | | | | | |
| of dividends – Institutional Class | | | 239,922 | | | | 36,903 | |
| Shares redeemed – Investor Class | | | (3,820,415 | ) | | | (4,978,901 | ) |
| Shares redeemed – Institutional Class | | | (1,078,256 | ) | | | (1,204,269 | ) |
| Net increase in shares outstanding | | | 8,073,232 | | | | 755,761 | |
(1) | Net of redemption fees of $949 related to redemption fees imposed by the FBR Focus Fund during a prior year but not received until the fiscal year 2014. |
The accompanying notes are an integral part of these financial statements.
| HENNESSY FUNDS | 1-800-966-4354 | |
Financial Statements
For an Investor Class share outstanding throughout each year
PER SHARE DATA:
Net asset value, beginning of year
Income from investment operations:
Net investment income (loss)
Net realized and unrealized gains on investments
Total from investment operations
Less distributions:
Dividends from net investment income
Dividends from net realized gains
Total distributions
Paid-in capital from redemption fees
Net asset value, end of year
TOTAL RETURN
SUPPLEMENTAL DATA AND RATIOS:
Net assets, end of year (millions)
Ratio of expenses to average net assets
Ratio of net investment income (loss) to average net assets
Portfolio turnover rate(3)
(1) | Calculated based on average shares outstanding method. |
(2) | Amount is less than $0.01. |
(3) | Portfolio turnover is calculated on the basis of the Fund as a whole. |
The accompanying notes are an integral part of these financial statements.
| Year Ended October 31, | |
| 2015 | | | 2014 | | | 2013 | | | 2012 | | | 2011 | |
| | | | | | | | | | | | | |
| $ | 69.46 | | | $ | 63.58 | | | $ | 51.78 | | | $ | 49.80 | | | $ | 47.57 | |
| | | | | | | | | | | | | | | | | | | |
| | | | | | | | | | | | | | | | | | | |
| | (0.33 | ) | | | 0.27 | | | | (0.32 | ) | | | (0.39 | ) | | | (0.50 | )(1) |
| | 8.07 | | | | 6.68 | | | | 16.44 | | | | 7.61 | | | | 4.44 | |
| | 7.74 | | | | 6.95 | | | | 16.12 | | | | 7.22 | | | | 3.94 | |
| | | | | | | | | | | | | | | | | | | |
| | | | | | | | | | | | | | | | | | | |
| | (0.02 | ) | | | — | | | | — | | | | — | | | | — | |
| | (5.24 | ) | | | (1.07 | ) | | | (4.32 | ) | | | (5.24 | ) | | | (1.72 | ) |
| | (5.26 | ) | | | (1.07 | ) | | | (4.32 | ) | | | (5.24 | ) | | | (1.72 | ) |
| | — | | | | 0.00 | (2) | | | 0.00 | (2) | | | 0.00 | (2) | | | 0.01 | |
| $ | 71.94 | | | $ | 69.46 | | | $ | 63.58 | | | $ | 51.78 | | | $ | 49.80 | |
| | | | | | | | | | | | | | | | | | | |
| | 11.83 | % | | | 11.05 | % | | | 33.54 | % | | | 16.17 | % | | | 8.35 | % |
| | | | | | | | | | | | | | | | | | | |
| | | | | | | | | | | | | | | | | | | |
| $ | 1,615.36 | | | $ | 1,213.03 | | | $ | 1,139.85 | | | $ | 707.61 | | | $ | 611.34 | |
| | 1.46 | % | | | 1.41 | % | | | 1.43 | % | | | 1.41 | % | | | 1.44 | % |
| | (0.55 | )% | | | 0.41 | % | | | (0.85 | )% | | | (0.79 | )% | | | (1.01 | )% |
| | 4 | % | | | 18 | % | | | 4 | % | | | 13 | % | | | 13 | % |
The accompanying notes are an integral part of these financial statements.
| HENNESSY FUNDS | 1-800-966-4354 | |
Financial Statements
For an Institutional Class share outstanding throughout each year*
PER SHARE DATA:
Net asset value, beginning of year
Income from investment operations:
Net investment income (loss)
Net realized and unrealized gains on investments
Total from investment operations
Less distributions:
Dividends from net investment income
Dividends from net realized gains
Total distributions
Net asset value, end of year
TOTAL RETURN
SUPPLEMENTAL DATA AND RATIOS:
Net assets, end of year (millions)
Ratio of expenses to average net assets
Ratio of net investment income (loss) to average net assets
Portfolio turnover rate(2)
| * | Per share amounts have been restated on a retroactive basis to reflect a 1:18 reverse stock split effective December 10, 2010. |
(1) | Calculated based on average shares outstanding method. |
(2) | Portfolio turnover is calculated on the basis of the Fund as a whole. |
The accompanying notes are an integral part of these financial statements.
| Year Ended October 31, | |
| 2015 | | | 2014 | | | 2013 | | | 2012 | | | 2011 | |
| | | | | | | | | | | | | |
| $ | 70.50 | | | $ | 64.32 | | | $ | 52.19 | | | $ | 50.02 | | | $ | 47.64 | |
| | | | | | | | | | | | | | | | | | | |
| | | | | | | | | | | | | | | | | | | |
| | (0.08 | ) | | | 0.35 | | | | (0.13 | ) | | | (0.22 | ) | | | (0.37 | )(1) |
| | 8.19 | | | | 6.90 | | | | 16.58 | | | | 7.63 | | | | 4.47 | |
| | 8.11 | | | | 7.25 | | | | 16.45 | | | | 7.41 | | | | 4.10 | |
| | | | | | | | | | | | | | | | | | | |
| | | | | | | | | | | | | | | | | | | |
| | (0.05 | ) | | | — | | | | — | | | | — | | | | — | |
| | (5.32 | ) | | | (1.07 | ) | | | (4.32 | ) | | | (5.24 | ) | | | (1.72 | ) |
| | (5.37 | ) | | | (1.07 | ) | | | (4.32 | ) | | | (5.24 | ) | | | (1.72 | ) |
| $ | 73.24 | | | $ | 70.50 | | | $ | 64.32 | | | $ | 52.19 | | | $ | 50.02 | |
| | | | | | | | | | | | | | | | | | | |
| | 12.23 | % | | | 11.40 | % | | | 33.94 | % | | | 16.51 | % | | | 8.53 | % |
| | | | | | | | | | | | | | | | | | | |
| | | | | | | | | | | | | | | | | | | |
| $ | 520.06 | | | $ | 283.31 | | | $ | 179.89 | | | $ | 77.28 | | | $ | 49.01 | |
| | 1.11 | % | | | 1.10 | % | | | 1.13 | % | | | 1.12 | % | | | 1.15 | % |
| | (0.19 | )% | | | 0.59 | % | | | (0.52 | )% | | | (0.52 | )% | | | (0.76 | )% |
| | 4 | % | | | 18 | % | | | 4 | % | | | 13 | % | | | 13 | % |
The accompanying notes are an integral part of these financial statements.
| HENNESSY FUNDS | 1-800-966-4354 | |
Financial Statements
Notes to the Financial Statements October 31, 2015 |
1). ORGANIZATION
The Hennessy Focus Fund (the “Fund”) is a series of Hennessy Funds Trust (the “Trust”), which was organized as a Delaware statutory trust on September 17, 1992. The Fund is an open-end management investment company registered under the Investment Company Act of 1940, as amended. The Fund is a successor to the FBR Focus Fund (the “Predecessor FBR Fund”), a series of The FBR Funds, a Delaware statutory trust, pursuant to a reorganization that took place after the close of business on October 26, 2012. Prior to October 26, 2012, the Fund had no investment operations. As a result of the reorganization, holders of the Investor Class shares of the Predecessor FBR Fund received Investor Class shares of the Fund (the Investor Class shares of the Fund are the successor to the accounting and performance information of the Predecessor FBR Fund), and holders of the Institutional Class shares of the Predecessor FBR Fund received Institutional Class shares of the Fund (the Institutional Class shares of the Fund are the successor to the accounting and performance information of the Predecessor FBR Fund). The investment objective of the Fund is capital appreciation. The Fund is a non-diversified fund.
The Fund offers Investor Class and Institutional Class shares. Each class of shares differs principally in its respective administration, 12b-1 distribution and service, shareholder servicing, and transfer agent expenses and sales charges, if any. Each class has identical rights to earnings, assets, and voting privileges, except for class-specific expenses and exclusive rights to vote on matters affecting only an individual class.
As an investment company, the Fund follows the investment company accounting and reporting guidance of the Financial Accounting Standards Board (“FASB”) Accounting Standard Codification Topic 946 “Financial Services—Investment Companies.”
2). SIGNIFICANT ACCOUNTING POLICIES
The following is a summary of significant accounting policies consistently followed by the Fund in the preparation of the financial statements. These policies are in conformity with U.S. generally accepted accounting principles (“GAAP”).
| a). | Investment Valuation – All investments in securities are recorded at their estimated fair value, as described in Note 3. |
| | |
| b). | Federal Income Taxes – Provision for federal income taxes or excise taxes has not been made since the Fund has elected to be taxed as a “regulated investment company” and intends to distribute substantially all of its taxable income to its shareholders and otherwise comply with the provisions of the Internal Revenue Code of 1986, as amended, applicable to regulated investment companies. Net investment income or loss and realized gains and losses for federal income tax purposes may differ from that reported on the financial statements because of temporary book and tax basis differences. Temporary differences are primarily the result of the treatment of wash sales for tax reporting purposes. The Fund recognizes interest and penalties related to income tax benefits, if any, in the statement of operations as an income tax expense. Distributions from net realized gains for book purposes may include short-term capital gains, which are included as ordinary income to shareholders for tax purposes. |
| | Due to inherent differences in the recognition of income, expenses, and realized gains/losses under GAAP and federal income tax regulations, permanent differences between book and tax basis reporting for the 2015 fiscal year have been identified and appropriately reclassified on the Statement of Assets and Liabilities. The adjustments are as follows: |
| Undistributed | Accumulated | |
| Net Investment | Net Realized | |
Income/(Loss) | Gain/(Loss) | Paid-in Capital |
| $531,173 | $(531,173) | $— |
| c). | Income and Expenses – Dividend income is recognized on the ex-dividend date or as soon as information is available to the Fund. Interest income, which includes the amortization of premium and accretion of discount, is recognized on an accrual basis. The Fund is charged for those expenses that are directly attributable to the portfolio, such as advisory, administration, and certain shareholder service fees. Income, expenses (other than expenses attributable to a specific class), and realized and unrealized gains or losses on investments are allocated to each class of shares based on its respective net assets. |
| | |
| d). | Distributions to Shareholders – Dividends from net investment income for the Fund, if any, are declared and paid annually, usually in December. Distributions of net realized capital gains, if any, are declared and paid annually, usually in December. |
| | |
| e). | Security Transactions – Investment and shareholder transactions are recorded on the trade date. The Fund determines the gain or loss realized from the investment transactions by comparing the original cost of the security lot sold with the net sale proceeds. Discounts and premiums on securities purchased are accreted/amortized over the life of the respective security. |
| | |
| f). | Use of Estimates – The preparation of financial statements in conformity with GAAP requires management to make estimates and assumptions that affect the reported amounts of assets and liabilities and disclosure of contingent assets and liabilities at the date of the financial statements and the reported change in net assets during the reporting period. Actual results could differ from those estimates. |
| | |
| g). | Share Valuation – The net asset value (“NAV”) per share of the Fund is calculated by dividing the sum of the value of the securities held by the Fund, plus cash or other assets, minus all liabilities (including estimated accrued expenses) by the total number of shares outstanding for the Fund, rounded to the nearest cent. The Fund’s shares will not be priced on days the New York Stock Exchange is closed for trading. The offering and redemption price per share for the Fund is equal to the Fund’s NAV per share. |
| | |
| h). | Foreign Currency – Values of investments denominated in foreign currencies, if any, are converted into U.S. dollars using the spot market rate of exchange at the time of valuation. Purchases and sales of investments and income are translated into U.S. dollars using the spot market rate of exchange prevailing on the respective dates of such transactions. The Fund does not isolate the portion of the results of operations resulting from fluctuations in foreign exchange rates on investments from fluctuations resulting from changes in the market prices of securities held. Such fluctuations are included with the net realized and unrealized gain or loss on investments. Foreign investments present additional risks due to currency fluctuations, economic and political factors, lower liquidity, government regulations, differences in accounting standards, and other factors. |
| HENNESSY FUNDS | 1-800-966-4354 | |
| i). | Forward Contracts – The Fund may enter into forward currency contracts to reduce its exposure to changes in foreign currency exchange rates on its foreign holdings and to lock in the U.S. dollar cost of firm purchase and sale commitments for securities denominated in foreign currencies. A forward currency contract is a commitment to purchase or sell a foreign currency at a future date at a negotiated forward rate. The gain or loss arising from the difference between the U.S. dollar cost of the original contract and the value of the foreign currency in U.S. dollars upon closing of such contract is included in net realized gain or loss from foreign currency transactions. During the fiscal year ended October 31, 2015, the Fund did not enter into any forward contracts. |
| | |
| j). | Repurchase Agreements – The Fund may enter into repurchase agreements with member banks or security dealers of the Federal Reserve Board whom the investment advisor deems creditworthy. The repurchase price generally equals the price paid by the Fund plus interest negotiated on the basis of current short-term rates. |
| | |
| | Securities pledged as collateral for repurchase agreements are held by the custodian bank until the respective agreements mature. Provisions of the repurchase agreements ensure that the market value of the collateral, including accrued interest thereon, is sufficient to cover the repurchase amount in the event of default of the counterparty. If the counterparty defaults and the value of the collateral declines or if the counterparty enters an insolvency proceeding, realization of the collateral by the Fund may be delayed or limited. |
| | |
| k). | Accounting for Uncertainty in Income Taxes – The Fund has accounting policies regarding recognition and measurement of tax positions taken or expected to be taken on a tax return. The tax returns of the Fund for the prior three fiscal years are open for examination. The Fund has reviewed all open tax years in major jurisdictions and concluded that there is no impact on the Fund’s net assets and no tax liability resulting from unrecognized tax benefits relating to uncertain income tax positions taken or expected to be taken on a tax return. The Fund’s major tax jurisdictions are U.S. federal and Delaware. |
| | |
| l). | Derivatives – The Fund may invest in, or enter into, derivatives, such as options, futures contracts, options on futures contracts, and swaps, for a variety of reasons, including to hedge certain risks, to provide a substitute for purchasing or selling particular securities, or to increase potential income gain. Derivatives may provide a cheaper, quicker, or more specifically focused way for a Fund to invest than “traditional” securities would. The main purpose of utilizing these derivative instruments is for hedging purposes. |
| | |
| | The Fund follows the financial accounting reporting rules as required by the Derivatives and Hedging Topic of the FASB Accounting Standards Codification. Under such rules, the Fund is required to include enhanced disclosure that enables investors to understand how and why an entity uses derivatives, how derivatives are accounted for, and how derivatives instruments affect an entity’s results of operations and financial position. During the fiscal year ended October 31, 2015, the Fund did not hold any derivative instruments. |
| | |
| m). | New Accounting Pronouncements – In June 2014, the FASB issued Accounting Standards Update (“ASU”) No. 2014-11 “Repurchase-to Maturity Transactions, Repurchase Financings, and Disclosures.” The amendments in this ASU require an entity to modify accounting for repurchase-to-maturity transactions and repurchase financing arrangements, as well as modify required disclosures for repurchase agreements, securities lending transactions, and repurchase-to-maturity transactions |
| | that are accounted for as secured borrowings. The guidance is effective for fiscal years beginning on or after December 15, 2014, and for interim periods within those fiscal years. Management is currently evaluating the impact these changes will have on the Fund’s financial statement disclosures. |
| | |
| | In May 2015, the FASB issued ASU No. 2015-07 “Disclosure for Investments in Certain Entities that Calculate Net Asset Value per Share (or Its Equivalent).” The amendments in ASU No. 2015-07 remove the requirement to categorize within the fair value hierarchy investments measured at NAV and require the disclosure of sufficient information to reconcile the fair value of the remaining assets categorized within the fair value hierarchy to the financial statements. The amendments in ASU No. 2015-07 are effective for fiscal years beginning after December 15, 2015, and interim periods within those fiscal years. Management has reviewed the requirements and believes the adoption of ASU 2015-07 will not have a material impact on the Fund’s financial statements and related disclosures. |
3). SECURITIES VALUATION
The Fund follows authoritative fair valuation accounting standards that establish an authoritative definition of fair value and set out a hierarchy for measuring fair value. These standards require additional disclosures about the various inputs and valuation techniques used to develop the measurements of fair value and a discussion in changes in valuation techniques and related inputs during the period. These inputs are summarized in the three broad levels listed below:
| | Level 1 – | Quoted unadjusted prices for identical instruments in active markets to which the Fund has access at the date of measurement. |
| | | |
| | Level 2 – | Quoted prices for similar instruments in active markets; quoted prices for identical or similar instruments in markets that are not active; and model-derived valuations in which all significant inputs and significant value drivers are observable in active markets. Level 2 inputs are those in markets for which there are few transactions, the prices are not current, the prices are fair value adjusted due to post-market close subsequent events (foreign markets), little public information exists, or instances where prices vary substantially over time or among brokered market makers. These inputs may also include interest rates, prepayment speeds, credit risk curves, default rates, and similar data. |
| | | |
| | Level 3 – | Model-derived valuations in which one or more significant inputs or significant value drivers are unobservable. Unobservable inputs are those inputs that reflect the Fund’s own assumptions about what market participants would use to price the asset or liability based on the best available information. |
Following is a description of the valuation techniques applied to the Fund’s major categories of assets and liabilities measured at fair value on a recurring basis.
Equity Securities – Equity securities, including common stocks, preferred stocks, foreign-issued common stocks, exchange-traded funds, closed-end mutual funds, partnerships, rights, and real estate investment trusts, that are traded on a securities exchange for which a last-quoted sales price is readily available will generally be valued at the last sales price as reported by the primary exchange on which the securities are listed. Securities listed on The NASDAQ Stock Market (“NASDAQ”) will generally be valued at the NASDAQ Official Closing Price, which may differ from the last sales price reported. Securities traded on a securities exchange for which a last-quoted sales price is not readily
| HENNESSY FUNDS | 1-800-966-4354 | |
available will generally be valued at the mean between the bid and ask prices. To the extent these securities are actively traded and valuation adjustments are not applied, they are classified in Level 1 of the fair value hierarchy. Securities traded on foreign exchanges generally are not valued at the same time the Fund calculates its NAV because most foreign markets close well before such time. The earlier close of most foreign markets gives rise to the possibility that significant events, including broad market moves, may have occurred in the interim. In certain circumstances, it may be determined that a security needs to be fair valued because it appears that the value of the security might have been materially affected by events occurring after the close of the market in which the security is principally traded, but before the time the Fund calculates its NAV, such as by a development that affects an entire market or region (e.g., weather-related events) or a potentially global development (e.g., a terrorist attack that may be expected to have an effect on investor expectations worldwide).
Registered Investment Companies – Investments in registered investment companies (e.g., mutual funds) are generally priced at the ending NAV provided by the applicable registered investment company’s service agent and will be classified in Level 1 of the fair value hierarchy.
Debt Securities – Debt securities, including corporate bonds, asset-backed securities, mortgage-backed securities, municipal bonds, U.S. Treasuries, and U.S. government agency issues, are generally valued at market on the basis of valuations furnished by an independent pricing service that utilizes both dealer-supplied valuations and formula-based techniques. The pricing service may consider recently executed transactions in securities of the issuer or comparable issuers, market price quotations (where observable), bond spreads, and fundamental data relating to the issuer. In addition, the model may incorporate market observable data such as reported sales of similar securities, broker quotes, yields, bids, offers, and reference data. Certain securities are valued principally using dealer quotations. These securities are generally classified in Level 2 of the fair value hierarchy.
Short-Term Securities – Short-term equity investments, including money market funds, are valued in the manner specified above. Short-term debt investments are generally valued at amortized cost, which approximates fair market value, if their original term to maturity was 60 days or less, or by amortizing the values as of the 61st day prior to maturity, if their original term to maturity exceeded 60 days. Amortized cost is not used if its use would be inappropriate due to credit or other impairments of the issuer, in which case the security’s fair value would be determined, as described below. Short-term securities are generally classified in Level 1 or Level 2 of the fair market hierarchy depending on the inputs used and market activity levels for specific securities.
The Board of Trustees of the Fund (the “Board”) has adopted fair value pricing procedures that are followed when a price for a security is not readily available or if a significant event has occurred that indicates the closing price of a security no longer represents the true value of that security. Fair value pricing determinations are made in good faith in accordance with these procedures. There are numerous criteria that will be given consideration in determining a fair value of a security. Some of these criteria are trading volume of a security and markets, the value of other like securities, and news events with direct bearing to a security or markets. Fair value pricing results in an estimated price for a security that reflects the amount the Fund might reasonably expect to receive in a current sale. Depending on the relative significance of the valuation inputs, these securities may be classified in either Level 2 or Level 3 of the fair value hierarchy.
The fair valuation of foreign securities may be determined with the assistance of a pricing service using correlations between the movement of prices of such securities and indices of domestic securities and other appropriate indicators, such as closing market prices of relevant American Depositary Receipts or futures contracts. The effect of using fair value pricing is that the Fund’s NAV will reflect the affected portfolio securities’ value as determined in the judgment of the Board or its designee instead of being determined by the market. Using a fair value pricing methodology to price foreign securities may result in a value that is different from a foreign security’s most recent closing price and from the prices used by other investment companies to calculate their NAVs and are generally considered Level 2 prices in the fair valuation hierarchy. Because the Fund may invest in foreign securities, the value of the Fund’s portfolio securities may change on days when you will not be able to purchase or redeem your shares.
The Board has delegated day-to-day valuation matters to a Valuation Committee comprised of one or more representatives from Hennessy Advisors, Inc., the Fund’s investment advisor. The function of the Valuation Committee is to value securities where current and reliable market quotations are not readily available. All actions taken by the Valuation Committee are reviewed by the Board.
The Fund has performed an analysis of all existing investments to determine the significance and character of all inputs to their fair value determination. Various inputs are used in determining the value of the Fund’s investments. The inputs or methodology used for valuing securities are not necessarily an indication of the risk associated with investing in those securities. Details related to the fair valuation hierarchy of the Fund’s securities as of October 31, 2015 are included in the Fund’s Schedule of Investments.
4). INVESTMENT TRANSACTIONS
Purchases and sales of investment securities (excluding government and short-term investments) for the Fund during the fiscal year ended October 31, 2015 were $347,866,481 and $64,150,419, respectively.
There were no purchases or sales/maturities of long-term U.S. Government Securities for the Fund during the fiscal year ended October 31, 2015.
5). INVESTMENT MANAGEMENT FEE AND OTHER TRANSACTIONS WITH AFFILIATES
Hennessy Advisors, Inc. (the “Advisor”) is the investment advisor of the Fund. The Advisor provides the Fund with investment management services under an Investment Advisory Agreement. The Advisor furnishes all investment advice, office space, facilities, and provides most of the personnel needed by the Fund. As compensation for its services, the Advisor is entitled to a monthly fee from the Fund. The fee is based upon the average daily net assets of the Fund at the annual rate of 0.90%. The net investment advisory fees payable by the Fund as of October 31, 2015 were $1,544,508.
The Advisor has delegated the day-to-day management of the Fund to a sub-advisor, Broad Run Investment Management, LLC. The Advisor pays the sub-advisor fees for the Fund from its own assets and these fees are not an additional expense of the Fund.
The Advisor contractually agreed to limit the total annual operating expenses of the Fund (excluding interest, taxes, brokerage commissions, dividend expenses, acquired fund fees and expenses, extraordinary legal expenses, or any other extraordinary expenses and, from and after November 1, 2014, 12b-1 fees) to 1.95% and 1.70% of the Fund’s net assets for the Investor Class shares and Institutional Class shares of the Fund, respectively, through February 28, 2015. The expense limitation agreement for the Fund is no longer in effect.
| HENNESSY FUNDS | 1-800-966-4354 | |
For a period of three years after the year in which the Advisor waived or reimbursed expenses, the Advisor may seek reimbursement from the Fund to the extent that total annual fund operating expenses are less than the expense limitation that was in effect at the time the Advisor waived or reimbursed expenses. During the three years ended October 31, 2015, no expenses were waived or reimbursed by the Advisor and therefore no expenses are subject to potential recovery.
The Board has approved a Shareholder Servicing Agreement for the Investor Class shares of the Fund, effective as of February 28, 2015, which was instituted to compensate the Advisor for the non-investment management services it provides to the Fund. The Shareholder Servicing Agreement provides for a monthly fee paid to the Advisor at an annual rate of 0.10% of the average daily net assets of the Fund attributable to Investor Class shares. Shareholder service fees payable by the Fund as of October 31, 2015 were $130,481.
The Fund has adopted a plan pursuant to Rule 12b-1 under the Investment Company Act of 1940, as amended, that authorizes payments in connection with the distribution of the Fund’s shares at an annual rate of up to 0.25% of the Fund’s average daily net assets attributable to Investor Class shares, although the Fund has only been using up to 0.15% of its average daily net assets attributable to Investor Class shares for such purpose since March 1, 2015. Amounts paid under the plan may be spent on any activities or expenses primarily intended to result in the sale of shares, including but not limited to, advertising, shareholder account servicing, the printing and mailing of prospectuses to other than current shareholders, the printing and mailing of sales literature, and compensation for sales and marketing activities or to financial institutions and others, such as dealers and distributors.
The Fund has entered into agreements with various brokers, dealers, and financial intermediaries in connection with the sale of shares of the Fund. The agreements provide for periodic payments by the Fund to the brokers, dealers, and financial intermediaries for providing certain shareholder maintenance services (sub-transfer agent expenses). These shareholder services include the pre-processing and quality control of new accounts, shareholder correspondence, answering customer inquiries regarding account status, and facilitating shareholder telephone transactions. Fees paid by the Fund to various brokers, dealers, and financial intermediaries during the fiscal year ended October 31, 2015 were $2,960,782.
U.S. Bancorp Fund Services, LLC (“USBFS”) provides the Fund with administrative, fund accounting, and transfer agent services, including all regulatory reporting, and necessary office equipment and per sonnel. As administrator, USBFS is responsible for activities such as (i) preparing various federal and state regulatory filings, reports, and returns for the Fund, (ii) preparing reports and materials to be supplied to the Board, (iii) monitoring the activities of the Fund’s custodian, transfer agent, and accountants, and (iv) coordinating the preparation and payment of the Fund’s expenses and reviewing the Fund’s expense accruals. Fees paid to USBFS during the fiscal year ended October 31, 2015 were $1,730,741.
U.S. Bank, N.A., an affiliate of USBFS, serves as the Fund’s custodian. Quasar Distributors, LLC acts as the Fund’s principal underwriter in a continuous public offering of the Fund’s shares. Quasar Distributors, LLC is an affiliate of USBFS and U.S. Bank, N.A.
6). LINE OF CREDIT
The Fund has an uncommitted line of credit with the other funds in the Hennessy Funds family of funds (the “Hennessy Funds”) in the amount of the lesser of (i) $100,000,000 or (ii) 33.33% of each Hennessy Fund’s net assets, or 30% for the Hennessy Gas Utility Fund
and 10% for the Hennessy Balanced Fund, intended to provide short-term financing, if necessary, subject to certain restrictions, in connection with shareholder redemptions. The credit facility is with the Hennessy Funds’ custodian bank, U.S. Bank, N.A. Borrowings under this arrangement bear interest at the bank’s prime rate and are secured by all of the Fund’s assets (as to its own borrowings only). During the fiscal year ended October 31, 2015, the Fund did not have any borrowings outstanding under the line of credit.
7). FEDERAL TAX INFORMATION
As of October 31, 2015, the components of accumulated earnings (losses) for income tax purposes were as follows:
| Cost of investments for tax purposes | | $ | 1,278,943,526 | |
| Gross tax unrealized appreciation | | $ | 847,489,776 | |
| Gross tax unrealized depreciation | | | (28,444,576 | ) |
| Net tax unrealized appreciation | | $ | 819,045,200 | |
| Undistributed ordinary income | | $ | — | |
| Undistributed long-term capital gains | | | 4,051,234 | |
| Total distributable earnings | | $ | 4,051,234 | |
| Other accumulated loss | | $ | (8,330,095 | ) |
| Total accumulated gain | | $ | 814,766,339 | |
At October 31, 2015, the Fund had no tax basis capital losses to offset future capital gains.
At October 31, 2015, the Fund deferred, on a tax basis, a late year ordinary loss of $8,330,095.
The tax character of distributions paid during fiscal year 2015 and fiscal year 2014 for the Fund were as follows:
| | | Year Ended | | | Year Ended | |
| | | October 31, 2015 | | | October 31, 2014 | |
| Ordinary income | | $ | 2,736,846 | | | $ | — | |
| Long-term capital gain | | | 111,102,624 | | | | 22,446,515 | |
| | | $ | 113,839,470 | | | $ | 22,446,515 | |
8). EVENTS SUBSEQUENT TO YEAR END
Management has evaluated the Fund’s related events and transactions that occurred subsequent to October 31, 2015, through the date of issuance of the Fund’s financial statements. Other than as disclosed below, management has determined that there were no subsequent events requiring recognition or disclosure in the financial statements.
On December 9, 2015, capital gains were declared and paid to shareholders of record as of December 8, 2015 as follows:
| | Long-term | |
| Investor Class | $0.13953 | |
| Institutional Class | $0.14191 | |
| HENNESSY FUNDS | 1-800-966-4354 | |
Report of Independent Registered Public Accounting Firm
To the Board of Trustees of Hennessy Funds Trust
And the Shareholders of the Hennessy Focus Fund
Novato, CA
We have audited the accompanying statement of assets and liabilities, including the schedule of investments, of the Hennessy Focus Fund (the “Fund”), a series of Hennessy Funds Trust (the “Trust”), as of October 31, 2015, and the related statement of operations for the year then ended, the statements of changes in net assets for each of the two years in the period then ended, and the financial highlights for each of the five years in the period then ended. These financial statements and financial highlights are the responsibility of the Fund’s management. Our responsibility is to express an opinion on these financial statements and financial highlights based on our audits.
We conducted our audits in accordance with the standards of the Public Company Accounting Oversight Board (United States). Those standards require that we plan and perform the audits to obtain reasonable assurance about whether the financial statements and financial highlights are free of material misstatement. The Fund is not required to have, nor were we engaged to perform, an audit of its internal control over financial reporting. Our audits included consideration of internal control over financial reporting as a basis for designing audit procedures that are appropriate in the circumstances, but not for the purposes of expressing an opinion on the effectiveness of the Fund’s internal control over financial reporting. Accordingly, we express no such opinion. An audit includes examining, on a test basis, evidence supporting the amounts and disclosures in the financial statements. Our procedures included confirmation of securities owned as of October 31, 2015, by correspondence with the custodian. An audit also includes assessing the accounting principles used and significant estimates made by management, as well as evaluating the overall financial statement presentation. We believe that our audits provide a reasonable basis for our opinion.
In our opinion, the financial statements and financial highlights referred to above present fairly, in all material respects, the financial position of the Hennessy Focus Fund as of October 31, 2015, the results of its operations for the year then ended, the changes in its net assets for each of the two years in the period then ended, and the financial highlights for each of the five years in the period then ended, in conformity with accounting principles generally accepted in the United States of America.
Philadelphia, Pennsylvania
December 21, 2015
Trustees and Officers of the Fund (Unaudited)
The business and affairs of the Fund are managed under the direction of the Board of Trustees of the Trust, and the Board of Trustees elects the Officers of the Trust. Information pertaining to the Trustees and the Officers of the Trust is set forth below. Such persons serve until their successors are duly elected and qualified or until their earlier death, resignation, or removal. Each of the Trustees oversees 16 Hennessy Funds. Unless otherwise indicated, the address of all persons listed below is 7250 Redwood Boulevard, Suite 200, Novato, CA 94945. The Fund’s Statement of Additional Information includes more information about the persons listed below and is available, without charge, upon request by calling 1-800-966-4354.
| | | | Other |
| | | | Directorships |
| Name, Year of Birth, | | | (During Past |
| and Position Held | Length of | Principal Occupation(s) | Five Years) |
with the Trust | Time Served | During Past Five Years | Held by Trustee(1) |
| | | | |
| Disinterested Trustees | | | |
| | | | |
| J. Dennis DeSousa (1936) | Since January | Mr. DeSousa is a real estate investor. | Hennessy SPARX |
| Trustee | 1996 for the | | Funds Trust; |
| | Hennessy Funds | | Hennessy Mutual |
| | | | Funds, Inc.; and |
| | | | The Hennessy |
| | | | Funds, Inc. |
| | | | |
| Robert T. Doyle (1947) | Since January | Mr. Doyle has been the Sheriff of | Hennessy SPARX |
| Trustee | 1996 for the | Marin County, California since 1996. | Funds Trust; |
| | Hennessy Funds | | Hennessy Mutual |
| | | | Funds, Inc.; and |
| | | | The Hennessy |
| | | | Funds, Inc. |
| | | | |
| Gerald P. Richardson (1945) | Since May | Mr. Richardson is an independent | Hennessy SPARX |
| Trustee | 2004 for the | consultant in the securities industry. | Funds Trust; |
| | Hennessy Funds | | Hennessy Mutual |
| | | | Funds, Inc.; and |
| | | | The Hennessy |
| | | | Funds, Inc. |
Interested Trustee(2) | | | |
| | | | |
| Neil J. Hennessy (1956) | Since January | Mr. Hennessy has been employed by | Hennessy Advisors, |
| Trustee, Chairman of | 1996 as a Trustee | Hennessy Advisors, Inc., the Funds’ | Inc.; Hennessy |
| the Board, Chief | for the Hennessy | investment advisor, since 1989. | SPARX Funds Trust; |
| Investment Officer, | Funds and since | He currently serves as President, | Hennessy Mutual |
| Portfolio Manager, | June 2008 as | Chairman and Chief Executive Officer | Funds, Inc.; and |
| and President | an Officer of the | of Hennessy Advisors, Inc. | The Hennessy |
| | Hennessy Funds | | Funds, Inc. |
| HENNESSY FUNDS | 1-800-966-4354 | |
| Name, Year of Birth, | | |
| and Position Held | Length of | Principal Occupation(s) |
with the Trust | Time Served | During Past Five Years |
| | | |
| Officers | | |
| | | |
| Teresa M. Nilsen (1966) | Since January | Ms. Nilsen has been employed by Hennessy Advisors, Inc., |
| Executive Vice President | 1996 for the | the Funds’ investment advisor, since 1989. She currently |
| and Treasurer | Hennessy Funds | serves as Executive Vice President, Chief Operations Officer, |
| | | Chief Financial Officer, and Secretary of Hennessy Advisors, Inc. |
| | | |
| Daniel B. Steadman (1956) | Since March | Mr. Steadman has been employed by Hennessy Advisors, Inc., |
| Executive Vice President | 2000 for the | the Funds’ investment advisor, since 2000. He currently serves |
| and Secretary | Hennessy Funds | as Executive Vice President and Chief Compliance Officer of |
| | | Hennessy Advisors, Inc. |
| | | |
| Jennifer Cheskiewicz (1977) | Since June | Ms. Cheskiewicz has been employed by Hennessy Advisors, |
| Senior Vice President and | 2013 for the | Inc., the Funds’ investment advisor, since June 2013. She |
| Chief Compliance Officer | Hennessy Funds | currently serves as General Counsel of Hennessy Advisors, Inc. |
| | | |
| | | She previously served as in-house counsel to Carlson Capital, |
| | | L.P., an SEC-registered investment advisor to several private |
| | | funds from February 2010 to May 2013. |
| | | |
| Brian Carlson (1972) | Since December | Mr. Carlson has been employed by Hennessy Advisors, Inc., the |
| Senior Vice President and | 2013 for the | Funds’ investment advisor, since December 2013. |
| Head of Distribution | Hennessy Funds | |
| | | Mr. Carlson was previously a co-founder and principal of |
| | | Trivium Consultants, LLC from February 2011 through |
| | | November 2013. |
| | | |
David Ellison (1958)(3) | Since October | Mr. Ellison has served as a Portfolio Manager of the Hennessy |
| Senior Vice President and | 2012 for the | Small Cap Financial Fund, the Hennessy Large Cap Financial |
| Portfolio Manager | Hennessy Funds | Fund, and the Hennessy Technology Fund since inception. |
| | | |
| | | Mr. Ellison previously served as Director, CIO and President of |
| | | FBR Fund Advisers, Inc. from December 1999 to October 2012. |
| | | |
| Brian Peery (1969) | Since March | Mr. Peery has served as a Portfolio Manager of the Hennessy |
| Senior Vice President and | 2003 as an | Cornerstone Growth Fund, the Hennessy Cornerstone Mid Cap |
| Portfolio Manager | Officer of the | 30 Fund, the Hennessy Cornerstone Large Growth Fund, the |
| | Hennessy Funds | Hennessy Cornerstone Value Fund, the Hennessy Total Return |
| | and since | Fund, and the Hennessy Balanced Fund since October 2014. |
| | February 2011 | From February 2011 through September 2014, he served as |
| | as a Co-Portfolio | Co-Portfolio Manager of the same funds. Mr. Peery has also |
| | Manager or | served as a Portfolio Manager of the Hennessy Gas Utility Fund |
| | Portfolio Manager | since February 2015. |
| | for the | |
| | Hennessy Funds | Mr. Peery has been employed by Hennessy Advisors, Inc., the |
| | | Funds’ investment advisor, since 2002. |
| | | |
| Winsor (Skip) Aylesworth | Since October | Mr. Aylesworth has served as a Portfolio Manager of the |
(1947)(3) | 2012 for the | Hennessy Gas Utility Fund since 1998 and as a Portfolio |
| Vice President and | Hennessy Funds | Manager of the Hennessy Technology Fund since inception. |
| Portfolio Manager | | |
| | | Mr. Aylesworth previously served as Executive Vice President |
| | | of The FBR Funds from 1999 to October 2012. |
| Name, Year of Birth, | | |
| and Position Held | Length of | Principal Occupation(s) |
with the Trust | Time Served | During Past Five Years |
| | | |
Ryan Kelley (1972)(4) | Since March | Mr. Kelley has served as a Portfolio Manager of the Hennessy |
| Vice President and | 2013 for the | Gas Utility Fund, the Hennessy Small Cap Financial Fund, and |
| Portfolio Manager | Hennessy Funds | the Hennessy Large Cap Financial Fund since October 2014. |
| | | From March 2013 through September 2014, he served as a |
| | | Co-Portfolio Manager of the same funds. Prior to that, |
| | | he was a Portfolio Analyst of the Hennessy Funds. |
(1) | Pursuant to an internal reorganization, the series of Hennessy Mutual Funds, Inc. (“HMFI”), The Hennessy Funds, Inc. (“HFI”), and Hennessy SPARX Funds Trust (“HSFT”) were reorganized into series of Hennessy Funds Trust on February 28, 2014, which mirrored the corresponding series of HFMI, HFI, and HSFT. Subsequent to the reorganization, HFMI, HFI, and HSFT were dissolved. |
(2) | Mr. Hennessy is considered an “interested person,” as defined in the Investment Company Act of 1940, as amended, because he is an officer of the Hennessy Funds. |
(3) | The address of these officers is 101 Federal Street, Suite 1900, Boston, MA 02110. |
(4) | The address of this officer is 1340 Environ Way, Chapel Hill, NC 27517. |
| HENNESSY FUNDS | 1-800-966-4354 | |
Expense Example (Unaudited)
October 31, 2015
As a shareholder of the Fund, you incur two types of costs: (1) transaction costs, including sales charges (loads) on purchase payments, reinvested dividends, or other distributions; redemption fees; and exchange fees; and (2) ongoing costs, including management fees; service fees; and other Fund expenses. This Example is intended to help you understand your ongoing costs (in dollars) of investing in the Fund and to compare these costs with the ongoing costs of investing in other mutual funds. The Example is based on an investment of $1,000 invested at the beginning of the period and held for the entire period from May 1, 2015 through October 31, 2015.
Actual Expenses
The first line of the table below under the “Investor Class” and “Institutional Class” headings provides information about actual account values and actual expenses. Although the Fund charges no sales loads or transaction fees, you will be assessed fees for outgoing wire transfers, returned checks and stop payment orders at prevailing rates charged by U.S. Bancorp Fund Services, LLC, the Fund’s transfer agent. If you request that a redemption be made by wire transfer, currently a $15.00 fee is charged by the Fund’s transfer agent. IRA accounts will be charged a $15.00 annual maintenance fee. The example below includes, but is not limited to, management fees, shareholder servicing fees, fund accounting, custody, and transfer agent fees. However, the example below does not include portfolio trading commissions and related expenses, and other extraordinary expenses as determined under generally accepted accounting principles. You may use the information in this line, together with the amount you invested, to estimate the expenses that you paid over the period. Simply divide your account value by $1,000 (for example, an $8,600 account value divided by $1,000 = 8.6), then multiply the result by the number in the first line of the table under the “Investor Class” and “Institutional Class” headings in the column entitled “Expenses Paid During Period” to estimate the expenses you paid on your account during this period.
Hypothetical Example for Comparison Purposes
The second line of the table below under the “Investor Class” and “Institutional Class” headings provides information about hypothetical account values and hypothetical expenses based on the Fund’s actual expense ratios and an assumed rate of return of 5% per year before expenses, which is not the Fund’s actual return. The hypothetical account values and expenses may not be used to estimate the actual ending account balance or expenses you paid for the period. You may use this information to compare the ongoing costs of investing in the Fund and other funds. To do so, compare this 5% hypothetical example with the 5% hypothetical examples that appear in the shareholder reports of the other funds. Please note that the expenses shown in the table are meant to highlight your ongoing costs only and do not reflect any transactional costs, such as sales charges (loads), or exchange fees. Therefore, the second line of the table under the “Investor Class” and “Institutional Class” headings is useful in comparing ongoing costs only, and will not help you determine the relative total costs of owning different funds. In addition, if these transactional costs were included, your costs would have been higher.
| | | | Expenses Paid |
| | Beginning | Ending | During Period(1) |
| | Account Value | Account Value | May 1, 2015 – |
| | May 1, 2015 | October 31, 2015 | October 31, 2015 |
| Investor Class | | | |
| Actual | $1,000.00 | $1,026.00 | $7.66 |
| Hypothetical (5% return before expenses) | $1,000.00 | $1,017.64 | $7.63 |
| Institutional Class | | | |
| Actual | $1,000.00 | $1,027.90 | $5.72 |
| Hypothetical (5% return before expenses) | $1,000.00 | $1,019.56 | $5.70 |
(1) | Expenses are equal to the Fund’s annualized expense ratio of 1.50% for Investor Class shares or 1.12% for Institutional Class shares, as applicable, multiplied by the average account value over the period, multiplied by 184/365 days (to reflect one-half year period). |
| HENNESSY FUNDS | 1-800-966-4354 | |
How to Obtain a Copy of the Fund’s
Proxy Voting Policy and Proxy Voting Records
A description of the policies and procedures the Fund uses to determine how to vote proxies relating to portfolio securities is available without charge: (1) by calling 1-800-966-4354; (2) on the Hennessy Funds’ website at hennessyfunds.com/proxy-voting/policy.fs; or (3) on the U.S. Securities and Exchange Commission’s website at www.sec.gov. The Fund’s proxy voting record is available without charge on both the Hennessy Funds’ website at hennessyfunds.com/proxy-voting/policy.fs and the SEC’s website at www.sec.gov no later than August 31 for the prior 12 months ending June 30.
Quarterly Filings on Form N-Q
The Fund files its complete schedule of portfolio holdings with the SEC for the first and third quarters of each fiscal year on Form N-Q. The Fund’s Form N-Q will be available on the SEC’s website at www.sec.gov. The Fund’s Form N-Q may be reviewed and copied at the SEC’s Public Reference Room in Washington, DC and information on the operation of the Public Reference Room may be obtained by calling 1-800-SEC-0330. Information included in the Fund’s N-Q will also be available upon request by calling 1-800-966-4354.
Federal Tax Distribution Information
(Unaudited)
For the fiscal year ended October 31, 2015, certain dividends paid by the Fund may be subject to a maximum tax rate of 23.8%, as provided for by the Jobs and Growth Tax Relief Reconciliation Act of 2003. The percentage of dividends declared from ordinary income designated as qualified dividend income was 100.00%.
For corporate shareholders, the percent of ordinary income distributions that qualified for the corporate dividends received deduction for the fiscal year ended October 31, 2015 was 100.00%.
The percentage of taxable ordinary income distributions that are designated as short-term capital gain distributions under Section 871(k)(2)(C) of the Internal Revenue Code of 1986, as amended, for the Fund was 90.67%.
Householding
To help keep the Fund’s costs as low as possible, we generally deliver a single copy of most financial reports and prospectuses to shareholders who share an address, even if the accounts are registered under different names. This process, known as “householding,” does not apply to account statements. You may, of course, request an individual copy of a prospectus or financial report at any time. If you would like to receive separate mailings, please call the Administrator at 1-800-261-6950 or 1-414-765-4124 and we will begin individual delivery within 30 days of your request. If your account is held through a financial institution or other intermediary, please contact them directly to request individual delivery.
Privacy Policy
We collect the following non-public personal information about you:
| | • | information we receive from you on or in applications or other forms, correspondence, or conversations, including, but not limited to, your name, address, phone number, social security number, assets, income, and date of birth; and |
| | | |
| | • | information about your transactions with us, our affiliates, or others, including, but not limited to, your account number and balance, payment history, parties to transactions, cost basis information, and other financial information. |
We do not disclose any non-public personal information about our current or former shareholders to nonaffiliated third parties, except as permitted by law. For example, we are permitted by law to disclose all of the information we collect, as described above, to our Transfer Agent to process your transactions. Furthermore, we restrict access to your non-public personal information to those persons who require such information to provide products or services to you. We maintain physical, electronic, and procedural safeguards that comply with federal standards to guard your non-public personal information.
In the event that you hold shares of the Fund through a financial intermediary, including, but not limited to, a broker-dealer, bank or trust company, the privacy policy of your financial intermediary would govern how your non-public personal information would be shared with nonaffiliated third parties.
| HENNESSY FUNDS | 1-800-966-4354 | |
For information, questions or assistance, please call
The Hennessy Funds
1-800-966-4354 or 1-415-899-1555
INVESTMENT ADVISOR
Hennessy Advisors, Inc.
7250 Redwood Blvd., Suite 200
Novato, California 94945
ADMINISTRATOR,
TRANSFER AGENT,
DIVIDEND PAYING AGENT &
SHAREHOLDER SERVICING AGENT
U.S. Bancorp Fund Services, LLC
P.O. Box 701
Milwaukee, Wisconsin 53201-0701
CUSTODIAN
U.S. Bank N.A.
Custody Operations
1555 North River Center Dr., Suite 302
Milwaukee, Wisconsin 53212
TRUSTEES
Neil J. Hennessy
Robert T. Doyle
J. Dennis DeSousa
Gerald P. Richardson
COUNSEL
Foley & Lardner LLP
777 East Wisconsin Avenue
Milwaukee, Wisconsin 53202-5306
INDEPENDENT REGISTERED
PUBLIC ACCOUNTING FIRM
Tait, Weller & Baker LLP
1818 Market Street, Suite 2400
Philadelphia, Pennsylvania 19103
DISTRIBUTOR
Quasar Distributors, LLC
615 East Michigan Street
Milwaukee, Wisconsin 53202
| hennessyfunds.com | 1-800-966-4354 |
This report has been prepared for shareholders and may be distributed to
others only if preceded or accompanied by a current prospectus.
ANNUAL REPORT
OCTOBER 31, 2015
HENNESSY CORNERSTONE
MID CAP 30 FUND
Investor Class HFMDX
Institutional Class HIMDX
| hennessyfunds.com | 1-800-966-4354 |
(This Page Intentionally Left Blank.)
Contents
| Letter to Shareholders | 2 |
| Performance Overview | 4 |
| Financial Statements | |
| Schedule of Investments | 7 |
| Statement of Assets and Liabilities | 11 |
| Statement of Operations | 12 |
| Statements of Changes in Net Assets | 13 |
| Financial Highlights | 14 |
| Notes to the Financial Statements | 18 |
| Report of Independent Registered Public Accounting Firm | 25 |
| Trustees and Officers of the Fund | 26 |
| Expense Example | 30 |
| Proxy Voting | 32 |
| Quarterly Filings on Form N-Q | 32 |
| Federal Tax Distribution Information | 32 |
| Householding | 32 |
| Matters Submitted to a Shareholder Vote | 33 |
| Privacy Policy | 33 |
| HENNESSY FUNDS | 1-800-966-4354 | |
December 2015
Dear Hennessy Funds Shareholder:
As I look back over the year, I am reminded that the U.S. economy has come a long way since the depths of the recession in 2009. The economy has been expanding steadily for almost six years, the unemployment rate has halved, the housing market has been recovering and capital expenditures have been growing. The financial markets have performed well too, driven largely by strong corporate earnings growth, especially in the early years. The U.S. market, as measured by the S&P 500 Index, has roughly tripled since the bull market began in 2009, and the Index’s earnings per share have increased 260% over this same time period. For the year ended October 31, 2015, the U.S. equity market performed reasonably well, with the S&P 500 posting another advance of 5.2%. However, behind this headline number, the market experienced a great deal of volatility as investors reacted to falling energy prices, a rise in the U.S. Dollar, pressure on export earnings growth, slower growth in China and, most significantly, the likelihood of a rise in the Fed Funds rate for the first time in nearly a decade – the featured topic of conversation around every office water cooler in the financial world this year.
Investors, reporters and friends often ask me “What’s next?” The market has been in a volatile, sideways correction for over a year now, and throughout this period of volatility, I have consistently advised investors to continue to focus on the long-term fundamentals of the market.
In my view, the fundamentals of the market are in good shape. Despite a stronger U.S. Dollar and its impact on export growth, the economy is still growing steadily. Inflation remains low, so we expect the Federal Reserve, once it does begin to raise short-term interest rates, will not likely raise them by very much. New jobs are being created at what I believe is a healthy rate, and average hourly wages are rising in response to a tighter labor market. Higher wages and lower gasoline prices are helping to keep consumer confidence positive.
Notwithstanding what I view as a relatively solid economic environment, however, I think investor sentiment remains restrained. The same factors that contributed to the market volatility this past year are still troubling investors today: the slowdown in the Chinese economy, slower earnings growth here in the U.S., and, of course, the prospect of rising interest rates. As a result of these investor worries, I do not see any solid enthusiasm for the market – no euphoria. Universal optimism about the market often coincides with a peak in stock prices and this absence of euphoria is yet another reason I feel bullish. And finally, I do not believe stocks are expensive. The Dow Jones Industrial Average and the S&P 500 Index have forward PE (price-to-earnings) ratios of approximately 16x and 17x, respectively, close to long-term averages. In my view, these fundamentals taken together signal a continuation of the bull market that began six years ago.
A final positive note: I still do not believe that investors have fully returned to investing in U.S. equities. Assets in domestic equity funds have now reached parity with fixed income/money market funds, with $6.2 trillion in each. I believe that fixed income investments will continue to trickle into equities, which should have a positive effect on the market.
Thank you for your continued confidence and investment in our products. If you have any questions or would like to speak with us directly, please don’t hesitate to call us at (800) 966-4354.
Best regards,
Neil J. Hennessy
President and Chief Investment Officer
Past performance does not guarantee future results.
Mutual fund investing involves risk. Principal loss is possible.
Opinions expressed are those of Neil Hennessy and are subject to change, are not guaranteed and should not be considered investment advice.
The Dow Jones Industrial Average and the S&P 500 Index are unmanaged indices commonly used to measure the performance of U.S. stocks. One cannot invest directly in an index.
Price to earnings (“PE”) is the market price per share divided by earnings per share. Earnings per share is the portion of a company’s profit allocated to each outstanding share of common stock. It serves as an indicator of a company’s profitability.
| HENNESSY FUNDS | 1-800-966-4354 | |
Performance Overview (Unaudited)
CHANGE IN VALUE OF $10,000 INVESTMENT
This graph illustrates the performance of an initial investment of $10,000 made in the Fund ten years ago and assumes the reinvestment of dividends.
AVERAGE ANNUAL TOTAL RETURN FOR PERIODS ENDED OCTOBER 31, 2015
| | One | Five | Ten |
| | Year | Years | Years |
| Hennessy Cornerstone Mid Cap 30 Fund – | | | |
| Investor Class (HFMDX) | 12.35% | 15.83% | 10.03% |
| Hennessy Cornerstone Mid Cap 30 Fund – | | | |
Institutional Class (HIMDX)(1) | 12.62% | 16.20% | 10.31% |
Russell Midcap® Index | 2.77% | 13.91% | 8.85% |
| S&P 500 Index | 5.20% | 14.33% | 7.85% |
Expense ratios from most recent prospectus: 1.17% (Investor Class); 0.99% (Institutional Class). As set forth in the Supplement to the Prospectus dated October 7, 2015, a 12b-1 fee of 0.15% was instituted on Investor Class shares effective as of November 1, 2015, and is not included in the Investor Class expense ratio.
Performance data quoted represents past performance; past performance does not guarantee future results. The investment return and principal value of an investment will fluctuate so that an investor’s shares, when redeemed, may be worth more or less than their original cost. The performance graph and table do not reflect the deduction of taxes that a shareholder would pay on Fund distributions or the redemption of Fund shares. Current performance of the Fund may be lower or higher than the performance quoted. Performance data current to the most recent month end may be obtained by visiting hennessyfunds.com.
(1) | The inception date of Institutional Class shares is March 3, 2008. Performance shown prior to the inception of Institutional Class shares reflects the performance of Investor Class shares and includes expenses that are not applicable to and are higher than those of Institutional Class shares. |
PERFORMANCE NARRATIVE
Portfolio Managers Neil Hennessy and Brian Peery
Performance:
For the twelve-month period ended October 31, 2015, the Investor Class of the Hennessy Cornerstone Mid Cap 30 Fund returned 12.35%, significantly outperforming the Russell
Midcap® Index and the S&P 500 Index, which returned 2.77% and 5.20% for the same period, respectively.
We are very pleased with the overall performance of the Fund during the twelve-month period ended October 31, 2015. The Fund’s relative outperformance was driven entirely by underlying stock selection, as sector allocation was slightly negative. Roughly half of the Fund’s outperformance versus the Russell Midcap® Index was due to stock selection within the Consumer Discretionary sector, including Skechers USA, Inc., Mohawk Industries, Inc. and Advance Auto Parts, Inc., which performed especially well over the period. The next largest contributor to Fund performance was stock selection within the Industrials sector, with JetBlue Airways Corp., Masco Corp. and HD Supply Holdings. Inc. leading the list of outperformers over the period. The largest detractor to the Fund’s performance was stock selection within the Telecommunications sector, where the decline in Windstream Holdings accounted for a substantial portion of the sector’s underperformance. The Fund continues to hold all the stocks mentioned above.
Portfolio Strategy:
We believe that limiting the Fund to 30 stocks produces a relatively concentrated portfolio, where individual stock performance can influence the performance of the portfolio as a whole while at the same time providing ample diversification in our view. Additionally, the Fund employs a strict price-to-sales ratio limit of 1.5, resulting in the Fund investing in what we deem to be reasonably-valued stocks rather than those whose price may be predicated on expected future growth. This “growth at a reasonable price” stock selection approach has served us well, and we believe wholeheartedly in utilizing this methodology when investing.
Market Outlook:
Over the twelve-month period ended October 31, 2015, U.S. equities, as measured by the S&P 500 Index, advanced by just over 5%. Notwithstanding this modest rise, the year was marked by a great deal of volatility, especially during the second half of the period when uncertainty regarding the timing and magnitude of a rise in short-term interest rates being contemplated by the Federal Reserve dominated investor thinking. Earnings growth, too, caused anxiety for investors. Lower energy prices impacted many companies in the Energy sector, and the higher U.S. Dollar and slower growth abroad affected exporters. Many companies saw their sales and earnings growth slow.
In the end, however, confidence in continued economic growth was strong enough to offset investor concerns, with the market staging a dramatic rally in October, the final month of the Fund’s fiscal year. We believe the basic fundamentals of the market are attractive, and we continue to be optimistic about the possibility of further market advances over the course of the next year. The economy is growing slowly but steadily. Inflation is low, so we expect that the Fed, once they do start to raise rates, will not raise them by very much. The labor market has continued to recover over the last 12 months, and consumer confidence appears buoyant. Most importantly, we do not believe stocks are expensive. The Dow Jones Industrial Average and the S&P 500 have forward PE ratios of approximately 16x and 17x, respectively, close to long-term averages. Corporate balance sheets appear to be in excellent shape, and while executives have shown some reluctance to increase capital spending beyond maintenance levels this cycle, we believe companies will eventually start investing for expansion. This spending could, in turn, help drive share prices higher through an acceleration in sales and earnings growth.
| HENNESSY FUNDS | 1-800-966-4354 | |
Investment Outlook:
We are confident that there are good investment opportunities in the mid-cap space. While we believe higher interest rates may lead to an even stronger U.S. Dollar and difficulties for exporters, many mid-cap companies have purely domestic businesses, which are benefiting from steady economic growth at home, low inflation and low energy prices. With consumer debt levels falling and wage growth finally starting to accelerate, we are expecting a fairly good holiday season for consumer-based companies and stronger demand for their products and services next year. However, we recognize that despite low gas prices, consumers and especially younger consumers, seem to prefer spending less and saving more, in contrast to previous generations. Going into the new fiscal year, we are pleased with the positioning of the portfolio, which includes a large number of companies that are domestically focused and that we believe are reasonably valued and may be poised for growth. Relative to the Fund’s benchmarks, the portfolio is overweight in both the Consumer Discretionary and Industrial sectors and we think that these areas of the market offer great growth potential now and into 2016.
Opinions expressed are those of the Portfolio Managers as of the date written and are subject to change, are not guaranteed, and should not be considered investment advice or an indication of trading intent.
The Russell Midcap® Index is an index commonly used to measure the performance of U.S. medium-capitalization stocks. The S&P 500 Index and Dow Jones Industrial Average are unmanaged indices commonly used to measure the performance of U.S. stocks. One cannot invest directly in an index.
The Fund invests in small and medium capitalized companies, which may have limited liquidity and greater price volatility than large capitalization companies. The Fund’s formula-based strategy may cause the Fund to buy or sell securities at times when it may not be advantageous.
References to specific securities should not be considered a recommendation to buy or sell any security. Fund holdings and sector allocations are subject to change. Please refer to the Schedule of Investments included in this report for additional portfolio information.
Diversification does not assure a profit or protect against loss in a declining market. Price to sales ratio is a tool for calculating a stock’s valuation relative to other companies. It is calculated by dividing a company’s market price per share by its revenue per share. PE, or price to earnings, is calculated by dividing a company’s market price per share by its earnings per share. Earnings growth is not a measure of the Fund’s future performance.
Financial Statements
Schedule of Investments as of October 31, 2015 |
HENNESSY CORNERSTONE MID CAP 30 FUND
(% of Net Assets)
| TOP TEN HOLDINGS (EXCLUDING CASH/CASH EQUIVALENTS) | % NET ASSETS |
| JetBlue Airways Corp. | 4.78% |
| Advance Auto Parts, Inc. | 4.37% |
| Centene Corp. | 4.37% |
| Mohawk Industries, Inc. | 4.31% |
| Sealed Air Corp. | 4.31% |
| Take-Two Interactive Software, Inc. | 4.30% |
| NVR, Inc. | 4.25% |
| Pinnacle Foods, Inc. | 4.02% |
| Masco Corp. | 3.65% |
| Foot Locker, Inc. | 3.60% |
Note: For presentation purposes, the Fund has grouped some of the industry categories. For purposes of categorizing securities for compliance with Section 8(b)(1) of the Investment Company Act of 1940, as amended, the Fund uses more specific industry classifications.
| HENNESSY FUNDS | 1-800-966-4354 | |
| COMMON STOCKS – 93.32% | | Number | | | | | | % of | |
| | | of Shares | | | Value | | | Net Assets | |
| Consumer Discretionary – 29.05% | | | | | | | | | |
| Advance Auto Parts, Inc. | | | 236,300 | | | $ | 46,889,009 | | | | 4.37 | % |
| Brinker International, Inc. | | | 601,200 | | | | 27,360,612 | | | | 2.55 | % |
| Foot Locker, Inc. | | | 569,700 | | | | 38,597,175 | | | | 3.60 | % |
| JC Penney Co., Inc. (a) | | | 3,364,400 | | | | 30,851,548 | | | | 2.88 | % |
| Live Nation Entertainment, Inc. (a) | | | 1,318,400 | | | | 35,965,952 | | | | 3.36 | % |
| Mohawk Industries, Inc. (a) | | | 236,400 | | | | 46,216,200 | | | | 4.31 | % |
| NVR, Inc. (a) | | | 27,814 | | | | 45,552,657 | | | | 4.25 | % |
| Skechers USA, Inc. (a) | | | 1,146,900 | | | | 35,783,280 | | | | 3.34 | % |
| TopBuild Corp. (a) | | | 150,011 | | | | 4,219,809 | | | | 0.39 | % |
| | | | | | | | 311,436,242 | | | | 29.05 | % |
| | | | | | | | | | | | | |
| Consumer Staples – 5.79% | | | | | | | | | | | | |
| Pilgrim’s Pride Corp. | | | 997,200 | | | | 18,936,828 | | | | 1.77 | % |
| Pinnacle Foods, Inc. | | | 977,200 | | | | 43,074,976 | | | | 4.02 | % |
| | | | | | | | 62,011,804 | | | | 5.79 | % |
| | | | | | | | | | | | | |
| Financials – 6.46% | | | | | | | | | | | | |
| Reinsurance Group of America, Inc. | | | 401,100 | | | | 36,195,264 | | | | 3.38 | % |
| Voya Financial, Inc. | | | 815,000 | | | | 33,064,550 | | | | 3.08 | % |
| | | | | | | | 69,259,814 | | | | 6.46 | % |
| | | | | | | | | | | | | |
| Health Care – 8.93% | | | | | | | | | | | | |
| Centene Corp. (a) | | | 787,700 | | | | 46,852,396 | | | | 4.37 | % |
| LifePoint Hospitals, Inc. (a) | | | 459,320 | | | | 31,637,962 | | | | 2.95 | % |
| Tenet Healthcare Corp. (a) | | | 550,900 | | | | 17,281,733 | | | | 1.61 | % |
| | | | | | | | 95,772,091 | | | | 8.93 | % |
| | | | | | | | | | | | | |
| Industrials – 16.76% | | | | | | | | | | | | |
| AECOM Technology Corp. (a) | | | 983,000 | | | | 28,969,010 | | | | 2.70 | % |
| HD Supply Holdings, Inc. (a) | | | 1,163,400 | | | | 34,657,686 | | | | 3.23 | % |
| JetBlue Airways Corp. (a) | | | 2,060,400 | | | | 51,180,336 | | | | 4.78 | % |
| Masco Corp. | | | 1,350,300 | | | | 39,158,700 | | | | 3.65 | % |
| Ryder System, Inc. | | | 357,700 | | | | 25,675,706 | | | | 2.40 | % |
| | | | | | | | 179,641,438 | | | | 16.76 | % |
| | | | | | | | | | | | | |
| Information Technology – 4.30% | | | | | | | | | | | | |
| Take-Two Interactive Software, Inc. (a) | | | 1,386,900 | | | | 46,045,080 | | | | 4.30 | % |
The accompanying notes are an integral part of these financial statements.
| COMMON STOCKS | | Number | | | | | | % of | |
| | | of Shares | | | Value | | | Net Assets | |
| Materials – 16.15% | | | | | | | | | |
| Ball Corp. | | | 503,300 | | | $ | 34,476,050 | | | | 3.22 | % |
| RPM International, Inc. | | | 704,500 | | | | 32,202,695 | | | | 3.00 | % |
| Sealed Air Corp. | | | 940,500 | | | | 46,197,360 | | | | 4.31 | % |
| Steel Dynamics, Inc. | | | 1,470,300 | | | | 27,156,441 | | | | 2.53 | % |
| Valspar Corp. | | | 408,700 | | | | 33,084,265 | | | | 3.09 | % |
| | | | | | | | 173,116,811 | | | | 16.15 | % |
| | | | | | | | | | | | | |
| Telecommunication Services – 2.70% | | | | | | | | | | | | |
| Frontier Communications Corp. | | | 5,001,500 | | | | 25,707,710 | | | | 2.40 | % |
| Windstream Holdings, Inc. | | | 498,867 | | | | 3,247,624 | | | | 0.30 | % |
| | | | | | | | 28,955,334 | | | | 2.70 | % |
| | | | | | | | | | | | | |
| Utilities – 3.18% | | | | | | | | | | | | |
| UGI Corp. | | | 929,500 | | | | 34,084,765 | | | | 3.18 | % |
| | | | | | | | | | | | | |
| Total Common Stocks | | | | | | | | | | | | |
| (Cost $953,129,295) | | | | | | | 1,000,323,379 | | | | 93.32 | % |
| | | | | | | | | | | | | |
| REITS – 1.12% | | | | | | | | | | | | |
| Financials – 1.12% | | | | | | | | | | | | |
| Communications Sales & Leasing, Inc. | | | 598,640 | | | | 12,026,677 | | | | 1.12 | % |
| | | | | | | | | | | | | |
| Total REITS | | | | | | | | | | | | |
| (Cost $17,630,782) | | | | | | | 12,026,677 | | | | 1.12 | % |
| | | | | | | | | | | | | |
| SHORT-TERM INVESTMENTS – 4.41% | | | | | | | | | | | | |
| Money Market Funds – 4.41% | | | | | | | | | | | | |
| Fidelity Government Portfolio – Institutional Class, 0.01% (b) | | | 47,245,876 | | | | 47,245,876 | | | | 4.41 | % |
| | | | | | | | | | | | | |
| Total Short-Term Investments | | | | | | | | | | | | |
| (Cost $47,245,876) | | | | | | | 47,245,876 | | | | 4.41 | % |
| | | | | | | | | | | | | |
| Total Investments | | | | | | | | | | | | |
| (Cost $1,018,005,953) – 98.85% | | | | | | | 1,059,595,932 | | | | 98.85 | % |
| Other Assets in | | | | | | | | | | | | |
| Excess of Liabilities – 1.15% | | | | | | | 12,345,345 | | | | 1.15 | % |
TOTAL NET ASSETS – 100.00% | | | | | | $ | 1,071,941,277 | | | | 100.00 | % |
Percentages are stated as a percent of net assets.
REIT – Real Estate Investment Trust
| (a) | Non-income producing security. |
| (b) | The rate listed is the fund’s 7-day yield as of October 31, 2015. |
The accompanying notes are an integral part of these financial statements.
| HENNESSY FUNDS | 1-800-966-4354 | |
Summary of Fair Value Exposure at October 31, 2015
The following is a summary of the inputs used to value the Fund’s net assets as of October 31, 2015 (see Note 3 in the accompanying notes to the financial statements):
| Common Stocks | | Level 1 | | | Level 2 | | | Level 3 | | | Total | |
| Consumer Discretionary | | $ | 311,436,242 | | | $ | — | | | $ | — | | | $ | 311,436,242 | |
| Consumer Staples | | | 62,011,804 | | | | — | | | | — | | | | 62,011,804 | |
| Financials | | | 69,259,814 | | | | — | | | | — | | | | 69,259,814 | |
| Health Care | | | 95,772,091 | | | | — | | | | — | | | | 95,772,091 | |
| Industrials | | | 179,641,438 | | | | — | | | | — | | | | 179,641,438 | |
| Information Technology | | | 46,045,080 | | | | — | | | | — | | | | 46,045,080 | |
| Materials | | | 173,116,811 | | | | — | | | | — | | | | 173,116,811 | |
| Telecommunication Services | | | 28,955,334 | | | | — | | | | — | | | | 28,955,334 | |
| Utilities | | | 34,084,765 | | | | — | | | | — | | | | 34,084,765 | |
| Total Common Stocks | | $ | 1,000,323,379 | | | $ | — | | | $ | — | | | $ | 1,000,323,379 | |
| REITS | | | | | | | | | | | | | | | | |
| Financials | | $ | 12,026,677 | | | $ | — | | | $ | — | | | $ | 12,026,677 | |
| Total REITS | | $ | 12,026,677 | | | $ | — | | | $ | — | | | $ | 12,026,677 | |
| Short-Term Investments | | | | | | | | | | | | | | | | |
| Money Market Funds | | $ | 47,245,876 | | | $ | — | | | $ | — | | | $ | 47,245,876 | |
| Total Short-Term Investments | | $ | 47,245,876 | | | $ | — | | | $ | — | | | $ | 47,245,876 | |
| Total Investments | | $ | 1,059,595,932 | | | $ | — | | | $ | — | | | $ | 1,059,595,932 | |
Transfers between levels are recognized at the end of the reporting period. During the year ended October 31, 2015, the Fund recognized no transfers between levels.
The accompanying notes are an integral part of these financial statements.
Financial Statements
Statement of Assets and Liabilities as of October 31, 2015 |
| ASSETS: | | | |
| Investments in securities, at value (cost $1,018,005,953) | | $ | 1,059,595,932 | |
| Dividends and interest receivable | | | 121,137 | |
| Receivable for fund shares sold | | | 14,926,975 | |
| Prepaid expenses and other assets | | | 44,798 | |
| Total Assets | | | 1,074,688,842 | |
| | | | | |
| LIABILITIES: | | | | |
| Payable for fund shares redeemed | | | 1,721,920 | |
| Payable to advisor | | | 643,549 | |
| Payable to administrator | | | 171,656 | |
| Payable to auditor | | | 21,831 | |
| Accrued service fees | | | 61,932 | |
| Accrued trustees fees | | | 2,501 | |
| Accrued expenses and other payables | | | 124,176 | |
| Total Liabilities | | | 2,747,565 | |
| NET ASSETS | | $ | 1,071,941,277 | |
| | | | | |
| NET ASSETS CONSIST OF: | | | | |
| Capital stock | | $ | 1,022,398,505 | |
| Accumulated net investment income | | | 797,037 | |
| Accumulated net realized gain on investments | | | 7,155,756 | |
| Unrealized net appreciation on investments | | | 41,589,979 | |
| Total Net Assets | | $ | 1,071,941,277 | |
| | | | | |
| NET ASSETS | | | | |
| Investor Class: | | | | |
| Shares authorized (no par value) | | Unlimited | |
| Net assets applicable to outstanding Investor Class shares | | $ | 765,903,830 | |
| Shares issued and outstanding | | | 38,062,565 | |
| Net asset value, offering price and redemption price per share | | $ | 20.12 | |
| | | | | |
| Institutional Class: | | | | |
| Shares authorized (no par value) | | Unlimited | |
| Net assets applicable to outstanding Institutional Class shares | | $ | 306,037,447 | |
| Shares issued and outstanding | | | 14,891,989 | |
| Net asset value, offering price and redemption price per share | | $ | 20.55 | |
The accompanying notes are an integral part of these financial statements.
| HENNESSY FUNDS | 1-800-966-4354 | |
Financial Statements
Statement of Operations for the year ended October 31, 2015 |
| INVESTMENT INCOME: | | | |
| Dividend income | | $ | 8,474,773 | |
| Interest income | | | 3,053 | |
| Total investment income | | | 8,477,826 | |
| | | | | |
| EXPENSES: | | | | |
| Investment advisory fees (See Note 5) | | | 4,416,181 | |
| Sub-transfer agent expenses – Investor Class (See Note 5) | | | 868,942 | |
| Sub-transfer agent expenses – Institutional Class (See Note 5) | | | 139,791 | |
| Administration, fund accounting, custody and transfer agent fees (See Note 5) | | | 596,880 | |
| Service fees – Investor Class (See Note 5) | | | 445,295 | |
| Federal and state registration fees | | | 61,291 | |
| Reports to shareholders | | | 33,440 | |
| Audit fees | | | 22,610 | |
| Compliance expense | | | 22,187 | |
| Trustees’ fees and expenses | | | 12,467 | |
| Legal fees | | | 4,736 | |
| Other expenses | | | 23,485 | |
| Net expenses | | | 6,647,305 | |
| NET INVESTMENT INCOME | | $ | 1,830,521 | |
| | | | | |
| REALIZED AND UNREALIZED GAINS (LOSSES): | | | | |
| Net realized gain on investments | | $ | 8,189,909 | |
| Net change in unrealized appreciation on investments | | | 19,847,205 | |
| Net gain on investments | | | 28,037,114 | |
| NET INCREASE IN NET ASSETS RESULTING FROM OPERATIONS | | $ | 29,867,635 | |
The accompanying notes are an integral part of these financial statements.
Financial Statements
| Statements of Changes in Net Assets |
| | | Year Ended | | | Year Ended | |
| | | October 31, 2015 | | | October 31, 2014 | |
| OPERATIONS: | | | | | | |
| Net investment income (loss) | | $ | 1,830,521 | | | $ | (1,043,883 | ) |
| Net realized gain on investments | | | 8,189,909 | | | | 21,172,663 | |
| Net change in unrealized appreciation on investments | | | 19,847,205 | | | | 14,300,425 | |
| Net increase in net assets resulting from operations | | | 29,867,635 | | | | 34,429,205 | |
| | | | | | | | | |
| DISTRIBUTIONS TO SHAREHOLDERS FROM: | | | | | | | | |
| Net investment income | | | | | | | | |
| Investor Class | | | — | | | | (454,042 | ) |
| Institutional Class | | | — | | | | (270,203 | ) |
| Net realized gains | | | | | | | | |
| Investor Class | | | (16,025,638 | ) | | | (11,623,817 | ) |
| Institutional Class | | | (4,641,869 | ) | | | (3,628,891 | ) |
| Total distributions | | | (20,667,507 | ) | | | (15,976,953 | ) |
| | | | | | | | | |
| CAPITAL SHARE TRANSACTIONS: | | | | | | | | |
| Proceeds from shares subscribed – Investor Class | | | 626,037,117 | | | | 123,845,765 | |
| Proceeds from shares subscribed – Institutional Class | | | 265,472,593 | | | | 42,799,834 | |
| Dividends reinvested – Investor Class | | | 15,829,426 | | | | 11,873,075 | |
| Dividends reinvested – Institutional Class | | | 4,211,897 | | | | 3,660,618 | |
| Cost of shares redeemed – Investor Class | | | (143,926,929 | ) | | | (50,946,355 | ) |
| Cost of shares redeemed – Institutional Class | | | (38,580,417 | ) | | | (26,622,774 | ) |
| Net increase in net assets derived | | | | | | | | |
| from capital share transactions | | | 729,043,687 | | | | 104,610,163 | |
| TOTAL INCREASE IN NET ASSETS | | | 738,243,815 | | | | 123,062,415 | |
| | | | | | | | | |
| NET ASSETS: | | | | | | | | |
| Beginning of year | | | 333,697,462 | | | | 210,635,047 | |
| End of year | | $ | 1,071,941,277 | | | $ | 333,697,462 | |
| Undistributed net investment income (loss), | | | | | | | | |
| end of year | | $ | 797,037 | | | $ | (1,033,484 | ) |
| | | | | | | | | |
| CHANGES IN SHARES OUTSTANDING: | | | | | | | | |
| Shares sold – Investor Class | | | 30,736,606 | | | | 6,500,015 | |
| Shares sold – Institutional Class | | | 12,673,580 | | | | 2,212,501 | |
| Shares issued to holders as | | | | | | | | |
| reinvestment of dividends – Investor Class | | | 847,400 | | | | 706,175 | |
| Shares issued to holders as | | | | | | | | |
| reinvestment of dividends – Institutional Class | | | 221,213 | | | | 213,582 | |
| Shares redeemed – Investor Class | | | (7,112,737 | ) | | | (2,821,483 | ) |
| Shares redeemed – Institutional Class | | | (1,904,158 | ) | | | (1,429,482 | ) |
| Net increase in shares outstanding | | | 35,461,904 | | | | 5,381,308 | |
The accompanying notes are an integral part of these financial statements.
| HENNESSY FUNDS | 1-800-966-4354 | |
Financial Statements
For an Investor Class share outstanding throughout each year
PER SHARE DATA:
Net asset value, beginning of year
Income from investment operations:
Net investment income (loss)
Net realized and unrealized gains on investments
Total from investment operations
Less distributions:
Dividends from net investment income
Dividends from net realized gains
Total distributions
Net asset value, end of year
TOTAL RETURN
SUPPLEMENTAL DATA AND RATIOS:
Net assets, end of year (millions)
Ratio of expenses to average net assets
Ratio of net investment income (loss) to average net assets
Portfolio turnover rate(1)
(1) | Portfolio turnover is calculated on the basis of the Fund as a whole. |
The accompanying notes are an integral part of these financial statements.
| Year Ended October 31, | |
| 2015 | | | 2014 | | | 2013 | | | 2012 | | | 2011 | |
| | | | | | | | | | | | | |
| $ | 19.00 | | | $ | 17.32 | | | $ | 14.06 | | | $ | 12.15 | | | $ | 11.18 | |
| | | | | | | | | | | | | | | | | | | |
| | | | | | | | | | | | | | | | | | | |
| | 0.10 | | | | (0.05 | ) | | | 0.09 | | | | 0.08 | | | | (0.09 | ) |
| | 2.16 | | | | 3.04 | | | | 3.35 | | | | 1.83 | | | | 1.06 | |
| | 2.26 | | | | 2.99 | | | | 3.44 | | | | 1.91 | | | | 0.97 | |
| | | | | | | | | | | | | | | | | | | |
| | | | | | | | | | | | | | | | | | | |
| | — | | | | (0.05 | ) | | | (0.18 | ) | | | — | | | | — | |
| | (1.14 | ) | | | (1.26 | ) | | | — | | | | — | | | | — | |
| | (1.14 | ) | | | (1.31 | ) | | | (0.18 | ) | | | — | | | | — | |
| $ | 20.12 | | | $ | 19.00 | | | $ | 17.32 | | | $ | 14.06 | | | $ | 12.15 | |
| | | | | | | | | | | | | | | | | | | |
| | 12.35 | % | | | 18.25 | % | | | 24.78 | % | | | 15.72 | % | | | 8.68 | % |
| | | | | | | | | | | | | | | | | | | |
| | | | | | | | | | | | | | | | | | | |
| $ | 765.90 | | | $ | 258.17 | | | $ | 159.45 | | | $ | 145.85 | | | $ | 146.23 | |
| | 1.17 | % | | | 1.25 | % | | | 1.31 | % | | | 1.37 | % | | | 1.36 | % |
| | 0.27 | % | | | (0.47 | )% | | | 0.51 | % | | | 0.59 | % | | | (0.79 | )% |
| | 5 | % | | | 132 | % | | | 212 | % | | | 25 | % | | | 107 | % |
The accompanying notes are an integral part of these financial statements.
| HENNESSY FUNDS | 1-800-966-4354 | |
Financial Statements
For an Institutional Class share outstanding throughout each year
PER SHARE DATA:
Net asset value, beginning of year
Income from investment operations:
Net investment income (loss)
Net realized and unrealized gains on investments
Total from investment operations
Less distributions:
Dividends from net investment income
Dividends from net realized gains
Total distributions
Net asset value, end of year
TOTAL RETURN
SUPPLEMENTAL DATA AND RATIOS:
Net assets, end of year (millions)
Ratio of expenses to average net assets:
Before expense reimbursement
After expense reimbursement
Ratio of net investment income to average net assets:
Before expense reimbursement
After expense reimbursement
Portfolio turnover rate(1)
(1) | Portfolio turnover is calculated on the basis of the Fund as a whole. |
The accompanying notes are an integral part of these financial statements.
| Year Ended October 31, | |
| 2015 | | | 2014 | | | 2013 | | | 2012 | | | 2011 | |
| | | | | | | | | | | | | |
| $ | 19.36 | | | $ | 17.62 | | | $ | 14.31 | | | $ | 12.32 | | | $ | 11.29 | |
| | | | | | | | | | | | | | | | | | | |
| | | | | | | | | | | | | | | | | | | |
| | (0.03 | ) | | | (0.08 | ) | | | 0.14 | | | | 0.09 | | | | (0.05 | ) |
| | 2.38 | | | | 3.17 | | | | 3.41 | | | | 1.90 | | | | 1.08 | |
| | 2.35 | | | | 3.09 | | | | 3.55 | | | | 1.99 | | | | 1.03 | |
| | | | | | | | | | | | | | | | | | | |
| | | | | | | | | | | | | | | | | | | |
| | — | | | | (0.09 | ) | | | (0.24 | ) | | | — | | | | — | |
| | (1.16 | ) | | | (1.26 | ) | | | — | | | | — | | | | — | |
| | (1.16 | ) | | | (1.35 | ) | | | (0.24 | ) | | | — | | | | — | |
| $ | 20.55 | | | $ | 19.36 | | | $ | 17.62 | | | $ | 14.31 | | | $ | 12.32 | |
| | | | | | | | | | | | | | | | | | | |
| | 12.62 | % | | | 18.57 | % | | | 25.15 | % | | | 16.15 | % | | | 9.12 | % |
| | | | | | | | | | | | | | | | | | | |
| | | | | | | | | | | | | | | | | | | |
| $ | 306.04 | | | $ | 75.53 | | | $ | 51.19 | | | $ | 41.62 | | | $ | 24.06 | |
| | | | | | | | | | | | | | | | | | | |
| | 0.96 | % | | | 1.07 | % | | | 1.11 | % | | | 1.16 | % | | | 1.14 | % |
| | 0.96 | % | | | 0.98 | % | | | 0.98 | % | | | 0.98 | % | | | 0.98 | % |
| | | | | | | | | | | | | | | | | | | |
| | 0.41 | % | | | (0.29 | )% | | | 0.71 | % | | | 0.90 | % | | | (0.41 | )% |
| | 0.41 | % | | | (0.20 | )% | | | 0.84 | % | | | 1.08 | % | | | (0.57 | )% |
| | 5 | % | | | 132 | % | | | 212 | % | | | 25 | % | | | 107 | % |
The accompanying notes are an integral part of these financial statements.
| HENNESSY FUNDS | 1-800-966-4354 | |
Financial Statements
Notes to the Financial Statements October 31, 2015 |
1). ORGANIZATION
The Hennessy Cornerstone Mid Cap 30 Fund (the “Fund”) is a series of Hennessy Funds Trust (the “Trust”), which was organized as a Delaware statutory trust on September 17, 1992. The Fund is an open-end management investment company registered under the Investment Company Act of 1940, as amended. The Fund is a successor to a fund with the same name (the “Predecessor Fund”) that was a series of Hennessy Mutual Funds, Inc., a Maryland corporation, pursuant to a reorganization that took place after the close of business on February 28, 2014. Prior to February 28, 2014, the Fund had no investment operations. As a result of the reorganization, holders of the Investor Class shares of the Predecessor Fund received Investor Class shares of the Fund (the Investor Class shares of the Fund are the successor to the accounting and performance information of the Predecessor Fund), and holders of the Institutional Class shares of the Predecessor Fund received Institutional Class shares of the Fund (the Institutional Class shares of the Fund are the successor to the accounting and performance information of the Predecessor Fund). The investment objective of the Fund is long-term growth of capital. The Fund is a diversified fund.
| | The Fund offers Investor Class and Institutional Class shares. Each class of shares differs principally in its respective administration, shareholder servicing, and transfer agent expenses and sales charges, if any. Each class has identical rights to earnings, assets, and voting privileges, except for class-specific expenses and exclusive rights to vote on matters affecting only an individual class. |
| | As an investment company, the Fund follows the investment company accounting and reporting guidance of the Financial Accounting Standards Board (“FASB”) Accounting Standard Codification Topic 946 “Financial Services—Investment Companies.” |
2). SIGNIFICANT ACCOUNTING POLICIES
The following is a summary of significant accounting policies consistently followed by the Fund in the preparation of the financial statements. These policies are in conformity with U.S. generally accepted accounting principles (“GAAP”).
| a). | Investment Valuation – All investments in securities are recorded at their estimated fair value, as described in Note 3. |
| b). | Federal Income Taxes – Provision for federal income taxes or excise taxes has not been made since the Fund has elected to be taxed as a “regulated investment company” and intends to distribute substantially all of its taxable income to its shareholders and otherwise comply with the provisions of the Internal Revenue Code of 1986, as amended, applicable to regulated investment companies. Net investment income or loss and realized gains and losses for federal income tax purposes may differ from that reported on the financial statements because of temporary book and tax basis differences. Temporary differences are primarily the result of the treatment of wash sales for tax reporting purposes. The Fund recognizes interest and penalties related to income tax benefits, if any, in the statement of operations as an income tax expense. Distributions from net realized gains for book purposes may include short-term capital gains, which are included as ordinary income to shareholders for tax purposes. |
| c). | Income and Expenses – Dividend income is recognized on the ex-dividend date or as soon as information is available to the Fund. Interest income, which includes the amortization of premium and accretion of discount, is recognized on an accrual basis. The Fund is charged for those expenses that are directly attributable to the portfolio, such as advisory, administration, and certain shareholder service fees. Income, expenses (other than expenses attributable to a specific class), and realized and unrealized gains or losses on investments are allocated to each class of shares based on its respective net assets. |
| d). | Distributions to Shareholders – Dividends from net investment income for the Fund, if any, are declared and paid annually, usually in December. Distributions of net realized capital gains, if any, are declared and paid annually, usually in December. |
| e). | Security Transactions – Investment and shareholder transactions are recorded on the trade date. The Fund determines the gain or loss realized from the investment transactions by comparing the original cost of the security lot sold with the net sale proceeds. Discounts and premiums on securities purchased are accreted/amortized over the life of the respective security. |
| f). | Use of Estimates – The preparation of financial statements in conformity with GAAP requires management to make estimates and assumptions that affect the reported amounts of assets and liabilities and disclosure of contingent assets and liabilities at the date of the financial statements and the reported change in net assets during the reporting period. Actual results could differ from those estimates. |
| g). | Share Valuation – The net asset value (“NAV”) per share of the Fund is calculated by dividing the sum of the value of the securities held by the Fund, plus cash or other assets, minus all liabilities (including estimated accrued expenses) by the total number of shares outstanding for the Fund, rounded to the nearest cent. The Fund’s shares will not be priced on days the New York Stock Exchange is closed for trading. The offering and redemption price per share for the Fund is equal to the Fund’s NAV per share. |
| h). | Repurchase Agreements – The Fund may enter into repurchase agreements with member banks or security dealers of the Federal Reserve Board whom the investment advisor deems creditworthy. The repurchase price generally equals the price paid by the Fund plus interest negotiated on the basis of current short-term rates. |
| | Securities pledged as collateral for repurchase agreements are held by the custodian bank until the respective agreements mature. Provisions of the repurchase agreements ensure that the market value of the collateral, including accrued interest thereon, is sufficient to cover the repurchase amount in the event of default of the counterparty. If the counterparty defaults and the value of the collateral declines or if the counterparty enters an insolvency proceeding, realization of the collateral by the Fund may be delayed or limited. |
| i). | Accounting for Uncertainty in Income Taxes – The Fund has accounting policies regarding recognition and measurement of tax positions taken or expected to be taken on a tax return. The tax returns of the Fund for the prior three fiscal years are open for examination. The Fund has reviewed all open tax years in major jurisdictions and concluded that there is no impact on the Fund’s net assets and no tax liability resulting from unrecognized tax benefits relating to uncertain income tax positions taken or expected to be taken on a tax return. The Fund’s major tax jurisdictions are U.S. federal and Delaware. |
| j). | Derivatives – The Fund may invest in, or enter into, derivatives, such as options, futures contracts, options on futures contracts, and swaps, for a variety of reasons, |
| HENNESSY FUNDS | 1-800-966-4354 | |
| | including to hedge certain risks, to provide a substitute for purchasing or selling particular securities, or to increase potential income gain. Derivatives may provide a cheaper, quicker, or more specifically focused way for a Fund to invest than “traditional” securities would. The main purpose of utilizing these derivative instruments is for hedging purposes. |
| | The Fund follows the financial accounting reporting rules as required by the Derivatives and Hedging Topic of the FASB Accounting Standards Codification. Under such rules, the Fund is required to include enhanced disclosure that enables investors to understand how and why an entity uses derivatives, how derivatives are accounted for, and how derivatives instruments affect an entity’s results of operations and financial position. During the fiscal year ended October 31, 2015, the Fund did not hold any derivative instruments. |
| k). | New Accounting Pronouncements – In June 2014, the FASB issued Accounting Standards Update (“ASU”) No. 2014-11 “Repurchase-to Maturity Transactions, Repurchase Financings, and Disclosures.” The amendments in this ASU require an entity to modify accounting for repurchase-to-maturity transactions and repurchase financing arrangements, as well as modify required disclosures for repurchase agreements, securities lending transactions, and repurchase-to-maturity transactions that are accounted for as secured borrowings. The guidance is effective for fiscal years beginning on or after December 15, 2014, and for interim periods within those fiscal years. Management is currently evaluating the impact these changes will have on the Fund’s financial statement disclosures. |
| | In May 2015, the FASB issued ASU No. 2015-07 “Disclosure for Investments in Certain Entities that Calculate Net Asset Value per Share (or Its Equivalent).” The amendments in ASU No. 2015-07 remove the requirement to categorize within the fair value hierarchy investments measured at NAV and require the disclosure of sufficient information to reconcile the fair value of the remaining assets categorized within the fair value hierarchy to the financial statements. The amendments in ASU No. 2015-07 are effective for fiscal years beginning after December 15, 2015, and interim periods within those fiscal years. Management has reviewed the requirements and believes the adoption of ASU 2015-07 will not have a material impact on the Fund’s financial statements and related disclosures. |
3). SECURITIES VALUATION
The Fund follows authoritative fair valuation accounting standards that establish an authoritative definition of fair value and set out a hierarchy for measuring fair value. These standards require additional disclosures about the various inputs and valuation techniques used to develop the measurements of fair value and a discussion in changes in valuation techniques and related inputs during the period. These inputs are summarized in the three broad levels listed below:
| | Level 1 – | Quoted unadjusted prices for identical instruments in active markets to which the Fund has access at the date of measurement. |
| | Level 2 – | Quoted prices for similar instruments in active markets; quoted prices for identical or similar instruments in markets that are not active; and model-derived valuations in which all significant inputs and significant value drivers are observable in active markets. Level 2 inputs are those in markets for which there are few transactions, the prices are not current, the prices are fair value adjusted due to post-market close subsequent events (foreign markets), little public information exists, or instances where prices |
| | | vary substantially over time or among brokered market makers. These inputs may also include interest rates, prepayment speeds, credit risk curves, default rates, and similar data. |
| | Level 3 – | Model-derived valuations in which one or more significant inputs or significant value drivers are unobservable. Unobservable inputs are those inputs that reflect the Fund’s own assumptions about what market participants would use to price the asset or liability based on the best available information. |
Following is a description of the valuation techniques applied to the Fund’s major categories of assets and liabilities measured at fair value on a recurring basis.
Equity Securities – Equity securities, including common stocks, preferred stocks, exchange-traded funds, closed-end mutual funds, partnerships, rights, and real estate investment trusts, that are traded on a securities exchange for which a last-quoted sales price is readily available will generally be valued at the last sales price as reported by the primary exchange on which the securities are listed. Securities listed on The NASDAQ Stock Market (“NASDAQ”) will generally be valued at the NASDAQ Official Closing Price, which may differ from the last sales price reported. Securities traded on a securities exchange for which a last-quoted sales price is not readily available will generally be valued at the mean between the bid and ask prices. To the extent these securities are actively traded and valuation adjustments are not applied, they are classified in Level 1 of the fair value hierarchy.
Registered Investment Companies – Investments in registered investment companies (e.g., mutual funds) are generally priced at the ending NAV provided by the applicable registered investment company’s service agent and will be classified in Level 1 of the fair value hierarchy.
Debt Securities – Debt securities, including corporate bonds, asset-backed securities, mortgage-backed securities, municipal bonds, U.S. Treasuries, and U.S. government agency issues, are generally valued at market on the basis of valuations furnished by an independent pricing service that utilizes both dealer-supplied valuations and formula-based techniques. The pricing service may consider recently executed transactions in securities of the issuer or comparable issuers, market price quotations (where observable), bond spreads, and fundamental data relating to the issuer. In addition, the model may incorporate market observable data such as reported sales of similar securities, broker quotes, yields, bids, offers, and reference data. Certain securities are valued principally using dealer quotations. These securities are generally classified in Level 2 of the fair value hierarchy.
Short-Term Securities – Short-term equity investments, including money market funds, are valued in the manner specified above. Short-term debt investments are generally valued at amortized cost, which approximates fair market value, if their original term to maturity was 60 days or less, or by amortizing the values as of the 61st day prior to maturity, if their original term to maturity exceeded 60 days. Amortized cost is not used if its use would be inappropriate due to credit or other impairments of the issuer, in which case the security’s fair value would be determined, as described below. Short-term securities are generally classified in Level 1 or Level 2 of the fair market hierarchy depending on the inputs used and market activity levels for specific securities.
The Board of Trustees of the Fund (the “Board”) has adopted fair value pricing procedures that are followed when a price for a security is not readily available or if a significant event has occurred that indicates the closing price of a security no longer represents the true value of that security. Fair value pricing determinations are made in
| HENNESSY FUNDS | 1-800-966-4354 | |
good faith in accordance with these procedures. There are numerous criteria that will be given consideration in determining a fair value of a security. Some of these criteria are trading volume of a security and markets, the value of other like securities, and news events with direct bearing to a security or markets. Fair value pricing results in an estimated price for a security that reflects the amount the Fund might reasonably expect to receive in a current sale. Depending on the relative significance of the valuation inputs, these securities may be classified in either Level 2 or Level 3 of the fair value hierarchy.
The Board has delegated day-to-day valuation matters to a Valuation Committee comprised of one or more representatives from Hennessy Advisors, Inc., the Fund’s investment advisor. The function of the Valuation Committee is to value securities where current and reliable market quotations are not readily available. All actions taken by the Valuation Committee are reviewed by the Board.
The Fund has performed an analysis of all existing investments to determine the significance and character of all inputs to their fair value determination. Various inputs are used in determining the value of the Fund’s investments. The inputs or methodology used for valuing securities are not necessarily an indication of the risk associated with investing in those securities. Details related to the fair valuation hierarchy of the Fund’s securities as of October 31, 2015 are included in the Fund’s Schedule of Investments.
4). INVESTMENT TRANSACTIONS
Purchases and sales of investment securities (excluding government and short-term investments) for the Fund during the fiscal year ended October 31, 2015 were $688,467,737 and $26,903,640, respectively.
There were no purchases or sales/maturities of long-term U.S. Government Securities for the Fund during the fiscal year ended October 31, 2015.
5). INVESTMENT MANAGEMENT FEE AND OTHER TRANSACTIONS WITH AFFILIATES
Hennessy Advisors, Inc. (the “Advisor”) is the investment advisor of the Fund. The Advisor provides the Fund with investment management services under an Investment Advisory Agreement. The Advisor furnishes all investment advice, office space, facilities, and provides most of the personnel needed by the Fund. As compensation for its services, the Advisor is entitled to a monthly fee from the Fund. The fee is based upon the average daily net assets of the Fund at the annual rate of 0.74%. The net investment advisory fees payable by the Fund as of October 31, 2015 were $643,549.
In the past, the Advisor has agreed to waive its fees and absorb expenses to the extent that the total annual operating expenses (excluding all federal, state and local taxes, interest, brokerage commissions, acquired fund fees and expenses and other costs incurred in connection with the purchase and sale of securities and extraordinary items) exceeded 0.98% of the Fund’s net assets for the Institutional Class shares of the Fund. The expense limitation agreement for the Institutional Class shares could only be terminated by the Board and was terminated by the Board as of February 28, 2015.
For a period of three years after the year in which the Advisor waived or reimbursed expenses, the Advisor may seek reimbursement from the Fund to the extent that total annual fund operating expenses are less than the expense limitation that was in effect at the time the Advisor waived or reimbursed expenses. During the three years ended October 31, 2015, no expenses were waived or reimbursed by the Advisor and therefore no expenses are subject to potential recovery.
The Board has approved a Shareholder Servicing Agreement for the Investor Class shares of the Fund, which was instituted to compensate the Advisor for the non-investment management services it provides to the Fund. The Shareholder Servicing
Agreement provides for a monthly fee paid to the Advisor at an annual rate of 0.10% of the average daily net assets of the Fund attributable to Investor Class shares. Shareholder service fees payable by the Fund as of October 31, 2015 were $61,932.
The Fund has entered into agreements with various brokers, dealers, and financial intermediaries in connection with the sale of shares of the Fund. The agreements provide for periodic payments by the Fund to the brokers, dealers, and financial intermediaries for providing certain shareholder maintenance services (sub-transfer agent expenses). These shareholder services include the pre-processing and quality control of new accounts, shareholder correspondence, answering customer inquiries regarding account status, and facilitating shareholder telephone transactions. Fees paid by the Fund to various brokers, dealers, and financial intermediaries during the fiscal year ended October 31, 2015 were $1,008,733.
U.S. Bancorp Fund Services, LLC (“USBFS”) provides the Fund with administrative, fund accounting, and transfer agent services, including all regulatory reporting, and necessary office equipment and personnel. As administrator, USBFS is responsible for activities such as (i) preparing various federal and state regulatory filings, reports, and returns for the Fund, (ii) preparing reports and materials to be supplied to the Board, (iii) monitoring the activities of the Fund’s custodian, transfer agent, and accountants, and (iv) coordinating the preparation and payment of the Fund’s expenses and reviewing the Fund’s expense accruals. Fees paid to USBFS during the fiscal year ended October 31, 2015 were $596,880.
U.S. Bank, N.A., an affiliate of USBFS, serves as the Fund’s custodian. Quasar Distributors, LLC acts as the Fund’s principal underwriter in a continuous public offering of the Fund’s shares. Quasar Distributors, LLC is an affiliate of USBFS and U.S. Bank, N.A.
6). LINE OF CREDIT
The Fund has an uncommitted line of credit with the other funds in the Hennessy Funds family of funds (the “Hennessy Funds”) in the amount of the lesser of (i) $100,000,000 or (ii) 33.33% of each Hennessy Fund’s net assets, or 30% for the Hennessy Gas Utility Fund and 10% for the Hennessy Balanced Fund, intended to provide short-term financing, if necessary, subject to certain restrictions, in connection with shareholder redemptions. The credit facility is with the Hennessy Funds’ custodian bank, U.S. Bank, N.A. Borrowings under this arrangement bear interest at the bank’s prime rate and are secured by all of the Fund’s assets (as to its own borrowings only). During the fiscal year ended October 31, 2015, the Fund did not have any borrowings outstanding under the line of credit.
7). FEDERAL TAX INFORMATION
As of October 31, 2015, the components of accumulated earnings (losses) for income tax purposes were as follows:
| | Cost of investments for tax purposes | | $ | 1,018,008,256 | |
| | Gross tax unrealized appreciation | | $ | 105,116,797 | |
| | Gross tax unrealized depreciation | | | (63,529,121 | ) |
| | Net tax unrealized appreciation | | $ | 41,587,676 | |
| | Undistributed ordinary income | | $ | 8,448,767 | |
| | Undistributed long-term capital gains | | | — | |
| | Total distributable earnings | | $ | 8,448,767 | |
| | Other accumulated loss | | $ | (493,671 | ) |
| | Total accumulated gain | | $ | 49,542,772 | |
The difference between book-basis and tax-basis unrealized appreciation is attributable primarily to wash sales.
| HENNESSY FUNDS | 1-800-966-4354 | |
At October 31, 2015, the Fund had capital loss carryforwards of $493,671 that expire on October 31, 2016.
During the fiscal year ended October 31, 2015, the capital loss carry forwards utilized for the Fund were $493,673.
Capital losses sustained in the fiscal year ended October 31, 2012 and in future taxable years will not expire and may be carried over by the Fund without limitation; however, they will retain the character of the original loss. Furthermore, any loss incurred during those taxable years will be required to be utilized prior to the losses incurred in taxable years prior to 2012. As a result of this ordering rule, pre-enactment capital loss carryforwards may be more likely to expire unused. Under pre-enactment law, capital losses could be carried forward for eight years, and carried forward as short-term capital losses, irrespective of the character of the original loss.
At October 31, 2015, the Fund did not defer, on a tax basis, any post-December late year ordinary loss deferrals.
The tax character of distributions paid during fiscal year 2015 and fiscal year 2014 for the Fund were as follows:
| | | | Year Ended | | | Year Ended | |
| | | | October 31, 2015 | | | October 31, 2014 | |
| | Ordinary income | | $ | 44,515 | | | $ | 724,245 | |
| | Long-term capital gain | | | 20,622,992 | | | | 15,252,708 | |
| | | | $ | 20,667,507 | | | $ | 15,976,953 | |
8). EVENTS SUBSEQUENT TO YEAR END
Management has evaluated the Fund’s related events and transactions that occurred subsequent to October 31, 2015, through the date of issuance of the Fund’s financial statements. Other than as disclosed below, management has determined that there were no subsequent events requiring recognition or disclosure in the financial statements.
On December 9, 2015, capital gains were declared and paid to shareholders of record as of December 8, 2015 as follows:
| | | Short-term | |
| | Investor Class | $0.14238 | |
| | Institutional Class | $0.14547 | |
Effective November 1, 2015, the Fund adopted a plan pursuant to Rule 12b-1 under the Investment Company Act of 1940, as amended, that authorizes payments in connection with the distribution of the Fund’s shares at an annual rate of up to 0.25% of the Fund’s average daily net assets attributable to Investor Class shares. Even though the authorized rate is up to 0.25%, the Fund has only used 0.15% of its average daily net assets attributable to Investor Class shares for such purpose since the plan was implemented on November 1, 2015. Amounts paid under the plan may be spent on any activities or expenses primarily intended to result in the sale of shares, including but not limited to, advertising, compensation for sales and marketing activities or to financial institutions and others, such as dealers and distributors, shareholder account servicing, the printing and mailing of prospectuses to other than current shareholders, and the printing and mailing of sales literature.
Report of Independent Registered Public Accounting Firm
To the Board of Trustees of Hennessy Funds Trust
and the Shareholders of the Hennessy Cornerstone Mid Cap 30 Fund:
We have audited the accompanying statement of assets and liabilities of Hennessy Cornerstone Mid Cap 30 Fund (the Fund), a series of Hennessy Funds Trust, including the schedule of investments, as of October 31, 2015, and the related statement of operations for the year then ended, the statements of changes in net assets for each of the years in the two-year period then ended, and the financial highlights for each of the years in the five-year period then ended. These financial statements and financial highlights are the responsibility of the Fund’s management. Our responsibility is to express an opinion on these financial statements and financial highlights based on our audits.
We conducted our audits in accordance with the standards of the Public Company Accounting Oversight Board (United States). Those standards require that we plan and perform the audit to obtain reasonable assurance about whether the financial statements and financial highlights are free of material misstatement. An audit includes examining, on a test basis, evidence supporting the amounts and disclosures in the financial statements. Our procedures included confirmation of investments owned as of October 31, 2015, by correspondence with the custodian and brokers or by other appropriate auditing procedures. An audit also includes assessing the accounting principles used and significant estimates made by management, as well as evaluating the overall financial statement presentation. We believe that our audits provide a reasonable basis for our opinion.
In our opinion, the financial statements and financial highlights referred to above present fairly, in all material respects, the financial position of the Fund as of October 31, 2015, and the results of its operations for the year then ended, the changes in its net assets for each of the years in the two-year period then ended, and the financial highlights for each of the years in the five-year period then ended, in conformity with U.S. generally accepted accounting principles.
Milwaukee, Wisconsin
December 23, 2015
| HENNESSY FUNDS | 1-800-966-4354 | |
Trustees and Officers of the Fund (Unaudited)
The business and affairs of the Fund are managed under the direction of the Board of Trustees of the Trust, and the Board of Trustees elects the Officers of the Trust. Information pertaining to the Trustees and the Officers of the Trust is set forth below. Such persons serve until their successors are duly elected and qualified or until their earlier death, resignation, or removal. Each of the Trustees oversees 16 Hennessy Funds. Unless otherwise indicated, the address of all persons listed below is 7250 Redwood Boulevard, Suite 200, Novato, CA 94945. The Fund’s Statement of Additional Information includes more information about the persons listed below and is available, without charge, upon request by calling 1-800-966-4354.
| | | | Other |
| | | | Directorships |
| Name, Year of Birth, | | | (During Past |
| and Position Held | Length of | Principal Occupation(s) | Five Years) |
with the Trust | Time Served | During Past Five Years | Held by Trustee(1) |
| | | | |
| Disinterested Trustees | | | |
| | | | |
| J. Dennis DeSousa (1936) | Since January | Mr. DeSousa is a real estate investor. | Hennessy SPARX |
| Trustee | 1996 for the | | Funds Trust; |
| | Hennessy Funds | | Hennessy Mutual |
| | | | Funds, Inc.; and |
| | | | The Hennessy |
| | | | Funds, Inc. |
| | | | |
| Robert T. Doyle (1947) | Since January | Mr. Doyle has been the Sheriff of | Hennessy SPARX |
| Trustee | 1996 for the | Marin County, California since 1996. | Funds Trust; |
| | Hennessy Funds | | Hennessy Mutual |
| | | | Funds, Inc.; and |
| | | | The Hennessy |
| | | | Funds, Inc. |
| | | | |
| Gerald P. Richardson (1945) | Since May | Mr. Richardson is an independent | Hennessy SPARX |
| Trustee | 2004 for the | consultant in the securities industry. | Funds Trust; |
| | Hennessy Funds | | Hennessy Mutual |
| | | | Funds, Inc.; and |
| | | | The Hennessy |
| | | | Funds, Inc. |
Interested Trustee(2) | | | |
| | | | |
| Neil J. Hennessy (1956) | Since January | Mr. Hennessy has been employed by | Hennessy Advisors, |
| Trustee, Chairman of | 1996 as a Trustee | Hennessy Advisors, Inc., the Funds’ | Inc.; Hennessy |
| the Board, Chief | for the Hennessy | investment advisor, since 1989. | SPARX Funds Trust; |
| Investment Officer, | Funds and since | He currently serves as President, | Hennessy Mutual |
| Portfolio Manager, | June 2008 as | Chairman and Chief Executive Officer | Funds, Inc.; and |
| and President | an Officer of the | of Hennessy Advisors, Inc. | The Hennessy |
| | Hennessy Funds | | Funds, Inc. |
| Name, Year of Birth, | | |
| and Position Held | Length of | Principal Occupation(s) |
with the Trust | Time Served | During Past Five Years |
| | | |
| Officers | | |
| | | |
| Teresa M. Nilsen (1966) | Since January | Ms. Nilsen has been employed by Hennessy Advisors, Inc., |
| Executive Vice President | 1996 for the | the Funds’ investment advisor, since 1989. She currently |
| and Treasurer | Hennessy Funds | serves as Executive Vice President, Chief Operations Officer, |
| | | Chief Financial Officer, and Secretary of Hennessy Advisors, Inc. |
| | | |
| Daniel B. Steadman (1956) | Since March | Mr. Steadman has been employed by Hennessy Advisors, Inc., |
| Executive Vice President | 2000 for the | the Funds’ investment advisor, since 2000. He currently serves |
| and Secretary | Hennessy Funds | as Executive Vice President and Chief Compliance Officer of |
| | | Hennessy Advisors, Inc. |
| | | |
| Jennifer Cheskiewicz (1977) | Since June | Ms. Cheskiewicz has been employed by Hennessy Advisors, |
| Senior Vice President and | 2013 for the | Inc., the Funds’ investment advisor, since June 2013. She |
| Chief Compliance Officer | Hennessy Funds | currently serves as General Counsel of Hennessy Advisors, Inc. |
| | | |
| | | She previously served as in-house counsel to Carlson Capital, |
| | | L.P., an SEC-registered investment advisor to several private |
| | | funds from February 2010 to May 2013. |
| | | |
| Brian Carlson (1972) | Since December | Mr. Carlson has been employed by Hennessy Advisors, Inc., the |
| Senior Vice President and | 2013 for the | Funds’ investment advisor, since December 2013. |
| Head of Distribution | Hennessy Funds | |
| | | Mr. Carlson was previously a co-founder and principal of |
| | | Trivium Consultants, LLC from February 2011 through |
| | | November 2013. |
| | | |
David Ellison (1958)(3) | Since October | Mr. Ellison has served as a Portfolio Manager of the Hennessy |
| Senior Vice President and | 2012 for the | Small Cap Financial Fund, the Hennessy Large Cap Financial |
| Portfolio Manager | Hennessy Funds | Fund, and the Hennessy Technology Fund since inception. |
| | | |
| | | Mr. Ellison previously served as Director, CIO and President of |
| | | FBR Fund Advisers, Inc. from December 1999 to October 2012. |
| | | |
| Brian Peery (1969) | Since March | Mr. Peery has served as a Portfolio Manager of the Hennessy |
| Senior Vice President and | 2003 as an | Cornerstone Growth Fund, the Hennessy Cornerstone Mid Cap |
| Portfolio Manager | Officer of the | 30 Fund, the Hennessy Cornerstone Large Growth Fund, the |
| | Hennessy Funds | Hennessy Cornerstone Value Fund, the Hennessy Total Return |
| | and since | Fund, and the Hennessy Balanced Fund since October 2014. |
| | February 2011 | From February 2011 through September 2014, he served as |
| | as a Co-Portfolio | Co-Portfolio Manager of the same funds. Mr. Peery has also |
| | Manager or | served as a Portfolio Manager of the Hennessy Gas Utility Fund |
| | Portfolio Manager | since February 2015. |
| | for the | |
| | Hennessy Funds | Mr. Peery has been employed by Hennessy Advisors, Inc., the |
| | | Funds’ investment advisor, since 2002. |
| | | |
| Winsor (Skip) Aylesworth | Since October | Mr. Aylesworth has served as a Portfolio Manager of the |
(1947)(3) | 2012 for the | Hennessy Gas Utility Fund since 1998 and as a Portfolio |
| Vice President and | Hennessy Funds | Manager of the Hennessy Technology Fund since inception. |
| Portfolio Manager | | |
| | Mr. Aylesworth previously served as Executive Vice President |
| | | of The FBR Funds from 1999 to October 2012. |
| HENNESSY FUNDS | 1-800-966-4354 | |
| Name, Year of Birth, | | |
| and Position Held | Length of | Principal Occupation(s) |
| with the Trust | Time Served | During Past Five Years |
Ryan Kelley (1972)(4) | Since March | Mr. Kelley has served as a Portfolio Manager of the Hennessy |
| Vice President and | 2013 for the | Gas Utility Fund, the Hennessy Small Cap Financial Fund, and |
| Portfolio Manager | Hennessy Funds | the Hennessy Large Cap Financial Fund since October 2014. |
| | | From March 2013 through September 2014, he served as a |
| | | Co-Portfolio Manager of the same funds. Prior to that, |
| | | he was a Portfolio Analyst of the Hennessy Funds. |
(1) | Pursuant to an internal reorganization, the series of Hennessy Mutual Funds, Inc. (“HMFI”), The Hennessy Funds, Inc. (“HFI”), and Hennessy SPARX Funds Trust (“HSFT”) were reorganized into series of Hennessy Funds Trust on February 28, 2014, which mirrored the corresponding series of HFMI, HFI, and HSFT. Subsequent to the reorganization, HFMI, HFI, and HSFT were dissolved. |
(2) | Mr. Hennessy is considered an “interested person,” as defined in the Investment Company Act of 1940, as amended, because he is an officer of the Hennessy Funds. |
(3) | The address of these officers is 101 Federal Street, Suite 1900, Boston, MA 02110. |
(4) | The address of this officer is 1340 Environ Way, Chapel Hill, NC 27517. |
(This Page Intentionally Left Blank.)-
| HENNESSY FUNDS | 1-800-966-4354 | |
Expense Example (Unaudited)
October 31, 2015
As a shareholder of the Fund, you incur two types of costs: (1) transaction costs, including sales charges (loads) on purchase payments, reinvested dividends, or other distributions; redemption fees; and exchange fees; and (2) ongoing costs, including management fees; service fees; and other Fund expenses. This Example is intended to help you understand your ongoing costs (in dollars) of investing in the Fund and to compare these costs with the ongoing costs of investing in other mutual funds. The Example is based on an investment of $1,000 invested at the beginning of the period and held for the entire period from May 1, 2015 through October 31, 2015.
Actual Expenses
The first line of the table below under the “Investor Class” and “Institutional Class” headings provides information about actual account values and actual expenses. Although the Fund charges no sales loads or transaction fees, you will be assessed fees for outgoing wire transfers, returned checks and stop payment orders at prevailing rates charged by U.S. Bancorp Fund Services, LLC, the Fund’s transfer agent. If you request that a redemption be made by wire transfer, currently a $15.00 fee is charged by the Fund’s transfer agent. IRA accounts will be charged a $15.00 annual maintenance fee. The example below includes, but is not limited to, management fees, shareholder servicing fees, fund accounting, custody, and transfer agent fees. However, the example below does not include portfolio trading commissions and related expenses, and other extraordinary expenses as determined under generally accepted accounting principles. You may use the information in this line, together with the amount you invested, to estimate the expenses that you paid over the period. Simply divide your account value by $1,000 (for example, an $8,600 account value divided by $1,000 = 8.6), then multiply the result by the number in the first line of the table under the “Investor Class” and “Institutional Class” headings in the column entitled “Expenses Paid During Period” to estimate the expenses you paid on your account during this period.
Hypothetical Example for Comparison Purposes
The second line of the table below under the “Investor Class” and “Institutional Class” headings provides information about hypothetical account values and hypothetical expenses based on the Fund’s actual expense ratios and an assumed rate of return of 5% per year before expenses, which is not the Fund’s actual return. The hypothetical account values and expenses may not be used to estimate the actual ending account balance or expenses you paid for the period. You may use this information to compare the ongoing costs of investing in the Fund and other funds. To do so, compare this 5% hypothetical example with the 5% hypothetical examples that appear in the shareholder reports of the other funds. Please note that the expenses shown in the table are meant to highlight your ongoing costs only and do not reflect any transactional costs, such as sales charges (loads), or exchange fees. Therefore, the second line of the table under the “Investor Class” and “Institutional Class” headings is useful in comparing ongoing costs only, and will not help you determine the relative total costs of owning different funds. In addition, if these transactional costs were included, your costs would have been higher.
| | | | Expenses Paid |
| | Beginning | Ending | During Period(1) |
| | Account Value | Account Value | May 1, 2015 – |
| | May 1, 2015 | October 31, 2015 | October 31, 2015 |
| Investor Class | | | |
| Actual | $1,000.00 | $1,024.40 | $5.97 |
| Hypothetical (5% return before expenses) | $1,000.00 | $1,019.31 | $5.96 |
| Institutional Class | | | |
| Actual | $1,000.00 | $1,025.40 | $4.95 |
| Hypothetical (5% return before expenses) | $1,000.00 | $1,020.32 | $4.94 |
(1) | Expenses are equal to the Fund’s annualized expense ratio of 1.17% for Investor Class shares or 0.97% for Institutional Class shares, as applicable, multiplied by the average account value over the period, multiplied by 184/365 days (to reflect one-half year period). |
| HENNESSY FUNDS | 1-800-966-4354 | |
How to Obtain a Copy of the Fund’s
Proxy Voting Policy and Proxy Voting Records
A description of the policies and procedures the Fund uses to determine how to vote proxies relating to portfolio securities is available without charge: (1) by calling 1-800-966-4354; (2) on the Hennessy Funds’ website at hennessyfunds.com/proxy-voting/policy.fs; or (3) on the U.S. Securities and Exchange Commission’s website at www.sec.gov. The Fund’s proxy voting record is available without charge on both the Hennessy Funds’ website at hennessyfunds.com/proxy-voting/policy.fs and the SEC’s website at www.sec.gov no later than August 31 for the prior 12 months ending June 30.
Quarterly Filings on Form N-Q
The Fund files its complete schedule of portfolio holdings with the SEC for the first and third quarters of each fiscal year on Form N-Q. The Fund’s Form N-Q will be available on the SEC’s website at www.sec.gov. The Fund’s Form N-Q may be reviewed and copied at the SEC’s Public Reference Room in Washington, DC and information on the operation of the Public Reference Room may be obtained by calling 1-800-SEC-0330. Information included in the Fund’s N-Q will also be available upon request by calling 1-800-966-4354.
Federal Tax Distribution Information
(Unaudited)
For the fiscal year ended October 31, 2015, certain dividends paid by the Fund may be subject to a maximum tax rate of 23.8%, as provided for by the Jobs and Growth Tax Relief Reconciliation Act of 2003. The percentage of dividends declared from ordinary income designated as qualified dividend income was 99.78%.
For corporate shareholders, the percent of ordinary income distributions that qualified for the corporate dividends received deduction for the fiscal year ended October 31, 2015 was 99.78%.
The percentage of taxable ordinary income distributions that are designated as short-term capital gain distributions under Section 871(k)(2)(C) of the Internal Revenue Code of 1986, as amended, for the Fund was 100.00%.
Householding
To help keep the Fund’s costs as low as possible, we generally deliver a single copy of most financial reports and prospectuses to shareholders who share an address, even if the accounts are registered under different names. This process, known as “householding,” does not apply to account statements. You may, of course, request an individual copy of a prospectus or financial report at any time. If you would like to receive separate mailings, please call the Administrator at 1-800-261-6950 or 1-414-765-4124 and we will begin individual delivery within 30 days of your request. If your account is held through a financial institution or other intermediary, please contact them directly to request individual delivery.
Matters Submitted to a Shareholder Vote
A special meeting of shareholders of the Investor Class shares of the Fund was held on October 2, 2015, and the following matters were approved by the Fund’s voting Investor Class shares:
| | | | | Broker |
| | For | Against | Abstain | Nonvotes |
| To approve a distribution | | | | |
| (Rule 12b-1) plan for the | | | | |
| Investor Class shares of the Fund | 7,535,374.144 | 1,625,052.208 | 319,146.384 | 1,090,038.000 |
Privacy Policy
We collect the following non-public personal information about you:
| | • | information we receive from you on or in applications or other forms, correspondence, or conversations, including, but not limited to, your name, address, phone number, social security number, assets, income, and date of birth; and |
| | • | information about your transactions with us, our affiliates, or others, including, but not limited to, your account number and balance, payment history, parties to transactions, cost basis information, and other financial information. |
We do not disclose any non-public personal information about our current or former shareholders to nonaffiliated third parties, except as permitted by law. For example, we are permitted by law to disclose all of the information we collect, as described above, to our Transfer Agent to process your transactions. Furthermore, we restrict access to your non-public personal information to those persons who require such information to provide products or services to you. We maintain physical, electronic, and procedural safeguards that comply with federal standards to guard your non-public personal information.
In the event that you hold shares of the Fund through a financial intermediary, including, but not limited to, a broker-dealer, bank or trust company, the privacy policy of your financial intermediary would govern how your non-public personal information would be shared with nonaffiliated third parties.
| HENNESSY FUNDS | 1-800-966-4354 | |
For information, questions or assistance, please call
The Hennessy Funds
1-800-966-4354 or 1-415-899-1555
INVESTMENT ADVISOR
Hennessy Advisors, Inc.
7250 Redwood Blvd., Suite 200
Novato, California 94945
ADMINISTRATOR,
TRANSFER AGENT,
DIVIDEND PAYING AGENT &
SHAREHOLDER SERVICING AGENT
U.S. Bancorp Fund Services, LLC
P.O. Box 701
Milwaukee, Wisconsin 53201-0701
CUSTODIAN
U.S. Bank N.A.
Custody Operations
1555 North River Center Dr., Suite 302
Milwaukee, Wisconsin 53212
TRUSTEES
Neil J. Hennessy
Robert T. Doyle
J. Dennis DeSousa
Gerald P. Richardson
COUNSEL
Foley & Lardner LLP
777 East Wisconsin Avenue
Milwaukee, Wisconsin 53202-5306
INDEPENDENT REGISTERED
PUBLIC ACCOUNTING FIRM
KPMG LLP
777 East Wisconsin Avenue
Milwaukee, Wisconsin 53202-5306
DISTRIBUTOR
Quasar Distributors, LLC
615 East Michigan Street
Milwaukee, Wisconsin 53202
hennessyfunds.com | 1-800-966-4354
This report has been prepared for shareholders and may be distributed to
others only if preceded or accompanied by a current prospectus.
ANNUAL REPORT
OCTOBER 31, 2015
HENNESSY CORNERSTONE
LARGE GROWTH FUND
Investor Class HFLGX
Institutional Class HILGX
| hennessyfunds.com | 1-800-966-4354 |
(This Page Intentionally Left Blank.)
Contents
| Letter to Shareholders | 2 |
| Performance Overview | 4 |
| Financial Statements | |
| Schedule of Investments | 7 |
| Statement of Assets and Liabilities | 11 |
| Statement of Operations | 12 |
| Statements of Changes in Net Assets | 13 |
| Financial Highlights | 14 |
| Notes to the Financial Statements | 18 |
| Report of Independent Registered Public Accounting Firm | 25 |
| Trustees and Officers of the Fund | 26 |
| Expense Example | 30 |
| Proxy Voting | 32 |
| Quarterly Filings on Form N-Q | 32 |
| Federal Tax Distribution Information | 32 |
| Householding | 32 |
| Matters Submitted to a Shareholder Vote | 33 |
| Privacy Policy | 33 |
| HENNESSY FUNDS | 1-800-966-4354 | |
December 2015
Dear Hennessy Funds Shareholder:
As I look back over the year, I am reminded that the U.S. economy has come a long way since the depths of the recession in 2009. The economy has been expanding steadily for almost six years, the unemployment rate has halved, the housing market has been recovering and capital expenditures have been growing. The financial markets have performed well too, driven largely by strong corporate earnings growth, especially in the early years. The U.S. market, as measured by the S&P 500 Index, has roughly tripled since the bull market began in 2009, and the Index’s earnings per share have increased 260% over this same time period. For the year ended October 31, 2015, the U.S. equity market performed reasonably well, with the S&P 500 posting another advance of 5.2%. However, behind this headline number, the market experienced a great deal of volatility as investors reacted to falling energy prices, a rise in the U.S. Dollar, pressure on export earnings growth, slower growth in China and, most significantly, the likelihood of a rise in the Fed Funds rate for the first time in nearly a decade – the featured topic of conversation around every office water cooler in the financial world this year.
Investors, reporters and friends often ask me “What’s next?” The market has been in a volatile, sideways correction for over a year now, and throughout this period of volatility, I have consistently advised investors to continue to focus on the long-term fundamentals of the market.
In my view, the fundamentals of the market are in good shape. Despite a stronger U.S. Dollar and its impact on export growth, the economy is still growing steadily. Inflation remains low, so we expect the Federal Reserve, once it does begin to raise short-term interest rates, will not likely raise them by very much. New jobs are being created at what I believe is a healthy rate, and average hourly wages are rising in response to a tighter labor market. Higher wages and lower gasoline prices are helping to keep consumer confidence positive.
Notwithstanding what I view as a relatively solid economic environment, however, I think investor sentiment remains restrained. The same factors that contributed to the market volatility this past year are still troubling investors today: the slowdown in the Chinese economy, slower earnings growth here in the U.S., and, of course, the prospect of rising interest rates. As a result of these investor worries, I do not see any solid enthusiasm for the market – no euphoria. Universal optimism about the market often coincides with a peak in stock prices and this absence of euphoria is yet another reason I feel bullish. And finally, I do not believe stocks are expensive. The Dow Jones Industrial Average and the S&P 500 Index have forward PE (price-to-earnings) ratios of approximately 16x and 17x, respectively, close to long-term averages. In my view, these fundamentals taken together signal a continuation of the bull market that began six years ago.
A final positive note: I still do not believe that investors have fully returned to investing in U.S. equities. Assets in domestic equity funds have now reached parity with fixed income/money market funds, with $6.2 trillion in each. I believe that fixed income investments will continue to trickle into equities, which should have a positive effect on the market.
Thank you for your continued confidence and investment in our products. If you have any questions or would like to speak with us directly, please don’t hesitate to call us at (800) 966-4354.
Best regards,
Neil J. Hennessy
President and Chief Investment Officer
Past performance does not guarantee future results.
Mutual fund investing involves risk. Principal loss is possible.
Opinions expressed are those of Neil Hennessy and are subject to change, are not guaranteed and should not be considered investment advice.
The Dow Jones Industrial Average and the S&P 500 Index are unmanaged indices commonly used to measure the performance of U.S. stocks. One cannot invest directly in an index.
Price to earnings (“PE”) is the market price per share divided by earnings per share. Earnings per share is the portion of a company’s profit allocated to each outstanding share of common stock. It serves as an indicator of a company’s profitability.
| HENNESSY FUNDS | 1-800-966-4354 | |
Performance Overview (Unaudited)
CHANGE IN VALUE OF $10,000 INVESTMENT
This graph illustrates the performance of an initial investment of $10,000 made in the Fund on its inception date and assumes the reinvestment of dividends.
AVERAGE ANNUAL TOTAL RETURN FOR PERIODS ENDED OCTOBER 31, 2015
| | | | Since |
| | One | Five | Inception |
| | Year | Years | (3/20/09) |
| Hennessy Cornerstone Large Growth Fund – | | | |
| Investor Class (HFLGX) | 1.11% | 12.22% | 18.70% |
| Hennessy Cornerstone Large Growth Fund – | | | |
| Institutional Class (HILGX) | 1.19% | 12.46% | 18.99% |
Russell 1000® Index | 4.86% | 14.32% | 18.98% |
| S&P 500 Index | 5.20% | 14.33% | 18.71% |
Expense ratios from most recent prospectus: 1.08% (Investor Class); 0.99% (Institutional Class). As set forth in the Supplement to the Prospectus dated October 7, 2015, a 12b-1 fee of 0.15% was instituted on Investor Class shares effective as of November 1, 2015, and is not included in the Investor Class expense ratio.
Performance data quoted represents past performance; past performance does not guarantee future results. The investment return and principal value of an investment will fluctuate so that an investor’s shares, when redeemed, may be worth more or less than their original cost. The performance graph and table do not reflect the deduction of taxes that a shareholder would pay on Fund distributions or the redemption of Fund shares. Current performance of the Fund may be lower or higher than the performance quoted. Performance data current to the most recent month end may be obtained by visiting hennessyfunds.com.
PERFORMANCE NARRATIVE
Portfolio Managers Neil Hennessy and Brian Peery
Performance:
For the twelve-month period ended October 31, 2015, the Investor Class of the Hennessy Cornerstone Large Growth Fund returned 1.11%, underperforming the Russell 1000® Index and the S&P 500 Index, which returned 4.86% and 5.20% for the same period, respectively.
The Fund’s overweight position in retailers including The Gap, Inc., Bed, Bath & Beyond, Inc. and Macy’s, Inc. hurt its relative performance, as many retailers are struggling with slow growth in consumer demand and increased competition from internet shopping. The Fund also lost ground relative to its benchmark with its investments in the Technology sector. Holdings in Teradata Corp. and Micron Technology, Inc. performed poorly, and the Fund invested too little in the large technology companies dominating investor focus this year, especially Facebook, Inc. (Class A) and Alphabet, Inc. (Class C). The Fund’s investments in the Consumer Staples sector performed well, especially Coca-Cola Enterprises, Kroger Co. and Wal-Mart Stores, Inc. The Fund continues to hold Teradata, Micron Technology and Coca-Cola.
Portfolio Strategy:
The Fund’s investment strategy is based on identifying stocks that are large and established, yet trade at below average price-to-cash-flow ratios. The Fund also seeks to invest only in what it deems to be higher quality businesses and so focuses on companies with high returns on total capital.
Market Outlook:
Over the twelve-month period ended October 31, 2015, U.S. equities, as measured by the S&P 500 Index, advanced by just over 5%. Notwithstanding this modest rise, the year was marked by a great deal of volatility, especially during the second half of the period when uncertainty regarding the timing and magnitude of a rise in short-term interest rates being contemplated by the Federal Reserve dominated investor thinking. Earnings growth, too, caused anxiety for investors. Lower energy prices impacted many companies in the Energy sector, and the higher U.S. Dollar and slower growth abroad affected exporters. Many companies saw their sales and earnings growth slow.
In the end, however, confidence in continued economic growth was strong enough to offset investor concerns, with the market staging a dramatic rally in October, the final month of the Fund’s fiscal year. We believe the fundamentals of the market are attractive, and we continue to be optimistic about the possibility of further market advances over the course of the next year. The economy is growing slowly but steadily. Inflation is low, so we expect that the Fed, once they do start to raise rates, will not raise them by very much. The labor market has continued to recover over the last 12 months, and consumer confidence appears buoyant. Most importantly, we do not believe stocks are expensive. The Dow Jones Industrial Average and the S&P 500 have forward PE ratios of approximately 16x and 17x, respectively, close to long-term averages. Corporate balance sheets appear to be in excellent shape, and while executives have shown some reluctance to increase capital spending beyond maintenance levels this cycle, we believe companies will eventually start investing for expansion. This spending could, in turn, help drive share prices higher through an acceleration in sales and earnings growth.
Investment Outlook:
We are confident that there are good investment opportunities in the large-cap space. While we believe higher interest rates may lead to an even stronger U.S. Dollar and difficulties for exporters, large-cap companies with purely domestic businesses are benefiting from steady economic growth at home, low inflation and low energy prices. With consumer debt levels falling and wage growth finally starting to accelerate, we are expecting a fairly good holiday season for consumer-based companies and stronger demand for their products and services next year. However, we recognize that despite low gas prices, consumers and especially younger consumers, seem to prefer spending less and saving more, in contrast to previous generations. Going into the new fiscal year, we are pleased with the positioning of the portfolio, which includes a large number of
| HENNESSY FUNDS | 1-800-966-4354 | |
companies that are domestically focused and that we believe are reasonably valued and may be poised for growth. Relative to the Fund’s benchmarks, the portfolio is overweight in both the Consumer Discretionary and Industrial sectors, and we think that these areas of the market offer great growth potential now and into 2016.
Opinions expressed are those of the Portfolio Managers as of the date written and are subject to change, are not guaranteed, and should not be considered investment advice or an indication of trading intent.
The Russell 1000® Index is commonly used to measure the performance of large-capitalization U.S. stocks. The S&P 500 Index and Dow Jones Industrial Average are unmanaged indices commonly used to measure the performance of U.S. stocks. One cannot invest directly in an index.
The Fund may invest in medium capitalized companies, which may have more limited liquidity and greater price volatility than large capitalization companies. The Fund’s formula-based strategy may cause the Fund to buy or sell securities at times when it may not be advantageous.
References to specific securities should not be considered a recommendation to buy or sell any security. Fund holdings and sector allocations are subject to change. Please refer to the Schedule of Investments included in this report for additional portfolio information.
Earnings growth is not a measure of the Fund’s future performance. PE, or price to earnings, is calculated by dividing a company’s market price per share by its earnings per share. Price to cash flow ratio is a stock valuation measure calculated by dividing a firm’s cash flow per share into the current stock price.
Financial Statements
Schedule of Investments as of October 31, 2015 |
HENNESSY CORNERSTONE LARGE GROWTH FUND
(% of Net Assets)
| TOP TEN HOLDINGS (EXCLUDING CASH/CASH EQUIVALENTS) | % NET ASSETS |
| Valero Energy Corp. | 3.00% |
| AutoZone, Inc. | 2.86% |
| Foot Locker, Inc. | 2.77% |
| Lear Corp. | 2.75% |
| Marathon Petroleum Corp. | 2.73% |
| The Progressive Corp. | 2.66% |
| McDonald’s Corp. | 2.62% |
| Coca-Cola Enterprises, Inc. | 2.50% |
| Alaska Air Group, Inc. | 2.50% |
| H&R Block, Inc. | 2.42% |
Note: For presentation purposes, the Fund has grouped some of the industry categories. For purposes of categorizing securities for compliance with Section 8(b)(1) of the Investment Company Act of 1940, as amended, the Fund uses more specific industry classifications.
| HENNESSY FUNDS | 1-800-966-4354 | |
| COMMON STOCKS – 96.70% | | Number | | | | | | % of | |
| | | of Shares | | | Value | | | Net Assets | |
| Consumer Discretionary – 29.26% | | | | | | | | | |
| AutoZone, Inc. (a) | | | 4,100 | | | $ | 3,216,081 | | | | 2.86 | % |
| Bed Bath & Beyond, Inc. (a) | | | 32,500 | | | | 1,937,975 | | | | 1.72 | % |
| Coach, Inc. | | | 66,000 | | | | 2,059,200 | | | | 1.83 | % |
| Foot Locker, Inc. | | | 45,900 | | | | 3,109,725 | | | | 2.77 | % |
| H&R Block, Inc. | | | 73,000 | | | | 2,719,980 | | | | 2.42 | % |
| Harley-Davidson, Inc. | | | 37,600 | | | | 1,859,320 | | | | 1.65 | % |
| Las Vegas Sands Corp. | | | 44,700 | | | | 2,213,097 | | | | 1.97 | % |
| Lear Corp. | | | 24,700 | | | | 3,088,982 | | | | 2.75 | % |
| Macy’s, Inc. | | | 37,600 | | | | 1,916,848 | | | | 1.70 | % |
| McDonald’s Corp. | | | 26,200 | | | | 2,940,950 | | | | 2.62 | % |
| Nordstrom, Inc. | | | 31,400 | | | | 2,047,594 | | | | 1.82 | % |
| Omnicom Group, Inc. | | | 32,300 | | | | 2,419,916 | | | | 2.15 | % |
| The Gap, Inc. | | | 58,900 | | | | 1,603,258 | | | | 1.43 | % |
| Viacom, Inc. | | | 35,900 | | | | 1,770,229 | | | | 1.57 | % |
| | | | | | | | 32,903,155 | | | | 29.26 | % |
| | | | | | | | | | | | | |
| Consumer Staples – 8.08% | | | | | | | | | | | | |
| Campbell Soup Co. | | | 50,700 | | | | 2,575,053 | | | | 2.29 | % |
| Coca-Cola Enterprises, Inc. | | | 54,800 | | | | 2,813,432 | | | | 2.50 | % |
| Kellogg Co. | | | 34,500 | | | | 2,432,940 | | | | 2.16 | % |
| Pilgrim’s Pride Corp. | | | 66,700 | | | | 1,266,633 | | | | 1.13 | % |
| | | | | | | | 9,088,058 | | | | 8.08 | % |
| | | | | | | | | | | | | |
| Energy – 11.42% | | | | | | | | | | | | |
| Exxon Mobil Corp. | | | 26,100 | | | | 2,159,514 | | | | 1.92 | % |
| FMC Technologies, Inc. (a) | | | 61,200 | | | | 2,070,396 | | | | 1.84 | % |
| Helmerich & Payne, Inc. | | | 38,500 | | | | 2,166,395 | | | | 1.93 | % |
| Marathon Petroleum Corp. | | | 59,200 | | | | 3,066,560 | | | | 2.73 | % |
| Valero Energy Corp. | | | 51,200 | | | | 3,375,104 | | | | 3.00 | % |
| | | | | | | | 12,837,969 | | | | 11.42 | % |
| | | | | | | | | | | | | |
| Financials – 4.33% | | | | | | | | | | | | |
| Franklin Resources, Inc. | | | 46,100 | | | | 1,879,036 | | | | 1.67 | % |
| The Progressive Corp. | | | 90,400 | | | | 2,994,952 | | | | 2.66 | % |
| | | | | | | | 4,873,988 | | | | 4.33 | % |
The accompanying notes are an integral part of these financial statements.
| COMMON STOCKS | | Number | | | | | | % of | |
| | | of Shares | | | Value | | | Net Assets | |
| Health Care – 6.49% | | | | | | | | | |
| C.R. Bard, Inc. | | | 13,500 | | | $ | 2,515,725 | | | | 2.23 | % |
| HCA Holdings, Inc. (a) | | | 35,100 | | | | 2,414,529 | | | | 2.15 | % |
| Johnson & Johnson | | | 23,500 | | | | 2,374,205 | | | | 2.11 | % |
| | | | | | | | 7,304,459 | | | | 6.49 | % |
| | | | | | | | | | | | | |
| Industrials – 18.29% | | | | | | | | | | | | |
| Alaska Air Group, Inc. | | | 36,800 | | | | 2,806,000 | | | | 2.50 | % |
| Caterpillar, Inc. | | | 28,300 | | | | 2,065,617 | | | | 1.84 | % |
| Deere & Co. | | | 27,300 | | | | 2,129,400 | | | | 1.89 | % |
| Dover Corp. | | | 33,900 | | | | 2,184,177 | | | | 1.94 | % |
| Flowserve Corp. | | | 42,400 | | | | 1,965,664 | | | | 1.75 | % |
| Fluor Corp. | | | 43,700 | | | | 2,089,297 | | | | 1.86 | % |
| PACCAR, Inc. | | | 36,900 | | | | 1,942,785 | | | | 1.73 | % |
| Southwest Airlines Co. | | | 58,400 | | | | 2,703,336 | | | | 2.40 | % |
| The Boeing Co. | | | 18,100 | | | | 2,680,067 | | | | 2.38 | % |
| | | | | | | | 20,566,343 | | | | 18.29 | % |
| | | | | | | | | | | | | |
| Information Technology – 11.15% | | | | | | | | | | | | |
| Apple, Inc. | | | 21,850 | | | | 2,611,075 | | | | 2.32 | % |
| Intel Corp. | | | 66,000 | | | | 2,234,760 | | | | 1.99 | % |
| International Business Machines Corp. | | | 15,200 | | | | 2,129,216 | | | | 1.89 | % |
| Micron Technology, Inc. (a) | | | 80,200 | | | | 1,328,112 | | | | 1.18 | % |
| Teradata Corp. (a) | | | 54,900 | | | | 1,543,239 | | | | 1.37 | % |
| Western Union Co. | | | 139,900 | | | | 2,693,075 | | | | 2.40 | % |
| | | | | | | | 12,539,477 | | | | 11.15 | % |
| | | | | | | | | | | | | |
| Materials – 5.62% | | | | | | | | | | | | |
| Albemarle Corp. | | | 41,200 | | | | 2,205,024 | | | | 1.96 | % |
| FMC Corp. | | | 41,100 | | | | 1,673,181 | | | | 1.49 | % |
| Southern Copper Corp. | | | 88,000 | | | | 2,442,880 | | | | 2.17 | % |
| | | | | | | | 6,321,085 | | | | 5.62 | % |
| | | | | | | | | | | | | |
| Telecommunication Services – 2.06% | | | | | | | | | | | | |
| Verizon Communications, Inc. | | | 49,400 | | | | 2,315,872 | | | | 2.06 | % |
| | | | | | | | | | | | | |
| Total Common Stocks | | | | | | | | | | | | |
| (Cost $107,250,783) | | | | | | | 108,750,406 | | | | 96.70 | % |
The accompanying notes are an integral part of these financial statements.
| HENNESSY FUNDS | 1-800-966-4354 | |
| SHORT-TERM INVESTMENTS – 3.69% | | Number | | | | | | % of | |
| | | of Shares | | | Value | | | Net Assets | |
| Money Market Funds – 3.69% | | | | | | | | | |
| Fidelity Government Portfolio – Institutional Class, 0.01% (b) | | | 4,150,079 | | | $ | 4,150,079 | | | | 3.69 | % |
| | | | | | | | | | | | | |
| Total Short-Term Investments | | | | | | | | | | | | |
| (Cost $4,150,079) | | | | | | | 4,150,079 | | | | 3.69 | % |
| | | | | | | | | | | | | |
| Total Investments | | | | | | | | | | | | |
| (Cost $111,400,862) – 100.39% | | | | | | | 112,900,485 | | | | 100.39 | % |
| Liabilities in Excess | | | | | | | | | | | | |
| of Other Assets – (0.39)% | | | | | | | (440,640 | ) | | | (0.39 | )% |
TOTAL NET ASSETS – 100.00% | | | | | | $ | 112,459,845 | | | | 100.00 | % |
Percentages are stated as a percent of net assets.
| (a) | Non-income producing security. |
| (b) | The rate listed is the fund’s 7-day yield as of October 31, 2015. |
Summary of Fair Value Exposure at October 31, 2015
The following is a summary of the inputs used to value the Fund’s net assets as of October 31, 2015 (see Note 3 in the accompanying notes to the financial statements):
| Common Stock | | Level 1 | | | Level 2 | | | Level 3 | | | Total | |
| Consumer Discretionary | | $ | 32,903,155 | | | $ | — | | | $ | — | | | $ | 32,903,155 | |
| Consumer Staples | | | 9,088,058 | | | | — | | | | — | | | | 9,088,058 | |
| Energy | | | 12,837,969 | | | | — | | | | — | | | | 12,837,969 | |
| Financials | | | 4,873,988 | | | | — | | | | — | | | | 4,873,988 | |
| Health Care | | | 7,304,459 | | | | — | | | | — | | | | 7,304,459 | |
| Industrials | | | 20,566,343 | | | | — | | | | — | | | | 20,566,343 | |
| Information Technology | | | 12,539,477 | | | | — | | | | — | | | | 12,539,477 | |
| Materials | | | 6,321,085 | | | | — | | | | — | | | | 6,321,085 | |
| Telecommunication Services | | | 2,315,872 | | | | — | | | | — | | | | 2,315,872 | |
| Total Common Stocks | | $ | 108,750,406 | | | $ | — | | | $ | — | | | $ | 108,750,406 | |
| Short-Term Investments | | | | | | | | | | | | | | | | |
| Money Market Funds | | $ | 4,150,079 | | | $ | — | | | $ | — | | | $ | 4,150,079 | |
| Total Short-Term Investments | | $ | 4,150,079 | | | $ | — | | | $ | — | | | $ | 4,150,079 | |
| Total Investments | | $ | 112,900,485 | | | $ | — | | | $ | — | | | $ | 112,900,485 | |
Transfers between levels are recognized at the end of the reporting period. During the year ended October 31, 2015, the Fund recognized no transfers between levels.
The accompanying notes are an integral part of these financial statements.
Financial Statements
Statement of Assets and Liabilities as of October 31, 2015 |
| ASSETS: | | | |
| Investments in securities, at value (cost $111,400,862) | | $ | 112,900,485 | |
| Dividends and interest receivable | | | 82,991 | |
| Receivable for fund shares sold | | | 3,296 | |
| Receivable for securities sold | | | 2,527,663 | |
| Prepaid expenses and other assets | | | 15,833 | |
| Total Assets | | | 115,530,268 | |
| | | | | |
| LIABILITIES: | | | | |
| Payable for securities purchased | | | 2,740,212 | |
| Payable for fund shares redeemed | | | 184,692 | |
| Payable to advisor | | | 69,017 | |
| Payable to administrator | | | 17,975 | |
| Payable to auditor | | | 20,599 | |
| Accrued service fees | | | 8,183 | |
| Accrued interest payable | | | 70 | |
| Accrued trustees fees | | | 2,364 | |
| Accrued expenses and other payables | | | 27,311 | |
| Total Liabilities | | | 3,070,423 | |
| NET ASSETS | | $ | 112,459,845 | |
| | | | | |
| NET ASSETS CONSIST OF: | | | | |
| Capital stock | | $ | 87,696,470 | |
| Accumulated net investment income | | | 1,652,799 | |
| Accumulated net realized gain on investments | | | 21,610,953 | |
| Unrealized net appreciation on investments | | | 1,499,623 | |
| Total Net Assets | | $ | 112,459,845 | |
| | | | | |
| NET ASSETS | | | | |
| Investor Class: | | | | |
| Shares authorized (no par value) | | Unlimited | |
| Net assets applicable to outstanding Investor Class shares | | $ | 98,640,994 | |
| Shares issued and outstanding | | | 7,592,655 | |
| Net asset value, offering price and redemption price per share | | $ | 12.99 | |
| | | | | |
| Institutional Class: | | | | |
| Shares authorized (no par value) | | Unlimited | |
| Net assets applicable to outstanding Institutional Class shares | | $ | 13,818,851 | |
| Shares issued and outstanding | | | 1,054,546 | |
| Net asset value, offering price and redemption price per share | | $ | 13.10 | |
The accompanying notes are an integral part of these financial statements.
| HENNESSY FUNDS | 1-800-966-4354 | |
Financial Statements
Statement of Operations for the year ended October 31, 2015 |
| INVESTMENT INCOME: | | | |
| Dividend income | | $ | 2,935,446 | |
| Interest income | | | 347 | |
| Total investment income | | | 2,935,793 | |
| | | | | |
| EXPENSES: | | | | |
| Investment advisory fees (See Note 5) | | | 883,980 | |
| Administration, fund accounting, custody and transfer agent fees (See Note 5) | | | 118,095 | |
| Service fees – Investor Class (See Note 5) | | | 104,668 | |
| Sub-transfer agent expenses – Investor Class (See Note 5) | | | 58,856 | |
| Sub-transfer agent expenses – Institutional Class (See Note 5) | | | 8,292 | |
| Federal and state registration fees | | | 28,391 | |
| Compliance expense | | | 22,187 | |
| Audit fees | | | 21,327 | |
| Reports to shareholders | | | 12,355 | |
| Trustees’ fees and expenses | | | 11,632 | |
| Legal fees | | | 1,615 | |
| Other expenses | | | 11,804 | |
| Total expenses before reimbursement by advisor | | | 1,283,202 | |
| Expense reimbursement by advisor – Institutional Class (See Note 5) | | | (238 | ) |
| Net expenses | | | 1,282,964 | |
| NET INVESTMENT INCOME | | $ | 1,652,829 | |
| | | | | |
| REALIZED AND UNREALIZED GAINS (LOSSES): | | | | |
| Net realized gain on investments | | $ | 23,691,496 | |
| Net change in unrealized depreciation on investments | | | (23,789,596 | ) |
| Net loss on investments | | | (98,100 | ) |
| NET INCREASE IN NET ASSETS RESULTING FROM OPERATIONS | | $ | 1,554,729 | |
The accompanying notes are an integral part of these financial statements.
Financial Statements
| Statements of Changes in Net Assets |
| | | Year Ended | | | Year Ended | |
| | | October 31, 2015 | | | October 31, 2014 | |
| OPERATIONS: | | | | | | |
| Net investment income | | $ | 1,652,829 | | | $ | 1,313,663 | |
| Net realized gain on investments | | | 23,691,496 | | | | 18,680,208 | |
| Net change in unrealized depreciation on investments | | | (23,789,596 | ) | | | (586,375 | ) |
| Net increase in net assets resulting from operations | | | 1,554,729 | | | | 19,407,496 | |
| | | | | | | | | |
| DISTRIBUTIONS TO SHAREHOLDERS FROM: | | | | | | | | |
| Net investment income | | | | | | | | |
| Investor Class | | | (1,131,289 | ) | | | (985,143 | ) |
| Institutional Class | | | (182,392 | ) | | | (209,291 | ) |
| Net realized gains | | | | | | | | |
| Investor Class | | | (15,515,006 | ) | | | (4,397,057 | ) |
| Institutional Class | | | (2,199,959 | ) | | | (781,019 | ) |
| Total distributions | | | (19,028,646 | ) | | | (6,372,510 | ) |
| | | | | | | | | |
| CAPITAL SHARE TRANSACTIONS: | | | | | | | | |
| Proceeds from shares subscribed – Investor Class | | | 10,488,951 | | | | 11,881,168 | |
| Proceeds from shares subscribed – Institutional Class | | | 1,162,873 | | | | 4,305,238 | |
| Dividends reinvested – Investor Class | | | 15,613,606 | | | | 5,021,319 | |
| Dividends reinvested – Institutional Class | | | 2,276,330 | | | | 949,886 | |
| Cost of shares redeemed – Investor Class | | | (17,679,567 | ) | | | (11,322,920 | ) |
| Cost of shares redeemed – Institutional Class | | | (2,316,917 | ) | | | (8,441,558 | )(1) |
| Net increase in net assets derived | | | | | | | | |
| from capital share transactions | | | 9,545,276 | | | | 2,393,133 | |
| TOTAL INCREASE (DECREASE) IN NET ASSETS | | | (7,928,641 | ) | | | 15,428,119 | |
| | | | | | | | | |
| NET ASSETS: | | | | | | | | |
| Beginning of year | | | 120,388,486 | | | | 104,960,367 | |
| End of year | | $ | 112,459,845 | | | $ | 120,388,486 | |
| Accumulated net investment income, end of year | | $ | 1,652,799 | | | $ | 1,313,651 | |
| | | | | | | | | |
| CHANGES IN SHARES OUTSTANDING: | | | | | | | | |
| Shares sold – Investor Class | | | 772,173 | | | | 822,355 | |
| Shares sold – Institutional Class | | | 84,750 | | | | 298,334 | |
| Shares issued to holders as reinvestment | | | | | | | | |
| of dividends – Investor Class | | | 1,169,440 | | | | 375,434 | |
| Shares issued to holders as reinvestment | | | | | | | | |
| of dividends – Institutional Class | | | 168,993 | | | | 70,320 | |
| Shares redeemed – Investor Class | | | (1,307,953 | ) | | | (783,194 | ) |
| Shares redeemed – Institutional Class | | | (171,821 | ) | | | (579,248 | ) |
| Net increase in shares outstanding | | | 715,582 | | | | 204,001 | |
(1) | Net of redemption fees of $3 related to redemption fees imposed by the FBR Large Cap Fund (which was reorganized into the Fund) during a prior year but not received until the year ended October 31, 2014. |
The accompanying notes are an integral part of these financial statements.
| HENNESSY FUNDS | 1-800-966-4354 | |
Financial Statements
For an Investor Class share outstanding throughout each year
PER SHARE DATA:
Net asset value, beginning of year
Income from investment operations:
Net investment income
Net realized and unrealized gains on investments
Total from investment operations
Less distributions:
Dividends from net investment income
Dividends from net realized gains
Total distributions
Net asset value, end of year
TOTAL RETURN
SUPPLEMENTAL DATA AND RATIOS:
Net assets, end of year (millions)
Ratio of expenses to average net assets:
Before expense reimbursement
After expense reimbursement
Ratio of net investment income to average net assets:
Before expense reimbursement
After expense reimbursement
Portfolio turnover rate(1)
(1) | Portfolio turnover is calculated on the basis of the Fund as a whole. |
The accompanying notes are an integral part of these financial statements.
| Year Ended October 31, | |
| 2015 | | | 2014 | | | 2013 | | | 2012 | | | 2011 | |
| | | | | | | | | | | | | |
| $ | 15.16 | | | $ | 13.56 | | | $ | 10.77 | | | $ | 12.37 | | | $ | 11.70 | |
| | | | | | | | | | | | | | | | | | | |
| | | | | | | | | | | | | | | | | | | |
| | 0.17 | | | | 0.15 | | | | 0.14 | | | | 0.13 | | | | 0.09 | |
| | 0.04 | | | | 2.28 | | | | 2.77 | | | | 0.80 | | | | 0.69 | |
| | 0.21 | | | | 2.43 | | | | 2.91 | | | | 0.93 | | | | 0.78 | |
| | | | | | | | | | | | | | | | | | | |
| | | | | | | | | | | | | | | | | | | |
| | (0.14 | ) | | | (0.15 | ) | | | (0.10 | ) | | | (0.07 | ) | | | (0.09 | ) |
| | (2.24 | ) | | | (0.68 | ) | | | (0.02 | ) | | | (2.46 | ) | | | (0.02 | ) |
| | (2.38 | ) | | | (0.83 | ) | | | (0.12 | ) | | | (2.53 | ) | | | (0.11 | ) |
| $ | 12.99 | | | $ | 15.16 | | | $ | 13.56 | | | $ | 10.77 | | | $ | 12.37 | |
| | | | | | | | | | | | | | | | | | | |
| | 1.11 | % | | | 18.73 | % | | | 27.32 | % | | | 9.14 | % | | | 6.70 | % |
| | | | | | | | | | | | | | | | | | | |
| | | | | | | | | | | | | | | | | | | |
| $ | 98.64 | | | $ | 105.51 | | | $ | 88.77 | | | $ | 75.83 | | | $ | 77.88 | |
| | | | | | | | | | | | | | | | | | | |
| | 1.09 | % | | | 1.15 | % | | | 1.19 | % | | | 1.27 | % | | | 1.26 | % |
| | 1.09 | % | | | 1.15 | % | | | 1.19 | % | | | 1.27 | % | | | 1.30 | % |
| | | | | | | | | | | | | | | | | | | |
| | 1.37 | % | | | 1.12 | % | | | 1.10 | % | | | 1.35 | % | | | 0.72 | % |
| | 1.37 | % | | | 1.12 | % | | | 1.10 | % | | | 1.35 | % | | | 0.68 | % |
| | 79 | % | | | 57 | % | | | 73 | % | | | 0 | % | | | 70 | % |
The accompanying notes are an integral part of these financial statements.
| HENNESSY FUNDS | 1-800-966-4354 | |
Financial Statements
For an Institutional Class share outstanding throughout each year
PER SHARE DATA:
Net asset value, beginning of year
Income from investment operations:
Net investment income
Net realized and unrealized gains on investments
Total from investment operations
Less distributions:
Dividends from net investment income
Dividends from net realized gains
Total distributions
Net asset value, end of year
TOTAL RETURN
SUPPLEMENTAL DATA AND RATIOS:
Net assets, end of year (millions)
Ratio of expenses to average net assets:
Before expense reimbursement
After expense reimbursement
Ratio of net investment income to average net assets:
Before expense reimbursement
After expense reimbursement
Portfolio turnover rate(1)
(1) | Portfolio turnover is calculated on the basis of the Fund as a whole. |
The accompanying notes are an integral part of these financial statements.
| Year Ended October 31, | |
| 2015 | | | 2014 | | | 2013 | | | 2012 | | | 2011 | |
| | | | | | | | | | | | | |
| $ | 15.30 | | | $ | 13.68 | | | $ | 10.85 | | | $ | 12.44 | | | $ | 11.76 | |
| | | | | | | | | | | | | | | | | | | |
| | | | | | | | | | | | | | | | | | | |
| | 0.20 | | | | 0.17 | | | | 0.09 | | | | 0.07 | | | | 0.08 | |
| | 0.02 | | | | 2.30 | | | | 2.88 | | | | 0.89 | | | | 0.74 | |
| | 0.22 | | | | 2.47 | | | | 2.97 | | | | 0.96 | | | | 0.82 | |
| | | | | | | | | | | | | | | | | | | |
| | | | | | | | | | | | | | | | | | | |
| | (0.16 | ) | | | (0.17 | ) | | | (0.12 | ) | | | (0.09 | ) | | | (0.12 | ) |
| | (2.26 | ) | | | (0.68 | ) | | | (0.02 | ) | | | (2.46 | ) | | | (0.02 | ) |
| | (2.42 | ) | | | (0.85 | ) | | | (0.14 | ) | | | (2.55 | ) | | | (0.14 | ) |
| $ | 13.10 | | | $ | 15.30 | | | $ | 13.68 | | | $ | 10.85 | | | $ | 12.44 | |
| | | | | | | | | | | | | | | | | | | |
| | 1.19 | % | | | 18.96 | % | | | 27.63 | % | | | 9.43 | % | | | 6.99 | % |
| | | | | | | | | | | | | | | | | | | |
| | | | | | | | | | | | | | | | | | | |
| $ | 13.82 | | | $ | 14.88 | | | $ | 16.19 | | | $ | 33.94 | | | $ | 0.14 | |
| | | | | | | | | | | | | | | | | | | |
| | 0.99 | % | | | 1.06 | % | | | 1.10 | % | | | 1.41 | % | | | 1.14 | % |
| | 0.99 | % | | | 0.98 | % | | | 0.98 | % | | | 0.98 | % | | | 0.98 | % |
| | | | | | | | | | | | | | | | | | | |
| | 1.47 | % | | | 1.21 | % | | | 1.38 | % | | | 6.44 | % | | | 0.81 | % |
| | 1.47 | % | | | 1.30 | % | | | 1.50 | % | | | 6.87 | % | | | 0.97 | % |
| | 79 | % | | | 57 | % | | | 73 | % | | | 0 | % | | | 70 | % |
The accompanying notes are an integral part of these financial statements.
| HENNESSY FUNDS | 1-800-966-4354 | |
Financial Statements
Notes to the Financial Statements October 31, 2015 |
1). ORGANIZATION
The Hennessy Cornerstone Large Growth Fund (the “Fund”) is a series of Hennessy Funds Trust (the “Trust”), which was organized as a Delaware statutory trust on September 17, 1992. The Fund is an open-end management investment company registered under the Investment Company Act of 1940, as amended. The investment objective of the Fund is long-term growth of capital. The Fund is a diversified fund.
| | The Fund offers Investor Class and Institutional Class shares. Each class of shares differs principally in its respective administration, shareholder servicing, and transfer agent expenses and sales charges, if any. Each class has identical rights to earnings, assets, and voting privileges, except for class-specific expenses and exclusive rights to vote on matters affecting only an individual class. |
| | As an investment company, the Fund follows the investment company accounting and reporting guidance of the Financial Accounting Standards Board (“FASB”) Accounting Standard Codification Topic 946 “Financial Services—Investment Companies.” |
2). SIGNIFICANT ACCOUNTING POLICIES
The following is a summary of significant accounting policies consistently followed by the Fund in the preparation of the financial statements. These policies are in conformity with U.S. generally accepted accounting principles (“GAAP”).
| a). | Investment Valuation – All investments in securities are recorded at their estimated fair value, as described in Note 3. |
| b). | Federal Income Taxes – Provision for federal income taxes or excise taxes has not been made since the Fund has elected to be taxed as a “regulated investment company” and intends to distribute substantially all of its taxable income to its shareholders and otherwise comply with the provisions of the Internal Revenue Code of 1986, as amended, applicable to regulated investment companies. Net investment income or loss and realized gains and losses for federal income tax purposes may differ from that reported on the financial statements because of temporary book and tax basis differences. Temporary differences are primarily the result of the treatment of wash sales for tax reporting purposes. The Fund recognizes interest and penalties related to income tax benefits, if any, in the statement of operations as an income tax expense. Distributions from net realized gains for book purposes may include short-term capital gains, which are included as ordinary income to shareholders for tax purposes. |
| c). | Income and Expenses – Dividend income is recognized on the ex-dividend date or as soon as information is available to the Fund. Interest income, which includes the amortization of premium and accretion of discount, is recognized on an accrual basis. The Fund is charged for those expenses that are directly attributable to the portfolio, such as advisory, administration, and certain shareholder service fees. Income, expenses (other than expenses attributable to a specific class), and realized and unrealized gains or losses on investments are allocated to each class of shares based on its respective net assets. |
| d). | Distributions to Shareholders – Dividends from net investment income for the Fund, if any, are declared and paid annually, usually in December. Distributions of net realized capital gains, if any, are declared and paid annually, usually in December. |
| e). | Security Transactions – Investment and shareholder transactions are recorded on the trade date. The Fund determines the gain or loss realized from the investment transactions by comparing the original cost of the security lot sold with the net sale proceeds. Discounts and premiums on securities purchased are accreted/amortized over the life of the respective security. |
| f). | Use of Estimates – The preparation of financial statements in conformity with GAAP requires management to make estimates and assumptions that affect the reported amounts of assets and liabilities and disclosure of contingent assets and liabilities at the date of the financial statements and the reported change in net assets during the reporting period. Actual results could differ from those estimates. |
| g). | Share Valuation – The net asset value (“NAV”) per share of the Fund is calculated by dividing the sum of the value of the securities held by the Fund, plus cash or other assets, minus all liabilities (including estimated accrued expenses) by the total number of shares outstanding for the Fund, rounded to the nearest cent. The Fund’s shares will not be priced on days the New York Stock Exchange is closed for trading. The offering and redemption price per share for the Fund is equal to the Fund’s NAV per share. |
| h). | Repurchase Agreements – The Fund may enter into repurchase agreements with member banks or security dealers of the Federal Reserve Board whom the investment advisor deems creditworthy. The repurchase price generally equals the price paid by the Fund plus interest negotiated on the basis of current short-term rates. |
| | Securities pledged as collateral for repurchase agreements are held by the custodian bank until the respective agreements mature. Provisions of the repurchase agreements ensure that the market value of the collateral, including accrued interest thereon, is sufficient to cover the repurchase amount in the event of default of the counterparty. If the counterparty defaults and the value of the collateral declines or if the counterparty enters an insolvency proceeding, realization of the collateral by the Fund may be delayed or limited. |
| i). | Accounting for Uncertainty in Income Taxes – The Fund has accounting policies regarding recognition and measurement of tax positions taken or expected to be taken on a tax return. The tax returns of the Fund for the prior three fiscal years are open for examination. The Fund has reviewed all open tax years in major jurisdictions and concluded that there is no impact on the Fund’s net assets and no tax liability resulting from unrecognized tax benefits relating to uncertain income tax positions taken or expected to be taken on a tax return. The Fund’s major tax jurisdictions are U.S. federal and Delaware. |
| j). | Derivatives – The Fund may invest in, or enter into, derivatives, such as options, futures contracts, options on futures contracts, and swaps, for a variety of reasons, including to hedge certain risks, to provide a substitute for purchasing or selling particular securities, or to increase potential income gain. Derivatives may provide a cheaper, quicker, or more specifically focused way for a Fund to invest than “traditional” securities would. The main purpose of utilizing these derivative instruments is for hedging purposes. |
| | The Fund follows the financial accounting reporting rules as required by the Derivatives and Hedging Topic of the FASB Accounting Standards Codification. Under such rules, the Fund is required to include enhanced disclosure that enables investors to understand how and why an entity uses derivatives, how derivatives are accounted for, and how derivatives instruments affect an entity’s results of operations and financial position. During the fiscal year ended October 31, 2015, the Fund did not hold any derivative instruments. |
| HENNESSY FUNDS | 1-800-966-4354 | |
| k). | New Accounting Pronouncements – In June 2014, the FASB issued Accounting Standards Update (“ASU”) No. 2014-11 “Repurchase-to Maturity Transactions, Repurchase Financings, and Disclosures.” The amendments in this ASU require an entity to modify accounting for repurchase-to-maturity transactions and repurchase financing arrangements, as well as modify required disclosures for repurchase agreements, securities lending transactions, and repurchase-to-maturity transactions that are accounted for as secured borrowings. The guidance is effective for fiscal years beginning on or after December 15, 2014, and for interim periods within those fiscal years. Management is currently evaluating the impact these changes will have on the Fund’s financial statement disclosures. |
| | In May 2015, the FASB issued ASU No. 2015-07 “Disclosure for Investments in Certain Entities that Calculate Net Asset Value per Share (or Its Equivalent).” The amendments in ASU No. 2015-07 remove the requirement to categorize within the fair value hierarchy investments measured at NAV and require the disclosure of sufficient information to reconcile the fair value of the remaining assets categorized within the fair value hierarchy to the financial statements. The amendments in ASU No. 2015-07 are effective for fiscal years beginning after December 15, 2015, and interim periods within those fiscal years. Management has reviewed the requirements and believes the adoption of ASU 2015-07 will not have a material impact on the Fund’s financial statements and related disclosures. |
3). SECURITIES VALUATION
The Fund follows authoritative fair valuation accounting standards that establish an authoritative definition of fair value and set out a hierarchy for measuring fair value. These standards require additional disclosures about the various inputs and valuation techniques used to develop the measurements of fair value and a discussion in changes in valuation techniques and related inputs during the period. These inputs are summarized in the three broad levels listed below:
| | Level 1 – | Quoted unadjusted prices for identical instruments in active markets to which the Fund has access at the date of measurement. |
| | Level 2 – | Quoted prices for similar instruments in active markets; quoted prices for identical or similar instruments in markets that are not active; and model-derived valuations in which all significant inputs and significant value drivers are observable in active markets. Level 2 inputs are those in markets for which there are few transactions, the prices are not current, the prices are fair value adjusted due to post-market close subsequent events (foreign markets), little public information exists, or instances where prices vary substantially over time or among brokered market makers. These inputs may also include interest rates, prepayment speeds, credit risk curves, default rates, and similar data. |
| | Level 3 – | Model-derived valuations in which one or more significant inputs or significant value drivers are unobservable. Unobservable inputs are those inputs that reflect the Fund’s own assumptions about what market participants would use to price the asset or liability based on the best available information. |
Following is a description of the valuation techniques applied to the Fund’s major categories of assets and liabilities measured at fair value on a recurring basis.
Equity Securities – Equity securities, including common stocks, preferred stocks, exchange-traded funds, closed-end mutual funds, partnerships, rights, and real estate
investment trusts, that are traded on a securities exchange for which a last-quoted sales price is readily available will generally be valued at the last sales price as reported by the primary exchange on which the securities are listed. Securities listed on The NASDAQ Stock Market (“NASDAQ”) will generally be valued at the NASDAQ Official Closing Price, which may differ from the last sales price reported. Securities traded on a securities exchange for which a last-quoted sales price is not readily available will generally be valued at the mean between the bid and ask prices. To the extent these securities are actively traded and valuation adjustments are not applied, they are classified in Level 1 of the fair value hierarchy.
Registered Investment Companies – Investments in registered investment companies (e.g., mutual funds) are generally priced at the ending NAV provided by the applicable registered investment company’s service agent and will be classified in Level 1 of the fair value hierarchy.
Debt Securities – Debt securities, including corporate bonds, asset-backed securities, mortgage-backed securities, municipal bonds, U.S. Treasuries, and U.S. government agency issues, are generally valued at market on the basis of valuations furnished by an independent pricing service that utilizes both dealer-supplied valuations and formula-based techniques. The pricing service may consider recently executed transactions in securities of the issuer or comparable issuers, market price quotations (where observable), bond spreads, and fundamental data relating to the issuer. In addition, the model may incorporate market observable data such as reported sales of similar securities, broker quotes, yields, bids, offers, and reference data. Certain securities are valued principally using dealer quotations. These securities are generally classified in Level 2 of the fair value hierarchy.
Short-Term Securities – Short-term equity investments, including money market funds, are valued in the manner specified above. Short-term debt investments are generally valued at amortized cost, which approximates fair market value, if their original term to maturity was 60 days or less, or by amortizing the values as of the 61st day prior to maturity, if their original term to maturity exceeded 60 days. Amortized cost is not used if its use would be inappropriate due to credit or other impairments of the issuer, in which case the security’s fair value would be determined, as described below. Short-term securities are generally classified in Level 1 or Level 2 of the fair market hierarchy depending on the inputs used and market activity levels for specific securities.
The Board of Trustees of the Fund (the “Board”) has adopted fair value pricing procedures that are followed when a price for a security is not readily available or if a significant event has occurred that indicates the closing price of a security no longer represents the true value of that security. Fair value pricing determinations are made in good faith in accordance with these procedures. There are numerous criteria that will be given consideration in determining a fair value of a security. Some of these criteria are trading volume of a security and markets, the value of other like securities, and news events with direct bearing to a security or markets. Fair value pricing results in an estimated price for a security that reflects the amount the Fund might reasonably expect to receive in a current sale. Depending on the relative significance of the valuation inputs, these securities may be classified in either Level 2 or Level 3 of the fair value hierarchy.
The Board has delegated day-to-day valuation matters to a Valuation Committee comprised of one or more representatives from Hennessy Advisors, Inc., the Fund’s investment advisor. The function of the Valuation Committee is to value securities where current and reliable market quotations are not readily available. All actions taken by the Valuation Committee are reviewed by the Board.
| HENNESSY FUNDS | 1-800-966-4354 | |
The Fund has performed an analysis of all existing investments to determine the significance and character of all inputs to their fair value determination. Various inputs are used in determining the value of the Fund’s investments. The inputs or methodology used for valuing securities are not necessarily an indication of the risk associated with investing in those securities. Details related to the fair valuation hierarchy of the Fund’s securities as of October 31, 2015 are included in the Fund’s Schedule of Investments.
4). INVESTMENT TRANSACTIONS
Purchases and sales of investment securities (excluding government and short-term investments) for the Fund during the fiscal year ended October 31, 2015 were $90,881,486 and $99,030,144, respectively.
There were no purchases or sales/maturities of long-term U.S. Government Securities for the Fund during the fiscal year ended October 31, 2015.
5). INVESTMENT MANAGEMENT FEE AND OTHER TRANSACTIONS WITH AFFILIATES
Hennessy Advisors, Inc. (the “Advisor”) is the investment advisor of the Fund. The Advisor provides the Fund with investment management services under an Investment Advisory Agreement. The Advisor furnishes all investment advice, office space, facilities, and provides most of the personnel needed by the Fund. As compensation for its services, the Advisor is entitled to a monthly fee from the Fund. The fee is based upon the average daily net assets of the Fund at the annual rate of 0.74%. The net investment advisory fees payable by the Fund as of October 31, 2015 were $69,017.
In the past, the Advisor has agreed to waive its fees and absorb expenses to the extent that the total annual operating expenses (excluding all federal, state and local taxes, interest, brokerage commissions, acquired fund fees and expenses and other costs incurred in connection with the purchase and sale of securities and extraordinary items) exceeded 0.98% of the Fund’s net assets for the Institutional Class shares of the Fund. The expense limitation agreement for the Institutional Class shares could only be terminated by the Board and was terminated by the Board as of February 28, 2015.
For a period of three years after the year in which the Advisor waived or reimbursed expenses, the Advisor may seek reimbursement from the Fund to the extent that total annual fund operating expenses are less than the expense limitation that was in effect at the time the Advisor waived or reimbursed expenses. The Advisor waived or reimbursed expenses of $238 for the Fund during the fiscal year ended October 31, 2015. As of October 31, 2015, cumulative expenses subject to potential recovery under the aforementioned conditions were $238 for Institutional Class shares, which will expire on October 31, 2018.
The Board has approved a Shareholder Servicing Agreement for the Investor Class shares of the Fund, which was instituted to compensate the Advisor for the non-investment management services it provides to the Fund. The Shareholder Servicing Agreement provides for a monthly fee paid to the Advisor at an annual rate of 0.10% of the average daily net assets of the Fund attributable to Investor Class shares. Shareholder service fees payable by the Fund as of October 31, 2015 were $8,183.
The Fund has entered into agreements with various brokers, dealers, and financial intermediaries in connection with the sale of shares of the Fund. The agreements provide for periodic payments by the Fund to the brokers, dealers, and financial intermediaries for providing certain shareholder maintenance services (sub-transfer agent expenses). These shareholder services include the pre-processing and quality control of new accounts, shareholder correspondence, answering customer inquiries regarding account status, and facilitating shareholder telephone transactions. Fees paid by the
Fund to various brokers, dealers, and financial intermediaries during the fiscal year ended October 31, 2015 were $67,148.
U.S. Bancorp Fund Services, LLC (“USBFS”) provides the Fund with administrative, fund accounting, and transfer agent services, including all regulatory reporting, and necessary office equipment and personnel. As administrator, USBFS is responsible for activities such as (i) preparing various federal and state regulatory filings, reports, and returns for the Fund, (ii) preparing reports and materials to be supplied to the Board, (iii) monitoring the activities of the Fund’s custodian, transfer agent, and accountants, and (iv) coordinating the preparation and payment of the Fund’s expenses and reviewing the Fund’s expense accruals. Fees paid to USBFS during the fiscal year ended October 31, 2015 were $118,095.
U.S. Bank, N.A., an affiliate of USBFS, serves as the Fund’s custodian. Quasar Distributors, LLC acts as the Fund’s principal underwriter in a continuous public offering of the Fund’s shares. Quasar Distributors, LLC is an affiliate of USBFS and U.S. Bank, N.A.
6). LINE OF CREDIT
The Fund has an uncommitted line of credit with the other funds in the Hennessy Funds family of funds (the “Hennessy Funds”) in the amount of the lesser of (i) $100,000,000 or (ii) 33.33% of each Hennessy Fund’s net assets, or 30% for the Hennessy Gas Utility Fund and 10% for the Hennessy Balanced Fund, intended to provide short-term financing, if necessary, subject to certain restrictions, in connection with shareholder redemptions. The credit facility is with the Hennessy Funds’ custodian bank, U.S. Bank, N.A. Borrowings under this arrangement bear interest at the bank’s prime rate and are secured by all of the Fund’s assets (as to its own borrowings only). During the fiscal year ended October 31, 2015, the Fund did not have any borrowings outstanding under the line of credit.
7). FEDERAL TAX INFORMATION
As of October 31, 2015, the components of accumulated earnings (losses) for income tax purposes were as follows:
| | Cost of investments for tax purposes | | $ | 111,428,315 | |
| | Gross tax unrealized appreciation | | $ | 11,949,775 | |
| | Gross tax unrealized depreciation | | | (10,477,605 | ) |
| | Net tax unrealized appreciation | | $ | 1,472,170 | |
| | Undistributed ordinary income | | $ | 1,652,799 | |
| | Undistributed long-term capital gains | | | 22,653,659 | |
| | Total distributable earnings | | $ | 24,306,458 | |
| | Other accumulated loss | | $ | (1,015,253 | ) |
| | Total accumulated gain | | $ | 24,763,375 | |
The difference between book-basis and tax-basis unrealized appreciation is attributable primarily to wash sales.
At October 31, 2015, the Fund had capital loss carryforwards of $1,015,253 that expire on October 31, 2016.
During the fiscal year ended October 31, 2015, the capital loss carry forwards utilized for the Fund were $1,015,253.
Capital losses sustained in the fiscal year ended October 31, 2012 and in future taxable years will not expire and may be carried over by the Fund without limitation; however, they will retain the character of the original loss. Furthermore, any loss incurred during those taxable years will be required to be utilized prior to the losses incurred in taxable years prior to 2012. As a result of this ordering rule, pre-enactment
| HENNESSY FUNDS | 1-800-966-4354 | |
capital loss carryforwards may be more likely to expire unused. Under pre-enactment law, capital losses could be carried forward for eight years, and carried forward as short-term capital losses, irrespective of the character of the original loss.
At October 31, 2015, the Fund did not defer, on a tax basis, any post-December late year ordinary loss deferrals.
The tax character of distributions paid during fiscal year 2015 and fiscal year 2014 for the Fund were as follows:
| | | | Year Ended | | | Year Ended | |
| | | | October 31, 2015 | | | October 31, 2014 | |
| | Ordinary income | | $ | 1,313,681 | | | $ | 1,205,688 | |
| | Long-term capital gain | | | 17,714,965 | | | | 5,166,822 | |
| | | | $ | 19,028,646 | | | $ | 6,372,510 | |
8). EVENTS SUBSEQUENT TO YEAR END
Management has evaluated the Fund’s related events and transactions that occurred subsequent to October 31, 2015, through the date of issuance of the Fund’s financial statements. Other than as disclosed below, management has determined that there were no subsequent events requiring recognition or disclosure in the financial statements.
On December 9, 2015, capital gains were declared and paid to shareholders of record as of December 8, 2015 as follows:
| | | Long-term | |
| | Investor Class | $2.73419 | |
| | Institutional Class | $2.76324 | |
Effective November 1, 2015, the Fund adopted a plan pursuant to Rule 12b-1 under the Investment Company Act of 1940, as amended, that authorizes payments in connection with the distribution of the Fund’s shares at an annual rate of up to 0.25% of the Fund’s average daily net assets attributable to Investor Class shares. Even though the authorized rate is up to 0.25%, the Fund has only used 0.15% of its average daily net assets attributable to Investor Class shares for such purpose since the plan was implemented on November 1, 2015. Amounts paid under the plan may be spent on any activities or expenses primarily intended to result in the sale of shares, including but not limited to, advertising, compensation for sales and marketing activities or to financial institutions and others, such as dealers and distributors, shareholder account servicing, the printing and mailing of prospectuses to other than current shareholders, and the printing and mailing of sales literature.
Report of Independent Registered Public Accounting Firm
To the Board of Trustees of Hennessy Funds Trust
and the Shareholders of the Hennessy Cornerstone Large Growth Fund:
We have audited the accompanying statement of assets and liabilities of Hennessy Cornerstone Large Growth Fund (the Fund), a series of Hennessy Funds Trust, including the schedule of investments, as of October 31, 2015, and the related statement of operations for the year then ended, the statements of changes in net assets for each of the years in the two-year period then ended, and the financial highlights for each of the years in the five-year period then ended. These financial statements and financial highlights are the responsibility of the Fund’s management. Our responsibility is to express an opinion on these financial statements and financial highlights based on our audits.
We conducted our audits in accordance with the standards of the Public Company Accounting Oversight Board (United States). Those standards require that we plan and perform the audit to obtain reasonable assurance about whether the financial statements and financial highlights are free of material misstatement. An audit includes examining, on a test basis, evidence supporting the amounts and disclosures in the financial statements. Our procedures included confirmation of investments owned as of October 31, 2015, by correspondence with the custodian and brokers or by other appropriate auditing procedures. An audit also includes assessing the accounting principles used and significant estimates made by management, as well as evaluating the overall financial statement presentation. We believe that our audits provide a reasonable basis for our opinion.
In our opinion, the financial statements and financial highlights referred to above present fairly, in all material respects, the financial position of the Fund as of October 31, 2015, and the results of its operations for the year then ended, the changes in its net assets for each of the years in the two-year period then ended, and the financial highlights for each of the years in the five-year period then ended, in conformity with U.S. generally accepted accounting principles.
Milwaukee, Wisconsin
December 23, 2015
| HENNESSY FUNDS | 1-800-966-4354 | |
Trustees and Officers of the Fund (Unaudited)
The business and affairs of the Fund are managed under the direction of the Board of Trustees of the Trust, and the Board of Trustees elects the Officers of the Trust. Information pertaining to the Trustees and the Officers of the Trust is set forth below. Such persons serve until their successors are duly elected and qualified or until their earlier death, resignation, or removal. Each of the Trustees oversees 16 Hennessy Funds. Unless otherwise indicated, the address of all persons listed below is 7250 Redwood Boulevard, Suite 200, Novato, CA 94945. The Fund’s Statement of Additional Information includes more information about the persons listed below and is available, without charge, upon request by calling 1-800-966-4354.
| | | | Other |
| | | | Directorships |
| Name, Year of Birth, | | | (During Past |
| and Position Held | Length of | Principal Occupation(s) | Five Years) |
with the Trust | Time Served | During Past Five Years | Held by Trustee(1) |
| | | | |
| Disinterested Trustees | | | |
| | | | |
| J. Dennis DeSousa (1936) | Since January | Mr. DeSousa is a real estate investor. | Hennessy SPARX |
| Trustee | 1996 for the | | Funds Trust; |
| | Hennessy Funds | | Hennessy Mutual |
| | | | Funds, Inc.; and |
| | | | The Hennessy |
| | | | Funds, Inc. |
| | | | |
| Robert T. Doyle (1947) | Since January | Mr. Doyle has been the Sheriff of | Hennessy SPARX |
| Trustee | 1996 for the | Marin County, California since 1996. | Funds Trust; |
| | Hennessy Funds | | Hennessy Mutual |
| | | | Funds, Inc.; and |
| | | | The Hennessy |
| | | | Funds, Inc. |
| | | | |
| Gerald P. Richardson (1945) | Since May | Mr. Richardson is an independent | Hennessy SPARX |
| Trustee | 2004 for the | consultant in the securities industry. | Funds Trust; |
| | Hennessy Funds | | Hennessy Mutual |
| | | | Funds, Inc.; and |
| | | | The Hennessy |
| | | | Funds, Inc. |
Interested Trustee(2) | | | |
| | | | |
| Neil J. Hennessy (1956) | Since January | Mr. Hennessy has been employed by | Hennessy Advisors, |
| Trustee, Chairman of | 1996 as a Trustee | Hennessy Advisors, Inc., the Funds’ | Inc.; Hennessy |
| the Board, Chief | for the Hennessy | investment advisor, since 1989. | SPARX Funds Trust; |
| Investment Officer, | Funds and since | He currently serves as President, | Hennessy Mutual |
| Portfolio Manager, | June 2008 as | Chairman and Chief Executive Officer | Funds, Inc.; and |
| and President | an Officer of the | of Hennessy Advisors, Inc. | The Hennessy |
| | Hennessy Funds | | Funds, Inc. |
| Name, Year of Birth, | | |
| and Position Held | Length of | Principal Occupation(s) |
with the Trust | Time Served | During Past Five Years |
| | | |
| Officers | | |
| | | |
| Teresa M. Nilsen (1966) | Since January | Ms. Nilsen has been employed by Hennessy Advisors, Inc., |
| Executive Vice President | 1996 for the | the Funds’ investment advisor, since 1989. She currently |
| and Treasurer | Hennessy Funds | serves as Executive Vice President, Chief Operations Officer, |
| | | Chief Financial Officer, and Secretary of Hennessy Advisors, Inc. |
| | | |
| Daniel B. Steadman (1956) | Since March | Mr. Steadman has been employed by Hennessy Advisors, Inc., |
| Executive Vice President | 2000 for the | the Funds’ investment advisor, since 2000. He currently serves |
| and Secretary | Hennessy Funds | as Executive Vice President and Chief Compliance Officer of |
| | | Hennessy Advisors, Inc. |
| | | |
| Jennifer Cheskiewicz (1977) | Since June | Ms. Cheskiewicz has been employed by Hennessy Advisors, |
| Senior Vice President and | 2013 for the | Inc., the Funds’ investment advisor, since June 2013. She |
| Chief Compliance Officer | Hennessy Funds | currently serves as General Counsel of Hennessy Advisors, Inc. |
| | | |
| | | She previously served as in-house counsel to Carlson Capital, |
| | | L.P., an SEC-registered investment advisor to several private |
| | | funds from February 2010 to May 2013. |
| | | |
| Brian Carlson (1972) | Since December | Mr. Carlson has been employed by Hennessy Advisors, Inc., the |
| Senior Vice President and | 2013 for the | Funds’ investment advisor, since December 2013. |
| Head of Distribution | Hennessy Funds | |
| | | Mr. Carlson was previously a co-founder and principal of |
| | | Trivium Consultants, LLC from February 2011 through |
| | | November 2013. |
| | | |
David Ellison (1958)(3) | Since October | Mr. Ellison has served as a Portfolio Manager of the Hennessy |
| Senior Vice President and | 2012 for the | Small Cap Financial Fund, the Hennessy Large Cap Financial |
| Portfolio Manager | Hennessy Funds | Fund, and the Hennessy Technology Fund since inception. |
| | | |
| | | Mr. Ellison previously served as Director, CIO and President of |
| | | FBR Fund Advisers, Inc. from December 1999 to October 2012. |
| | | |
| Brian Peery (1969) | Since March | Mr. Peery has served as a Portfolio Manager of the Hennessy |
| Senior Vice President and | 2003 as an | Cornerstone Growth Fund, the Hennessy Cornerstone Mid Cap |
| Portfolio Manager | Officer of the | 30 Fund, the Hennessy Cornerstone Large Growth Fund, the |
| | Hennessy Funds | Hennessy Cornerstone Value Fund, the Hennessy Total Return |
| | and since | Fund, and the Hennessy Balanced Fund since October 2014. |
| | February 2011 | From February 2011 through September 2014, he served as |
| | as a Co-Portfolio | Co-Portfolio Manager of the same funds. Mr. Peery has also |
| | Manager or | served as a Portfolio Manager of the Hennessy Gas Utility Fund |
| | Portfolio Manager | since February 2015. |
| | for the | |
| | Hennessy Funds | Mr. Peery has been employed by Hennessy Advisors, Inc., the |
| | | Funds’ investment advisor, since 2002. |
| | | |
| Winsor (Skip) Aylesworth | Since October | Mr. Aylesworth has served as a Portfolio Manager of the |
(1947)(3) | 2012 for the | Hennessy Gas Utility Fund since 1998 and as a Portfolio |
| Vice President and | Hennessy Funds | Manager of the Hennessy Technology Fund since inception. |
| Portfolio Manager | | |
| | Mr. Aylesworth previously served as Executive Vice President |
| | | of The FBR Funds from 1999 to October 2012. |
| HENNESSY FUNDS | 1-800-966-4354 | |
| Name, Year of Birth, | | |
| and Position Held | Length of | Principal Occupation(s) |
with the Trust | Time Served | During Past Five Years |
| | | |
Ryan Kelley (1972)(4) | Since March | Mr. Kelley has served as a Portfolio Manager of the Hennessy |
| Vice President and | 2013 for the | Gas Utility Fund, the Hennessy Small Cap Financial Fund, and |
| Portfolio Manager | Hennessy Funds | the Hennessy Large Cap Financial Fund since October 2014. |
| | | From March 2013 through September 2014, he served as a |
| | | Co-Portfolio Manager of the same funds. Prior to that, |
| | | he was a Portfolio Analyst of the Hennessy Funds. |
(1) | Pursuant to an internal reorganization, the series of Hennessy Mutual Funds, Inc. (“HMFI”), The Hennessy Funds, Inc. (“HFI”), and Hennessy SPARX Funds Trust (“HSFT”) were reorganized into series of Hennessy Funds Trust on February 28, 2014, which mirrored the corresponding series of HFMI, HFI, and HSFT. Subsequent to the reorganization, HFMI, HFI, and HSFT were dissolved. |
(2) | Mr. Hennessy is considered an “interested person,” as defined in the Investment Company Act of 1940, as amended, because he is an officer of the Hennessy Funds. |
(3) | The address of these officers is 101 Federal Street, Suite 1900, Boston, MA 02110. |
(4) | The address of this officer is 1340 Environ Way, Chapel Hill, NC 27517. |
(This Page Intentionally Left Blank.)
| HENNESSY FUNDS | 1-800-966-4354 | |
Expense Example (Unaudited)
October 31, 2015
As a shareholder of the Fund, you incur two types of costs: (1) transaction costs, including sales charges (loads) on purchase payments, reinvested dividends, or other distributions; redemption fees; and exchange fees; and (2) ongoing costs, including management fees; service fees; and other Fund expenses. This Example is intended to help you understand your ongoing costs (in dollars) of investing in the Fund and to compare these costs with the ongoing costs of investing in other mutual funds. The Example is based on an investment of $1,000 invested at the beginning of the period and held for the entire period from May 1, 2015 through October 31, 2015.
Actual Expenses
The first line of the table below under the “Investor Class” and “Institutional Class” headings provides information about actual account values and actual expenses. Although the Fund charges no sales loads or transaction fees, you will be assessed fees for outgoing wire transfers, returned checks and stop payment orders at prevailing rates charged by U.S. Bancorp Fund Services, LLC, the Fund’s transfer agent. If you request that a redemption be made by wire transfer, currently a $15.00 fee is charged by the Fund’s transfer agent. IRA accounts will be charged a $15.00 annual maintenance fee. The example below includes, but is not limited to, management fees, shareholder servicing fees, fund accounting, custody, and transfer agent fees. However, the example below does not include portfolio trading commissions and related expenses, and other extraordinary expenses as determined under generally accepted accounting principles. You may use the information in this line, together with the amount you invested, to estimate the expenses that you paid over the period. Simply divide your account value by $1,000 (for example, an $8,600 account value divided by $1,000 = 8.6), then multiply the result by the number in the first line of the table under the “Investor Class” and “Institutional Class” headings in the column entitled “Expenses Paid During Period” to estimate the expenses you paid on your account during this period.
Hypothetical Example for Comparison Purposes
The second line of the table below under the “Investor Class” and “Institutional Class” headings provides information about hypothetical account values and hypothetical expenses based on the Fund’s actual expense ratios and an assumed rate of return of 5% per year before expenses, which is not the Fund’s actual return. The hypothetical account values and expenses may not be used to estimate the actual ending account balance or expenses you paid for the period. You may use this information to compare the ongoing costs of investing in the Fund and other funds. To do so, compare this 5% hypothetical example with the 5% hypothetical examples that appear in the shareholder reports of the other funds. Please note that the expenses shown in the table are meant to highlight your ongoing costs only and do not reflect any transactional costs, such as sales charges (loads), or exchange fees. Therefore, the second line of the table under the “Investor Class” and “Institutional Class” headings is useful in comparing ongoing costs only, and will not help you determine the relative total costs of owning different funds. In addition, if these transactional costs were included, your costs would have been higher.
| | | | Expenses Paid |
| | Beginning | Ending | During Period(1) |
| | Account Value | Account Value | May 1, 2015 – |
| | May 1, 2015 | October 31, 2015 | October 31, 2015 |
| Investor Class | | | |
| Actual | $1,000.00 | $ 950.30 | $5.36 |
| Hypothetical (5% return before expenses) | $1,000.00 | $1,019.71 | $5.55 |
| Institutional Class | | | |
| Actual | $1,000.00 | $ 950.70 | $4.82 |
| Hypothetical (5% return before expenses) | $1,000.00 | $1,019.27 | $4.99 |
(1) | Expenses are equal to the Fund’s annualized expense ratio of 1.09% for Investor Class shares or 0.98% for Institutional Class shares, as applicable, multiplied by the average account value over the period, multiplied by 184/365 days (to reflect one-half year period). |
| HENNESSY FUNDS | 1-800-966-4354 | |
How to Obtain a Copy of the Fund’s
Proxy Voting Policy and Proxy Voting Records
A description of the policies and procedures the Fund uses to determine how to vote proxies relating to portfolio securities is available without charge: (1) by calling 1-800-966-4354; (2) on the Hennessy Funds’ website at hennessyfunds.com/proxy-voting/policy.fs; or (3) on the U.S. Securities and Exchange Commission’s website at www.sec.gov. The Fund’s proxy voting record is available without charge on both the Hennessy Funds’ website at hennessyfunds.com/proxy-voting/policy.fs and the SEC’s website at www.sec.gov no later than August 31 for the prior 12 months ending June 30.
Quarterly Filings on Form N-Q
The Fund files its complete schedule of portfolio holdings with the SEC for the first and third quarters of each fiscal year on Form N-Q. The Fund’s Form N-Q will be available on the SEC’s website at www.sec.gov. The Fund’s Form N-Q may be reviewed and copied at the SEC’s Public Reference Room in Washington, DC and information on the operation of the Public Reference Room may be obtained by calling 1-800-SEC-0330. Information included in the Fund’s N-Q will also be available upon request by calling 1-800-966-4354.
Federal Tax Distribution Information
(Unaudited)
For the fiscal year ended October 31, 2015, certain dividends paid by the Fund may be subject to a maximum tax rate of 23.8%, as provided for by the Jobs and Growth Tax Relief Reconciliation Act of 2003. The percentage of dividends declared from ordinary income designated as qualified dividend income was 100.00%.
For corporate shareholders, the percent of ordinary income distributions that qualified for the corporate dividends received deduction for the fiscal year ended October 31, 2015 was 100.00%.
The percentage of taxable ordinary income distributions that are designated as short-term capital gain distributions under Section 871(k)(2)(C) of the Internal Revenue Code of 1986, as amended, for the Fund was 0.00%.
Householding
To help keep the Fund’s costs as low as possible, we generally deliver a single copy of most financial reports and prospectuses to shareholders who share an address, even if the accounts are registered under different names. This process, known as “householding,” does not apply to account statements. You may, of course, request an individual copy of a prospectus or financial report at any time. If you would like to receive separate mailings, please call the Administrator at 1-800-261-6950 or 1-414-765-4124 and we will begin individual delivery within 30 days of your request. If your account is held through a financial institution or other intermediary, please contact them directly to request individual delivery.
Matters Submitted to a Shareholder Vote
A special meeting of shareholders of the Investor Class shares of the Fund was held on September 15, 2015, and the following matters were approved by the Fund’s voting Investor Class shares:
| | For | Against | Abstain |
| To approve a distribution | | | |
| (Rule 12b-1) plan for the | | | |
| Investor Class shares of the Fund | 4,109,029.550 | 613,737.288 | 84,041.989 |
Privacy Policy
We collect the following non-public personal information about you:
| | • | information we receive from you on or in applications or other forms, correspondence, or conversations, including, but not limited to, your name, address, phone number, social security number, assets, income, and date of birth; and |
| | • | information about your transactions with us, our affiliates, or others, including, but not limited to, your account number and balance, payment history, parties to transactions, cost basis information, and other financial information. |
We do not disclose any non-public personal information about our current or former shareholders to nonaffiliated third parties, except as permitted by law. For example, we are permitted by law to disclose all of the information we collect, as described above, to our Transfer Agent to process your transactions. Furthermore, we restrict access to your non-public personal information to those persons who require such information to provide products or services to you. We maintain physical, electronic, and procedural safeguards that comply with federal standards to guard your non-public personal information.
In the event that you hold shares of the Fund through a financial intermediary, including, but not limited to, a broker-dealer, bank or trust company, the privacy policy of your financial intermediary would govern how your non-public personal information would be shared with nonaffiliated third parties.
| HENNESSY FUNDS | 1-800-966-4354 | |
For information, questions or assistance, please call
The Hennessy Funds
1-800-966-4354 or 1-415-899-1555
INVESTMENT ADVISOR
Hennessy Advisors, Inc.
7250 Redwood Blvd., Suite 200
Novato, California 94945
ADMINISTRATOR,
TRANSFER AGENT,
DIVIDEND PAYING AGENT &
SHAREHOLDER SERVICING AGENT
U.S. Bancorp Fund Services, LLC
P.O. Box 701
Milwaukee, Wisconsin 53201-0701
CUSTODIAN
U.S. Bank N.A.
Custody Operations
1555 North River Center Dr., Suite 302
Milwaukee, Wisconsin 53212
TRUSTEES
Neil J. Hennessy
Robert T. Doyle
J. Dennis DeSousa
Gerald P. Richardson
COUNSEL
Foley & Lardner LLP
777 East Wisconsin Avenue
Milwaukee, Wisconsin 53202-5306
INDEPENDENT REGISTERED
PUBLIC ACCOUNTING FIRM
KPMG LLP
777 East Wisconsin Avenue
Milwaukee, Wisconsin 53202-5306
DISTRIBUTOR
Quasar Distributors, LLC
615 East Michigan Street
Milwaukee, Wisconsin 53202
hennessyfunds.com | 1-800-966-4354
This report has been prepared for shareholders and may be distributed to
others only if preceded or accompanied by a current prospectus.

ANNUAL REPORT
OCTOBER 31, 2015
HENNESSY CORNERSTONE
VALUE FUND
Investor Class HFCVX
Institutional Class HICVX
| hennessyfunds.com | 1-800-966-4354 |
(This Page Intentionally Left Blank.)
Contents
| Letter to Shareholders | 2 |
| Performance Overview | 4 |
| Financial Statements | |
| Schedule of Investments | 7 |
| Statement of Assets and Liabilities | 12 |
| Statement of Operations | 13 |
| Statements of Changes in Net Assets | 15 |
| Financial Highlights | 16 |
| Notes to the Financial Statements | 20 |
| Report of Independent Registered Public Accounting Firm | 28 |
| Trustees and Officers of the Fund | 29 |
| Expense Example | 32 |
| Proxy Voting | 34 |
| Quarterly Filings on Form N-Q | 34 |
| Federal Tax Distribution Information | 34 |
| Householding | 34 |
| Matters Submitted to a Shareholder Vote | 35 |
| Privacy Policy | 35 |
| HENNESSY FUNDS | 1-800-966-4354 | |
December 2015
Dear Hennessy Funds Shareholder:
As I look back over the year, I am reminded that the U.S. economy has come a long way since the depths of the recession in 2009. The economy has been expanding steadily for almost six years, the unemployment rate has halved, the housing market has been recovering and capital expenditures have been growing. The financial markets have performed well too, driven largely by strong corporate earnings growth, especially in the early years. The U.S. market, as measured by the S&P 500 Index, has roughly tripled since the bull market began in 2009, and the Index’s earnings per share have increased 260% over this same time period. For the year ended October 31, 2015, the U.S. equity market performed reasonably well, with the S&P 500 posting another advance of 5.2%. However, behind this headline number, the market experienced a great deal of volatility as investors reacted to falling energy prices, a rise in the U.S. Dollar, pressure on export earnings growth, slower growth in China and, most significantly, the likelihood of a rise in the Fed Funds rate for the first time in nearly a decade – the featured topic of conversation around every office water cooler in the financial world this year.
Investors, reporters and friends often ask me “What’s next?” The market has been in a volatile, sideways correction for over a year now, and throughout this period of volatility, I have consistently advised investors to continue to focus on the long-term fundamentals of the market.
In my view, the fundamentals of the market are in good shape. Despite a stronger U.S. Dollar and its impact on export growth, the economy is still growing steadily. Inflation remains low, so we expect the Federal Reserve, once it does begin to raise short-term interest rates, will not likely raise them by very much. New jobs are being created at what I believe is a healthy rate, and average hourly wages are rising in response to a tighter labor market. Higher wages and lower gasoline prices are helping to keep consumer confidence positive.
Notwithstanding what I view as a relatively solid economic environment, however, I think investor sentiment remains restrained. The same factors that contributed to the market volatility this past year are still troubling investors today: the slowdown in the Chinese economy, slower earnings growth here in the U.S., and, of course, the prospect of rising interest rates. As a result of these investor worries, I do not see any solid enthusiasm for the market – no euphoria. Universal optimism about the market often coincides with a peak in stock prices and this absence of euphoria is yet another reason I feel bullish. And finally, I do not believe stocks are expensive. The Dow Jones Industrial Average and the S&P 500 Index have forward PE (price-to-earnings) ratios of approximately 16x and 17x, respectively, close to long-term averages. In my view, these fundamentals taken together signal a continuation of the bull market that began six years ago.
A final positive note: I still do not believe that investors have fully returned to investing in U.S. equities. Assets in domestic equity funds have now reached parity with fixed income/money market funds, with $6.2 trillion in each. I believe that fixed income investments will continue to trickle into equities, which should have a positive effect on the market.
Thank you for your continued confidence and investment in our products. If you have any questions or would like to speak with us directly, please don’t hesitate to call us at (800) 966-4354.
Best regards,
Neil J. Hennessy
President and Chief Investment Officer
Past performance does not guarantee future results.
Mutual fund investing involves risk. Principal loss is possible.
Opinions expressed are those of Neil Hennessy and are subject to change, are not guaranteed and should not be considered investment advice.
The Dow Jones Industrial Average and the S&P 500 Index are unmanaged indices commonly used to measure the performance of U.S. stocks. One cannot invest directly in an index.
Price to earnings (“PE”) is the market price per share divided by earnings per share. Earnings per share is the portion of a company’s profit allocated to each outstanding share of common stock. It serves as an indicator of a company’s profitability.
| HENNESSY FUNDS | 1-800-966-4354 | |
Performance Overview (Unaudited)
CHANGE IN VALUE OF $10,000 INVESTMENT
This graph illustrates the performance of an initial investment of $10,000 made in the Fund ten years ago and assumes the reinvestment of dividends.
AVERAGE ANNUAL TOTAL RETURN FOR PERIODS ENDED OCTOBER 31, 2015
| | One | Five | Ten |
| | Year | Years | Years |
| Hennessy Cornerstone Value Fund – | | | |
| Investor Class (HFCVX) | -1.77% | 10.10% | 6.26% |
| Hennessy Cornerstone Value Fund – | | | |
Institutional Class (HICVX)(1) | -1.72% | 10.35% | 6.45% |
Russell 1000® Value Index | 0.53% | 13.26% | 6.75% |
| S&P 500 Index | 5.20% | 14.33% | 7.85% |
Expense ratios from most recent prospectus: 1.09% (Investor Class); 0.95% (Institutional Class). As set forth in the Supplement to the Prospectus dated October 7, 2015, a 12b-1 fee of 0.15% was instituted on Investor Class shares effective as of November 1, 2015, and is not included in the Investor Class expense ratio.
Performance data quoted represents past performance; past performance does not guarantee future results. The investment return and principal value of an investment will fluctuate so that an investor’s shares, when redeemed, may be worth more or less than their original cost. The performance graph and table do not reflect the deduction of taxes that a shareholder would pay on Fund distributions or the redemption of Fund shares. Current performance of the Fund may be lower or higher than the performance quoted. Performance data current to the most recent month end may be obtained by visiting hennessyfunds.com.
(1) | The inception date of Institutional Class shares is March 3, 2008. Performance shown prior to the inception of Institutional Class shares reflects the performance of Investor Class shares and includes expenses that are not applicable to and are higher than those of Institutional Class shares. |
PERFORMANCE NARRATIVE
Portfolio Managers Neil Hennessy and Brian Peery
Performance:
For the twelve-month period ended October 31, 2015, the Investor Class of the Hennessy Cornerstone Value Fund returned -1.77%, underperforming the Russell 1000® Value
Index and the S&P 500 Index, which returned 0.53% and 5.20% for the same period, respectively.
Sector allocation, chiefly overweight positions in Energy and Materials, accounted for all of the Fund’s relative underperformance over the year. Stocks in these sectors were driven lower in tandem with the year-long decline in the price of the commodities that many of them produce and sell. Performance was also hurt by the Fund’s underweight position in the Financials sector, which performed well due to expectations of the Federal Reserve increasing interest rates. Offsetting some of the drag from sector allocation, the Fund benefitted from strong stock selection overall, and especially in the Consumer sectors, where Altria Group, Inc., General Mills, Inc., Kellogg Co. and McDonald’s Corp. performed particularly well. The Fund continues to hold all these stocks.
Portfolio Strategy:
The Fund’s investment strategy is to identify large, widely-held stocks that exhibit strong sales and cash flow. The Fund then selects the companies we believe are best able to pay and sustain a high dividend yield. Limiting the Fund’s portfolio to 50 stocks produces a relatively concentrated portfolio, where individual stock performance can influence the performance of the portfolio as a whole.
Market Outlook:
Over the twelve-month period ended October 31, 2015, U.S. equities, as measured by the S&P 500 Index, advanced by just over 5%. Notwithstanding this modest rise, the year was marked by a great deal of volatility, especially during the second half of the period when uncertainty regarding the timing and magnitude of a rise in short-term interest rates being contemplated by the Federal Reserve dominated investor thinking. Earnings growth, too, caused anxiety for investors. Lower energy prices impacted many companies in the Energy sector, and the higher U.S. Dollar and slower growth abroad affected exporters. Many companies saw their sales and earnings growth slow.
In the end, however, confidence in continued economic growth was strong enough to offset investor concerns, with the market staging a dramatic rally in October, the final month of the Fund’s fiscal year. We believe the basic fundamentals of the market are attractive, and we continue to be optimistic about the possibility of further market advances over the course of the next year. The economy is growing slowly but steadily. Inflation is low, so we expect that the Fed, once they do start to raise rates, will not raise them by very much. The labor market has continued to recover over the last 12 months, and consumer confidence appears buoyant. Most importantly, we do not believe stocks are expensive. The Dow Jones Industrial Average and the S&P 500 have forward PE ratios of approximately 16x and 17x, respectively, close to long-term averages. Corporate balance sheets appear to be in excellent shape, and while executives have shown some reluctance to increase capital spending beyond maintenance levels this cycle, we believe companies will eventually start investing for expansion. This spending could, in turn, help drive share prices higher through an acceleration in sales and earnings growth.
Investment Outlook:
Large, multinational companies have been facing difficulties recently. Just the prospect of higher interest rates has led to a rally in the U.S. Dollar, and we believe actual higher rates, when they take effect, will lead to an even stronger U.S. Dollar, hampering profits growth for some large American corporations. Meanwhile, energy stocks have fallen as investors have shunned them in the wake of slumping oil prices. As a result, some of what we believe are the highest quality companies in the U.S. with the strongest financials are trading at very reasonable valuations in our view. We believe these stocks are attractive
| HENNESSY FUNDS | 1-800-966-4354 | |
“value” investments, and this opinion is reflected in our sector weightings in the Fund today, with the three largest weightings in Consumer Staples, Energy and Financials. Some large corporations are also restructuring their operations to improve growth and profitability. We are hopeful that McDonald’s, Microsoft and General Electric will benefit the portfolio as a result of their reforms over the coming year.
Opinions expressed are those of the Portfolio Managers as of the date written and are subject to change, are not guaranteed, and should not be considered investment advice or an indication of trading intent.
The Russell 1000® Value Index is an unmanaged index commonly used to measure the performance of U.S. large-capitalization value stocks. The S&P 500 Index and Dow Jones Industrial Average are unmanaged indices commonly used to measure the performance of U.S. stocks. One cannot invest directly in an index.
The Fund may invest in medium capitalized companies, which may have more limited liquidity and greater price volatility than large capitalization companies. Investments in foreign securities may involve political, economic and currency risks, greater volatility and differences in accounting methods. The Fund’s formula-based strategy may cause the Fund to buy or sell securities at times when it may not be advantageous.
References to specific securities should not be considered a recommendation to buy or sell any security. Fund holdings and sector allocations are subject to change. Please refer to the Schedule of Investments included in this report for additional portfolio information.
Earnings growth is not a measure of the Fund’s future performance. Dividend yield is calculated as the annual dividends paid by a company divided by the price of a share of their stock. PE, or price to earnings, is calculated by dividing a company’s market price per share by its earnings per share.
Financial Statements
Schedule of Investments as of October 31, 2015 |
HENNESSY CORNERSTONE VALUE FUND
(% of Net Assets)
| TOP TEN HOLDINGS (EXCLUDING CASH/CASH EQUIVALENTS) | % NET ASSETS |
| Microsoft Corp. | 2.69% |
| McDonald’s Corp. | 2.63% |
| Valero Energy Corp. | 2.62% |
| General Electric Co. | 2.55% |
| Altria Group, Inc. | 2.47% |
| Kimberly Clark Corp. | 2.40% |
| General Mills, Inc. | 2.38% |
| Philip Morris International, Inc. | 2.37% |
| Kellogg Co. | 2.33% |
| AbbVie, Inc. | 2.33% |
Note: For presentation purposes, the Fund has grouped some of the industry categories. For purposes of categorizing securities for compliance with Section 8(b)(1) of the Investment Company Act of 1940, as amended, the Fund uses more specific industry classifications.
| HENNESSY FUNDS | 1-800-966-4354 | |
| COMMON STOCKS – 96.91% | | Number | | | | | | % of | |
| | | of Shares | | | Value | | | Net Assets | |
| Consumer Discretionary – 12.56% | | | | | | | | | |
| Ford Motor Co. | | | 179,400 | | | $ | 2,656,914 | | | | 2.02 | % |
| General Motors Co. | | | 79,300 | | | | 2,768,363 | | | | 2.10 | % |
| Las Vegas Sands Corp. | | | 51,200 | | | | 2,534,912 | | | | 1.92 | % |
| McDonald’s Corp. | | | 30,800 | | | | 3,457,300 | | | | 2.63 | % |
| Staples, Inc. | | | 166,800 | | | | 2,166,732 | | | | 1.65 | % |
| Thomson Reuters Corp. (a) | | | 71,800 | | | | 2,945,236 | | | | 2.24 | % |
| | | | | | | | 16,529,457 | | | | 12.56 | % |
| | | | | | | | | | | | | |
| Consumer Staples – 18.36% | | | | | | | | | | | | |
| Altria Group, Inc. | | | 53,700 | | | | 3,247,239 | | | | 2.47 | % |
| General Mills, Inc. | | | 53,900 | | | | 3,132,129 | | | | 2.38 | % |
| Kellogg Co. | | | 43,400 | | | | 3,060,568 | | | | 2.33 | % |
| Kimberly Clark Corp. | | | 26,400 | | | | 3,160,344 | | | | 2.40 | % |
| Philip Morris International, Inc. | | | 35,300 | | | | 3,120,520 | | | | 2.37 | % |
| Procter & Gamble Co. | | | 33,600 | | | | 2,566,368 | | | | 1.95 | % |
| Sysco Corp. | | | 71,200 | | | | 2,937,000 | | | | 2.23 | % |
| The Coca-Cola Co. | | | 69,300 | | | | 2,934,855 | | | | 2.23 | % |
| | | | | | | | 24,159,023 | | | | 18.36 | % |
| | | | | | | | | | | | | |
| Energy – 16.65% | | | | | | | | | | | | |
| Cenovus Energy, Inc. (a) | | | 139,600 | | | | 2,081,436 | | | | 1.58 | % |
| Chevron Corp. | | | 25,900 | | | | 2,353,792 | | | | 1.79 | % |
| ConocoPhillips | | | 42,100 | | | | 2,246,035 | | | | 1.70 | % |
| Exxon Mobil Corp. | | | 31,200 | | | | 2,581,488 | | | | 1.96 | % |
| Marathon Oil Corp. | | | 100,900 | | | | 1,854,542 | | | | 1.41 | % |
| National Oilwell Varco, Inc. | | | 54,100 | | | | 2,036,324 | | | | 1.55 | % |
| Occidental Petroleum Corp. | | | 35,100 | | | | 2,616,354 | | | | 1.99 | % |
| Suncor Energy, Inc. (a) | | | 90,600 | | | | 2,693,538 | | | | 2.05 | % |
| Valero Energy Corp. | | | 52,400 | | | | 3,454,208 | | | | 2.62 | % |
| | | | | | | | 21,917,717 | | | | 16.65 | % |
| | | | | | | | | | | | | |
| Financials – 12.56% | | | | | | | | | | | | |
| Bank of Nova Scotia (a) | | | 54,300 | | | | 2,551,014 | | | | 1.94 | % |
| Manulife Financial Corp. (a) | | | 163,500 | | | | 2,712,465 | | | | 2.06 | % |
| MetLife, Inc. | | | 57,600 | | | | 2,901,888 | | | | 2.20 | % |
| Prudential Financial, Inc. | | | 37,000 | | | | 3,052,500 | | | | 2.32 | % |
| Royal Bank of Canada (a) | | | 46,500 | | | | 2,642,595 | | | | 2.01 | % |
The accompanying notes are an integral part of these financial statements.
| COMMON STOCKS | | Number | | | | | �� | % of | |
| | | of Shares | | | Value | | | Net Assets | |
| Financials (Continued) | | | | | | | | | |
| Toronto-Dominion Bank (a) | | | 65,200 | | | $ | 2,674,504 | | | | 2.03 | % |
| | | | | | | | 16,534,966 | | | | 12.56 | % |
| | | | | | | | | | | | | |
| Health Care – 8.82% | | | | | | | | | | | | |
| AbbVie, Inc. | | | 51,500 | | | | 3,066,825 | | | | 2.33 | % |
| Baxalta, Inc. | | | 41,000 | | | | 1,412,860 | | | | 1.07 | % |
| Baxter International, Inc. | | | 41,000 | | | | 1,532,990 | | | | 1.16 | % |
| Merck & Co., Inc. | | | 49,000 | | | | 2,678,340 | | | | 2.04 | % |
| Pfizer, Inc. | | | 86,300 | | | | 2,918,666 | | | | 2.22 | % |
| | | | | | | | 11,609,681 | | | | 8.82 | % |
| | | | | | | | | | | | | |
| Industrials – 8.43% | | | | | | | | | | | | |
| Caterpillar, Inc. | | | 33,700 | | | | 2,459,763 | | | | 1.87 | % |
| Emerson Electric Co. | | | 49,800 | | | | 2,352,054 | | | | 1.79 | % |
| General Electric Co. | | | 115,900 | | | | 3,351,828 | | | | 2.55 | % |
| Waste Management, Inc. | | | 54,400 | | | | 2,924,544 | | | | 2.22 | % |
| | | | | | | | 11,088,189 | | | | 8.43 | % |
| | | | | | | | | | | | | |
| Information Technology – 4.06% | | | | | | | | | | | | |
| Microsoft Corp. | | | 67,400 | | | | 3,547,936 | | | | 2.69 | % |
| Seagate Technology PLC (a) | | | 47,300 | | | | 1,800,238 | | | | 1.37 | % |
| | | | | | | | 5,348,174 | | | | 4.06 | % |
| | | | | | | | | | | | | |
| Materials – 7.62% | | | | | | | | | | | | |
| Freeport-McMoRan Copper & Gold, Inc. | | | 146,300 | | | | 1,721,951 | | | | 1.31 | % |
| International Paper Co. | | | 52,700 | | | | 2,249,763 | | | | 1.71 | % |
| LyondellBasell Industries NV (a) | | | 32,300 | | | | 3,000,993 | | | | 2.28 | % |
| The Dow Chemical Co. | | | 59,200 | | | | 3,058,864 | | | | 2.32 | % |
| | | | | | | | 10,031,571 | | | | 7.62 | % |
| | | | | | | | | | | | | |
| Telecommunication Services – 7.85% | | | | | | | | | | | | |
| AT&T, Inc. | | | 82,400 | | | | 2,761,224 | | | | 2.10 | % |
| BCE, Inc. (a) | | | 64,900 | | | | 2,804,329 | | | | 2.13 | % |
| CenturyLink, Inc. | | | 72,000 | | | | 2,031,120 | | | | 1.55 | % |
| Verizon Communications, Inc. | | | 58,200 | | | | 2,728,416 | | | | 2.07 | % |
| | | | | | | | 10,325,089 | | | | 7.85 | % |
| | | | | | | | | | | | | |
| Total Common Stocks | | | | | | | | | | | | |
| (Cost $115,377,987) | | | | | | | 127,543,867 | | | | 96.91 | % |
The accompanying notes are an integral part of these financial statements.
| HENNESSY FUNDS | 1-800-966-4354 | |
| REITS – 1.82% | | Number | | | | | | % of | |
| | | of Shares | | | Value | | | Net Assets | |
| Financials – 1.82% | | | | | | | | | |
| Weyerhaeuser Co. | | | 81,900 | | | $ | 2,402,127 | | | | 1.82 | % |
| | | | | | | | | | | | | |
| Total REITS | | | | | | | | | | | | |
| (Cost $2,875,808) | | | | | | | 2,402,127 | | | | 1.82 | % |
| | | | | | | | | | | | | |
| SHORT-TERM INVESTMENTS – 1.16% | | | | | | | | | | | | |
| Money Market Funds – 1.16% | | | | | | | | | | | | |
| Fidelity Government Portfolio – Institutional Class, 0.01% (b) | | | 1,522,213 | | | | 1,522,213 | | | | 1.16 | % |
| | | | | | | | | | | | | |
| Total Short-Term Investments | | | | | | | | | | | | |
| (Cost $1,522,213) | | | | | | | 1,522,213 | | | | 1.16 | % |
| | | | | | | | | | | | | |
| Total Investments | | | | | | | | | | | | |
| (Cost $119,776,008) – 99.89% | | | | | | | 131,468,207 | | | | 99.89 | % |
| Other Assets in | | | | | | | | | | | | |
| Excess of Liabilities – 0.11% | | | | | | | 144,474 | | | | 0.11 | % |
TOTAL NET ASSETS – 100.00% | | | | | | $ | 131,612,681 | | | | 100.00 | % |
Percentages are stated as a percent of net assets.
REIT – Real Estate Investment Trust
| (a) | U.S. traded security of a foreign corporation. |
| (b) | The rate listed is the fund’s 7-day yield as of October 31, 2015. |
The accompanying notes are an integral part of these financial statements.
Summary of Fair Value Exposure at October 31, 2015
The following is a summary of the inputs used to value the Fund’s net assets as of October 31, 2015 (see Note 3 in the accompanying notes to the financial statements):
| Common Stocks | | Level 1 | | | Level 2 | | | Level 3 | | | Total | |
| Consumer Discretionary | | $ | 16,529,457 | | | $ | — | | | $ | — | | | $ | 16,529,457 | |
| Consumer Staples | | | 24,159,023 | | | | — | | | | — | | | | 24,159,023 | |
| Energy | | | 21,917,717 | | | | — | | | | — | | | | 21,917,717 | |
| Financials | | | 16,534,966 | | | | — | | | | — | | | | 16,534,966 | |
| Health Care | | | 11,609,681 | | | | — | | | | — | | | | 11,609,681 | |
| Industrials | | | 11,088,189 | | | | — | | | | — | | | | 11,088,189 | |
| Information Technology | | | 5,348,174 | | | | — | | | | — | | | | 5,348,174 | |
| Materials | | | 10,031,571 | | | | — | | | | — | | | | 10,031,571 | |
| Telecommunication Services | | | 10,325,089 | | | | — | | | | — | | | | 10,325,089 | |
| Total Common Stocks | | $ | 127,543,867 | | | $ | — | | | $ | — | | | $ | 127,543,867 | |
| REITS | | | | | | | | | | | | | | | | |
| Financials | | $ | 2,402,127 | | | $ | — | | | $ | — | | | $ | 2,402,127 | |
| Total REITS | | $ | 2,402,127 | | | $ | — | | | $ | — | | | $ | 2,402,127 | |
| Short-Term Investments | | | | | | | | | | | | | | | | |
| Money Market Funds | | $ | 1,522,213 | | | $ | — | | | $ | — | | | $ | 1,522,213 | |
| Total Short-Term Investments | | $ | 1,522,213 | | | $ | — | | | $ | — | | | $ | 1,522,213 | |
| Total Investments | | $ | 131,468,207 | | | $ | — | | | $ | — | | | $ | 131,468,207 | |
Transfers between levels are recognized at the end of the reporting period. During the year ended October 31, 2015, the Fund recognized no transfers between levels.
The accompanying notes are an integral part of these financial statements.
| HENNESSY FUNDS | 1-800-966-4354 | |
Financial Statements
Statement of Assets and Liabilities as of October 31, 2015 |
| ASSETS: | | | |
| Investments in securities, at value (cost $119,776,008) | | $ | 131,468,207 | |
| Cash | | | 21,513 | |
| Dividends and interest receivable | | | 310,891 | |
| Receivable for fund shares sold | | | 418 | |
| Prepaid expenses and other assets | | | 16,850 | |
| Total Assets | | | 131,817,879 | |
| | | | | |
| LIABILITIES: | | | | |
| Payable for fund shares redeemed | | | 36,909 | |
| Payable to advisor | | | 80,963 | |
| Payable to administrator | | | 21,313 | |
| Payable to auditor | | | 23,600 | |
| Accrued service fees | | | 10,793 | |
| Accrued interest payable | | | 127 | |
| Accrued trustees fees | | | 2,487 | |
| Accrued expenses and other payables | | | 29,006 | |
| Total Liabilities | | | 205,198 | |
| NET ASSETS | | $ | 131,612,681 | |
| NET ASSETS CONSIST OF: | | | | |
| Capital stock | | $ | 121,772,620 | |
| Accumulated net investment income | | | 2,587,361 | |
| Accumulated net realized loss on investments | | | (4,439,328 | ) |
| Unrealized net appreciation on investments | | | 11,692,028 | |
| Total Net Assets | | $ | 131,612,681 | |
| | | | | |
| NET ASSETS | | | | |
| Investor Class: | | | | |
| Shares authorized (no par value) | | Unlimited | |
| Net assets applicable to outstanding Investor Class shares | | $ | 129,859,809 | |
| Shares issued and outstanding | | | 7,342,616 | |
| Net asset value, offering price and redemption price per share | | $ | 17.69 | |
| Institutional Class: | | | | |
| Shares authorized (no par value) | | Unlimited | |
| Net assets applicable to outstanding Institutional Class shares | | $ | 1,752,872 | |
| Shares issued and outstanding | | | 99,223 | |
| Net asset value, offering price and redemption price per share | | $ | 17.67 | |
The accompanying notes are an integral part of these financial statements.
Financial Statements
Statement of Operations for the year ended October 31, 2015 |
| INVESTMENT INCOME: | | | |
Dividend income(1) | | $ | 4,887,563 | |
| Interest income | | | 332 | |
| Total investment income | | | 4,887,895 | |
| | | | | |
| EXPENSES: | | | | |
| Investment advisory fees (See Note 5) | | | 1,058,065 | |
| Administration, fund accounting, custody and transfer agent fees (See Note 5) | | | 141,305 | |
| Service fees – Investor Class (See Note 5) | | | 137,389 | |
| Sub-transfer agent expenses – Investor Class (See Note 5) | | | 99,927 | |
| Sub-transfer agent expenses – Institutional Class (See Note 5) | | | 4,704 | |
| Federal and state registration fees | | | 29,800 | |
| Audit fees | | | 24,426 | |
| Compliance expense | | | 22,187 | |
| Reports to shareholders | | | 14,238 | |
| Trustees’ fees and expenses | | | 11,947 | |
| Legal fees | | | 2,000 | |
| Interest expense (See Note 6) | | | 200 | |
| Other expenses | | | 13,854 | |
| Total expenses | | | 1,560,042 | |
| NET INVESTMENT INCOME | | $ | 3,327,853 | |
| | | | | |
| REALIZED AND UNREALIZED GAINS (LOSSES): | | | | |
| Net realized gain on investments | | $ | 19,281,025 | |
| Net change in unrealized depreciation on investments | | | (25,214,358 | ) |
| Net loss on investments | | | (5,933,333 | ) |
| NET DECREASE IN NET ASSETS RESULTING FROM OPERATIONS | | $ | (2,605,480 | ) |
| | | | | |
(1) | Net of foreign taxes withheld and issuance fees of $117,021. |
The accompanying notes are an integral part of these financial statements.
| HENNESSY FUNDS | 1-800-966-4354 | |
(This Page Intentionally Left Blank.)
Financial Statements
| Statements of Changes in Net Assets |
| | | Year Ended | | | Year Ended | |
| | | October 31, 2015 | | | October 31, 2014 | |
| OPERATIONS: | | | | | | |
| Net investment income | | $ | 3,327,853 | | | $ | 3,315,800 | |
| Net realized gain on securities | | | 19,281,025 | | | | 8,660,346 | |
| Net change in unrealized appreciation (depreciation) | | | | | | | | |
| on securities | | | (25,214,358 | ) | | | 4,550,966 | |
| Net increase (decrease) in net assets | | | | | | | | |
| resulting from operations | | | (2,605,480 | ) | | | 16,527,112 | |
| | | | | | | | | |
| DISTRIBUTIONS TO SHAREHOLDERS FROM: | | | | | | | | |
| Net investment income | | | | | | | | |
| Investor Class | | | (3,147,811 | ) | | | (3,513,687 | ) |
| Institutional Class | | | (257,598 | ) | | | (87,011 | ) |
| Total distributions | | | (3,405,409 | ) | | | (3,600,698 | ) |
| | | | | | | | | |
| CAPITAL SHARE TRANSACTIONS: | | | | | | | | |
| Proceeds from shares subscribed – Investor Class | | | 2,074,393 | | | | 3,491,144 | |
| Proceeds from shares subscribed – Institutional Class | | | 1,559,641 | | | | 14,793,692 | |
| Dividends reinvested – Investor Class | | | 2,823,170 | | | | 3,144,019 | |
| Dividends reinvested – Institutional Class | | | 243,110 | | | | 73,379 | |
| Cost of shares redeemed – Investor Class | | | (14,508,452 | ) | | | (12,672,806 | )(1) |
| Cost of shares redeemed – Institutional Class | | | (10,255,757 | ) | | | (9,101,431 | ) |
| Net decrease in net assets derived | | | | | | | | |
| from capital share transactions | | | (18,063,895 | ) | | | (272,003 | ) |
| TOTAL INCREASE (DECREASE) IN NET ASSETS | | | (24,074,784 | ) | | | 12,654,411 | |
| | | | | | | | | |
| NET ASSETS: | | | | | | | | |
| Beginning of year | | | 155,687,465 | | | | 143,033,054 | |
| End of year | | $ | 131,612,681 | | | $ | 155,687,465 | |
| Undistributed net investment income, end of year | | $ | 2,587,361 | | | $ | 2,764,012 | |
| | | | | | | | | |
| CHANGES IN SHARES OUTSTANDING: | | | | | | | | |
| Shares sold – Investor Class | | | 115,014 | | | | 198,545 | |
| Shares sold – Institutional Class | | | 88,261 | | | | 838,952 | |
| Shares issued to holders as | | | | | | | | |
| reinvestment of dividends – Investor Class | | | 155,034 | | | | 183,861 | |
| Shares issued to holders as | | | | | | | | |
| reinvestment of dividends – Institutional Class | | | 13,365 | | | | 4,296 | |
| Shares redeemed – Investor Class | | | (807,635 | ) | | | (721,925 | ) |
| Shares redeemed – Institutional Class | | | (580,726 | ) | | | (506,582 | ) |
| Net decrease in shares outstanding | | | (1,016,687 | ) | | | (2,853 | ) |
(1) | Net of redemption fees of $2,165 related to redemption fees imposed by the Fund during a prior year but not received until the year ended October 31, 2014. |
The accompanying notes are an integral part of these financial statements.
| HENNESSY FUNDS | 1-800-966-4354 | |
Financial Statements
For an Investor Class share outstanding throughout each year
PER SHARE DATA:
Net asset value, beginning of year
Income from investment operations:
Net investment income
Net realized and unrealized gains (losses) on investments
Total from investment operations
Less distributions:
Dividends from net investment income
Total distributions
Net asset value, end of year
TOTAL RETURN
SUPPLEMENTAL DATA AND RATIOS:
Net assets, end of year (millions)
Ratio of expenses to average net assets
Ratio of net investment income to average net assets
Portfolio turnover rate(1)
(1) | Portfolio turnover is calculated on the basis of the Fund as a whole. |
The accompanying notes are an integral part of these financial statements.
| Year Ended October 31, | |
| 2015 | | | 2014 | | | 2013 | | | 2012 | | | 2011 | |
| | | | | | | | | | | | | |
| $ | 18.41 | | | $ | 16.90 | | | $ | 14.02 | | | $ | 12.84 | | | $ | 12.53 | |
| | | | | | | | | | | | | | | | | | | |
| | | | | | | | | | | | | | | | | | | |
| | 0.44 | | | | 0.39 | | | | 0.42 | | | | 0.37 | | | | 0.45 | |
| | (0.75 | ) | | | 1.55 | | | | 2.84 | | | | 1.23 | | | | 0.23 | |
| | (0.31 | ) | | | 1.94 | | | | 3.26 | | | | 1.60 | | | | 0.68 | |
| | | | | | | | | | | | | | | | | | | |
| | | | | | | | | | | | | | | | | | | |
| | (0.41 | ) | | | (0.43 | ) | | | (0.38 | ) | | | (0.42 | ) | | | (0.37 | ) |
| | (0.41 | ) | | | (0.43 | ) | | | (0.38 | ) | | | (0.42 | ) | | | (0.37 | ) |
| $ | 17.69 | | | $ | 18.41 | | | $ | 16.90 | | | $ | 14.02 | | | $ | 12.84 | |
| | | | | | | | | | | | | | | | | | | |
| | (1.77 | )% | | | 11.69 | % | | | 23.84 | % | | | 12.79 | % | | | 5.58 | % |
| | | | | | | | | | | | | | | | | | | |
| | | | | | | | | | | | | | | | | | | |
| $ | 129.86 | | | $ | 145.04 | | | $ | 138.94 | | | $ | 124.99 | | | $ | 116.41 | |
| | 1.10 | % | | | 1.17 | % | | | 1.22 | % | | | 1.26 | % | | | 1.31 | % |
| | 2.32 | % | | | 2.18 | % | | | 2.60 | % | | | 2.67 | % | | | 2.94 | % |
| | 46 | % | | | 34 | % | | | 41 | % | | | 47 | % | | | 40 | % |
The accompanying notes are an integral part of these financial statements.
| HENNESSY FUNDS | 1-800-966-4354 | |
Financial Statements
For an Institutional Class share outstanding throughout each year
PER SHARE DATA:
Net asset value, beginning of year
Income from investment operations:
Net investment income
Net realized and unrealized gains (losses) on investments
Total from investment operations
Less distributions:
Dividends from net investment income
Total distributions
Net asset value, end of year
TOTAL RETURN
SUPPLEMENTAL DATA AND RATIOS:
Net assets, end of year (millions)
Ratio of expenses to average net assets:
Before expense reimbursement
After expense reimbursement
Ratio of net investment income to average net assets:
Before expense reimbursement
After expense reimbursement
Portfolio Turnover(1)
(1) | Portfolio turnover is calculated on the basis of the Fund as a whole. |
The accompanying notes are an integral part of these financial statements.
| Year Ended October 31, | |
| 2015 | | | 2014 | | | 2013 | | | 2012 | | | 2011 | |
| | | | | | | | | | | | | |
| $ | 18.41 | | | $ | 16.92 | | | $ | 14.04 | | | $ | 12.86 | | | $ | 12.54 | |
| | | | | | | | | | | | | | | | | | | |
| | | | | | | | | | | | | | | | | | | |
| | 0.53 | | | | 0.59 | | | | 0.50 | | | | 0.45 | | | | 0.36 | |
| | (0.83 | ) | | | 1.37 | | | | 2.80 | | | | 1.19 | | | | 0.37 | |
| | (0.30 | ) | | | 1.96 | | | | 3.30 | | | | 1.64 | | | | 0.73 | |
| | | | | | | | | | | | | | | | | | | |
| | | | | | | | | | | | | | | | | | | |
| | (0.44 | ) | | | (0.47 | ) | | | (0.42 | ) | | | (0.46 | ) | | | (0.41 | ) |
| | (0.44 | ) | | | (0.47 | ) | | | (0.42 | ) | | | (0.46 | ) | | | (0.41 | ) |
| $ | 17.67 | | | $ | 18.41 | | | $ | 16.92 | | | $ | 14.04 | | | $ | 12.86 | |
| | | | | | | | | | | | | | | | | | | |
| | (1.72 | )% | | | 11.82 | % | | | 24.13 | % | | | 13.13 | % | | | 6.00 | % |
| | | | | | | | | | | | | | | | | | | |
| | | | | | | | | | | | | | | | | | | |
| $ | 1.75 | | | $ | 10.65 | | | $ | 4.09 | | | $ | 2.53 | | | $ | 1.17 | |
| | | | | | | | | | | | | | | | | | | |
| | 1.00 | % | | | 1.03 | % | | | 1.10 | % | | | 1.20 | % | | | 1.14 | % |
| | 1.00 | % | | | 0.98 | % | | | 0.98 | % | | | 0.98 | % | | | 0.98 | % |
| | | | | | | | | | | | | | | | | | | |
| | 2.43 | % | | | 2.30 | % | | | 2.64 | % | | | 2.72 | % | | | 3.04 | % |
| | 2.43 | % | | | 2.35 | % | | | 2.76 | % | | | 2.94 | % | | | 3.20 | % |
| | 46 | % | | | 34 | % | | | 41 | % | | | 47 | % | | | 40 | % |
The accompanying notes are an integral part of these financial statements.
| HENNESSY FUNDS | 1-800-966-4354 | |
Financial Statements
Notes to the Financial Statements October 31, 2015 |
1). ORGANIZATION
The Hennessy Cornerstone Value Fund (the “Fund”) is a series of Hennessy Funds Trust (the “Trust”), which was organized as a Delaware statutory trust on September 17, 1992. The Fund is an open-end management investment company registered under the Investment Company Act of 1940, as amended. The Fund is a successor to a fund with the same name (the “Predecessor Fund”) that was a series of Hennessy Mutual Funds, Inc., a Maryland corporation, pursuant to a reorganization that took place after the close of business on February 28, 2014. Prior to February 28, 2014, the Fund had no investment operations. As a result of the reorganization, holders of the Investor Class shares of the Predecessor Fund received Investor Class shares of the Fund (the Investor Class shares of the Fund are the successor to the accounting and performance information of the Predecessor Fund), and holders of the Institutional Class shares of the Predecessor Fund received Institutional Class shares of the Fund (the Institutional Class shares of the Fund are the successor to the accounting and performance information of the Predecessor Fund). The investment objective of the Fund is total return, consisting of capital appreciation and current income. The Fund is a diversified fund.
The Fund offers Investor Class and Institutional Class shares. Each class of shares differs principally in its respective administration, shareholder servicing, and transfer agent expenses and sales charges, if any. Each class has identical rights to earnings, assets, and voting privileges, except for class-specific expenses and exclusive rights to vote on matters affecting only an individual class.
As an investment company, the Fund follows the investment company accounting and reporting guidance of the Financial Accounting Standards Board (“FASB”) Accounting Standard Codification Topic 946 “Financial Services—Investment Companies.”
2). SIGNIFICANT ACCOUNTING POLICIES
The following is a summary of significant accounting policies consistently followed by the Fund in the preparation of the financial statements. These policies are in conformity with U.S. generally accepted accounting principles (“GAAP”).
| a). | Investment Valuation – All investments in securities are recorded at their estimated fair value, as described in Note 3. |
| b). | Federal Income Taxes – Provision for federal income taxes or excise taxes has not been made since the Fund has elected to be taxed as a “regulated investment company” and intends to distribute substantially all of its taxable income to its shareholders and otherwise comply with the provisions of the Internal Revenue Code of 1986, as amended, applicable to regulated investment companies. Net investment income or loss and realized gains and losses for federal income tax purposes may differ from that reported on the financial statements because of temporary book and tax basis differences. Temporary differences are primarily the result of the treatment of wash sales for tax reporting purposes. The Fund recognizes interest and penalties related to income tax benefits, if any, in the statement of operations as an income tax expense. Distributions from net realized gains for book purposes may include short-term capital gains, which are included as ordinary income to shareholders for tax purposes. |
| | Due to inherent differences in the recognition of income, expenses, and realized gains/losses under GAAP and federal income tax regulations, permanent differences |
| | between book and tax basis reporting for the 2015 fiscal year have been identified and appropriately reclassified on the Statement of Assets and Liabilities. The adjustments are as follows: |
| Undistributed | Accumulated | |
| Net Investment | Net Realized | |
Income/(Loss) | Gain/(Loss) | Paid-in Capital |
| $(99,095) | $99,095 | $ — |
| c). | Income and Expenses – Dividend income is recognized on the ex-dividend date or as soon as information is available to the Fund. Interest income, which includes the amortization of premium and accretion of discount, is recognized on an accrual basis. The Fund is charged for those expenses that are directly attributable to the portfolio, such as advisory, administration, and certain shareholder service fees. Income, expenses (other than expenses attributable to a specific class), and realized and unrealized gains or losses on investments are allocated to each class of shares based on its respective net assets. |
| d). | Distributions to Shareholders – Dividends from net investment income for the Fund, if any, are declared and paid annually, usually in December. Distributions of net realized capital gains, if any, are declared and paid annually, usually in December. |
| e). | Security Transactions – Investment and shareholder transactions are recorded on the trade date. The Fund determines the gain or loss realized from the investment transactions by comparing the original cost of the security lot sold with the net sale proceeds. Discounts and premiums on securities purchased are accreted/amortized over the life of the respective security. |
| f). | Use of Estimates – The preparation of financial statements in conformity with GAAP requires management to make estimates and assumptions that affect the reported amounts of assets and liabilities and disclosure of contingent assets and liabilities at the date of the financial statements and the reported change in net assets during the reporting period. Actual results could differ from those estimates. |
| g). | Share Valuation – The net asset value (“NAV”) per share of the Fund is calculated by dividing the sum of the value of the securities held by the Fund, plus cash or other assets, minus all liabilities (including estimated accrued expenses) by the total number of shares outstanding for the Fund, rounded to the nearest cent. The Fund’s shares will not be priced on days the New York Stock Exchange is closed for trading. The offering and redemption price per share for the Fund is equal to the Fund’s NAV per share. |
| h). | Foreign Currency – Values of investments denominated in foreign currencies, if any, are converted into U.S. dollars using the spot market rate of exchange at the time of valuation. Purchases and sales of investments and income are translated into U.S. dollars using the spot market rate of exchange prevailing on the respective dates of such transactions. The Fund does not isolate the portion of the results of operations resulting from fluctuations in foreign exchange rates on investments from fluctuations resulting from changes in the market prices of securities held. Such fluctuations are included with the net realized and unrealized gain or loss on investments. Foreign investments present additional risks due to currency fluctuations, economic and political factors, lower liquidity, government regulations, differences in accounting standards, and other factors. |
| i). | Forward Contracts – The Fund may enter into forward currency contracts to reduce its exposure to changes in foreign currency exchange rates on its foreign holdings and to lock in the U.S. dollar cost of firm purchase and sale commitments for securities denominated in foreign currencies. A forward currency contract is a |
| HENNESSY FUNDS | 1-800-966-4354 | |
| | commitment to purchase or sell a foreign currency at a future date at a negotiated forward rate. The gain or loss arising from the difference between the U.S. dollar cost of the original contract and the value of the foreign currency in U.S. dollars upon closing of such contract is included in net realized gain or loss from foreign currency transactions. During the fiscal year ended October 31, 2015, the Fund did not enter into any forward contracts. |
| j). | Repurchase Agreements – The Fund may enter into repurchase agreements with member banks or security dealers of the Federal Reserve Board whom the investment advisor deems creditworthy. The repurchase price generally equals the price paid by the Fund plus interest negotiated on the basis of current short-term rates. |
| | Securities pledged as collateral for repurchase agreements are held by the custodian bank until the respective agreements mature. Provisions of the repurchase agreements ensure that the market value of the collateral, including accrued interest thereon, is sufficient to cover the repurchase amount in the event of default of the counterparty. If the counterparty defaults and the value of the collateral declines or if the counterparty enters an insolvency proceeding, realization of the collateral by the Fund may be delayed or limited. |
| k). | Accounting for Uncertainty in Income Taxes – The Fund has accounting policies regarding recognition and measurement of tax positions taken or expected to be taken on a tax return. The tax returns of the Fund for the prior three fiscal years are open for examination. The Fund has reviewed all open tax years in major jurisdictions and concluded that there is no impact on the Fund’s net assets and no tax liability resulting from unrecognized tax benefits relating to uncertain income tax positions taken or expected to be taken on a tax return. The Fund’s major tax jurisdictions are U.S. federal and Delaware. |
| l). | Derivatives – The Fund may invest in, or enter into, derivatives, such as options, futures contracts, options on futures contracts, and swaps, for a variety of reasons, including to hedge certain risks, to provide a substitute for purchasing or selling particular securities, or to increase potential income gain. Derivatives may provide a cheaper, quicker, or more specifically focused way for a Fund to invest than “traditional” securities would. The main purpose of utilizing these derivative instruments is for hedging purposes. |
| | The Fund follows the financial accounting reporting rules as required by the Derivatives and Hedging Topic of the FASB Accounting Standards Codification. Under such rules, the Fund is required to include enhanced disclosure that enables investors to understand how and why an entity uses derivatives, how derivatives are accounted for, and how derivatives instruments affect an entity’s results of operations and financial position. During the fiscal year ended October 31, 2015, the Fund did not hold any derivative instruments. |
| m). | New Accounting Pronouncements – In June 2014, the FASB issued Accounting Standards Update (“ASU”) No. 2014-11 “Repurchase-to Maturity Transactions, Repurchase Financings, and Disclosures.” The amendments in this ASU require an entity to modify accounting for repurchase-to-maturity transactions and repurchase financing arrangements, as well as modify required disclosures for repurchase agreements, securities lending transactions, and repurchase-to-maturity transactions that are accounted for as secured borrowings. The guidance is effective for fiscal years beginning on or after December 15, 2014, and for interim periods within those fiscal years. Management is currently evaluating the impact these changes will have on the Fund’s financial statement disclosures. |
| | In May 2015, the FASB issued ASU No. 2015-07 “Disclosure for Investments in Certain Entities that Calculate Net Asset Value per Share (or Its Equivalent).” The amendments in ASU No. 2015-07 remove the requirement to categorize within the fair value hierarchy investments measured at NAV and require the disclosure of sufficient information to reconcile the fair value of the remaining assets categorized within the fair value hierarchy to the financial statements. The amendments in ASU No. 2015-07 are effective for fiscal years beginning after December 15, 2015, and interim periods within those fiscal years. Management has reviewed the requirements and believes the adoption of ASU 2015-07 will not have a material impact on the Fund’s financial statements and related disclosures. |
3). SECURITIES VALUATION
The Fund follows authoritative fair valuation accounting standards that establish an authoritative definition of fair value and set out a hierarchy for measuring fair value. These standards require additional disclosures about the various inputs and valuation techniques used to develop the measurements of fair value and a discussion in changes in valuation techniques and related inputs during the period. These inputs are summarized in the three broad levels listed below:
| | Level 1 – | Quoted unadjusted prices for identical instruments in active markets to which the Fund has access at the date of measurement. |
| | Level 2 – | Quoted prices for similar instruments in active markets; quoted prices for identical or similar instruments in markets that are not active; and model-derived valuations in which all significant inputs and significant value drivers are observable in active markets. Level 2 inputs are those in markets for which there are few transactions, the prices are not current, the prices are fair value adjusted due to post-market close subsequent events (foreign markets), little public information exists, or instances where prices vary substantially over time or among brokered market makers. These inputs may also include interest rates, prepayment speeds, credit risk curves, default rates, and similar data. |
| | Level 3 – | Model-derived valuations in which one or more significant inputs or significant value drivers are unobservable. Unobservable inputs are those inputs that reflect the Fund’s own assumptions about what market participants would use to price the asset or liability based on the best available information. |
Following is a description of the valuation techniques applied to the Fund’s major categories of assets and liabilities measured at fair value on a recurring basis.
Equity Securities – Equity securities, including common stocks, preferred stocks, foreign-issued common stocks, exchange-traded funds, closed-end mutual funds, partnerships, rights, and real estate investment trusts, that are traded on a securities exchange for which a last-quoted sales price is readily available will generally be valued at the last sales price as reported by the primary exchange on which the securities are listed. Securities listed on The NASDAQ Stock Market (“NASDAQ”) will generally be valued at the NASDAQ Official Closing Price, which may differ from the last sales price reported. Securities traded on a securities exchange for which a last-quoted sales price is not readily available will generally be valued at the mean between the bid and ask prices. To the extent these securities are actively traded and valuation adjustments are not applied, they are classified in Level 1 of the fair value hierarchy. Securities traded on foreign exchanges generally are not valued at the same time the Fund calculates its NAV because most foreign markets close well before such time. The earlier close of most foreign markets
| HENNESSY FUNDS | 1-800-966-4354 | |
gives rise to the possibility that significant events, including broad market moves, may have occurred in the interim. In certain circumstances, it may be determined that a security needs to be fair valued because it appears that the value of the security might have been materially affected by events occurring after the close of the market in which the security is principally traded, but before the time the Fund calculates its NAV, such as by a development that affects an entire market or region (e.g., weather-related events) or a potentially global development (e.g., a terrorist attack that may be expected to have an effect on investor expectations worldwide).
Registered Investment Companies – Investments in registered investment companies (e.g., mutual funds) are generally priced at the ending NAV provided by the applicable registered investment company’s service agent and will be classified in Level 1 of the fair value hierarchy.
Debt Securities – Debt securities, including corporate bonds, asset-backed securities, mortgage-backed securities, municipal bonds, U.S. Treasuries, and U.S. government agency issues, are generally valued at market on the basis of valuations furnished by an independent pricing service that utilizes both dealer-supplied valuations and formula-based techniques. The pricing service may consider recently executed transactions in securities of the issuer or comparable issuers, market price quotations (where observable), bond spreads, and fundamental data relating to the issuer. In addition, the model may incorporate market observable data such as reported sales of similar securities, broker quotes, yields, bids, offers, and reference data. Certain securities are valued principally using dealer quotations. These securities are generally classified in Level 2 of the fair value hierarchy.
Short-Term Securities – Short-term equity investments, including money market funds, are valued in the manner specified above. Short-term debt investments are generally valued at amortized cost, which approximates fair market value, if their original term to maturity was 60 days or less, or by amortizing the values as of the 61st day prior to maturity, if their original term to maturity exceeded 60 days. Amortized cost is not used if its use would be inappropriate due to credit or other impairments of the issuer, in which case the security’s fair value would be determined, as described below. Short-term securities are generally classified in Level 1 or Level 2 of the fair market hierarchy depending on the inputs used and market activity levels for specific securities.
The Board of Trustees of the Fund (the “Board”) has adopted fair value pricing procedures that are followed when a price for a security is not readily available or if a significant event has occurred that indicates the closing price of a security no longer represents the true value of that security. Fair value pricing determinations are made in good faith in accordance with these procedures. There are numerous criteria that will be given consideration in determining a fair value of a security. Some of these criteria are trading volume of a security and markets, the value of other like securities, and news events with direct bearing to a security or markets. Fair value pricing results in an estimated price for a security that reflects the amount the Fund might reasonably expect to receive in a current sale. Depending on the relative significance of the valuation inputs, these securities may be classified in either Level 2 or Level 3 of the fair value hierarchy.
The fair valuation of foreign securities may be determined with the assistance of a pricing service using correlations between the movement of prices of such securities and indices of domestic securities and other appropriate indicators, such as closing market prices of relevant American Depositary Receipts or futures contracts. The effect of using fair value pricing is that the Fund’s NAV will reflect the affected portfolio securities’ value as determined in the judgment of the Board or its designee instead of being determined by
the market. Using a fair value pricing methodology to price foreign securities may result in a value that is different from a foreign security’s most recent closing price and from the prices used by other investment companies to calculate their NAVs and are generally considered Level 2 prices in the fair valuation hierarchy. Because the Fund may invest in foreign securities, the value of the Fund’s portfolio securities may change on days when you will not be able to purchase or redeem your shares.
The Board has delegated day-to-day valuation matters to a Valuation Committee comprised of one or more representatives from Hennessy Advisors, Inc., the Fund’s investment advisor. The function of the Valuation Committee is to value securities where current and reliable market quotations are not readily available. All actions taken by the Valuation Committee are reviewed by the Board.
The Fund has performed an analysis of all existing investments to determine the significance and character of all inputs to their fair value determination. Various inputs are used in determining the value of the Fund’s investments. The inputs or methodology used for valuing securities are not necessarily an indication of the risk associated with investing in those securities. Details related to the fair valuation hierarchy of the Fund’s securities as of October 31, 2015 are included in the Fund’s Schedule of Investments.
4). INVESTMENT TRANSACTIONS
Purchases and sales of investment securities (excluding government and short-term investments) for the Fund during the fiscal year ended October 31, 2015 were $64,297,730 and $81,673,950, respectively.
There were no purchases or sales/maturities of long-term U.S. Government Securities for the Fund during the fiscal year ended October 31, 2015.
5). INVESTMENT MANAGEMENT FEE AND OTHER TRANSACTIONS WITH AFFILIATES
Hennessy Advisors, Inc. (the “Advisor”) is the investment advisor of the Fund. The Advisor provides the Fund with investment management services under an Investment Advisory Agreement. The Advisor furnishes all investment advice, office space, facilities, and provides most of the personnel needed by the Fund. As compensation for its services, the Advisor is entitled to a monthly fee from the Fund. The fee is based upon the average daily net assets of the Fund at the annual rate of 0.74%. The net investment advisory fees payable by the Fund as of October 31, 2015 were $80,963.
In the past, the Advisor has agreed to waive its fees and absorb expenses to the extent that the total annual operating expenses (excluding all federal, state and local taxes, interest, brokerage commissions, acquired fund fees and expenses and other costs incurred in connection with the purchase and sale of securities and extraordinary items) exceeded 0.98% of the Fund’s net assets for the Institutional Class shares of the Fund. The expense limitation agreement for the Institutional Class shares could only be terminated by the Board and was terminated by the Board as of February 28, 2015.
For a period of three years after the year in which the Advisor waived or reimbursed expenses, the Advisor may seek reimbursement from the Fund to the extent that total annual fund operating expenses are less than the expense limitation that was in effect at the time the Advisor waived or reimbursed expenses. During the three years ended October 31, 2015, no expenses were waived or reimbursed by the Advisor and therefore no expenses are subject to potential recovery.
The Board has approved a Shareholder Servicing Agreement for the Investor Class shares of the Fund, which was instituted to compensate the Advisor for the non-investment management services it provides to the Fund. The Shareholder Servicing Agreement provides for a monthly fee paid to the Advisor at an annual rate of 0.10% of
| HENNESSY FUNDS | 1-800-966-4354 | |
the average daily net assets of the Fund attributable to Investor Class shares. Shareholder service fees payable by the Fund as of October 31, 2015 were $10,793.
The Fund has entered into agreements with various brokers, dealers, and financial intermediaries in connection with the sale of shares of the Fund. The agreements provide for periodic payments by the Fund to the brokers, dealers, and financial intermediaries for providing certain shareholder maintenance services (sub-transfer agent expenses). These shareholder services include the pre-processing and quality control of new accounts, shareholder correspondence, answering customer inquiries regarding account status, and facilitating shareholder telephone transactions. Fees paid by the Fund to various brokers, dealers, and financial intermediaries during the fiscal year ended October 31, 2015 were $104,631.
U.S. Bancorp Fund Services, LLC (“USBFS”) provides the Fund with administrative, fund accounting, and transfer agent services, including all regulatory reporting, and necessary office equipment and personnel. As administrator, USBFS is responsible for activities such as (i) preparing various federal and state regulatory filings, reports, and returns for the Fund, (ii) preparing reports and materials to be supplied to the Board, (iii) monitoring the activities of the Fund’s custodian, transfer agent, and accountants, and (iv) coordinating the preparation and payment of the Fund’s expenses and reviewing the Fund’s expense accruals. Fees paid to USBFS during the fiscal year ended October 31, 2015 were $141,305.
U.S. Bank, N.A., an affiliate of USBFS, serves as the Fund’s custodian. Quasar Distributors, LLC acts as the Fund’s principal underwriter in a continuous public offering of the Fund’s shares. Quasar Distributors, LLC is an affiliate of USBFS and U.S. Bank, N.A.
6). LINE OF CREDIT
The Fund has an uncommitted line of credit with the other funds in the Hennessy Funds family of funds (the “Hennessy Funds”) in the amount of the lesser of (i) $100,000,000 or (ii) 33.33% of each Hennessy Fund’s net assets, or 30% for the Hennessy Gas Utility Fund and 10% for the Hennessy Balanced Fund, intended to provide short-term financing, if necessary, subject to certain restrictions, in connection with shareholder redemptions. The credit facility is with the Hennessy Funds’ custodian bank, U.S. Bank, N.A. Borrowings under this arrangement bear interest at the bank’s prime rate and are secured by all of the Fund’s assets (as to its own borrowings only). During the fiscal year ended October 31, 2015, the Fund had an outstanding average daily balance and a weighted average interest rate of $6,575 and 3.25%, respectively. The maximum amount outstanding for the Fund during the period was $577,000. At October 31, 2015, the Fund did not have any borrowings outstanding under the line of credit.
7). FEDERAL TAX INFORMATION
As of October 31, 2015, the components of accumulated earnings (losses) for income tax purposes were as follows:
| Cost of investments for tax purposes | | $ | 120,220,585 | |
| Gross tax unrealized appreciation | | $ | 21,946,324 | |
| Gross tax unrealized depreciation | | | (10,698,702 | ) |
| Net tax unrealized appreciation | | $ | 11,247,622 | |
| Undistributed ordinary income | | $ | 2,587,361 | |
| Undistributed long-term capital gains | | | — | |
| Total distributable earnings | | $ | 2,587,361 | |
| Other accumulated loss | | $ | (3,994,922 | ) |
| Total accumulated gain | | $ | 9,840,061 | |
The difference between book-basis and tax-basis unrealized appreciation is attributable primarily to wash sales.
At October 31, 2015, the Fund had capital loss carryforwards of $3,994,751 that expire on October 31, 2017.
During the fiscal year ended October 31, 2015, the capital loss carry forwards utilized for the Fund were $19,412,346.
Capital losses sustained in the fiscal year ended October 31, 2012 and in future taxable years will not expire and may be carried over by the Fund without limitation; however, they will retain the character of the original loss. Furthermore, any loss incurred during those taxable years will be required to be utilized prior to the losses incurred in taxable years prior to 2012. As a result of this ordering rule, pre-enactment capital loss carryforwards may be more likely to expire unused. Under pre-enactment law, capital losses could be carried forward for eight years, and carried forward as short-term capital losses, irrespective of the character of the original loss.
At October 31, 2015, the Fund did not defer, on a tax basis, any post-December late year ordinary loss deferrals.
The tax character of distributions paid during fiscal year 2015 and fiscal year 2014 for the Fund were as follows:
| | | Year Ended | | | Year Ended | |
| | | October 31, 2015 | | | October 31, 2014 | |
| Ordinary income | | $ | 3,405,409 | | | $ | 3,600,698 | |
| Long-term capital gain | | | — | | | | — | |
| | | $ | 3,405,409 | | | $ | 3,600,698 | |
8). EVENTS SUBSEQUENT TO YEAR END
Management has evaluated the Fund’s related events and transactions that occurred subsequent to October 31, 2015, through the date of issuance of the Fund’s financial statements. Other than as disclosed below, management has determined that there were no subsequent events requiring recognition or disclosure in the financial statements.
Effective November 1, 2015, the Fund adopted a plan pursuant to Rule 12b-1 under the Investment Company Act of 1940, as amended, that authorizes payments in connection with the distribution of the Fund’s shares at an annual rate of up to 0.25% of the Fund’s average daily net assets attributable to Investor Class shares. Even though the authorized rate is up to 0.25%, the Fund has only used 0.15% of its average daily net assets attributable to Investor Class shares for such purpose since the plan was implemented on November 1, 2015. Amounts paid under the plan may be spent on any activities or expenses primarily intended to result in the sale of shares, including but not limited to, advertising, compensation for sales and marketing activities or to financial institutions and others, such as dealers and distributors, shareholder account servicing, the printing and mailing of prospectuses to other than current shareholders, and the printing and mailing of sales literature.
| HENNESSY FUNDS | 1-800-966-4354 | |
Report of Independent Registered Public Accounting Firm
The Board of Trustees of Hennessy Funds Trust
and the Shareholders of the Hennessy Cornerstone Value Fund:
We have audited the accompanying statement of assets and liabilities of Hennessy Cornerstone Value Fund (the Fund), a series of Hennessy Funds Trust, including the schedule of investments, as of October 31, 2015, and the related statement of operations for the year then ended, the statements of changes in net assets for each of the years in the two-year period then ended, and the financial highlights for each of the years in the five-year period then ended. These financial statements and financial highlights are the responsibility of the Fund’s management. Our responsibility is to express an opinion on these financial statements and financial highlights based on our audits.
We conducted our audits in accordance with the standards of the Public Company Accounting Oversight Board (United States). Those standards require that we plan and perform the audit to obtain reasonable assurance about whether the financial statements and financial highlights are free of material misstatement. An audit includes examining, on a test basis, evidence supporting the amounts and disclosures in the financial statements. Our procedures included confirmation of investments owned as of October 31, 2015, by correspondence with the custodian and brokers or by other appropriate auditing procedures. An audit also includes assessing the accounting principles used and significant estimates made by management, as well as evaluating the overall financial statement presentation. We believe that our audits provide a reasonable basis for our opinion.
In our opinion, the financial statements and financial highlights referred to above present fairly, in all material respects, the financial position of the Fund as of October 31, 2015, and the results of its operations for the year then ended, the changes in its net assets for each of the years in the two-year period then ended, and the financial highlights for each of the years in the five-year period then ended, in conformity with U.S. generally accepted accounting principles.
Milwaukee, Wisconsin
December 23, 2015
Trustees and Officers of the Fund (Unaudited)
The business and affairs of the Fund are managed under the direction of the Board of Trustees of the Trust, and the Board of Trustees elects the Officers of the Trust. Information pertaining to the Trustees and the Officers of the Trust is set forth below. Such persons serve until their successors are duly elected and qualified or until their earlier death, resignation, or removal. Each of the Trustees oversees 16 Hennessy Funds. Unless otherwise indicated, the address of all persons listed below is 7250 Redwood Boulevard, Suite 200, Novato, CA 94945. The Fund’s Statement of Additional Information includes more information about the persons listed below and is available, without charge, upon request by calling 1-800-966-4354.
| | | | Other |
| | | | Directorships |
| Name, Year of Birth, | | | (During Past |
| and Position Held | Length of | Principal Occupation(s) | Five Years) |
with the Trust | Time Served | During Past Five Years | Held by Trustee(1) |
| | | | |
| Disinterested Trustees | | | |
| | | | |
| J. Dennis DeSousa (1936) | Since January | Mr. DeSousa is a real estate investor. | Hennessy SPARX |
| Trustee | 1996 for the | | Funds Trust; |
| | Hennessy Funds | | Hennessy Mutual |
| | | | Funds, Inc.; and |
| | | | The Hennessy |
| | | | Funds, Inc. |
| | | | |
| Robert T. Doyle (1947) | Since January | Mr. Doyle has been the Sheriff of | Hennessy SPARX |
| Trustee | 1996 for the | Marin County, California since 1996. | Funds Trust; |
| | Hennessy Funds | | Hennessy Mutual |
| | | | Funds, Inc.; and |
| | | | The Hennessy |
| | | | Funds, Inc. |
| | | | |
| Gerald P. Richardson (1945) | Since May | Mr. Richardson is an independent | Hennessy SPARX |
| Trustee | 2004 for the | consultant in the securities industry. | Funds Trust; |
| | Hennessy Funds | | Hennessy Mutual |
| | | | Funds, Inc.; and |
| | | | The Hennessy |
| | | | Funds, Inc. |
| | | | |
Interested Trustee(2) | | | |
| | | | |
| Neil J. Hennessy (1956) | Since January | Mr. Hennessy has been employed by | Hennessy Advisors, |
| Trustee, Chairman of | 1996 as a Trustee | Hennessy Advisors, Inc., the Funds’ | Inc.; Hennessy |
| the Board, Chief | for the Hennessy | investment advisor, since 1989. | SPARX Funds Trust; |
| Investment Officer, | Funds and since | He currently serves as President, | Hennessy Mutual |
| Portfolio Manager, | June 2008 as | Chairman and Chief Executive Officer | Funds, Inc.; and |
| and President | an Officer of the | of Hennessy Advisors, Inc. | The Hennessy |
| | Hennessy Funds | | Funds, Inc. |
| HENNESSY FUNDS | 1-800-966-4354 | |
| Name, Year of Birth, | | |
| and Position Held | Length of | Principal Occupation(s) |
with the Trust | Time Served | During Past Five Years |
| | | |
| Officers | | |
| | | |
| Teresa M. Nilsen (1966) | Since January | Ms. Nilsen has been employed by Hennessy Advisors, Inc., |
| Executive Vice President | 1996 for the | the Funds’ investment advisor, since 1989. She currently |
| and Treasurer | Hennessy Funds | serves as Executive Vice President, Chief Operations Officer, |
| | | Chief Financial Officer, and Secretary of Hennessy Advisors, Inc. |
| | | |
| Daniel B. Steadman (1956) | Since March | Mr. Steadman has been employed by Hennessy Advisors, Inc., |
| Executive Vice President | 2000 for the | the Funds’ investment advisor, since 2000. He currently serves |
| and Secretary | Hennessy Funds | as Executive Vice President and Chief Compliance Officer of |
| | | Hennessy Advisors, Inc. |
| | | |
| Jennifer Cheskiewicz (1977) | Since June | Ms. Cheskiewicz has been employed by Hennessy Advisors, |
| Senior Vice President and | 2013 for the | Inc., the Funds’ investment advisor, since June 2013. She |
| Chief Compliance Officer | Hennessy Funds | currently serves as General Counsel of Hennessy Advisors, Inc. |
| | | |
| | | She previously served as in-house counsel to Carlson Capital, |
| | | L.P., an SEC-registered investment advisor to several private |
| | | funds from February 2010 to May 2013. |
| | | |
| Brian Carlson (1972) | Since December | Mr. Carlson has been employed by Hennessy Advisors, Inc., the |
| Senior Vice President and | 2013 for the | Funds’ investment advisor, since December 2013. |
| Head of Distribution | Hennessy Funds | |
| | | Mr. Carlson was previously a co-founder and principal of |
| | | Trivium Consultants, LLC from February 2011 through |
| | | November 2013. |
| | | |
David Ellison (1958)(3) | Since October | Mr. Ellison has served as a Portfolio Manager of the Hennessy |
| Senior Vice President and | 2012 for the | Small Cap Financial Fund, the Hennessy Large Cap Financial |
| Portfolio Manager | Hennessy Funds | Fund, and the Hennessy Technology Fund since inception. |
| | | |
| | | Mr. Ellison previously served as Director, CIO and President of |
| | | FBR Fund Advisers, Inc. from December 1999 to October 2012. |
| | | |
| Brian Peery (1969) | Since March | Mr. Peery has served as a Portfolio Manager of the Hennessy |
| Senior Vice President and | 2003 as an | Cornerstone Growth Fund, the Hennessy Cornerstone Mid Cap |
| Portfolio Manager | Officer of the | 30 Fund, the Hennessy Cornerstone Large Growth Fund, the |
| | Hennessy Funds | Hennessy Cornerstone Value Fund, the Hennessy Total Return |
| | and since | Fund, and the Hennessy Balanced Fund since October 2014. |
| | February 2011 | From February 2011 through September 2014, he served as |
| | as a Co-Portfolio | Co-Portfolio Manager of the same funds. Mr. Peery has also |
| | Manager or | served as a Portfolio Manager of the Hennessy Gas Utility Fund |
| | Portfolio Manager | since February 2015. |
| | for the | |
| | Hennessy Funds | Mr. Peery has been employed by Hennessy Advisors, Inc., the |
| | | Funds’ investment advisor, since 2002. |
| | | |
| Winsor (Skip) Aylesworth | Since October | Mr. Aylesworth has served as a Portfolio Manager of the |
(1947)(3) | 2012 for the | Hennessy Gas Utility Fund since 1998 and as a Portfolio |
| Vice President and | Hennessy Funds | Manager of the Hennessy Technology Fund since inception. |
| Portfolio Manager | | |
| | | Mr. Aylesworth previously served as Executive Vice President |
| | | of The FBR Funds from 1999 to October 2012. |
| Name, Year of Birth, | | |
| and Position Held | Length of | Principal Occupation(s) |
with the Trust | Time Served | During Past Five Years |
| | | |
Ryan Kelley (1972)(4) | Since March | Mr. Kelley has served as a Portfolio Manager of the Hennessy |
| Vice President and | 2013 for the | Gas Utility Fund, the Hennessy Small Cap Financial Fund, and |
| Portfolio Manager | Hennessy Funds | the Hennessy Large Cap Financial Fund since October 2014. |
| | | From March 2013 through September 2014, he served as a |
| | | Co-Portfolio Manager of the same funds. Prior to that, |
| | | he was a Portfolio Analyst of the Hennessy Funds. |
(1) | Pursuant to an internal reorganization, the series of Hennessy Mutual Funds, Inc. (“HMFI”), The Hennessy Funds, Inc. (“HFI”), and Hennessy SPARX Funds Trust (“HSFT”) were reorganized into series of Hennessy Funds Trust on February 28, 2014, which mirrored the corresponding series of HFMI, HFI, and HSFT. Subsequent to the reorganization, HFMI, HFI, and HSFT were dissolved. |
(2) | Mr. Hennessy is considered an “interested person,” as defined in the Investment Company Act of 1940, as amended, because he is an officer of the Hennessy Funds. |
(3) | The address of these officers is 101 Federal Street, Suite 1900, Boston, MA 02110. |
(4) | The address of this officer is 1340 Environ Way, Chapel Hill, NC 27517. |
| HENNESSY FUNDS | 1-800-966-4354 | |
Expense Example (Unaudited)
October 31, 2015
As a shareholder of the Fund, you incur two types of costs: (1) transaction costs, including sales charges (loads) on purchase payments, reinvested dividends, or other distributions; redemption fees; and exchange fees; and (2) ongoing costs, including management fees; service fees; and other Fund expenses. This Example is intended to help you understand your ongoing costs (in dollars) of investing in the Fund and to compare these costs with the ongoing costs of investing in other mutual funds. The Example is based on an investment of $1,000 invested at the beginning of the period and held for the entire period from May 1, 2015 through October 31, 2015.
Actual Expenses
The first line of the table below under the “Investor Class” and “Institutional Class” headings provides information about actual account values and actual expenses. Although the Fund charges no sales loads or transaction fees, you will be assessed fees for outgoing wire transfers, returned checks and stop payment orders at prevailing rates charged by U.S. Bancorp Fund Services, LLC, the Fund’s transfer agent. If you request that a redemption be made by wire transfer, currently a $15.00 fee is charged by the Fund’s transfer agent. IRA accounts will be charged a $15.00 annual maintenance fee. The example below includes, but is not limited to, management fees, shareholder servicing fees, fund accounting, custody, and transfer agent fees. However, the example below does not include portfolio trading commissions and related expenses, and other extraordinary expenses as determined under generally accepted accounting principles. You may use the information in this line, together with the amount you invested, to estimate the expenses that you paid over the period. Simply divide your account value by $1,000 (for example, an $8,600 account value divided by $1,000 = 8.6), then multiply the result by the number in the first line of the table under the “Investor Class” and “Institutional Class” headings in the column entitled “Expenses Paid During Period” to estimate the expenses you paid on your account during this period.
Hypothetical Example for Comparison Purposes
The second line of the table below under the “Investor Class” and “Institutional Class” headings provides information about hypothetical account values and hypothetical expenses based on the Fund’s actual expense ratios and an assumed rate of return of 5% per year before expenses, which is not the Fund’s actual return. The hypothetical account values and expenses may not be used to estimate the actual ending account balance or expenses you paid for the period. You may use this information to compare the ongoing costs of investing in the Fund and other funds. To do so, compare this 5% hypothetical example with the 5% hypothetical examples that appear in the shareholder reports of the other funds. Please note that the expenses shown in the table are meant to highlight your ongoing costs only and do not reflect any transactional costs, such as sales charges (loads), or exchange fees. Therefore, the second line of the table under the “Investor Class” and “Institutional Class” headings is useful in comparing ongoing costs only, and will not help you determine the relative total costs of owning different funds. In addition, if these transactional costs were included, your costs would have been higher.
| | | | Expenses Paid |
| | Beginning | Ending | During Period(1) |
| | Account Value | Account Value | May 1, 2015 – |
| | May 1, 2015 | October 31, 2015 | October 31, 2015 |
| Investor Class | | | |
| Actual | $1,000.00 | $ 947.50 | $5.40 |
| Hypothetical (5% return before expenses) | $1,000.00 | $1,019.66 | $5.60 |
| | | | |
| Institutional Class | | | |
| Actual | $1,000.00 | $ 947.50 | $5.50 |
| Hypothetical (5% return before expenses) | $1,000.00 | $1,019.56 | $5.70 |
(1) | Expenses are equal to the Fund’s annualized expense ratio of 1.10% for Investor Class shares or 1.12% for Institutional Class shares, as applicable, multiplied by the average account value over the period, multiplied by 184/365 days (to reflect one-half year period). |
| HENNESSY FUNDS | 1-800-966-4354 | |
How to Obtain a Copy of the Fund’s
Proxy Voting Policy and Proxy Voting Records
A description of the policies and procedures the Fund uses to determine how to vote proxies relating to portfolio securities is available without charge: (1) by calling 1-800-966-4354; (2) on the Hennessy Funds’ website at hennessyfunds.com/proxy-voting/policy.fs; or (3) on the U.S. Securities and Exchange Commission’s website at www.sec.gov. The Fund’s proxy voting record is available without charge on both the Hennessy Funds’ website at hennessyfunds.com/proxy-voting/policy.fs and the SEC’s website at www.sec.gov no later than August 31 for the prior 12 months ending June 30.
Quarterly Filings on Form N-Q
The Fund files its complete schedule of portfolio holdings with the SEC for the first and third quarters of each fiscal year on Form N-Q. The Fund’s Form N-Q will be available on the SEC’s website at www.sec.gov. The Fund’s Form N-Q may be reviewed and copied at the SEC’s Public Reference Room in Washington, DC and information on the operation of the Public Reference Room may be obtained by calling 1-800-SEC-0330. Information included in the Fund’s N-Q will also be available upon request by calling 1-800-966-4354.
Federal Tax Distribution Information
(Unaudited)
For the fiscal year ended October 31, 2015, certain dividends paid by the Fund may be subject to a maximum tax rate of 23.8%, as provided for by the Jobs and Growth Tax Relief Reconciliation Act of 2003. The percentage of dividends declared from ordinary income designated as qualified dividend income was 100.00%.
For corporate shareholders, the percent of ordinary income distributions that qualified for the corporate dividends received deduction for the fiscal year ended October 31, 2015 was 100.00%.
The percentage of taxable ordinary income distributions that are designated as short-term capital gain distributions under Section 871(k)(2)(C) of the Internal Revenue Code of 1986, as amended, for the Fund was 0.00%.
Householding
To help keep the Fund’s costs as low as possible, we generally deliver a single copy of most financial reports and prospectuses to shareholders who share an address, even if the accounts are registered under different names. This process, known as “householding,” does not apply to account statements. You may, of course, request an individual copy of a prospectus or financial report at any time. If you would like to receive separate mailings, please call the Administrator at 1-800-261-6950 or 1-414-765-4124 and we will begin individual delivery within 30 days of your request. If your account is held through a financial institution or other intermediary, please contact them directly to request individual delivery.
Matters Submitted to a Shareholder Vote
A special meeting of shareholders of the Investor Class shares of the Fund was held on September 15, 2015, and the following matters were approved by the Fund’s voting Investor Class shares:
| | For | Against | Abstain |
| To approve a distribution | | | |
| (Rule 12b-1) plan for the | | | |
| Investor Class shares of the Fund | 3,263,842.798 | 639,151.651 | 94,767.208 |
Privacy Policy
We collect the following non-public personal information about you:
| | • | information we receive from you on or in applications or other forms, correspondence, or conversations, including, but not limited to, your name, address, phone number, social security number, assets, income, and date of birth; and |
| | • | information about your transactions with us, our affiliates, or others, including, but not limited to, your account number and balance, payment history, parties to transactions, cost basis information, and other financial information. |
We do not disclose any non-public personal information about our current or former shareholders to nonaffiliated third parties, except as permitted by law. For example, we are permitted by law to disclose all of the information we collect, as described above, to our Transfer Agent to process your transactions. Furthermore, we restrict access to your non-public personal information to those persons who require such information to provide products or services to you. We maintain physical, electronic, and procedural safeguards that comply with federal standards to guard your non-public personal information.
In the event that you hold shares of the Fund through a financial intermediary, including, but not limited to, a broker-dealer, bank or trust company, the privacy policy of your financial intermediary would govern how your non-public personal information would be shared with nonaffiliated third parties.
| HENNESSY FUNDS | 1-800-966-4354 | |
(This Page Intentionally Left Blank.)
(This Page Intentionally Left Blank.)
For information, questions or assistance, please call
The Hennessy Funds
1-800-966-4354 or 1-415-899-1555
INVESTMENT ADVISOR
Hennessy Advisors, Inc.
7250 Redwood Blvd., Suite 200
Novato, California 94945
ADMINISTRATOR,
TRANSFER AGENT,
DIVIDEND PAYING AGENT &
SHAREHOLDER SERVICING AGENT
U.S. Bancorp Fund Services, LLC
P.O. Box 701
Milwaukee, Wisconsin 53201-0701
CUSTODIAN
U.S. Bank N.A.
Custody Operations
1555 North River Center Dr., Suite 302
Milwaukee, Wisconsin 53212
TRUSTEES
Neil J. Hennessy
Robert T. Doyle
J. Dennis DeSousa
Gerald P. Richardson
COUNSEL
Foley & Lardner LLP
777 East Wisconsin Avenue
Milwaukee, Wisconsin 53202-5306
INDEPENDENT REGISTERED
PUBLIC ACCOUNTING FIRM
KPMG LLP
777 East Wisconsin Avenue
Milwaukee, Wisconsin 53202-5306
DISTRIBUTOR
Quasar Distributors, LLC
615 East Michigan Street
Milwaukee, Wisconsin 53202
hennessyfunds.com | 1-800-966-4354
This report has been prepared for shareholders and may be distributed to
others only if preceded or accompanied by a current prospectus.
ANNUAL REPORT
OCTOBER 31, 2015
HENNESSY LARGE VALUE FUND
Investor Class HLVFX
Institutional Class HLVIX
hennessyfunds.com | 1-800-966-4354
(This Page Intentionally Left Blank.)
Contents
| Letter to Shareholders | 2 |
| Performance Overview | 4 |
| Financial Statements | |
| Schedule of Investments | 7 |
| Statement of Assets and Liabilities | 13 |
| Statement of Operations | 14 |
| Statements of Changes in Net Assets | 15 |
| Financial Highlights | 16 |
| Notes to the Financial Statements | 20 |
| Report of Independent Registered Public Accounting Firm | 28 |
| Trustees and Officers of the Fund | 29 |
| Expense Example | 32 |
| Proxy Voting | 34 |
| Quarterly Filings on Form N-Q | 34 |
| Federal Tax Distribution Information | 34 |
| Householding | 34 |
| Matters Submitted to a Shareholder Vote | 35 |
| Privacy Policy | 35 |
| HENNESSY FUNDS | 1-800-966-4354 | |
December 2015
Dear Hennessy Funds Shareholder:
As I look back over the year, I am reminded that the U.S. economy has come a long way since the depths of the recession in 2009. The economy has been expanding steadily for almost six years, the unemployment rate has halved, the housing market has been recovering and capital expenditures have been growing. The financial markets have performed well too, driven largely by strong corporate earnings growth, especially in the early years. The U.S. market, as measured by the S&P 500 Index, has roughly tripled since the bull market began in 2009, and the Index’s earnings per share have increased 260% over this same time period. For the year ended October 31, 2015, the U.S. equity market performed reasonably well, with the S&P 500 posting another advance of 5.2%. However, behind this headline number, the market experienced a great deal of volatility as investors reacted to falling energy prices, a rise in the U.S. Dollar, pressure on export earnings growth, slower growth in China and, most significantly, the likelihood of a rise in the Fed Funds rate for the first time in nearly a decade – the featured topic of conversation around every office water cooler in the financial world this year.
Investors, reporters and friends often ask me “What’s next?” The market has been in a volatile, sideways correction for over a year now, and throughout this period of volatility, I have consistently advised investors to continue to focus on the long-term fundamentals of the market.
In my view, the fundamentals of the market are in good shape. Despite a stronger U.S. Dollar and its impact on export growth, the economy is still growing steadily. Inflation remains low, so we expect the Federal Reserve, once it does begin to raise short-term interest rates, will not likely raise them by very much. New jobs are being created at what I believe is a healthy rate, and average hourly wages are rising in response to a tighter labor market. Higher wages and lower gasoline prices are helping to keep consumer confidence positive.
Notwithstanding what I view as a relatively solid economic environment, however, I think investor sentiment remains restrained. The same factors that contributed to the market volatility this past year are still troubling investors today: the slowdown in the Chinese economy, slower earnings growth here in the U.S., and, of course, the prospect of rising interest rates. As a result of these investor worries, I do not see any solid enthusiasm for the market – no euphoria. Universal optimism about the market often coincides with a peak in stock prices and this absence of euphoria is yet another reason I feel bullish. And finally, I do not believe stocks are expensive. The Dow Jones Industrial Average and the S&P 500 Index have forward PE (price-to-earnings) ratios of approximately 16x and 17x, respectively, close to long-term averages. In my view, these fundamentals taken together signal a continuation of the bull market that began six years ago.
A final positive note: I still do not believe that investors have fully returned to investing in U.S. equities. Assets in domestic equity funds have now reached parity with fixed income/money market funds, with $6.2 trillion in each. I believe that fixed income investments will continue to trickle into equities, which should have a positive effect on the market.
Thank you for your continued confidence and investment in our products. If you have any questions or would like to speak with us directly, please don’t hesitate to call us at (800) 966-4354.
Best regards,
Neil J. Hennessy
President and Chief Investment Officer
Past performance does not guarantee future results.
Mutual fund investing involves risk. Principal loss is possible.
Opinions expressed are those of Neil Hennessy and are subject to change, are not guaranteed and should not be considered investment advice.
The Dow Jones Industrial Average and the S&P 500 Index are unmanaged indices commonly used to measure the performance of U.S. stocks. One cannot invest directly in an index.
Price to earnings (“PE”) is the market price per share divided by earnings per share. Earnings per share is the portion of a company’s profit allocated to each outstanding share of common stock. It serves as an indicator of a company’s profitability.
| HENNESSY FUNDS | 1-800-966-4354 | |
Performance Overview (Unaudited)
CHANGE IN VALUE OF $10,000 INVESTMENT
This graph illustrates the performance of an initial investment of $10,000 made in the Fund ten years ago and assumes the reinvestment of dividends.
AVERAGE ANNUAL TOTAL RETURN FOR PERIODS ENDED OCTOBER 31, 2015
| | One | Five | Ten |
| | Year | Years | Years |
| Hennessy Large Value Fund – | | | |
| Investor Class (HLVFX) | 1.77% | 12.30% | 5.51% |
| Hennessy Large Value Fund – | | | |
Institutional Class (HLVIX)(1) | 1.89% | 12.65% | 5.75% |
Russell 1000® Value Index | 0.53% | 13.26% | 6.75% |
| S&P 500 Index | 5.20% | 14.33% | 7.85% |
Expense ratios from most recent prospectus: 1.21% (Investor Class); 1.11% (Institutional Class). As set forth in the Supplement to the Prospectus dated October 7, 2015, a 12b-1 fee of 0.15% was instituted on Investor Class shares effective as of November 1, 2015, and is not included in the Investor Class expense ratio.
Performance data quoted represents past performance; past performance does not guarantee future results. The investment return and principal value of an investment will fluctuate so that an investor’s shares, when redeemed, may be worth more or less than their original cost. The performance graph and table do not reflect the deduction of taxes that a shareholder would pay on Fund distributions or the redemption of Fund shares. Current performance of the Fund may be lower or higher than the performance quoted. Performance for periods prior to March 20, 2009 reflects the performance of the Tamarack Value Fund, the predecessor to the Hennessy Large Value Fund. Performance data current to the most recent month end may be obtained by visiting hennessyfunds.com.
(1) | The inception date of Institutional Class shares is March 20, 2009. Performance shown prior to the inception of Institutional Class shares reflects the performance of Investor Class shares and includes expenses that are not applicable to and are higher than those of Institutional Class shares. |
PERFORMANCE NARRATIVE
Portfolio Managers Stuart Lippe, Barbara Browning, CFA, and Adam Scheiner, CFA RBC Global Asset Management (U.S.) Inc. (sub-advisor)
Performance:
For the twelve-month period ended October 31, 2015, the Investor Class of the Hennessy Large Value Fund returned 1.77%, outperforming the Russell 1000® Value Index, which returned 0.53%, but underperforming the S&P 500 Index, which returned 5.20%, for the same period.
The Fund’s relative outperformance was due primarily to favorable stock selection in the Consumer Staples, Consumer Discretionary and Health Care sectors, which outweighed the adverse stock selection in the Energy, Information Technology and Financials sectors. Performance due to sector allocation decisions was essentially flat, as the Fund’s sector neutral mandate, by design, limits the impact of sector weighting decisions, with the Fund’s managers instead making bets at the industry level. The positive effect of the modest underweight position in the Energy sector was partially offset by the adverse effect of a slight underweight position in the Health Care sector.
Within the Consumer Staples sector, Kraft Heinz Co. (+46%), a food and beverage product manufacturer, and Kroger Co. (+33%), a retail food and drug store operator, were both strong performers. Kraft was bought out by 3G Capital Inc. in the first quarter of 2015 and later merged with Heinz. The market is hopeful that the combination of the two companies, which is valued at over $50 billion, should be able to create significant synergies, benefiting shareholders through lower costs and higher efficiency. The Fund no longer holds Kraft Heinz, as we consider the post-acquisition valuation too rich. Kroger had been executing well despite being in a competitive space, and investors favored the company this year especially due to its domestic focus and limited overseas exposure. Kroger also benefitted from lower fuel costs. The Fund no longer holds Kroger as we believe that due to the fiercely competitive nature of grocery retailing, it will be difficult for Kroger to continue to drive comparable store sales growth faster than 5% per year without sacrificing margin. In addition, Kroger has reaccelerated its capital spending to the point that it is not expected to be free cash flow positive for the next 12 months. The Fund also benefitted from not holding some poor-performing stocks in the sector, including Wal-Mart Stores, Inc. (-23%) and Avon Products, Inc. (-60%).
The Consumer Discretionary sector was also a significant contributor to relative performance. Advance Auto Parts, Inc. (+30%), a retailer of automotive aftermarket parts, was the largest contributor to performance within the sector. The company acquired General Parts and the Carquest line of auto supply shops earlier this year. This is expected to provide synergies and margin expansion. Advance Auto Parts also attracted the attention of Starboard Value, an activist investor, who has identified several catalysts and opportunities for significant margin expansion. The Fund continues to hold Advance Auto Parts.
Our stock selection within the Health Care sector positively contributed to performance as well. Aetna, Inc. (+32%), a health care benefits provider, was the top performer in the portfolio within this sector, as the company announced a bid for Humana at $230 per share in cash and stock. Currently, any combination of the top five managed care companies seems to be considered by investors to be a good deal for both the acquiring and the acquired company. Humana is very strong in Medicare Advantage, which is growing rapidly as baby boomers retire, and is an area where Aetna does not have a strong presence. At the same time, investors think there will be huge cost synergies from the acquisition, especially looking out four or five years. The Fund continues to hold Aetna.
On the negative side of the ledger, stock selection in the Energy sector detracted from relative performance. Oil and gas exploration and production companies, Whiting Petroleum Corp. (-56%) and Marathon Oil Corp. (-46%) declined, primarily due to the
| HENNESSY FUNDS | 1-800-966-4354 | |
sharp drop in oil prices at the end of 2014. In the fourth calendar quarter of 2014, the Energy sector was the worst performing sector in the market by far. Marathon Oil and Whiting Petroleum were no exception, as the stocks plunged despite both companies having beaten earnings estimates. Other factors that hurt Whiting included its decision not to hedge its oil production for 2015, the substantial debt it picked up with the acquisition of Kodiak, and the perception that the Bakken itself is in trouble. The Fund no longer holds Whiting but does still hold Marathon Oil.
Within the Information Technology sector, the largest detractor from performance was data storage solutions provider Western Digital, Inc. (-31%). The stock was down due to currency headwinds and a deterioration of the PC business. Offsetting Western Digital’s negative performance in the sector was our overweight position in Microsoft Corp. (+15%). The company benefitted from favorable trends in its software as a service (SAAS) and cloud businesses. Both its Windows 365 platform and cloud hosting are growing nicely. The Fund continues to hold Western Digital and Microsoft.
Investment Outlook:
We remain confident in our stock selection-driven process and our ability to find special situation stocks that are expected to outperform regardless of the market environment. While investment decisions are the result of bottom-up stock selection and our sector-neutral mandate requires investment in all 10 major sectors of the market, there are a number of industry-based themes that we believe could drive performance of the Fund over the coming year. Within the Consumer Discretionary sector, we are overweight department stores and multiline retail.�� The department stores and multiline retailers are insulated from online competition somewhat by their breadth of offerings, are less reliant on mall foot traffic, and are farther ahead in building online and “omnichannel” capabilities than specialty retail stores.
In regard to Technology, trends in the industry continue to favor companies exposed to the secular growth areas of mobile content, cloud and software. We continue to look for attractively valued opportunities in these areas. We are overweight semiconductors as we look for exposure to the Internet of Things (IoT). Essentially, the IoT is the idea of everyday things becoming “connected” or “smart.” This transition is occurring in autos through infotainment offerings, safety features, and fuel efficiency mechanisms that all require integrated circuits and sensors to communicate, measure and process data. This theme is also penetrating other industries, such as industrial automation, appliances, and fitness wearables. Finally, in Health Care, we are seeing continued growth in demand for health services prompted by health care reform (especially with regard to managed care) that we believe supports our overweight position in health care products and services.
Opinions expressed are those of the Portfolio Managers as of the date written and are subject to change, are not guaranteed, and should not be considered investment advice or an indication of trading intent.
The Russell 1000® Value Index is an unmanaged index commonly used to measure the performance of U.S. large-capitalization value stocks. The S&P 500 Index is an unmanaged index commonly used to measure the performance of U.S. stocks. One cannot invest directly in an index.
The Fund may invest in medium-capitalization companies, which may have more limited liquidity and greater price volatility than large-capitalization companies.
References to specific securities should not be considered a recommendation to buy or sell any security. Fund holdings and sector allocations are subject to change. Please refer to the Schedule of Investments included in this report for additional portfolio information.
Free cash flow is a measure of how much cash a business generates after accounting for capital expenditures.
Financial Statements
Schedule of Investments as of October 31, 2015 |
HENNESSY LARGE VALUE FUND
(% of Net Assets)
| TOP TEN HOLDINGS (EXCLUDING CASH/CASH EQUIVALENTS) | % NET ASSETS |
| Wells Fargo & Co. | 3.83% |
| Exxon Mobil Corp. | 3.20% |
| Microsoft Corp. | 2.98% |
| Occidental Petroleum Corp. | 2.93% |
| Altria Group, Inc. | 2.79% |
| JPMorgan Chase & Co. | 2.74% |
| Johnson & Johnson | 2.69% |
| General Electric Co. | 2.66% |
| DTE Energy Co. | 2.49% |
| Citigroup, Inc. | 2.20% |
Note: For presentation purposes, the Fund has grouped some of the industry categories. For purposes of categorizing securities for compliance with Section 8(b)(1) of the Investment Company Act of 1940, as amended, the Fund uses more specific industry classifications.
| HENNESSY FUNDS | 1-800-966-4354 | |
| COMMON STOCKS – 95.54% | | Number | | | | | | % of | |
| | | of Shares | | | Value | | | Net Assets | |
| Consumer Discretionary – 6.68% | | | | | | | | | |
| Advance Auto Parts, Inc. | | | 8,950 | | | $ | 1,775,948 | | | | 1.24 | % |
| Carnival Corp. (b) | | | 26,560 | | | | 1,436,365 | | | | 1.00 | % |
| Ford Motor Co. | | | 113,305 | | | | 1,678,047 | | | | 1.17 | % |
| Macy’s, Inc. | | | 16,000 | | | | 815,680 | | | | 0.57 | % |
| Target Corp. | | | 27,155 | | | | 2,095,823 | | | | 1.47 | % |
| Time Warner, Inc. | | | 23,420 | | | | 1,764,463 | | | | 1.23 | % |
| | | | | | | | 9,566,326 | | | | 6.68 | % |
| | | | | | | | | | | | | |
| Consumer Staples – 6.14% | | | | | | | | | | | | |
| Altria Group, Inc. | | | 66,010 | | | | 3,991,625 | | | | 2.79 | % |
| General Mills, Inc. | | | 32,320 | | | | 1,878,115 | | | | 1.31 | % |
| PepsiCo, Inc. | | | 14,100 | | | | 1,440,879 | | | | 1.01 | % |
| Procter & Gamble Co. | | | 19,385 | | | | 1,480,626 | | | | 1.03 | % |
| | | | | | | | 8,791,245 | | | | 6.14 | % |
| | | | | | | | | | | | | |
| Energy – 12.49% | | | | | | | | | | | | |
| Anadarko Petroleum Corp. | | | 39,660 | | | | 2,652,461 | | | | 1.85 | % |
| Chevron Corp. | | | 13,625 | | | | 1,238,240 | | | | 0.86 | % |
| ConocoPhillips | | | 31,260 | | | | 1,667,721 | | | | 1.16 | % |
| Exxon Mobil Corp. | | | 55,310 | | | | 4,576,349 | | | | 3.20 | % |
| FMC Technologies, Inc. (a) | | | 40,890 | | | | 1,383,309 | | | | 0.97 | % |
| Marathon Oil Corp. | | | 66,385 | | | | 1,220,156 | | | | 0.85 | % |
| Occidental Petroleum Corp. | | | 56,290 | | | | 4,195,857 | | | | 2.93 | % |
| Valero Energy Corp. | | | 14,575 | | | | 960,784 | | | | 0.67 | % |
| | | | | | | | 17,894,877 | | | | 12.49 | % |
| | | | | | | | | | | | | |
| Financials – 23.95% | | | | | | | | | | | | |
| Affiliated Managers Group, Inc. (a) | | | 8,340 | | | | 1,503,369 | | | | 1.05 | % |
| Allstate Corp. | | | 22,995 | | | | 1,422,931 | | | | 0.99 | % |
| American International Group, Inc. | | | 24,585 | | | | 1,550,330 | | | | 1.08 | % |
| Bank of America Corp. | | | 118,645 | | | | 1,990,863 | | | | 1.39 | % |
| BlackRock, Inc. | | | 7,520 | | | | 2,646,814 | | | | 1.85 | % |
| Citigroup, Inc. | | | 59,335 | | | | 3,154,842 | | | | 2.20 | % |
| CME Group, Inc. | | | 12,240 | | | | 1,156,313 | | | | 0.81 | % |
| Hartford Financial Services Group, Inc. | | | 56,035 | | | | 2,592,179 | | | | 1.81 | % |
| JPMorgan Chase & Co. | | | 61,045 | | | | 3,922,141 | | | | 2.74 | % |
| KeyCorp | | | 53,134 | | | | 659,924 | | | | 0.46 | % |
The accompanying notes are an integral part of these financial statements.
| COMMON STOCKS | | Number | | | | | | % of | |
| | | of Shares | | | Value | | | Net Assets | |
| Financials (Continued) | | | | | | | | | |
| Marsh & McLennan Companies, Inc. | | | 39,045 | | | $ | 2,176,368 | | | | 1.52 | % |
| MetLife, Inc. | | | 36,285 | | | | 1,828,038 | | | | 1.28 | % |
| Morgan Stanley | | | 49,395 | | | | 1,628,553 | | | | 1.14 | % |
| SunTrust Banks, Inc. | | | 47,074 | | | | 1,954,513 | | | | 1.36 | % |
| Synchrony Financial (a) | | | 20,414 | | | | 627,935 | | | | 0.44 | % |
| Wells Fargo & Co. | | | 101,380 | | | | 5,488,713 | | | | 3.83 | % |
| | | | | | | | 34,303,826 | | | | 23.95 | % |
| | | | | | | | | | | | | |
| Health Care – 12.86% | | | | | | | | | | | | |
| Aetna, Inc. | | | 13,952 | | | | 1,601,410 | | | | 1.12 | % |
| Allergan PLC (a)(b) | | | 2,340 | | | | 721,820 | | | | 0.50 | % |
| CIGNA Corp. | | | 19,566 | | | | 2,622,627 | | | | 1.83 | % |
| Johnson & Johnson | | | 38,160 | | | | 3,855,305 | | | | 2.69 | % |
| Medtronic PLC (b) | | | 23,235 | | | | 1,717,531 | | | | 1.20 | % |
| Merck & Co., Inc. | | | 49,980 | | | | 2,731,907 | | | | 1.91 | % |
| Pfizer, Inc. | | | 90,665 | | | | 3,066,290 | | | | 2.14 | % |
| Thermo Fisher Scientific, Inc. | | | 16,160 | | | | 2,113,405 | | | | 1.47 | % |
| | | | | | | | 18,430,295 | | | | 12.86 | % |
| | | | | | | | | | | | | |
| Industrials – 11.83% | | | | | | | | | | | | |
| CSX Corp. | | | 41,978 | | | | 1,132,986 | | | | 0.79 | % |
| Danaher Corp. | | | 22,080 | | | | 2,060,285 | | | | 1.44 | % |
| Dover Corp. | | | 11,310 | | | | 728,703 | | | | 0.51 | % |
| FedEx Corp. | | | 8,342 | | | | 1,301,769 | | | | 0.91 | % |
| General Dynamics Corp. | | | 9,380 | | | | 1,393,680 | | | | 0.97 | % |
| General Electric Co. | | | 131,650 | | | | 3,807,318 | | | | 2.66 | % |
| Honeywell International, Inc. | | | 16,920 | | | | 1,747,498 | | | | 1.22 | % |
| Ingersoll-Rand PLC (b) | | | 24,765 | | | | 1,467,574 | | | | 1.02 | % |
| Northrop Grumman Corp. | | | 7,050 | | | | 1,323,638 | | | | 0.92 | % |
| Ryder System, Inc. | | | 13,539 | | | | 971,829 | | | | 0.68 | % |
| Southwest Airlines Co. | | | 21,851 | | | | 1,011,483 | | | | 0.71 | % |
| | | | | | | | 16,946,763 | | | | 11.83 | % |
| | | | | | | | | | | | | |
| Information Technology – 12.71% | | | | | | | | | | | | |
| Adobe Systems, Inc. (a) | | | 12,390 | | | | 1,098,497 | | | | 0.77 | % |
| Avago Technologies, Ltd. | | | 6,100 | | | | 751,093 | | | | 0.52 | % |
| Ciena Corp. (a) | | | 39,165 | | | | 945,443 | | | | 0.66 | % |
| Cisco Systems, Inc. | | | 102,830 | | | | 2,966,646 | | | | 2.07 | % |
The accompanying notes are an integral part of these financial statements.
| HENNESSY FUNDS | 1-800-966-4354 | |
| COMMON STOCKS | | Number | | | | | | % of | |
| | | of Shares | | | Value | | | Net Assets | |
| Information Technology (Continued) | | | | | | | | | |
| Citrix Systems, Inc. (a) | | | 18,790 | | | $ | 1,542,659 | | | | 1.08 | % |
| F5 Networks, Inc. (a) | | | 7,861 | | | | 866,282 | | | | 0.60 | % |
| LAM Research Corp. | | | 22,635 | | | | 1,733,615 | | | | 1.21 | % |
| Microsoft Corp. | | | 81,125 | | | | 4,270,420 | | | | 2.98 | % |
| NXP Semiconductors NV (a)(b) | | | 13,869 | | | | 1,086,636 | | | | 0.76 | % |
| Skyworks Solutions, Inc. | | | 25,885 | | | | 1,999,357 | | | | 1.40 | % |
| Western Digital Corp. | | | 14,195 | | | | 948,510 | | | | 0.66 | % |
| | | | | | | | 18,209,158 | | | | 12.71 | % |
| | | | | | | | | | | | | |
| Materials – 2.78% | | | | | | | | | | | | |
| CF Industries Holdings, Inc. | | | 16,360 | | | | 830,597 | | | | 0.58 | % |
| PPG Industries, Inc. | | | 14,810 | | | | 1,544,091 | | | | 1.08 | % |
| WestRock Co. | | | 29,965 | | | | 1,610,918 | | | | 1.12 | % |
| | | | | | | | 3,985,606 | | | | 2.78 | % |
| | | | | | | | | | | | | |
| Telecommunication Services – 0.67% | | | | | | | | | | | | |
| Level 3 Communications, Inc. (a) | | | 18,945 | | | | 965,248 | | | | 0.67 | % |
| | | | | | | | | | | | | |
| Utilities – 5.43% | | | | | | | | | | | | |
| Ameren Corp. | | | 19,630 | | | | 857,438 | | | | 0.60 | % |
| American Electric Power, Inc. | | | 33,000 | | | | 1,869,450 | | | | 1.31 | % |
| DTE Energy Co. | | | 43,745 | | | | 3,569,155 | | | | 2.49 | % |
| Exelon Corp. | | | 52,976 | | | | 1,479,090 | | | | 1.03 | % |
| | | | | | | | 7,775,133 | | | | 5.43 | % |
| | | | | | | | | | | | | |
| Total Common Stocks | | | | | | | | | | | | |
| (Cost $115,164,354) | | | | | | | 136,868,477 | | | | 95.54 | % |
| | | | | | | | | | | | | |
| REITS – 3.83% | | | | | | | | | | | | |
| | | | | | | | | | | | | |
| Financials – 3.83% | | | | | | | | | | | | |
| AvalonBay Communities, Inc. | | | 14,890 | | | | 2,603,219 | | | | 1.82 | % |
| Host Hotels & Resorts, Inc. | | | 82,932 | | | | 1,437,211 | | | | 1.00 | % |
| Kilroy Realty Corp. | | | 21,894 | | | | 1,441,501 | | | | 1.01 | % |
| | | | | | | | | | | | | |
| Total REITS | | | | | | | | | | | | |
| (Cost $5,491,235) | | | | | | | 5,481,931 | | | | 3.83 | % |
The accompanying notes are an integral part of these financial statements.
| SHORT-TERM INVESTMENTS – 1.22% | | Number | | | | | | % of | |
| | | of Shares | | | Value | | | Net Assets | |
| Money Market Funds – 1.22% | | | | | | | | | |
| Fidelity Government Portfolio – | | | | | | | | | |
| Institutional Class, 0.01% (c) | | | 1,749,592 | | | $ | 1,749,592 | | | | 1.22 | % |
| | | | | | | | | | | | | |
| Total Short-Term Investments | | | | | | | | | | | | |
| (Cost $1,749,592) | | | | | | | 1,749,592 | | | | 1.22 | % |
| | | | | | | | | | | | | |
| Total Investments | | | | | | | | | | | | |
| (Cost $122,405,181) – 100.59% | | | | | | | 144,100,000 | | | | 100.59 | % |
| Liabilities in | | | | | | | | | | | | |
| Excess of Other Assets – (0.59)% | | | | | | | (842,604 | ) | | | (0.59 | )% |
TOTAL NET ASSETS – 100.00% | | | | | | $ | 143,257,396 | | | | 100.00 | % |
Percentages are stated as a percent of net assets.
REIT – Real Estate Investment Trust
| (a) | Non-income producing security. |
| (b) | U.S. traded security of a foreign corporation. |
| (c) | The rate listed is the fund’s 7-day yield as of October 31, 2015. |
| HENNESSY FUNDS | 1-800-966-4354 | |
Summary of Fair Value Exposure at October 31, 2015
The following is a summary of the inputs used to value the Fund’s net assets as of October 31, 2015 (see Note 3 in the accompanying notes to the financial statements):
| Common Stocks | | Level 1 | | | Level 2 | | | Level 3 | | | Total | |
| Consumer Discretionary | | $ | 9,566,326 | | | $ | — | | | $ | — | | | $ | 9,566,326 | |
| Consumer Staples | | | 8,791,245 | | | | — | | | | — | | | | 8,791,245 | |
| Energy | | | 17,894,877 | | | | — | | | | — | | | | 17,894,877 | |
| Financials | | | 34,303,826 | | | | — | | | | — | | | | 34,303,826 | |
| Health Care | | | 18,430,295 | | | | — | | | | — | | | | 18,430,295 | |
| Industrials | | | 16,946,763 | | | | — | | | | — | | | | 16,946,763 | |
| Information Technology | | | 18,209,158 | | | | — | | | | — | | | | 18,209,158 | |
| Materials | | | 3,985,606 | | | | — | | | | — | | | | 3,985,606 | |
| Telecommunication Services | | | 965,248 | | | | — | | | | — | | | | 965,248 | |
| Utilities | | | 7,775,133 | | | | — | | | | — | | | | 7,775,133 | |
| Total Common Stocks | | $ | 136,868,477 | | | $ | — | | | $ | — | | | $ | 136,868,477 | |
| REITS | | | | | | | | | | | | | | | | |
| Financials | | $ | 5,481,931 | | | $ | — | | | $ | — | | | $ | 5,481,931 | |
| Total REITS | | $ | 5,481,931 | | | $ | — | | | $ | — | | | $ | 5,481,931 | |
| Short-Term Investments | | | | | | | | | | | | | | | | |
| Money Market Funds | | $ | 1,749,592 | | | $ | — | | | $ | — | | | $ | 1,749,592 | |
| Total Short-Term Investments | | $ | 1,749,592 | | | $ | — | | | $ | — | | | $ | 1,749,592 | |
| Total Investments | | $ | 144,100,000 | | | $ | — | | | $ | — | | | $ | 144,100,000 | |
Transfers between levels are recognized at the end of the reporting period. During the year ended October 31, 2015, the Fund recognized no transfers between levels.
The accompanying notes are an integral part of these financial statements.
Financial Statements
Statement of Assets and Liabilities as of October 31, 2015 |
| ASSETS: | | | |
| Investments in securities, at value (cost $122,405,181) | | $ | 144,100,000 | |
| Dividends and interest receivable | | | 130,099 | |
| Receivable for fund shares sold | | | 68,036 | |
| Receivable for securities sold | | | 2,054,692 | |
| Prepaid expenses and other assets | | | 14,532 | |
| Total Assets | | | 146,367,359 | |
| | | | | |
| LIABILITIES: | | | | |
| Payable for securities purchased | | | 2,914,196 | |
| Payable for fund shares redeemed | | | 300 | |
| Payable to advisor | | | 101,711 | |
| Payable to administrator | | | 22,806 | |
| Payable to auditor | | | 22,600 | |
| Accrued service fees | | | 11,871 | |
| Accrued trustees fees | | | 2,407 | |
| Accrued expenses and other payables | | | 34,072 | |
| Total Liabilities | | | 3,109,963 | |
| NET ASSETS | | $ | 143,257,396 | |
| | | | | |
| NET ASSETS CONSIST OF: | | | | |
| Capital stock | | $ | 109,993,673 | |
| Accumulated net investment income | | | 1,020,438 | |
| Accumulated net realized gain on investments | | | 10,548,466 | |
| Unrealized net appreciation on investments | | | 21,694,819 | |
| Total Net Assets | | $ | 143,257,396 | |
| | | | | |
| NET ASSETS | | | | |
| Investor Class: | | | | |
| Shares authorized (no par value) | | Unlimited | |
| Net assets applicable to outstanding Investor Class shares | | $ | 141,956,807 | |
| Shares issued and outstanding | | | 4,209,437 | |
| Net asset value, offering price and redemption price per share | | $ | 33.72 | |
| | | | | |
| Institutional Class: | | | | |
| Shares authorized (no par value) | | Unlimited | |
| Net assets applicable to outstanding Institutional Class shares | | $ | 1,300,589 | |
| Shares issued and outstanding | | | 38,456 | |
| Net asset value, offering price and redemption price per share | | $ | 33.82 | |
The accompanying notes are an integral part of these financial statements.
| HENNESSY FUNDS | 1-800-966-4354 | |
Financial Statements
Statement of Operations for the year ended October 31, 2015 |
| INVESTMENT INCOME: | | | |
| Dividend income | | $ | 3,145,614 | |
| Interest income | | | 141 | |
| Total investment income | | | 3,145,755 | |
| | | | | |
| EXPENSES: | | | | |
| Investment advisory fees (See Note 5) | | | 1,273,573 | |
| Service fees – Investor Class (See Note 5) | | | 149,326 | |
| Administration, fund accounting, custody and transfer agent fees (See Note 5) | | | 147,112 | |
| Sub-transfer agent expenses – Investor Class (See Note 5) | | | 116,001 | |
| Sub-transfer agent expenses – Institutional Class (See Note 5) | | | 769 | |
| Federal and state registration fees | | | 29,483 | |
| Audit fees | | | 23,392 | |
| Compliance expense | | | 22,187 | |
| Reports to shareholders | | | 16,079 | |
| Trustees’ fees and expenses | | | 11,522 | |
| Legal fees | | | 2,250 | |
| Other expenses | | | 13,397 | |
| Total expenses before reimbursement by advisor | | | 1,805,091 | |
| Expense reimbursement by advisor – Institutional Class (See Note 5) | | | (144 | ) |
| Net expenses | | | 1,804,947 | |
| NET INVESTMENT INCOME | | $ | 1,340,808 | |
| | | | | |
| REALIZED AND UNREALIZED GAINS (LOSSES): | | | | |
| Net realized gain on investments | | $ | 10,907,367 | |
| Net change in unrealized depreciation on investments | | | (9,429,582 | ) |
| Net gain on investments | | | 1,477,785 | |
| NET INCREASE IN NET ASSETS RESULTING FROM OPERATIONS | | $ | 2,818,593 | |
The accompanying notes are an integral part of these financial statements.
Financial Statements
| Statements of Changes in Net Assets |
| | | Year Ended | | | Year Ended | |
| | | October 31, 2015 | | | October 31, 2014 | |
| OPERATIONS: | | | | | | |
| Net investment income | | $ | 1,340,808 | | | $ | 1,189,360 | |
| Net realized gain on investments | | | 10,907,367 | | | | 18,120,591 | |
| Net change in unrealized appreciation | | | | | | | | |
| (depreciation) on investments | | | (9,429,582 | ) | | | 384,704 | |
| Net increase in net assets resulting from operations | | | 2,818,593 | | | | 19,694,655 | |
| | | | | | | | | |
| DISTRIBUTIONS TO SHAREHOLDERS FROM: | | | | | | | | |
| Net investment income | | | | | | | | |
| Investor Class | | | (1,223,834 | ) | | | (1,140,763 | ) |
| Institutional Class | | | (4,422 | ) | | | (3,752 | ) |
| Net realized gains | | | | | | | | |
| Investor Class | | | (6,143,232 | ) | | | — | |
| Institutional Class | | | (16,453 | ) | | | — | |
| Total distributions | | | (7,387,941 | ) | | | (1,144,515 | ) |
| | | | | | | | | |
| CAPITAL SHARE TRANSACTIONS: | | | | | | | | |
| Proceeds from shares subscribed – Investor Class | | | 1,694,661 | | | | 1,675,893 | |
| Proceeds from shares subscribed – Institutional Class | | | 963,669 | | | | 60,482 | |
| Dividends reinvested – Investor Class | | | 7,104,575 | | | | 1,092,130 | |
| Dividends reinvested – Institutional Class | | | 20,495 | | | | 3,353 | |
| Cost of shares redeemed – Investor Class | | | (13,521,759 | ) | | | (13,509,532 | ) |
| Cost of shares redeemed – Institutional Class | | | (82,147 | ) | | | (46,510 | ) |
| Net decrease in net assets derived from | | | | | | | | |
| capital share transactions | | | (3,820,506 | ) | | | (10,724,184 | ) |
| TOTAL INCREASE (DECREASE) IN NET ASSETS | | | (8,389,854 | ) | | | 7,825,956 | |
| | | | | | | | | |
| NET ASSETS: | | | | | | | | |
| Beginning of year | | | 151,647,250 | | | | 143,821,294 | |
| End of year | | $ | 143,257,396 | | | $ | 151,647,250 | |
| Undistributed net investment income, end of year | | $ | 1,020,438 | | | $ | 914,964 | |
| | | | | | | | | |
| CHANGES IN SHARES OUTSTANDING: | | | | | | | | |
| Shares sold – Investor Class | | | 49,427 | | | | 51,293 | |
| Shares sold – Institutional Class | | | 28,858 | | | | 1,784 | |
| Shares issued to holders as reinvestment | | | | | | | | |
| of dividends – Investor Class | | | 208,039 | | | | 34,322 | |
| Shares issued to holders as reinvestment | | | | | | | | |
| of dividends – Institutional Class | | | 598 | | | | 105 | |
| Shares redeemed – Investor Class | | | (395,518 | ) | | | (412,605 | ) |
| Shares redeemed – Institutional Class | | | (2,406 | ) | | | (1,408 | ) |
| Net decrease in shares outstanding | | | (111,002 | ) | | | (326,509 | ) |
The accompanying notes are an integral part of these financial statements.
| HENNESSY FUNDS | 1-800-966-4354 | |
Financial Statements
For an Investor Class share outstanding throughout each year
PER SHARE DATA:
Net asset value, beginning of year
Income from investment operations:
Net investment income
Net realized and unrealized gains on investments
Total from investment operations
Less distributions:
Dividends from net investment income
Dividends from net realized gains
Total distributions
Net asset value, end of year
TOTAL RETURN
SUPPLEMENTAL DATA AND RATIOS:
Net assets, end of year (millions)
Ratio of expenses to average net assets
Ratio of net investment income to average net assets
Portfolio turnover rate(1)
(1) | Portfolio turnover is calculated on the basis of the Fund as a whole. |
The accompanying notes are an integral part of these financial statements.
| Year Ended October 31, | |
| 2015 | | | 2014 | | | 2013 | | | 2012 | | | 2011 | |
| | | | | | | | | | | | | |
| $ | 34.79 | | | $ | 30.70 | | | $ | 24.71 | | | $ | 21.47 | | | $ | 20.57 | |
| | | | | | | | | | | | | | | | | | | |
| | | | | | | | | | | | | | | | | | | |
| | 0.30 | | | | 0.28 | | | | 0.28 | | | | 0.28 | | | | 0.22 | |
| | 0.32 | | | | 4.06 | | | | 6.00 | | | | 3.14 | | | | 0.89 | |
| | 0.62 | | | | 4.34 | | | | 6.28 | | | | 3.42 | | | | 1.11 | |
| | | | | | | | | | | | | | | | | | | |
| | | | | | | | | | | | | | | | | | | |
| | (0.27 | ) | | | (0.25 | ) | | | (0.29 | ) | | | (0.18 | ) | | | (0.21 | ) |
| | (1.42 | ) | | | — | | | | — | | | | — | | | | — | |
| | (1.69 | ) | | | (0.25 | ) | | | (0.29 | ) | | | (0.18 | ) | | | (0.21 | ) |
| $ | 33.72 | | | $ | 34.79 | | | $ | 30.70 | | | $ | 24.71 | | | $ | 21.47 | |
| | | | | | | | | | | | | | | | | | | |
| | 1.77 | % | | | 14.20 | % | | | 25.64 | % | | | 16.07 | % | | | 5.36 | % |
| | | | | | | | | | | | | | | | | | | |
| | | | | | | | | | | | | | | | | | | |
| $ | 141.96 | | | $ | 151.25 | | | $ | 143.48 | | | $ | 125.00 | | | $ | 123.97 | |
| | 1.20 | % | | | 1.28 | % | | | 1.33 | % | | | 1.40 | % | | | 1.38 | % |
| | 0.90 | % | | | 0.80 | % | | | 0.98 | % | | | 1.16 | % | | | 0.97 | % |
| | 85 | % | | | 85 | % | | | 91 | % | | | 111 | % | | | 149 | % |
The accompanying notes are an integral part of these financial statements.
| HENNESSY FUNDS | 1-800-966-4354 | |
Financial Statements
For an Institutional Class share outstanding throughout each year
PER SHARE DATA:
Net asset value, beginning of year
Income from investment operations:
Net investment income
Net realized and unrealized gains on investments
Total from investment operations
Less distributions:
Dividends from net investment income
Dividends from net realized gains
Total distributions
Net asset value, end of year
TOTAL RETURN
SUPPLEMENTAL DATA AND RATIOS:
Net assets, end of year (millions)
Ratio of expenses to average net assets:
Before expense reimbursement
After expense reimbursement
Ratio of net investment income to average net assets:
Before expense reimbursement
After expense reimbursement
Portfolio turnover rate(1)
(1) | Portfolio turnover is calculated on the basis of the Fund as a whole. |
The accompanying notes are an integral part of these financial statements.
| Year Ended October 31, | |
| 2015 | | | 2014 | | | 2013 | | | 2012 | | | 2011 | |
| | | | | | | | | | | | | |
| $ | 34.94 | | | $ | 30.83 | | | $ | 24.83 | | | $ | 21.56 | | | $ | 20.65 | |
| | | | | | | | | | | | | | | | | | | |
| | | | | | | | | | | | | | | | | | | |
| | 0.23 | | | | 0.34 | | | | 0.49 | | | | 0.39 | | | | 0.27 | |
| | 0.44 | | | | 4.11 | | | | 5.90 | | | | 3.15 | | | | 0.92 | |
| | 0.67 | | | | 4.45 | | | | 6.39 | | | | 3.54 | | | | 1.19 | |
| | | | | | | | | | | | | | | | | | | |
| | | | | | | | | | | | | | | | | | | |
| | (0.36 | ) | | | (0.34 | ) | | | (0.39 | ) | | | (0.27 | ) | | | (0.28 | ) |
| | (1.43 | ) | | | — | | | | — | | | | — | | | | — | |
| | (1.79 | ) | | | (0.34 | ) | | | (0.39 | ) | | | (0.27 | ) | | | (0.28 | ) |
| $ | 33.82 | | | $ | 34.94 | | | $ | 30.83 | | | $ | 24.83 | | | $ | 21.56 | |
| | | | | | | | | | | | | | | | | | | |
| | 1.89 | % | | | 14.55 | % | | | 26.08 | % | | | 16.58 | % | | | 5.76 | % |
| | | | | | | | | | | | | | | | | | | |
| | | | | | | | | | | | | | | | | | | |
| $ | 1.30 | | | $ | 0.40 | | | $ | 0.34 | | | $ | 0.06 | | | $ | 0.04 | |
| | | | | | | | | | | | | | | | | | | |
| | 1.18 | % | | | 1.18 | % | | | 1.14 | % | | | 1.22 | % | | | 1.21 | % |
| | 1.15 | % | | | 0.98 | % | | | 0.98 | % | | | 0.98 | % | | | 0.98 | % |
| | | | | | | | | | | | | | | | | | | |
| | 0.83 | % | | | 0.91 | % | | | 1.07 | % | | | 1.29 | % | | | 1.13 | % |
| | 0.86 | % | | | 1.11 | % | | | 1.23 | % | | | 1.53 | % | | | 1.36 | % |
| | 85 | % | | | 85 | % | | | 91 | % | | | 111 | % | | | 149 | % |
The accompanying notes are an integral part of these financial statements.
| HENNESSY FUNDS | 1-800-966-4354 | |
Financial Statements
Notes to the Financial Statements October 31, 2015 |
1). ORGANIZATION
The Hennessy Large Value Fund (the “Fund”) is a series of Hennessy Funds Trust (the “Trust”), which was organized as a Delaware statutory trust on September 17, 1992. The Fund is an open-end management investment company registered under the Investment Company Act of 1940, as amended. The investment objective of the Fund is long-term growth of capital and current income. The Fund is a diversified fund.
The Fund offers Investor Class and Institutional Class shares. Each class of shares differs principally in its respective administration, shareholder servicing, and transfer agent expenses and sales charges, if any. Each class has identical rights to earnings, assets, and voting privileges, except for class-specific expenses and exclusive rights to vote on matters affecting only an individual class.
As an investment company, the Fund follows the investment company accounting and reporting guidance of the Financial Accounting Standards Board (“FASB”) Accounting Standard Codification Topic 946 “Financial Services—Investment Companies.”
2). SIGNIFICANT ACCOUNTING POLICIES
The following is a summary of significant accounting policies consistently followed by the Fund in the preparation of the financial statements. These policies are in conformity with U.S. generally accepted accounting principles (“GAAP”).
| a). | Investment Valuation – All investments in securities are recorded at their estimated fair value, as described in Note 3. |
| | |
| b). | Federal Income Taxes – Provision for federal income taxes or excise taxes has not been made since the Fund has elected to be taxed as a “regulated investment company” and intends to distribute substantially all of its taxable income to its shareholders and otherwise comply with the provisions of the Internal Revenue Code of 1986, as amended, applicable to regulated investment companies. Net investment income or loss and realized gains and losses for federal income tax purposes may differ from that reported on the financial statements because of temporary book and tax basis differences. Temporary differences are primarily the result of the treatment of wash sales for tax reporting purposes. The Fund recognizes interest and penalties related to income tax benefits, if any, in the statement of operations as an income tax expense. Distributions from net realized gains for book purposes may include short-term capital gains, which are included as ordinary income to shareholders for tax purposes. |
| | |
| | Due to inherent differences in the recognition of income, expenses, and realized gains/losses under GAAP and federal income tax regulations, permanent differences between book and tax basis reporting for the 2015 fiscal year have been identified and appropriately reclassified on the Statement of Assets and Liabilities. The adjustments are as follows: |
| Undistributed | Accumulated | |
| Net Investment | Net Realized | |
Income/(Loss) | Gain/(Loss) | Paid-in Capital |
| $(7,078) | $7,078 | $— |
| c). | Income and Expenses – Dividend income is recognized on the ex-dividend date or as soon as information is available to the Fund. Interest income, which includes the |
| | amortization of premium and accretion of discount, is recognized on an accrual basis. The Fund is charged for those expenses that are directly attributable to the portfolio, such as advisory, administration, and certain shareholder service fees. Income, expenses (other than expenses attributable to a specific class), and realized and unrealized gains or losses on investments are allocated to each class of shares based on its respective net assets. |
| | |
| d). | Distributions to Shareholders – Dividends from net investment income for the Fund, if any, are declared and paid annually, usually in December. Distributions of net realized capital gains, if any, are declared and paid annually, usually in December. |
| | |
| e). | Security Transactions – Investment and shareholder transactions are recorded on the trade date. The Fund determines the gain or loss realized from the investment transactions by comparing the original cost of the security lot sold with the net sale proceeds. Discounts and premiums on securities purchased are accreted/amortized over the life of the respective security. |
| | |
| f). | Use of Estimates – The preparation of financial statements in conformity with GAAP requires management to make estimates and assumptions that affect the reported amounts of assets and liabilities and disclosure of contingent assets and liabilities at the date of the financial statements and the reported change in net assets during the reporting period. Actual results could differ from those estimates. |
| | |
| g). | Share Valuation – The net asset value (“NAV”) per share of the Fund is calculated by dividing the sum of the value of the securities held by the Fund, plus cash or other assets, minus all liabilities (including estimated accrued expenses) by the total number of shares outstanding for the Fund, rounded to the nearest cent. The Fund’s shares will not be priced on days the New York Stock Exchange is closed for trading. The offering and redemption price per share for the Fund is equal to the Fund’s NAV per share. |
| | |
| h). | Foreign Currency – Values of investments denominated in foreign currencies, if any, are converted into U.S. dollars using the spot market rate of exchange at the time of valuation. Purchases and sales of investments and income are translated into U.S. dollars using the spot market rate of exchange prevailing on the respective dates of such transactions. The Fund does not isolate the portion of the results of operations resulting from fluctuations in foreign exchange rates on investments from fluctuations resulting from changes in the market prices of securities held. Such fluctuations are included with the net realized and unrealized gain or loss on investments. Foreign investments present additional risks due to currency fluctuations, economic and political factors, lower liquidity, government regulations, differences in accounting standards, and other factors. |
| | |
| i). | Forward Contracts – The Fund may enter into forward currency contracts to reduce its exposure to changes in foreign currency exchange rates on its foreign holdings and to lock in the U.S. dollar cost of firm purchase and sale commitments for securities denominated in foreign currencies. A forward currency contract is a commitment to purchase or sell a foreign currency at a future date at a negotiated forward rate. The gain or loss arising from the difference between the U.S. dollar cost of the original contract and the value of the foreign currency in U.S. dollars upon closing of such contract is included in net realized gain or loss from foreign currency transactions. During the fiscal year ended October 31, 2015, the Fund did not enter into any forward contracts. |
| | |
| j). | Repurchase Agreements – The Fund may enter into repurchase agreements with member banks or security dealers of the Federal Reserve Board whom the investment advisor deems creditworthy. The repurchase price generally equals the price paid by the Fund plus interest negotiated on the basis of current short-term rates. |
| HENNESSY FUNDS | 1-800-966-4354 | |
| | Securities pledged as collateral for repurchase agreements are held by the custodian bank until the respective agreements mature. Provisions of the repurchase agreements ensure that the market value of the collateral, including accrued interest thereon, is sufficient to cover the repurchase amount in the event of default of the counterparty. If the counterparty defaults and the value of the collateral declines or if the counterparty enters an insolvency proceeding, realization of the collateral by the Fund may be delayed or limited. |
| | |
| k). | Accounting for Uncertainty in Income Taxes – The Fund has accounting policies regarding recognition and measurement of tax positions taken or expected to be taken on a tax return. The tax returns of the Fund for the prior three fiscal years are open for examination. The Fund has reviewed all open tax years in major jurisdictions and concluded that there is no impact on the Fund’s net assets and no tax liability resulting from unrecognized tax benefits relating to uncertain income tax positions taken or expected to be taken on a tax return. The Fund’s major tax jurisdictions are U.S. federal and Delaware. |
| | |
| l). | Derivatives – The Fund may invest in, or enter into, derivatives, such as options, futures contracts, options on futures contracts, and swaps, for a variety of reasons, including to hedge certain risks, to provide a substitute for purchasing or selling particular securities, or to increase potential income gain. Derivatives may provide a cheaper, quicker, or more specifically focused way for a Fund to invest than “traditional” securities would. The main purpose of utilizing these derivative instruments is for hedging purposes. |
| | |
| | The Fund follows the financial accounting reporting rules as required by the Derivatives and Hedging Topic of the FASB Accounting Standards Codification. Under such rules, the Fund is required to include enhanced disclosure that enables investors to understand how and why an entity uses derivatives, how derivatives are accounted for, and how derivatives instruments affect an entity’s results of operations and financial position. During the fiscal year ended October 31, 2015, the Fund did not hold any derivative instruments. |
| | |
| m). | New Accounting Pronouncements – In June 2014, the FASB issued Accounting Standards Update (“ASU”) No. 2014-11 “Repurchase-to Maturity Transactions, Repurchase Financings, and Disclosures.” The amendments in this ASU require an entity to modify accounting for repurchase-to-maturity transactions and repurchase financing arrangements, as well as modify required disclosures for repurchase agreements, securities lending transactions, and repurchase-to-maturity transactions that are accounted for as secured borrowings. The guidance is effective for fiscal years beginning on or after December 15, 2014, and for interim periods within those fiscal years. Management is currently evaluating the impact these changes will have on the Fund’s financial statement disclosures. |
| | |
| | In May 2015, the FASB issued ASU No. 2015-07 “Disclosure for Investments in Certain Entities that Calculate Net Asset Value per Share (or Its Equivalent).” The amendments in ASU No. 2015-07 remove the requirement to categorize within the fair value hierarchy investments measured at NAV and require the disclosure of sufficient information to reconcile the fair value of the remaining assets categorized within the fair value hierarchy to the financial statements. The amendments in ASU No. 2015-07 are effective for fiscal years beginning after December 15, 2015, and interim periods within those fiscal years. Management has reviewed the requirements and believes the adoption of ASU 2015-07 will not have a material impact on the Fund’s financial statements and related disclosures. |
3). SECURITIES VALUATION
The Fund follows authoritative fair valuation accounting standards that establish an authoritative definition of fair value and set out a hierarchy for measuring fair value. These standards require additional disclosures about the various inputs and valuation techniques used to develop the measurements of fair value and a discussion in changes in valuation techniques and related inputs during the period. These inputs are summarized in the three broad levels listed below:
| | Level 1 – | Quoted unadjusted prices for identical instruments in active markets to which the Fund has access at the date of measurement. |
| | | |
| | Level 2 – | Quoted prices for similar instruments in active markets; quoted prices for identical or similar instruments in markets that are not active; and model-derived valuations in which all significant inputs and significant value drivers are observable in active markets. Level 2 inputs are those in markets for which there are few transactions, the prices are not current, the prices are fair value adjusted due to post-market close subsequent events (foreign markets), little public information exists, or instances where prices vary substantially over time or among brokered market makers. These inputs may also include interest rates, prepayment speeds, credit risk curves, default rates, and similar data. |
| | | |
| | Level 3 – | Model-derived valuations in which one or more significant inputs or significant value drivers are unobservable. Unobservable inputs are those inputs that reflect the Fund’s own assumptions about what market participants would use to price the asset or liability based on the best available information. |
Following is a description of the valuation techniques applied to the Fund’s major categories of assets and liabilities measured at fair value on a recurring basis.
Equity Securities – Equity securities, including common stocks, preferred stocks, foreign-issued common stocks, exchange-traded funds, closed-end mutual funds, partnerships, rights, and real estate investment trusts, that are traded on a securities exchange for which a last-quoted sales price is readily available will generally be valued at the last sales price as reported by the primary exchange on which the securities are listed. Securities listed on The NASDAQ Stock Market (“NASDAQ”) will generally be valued at the NASDAQ Official Closing Price, which may differ from the last sales price reported. Securities traded on a securities exchange for which a last-quoted sales price is not readily available will generally be valued at the mean between the bid and ask prices. To the extent these securities are actively traded and valuation adjustments are not applied, they are classified in Level 1 of the fair value hierarchy. Securities traded on foreign exchanges generally are not valued at the same time the Fund calculates its NAV because most foreign markets close well before such time. The earlier close of most foreign markets gives rise to the possibility that significant events, including broad market moves, may have occurred in the interim. In certain circumstances, it may be determined that a security needs to be fair valued because it appears that the value of the security might have been materially affected by events occurring after the close of the market in which the security is principally traded, but before the time the Fund calculates its NAV, such as by a development that affects an entire market or region (e.g., weather-related events) or a potentially global development (e.g., a terrorist attack that may be expected to have an effect on investor expectations worldwide).
Registered Investment Companies – Investments in registered investment companies (e.g., mutual funds) are generally priced at the ending NAV provided by the applicable
| HENNESSY FUNDS | 1-800-966-4354 | |
registered investment company’s service agent and will be classified in Level 1 of the fair value hierarchy.
Debt Securities – Debt securities, including corporate bonds, asset-backed securities, mortgage-backed securities, municipal bonds, U.S. Treasuries, and U.S. government agency issues, are generally valued at market on the basis of valuations furnished by an independent pricing service that utilizes both dealer-supplied valuations and formula-based techniques. The pricing service may consider recently executed transactions in securities of the issuer or comparable issuers, market price quotations (where observable), bond spreads, and fundamental data relating to the issuer. In addition, the model may incorporate market observable data such as reported sales of similar securities, broker quotes, yields, bids, offers, and reference data. Certain securities are valued principally using dealer quotations. These securities are generally classified in Level 2 of the fair value hierarchy.
Short-Term Securities – Short-term equity investments, including money market funds, are valued in the manner specified above. Short-term debt investments are generally valued at amortized cost, which approximates fair market value, if their original term to maturity was 60 days or less, or by amortizing the values as of the 61st day prior to maturity, if their original term to maturity exceeded 60 days. Amortized cost is not used if its use would be inappropriate due to credit or other impairments of the issuer, in which case the security’s fair value would be determined, as described below. Short-term securities are generally classified in Level 1 or Level 2 of the fair market hierarchy depending on the inputs used and market activity levels for specific securities.
The Board of Trustees of the Fund (the “Board”) has adopted fair value pricing procedures that are followed when a price for a security is not readily available or if a significant event has occurred that indicates the closing price of a security no longer represents the true value of that security. Fair value pricing determinations are made in good faith in accordance with these procedures. There are numerous criteria that will be given consideration in determining a fair value of a security. Some of these criteria are trading volume of a security and markets, the value of other like securities, and news events with direct bearing to a security or markets. Fair value pricing results in an estimated price for a security that reflects the amount the Fund might reasonably expect to receive in a current sale. Depending on the relative significance of the valuation inputs, these securities may be classified in either Level 2 or Level 3 of the fair value hierarchy.
The fair valuation of foreign securities may be determined with the assistance of a pricing service using correlations between the movement of prices of such securities and indices of domestic securities and other appropriate indicators, such as closing market prices of relevant American Depositary Receipts or futures contracts. The effect of using fair value pricing is that the Fund’s NAV will reflect the affected portfolio securities’ value as determined in the judgment of the Board or its designee instead of being determined by the market. Using a fair value pricing methodology to price foreign securities may result in a value that is different from a foreign security’s most recent closing price and from the prices used by other investment companies to calculate their NAVs and are generally considered Level 2 prices in the fair valuation hierarchy. Because the Fund may invest in foreign securities, the value of the Fund’s portfolio securities may change on days when you will not be able to purchase or redeem your shares.
The Board has delegated day-to-day valuation matters to a Valuation Committee comprised of one or more representatives from Hennessy Advisors, Inc., the Fund’s investment advisor. The function of the Valuation Committee is to value securities where current and reliable market quotations are not readily available. All actions taken by the Valuation Committee are reviewed by the Board.
The Fund has performed an analysis of all existing investments to determine the significance and character of all inputs to their fair value determination. Various inputs are used in determining the value of the Fund’s investments. The inputs or methodology used for valuing securities are not necessarily an indication of the risk associated with investing in those securities. Details related to the fair valuation hierarchy of the Fund’s securities as of October 31, 2015 are included in the Fund’s Schedule of Investments.
4). INVESTMENT TRANSACTIONS
Purchases and sales of investment securities (excluding government and short-term investments) for the Fund during the fiscal year ended October 31, 2015 were $125,014,670 and $134,049,392, respectively.
There were no purchases or sales/maturities of long-term U.S. Government Securities for the Fund during the fiscal year ended October 31, 2015.
5). INVESTMENT MANAGEMENT FEE AND OTHER TRANSACTIONS WITH AFFILIATES
Hennessy Advisors, Inc. (the “Advisor”) is the investment advisor of the Fund. The Advisor provides the Fund with investment management services under an Investment Advisory Agreement. The Advisor furnishes all investment advice, office space, facilities, and provides most of the personnel needed by the Fund. As compensation for its services, the Advisor is entitled to a monthly fee from the Fund. The fee is based upon the average daily net assets of the Fund at the annual rate of 0.85%. The net investment advisory fees payable by the Fund as of October 31, 2015 were $101,711.
The Advisor has delegated the day-to-day management of the Fund to a sub-advisor, RBC Global Asset Management (U.S.) Inc. The Advisor pays the sub-advisor fees for the Fund from its own assets and these fees are not an additional expense of the Fund.
In the past, the Advisor has agreed to waive its fees and absorb expenses to the extent that the total annual operating expenses (excluding all federal, state and local taxes, interest, brokerage commissions, acquired fund fees and expenses and other costs incurred in connection with the purchase and sale of securities and extraordinary items) exceeded 0.98% of the Fund’s net assets for the Institutional Class shares of the Fund. The expense limitation agreement for the Institutional Class shares could only be terminated by the Board and was terminated by the Board as of February 28, 2015.
For a period of three years after the year in which the Advisor waived or reimbursed expenses, the Advisor may seek reimbursement from the Fund to the extent that total annual fund operating expenses are less than the expense limitation that was in effect at the time the Advisor waived or reimbursed expenses. The Advisor waived or reimbursed expenses of $144 for the Fund during the fiscal year ended October 31, 2015. As of October 31, 2015, cumulative expenses subject to potential recovery under the aforementioned conditions were $153 for Institutional Class shares, of which $9 will expire on October 31, 2017, and $144 will expire on October 31, 2018.
The Board has approved a Shareholder Servicing Agreement for the Investor Class shares of the Fund, which was instituted to compensate the Advisor for the non-investment management services it provides to the Fund. The Shareholder Servicing Agreement provides for a monthly fee paid to the Advisor at an annual rate of 0.10% of the average daily net assets of the Fund attributable to Investor Class shares. Shareholder service fees payable by the Fund as of October 31, 2015 were $11,871.
The Fund has entered into agreements with various brokers, dealers, and financial intermediaries in connection with the sale of shares of the Fund. The agreements provide for periodic payments by the Fund to the brokers, dealers, and financial
| HENNESSY FUNDS | 1-800-966-4354 | |
intermediaries for providing certain shareholder maintenance services (sub-transfer agent expenses). These shareholder services include the pre-processing and quality control of new accounts, shareholder correspondence, answering customer inquiries regarding account status, and facilitating shareholder telephone transactions. Fees paid by the Fund to various brokers, dealers, and financial intermediaries during the fiscal year ended October 31, 2015 were $116,770.
U.S. Bancorp Fund Services, LLC (“USBFS”) provides the Fund with administrative, fund accounting, and transfer agent services, including all regulatory reporting, and necessary office equipment and personnel. As administrator, USBFS is responsible for activities such as (i) preparing various federal and state regulatory filings, reports, and returns for the Fund, (ii) preparing reports and materials to be supplied to the Board, (iii) monitoring the activities of the Fund’s custodian, transfer agent, and accountants, and (iv) coordinating the preparation and payment of the Fund’s expenses and reviewing the Fund’s expense accruals. Fees paid to USBFS during the fiscal year ended October 31, 2015 were $147,112.
U.S. Bank, N.A., an affiliate of USBFS, serves as the Fund’s custodian. Quasar Distributors, LLC acts as the Fund’s principal underwriter in a continuous public offering of the Fund’s shares. Quasar Distributors, LLC is an affiliate of USBFS and U.S. Bank, N.A.
6). LINE OF CREDIT
The Fund has an uncommitted line of credit with the other funds in the Hennessy Funds family of funds (the “Hennessy Funds”) in the amount of the lesser of (i) $100,000,000 or (ii) 33.33% of each Hennessy Fund’s net assets, or 30% for the Hennessy Gas Utility Fund and 10% for the Hennessy Balanced Fund, intended to provide short-term financing, if necessary, subject to certain restrictions, in connection with shareholder redemptions. The credit facility is with the Hennessy Funds’ custodian bank, U.S. Bank, N.A. Borrowings under this arrangement bear interest at the bank’s prime rate and are secured by all of the Fund’s assets (as to its own borrowings only). During the fiscal year ended October 31, 2015, the Fund did not have any borrowings outstanding under the line of credit.
7). FEDERAL TAX INFORMATION
As of October 31, 2015, the components of accumulated earnings (losses) for income tax purposes were as follows:
| | Cost of investments for tax purposes | | $ | 123,086,450 | |
| | Gross tax unrealized appreciation | | $ | 26,647,958 | |
| | Gross tax unrealized depreciation | | | (5,634,408 | ) |
| | Net tax unrealized appreciation | | $ | 21,013,550 | |
| | Undistributed ordinary income | | $ | 1,846,994 | |
| | Undistributed long-term capital gains | | | 10,403,179 | |
| | Total distributable earnings | | $ | 12,250,173 | |
| | Other accumulated loss | | $ | — | |
| | Total accumulated gain | | $ | 33,263,723 | |
The difference between book-basis and tax-basis unrealized appreciation is attributable primarily to wash sales.
At October 31, 2015, the Fund had no tax basis capital losses to offset future capital gains.
At October 31, 2015, the Fund did not defer, on a tax basis, any post-December late year ordinary loss deferrals.
The tax character of distributions paid during fiscal year 2015 and fiscal year 2014 for the Fund were as follows:
| | | Year Ended | | | Year Ended | |
| | | October 31, 2015 | | | October 31, 2014 | |
| Ordinary income | | $ | 1,228,256 | | | $ | 1,144,515 | |
Long-term capital gain | | | 6,159,685 | | | | — | |
| | | $ | 7,387,941 | | | $ | 1,144,515 | |
8). EVENTS SUBSEQUENT TO YEAR END
Management has evaluated the Fund’s related events and transactions that occurred subsequent to October 31, 2015, through the date of issuance of the Fund’s financial statements. Other than as disclosed below, management has determined that there were no subsequent events requiring recognition or disclosure in the financial statements.
On December 9, 2015, capital gains were declared and paid to shareholders of record as of December 8, 2015 as follows:
| | | Long-term | Short-term |
| | Investor Class | $2.45891 | $0.19537 |
| | Institutional Class | $2.46247 | $0.19565 |
Effective November 1, 2015, the Fund adopted a plan pursuant to Rule 12b-1 under the Investment Company Act of 1940, as amended, that authorizes payments in connection with the distribution of the Fund’s shares at an annual rate of up to 0.25% of the Fund’s average daily net assets attributable to Investor Class shares. Even though the authorized rate is up to 0.25%, the Fund has only used 0.15% of its average daily net assets attributable to Investor Class shares for such purpose since the plan was implemented on November 1, 2015. Amounts paid under the plan may be spent on any activities or expenses primarily intended to result in the sale of shares, including but not limited to, advertising, compensation for sales and marketing activities or to financial institutions and others, such as dealers and distributors, shareholder account servicing, the printing and mailing of prospectuses to other than current shareholders, and the printing and mailing of sales literature.
| HENNESSY FUNDS | 1-800-966-4354 | |
Report of Independent Registered Public Accounting Firm
To the Board of Trustees of Hennessy Funds Trust
and the Shareholders of the Hennessy Large Value Fund:
We have audited the accompanying statement of assets and liabilities of Hennessy Large Value Fund (the Fund), a series of Hennessy Funds Trust, including the schedule of investments, as of October 31, 2015, and the related statement of operations for the year then ended, the statements of changes in net assets for each of the years in the two-year period then ended, and the financial highlights for each of the years in the five-year period then ended. These financial statements and financial highlights are the responsibility of the Fund’s management. Our responsibility is to express an opinion on these financial statements and financial highlights based on our audits.
We conducted our audits in accordance with the standards of the Public Company Accounting Oversight Board (United States). Those standards require that we plan and perform the audit to obtain reasonable assurance about whether the financial statements and financial highlights are free of material misstatement. An audit includes examining, on a test basis, evidence supporting the amounts and disclosures in the financial statements. Our procedures included confirmation of investments owned as of October 31, 2015, by correspondence with the custodian and brokers or by other appropriate auditing procedures. An audit also includes assessing the accounting principles used and significant estimates made by management, as well as evaluating the overall financial statement presentation. We believe that our audits provide a reasonable basis for our opinion.
In our opinion, the financial statements and financial highlights referred to above present fairly, in all material respects, the financial position of the Fund as of October 31, 2015, and the results of its operations for the year then ended, the changes in its net assets for each of the years in the two-year period then ended, and the financial highlights for each of the years in the five-year period then ended, in conformity with U.S. generally accepted accounting principles.
Milwaukee, Wisconsin
December 23, 2015
Trustees and Officers of the Fund (Unaudited)
The business and affairs of the Fund are managed under the direction of the Board of Trustees of the Trust, and the Board of Trustees elects the Officers of the Trust. Information pertaining to the Trustees and the Officers of the Trust is set forth below. Such persons serve until their successors are duly elected and qualified or until their earlier death, resignation, or removal. Each of the Trustees oversees 16 Hennessy Funds. Unless otherwise indicated, the address of all persons listed below is 7250 Redwood Boulevard, Suite 200, Novato, CA 94945. The Fund’s Statement of Additional Information includes more information about the persons listed below and is available, without charge, upon request by calling 1-800-966-4354.
| | | | Other |
| | | | Directorships |
| Name, Year of Birth, | | | (During Past |
| and Position Held | Length of | Principal Occupation(s) | Five Years) |
with the Trust | Time Served | During Past Five Years | Held by Trustee(1) |
| | | | |
| Disinterested Trustees | | | |
| | | | |
| J. Dennis DeSousa (1936) | Since January | Mr. DeSousa is a real estate investor. | Hennessy SPARX |
| Trustee | 1996 for the | | Funds Trust; |
| | Hennessy Funds | | Hennessy Mutual |
| | | | Funds, Inc.; and |
| | | | The Hennessy |
| | | | Funds, Inc. |
| | | | |
| Robert T. Doyle (1947) | Since January | Mr. Doyle has been the Sheriff of | Hennessy SPARX |
| Trustee | 1996 for the | Marin County, California since 1996. | Funds Trust; |
| | Hennessy Funds | | Hennessy Mutual |
| | | | Funds, Inc.; and |
| | | | The Hennessy |
| | | | Funds, Inc. |
| | | | |
| Gerald P. Richardson (1945) | Since May | Mr. Richardson is an independent | Hennessy SPARX |
| Trustee | 2004 for the | consultant in the securities industry. | Funds Trust; |
| | Hennessy Funds | | Hennessy Mutual |
| | | | Funds, Inc.; and |
| | | | The Hennessy |
| | | | Funds, Inc. |
Interested Trustee(2) | | | |
| | | | |
| Neil J. Hennessy (1956) | Since January | Mr. Hennessy has been employed by | Hennessy Advisors, |
| Trustee, Chairman of | 1996 as a Trustee | Hennessy Advisors, Inc., the Funds’ | Inc.; Hennessy |
| the Board, Chief | for the Hennessy | investment advisor, since 1989. | SPARX Funds Trust; |
| Investment Officer, | Funds and since | He currently serves as President, | Hennessy Mutual |
| Portfolio Manager, | June 2008 as | Chairman and Chief Executive Officer | Funds, Inc.; and |
| and President | an Officer of the | of Hennessy Advisors, Inc. | The Hennessy |
| | Hennessy Funds | | Funds, Inc. |
| HENNESSY FUNDS | 1-800-966-4354 | |
| Name, Year of Birth, | | |
| and Position Held | Length of | Principal Occupation(s) |
with the Trust | Time Served | During Past Five Years |
| | | |
| Officers | | |
| | | |
| Teresa M. Nilsen (1966) | Since January | Ms. Nilsen has been employed by Hennessy Advisors, Inc., |
| Executive Vice President | 1996 for the | the Funds’ investment advisor, since 1989. She currently |
| and Treasurer | Hennessy Funds | serves as Executive Vice President, Chief Operations Officer, |
| | | Chief Financial Officer, and Secretary of Hennessy Advisors, Inc. |
| | | |
| Daniel B. Steadman (1956) | Since March | Mr. Steadman has been employed by Hennessy Advisors, Inc., |
| Executive Vice President | 2000 for the | the Funds’ investment advisor, since 2000. He currently serves |
| and Secretary | Hennessy Funds | as Executive Vice President and Chief Compliance Officer of |
| | | Hennessy Advisors, Inc. |
| | | |
| Jennifer Cheskiewicz (1977) | Since June | Ms. Cheskiewicz has been employed by Hennessy Advisors, |
| Senior Vice President and | 2013 for the | Inc., the Funds’ investment advisor, since June 2013. She |
| Chief Compliance Officer | Hennessy Funds | currently serves as General Counsel of Hennessy Advisors, Inc. |
| | | |
| | | She previously served as in-house counsel to Carlson Capital, |
| | | L.P., an SEC-registered investment advisor to several private |
| | | funds from February 2010 to May 2013. |
| | | |
| Brian Carlson (1972) | Since December | Mr. Carlson has been employed by Hennessy Advisors, Inc., the |
| Senior Vice President and | 2013 for the | Funds’ investment advisor, since December 2013. |
| Head of Distribution | Hennessy Funds | |
| | | Mr. Carlson was previously a co-founder and principal of |
| | | Trivium Consultants, LLC from February 2011 through |
| | | November 2013. |
| | | |
David Ellison (1958)(3) | Since October | Mr. Ellison has served as a Portfolio Manager of the Hennessy |
| Senior Vice President and | 2012 for the | Small Cap Financial Fund, the Hennessy Large Cap Financial |
| Portfolio Manager | Hennessy Funds | Fund, and the Hennessy Technology Fund since inception. |
| | | |
| | | Mr. Ellison previously served as Director, CIO and President of |
| | | FBR Fund Advisers, Inc. from December 1999 to October 2012. |
| | | |
| Brian Peery (1969) | Since March | Mr. Peery has served as a Portfolio Manager of the Hennessy |
| Senior Vice President and | 2003 as an | Cornerstone Growth Fund, the Hennessy Cornerstone Mid Cap |
| Portfolio Manager | Officer of the | 30 Fund, the Hennessy Cornerstone Large Growth Fund, the |
| | Hennessy Funds | Hennessy Cornerstone Value Fund, the Hennessy Total Return |
| | and since | Fund, and the Hennessy Balanced Fund since October 2014. |
| | February 2011 | From February 2011 through September 2014, he served as |
| | as a Co-Portfolio | Co-Portfolio Manager of the same funds. Mr. Peery has also |
| | Manager or | served as a Portfolio Manager of the Hennessy Gas Utility Fund |
| | Portfolio Manager | since February 2015. |
| | for the | |
| | Hennessy Funds | Mr. Peery has been employed by Hennessy Advisors, Inc., the |
| | | Funds’ investment advisor, since 2002. |
| | | |
| Winsor (Skip) Aylesworth | Since October | Mr. Aylesworth has served as a Portfolio Manager of the |
(1947)(3) | 2012 for the | Hennessy Gas Utility Fund since 1998 and as a Portfolio |
| Vice President and | Hennessy Funds | Manager of the Hennessy Technology Fund since inception. |
| Portfolio Manager | | |
| | | Mr. Aylesworth previously served as Executive Vice President |
| | | of The FBR Funds from 1999 to October 2012. |
| Name, Year of Birth, | | |
| and Position Held | Length of | Principal Occupation(s) |
with the Trust | Time Served | During Past Five Years |
| | | |
Ryan Kelley (1972)(4) | Since March | Mr. Kelley has served as a Portfolio Manager of the Hennessy |
| Vice President and | 2013 for the | Gas Utility Fund, the Hennessy Small Cap Financial Fund, and |
| Portfolio Manager | Hennessy Funds | the Hennessy Large Cap Financial Fund since October 2014. |
| | | From March 2013 through September 2014, he served as a |
| | | Co-Portfolio Manager of the same funds. Prior to that, |
| | | he was a Portfolio Analyst of the Hennessy Funds. |
(1) | Pursuant to an internal reorganization, the series of Hennessy Mutual Funds, Inc. (“HMFI”), The Hennessy Funds, Inc. (“HFI”), and Hennessy SPARX Funds Trust (“HSFT”) were reorganized into series of Hennessy Funds Trust on February 28, 2014, which mirrored the corresponding series of HFMI, HFI, and HSFT. Subsequent to the reorganization, HFMI, HFI, and HSFT were dissolved. |
(2) | Mr. Hennessy is considered an “interested person,” as defined in the Investment Company Act of 1940, as amended, because he is an officer of the Hennessy Funds. |
(3) | The address of these officers is 101 Federal Street, Suite 1900, Boston, MA 02110. |
(4) | The address of this officer is 1340 Environ Way, Chapel Hill, NC 27517. |
| HENNESSY FUNDS | 1-800-966-4354 | |
Expense Example (Unaudited)
October 31, 2015
As a shareholder of the Fund, you incur two types of costs: (1) transaction costs, including sales charges (loads) on purchase payments, reinvested dividends, or other distributions; redemption fees; and exchange fees; and (2) ongoing costs, including management fees; service fees; and other Fund expenses. This Example is intended to help you understand your ongoing costs (in dollars) of investing in the Fund and to compare these costs with the ongoing costs of investing in other mutual funds. The Example is based on an investment of $1,000 invested at the beginning of the period and held for the entire period from May 1, 2015 through October 31, 2015.
Actual Expenses
The first line of the table below under the “Investor Class” and “Institutional Class” headings provides information about actual account values and actual expenses. Although the Fund charges no sales loads or transaction fees, you will be assessed fees for outgoing wire transfers, returned checks and stop payment orders at prevailing rates charged by U.S. Bancorp Fund Services, LLC, the Fund’s transfer agent. If you request that a redemption be made by wire transfer, currently a $15.00 fee is charged by the Fund’s transfer agent. IRA accounts will be charged a $15.00 annual maintenance fee. The example below includes, but is not limited to, management fees, shareholder servicing fees, fund accounting, custody, and transfer agent fees. However, the example below does not include portfolio trading commissions and related expenses, and other extraordinary expenses as determined under generally accepted accounting principles. You may use the information in this line, together with the amount you invested, to estimate the expenses that you paid over the period. Simply divide your account value by $1,000 (for example, an $8,600 account value divided by $1,000 = 8.6), then multiply the result by the number in the first line of the table under the “Investor Class” and “Institutional Class” headings in the column entitled “Expenses Paid During Period” to estimate the expenses you paid on your account during this period.
Hypothetical Example for Comparison Purposes
The second line of the table below under the “Investor Class” and “Institutional Class” headings provides information about hypothetical account values and hypothetical expenses based on the Fund’s actual expense ratios and an assumed rate of return of 5% per year before expenses, which is not the Fund’s actual return. The hypothetical account values and expenses may not be used to estimate the actual ending account balance or expenses you paid for the period. You may use this information to compare the ongoing costs of investing in the Fund and other funds. To do so, compare this 5% hypothetical example with the 5% hypothetical examples that appear in the shareholder reports of the other funds. Please note that the expenses shown in the table are meant to highlight your ongoing costs only and do not reflect any transactional costs, such as sales charges (loads), or exchange fees. Therefore, the second line of the table under the “Investor Class” and “Institutional Class” headings is useful in comparing ongoing costs only, and will not help you determine the relative total costs of owning different funds. In addition, if these transactional costs were included, your costs would have been higher.
| | | | Expenses Paid |
| | Beginning | Ending | During Period(1) |
| | Account Value | Account Value | May 1, 2015 – |
| | May 1, 2015 | October 31, 2015 | October 31, 2015 |
| Investor Class | | | |
| Actual | $1,000.00 | $ 976.50 | $6.03 |
| Hypothetical (5% return before expenses) | $1,000.00 | $1,019.11 | $6.16 |
| | | | |
| Institutional Class | | | |
| Actual | $1,000.00 | $ 976.90 | $6.23 |
| Hypothetical (5% return before expenses) | $1,000.00 | $1,018.90 | $6.36 |
(1) | Expenses are equal to the Fund’s annualized expense ratio of 1.21% for Investor Class shares or 1.25% for Institutional Class shares, as applicable, multiplied by the average account value over the period, multiplied by 184/365 days (to reflect one-half year period). |
| HENNESSY FUNDS | 1-800-966-4354 | |
How to Obtain a Copy of the Fund’s
Proxy Voting Policy and Proxy Voting Records
A description of the policies and procedures the Fund uses to determine how to vote proxies relating to portfolio securities is available without charge: (1) by calling 1-800-966-4354; (2) on the Hennessy Funds’ website at hennessyfunds.com/proxy-voting/policy.fs; or (3) on the U.S. Securities and Exchange Commission’s website at www.sec.gov. The Fund’s proxy voting record is available without charge on both the Hennessy Funds’ website at hennessyfunds.com/proxy-voting/policy.fs and the SEC’s website at www.sec.gov no later than August 31 for the prior 12 months ending June 30.
Quarterly Filings on Form N-Q
The Fund files its complete schedule of portfolio holdings with the SEC for the first and third quarters of each fiscal year on Form N-Q. The Fund’s Form N-Q will be available on the SEC’s website at www.sec.gov. The Fund’s Form N-Q may be reviewed and copied at the SEC’s Public Reference Room in Washington, DC and information on the operation of the Public Reference Room may be obtained by calling 1-800-SEC-0330. Information included in the Fund’s N-Q will also be available upon request by calling 1-800-966-4354.
Federal Tax Distribution Information
(Unaudited)
For the fiscal year ended October 31, 2015, certain dividends paid by the Fund may be subject to a maximum tax rate of 23.8%, as provided for by the Jobs and Growth Tax Relief Reconciliation Act of 2003. The percentage of dividends declared from ordinary income designated as qualified dividend income was 100.00%.
For corporate shareholders, the percent of ordinary income distributions that qualified for the corporate dividends received deduction for the fiscal year ended October 31, 2015 was 100.00%.
The percentage of taxable ordinary income distributions that are designated as short-term capital gain distributions under Section 871(k)(2)(C) of the Internal Revenue Code of 1986, as amended, for the Fund was 0.00%.
Householding
To help keep the Fund’s costs as low as possible, we generally deliver a single copy of most financial reports and prospectuses to shareholders who share an address, even if the accounts are registered under different names. This process, known as “householding,” does not apply to account statements. You may, of course, request an individual copy of a prospectus or financial report at any time. If you would like to receive separate mailings, please call the Administrator at 1-800-261-6950 or 1-414-765-4124 and we will begin individual delivery within 30 days of your request. If your account is held through a financial institution or other intermediary, please contact them directly to request individual delivery.
Matters Submitted to a Shareholder Vote
A special meeting of shareholders of the Investor Class shares of the Fund was held on September 15, 2015, and the following matters were approved by the Fund’s voting Investor Class shares:
| | For | Against | Abstain |
| To approve a distribution | | | |
| (Rule 12b-1) plan for the | | | |
| Investor Class shares of the Fund | 1,787,502.562 | 353,770.518 | 97,505.575 |
Privacy Policy
We collect the following non-public personal information about you:
| | • | information we receive from you on or in applications or other forms, correspondence, or conversations, including, but not limited to, your name, address, phone number, social security number, assets, income, and date of birth; and |
| | • | information about your transactions with us, our affiliates, or others, including, but not limited to, your account number and balance, payment history, parties to transactions, cost basis information, and other financial information. |
We do not disclose any non-public personal information about our current or former shareholders to nonaffiliated third parties, except as permitted by law. For example, we are permitted by law to disclose all of the information we collect, as described above, to our Transfer Agent to process your transactions. Furthermore, we restrict access to your non-public personal information to those persons who require such information to provide products or services to you. We maintain physical, electronic, and procedural safeguards that comply with federal standards to guard your non-public personal information.
In the event that you hold shares of the Fund through a financial intermediary, including, but not limited to, a broker-dealer, bank or trust company, the privacy policy of your financial intermediary would govern how your non-public personal information would be shared with nonaffiliated third parties.
| HENNESSY FUNDS | 1-800-966-4354 | |
(This Page Intentionally Left Blank.)
(This Page Intentionally Left Blank.)
For information, questions or assistance, please call
The Hennessy Funds
1-800-966-4354 or 1-415-899-1555
INVESTMENT ADVISOR
Hennessy Advisors, Inc.
7250 Redwood Blvd., Suite 200
Novato, California 94945
ADMINISTRATOR,
TRANSFER AGENT,
DIVIDEND PAYING AGENT &
SHAREHOLDER SERVICING AGENT
U.S. Bancorp Fund Services, LLC
P.O. Box 701
Milwaukee, Wisconsin 53201-0701
CUSTODIAN
U.S. Bank N.A.
Custody Operations
1555 North River Center Dr., Suite 302
Milwaukee, Wisconsin 53212
TRUSTEES
Neil J. Hennessy
Robert T. Doyle
J. Dennis DeSousa
Gerald P. Richardson
COUNSEL
Foley & Lardner LLP
777 East Wisconsin Avenue
Milwaukee, Wisconsin 53202-5306
INDEPENDENT REGISTERED
PUBLIC ACCOUNTING FIRM
KPMG LLP
777 East Wisconsin Avenue
Milwaukee, Wisconsin 53202-5306
DISTRIBUTOR
Quasar Distributors, LLC
615 East Michigan Street
Milwaukee, Wisconsin 53202
| hennessyfunds.com | 1-800-966-4354 |
This report has been prepared for shareholders and may be distributed to
others only if preceded or accompanied by a current prospectus.
ANNUAL REPORT
OCTOBER 31, 2015
HENNESSY TOTAL RETURN FUND
Investor Class HDOGX
| hennessyfunds.com | 1-800-966-4354 |
(This Page Intentionally Left Blank.)
Contents
| Letter to Shareholders | 2 |
| Performance Overview | 4 |
| Financial Statements | |
| Schedule of Investments | 7 |
| Statement of Assets and Liabilities | 11 |
| Statement of Operations | 12 |
| Statements of Changes in Net Assets | 13 |
| Statement of Cash Flows | 14 |
| Financial Highlights | 16 |
| Notes to the Financial Statements | 18 |
| Report of Independent Registered Public Accounting Firm | 25 |
| Trustees and Officers of the Fund | 26 |
| Expense Example | 30 |
| Proxy Voting | 32 |
| Quarterly Filings on Form N-Q | 32 |
| Federal Tax Distribution Information | 32 |
| Householding | 32 |
| Privacy Policy | 33 |
| HENNESSY FUNDS | 1-800-966-4354 | |
December 2015
Dear Hennessy Funds Shareholder:
As I look back over the year, I am reminded that the U.S. economy has come a long way since the depths of the recession in 2009. The economy has been expanding steadily for almost six years, the unemployment rate has halved, the housing market has been recovering and capital expenditures have been growing. The financial markets have performed well too, driven largely by strong corporate earnings growth, especially in the early years. The U.S. market, as measured by the S&P 500 Index, has roughly tripled since the bull market began in 2009, and the Index’s earnings per share have increased 260% over this same time period. For the year ended October 31, 2015, the U.S. equity market performed reasonably well, with the S&P 500 posting another advance of 5.2%. However, behind this headline number, the market experienced a great deal of volatility as investors reacted to falling energy prices, a rise in the U.S. Dollar, pressure on export earnings growth, slower growth in China and, most significantly, the likelihood of a rise in the Fed Funds rate for the first time in nearly a decade – the featured topic of conversation around every office water cooler in the financial world this year.
Investors, reporters and friends often ask me “What’s next?” The market has been in a volatile, sideways correction for over a year now, and throughout this period of volatility, I have consistently advised investors to continue to focus on the long-term fundamentals of the market.
In my view, the fundamentals of the market are in good shape. Despite a stronger U.S. Dollar and its impact on export growth, the economy is still growing steadily. Inflation remains low, so we expect the Federal Reserve, once it does begin to raise short-term interest rates, will not likely raise them by very much. New jobs are being created at what I believe is a healthy rate, and average hourly wages are rising in response to a tighter labor market. Higher wages and lower gasoline prices are helping to keep consumer confidence positive.
Notwithstanding what I view as a relatively solid economic environment, however, I think investor sentiment remains restrained. The same factors that contributed to the market volatility this past year are still troubling investors today: the slowdown in the Chinese economy, slower earnings growth here in the U.S., and, of course, the prospect of rising interest rates. As a result of these investor worries, I do not see any solid enthusiasm for the market – no euphoria. Universal optimism about the market often coincides with a peak in stock prices and this absence of euphoria is yet another reason I feel bullish. And finally, I do not believe stocks are expensive. The Dow Jones Industrial Average and the S&P 500 Index have forward PE (price-to-earnings) ratios of approximately 16x and 17x, respectively, close to long-term averages. In my view, these fundamentals taken together signal a continuation of the bull market that began six years ago.
A final positive note: I still do not believe that investors have fully returned to investing in U.S. equities. Assets in domestic equity funds have now reached parity with fixed income/money market funds, with $6.2 trillion in each. I believe that fixed income investments will continue to trickle into equities, which should have a positive effect on the market.
Thank you for your continued confidence and investment in our products. If you have any questions or would like to speak with us directly, please don’t hesitate to call us at (800) 966-4354.
Best regards,
Neil J. Hennessy
President and Chief Investment Officer
Past performance does not guarantee future results.
Mutual fund investing involves risk. Principal loss is possible.
Opinions expressed are those of Neil Hennessy and are subject to change, are not guaranteed and should not be considered investment advice.
The Dow Jones Industrial Average and the S&P 500 Index are unmanaged indices commonly used to measure the performance of U.S. stocks. One cannot invest directly in an index.
Price to earnings (“PE”) is the market price per share divided by earnings per share. Earnings per share is the portion of a company’s profit allocated to each outstanding share of common stock. It serves as an indicator of a company’s profitability.
| HENNESSY FUNDS | 1-800-966-4354 | |
Performance Overview (Unaudited)
CHANGE IN VALUE OF $10,000 INVESTMENT
This graph illustrates the performance of an initial investment of $10,000 made in the Fund ten years ago and assumes the reinvestment of dividends.
AVERAGE ANNUAL TOTAL RETURN FOR PERIODS ENDED OCTOBER 31, 2015
| | One | Five | Ten |
| | Year | Years | Years |
| Hennessy Total | | | |
| Return Fund (HDOGX) | 1.22% | 9.08% | 5.66% |
| 75/25 Blended DJIA/Treasury Index* | 3.20% | 9.40% | 6.62% |
| Dow Jones Industrial Average | 4.06% | 12.51% | 8.18% |
Expense ratio: 1.26%
Performance data quoted represents past performance; past performance does not guarantee future results. The investment return and principal value of an investment will fluctuate so that an investor’s shares, when redeemed, may be worth more or less than their original cost. The performance graph and table do not reflect the deduction of taxes that a shareholder would pay on Fund distributions or the redemption of Fund shares. Current performance of the Fund may be lower or higher than the performance quoted. Performance data current to the most recent month end may be obtained by visiting hennessyfunds.com.
The expense ratio presented is from the most recent prospectus.
| * | The 75/25 Blended DJIA/Treasury Index consists of 75% common stocks represented by the Dow Jones Industrial Average and 25% short-duration Treasury securities represented by the BofA Merrill Lynch 90-day U.S. Treasury Bill Index. |
PERFORMANCE NARRATIVE
Portfolio Managers Neil Hennessy and Brian Peery
Performance:
For the twelve-month period ended October 31, 2015, the Hennessy Total Return Fund returned 1.22%, underperforming the 75/25 Blended DJIA/Treasury Index* and the Dow Jones Industrial Average, which returned 3.20% and 4.06% for the same period, respectively.
The Fund maintains a roughly 25% weighting in U.S. Treasuries, which caused it to underperform its equity benchmark, the Dow Jones Industrial Average, for the twelve-
month period ended October 31, 2015. The Fund also underperformed its 75/25 Blended DJIA/Treasury Index* benchmark as a result of sector allocation, in particular the Fund’s underweight position in the Consumer Discretionary sector and, to a lesser extent, the Fund’s slight overweight position in Energy. The Fund did not own The Walt Disney Company, Home Depot, Inc. or Nike, Inc. in the Consumer Discretionary sector, each of which posted returns of more than 25% for the period. Strong performance from several other portfolio holdings, including General Electric Co, Cisco Systems, Inc. and Pfizer, Inc. (U.S.), were unfortunately insufficient to offset the relative losses from other sectors. The Fund continues to hold General Electric, Cisco and Pfizer.
Portfolio Strategy:
The Fund invests approximately 75% of its assets in the “Dogs of the Dow,” the 10-highest yielding Dow stocks, and 25% of its assets in U.S. Treasuries. As a result of this “blended” strategy, the Fund may be expected to underperform equities in periods when markets rise and outperform in periods when markets fall. The Fund is designed to allow investors to gain exposure to the equity market while maintaining a percentage of their investment in fixed income securities. We believe the Fund is well positioned for the more conservative investor, as the equity portion of the portfolio is invested in what we would deem to be high quality companies, each with a relatively high dividend yield historically. The relatively short duration of the 25% weighting of U.S. Treasuries in the portfolio (all less than one year) may allow us the ability to roll into higher yielding treasuries in the event yields continue to rise.
Market Outlook:
Over the twelve-month period ended October 31, 2015, U.S. equities, as measured by the S&P 500 Index, advanced by just over 5%. Notwithstanding this modest rise, the year was marked by a great deal of volatility, especially during the second half of the period when uncertainty regarding the timing and magnitude of a rise in short-term interest rates being contemplated by the Federal Reserve dominated investor thinking. Earnings growth, too, caused anxiety for investors. Lower energy prices impacted many companies in the Energy sector, and the higher U.S. Dollar and slower growth abroad affected exporters. Many companies saw their sales and earnings growth slow.
In the end, however, confidence in continued economic growth was strong enough to offset investor concerns, with the market staging a dramatic rally in October, the final month of the Fund’s fiscal year. We believe the basic fundamentals of the market are attractive, and we continue to be optimistic about the possibility of further market advances over the course of the next year. The economy is growing slowly but steadily. Inflation is low, so we expect that the Fed, once they do start to raise rates, will not raise them by very much. The labor market has continued to recover over the last 12 months, and consumer confidence appears buoyant. Most importantly, we do not believe stocks are expensive. The Dow Jones Industrial Average and the S&P 500 have forward PE ratios of approximately 16x and 17x, respectively, close to long-term averages. Corporate balance sheets appear to be in excellent shape, and while executives have shown some reluctance to increase capital spending beyond maintenance levels this cycle, we believe companies will eventually start investing for expansion. This spending could, in turn, help drive share prices higher through an acceleration in sales and earnings growth.
| * | The 75/25 Blended DJIA/Treasury Index consists of 75% common stocks represented by the Dow Jones Industrial Average and 25% short-duration Treasury securities represented by the BofA Merrill Lynch 90-day U.S. Treasury Bill Index. |
| HENNESSY FUNDS | 1-800-966-4354 | |
Opinions expressed are those of the Portfolio Managers as of the date written and are subject to change, are not guaranteed, and should not be considered investment advice or an indication of trading intent.
The S&P 500 Index and Dow Jones Industrial Average are unmanaged indices commonly used to measure the performance of U.S. stocks. The BofA Merrill Lynch 90-day U.S. Treasury Bill Index is an unmanaged index of Treasury securities maturing in 90 days. One cannot invest directly in an index.
The Fund is non-diversified, meaning it may concentrate its assets in fewer individual holdings than a diversified fund, making it more exposed to individual stock volatility than a diversified fund. The Fund’s formula-based strategy may cause the Fund to buy or sell securities at times when it may not be advantageous.
References to specific securities should not be considered a recommendation to buy or sell any security. Fund holdings and sector allocations are subject to change. Please refer to the Schedule of Investments included in this report for additional portfolio information.
Earnings growth is not a measure of the Fund’s future performance. Dividend yield is calculated as the annual dividends paid by a company divided by its market price per share. PE, or price to earnings, is calculated by dividing a company’s market price per share by its earnings per share.
Financial Statements
Schedule of Investments as of October 31, 2015 |
HENNESSY TOTAL RETURN FUND
(% of Net Assets)
| TOP TEN HOLDINGS | % NET ASSETS |
| U.S. Treasury Bill, 0.015%, 01/21/2016 | 28.80% |
| U.S. Treasury Bill, 0.055%, 12/17/2015 | 21.61% |
| U.S. Treasury Bill, 0.120%, 11/19/2015 | 14.41% |
| General Electric Co. | 7.19% |
| Pfizer, Inc. | 6.93% |
| Verizon Communications, Inc. | 6.92% |
| Chevron Corp. | 6.82% |
| Merck & Co., Inc. | 6.55% |
| Procter & Gamble Co. | 6.50% |
| Exxon Mobil Corp. | 5.60% |
Note: For presentation purposes, the Fund has grouped some of the industry categories. For purposes of categorizing securities for compliance with Section 8(b)(1) of the Investment Company Act of 1940, as amended, the Fund uses more specific industry classifications.
| HENNESSY FUNDS | 1-800-966-4354 | |
| COMMON STOCKS – 69.89% | | Number | | | | | | % of | |
| | | of Shares | | | Value | | | Net Assets | |
| Consumer Discretionary – 5.19% | | | | | | | | | |
| McDonald’s Corp. | | | 32,100 | | | $ | 3,603,225 | | | | 5.19 | % |
| | | | | | | | | | | | | |
| Consumer Staples – 11.81% | | | | | | | | | | | | |
| Procter & Gamble Co. | | | 59,100 | | | | 4,514,058 | | | | 6.50 | % |
| The Coca-Cola Co. | | | 52,000 | | | | 2,202,200 | | | | 3.17 | % |
| Wal-Mart Stores, Inc. | | | 25,900 | | | | 1,482,516 | | | | 2.14 | % |
| | | | | | | | 8,198,774 | | | | 11.81 | % |
| | | | | | | | | | | | | |
| Energy – 12.42% | | | | | | | | | | | | |
| Chevron Corp. | | | 52,100 | | | | 4,734,848 | | | | 6.82 | % |
| Exxon Mobil Corp. | | | 47,000 | | | | 3,888,780 | | | | 5.60 | % |
| | | | | | | | 8,623,628 | | | | 12.42 | % |
| | | | | | | | | | | | | |
| Health Care – 13.48% | | | | | | | | | | | | |
| Merck & Co., Inc. | | | 83,200 | | | | 4,547,712 | | | | 6.55 | % |
| Pfizer, Inc. | | | 142,100 | | | | 4,805,822 | | | | 6.93 | % |
| | | | | | | | 9,353,534 | | | | 13.48 | % |
| | | | | | | | | | | | | |
| Industrials – 12.49% | | | | | | | | | | | | |
| Caterpillar, Inc. | | | 50,400 | | | | 3,678,696 | | | | 5.30 | % |
| General Electric Co. | | | 172,700 | | | | 4,994,484 | | | | 7.19 | % |
| | | | | | | | 8,673,180 | | | | 12.49 | % |
| | | | | | | | | | | | | |
| Information Technology – 5.32% | | | | | | | | | | | | |
| Cisco Systems, Inc. | | | 22,000 | | | | 634,700 | | | | 0.91 | % |
| Intel Corp. | | | 7,100 | | | | 240,406 | | | | 0.35 | % |
| International Business Machines Corp. | | | 20,100 | | | | 2,815,608 | | | | 4.06 | % |
| | | | | | | | 3,690,714 | | | | 5.32 | % |
| | | | | | | | | | | | | |
| Materials – 0.31% | | | | | | | | | | | | |
| E.I. du Pont de Nemours & Co. | | | 3,400 | | | | 215,560 | | | | 0.31 | % |
| | | | | | | | | | | | | |
| Telecommunication Services – 8.87% | | | | | | | | | | | | |
| AT&T, Inc. | | | 40,500 | | | | 1,357,155 | | | | 1.95 | % |
| Verizon Communications, Inc. | | | 102,400 | | | | 4,800,512 | | | | 6.92 | % |
| | | | | | | | 6,157,667 | | | | 8.87 | % |
| | | | | | | | | | | | | |
| Total Common Stocks | | | | | | | | | | | | |
| (Cost $43,780,873) | | | | | | | 48,516,282 | | | | 69.89 | % |
The accompanying notes are an integral part of these financial statements.
| SHORT-TERM INVESTMENTS – 70.38% | | Number of Shares/ | | | | | | % of | |
| | | Par Amount | | | Value | | | Net Assets | |
| Money Market Funds – 5.56% | | | | | | | | | |
| Federated Government Obligations Fund – | | | | | | | | | |
| Class I, 0.01% (a) | | | 524,742 | | | $ | 524,742 | | | | 0.76 | % |
| Fidelity Government Portfolio – | | | | | | | | | | | | |
| Institutional Class, 0.01% (a) | | | 3,335,000 | | | | 3,335,000 | | | | 4.80 | % |
| | | | | | | | 3,859,742 | | | | 5.56 | % |
| U.S. Treasury Bills (c) – 64.82% | | | | | | | | | | | | |
| 0.120%, 11/19/2015 (b) | | | 10,000,000 | | | | 9,999,950 | | | | 14.41 | % |
| 0.055%, 12/17/2015 (b) | | | 15,000,000 | | | | 14,999,233 | | | | 21.61 | % |
| 0.015%, 01/21/2016 (b) | | | 20,000,000 | | | | 19,997,280 | | | | 28.80 | % |
| | | | | | | | 44,996,463 | | | | 64.82 | % |
| | | | | | | | | | | | | |
| Total Short-Term Investments | | | | | | | | | | | | |
| (Cost $48,859,263) | | | | | | | 48,856,205 | | | | 70.38 | % |
| | | | | | | | | | | | | |
| Total Investments | | | | | | | | | | | | |
| (Cost $92,640,136) – 140.27% | | | | | | | 97,372,487 | | | | 140.27 | % |
| Liabilities in Excess | | | | | | | | | | | | |
| of Other Assets – (40.27)% | | | | | | | (27,956,410 | ) | | | (40.27 | )% |
TOTAL NET ASSETS – 100.00% | | | | | | $ | 69,416,077 | | | | 100.00 | % |
Percentages are stated as a percent of net assets.
| (a) | The rate listed is the fund’s 7-day yield as of October 31, 2015. |
| (b) | The rate listed is discount rate at issue. |
| (c) | Collateral or partial collateral for securities sold subject to repurchase. |
The accompanying notes are an integral part of these financial statements.
| HENNESSY FUNDS | 1-800-966-4354 | |
Summary of Fair Value Exposure at October 31, 2015
The following is a summary of the inputs used to value the Fund’s net assets as of October 31, 2015 (see Note 3 in the accompanying notes to the financial statements):
| Common Stocks | | Level 1 | | | Level 2 | | | Level 3 | | | Total | |
| Consumer Discretionary | | $ | 3,603,225 | | | $ | — | | | $ | — | | | $ | 3,603,225 | |
| Consumer Staples | | | 8,198,774 | | | | — | | | | — | | | | 8,198,774 | |
| Energy | | | 8,623,628 | | | | — | | | | — | | | | 8,623,628 | |
| Health Care | | | 9,353,534 | | | | — | | | | — | | | | 9,353,534 | |
| Industrials | | | 8,673,180 | | | | — | | | | — | | | | 8,673,180 | |
| Information Technology | | | 3,690,714 | | | | — | | | | — | | | | 3,690,714 | |
| Materials | | | 215,560 | | | | — | | | | — | | | | 215,560 | |
| Telecommunication Services | | | 6,157,667 | | | | — | | | | — | | | | 6,157,667 | |
| Total Common Stocks | | $ | 48,516,282 | | | $ | — | | | $ | — | | | $ | 48,516,282 | |
| Short-Term Investments | | | | | | | | | | | | | | | | |
| Money Market Funds | | $ | 3,859,742 | | | $ | — | | | $ | — | | | $ | 3,859,742 | |
| U.S. Treasury Bills | | | — | | | | 44,996,463 | | | | — | | | | 44,996,463 | |
| Total Short-Term Investments | | $ | 3,859,742 | | | $ | 44,996,463 | | | $ | — | | | $ | 48,856,205 | |
| Total Investments | | $ | 52,376,024 | | | $ | 44,996,463 | | | $ | — | | | $ | 97,372,487 | |
Transfers between levels are recognized at the end of the reporting period. During the year ended October 31, 2015, the Fund recognized no transfers between levels.
Schedule of Reverse Repurchase Agreements
| | | | | | Principal | Maturity | | Maturity | |
| Face Value | | Counterparty | | Rate | | Trade Date | Date | | Amount | |
| $ | 5,397,000 | | Jefferies LLC | | | 0.35% | | 8/28/15 | 11/19/15 | | $ | 5,401,355 | |
| | 8,995,000 | | Jefferies LLC | | | 0.50% | | 9/18/15 | 12/17/15 | | | 9,006,244 | |
| | 13,492,500 | | Jefferies LLC | | | 0.40% | | 10/23/15 | 1/21/16 | | | 13,505,993 | |
| $ | 27,884,500 | | | | | | | | | | $ | 27,913,592 | |
As of October 31, 2015, the fair value of securities held as collateral for reverse repurchase agreements was $44,996,463 as noted on the Schedule of Investments.
The accompanying notes are an integral part of these financial statements.
Financial Statements
Statement of Assets and Liabilities as of October 31, 2015 |
| ASSETS: | | | |
| Investments in securities, at value (cost $92,640,136) | | $ | 97,372,487 | |
| Dividends and interest receivable | | | 160,033 | |
| Receivable for fund shares sold | | | 729 | |
| Prepaid expenses and other assets | | | 9,439 | |
| Total Assets | | | 97,542,688 | |
| | | | | |
| LIABILITIES: | | | | |
| Payable for fund shares redeemed | | | 47,698 | |
| Payable to advisor | | | 34,882 | |
| Payable to administrator | | | 11,423 | |
| Payable to auditor | | | 21,600 | |
| Accrued distribution fees | | | 64,306 | |
| Accrued service fees | | | 5,814 | |
| Reverse repurchase agreements | | | 27,884,500 | |
| Accrued interest payable | | | 11,429 | |
| Accrued trustees fees | | | 1,660 | |
| Accrued expenses and other payables | | | 43,299 | |
| Total Liabilities | | | 28,126,611 | |
| NET ASSETS | | $ | 69,416,077 | |
| | | | | |
| NET ASSETS CONSIST OF: | | | | |
| Capital stock | | $ | 58,753,909 | |
| Accumulated net investment income | | | 100,735 | |
| Accumulated net realized gain on investments | | | 5,829,082 | |
| Unrealized net appreciation on investments | | | 4,732,351 | |
| Total Net Assets | | $ | 69,416,077 | |
| | | | | |
| NET ASSETS | | | | |
| Investor Class: | | | | |
| Shares authorized (no par value) | | Unlimited | |
| Net assets applicable to outstanding Investor Class shares | | $ | 69,416,077 | |
| Shares issued and outstanding | | | 4,891,750 | |
| Net asset value, offering price and redemption price per share | | $ | 14.19 | |
The accompanying notes are an integral part of these financial statements.
| HENNESSY FUNDS | 1-800-966-4354 | |
Financial Statements
Statement of Operations for the year ended October 31, 2015 |
| INVESTMENT INCOME: | | | |
| Dividend income | | $ | 2,047,241 | |
| Interest income | | | 4,827 | |
| Total investment income | | | 2,052,068 | |
| | | | | |
| EXPENSES: | | | | |
| Investment advisory fees (See Note 5) | | | 459,718 | |
| Distribution fees – Investor Class (See Note 5) | | | 114,929 | |
| Interest expense (See Notes 6 and 8) | | | 91,702 | |
| Service fees – Investor Class (See Note 5) | | | 76,620 | |
| Administration, fund accounting, custody and transfer agent fees (See Note 5) | | | 76,054 | |
| Sub-transfer agent expenses – Investor Class (See Note 5) | | | 63,614 | |
| Audit fees | | | 22,360 | |
| Compliance expense | | | 22,186 | |
| Federal and state registration fees | | | 20,353 | |
| Reports to shareholders | | | 12,512 | |
| Trustees’ fees and expenses | | | 8,368 | |
| Legal fees | | | 1,500 | |
| Other expenses | | | 7,988 | |
| Total expenses | | | 977,904 | |
| NET INVESTMENT INCOME | | $ | 1,074,164 | |
| | | | | |
| REALIZED AND UNREALIZED GAINS (LOSSES): | | | | |
| Net realized gain on investments | | $ | 5,969,412 | |
| Net change in unrealized depreciation on investments | | | (6,270,901 | ) |
| Net loss on investments | | | (301,489 | ) |
| NET INCREASE IN NET ASSETS RESULTING FROM OPERATIONS | | $ | 772,675 | |
The accompanying notes are an integral part of these financial statements.
Financial Statements
| Statements of Changes in Net Assets |
| | | Year Ended | | | Year Ended | |
| | | October 31, 2015 | | | October 31, 2014 | |
| OPERATIONS: | | | | | | |
| Net investment income | | $ | 1,074,164 | | | $ | 1,124,705 | |
| Net realized gain on investments | | | 5,969,412 | | | | 7,876,199 | |
| Net change in unrealized depreciation on investments | | | (6,270,901 | ) | | | (2,312,252 | ) |
| Net increase in net assets resulting from operations | | | 772,675 | | | | 6,688,652 | |
| | | | | | | | | |
| DISTRIBUTIONS TO SHAREHOLDERS FROM: | | | | | | | | |
| Net investment income – Investor Class | | | (1,084,818 | ) | | | (1,079,733 | ) |
| Net realized gains – Investor Class | | | (5,767,007 | ) | | | — | |
| Total distributions | | | (6,851,825 | ) | | | (1,079,733 | ) |
| | | | | | | | | |
| CAPITAL SHARE TRANSACTIONS: | | | | | | | | |
| Proceeds from shares subscribed – Investor Class | | | 2,980,355 | | | | 6,812,637 | |
| Dividends reinvested – Investor Class | | | 6,420,583 | | | | 1,006,867 | |
| Cost of shares redeemed – Investor Class | | | (17,800,502 | ) | | | (19,774,754 | ) |
| Net decrease in net assets derived | | | | | | | | |
| from capital share transactions | | | (8,399,564 | ) | | | (11,955,250 | ) |
| TOTAL DECREASE IN NET ASSETS | | | (14,478,714 | ) | | | (6,346,331 | ) |
| | | | | | | | | |
| NET ASSETS: | | | | | | | | |
| Beginning of year | | | 83,894,791 | | | | 90,241,122 | |
| End of year | | $ | 69,416,077 | | | $ | 83,894,791 | |
| Undistributed net investment income, end of year | | $ | 100,735 | | | $ | 111,389 | |
| | | | | | | | | |
| CHANGES IN SHARES OUTSTANDING: | | | | | | | | |
| Shares sold – Investor Class | | | 203,884 | | | | 461,575 | |
| Shares issued to holders as | | | | | | | | |
| reinvestment of dividends – Investor Class | | | 448,889 | | | | 67,319 | |
| Shares redeemed – Investor Class | | | (1,254,599 | ) | | | (1,344,123 | ) |
| Net decrease in shares outstanding | | | (601,826 | ) | | | (815,229 | ) |
The accompanying notes are an integral part of these financial statements.
| HENNESSY FUNDS | 1-800-966-4354 | |
Financial Statements
Statement of Cash Flows for the year ended October 31, 2015 |
| Cash flows from operating activities: | | | |
| Net increase in net assets from operations | | $ | 772,675 | |
| Adjustments to reconcile net increase in net assets from | | | | |
| operations to net cash provided by operating activities: | | | | |
| Payments to purchase securities | | | (14,853,390 | ) |
| Proceeds from sale of securities | | | 27,534,958 | |
| (Purchase) sale of short term investments, net | | | 6,922,120 | |
| Realized gain on investments in securities | | | (5,969,412 | ) |
| Net accretion of discount on securities | | | (4,555 | ) |
| Change in unrealized depreciation on investments in securities | | | 6,270,901 | |
| (Increases) decreases in operating assets: | | | | |
| Decrease in dividends and interest receivable | | | 21,212 | |
| Decrease in prepaid expenses and other assets | | | 391 | |
| Increases (decreases) in operating liabilities: | | | | |
| Decrease in payable to advisor | | | (7,017 | ) |
| Decrease in payable to administrator | | | (7,502 | ) |
| Increase in accrued distribution fees | | | 2,129 | |
| Decrease in accrued service fees | | | (1,169 | ) |
| Increase in accrued interest payable | | | 3,471 | |
| Increase in accrued audit fees | | | 3,010 | |
| Decrease in accrued trustee fees | | | (72 | ) |
| Increase in other accrued expenses and payables | | | 3,970 | |
| Net cash provided by operating activities | | | 20,691,720 | |
| | | | | |
| Cash flows from financing activities: | | | | |
| Decrease in reverse repurchase agreements | | | (5,397,000 | ) |
| Proceeds from shares sold | | | 3,012,775 | |
| Payment on shares redeemed | | | (17,876,823 | ) |
| Distributions paid in cash, net of reinvestments | | | (431,242 | ) |
| Net cash used in financing activities | | | (20,692,290 | ) |
| Net increase in cash | | | (570 | ) |
| | | | | |
| Cash: | | | | |
| Beginning balance | | | 570 | |
| Ending balance | | $ | — | |
| | | | | |
| Supplemental information: | | | | |
| Non-cash financing activities not included herein consists | | | | |
| of dividend reinvestment of dividends and distributions | | $ | 6,420,583 | |
| Proceeds from securities litigation | | | 88,859 | |
| | | | | |
| Cash paid for interest | | $ | 88,231 | |
The accompanying notes are an integral part of these financial statements.
(This Page Intentionally Left Blank.)
| HENNESSY FUNDS | 1-800-966-4354 | |
Financial Statements
For an Investor Class share outstanding throughout each year
PER SHARE DATA:
Net asset value, beginning of year
Income from investment operations:
Net investment income
Net realized and unrealized gains (losses) on investments
Total from investment operations
Less distributions:
Dividends from net investment income
Dividends from net realized gains
Total distributions
Net asset value, end of year
TOTAL RETURN
SUPPLEMENTAL DATA AND RATIOS:
Net assets, end of year (millions)
Ratio of expenses to average net assets
Ratio of net investment income to average net assets
Portfolio turnover rate
The accompanying notes are an integral part of these financial statements.
| Year Ended October 31, | |
| 2015 | | | 2014 | | | 2013 | | | 2012 | | | 2011 | |
| | | | | | | | | | | | | |
| $ | 15.27 | | | $ | 14.30 | | | $ | 12.64 | | | $ | 11.47 | | | $ | 10.57 | |
| | | | | | | | | | | | | | | | | | | |
| | | | | | | | | | | | | | | | | | | |
| | 0.20 | | | | 0.20 | | | | 0.16 | | | | 0.18 | | | | 0.18 | |
| | (0.02 | ) | | | 0.96 | | | | 1.66 | | | | 1.17 | | | | 0.89 | |
| | 0.18 | | | | 1.16 | | | | 1.82 | | | | 1.35 | | | | 1.07 | |
| | | | | | | | | | | | | | | | | | | |
| | | | | | | | | | | | | | | | | | | |
| | (0.20 | ) | | | (0.19 | ) | | | (0.16 | ) | | | (0.18 | ) | | | (0.17 | ) |
| | (1.06 | ) | | | — | | | | — | | | | — | | | | — | |
| | (1.26 | ) | | | (0.19 | ) | | | (0.16 | ) | | | (0.18 | ) | | | (0.17 | ) |
| $ | 14.19 | | | $ | 15.27 | | | $ | 14.30 | | | $ | 12.64 | | | $ | 11.47 | |
| | | | | | | | | | | | | | | | | | | |
| | 1.22 | % | | | 8.15 | % | | | 14.49 | % | | | 11.78 | % | | | 10.22 | % |
| | | | | | | | | | | | | | | | | | | |
| | | | | | | | | | | | | | | | | | | |
| $ | 69.42 | | | $ | 83.89 | | | $ | 90.24 | | | $ | 77.67 | | | $ | 64.13 | |
| | 1.28 | % | | | 1.34 | % | | | 1.37 | % | | | 1.37 | % | | | 1.34 | % |
| | 1.40 | % | | | 1.31 | % | | | 1.16 | % | | | 1.44 | % | | | 1.56 | % |
| | 27 | % | | | 23 | % | | | 31 | % | | | 22 | % | | | 21 | % |
The accompanying notes are an integral part of these financial statements.
| HENNESSY FUNDS | 1-800-966-4354 | |
Financial Statements
Notes to the Financial Statements October 31, 2015 |
1). ORGANIZATION
The Hennessy Total Return Fund (the “Fund”) is a series of Hennessy Funds Trust (the “Trust”), which was organized as a Delaware statutory trust on September 17, 1992. The Fund is an open-end management investment company registered under the Investment Company Act of 1940, as amended. The Fund is a successor to a fund with the same name (the “Predecessor Fund”) that was a series of The Hennessy Funds, Inc., a Maryland corporation, pursuant to a reorganization that took place after the close of business on February 28, 2014. Prior to February 28, 2014, the Fund had no investment operations. As a result of the reorganization, holders of the Investor Class shares of the Predecessor Fund received Investor Class shares of the Fund (the Investor Class shares of the Fund are the successor to the accounting and performance information of the Predecessor Fund). The investment objective of the Fund is total return, consisting of capital appreciation and current income. The Fund is a non-diversified fund and offers Investor Class shares.
As an investment company, the Fund follows the investment company accounting and reporting guidance of the Financial Accounting Standards Board (“FASB”) Accounting Standard Codification Topic 946 “Financial Services—Investment Companies.”
2). SIGNIFICANT ACCOUNTING POLICIES
The following is a summary of significant accounting policies consistently followed by the Fund in the preparation of the financial statements. These policies are in conformity with U.S. generally accepted accounting principles (“GAAP”).
| a). | Investment Valuation – All investments in securities are recorded at their estimated fair value, as described in Note 3. |
| | |
| b). | Federal Income Taxes – Provision for federal income taxes or excise taxes has not been made since the Fund has elected to be taxed as a “regulated investment company” and intends to distribute substantially all of its taxable income to its shareholders and otherwise comply with the provisions of the Internal Revenue Code of 1986, as amended, applicable to regulated investment companies. Net investment income or loss and realized gains and losses for federal income tax purposes may differ from that reported on the financial statements because of temporary book and tax basis differences. Temporary differences are primarily the result of the treatment of wash sales for tax reporting purposes. The Fund recognizes interest and penalties related to income tax benefits, if any, in the statement of operations as an income tax expense. Distributions from net realized gains for book purposes may include short-term capital gains, which are included as ordinary income to shareholders for tax purposes. |
| | |
| c). | Income and Expenses – Dividend income is recognized on the ex-dividend date or as soon as information is available to the Fund. Interest income, which includes the amortization of premium and accretion of discount, is recognized on an accrual basis. The Fund is charged for those expenses that are directly attributable to the portfolio, such as advisory, administration, and certain shareholder service fees. |
| | |
| d). | Distributions to Shareholders – Dividends from net investment income for the Fund, if any, are declared and paid on a calendar quarter basis. Distributions of net realized capital gains, if any, are declared and paid annually, usually in December. |
| e). | Security Transactions – Investment and shareholder transactions are recorded on the trade date. The Fund determines the gain or loss realized from the investment transactions by comparing the original cost of the security lot sold with the net sale proceeds. Discounts and premiums on securities purchased are accreted/amortized over the life of the respective security. |
| | |
| f). | Use of Estimates – The preparation of financial statements in conformity with GAAP requires management to make estimates and assumptions that affect the reported amounts of assets and liabilities and disclosure of contingent assets and liabilities at the date of the financial statements and the reported change in net assets during the reporting period. Actual results could differ from those estimates. |
| | |
| g). | Share Valuation – The net asset value (“NAV”) per share of the Fund is calculated by dividing the sum of the value of the securities held by the Fund, plus cash or other assets, minus all liabilities (including estimated accrued expenses) by the total number of shares outstanding for the Fund, rounded to the nearest cent. The Fund’s shares will not be priced on days the New York Stock Exchange is closed for trading. The offering and redemption price per share for the Fund is equal to the Fund’s NAV per share. |
| | |
| h). | Repurchase Agreements – The Fund may enter into repurchase agreements with member banks or security dealers of the Federal Reserve Board whom the investment advisor deems creditworthy. The repurchase price generally equals the price paid by the Fund plus interest negotiated on the basis of current short-term rates. |
| | |
| | Securities pledged as collateral for repurchase agreements are held by the custodian bank until the respective agreements mature. Provisions of the repurchase agreements ensure that the market value of the collateral, including accrued interest thereon, is sufficient to cover the repurchase amount in the event of default of the counterparty. If the counterparty defaults and the value of the collateral declines or if the counterparty enters an insolvency proceeding, realization of the collateral by the Fund may be delayed or limited. |
| | |
| i). | Accounting for Uncertainty in Income Taxes – The Fund has accounting policies regarding recognition and measurement of tax positions taken or expected to be taken on a tax return. The tax returns of the Fund for the prior three fiscal years are open for examination. The Fund has reviewed all open tax years in major jurisdictions and concluded that there is no impact on the Fund’s net assets and no tax liability resulting from unrecognized tax benefits relating to uncertain income tax positions taken or expected to be taken on a tax return. The Fund’s major tax jurisdictions are U.S. federal and Delaware. |
| | |
| j). | Offsetting Assets and Liabilities – The Fund follows the financial reporting rules regarding offsetting assets and liabilities and related netting arrangements to enable users of its financial statements to understand the effect of those arrangements on its financial position. Reverse repurchase transactions are entered into by the Fund under Master Repurchase Agreements (“MRA”) that permit the Fund, under certain circumstances, including an event of default (such as bankruptcy or insolvency), to offset payables under the MRA with collateral held with the counterparty and create one single net payment from the Fund. Upon a bankruptcy or insolvency of the MRA counterparty, the Fund is considered an unsecured creditor with respect to excess collateral and, as such, the return of excess collateral may be delayed. In the event the buyer of securities under an MRA files for bankruptcy or becomes insolvent, the Fund’s use of the proceeds of the agreement may be restricted while the other party, or its trustee or receiver, determines whether or not to enforce the Fund’s obligation to repurchase the securities. For additional information regarding the offsetting of assets and liabilities at October 31, 2015, please reference the table in Note 8. |
| HENNESSY FUNDS | 1-800-966-4354 | |
| k). | New Accounting Pronouncements – In June 2014, the FASB issued Accounting Standards Update (“ASU”) No. 2014-11 “Repurchase-to Maturity Transactions, Repurchase Financings, and Disclosures.” The amendments in this ASU require an entity to modify accounting for repurchase-to-maturity transactions and repurchase financing arrangements, as well as modify required disclosures for repurchase agreements, securities lending transactions, and repurchase-to-maturity transactions that are accounted for as secured borrowings. The guidance is effective for fiscal years beginning on or after December 15, 2014, and for interim periods within those fiscal years. Management is currently evaluating the impact these changes will have on the Fund’s financial statement disclosures. |
| | In May 2015, the FASB issued ASU No. 2015-07 “Disclosure for Investments in Certain Entities that Calculate Net Asset Value per Share (or Its Equivalent).” The amendments in ASU No. 2015-07 remove the requirement to categorize within the fair value hierarchy investments measured at NAV and require the disclosure of sufficient information to reconcile the fair value of the remaining assets categorized within the fair value hierarchy to the financial statements. The amendments in ASU No. 2015-07 are effective for fiscal years beginning after December 15, 2015, and interim periods within those fiscal years. Management has reviewed the requirements and believes the adoption of ASU 2015-07 will not have a material impact on the Fund’s financial statements and related disclosures. |
3). SECURITIES VALUATION
The Fund follows authoritative fair valuation accounting standards that establish an authoritative definition of fair value and set out a hierarchy for measuring fair value. These standards require additional disclosures about the various inputs and valuation techniques used to develop the measurements of fair value and a discussion in changes in valuation techniques and related inputs during the period. These inputs are summarized in the three broad levels listed below:
| | Level 1 – | Quoted unadjusted prices for identical instruments in active markets to which the Fund has access at the date of measurement. |
| | | |
| | Level 2 – | Quoted prices for similar instruments in active markets; quoted prices for identical or similar instruments in markets that are not active; and model-derived valuations in which all significant inputs and significant value drivers are observable in active markets. Level 2 inputs are those in markets for which there are few transactions, the prices are not current, the prices are fair value adjusted due to post-market close subsequent events (foreign markets), little public information exists, or instances where prices vary substantially over time or among brokered market makers. These inputs may also include interest rates, prepayment speeds, credit risk curves, default rates, and similar data. |
| | | |
| | Level 3 – | Model-derived valuations in which one or more significant inputs or significant value drivers are unobservable. Unobservable inputs are those inputs that reflect the Fund’s own assumptions about what market participants would use to price the asset or liability based on the best available information. |
Following is a description of the valuation techniques applied to the Fund’s major categories of assets and liabilities measured at fair value on a recurring basis.
Equity Securities – Equity securities, including common stocks, preferred stocks, exchange-traded funds, closed-end mutual funds, partnerships, rights, and real estate
investment trusts, that are traded on a securities exchange for which a last-quoted sales price is readily available will generally be valued at the last sales price as reported by the primary exchange on which the securities are listed. Securities listed on The NASDAQ Stock Market (“NASDAQ”) will generally be valued at the NASDAQ Official Closing Price, which may differ from the last sales price reported. Securities traded on a securities exchange for which a last-quoted sales price is not readily available will generally be valued at the mean between the bid and ask prices. To the extent these securities are actively traded and valuation adjustments are not applied, they are classified in Level 1 of the fair value hierarchy.
Registered Investment Companies – Investments in registered investment companies (e.g., mutual funds) are generally priced at the ending NAV provided by the applicable registered investment company’s service agent and will be classified in Level 1 of the fair value hierarchy.
Debt Securities – Debt securities, including corporate bonds, asset-backed securities, mortgage-backed securities, municipal bonds, U.S. Treasuries, and U.S. government agency issues, are generally valued at market on the basis of valuations furnished by an independent pricing service that utilizes both dealer-supplied valuations and formula-based techniques. The pricing service may consider recently executed transactions in securities of the issuer or comparable issuers, market price quotations (where observable), bond spreads, and fundamental data relating to the issuer. In addition, the model may incorporate market observable data such as reported sales of similar securities, broker quotes, yields, bids, offers, and reference data. Certain securities are valued principally using dealer quotations. These securities are generally classified in Level 2 of the fair value hierarchy.
Short-Term Securities – Short-term equity investments, including money market funds, are valued in the manner specified above. Short-term debt investments are generally valued at amortized cost, which approximates fair market value, if their original term to maturity was 60 days or less, or by amortizing the values as of the 61st day prior to maturity, if their original term to maturity exceeded 60 days. Amortized cost is not used if its use would be inappropriate due to credit or other impairments of the issuer, in which case the security’s fair value would be determined, as described below. Short-term securities are generally classified in Level 1 or Level 2 of the fair market hierarchy depending on the inputs used and market activity levels for specific securities.
The Board of Trustees of the Fund (the “Board”) has adopted fair value pricing procedures that are followed when a price for a security is not readily available or if a significant event has occurred that indicates the closing price of a security no longer represents the true value of that security. Fair value pricing determinations are made in good faith in accordance with these procedures. There are numerous criteria that will be given consideration in determining a fair value of a security. Some of these criteria are trading volume of a security and markets, the value of other like securities, and news events with direct bearing to a security or markets. Fair value pricing results in an estimated price for a security that reflects the amount the Fund might reasonably expect to receive in a current sale. Depending on the relative significance of the valuation inputs, these securities may be classified in either Level 2 or Level 3 of the fair value hierarchy.
The Board has delegated day-to-day valuation matters to a Valuation Committee comprised of one or more representatives from Hennessy Advisors, Inc., the Fund’s investment advisor. The function of the Valuation Committee is to value securities where current and reliable market quotations are not readily available. All actions taken by the Valuation Committee are reviewed by the Board.
| HENNESSY FUNDS | 1-800-966-4354 | |
The Fund has performed an analysis of all existing investments to determine the significance and character of all inputs to their fair value determination. Various inputs are used in determining the value of the Fund’s investments. The inputs or methodology used for valuing securities are not necessarily an indication of the risk associated with investing in those securities. Details related to the fair valuation hierarchy of the Fund’s securities as of October 31, 2015 are included in the Fund’s Schedule of Investments.
4). INVESTMENT TRANSACTIONS
Purchases and sales of investment securities (excluding government and short-term investments) for the Fund during the fiscal year ended October 31, 2015 were $14,853,390 and $27,446,097, respectively.
There were no purchases or sales/maturities of long-term U.S. Government Securities for the Fund during the fiscal year ended October 31, 2015.
5). INVESTMENT MANAGEMENT FEE AND OTHER TRANSACTIONS WITH AFFILIATES
Hennessy Advisors, Inc. (the “Advisor”) is the investment advisor of the Fund. The Advisor provides the Fund with investment management services under an Investment Advisory Agreement. The Advisor furnishes all investment advice, office space, facilities, and provides most of the personnel needed by the Fund. As compensation for its services, the Advisor is entitled to a monthly fee from the Fund. The fee is based upon the average daily net assets of the Fund at the annual rate of 0.60%. The net investment advisory fees payable by the Fund as of October 31, 2015 were $34,882.
The Board has approved a Shareholder Servicing Agreement for the Fund, which was instituted to compensate the Advisor for the non-investment management services it provides to the Fund. The Shareholder Servicing Agreement provides for a monthly fee paid to the Advisor at an annual rate of 0.10% of the average daily net assets of the Fund. Shareholder service fees payable by the Fund as of October 31, 2015 were $5,814.
The Fund has adopted a plan pursuant to Rule 12b-1 under the Investment Company Act of 1940, as amended, that authorizes payments in connection with the distribution of the Fund’s shares at an annual rate of up to 0.25% of the Fund’s average daily net assets, although the Fund is currently only using up to 0.15% of its average daily net assets for such purpose. Amounts paid under the plan may be spent on any activities or expenses primarily intended to result in the sale of shares, including but not limited to, advertising, shareholder account servicing, the printing and mailing of prospectuses to other than current shareholders, the printing and mailing of sales literature, and compensation for sales and marketing activities or to financial institutions and others, such as dealers and distributors.
The Fund has entered into agreements with various brokers, dealers, and financial intermediaries in connection with the sale of shares of the Fund. The agreements provide for periodic payments by the Fund to the brokers, dealers, and financial intermediaries for providing certain shareholder maintenance services (sub-transfer agent expenses). These shareholder services include the pre-processing and quality control of new accounts, shareholder correspondence, answering customer inquiries regarding account status, and facilitating shareholder telephone transactions. Fees paid by the Fund to various brokers, dealers, and financial intermediaries during the fiscal year ended October 31, 2015 were $63,614.
U.S. Bancorp Fund Services, LLC (“USBFS”) provides the Fund with administrative, fund accounting, and transfer agent services, including all regulatory reporting, and necessary office equipment and personnel. As administrator, USBFS is responsible for activities such as (i) preparing various federal and state regulatory filings, reports, and
returns for the Fund, (ii) preparing reports and materials to be supplied to the Board, (iii) monitoring the activities of the Fund’s custodian, transfer agent, and accountants, and (iv) coordinating the preparation and payment of the Fund’s expenses and reviewing the Fund’s expense accruals. Fees paid to USBFS during the fiscal year ended October 31, 2015 were $76,054.
U.S. Bank, N.A., an affiliate of USBFS, serves as the Fund’s custodian. Quasar Distributors, LLC acts as the Fund’s principal underwriter in a continuous public offering of the Fund’s shares. Quasar Distributors, LLC is an affiliate of USBFS and U.S. Bank, N.A.
6). LINE OF CREDIT
The Fund has an uncommitted line of credit with the other funds in the Hennessy Funds family of funds (the “Hennessy Funds”) in the amount of the lesser of (i) $100,000,000 or (ii) 33.33% of each Hennessy Fund’s net assets, or 30% for the Hennessy Gas Utility Fund and 10% for the Hennessy Balanced Fund, intended to provide short-term financing, if necessary, subject to certain restrictions, in connection with shareholder redemptions. The credit facility is with the Hennessy Funds’ custodian bank, U.S. Bank, N.A. Borrowings under this arrangement bear interest at the bank’s prime rate and are secured by all of the Fund’s assets (as to its own borrowings only). During the fiscal year ended October 31, 2015, the Fund did not have any borrowings outstanding under the line of credit.
7). FEDERAL TAX INFORMATION
As of October 31, 2015, the components of accumulated earnings (losses) for income tax purposes were as follows:
| Cost of investments for tax purposes | | $ | 92,743,932 | |
| Gross tax unrealized appreciation | | $ | 6,417,649 | |
| Gross tax unrealized depreciation | | | (1,789,094 | ) |
| Net tax unrealized appreciation | | $ | 4,628,555 | |
| Undistributed ordinary income | | $ | 189,594 | |
| Undistributed long-term capital gains | | | 5,844,019 | |
| Total distributable earnings | | $ | 6,033,613 | |
| Other accumulated gain | | $ | — | |
| Total accumulated gain | | $ | 10,662,168 | |
The difference between book-basis and tax-basis unrealized appreciation is attributable primarily to wash sales.
At October 31, 2015, the Fund had no tax basis capital losses to offset future capital gains.
At October 31, 2015, the Fund did not defer, on a tax basis, any post-December late year ordinary loss deferrals.
The tax character of distributions paid during fiscal year 2015 and fiscal year 2014 for the Fund were as follows:
| | | Year Ended | | | Year Ended | |
| | | October 31, 2015 | | | October 31, 2014 | |
| Ordinary income | | $ | 1,084,818 | | | $ | 1,079,733 | |
| Long-term capital gain | | | 5,767,007 | | | | — | |
| | | $ | 6,851,825 | | | $ | 1,079,733 | |
| HENNESSY FUNDS | 1-800-966-4354 | |
8). REVERSE REPURCHASE AGREEMENTS
The Fund may enter into reverse repurchase agreements with the same parties with whom it may enter into repurchase agreements. Under a reverse repurchase agreement, the Fund sells securities and agrees to repurchase them at a mutually agreed upon date and price. Reverse repurchase agreements are regarded as a form of secured borrowing by the Fund. Securities sold under reverse repurchase agreements are reflected as a liability on the Statement of Assets and Liabilities. Interest payments made are recorded as a component of interest expense on the Statement of Operations.
For the fiscal year ended October 31, 2015, the average daily balance and average interest rate in effect for reverse repurchase agreements were $31,135,024 and 0.276%, respectively. At October 31, 2015, the interest rate in effect for the outstanding reverse repurchase agreements scheduled to mature on November 19, 2015 ($5,397,000), December 17, 2015 ($8,995,000), and January 21, 2016 ($13,492,000) was 0.35%, 0.50%, and 0.40%, respectively. Outstanding reverse repurchase agreements at October 31, 2015 were equal to 40.17% of the Fund’s net assets.
Below is the gross and net information about instruments and transactions eligible for offset in the Statement of Assets and Liabilities as well as instruments and transactions subject to an agreement similar to a master netting arrangement:
| | | | | | | | | | | | | | | | | | | |
| | | | | | Gross | | | Net | | | | | | | | | | |
| | | | | | Amounts | | | Amounts | | | | | | | | | | |
| | | | | | Offset | | | Presented | | | Gross Amounts Not | | | | |
| | | | | | in the | | | in the | | | Offset in the Statement | | | | |
| | | Gross | | | Statement | | | Statement | | | of Assets and Liabilities | | | | |
| | | Amounts of | | | of | | | of | | | | | | Collateral | | | | |
| | | Recognized | | | Assets and | | | Assets and | | | Financial | | | Pledged | | | Net | |
| Description | | Liabilities | | | Liabilities | | | Liabilities | | | Instruments | | | (Received) | | | Amount | |
| Reverse | | | | | | | | | | | | | | | | | | |
| Repurchase | | | | | | | | | | | | | | | | | | |
| Agreements | | $ | 27,884,500 | | | $ | — | | | $ | 27,884,500 | | | $ | 27,884,500 | | | $ | — | | | $ | — | |
| | | $ | 27,884,500 | | | $ | — | | | $ | 27,884,500 | | | $ | 27,884,500 | | | $ | — | | | $ | — | |
For additional information, please reference the “Offsetting Assets and Liabilities” section in Note 2.
9). EVENTS SUBSEQUENT TO YEAR END
Management has evaluated the Fund’s related events and transactions that occurred subsequent to October 31, 2015, through the date of issuance of the Fund’s financial statements. Other than as disclosed below, management has determined that there were no subsequent events requiring recognition or disclosure in the financial statements.
On December 9, 2015, capital gains were declared and paid to shareholders of record as of December 8, 2015 as follows:
| | | Long-term | | | Short-term | |
| Investor Class | | $ | 1.20995 | | | $ | 0.01840 | |
Report of Independent Registered Public Accounting Firm
To the Board of Trustees of Hennessy Funds Trust
and the Shareholders of the Hennessy Total Return Fund:
We have audited the accompanying statement of assets and liabilities of Hennessy Total Return Fund (the Fund), a series of Hennessy Funds Trust, including the schedule of investments, as of October 31, 2015, and the related statement of operations for the year then ended, the statements of changes in net assets for each of the years in the two-year period then ended, the statement of cash flows for the year then ended, and the financial highlights for each of the years in the five-year period then ended. These financial statements and financial highlights are the responsibility of the Fund’s management. Our responsibility is to express an opinion on these financial statements and financial highlights based on our audits.
We conducted our audits in accordance with the standards of the Public Company Accounting Oversight Board (United States). Those standards require that we plan and perform the audit to obtain reasonable assurance about whether the financial statements and financial highlights are free of material misstatement. An audit includes examining, on a test basis, evidence supporting the amounts and disclosures in the financial statements. Our procedures included confirmation of investments owned as of October 31, 2015, by correspondence with the custodian and brokers or by other appropriate auditing procedures. An audit also includes assessing the accounting principles used and significant estimates made by management, as well as evaluating the overall financial statement presentation. We believe that our audits provide a reasonable basis for our opinion.
In our opinion, the financial statements and financial highlights referred to above present fairly, in all material respects, the financial position of the Fund as of October 31, 2015, and the results of its operations and cash flows for the year then ended, the changes in its net assets for each of the years in the two-year period then ended, and the financial highlights for each of the years in the five-year period then ended, in conformity with U.S. generally accepted accounting principles.
Milwaukee, Wisconsin
December 23, 2015
| HENNESSY FUNDS | 1-800-966-4354 | |
Trustees and Officers of the Fund (Unaudited)
The business and affairs of the Fund are managed under the direction of the Board of Trustees of the Trust, and the Board of Trustees elects the Officers of the Trust. Information pertaining to the Trustees and the Officers of the Trust is set forth below. Such persons serve until their successors are duly elected and qualified or until their earlier death, resignation, or removal. Each of the Trustees oversees 16 Hennessy Funds. Unless otherwise indicated, the address of all persons listed below is 7250 Redwood Boulevard, Suite 200, Novato, CA 94945. The Fund’s Statement of Additional Information includes more information about the persons listed below and is available, without charge, upon request by calling 1-800-966-4354.
| | | | Other |
| | | | Directorships |
| Name, Year of Birth, | | | (During Past |
| and Position Held | Length of | Principal Occupation(s) | Five Years) |
with the Trust | Time Served | During Past Five Years | Held by Trustee(1) |
| | | | |
| Disinterested Trustees | | | |
| | | | |
| J. Dennis DeSousa (1936) | Since January | Mr. DeSousa is a real estate investor. | Hennessy SPARX |
| Trustee | 1996 for the | | Funds Trust; |
| | Hennessy Funds | | Hennessy Mutual |
| | | | Funds, Inc.; and |
| | | | The Hennessy |
| | | | Funds, Inc. |
| | | | |
| Robert T. Doyle (1947) | Since January | Mr. Doyle has been the Sheriff of | Hennessy SPARX |
| Trustee | 1996 for the | Marin County, California since 1996. | Funds Trust; |
| | Hennessy Funds | | Hennessy Mutual |
| | | | Funds, Inc.; and |
| | | | The Hennessy |
| | | | Funds, Inc. |
| | | | |
| Gerald P. Richardson (1945) | Since May | Mr. Richardson is an independent | Hennessy SPARX |
| Trustee | 2004 for the | consultant in the securities industry. | Funds Trust; |
| | Hennessy Funds | | Hennessy Mutual |
| | | | Funds, Inc.; and |
| | | | The Hennessy |
| | | | Funds, Inc. |
Interested Trustee(2) | | | |
| | | | |
| Neil J. Hennessy (1956) | Since January | Mr. Hennessy has been employed by | Hennessy Advisors, |
| Trustee, Chairman of | 1996 as a Trustee | Hennessy Advisors, Inc., the Funds’ | Inc.; Hennessy |
| the Board, Chief | for the Hennessy | investment advisor, since 1989. | SPARX Funds Trust; |
| Investment Officer, | Funds and since | He currently serves as President, | Hennessy Mutual |
| Portfolio Manager, | June 2008 as | Chairman and Chief Executive Officer | Funds, Inc.; and |
| and President | an Officer of the | of Hennessy Advisors, Inc. | The Hennessy |
| | Hennessy Funds | | Funds, Inc. |
| Name, Year of Birth, | | |
| and Position Held | Length of | Principal Occupation(s) |
with the Trust | Time Served | During Past Five Years |
| | | |
| Officers | | |
| | | |
| Teresa M. Nilsen (1966) | Since January | Ms. Nilsen has been employed by Hennessy Advisors, Inc., |
| Executive Vice President | 1996 for the | the Funds’ investment advisor, since 1989. She currently |
| and Treasurer | Hennessy Funds | serves as Executive Vice President, Chief Operations Officer, |
| | | Chief Financial Officer, and Secretary of Hennessy Advisors, Inc. |
| | | |
| Daniel B. Steadman (1956) | Since March | Mr. Steadman has been employed by Hennessy Advisors, Inc., |
| Executive Vice President | 2000 for the | the Funds’ investment advisor, since 2000. He currently serves |
| and Secretary | Hennessy Funds | as Executive Vice President and Chief Compliance Officer of |
| | | Hennessy Advisors, Inc. |
| | | |
| Jennifer Cheskiewicz (1977) | Since June | Ms. Cheskiewicz has been employed by Hennessy Advisors, |
| Senior Vice President and | 2013 for the | Inc., the Funds’ investment advisor, since June 2013. She |
| Chief Compliance Officer | Hennessy Funds | currently serves as General Counsel of Hennessy Advisors, Inc. |
| | | |
| | | She previously served as in-house counsel to Carlson Capital, |
| | | L.P., an SEC-registered investment advisor to several private |
| | | funds from February 2010 to May 2013. |
| | | |
| Brian Carlson (1972) | Since December | Mr. Carlson has been employed by Hennessy Advisors, Inc., the |
| Senior Vice President and | 2013 for the | Funds’ investment advisor, since December 2013. |
| Head of Distribution | Hennessy Funds | Mr. Carlson was previously a co-founder and principal of |
| | | Trivium Consultants, LLC from February 2011 through |
| | | November 2013. |
| | | |
David Ellison (1958)(3) | Since October | Mr. Ellison has served as a Portfolio Manager of the Hennessy |
| Senior Vice President and | 2012 for the | Small Cap Financial Fund, the Hennessy Large Cap Financial |
| Portfolio Manager | Hennessy Funds | Fund, and the Hennessy Technology Fund since inception. |
| | | |
| | | Mr. Ellison previously served as Director, CIO and President of |
| | | FBR Fund Advisers, Inc. from December 1999 to October 2012. |
| | | |
| Brian Peery (1969) | Since March | Mr. Peery has served as a Portfolio Manager of the Hennessy |
| Senior Vice President and | 2003 as an | Cornerstone Growth Fund, the Hennessy Cornerstone Mid Cap |
| Portfolio Manager | Officer of the | 30 Fund, the Hennessy Cornerstone Large Growth Fund, the |
| | Hennessy Funds | Hennessy Cornerstone Value Fund, the Hennessy Total Return |
| | and since | Fund, and the Hennessy Balanced Fund since October 2014. |
| | February 2011 | From February 2011 through September 2014, he served as |
| | as a Co-Portfolio | Co-Portfolio Manager of the same funds. Mr. Peery has also |
| | Manager or | served as a Portfolio Manager of the Hennessy Gas Utility Fund |
| | Portfolio Manager | since February 2015. |
| | for the | |
| | Hennessy Funds | Mr. Peery has been employed by Hennessy Advisors, Inc., the |
| | | Funds’ investment advisor, since 2002. |
| | | |
| Winsor (Skip) Aylesworth | Since October | Mr. Aylesworth has served as a Portfolio Manager of the |
(1947)(3) | 2012 for the | Hennessy Gas Utility Fund since 1998 and as a Portfolio |
| Vice President and | Hennessy Funds | Manager of the Hennessy Technology Fund since inception. |
| Portfolio Manager | | |
| | | Mr. Aylesworth previously served as Executive Vice President |
| | | of The FBR Funds from 1999 to October 2012. |
| HENNESSY FUNDS | 1-800-966-4354 | |
| Name, Year of Birth, | | |
| and Position Held | Length of | Principal Occupation(s) |
with the Trust | Time Served | During Past Five Years |
| | | |
Ryan Kelley (1972)(4) | Since March | Mr. Kelley has served as a Portfolio Manager of the Hennessy |
| Vice President and | 2013 for the | Gas Utility Fund, the Hennessy Small Cap Financial Fund, and |
| Portfolio Manager | Hennessy Funds | the Hennessy Large Cap Financial Fund since October 2014. |
| | | From March 2013 through September 2014, he served as a |
| | | Co-Portfolio Manager of the same funds. Prior to that, |
| | | he was a Portfolio Analyst of the Hennessy Funds. |
(1) | Pursuant to an internal reorganization, the series of Hennessy Mutual Funds, Inc. (“HMFI”), The Hennessy Funds, Inc. (“HFI”), and Hennessy SPARX Funds Trust (“HSFT”) were reorganized into series of Hennessy Funds Trust on February 28, 2014, which mirrored the corresponding series of HFMI, HFI, and HSFT. Subsequent to the reorganization, HFMI, HFI, and HSFT were dissolved. |
(2) | Mr. Hennessy is considered an “interested person,” as defined in the Investment Company Act of 1940, as amended, because he is an officer of the Hennessy Funds. |
(3) | The address of these officers is 101 Federal Street, Suite 1900, Boston, MA 02110. |
(4) | The address of this officer is 1340 Environ Way, Chapel Hill, NC 27517. |
(This Page Intentionally Left Blank.)
| HENNESSY FUNDS | 1-800-966-4354 | |
Expense Example (Unaudited)
October 31, 2015
As a shareholder of the Fund, you incur two types of costs: (1) transaction costs, including sales charges (loads) on purchase payments, reinvested dividends, or other distributions; redemption fees; and exchange fees; and (2) ongoing costs, including management fees; service fees; and other Fund expenses. This Example is intended to help you understand your ongoing costs (in dollars) of investing in the Fund and to compare these costs with the ongoing costs of investing in other mutual funds. The Example is based on an investment of $1,000 invested at the beginning of the period and held for the entire period from May 1, 2015 through October 31, 2015.
Actual Expenses
The first line of the table below provides information about actual account values and actual expenses. Although the Fund charges no sales loads or transaction fees, you will be assessed fees for outgoing wire transfers, returned checks and stop payment orders at prevailing rates charged by U.S. Bancorp Fund Services, LLC, the Fund’s transfer agent. If you request that a redemption be made by wire transfer, currently a $15.00 fee is charged by the Fund’s transfer agent. IRA accounts will be charged a $15.00 annual maintenance fee. The example below includes, but is not limited to, management fees, shareholder servicing fees, fund accounting, custody, and transfer agent fees. However, the example below does not include portfolio trading commissions and related expenses, and other extraordinary expenses as determined under generally accepted accounting principles. You may use the information in this line, together with the amount you invested, to estimate the expenses that you paid over the period. Simply divide your account value by $1,000 (for example, an $8,600 account value divided by $1,000 = 8.6), then multiply the result by the number in the first line of the table under the heading entitled “Expenses Paid During Period” to estimate the expenses you paid on your account during this period.
Hypothetical Example for Comparison Purposes
The second line of the table below provides information about hypothetical account values and hypothetical expenses based on the Fund’s actual expense ratios and an assumed rate of return of 5% per year before expenses, which is not the Fund’s actual return. The hypothetical account values and expenses may not be used to estimate the actual ending account balance or expenses you paid for the period. You may use this information to compare the ongoing costs of investing in the Fund and other funds. To do so, compare this 5% hypothetical example with the 5% hypothetical examples that appear in the shareholder reports of the other funds. Please note that the expenses shown in the table are meant to highlight your ongoing costs only and do not reflect any transactional costs, such as sales charges (loads), or exchange fees. Therefore, the second line of the table is useful in comparing ongoing costs only, and will not help you determine the relative total costs of owning different funds. In addition, if these transactional costs were included, your costs would have been higher.
| | | | Expenses Paid |
| | Beginning | Ending | During Period(1) |
| | Account Value | Account Value | May 1, 2015 – |
| | May 1, 2015 | October 31, 2015 | October 31, 2015 |
| Investor Class | | | |
| Actual | $1,000.00 | $ 990.20 | $6.57 |
| Hypothetical (5% return before expenses) | $1,000.00 | $1,018.60 | $6.67 |
(1) | Expenses are equal to the Fund’s annualized expense ratio of 1.31%, multiplied by the average account value over the period, multiplied by 184/365 days (to reflect one-half year period). |
| HENNESSY FUNDS | 1-800-966-4354 | |
How to Obtain a Copy of the Fund’s
Proxy Voting Policy and Proxy Voting Records
A description of the policies and procedures the Fund uses to determine how to vote proxies relating to portfolio securities is available without charge: (1) by calling 1-800-966-4354; (2) on the Hennessy Funds’ website at hennessyfunds.com/proxy-voting/policy.fs; or (3) on the U.S. Securities and Exchange Commission’s website at www.sec.gov. The Fund’s proxy voting record is available without charge on both the Hennessy Funds’ website at hennessyfunds.com/proxy-voting/policy.fs and the SEC’s website at www.sec.gov no later than August 31 for the prior 12 months ending June 30.
Quarterly Filings on Form N-Q
The Fund files its complete schedule of portfolio holdings with the SEC for the first and third quarters of each fiscal year on Form N-Q. The Fund’s Form N-Q will be available on the SEC’s website at www.sec.gov. The Fund’s Form N-Q may be reviewed and copied at the SEC’s Public Reference Room in Washington, DC and information on the operation of the Public Reference Room may be obtained by calling 1-800-SEC-0330. Information included in the Fund’s N-Q will also be available upon request by calling 1-800-966-4354.
Federal Tax Distribution Information
(Unaudited)
For the fiscal year ended October 31, 2015, certain dividends paid by the Fund may be subject to a maximum tax rate of 23.8%, as provided for by the Jobs and Growth Tax Relief Reconciliation Act of 2003. The percentage of dividends declared from ordinary income designated as qualified dividend income was 100.00%.
For corporate shareholders, the percent of ordinary income distributions that qualified for the corporate dividends received deduction for the fiscal year ended October 31, 2015 was 100.00%.
The percentage of taxable ordinary income distributions that are designated as short-term capital gain distributions under Section 871(k)(2)(C) of the Internal Revenue Code of 1986, as amended, for the Fund was 0.00%.
Householding
To help keep the Fund’s costs as low as possible, we generally deliver a single copy of most financial reports and prospectuses to shareholders who share an address, even if the accounts are registered under different names. This process, known as “householding,” does not apply to account statements. You may, of course, request an individual copy of a prospectus or financial report at any time. If you would like to receive separate mailings, please call the Administrator at 1-800-261-6950 or 1-414-765-4124 and we will begin individual delivery within 30 days of your request. If your account is held through a financial institution or other intermediary, please contact them directly to request individual delivery.
Privacy Policy
We collect the following non-public personal information about you:
| | • | information we receive from you on or in applications or other forms, correspondence, or conversations, including, but not limited to, your name, address, phone number, social security number, assets, income, and date of birth; and |
| | • | information about your transactions with us, our affiliates, or others, including, but not limited to, your account number and balance, payment history, parties to transactions, cost basis information, and other financial information. |
We do not disclose any non-public personal information about our current or former shareholders to nonaffiliated third parties, except as permitted by law. For example, we are permitted by law to disclose all of the information we collect, as described above, to our Transfer Agent to process your transactions. Furthermore, we restrict access to your non-public personal information to those persons who require such information to provide products or services to you. We maintain physical, electronic, and procedural safeguards that comply with federal standards to guard your non-public personal information.
In the event that you hold shares of the Fund through a financial intermediary, including, but not limited to, a broker-dealer, bank or trust company, the privacy policy of your financial intermediary would govern how your non-public personal information would be shared with nonaffiliated third parties.
| HENNESSY FUNDS | 1-800-966-4354 | |
For information, questions or assistance, please call
The Hennessy Funds
1-800-966-4354 or 1-415-899-1555
INVESTMENT ADVISOR
Hennessy Advisors, Inc.
7250 Redwood Blvd., Suite 200
Novato, California 94945
ADMINISTRATOR,
TRANSFER AGENT,
DIVIDEND PAYING AGENT &
SHAREHOLDER SERVICING AGENT
U.S. Bancorp Fund Services, LLC
P.O. Box 701
Milwaukee, Wisconsin 53201-0701
CUSTODIAN
U.S. Bank N.A.
Custody Operations
1555 North River Center Dr., Suite 302
Milwaukee, Wisconsin 53212
TRUSTEES
Neil J. Hennessy
Robert T. Doyle
J. Dennis DeSousa
Gerald P. Richardson
COUNSEL
Foley & Lardner LLP
777 East Wisconsin Avenue
Milwaukee, Wisconsin 53202-5306
INDEPENDENT REGISTERED
PUBLIC ACCOUNTING FIRM
KPMG LLP
777 East Wisconsin Avenue
Milwaukee, Wisconsin 53202-5306
DISTRIBUTOR
Quasar Distributors, LLC
615 East Michigan Street
Milwaukee, Wisconsin 53202
| hennessyfunds.com | 1-800-966-4354 |
This report has been prepared for shareholders and may be distributed to
others only if preceded or accompanied by a current prospectus.
ANNUAL REPORT
OCTOBER 31, 2015
HENNESSY EQUITY AND
INCOME FUND
Investor Class HEIFX
Institutional Class HEIIX
hennessyfunds.com | 1-800-966-4354
(This Page Intentionally Left Blank.)
Contents
| Letter to Shareholders | 2 |
| Performance Overview | 4 |
| Financial Statements | |
| Schedule of Investments | 7 |
| Statement of Assets and Liabilities | 18 |
| Statement of Operations | 19 |
| Statements of Changes in Net Assets | 21 |
| Financial Highlights | 22 |
| Notes to the Financial Statements | 26 |
| Report of Independent Registered Public Accounting Firm | 34 |
| Trustees and Officers of the Fund | 35 |
| Expense Example | 38 |
| Proxy Voting | 40 |
| Quarterly Filings on Form N-Q | 40 |
| Federal Tax Distribution Information | 40 |
| Householding | 40 |
| Privacy Policy | 41 |
| HENNESSY FUNDS | 1-800-966-4354 | |
December 2015
Dear Hennessy Funds Shareholder:
As I look back over the year, I am reminded that the U.S. economy has come a long way since the depths of the recession in 2009. The economy has been expanding steadily for almost six years, the unemployment rate has halved, the housing market has been recovering and capital expenditures have been growing. The financial markets have performed well too, driven largely by strong corporate earnings growth, especially in the early years. The U.S. market, as measured by the S&P 500 Index, has roughly tripled since the bull market began in 2009, and the Index’s earnings per share have increased 260% over this same time period. For the year ended October 31, 2015, the U.S. equity market performed reasonably well, with the S&P 500 posting another advance of 5.2%. However, behind this headline number, the market experienced a great deal of volatility as investors reacted to falling energy prices, a rise in the U.S. Dollar, pressure on export earnings growth, slower growth in China and, most significantly, the likelihood of a rise in the Fed Funds rate for the first time in nearly a decade – the featured topic of conversation around every office water cooler in the financial world this year.
Investors, reporters and friends often ask me “What’s next?” The market has been in a volatile, sideways correction for over a year now, and throughout this period of volatility, I have consistently advised investors to continue to focus on the long-term fundamentals of the market.
In my view, the fundamentals of the market are in good shape. Despite a stronger U.S. Dollar and its impact on export growth, the economy is still growing steadily. Inflation remains low, so we expect the Federal Reserve, once it does begin to raise short-term interest rates, will not likely raise them by very much. New jobs are being created at what I believe is a healthy rate, and average hourly wages are rising in response to a tighter labor market. Higher wages and lower gasoline prices are helping to keep consumer confidence positive.
Notwithstanding what I view as a relatively solid economic environment, however, I think investor sentiment remains restrained. The same factors that contributed to the market volatility this past year are still troubling investors today: the slowdown in the Chinese economy, slower earnings growth here in the U.S., and, of course, the prospect of rising interest rates. As a result of these investor worries, I do not see any solid enthusiasm for the market – no euphoria. Universal optimism about the market often coincides with a peak in stock prices and this absence of euphoria is yet another reason I feel bullish. And finally, I do not believe stocks are expensive. The Dow Jones Industrial Average and the S&P 500 Index have forward PE (price-to-earnings) ratios of approximately 16x and 17x, respectively, close to long-term averages. In my view, these fundamentals taken together signal a continuation of the bull market that began six years ago.
A final positive note: I still do not believe that investors have fully returned to investing in U.S. equities. Assets in domestic equity funds have now reached parity with fixed income/money market funds, with $6.2 trillion in each. I believe that fixed income investments will continue to trickle into equities, which should have a positive effect on the market.
Thank you for your continued confidence and investment in our products. If you have any questions or would like to speak with us directly, please don’t hesitate to call us at (800) 966-4354.
Best regards,
Neil J. Hennessy
President and Chief Investment Officer
Past performance does not guarantee future results.
Mutual fund investing involves risk. Principal loss is possible.
Opinions expressed are those of Neil Hennessy and are subject to change, are not guaranteed and should not be considered investment advice.
The Dow Jones Industrial Average and the S&P 500 Index are unmanaged indices commonly used to measure the performance of U.S. stocks. One cannot invest directly in an index.
Price to earnings (“PE”) is the market price per share divided by earnings per share. Earnings per share is the portion of a company’s profit allocated to each outstanding share of common stock. It serves as an indicator of a company’s profitability.
| HENNESSY FUNDS | 1-800-966-4354 | |
Performance Overview (Unaudited)
CHANGE IN VALUE OF $10,000 INVESTMENT
This graph illustrates the performance of an initial investment of $10,000 made in the Fund ten years ago and assumes the reinvestment of dividends.
AVERAGE ANNUAL TOTAL RETURN FOR PERIODS ENDED OCTOBER 31, 2015
| | One | Five | Ten |
| | Year | Years | Years |
| Hennessy Equity and Income Fund – | | | |
| Investor Class (HEIFX) | 1.43% | 9.26% | 7.30% |
| Hennessy Equity and Income Fund – | | | |
| Institutional Class (HEIIX) | 1.75% | 9.55% | 7.58% |
| Blended Balanced Index* | 4.09% | 9.57% | 6.68% |
| S&P 500 Index | 5.20% | 14.33% | 7.85% |
Expense ratios: 1.40% (Investor Class); 1.07% (Institutional Class)
Performance data quoted represents past performance; past performance does not guarantee future results. The investment return and principal value of an investment will fluctuate so that an investor’s shares, when redeemed, may be worth more or less than their original cost. The performance graph and table do not reflect the deduction of taxes that a shareholder would pay on Fund distributions or the redemption of Fund shares. Current performance of the Fund may be lower or higher than the performance quoted. Performance data current to the most recent month end may be obtained by visiting hennessyfunds.com. Performance for the period from March 12, 2010 to October 26, 2012 is that of the FBR Balanced Fund and for the periods prior to March 12, 2010 is that of the AFBA 5 Star Balanced Fund.
The expense ratios presented are from the most recent prospectus.
| * | The Blended Balanced Index consists of 60% common stocks represented by the S&P 500 Index and 40% bonds represented by the Barclays Capital Intermediate U.S. Government/Credit Index. |
PERFORMANCE NARRATIVE
Portfolio Managers for Equity Portion: Stephen M. Goddard, CFA (Lead Portfolio Manager), Jonathan T. Moody, CFA, J. Brian Campbell, CFA, and Mark DeVaul, CFA, CPA The London Company of Virginia, LLC (sub-advisor)
Portfolio Managers for Fixed Income Portion: Gary B. Cloud, CFA, and Peter G. Greig, CFA Financial Counselors, Inc. (sub-advisor)
Performance:
For the twelve-month period ended October 31, 2015, the Investor Class of the Hennessy Equity and Income Fund returned 1.43%, underperforming the Blended Balanced Index* and the S&P 500 Index, which returned 4.09% and 5.20% for the same period, respectively.
Equities: Stock selection accounted for most of the relative underperformance of the equity portion of the Fund over the year, as well as the Fund’s overweight position in Materials and underweight position in Health Care. Offsetting some of the drag from individual stocks, sector allocation helped performance, especially our overweight position in the Consumer Discretionary sector and underweight position in Energy.
On an individual stock level, the top contributors to Fund performance for the period were Carnival Corp, Lowe’s Companies, Altria Group, Inc., Visa Inc., and Eli Lilly and Company, while the top detractors were Apache Corp (U.S.), Scripps Networks, Interactive, Inc., Mosaic Company, ConocoPhillips (U.S.), and Dollar Tree, Inc. The Fund no longer holds Apache or Scripps Networks Interactive, but continues to hold the other named stocks.
Fixed Income: The Fund’s overweight position in investment grade corporate credit accounted for most of the underperformance of the fixed income portion of the Fund over the year. The Fund’s exposure to high yield credit securities, or junk bonds, also detracted from performance. Higher-yielding investment grade securities in the Fund contributed most positively to overall relative performance. Duration and yield curve-related factors were neutral drivers on relative Fund performance for the period.
Portfolio Strategy:
The Fund seeks a balanced portfolio of 60% equities and 40% fixed income with the goal of maintaining broad market exposure but with lower volatility. Our bottom-up equity selection strategy seeks companies with strong returns on capital and the flexibility to enhance shareholder value by using their balance sheets. The fixed income portion of the portfolio focuses on high-quality domestic corporate, agency and government bonds.
Investment Outlook:
Equities: The low interest rates and relatively high equity risk premiums prevalent today can make adjusting the capital structure of balance sheets especially beneficial for shareholders. Separately, with elevated cash levels on corporate balance sheets and dividend payout ratios near historic lows, we expect investors to reward companies that wisely deploy capital. Higher dividends, share repurchases and mergers and acquisition transactions have been, and we expect will continue to be, well-received by shareholders.
Many of the factors that limited gains in equities over the prior twelve months will likely remain as headwinds over the next twelve months. Nevertheless, the U.S. consumer is benefiting from an improving balance sheet, a stronger labor market, higher wage growth and lower gas prices, while central banks around the world remain accommodative. We believe the fundamentals of the market are attractive and we continue to be optimistic about the possibility of further market advances over the course of the next year. We believe our more conservative portfolio is well positioned for a slow growth environment that generally rewards strong capital allocation. We are still finding high conviction investment ideas. We are always focused on limiting downside risk and we see reasons to be optimistic in that regard.
Fixed Income: The Federal Reserve is contemplating the first rise in short term rates in nearly a decade. While we believe the Fed will raise rates only gradually, a steep hike in U.S. rates, while our major trading partners keep their interest rates unchanged or maybe
| HENNESSY FUNDS | 1-800-966-4354 | |
even cut them a little, would likely lead to another sharp drop in commodity prices, a further rally in the U.S. Dollar, and create deflationary pressures strong enough to cause negative economic growth and falling prices. We do not believe this chain of events will come about. We believe the Fed is inherently cautious and is constantly modifying its forecast as the data changes. If global economic activity data remain steady, but subpar, we expect the pace and slope of future Fed rate adjustments to decline and thereby allow international growth rates to become better aligned. This should be positive for our overweight in corporate credit because it will reduce the likelihood of long-term interest rates breaking out of their multi-year range.
| * | The Blended Balanced Index consists of 60% common stocks represented by the S&P 500 Index and 40% bonds represented by the Barclays Capital Intermediate U.S. Government/Credit Index. |
Opinions expressed are those of the Portfolio Managers as of the date written and are subject to change, are not guaranteed, and should not be considered investment advice or an indication of trading intent.
The S&P 500 Index is an unmanaged index commonly used to measure the performance of U.S. stocks. The Barclays Capital Intermediate U.S. Government/Credit Index is an unmanaged index commonly used to measure the performance of U.S. bonds. One cannot invest directly in an index.
Investments in debt securities typically decrease in value when interest rates rise. The risk is greater for longer-term debt securities. Investments by the Fund in lower-rated and non-rated securities presents a greater risk of loss to principal and interest than higher-rated securities. Investments in Asset-Backed and Mortgage-Backed securities include additional risks that investors should be aware of including credit risk, prepayment risk, possible illiquidity and default, as well as increased susceptibility to adverse economic developments. Investments in foreign securities may involve political, economic and currency risks, greater volatility and differences in accounting methods. The Fund may experience higher fees due to investments in pooled investment vehicles (including ETFs).
References to specific securities should not be considered a recommendation to buy or sell any security. Fund holdings and sector allocations are subject to change. Please refer to the Schedule of Investments included in this report for additional portfolio information.
Financial Statements
Schedule of Investments as of October 31, 2015 |
HENNESSY EQUITY AND INCOME FUND
(% of Net Assets)
| TOP TEN HOLDINGS (EXCLUDING CASH/CASH EQUIVALENTS) | % NET ASSETS |
| Altria Group, Inc. | 3.63% |
| General Dynamics Corp. | 3.08% |
| Carnival Corp. | 3.03% |
| Visa, Inc., Class A | 2.93% |
| Carmax, Inc. | 2.86% |
| Berkshire Hathaway, Inc., Class B | 2.85% |
| Bristol-Myers Squibb Co. | 2.75% |
| Wells Fargo & Co. | 2.66% |
| Eli Lilly & Co. | 2.57% |
| Lowe’s Companies, Inc. | 2.54% |
Note: For presentation purposes, the Fund has grouped some of the industry categories. For purposes of categorizing securities for compliance with Section 8(b)(1) of the Investment Company Act of 1940, as amended, the Fund uses more specific industry classifications.
| HENNESSY FUNDS | 1-800-966-4354 | |
| COMMON STOCKS – 60.57% | | Number | | | | | | % of | |
| | | of Shares | | | Value | | | Net Assets | |
| Consumer Discretionary – 12.64% | | | | | | | | | |
| CarMax, Inc. (a) | | | 223,449 | | | $ | 13,185,726 | | | | 2.86 | % |
| Carnival Corp. (b) | | | 258,560 | | | | 13,982,925 | | | | 3.03 | % |
| Dollar Tree, Inc. (a) | | | 153,700 | | | | 10,065,813 | | | | 2.18 | % |
| Lowe’s Companies, Inc. | | | 158,816 | | | | 11,725,385 | | | | 2.54 | % |
| O’Reilly Automotive, Inc. (a) | | | 34,000 | | | | 9,392,840 | | | | 2.03 | % |
| | | | | | | | 58,352,689 | | | | 12.64 | % |
| | | | | | | | | | | | | |
| Consumer Staples – 6.37% | | | | | | | | | | | | |
| Altria Group, Inc. | | | 276,939 | | | | 16,746,501 | | | | 3.63 | % |
| Edgewell Personal Care Co. | | | 74,122 | | | | 6,278,875 | | | | 1.36 | % |
| The Coca-Cola Co. | | | 150,481 | | | | 6,372,870 | | | | 1.38 | % |
| | | | | | | | 29,398,246 | | | | 6.37 | % |
| | | | | | | | | | | | | |
| Energy – 2.56% | | | | | | | | | | | | |
| Chevron Corp. | | | 70,591 | | | | 6,415,310 | | | | 1.39 | % |
| ConocoPhillips | | | 101,328 | | | | 5,405,849 | | | | 1.17 | % |
| | | | | | | | 11,821,159 | | | | 2.56 | % |
| | | | | | | | | | | | | |
| Financials – 11.63% | | | | | | | | | | | | |
| Alleghany Corp. (a) | | | 19,270 | | | | 9,563,123 | | | | 2.07 | % |
| Bank of America Corp. | | | 471,370 | | | | 7,909,588 | | | | 1.71 | % |
| Berkshire Hathaway, Inc., Class B (a) | | | 96,639 | | | | 13,144,837 | | | | 2.85 | % |
| BlackRock, Inc. | | | 30,698 | | | | 10,804,775 | | | | 2.34 | % |
| Wells Fargo & Co. | | | 227,293 | | | | 12,305,643 | | | | 2.66 | % |
| | | | | | | | 53,727,966 | | | | 11.63 | % |
| | | | | | | | | | | | | |
| Health Care – 6.66% | | | | | | | | | | | | |
| Bristol-Myers Squibb Co. | | | 192,293 | | | | 12,681,723 | | | | 2.75 | % |
| Eli Lilly & Co. | | | 145,740 | | | | 11,888,012 | | | | 2.57 | % |
| Pfizer, Inc. | | | 183,115 | | | | 6,192,949 | | | | 1.34 | % |
| | | | | | | | 30,762,684 | | | | 6.66 | % |
| | | | | | | | | | | | | |
| Industrials – 7.94% | | | | | | | | | | | | |
| Deere & Co. | | | 101,700 | | | | 7,932,600 | | | | 1.72 | % |
| FedEx Corp. | | | 41,718 | | | | 6,510,094 | | | | 1.41 | % |
| General Dynamics Corp. | | | 95,570 | | | | 14,199,791 | | | | 3.08 | % |
| Norfolk Southern Corp. | | | 100,100 | | | | 8,011,003 | | | | 1.73 | % |
| | | | | | | | 36,653,488 | | | | 7.94 | % |
The accompanying notes are an integral part of these financial statements.
| COMMON STOCKS | | Number | | | | | | % of | |
| | | of Shares | | | Value | | | Net Assets | |
| Information Technology – 8.30% | | | | | | | | | |
| Cisco Systems, Inc. | | | 257,366 | | | $ | 7,425,009 | | | | 1.61 | % |
| EMC Corp. | | | 296,613 | | | | 7,777,193 | | | | 1.68 | % |
| International Business Machines Corp. | | | 27,405 | | | | 3,838,892 | | | | 0.83 | % |
| Microsoft Corp. | | | 109,493 | | | | 5,763,712 | | | | 1.25 | % |
| Visa, Inc., Class A | | | 174,146 | | | | 13,510,247 | | | | 2.93 | % |
| | | | | | | | 38,315,053 | | | | 8.30 | % |
| | | | | | | | | | | | | |
| Materials – 3.14% | | | | | | | | | | | | |
| NewMarket Corp. | | | 23,040 | | | | 9,071,770 | | | | 1.96 | % |
| The Mosaic Co. | | | 160,550 | | | | 5,424,984 | | | | 1.18 | % |
| | | | | | | | 14,496,754 | | | | 3.14 | % |
| | | | | | | | | | | | | |
| Telecommunication Services – 1.33% | | | | | | | | | | | | |
| Verizon Communications, Inc. | | | 130,918 | | | | 6,137,436 | | | | 1.33 | % |
| | | | | | | | | | | | | |
| Total Common Stocks | | | | | | | | | | | | |
| (Cost $231,034,801) | | | | | | | 279,665,475 | | | | 60.57 | % |
| | | | | | | | | | | | | |
| PREFERRED STOCKS – 1.37% | | | | | | | | | | | | |
| | | | | | | | | | | | | |
| Construction – 0.06% | | | | | | | | | | | | |
| SCE Trust I | | | 11,130 | | | | 285,596 | | | | 0.06 | % |
| | | | | | | | | | | | | |
| Consumer Staples – 0.05% | | | | | | | | | | | | |
| CHS, Inc. | | | 8,885 | | | | 246,736 | | | | 0.05 | % |
| | | | | | | | | | | | | |
| Energy – 0.01% | | | | | | | | | | | | |
| GasLog Ltd. (b) | | | 1,650 | | | | 40,211 | | | | 0.01 | % |
| | | | | | | | | | | | | |
| Financials – 1.25% | | | | | | | | | | | | |
| Aegon N V (b) | | | 3,620 | | | | 92,672 | | | | 0.02 | % |
| Allstate Corp. | | | 10,260 | | | | 278,969 | | | | 0.06 | % |
| Bank of America Corp. | | | 6,655 | | | | 176,624 | | | | 0.04 | % |
| Bank of New York Mellon Corp. | | | 11,070 | | | | 284,388 | | | | 0.06 | % |
| BB&T Corp. | | | 11,420 | | | | 283,559 | | | | 0.06 | % |
| Capital One Financial Corp. | | | 10,990 | | | | 281,674 | | | | 0.06 | % |
| Citigroup, Inc. | | | 6,865 | | | | 172,243 | | | | 0.04 | % |
| Discover Financial Services | | | 10,490 | | | | 279,978 | | | | 0.06 | % |
| Fannie Mae Preferred (a) | | | 10,600 | | | | 50,096 | | | | 0.01 | % |
| First Republic Bank of San Francisco | | | 8,110 | | | | 202,020 | | | | 0.05 | % |
| HSBC Finance Corp. | | | 3,640 | | | | 92,310 | | | | 0.02 | % |
The accompanying notes are an integral part of these financial statements.
| HENNESSY FUNDS | 1-800-966-4354 | |
| PREFERRED STOCKS | | Number of Shares/ | | | | | | % of | |
| | | Par Amount | | | Value | | | Net Assets | |
| Financials (Continued) | | | | | | | | | |
| JPMorgan Chase & Co. (a) | | | 10,985 | | | $ | 276,932 | | | | 0.06 | % |
| KKR Financial Holdings LLC | | | 6,460 | | | | 170,996 | | | | 0.04 | % |
| MetLife, Inc. | | | 11,350 | | | | 277,167 | | | | 0.06 | % |
| Morgan Stanley | | | 6,535 | | | | 174,877 | | | | 0.04 | % |
| Northern Trust Corp. | | | 10,765 | | | | 282,797 | | | | 0.06 | % |
| PNC Financial Services Group, Inc. | | | 11,065 | | | | 280,719 | | | | 0.06 | % |
| RBS Capital Funding Trust V | | | 9,685 | | | | 238,735 | | | | 0.05 | % |
| Regions Financial Corp. | | | 10,865 | | | | 282,490 | | | | 0.06 | % |
| State Street Corp. | | | 10,670 | | | | 284,035 | | | | 0.06 | % |
| SunTrust Banks, Inc. | | | 11,010 | | | | 279,984 | | | | 0.06 | % |
| The Charles Schwab Corp. (a) | | | 10,870 | | | | 281,642 | | | | 0.06 | % |
| The Goldman Sachs Group, Inc. | | | 6,830 | | | | 174,711 | | | | 0.04 | % |
| U.S. Bancorp (d) | | | 11,015 | | | | 279,010 | | | | 0.06 | % |
| Wells Fargo & Co. (a) | | | 10,955 | | | | 283,296 | | | | 0.06 | % |
| | | | | | | | 5,761,924 | | | | 1.25 | % |
| | | | | | | | | | | | | |
| Total Preferred Stocks | | | | | | | | | | | | |
| (Cost $6,432,151) | | | | | | | 6,334,467 | | | | 1.37 | % |
| | | | | | | | | | | | | |
| REITS – 0.22% | | | | | | | | | | | | |
| | | | | | | | | | | | | |
| Financials – 0.22% | | | | | | | | | | | | |
| Apollo Commercial Real Estate Finance, Inc. | | | 28,000 | | | | 465,080 | | | | 0.10 | % |
| Chimera Investment Corp. | | | 39,000 | | | | 549,120 | | | | 0.12 | % |
| | | | | | | | | | | | | |
| Total REITS | | | | | | | | | | | | |
| (Cost $1,056,365) | | | | | | | 1,014,200 | | | | 0.22 | % |
| | | | | | | | | | | | | |
| CORPORATE BONDS – 20.97% | | | | | | | | | | | | |
| | | | | | | | | | | | | |
| Consumer Discretionary – 0.76% | | | | | | | | | | | | |
| Amazon.com, Inc. | | | | | | | | | | | | |
| 3.300%, 12/05/2021 | | | 1,000,000 | | | | 1,040,118 | | | | 0.23 | % |
| 3.800%, 12/05/2024 | | | 800,000 | | | | 836,363 | | | | 0.18 | % |
| Burlington North Santa Fe LLC, 3.400%, 09/01/2024 | | | 1,000,000 | | | | 1,005,835 | | | | 0.22 | % |
| Comcast Corp., 4.950%, 06/15/2016 | | | 600,000 | | | | 615,882 | | | | 0.13 | % |
| | | | | | | | 3,498,198 | | | | 0.76 | % |
The accompanying notes are an integral part of these financial statements.
| CORPORATE BONDS | | Par | | | | | | % of | |
| | | Amount | | | Value | | | Net Assets | |
| Consumer Staples – 1.09% | | | | | | | | | |
| Anheuser-Busch InBev Worldwide, Inc., 7.750%, 01/15/2019 | | | 150,000 | | | $ | 175,264 | | | | 0.04 | % |
| CVS Health Corp. | | | | | | | | | | | | |
| 1.900%, 07/20/2018 | | | 1,300,000 | | | | 1,310,759 | | | | 0.28 | % |
| 2.250%, 12/05/2018 | | | 1,500,000 | | | | 1,521,539 | | | | 0.33 | % |
| 4.125%, 05/15/2021 | | | 1,000,000 | | | | 1,071,807 | | | | 0.23 | % |
| 5.750%, 06/01/2017 | | | 600,000 | | | | 641,674 | | | | 0.14 | % |
| Wal-Mart Stores, Inc., 5.000%, 10/25/2040 | | | 300,000 | | | | 336,229 | | | | 0.07 | % |
| | | | | | | | 5,057,272 | | | | 1.09 | % |
| | | | | | | | | | | | | |
| Energy – 0.71% | | | | | | | | | | | | |
| Canadian Natural Resources Ltd., 3.900%, 02/01/2025 (b) | | | 1,000,000 | | | | 950,890 | | | | 0.21 | % |
| Encana Corp., 3.900%, 11/15/2021 (b) | | | 1,600,000 | | | | 1,489,925 | | | | 0.32 | % |
| Kinder Morgan, Inc., 3.050%, 12/01/2019 | | | 883,000 | | | | 856,740 | | | | 0.18 | % |
| | | | | | | | 3,297,555 | | | | 0.71 | % |
| | | | | | | | | | | | | |
| Financials – 10.89% | | | | | | | | | | | | |
| American Express Co., 6.150%, 08/28/2017 | | | 1,550,000 | | | | 1,676,158 | | | | 0.36 | % |
| American International Group, Inc. | | | | | | | | | | | | |
| 4.875%, 06/01/2022 | | | 1,600,000 | | | | 1,781,869 | | | | 0.39 | % |
| 5.850%, 01/16/2018 | | | 1,075,000 | | | | 1,172,424 | | | | 0.25 | % |
| Associated Banc-Corp, 5.125%, 03/28/2016 | | | 700,000 | | | | 708,749 | | | | 0.15 | % |
| Associates Corporation of North America, 6.950%, 11/01/2018 | | | 300,000 | | | | 341,560 | | | | 0.07 | % |
| Bank of Montreal, 2.500%, 01/11/2017 (b) | | | 400,000 | | | | 407,110 | | | | 0.09 | % |
| Bank of New York Mellon Corp., 1.969%, 06/20/2017 | | | 500,000 | | | | 506,125 | | | | 0.11 | % |
| Bank of Nova Scotia, 2.550%, 01/12/2017 (b) | | | 1,000,000 | | | | 1,017,887 | | | | 0.22 | % |
| BB&T Corp., 2.300%, 10/15/2018 | | | 1,000,000 | | | | 1,012,976 | | | | 0.22 | % |
| BlackRock, Inc., 3.500%, 03/18/2024 | | | 1,000,000 | | | | 1,027,090 | | | | 0.22 | % |
| Boston Properties, Inc., 5.875%, 10/15/2019 | | | 700,000 | | | | 785,303 | | | | 0.17 | % |
| Capital One Financial Corp., 4.750%, 07/15/2021 | | | 1,500,000 | | | | 1,647,287 | | | | 0.36 | % |
| Citigroup, Inc., 6.125%, 11/21/2017 | | | 1,455,000 | | | | 1,583,057 | | | | 0.34 | % |
| Discover Financial Services, 5.200%, 04/27/2022 | | | 900,000 | | | | 965,048 | | | | 0.21 | % |
| Fifth Third Bancorp | | | | | | | | | | | | |
| 1.350%, 06/01/2017 | | | 1,000,000 | | | | 1,000,639 | | | | 0.22 | % |
| 3.625%, 01/25/2016 | | | 700,000 | | | | 704,710 | | | | 0.15 | % |
| First Niagara Financial Group, Inc., 6.750%, 03/19/2020 | | | 590,000 | | | | 665,874 | | | | 0.14 | % |
| Ford Motor Credit Co. LLC, 3.000%, 06/12/2017 | | | 1,750,000 | | | | 1,777,780 | | | | 0.39 | % |
| Franklin Resources, Inc., 1.375%, 09/15/2017 | | | 1,080,000 | | | | 1,082,948 | | | | 0.23 | % |
The accompanying notes are an integral part of these financial statements.
| HENNESSY FUNDS | 1-800-966-4354 | |
| CORPORATE BONDS | | Par | | | | | | % of | |
| | | Amount | | | Value | | | Net Assets | |
| Financials (Continued) | | | | | | | | | |
| General Electric Capital Corp. | | | | | | | | | |
| 1.625%, 04/02/2018 | | | 500,000 | | | $ | 502,541 | | | | 0.11 | % |
| 5.625%, 05/01/2018 | | | 1,050,000 | | | | 1,154,174 | | | | 0.25 | % |
| 6.000%, 08/07/2019 | | | 1,610,000 | | | | 1,847,269 | | | | 0.40 | % |
| JPMorgan Chase & Co., 6.000%, 01/15/2018 | | | 1,000,000 | | | | 1,091,644 | | | | 0.24 | % |
| KeyCorp | | | | | | | | | | | | |
| 2.300%, 12/13/2018 | | | 2,600,000 | | | | 2,618,020 | | | | 0.57 | % |
| 5.100%, 03/24/2021 | | | 950,000 | | | | 1,058,844 | | | | 0.23 | % |
| Lazard Group, 6.850%, 06/15/2017 | | | 56,000 | | | | 60,046 | | | | 0.01 | % |
| Lincoln National Corp., 6.250%, 02/15/2020 | | | 780,000 | | | | 888,690 | | | | 0.19 | % |
| Merrill Lynch & Company, Inc., 6.875%, 04/25/2018 | | | 955,000 | | | | 1,066,545 | | | | 0.23 | % |
| MetLife, Inc., Series A, 6.817%, 08/15/2018 | | | 100,000 | | | | 113,509 | | | | 0.02 | % |
| Morgan Stanley | | | | | | | | | | | | |
| 5.500%, 07/28/2021 | | | 2,333,000 | | | | 2,642,727 | | | | 0.57 | % |
| 6.625%, 04/01/2018 | | | 750,000 | | | | 833,430 | | | | 0.18 | % |
| PNC Financial Services Group, Inc., 1.600%, 06/01/2018 | | | 1,000,000 | | | | 998,552 | | | | 0.22 | % |
| Qwest Capital Funding, Inc., 6.500%, 11/15/2018 | | | 700,000 | | | | 738,500 | | | | 0.16 | % |
| Raymond James Financial, Inc., 5.625%, 04/01/2024 | | | 700,000 | | | | 787,099 | | | | 0.17 | % |
| Royal Bank of Canada, 2.200%, 07/27/2018 (b) | | | 1,000,000 | | | | 1,015,393 | | | | 0.22 | % |
| Schlumberger Investment SA, 3.650%, 12/01/2023 (b) | | | 1,265,000 | | | | 1,316,035 | | | | 0.29 | % |
| St. Paul Travelers, Inc., 5.500%, 12/01/2015 | | | 275,000 | | | | 276,081 | | | | 0.06 | % |
| SunTrust Banks, Inc. | | | | | | | | | | | | |
| 3.600%, 04/15/2016 | | | 250,000 | | | | 252,597 | | | | 0.05 | % |
| 6.000%, 09/11/2017 | | | 250,000 | | | | 269,399 | | | | 0.06 | % |
| Synchrony Financial, 3.750%, 08/15/2021 | | | 1,200,000 | | | | 1,211,738 | | | | 0.26 | % |
| The Bear Stearns Companies, Inc., 6.400%, 10/02/2017 | | | 1,350,000 | | | | 1,470,556 | | | | 0.32 | % |
| The Charles Schwab Corp., 0.850%, 12/04/2015 | | | 1,000,000 | | | | 1,000,440 | | | | 0.22 | % |
| The Goldman Sachs Group, Inc. | | | | | | | | | | | | |
| 5.375%, 03/15/2020 | | | 1,100,000 | | | | 1,229,360 | | | | 0.27 | % |
| 6.000%, 06/15/2020 | | | 1,500,000 | | | | 1,719,375 | | | | 0.37 | % |
| The Hartford Financial Services Group, Inc., 5.375%, 03/15/2017 | | | 300,000 | | | | 315,773 | | | | 0.07 | % |
| The Royal Bank of Scotland PLC, 4.375%, 03/16/2016 (b) | | | 400,000 | | | | 405,097 | | | | 0.09 | % |
| Toronto Dominion Bank, 2.375%, 10/19/2016 (b) | | | 1,000,000 | | | | 1,015,731 | | | | 0.22 | % |
| Wachovia Corp., 5.750%, 06/15/2017 | | | 850,000 | | | | 909,743 | | | | 0.20 | % |
| Wells Fargo & Co., 5.625%, 12/11/2017 | | | 1,000,000 | | | | 1,085,786 | | | | 0.24 | % |
| Westpac Banking Corp., 4.875%, 11/19/2019 (b) | | | 450,000 | | | | 496,791 | | | | 0.11 | % |
| | | | | | | | 50,256,079 | | | | 10.89 | % |
The accompanying notes are an integral part of these financial statements.
| CORPORATE BONDS | | Par | | | | | | % of | |
| | | Amount | | | Value | | | Net Assets | |
| Health Care – 2.18% | | | | | | | | | |
| Agilent Technologies, Inc., 5.000%, 07/15/2020 | | | 650,000 | | | $ | 699,257 | | | | 0.15 | % |
| Amgen, Inc. | | | | | | | | | | | | |
| 3.450%, 10/01/2020 | | | 1,000,000 | | | | 1,045,243 | | | | 0.23 | % |
| 3.625%, 05/22/2024 | | | 1,500,000 | | | | 1,526,964 | | | | 0.33 | % |
| Anthem, Inc., 2.375%, 02/15/2017 | | | 960,000 | | | | 972,002 | | | | 0.21 | % |
| Celgene Corp. | | | | | | | | | | | | |
| 2.300%, 08/15/2018 | | | 1,000,000 | | | | 1,013,264 | | | | 0.22 | % |
| 3.625%, 05/15/2024 | | | 1,600,000 | | | | 1,600,161 | | | | 0.35 | % |
| Express Scripts Holding Co. | | | | | | | | | | | | |
| 1.250%, 06/02/2017 | | | 500,000 | | | | 498,102 | | | | 0.11 | % |
| 2.250%, 06/15/2019 | | | 1,250,000 | | | | 1,250,974 | | | | 0.27 | % |
| 3.500%, 06/15/2024 | | | 700,000 | | | | 692,599 | | | | 0.15 | % |
| GlaxoSmithKline Capital, Inc., 1.500%, 05/08/2017 (b) | | | 500,000 | | | | 503,820 | | | | 0.11 | % |
| UnitedHealth Group, Inc., 5.375%, 03/15/2016 | | | 250,000 | | | | 254,366 | | | | 0.05 | % |
| | | | | | | | 10,056,752 | | | | 2.18 | % |
| | | | | | | | | | | | | |
| Industrials – 0.22% | | | | | | | | | | | | |
| John Deere Capital Corp., 1.850%, 09/15/2016 | | | 1,000,000 | | | | 1,011,241 | | | | 0.22 | % |
| | | | | | | | | | | | | |
| Information Technology – 1.27% | | | | | | | | | | | | |
| Altera Corp., 1.750%, 05/15/2017 | | | 1,000,000 | | | | 1,005,222 | | | | 0.22 | % |
| Applied Materials, Inc., 4.300%, 06/15/2021 | | | 300,000 | | | | 322,581 | | | | 0.07 | % |
| Corning, Inc., 6.850%, 03/01/2029 | | | 275,000 | | | | 347,271 | | | | 0.07 | % |
| eBay, Inc., 3.250%, 10/15/2020 | | | 1,000,000 | | | | 1,013,699 | | | | 0.22 | % |
| EMC Corp., 1.875%, 06/01/2018 | | | 1,000,000 | | | | 956,334 | | | | 0.21 | % |
| Juniper Networks, Inc., 4.600%, 03/15/2021 | | | 1,000,000 | | | | 1,042,520 | | | | 0.22 | % |
| QUALCOMM, Inc. | | | | | | | | | | | | |
| 2.250%, 05/20/2020 | | | 600,000 | | | | 597,224 | | | | 0.13 | % |
| 3.000%, 05/20/2022 | | | 600,000 | | | | 593,010 | | | | 0.13 | % |
| | | | | | | | 5,877,861 | | | | 1.27 | % |
| | | | | | | | | | | | | |
| Manufacturing – 0.28% | | | | | | | | | | | | |
| Teva Pharmaceutical Financial Co. BV, 2.950%, 12/18/2022 (b) | | | 1,380,000 | | | | 1,299,161 | | | | 0.28 | % |
| | | | | | | | | | | | | |
| Materials – 1.56% | | | | | | | | | | | | |
| Alcoa, Inc., 6.150%, 08/15/2020 | | | 625,000 | | | | 661,719 | | | | 0.14 | % |
| AngloGold Ashanti Holdings PLC, 5.125%, 08/01/2022 (b) | | | 1,000,000 | | | | 915,625 | | | | 0.20 | % |
| Goldcorp, Inc. (b) | | | | | | | | | | | | |
| 2.125%, 03/15/2018 | | | 1,250,000 | | | | 1,230,909 | | | | 0.27 | % |
| 3.625%, 06/09/2021 | | | 750,000 | | | | 736,401 | | | | 0.16 | % |
| Newmont Mining Corp., 3.500%, 03/15/2022 | | | 1,000,000 | | | | 924,398 | | | | 0.20 | % |
The accompanying notes are an integral part of these financial statements.
| HENNESSY FUNDS | 1-800-966-4354 | |
| CORPORATE BONDS | | Par | | | | | | % of | |
| | | Amount | | | Value | | | Net Assets | |
| Materials (Continued) | | | | | | | | | |
| Rio Tinto Finance USA PLC (b) | | | | | | | | | |
| 1.375%, 06/17/2016 | | | 1,000,000 | | | $ | 1,001,806 | | | | 0.22 | % |
| 2.000%, 03/22/2017 | | | 640,000 | | | | 642,876 | | | | 0.14 | % |
| The Dow Chemical Co., 4.250%, 11/15/2020 | | | 1,000,000 | | | | 1,077,004 | | | | 0.23 | % |
| | | | | | | | 7,190,738 | | | | 1.56 | % |
| | | | | | | | | | | | | |
| Telecommunication Services – 2.01% | | | | | | | | | | | | |
| AT&T, Inc. | | | | | | | | | | | | |
| 3.000%, 02/15/2022 | | | 1,000,000 | | | | 988,450 | | | | 0.21 | % |
| 5.350%, 09/01/2040 | | | 200,000 | | | | 200,021 | | | | 0.04 | % |
| 5.500%, 02/01/2018 | | | 1,600,000 | | | | 1,732,029 | | | | 0.38 | % |
| 5.800%, 02/15/2019 | | | 800,000 | | | | 890,421 | | | | 0.19 | % |
| CenturyLink, Inc., 5.150%, 06/15/2017 | | | 400,000 | | | | 415,500 | | | | 0.09 | % |
| Deutsche Telekom AG, 6.000%, 07/08/2019 (b) | | | 1,160,000 | | | | 1,312,493 | | | | 0.28 | % |
| Verizon Communications, Inc. | | | | | | | | | | | | |
| 2.450%, 11/01/2022 | | | 1,200,000 | | | | 1,157,608 | | | | 0.25 | % |
| 6.350%, 04/01/2019 | | | 1,400,000 | | | | 1,592,396 | | | | 0.35 | % |
| Vodafone Group PLC, 1.500%, 02/19/2018 (b) | | | 1,000,000 | | | | 995,336 | | | | 0.22 | % |
| | | | | | | | 9,284,254 | | | | 2.01 | % |
| | | | | | | | | | | | | |
| Total Corporate Bonds | | | | | | | | | | | | |
| (Cost $96,375,621) | | | | | | | 96,829,111 | | | | 20.97 | % |
| | | | | | | | | | | | | |
| MORTGAGE BACKED SECURITIES – 4.82% | | | | | | | | | | | | |
| Federal Home Loan Mortgage Corp. | | | | | | | | | | | | |
| 3.000%, 05/01/2042 | | | 1,289,939 | | | | 1,305,180 | | | | 0.28 | % |
| 3.000%, 09/01/2042 | | | 2,432,667 | | | | 2,461,023 | | | | 0.53 | % |
| 5.000%, 05/01/2020 | | | 76,772 | | | | 80,504 | | | | 0.02 | % |
| 5.500%, 04/01/2037 | | | 146,311 | | | | 165,710 | | | | 0.04 | % |
| Federal National Mortgage Association | | | | | | | | | | | | |
| 0.000%, 10/29/2018 | | | 1,550,000 | | | | 1,548,749 | | | | 0.34 | % |
| 1.000%, 03/18/2025 | | | 2,000,000 | | | | 2,003,814 | | | | 0.43 | % |
| 1.000%, 01/30/2030 | | | 2,000,000 | | | | 1,996,110 | | | | 0.43 | % |
| 1.250%, 06/25/2043 | | | 361,998 | | | | 346,475 | | | | 0.07 | % |
| 1.750%, 02/16/2043 | | | 539,945 | | | | 536,162 | | | | 0.12 | % |
| 2.000%, 12/30/2024 | | | 1,200,000 | | | | 1,195,433 | | | | 0.26 | % |
| 2.000%, 05/23/2033 | | | 1,500,000 | | | | 1,500,622 | | | | 0.33 | % |
| 2.000%, 11/25/2041 | | | 196,775 | | | | 196,899 | | | | 0.04 | % |
| 2.250%, 03/25/2039 | | | 223,110 | | | | 226,445 | | | | 0.05 | % |
| 2.400%, 11/07/2024 | | | 1,000,000 | | | | 981,836 | | | | 0.21 | % |
| 2.750%, 01/15/2041 | | | 170,309 | | | | 173,025 | | | | 0.04 | % |
| 3.000%, 09/15/2039 | | | 590,788 | | | | 610,238 | | | | 0.13 | % |
| 3.000%, 10/01/2043 | | | 3,586,498 | | | | 3,635,384 | | | | 0.79 | % |
| 3.500%, 01/01/2042 | | | 769,692 | | | | 803,104 | | | | 0.17 | % |
| 4.000%, 10/01/2041 | | | 1,121,130 | | | | 1,197,113 | | | | 0.26 | % |
The accompanying notes are an integral part of these financial statements.
| MORTGAGE BACKED SECURITIES | | Par | | | | | | % of | |
| | | Amount | | | Value | | | Net Assets | |
| Federal National Mortgage Association (Continued) | | | | | | | | | |
| 4.000%, 12/01/2041 | | | 940,840 | | | $ | 1,004,794 | | | | 0.22 | % |
| 4.500%, 08/01/2020 | | | 83,366 | | | | 86,989 | | | | 0.02 | % |
| 6.000%, 10/01/2037 | | | 161,654 | | | | 183,619 | | | | 0.04 | % |
| Total Mortgage Backed Securities | | | | | | | | | | | | |
| (Cost $22,142,884) | | | | | | | 22,239,228 | | | | 4.82 | % |
| | | | | | | | | | | | | |
| U.S. TREASURY OBLIGATIONS – 8.89% | | | | | | | | | | | | |
| | | | | | | | | | | | | |
| U.S. Treasury Bonds – 0.69% | | | | | | | | | | | | |
| U.S. Treasury Bonds, 3.625%, 02/15/2044 | | | 2,750,000 | | | | 3,140,013 | | | | 0.68 | % |
| U.S. Treasury Inflation Index Bond, 0.125%, 07/15/2022 | | | 25,908 | | | | 25,335 | | | | 0.01 | % |
| | | | | | | | 3,165,348 | | | | 0.69 | % |
| | | | | | | | | | | | | |
| U.S. Treasury Notes – 8.20% | | | | | | | | | | | | |
| U.S. Treasury Notes | | | | | | | | | | | | |
| 1.625%, 04/30/2019 | | | 260,000 | | | | 263,600 | | | | 0.06 | % |
| 1.625%, 06/30/2019 | | | 4,000,000 | | | | 4,050,312 | | | | 0.88 | % |
| 1.750%, 04/30/2022 | | | 2,700,000 | | | | 2,683,741 | | | | 0.58 | % |
| 2.125%, 05/15/2025 | | | 3,750,000 | | | | 3,742,748 | | | | 0.81 | % |
| 2.250%, 07/31/2021 | | | 1,100,000 | | | | 1,133,279 | | | | 0.24 | % |
| 2.375%, 03/31/2016 | | | 4,955,000 | | | | 4,999,422 | | | | 1.08 | % |
| 2.500%, 08/15/2023 | | | 2,335,000 | | | | 2,423,597 | | | | 0.53 | % |
| 2.750%, 02/15/2024 | | | 8,550,000 | | | | 9,016,411 | | | | 1.95 | % |
| 3.250%, 03/31/2017 | | | 9,200,000 | | | | 9,545,092 | | | | 2.07 | % |
| | | | | | | | 37,858,202 | | | | 8.20 | % |
| | | | | | | | | | | | | |
| Total U.S. Treasury Obligations | | | | | | | | | | | | |
| (Cost $40,915,051) | | | | | | | 41,023,550 | | | | 8.89 | % |
| | | | | | | | | | | | | |
| U.S. GOVERNMENT AGENCY ISSUES – 0.14% | | | | | | | | | | | | |
| | | | | | | | | | | | | |
| Finance and Insurance – 0.14% | | | | | | | | | | | | |
| Federal Home Loan Banks, 5.750%, 06/15/2037 | | | 600,000 | | | | 644,311 | | | | 0.14 | % |
| | | | | | | | | | | | | |
| Total U.S. Government Agency Issues | | | | | | | | | | | | |
| (Cost $644,311) | | | | | | | 644,311 | | | | 0.14 | % |
| | | | | | | | | | | | | |
| INVESTMENT COMPANIES (EXCLUDING | | | | | | | | | | | | |
| MONEY MARKET FUNDS) – 1.89% | | | | | | | | | | | | |
| | | | | | | | | | | | | |
| Alerian MLP ETF | | | 36,700 | | | | 498,753 | | | | 0.11 | % |
| Apollo Investment Corp. | | | 90,000 | | | | 480,600 | | | | 0.10 | % |
| Ares Capital Corp. | | | 40,000 | | | | 609,200 | | | | 0.13 | % |
| Calamos Convertible Opportunity and Income Fund | | | 16,000 | | | | 166,560 | | | | 0.04 | % |
The accompanying notes are an integral part of these financial statements.
| HENNESSY FUNDS | 1-800-966-4354 | |
| INVESTMENT COMPANIES (EXCLUDING | | Par Amount/ | | | | | | % of | |
| MONEY MARKET FUNDS) | | Number of Shares | | | Value | | | Net Assets | |
| | | | | | | | | | | | | |
| Fifth Street Finance Corp. | | | 89,500 | | | $ | 512,835 | | | | 0.11 | % |
| FS Investment Corp. | | | 50,000 | | | | 488,000 | | | | 0.10 | % |
| Guggenheim Credit Allocation Fund | | | 29,000 | | | | 588,990 | | | | 0.13 | % |
| iShares iBoxx $High Yield Corporation Bond Fund | | | 15,900 | | | | 1,360,563 | | | | 0.30 | % |
| Oha Investment Corp. | | | 8,000 | | | | 34,320 | | | | 0.01 | % |
| PennantPark Investment Corp. | | | 62,000 | | | | 428,420 | | | | 0.09 | % |
| SPDR Barclays Capital High Yield Bond | | | 52,600 | | | | 1,918,322 | | | | 0.42 | % |
| SPDR Barclays Short Term High Yield | | | 59,700 | | | | 1,629,810 | | | | 0.35 | % |
| | | | | | | | | | | | | |
| Total Investment Companies (Excluding | | | | | | | | | | | | |
| Money Market Funds) | | | | | | | | | | | | |
| (Cost $9,651,004) | | | | | | | 8,716,373 | | | | 1.89 | % |
| | | | | | | | | | | | | |
| SHORT-TERM INVESTMENTS – 1.26% | | | | | | | | | | | | |
| | | | | | | | | | | | | |
| Money Market Funds – 1.26% | | | | | | | | | | | | |
| Fidelity Government Portfolio – Institutional Class, 0.01% (c) | | | 5,823,275 | | | | 5,823,275 | | | | 1.26 | % |
| | | | | | | | | | | | | |
| Total Short-Term Investments | | | | | | | | | | | | |
| (Cost $5,823,275) | | | | | | | 5,823,275 | | | | 1.26 | % |
| | | | | | | | | | | | | |
| Total Investments | | | | | | | | | | | | |
| (Cost $414,075,463) – 100.13% | | | | | | | 462,289,990 | | | | 100.13 | % |
| Other Assets in | | | | | | | | | | | | |
| Excess of Liabilities – (0.13)% | | | | | | | (607,604 | ) | | | (0.13 | )% |
TOTAL NET ASSETS – 100.00% | | | | | | $ | 461,682,386 | | | | 100.00 | % |
Percentages are stated as a percent of net assets.
REIT – Real Estate Investment Trust
| (a) | Non-income producing security. |
| (b) | U.S. traded security of a foreign corporation. |
| (c) | The rate listed is the fund’s 7-day yield as of October 31, 2015. |
| (d) | Investment in affiliated security. Quasar Distributors, LLC, which serves as the Fund’s distributor, is a subsidiary of U.S. Bancorp. Details of transactions with this affiliated company for the period ended October 31, 2015, are as follows: |
| | Issuer | | U.S. Bancorp | |
| | Beginning Cost | | $ | — | |
| | Purchase Cost | | $ | 269,800 | |
| | Sales Cost | | $ | — | |
| | Ending Cost | | $ | 269,800 | |
| | Dividend Income | | $ | 9,088 | |
| | Shares | | | 11,015 | |
| | Market Value | | $ | 279,010 | |
The accompanying notes are an integral part of these financial statements.
Summary of Fair Value Exposure at October 31, 2015
The following is a summary of the inputs used to value the Fund’s net assets as of October 31, 2015 (see Note 3 in the accompanying notes to the financial statements):
| Common Stocks | | Level 1 | | | Level 2 | | | Level 3 | | | Total | |
| Consumer Discretionary | | $ | 58,352,689 | | | $ | — | | | $ | — | | | $ | 58,352,689 | |
| Consumer Staples | | | 29,398,246 | | | | — | | | | — | | | | 29,398,246 | |
| Energy | | | 11,821,159 | | | | — | | | | — | | | | 11,821,159 | |
| Financials | | | 53,727,966 | | | | — | | | | — | | | | 53,727,966 | |
| Health Care | | | 30,762,684 | | | | — | | | | — | | | | 30,762,684 | |
| Industrials | | | 36,653,488 | | | | — | | | | — | | | | 36,653,488 | |
| Information Technology | | | 38,315,053 | | | | — | | | | — | | | | 38,315,053 | |
| Materials | | | 14,496,754 | | | | — | | | | — | | | | 14,496,754 | |
| Telecommunication Services | | | 6,137,436 | | | | — | | | | — | | | | 6,137,436 | |
| Total Common Stocks | | $ | 279,665,475 | | | $ | — | | | $ | — | | | $ | 279,665,475 | |
| Preferred Stocks | | | | | | | | | | | | | | | | |
| Construction | | $ | 285,596 | | | $ | — | | | $ | — | | | $ | 285,596 | |
| Consumer Staples | | | 246,736 | | | | — | | | | — | | | | 246,736 | |
| Energy | | | 40,211 | | | | — | | | | — | | | | 40,211 | |
| Financials | | | 5,761,924 | | | | — | | | | — | | | | 5,761,924 | |
| Total Preferred Stocks | | $ | 6,334,467 | | | $ | — | | | $ | — | | | $ | 6,334,467 | |
| REITS | | | | | | | | | | | | | | | | |
| Financials | | $ | 1,014,200 | | | $ | — | | | $ | — | | | $ | 1,014,200 | |
| Total REITS | | $ | 1,014,200 | | | $ | — | | | $ | — | | | $ | 1,014,200 | |
| Corporate Bonds | | | | | | | | | | | | | | | | |
| Consumer Discretionary | | $ | — | | | $ | 3,498,198 | | | $ | — | | | $ | 3,498,198 | |
| Consumer Staples | | | — | | | | 5,057,272 | | | | — | | | | 5,057,272 | |
| Energy | | | — | | | | 3,297,555 | | | | — | | | | 3,297,555 | |
| Financials | | | — | | | | 50,256,079 | | | | — | | | | 50,256,079 | |
| Health Care | | | — | | | | 10,056,752 | | | | — | | | | 10,056,752 | |
| Industrials | | | — | | | | 1,011,241 | | | | — | | | | 1,011,241 | |
| Information Technology | | | — | | | | 5,877,861 | | | | — | | | | 5,877,861 | |
| Manufacturing | | | — | | | | 1,299,161 | | | | — | | | | 1,299,161 | |
| Materials | | | — | | | | 7,190,738 | | | | — | | | | 7,190,738 | |
| Telecommunication Services | | | — | | | | 9,284,254 | | | | — | | | | 9,284,254 | |
| Total Corporate Bonds | | $ | — | | | $ | 96,829,111 | | | $ | — | | | $ | 96,829,111 | |
| Mortgage Backed Securities | | $ | — | | | $ | 22,239,228 | | | $ | — | | | $ | 22,239,228 | |
| U.S. Treasury Obligations | | | | | | | | | | | | | | | | |
| U.S. Treasury Bonds | | $ | — | | | $ | 3,165,348 | | | $ | — | | | $ | 3,165,348 | |
| U.S. Treasury Notes | | | — | | | | 37,858,202 | | | | — | | | | 37,858,202 | |
| Total U.S. Treasury Obligations | | $ | — | | | $ | 41,023,550 | | | $ | — | | | $ | 41,023,550 | |
| U.S. Government Agency Issues | | $ | — | | | $ | 644,311 | | | $ | — | | | $ | 644,311 | |
| Investment Companies (Excluding | | | | | | | | | | | | | | | | |
| Money Market Funds) | | $ | 8,716,373 | | | $ | — | | | $ | — | | | $ | 8,716,373 | |
| Short-Term Investments | | | | | | | | | | | | | | | | |
| Money Market Funds | | $ | 5,823,275 | | | $ | — | | | $ | — | | | $ | 5,823,275 | |
| Total Short-Term Investments | | $ | 5,823,275 | | | $ | — | | | $ | — | | | $ | 5,823,275 | |
| Total Investments | | $ | 301,553,790 | | | $ | 160,736,200 | | | $ | — | | | $ | 462,289,990 | |
Transfers between levels are recognized at the end of the reporting period. During the year ended October 31, 2015, the Fund recognized no transfers between levels.
The accompanying notes are an integral part of these financial statements.
| HENNESSY FUNDS | 1-800-966-4354 | |
Financial Statements
Statement of Assets and Liabilities as of October 31, 2015 |
| ASSETS: | | | |
| Investments in securities, at value (cost $413,805,663) | | $ | 462,010,980 | |
| Investments in affiliated securities, at value (cost $269,800) | | | 279,010 | |
| Total investments in securities (cost $414,075,463) | | | 462,289,990 | |
| Dividends and interest receivable | | | 1,712,508 | |
| Receivable for fund shares sold | | | 566,058 | |
| Prepaid expenses and other assets | | | 37,950 | |
| Total Assets | | | 464,606,506 | |
| | | | | |
| LIABILITIES: | | | | |
| Payable for securities purchased | | | 1,549,135 | |
| Payable for fund shares redeemed | | | 797,990 | |
| Payable to advisor | | | 313,683 | |
| Payable to administrator | | | 78,367 | |
| Payable to auditor | | | 20,299 | |
| Accrued distribution fees | | | 39,341 | |
| Accrued service fees | | | 24,751 | |
| Accrued trustees fees | | | 2,406 | |
| Accrued expenses and other payables | | | 98,148 | |
| Total Liabilities | | | 2,924,120 | |
| NET ASSETS | | $ | 461,682,386 | |
| | | | | |
| NET ASSETS CONSIST OF: | | | | |
| Capital stock | | $ | 402,404,737 | |
| Accumulated net investment income | | | 243,451 | |
| Accumulated net realized gain on investments | | | 10,819,671 | |
| Unrealized net appreciation on investments | | | 48,214,527 | |
| Total Net Assets | | $ | 461,682,386 | |
| | | | | |
| NET ASSETS | | | | |
| Investor Class: | | | | |
| Shares authorized (no par value) | | Unlimited | |
| Net assets applicable to outstanding Investor Class shares | | $ | 292,844,556 | |
| Shares issued and outstanding | | | 18,137,040 | |
| Net asset value, offering price and redemption price per share | | $ | 16.15 | |
| | | | | |
| Institutional Class: | | | | |
| Shares authorized (no par value) | | Unlimited | |
| Net assets applicable to outstanding Institutional Class shares | | $ | 168,837,830 | |
| Shares issued and outstanding | | | 11,050,670 | |
| Net asset value, offering price and redemption price per share | | $ | 15.28 | |
The accompanying notes are an integral part of these financial statements.
Financial Statements
Statement of Operations for the year ended October 31, 2015 |
| INVESTMENT INCOME: | | | |
| Dividend income from unaffiliated securities | | $ | 6,831,825 | |
| Dividend income from affiliated securities | | | 9,088 | |
| Interest income | | | 3,727,690 | |
| Total investment income | | | 10,568,603 | |
| | | | | |
| EXPENSES: | | | | |
| Investment advisory fees (See Note 5) | | | 3,815,410 | |
| Sub-transfer agent expenses – Investor Class (See Note 5) | | | 634,638 | |
| Sub-transfer agent expenses – Institutional Class (See Note 5) | | | 149,954 | |
| Distribution fees – Investor Class (See Note 5) | | | 600,733 | |
| Administration, fund accounting, custody and transfer agent fees (See Note 5) | | | 475,078 | |
| Service fees – Investor Class (See Note 5) | | | 224,909 | |
| Reports to shareholders | | | 38,874 | |
| Federal and state registration fees | | | 38,060 | |
| Compliance expense | | | 22,186 | |
| Audit fees | | | 20,893 | |
| Trustees’ fees and expenses | | | 12,878 | |
| Legal fees | | | 5,501 | |
| Interest expense (See Note 6) | | | 34 | |
| Other expenses | | | 26,625 | |
| Total expenses before recoupment from advisor | | | 6,065,773 | |
| Expense recoupment by advisor – Investor Class | | | 23,335 | |
| Net expenses | | | 6,089,108 | |
| NET INVESTMENT INCOME | | $ | 4,479,495 | |
| | | | | |
| REALIZED AND UNREALIZED GAINS (LOSSES): | | | | |
| Net realized gain on investments | | $ | 10,940,484 | |
| Net change in unrealized depreciation on investments | | | (11,492,039 | ) |
| Net loss on investments | | | (551,555 | ) |
| NET INCREASE IN NET ASSETS RESULTING FROM OPERATIONS | | $ | 3,927,940 | |
The accompanying notes are an integral part of these financial statements.
| HENNESSY FUNDS | 1-800-966-4354 | |
(This Page Intentionally Left Blank.)
Financial Statements
| Statements of Changes in Net Assets |
| | | Year Ended | | | Year Ended | |
| | | October 31, 2015 | | | October 31, 2014 | |
| OPERATIONS: | | | | | | |
| Net investment income | | $ | 4,479,495 | | | $ | 3,676,837 | |
| Net realized gain on investments | | | 10,940,484 | | | | 15,504,616 | |
| Net change in unrealized appreciation (depreciation) | | | | | | | | |
| on investments | | | (11,492,039 | ) | | | 14,585,293 | |
| Net increase in net assets resulting from operations | | | 3,927,940 | | | | 33,766,746 | |
| | | | | | | | | |
| DISTRIBUTIONS TO SHAREHOLDERS FROM: | | | | | | | | |
| Net investment income – Investor Class | | | (2,652,418 | ) | | | (2,501,276 | ) |
| Net investment income – Institutional Class | | | (1,838,359 | ) | | | (1,216,647 | ) |
| Net realized gains – Investor Class | | | (11,372,184 | ) | | | (7,388,837 | ) |
| Net realized gains – Institutional Class | | | (4,128,029 | ) | | | (2,912,412 | ) |
| Total distributions | | | (19,990,990 | ) | | | (14,019,172 | ) |
| | | | | | | | | |
| CAPITAL SHARE TRANSACTIONS: | | | | | | | | |
| Proceeds from shares subscribed – Investor Class | | | 135,379,984 | | | | 89,438,072 | |
| Proceeds from shares subscribed – Institutional Class | | | 108,112,772 | | | | 33,413,966 | |
| Dividends reinvested – Investor Class | | | 13,787,702 | | | | 9,653,413 | |
| Dividends reinvested – Institutional Class | | | 4,360,249 | | | | 2,948,861 | |
| Cost of shares redeemed – Investor Class | | | (129,944,959 | ) | | | (62,677,527 | )(1) |
| Cost of shares redeemed – Institutional Class | | | (40,503,901 | ) | | | (24,337,024 | ) |
| Net increase in net assets derived | | | | | | | | |
| from capital share transactions | | | 91,191,847 | | | | 48,439,761 | |
| TOTAL INCREASE IN NET ASSETS | | | 75,128,797 | | | | 68,187,335 | |
| | | | | | | | | |
| NET ASSETS: | | | | | | | | |
| Beginning of year | | | 386,553,589 | | | | 318,366,254 | |
| End of year | | $ | 461,682,386 | | | $ | 386,553,589 | |
| Undistributed net investment income, end of year | | $ | 243,451 | | | $ | 225,718 | |
| | | | | | | | | |
| CHANGES IN SHARES OUTSTANDING: | | | | | | | | |
| Shares sold – Investor Class | | | 8,189,500 | | | | 5,597,992 | |
| Shares sold – Institutional Class | | | 6,931,570 | | | | 2,204,175 | |
| Shares issued to holders as reinvestment | | | | | | | | |
| of dividends – Investor Class | | | 839,879 | | | | 620,329 | |
| Shares issued to holders as reinvestment | | | | | | | | |
| of dividends – Institutional Class | | | 281,456 | | | | 199,624 | |
| Shares redeemed – Investor Class | | | (7,942,623 | ) | | | (3,961,896 | ) |
| Shares redeemed – Institutional Class | | | (2,624,280 | ) | | | (1,628,945 | ) |
| Net increase in shares outstanding | | | 5,675,502 | | | | 3,031,279 | |
(1) | Net of redemption fees of $105 related to redemption fees imposed by the FBR Balanced Fund during a prior year but not received until the fiscal year ended October 31, 2014. |
The accompanying notes are an integral part of these financial statements.
| HENNESSY FUNDS | 1-800-966-4354 | |
Financial Statements
For an Investor Class share outstanding throughout each year
PER SHARE DATA:
Net asset value, beginning of year
Income from investment operations:
Net investment income
Net realized and unrealized gains on investments
Total from investment operations
Less distributions:
Dividends from net investment income
Dividends from net realized gains
Total distributions
Net asset value, end of year
TOTAL RETURN
SUPPLEMENTAL DATA AND RATIOS:
Net assets, end of year (millions)
Ratio of expenses to average net assets:
Before expense reimbursement/recoupment
After expense reimbursement/recoupment
Ratio of net investment income to average net assets:
Before expense reimbursement/recoupment
After expense reimbursement/recoupment
Portfolio turnover rate(2)
(1) | Calculated based on average shares outstanding method. |
(2) | Portfolio turnover is calculated on the basis of the Fund as a whole. |
The accompanying notes are an integral part of these financial statements.
| Year Ended October 31, | |
| 2015 | | | 2014 | | | 2013 | | | 2012 | | | 2011 | |
| | | | | | | | | | | | | |
| $ | 16.68 | | | $ | 15.77 | | | $ | 13.96 | | | $ | 12.99 | | | $ | 11.93 | |
| | | | | | | | | | | | | | | | | | | |
| | 0.13 | | | | 0.16 | | | | 0.23 | | | | 0.18 | | | | 0.29 | (1) |
| | 0.11 | | | | 1.41 | | | | 1.81 | | | | 0.99 | | | | 1.04 | |
| | 0.24 | | | | 1.57 | | | | 2.04 | | | | 1.17 | | | | 1.33 | |
| | | | | | | | | | | | | | | | | | | |
| | (0.13 | ) | | | (0.16 | ) | | | (0.23 | ) | | | (0.20 | ) | | | (0.27 | ) |
| | (0.64 | ) | | | (0.50 | ) | | | — | | | | — | | | | — | |
| | (0.77 | ) | | | (0.66 | ) | | | (0.23 | ) | | | (0.20 | ) | | | (0.27 | ) |
| $ | 16.15 | | | $ | 16.68 | | | $ | 15.77 | | | $ | 13.96 | | | $ | 12.99 | |
| | | | | | | | | | | | | | | | | | | |
| | 1.43 | % | | | 10.28 | % | | | 14.72 | % | | | 9.01 | % | | | 11.30 | % |
| | | | | | | | | | | | | | | | | | | |
| $ | 292.84 | | | $ | 284.45 | | | $ | 233.25 | | | $ | 196.92 | | | $ | 56.75 | |
| | 1.38 | % | | | 1.33 | % | | | 1.36 | % | | | 1.33 | % | | | 1.54 | % |
| | 1.38 | % | | | 1.33 | % | | | 1.33 | % | | | 1.24 | % | | | 1.24 | % |
| | | | | | | | | | | | | | | | | | | |
| | 0.83 | % | | | 1.01 | % | | | 1.51 | % | | | 1.37 | % | | | 2.03 | % |
| | 0.83 | % | | | 1.01 | % | | | 1.54 | % | | | 1.46 | % | | | 2.33 | % |
| | 39 | % | | | 28 | % | | | 52 | % | | | 34 | % | | | 35 | % |
The accompanying notes are an integral part of these financial statements.
| HENNESSY FUNDS | 1-800-966-4354 | |
Financial Statements
For an Institutional Class share outstanding throughout each year
PER SHARE DATA:
Net asset value, beginning of year
Income from investment operations:
Net investment income
Net realized and unrealized gains on investments
Total from investment operations
Less distributions:
Dividends from net investment income
Dividends from net realized gains
Total distributions
Net asset value, end of year
TOTAL RETURN
SUPPLEMENTAL DATA AND RATIOS:
Net assets, end of year (millions)
Ratio of expenses to average net assets:
Before expense reimbursement
After expense reimbursement
Ratio of net investment income to average net assets:
Before expense reimbursement
After expense reimbursement
Portfolio turnover rate(2)
(1) | Calculated based on average shares outstanding method. |
(2) | Portfolio turnover is calculated on the basis of the Fund as a whole. |
The accompanying notes are an integral part of these financial statements.
| Year Ended October 31, | |
| 2015 | | | 2014 | | | 2013 | | | 2012 | | | 2011 | |
| | | | | | | | | | | | | |
| $ | 15.80 | | | $ | 14.97 | | | $ | 13.29 | | | $ | 12.38 | | | $ | 11.38 | |
| | | | | | | | | | | | | | | | | | | |
| | | | | | | | | | | | | | | | | | | |
| | 0.19 | | | | 0.20 | | | | 0.25 | | | | 0.22 | | | | 0.32 | (1) |
| | 0.09 | | | | 1.33 | | | | 1.72 | | | | 0.92 | | | | 0.99 | |
| | 0.28 | | | | 1.53 | | | | 1.97 | | | | 1.14 | | | | 1.31 | |
| | | | | | | | | | | | | | | | | | | |
| | | | | | | | | | | | | | | | | | | |
| | (0.19 | ) | | | (0.20 | ) | | | (0.29 | ) | | | (0.23 | ) | | | (0.31 | ) |
| | (0.61 | ) | | | (0.50 | ) | | | — | | | | — | | | | — | |
| | (0.80 | ) | | | (0.70 | ) | | | (0.29 | ) | | | (0.23 | ) | | | (0.31 | ) |
| $ | 15.28 | | | $ | 15.80 | | | $ | 14.97 | | | $ | 13.29 | | | $ | 12.38 | |
| | | | | | | | | | | | | | | | | | | |
| | 1.75 | % | | | 10.60 | % | | | 14.99 | % | | | 9.23 | % | | | 11.62 | % |
| | | | | | | | | | | | | | | | | | | |
| | | | | | | | | | | | | | | | | | | |
| $ | 168.84 | | | $ | 102.10 | | | $ | 85.12 | | | $ | 108.49 | | | $ | 55.28 | |
| | | | | | | | | | | | | | | | | | | |
| | 1.04 | % | | | 1.05 | % | | | 1.06 | % | | | 1.06 | % | | | 1.12 | % |
| | 1.04 | % | | | 1.05 | % | | | 1.06 | % | | | 0.99 | % | | | 0.99 | % |
| | | | | | | | | | | | | | | | | | | |
| | 1.18 | % | | | 1.29 | % | | | 1.95 | % | | | 1.68 | % | | | 2.56 | % |
| | 1.18 | % | | | 1.29 | % | | | 1.95 | % | | | 1.75 | % | | | 2.69 | % |
| | 39 | % | | | 28 | % | | | 52 | % | | | 34 | % | | | 35 | % |
The accompanying notes are an integral part of these financial statements.
| HENNESSY FUNDS | 1-800-966-4354 | |
Financial Statements
Notes to the Financial Statements October 31, 2015 |
1). ORGANIZATION
The Hennessy Equity and Income Fund (the “Fund”) is a series of Hennessy Funds Trust (the “Trust”), which was organized as a Delaware statutory trust on September 17, 1992. The Fund is an open-end management investment company registered under the Investment Company Act of 1940, as amended. The Fund is a successor to the FBR Balanced Fund (the “Predecessor FBR Fund”), a series of The FBR Funds, a Delaware statutory trust, pursuant to a reorganization that took place after the close of business on October 26, 2012. Prior to October 26, 2012, the Fund had no investment operations. As a result of the reorganization, holders of the Investor Class shares of the Predecessor FBR Fund received Investor Class shares of the Fund (the Investor Class shares of the Fund are the successor to the accounting and performance information of the Predecessor FBR Fund), and holders of the Institutional Class shares of the Predecessor FBR Fund received Institutional Class shares of the Fund (the Institutional Class shares of the Fund are the successor to the accounting and performance information of the Predecessor FBR Fund). The investment objective of the Fund is long-term capital growth and current income. The Fund is a diversified fund.
The Fund offers Investor Class and Institutional Class shares. Each class of shares differs principally in its respective administration, 12b-1 distribution and service, shareholder servicing, and transfer agent expenses and sales charges, if any. Each class has identical rights to earnings, assets, and voting privileges, except for class-specific expenses and exclusive rights to vote on matters affecting only an individual class.
As an investment company, the Fund follows the investment company accounting and reporting guidance of the Financial Accounting Standards Board (“FASB”) Accounting Standard Codification Topic 946 “Financial Services—Investment Companies.”
2). SIGNIFICANT ACCOUNTING POLICIES
The following is a summary of significant accounting policies consistently followed by the Fund in the preparation of the financial statements. These policies are in conformity with U.S. generally accepted accounting principles (“GAAP”).
| a). | Investment Valuation – All investments in securities are recorded at their estimated fair value, as described in Note 3. |
| | |
| b). | Federal Income Taxes – Provision for federal income taxes or excise taxes has not been made since the Fund has elected to be taxed as a “regulated investment company” and intends to distribute substantially all of its taxable income to its shareholders and otherwise comply with the provisions of the Internal Revenue Code of 1986, as amended, applicable to regulated investment companies. Net investment income or loss and realized gains and losses for federal income tax purposes may differ from that reported on the financial statements because of temporary book and tax basis differences. Temporary differences are primarily the result of the treatment of wash sales for tax reporting purposes. The Fund recognizes interest and penalties related to income tax benefits, if any, in the statement of operations as an income tax expense. Distributions from net realized gains for book purposes may include short-term capital gains, which are included as ordinary income to shareholders for tax purposes. |
| | Due to inherent differences in the recognition of income, expenses, and realized gains/losses under GAAP and federal income tax regulations, permanent differences between book and tax basis reporting for the 2015 fiscal year have been identified and appropriately reclassified on the Statement of Assets and Liabilities. The adjustments are as follows: |
| Undistributed | Accumulated | |
| Net Investment | Net Realized | |
Income/(Loss) | Gain/(Loss) | Paid-in Capital |
| $29,015 | $(29,015) | $— |
| c). | Income and Expenses – Dividend income is recognized on the ex-dividend date or as soon as information is available to the Fund. Interest income, which includes the amortization of premium and accretion of discount, is recognized on an accrual basis. The Fund is charged for those expenses that are directly attributable to the portfolio, such as advisory, administration, and certain shareholder service fees. Income, expenses (other than expenses attributable to a specific class), and realized and unrealized gains or losses on investments are allocated to each class of shares based on its respective net assets. |
| | |
| d). | Distributions to Shareholders – Dividends from net investment income for the Fund, if any, are declared and paid on a calendar quarter basis. Distributions of net realized capital gains, if any, are declared and paid annually, usually in December. |
| | |
| e). | Security Transactions – Investment and shareholder transactions are recorded on the trade date. The Fund determines the gain or loss realized from the investment transactions by comparing the original cost of the security lot sold with the net sale proceeds. Discounts and premiums on securities purchased are accreted/amortized over the life of the respective security. |
| | |
| f). | Use of Estimates – The preparation of financial statements in conformity with GAAP requires management to make estimates and assumptions that affect the reported amounts of assets and liabilities and disclosure of contingent assets and liabilities at the date of the financial statements and the reported change in net assets during the reporting period. Actual results could differ from those estimates. |
| | |
| g). | Share Valuation – The net asset value (“NAV”) per share of the Fund is calculated by dividing the sum of the value of the securities held by the Fund, plus cash or other assets, minus all liabilities (including estimated accrued expenses) by the total number of shares outstanding for the Fund, rounded to the nearest cent. The Fund’s shares will not be priced on days the New York Stock Exchange is closed for trading. The offering and redemption price per share for the Fund is equal to the Fund’s NAV per share. |
| | |
| h). | Foreign Currency – Values of investments denominated in foreign currencies, if any, are converted into U.S. dollars using the spot market rate of exchange at the time of valuation. Purchases and sales of investments and income are translated into U.S. dollars using the spot market rate of exchange prevailing on the respective dates of such transactions. The Fund does not isolate the portion of the results of operations resulting from fluctuations in foreign exchange rates on investments from fluctuations resulting from changes in the market prices of securities held. Such fluctuations are included with the net realized and unrealized gain or loss on investments. Foreign investments present additional risks due to currency fluctuations, economic and political factors, lower liquidity, government regulations, differences in accounting standards, and other factors. |
| | |
| i). | Forward Contracts – The Fund may enter into forward currency contracts to reduce its exposure to changes in foreign currency exchange rates on its foreign holdings and to lock in the U.S. dollar cost of firm purchase and sale commitments for |
| HENNESSY FUNDS | 1-800-966-4354 | |
| | securities denominated in foreign currencies. A forward currency contract is a commitment to purchase or sell a foreign currency at a future date at a negotiated forward rate. The gain or loss arising from the difference between the U.S. dollar cost of the original contract and the value of the foreign currency in U.S. dollars upon closing of such contract is included in net realized gain or loss from foreign currency transactions. During the fiscal year ended October 31, 2015, the Fund did not enter into any forward contracts. |
| | |
| j). | Repurchase Agreements – The Fund may enter into repurchase agreements with member banks or security dealers of the Federal Reserve Board whom the investment advisor deems creditworthy. The repurchase price generally equals the price paid by the Fund plus interest negotiated on the basis of current short-term rates. |
| | |
| | Securities pledged as collateral for repurchase agreements are held by the custodian bank until the respective agreements mature. Provisions of the repurchase agreements ensure that the market value of the collateral, including accrued interest thereon, is sufficient to cover the repurchase amount in the event of default of the counterparty. If the counterparty defaults and the value of the collateral declines or if the counterparty enters an insolvency proceeding, realization of the collateral by the Fund may be delayed or limited. |
| | |
| k). | Accounting for Uncertainty in Income Taxes – The Fund has accounting policies regarding recognition and measurement of tax positions taken or expected to be taken on a tax return. The tax returns of the Fund for the prior three fiscal years are open for examination. The Fund has reviewed all open tax years in major jurisdictions and concluded that there is no impact on the Fund’s net assets and no tax liability resulting from unrecognized tax benefits relating to uncertain income tax positions taken or expected to be taken on a tax return. The Fund’s major tax jurisdictions are U.S. federal and Delaware. |
| | |
| l). | Derivatives – The Fund may invest in, or enter into, derivatives, such as options, futures contracts, options on futures contracts, and swaps, for a variety of reasons, including to hedge certain risks, to provide a substitute for purchasing or selling particular securities, or to increase potential income gain. Derivatives may provide a cheaper, quicker, or more specifically focused way for a Fund to invest than “traditional” securities would. The main purpose of utilizing these derivative instruments is for hedging purposes. |
| | |
| | The Fund follows the financial accounting reporting rules as required by the Derivatives and Hedging Topic of the FASB Accounting Standards Codification. Under such rules, the Fund is required to include enhanced disclosure that enables investors to understand how and why an entity uses derivatives, how derivatives are accounted for, and how derivatives instruments affect an entity’s results of operations and financial position. During the fiscal year ended October 31, 2015, the Fund did not hold any derivative instruments. |
| | |
| m). | New Accounting Pronouncements – In June 2014, the FASB issued Accounting Standards Update (“ASU”) No. 2014-11 “Repurchase-to Maturity Transactions, Repurchase Financings, and Disclosures.” The amendments in this ASU require an entity to modify accounting for repurchase-to-maturity transactions and repurchase financing arrangements, as well as modify required disclosures for repurchase agreements, securities lending transactions, and repurchase-to-maturity transactions that are accounted for as secured borrowings. The guidance is effective for fiscal years beginning on or after December 15, 2014, and for interim periods within those fiscal years. Management is currently evaluating the impact these changes will have on the Fund’s financial statement disclosures. |
| | In May 2015, the FASB issued ASU No. 2015-07 “Disclosure for Investments in Certain Entities that Calculate Net Asset Value per Share (or Its Equivalent).” The amendments in ASU No. 2015-07 remove the requirement to categorize within the fair value hierarchy investments measured at NAV and require the disclosure of sufficient information to reconcile the fair value of the remaining assets categorized within the fair value hierarchy to the financial statements. The amendments in ASU No. 2015-07 are effective for fiscal years beginning after December 15, 2015, and interim periods within those fiscal years. Management has reviewed the requirements and believes the adoption of ASU 2015-07 will not have a material impact on the Fund’s financial statements and related disclosures. |
3). SECURITIES VALUATION
The Fund follows authoritative fair valuation accounting standards that establish an authoritative definition of fair value and set out a hierarchy for measuring fair value. These standards require additional disclosures about the various inputs and valuation techniques used to develop the measurements of fair value and a discussion in changes in valuation techniques and related inputs during the period. These inputs are summarized in the three broad levels listed below:
| | Level 1 – | Quoted unadjusted prices for identical instruments in active markets to which the Fund has access at the date of measurement. |
| | | |
| | Level 2 – | Quoted prices for similar instruments in active markets; quoted prices for identical or similar instruments in markets that are not active; and model-derived valuations in which all significant inputs and significant value drivers are observable in active markets. Level 2 inputs are those in markets for which there are few transactions, the prices are not current, the prices are fair value adjusted due to post-market close subsequent events (foreign markets), little public information exists, or instances where prices vary substantially over time or among brokered market makers. These inputs may also include interest rates, prepayment speeds, credit risk curves, default rates, and similar data. |
| | | |
| | Level 3 – | Model-derived valuations in which one or more significant inputs or significant value drivers are unobservable. Unobservable inputs are those inputs that reflect the Fund’s own assumptions about what market participants would use to price the asset or liability based on the best available information. |
Following is a description of the valuation techniques applied to the Fund’s major categories of assets and liabilities measured at fair value on a recurring basis.
Equity Securities – Equity securities, including common stocks, preferred stocks, foreign-issued common stocks, exchange-traded funds, closed-end mutual funds, partnerships, rights, and real estate investment trusts, that are traded on a securities exchange for which a last-quoted sales price is readily available will generally be valued at the last sales price as reported by the primary exchange on which the securities are listed. Securities listed on The NASDAQ Stock Market (“NASDAQ”) will generally be valued at the NASDAQ Official Closing Price, which may differ from the last sales price reported. Securities traded on a securities exchange for which a last-quoted sales price is not readily available will generally be valued at the mean between the bid and ask prices. To the extent these securities are actively traded and valuation adjustments are not applied, they are classified in Level 1 of the fair value hierarchy. Securities traded on foreign exchanges generally are not valued at the same time the Fund calculates its NAV because most foreign markets close well before such time. The earlier close of most foreign markets
| HENNESSY FUNDS | 1-800-966-4354 | |
gives rise to the possibility that significant events, including broad market moves, may have occurred in the interim. In certain circumstances, it may be determined that a security needs to be fair valued because it appears that the value of the security might have been materially affected by events occurring after the close of the market in which the security is principally traded, but before the time the Fund calculates its NAV, such as by a development that affects an entire market or region (e.g., weather-related events) or a potentially global development (e.g., a terrorist attack that may be expected to have an effect on investor expectations worldwide).
Registered Investment Companies – Investments in registered investment companies (e.g., mutual funds) are generally priced at the ending NAV provided by the applicable registered investment company’s service agent and will be classified in Level 1 of the fair value hierarchy.
Debt Securities – Debt securities, including corporate bonds, asset-backed securities, mortgage-backed securities, municipal bonds, U.S. Treasuries, and U.S. government agency issues, are generally valued at market on the basis of valuations furnished by an independent pricing service that utilizes both dealer-supplied valuations and formula-based techniques. The pricing service may consider recently executed transactions in securities of the issuer or comparable issuers, market price quotations (where observable), bond spreads, and fundamental data relating to the issuer. In addition, the model may incorporate market observable data such as reported sales of similar securities, broker quotes, yields, bids, offers, and reference data. Certain securities are valued principally using dealer quotations. These securities are generally classified in Level 2 of the fair value hierarchy.
Short-Term Securities – Short-term equity investments, including money market funds, are valued in the manner specified above. Short-term debt investments are generally valued at amortized cost, which approximates fair market value, if their original term to maturity was 60 days or less, or by amortizing the values as of the 61st day prior to maturity, if their original term to maturity exceeded 60 days. Amortized cost is not used if its use would be inappropriate due to credit or other impairments of the issuer, in which case the security’s fair value would be determined, as described below. Short-term securities are generally classified in Level 1 or Level 2 of the fair market hierarchy depending on the inputs used and market activity levels for specific securities.
The Board of Trustees of the Fund (the “Board”) has adopted fair value pricing procedures that are followed when a price for a security is not readily available or if a significant event has occurred that indicates the closing price of a security no longer represents the true value of that security. Fair value pricing determinations are made in good faith in accordance with these procedures. There are numerous criteria that will be given consideration in determining a fair value of a security. Some of these criteria are trading volume of a security and markets, the value of other like securities, and news events with direct bearing to a security or markets. Fair value pricing results in an estimated price for a security that reflects the amount the Fund might reasonably expect to receive in a current sale. Depending on the relative significance of the valuation inputs, these securities may be classified in either Level 2 or Level 3 of the fair value hierarchy.
The fair valuation of foreign securities may be determined with the assistance of a pricing service using correlations between the movement of prices of such securities and indices of domestic securities and other appropriate indicators, such as closing market prices of relevant American Depositary Receipts or futures contracts. The effect of using fair value pricing is that the Fund’s NAV will reflect the affected portfolio securities’ value as determined in the judgment of the Board or its designee instead of being determined by
the market. Using a fair value pricing methodology to price foreign securities may result in a value that is different from a foreign security’s most recent closing price and from the prices used by other investment companies to calculate their NAVs and are generally considered Level 2 prices in the fair valuation hierarchy. Because the Fund may invest in foreign securities, the value of the Fund’s portfolio securities may change on days when you will not be able to purchase or redeem your shares.
The Board has delegated day-to-day valuation matters to a Valuation Committee comprised of one or more representatives from Hennessy Advisors, Inc., the Fund’s investment advisor. The function of the Valuation Committee is to value securities where current and reliable market quotations are not readily available. All actions taken by the Valuation Committee are reviewed by the Board.
The Fund has performed an analysis of all existing investments to determine the significance and character of all inputs to their fair value determination. Various inputs are used in determining the value of the Fund’s investments. The inputs or methodology used for valuing securities are not necessarily an indication of the risk associated with investing in those securities. Details related to the fair valuation hierarchy of the Fund’s securities as of October 31, 2015 are included in the Fund’s Schedule of Investments.
4). INVESTMENT TRANSACTIONS
Purchases and sales of investment securities (excluding government and short-term investments) for the Fund during the fiscal year ended October 31, 2015 were $218,790,563 and $140,524,543, respectively.
Purchases and sales/maturities of long-term U.S. Government Securities for the Fund during the fiscal year ended October 31, 2015 were $50,397,400 and $41,761,787, respectively.
5). INVESTMENT MANAGEMENT FEE AND OTHER TRANSACTIONS WITH AFFILIATES
Hennessy Advisors, Inc. (the “Advisor”) is the investment advisor of the Fund. The Advisor provides the Fund with investment management services under an Investment Advisory Agreement. The Advisor furnishes all investment advice, office space, facilities, and provides most of the personnel needed by the Fund. As compensation for its services, the Advisor is entitled to a monthly fee from the Fund. The fee is based upon the average daily net assets of the Fund at the annual rate of 0.80%. The net investment advisory fees payable by the Fund as of October 31, 2015 were $313,683.
The Advisor has delegated the day-to-day management of the equity sleeve of the Fund to The London Company of Virginia, LLC and has delegated the day-to-day management of the fixed income sleeve of the Fund to Financial Counselors, Inc. The Advisor pays the sub-advisor fees for the Fund from its own assets and these fees are not an additional expense of the Fund.
The Advisor contractually agreed to limit the total annual operating expenses of the Fund (excluding interest, taxes, brokerage commissions, dividend expenses, 12b-1 fees, acquired fund fees and expenses, extraordinary legal expenses, or any other extraordinary expenses) to 1.08% of the Fund’s net assets for both the Investor Class shares and Institutional Class shares of the Fund through February 28, 2015. The expense limitation agreement for the Fund is no longer in effect.
For a period of three years after the year in which the Advisor waived or reimbursed expenses, the Advisor may seek reimbursement from the Fund to the extent that total annual fund operating expenses are less than the expense limitation that was in effect at the time the Advisor waived or reimbursed expenses. The Advisor recouped $23,335
| HENNESSY FUNDS | 1-800-966-4354 | |
from the Fund during the fiscal year ended October 31, 2015. As of October 31, 2015, cumulative expenses subject to potential recovery under the aforementioned conditions were $39,031 for Investor Class shares, which will expire on October 31, 2016.
The Board has approved a Shareholder Servicing Agreement for the Investor Class shares of the Fund, effective as of February 28, 2015, which was instituted to compensate the Advisor for the non-investment management services it provides to the Fund. The Shareholder Servicing Agreement provides for a monthly fee paid to the Advisor at an annual rate of 0.10% of the average daily net assets of the Fund attributable to Investor Class shares. Shareholder service fees payable by the Fund as of October 31, 2015 were $24,751.
The Fund has adopted a plan pursuant to Rule 12b-1 under the Investment Company Act of 1940, as amended, that authorizes payments in connection with the distribution of the Fund’s shares at an annual rate of up to 0.25% of the Fund’s average daily net assets attributable to Investor Class shares, although the Fund has only been using up to 0.15% of its average daily net assets attributable to Investor Class shares for such purpose since March 1, 2015. Amounts paid under the plan may be spent on any activities or expenses primarily intended to result in the sale of shares, including but not limited to, advertising, shareholder account servicing, the printing and mailing of prospectuses to other than current shareholders, the printing and mailing of sales literature, and compensation for sales and marketing activities or to financial institutions and others, such as dealers and distributors.
The Fund has entered into agreements with various brokers, dealers, and financial intermediaries in connection with the sale of shares of the Fund. The agreements provide for periodic payments by the Fund to the brokers, dealers, and financial intermediaries for providing certain shareholder maintenance services (sub-transfer agent expenses). These shareholder services include the pre-processing and quality control of new accounts, shareholder correspondence, answering customer inquiries regarding account status, and facilitating shareholder telephone transactions. Fees paid by the Fund to various brokers, dealers, and financial intermediaries during the fiscal year ended October 31, 2015 were $784,592.
U.S. Bancorp Fund Services, LLC (“USBFS”) provides the Fund with administrative, fund accounting, and transfer agent services, including all regulatory reporting, and necessary office equipment and personnel. As administrator, USBFS is responsible for activities such as (i) preparing various federal and state regulatory filings, reports, and returns for the Fund, (ii) preparing reports and materials to be supplied to the Board, (iii) monitoring the activities of the Fund’s custodian, transfer agent, and accountants, and (iv) coordinating the preparation and payment of the Fund’s expenses and reviewing the Fund’s expense accruals. Fees paid to USBFS during the fiscal year ended October 31, 2015 were $475,078.
U.S. Bank, N.A., an affiliate of USBFS, serves as the Fund’s custodian. Quasar Distributors, LLC acts as the Fund’s principal underwriter in a continuous public offering of the Fund’s shares. Quasar Distributors, LLC is an affiliate of USBFS and U.S. Bank, N.A.
6). LINE OF CREDIT
The Fund has an uncommitted line of credit with the other funds in the Hennessy Funds family of funds (the “Hennessy Funds”) in the amount of the lesser of (i) $100,000,000 or (ii) 33.33% of each Hennessy Fund’s net assets, or 30% for the Hennessy Gas Utility Fund and 10% for the Hennessy Balanced Fund, intended to provide short-term financing, if necessary, subject to certain restrictions, in connection with shareholder redemptions. The credit facility is with the Hennessy Funds’ custodian bank, U.S. Bank, N.A. Borrowings
under this arrangement bear interest at the bank’s prime rate and are secured by all of the Fund’s assets (as to its own borrowings only). During the fiscal year ended October 31, 2015, the Fund had an outstanding average daily balance and a weighted average interest rate of $2,359 and 3.25%, respectively. The maximum amount outstanding for the Fund during the period was $483,000. At October 31, 2015, the Fund did not have any borrowings outstanding under the line of credit.
7). FEDERAL TAX INFORMATION
As of October 31, 2015, the components of accumulated earnings (losses) for income tax purposes were as follows:
| | Cost of investments for tax purposes | | $ | 414,197,023 | |
| | Gross tax unrealized appreciation | | $ | 60,332,993 | |
| | Gross tax unrealized depreciation | | | (12,240,026 | ) |
| | Net tax unrealized appreciation | | $ | 48,092,967 | |
| | Undistributed ordinary income | | $ | 243,451 | |
| | Undistributed long-term capital gains | | | 10,941,231 | |
| | Total distributable earnings | | $ | 11,184,682 | |
| | Other accumulated gain | | $ | — | |
| | Total accumulated gain | | $ | 59,277,649 | |
The difference between book-basis and tax-basis unrealized appreciation is attributable primarily to wash sales.
At October 31, 2015, the Fund had no tax basis capital losses to offset future capital gains.
At October 31, 2015, the Fund did not defer, on a tax basis, any late year ordinary losses.
The tax character of distributions paid during fiscal year 2015 and fiscal year 2014 for the Fund were as follows:
| | | | Year Ended | | | Year Ended | |
| | | | October 31, 2015 | | | October 31, 2014 | |
| | Ordinary income | | $ | 4,605,202 | | | $ | 3,717,923 | |
| | Long-term capital gain | | | 15,385,788 | | | | 10,301,249 | |
| | | | $ | 19,990,990 | | | $ | 14,019,172 | |
8). EVENTS SUBSEQUENT TO YEAR END
Management has evaluated the Fund’s related events and transactions that occurred subsequent to October 31, 2015, through the date of issuance of the Fund’s financial statements. Other than as disclosed below, management has determined that there were no subsequent events requiring recognition or disclosure in the financial statements.
On December 9, 2015, capital gains were declared and paid to shareholders of record as of December 8, 2015 as follows:
| | | Long-term | |
| Investor Class | | $ | 0.38708 | |
| Institutional Class | | $ | 0.36612 | |
| HENNESSY FUNDS | 1-800-966-4354 | |
Report of Independent Registered Public Accounting Firm
To the Board of Trustees of Hennessy Funds Trust
And the Shareholders of the Hennessy Equity and Income Fund
Novato, CA
We have audited the accompanying statement of assets and liabilities, including the schedule of investments, of the Hennessy Equity and Income Fund (the “Fund”), a series of Hennessy Funds Trust, as of October 31, 2015, and the related statement of operations for the year then ended, the statements of changes in net assets for each of the two years in the period then ended and the financial highlights for each of the five years in the period then ended. These financial statements and financial highlights are the responsibility of the Fund’s management. Our responsibility is to express an opinion on these financial statements and financial highlights based on our audits.
We conducted our audits in accordance with the standards of the Public Company Accounting Oversight Board (United States). Those standards require that we plan and perform the audits to obtain reasonable assurance about whether the financial statements and financial highlights are free of material misstatement. The Fund is not required to have, nor were we engaged to perform, an audit of the Fund’s internal control over financial reporting. Our audits included consideration of internal control over financial reporting as a basis for designing audit procedures that are appropriate in the circumstances, but not for the purposes of expressing an opinion on the effectiveness of the Fund’s internal control over financial reporting. Accordingly, we express no such opinion. An audit includes examining, on a test basis, evidence supporting the amounts and disclosures in the financial statements. Our procedures included confirmation of securities owned as of October 31, 2015, by correspondence with the custodian and brokers. An audit also includes assessing the accounting principles used and significant estimates made by management, as well as evaluating the overall financial statement presentation. We believe that our audits provide a reasonable basis for our opinion.
In our opinion, the financial statements and financial highlights referred to above present fairly, in all material respects, the financial position of the Hennessy Equity and Income Fund as of October 31, 2015, the results of its operations for the year then ended, the changes in its net assets for each of the two years in the period then ended, and the financial highlights for each of the five years in the period then ended, in conformity with accounting principles generally accepted in the United States of America.
TAIT, WELLER & BAKER LLP
Philadelphia, Pennsylvania
December 21, 2015
Trustees and Officers of the Fund (Unaudited)
The business and affairs of the Fund are managed under the direction of the Board of Trustees of the Trust, and the Board of Trustees elects the Officers of the Trust. Information pertaining to the Trustees and the Officers of the Trust is set forth below. Such persons serve until their successors are duly elected and qualified or until their earlier death, resignation, or removal. Each of the Trustees oversees 16 Hennessy Funds. Unless otherwise indicated, the address of all persons listed below is 7250 Redwood Boulevard, Suite 200, Novato, CA 94945. The Fund’s Statement of Additional Information includes more information about the persons listed below and is available, without charge, upon request by calling 1-800-966-4354.
| | | | Other |
| | | | Directorships |
| Name, Year of Birth, | | | (During Past |
| and Position Held | Length of | Principal Occupation(s) | Five Years) |
with the Trust | Time Served | During Past Five Years | Held by Trustee(1) |
| | | | |
| Disinterested Trustees | | | |
| | | | |
| J. Dennis DeSousa (1936) | Since January | Mr. DeSousa is a real estate investor. | Hennessy SPARX |
| Trustee | 1996 for the | | Funds Trust; |
| | Hennessy Funds | | Hennessy Mutual |
| | | | Funds, Inc.; and |
| | | | The Hennessy |
| | | | Funds, Inc. |
| | | | |
| Robert T. Doyle (1947) | Since January | Mr. Doyle has been the Sheriff of | Hennessy SPARX |
| Trustee | 1996 for the | Marin County, California since 1996. | Funds Trust; |
| | Hennessy Funds | | Hennessy Mutual |
| | | | Funds, Inc.; and |
| | | | The Hennessy |
| | | | Funds, Inc. |
| | | | |
| Gerald P. Richardson (1945) | Since May | Mr. Richardson is an independent | Hennessy SPARX |
| Trustee | 2004 for the | consultant in the securities industry. | Funds Trust; |
| | Hennessy Funds | | Hennessy Mutual |
| | | | Funds, Inc.; and |
| | | | The Hennessy |
| | | | Funds, Inc. |
| | | | |
Interested Trustee(2) | | | |
| | | | |
| Neil J. Hennessy (1956) | Since January | Mr. Hennessy has been employed by | Hennessy Advisors, |
| Trustee, Chairman of | 1996 as a Trustee | Hennessy Advisors, Inc., the Funds’ | Inc.; Hennessy |
| the Board, Chief | for the Hennessy | investment advisor, since 1989. | SPARX Funds Trust; |
| Investment Officer, | Funds and since | He currently serves as President, | Hennessy Mutual |
| Portfolio Manager, | June 2008 as | Chairman and Chief Executive Officer | Funds, Inc.; and |
| and President | an Officer of the | of Hennessy Advisors, Inc. | The Hennessy |
| | Hennessy Funds | | Funds, Inc. |
| HENNESSY FUNDS | 1-800-966-4354 | |
| Name, Year of Birth, | | |
| and Position Held | Length of | Principal Occupation(s) |
with the Trust | Time Served | During Past Five Years |
| | | |
| Officers | | |
| | | |
| Teresa M. Nilsen (1966) | Since January | Ms. Nilsen has been employed by Hennessy Advisors, Inc., |
| Executive Vice President | 1996 for the | the Funds’ investment advisor, since 1989. She currently |
| and Treasurer | Hennessy Funds | serves as Executive Vice President, Chief Operations Officer, |
| | | Chief Financial Officer, and Secretary of Hennessy Advisors, Inc. |
| | | |
| Daniel B. Steadman (1956) | Since March | Mr. Steadman has been employed by Hennessy Advisors, Inc., |
| Executive Vice President | 2000 for the | the Funds’ investment advisor, since 2000. He currently serves |
| and Secretary | Hennessy Funds | as Executive Vice President and Chief Compliance Officer of |
| | | Hennessy Advisors, Inc. |
| | | |
| Jennifer Cheskiewicz (1977) | Since June | Ms. Cheskiewicz has been employed by Hennessy Advisors, |
| Senior Vice President and | 2013 for the | Inc., the Funds’ investment advisor, since June 2013. She |
| Chief Compliance Officer | Hennessy Funds | currently serves as General Counsel of Hennessy Advisors, Inc. |
| | | |
| | | She previously served as in-house counsel to Carlson Capital, |
| | | L.P., an SEC-registered investment advisor to several private |
| | | funds from February 2010 to May 2013. |
| | | |
| Brian Carlson (1972) | Since December | Mr. Carlson has been employed by Hennessy Advisors, Inc., the |
| Senior Vice President and | 2013 for the | Funds’ investment advisor, since December 2013. |
| Head of Distribution | Hennessy Funds | |
| | | Mr. Carlson was previously a co-founder and principal of |
| | | Trivium Consultants, LLC from February 2011 through |
| | | November 2013. |
| | | |
David Ellison (1958)(3) | Since October | Mr. Ellison has served as a Portfolio Manager of the Hennessy |
| Senior Vice President and | 2012 for the | Small Cap Financial Fund, the Hennessy Large Cap Financial |
| Portfolio Manager | Hennessy Funds | Fund, and the Hennessy Technology Fund since inception. |
| | | |
| | | Mr. Ellison previously served as Director, CIO and President of |
| | | FBR Fund Advisers, Inc. from December 1999 to October 2012. |
| | | |
| Brian Peery (1969) | Since March | Mr. Peery has served as a Portfolio Manager of the Hennessy |
| Senior Vice President and | 2003 as an | Cornerstone Growth Fund, the Hennessy Cornerstone Mid Cap |
| Portfolio Manager | Officer of the | 30 Fund, the Hennessy Cornerstone Large Growth Fund, the |
| | Hennessy Funds | Hennessy Cornerstone Value Fund, the Hennessy Total Return |
| | and since | Fund, and the Hennessy Balanced Fund since October 2014. |
| | February 2011 | From February 2011 through September 2014, he served as |
| | as a Co-Portfolio | Co-Portfolio Manager of the same funds. Mr. Peery has also |
| | Manager or | served as a Portfolio Manager of the Hennessy Gas Utility Fund |
| | Portfolio Manager | since February 2015. |
| | for the | |
| | Hennessy Funds | Mr. Peery has been employed by Hennessy Advisors, Inc., the |
| | | Funds’ investment advisor, since 2002. |
| | | |
| Winsor (Skip) Aylesworth | Since October | Mr. Aylesworth has served as a Portfolio Manager of the |
(1947)(3) | 2012 for the | Hennessy Gas Utility Fund since 1998 and as a Portfolio |
| Vice President and | Hennessy Funds | Manager of the Hennessy Technology Fund since inception. |
| Portfolio Manager | | |
| | | Mr. Aylesworth previously served as Executive Vice President |
| | | of The FBR Funds from 1999 to October 2012. |
| Name, Year of Birth, | | |
| and Position Held | Length of | Principal Occupation(s) |
with the Trust | Time Served | During Past Five Years |
| | | |
Ryan Kelley (1972)(4) | Since March | Mr. Kelley has served as a Portfolio Manager of the Hennessy |
| Vice President and | 2013 for the | Gas Utility Fund, the Hennessy Small Cap Financial Fund, and |
| Portfolio Manager | Hennessy Funds | the Hennessy Large Cap Financial Fund since October 2014. |
| | | From March 2013 through September 2014, he served as a |
| | | Co-Portfolio Manager of the same funds. Prior to that, |
| | | he was a Portfolio Analyst of the Hennessy Funds. |
(1) | Pursuant to an internal reorganization, the series of Hennessy Mutual Funds, Inc. (“HMFI”), The Hennessy Funds, Inc. (“HFI”), and Hennessy SPARX Funds Trust (“HSFT”) were reorganized into series of Hennessy Funds Trust on February 28, 2014, which mirrored the corresponding series of HFMI, HFI, and HSFT. Subsequent to the reorganization, HFMI, HFI, and HSFT were dissolved. |
(2) | Mr. Hennessy is considered an “interested person,” as defined in the Investment Company Act of 1940, as amended, because he is an officer of the Hennessy Funds. |
(3) | The address of these officers is 101 Federal Street, Suite 1900, Boston, MA 02110. |
(4) | The address of this officer is 1340 Environ Way, Chapel Hill, NC 27517. |
| HENNESSY FUNDS | 1-800-966-4354 | |
Expense Example (Unaudited)
October 31, 2015
As a shareholder of the Fund, you incur two types of costs: (1) transaction costs, including sales charges (loads) on purchase payments, reinvested dividends, or other distributions; redemption fees; and exchange fees; and (2) ongoing costs, including management fees; service fees; and other Fund expenses. This Example is intended to help you understand your ongoing costs (in dollars) of investing in the Fund and to compare these costs with the ongoing costs of investing in other mutual funds. The Example is based on an investment of $1,000 invested at the beginning of the period and held for the entire period from May 1, 2015 through October 31, 2015.
Actual Expenses
The first line of the table below under the “Investor Class” and “Institutional Class” headings provides information about actual account values and actual expenses. Although the Fund charges no sales loads or transaction fees, you will be assessed fees for outgoing wire transfers, returned checks and stop payment orders at prevailing rates charged by U.S. Bancorp Fund Services, LLC, the Fund’s transfer agent. If you request that a redemption be made by wire transfer, currently a $15.00 fee is charged by the Fund’s transfer agent. IRA accounts will be charged a $15.00 annual maintenance fee. The example below includes, but is not limited to, management fees, shareholder servicing fees, fund accounting, custody, and transfer agent fees. However, the example below does not include portfolio trading commissions and related expenses, and other extraordinary expenses as determined under generally accepted accounting principles. You may use the information in this line, together with the amount you invested, to estimate the expenses that you paid over the period. Simply divide your account value by $1,000 (for example, an $8,600 account value divided by $1,000 = 8.6), then multiply the result by the number in the first line of the table under the “Investor Class” and “Institutional Class” headings in the column entitled “Expenses Paid During Period” to estimate the expenses you paid on your account during this period.
Hypothetical Example for Comparison Purposes
The second line of the table below under the “Investor Class” and “Institutional Class” headings provides information about hypothetical account values and hypothetical expenses based on the Fund’s actual expense ratios and an assumed rate of return of 5% per year before expenses, which is not the Fund’s actual return. The hypothetical account values and expenses may not be used to estimate the actual ending account balance or expenses you paid for the period. You may use this information to compare the ongoing costs of investing in the Fund and other funds. To do so, compare this 5% hypothetical example with the 5% hypothetical examples that appear in the shareholder reports of the other funds. Please note that the expenses shown in the table are meant to highlight your ongoing costs only and do not reflect any transactional costs, such as sales charges (loads), or exchange fees. Therefore, the second line of the table under the “Investor Class” and “Institutional Class” headings is useful in comparing ongoing costs only, and will not help you determine the relative total costs of owning different funds. In addition, if these transactional costs were included, your costs would have been higher.
| | | | Expenses Paid |
| | Beginning | Ending | During Period(1) |
| | Account Value | Account Value | May 1, 2015 – |
| | May 1, 2015 | October 31, 2015 | October 31, 2015 |
| Investor Class | | | |
| Actual | $1,000.00 | $ 982.10 | $7.14 |
| Hypothetical (5% return before expenses) | $1,000.00 | $1,018.00 | $7.27 |
| | | | |
| Institutional Class | | | |
| Actual | $1,000.00 | $ 983.90 | $5.25 |
| Hypothetical (5% return before expenses) | $1,000.00 | $1,019.91 | $5.35 |
(1) | Expenses are equal to the Fund’s annualized expense ratio of 1.43% for Investor Class shares or 1.05% for Institutional Class shares, as applicable, multiplied by the average account value over the period, multiplied by 184/365 days (to reflect one-half year period). |
| HENNESSY FUNDS | 1-800-966-4354 | |
How to Obtain a Copy of the Fund’s
Proxy Voting Policy and Proxy Voting Records
A description of the policies and procedures the Fund uses to determine how to vote proxies relating to portfolio securities is available without charge: (1) by calling 1-800-966-4354; (2) on the Hennessy Funds’ website at hennessyfunds.com/proxy-voting/policy.fs; or (3) on the U.S. Securities and Exchange Commission’s website at www.sec.gov. The Fund’s proxy voting record is available without charge on both the Hennessy Funds’ website at hennessyfunds.com/proxy-voting/policy.fs and the SEC’s website at www.sec.gov no later than August 31 for the prior 12 months ending June 30.
Quarterly Filings on Form N-Q
The Fund files its complete schedule of portfolio holdings with the SEC for the first and third quarters of each fiscal year on Form N-Q. The Fund’s Form N-Q will be available on the SEC’s website at www.sec.gov. The Fund’s Form N-Q may be reviewed and copied at the SEC’s Public Reference Room in Washington, DC and information on the operation of the Public Reference Room may be obtained by calling 1-800-SEC-0330. Information included in the Fund’s N-Q will also be available upon request by calling 1-800-966-4354.
Federal Tax Distribution Information
(Unaudited)
For the fiscal year ended October 31, 2015, certain dividends paid by the Fund may be subject to a maximum tax rate of 23.8%, as provided for by the Jobs and Growth Tax Relief Reconciliation Act of 2003. The percentage of dividends declared from ordinary income designated as qualified dividend income was 100.00%.
For corporate shareholders, the percent of ordinary income distributions that qualified for the corporate dividends received deduction for the fiscal year ended October 31, 2015 was 100.00%.
The percentage of taxable ordinary income distributions that are designated as short-term capital gain distributions under Section 871(k)(2)(C) of the Internal Revenue Code of 1986, as amended, for the Fund was 2.48%.
Householding
To help keep the Fund’s costs as low as possible, we generally deliver a single copy of most financial reports and prospectuses to shareholders who share an address, even if the accounts are registered under different names. This process, known as “householding,” does not apply to account statements. You may, of course, request an individual copy of a prospectus or financial report at any time. If you would like to receive separate mailings, please call the Administrator at 1-800-261-6950 or 1-414-765-4124 and we will begin individual delivery within 30 days of your request. If your account is held through a financial institution or other intermediary, please contact them directly to request individual delivery.
Privacy Policy
We collect the following non-public personal information about you:
| | • | information we receive from you on or in applications or other forms, correspondence, or conversations, including, but not limited to, your name, address, phone number, social security number, assets, income, and date of birth; and |
| | • | information about your transactions with us, our affiliates, or others, including, but not limited to, your account number and balance, payment history, parties to transactions, cost basis information, and other financial information. |
We do not disclose any non-public personal information about our current or former shareholders to nonaffiliated third parties, except as permitted by law. For example, we are permitted by law to disclose all of the information we collect, as described above, to our Transfer Agent to process your transactions. Furthermore, we restrict access to your non-public personal information to those persons who require such information to provide products or services to you. We maintain physical, electronic, and procedural safeguards that comply with federal standards to guard your non-public personal information.
In the event that you hold shares of the Fund through a financial intermediary, including, but not limited to, a broker-dealer, bank or trust company, the privacy policy of your financial intermediary would govern how your non-public personal information would be shared with nonaffiliated third parties.
| HENNESSY FUNDS | 1-800-966-4354 | |
For information, questions or assistance, please call
The Hennessy Funds
1-800-966-4354 or 1-415-899-1555
INVESTMENT ADVISOR
Hennessy Advisors, Inc.
7250 Redwood Blvd., Suite 200
Novato, California 94945
ADMINISTRATOR,
TRANSFER AGENT,
DIVIDEND PAYING AGENT &
SHAREHOLDER SERVICING AGENT
U.S. Bancorp Fund Services, LLC
P.O. Box 701
Milwaukee, Wisconsin 53201-0701
CUSTODIAN
U.S. Bank N.A.
Custody Operations
1555 North River Center Dr., Suite 302
Milwaukee, Wisconsin 53212
TRUSTEES
Neil J. Hennessy
Robert T. Doyle
J. Dennis DeSousa
Gerald P. Richardson
COUNSEL
Foley & Lardner LLP
777 East Wisconsin Avenue
Milwaukee, Wisconsin 53202-5306
INDEPENDENT REGISTERED
PUBLIC ACCOUNTING FIRM
Tait, Weller & Baker LLP
1818 Market Street, Suite 2400
Philadelphia, Pennsylvania 19103
DISTRIBUTOR
Quasar Distributors, LLC
615 East Michigan Street
Milwaukee, Wisconsin 53202
hennessyfunds.com | 1-800-966-4354
This report has been prepared for shareholders and may be distributed to
others only if preceded or accompanied by a current prospectus.
ANNUAL REPORT
OCTOBER 31, 2015
HENNESSY BALANCED
FUND
Investor Class HBFBX
hennessyfunds.com | 1-800-966-4354
(This Page Intentionally Left Blank.)
Contents
| Letter to Shareholders | 2 |
| Performance Overview | 4 |
| Financial Statements | |
| Schedule of Investments | 7 |
| Statement of Assets and Liabilities | 11 |
| Statement of Operations | 12 |
| Statements of Changes in Net Assets | 13 |
| Financial Highlights | 14 |
| Notes to the Financial Statements | 16 |
| Report of Independent Registered Public Accounting Firm | 23 |
| Trustees and Officers of the Fund | 24 |
| Expense Example | 28 |
| Proxy Voting | 30 |
| Quarterly Filings on Form N-Q | 30 |
| Federal Tax Distribution Information | 30 |
| Householding | 30 |
| Privacy Policy | 31 |
| HENNESSY FUNDS | 1-800-966-4354 | |
December 2015
Dear Hennessy Funds Shareholder:
As I look back over the year, I am reminded that the U.S. economy has come a long way since the depths of the recession in 2009. The economy has been expanding steadily for almost six years, the unemployment rate has halved, the housing market has been recovering and capital expenditures have been growing. The financial markets have performed well too, driven largely by strong corporate earnings growth, especially in the early years. The U.S. market, as measured by the S&P 500 Index, has roughly tripled since the bull market began in 2009, and the Index’s earnings per share have increased 260% over this same time period. For the year ended October 31, 2015, the U.S. equity market performed reasonably well, with the S&P 500 posting another advance of 5.2%. However, behind this headline number, the market experienced a great deal of volatility as investors reacted to falling energy prices, a rise in the U.S. Dollar, pressure on export earnings growth, slower growth in China and, most significantly, the likelihood of a rise in the Fed Funds rate for the first time in nearly a decade – the featured topic of conversation around every office water cooler in the financial world this year.
Investors, reporters and friends often ask me “What’s next?” The market has been in a volatile, sideways correction for over a year now, and throughout this period of volatility, I have consistently advised investors to continue to focus on the long-term fundamentals of the market.
In my view, the fundamentals of the market are in good shape. Despite a stronger U.S. Dollar and its impact on export growth, the economy is still growing steadily. Inflation remains low, so we expect the Federal Reserve, once it does begin to raise short-term interest rates, will not likely raise them by very much. New jobs are being created at what I believe is a healthy rate, and average hourly wages are rising in response to a tighter labor market. Higher wages and lower gasoline prices are helping to keep consumer confidence positive.
Notwithstanding what I view as a relatively solid economic environment, however, I think investor sentiment remains restrained. The same factors that contributed to the market volatility this past year are still troubling investors today: the slowdown in the Chinese economy, slower earnings growth here in the U.S., and, of course, the prospect of rising interest rates. As a result of these investor worries, I do not see any solid enthusiasm for the market – no euphoria. Universal optimism about the market often coincides with a peak in stock prices and this absence of euphoria is yet another reason I feel bullish. And finally, I do not believe stocks are expensive. The Dow Jones Industrial Average and the S&P 500 Index have forward PE (price-to-earnings) ratios of approximately 16x and 17x, respectively, close to long-term averages. In my view, these fundamentals taken together signal a continuation of the bull market that began six years ago.
A final positive note: I still do not believe that investors have fully returned to investing in U.S. equities. Assets in domestic equity funds have now reached parity with fixed income/money market funds, with $6.2 trillion in each. I believe that fixed income investments will continue to trickle into equities, which should have a positive effect on the market.
Thank you for your continued confidence and investment in our products. If you have any questions or would like to speak with us directly, please don’t hesitate to call us at (800) 966-4354.
Best regards,
Neil J. Hennessy
President and Chief Investment Officer
Past performance does not guarantee future results.
Mutual fund investing involves risk. Principal loss is possible.
Opinions expressed are those of Neil Hennessy and are subject to change, are not guaranteed and should not be considered investment advice.
The Dow Jones Industrial Average and the S&P 500 Index are unmanaged indices commonly used to measure the performance of U.S. stocks. One cannot invest directly in an index.
Price to earnings (“PE”) is the market price per share divided by earnings per share. Earnings per share is the portion of a company’s profit allocated to each outstanding share of common stock. It serves as an indicator of a company’s profitability.
| HENNESSY FUNDS | 1-800-966-4354 | |
Performance Overview (Unaudited)
CHANGE IN VALUE OF $10,000 INVESTMENT
This graph illustrates the performance of an initial investment of $10,000 made in the Fund ten years ago and assumes the reinvestment of dividends.
AVERAGE ANNUAL TOTAL RETURN FOR PERIODS ENDED OCTOBER 31, 2015
| | One | Five | Ten |
| | Year | Years | Years |
| Hennessy Balanced Fund (HBFBX) | 0.11% | 5.44% | 4.10% |
| 50/50 Blended DJIA/Treasury Index* | 2.35% | 6.42% | 5.25% |
| Dow Jones Industrial Average | 4.06% | 12.51% | 8.18% |
Expense ratio: 1.68%
Performance data quoted represents past performance; past performance does not guarantee future results. The investment return and principal value of an investment will fluctuate so that an investor’s shares, when redeemed, may be worth more or less than their original cost. The performance graph and table do not reflect the deduction of taxes that a shareholder would pay on Fund distributions or the redemption of Fund shares. Current performance of the Fund may be lower or higher than the performance quoted. Performance data current to the most recent month end may be obtained by visiting hennessyfunds.com.
The expense ratio presented is from the most recent prospectus.
| * | The 50/50 Blended DJIA/Treasury Index consists of 50% common stocks represented by the Dow Jones Industrial Average and 50% short-duration Treasury securities represented by the BofA Merrill Lynch 1-year U.S. Treasury Note Index. |
PERFORMANCE NARRATIVE
Portfolio Managers Neil Hennessy and Brian Peery
Performance:
For the twelve-month period ended October 31, 2015, the Hennessy Balanced Fund returned 0.11%, underperforming the 50/50 Blended DJIA/Treasury Index* and the Dow Jones Industrial Average, which returned 2.35% and 4.06% for the same period, respectively.
The Fund maintains a roughly 50% weighting in U.S. Treasuries, which caused it to underperform its equity benchmark, the Dow Jones Industrial Average, for the year ended October 31, 2015. The Fund also underperformed its 50/50 Blended DJIA/Treasury
Index* benchmark as a result of sector allocation, in particular the Fund’s underweight position in the Consumer Discretionary sector, which performed well over the period. The Fund did not own The Walt Disney Company, Home Depot, Inc. or Nike, Inc., each of which posted returns of more than 25% for the period. Strong performance from several other portfolio holdings, including General Electric Co. and Pfizer, Inc., were unfortunately insufficient to offset the relative losses against the index from the Consumer Discretionary sector. The Fund continues to hold General Electric and Pfizer.
Portfolio Strategy:
The Fund invests approximately 50% of its assets in the “Dogs of the Dow,” the 10-highest yielding Dow stocks, and 50% of its assets in U.S. Treasuries. As a result of this “balanced” strategy, the Fund may be expected to underperform equities in periods when markets rise and outperform in periods when markets fall. The Fund is designed to allow investors to gain some exposure to the equity market while maintaining a significant share of their investment in fixed income securities. We believe the Fund is well positioned for the more conservative investor, as the equity portion of the portfolio is invested in what we would deem to be high quality companies, each with a relatively high dividend yield historically. The relatively short duration of the 50% weighting of U.S. Treasuries in the portfolio (all less than one year) may allow us the ability to roll into higher yielding treasuries in the event yields continue to rise.
Market Outlook:
Over the twelve-month period ended October 31, 2015, U.S. equities, as measured by the S&P 500 Index, advanced by just over 5%. Notwithstanding this modest rise, the year was marked by a great deal of volatility, especially during the second half of the period when uncertainty regarding the timing and magnitude of a rise in short-term interest rates being contemplated by the Federal Reserve dominated investor thinking. Earnings growth, too, caused anxiety for investors. Lower energy prices impacted many companies in the Energy sector, and the higher U.S. Dollar and slower growth abroad affected exporters. Many companies saw their sales and earnings growth slow.
In the end, however, confidence in continued economic growth was strong enough to offset investor concerns, with the market staging a dramatic rally in October, the final month of the Fund’s fiscal year. We believe the basic fundamentals of the market are attractive, and we continue to be optimistic about the possibility of further market advances over the course of the next year. The economy is growing slowly but steadily. Inflation is low, so we expect that the Fed, once they do start to raise rates, will not raise them by very much. The labor market has continued to recover over the last 12 months, and consumer confidence appears buoyant. Most importantly, we do not believe stocks are expensive. The Dow Jones Industrial Average and the S&P 500 have forward PE ratios of approximately 16x and 17x, respectively, close to long-term averages. Corporate balance sheets appear to be in excellent shape, and while executives have shown some reluctance to increase capital spending beyond maintenance levels this cycle, we believe companies will eventually start investing for expansion. This spending could, in turn, help drive share prices higher through an acceleration in sales and earnings growth.
| * | The 50/50 Blended DJIA/Treasury Index consists of 50% common stocks represented by the Dow Jones Industrial Average and 50% short duration Treasury securities represented by the BofA Merrill Lynch 1-Year U.S. Treasury Note Index. |
Opinions expressed are those of the Portfolio Managers as of the date written and are subject to change, are not guaranteed, and should not be considered investment advice or an indication of trading intent.
| HENNESSY FUNDS | 1-800-966-4354 | |
The S&P 500 Index and Dow Jones Industrial Average are unmanaged indices commonly used to measure the performance of U.S. stocks. The BofA Merrill Lynch 1-Year U.S. Treasury Note Index is an unmanaged index comprised of Treasury securities maturing in approximately one year. One cannot invest directly in an index.
The Fund is non-diversified, meaning it may concentrate its assets in fewer individual holdings than a diversified fund, making it more exposed to individual stock volatility than a diversified fund. The Fund’s formula-based strategy may cause the Fund to buy or sell securities at times when it may not be advantageous.
References to specific securities should not be considered a recommendation to buy or sell any security. Fund holdings and sector allocations are subject to change. Please refer to the Schedule of Investments included in this report for additional portfolio information.
Earnings growth is not a measure of the Fund’s future performance. Dividend yield is calculated as the annual dividends paid by a company divided by its market price per share. PE, or price to earnings, is calculated by dividing a company’s market price per share by its earnings per share.
Financial Statements
Schedule of Investments as of October 31, 2015 |
HENNESSY BALANCED FUND
(% of Net Assets)
| TOP TEN HOLDINGS | % NET ASSETS |
| U.S. Treasury Bill, 0.110%, 02/04/2016 | 10.32% |
| U.S. Treasury Bill, 0.290%, 06/23/2016 | 8.58% |
| U.S. Treasury Bill, 0.410%, 08/18/2016 | 8.58% |
| U.S. Treasury Bill, 0.440%, 09/15/2016 | 8.58% |
| Chevron Corp. | 5.47% |
| General Electric Co. | 5.39% |
| McDonald’s Corp. | 5.36% |
| Procter & Gamble Co. | 5.22% |
| U.S. Treasury Bill, 0.255%, 05/26/2016 | 5.15% |
| Exxon Mobil Corp. | 5.12% |
Note: For presentation purposes, the Fund has grouped some of the industry categories. For purposes of categorizing securities for compliance with Section 8(b)(1) of the Investment Company Act of 1940, as amended, the Fund uses more specific industry classifications.
| HENNESSY FUNDS | 1-800-966-4354 | |
| COMMON STOCKS – 50.53% | | Number | | | | | | % of | |
| | | of Shares | | | Value | | | Net Assets | |
| Consumer Discretionary – 5.36% | | | | | | | | | |
| McDonald’s Corp. | | | 5,550 | | | $ | 622,988 | | | | 5.36 | % |
| | | | | | | | | | | | | |
| Consumer Staples – 6.51% | | | | | | | | | | | | |
| Procter & Gamble Co. | | | 7,950 | | | | 607,221 | | | | 5.22 | % |
| The Coca-Cola Co. | | | 2,800 | | | | 118,580 | | | | 1.02 | % |
| Wal-Mart Stores, Inc. | | | 550 | | | | 31,482 | | | | 0.27 | % |
| | | | | | | | | | | | | |
| | | | | | | | 757,283 | | | | 6.51 | % |
| | | | | | | | | | | | | |
| Energy – 10.59% | | | | | | | | | | | | |
| Chevron Corp. | | | 7,000 | | | | 636,160 | | | | 5.47 | % |
| Exxon Mobil Corp. | | | 7,200 | | | | 595,728 | | | | 5.12 | % |
| | | | | | | | 1,231,888 | | | | 10.59 | % |
| | | | | | | | | | | | | |
| Health Care – 8.79% | | | | | | | | | | | | |
| Merck & Co., Inc. | | | 9,150 | | | | 500,139 | | | | 4.30 | % |
| Pfizer, Inc. | | | 15,450 | | | | 522,519 | | | | 4.49 | % |
| | | | | | | | 1,022,658 | | | | 8.79 | % |
| | | | | | | | | | | | | |
| Industrials – 10.16% | | | | | | | | | | | | |
| Caterpillar, Inc. | | | 7,600 | | | | 554,724 | | | | 4.77 | % |
| General Electric Co. | | | 21,650 | | | | 626,118 | | | | 5.39 | % |
| | | | | | | | 1,180,842 | | | | 10.16 | % |
| | | | | | | | | | | | | |
| Information Technology – 3.43% | | | | | | | | | | | | |
| International Business Machines Corp. | | | 2,850 | | | | 399,228 | | | | 3.43 | % |
| | | | | | | | | | | | | |
| Materials – 0.85% | | | | | | | | | | | | |
| E.I. du Pont de Nemours & Co. | | | 1,550 | | | | 98,270 | | | | 0.85 | % |
| | | | | | | | | | | | | |
| Telecommunication Services – 4.84% | | | | | | | | | | | | |
| Verizon Communications, Inc. | | | 12,000 | | | | 562,560 | | | | 4.84 | % |
| | | | | | | | | | | | | |
| Total Common Stocks | | | | | | | | | | | | |
| (Cost $5,278,027) | | | | | | | 5,875,717 | | | | 50.53 | % |
The accompanying notes are an integral part of these financial statements.
| SHORT-TERM INVESTMENTS – 49.43% | | Number of Shares/ | | | | | | % of | |
| | | Par Amount | | | Value | | | Net Assets | |
| Money Market Funds – 3.92% | | | | | | | | | |
| Fidelity Government Portfolio – | | | | | | | | | |
| Institutional Class, 0.01% (a) | | | 455,966 | | | $ | 455,966 | | | | 3.92 | % |
| | | | | | | | | | | | | |
| U.S. Treasury Bills – 45.51% | | | | | | | | | | | | |
| 0.110%, 02/04/2016 (b) | | | 1,200,000 | | | | 1,199,709 | | | | 10.32 | % |
| 0.105%, 03/31/2016 (b) | | | 500,000 | | | | 499,646 | | | | 4.30 | % |
| 0.255%, 05/26/2016 (b) | | | 600,000 | | | | 599,240 | | | | 5.15 | % |
| 0.290%, 06/23/2016 (b) | | | 1,000,000 | | | | 998,204 | | | | 8.58 | % |
| 0.410%, 08/18/2016 (b) | | | 1,000,000 | | | | 997,573 | | | | 8.58 | % |
| 0.440%, 09/15/2016 (b) | | | 1,000,000 | | | | 997,173 | | | | 8.58 | % |
| | | | | | | | | | | | | |
| | | | | | | | 5,291,545 | | | | 45.51 | % |
| | | | | | | | | | | | | |
| Total Short-Term Investments | | | | | | | | | | | | |
| (Cost $5,745,592) | | | | | | | 5,747,511 | | | | 49.43 | % |
| | | | | | | | | | | | | |
| Total Investments | | | | | | | | | | | | |
| (Cost $11,023,619) – 99.96% | | | | | | | 11,623,228 | | | | 99.96 | % |
| Other Assets in | | | | | | | | | | | | |
| Excess of Liabilities – 0.04% | | | | | | | 4,378 | | | | 0.04 | % |
TOTAL NET ASSETS – 100.00% | | | | | | $ | 11,627,606 | | | | 100.00 | % |
Percentages are stated as a percent of net assets.
| (a) | The rate listed is the fund’s 7-day yield as of October 31, 2015. |
| (b) | The rate listed is discount rate at issue. |
The accompanying notes are an integral part of these financial statements.
| HENNESSY FUNDS | 1-800-966-4354 | |
Summary of Fair Value Exposure at October 31, 2015
The following is a summary of the inputs used to value the Fund’s net assets as of October 31, 2015 (see Note 3 in the accompanying notes to the financial statements):
| Common Stocks | | Level 1 | | | Level 2 | | | Level 3 | | | Total | |
| Consumer Discretionary | | $ | 622,988 | | | $ | — | | | $ | — | | | $ | 622,988 | |
| Consumer Staples | | | 757,283 | | | | — | | | | — | | | | 757,283 | |
| Energy | | | 1,231,888 | | | | — | | | | — | | | | 1,231,888 | |
| Health Care | | | 1,022,658 | | | | — | | | | — | | | | 1,022,658 | |
| Industrials | | | 1,180,842 | | | | — | | | | — | | | | 1,180,842 | |
| Information Technology | | | 399,228 | | | | — | | | | — | | | | 399,228 | |
| Materials | | | 98,270 | | | | — | | | | — | | | | 98,270 | |
| Telecommunication Services | | | 562,560 | | | | — | | | | — | | | | 562,560 | |
| Total Common Stocks | | $ | 5,875,717 | | | $ | — | | | $ | — | | | $ | 5,875,717 | |
| Short-Term Investments | | | | | | | | | | | | | | | | |
| Money Market Funds | | $ | 455,966 | | | $ | — | | | $ | — | | | $ | 455,966 | |
| U.S. Treasury Bills | | | — | | | | 5,291,545 | | | | — | | | | 5,291,545 | |
| Total Short-Term Investments | | $ | 455,966 | | | $ | 5,291,545 | | | $ | — | | | $ | 5,747,511 | |
| Total Investments | | $ | 6,331,683 | | | $ | 5,291,545 | | | $ | — | | | $ | 11,623,228 | |
Transfers between levels are recognized at the end of the reporting period. During the year ended October 31, 2015, the Fund recognized no transfers between levels.
The accompanying notes are an integral part of these financial statements.
Financial Statements
Statement of Assets and Liabilities as of October 31, 2015 |
| ASSETS: | | | |
| Investments in securities, at value (cost $11,023,619) | | $ | 11,623,228 | |
| Dividends and interest receivable | | | 18,029 | |
| Receivable for securities sold | | | 162,107 | |
| Prepaid expenses and other assets | | | 5,702 | |
| Total Assets | | | 11,809,066 | |
| | | | | |
| LIABILITIES: | | | | |
| Payable for securities purchased | | | 98,392 | |
| Payable for fund shares redeemed | | | 12,000 | |
| Payable to advisor | | | 5,812 | |
| Payable to administrator | | | 2,036 | |
| Payable to auditor | | | 19,599 | |
| Accrued distribution fees | | | 28,649 | |
| Accrued service fees | | | 969 | |
| Accrued trustees fees | | | 1,653 | |
| Accrued expenses and other payables | | | 12,350 | |
| Total Liabilities | | | 181,460 | |
| NET ASSETS | | $ | 11,627,606 | |
| | | | | |
| NET ASSETS CONSIST OF: | | | | |
| Capital stock | | $ | 10,784,271 | |
| Accumulated net investment income | | | 1,890 | |
| Accumulated net realized gain on investments | | | 241,836 | |
| Unrealized net appreciation on investments | | | 599,609 | |
| Total Net Assets | | $ | 11,627,606 | |
| | | | | |
| NET ASSETS | | | | |
| Investor Class: | | | | |
| Shares authorized (no par value) | | Unlimited | |
| Net assets applicable to outstanding Investor Class shares | | $ | 11,627,606 | |
| Shares issued and outstanding | | | 940,303 | |
| Net asset value, offering price and redemption price per share | | $ | 12.37 | |
The accompanying notes are an integral part of these financial statements.
| HENNESSY FUNDS | 1-800-966-4354 | |
Financial Statements
Statement of Operations for the year ended October 31, 2015 |
| INVESTMENT INCOME: | | | |
| Dividend income | | $ | 214,464 | |
| Interest income | | | 8,534 | |
| Total investment income | | | 222,998 | |
| | | | | |
| EXPENSES: | | | | |
| Investment advisory fees (See Note 5) | | | 71,219 | |
| Compliance expense | | | 22,186 | |
| Audit fees | | | 19,851 | |
| Distribution fees – Investor Class (See Note 5) | | | 17,804 | |
| Federal and state registration fees | | | 17,455 | |
| Administration, fund accounting, custody and transfer agent fees (See Note 5) | | | 11,933 | |
| Service fees – Investor Class (See Note 5) | | | 11,870 | |
| Trustees’ fees and expenses | | | 8,315 | |
| Sub-transfer agent expenses – Investor Class (See Note 5) | | | 8,019 | |
| Reports to shareholders | | | 5,260 | |
| Legal fees | | | 224 | |
| Other expenses | | | 4,788 | |
| Total expenses | | | 198,924 | |
| NET INVESTMENT INCOME | | $ | 24,074 | |
| | | | | |
| REALIZED AND UNREALIZED GAINS (LOSSES): | | | | |
| Net realized gain on investments | | $ | 250,576 | |
| Net change in unrealized depreciation on investments | | | (265,259 | ) |
| Net loss on investments | | | (14,683 | ) |
| NET INCREASE IN NET ASSETS RESULTING FROM OPERATIONS | | $ | 9,391 | |
The accompanying notes are an integral part of these financial statements.
Financial Statements
| Statements of Changes in Net Assets |
| | | Year Ended | | | Year Ended | |
| | | October 31, 2015 | | | October 31, 2014 | |
| OPERATIONS: | | | | | | |
| Net investment income | | $ | 24,074 | | | $ | 20,133 | |
| Net realized gain on investments | | | 250,576 | | | | 572,766 | |
| Net change in unrealized depreciation on investments | | | (265,259 | ) | | | (93,669 | ) |
| Net increase in net assets resulting from operations | | | 9,391 | | | | 499,230 | |
| | | | | | | | | |
| DISTRIBUTIONS TO SHAREHOLDERS FROM: | | | | | | | | |
| Net investment income – Investor Class | | | (30,298 | ) | | | (12,019 | ) |
| Net realized gains – Investor Class | | | (571,934 | ) | | | (413,659 | ) |
| Total distributions | | | (602,232 | ) | | | (425,678 | ) |
| | | | | | | | | |
| CAPITAL SHARE TRANSACTIONS: | | | | | | | | |
| Proceeds from shares subscribed – Investor Class | | | 450,977 | | | | 1,215,042 | |
| Dividends reinvested – Investor Class | | | 589,193 | | | | 413,511 | |
| Cost of shares redeemed – Investor Class | | | (1,362,738 | ) | | | (1,369,664 | ) |
| Net increase (decrease) in net assets derived | | | | | | | | |
| from capital share transactions | | | (322,568 | ) | | | 258,889 | |
| TOTAL INCREASE (DECREASE) IN NET ASSETS | | | (915,409 | ) | | | 332,441 | |
| | | | | | | | | |
| NET ASSETS: | | | | | | | | |
| Beginning of year | | | 12,543,015 | | | | 12,210,574 | |
| End of year | | $ | 11,627,606 | | | $ | 12,543,015 | |
| Undistributed net investment income, end of year | | $ | 1,890 | | | $ | 8,114 | |
| | | | | | | | | |
| CHANGES IN SHARES OUTSTANDING: | | | | | | | | |
| Shares sold – Investor Class | | | 36,214 | | | | 94,444 | |
| Shares issued to holders as reinvestment of dividends – | | | | | | | | |
| Investor Class | | | 47,227 | | | | 32,872 | |
| Shares redeemed – Investor Class | | | (109,315 | ) | | | (107,426 | ) |
| Net increase (decrease) in shares outstanding | | | (25,874 | ) | | | 19,890 | |
The accompanying notes are an integral part of these financial statements.
| HENNESSY FUNDS | 1-800-966-4354 | |
Financial Statements
For an Investor Class share outstanding throughout each year
PER SHARE DATA:
Net asset value, beginning of year
Income from investment operations:
Net investment income
Net realized and unrealized gains (losses) on investments
Total from investment operations
Less distributions:
Dividends from net investment income
Dividends from net realized gains
Total distributions
Net asset value, end of year
TOTAL RETURN
SUPPLEMENTAL DATA AND RATIOS:
Net assets, end of year (millions)
Ratio of expenses to average net assets
Ratio of net investment income to average net assets
Portfolio turnover rate
The accompanying notes are an integral part of these financial statements.
| Year Ended October 31, | |
| 2015 | | | 2014 | | | 2013 | | | 2012 | | | 2011 | |
| | | | | | | | | | | | | |
| $ | 12.98 | | | $ | 12.90 | | | $ | 11.88 | | | $ | 11.13 | | | $ | 10.43 | |
| | | | | | | | | | | | | | | | | | | |
| | | | | | | | | | | | | | | | | | | |
| | 0.03 | | | | 0.02 | | | | 0.02 | | | | 0.04 | | | | 0.05 | |
| | (0.01 | ) | | | 0.51 | | | | 1.02 | | | | 0.75 | | | | 0.70 | |
| | 0.02 | | | | 0.53 | | | | 1.04 | | | | 0.79 | | | | 0.75 | |
| | | | | | | | | | | | | | | | | | | |
| | | | | | | | | | | | | | | | | | | |
| | (0.03 | ) | | | (0.01 | ) | | | (0.02 | ) | | | (0.04 | ) | | | (0.05 | ) |
| | (0.60 | ) | | | (0.44 | ) | | | — | | | | — | | | | — | |
| | (0.63 | ) | | | (0.45 | ) | | | (0.02 | ) | | | (0.04 | ) | | | (0.05 | ) |
| $ | 12.37 | | | $ | 12.98 | | | $ | 12.90 | | | $ | 11.88 | | | $ | 11.13 | |
| | | | | | | | | | | | | | | | | | | |
| | 0.11 | % | | | 4.26 | % | | | 8.77 | % | | | 7.13 | % | | | 7.16 | % |
| | | | | | | | | | | | | | | | | | | |
| | | | | | | | | | | | | | | | | | | |
| $ | 11.63 | | | $ | 12.54 | | | $ | 12.21 | | | $ | 25.17 | | | $ | 18.02 | |
| | 1.68 | % | | | 1.75 | % | | | 1.75 | % | | | 1.54 | % | | | 1.61 | % |
| | 0.20 | % | | | 0.17 | % | | | 0.14 | % | | | 0.34 | % | | | 0.42 | % |
| | 34 | % | | | 23 | % | | | 22 | % | | | 17 | % | | | 39 | % |
The accompanying notes are an integral part of these financial statements.
| HENNESSY FUNDS | 1-800-966-4354 | |
Financial Statements
Notes to the Financial Statements October 31, 2015 |
1). ORGANIZATION
The Hennessy Balanced Fund (the “Fund”) is a series of Hennessy Funds Trust (the “Trust”), which was organized as a Delaware statutory trust on September 17, 1992. The Fund is an open-end management investment company registered under the Investment Company Act of 1940, as amended. The Fund is a successor to a fund with the same name (the “Predecessor Fund”) that was a series of The Hennessy Funds, Inc., a Maryland corporation, pursuant to a reorganization that took place after the close of business on February 28, 2014. Prior to February 28, 2014, the Fund had no investment operations. As a result of the reorganization, holders of the Investor Class shares of the Predecessor Fund received Investor Class shares of the Fund (the Investor Class shares of the Fund are the successor to the accounting and performance information of the Predecessor Fund). The investment objective of the Fund is a combination of capital appreciation and current income. The Fund is a non-diversified fund and offers Investor Class shares.
As an investment company, the Fund follows the investment company accounting and reporting guidance of the Financial Accounting Standards Board (“FASB”) Accounting Standard Codification Topic 946 “Financial Services—Investment Companies.”
2). SIGNIFICANT ACCOUNTING POLICIES
The following is a summary of significant accounting policies consistently followed by the Fund in the preparation of the financial statements. These policies are in conformity with U.S. generally accepted accounting principles (“GAAP”).
| a). | Investment Valuation – All investments in securities are recorded at their estimated fair value, as described in Note 3. |
| | |
| b). | Federal Income Taxes – Provision for federal income taxes or excise taxes has not been made since the Fund has elected to be taxed as a “regulated investment company” and intends to distribute substantially all of its taxable income to its shareholders and otherwise comply with the provisions of the Internal Revenue Code of 1986, as amended, applicable to regulated investment companies. Net investment income or loss and realized gains and losses for federal income tax purposes may differ from that reported on the financial statements because of temporary book and tax basis differences. Temporary differences are primarily the result of the treatment of wash sales for tax reporting purposes. The Fund recognizes interest and penalties related to income tax benefits, if any, in the statement of operations as an income tax expense. Distributions from net realized gains for book purposes may include short-term capital gains, which are included as ordinary income to shareholders for tax purposes. |
| | |
| c). | Income and Expenses – Dividend income is recognized on the ex-dividend date or as soon as information is available to the Fund. Interest income, which includes the amortization of premium and accretion of discount, is recognized on an accrual basis. The Fund is charged for those expenses that are directly attributable to the portfolio, such as advisory, administration, and certain shareholder service fees. |
| | |
| d). | Distributions to Shareholders – Dividends from net investment income for the Fund, if any, are declared and paid on a calendar quarter basis. Distributions of net realized capital gains, if any, are declared and paid annually, usually in December. |
| e). | Security Transactions – Investment and shareholder transactions are recorded on the trade date. The Fund determines the gain or loss realized from the investment transactions by comparing the original cost of the security lot sold with the net sale proceeds. Discounts and premiums on securities purchased are accreted/amortized over the life of the respective security. |
| | |
| f). | Use of Estimates – The preparation of financial statements in conformity with GAAP requires management to make estimates and assumptions that affect the reported amounts of assets and liabilities and disclosure of contingent assets and liabilities at the date of the financial statements and the reported change in net assets during the reporting period. Actual results could differ from those estimates. |
| | |
| g). | Share Valuation – The net asset value (“NAV”) per share of the Fund is calculated by dividing the sum of the value of the securities held by the Fund, plus cash or other assets, minus all liabilities (including estimated accrued expenses) by the total number of shares outstanding for the Fund, rounded to the nearest cent. The Fund’s shares will not be priced on days the New York Stock Exchange is closed for trading. The offering and redemption price per share for the Fund is equal to the Fund’s NAV per share. |
| | |
| h). | Repurchase Agreements – The Fund may enter into repurchase agreements with member banks or security dealers of the Federal Reserve Board whom the investment advisor deems creditworthy. The repurchase price generally equals the price paid by the Fund plus interest negotiated on the basis of current short-term rates. |
| | |
| | Securities pledged as collateral for repurchase agreements are held by the custodian bank until the respective agreements mature. Provisions of the repurchase agreements ensure that the market value of the collateral, including accrued interest thereon, is sufficient to cover the repurchase amount in the event of default of the counterparty. If the counterparty defaults and the value of the collateral declines or if the counterparty enters an insolvency proceeding, realization of the collateral by the Fund may be delayed or limited. |
| | |
| i). | Accounting for Uncertainty in Income Taxes – The Fund has accounting policies regarding recognition and measurement of tax positions taken or expected to be taken on a tax return. The tax returns of the Fund for the prior three fiscal years are open for examination. The Fund has reviewed all open tax years in major jurisdictions and concluded that there is no impact on the Fund’s net assets and no tax liability resulting from unrecognized tax benefits relating to uncertain income tax positions taken or expected to be taken on a tax return. The Fund’s major tax jurisdictions are U.S. federal and Delaware. |
| | |
| j). | Derivatives – The Fund may invest in, or enter into, derivatives, such as options, futures contracts, options on futures contracts, and swaps, for a variety of reasons, including to hedge certain risks, to provide a substitute for purchasing or selling particular securities, or to increase potential income gain. Derivatives may provide a cheaper, quicker, or more specifically focused way for a Fund to invest than “traditional” securities would. The main purpose of utilizing these derivative instruments is for hedging purposes. |
| | |
| | The Fund follows the financial accounting reporting rules as required by the Derivatives and Hedging Topic of the FASB Accounting Standards Codification. Under such rules, the Fund is required to include enhanced disclosure that enables investors to understand how and why an entity uses derivatives, how derivatives are accounted for, and how derivatives instruments affect an entity’s results of operations and financial position. During the fiscal year ended October 31, 2015, the Fund did not hold any derivative instruments. |
| HENNESSY FUNDS | 1-800-966-4354 | |
| k). | New Accounting Pronouncements – In June 2014, the FASB issued Accounting Standards Update (“ASU”) No. 2014-11 “Repurchase-to Maturity Transactions, Repurchase Financings, and Disclosures.” The amendments in this ASU require an entity to modify accounting for repurchase-to-maturity transactions and repurchase financing arrangements, as well as modify required disclosures for repurchase agreements, securities lending transactions, and repurchase-to-maturity transactions that are accounted for as secured borrowings. The guidance is effective for fiscal years beginning on or after December 15, 2014, and for interim periods within those fiscal years. Management is currently evaluating the impact these changes will have on the Fund’s financial statement disclosures. |
| | |
| | In May 2015, the FASB issued ASU No. 2015-07 “Disclosure for Investments in Certain Entities that Calculate Net Asset Value per Share (or Its Equivalent).” The amendments in ASU No. 2015-07 remove the requirement to categorize within the fair value hierarchy investments measured at NAV and require the disclosure of sufficient information to reconcile the fair value of the remaining assets categorized within the fair value hierarchy to the financial statements. The amendments in ASU No. 2015-07 are effective for fiscal years beginning after December 15, 2015, and interim periods within those fiscal years. Management has reviewed the requirements and believes the adoption of ASU 2015-07 will not have a material impact on the Fund’s financial statements and related disclosures. |
3). SECURITIES VALUATION
The Fund follows authoritative fair valuation accounting standards that establish an authoritative definition of fair value and set out a hierarchy for measuring fair value. These standards require additional disclosures about the various inputs and valuation techniques used to develop the measurements of fair value and a discussion in changes in valuation techniques and related inputs during the period. These inputs are summarized in the three broad levels listed below:
| | Level 1 – | Quoted unadjusted prices for identical instruments in active markets to which the Fund has access at the date of measurement. |
| | | |
| | Level 2 – | Quoted prices for similar instruments in active markets; quoted prices for identical or similar instruments in markets that are not active; and model-derived valuations in which all significant inputs and significant value drivers are observable in active markets. Level 2 inputs are those in markets for which there are few transactions, the prices are not current, the prices are fair value adjusted due to post-market close subsequent events (foreign markets), little public information exists, or instances where prices vary substantially over time or among brokered market makers. These inputs may also include interest rates, prepayment speeds, credit risk curves, default rates, and similar data. |
| | | |
| | Level 3 – | Model-derived valuations in which one or more significant inputs or significant value drivers are unobservable. Unobservable inputs are those inputs that reflect the Fund’s own assumptions about what market participants would use to price the asset or liability based on the best available information. |
Following is a description of the valuation techniques applied to the Fund’s major categories of assets and liabilities measured at fair value on a recurring basis.
Equity Securities – Equity securities, including common stocks, preferred stocks, exchange-traded funds, closed-end mutual funds, partnerships, rights, and real estate
investment trusts, that are traded on a securities exchange for which a last-quoted sales price is readily available will generally be valued at the last sales price as reported by the primary exchange on which the securities are listed. Securities listed on The NASDAQ Stock Market (“NASDAQ”) will generally be valued at the NASDAQ Official Closing Price, which may differ from the last sales price reported. Securities traded on a securities exchange for which a last-quoted sales price is not readily available will generally be valued at the mean between the bid and ask prices. To the extent these securities are actively traded and valuation adjustments are not applied, they are classified in Level 1 of the fair value hierarchy.
Registered Investment Companies – Investments in registered investment companies (e.g., mutual funds) are generally priced at the ending NAV provided by the applicable registered investment company’s service agent and will be classified in Level 1 of the fair value hierarchy.
Debt Securities – Debt securities, including corporate bonds, asset-backed securities, mortgage-backed securities, municipal bonds, U.S. Treasuries, and U.S. government agency issues, are generally valued at market on the basis of valuations furnished by an independent pricing service that utilizes both dealer-supplied valuations and formula-based techniques. The pricing service may consider recently executed transactions in securities of the issuer or comparable issuers, market price quotations (where observable), bond spreads, and fundamental data relating to the issuer. In addition, the model may incorporate market observable data such as reported sales of similar securities, broker quotes, yields, bids, offers, and reference data. Certain securities are valued principally using dealer quotations. These securities are generally classified in Level 2 of the fair value hierarchy.
Short-Term Securities – Short-term equity investments, including money market funds, are valued in the manner specified above. Short-term debt investments are generally valued at amortized cost, which approximates fair market value, if their original term to maturity was 60 days or less, or by amortizing the values as of the 61st day prior to maturity, if their original term to maturity exceeded 60 days. Amortized cost is not used if its use would be inappropriate due to credit or other impairments of the issuer, in which case the security’s fair value would be determined, as described below. Short-term securities are generally classified in Level 1 or Level 2 of the fair market hierarchy depending on the inputs used and market activity levels for specific securities.
The Board of Trustees of the Fund (the “Board”) has adopted fair value pricing procedures that are followed when a price for a security is not readily available or if a significant event has occurred that indicates the closing price of a security no longer represents the true value of that security. Fair value pricing determinations are made in good faith in accordance with these procedures. There are numerous criteria that will be given consideration in determining a fair value of a security. Some of these criteria are trading volume of a security and markets, the value of other like securities, and news events with direct bearing to a security or markets. Fair value pricing results in an estimated price for a security that reflects the amount the Fund might reasonably expect to receive in a current sale. Depending on the relative significance of the valuation inputs, these securities may be classified in either Level 2 or Level 3 of the fair value hierarchy.
The Board has delegated day-to-day valuation matters to a Valuation Committee comprised of one or more representatives from Hennessy Advisors, Inc., the Fund’s investment advisor. The function of the Valuation Committee is to value securities where current and reliable market quotations are not readily available. All actions taken by the Valuation Committee are reviewed by the Board.
| HENNESSY FUNDS | 1-800-966-4354 | |
The Fund has performed an analysis of all existing investments to determine the significance and character of all inputs to their fair value determination. Various inputs are used in determining the value of the Fund’s investments. The inputs or methodology used for valuing securities are not necessarily an indication of the risk associated with investing in those securities. Details related to the fair valuation hierarchy of the Fund’s securities as of October 31, 2015 are included in the Fund’s Schedule of Investments.
4). INVESTMENT TRANSACTIONS
Purchases and sales of investment securities (excluding government and short-term investments) for the Fund during the fiscal year ended October 31, 2015 were $2,061,469 and $2,319,342, respectively.
There were no purchases or sales/maturities of long-term U.S. Government Securities for the Fund during the fiscal year ended October 31, 2015.
5). INVESTMENT MANAGEMENT FEE AND OTHER TRANSACTIONS WITH AFFILIATES
Hennessy Advisors, Inc. (the “Advisor”) is the investment advisor of the Fund. The Advisor provides the Fund with investment management services under an Investment Advisory Agreement. The Advisor furnishes all investment advice, office space, facilities, and provides most of the personnel needed by the Fund. As compensation for its services, the Advisor is entitled to a monthly fee from the Fund. The fee is based upon the average daily net assets of the Fund at the annual rate of 0.60%. The net investment advisory fees payable by the Fund as of October 31, 2015 were $5,812.
The Board has approved a Shareholder Servicing Agreement for the Fund, which was instituted to compensate the Advisor for the non-investment management services it provides to the Fund. The Shareholder Servicing Agreement provides for a monthly fee paid to the Advisor at an annual rate of 0.10% of the average daily net assets of the Fund. Shareholder service fees payable by the Fund as of October 31, 2015 were $969.
The Fund has adopted a plan pursuant to Rule 12b-1 under the Investment Company Act of 1940, as amended, that authorizes payments in connection with the distribution of the Fund’s shares at an annual rate of up to 0.25% of the Fund’s average daily net assets, although the Fund is currently only using up to 0.15% of its average daily net assets for such purpose. Amounts paid under the plan may be spent on any activities or expenses primarily intended to result in the sale of shares, including but not limited to, advertising, shareholder account servicing, the printing and mailing of prospectuses to other than current shareholders, the printing and mailing of sales literature, and compensation for sales and marketing activities or to financial institutions and others, such as dealers and distributors.
The Fund has entered into agreements with various brokers, dealers, and financial intermediaries in connection with the sale of shares of the Fund. The agreements provide for periodic payments by the Fund to the brokers, dealers, and financial intermediaries for providing certain shareholder maintenance services (sub-transfer agent expenses). These shareholder services include the pre-processing and quality control of new accounts, shareholder correspondence, answering customer inquiries regarding account status, and facilitating shareholder telephone transactions. Fees paid by the Fund to various brokers, dealers, and financial intermediaries during the fiscal year ended October 31, 2015 were $8,019.
U.S. Bancorp Fund Services, LLC (“USBFS”) provides the Fund with administrative, fund accounting, and transfer agent services, including all regulatory reporting, and necessary office equipment and personnel. As administrator, USBFS is responsible for activities such as (i) preparing various federal and state regulatory filings, reports, and
returns for the Fund, (ii) preparing reports and materials to be supplied to the Board, (iii) monitoring the activities of the Fund’s custodian, transfer agent, and accountants, and (iv) coordinating the preparation and payment of the Fund’s expenses and reviewing the Fund’s expense accruals. Fees paid to USBFS during the fiscal year ended October 31, 2015 were $11,933.
U.S. Bank, N.A., an affiliate of USBFS, serves as the Fund’s custodian. Quasar Distributors, LLC acts as the Fund’s principal underwriter in a continuous public offering of the Fund’s shares. Quasar Distributors, LLC is an affiliate of USBFS and U.S. Bank, N.A.
6). LINE OF CREDIT
The Fund has an uncommitted line of credit with the other funds in the Hennessy Funds family of funds (the “Hennessy Funds”) in the amount of the lesser of (i) $100,000,000 or (ii) 33.33% of each Hennessy Fund’s net assets, or 30% for the Hennessy Gas Utility Fund and 10% for the Fund, intended to provide short-term financing, if necessary, subject to certain restrictions, in connection with shareholder redemptions. The credit facility is with the Hennessy Funds’ custodian bank, U.S. Bank, N.A. Borrowings under this arrangement bear interest at the bank’s prime rate and are secured by all of the Fund’s assets (as to its own borrowings only). During the fiscal year ended October 31, 2015, the Fund did not have any borrowings outstanding under the line of credit.
7). FEDERAL TAX INFORMATION
As of October 31, 2015, the components of accumulated earnings (losses) for income tax purposes were as follows:
| | Cost of investments for tax purposes | | $ | 11,035,916 | |
| | Gross tax unrealized appreciation | | $ | 769,738 | |
| | Gross tax unrealized depreciation | | | (182,426 | ) |
| | Net tax unrealized appreciation | | $ | 587,312 | |
| | Undistributed ordinary income | | $ | 17,561 | |
| | Undistributed long-term capital gains | | | 238,462 | |
| | Total distributable earnings | | $ | 256,023 | |
| | Other accumulated gain | | $ | — | |
| | Total accumulated gain | | $ | 843,335 | |
The difference between book-basis and tax-basis unrealized appreciation is attributable primarily to wash sales.
At October 31, 2015, the Fund had no tax basis capital losses to offset future capital gains.
At October 31, 2015, the Fund did not defer, on a tax basis, any post-December late year ordinary loss deferrals.
The tax character of distributions paid during fiscal year 2015 and fiscal year 2014 for the Fund were as follows:
| | | | Year Ended | | | Year Ended | |
| | | | October 31, 2015 | | | October 31, 2014 | |
| | Ordinary income | | $ | 39,518 | | | $ | 12,019 | |
| | Long-term capital gain | | | 562,714 | | | | 413,659 | |
| | | | $ | 602,232 | | | $ | 425,678 | |
| HENNESSY FUNDS | 1-800-966-4354 | |
8). EVENTS SUBSEQUENT TO YEAR END
Management has evaluated the Fund’s related events and transactions that occurred subsequent to October 31, 2015, through the date of issuance of the Fund’s financial statements. Other than as disclosed below, management has determined that there were no subsequent events requiring recognition or disclosure in the financial statements.
On December 9, 2015, capital gains were declared and paid to shareholders of record as of December 8, 2015 as follows:
| | | Long-term | | | Short-term | |
| Investor Class | | $ | 0.25408 | | | $ | 0.01670 | |
Report of Independent Registered Public Accounting Firm
The Board of Trustees of Hennessy Funds Trust
and the Shareholders of the Hennessy Balanced Fund:
We have audited the accompanying statement of assets and liabilities of Hennessy Balanced Fund (the Fund), a series of Hennessy Funds Trust, including the schedule of investments, as of October 31, 2015, and the related statement of operations for the year then ended, the statements of changes in net assets for each of the years in the two-year period then ended, and the financial highlights for each of the years in the five-year period then ended. These financial statements and financial highlights are the responsibility of the Fund’s management. Our responsibility is to express an opinion on these financial statements and financial highlights based on our audits.
We conducted our audits in accordance with the standards of the Public Company Accounting Oversight Board (United States). Those standards require that we plan and perform the audit to obtain reasonable assurance about whether the financial statements and financial highlights are free of material misstatement. An audit includes examining, on a test basis, evidence supporting the amounts and disclosures in the financial statements. Our procedures included confirmation of investments owned as of October 31, 2015, by correspondence with the custodian and brokers or by other appropriate auditing procedures. An audit also includes assessing the accounting principles used and significant estimates made by management, as well as evaluating the overall financial statement presentation. We believe that our audits provide a reasonable basis for our opinion.
In our opinion, the financial statements and financial highlights referred to above present fairly, in all material respects, the financial position of the Fund as of October 31, 2015, and the results of its operations for the year then ended, the changes in its net assets for each of the years in the two-year period then ended, and the financial highlights for each of the years in the five-year period then ended, in conformity with U.S. generally accepted accounting principles.
Milwaukee, Wisconsin
December 23, 2015
| HENNESSY FUNDS | 1-800-966-4354 | |
Trustees and Officers of the Fund (Unaudited)
The business and affairs of the Fund are managed under the direction of the Board of Trustees of the Trust, and the Board of Trustees elects the Officers of the Trust. Information pertaining to the Trustees and the Officers of the Trust is set forth below. Such persons serve until their successors are duly elected and qualified or until their earlier death, resignation, or removal. Each of the Trustees oversees 16 Hennessy Funds. Unless otherwise indicated, the address of all persons listed below is 7250 Redwood Boulevard, Suite 200, Novato, CA 94945. The Fund’s Statement of Additional Information includes more information about the persons listed below and is available, without charge, upon request by calling 1-800-966-4354.
| | | | Other |
| | | | Directorships |
| Name, Year of Birth, | | | (During Past |
| and Position Held | Length of | Principal Occupation(s) | Five Years) |
with the Trust | Time Served | During Past Five Years | Held by Trustee(1) |
| | | | |
| Disinterested Trustees | | | |
| | | | |
| J. Dennis DeSousa (1936) | Since January | Mr. DeSousa is a real estate investor. | Hennessy SPARX |
| Trustee | 1996 for the | | Funds Trust; |
| | Hennessy Funds | | Hennessy Mutual |
| | | | Funds, Inc.; and |
| | | | The Hennessy |
| | | | Funds, Inc. |
| | | | |
| Robert T. Doyle (1947) | Since January | Mr. Doyle has been the Sheriff of | Hennessy SPARX |
| Trustee | 1996 for the | Marin County, California since 1996. | Funds Trust; |
| | Hennessy Funds | | Hennessy Mutual |
| | | | Funds, Inc.; and |
| | | | The Hennessy |
| | | | Funds, Inc. |
| | | | |
| Gerald P. Richardson (1945) | Since May | Mr. Richardson is an independent | Hennessy SPARX |
| Trustee | 2004 for the | consultant in the securities industry. | Funds Trust; |
| | Hennessy Funds | | Hennessy Mutual |
| | | | Funds, Inc.; and |
| | | | The Hennessy |
| | | | Funds, Inc. |
| | | | |
Interested Trustee(2) | | | |
| | | | |
| Neil J. Hennessy (1956) | Since January | Mr. Hennessy has been employed by | Hennessy Advisors, |
| Trustee, Chairman of | 1996 as a Trustee | Hennessy Advisors, Inc., the Funds’ | Inc.; Hennessy |
| the Board, Chief | for the Hennessy | investment advisor, since 1989. | SPARX Funds Trust; |
| Investment Officer, | Funds and since | He currently serves as President, | Hennessy Mutual |
| Portfolio Manager, | June 2008 as | Chairman and Chief Executive Officer | Funds, Inc.; and |
| and President | an Officer of the | of Hennessy Advisors, Inc. | The Hennessy |
| | Hennessy Funds | | Funds, Inc. |
| Name, Year of Birth, | | |
| and Position Held | Length of | Principal Occupation(s) |
with the Trust | Time Served | During Past Five Years |
| | | |
| Officers | | |
| | | |
| Teresa M. Nilsen (1966) | Since January | Ms. Nilsen has been employed by Hennessy Advisors, Inc., |
| Executive Vice President | 1996 for the | the Funds’ investment advisor, since 1989. She currently |
| and Treasurer | Hennessy Funds | serves as Executive Vice President, Chief Operations Officer, |
| | | Chief Financial Officer, and Secretary of Hennessy Advisors, Inc. |
| | | |
| Daniel B. Steadman (1956) | Since March | Mr. Steadman has been employed by Hennessy Advisors, Inc., |
| Executive Vice President | 2000 for the | the Funds’ investment advisor, since 2000. He currently serves |
| and Secretary | Hennessy Funds | as Executive Vice President and Chief Compliance Officer of |
| | | Hennessy Advisors, Inc. |
| | | |
| Jennifer Cheskiewicz (1977) | Since June | Ms. Cheskiewicz has been employed by Hennessy Advisors, |
| Senior Vice President and | 2013 for the | Inc., the Funds’ investment advisor, since June 2013. She |
| Chief Compliance Officer | Hennessy Funds | currently serves as General Counsel of Hennessy Advisors, Inc. |
| | | |
| | | She previously served as in-house counsel to Carlson Capital, |
| | | L.P., an SEC-registered investment advisor to several private |
| | | funds from February 2010 to May 2013. |
| | | |
| Brian Carlson (1972) | Since December | Mr. Carlson has been employed by Hennessy Advisors, Inc., the |
| Senior Vice President and | 2013 for the | Funds’ investment advisor, since December 2013. |
| Head of Distribution | | |
| | Hennessy Funds | Mr. Carlson was previously a co-founder and principal of |
| | | Trivium Consultants, LLC from February 2011 through |
| | | November 2013. |
| | | |
David Ellison (1958)(3) | Since October | Mr. Ellison has served as a Portfolio Manager of the Hennessy |
| Senior Vice President and | 2012 for the | Small Cap Financial Fund, the Hennessy Large Cap Financial |
| Portfolio Manager | Hennessy Funds | Fund, and the Hennessy Technology Fund since inception. |
| | | |
| | | Mr. Ellison previously served as Director, CIO and President of |
| | | FBR Fund Advisers, Inc. from December 1999 to October 2012. |
| | | |
| Brian Peery (1969) | Since March | Mr. Peery has served as a Portfolio Manager of the Hennessy |
| Senior Vice President and | 2003 as an | Cornerstone Growth Fund, the Hennessy Cornerstone Mid Cap |
| Portfolio Manager | Officer of the | 30 Fund, the Hennessy Cornerstone Large Growth Fund, the |
| | Hennessy Funds | Hennessy Cornerstone Value Fund, the Hennessy Total Return |
| | and since | Fund, and the Hennessy Balanced Fund since October 2014. |
| | February 2011 | From February 2011 through September 2014, he served as |
| | as a Co-Portfolio | Co-Portfolio Manager of the same funds. Mr. Peery has also |
| | Manager or | served as a Portfolio Manager of the Hennessy Gas Utility Fund |
| | Portfolio Manager | since February 2015. |
| | for the | |
| | Hennessy Funds | Mr. Peery has been employed by Hennessy Advisors, Inc., the |
| | | Funds’ investment advisor, since 2002. |
| | | |
| Winsor (Skip) Aylesworth | Since October | Mr. Aylesworth has served as a Portfolio Manager of the |
(1947)(3) | 2012 for the | Hennessy Gas Utility Fund since 1998 and as a Portfolio |
| Vice President and | Hennessy Funds | Manager of the Hennessy Technology Fund since inception. |
| Portfolio Manager | | |
| | | Mr. Aylesworth previously served as Executive Vice President |
| | | of The FBR Funds from 1999 to October 2012. |
| HENNESSY FUNDS | 1-800-966-4354 | |
| Name, Year of Birth, | | |
| and Position Held | Length of | Principal Occupation(s) |
with the Trust | Time Served | During Past Five Years |
| | | |
Ryan Kelley (1972)(4) | Since March | Mr. Kelley has served as a Portfolio Manager of the Hennessy |
| Vice President and | 2013 for the | Gas Utility Fund, the Hennessy Small Cap Financial Fund, and |
| Portfolio Manager | Hennessy Funds | the Hennessy Large Cap Financial Fund since October 2014. |
| | | From March 2013 through September 2014, he served as a |
| | | Co-Portfolio Manager of the same funds. Prior to that, |
| | | he was a Portfolio Analyst of the Hennessy Funds. |
(1) | Pursuant to an internal reorganization, the series of Hennessy Mutual Funds, Inc. (“HMFI”), The Hennessy Funds, Inc. (“HFI”), and Hennessy SPARX Funds Trust (“HSFT”) were reorganized into series of Hennessy Funds Trust on February 28, 2014, which mirrored the corresponding series of HFMI, HFI, and HSFT. Subsequent to the reorganization, HFMI, HFI, and HSFT were dissolved. |
(2) | Mr. Hennessy is considered an “interested person,” as defined in the Investment Company Act of 1940, as amended, because he is an officer of the Hennessy Funds. |
(3) | The address of these officers is 101 Federal Street, Suite 1900, Boston, MA 02110. |
(4) | The address of this officer is 1340 Environ Way, Chapel Hill, NC 27517. |
(This Page Intentionally Left Blank.)
| HENNESSY FUNDS | 1-800-966-4354 | |
Expense Example (Unaudited)
October 31, 2015
As a shareholder of the Fund, you incur two types of costs: (1) transaction costs, including sales charges (loads) on purchase payments, reinvested dividends, or other distributions; redemption fees; and exchange fees; and (2) ongoing costs, including management fees; service fees; and other Fund expenses. This Example is intended to help you understand your ongoing costs (in dollars) of investing in the Fund and to compare these costs with the ongoing costs of investing in other mutual funds. The Example is based on an investment of $1,000 invested at the beginning of the period and held for the entire period from May 1, 2015 through October 31, 2015.
Actual Expenses
The first line of the table below provides information about actual account values and actual expenses. Although the Fund charges no sales loads or transaction fees, you will be assessed fees for outgoing wire transfers, returned checks and stop payment orders at prevailing rates charged by U.S. Bancorp Fund Services, LLC, the Fund’s transfer agent. If you request that a redemption be made by wire transfer, currently a $15.00 fee is charged by the Fund’s transfer agent. IRA accounts will be charged a $15.00 annual maintenance fee. The example below includes, but is not limited to, management fees, shareholder servicing fees, fund accounting, custody, and transfer agent fees. However, the example below does not include portfolio trading commissions and related expenses, and other extraordinary expenses as determined under generally accepted accounting principles. You may use the information in this line, together with the amount you invested, to estimate the expenses that you paid over the period. Simply divide your account value by $1,000 (for example, an $8,600 account value divided by $1,000 = 8.6), then multiply the result by the number in the first line of the table under the heading entitled “Expenses Paid During Period” to estimate the expenses you paid on your account during this period.
Hypothetical Example for Comparison Purposes
The second line of the table below provides information about hypothetical account values and hypothetical expenses based on the Fund’s actual expense ratios and an assumed rate of return of 5% per year before expenses, which is not the Fund’s actual return. The hypothetical account values and expenses may not be used to estimate the actual ending account balance or expenses you paid for the period. You may use this information to compare the ongoing costs of investing in the Fund and other funds. To do so, compare this 5% hypothetical example with the 5% hypothetical examples that appear in the shareholder reports of the other funds. Please note that the expenses shown in the table are meant to highlight your ongoing costs only and do not reflect any transactional costs, such as sales charges (loads), or exchange fees. Therefore, the second line of the table is useful in comparing ongoing costs only, and will not help you determine the relative total costs of owning different funds. In addition, if these transactional costs were included, your costs would have been higher.
| | | | Expenses Paid |
| | Beginning | Ending | During Period(1) |
| | Account Value | Account Value | May 1, 2015 – |
| | May 1, 2015 | October 31, 2015 | October 31, 2015 |
| Investor Class | | | |
| Actual | $1,000.00 | $ 990.20 | $8.58 |
| Hypothetical (5% return before expenses) | $1,000.00 | $1,016.59 | $8.69 |
(1) | Expenses are equal to the Fund’s annualized expense ratio of 1.71% multiplied by the average account value over the period, multiplied by 184/365 days (to reflect one-half year period). |
| HENNESSY FUNDS | 1-800-966-4354 | |
How to Obtain a Copy of the Fund’s
Proxy Voting Policy and Proxy Voting Records
A description of the policies and procedures the Fund uses to determine how to vote proxies relating to portfolio securities is available without charge: (1) by calling 1-800-966-4354; (2) on the Hennessy Funds’ website at hennessyfunds.com/proxy-voting/policy.fs; or (3) on the U.S. Securities and Exchange Commission’s website at www.sec.gov. The Fund’s proxy voting record is available without charge on both the Hennessy Funds’ website at hennessyfunds.com/proxy-voting/policy.fs and the SEC’s website at www.sec.gov no later than August 31 for the prior 12 months ending June 30.
Quarterly Filings on Form N-Q
The Fund files its complete schedule of portfolio holdings with the SEC for the first and third quarters of each fiscal year on Form N-Q. The Fund’s Form N-Q will be available on the SEC’s website at www.sec.gov. The Fund’s Form N-Q may be reviewed and copied at the SEC’s Public Reference Room in Washington, DC and information on the operation of the Public Reference Room may be obtained by calling 1-800-SEC-0330. Information included in the Fund’s N-Q will also be available upon request by calling 1-800-966-4354.
Federal Tax Distribution Information
(Unaudited)
For the fiscal year ended October 31, 2015, certain dividends paid by the Fund may be subject to a maximum tax rate of 23.8%, as provided for by the Jobs and Growth Tax Relief Reconciliation Act of 2003. The percentage of dividends declared from ordinary income designated as qualified dividend income was 100.00%.
For corporate shareholders, the percent of ordinary income distributions that qualified for the corporate dividends received deduction for the fiscal year ended October 31, 2015 was 100.00%.
The percentage of taxable ordinary income distributions that are designated as short-term capital gain distributions under Section 871(k)(2)(C) of the Internal Revenue Code of 1986, as amended, for the Fund was 23.33%.
Householding
To help keep the Fund’s costs as low as possible, we generally deliver a single copy of most financial reports and prospectuses to shareholders who share an address, even if the accounts are registered under different names. This process, known as “householding,” does not apply to account statements. You may, of course, request an individual copy of a prospectus or financial report at any time. If you would like to receive separate mailings, please call the Administrator at 1-800-261-6950 or 1-414-765-4124 and we will begin individual delivery within 30 days of your request. If your account is held through a financial institution or other intermediary, please contact them directly to request individual delivery.
Privacy Policy
We collect the following non-public personal information about you:
| | • | information we receive from you on or in applications or other forms, correspondence, or conversations, including, but not limited to, your name, address, phone number, social security number, assets, income, and date of birth; and |
| | | |
| | • | information about your transactions with us, our affiliates, or others, including, but not limited to, your account number and balance, payment history, parties to transactions, cost basis information, and other financial information. |
We do not disclose any non-public personal information about our current or former shareholders to nonaffiliated third parties, except as permitted by law. For example, we are permitted by law to disclose all of the information we collect, as described above, to our Transfer Agent to process your transactions. Furthermore, we restrict access to your non-public personal information to those persons who require such information to provide products or services to you. We maintain physical, electronic, and procedural safeguards that comply with federal standards to guard your non-public personal information.
In the event that you hold shares of the Fund through a financial intermediary, including, but not limited to, a broker-dealer, bank or trust company, the privacy policy of your financial intermediary would govern how your non-public personal information would be shared with nonaffiliated third parties.
| HENNESSY FUNDS | 1-800-966-4354 | |
(This Page Intentionally Left Blank.)
(This Page Intentionally Left Blank.)
For information, questions or assistance, please call
The Hennessy Funds
1-800-966-4354 or 1-415-899-1555
INVESTMENT ADVISOR
Hennessy Advisors, Inc.
7250 Redwood Blvd., Suite 200
Novato, California 94945
ADMINISTRATOR,
TRANSFER AGENT,
DIVIDEND PAYING AGENT &
SHAREHOLDER SERVICING AGENT
U.S. Bancorp Fund Services, LLC
P.O. Box 701
Milwaukee, Wisconsin 53201-0701
CUSTODIAN
U.S. Bank N.A.
Custody Operations
1555 North River Center Dr., Suite 302
Milwaukee, Wisconsin 53212
TRUSTEES
Neil J. Hennessy
Robert T. Doyle
J. Dennis DeSousa
Gerald P. Richardson
COUNSEL
Foley & Lardner LLP
777 East Wisconsin Avenue
Milwaukee, Wisconsin 53202-5306
INDEPENDENT REGISTERED
PUBLIC ACCOUNTING FIRM
KPMG LLP
777 East Wisconsin Avenue
Milwaukee, Wisconsin 53202-5306
DISTRIBUTOR
Quasar Distributors, LLC
615 East Michigan Street
Milwaukee, Wisconsin 53202
hennessyfunds.com | 1-800-966-4354
This report has been prepared for shareholders and may be distributed to
others only if preceded or accompanied by a current prospectus.
ANNUAL REPORT
OCTOBER 31, 2015
HENNESSY CORE BOND FUND
Investor Class HCBFX
Institutional Class HCBIX
hennessyfunds.com | 1-800-966-4354
(This Page Intentionally Left Blank.)
Contents
| Letter to Shareholders | 2 |
| Performance Overview | 4 |
| Financial Statements | |
| Schedule of Investments | 6 |
| Statement of Assets and Liabilities | 12 |
| Statement of Operations | 13 |
| Statements of Changes in Net Assets | 14 |
| Financial Highlights | 16 |
| Notes to the Financial Statements | 20 |
| Report of Independent Registered Public Accounting Firm | 28 |
| Trustees and Officers of the Fund | 29 |
| Expense Example | 32 |
| Proxy Voting | 34 |
| Quarterly Filings on Form N-Q | 34 |
| Federal Tax Distribution Information | 34 |
| Householding | 34 |
| Privacy Policy | 35 |
| HENNESSY FUNDS | 1-800-966-4354 | |
December 2015
Dear Hennessy Funds Shareholder:
As I look back over the year, I am reminded that the U.S. economy has come a long way since the depths of the recession in 2009. The economy has been expanding steadily for almost six years, the unemployment rate has halved, the housing market has been recovering and capital expenditures have been growing. The financial markets have performed well too, driven largely by strong corporate earnings growth, especially in the early years. The U.S. market, as measured by the S&P 500 Index, has roughly tripled since the bull market began in 2009, and the Index’s earnings per share have increased 260% over this same time period. For the year ended October 31, 2015, the U.S. equity market performed reasonably well, with the S&P 500 posting another advance of 5.2%. However, behind this headline number, the market experienced a great deal of volatility as investors reacted to falling energy prices, a rise in the U.S. Dollar, pressure on export earnings growth, slower growth in China and, most significantly, the likelihood of a rise in the Fed Funds rate for the first time in nearly a decade – the featured topic of conversation around every office water cooler in the financial world this year.
Investors, reporters and friends often ask me “What’s next?” The market has been in a volatile, sideways correction for over a year now, and throughout this period of volatility, I have consistently advised investors to continue to focus on the long-term fundamentals of the market.
In my view, the fundamentals of the market are in good shape. Despite a stronger U.S. Dollar and its impact on export growth, the economy is still growing steadily. Inflation remains low, so we expect the Federal Reserve, once it does begin to raise short-term interest rates, will not likely raise them by very much. New jobs are being created at what I believe is a healthy rate, and average hourly wages are rising in response to a tighter labor market. Higher wages and lower gasoline prices are helping to keep consumer confidence positive.
Notwithstanding what I view as a relatively solid economic environment, however, I think investor sentiment remains restrained. The same factors that contributed to the market volatility this past year are still troubling investors today: the slowdown in the Chinese economy, slower earnings growth here in the U.S., and, of course, the prospect of rising interest rates. As a result of these investor worries, I do not see any solid enthusiasm for the market – no euphoria. Universal optimism about the market often coincides with a peak in stock prices and this absence of euphoria is yet another reason I feel bullish. And finally, I do not believe stocks are expensive. The Dow Jones Industrial Average and the S&P 500 Index have forward PE (price-to-earnings) ratios of approximately 16x and 17x, respectively, close to long-term averages. In my view, these fundamentals taken together signal a continuation of the bull market that began six years ago.
A final positive note: I still do not believe that investors have fully returned to investing in U.S. equities. Assets in domestic equity funds have now reached parity with fixed income/money market funds, with $6.2 trillion in each. I believe that fixed income investments will continue to trickle into equities, which should have a positive effect on the market.
Thank you for your continued confidence and investment in our products. If you have any questions or would like to speak with us directly, please don’t hesitate to call us at (800) 966-4354.
Best regards,
Neil J. Hennessy
President and Chief Investment Officer
Past performance does not guarantee future results.
Mutual fund investing involves risk. Principal loss is possible.
Opinions expressed are those of Neil Hennessy and are subject to change, are not guaranteed and should not be considered investment advice.
The Dow Jones Industrial Average and the S&P 500 Index are unmanaged indices commonly used to measure the performance of U.S. stocks. One cannot invest directly in an index.
Price to earnings (“PE”) is the market price per share divided by earnings per share. Earnings per share is the portion of a company’s profit allocated to each outstanding share of common stock. It serves as an indicator of a company’s profitability.
| HENNESSY FUNDS | 1-800-966-4354 | |
Performance Overview (Unaudited)
CHANGE IN VALUE OF $10,000 INVESTMENT
This graph illustrates the performance of an initial investment of $10,000 made in the Fund ten years ago and assumes the reinvestment of dividends.
AVERAGE ANNUAL TOTAL RETURN FOR PERIODS ENDED OCTOBER 31, 2015
| | One | Five | Ten |
| | Year | Years | Years |
| Hennessy Core Bond Fund – | | | |
| Investor Class (HCBFX) | -0.50% | 2.17% | 4.47% |
| Hennessy Core Bond Fund – | | | |
| Institutional Class (HCBIX) | -0.06% | 2.45% | 4.74% |
| Barclays Capital Intermediate | | | |
| U.S. Government/Credit Index | 1.86% | 2.30% | 4.22% |
Expense ratios: 2.94% (Investor Class); 2.60% (Institutional Class)
Performance data quoted represents past performance; past performance does not guarantee future results. The investment return and principal value of an investment will fluctuate so that an investor’s shares, when redeemed, may be worth more or less than their original cost. The performance graph and table do not reflect the deduction of taxes that a shareholder would pay on Fund distributions or the redemption of Fund shares. Current performance of the Fund may be lower or higher than the performance quoted. Performance data current to the most recent month end may be obtained by visiting hennessyfunds.com. Performance for the period from March 12, 2010 to October 26, 2012 is that of the FBR Core Bond Fund and for the periods prior to March 12, 2010 is that of the AFBA 5 Star Total Return Bond Fund.
The expense ratios presented are from the most recent prospectus.
PERFORMANCE NARRATIVE
Portfolio Managers Gary B. Cloud, CFA, and Peter G. Greig, CFA
Financial Counselors, Inc. (sub-advisor)
Performance:
For the twelve-month period ended October 31, 2015, the Investor Class of the Hennessy Core Bond Fund returned -0.50%, underperforming the Barclays Intermediate U.S. Government/Credit Index, which returned 1.86% for the same period.
The Fund’s overweight position in investment grade corporate credit accounted for most of the underperformance of the Fund over the year. The Fund’s exposure to high yield credit securities, or junk bonds, also detracted from performance. Higher-yielding investment grade securities in the Fund contributed most positively to overall relative performance. Duration and yield curve-related factors were neutral drivers on relative Fund performance for the period.
Investment Outlook:
The Federal Reserve is contemplating the first rise in short term rates in nearly a decade. While we believe the Fed will raise rates only gradually, a steep hike in U.S. rates, while our major trading partners keep their interest rates unchanged or maybe even cut them a little, would likely lead to another sharp drop in commodity prices, a further rally in the U.S. Dollar, and create deflationary pressures strong enough to cause negative economic growth and falling prices. We do not believe this chain of events will come about. We believe the Fed is inherently cautious and is constantly modifying its forecast as the data changes. If global economic activity data remain steady, but subpar, we expect the pace and slope of future Fed rate adjustments to decline and thereby allow international growth rates to become better aligned. This should be positive for our overweight in corporate credit because it will reduce the likelihood of long-term interest rates breaking out of their multi-year range.
Opinions expressed are those of the Portfolio Managers as of the date written and are subject to change, are not guaranteed, and should not be considered investment advice or an indication of trading intent.
The Barclays Capital Intermediate U.S. Government/Credit Index is an unmanaged index commonly used to measure the performance of U.S. bonds. One cannot invest directly in an index.
Investments in debt securities typically decrease in value when interest rates rise. The risk is greater for longer-term debt securities. Investments by the Fund in lower-rated and non-rated securities presents a greater risk of loss to principal and interest than higher-rated securities. Investments in Asset-Backed and Mortgage-Backed securities include additional risks that investors should be aware of including credit risk, prepayment risk, possible illiquidity and default, as well as increased susceptibility to adverse economic developments. Investments in foreign securities may involve political, economic and currency risks, greater volatility and differences in accounting methods. The Fund may experience higher fees due to investments in pooled investment vehicles (including ETFs).
References to specific securities should not be considered a recommendation to buy or sell any security. Fund holdings and sector allocations are subject to change. Please refer to the Schedule of Investments included in this report for additional portfolio information.
| HENNESSY FUNDS | 1-800-966-4354 | |
Financial Statements
Schedule of Investments as of October 31, 2015 |
HENNESSY CORE BOND FUND
(% of Net Assets)
| TOP TEN HOLDINGS (EXCLUDING CASH/CASH EQUIVALENTS) | % NET ASSETS |
| U.S. Treasury Note, 2.750%, 02/15/2024 | 8.91% |
| Federal National Mortgage Association, 3.000%, 08/01/2042 | 7.04% |
| The Hartford Financial Services Group, Inc., 5.375%, 03/15/2017 | 4.94% |
| Ford Motor Credit Co. LLC, 3.000%, 06/12/2017 | 4.89% |
| Associated Banc-Corp, 5.125%, 03/28/2016 | 4.75% |
| Associates Corporation of North America, 6.950%, 11/01/2018 | 4.68% |
| U.S. Treasury Note, 2.500%, 08/15/2023 | 4.51% |
| Agilent Technologies, Inc., 5.000%, 07/15/2020 | 4.41% |
| Discover Financial Services, 5.200%, 04/27/2022 | 4.40% |
| YUM! Brands, Inc., 5.300%, 09/15/2019 | 4.29% |
Note: For presentation purposes, the Fund has grouped some of the industry categories. For purposes of categorizing securities for compliance with Section 8(b)(1) of the Investment Company Act of 1940, as amended, the Fund uses more specific industry classifications.
| PREFERRED STOCKS – 8.01% | | Number of Shares/ | | | | | | % of | |
| | | Par Amount | | | Value | | | Net Assets | |
| Consumer Staples – 0.28% | | | | | | | | | |
| CHS, Inc. | | | 430 | | | $ | 11,941 | | | | 0.28 | % |
| | | | | | | | | | | | | |
| Construction – 0.33% | | | | | | | | | | | | |
| SCE Trust I | | | 540 | | | | 13,857 | | | | 0.33 | % |
| | | | | | | | | | | | | |
| Financials – 7.40% | | | | | | | | | | | | |
| Aegon N V (b) | | | 175 | | | | 4,480 | | | | 0.11 | % |
| Allstate Corp. | | | 500 | | | | 13,595 | | | | 0.32 | % |
| Bank of America Corp. | | | 325 | | | | 8,626 | | | | 0.20 | % |
| Bank of New York Mellon Corp. | | | 540 | | | | 13,873 | | | | 0.33 | % |
| BB&T Corp. | | | 555 | | | | 13,781 | | | | 0.32 | % |
| Capital One Financial Corp. | | | 535 | | | | 13,712 | | | | 0.32 | % |
| Citigroup, Inc. | | | 335 | | | | 8,405 | | | | 0.20 | % |
| Discover Financial Services | | | 510 | | | | 13,612 | | | | 0.32 | % |
| Fannie Mae Preferred (a) | | | 7,900 | | | | 37,335 | | | | 0.88 | % |
| First Republic Bank of San Francisco | | | 395 | | | | 9,840 | | | | 0.23 | % |
| HSBC Finance Corp. | | | 175 | | | | 4,438 | | | | 0.10 | % |
| JPMorgan Chase & Co. (a) | | | 535 | | | | 13,487 | | | | 0.32 | % |
| KKR Financial Holdings LLC | | | 315 | | | | 8,338 | | | | 0.20 | % |
| MetLife, Inc. | | | 550 | | | | 13,431 | | | | 0.31 | % |
| Morgan Stanley | | | 320 | | | | 8,563 | | | | 0.20 | % |
| Northern Trust Corp. | | | 525 | | | | 13,792 | | | | 0.32 | % |
| PNC Financial Services Group, Inc. | | | 540 | | | | 13,700 | | | | 0.32 | % |
| RBS Capital Funding Trust V | | | 465 | | | | 11,462 | | | | 0.27 | % |
| Regions Financial Corp. | | | 530 | | | | 13,780 | | | | 0.32 | % |
| State Street Corp. | | | 520 | | | | 13,842 | | | | 0.32 | % |
| SunTrust Banks, Inc. | | | 535 | | | | 13,605 | | | | 0.32 | % |
| The Charles Schwab Corp. (a) | | | 530 | | | | 13,732 | | | | 0.32 | % |
| The Goldman Sachs Group, Inc. | | | 330 | | | | 8,441 | | | | 0.20 | % |
| U.S. Bancorp (d) | | | 535 | | | | 13,552 | | | | 0.32 | % |
| Wells Fargo & Co. (a) | | | 535 | | | | 13,835 | | | | 0.33 | % |
| | | | | | | | 315,257 | | | | 7.40 | % |
| Total Preferred Stocks | | | | | | | | | | | | |
| (Cost $495,251) | | | | | | | 341,055 | | | | 8.01 | % |
The accompanying notes are an integral part of these financial statements.
| HENNESSY FUNDS | 1-800-966-4354 | |
| REITS – 2.34% | | Number of Shares/ | | | | | | % of | |
| | | Par Amount | | | Value | | | Net Assets | |
| Financials – 2.34% | | | | | | | | | |
| Apollo Commercial Real Estate Finance, Inc. | | | 6,000 | | | $ | 99,660 | | | | 2.34 | % |
| | | | | | | | | | | | | |
| Total REITS | | | | | | | | | | | | |
| (Cost $99,299) | | | | | | | 99,660 | | | | 2.34 | % |
| | | | | | | | | | | | | |
| CORPORATE BONDS – 50.01% | | | | | | | | | | | | |
| | | | | | | | | | | | | |
| Consumer Discretionary – 7.79% | | | | | | | | | | | | |
| Amazon.com, Inc., 2.500%, 11/29/2022 | | | 75,000 | | | | 73,331 | | | | 1.72 | % |
| Time Warner, Inc., 3.400%, 06/15/2022 | | | 75,000 | | | | 76,172 | | | | 1.78 | % |
| YUM! Brands, Inc., 5.300%, 09/15/2019 | | | 175,000 | | | | 182,842 | | | | 4.29 | % |
| | | | | | | | 332,345 | | | | 7.79 | % |
| | | | | | | | | | | | | |
| Financials – 30.04% | | | | | | | | | | | | |
| Associated Banc-Corp, 5.125%, 03/28/2016 | | | 200,000 | | | | 202,500 | | | | 4.75 | % |
| Associates Corporation of North America, 6.950%, 11/01/2018 | | | 175,000 | | | | 199,243 | | | | 4.68 | % |
| Citigroup, Inc., 6.125%, 11/21/2017 | | | 70,000 | | | | 76,161 | | | | 1.79 | % |
| Discover Financial Services, 5.200%, 04/27/2022 | | | 175,000 | | | | 187,648 | | | | 4.40 | % |
| Ford Motor Credit Co. LLC, 3.000%, 06/12/2017 | | | 205,000 | | | | 208,254 | | | | 4.89 | % |
| Lazard Group, 6.850%, 06/15/2017 | | | 37,000 | | | | 39,674 | | | | 0.93 | % |
| Merrill Lynch Co., Inc., 6.400%, 08/28/2017 | | | 70,000 | | | | 75,862 | | | | 1.78 | % |
| The Goldman Sachs Group, Inc., 6.000%, 06/15/2020 | | | 70,000 | | | | 80,237 | | | | 1.88 | % |
| The Hartford Financial Services Group, Inc., 5.375%, 03/15/2017 | | | 200,000 | | | | 210,515 | | | | 4.94 | % |
| | | | | | | | 1,280,094 | | | | 30.04 | % |
| | | | | | | | | | | | | |
| Health Care – 6.76% | | | | | | | | | | | | |
| Agilent Technologies, Inc., 5.000%, 07/15/2020 | | | 175,000 | | | | 188,262 | | | | 4.41 | % |
| Celgene Corp., 3.625%, 05/15/2024 | | | 100,000 | | | | 100,010 | | | | 2.35 | % |
| | | | | | | | 288,272 | | | | 6.76 | % |
| | | | | | | | | | | | | |
| Telecommunication Services – 3.48% | | | | | | | | | | | | |
| AT&T, Inc., 5.500%, 02/01/2018 | | | 70,000 | | | | 75,776 | | | | 1.78 | % |
| Verizon Communications, Inc., 2.450%, 11/01/2022 | | | 75,000 | | | | 72,351 | | | | 1.70 | % |
| | | | | | | | 148,127 | | | | 3.48 | % |
| | | | | | | | | | | | | |
| Utilities – 1.94% | | | | | | | | | | | | |
| Sempra Energy, 6.500%, 06/01/2016 | | | 80,000 | | | | 82,514 | | | | 1.94 | % |
| | | | | | | | | | | | | |
| Total Corporate Bonds | | | | | | | | | | | | |
| (Cost $2,097,526) | | | | | | | 2,131,352 | | | | 50.01 | % |
The accompanying notes are an integral part of these financial statements.
| MORTGAGE BACKED SECURITIES – 10.56% | | Par | | | | | | % of | |
| | | Amount | | | Value | | | Net Assets | |
| Federal National Mortgage Association | | | | | | | | | |
| 0.000%, 10/29/2018 | | | 150,000 | | | $ | 149,879 | | | | 3.52 | % |
| 3.000%, 08/01/2042 | | | 295,724 | | | | 299,904 | | | | 7.04 | % |
| | | | | | | | | | | | | |
| Total Mortgage Backed Securities | | | | | | | | | | | | |
| (Cost $453,643) | | | | | | | 449,783 | | | | 10.56 | % |
| | | | | | | | | | | | | |
| U.S. TREASURY OBLIGATIONS – 24.10% | | | | | | | | | | | | |
| | | | | | | | | | | | | |
| U.S. Treasury Notes – 24.10% | | | | | | | | | | | | |
| U.S. Treasury Notes | | | | | | | | | | | | |
| 1.625%, 04/30/2019 | | | 160,000 | | | | 162,216 | | | | 3.81 | % |
| 2.125%, 05/15/2025 | | | 165,000 | | | | 164,681 | | | | 3.87 | % |
| 2.500%, 08/15/2023 | | | 185,000 | | | | 192,019 | | | | 4.51 | % |
| 2.750%, 02/15/2024 | | | 360,000 | | | | 379,639 | | | | 8.91 | % |
| 3.250%, 03/31/2017 | | | 65,000 | | | | 67,438 | | | | 1.58 | % |
| 3.625%, 02/15/2021 | | | 55,000 | | | | 60,570 | | | | 1.42 | % |
| | | | | | | | 1,026,563 | | | | 24.10 | % |
| Total U.S. Treasury Obligations | | | | | | | | | | | | |
| (Cost $1,019,763) | | | | | | | 1,026,563 | | | | 24.10 | % |
| | | | | | | | | | | | | |
| INVESTMENT COMPANIES (EXCLUDING | | | | | | | | | | | | |
| MONEY MARKET FUNDS) – 3.85% | | | | | | | | | | | | |
| iShares iBoxx $High Yield Corporation Bond Fund | | | 960 | | | | 82,147 | | | | 1.93 | % |
| SPDR Barclays Short Term High Yield | | | 3,000 | | | | 81,900 | | | | 1.92 | % |
| | | | | | | | | | | | | |
| Total Investment Companies (Excluding | | | | | | | | | | | | |
| Money Market Funds) | | | | | | | | | | | | |
| (Cost $181,891) | | | | | | | 164,047 | | | | 3.85 | % |
The accompanying notes are an integral part of these financial statements.
| HENNESSY FUNDS | 1-800-966-4354 | |
| SHORT-TERM INVESTMENTS – 4.61% | | Number | | | | | | % of | |
| | | of Shares | | | Value | | | Net Assets | |
| Money Market Funds – 4.61% | | | | | | | | | |
| Fidelity Government Portfolio – | | | | | | | | | |
| Institutional Class, 0.01% (c) | | | 196,346 | | | $ | 196,346 | | | | 4.61 | % |
| | | | | | | | | | | | | |
| Total Short-Term Investments | | | | | | | | | | | | |
| (Cost $196,346) | | | | | | | 196,346 | | | | 4.61 | % |
| | | | | | | | | | | | | |
| Total Investments | | | | | | | | | | | | |
| (Cost $4,543,719) – 103.48% | | | | | | | 4,408,806 | | | | 103.48 | % |
| Other Assets in | | | | | | | | | | | | |
| Excess of Liabilities – (3.48)% | | | | | | | (148,266 | ) | | | (3.48 | )% |
TOTAL NET ASSETS – 100.00% | | | | | | $ | 4,260,540 | | | | 100.00 | % |
Percentages are stated as a percent of net assets.
REIT – Real Estate Investment Trust
| (a) | Non-income producing security. |
| (b) | U.S. traded security of a foreign corporation. |
| (c) | The rate listed is the fund’s 7-day yield as of October 31, 2015. |
| (d) | Investment in affiliated security. Quasar Distributors, LLC, which serves as the Fund’s distributor, is a subsidiary of U.S. Bancorp. Details of transactions with this affiliated company for the year ended October 31, 2015, are as follows: |
| | Issuer | | U.S. Bancorp | |
| | Beginning Cost | | $ | — | |
| | Purchase Cost | | $ | 13,348 | |
| | Sales Cost | | $ | — | |
| | Ending Cost | | $ | 13,348 | |
| | Dividend Income | | $ | 172 | |
| | Shares | | | 535 | |
| | Market Value | | $ | 13,552 | |
The accompanying notes are an integral part of these financial statements.
Summary of Fair Value Exposure at October 31, 2015
The following is a summary of the inputs used to value the Fund’s net assets as of October 31, 2015 (see Note 3 in the accompanying notes to the financial statements):
| Preferred Stocks | | Level 1 | | | Level 2 | | | Level 3 | | | Total | |
| Construction | | $ | 13,857 | | | $ | — | | | $ | — | | | $ | 13,857 | |
| Consumer Staples | | | 11,941 | | | | — | | | | — | | | | 11,941 | |
| Financials | | | 315,257 | | | | — | | | | — | | | | 315,257 | |
| Total Preferred Stocks | | $ | 341,055 | | | $ | — | | | $ | — | | | $ | 341,055 | |
| REITS | | | | | | | | | | | | | | | | |
| Financials | | $ | 99,660 | | | $ | — | | | $ | — | | | $ | 99,660 | |
| Total REITS | | $ | 99,660 | | | $ | — | | | $ | — | | | $ | 99,660 | |
| Corporate Bonds | | | | | | | | | | | | | | | | |
| Consumer Discretionary | | $ | — | | | $ | 332,345 | | | $ | — | | | $ | 332,345 | |
| Financials | | | — | | | | 1,280,094 | | | | — | | | | 1,280,094 | |
| Health Care | | | — | | | | 288,272 | | | | — | | | | 288,272 | |
| Telecommunication Services | | | — | | | | 148,127 | | | | — | | | | 148,127 | |
| Utilities | | | — | | | | 82,514 | | | | — | | | | 82,514 | |
| Total Corporate Bonds | | $ | — | | | $ | 2,131,352 | | | $ | — | | | $ | 2,131,352 | |
| Mortgage Backed Securities | | $ | — | | | $ | 449,783 | | | $ | — | | | $ | 449,783 | |
| U.S. Treasury Obligations | | | | | | | | | | | | | | | | |
| U.S. Treasury Notes | | $ | — | | | $ | 1,026,563 | | | $ | — | | | $ | 1,026,563 | |
| Total U.S. Treasury Obligations | | $ | — | | | $ | 1,026,563 | | | $ | — | | | $ | 1,026,563 | |
| Investment Companies (Excluding | | | | | | | | | | | | | | | | |
| Money Market Funds) | | $ | 164,047 | | | $ | — | | | $ | — | | | $ | 164,047 | |
| Short-Term Investments | | | | | | | | | | | | | | | | |
| Money Market Funds | | $ | 196,346 | | | $ | — | | | $ | — | | | $ | 196,346 | |
| Total Short-Term Investments | | $ | 196,346 | | | $ | — | | | $ | — | | | $ | 196,346 | |
| Total Investments | | $ | 801,108 | | | $ | 3,607,698 | | | $ | — | | | $ | 4,408,806 | |
Transfers between levels are recognized at the end of the reporting period. During the year ended October 31, 2015, the Fund recognized no transfers between levels.
The accompanying notes are an integral part of these financial statements.
| HENNESSY FUNDS | 1-800-966-4354 | |
Financial Statements
Statement of Assets and Liabilities as of October 31, 2015 |
| ASSETS: | | | |
| Investments in securities, at value (cost $4,530,371) | | $ | 4,395,254 | |
| Investments in affiliated securities, at value (cost $13,348) | | | 13,552 | |
| Total investments in securities (cost $4,543,719) | | | 4,408,806 | |
| Dividends and interest receivable | | | 35,100 | |
| Receivable for fund shares sold | | | 62 | |
| Prepaid expenses and other assets | | | 13,912 | |
| Total Assets | | | 4,457,880 | |
| | | | | |
| LIABILITIES: | | | | |
| Payable for securities purchased | | | 149,916 | |
| Payable for fund shares redeemed | | | 3,729 | |
| Payable to advisor | | | 2,916 | |
| Payable to administrator | | | 825 | |
| Payable to auditor | | | 20,258 | |
| Accrued distribution fees | | | 4,555 | |
| Accrued service fees | | | 161 | |
| Accrued trustees fees | | | 2,403 | |
| Accrued expenses and other payables | | | 12,577 | |
| Total Liabilities | | | 197,340 | |
| NET ASSETS | | $ | 4,260,540 | |
| | | | | |
| NET ASSETS CONSIST OF: | | | | |
| Capital stock | | $ | 4,346,171 | |
| Accumulated net realized gain on investments | | | 49,282 | |
| Unrealized net depreciation on investments | | | (134,913 | ) |
| Total Net Assets | | $ | 4,260,540 | |
| | | | | |
| NET ASSETS | | | | |
| Investor Class: | | | | |
| Shares authorized (no par value) | | Unlimited | |
| Net assets applicable to outstanding Investor Class shares | | $ | 1,867,466 | |
| Shares issued and outstanding | | | 252,257 | |
| Net asset value, offering price and redemption price per share | | $ | 7.40 | |
| | | | | |
| Institutional Class: | | | | |
| Shares authorized (no par value) | | Unlimited | |
| Net assets applicable to outstanding Institutional Class shares | | $ | 2,393,074 | |
| Shares issued and outstanding | | | 367,419 | |
| Net asset value, offering price and redemption price per share | | $ | 6.51 | |
The accompanying notes are an integral part of these financial statements.
Financial Statements
Statement of Operations for the year ended October 31, 2015 |
| INVESTMENT INCOME: | | | |
| Dividend income from unaffiliated securities | | $ | 35,295 | |
| Dividend income from affiliated securities | | | 172 | |
| Interest income | | | 134,536 | |
| Total investment income | | | 170,003 | |
| | | | | |
| EXPENSES: | | | | |
| Investment advisory fees (See Note 5) | | | 39,214 | |
| Federal and state registration fees | | | 27,682 | |
| Compliance expense | | | 22,186 | |
| Audit fees | | | 20,855 | |
| Trustees’ fees and expenses | | | 11,256 | |
| Reports to shareholders | | | 5,829 | |
| Administration, fund accounting, custody and transfer agent fees (See Note 5) | | | 4,929 | |
| Distribution fees – Investor Class (See Note 5) | | | 4,647 | |
| Sub-transfer agent expenses – Investor Class (See Note 5) | | | 3,523 | |
| Sub-transfer agent expenses – Institutional Class (See Note 5) | | | 66 | |
| Service fees – Investor Class (See Note 5) | | | 1,608 | |
| Legal fees | | | 78 | |
| Interest expense (See Note 6) | | | 4 | |
| Other expenses | | | 4,331 | |
| Total expenses before reimbursement by advisor | | | 146,208 | |
| Expense reimbursement by advisor – Investor Class | | | (16,047 | ) |
| Expense reimbursement by advisor – Institutional Class | | | (13,084 | ) |
| Net expenses | | | 117,077 | |
| NET INVESTMENT INCOME | | $ | 52,926 | |
| | | | | |
| REALIZED AND UNREALIZED GAINS (LOSSES): | | | | |
| Net realized gain on investments | | $ | 51,572 | |
| Net change in unrealized depreciation on investments | | | (121,931 | ) |
| Net loss on investments | | | (70,359 | ) |
| NET DECREASE IN NET ASSETS RESULTING FROM OPERATIONS | | $ | (17,433 | ) |
The accompanying notes are an integral part of these financial statements.
| HENNESSY FUNDS | 1-800-966-4354 | |
Financial Statements
| Statements of Changes in Net Assets |
| | | Year Ended | | | Year Ended | |
| | | October 31, 2015 | | | October 31, 2014 | |
| OPERATIONS: | | | | | | |
| Net investment income | | $ | 52,926 | | | $ | 141,693 | |
| Net realized gain on investments | | | 51,572 | | | | 70,699 | |
| Net change in unrealized depreciation on investments | | | (121,931 | ) | | | (120,967 | ) |
| Net increase (decrease) in net assets | | | | | | | | |
| resulting from operations | | | (17,433 | ) | | | 91,425 | |
| | | | | | | | | |
| DISTRIBUTIONS TO SHAREHOLDERS FROM: | | | | | | | | |
| Net investment income | | | | | | | | |
| Investor Class | | | (24,771 | ) | | | (67,126 | ) |
| Institutional Class | | | (30,102 | ) | | | (76,008 | ) |
| Net realized gains | | | | | | | | |
| Investor Class | | | (37,403 | ) | | | (629,457 | ) |
| Institutional Class | | | (30,800 | ) | | | (734,790 | ) |
| Total distributions | | | (123,076 | ) | | | (1,507,381 | ) |
| | | | | | | | | |
| CAPITAL SHARE TRANSACTIONS: | | | | | | | | |
| Proceeds from shares subscribed – Investor Class | | | 435,393 | | | | 1,440,996 | |
| Proceeds from shares subscribed – Institutional Class | | | 1,039,343 | | | | 179,145 | |
| Dividends reinvested – Investor Class | | | 56,956 | | | | 616,160 | |
| Dividends reinvested – Institutional Class | | | 60,107 | | | | 796,120 | |
| Cost of shares redeemed – Investor Class | | | (1,369,633 | ) | | | (1,605,535 | ) |
| Cost of shares redeemed – Institutional Class | | | (924,976 | ) | | | (1,311,742 | ) |
| Net increase (decrease) in net assets derived | | | | | | | | |
| from capital share transactions | | | (702,810 | ) | | | 115,144 | |
| TOTAL DECREASE IN NET ASSETS | | | (843,319 | ) | | | (1,300,812 | ) |
| | | | | | | | | |
| NET ASSETS: | | | | | | | | |
| Beginning of year | | | 5,103,859 | | | | 6,404,671 | |
| End of year | | $ | 4,260,540 | | | $ | 5,103,859 | |
| Undistributed net investment income, end of year | | $ | — | | | $ | — | |
The accompanying notes are an integral part of these financial statements.
| Statements of Changes in Net Assets – Continued |
| | | Year Ended | | | Year Ended | |
| | | October 31, 2015 | | | October 31, 2014 | |
| CHANGES IN SHARES OUTSTANDING: | | | | | | |
| Shares sold – Investor Class | | | 58,095 | | | | 181,144 | |
| Shares sold – Institutional Class | | | 157,489 | | | | 25,191 | |
| Shares issued to holders as reinvestment | | | | | | | | |
| of dividends – Investor Class | | | 7,586 | | | | 80,291 | |
| Shares issued to holders as reinvestment | | | | | | | | |
| of dividends – Institutional Class | | | 9,104 | | | | 117,695 | |
| Shares redeemed – Investor Class | | | (183,613 | ) | | | (207,447 | ) |
| Shares redeemed – Institutional Class | | | (140,907 | ) | | | (192,135 | ) |
| Net increase (decrease) in shares outstanding | | | (92,246 | ) | | | 4,739 | |
The accompanying notes are an integral part of these financial statements.
| HENNESSY FUNDS | 1-800-966-4354 | |
Financial Statements
For an Investor Class share outstanding throughout each year
PER SHARE DATA:
Net asset value, beginning of year
Income from investment operations:
Net investment income
Net realized and unrealized gains (losses) on investments
Total from investment operations
Less distributions:
Dividends from net investment income
Dividends from net realized gains
Total distributions
Net asset value, end of year
TOTAL RETURN
SUPPLEMENTAL DATA AND RATIOS:
Net assets, end of year (millions)
Ratio of expenses to average net assets:
Before expense reimbursement
After expense reimbursement
Ratio of net investment income to average net assets:
Before expense reimbursement
After expense reimbursement
Portfolio turnover rate(2)
(1) | Calculated based on average shares outstanding method. |
(2) | Portfolio turnover is calculated on the basis of the Fund as a whole. |
The accompanying notes are an integral part of these financial statements.
| Year Ended October 31, | |
| 2015 | | | 2014 | | | 2013 | | | 2012 | | | 2011 | |
| | | | | | | | | | | | | |
| $ | 7.61 | | | $ | 9.56 | | | $ | 9.97 | | | $ | 9.56 | | | $ | 9.82 | |
| | | | | | | | | | | | | | | | | | | |
| | | | | | | | | | | | | | | | | | | |
| | 0.06 | | | | 0.17 | | | | 0.27 | | | | 0.28 | | | | 0.35 | (1) |
| | (0.10 | ) | | | (0.06 | ) | | | (0.23 | ) | | | 0.41 | | | | (0.14 | ) |
| | (0.04 | ) | | | 0.11 | | | | 0.04 | | | | 0.69 | | | | 0.21 | |
| | | | | | | | | | | | | | | | | | | |
| | | | | | | | | | | | | | | | | | | |
| | (0.07 | ) | | | (0.18 | ) | | | (0.27 | ) | | | (0.20 | ) | | | (0.32 | ) |
| | (0.10 | ) | | | (1.88 | ) | | | (0.18 | ) | | | (0.08 | ) | | | (0.15 | ) |
| | (0.17 | ) | | | (2.06 | ) | | | (0.45 | ) | | | (0.28 | ) | | | (0.47 | ) |
| $ | 7.40 | | | $ | 7.61 | | | $ | 9.56 | | | $ | 9.97 | | | $ | 9.56 | |
| | | | | | | | | | | | | | | | | | | |
| | (0.50 | )% | | | 1.41 | % | | | 0.41 | % | | | 7.38 | % | | | 2.35 | % |
| | | | | | | | | | | | | | | | | | | |
| | | | | | | | | | | | | | | | | | | |
| $ | 1.87 | | | $ | 2.82 | | | $ | 3.02 | | | $ | 3.57 | | | $ | 4.05 | |
| | | | | | | | | | | | | | | | | | | |
| | 3.16 | % | | | 2.85 | % | | | 2.26 | % | | | 2.12 | % | | | 2.38 | % |
| | 2.52 | % | | | 1.30 | % | | | 1.30 | % | | | 1.30 | % | | | 1.30 | % |
| | | | | | | | | | | | | | | | | | | |
| | 0.32 | % | | | 0.74 | % | | | 1.70 | % | | | 2.01 | % | | | 2.58 | % |
| | 0.96 | % | | | 2.29 | % | | | 2.66 | % | | | 2.83 | % | | | 3.66 | % |
| | 50 | % | | | 54 | % | | | 74 | % | | | 75 | % | | | 57 | % |
The accompanying notes are an integral part of these financial statements.
| HENNESSY FUNDS | 1-800-966-4354 | |
Financial Statements
For an Institutional Class share outstanding throughout each year
PER SHARE DATA:
Net asset value, beginning of year
Income from investment operations:
Net investment income
Net realized and unrealized gains (losses) on investments
Total from investment operations
Less distributions:
Dividends from net investment income
Dividends from net realized gains
Total distributions
Net asset value, end of year
TOTAL RETURN
SUPPLEMENTAL DATA AND RATIOS:
Net assets, end of year (millions)
Ratio of expenses to average net assets:
Before expense reimbursement
After expense reimbursement
Ratio of net investment income to average net assets:
Before expense reimbursement
After expense reimbursement
Portfolio turnover rate(2)
(1) | Calculated based on average shares outstanding method. |
(2) | Portfolio turnover is calculated on the basis of the Fund as a whole. |
The accompanying notes are an integral part of these financial statements.
| Year Ended October 31, | |
| 2015 | | | 2014 | | | 2013 | | | 2012 | | | 2011 | |
| | | | | | | | | | | | | |
| $ | 6.69 | | | $ | 8.65 | | | $ | 9.06 | | | $ | 8.77 | | | $ | 9.05 | |
| | | | | | | | | | | | | | | | | | | |
| | | | | | | | | | | | | | | | | | | |
| | 0.09 | | | | 0.16 | | | | 0.19 | | | | 0.27 | | | | 0.34 | (1) |
| | (0.09 | ) | | | (0.06 | ) | | | (0.13 | ) | | | 0.38 | | | | (0.12 | ) |
| | — | | | | 0.10 | | | | 0.06 | | | | 0.65 | | | | 0.22 | |
| | | | | | | | | | | | | | | | | | | |
| | | | | | | | | | | | | | | | | | | |
| | (0.09 | ) | | | (0.18 | ) | | | (0.29 | ) | | | (0.28 | ) | | | (0.35 | ) |
| | (0.09 | ) | | | (1.88 | ) | | | (0.18 | ) | | | (0.08 | ) | | | (0.15 | ) |
| | (0.18 | ) | | | (2.06 | ) | | | (0.47 | ) | | | (0.36 | ) | | | (0.50 | ) |
| $ | 6.51 | | | $ | 6.69 | | | $ | 8.65 | | | $ | 9.06 | | | $ | 8.77 | |
| | | | | | | | | | | | | | | | | | | |
| | (0.06 | )% | | | 1.53 | % | | | 0.69 | % | | | 7.63 | % | | | 2.62 | % |
| | | | | | | | | | | | | | | | | | | |
| | | | | | | | | | | | | | | | | | | |
| $ | 2.39 | | | $ | 2.29 | | | $ | 3.38 | | | $ | 33.34 | | | $ | 23.25 | |
| | | | | | | | | | | | | | | | | | | |
| | 2.79 | % | | | 2.53 | % | | | 1.67 | % | | | 1.31 | % | | | 1.43 | % |
| | 2.25 | % | | | 1.05 | % | | | 1.05 | % | | | 1.05 | % | | | 1.05 | % |
| | | | | | | | | | | | | | | | | | | |
| | 0.66 | % | | | 1.06 | % | | | 2.28 | % | | | 2.74 | % | | | 3.54 | % |
| | 1.20 | % | | | 2.54 | % | | | 2.90 | % | | | 3.00 | % | | | 3.92 | % |
| | 50 | % | | | 54 | % | | | 74 | % | | | 75 | % | | | 57 | % |
The accompanying notes are an integral part of these financial statements.
| HENNESSY FUNDS | 1-800-966-4354 | |
Financial Statements
Notes to the Financial Statements October 31, 2015 |
1). ORGANIZATION
The Hennessy Core Bond Fund (the “Fund”) is a series of Hennessy Funds Trust (the “Trust”), which was organized as a Delaware statutory trust on September 17, 1992. The Fund is an open-end management investment company registered under the Investment Company Act of 1940, as amended. The Fund is a successor to the FBR Core Bond Fund (the “Predecessor FBR Fund”), a series of The FBR Funds, a Delaware statutory trust, pursuant to a reorganization that took place after the close of business on October 26, 2012. Prior to October 26, 2012, the Fund had no investment operations. As a result of the reorganization, holders of the Investor Class shares of the Predecessor FBR Fund received Investor Class shares of the Fund (the Investor Class shares of the Fund are the successor to the accounting and performance information of the Predecessor FBR Fund), and holders of the Institutional Class shares of the Predecessor FBR Fund received Institutional Class shares of the Fund (the Institutional Class shares of the Fund are the successor to the accounting and performance information of the Predecessor FBR Fund). The investment objective of the Fund is current income with capital growth as a secondary objective. The Fund is a diversified fund.
The Fund offers Investor Class and Institutional Class shares. Each class of shares differs principally in its respective administration, 12b-1 distribution and service, shareholder servicing, and transfer agent expenses and sales charges, if any. Each class has identical rights to earnings, assets, and voting privileges, except for class-specific expenses and exclusive rights to vote on matters affecting only an individual class.
As an investment company, the Fund follows the investment company accounting and reporting guidance of the Financial Accounting Standards Board (“FASB”) Accounting Standard Codification Topic 946 “Financial Services—Investment Companies.”
2). SIGNIFICANT ACCOUNTING POLICIES
The following is a summary of significant accounting policies consistently followed by the Fund in the preparation of the financial statements. These policies are in conformity with U.S. generally accepted accounting principles (“GAAP”).
| a). | Investment Valuation – All investments in securities are recorded at their estimated fair value, as described in Note 3. |
| | |
| b). | Federal Income Taxes – Provision for federal income taxes or excise taxes has not been made since the Fund has elected to be taxed as a “regulated investment company” and intends to distribute substantially all of its taxable income to its shareholders and otherwise comply with the provisions of the Internal Revenue Code of 1986, as amended, applicable to regulated investment companies. Net investment income or loss and realized gains and losses for federal income tax purposes may differ from that reported on the financial statements because of temporary book and tax basis differences. Temporary differences are primarily the result of the treatment of wash sales for tax reporting purposes. The Fund recognizes interest and penalties related to income tax benefits, if any, in the statement of operations as an income tax expense. Distributions from net realized gains for book purposes may include short-term capital gains, which are included as ordinary income to shareholders for tax purposes. |
| | Due to inherent differences in the recognition of income, expenses, and realized gains/losses under GAAP and federal income tax regulations, permanent differences between book and tax basis reporting for the 2015 fiscal year have been identified and appropriately reclassified on the Statement of Assets and Liabilities. The adjustments are as follows: |
| Undistributed | Accumulated | |
| Net Investment | Net Realized | |
Income/(Loss) | Gain/(Loss) | Paid-in Capital |
| $1,947 | $(1,946) | $(1) |
| c). | Income and Expenses – Dividend income is recognized on the ex-dividend date or as soon as information is available to the Fund. Interest income, which includes the amortization of premium and accretion of discount, is recognized on an accrual basis. The Fund is charged for those expenses that are directly attributable to the portfolio, such as advisory, administration, and certain shareholder service fees. Income, expenses (other than expenses attributable to a specific class), and realized and unrealized gains or losses on investments are allocated to each class of shares based on its respective net assets. |
| | |
| d). | Distributions to Shareholders – Dividends from net investment income for the Fund, if any, are declared and paid monthly. Distributions of net realized capital gains, if any, are declared and paid annually, usually in December. |
| | |
| e). | Security Transactions – Investment and shareholder transactions are recorded on the trade date. The Fund determines the gain or loss realized from the investment transactions by comparing the original cost of the security lot sold with the net sale proceeds. Discounts and premiums on securities purchased are accreted/amortized over the life of the respective security. |
| | |
| f). | Use of Estimates – The preparation of financial statements in conformity with GAAP requires management to make estimates and assumptions that affect the reported amounts of assets and liabilities and disclosure of contingent assets and liabilities at the date of the financial statements and the reported change in net assets during the reporting period. Actual results could differ from those estimates. |
| | |
| g). | Share Valuation – The net asset value (“NAV”) per share of the Fund is calculated by dividing the sum of the value of the securities held by the Fund, plus cash or other assets, minus all liabilities (including estimated accrued expenses) by the total number of shares outstanding for the Fund, rounded to the nearest cent. The Fund’s shares will not be priced on days the New York Stock Exchange is closed for trading. The offering and redemption price per share for the Fund is equal to the Fund’s NAV per share. |
| | |
| h). | Foreign Currency – Values of investments denominated in foreign currencies, if any, are converted into U.S. dollars using the spot market rate of exchange at the time of valuation. Purchases and sales of investments and income are translated into U.S. dollars using the spot market rate of exchange prevailing on the respective dates of such transactions. The Fund does not isolate the portion of the results of operations resulting from fluctuations in foreign exchange rates on investments from fluctuations resulting from changes in the market prices of securities held. Such fluctuations are included with the net realized and unrealized gain or loss on investments. Foreign investments present additional risks due to currency fluctuations, economic and political factors, lower liquidity, government regulations, differences in accounting standards, and other factors. |
| | |
| i). | Forward Contracts – The Fund may enter into forward currency contracts to reduce its exposure to changes in foreign currency exchange rates on its foreign holdings and to lock in the U.S. dollar cost of firm purchase and sale commitments for |
| HENNESSY FUNDS | 1-800-966-4354 | |
| | securities denominated in foreign currencies. A forward currency contract is a commitment to purchase or sell a foreign currency at a future date at a negotiated forward rate. The gain or loss arising from the difference between the U.S. dollar cost of the original contract and the value of the foreign currency in U.S. dollars upon closing of such contract is included in net realized gain or loss from foreign currency transactions. During the fiscal year ended October 31, 2015, the Fund did not enter into any forward contracts. |
| | |
| j). | Repurchase Agreements – The Fund may enter into repurchase agreements with member banks or security dealers of the Federal Reserve Board whom the investment advisor deems creditworthy. The repurchase price generally equals the price paid by the Fund plus interest negotiated on the basis of current short-term rates. |
| | |
| | Securities pledged as collateral for repurchase agreements are held by the custodian bank until the respective agreements mature. Provisions of the repurchase agreements ensure that the market value of the collateral, including accrued interest thereon, is sufficient to cover the repurchase amount in the event of default of the counterparty. If the counterparty defaults and the value of the collateral declines or if the counterparty enters an insolvency proceeding, realization of the collateral by the Fund may be delayed or limited. |
| | |
| k). | Accounting for Uncertainty in Income Taxes – The Fund has accounting policies regarding recognition and measurement of tax positions taken or expected to be taken on a tax return. The tax returns of the Fund for the prior three fiscal years are open for examination. The Fund has reviewed all open tax years in major jurisdictions and concluded that there is no impact on the Fund’s net assets and no tax liability resulting from unrecognized tax benefits relating to uncertain income tax positions taken or expected to be taken on a tax return. The Fund’s major tax jurisdictions are U.S. federal and Delaware. |
| | |
| l). | Derivatives – The Fund may invest in, or enter into, derivatives, such as options, futures contracts, options on futures contracts, and swaps, for a variety of reasons, including to hedge certain risks, to provide a substitute for purchasing or selling particular securities, or to increase potential income gain. Derivatives may provide a cheaper, quicker, or more specifically focused way for a Fund to invest than “traditional” securities would. The main purpose of utilizing these derivative instruments is for hedging purposes. |
| | |
| | The Fund follows the financial accounting reporting rules as required by the Derivatives and Hedging Topic of the FASB Accounting Standards Codification. Under such rules, the Fund is required to include enhanced disclosure that enables investors to understand how and why an entity uses derivatives, how derivatives are accounted for, and how derivatives instruments affect an entity’s results of operations and financial position. During the fiscal year ended October 31, 2015, the Fund did not hold any derivative instruments. |
| | |
| m). | New Accounting Pronouncements – In June 2014, the FASB issued Accounting Standards Update (“ASU”) No. 2014-11 “Repurchase-to Maturity Transactions, Repurchase Financings, and Disclosures.” The amendments in this ASU require an entity to modify accounting for repurchase-to-maturity transactions and repurchase financing arrangements, as well as modify required disclosures for repurchase agreements, securities lending transactions, and repurchase-to-maturity transactions that are accounted for as secured borrowings. The guidance is effective for fiscal years beginning on or after December 15, 2014, and for interim periods within those fiscal years. Management is currently evaluating the impact these changes will have on the Fund’s financial statement disclosures. |
| | In May 2015, the FASB issued ASU No. 2015-07 “Disclosure for Investments in Certain Entities that Calculate Net Asset Value per Share (or Its Equivalent).” The amendments in ASU No. 2015-07 remove the requirement to categorize within the fair value hierarchy investments measured at NAV and require the disclosure of sufficient information to reconcile the fair value of the remaining assets categorized within the fair value hierarchy to the financial statements. The amendments in ASU No. 2015-07 are effective for fiscal years beginning after December 15, 2015, and interim periods within those fiscal years. Management has reviewed the requirements and believes the adoption of ASU 2015-07 will not have a material impact on the Fund’s financial statements and related disclosures. |
3). SECURITIES VALUATION
The Fund follows authoritative fair valuation accounting standards that establish an authoritative definition of fair value and set out a hierarchy for measuring fair value. These standards require additional disclosures about the various inputs and valuation techniques used to develop the measurements of fair value and a discussion in changes in valuation techniques and related inputs during the period. These inputs are summarized in the three broad levels listed below:
| | Level 1 – | Quoted unadjusted prices for identical instruments in active markets to which the Fund has access at the date of measurement. |
| | | |
| | Level 2 – | Quoted prices for similar instruments in active markets; quoted prices for identical or similar instruments in markets that are not active; and model-derived valuations in which all significant inputs and significant value drivers are observable in active markets. Level 2 inputs are those in markets for which there are few transactions, the prices are not current, the prices are fair value adjusted due to post-market close subsequent events (foreign markets), little public information exists, or instances where prices vary substantially over time or among brokered market makers. These inputs may also include interest rates, prepayment speeds, credit risk curves, default rates, and similar data. |
| | | |
| | Level 3 – | Model-derived valuations in which one or more significant inputs or significant value drivers are unobservable. Unobservable inputs are those inputs that reflect the Fund’s own assumptions about what market participants would use to price the asset or liability based on the best available information. |
Following is a description of the valuation techniques applied to the Fund’s major categories of assets and liabilities measured at fair value on a recurring basis.
Equity Securities – Equity securities, including common stocks, preferred stocks, foreign-issued common stocks, exchange-traded funds, closed-end mutual funds, partnerships, rights, and real estate investment trusts, that are traded on a securities exchange for which a last-quoted sales price is readily available will generally be valued at the last sales price as reported by the primary exchange on which the securities are listed. Securities listed on The NASDAQ Stock Market (“NASDAQ”) will generally be valued at the NASDAQ Official Closing Price, which may differ from the last sales price reported. Securities traded on a securities exchange for which a last-quoted sales price is not readily available will generally be valued at the mean between the bid and ask prices. To the extent these securities are actively traded and valuation adjustments are not applied, they are classified in Level 1 of the fair value hierarchy. Securities traded on foreign exchanges generally are not valued at the same time the Fund calculates its NAV because most foreign markets close well before such time. The earlier close of most foreign markets
| HENNESSY FUNDS | 1-800-966-4354 | |
gives rise to the possibility that significant events, including broad market moves, may have occurred in the interim. In certain circumstances, it may be determined that a security needs to be fair valued because it appears that the value of the security might have been materially affected by events occurring after the close of the market in which the security is principally traded, but before the time the Fund calculates its NAV, such as by a development that affects an entire market or region (e.g., weather-related events) or a potentially global development (e.g., a terrorist attack that may be expected to have an effect on investor expectations worldwide).
Registered Investment Companies – Investments in registered investment companies (e.g., mutual funds) are generally priced at the ending NAV provided by the applicable registered investment company’s service agent and will be classified in Level 1 of the fair value hierarchy.
Debt Securities – Debt securities, including corporate bonds, asset-backed securities, mortgage-backed securities, municipal bonds, U.S. Treasuries, and U.S. government agency issues, are generally valued at market on the basis of valuations furnished by an independent pricing service that utilizes both dealer-supplied valuations and formula-based techniques. The pricing service may consider recently executed transactions in securities of the issuer or comparable issuers, market price quotations (where observable), bond spreads, and fundamental data relating to the issuer. In addition, the model may incorporate market observable data such as reported sales of similar securities, broker quotes, yields, bids, offers, and reference data. Certain securities are valued principally using dealer quotations. These securities are generally classified in Level 2 of the fair value hierarchy.
Short-Term Securities – Short-term equity investments, including money market funds, are valued in the manner specified above. Short-term debt investments are generally valued at amortized cost, which approximates fair market value, if their original term to maturity was 60 days or less, or by amortizing the values as of the 61st day prior to maturity, if their original term to maturity exceeded 60 days. Amortized cost is not used if its use would be inappropriate due to credit or other impairments of the issuer, in which case the security’s fair value would be determined, as described below. Short-term securities are generally classified in Level 1 or Level 2 of the fair market hierarchy depending on the inputs used and market activity levels for specific securities.
The Board of Trustees of the Fund (the “Board”) has adopted fair value pricing procedures that are followed when a price for a security is not readily available or if a significant event has occurred that indicates the closing price of a security no longer represents the true value of that security. Fair value pricing determinations are made in good faith in accordance with these procedures. There are numerous criteria that will be given consideration in determining a fair value of a security. Some of these criteria are trading volume of a security and markets, the value of other like securities, and news events with direct bearing to a security or markets. Fair value pricing results in an estimated price for a security that reflects the amount the Fund might reasonably expect to receive in a current sale. Depending on the relative significance of the valuation inputs, these securities may be classified in either Level 2 or Level 3 of the fair value hierarchy.
The fair valuation of foreign securities may be determined with the assistance of a pricing service using correlations between the movement of prices of such securities and indices of domestic securities and other appropriate indicators, such as closing market prices of relevant American Depositary Receipts or futures contracts. The effect of using fair value pricing is that the Fund’s NAV will reflect the affected portfolio securities’ value as determined in the judgment of the Board or its designee instead of being determined by
the market. Using a fair value pricing methodology to price foreign securities may result in a value that is different from a foreign security’s most recent closing price and from the prices used by other investment companies to calculate their NAVs and are generally considered Level 2 prices in the fair valuation hierarchy. Because the Fund may invest in foreign securities, the value of the Fund’s portfolio securities may change on days when you will not be able to purchase or redeem your shares.
The Board has delegated day-to-day valuation matters to a Valuation Committee comprised of one or more representatives from Hennessy Advisors, Inc., the Fund’s investment advisor. The function of the Valuation Committee is to value securities where current and reliable market quotations are not readily available. All actions taken by the Valuation Committee are reviewed by the Board.
The Fund has performed an analysis of all existing investments to determine the significance and character of all inputs to their fair value determination. Various inputs are used in determining the value of the Fund’s investments. The inputs or methodology used for valuing securities are not necessarily an indication of the risk associated with investing in those securities. Details related to the fair valuation hierarchy of the Fund’s securities as of October 31, 2015 are included in the Fund’s Schedule of Investments.
4). INVESTMENT TRANSACTIONS
Purchases and sales of investment securities (excluding government and short-term investments) for the Fund during the fiscal year ended October 31, 2015 were $1,212,380 and $1,900,439, respectively.
Purchases and sales/maturities of long-term U.S. Government Securities for the Fund during the fiscal year ended October 31, 2015 were $1,163,797 and $1,127,440, respectively.
5). INVESTMENT MANAGEMENT FEE AND OTHER TRANSACTIONS WITH AFFILIATES
Hennessy Advisors, Inc. (the “Advisor”) is the investment advisor of the Fund. The Advisor provides the Fund with investment management services under an Investment Advisory Agreement. The Advisor furnishes all investment advice, office space, facilities, and provides most of the personnel needed by the Fund. As compensation for its services, the Advisor is entitled to a monthly fee from the Fund. The fee is based upon the average daily net assets of the Fund at the annual rate of 0.80%. The net investment advisory fees payable by the Fund as of October 31, 2015 were $2,916.
The Advisor has delegated the day-to-day management of the Fund to a sub-advisor, Financial Counselors, Inc. The Advisor pays the sub-advisor fees for the Fund from its own assets and these fees are not an additional expense of the Fund.
The Advisor contractually agreed to limit the total annual operating expenses of the Fund (excluding interest, taxes, brokerage commissions, dividend expenses, 12b-1 fees, acquired fund fees and expenses, extraordinary legal expenses, or any other extraordinary expenses) to 1.05% of the Fund’s net assets for both the Investor Class shares and Institutional Class shares of the Fund through February 28, 2015. The expense limitation agreement for the Fund is no longer in effect.
For a period of three years after the year in which the Advisor waived or reimbursed expenses, the Advisor may seek reimbursement from the Fund to the extent that total annual fund operating expenses are less than the expense limitation that was in effect at the time the Advisor waived or reimbursed expenses. The Advisor waived or reimbursed expenses of $29,131 for the Fund during the fiscal year ended October 31, 2015. As of October 31, 2015, cumulative expenses subject to potential recovery under the aforementioned conditions and year of expiration were as follows:
| HENNESSY FUNDS | 1-800-966-4354 | |
| | October 31, | October 31, | October 31, | |
| | 2016 | 2017 | 2018 | Total |
| Investor Class | $36,603 | $46,263 | $16,047 | $98,913 |
| Institutional Class | $74,877 | $42,715 | $13,084 | $130,676 |
The Board has approved a Shareholder Servicing Agreement for the Investor Class shares of the Fund, effective as of February 28, 2015, which was instituted to compensate the Advisor for the non-investment management services it provides to the Fund. The Shareholder Servicing Agreement provides for a monthly fee paid to the Advisor at an annual rate of 0.10% of the average daily net assets of the Fund attributable to Investor Class shares. Shareholder service fees payable by the Fund as of October 31, 2015 were $161.
The Fund has adopted a plan pursuant to Rule 12b-1 under the Investment Company Act of 1940, as amended, that authorizes payments in connection with the distribution of the Fund’s shares at an annual rate of up to 0.25% of the Fund’s average daily net assets attributable to Investor Class shares, although the Fund has only been using up to 0.15% of its average daily net assets attributable to Investor Class shares for such purpose since March 1, 2015. Amounts paid under the plan may be spent on any activities or expenses primarily intended to result in the sale of shares, including but not limited to, advertising, shareholder account servicing, the printing and mailing of prospectuses to other than current shareholders, the printing and mailing of sales literature, and compensation for sales and marketing activities or to financial institutions and others, such as dealers and distributors.
The Fund has entered into agreements with various brokers, dealers, and financial intermediaries in connection with the sale of shares of the Fund. The agreements provide for periodic payments by the Fund to the brokers, dealers, and financial intermediaries for providing certain shareholder maintenance services (sub-transfer agent expenses). These shareholder services include the pre-processing and quality control of new accounts, shareholder correspondence, answering customer inquiries regarding account status, and facilitating shareholder telephone transactions. Fees paid by the Fund to various brokers, dealers, and financial intermediaries during the fiscal year ended October 31, 2015 were $3,589.
U.S. Bancorp Fund Services, LLC (“USBFS”) provides the Fund with administrative, fund accounting, and transfer agent services, including all regulatory reporting, and necessary office equipment and personnel. As administrator, USBFS is responsible for activities such as (i) preparing various federal and state regulatory filings, reports, and returns for the Fund, (ii) preparing reports and materials to be supplied to the Board, (iii) monitoring the activities of the Fund’s custodian, transfer agent, and accountants, and (iv) coordinating the preparation and payment of the Fund’s expenses and reviewing the Fund’s expense accruals. Fees paid to USBFS during the fiscal year ended October 31, 2015 were $4,929.
U.S. Bank, N.A., an affiliate of USBFS, serves as the Fund’s custodian. Quasar Distributors, LLC acts as the Fund’s principal underwriter in a continuous public offering of the Fund’s shares. Quasar Distributors, LLC is an affiliate of USBFS and U.S. Bank, N.A.
6). LINE OF CREDIT
The Fund has an uncommitted line of credit with the other funds in the Hennessy Funds family of funds (the “Hennessy Funds”) in the amount of the lesser of (i) $100,000,000 or (ii) 33.33% of each Hennessy Fund’s net assets, or 30% for the Hennessy Gas Utility Fund and 10% for the Hennessy Balanced Fund, intended to provide short-term financing, if necessary, subject to certain restrictions, in connection with shareholder redemptions. The
credit facility is with the Hennessy Funds’ custodian bank, U.S. Bank, N.A. Borrowings under this arrangement bear interest at the bank’s prime rate and are secured by all of the Fund’s assets (as to its own borrowings only). During the fiscal year ended October 31, 2015, the Fund had an outstanding average daily balance and a weighted average interest rate of $115 and 3.25%, respectively. The maximum amount outstanding for the Fund during the period was $42,000. At October 31, 2015, the Fund did not have any borrowings outstanding under the line of credit.
7). FEDERAL TAX INFORMATION
As of October 31, 2015, the components of accumulated earnings (losses) for income tax purposes were as follows:
| Cost of investments for tax purposes | | $ | 4,543,719 | |
| Gross tax unrealized appreciation | | $ | 62,956 | |
| Gross tax unrealized depreciation | | | (197,869 | ) |
| Net tax unrealized depreciation | | $ | (134,913 | ) |
| Undistributed ordinary income | | $ | 2,398 | |
| Undistributed long-term capital gains | | | 46,884 | |
| Total distributable earnings | | $ | 49,282 | |
| Other accumulated gain | | $ | — | |
| Total accumulated loss | | $ | (85,631 | ) |
At October 31, 2015, the Fund had no tax basis capital losses to offset future capital gains.
At October 31, 2015, the Fund did not defer, on a tax basis, any late year ordinary losses.
The tax character of distributions paid during fiscal year 2015 and fiscal year 2014 for the Fund were as follows:
| | Year Ended | | Year Ended | |
| | October 31, 2015 | | October 31, 2014 | |
| Ordinary income | | $ | 54,190 | | | $ | 156,269 | |
| Long-term capital gain | | | 68,886 | | | | 1,351,112 | |
| | | $ | 123,076 | | | $ | 1,507,381 | |
8). EVENTS SUBSEQUENT TO YEAR END
Management has evaluated the Fund’s related events and transactions that occurred subsequent to October 31, 2015, through the date of issuance of the Fund’s financial statements. Other than as disclosed below, management has determined that there were no subsequent events requiring recognition or disclosure in the financial statements.
On December 9, 2015, capital gains were declared and paid to shareholders of record as of December 8, 2015 as follows:
| | Long-term | Short-term |
| Investor Class | $0.07244 | $0.00371 |
| Institutional Class | $0.06375 | $0.00327 |
| HENNESSY FUNDS | 1-800-966-4354 | |
Report of Independent Registered Public Accounting Firm
To the Board of Trustees of Hennessy Funds Trust
And the Shareholders of the Hennessy Core Bond Fund
Novato, CA
We have audited the accompanying statement of assets and liabilities, including the schedule of investments, of the Hennessy Core Bond Fund (the “Fund”), a series of Hennessy Funds Trust, as of October 31, 2015, and the related statement of operations for the year then ended, the statements of changes in net assets for each of the two years in the period then ended and the financial highlights for each of the five years in the period then ended. These financial statements and financial highlights are the responsibility of the Fund’s management. Our responsibility is to express an opinion on these financial statements and financial highlights based on our audits.
We conducted our audits in accordance with the standards of the Public Company Accounting Oversight Board (United States). Those standards require that we plan and perform the audits to obtain reasonable assurance about whether the financial statements and financial highlights are free of material misstatement. The Fund is not required to have, nor were we engaged to perform, an audit of the Fund’s internal control over financial reporting. Our audits included consideration of internal control over financial reporting as a basis for designing audit procedures that are appropriate in the circumstances, but not for the purposes of expressing an opinion on the effectiveness of the Fund’s internal control over financial reporting. Accordingly, we express no such opinion. An audit includes examining, on a test basis, evidence supporting the amounts and disclosures in the financial statements. Our procedures included confirmation of securities owned as of October 31, 2015, by correspondence with the custodian and brokers. An audit also includes assessing the accounting principles used and significant estimates made by management, as well as evaluating the overall financial statement presentation. We believe that our audits provide a reasonable basis for our opinion.
In our opinion, the financial statements and financial highlights referred to above present fairly, in all material respects, the financial position of the Hennessy Core Bond Fund as of October 31, 2015, the results of its operations for the year then ended, the changes in its net assets for each of the two years in the period then ended, and the financial highlights for each of the five years in the period then ended, in conformity with accounting principles generally accepted in the United States of America.
Philadelphia, Pennsylvania
December 21, 2015
Trustees and Officers of the Fund (Unaudited)
The business and affairs of the Fund are managed under the direction of the Board of Trustees of the Trust, and the Board of Trustees elects the Officers of the Trust. Information pertaining to the Trustees and the Officers of the Trust is set forth below. Such persons serve until their successors are duly elected and qualified or until their earlier death, resignation, or removal. Each of the Trustees oversees 16 Hennessy Funds. Unless otherwise indicated, the address of all persons listed below is 7250 Redwood Boulevard, Suite 200, Novato, CA 94945. The Fund’s Statement of Additional Information includes more information about the persons listed below and is available, without charge, upon request by calling 1-800-966-4354.
| | | | Other |
| | | | Directorships |
| Name, Year of Birth, | | | (During Past |
| and Position Held | Length of | Principal Occupation(s) | Five Years) |
with the Trust | Time Served | During Past Five Years | Held by Trustee(1) |
| | | | |
| Disinterested Trustees | | | |
| | | | |
| J. Dennis DeSousa (1936) | Since January | Mr. DeSousa is a real estate investor. | Hennessy SPARX |
| Trustee | 1996 for the | | Funds Trust; |
| | Hennessy Funds | | Hennessy Mutual |
| | | | Funds, Inc.; and |
| | | | The Hennessy |
| | | | Funds, Inc. |
| | | | |
| Robert T. Doyle (1947) | Since January | Mr. Doyle has been the Sheriff of | Hennessy SPARX |
| Trustee | 1996 for the | Marin County, California since 1996. | Funds Trust; |
| | Hennessy Funds | | Hennessy Mutual |
| | | | Funds, Inc.; and |
| | | | The Hennessy |
| | | | Funds, Inc. |
| | | | |
| Gerald P. Richardson (1945) | Since May | Mr. Richardson is an independent | Hennessy SPARX |
| Trustee | 2004 for the | consultant in the securities industry. | Funds Trust; |
| | Hennessy Funds | | Hennessy Mutual |
| | | | Funds, Inc.; and |
| | | | The Hennessy |
| | | | Funds, Inc. |
| | | | |
Interested Trustee(2) | | | |
| | | | |
| Neil J. Hennessy (1956) | Since January | Mr. Hennessy has been employed by | Hennessy Advisors, |
| Trustee, Chairman of | 1996 as a Trustee | Hennessy Advisors, Inc., the Funds’ | Inc.; Hennessy |
| the Board, Chief | for the Hennessy | investment advisor, since 1989. | SPARX Funds Trust; |
| Investment Officer, | Funds and since | He currently serves as President, | Hennessy Mutual |
| Portfolio Manager, | June 2008 as | Chairman and Chief Executive Officer | Funds, Inc.; and |
| and President | an Officer of the | of Hennessy Advisors, Inc. | The Hennessy |
| | Hennessy Funds | | Funds, Inc. |
| HENNESSY FUNDS | 1-800-966-4354 | |
| Name, Year of Birth, | | |
| and Position Held | Length of | Principal Occupation(s) |
with the Trust | Time Served | During Past Five Years |
| | | |
| Officers | | |
| | | |
| Teresa M. Nilsen (1966) | Since January | Ms. Nilsen has been employed by Hennessy Advisors, Inc., |
| Executive Vice President | 1996 for the | the Funds’ investment advisor, since 1989. She currently |
| and Treasurer | Hennessy Funds | serves as Executive Vice President, Chief Operations Officer, |
| | | Chief Financial Officer, and Secretary of Hennessy Advisors, Inc. |
| | | |
| Daniel B. Steadman (1956) | Since March | Mr. Steadman has been employed by Hennessy Advisors, Inc., |
| Executive Vice President | 2000 for the | the Funds’ investment advisor, since 2000. He currently serves |
| and Secretary | Hennessy Funds | as Executive Vice President and Chief Compliance Officer of |
| | | Hennessy Advisors, Inc. |
| | | |
| Jennifer Cheskiewicz (1977) | Since June | Ms. Cheskiewicz has been employed by Hennessy Advisors, |
| Senior Vice President and | 2013 for the | Inc., the Funds’ investment advisor, since June 2013. She |
| Chief Compliance Officer | Hennessy Funds | currently serves as General Counsel of Hennessy Advisors, Inc. |
| | | |
| | | She previously served as in-house counsel to Carlson Capital, |
| | | L.P., an SEC-registered investment advisor to several private |
| | | funds from February 2010 to May 2013. |
| | | |
| Brian Carlson (1972) | Since December | Mr. Carlson has been employed by Hennessy Advisors, Inc., the |
| Senior Vice President and | 2013 for the | Funds’ investment advisor, since December 2013. |
| Head of Distribution | Hennessy Funds | |
| | Mr. Carlson was previously a co-founder and principal of |
| | | Trivium Consultants, LLC from February 2011 through |
| | | November 2013. |
| | | |
David Ellison (1958)(3) | Since October | Mr. Ellison has served as a Portfolio Manager of the Hennessy |
| Senior Vice President and | 2012 for the | Small Cap Financial Fund, the Hennessy Large Cap Financial |
| Portfolio Manager | Hennessy Funds | Fund, and the Hennessy Technology Fund since inception. |
| | | |
| | | Mr. Ellison previously served as Director, CIO and President of |
| | | FBR Fund Advisers, Inc. from December 1999 to October 2012. |
| | | |
| Brian Peery (1969) | Since March | Mr. Peery has served as a Portfolio Manager of the Hennessy |
| Senior Vice President and | 2003 as an | Cornerstone Growth Fund, the Hennessy Cornerstone Mid Cap |
| Portfolio Manager | Officer of the | 30 Fund, the Hennessy Cornerstone Large Growth Fund, the |
| �� | Hennessy Funds | Hennessy Cornerstone Value Fund, the Hennessy Total Return |
| | and since | Fund, and the Hennessy Balanced Fund since October 2014. |
| | February 2011 | From February 2011 through September 2014, he served as |
| | as a Co-Portfolio | Co-Portfolio Manager of the same funds. Mr. Peery has also |
| | Manager or | served as a Portfolio Manager of the Hennessy Gas Utility Fund |
| | Portfolio Manager | since February 2015. |
| | for the | |
| | Hennessy Funds | Mr. Peery has been employed by Hennessy Advisors, Inc., the |
| | | Funds’ investment advisor, since 2002. |
| | | |
| Winsor (Skip) Aylesworth | Since October | Mr. Aylesworth has served as a Portfolio Manager of the |
(1947)(3) | 2012 for the | Hennessy Gas Utility Fund since 1998 and as a Portfolio |
| Vice President and | Hennessy Funds | Manager of the Hennessy Technology Fund since inception. |
| Portfolio Manager | | |
| | | Mr. Aylesworth previously served as Executive Vice President |
| | | of The FBR Funds from 1999 to October 2012. |
| Name, Year of Birth, | | |
| and Position Held | Length of | Principal Occupation(s) |
with the Trust | Time Served | During Past Five Years |
| | | |
Ryan Kelley (1972)(4) | Since March | Mr. Kelley has served as a Portfolio Manager of the Hennessy |
| Vice President and | 2013 for the | Gas Utility Fund, the Hennessy Small Cap Financial Fund, and |
| Portfolio Manager | Hennessy Funds | the Hennessy Large Cap Financial Fund since October 2014. |
| | | From March 2013 through September 2014, he served as a |
| | | Co-Portfolio Manager of the same funds. Prior to that, |
| | | he was a Portfolio Analyst of the Hennessy Funds. |
(1) | Pursuant to an internal reorganization, the series of Hennessy Mutual Funds, Inc. (“HMFI”), The Hennessy Funds, Inc. (“HFI”), and Hennessy SPARX Funds Trust (“HSFT”) were reorganized into series of Hennessy Funds Trust on February 28, 2014, which mirrored the corresponding series of HFMI, HFI, and HSFT. Subsequent to the reorganization, HFMI, HFI, and HSFT were dissolved. |
(2) | Mr. Hennessy is considered an “interested person,” as defined in the Investment Company Act of 1940, as amended, because he is an officer of the Hennessy Funds. |
(3) | The address of these officers is 101 Federal Street, Suite 1900, Boston, MA 02110. |
(4) | The address of this officer is 1340 Environ Way, Chapel Hill, NC 27517. |
| HENNESSY FUNDS | 1-800-966-4354 | |
Expense Example (Unaudited)
October 31, 2015
As a shareholder of the Fund, you incur two types of costs: (1) transaction costs, including sales charges (loads) on purchase payments, reinvested dividends, or other distributions; redemption fees; and exchange fees; and (2) ongoing costs, including management fees; service fees; and other Fund expenses. This Example is intended to help you understand your ongoing costs (in dollars) of investing in the Fund and to compare these costs with the ongoing costs of investing in other mutual funds. The Example is based on an investment of $1,000 invested at the beginning of the period and held for the entire period from May 1, 2015 through October 31, 2015.
Actual Expenses
The first line of the table below under the “Investor Class” and “Institutional Class” headings provides information about actual account values and actual expenses. Although the Fund charges no sales loads or transaction fees, you will be assessed fees for outgoing wire transfers, returned checks and stop payment orders at prevailing rates charged by U.S. Bancorp Fund Services, LLC, the Fund’s transfer agent. If you request that a redemption be made by wire transfer, currently a $15.00 fee is charged by the Fund’s transfer agent. IRA accounts will be charged a $15.00 annual maintenance fee. The example below includes, but is not limited to, management fees, shareholder servicing fees, fund accounting, custody, and transfer agent fees. However, the example below does not include portfolio trading commissions and related expenses, and other extraordinary expenses as determined under generally accepted accounting principles. You may use the information in this line, together with the amount you invested, to estimate the expenses that you paid over the period. Simply divide your account value by $1,000 (for example, an $8,600 account value divided by $1,000 = 8.6), then multiply the result by the number in the first line of the table under the “Investor Class” and “Institutional Class” headings in the column entitled “Expenses Paid During Period” to estimate the expenses you paid on your account during this period.
Hypothetical Example for Comparison Purposes
The second line of the table below under the “Investor Class” and “Institutional Class” headings provides information about hypothetical account values and hypothetical expenses based on the Fund’s actual expense ratios and an assumed rate of return of 5% per year before expenses, which is not the Fund’s actual return. The hypothetical account values and expenses may not be used to estimate the actual ending account balance or expenses you paid for the period. You may use this information to compare the ongoing costs of investing in the Fund and other funds. To do so, compare this 5% hypothetical example with the 5% hypothetical examples that appear in the shareholder reports of the other funds. Please note that the expenses shown in the table are meant to highlight your ongoing costs only and do not reflect any transactional costs, such as sales charges (loads), or exchange fees. Therefore, the second line of the table under the “Investor Class” and “Institutional Class” headings is useful in comparing ongoing costs only, and will not help you determine the relative total costs of owning different funds. In addition, if these transactional costs were included, your costs would have been higher.
| | | | Expenses Paid |
| | Beginning | Ending | During Period(1) |
| | Account Value | Account Value | May 1, 2015 – |
| | May 1, 2015 | October 31, 2015 | October 31, 2015 |
| Investor Class | | | |
| Actual | $1,000.00 | $ 984.60 | $16.41 |
| Hypothetical (5% return before expenses) | $1,000.00 | $1,008.67 | $16.61 |
| | | | |
| Institutional Class | | | |
| Actual | $1,000.00 | $ 985.90 | $14.22 |
| Hypothetical (5% return before expenses) | $1,000.00 | $1,010.89 | $14.39 |
(1) | Expenses are equal to the Fund’s annualized expense ratio of 3.28% for Investor Class shares or 2.84% for Institutional Class shares, as applicable, multiplied by the average account value over the period, multiplied by 184/365 days (to reflect one-half year period). |
| HENNESSY FUNDS | 1-800-966-4354 | |
How to Obtain a Copy of the Fund’s
Proxy Voting Policy and Proxy Voting Records
A description of the policies and procedures the Fund uses to determine how to vote proxies relating to portfolio securities is available without charge: (1) by calling 1-800-966-4354; (2) on the Hennessy Funds’ website at hennessyfunds.com/proxy-voting/policy.fs; or (3) on the U.S. Securities and Exchange Commission’s website at www.sec.gov. The Fund’s proxy voting record is available without charge on both the Hennessy Funds’ website at hennessyfunds.com/proxy-voting/policy.fs and the SEC’s website at www.sec.gov no later than August 31 for the prior 12 months ending June 30.
Quarterly Filings on Form N-Q
The Fund files its complete schedule of portfolio holdings with the SEC for the first and third quarters of each fiscal year on Form N-Q. The Fund’s Form N-Q will be available on the SEC’s website at www.sec.gov. The Fund’s Form N-Q may be reviewed and copied at the SEC’s Public Reference Room in Washington, DC and information on the operation of the Public Reference Room may be obtained by calling 1-800-SEC-0330. Information included in the Fund’s N-Q will also be available upon request by calling 1-800-966-4354.
Federal Tax Distribution Information
(Unaudited)
For the fiscal year ended October 31, 2015, certain dividends paid by the Fund may be subject to a maximum tax rate of 23.8%, as provided for by the Jobs and Growth Tax Relief Reconciliation Act of 2003. The percentage of dividends declared from ordinary income designated as qualified dividend income was 2.39%.
For corporate shareholders, the percent of ordinary income distributions that qualified for the corporate dividends received deduction for the fiscal year ended October 31, 2015 was 2.39%.
The percentage of taxable ordinary income distributions that are designated as short-term capital gain distributions under Section 871(k)(2)(C) of the Internal Revenue Code of 1986, as amended, for the Fund was 2.84%.
Householding
To help keep the Fund’s costs as low as possible, we generally deliver a single copy of most financial reports and prospectuses to shareholders who share an address, even if the accounts are registered under different names. This process, known as “householding,” does not apply to account statements. You may, of course, request an individual copy of a prospectus or financial report at any time. If you would like to receive separate mailings, please call the Administrator at 1-800-261-6950 or 1-414-765-4124 and we will begin individual delivery within 30 days of your request. If your account is held through a financial institution or other intermediary, please contact them directly to request individual delivery.
Privacy Policy
We collect the following non-public personal information about you:
| | • | information we receive from you on or in applications or other forms, correspondence, or conversations, including, but not limited to, your name, address, phone number, social security number, assets, income, and date of birth; and |
| | | |
| | • | information about your transactions with us, our affiliates, or others, including, but not limited to, your account number and balance, payment history, parties to transactions, cost basis information, and other financial information. |
We do not disclose any non-public personal information about our current or former shareholders to nonaffiliated third parties, except as permitted by law. For example, we are permitted by law to disclose all of the information we collect, as described above, to our Transfer Agent to process your transactions. Furthermore, we restrict access to your non-public personal information to those persons who require such information to provide products or services to you. We maintain physical, electronic, and procedural safeguards that comply with federal standards to guard your non-public personal information.
In the event that you hold shares of the Fund through a financial intermediary, including, but not limited to, a broker-dealer, bank or trust company, the privacy policy of your financial intermediary would govern how your non-public personal information would be shared with nonaffiliated third parties.
| HENNESSY FUNDS | 1-800-966-4354 | |
(This Page Intentionally Left Blank.)
(This Page Intentionally Left Blank.)
For information, questions or assistance, please call
The Hennessy Funds
1-800-966-4354 or 1-415-899-1555
INVESTMENT ADVISOR
Hennessy Advisors, Inc.
7250 Redwood Blvd., Suite 200
Novato, California 94945
ADMINISTRATOR,
TRANSFER AGENT,
DIVIDEND PAYING AGENT &
SHAREHOLDER SERVICING AGENT
U.S. Bancorp Fund Services, LLC
P.O. Box 701
Milwaukee, Wisconsin 53201-0701
CUSTODIAN
U.S. Bank N.A.
Custody Operations
1555 North River Center Dr., Suite 302
Milwaukee, Wisconsin 53212
TRUSTEES
Neil J. Hennessy
Robert T. Doyle
J. Dennis DeSousa
Gerald P. Richardson
COUNSEL
Foley & Lardner LLP
777 East Wisconsin Avenue
Milwaukee, Wisconsin 53202-5306
INDEPENDENT REGISTERED
PUBLIC ACCOUNTING FIRM
Tait, Weller & Baker LLP
1818 Market Street, Suite 2400
Philadelphia, Pennsylvania 19103
DISTRIBUTOR
Quasar Distributors, LLC
615 East Michigan Street
Milwaukee, Wisconsin 53202
hennessyfunds.com | 1-800-966-4354
This report has been prepared for shareholders and may be distributed to
others only if preceded or accompanied by a current prospectus.
ANNUAL REPORT
OCTOBER 31, 2015
HENNESSY GAS UTILITY FUND
Investor Class GASFX
hennessyfunds.com | 1-800-966-4354
(This Page Intentionally Left Blank.)
Contents
| Letter to Shareholders | 2 |
| Performance Overview | 4 |
| Financial Statements | |
| Schedule of Investments | 6 |
| Statement of Assets and Liabilities | 11 |
| Statement of Operations | 12 |
| Statements of Changes in Net Assets | 13 |
| Financial Highlights | 14 |
| Notes to the Financial Statements | 16 |
| Report of Independent Registered Public Accounting Firm | 24 |
| Trustees and Officers of the Fund | 25 |
| Expense Example | 28 |
| Proxy Voting | 30 |
| Quarterly Filings on Form N-Q | 30 |
| Federal Tax Distribution Information | 30 |
| Householding | 30 |
| Privacy Policy | 31 |
| HENNESSY FUNDS | 1-800-966-4354 | |
December 2015
Dear Hennessy Funds Shareholder:
As I look back over the year, I am reminded that the U.S. economy has come a long way since the depths of the recession in 2009. The economy has been expanding steadily for almost six years, the unemployment rate has halved, the housing market has been recovering and capital expenditures have been growing. The financial markets have performed well too, driven largely by strong corporate earnings growth, especially in the early years. The U.S. market, as measured by the S&P 500 Index, has roughly tripled since the bull market began in 2009, and the Index’s earnings per share have increased 260% over this same time period. For the year ended October 31, 2015, the U.S. equity market performed reasonably well, with the S&P 500 posting another advance of 5.2%. However, behind this headline number, the market experienced a great deal of volatility as investors reacted to falling energy prices, a rise in the U.S. Dollar, pressure on export earnings growth, slower growth in China and, most significantly, the likelihood of a rise in the Fed Funds rate for the first time in nearly a decade – the featured topic of conversation around every office water cooler in the financial world this year.
Investors, reporters and friends often ask me “What’s next?” The market has been in a volatile, sideways correction for over a year now, and throughout this period of volatility, I have consistently advised investors to continue to focus on the long-term fundamentals of the market.
In my view, the fundamentals of the market are in good shape. Despite a stronger U.S. Dollar and its impact on export growth, the economy is still growing steadily. Inflation remains low, so we expect the Federal Reserve, once it does begin to raise short-term interest rates, will not likely raise them by very much. New jobs are being created at what I believe is a healthy rate, and average hourly wages are rising in response to a tighter labor market. Higher wages and lower gasoline prices are helping to keep consumer confidence positive.
Notwithstanding what I view as a relatively solid economic environment, however, I think investor sentiment remains restrained. The same factors that contributed to the market volatility this past year are still troubling investors today: the slowdown in the Chinese economy, slower earnings growth here in the U.S., and, of course, the prospect of rising interest rates. As a result of these investor worries, I do not see any solid enthusiasm for the market – no euphoria. Universal optimism about the market often coincides with a peak in stock prices and this absence of euphoria is yet another reason I feel bullish. And finally, I do not believe stocks are expensive. The Dow Jones Industrial Average and the S&P 500 Index have forward PE (price-to-earnings) ratios of approximately 16x and 17x, respectively, close to long-term averages. In my view, these fundamentals taken together signal a continuation of the bull market that began six years ago.
A final positive note: I still do not believe that investors have fully returned to investing in U.S. equities. Assets in domestic equity funds have now reached parity with fixed income/money market funds, with $6.2 trillion in each. I believe that fixed income investments will continue to trickle into equities, which should have a positive effect on the market.
Thank you for your continued confidence and investment in our products. If you have any questions or would like to speak with us directly, please don’t hesitate to call us at (800) 966-4354.
Best regards,
Neil J. Hennessy
President and Chief Investment Officer
Past performance does not guarantee future results.
Mutual fund investing involves risk. Principal loss is possible.
Opinions expressed are those of Neil Hennessy and are subject to change, are not guaranteed and should not be considered investment advice.
The Dow Jones Industrial Average and the S&P 500 Index are unmanaged indices commonly used to measure the performance of U.S. stocks. One cannot invest directly in an index.
Price to earnings (“PE”) is the market price per share divided by earnings per share. Earnings per share is the portion of a company’s profit allocated to each outstanding share of common stock. It serves as an indicator of a company’s profitability.
| HENNESSY FUNDS | 1-800-966-4354 | |
Performance Overview (Unaudited)
CHANGE IN VALUE OF $10,000 INVESTMENT
This graph illustrates the performance of an initial investment of $10,000 made in the Fund ten years ago and assumes the reinvestment of dividends.
AVERAGE ANNUAL TOTAL RETURN FOR PERIODS ENDED OCTOBER 31, 2015
| | One | Five | Ten |
| | Year | Years | Years |
| Hennessy Gas Utility Fund – | | | |
| Investor Class (GASFX) | -6.59% | 14.10% | 10.27% |
| AGA Stock Index* | -5.84% | 14.58% | 11.00% |
| S&P 500 Index | 5.20% | 14.33% | 7.85% |
Expense ratio: 0.94%
Performance data quoted represents past performance; past performance does not guarantee future results. The investment return and principal value of an investment will fluctuate so that an investor’s shares, when redeemed, may be worth more or less than their original cost. The performance graph and table do not reflect the deduction of taxes that a shareholder would pay on Fund distributions or the redemption of Fund shares. Current performance of the Fund may be lower or higher than the performance quoted. Performance data current to the most recent month end may be obtained by visiting hennessyfunds.com. Performance for periods prior to October 26, 2012 is that of the FBR Gas Utility Index Fund.
The expense ratio presented is from the most recent prospectus.
| * | The AGA Stock Index is a market capitalization-weighted index, adjusted monthly, consisting of member companies of the American Gas Association. Performance for the AGA Stock Index is provided monthly by the American Gas Association. |
PERFORMANCE NARRATIVE
Portfolio Managers Winsor H. (Skip) Aylesworth, Ryan Kelley and Brian Perry
Performance:
For the twelve-month period ended October 31, 2015, the Hennessy Gas Utility Fund returned -6.59%, underperforming the AGA Stock Index* and the S&P 500 Index, which returned -5.84% and 5.20%, for the same period, respectively.
The Fund performed as we expected against the AGA Stock Index for the year ended October 31, 2015, underperforming slightly due to expenses. The Fund underperformed
the broader market, as measured by the S&P 500 Index, as energy-related stocks fell, driven lower by the year-long decline in the prices of both oil and natural gas. The Fund invests in natural gas distribution companies, whose businesses are largely insulated from movements in oil and natural gas prices. However, this year the market chose to penalize all companies in the Energy sector regardless of their exposure to lower commodity prices.
Portfolio Strategy:
The Fund’s investment objective is to provide investors with the return of the AGA Stock Index less expenses. The AGA Stock Index is comprised of publicly-traded members of the American Gas Association (AGA), a national trade association of natural gas distribution companies. The investment thesis of the Fund centers on the presence of abundant natural gas supplies here in the U.S. keeping natural gas prices low and stable. Low prices, in turn, lead to steady growth in demand for and consumption of natural gas, which should drive growth in revenues for the natural gas distribution companies owned by the Fund. Natural gas is deemed the most environmentally friendly of all the fossil fuels, which is also helping drive growth in demand, especially within the power generation industry.
For the twelve-month period ended October 31, 2015, there were five changes to the composition of the AGA Stock Index. Three occurred in the first six months of the period and were covered in the semi-annual report. Two happened later in the period. One change involved the acquisition of Integrys Energy Group, Inc. by Wisconsin Energy Corporation, both Fund holdings. The resultant company, WEC Energy Group, Inc., continues to be owned in the Fund and has approximately a 2.7% weighting in the portfolio. The other change during the period involved NiSource, Inc., which spun off its interstate pipeline assets to form the Columbia Pipeline Group, Inc. Both firms remain in the AGA Stock Index, and therefore the Fund, with weights in the portfolio of 1.7% and 3.6%, respectively. After many years of minor changes, the AGA Stock Index composition and hence the Fund’s holdings changed more significantly this year. Based on transactions announced but not yet closed, we expect another active year of change in the AGA Stock Index and in Fund composition in 2016.
Investment Outlook:
Despite the sharp declines in the oil and natural gas prices over the last twelve months and related volatility in stock prices, we believe the thesis of the Fund remains firmly intact. Low prices and the attractive environmental characteristics of natural gas should likely continue to drive demand growth, which, we believe may drive long term revenue and profit growth for the distribution companies in the Fund.
| * | The AGA Stock Index is a market capitalization-weighted index, consisting of member companies of the American Gas Association. Performance for the AGA Stock Index is provided monthly by the American Gas Association. |
Opinions expressed are those of the Portfolio Managers as of the date written and are subject to change, are not guaranteed, and should not be considered investment advice or an indication of trading intent.
The S&P 500 Index is an unmanaged index commonly used to measure the performance of U.S. stocks. One cannot invest directly in an index.
The Fund is non-diversified, meaning it may concentrate its assets in fewer individual holdings than a diversified fund, making it more exposed to individual stock volatility than a diversified fund. Investments in foreign securities may involve political, economic and currency risks, greater volatility and differences in accounting methods. Investments are focused in the natural gas distribution and transmission industry; sector funds may be subject to a higher degree of market risk.
References to specific securities should not be considered a recommendation to buy or sell any security. Fund holdings and sector allocations are subject to change. Please refer to the Schedule of Investments included in this report for additional portfolio information.
| HENNESSY FUNDS | 1-800-966-4354 | |
Financial Statements
Schedule of Investments as of October 31, 2015 |
HENNESSY GAS UTILITY FUND
(% of Net Assets)
| TOP TEN HOLDINGS (EXCLUDING CASH/CASH EQUIVALENTS) | % NET ASSETS |
| Spectra Energy Corp. | 4.96% |
| Sempra Energy | 4.96% |
| Cheniere Energy, Inc. | 4.93% |
| The Williams Companies, Inc. | 4.92% |
| National Grid PLC | 4.90% |
| TransCanada Corp. | 4.88% |
| Kinder Morgan, Inc. | 4.83% |
| Dominion Resources, Inc. | 4.82% |
| Enbridge, Inc. | 4.66% |
| Columbia Pipeline Group, Inc. | 3.64% |
Note: For presentation purposes, the Fund has grouped some of the industry categories. For purposes of categorizing securities for compliance with Section 8(b)(1) of the Investment Company Act of 1940, as amended, the Fund uses more specific industry classifications.
| COMMON STOCKS – 98.09% | | Number | | | | | | % of | |
| | | of Shares | | | Value | | | Net Assets | |
| Energy – 34.15% | | | | | | | | | |
| Cheniere Energy, Inc. (a) | | | 1,642,617 | | | $ | 81,342,394 | | | | 4.93 | % |
| Columbia Pipeline Group, Inc. | | | 2,892,582 | | | | 60,078,928 | | | | 3.64 | % |
| Enbridge, Inc. (b) | | | 1,800,821 | | | | 76,877,048 | | | | 4.66 | % |
| EQT Corp. | | | 331,732 | | | | 21,917,533 | | | | 1.33 | % |
| Kinder Morgan, Inc. | | | 2,912,725 | | | | 79,663,029 | | | | 4.83 | % |
| Spectra Energy Corp. | | | 2,864,415 | | | | 81,836,337 | | | | 4.96 | % |
| The Williams Companies, Inc. | | | 2,055,057 | | | | 81,051,448 | | | | 4.92 | % |
| TransCanada Corp. (b) | | | 2,393,427 | | | | 80,395,213 | | | | 4.88 | % |
| | | | | | | | 563,161,930 | | | | 34.15 | % |
| | | | | | | | | | | | | |
| Financials – 0.44% | | | | | | | | | | | | |
| Berkshire Hathaway, Inc., Class A (a) | | | 36 | | | | 7,365,456 | | | | 0.44 | % |
| | | | | | | | | | | | | |
| Utilities – 63.50% | | | | | | | | | | | | |
| AGL Resources, Inc. | | | 931,730 | | | | 58,233,125 | | | | 3.53 | % |
| ALLETE, Inc. | | | 3,150 | | | | 158,161 | | | | 0.01 | % |
| Alliant Energy Corp. | | | 81,904 | | | | 4,833,974 | | | | 0.29 | % |
| Ameren Corp. | | | 200,490 | | | | 8,757,403 | | | | 0.53 | % |
| Atmos Energy Corp. | | | 913,288 | | | | 57,537,144 | | | | 3.49 | % |
| Avista Corp. | | | 106,472 | | | | 3,604,077 | | | | 0.22 | % |
| Black Hills Corp. | | | 87,959 | | | | 4,026,763 | | | | 0.24 | % |
| Centerpoint Energy, Inc. | | | 946,226 | | | | 17,552,492 | | | | 1.06 | % |
| Chesapeake Utilities Corp. | | | 115,108 | | | | 6,009,789 | | | | 0.36 | % |
| CMS Energy Corp. | | | 765,148 | | | | 27,598,888 | | | | 1.67 | % |
| Consolidated Edison, Inc. | | | 442,786 | | | | 29,113,180 | | | | 1.77 | % |
| Corning Natural Gas Holding Corp. | | | 24,767 | | | | 414,847 | | | | 0.03 | % |
| Delta Natural Gas Company, Inc. | | | 68,788 | | | | 1,405,339 | | | | 0.09 | % |
| Dominion Resources, Inc. | | | 1,112,446 | | | | 79,462,018 | | | | 4.82 | % |
| DTE Energy Co. | | | 301,454 | | | | 24,595,632 | | | | 1.49 | % |
| Duke Energy Corp. | | | 138,837 | | | | 9,922,680 | | | | 0.60 | % |
| Entergy Corp. | | | 12,900 | | | | 879,264 | | | | 0.05 | % |
| Eversource Energy | | | 289,975 | | | | 14,771,327 | | | | 0.90 | % |
| Exelon Corp. | | | 422,131 | | | | 11,785,898 | | | | 0.72 | % |
| Gas Natural, Inc. | | | 61,498 | | | | 542,412 | | | | 0.03 | % |
| Iberdrola SA – ADR (b) | | | 423,629 | | | | 12,081,899 | | | | 0.73 | % |
| MDU Resources Group, Inc. | | | 703,407 | | | | 13,266,256 | | | | 0.80 | % |
The accompanying notes are an integral part of these financial statements.
| HENNESSY FUNDS | 1-800-966-4354 | |
| COMMON STOCKS | | Number | | | | | | % of | |
| | | of Shares | | | Value | | | Net Assets | |
| Utilities (Continued) | | | | | | | | | |
| MGE Energy, Inc. | | | 58,554 | | | $ | 2,416,524 | | | | 0.15 | % |
| National Fuel Gas Co. | | | 369,424 | | | | 19,405,843 | | | | 1.18 | % |
| National Grid PLC – ADR (b) | | | 1,128,318 | | | | 80,787,569 | | | | 4.90 | % |
| New Jersey Resources Corp. | | | 538,884 | | | | 17,071,845 | | | | 1.04 | % |
| NiSource, Inc. | | | 1,455,131 | | | | 27,880,310 | | | | 1.69 | % |
| Northwest Natural Gas Co. | | | 255,951 | | | | 12,226,779 | | | | 0.74 | % |
| Northwestern Corp. | | | 135,698 | | | | 7,353,475 | | | | 0.45 | % |
| One Gas, Inc. | | | 473,125 | | | | 23,107,425 | | | | 1.40 | % |
| Pepco Holdings, Inc. | | | 79,404 | | | | 2,114,529 | | | | 0.13 | % |
| PG&E Corp. | | | 1,094,299 | | | | 58,435,567 | | | | 3.54 | % |
| Piedmont Natural Gas Company, Inc. | | | 668,361 | | | | 38,303,769 | | | | 2.32 | % |
| PPL Corp. | | | 534,719 | | | | 18,394,334 | | | | 1.12 | % |
| Public Service Enterprise Group, Inc. | | | 784,790 | | | | 32,403,979 | | | | 1.97 | % |
| Questar Corp. | | | 1,192,926 | | | | 24,633,922 | | | | 1.49 | % |
| RGC Resources, Inc. | | | 46,680 | | | | 970,944 | | | | 0.06 | % |
| SCANA Corp. | | | 195,966 | | | | 11,605,107 | | | | 0.70 | % |
| Sempra Energy | | | 798,340 | | | | 81,757,999 | | | | 4.96 | % |
| South Jersey Industries, Inc. | | | 419,671 | | | | 11,125,478 | | | | 0.67 | % |
| Southwest Gas Corp. | | | 387,645 | | | | 23,824,662 | | | | 1.44 | % |
| TECO Energy, Inc. | | | 560,551 | | | | 15,134,877 | | | | 0.92 | % |
| The Empire District Electric Co. | | | 21,075 | | | | 475,241 | | | | 0.03 | % |
| The Laclede Group, Inc. | | | 354,408 | | | | 20,757,677 | | | | 1.26 | % |
| UGI Corp. | | | 340,402 | | | | 12,482,541 | | | | 0.76 | % |
| UIL Holdings Corp. | | | 216,368 | | | | 11,032,604 | | | | 0.67 | % |
| Unitil Corp. | | | 78,771 | | | | 2,794,007 | | | | 0.17 | % |
| Vectren Corp. | | | 382,228 | | | | 17,379,907 | | | | 1.05 | % |
| WEC Energy Group, Inc. | | | 864,090 | | | | 44,552,480 | | | | 2.70 | % |
| WGL Holdings, Inc. | | | 376,992 | | | | 23,460,212 | | | | 1.42 | % |
| Xcel Energy, Inc. | | | 526,899 | | | | 18,773,411 | | | | 1.14 | % |
| | | | | | | | 1,047,215,585 | | | | 63.50 | % |
| | | | | | | | | | | | | |
| Total Common Stocks | | | | | | | | | | | | |
| (Cost $1,252,358,503) | | | | | | | 1,617,742,971 | | | | 98.09 | % |
The accompanying notes are an integral part of these financial statements.
| PARTNERSHIPS – 0.98% | | Number | | | | | | % of | |
| | | of Shares | | | Value | | | Net Assets | |
| Energy – 0.98% | | | | | | | | | |
| Plains GP Holdings LP | | | 1,037,777 | | | $ | 16,137,432 | | | | 0.98 | % |
| | | | | | | | | | | | | |
| Total Partnerships | | | | | | | | | | | | |
| (Cost $27,331,576) | | | | | | | 16,137,432 | | | | 0.98 | % |
| | | | | | | | | | | | | |
| SHORT-TERM INVESTMENTS – 0.86% | | | | | | | | | | | | |
| | | | | | | | | | | | | |
| Money Market Funds – 0.86% | | | | | | | | | | | | |
| Fidelity Government Portfolio – | | | | | | | | | | | | |
| Institutional Class, 0.01% (c) | | | 14,138,940 | | | | 14,138,940 | | | | 0.86 | % |
| | | | | | | | | | | | | |
| Total Short-Term Investments | | | | | | | | | | | | |
| (Cost $14,138,940) | | | | | | | 14,138,940 | | | | 0.86 | % |
| | | | | | | | | | | | | |
| Total Investments | | | | | | | | | | | | |
| (Cost $1,293,829,019) – 99.93% | | | | | | | 1,648,019,343 | | | | 99.93 | % |
| Other Assets in | | | | | | | | | | | | |
| Excess of Liabilities – 0.07% | | | | | | | 1,186,702 | | | | 0.07 | % |
TOTAL NET ASSETS – 100.00% | | | | | | $ | 1,649,206,045 | | | | 100.00 | % |
Percentages are stated as a percent of net assets.
ADR – American Depositary Receipt
| (a) | Non-income producing security. |
| (b) | U.S. traded security of a foreign corporation. |
| (c) | The rate listed is the fund’s 7-day yield as of October 31, 2015. |
The accompanying notes are an integral part of these financial statements.
| HENNESSY FUNDS | 1-800-966-4354 | |
Summary of Fair Value Exposure at October 31, 2015
The following is a summary of the inputs used to value the Fund’s net assets as of October 31, 2015 (see Note 3 in the accompanying notes to the financial statements):
| Common Stocks | | Level 1 | | | Level 2 | | | Level 3 | | | Total | |
| Energy | | $ | 563,161,930 | | | $ | — | | | $ | — | | | $ | 563,161,930 | |
| Financials | | | 7,365,456 | | | | — | | | | — | | | | 7,365,456 | |
| Utilities | | | 1,047,215,585 | | | | — | | | | — | | | | 1,047,215,585 | |
| Total Common Stocks | | $ | 1,617,742,971 | | | $ | — | | | $ | — | | | $ | 1,617,742,971 | |
| Partnerships | | | | | | | | | | | | | | | | |
| Energy | | $ | 16,137,432 | | | $ | — | | | $ | — | | | $ | 16,137,432 | |
| Total Partnerships | | $ | 16,137,432 | | | $ | — | | | $ | — | | | $ | 16,137,432 | |
| Short-Term Investments | | | | | | | | | | | | | | | | |
| Money Market Funds | | $ | 14,138,940 | | | $ | — | | | $ | — | | | $ | 14,138,940 | |
| Total Short-Term Investments | | $ | 14,138,940 | | | $ | — | | | $ | — | | | $ | 14,138,940 | |
| Total Investments | | $ | 1,648,019,343 | | | $ | — | | | $ | — | | | $ | 1,648,019,343 | |
Transfers between levels are recognized at the end of the reporting period. During the year ended October 31, 2015, the Fund recognized no transfers between levels.
The accompanying notes are an integral part of these financial statements.
Financial Statements
Statement of Assets and Liabilities as of October 31, 2015 |
| ASSETS: | | | |
| Investments in securities, at value (cost $1,293,829,019) | | $ | 1,648,019,343 | |
| Dividends and interest receivable | | | 2,625,328 | |
| Receivable for fund shares sold | | | 619,912 | |
| Receivable for securities sold | | | 6,267,872 | |
| Prepaid expenses and other assets | | | 77,331 | |
| Total Assets | | | 1,657,609,786 | |
| | | | | |
| LIABILITIES: | | | | |
| Payable for securities purchased | | | 4,759,488 | |
| Payable for fund shares redeemed | | | 1,573,733 | |
| Payable to advisor | | | 565,789 | |
| Payable to administrator | | | 272,223 | |
| Payable to auditor | | | 20,299 | |
| Accrued distribution fees | | | 552,105 | |
| Accrued service fees | | | 141,447 | |
| Accrued trustees fees | | | 2,398 | |
| Accrued expenses and other payables | | | 516,259 | |
| Total Liabilities | | | 8,403,741 | |
| NET ASSETS | | $ | 1,649,206,045 | |
| | | | | |
| NET ASSETS CONSIST OF: | | | | |
| Capital stock | | $ | 1,302,520,891 | |
| Accumulated net investment income | | | 3,171,307 | |
| Accumulated net realized loss on investments | | | (10,676,477 | ) |
| Unrealized net appreciation on investments | | | 354,190,324 | |
| Total Net Assets | | $ | 1,649,206,045 | |
| | | | | |
| NET ASSETS | | | | |
| Investor Class: | | | | |
| Shares authorized (no par value) | | Unlimited | |
| Net assets applicable to outstanding Investor Class shares | | $ | 1,649,206,045 | |
| Shares issued and outstanding | | | 59,566,272 | |
| Net asset value, offering price and redemption price per share | | $ | 27.69 | |
The accompanying notes are an integral part of these financial statements.
| HENNESSY FUNDS | 1-800-966-4354 | |
Financial Statements
Statement of Operations for the year ended October 31, 2015 |
| INVESTMENT INCOME: | | | |
Dividend income(1) | | $ | 66,800,950 | |
| Interest income | | | 1,522 | |
| Total investment income | | | 66,802,472 | |
| | | | | |
| EXPENSES: | | | | |
| Investment advisory fees (See Note 5) | | | 8,195,957 | |
| Sub-transfer agent expenses – Investor Class (See Note 5) | | | 4,289,552 | |
| Administration, fund accounting, custody and transfer agent fees (See Note 5) | | | 2,029,869 | |
| Distribution fees – Investor Class (See Note 5) | | | 1,951,249 | |
| Service fees – Investor Class (See Note 5) | | | 1,300,833 | |
| Reports to shareholders | | | 172,698 | |
| Federal and state registration fees | | | 47,163 | |
| Legal fees | | | 34,998 | |
| Interest expense (See Note 6) | | | 24,730 | |
| Compliance expense | | | 22,186 | |
| Audit fees | | | 20,898 | |
| Trustees’ fees and expenses | | | 19,926 | |
| Other expenses | | | 951,478 | |
| Total expenses | | | 19,061,537 | |
| NET INVESTMENT INCOME | | $ | 47,740,935 | |
| | | | | |
| REALIZED AND UNREALIZED GAINS (LOSSES): | | | | |
| Net realized gain on investments | | $ | 34,577,557 | |
| Net realized loss on foreign currency | | | (115,422 | ) |
| Net change in unrealized depreciation on investments | | | (223,791,585 | ) |
| Net loss on investments | | | (189,329,450 | ) |
| NET DECREASE IN NET ASSETS RESULTING FROM OPERATIONS | | $ | (141,588,515 | ) |
(1) | Net of foreign taxes withheld and issuance fees of $1,171,412. |
The accompanying notes are an integral part of these financial statements.
Financial Statements
| Statements of Changes in Net Assets |
| | | Year Ended | | | Year Ended | |
| | | October 31, 2015 | | | October 31, 2014 | |
| OPERATIONS: | | | | | | |
| Net investment income | | $ | 47,740,935 | | | $ | 38,250,537 | |
| Net realized gain on securities | | | 34,462,135 | | | | 47,518,015 | |
| Net change in unrealized appreciation (depreciation) | | | | | | | | |
| on securities | | | (223,791,585 | ) | | | 248,176,790 | |
| Net increase (decrease) in net assets | | | | | | | | |
| resulting from operations | | | (141,588,515 | ) | | | 333,945,342 | |
| | | | | | | | | |
| DISTRIBUTIONS TO SHAREHOLDERS FROM: | | | | | | | | |
| Net investment income – Investor Class | | | (48,567,636 | ) | | | (36,086,377 | ) |
| Net realized gains – Investor Class | | | (66,085,456 | ) | | | (27,515,134 | ) |
| Total distributions | | | (114,653,092 | ) | | | (63,601,511 | ) |
| | | | | | | | | |
| CAPITAL SHARE TRANSACTIONS: | | | | | | | | |
| Proceeds from shares subscribed – Investor Class | | | 442,529,547 | | | | 1,127,467,551 | |
| Dividends reinvested – Investor Class | | | 108,194,311 | | | | 60,140,074 | |
| Cost of shares redeemed – Investor Class | | | (900,257,726 | ) | | | (385,760,784 | )(1) |
| Net increase (decrease) in net assets derived | | | | | | | | |
| from capital share transactions | | | (349,533,868 | ) | | | 801,846,841 | |
| TOTAL INCREASE (DECREASE) IN NET ASSETS | | | (605,775,475 | ) | | | 1,072,190,672 | |
| | | | | | | | | |
| NET ASSETS: | | | | | | | | |
| Beginning of year | | | 2,254,981,520 | | | | 1,182,790,848 | |
| End of year | | $ | 1,649,206,045 | | | $ | 2,254,981,520 | |
| Undistributed net investment income, end of year | | $ | 3,171,307 | | | $ | 953,691 | |
| | | | | | | | | |
| CHANGES IN SHARES OUTSTANDING: | | | | | | | | |
| Shares sold – Investor Class | | | 14,803,286 | | | | 38,906,149 | |
| Shares issued to holders as reinvestment | | | | | | | | |
| of dividends – Investor Class | | | 3,682,284 | | | | 2,174,333 | |
| Shares redeemed – Investor Class | | | (30,966,426 | ) | | | (13,350,971 | ) |
| Net increase (decrease) in shares outstanding | | | (12,480,856 | ) | | | 27,729,511 | |
(1) | Net of redemption fees of $6,816 related to redemption fees imposed by the FBR Gas Utility Index Fund during a prior year but not received until fiscal year 2014. |
The accompanying notes are an integral part of these financial statements.
| HENNESSY FUNDS | 1-800-966-4354 | |
Financial Statements
For an Investor Class share outstanding throughout each year
PER SHARE DATA:
Net asset value, beginning of year
Income from investment operations:
Net investment income
Net realized and unrealized gains (losses) on investments
Total from investment operations
Less distributions:
Dividends from net investment income
Dividends from net realized gains
Total distributions
Paid-in capital from redemption fees
Net asset value, end of year
TOTAL RETURN
SUPPLEMENTAL DATA AND RATIOS:
Net assets, end of year (millions)
Ratio of expenses to average net assets
Ratio of net investment income to average net assets
Portfolio turnover rate
(1) | Calculated based on average shares outstanding method. |
(2) | Amount is less than $0.01. |
The accompanying notes are an integral part of these financial statements.
| Year Ended October 31, | |
| 2015 | | | 2014 | | | 2013 | | | 2012 | | | 2011 | |
| | | | | | | | | | | | | |
| $ | 31.30 | | | $ | 26.69 | | | $ | 23.05 | | | $ | 21.21 | | | $ | 17.83 | |
| | | | | | | | | | | | | | | | | | | |
| | | | | | | | | | | | | | | | | | | |
| | 0.69 | | | | 0.62 | | | | 0.62 | | | | 0.58 | | | | 0.51 | (1) |
| | (2.69 | ) | | | 5.18 | | | | 4.18 | | | | 1.99 | | | | 3.59 | |
| | (2.00 | ) | | | 5.80 | | | | 4.80 | | | | 2.57 | | | | 4.10 | |
| | | | | | | | | | | | | | | | | | | |
| | | | | | | | | | | | | | | | | | | |
| | (0.70 | ) | | | (0.59 | ) | | | (0.61 | ) | | | (0.58 | ) | | | (0.51 | ) |
| | (0.91 | ) | | �� | (0.60 | ) | | | (0.55 | ) | | | (0.16 | ) | | | (0.21 | ) |
| | (1.61 | ) | | | (1.19 | ) | | | (1.16 | ) | | | (0.74 | ) | | | (0.72 | ) |
| | — | | | | 0.00 | (2) | | | 0.00 | (2) | | | 0.01 | | | | 0.00 | (2) |
| $ | 27.69 | | | $ | 31.30 | | | $ | 26.69 | | | $ | 23.05 | | | $ | 21.21 | |
| | | | | | | | | | | | | | | | | | | |
| | (6.59 | )% | | | 22.49 | % | | | 21.70 | % | | | 12.41 | % | | | 23.54 | % |
| | | | | | | | | | | | | | | | | | | |
| | | | | | | | | | | | | | | | | | | |
| $ | 1,649.21 | | | $ | 2,254.98 | | | $ | 1,182.79 | | | $ | 746.82 | | | $ | 433.78 | |
| | 0.93 | % | | | 0.77 | % | | | 0.80 | % | | | 0.69 | % | | | 0.71 | % |
| | 2.33 | % | | | 2.26 | % | | | 2.56 | % | | | 2.72 | % | | | 2.68 | % |
| | 37 | % | | | 20 | % | | | 18 | % | | | 16 | % | | | 17 | % |
The accompanying notes are an integral part of these financial statements.
| HENNESSY FUNDS | 1-800-966-4354 | |
Financial Statements
Notes to the Financial Statements October 31, 2015 |
1). ORGANIZATION
The Hennessy Gas Utility Fund (the “Fund”) is a series of Hennessy Funds Trust (the “Trust”), which was organized as a Delaware statutory trust on September 17, 1992. Prior to February 27, 2015, the Fund was known as the Hennessy Gas Utility Index Fund. The Fund is an open-end management investment company registered under the Investment Company Act of 1940, as amended. The Fund is a successor to the FBR Gas Utility Index Fund (the “Predecessor FBR Fund”), a series of The FBR Funds, a Delaware statutory trust, pursuant to a reorganization that took place after the close of business on October 26, 2012. Prior to October 26, 2012, the Fund had no investment operations. As a result of the reorganization, holders of the Investor Class shares of the Predecessor FBR Fund received Investor Class shares of the Fund (the Investor Class shares of the Fund are the successor to the accounting and performance information of the Predecessor FBR Fund). The investment objective of the Fund is income and capital appreciation. The Fund is a non-diversified fund and offers Investor Class shares.
As an investment company, the Fund follows the investment company accounting and reporting guidance of the Financial Accounting Standards Board (“FASB”) Accounting Standard Codification Topic 946 “Financial Services—Investment Companies.”
2). SIGNIFICANT ACCOUNTING POLICIES
The following is a summary of significant accounting policies consistently followed by the Fund in the preparation of the financial statements. These policies are in conformity with U.S. generally accepted accounting principles (“GAAP”).
| a). | Investment Valuation – All investments in securities are recorded at their estimated fair value, as described in Note 3. |
| | |
| b). | Federal Income Taxes – Provision for federal income taxes or excise taxes has not been made since the Fund has elected to be taxed as a “regulated investment company” and intends to distribute substantially all of its taxable income to its shareholders and otherwise comply with the provisions of the Internal Revenue Code of 1986, as amended, applicable to regulated investment companies. Net investment income or loss and realized gains and losses for federal income tax purposes may differ from that reported on the financial statements because of temporary book and tax basis differences. Temporary differences are primarily the result of the treatment of wash sales for tax reporting purposes. The Fund recognizes interest and penalties related to income tax benefits, if any, in the statement of operations as an income tax expense. Distributions from net realized gains for book purposes may include short-term capital gains, which are included as ordinary income to shareholders for tax purposes. |
| | |
| | Due to inherent differences in the recognition of income, expenses, and realized gains/losses under GAAP and federal income tax regulations, permanent differences between book and tax basis reporting for the 2015 fiscal year have been identified and appropriately reclassified on the Statement of Assets and Liabilities. The adjustments are as follows: |
| Undistributed | Accumulated | |
| Net Investment | Net Realized | |
Income/(Loss) | Gain/(Loss) | Paid-in Capital |
| $3,044,317 | $(10,933,220) | $7,888,903 |
| c). | Income and Expenses – Dividend income is recognized on the ex-dividend date or as soon as information is available to the Fund. Interest income, which includes the amortization of premium and accretion of discount, is recognized on an accrual basis. The Fund is charged for those expenses that are directly attributable to the portfolio, such as advisory, administration, and certain shareholder service fees. |
| | |
| d). | Distributions to Shareholders – Dividends from net investment income for the Fund, if any, are declared and paid on a calendar quarter basis. Distributions of net realized capital gains, if any, are declared and paid annually, usually in December. |
| | |
| e). | Security Transactions – Investment and shareholder transactions are recorded on the trade date. The Fund determines the gain or loss realized from the investment transactions by comparing the original cost of the security lot sold with the net sale proceeds. Discounts and premiums on securities purchased are accreted/amortized over the life of the respective security. |
| | |
| f). | Use of Estimates – The preparation of financial statements in conformity with GAAP requires management to make estimates and assumptions that affect the reported amounts of assets and liabilities and disclosure of contingent assets and liabilities at the date of the financial statements and the reported change in net assets during the reporting period. Actual results could differ from those estimates. |
| | |
| g). | Share Valuation – The net asset value (“NAV”) per share of the Fund is calculated by dividing the sum of the value of the securities held by the Fund, plus cash or other assets, minus all liabilities (including estimated accrued expenses) by the total number of shares outstanding for the Fund, rounded to the nearest cent. The Fund’s shares will not be priced on days the New York Stock Exchange is closed for trading. The offering and redemption price per share for the Fund is equal to the Fund’s NAV per share. |
| | |
| h). | Foreign Currency – Values of investments denominated in foreign currencies, if any, are converted into U.S. dollars using the spot market rate of exchange at the time of valuation. Purchases and sales of investments and income are translated into U.S. dollars using the spot market rate of exchange prevailing on the respective dates of such transactions. The Fund does not isolate the portion of the results of operations resulting from fluctuations in foreign exchange rates on investments from fluctuations resulting from changes in the market prices of securities held. Such fluctuations are included with the net realized and unrealized gain or loss on investments. Foreign investments present additional risks due to currency fluctuations, economic and political factors, lower liquidity, government regulations, differences in accounting standards, and other factors. |
| | |
| i). | Forward Contracts – The Fund may enter into forward currency contracts to reduce its exposure to changes in foreign currency exchange rates on its foreign holdings and to lock in the U.S. dollar cost of firm purchase and sale commitments for securities denominated in foreign currencies. A forward currency contract is a commitment to purchase or sell a foreign currency at a future date at a negotiated forward rate. The gain or loss arising from the difference between the U.S. dollar cost of the original contract and the value of the foreign currency in U.S. dollars upon closing of such contract is included in net realized gain or loss from foreign currency transactions. During the fiscal year ended October 31, 2015, the Fund did not enter into any forward contracts. |
| | |
| j). | Repurchase Agreements – The Fund may enter into repurchase agreements with member banks or security dealers of the Federal Reserve Board whom the investment advisor deems creditworthy. The repurchase price generally equals the price paid by the Fund plus interest negotiated on the basis of current short-term rates. |
| HENNESSY FUNDS | 1-800-966-4354 | |
| | Securities pledged as collateral for repurchase agreements are held by the custodian bank until the respective agreements mature. Provisions of the repurchase agreements ensure that the market value of the collateral, including accrued interest thereon, is sufficient to cover the repurchase amount in the event of default of the counterparty. If the counterparty defaults and the value of the collateral declines or if the counterparty enters an insolvency proceeding, realization of the collateral by the Fund may be delayed or limited. |
| | |
| k). | Accounting for Uncertainty in Income Taxes – The Fund has accounting policies regarding recognition and measurement of tax positions taken or expected to be taken on a tax return. The tax returns of the Fund for the prior three fiscal years are open for examination. The Fund has reviewed all open tax years in major jurisdictions and concluded that there is no impact on the Fund’s net assets and no tax liability resulting from unrecognized tax benefits relating to uncertain income tax positions taken or expected to be taken on a tax return. The Fund’s major tax jurisdictions are U.S. federal and Delaware. |
| | |
| l). | New Accounting Pronouncements – In June 2014, the FASB issued Accounting Standards Update (“ASU”) No. 2014-11 “Repurchase-to Maturity Transactions, Repurchase Financings, and Disclosures.” The amendments in this ASU require an entity to modify accounting for repurchase-to-maturity transactions and repurchase financing arrangements, as well as modify required disclosures for repurchase agreements, securities lending transactions, and repurchase-to-maturity transactions that are accounted for as secured borrowings. The guidance is effective for fiscal years beginning on or after December 15, 2014, and for interim periods within those fiscal years. Management is currently evaluating the impact these changes will have on the Fund’s financial statement disclosures. |
| | |
| | In May 2015, the FASB issued ASU No. 2015-07 “Disclosure for Investments in Certain Entities that Calculate Net Asset Value per Share (or Its Equivalent).” The amendments in ASU No. 2015-07 remove the requirement to categorize within the fair value hierarchy investments measured at NAV and require the disclosure of sufficient information to reconcile the fair value of the remaining assets categorized within the fair value hierarchy to the financial statements. The amendments in ASU No. 2015-07 are effective for fiscal years beginning after December 15, 2015, and interim periods within those fiscal years. Management has reviewed the requirements and believes the adoption of ASU 2015-07 will not have a material impact on the Fund’s financial statements and related disclosures. |
3). SECURITIES VALUATION
The Fund follows authoritative fair valuation accounting standards that establish an authoritative definition of fair value and set out a hierarchy for measuring fair value. These standards require additional disclosures about the various inputs and valuation techniques used to develop the measurements of fair value and a discussion in changes in valuation techniques and related inputs during the period. These inputs are summarized in the three broad levels listed below:
| | Level 1 – | Quoted unadjusted prices for identical instruments in active markets to which the Fund has access at the date of measurement. |
| | | |
| | Level 2 – | Quoted prices for similar instruments in active markets; quoted prices for identical or similar instruments in markets that are not active; and model-derived valuations in which all significant inputs and significant value drivers are observable in active markets. Level 2 inputs are those in |
| | | markets for which there are few transactions, the prices are not current, the prices are fair value adjusted due to post-market close subsequent events (foreign markets), little public information exists, or instances where prices vary substantially over time or among brokered market makers. These inputs may also include interest rates, prepayment speeds, credit risk curves, default rates, and similar data. |
| | | |
| | Level 3 – | Model-derived valuations in which one or more significant inputs or significant value drivers are unobservable. Unobservable inputs are those inputs that reflect the Fund’s own assumptions about what market participants would use to price the asset or liability based on the best available information. |
Following is a description of the valuation techniques applied to the Fund’s major categories of assets and liabilities measured at fair value on a recurring basis.
Equity Securities – Equity securities, including common stocks, preferred stocks, foreign-issued common stocks, exchange-traded funds, closed-end mutual funds, partnerships, rights, and real estate investment trusts, that are traded on a securities exchange for which a last-quoted sales price is readily available will generally be valued at the last sales price as reported by the primary exchange on which the securities are listed. Securities listed on The NASDAQ Stock Market (“NASDAQ”) will generally be valued at the NASDAQ Official Closing Price, which may differ from the last sales price reported. Securities traded on a securities exchange for which a last-quoted sales price is not readily available will generally be valued at the mean between the bid and ask prices. To the extent these securities are actively traded and valuation adjustments are not applied, they are classified in Level 1 of the fair value hierarchy. Securities traded on foreign exchanges generally are not valued at the same time the Fund calculates its NAV because most foreign markets close well before such time. The earlier close of most foreign markets gives rise to the possibility that significant events, including broad market moves, may have occurred in the interim. In certain circumstances, it may be determined that a security needs to be fair valued because it appears that the value of the security might have been materially affected by events occurring after the close of the market in which the security is principally traded, but before the time the Fund calculates its NAV, such as by a development that affects an entire market or region (e.g., weather-related events) or a potentially global development (e.g., a terrorist attack that may be expected to have an effect on investor expectations worldwide).
Registered Investment Companies – Investments in registered investment companies (e.g., mutual funds) are generally priced at the ending NAV provided by the applicable registered investment company’s service agent and will be classified in Level 1 of the fair value hierarchy.
Debt Securities – Debt securities, including corporate bonds, asset-backed securities, mortgage-backed securities, municipal bonds, U.S. Treasuries, and U.S. government agency issues, are generally valued at market on the basis of valuations furnished by an independent pricing service that utilizes both dealer-supplied valuations and formula-based techniques. The pricing service may consider recently executed transactions in securities of the issuer or comparable issuers, market price quotations (where observable), bond spreads, and fundamental data relating to the issuer. In addition, the model may incorporate market observable data such as reported sales of similar securities, broker quotes, yields, bids, offers, and reference data. Certain securities are valued principally using dealer quotations. These securities are generally classified in Level 2 of the fair value hierarchy.
| HENNESSY FUNDS | 1-800-966-4354 | |
Short-Term Securities – Short-term equity investments, including money market funds, are valued in the manner specified above. Short-term debt investments are generally valued at amortized cost, which approximates fair market value, if their original term to maturity was 60 days or less, or by amortizing the values as of the 61st day prior to maturity, if their original term to maturity exceeded 60 days. Amortized cost is not used if its use would be inappropriate due to credit or other impairments of the issuer, in which case the security’s fair value would be determined, as described below. Short-term securities are generally classified in Level 1 or Level 2 of the fair market hierarchy depending on the inputs used and market activity levels for specific securities.
The Board of Trustees of the Fund (the “Board”) has adopted fair value pricing procedures that are followed when a price for a security is not readily available or if a significant event has occurred that indicates the closing price of a security no longer represents the true value of that security. Fair value pricing determinations are made in good faith in accordance with these procedures. There are numerous criteria that will be given consideration in determining a fair value of a security. Some of these criteria are trading volume of a security and markets, the value of other like securities, and news events with direct bearing to a security or markets. Fair value pricing results in an estimated price for a security that reflects the amount the Fund might reasonably expect to receive in a current sale. Depending on the relative significance of the valuation inputs, these securities may be classified in either Level 2 or Level 3 of the fair value hierarchy.
The fair valuation of foreign securities may be determined with the assistance of a pricing service using correlations between the movement of prices of such securities and indices of domestic securities and other appropriate indicators, such as closing market prices of relevant American Depositary Receipts or futures contracts. The effect of using fair value pricing is that the Fund’s NAV will reflect the affected portfolio securities’ value as determined in the judgment of the Board or its designee instead of being determined by the market. Using a fair value pricing methodology to price foreign securities may result in a value that is different from a foreign security’s most recent closing price and from the prices used by other investment companies to calculate their NAVs and are generally considered Level 2 prices in the fair valuation hierarchy. Because the Fund may invest in foreign securities, the value of the Fund’s portfolio securities may change on days when you will not be able to purchase or redeem your shares.
The Board has delegated day-to-day valuation matters to a Valuation Committee comprised of one or more representatives from Hennessy Advisors, Inc., the Fund’s investment advisor. The function of the Valuation Committee is to value securities where current and reliable market quotations are not readily available. All actions taken by the Valuation Committee are reviewed by the Board.
The Fund has performed an analysis of all existing investments to determine the significance and character of all inputs to their fair value determination. Various inputs are used in determining the value of the Fund’s investments. The inputs or methodology used for valuing securities are not necessarily an indication of the risk associated with investing in those securities. Details related to the fair valuation hierarchy of the Fund’s securities as of October 31, 2015 are included in the Fund’s Schedule of Investments.
4). INVESTMENT TRANSACTIONS
Purchases and sales of investment securities (excluding government and short-term investments) for the Fund during the fiscal year ended October 31, 2015 were $748,499,041 and $1,150,199,582, respectively.
There were no purchases or sales/maturities of long-term U.S. Government Securities for the Fund during the fiscal year ended October 31, 2015.
5). INVESTMENT MANAGEMENT FEE AND OTHER TRANSACTIONS WITH AFFILIATES
Hennessy Advisors, Inc. (the “Advisor”) is the investment advisor of the Fund. The Advisor provides the Fund with investment management services under an Investment Advisory Agreement. The Advisor furnishes all investment advice, office space, facilities, and provides most of the personnel needed by the Fund. As compensation for its services, the Advisor is entitled to a monthly fee from the Fund. The fee is based upon the average daily net assets of the Fund at the annual rate of 0.40%. The net investment advisory fees payable by the Fund as of October 31, 2015 were $565,789.
The Advisor contractually agreed to limit the total annual operating expenses of the Fund (excluding interest, taxes, brokerage commissions, dividend expenses, acquired fund fees and expenses, extraordinary legal expenses, or any other extraordinary expenses and, from and after November 1, 2014, 12b-1 fees) to 0.85% of the Fund’s net assets through February 28, 2015. The expense limitation agreement for the Fund is no longer in effect.
For a period of three years after the year in which the Advisor waived or reimbursed expenses, the Advisor may seek reimbursement from the Fund to the extent that total annual fund operating expenses are less than the expense limitation that was in effect at the time the Advisor waived or reimbursed expenses. During the three years ended October 31, 2015, no expenses were waived or reimbursed by the Advisor and therefore no expenses are subject to potential recovery.
The Board has approved a Shareholder Servicing Agreement for the Fund, effective as of February 28, 2015, which was instituted to compensate the Advisor for the non-investment management services it provides to the Fund. The Shareholder Servicing Agreement provides for a monthly fee paid to the Advisor at an annual rate of 0.10% of the average daily net assets of the Fund. Shareholder service fees payable by the Fund as of October 31, 2015 were $141,447.
The Fund has adopted a plan pursuant to Rule 12b-1 under the Investment Company Act of 1940, as amended, that authorizes payments in connection with the distribution of the Fund’s shares at an annual rate of up to 0.25% of the Fund’s average daily net assets. The plan was not implemented, however, until March 1, 2015, and the Fund is currently only using up to 0.15% of its average daily net assets for such purpose. Amounts paid under the plan may be spent on any activities or expenses primarily intended to result in the sale of shares, including but not limited to, advertising, shareholder account servicing, the printing and mailing of prospectuses to other than current shareholders, the printing and mailing of sales literature, and compensation for sales and marketing activities or to financial institutions and others, such as dealers and distributors.
The Fund has entered into agreements with various brokers, dealers, and financial intermediaries in connection with the sale of shares of the Fund. The agreements provide for periodic payments by the Fund to the brokers, dealers, and financial intermediaries for providing certain shareholder maintenance services (sub-transfer agent expenses). These shareholder services include the pre-processing and quality control of new accounts, shareholder correspondence, answering customer inquiries regarding account status, and facilitating shareholder telephone transactions. Fees paid by the Fund to various brokers, dealers, and financial intermediaries during the fiscal year ended October 31, 2015 were $4,289,552.
Membership fees are paid to the American Gas Association (“AGA”), which provides administrative services to the Fund pursuant to an Administrative Services Agreement between the Fund and AGA. These administrative services include overseeing the calculation of the AGA Stock Index. Prior to January 1, 2015, AUS Consultants Utility Services performed the actual computations required to produce the AGA Stock Index and
| HENNESSY FUNDS | 1-800-966-4354 | |
received a fee for such calculations pursuant to a contractual arrangement with AGA. As of January 1, 2015, AUS Consultants Utility Services was replaced by Sussex Economic Advisors, LLC. AGA does not furnish other securities advice to the Fund or the Advisor or make recommendations regarding the purchase or sale of securities by the Fund. Under the terms of an agreement approved by the Board, AGA provides the Advisor with current information regarding the common stock composition of the AGA Stock Index no less than quarterly, but may supply such information more frequently. In addition, AGA provides the Fund with information on the natural gas industry. The Fund pays AGA in its capacity as administrator a fee at an annual rate of 0.04% of the average daily net assets of the Fund.
U.S. Bancorp Fund Services, LLC (“USBFS”) provides the Fund with administrative, fund accounting, and transfer agent services, including all regulatory reporting, and necessary office equipment and personnel. As administrator, USBFS is responsible for activities such as (i) preparing various federal and state regulatory filings, reports, and returns for the Fund, (ii) preparing reports and materials to be supplied to the Board, (iii) monitoring the activities of the Fund’s custodian, transfer agent, and accountants, and (iv) coordinating the preparation and payment of the Fund’s expenses and reviewing the Fund’s expense accruals. Fees paid to USBFS during the fiscal year ended October 31, 2015 were $2,029,869.
U.S. Bank, N.A., an affiliate of USBFS, serves as the Fund’s custodian. Quasar Distributors, LLC acts as the Fund’s principal underwriter in a continuous public offering of the Fund’s shares. Quasar Distributors, LLC is an affiliate of USBFS and U.S. Bank, N.A.
6). LINE OF CREDIT
The Fund has an uncommitted line of credit with the other funds in the Hennessy Funds family of funds (the “Hennessy Funds”) in the amount of the lesser of (i) $100,000,000 or (ii) 33.33% of each Hennessy Fund’s net assets, or 30% for the Fund and 10% for the Hennessy Balanced Fund, intended to provide short-term financing, if necessary, subject to certain restrictions, in connection with shareholder redemptions. The credit facility is with the Hennessy Funds’ custodian bank, U.S. Bank, N.A. Borrowings under this arrangement bear interest at the bank’s prime rate and are secured by all of the Fund’s assets (as to its own borrowings only). During the fiscal year ended October 31, 2015, the Fund had an outstanding average daily balance and a weighted average interest rate of $689,323 and 3.25%, respectively. The maximum amount outstanding for the Fund during the period was $16,036,000. At October 31, 2015, the Fund did not have any borrowings outstanding under the line of credit.
7). FEDERAL TAX INFORMATION
As of October 31, 2015, the components of accumulated earnings (losses) for income tax purposes were as follows:
| Cost of investments for tax purposes | | $ | 1,340,351,568 | |
| Gross tax unrealized appreciation | | $ | 431,871,765 | |
| Gross tax unrealized depreciation | | | (124,203,990 | ) |
| Net tax unrealized appreciation | | $ | 307,667,775 | |
| Undistributed ordinary income | | $ | 3,171,307 | |
| Undistributed long-term capital gains | | | 35,846,072 | |
| Total distributable earnings | | $ | 39,017,379 | |
| Other accumulated gain | | $ | — | |
| Total accumulated gain | | $ | 346,685,154 | |
The difference between book-basis and tax-basis unrealized appreciation is attributable primarily to wash sales and partnership adjustments.
At October 31, 2015, the Fund had no tax basis capital losses to offset future capital gains.
At October 31, 2015, the Fund did not defer, on a tax basis, any late year ordinary losses.
The tax character of distributions paid during fiscal year 2015 and fiscal year 2014 for the Fund were as follows:
| | | Year Ended | | | Year Ended | |
| | | October 31, 2015 | | | October 31, 2014 | |
| Ordinary income | | $ | 90,813,646 | | | $ | 46,037,795 | |
| Long-term capital gain | | | 23,839,446 | | | | 17,563,716 | |
| | | $ | 114,653,092 | | | $ | 63,601,511 | |
8). EVENTS SUBSEQUENT TO YEAR END
Management has evaluated the Fund’s related events and transactions that occurred subsequent to October 31, 2015, through the date of issuance of the Fund’s financial statements. Other than as disclosed below, management has determined that there were no subsequent events requiring recognition or disclosure in the financial statements.
On December 9, 2015, capital gains were declared and paid to shareholders of record as of December 8, 2015 as follows:
| | Long-term |
| Investor Class | $0.62624 |
| HENNESSY FUNDS | 1-800-966-4354 | |
Report of Independent Registered Public Accounting Firm
To the Board of Trustees of Hennessy Funds Trust
And the Shareholders of the Hennessy Gas Utility Fund
Novato, CA
We have audited the accompanying statement of assets and liabilities, including the schedule of investments, of the Hennessy Gas Utility Fund (the “Fund”) (formerly Hennessy Gas Utility Index Fund), a series of Hennessy Funds Trust (the “Trust”), as of October 31, 2015, and the related statement of operations for the year then ended, the statements of changes in net assets for each of the two years in the period then ended, and the financial highlights for each of the five years in the period then ended. These financial statements and financial highlights are the responsibility of the Fund’s management. Our responsibility is to express an opinion on these financial statements and financial highlights based on our audits.
We conducted our audits in accordance with the standards of the Public Company Accounting Oversight Board (United States). Those standards require that we plan and perform the audits to obtain reasonable assurance about whether the financial statements and financial highlights are free of material misstatement. The Fund is not required to have, nor were we engaged to perform, an audit of its internal control over financial reporting. Our audits included consideration of internal control over financial reporting as a basis for designing audit procedures that are appropriate in the circumstances, but not for the purposes of expressing an opinion on the effectiveness of the Fund’s internal control over financial reporting. Accordingly, we express no such opinion. An audit includes examining, on a test basis, evidence supporting the amounts and disclosures in the financial statements. Our procedures included confirmation of securities owned as of October 31, 2015, by correspondence with the custodian and brokers. An audit also includes assessing the accounting principles used and significant estimates made by management, as well as evaluating the overall financial statement presentation. We believe that our audits provide a reasonable basis for our opinion.
In our opinion, the financial statements and financial highlights referred to above present fairly, in all material respects, the financial position of the Hennessy Gas Utility Fund as of October 31, 2015, the results of its operations for the year then ended, the changes in its net assets for each of the two years in the period then ended, and the financial highlights for each of the five years in the period then ended, in conformity with accounting principles generally accepted in the United States of America.
TAIT, WELLER & BAKER LLP
Philadelphia, Pennsylvania
December 21, 2015
Trustees and Officers of the Fund (Unaudited)
The business and affairs of the Fund are managed under the direction of the Board of Trustees of the Trust, and the Board of Trustees elects the Officers of the Trust. Information pertaining to the Trustees and the Officers of the Trust is set forth below. Such persons serve until their successors are duly elected and qualified or until their earlier death, resignation, or removal. Each of the Trustees oversees 16 Hennessy Funds. Unless otherwise indicated, the address of all persons listed below is 7250 Redwood Boulevard, Suite 200, Novato, CA 94945. The Fund’s Statement of Additional Information includes more information about the persons listed below and is available, without charge, upon request by calling 1-800-966-4354.
| | | | Other |
| | | | Directorships |
| Name, Year of Birth, | | | (During Past |
| and Position Held | Length of | Principal Occupation(s) | Five Years) |
with the Trust | Time Served | During Past Five Years | Held by Trustee(1) |
| | | | |
| Disinterested Trustees | | | |
| | | | |
| J. Dennis DeSousa (1936) | Since January | Mr. DeSousa is a real estate investor. | Hennessy SPARX |
| Trustee | 1996 for the | | Funds Trust; |
| | Hennessy Funds | | Hennessy Mutual |
| | | | Funds, Inc.; and |
| | | | The Hennessy |
| | | | Funds, Inc. |
| | | | |
| Robert T. Doyle (1947) | Since January | Mr. Doyle has been the Sheriff of | Hennessy SPARX |
| Trustee | 1996 for the | Marin County, California since 1996. | Funds Trust; |
| | Hennessy Funds | | Hennessy Mutual |
| | | | Funds, Inc.; and |
| | | | The Hennessy |
| | | | Funds, Inc. |
| | | | |
| Gerald P. Richardson (1945) | Since May | Mr. Richardson is an independent | Hennessy SPARX |
| Trustee | 2004 for the | consultant in the securities industry. | Funds Trust; |
| | Hennessy Funds | | Hennessy Mutual |
| | | | Funds, Inc.; and |
| | | | The Hennessy |
| | | | Funds, Inc. |
| | | | |
Interested Trustee(2) | | | |
| | | | |
| Neil J. Hennessy (1956) | Since January | Mr. Hennessy has been employed by | Hennessy Advisors, |
| Trustee, Chairman of | 1996 as a Trustee | Hennessy Advisors, Inc., the Funds’ | Inc.; Hennessy |
| the Board, Chief | for the Hennessy | investment advisor, since 1989. | SPARX Funds Trust; |
| Investment Officer, | Funds and since | He currently serves as President, | Hennessy Mutual |
| Portfolio Manager, | June 2008 as | Chairman and Chief Executive Officer | Funds, Inc.; and |
| and President | an Officer of the | of Hennessy Advisors, Inc. | The Hennessy |
| | Hennessy Funds | | Funds, Inc. |
| HENNESSY FUNDS | 1-800-966-4354 | |
| Name, Year of Birth, | | |
| and Position Held | Length of | Principal Occupation(s) |
with the Trust | Time Served | During Past Five Years |
| | | |
| Officers | | |
| | | |
| Teresa M. Nilsen (1966) | Since January | Ms. Nilsen has been employed by Hennessy Advisors, Inc., |
| Executive Vice President | 1996 for the | the Funds’ investment advisor, since 1989. She currently |
| and Treasurer | Hennessy Funds | serves as Executive Vice President, Chief Operations Officer, |
| | | Chief Financial Officer, and Secretary of Hennessy Advisors, Inc. |
| | | |
| Daniel B. Steadman (1956) | Since March | Mr. Steadman has been employed by Hennessy Advisors, Inc., |
| Executive Vice President | 2000 for the | the Funds’ investment advisor, since 2000. He currently serves |
| and Secretary | Hennessy Funds | as Executive Vice President and Chief Compliance Officer of |
| | | Hennessy Advisors, Inc. |
| | | |
| Jennifer Cheskiewicz (1977) | Since June | Ms. Cheskiewicz has been employed by Hennessy Advisors, |
| Senior Vice President and | 2013 for the | Inc., the Funds’ investment advisor, since June 2013. She |
| Chief Compliance Officer | Hennessy Funds | currently serves as General Counsel of Hennessy Advisors, Inc. |
| | | |
| | | She previously served as in-house counsel to Carlson Capital, |
| | | L.P., an SEC-registered investment advisor to several private |
| | | funds from February 2010 to May 2013. |
| | | |
| Brian Carlson (1972) | Since December | Mr. Carlson has been employed by Hennessy Advisors, Inc., the |
| Senior Vice President and | 2013 for the | Funds’ investment advisor, since December 2013. |
| Head of Distribution | Hennessy Funds | |
| | | Mr. Carlson was previously a co-founder and principal of |
| | | Trivium Consultants, LLC from February 2011 through |
| | | November 2013. |
| | | |
David Ellison (1958)(3) | Since October | Mr. Ellison has served as a Portfolio Manager of the Hennessy |
| Senior Vice President and | 2012 for the | Small Cap Financial Fund, the Hennessy Large Cap Financial |
| Portfolio Manager | Hennessy Funds | Fund, and the Hennessy Technology Fund since inception. |
| | | |
| | | Mr. Ellison previously served as Director, CIO and President of |
| | | FBR Fund Advisers, Inc. from December 1999 to October 2012. |
| | | |
| Brian Peery (1969) | Since March | Mr. Peery has served as a Portfolio Manager of the Hennessy |
| Senior Vice President and | 2003 as an | Cornerstone Growth Fund, the Hennessy Cornerstone Mid Cap |
| Portfolio Manager | Officer of the | 30 Fund, the Hennessy Cornerstone Large Growth Fund, the |
| | Hennessy Funds | Hennessy Cornerstone Value Fund, the Hennessy Total Return |
| | and since | Fund, and the Hennessy Balanced Fund since October 2014. |
| | February 2011 | From February 2011 through September 2014, he served as |
| | as a Co-Portfolio | Co-Portfolio Manager of the same funds. Mr. Peery has also |
| | Manager or | served as a Portfolio Manager of the Hennessy Gas Utility Fund |
| | Portfolio Manager | since February 2015. |
| | for the | |
| | Hennessy Funds | Mr. Peery has been employed by Hennessy Advisors, Inc., the |
| | | Funds’ investment advisor, since 2002. |
| | | |
| Winsor (Skip) Aylesworth | Since October | Mr. Aylesworth has served as a Portfolio Manager of the |
(1947)(3) | 2012 for the | Hennessy Gas Utility Fund since 1998 and as a Portfolio |
| Vice President and | Hennessy Funds | Manager of the Hennessy Technology Fund since inception. |
| Portfolio Manager | | |
| | | Mr. Aylesworth previously served as Executive Vice President |
| | | of The FBR Funds from 1999 to October 2012. |
| Name, Year of Birth, | | |
| and Position Held | Length of | Principal Occupation(s) |
with the Trust | Time Served | During Past Five Years |
| | | |
Ryan Kelley (1972)(4) | Since March | Mr. Kelley has served as a Portfolio Manager of the Hennessy |
| Vice President and | 2013 for the | Gas Utility Fund, the Hennessy Small Cap Financial Fund, and |
| Portfolio Manager | Hennessy Funds | the Hennessy Large Cap Financial Fund since October 2014. |
| | | From March 2013 through September 2014, he served as a |
| | | Co-Portfolio Manager of the same funds. Prior to that, |
| | | he was a Portfolio Analyst of the Hennessy Funds. |
(1) | Pursuant to an internal reorganization, the series of Hennessy Mutual Funds, Inc. (“HMFI”), The Hennessy Funds, Inc. (“HFI”), and Hennessy SPARX Funds Trust (“HSFT”) were reorganized into series of Hennessy Funds Trust on February 28, 2014, which mirrored the corresponding series of HFMI, HFI, and HSFT. Subsequent to the reorganization, HFMI, HFI, and HSFT were dissolved. |
(2) | Mr. Hennessy is considered an “interested person,” as defined in the Investment Company Act of 1940, as amended, because he is an officer of the Hennessy Funds. |
(3) | The address of these officers is 101 Federal Street, Suite 1900, Boston, MA 02110. |
(4) | The address of this officer is 1340 Environ Way, Chapel Hill, NC 27517. |
| HENNESSY FUNDS | 1-800-966-4354 | |
Expense Example (Unaudited)
October 31, 2015
As a shareholder of the Fund, you incur two types of costs: (1) transaction costs, including sales charges (loads) on purchase payments, reinvested dividends, or other distributions; redemption fees; and exchange fees; and (2) ongoing costs, including management fees; service fees; and other Fund expenses. This Example is intended to help you understand your ongoing costs (in dollars) of investing in the Fund and to compare these costs with the ongoing costs of investing in other mutual funds. The Example is based on an investment of $1,000 invested at the beginning of the period and held for the entire period from May 1, 2015 through October 31, 2015.
Actual Expenses
The first line of the table below provides information about actual account values and actual expenses. Although the Fund charges no sales loads or transaction fees, you will be assessed fees for outgoing wire transfers, returned checks and stop payment orders at prevailing rates charged by U.S. Bancorp Fund Services, LLC, the Fund’s transfer agent. If you request that a redemption be made by wire transfer, currently a $15.00 fee is charged by the Fund’s transfer agent. IRA accounts will be charged a $15.00 annual maintenance fee. The example below includes, but is not limited to, management fees, shareholder servicing fees, fund accounting, custody, and transfer agent fees. However, the example below does not include portfolio trading commissions and related expenses, and other extraordinary expenses as determined under generally accepted accounting principles. You may use the information in this line, together with the amount you invested, to estimate the expenses that you paid over the period. Simply divide your account value by $1,000 (for example, an $8,600 account value divided by $1,000 = 8.6), then multiply the result by the number in the first line of the table under the heading entitled “Expenses Paid During Period” to estimate the expenses you paid on your account during this period.
Hypothetical Example for Comparison Purposes
The second line of the table below provides information about hypothetical account values and hypothetical expenses based on the Fund’s actual expense ratios and an assumed rate of return of 5% per year before expenses, which is not the Fund’s actual return. The hypothetical account values and expenses may not be used to estimate the actual ending account balance or expenses you paid for the period. You may use this information to compare the ongoing costs of investing in the Fund and other funds. To do so, compare this 5% hypothetical example with the 5% hypothetical examples that appear in the shareholder reports of the other funds. Please note that the expenses shown in the table are meant to highlight your ongoing costs only and do not reflect any transactional costs, such as sales charges (loads), or exchange fees. Therefore, the second line of the table is useful in comparing ongoing costs only, and will not help you determine the relative total costs of owning different funds. In addition, if these transactional costs were included, your costs would have been higher.
| | | | Expenses Paid |
| | Beginning | Ending | During Period(1) |
| | Account Value | Account Value | May 1, 2015 – |
| | May 1, 2015 | October 31, 2015 | October 31, 2015 |
| Investor Class | | | |
| Actual | $1,000.00 | $ 932.00 | $5.06 |
| Hypothetical (5% return before expenses) | $1,000.00 | $1,019.96 | $5.30 |
(1) | Expenses are equal to the Fund’s annualized expense ratio of 1.04%, multiplied by the average account value over the period, multiplied by 184/365 days (to reflect one-half year period). |
| HENNESSY FUNDS | 1-800-966-4354 | |
How to Obtain a Copy of the Fund’s
Proxy Voting Policy and Proxy Voting Records
A description of the policies and procedures the Fund uses to determine how to vote proxies relating to portfolio securities is available without charge: (1) by calling 1-800-966-4354; (2) on the Hennessy Funds’ website at hennessyfunds.com/proxy-voting/policy.fs; or (3) on the U.S. Securities and Exchange Commission’s website at www.sec.gov. The Fund’s proxy voting record is available without charge on both the Hennessy Funds’ website at hennessyfunds.com/proxy-voting/policy.fs and the SEC’s website at www.sec.gov no later than August 31 for the prior 12 months ending June 30.
Quarterly Filings on Form N-Q
The Fund files its complete schedule of portfolio holdings with the SEC for the first and third quarters of each fiscal year on Form N-Q. The Fund’s Form N-Q will be available on the SEC’s website at www.sec.gov. The Fund’s Form N-Q may be reviewed and copied at the SEC’s Public Reference Room in Washington, DC and information on the operation of the Public Reference Room may be obtained by calling 1-800-SEC-0330. Information included in the Fund’s N-Q will also be available upon request by calling 1-800-966-4354.
Federal Tax Distribution Information
(Unaudited)
For the fiscal year ended October 31, 2015, certain dividends paid by the Fund may be subject to a maximum tax rate of 23.8%, as provided for by the Jobs and Growth Tax Relief Reconciliation Act of 2003. The percentage of dividends declared from ordinary income designated as qualified dividend income was 83.89%.
For corporate shareholders, the percent of ordinary income distributions that qualified for the corporate dividends received deduction for the fiscal year ended October 31, 2015 was 78.02%.
The percentage of taxable ordinary income distributions that are designated as short-term capital gain distributions under Section 871(k)(2)(C) of the Internal Revenue Code of 1986, as amended, for the Fund was 46.09%.
Householding
To help keep the Fund’s costs as low as possible, we generally deliver a single copy of most financial reports and prospectuses to shareholders who share an address, even if the accounts are registered under different names. This process, known as “householding,” does not apply to account statements. You may, of course, request an individual copy of a prospectus or financial report at any time. If you would like to receive separate mailings, please call the Administrator at 1-800-261-6950 or 1-414-765-4124 and we will begin individual delivery within 30 days of your request. If your account is held through a financial institution or other intermediary, please contact them directly to request individual delivery.
Privacy Policy
We collect the following non-public personal information about you:
| • | information we receive from you on or in applications or other forms, correspondence, or conversations, including, but not limited to, your name, address, phone number, social security number, assets, income, and date of birth; and |
| • | information about your transactions with us, our affiliates, or others, including, but not limited to, your account number and balance, payment history, parties to transactions, cost basis information, and other financial information. |
We do not disclose any non-public personal information about our current or former shareholders to nonaffiliated third parties, except as permitted by law. For example, we are permitted by law to disclose all of the information we collect, as described above, to our Transfer Agent to process your transactions. Furthermore, we restrict access to your non-public personal information to those persons who require such information to provide products or services to you. We maintain physical, electronic, and procedural safeguards that comply with federal standards to guard your non-public personal information.
In the event that you hold shares of the Fund through a financial intermediary, including, but not limited to, a broker-dealer, bank or trust company, the privacy policy of your financial intermediary would govern how your non-public personal information would be shared with nonaffiliated third parties.
| HENNESSY FUNDS | 1-800-966-4354 | |
(This Page Intentionally Left Blank.)
(This Page Intentionally Left Blank.)
For information, questions or assistance, please call
The Hennessy Funds
1-800-966-4354 or 1-415-899-1555
INVESTMENT ADVISOR
Hennessy Advisors, Inc.
7250 Redwood Blvd., Suite 200
Novato, California 94945
ADMINISTRATOR,
TRANSFER AGENT,
DIVIDEND PAYING AGENT &
SHAREHOLDER SERVICING AGENT
U.S. Bancorp Fund Services, LLC
P.O. Box 701
Milwaukee, Wisconsin 53201-0701
CUSTODIAN
U.S. Bank N.A.
Custody Operations
1555 North River Center Dr., Suite 302
Milwaukee, Wisconsin 53212
TRUSTEES
Neil J. Hennessy
Robert T. Doyle
J. Dennis DeSousa
Gerald P. Richardson
COUNSEL
Foley & Lardner LLP
777 East Wisconsin Avenue
Milwaukee, Wisconsin 53202-5306
INDEPENDENT REGISTERED
PUBLIC ACCOUNTING FIRM
Tait, Weller & Baker LLP
1818 Market Street, Suite 2400
Philadelphia, Pennsylvania 19103
DISTRIBUTOR
Quasar Distributors, LLC
615 East Michigan Street
Milwaukee, Wisconsin 53202
hennessyfunds.com | 1-800-966-4354
This report has been prepared for shareholders and may be distributed to
others only if preceded or accompanied by a current prospectus.
ANNUAL REPORT
OCTOBER 31, 2015
HENNESSY SMALL CAP
FINANCIAL FUND
Investor Class HSFNX
Institutional Class HISFX
hennessyfunds.com | 1-800-966-4354
(This Page Intentionally Left Blank.)
Contents
| Letter to Shareholders | 2 |
| Performance Overview | 4 |
| Financial Statements | |
| Schedule of Investments | 6 |
| Statement of Assets and Liabilities | 9 |
| Statement of Operations | 10 |
| Statements of Changes in Net Assets | 12 |
| Financial Highlights | 14 |
| Notes to the Financial Statements | 18 |
| Report of Independent Registered Public Accounting Firm | 26 |
| Trustees and Officers of the Fund | 27 |
| Expense Example | 30 |
| Proxy Voting | 32 |
| Quarterly Filings on Form N-Q | 32 |
| Householding | 32 |
| Privacy Policy | 33 |
| HENNESSY FUNDS | 1-800-966-4354 | |
December 2015
Dear Hennessy Funds Shareholder:
As I look back over the year, I am reminded that the U.S. economy has come a long way since the depths of the recession in 2009. The economy has been expanding steadily for almost six years, the unemployment rate has halved, the housing market has been recovering and capital expenditures have been growing. The financial markets have performed well too, driven largely by strong corporate earnings growth, especially in the early years. The U.S. market, as measured by the S&P 500 Index, has roughly tripled since the bull market began in 2009, and the Index’s earnings per share have increased 260% over this same time period. For the year ended October 31, 2015, the U.S. equity market performed reasonably well, with the S&P 500 posting another advance of 5.2%. However, behind this headline number, the market experienced a great deal of volatility as investors reacted to falling energy prices, a rise in the U.S. Dollar, pressure on export earnings growth, slower growth in China and, most significantly, the likelihood of a rise in the Fed Funds rate for the first time in nearly a decade – the featured topic of conversation around every office water cooler in the financial world this year.
Investors, reporters and friends often ask me “What’s next?” The market has been in a volatile, sideways correction for over a year now, and throughout this period of volatility, I have consistently advised investors to continue to focus on the long-term fundamentals of the market.
In my view, the fundamentals of the market are in good shape. Despite a stronger U.S. Dollar and its impact on export growth, the economy is still growing steadily. Inflation remains low, so we expect the Federal Reserve, once it does begin to raise short-term interest rates, will not likely raise them by very much. New jobs are being created at what I believe is a healthy rate, and average hourly wages are rising in response to a tighter labor market. Higher wages and lower gasoline prices are helping to keep consumer confidence positive.
Notwithstanding what I view as a relatively solid economic environment, however, I think investor sentiment remains restrained. The same factors that contributed to the market volatility this past year are still troubling investors today: the slowdown in the Chinese economy, slower earnings growth here in the U.S., and, of course, the prospect of rising interest rates. As a result of these investor worries, I do not see any solid enthusiasm for the market – no euphoria. Universal optimism about the market often coincides with a peak in stock prices and this absence of euphoria is yet another reason I feel bullish. And finally, I do not believe stocks are expensive. The Dow Jones Industrial Average and the S&P 500 Index have forward PE (price-to-earnings) ratios of approximately 16x and 17x, respectively, close to long-term averages. In my view, these fundamentals taken together signal a continuation of the bull market that began six years ago.
A final positive note: I still do not believe that investors have fully returned to investing in U.S. equities. Assets in domestic equity funds have now reached parity with fixed income/money market funds, with $6.2 trillion in each. I believe that fixed income investments will continue to trickle into equities, which should have a positive effect on the market.
Thank you for your continued confidence and investment in our products. If you have any questions or would like to speak with us directly, please don’t hesitate to call us at (800) 966-4354.
Best regards,
Neil J. Hennessy
President and Chief Investment Officer
Past performance does not guarantee future results.
Mutual fund investing involves risk. Principal loss is possible.
Opinions expressed are those of Neil Hennessy and are subject to change, are not guaranteed and should not be considered investment advice.
The Dow Jones Industrial Average and the S&P 500 Index are unmanaged indices commonly used to measure the performance of U.S. stocks. One cannot invest directly in an index.
Price to earnings (“PE”) is the market price per share divided by earnings per share. Earnings per share is the portion of a company’s profit allocated to each outstanding share of common stock. It serves as an indicator of a company’s profitability.
| HENNESSY FUNDS | 1-800-966-4354 | |
Performance Overview (Unaudited)
CHANGE IN VALUE OF $10,000 INVESTMENT
This graph illustrates the performance of an initial investment of $10,000 made in the Fund ten years ago and assumes the reinvestment of dividends.
AVERAGE ANNUAL TOTAL RETURN FOR PERIODS ENDED OCTOBER 31, 2015
| | One | Five | Ten |
| | Year | Years | Years |
| Hennessy Small Cap Financial Fund – | | | |
| Investor Class (HSFNX) | 14.51% | 10.98% | 5.70% |
| Hennessy Small Cap Financial Fund – | | | |
Institutional Class (HISFX)(1) | 14.91% | 11.27% | 5.92% |
Russell 2000® Financial | | | |
| Services Index | 4.31% | 13.45% | 4.76% |
Russell 2000® Index | 0.34% | 12.06% | 7.47% |
Expense ratios: 1.49% (Investor Class); 1.12% (Institutional Class)
Performance data quoted represents past performance; past performance does not guarantee future results. The investment return and principal value of an investment will fluctuate so that an investor’s shares, when redeemed, may be worth more or less than their original cost. The performance graph and table do not reflect the deduction of taxes that a shareholder would pay on Fund distributions or the redemption of Fund shares. Current performance of the Fund may be lower or higher than the performance quoted. Performance data current to the most recent month end may be obtained by visiting hennessyfunds.com. Performance for periods prior to October 26, 2012 is that of the FBR Small Cap Financial Fund.
The expense ratios presented are from the most recent prospectus.
(1) | The inception date of Institutional Class shares is May 30, 2008. Performance shown prior to the inception of Institutional Class shares reflects the performance of Investor Class shares and includes expenses that are not applicable to and are higher than those of Institutional Class shares. |
PERFORMANCE NARRATIVE
Portfolio Managers David H. Ellison and Ryan Kelley
Performance:
For the twelve-month period ended October 31, 2015, the Investor Class of the Hennessy Small Cap Financial Fund returned 14.51%, significantly outperforming the Russell 2000® Financial Services Index and the Russell 2000® Index, which returned 4.31% and 0.34% for the same period, respectively.
The Fund’s outperformance versus its benchmark index over the year ended October 31, 2015 was principally due to the Fund’s overweight position in small and mid-cap banks and thrifts, which outperformed the broader Financial sector during the time period due to rising expectations of a move from the Federal Reserve to increase interest rates. Specific positions that contributed most strongly to the Fund’s positive performance included Hingham Institution for Savings, BankUnited, Inc. and Astoria Financial Corporation. The Fund continues to own these three companies. Companies with the weakest performance contributions to the Fund during the twelve-month period were life insurance, mortgage finance and debt management companies. Specific positions that underperformed included Genworth Financial, Inc., Stonegate Mortgage Corporation and Encore Capital Group, Inc. The Fund no longer holds these three companies.
Portfolio Strategy:
Traditionally, the Fund does not seek to diversify its investments across all the different sub-industries of the financial services sector. Rather, the Fund tilts its investments more heavily toward regional banks, thrifts and mortgage finance companies. Within these preferred sub-industries, we seek companies with what we believe are high-quality management teams, uncomplicated business models and sustainable earnings growth opportunities. Moreover, the Fund seeks companies expected to do well now, in the current environment, rather than those that appear to promise to increase profitability when interest rates rise or loan demand surges.
Investment Outlook:
Small and mid-cap banks and thrifts have performed well over the last twelve months. After half a decade of credit troubles, costly regulatory mandates, low rates pressuring lending margins and a sluggish economic recovery, headwinds appear to be abating. Liquidity, capital, credit, reserves, book value and earnings all improved this year and we believe industry fundamentals will continue to improve in the coming year. A major catalyst for the outperformance of smaller banks this fiscal year was the prospect of higher interest rates, and we believe the industry will indeed see improved lending margins if short term rates rise as expected in the coming year.
We believe the structure and condition of the financial system in the U.S. today is one of the best we have seen in quite some time and that the outlook for stocks in the Financial sector is bright.
Opinions expressed are those of the Portfolio Managers as of the date written and are subject to change, are not guaranteed, and should not be considered investment advice or an indication of trading intent.
The Russell 2000® Financial Services Index is an unmanaged index commonly used to measure the performance of U.S. small-capitalization financial sector stocks. The Russell 2000® Index is an unmanaged index commonly used to measure the performance of U.S. small-capitalization stocks. One cannot invest directly in an index.
The Fund is non-diversified, meaning it may concentrate its assets in fewer individual holdings than a diversified fund, making it more exposed to individual stock volatility than a diversified fund. Investments are focused in the financial services industry; sector funds may be subject to a higher degree of market risk. The Fund invests in smaller companies, which may have more limited liquidity and greater volatility compared to larger companies.
References to specific securities should not be considered a recommendation to buy or sell any security. Fund holdings and sector allocations are subject to change. Please refer to the Schedule of Investments included in this report for additional portfolio information.
Earnings growth is not a measure of the Fund’s future performance. Book value is the net asset value of a company, calculated by total assets minus liabilities.
| HENNESSY FUNDS | 1-800-966-4354 | |
Financial Statements
Schedule of Investments as of October 31, 2015 |
HENNESSY SMALL CAP FINANCIAL FUND
(% of Net Assets)
| TOP TEN HOLDINGS (EXCLUDING CASH/CASH EQUIVALENTS) | % NET ASSETS |
| Hingham Institution for Savings | 4.33% |
| WSFS Financial Corp. | 4.29% |
| Washington Federal, Inc. | 4.18% |
| Flushing Financial Corp. | 4.13% |
| Independent Bank Corp. | 4.11% |
| Provident Financial Services, Inc. | 4.03% |
| BankUnited, Inc. | 4.03% |
| Banner Corp. | 3.96% |
| Clifton Bancorp, Inc. | 3.88% |
| Investors Bancorp, Inc. | 3.84% |
Note: For presentation purposes, the Fund has grouped some of the industry categories. For purposes of categorizing securities for compliance with section 8(b)(1) of the Investment Company Act of 1940, as amended, the Fund uses more specific industry classifications.
| COMMON STOCKS – 93.98% | | Number | | | | | | % of | |
| | | of Shares | | | Value | | | Net Assets | |
| Financials – 93.98% | | | | | | | | | |
| 1st Source Corp. | | | 100,000 | | | $ | 3,176,000 | | | | 1.30 | % |
| Associated Banc-Corp. | | | 175,000 | | | | 3,384,500 | | | | 1.38 | % |
| Astoria Financial Corp. | | | 545,000 | | | | 8,698,200 | | | | 3.56 | % |
| BankUnited, Inc. | | | 265,000 | | | | 9,852,700 | | | | 4.03 | % |
| Banner Corp. | | | 197,500 | | | | 9,691,325 | | | | 3.96 | % |
| Beneficial Bancorp, Inc. (a) | | | 190,000 | | | | 2,635,300 | | | | 1.08 | % |
| Berkshire Hills Bancorp, Inc. | | | 140,000 | | | | 4,004,000 | | | | 1.64 | % |
| Brookline Bancorp, Inc. | | | 330,000 | | | | 3,745,500 | | | | 1.53 | % |
| Capital Bank Financial Corp. (a) | | | 170,000 | | | | 5,491,000 | | | | 2.25 | % |
| Clifton Bancorp, Inc. | | | 650,000 | | | | 9,477,000 | | | | 3.88 | % |
| Cullen/Frost Bankers, Inc. | | | 55,000 | | | | 3,764,200 | | | | 1.54 | % |
| Customers Bancorp, Inc. (a) | | | 190,000 | | | | 5,225,000 | | | | 2.14 | % |
| First Connecticut Bancorp, Inc. | | | 175,000 | | | | 3,041,500 | | | | 1.24 | % |
| First Niagara Financial Group, Inc. | | | 375,000 | | | | 3,881,250 | | | | 1.59 | % |
| Flushing Financial Corp. | | | 480,000 | | | | 10,099,200 | | | | 4.13 | % |
| Fulton Financial Corp. | | | 265,000 | | | | 3,556,300 | | | | 1.45 | % |
| Hingham Institution for Savings | | | 83,000 | | | | 10,575,030 | | | | 4.33 | % |
| IBERIABANK Corp. | | | 45,000 | | | | 2,728,350 | | | | 1.12 | % |
| Independent Bank Corp. | | | 215,000 | | | | 10,049,100 | | | | 4.11 | % |
| Investors Bancorp, Inc. | | | 750,000 | | | | 9,382,500 | | | | 3.84 | % |
| Kearny Financial Corp. of Maryland | | | 770,000 | | | | 9,201,500 | | | | 3.76 | % |
| Meridian Bancorp, Inc. | | | 325,000 | | | | 4,563,000 | | | | 1.87 | % |
| OceanFirst Financial Corp. | | | 287,500 | | | | 5,307,250 | | | | 2.17 | % |
| PacWest Bancorp | | | 140,000 | | | | 6,305,600 | | | | 2.58 | % |
| Provident Financial Services, Inc. | | | 485,000 | | | | 9,855,200 | | | | 4.03 | % |
| Servisfirst Bancshares, Inc. | | | 167,091 | | | | 7,081,316 | | | | 2.90 | % |
| Synovus Financial Corp. | | | 295,000 | | | | 9,330,850 | | | | 3.82 | % |
| Umpqua Holdings Corp. | | | 245,000 | | | | 4,091,500 | | | | 1.67 | % |
| Union Bankshares Corp. | | | 95,000 | | | | 2,379,750 | | | | 0.97 | % |
| United Financial Bancorp, Inc. | | | 390,000 | | | | 5,062,200 | | | | 2.07 | % |
| Washington Federal, Inc. | | | 410,000 | | | | 10,225,400 | | | | 4.18 | % |
| Webster Financial Corp. | | | 185,000 | | | | 6,863,500 | | | | 2.81 | % |
| Western Alliance Bancorp (a) | | | 80,000 | | | | 2,860,000 | | | | 1.17 | % |
| Wilshire Bancorp, Inc. | | | 240,000 | | | | 2,565,600 | | | | 1.05 | % |
The accompanying notes are an integral part of these financial statements.
| HENNESSY FUNDS | 1-800-966-4354 | |
| COMMON STOCKS | | Number | | | | | | % of | |
| | | of Shares | | | Value | | | Net Assets | |
| Financials (Continued) | | | | | | | | | |
| Wintrust Financial Corp. | | | 168,500 | | | $ | 8,507,565 | | | | 3.48 | % |
| WSFS Financial Corp. | | | 330,000 | | | | 10,484,100 | | | | 4.29 | % |
| Yadkin Financial Corp. | | | 110,000 | | | | 2,590,500 | | | | 1.06 | % |
| | | | | | | | | | | | | |
| Total Common Stocks | | | | | | | | | | | | |
| (Cost $185,819,243) | | | | | | | 229,732,786 | | | | 93.98 | % |
| | | | | | | | | | | | | |
| SHORT-TERM INVESTMENTS – 7.20% | | | | | | | | | | | | |
| | | | | | | | | | | | | |
| Money Market Funds – 7.20% | | | | | | | | | | | | |
| Federated Government Obligations Fund – Class I, 0.01% (b) | | | 5,201,717 | | | | 5,201,717 | | | | 2.13 | % |
| Fidelity Government Portfolio – Institutional Class, 0.01% (b) | | | 12,395,000 | | | | 12,395,000 | | | | 5.07 | % |
| | | | | | | | 17,596,717 | | | | 7.20 | % |
| | | | | | | | | | | | | |
| Total Short-Term Investments | | | | | | | | | | | | |
| (Cost $17,596,717) | | | | | | | 17,596,717 | | | | 7.20 | % |
| | | | | | | | | | | | | |
| Total Investments | | | | | | | | | | | | |
| (Cost $203,415,960) – 101.18% | | | | | | | 247,329,503 | | | | 101.18 | % |
| Liabilities in Excess | | | | | | | | | | | | |
| of Other Assets – (1.18)% | | | | | | | (2,883,146 | ) | | | (1.18 | )% |
TOTAL NET ASSETS – 100.00% | | | | | | $ | 244,446,357 | | | | 100.00 | % |
Percentages are stated as a percent of net assets.
| (a) | Non-income producing security. |
| (b) | The rate listed is the fund’s 7-day yield as of October 31, 2015. |
Summary of Fair Value Exposure at October 31, 2015
The following is a summary of the inputs used to value the Fund’s net assets as of October 31, 2015 (see Note 3 in the accompanying notes to the financial statements):
| Common Stocks | | Level 1 | | | Level 2 | | | Level 3 | | | Total | |
| Financials | | $ | 229,732,786 | | | $ | — | | | $ | — | | | $ | 229,732,786 | |
| Total Common Stocks | | $ | 229,732,786 | | | $ | — | | | $ | — | | | $ | 229,732,786 | |
| Short-Term Investments | | | | | | | | | | | | | | | | |
| Money Market Funds | | $ | 17,596,717 | | | $ | — | | | $ | — | | | $ | 17,596,717 | |
| Total Short-Term Investments | | $ | 17,596,717 | | | $ | — | | | $ | — | | | $ | 17,596,717 | |
| Total Investments | | $ | 247,329,503 | | | $ | — | | | $ | — | | | $ | 247,329,503 | |
Transfers between levels are recognized at the end of the reporting period. During the year ended October 31, 2015, the Fund recognized no transfers between levels.
The accompanying notes are an integral part of these financial statements.
Financial Statements
Statement of Assets and Liabilities as of October 31, 2015 |
| ASSETS: | | | |
| Investments in securities, at value (cost $203,415,960) | | $ | 247,329,503 | |
| Dividends and interest receivable | | | 119,344 | |
| Receivable for fund shares sold | | | 1,414,745 | |
| Prepaid expenses and other assets | | | 17,426 | |
| Total Assets | | | 248,881,018 | |
| | | | | |
| LIABILITIES: | | | | |
| Payable for securities purchased | | | 4,071,246 | |
| Payable for fund shares redeemed | | | 9,412 | |
| Payable to advisor | | | 175,604 | |
| Payable to administrator | | | 34,665 | |
| Payable to auditor | | | 20,300 | |
| Accrued distribution fees | | | 44,554 | |
| Accrued service fees | | | 17,399 | |
| Accrued trustees fees | | | 2,391 | |
| Accrued expenses and other payables | | | 59,090 | |
| Total Liabilities | | | 4,434,661 | |
| NET ASSETS | | $ | 244,446,357 | |
| | | | | |
| NET ASSETS CONSIST OF: | | | | |
| Capital stock | | $ | 183,220,203 | |
| Accumulated net realized gain on investments | | | 17,312,611 | |
| Unrealized net appreciation on investments | | | 43,913,543 | |
| Total Net Assets | | $ | 244,446,357 | |
| | | | | |
| NET ASSETS | | | | |
| Investor Class: | | | | |
| Shares authorized (no par value) | | Unlimited | |
| Net assets applicable to outstanding Investor Class shares | | $ | 218,504,146 | |
| Shares issued and outstanding | | | 9,175,819 | |
| Net asset value, offering price and redemption price per share | | $ | 23.81 | |
| | | | | |
| Institutional Class: | | | | |
| Shares authorized (no par value) | | Unlimited | |
| Net assets applicable to outstanding Institutional Class shares | | $ | 25,942,211 | |
| Shares issued and outstanding | | | 1,802,199 | |
| Net asset value, offering price and redemption price per share | | $ | 14.39 | |
The accompanying notes are an integral part of these financial statements.
| HENNESSY FUNDS | 1-800-966-4354 | |
Financial Statements
Statement of Operations for the year ended October 31, 2015 |
| INVESTMENT INCOME: | | | |
| Dividend income | | $ | 3,381,492 | |
| Interest income | | | 648 | |
| Total investment income | | | 3,382,140 | |
| | | | | |
| EXPENSES: | | | | |
| Investment advisory fees (See Note 5) | | | 1,829,124 | |
| Sub-transfer agent expenses – Investor Class (See Note 5) | | | 340,793 | |
| Sub-transfer agent expenses – Institutional Class (See Note 5) | | | 23,713 | |
| Distribution fees – Investor Class (See Note 5) | | | 331,503 | |
| Administration, fund accounting, custody and transfer agent fees (See Note 5) | | | 198,503 | |
| Service fees – Investor Class (See Note 5) | | | 122,244 | |
| Federal and state registration fees | | | 32,478 | |
| Compliance expense | | | 22,186 | |
| Audit fees | | | 20,898 | |
| Reports to shareholders | | | 14,723 | |
| Trustees’ fees and expenses | | | 11,833 | |
| Interest expense (See Note 6) | | | 4,198 | |
| Legal fees | | | 2,500 | |
| Other expenses | | | 18,504 | |
| Total expenses | | | 2,973,200 | |
| NET INVESTMENT INCOME | | $ | 408,940 | |
| | | | | |
| REALIZED AND UNREALIZED GAINS (LOSSES): | | | | |
| Net realized gain on investments | | $ | 18,278,191 | |
| Net change in unrealized appreciation on investments | | | 8,241,257 | |
| Net gain on investments | | | 26,519,448 | |
| NET INCREASE IN NET ASSETS RESULTING FROM OPERATIONS | | $ | 26,928,388 | |
The accompanying notes are an integral part of these financial statements.
(This Page Intentionally Left Blank.)
| HENNESSY FUNDS | 1-800-966-4354 | |
Financial Statements
| Statements of Changes in Net Assets |
| | | Year Ended | | | Year Ended | |
| | | October 31, 2015 | | | October 31, 2014 | |
| OPERATIONS: | | | | | | |
| Net investment income (loss) | | $ | 408,940 | | | $ | (825,377 | ) |
| Net realized gain on investments | | | 18,278,191 | | | | 34,099,662 | |
| Net change in unrealized appreciation (depreciation) | | | | | | | | |
| on investments | | | 8,241,257 | | | | (28,573,406 | ) |
| Net increase in net assets resulting from operations | | | 26,928,388 | | | | 4,700,879 | |
| | | | | | | | | |
| DISTRIBUTIONS TO SHAREHOLDERS FROM: | | | | | | | | |
| Net investment income | | | | | | | | |
| Investor Class | | | — | | | | (583,882 | ) |
| Institutional Class | | | — | | | | (611,323 | ) |
| Net realized gains | | | | | | | | |
| Investor Class | | | (25,724,771 | ) | | | (15,192,379 | ) |
| Institutional Class | | | (5,914,515 | ) | | | (6,931,392 | ) |
| Total distributions | | | (31,639,286 | ) | | | (23,318,976 | ) |
| | | | | | | | | |
| CAPITAL SHARE TRANSACTIONS: | | | | | | | | |
| Proceeds from shares subscribed – Investor Class | | | 54,313,216 | | | | 28,573,914 | |
| Proceeds from shares subscribed – Institutional Class | | | 13,953,486 | | | | 6,485,452 | |
| Dividends reinvested – Investor Class | | | 25,337,010 | | | | 15,450,637 | |
| Dividends reinvested – Institutional Class | | | 3,720,941 | | | | 3,238,127 | |
| Cost of shares redeemed – Investor Class | | | (53,885,643 | ) | | | (81,963,023 | )(1) |
| Cost of shares redeemed – Institutional Class | | | (29,606,425 | ) | | | (30,064,869 | ) |
| Net increase (decrease) in net assets derived | | | | | | | | |
| from capital share transactions | | | 13,832,585 | | | | (58,279,762 | ) |
| TOTAL INCREASE (DECREASE) IN NET ASSETS | | | 9,121,687 | | | | (76,897,859 | ) |
| | | | | | | | | |
| NET ASSETS: | | | | | | | | |
| Beginning of year | | | 235,324,670 | | | | 312,222,529 | |
| End of year | | $ | 244,446,357 | | | $ | 235,324,670 | |
| Accumulated net investment loss, end of year | | $ | — | | | $ | (483,665 | ) |
(1) | Net of redemption fees of $12,269 related to redemption fees imposed by the FBR Small Cap Financial Fund during a prior year but not received until the fiscal year ended October 31, 2014. |
The accompanying notes are an integral part of these financial statements.
| Statements of Changes in Net Assets – Continued |
| | | Year Ended | | | Year Ended | |
| | | October 31, 2015 | | | October 31, 2014 | |
| CHANGES IN SHARES OUTSTANDING: | | | | | | |
| Shares sold – Investor Class | | | 2,361,827 | | | | 1,158,040 | |
| Shares sold – Institutional Class | | | 1,012,204 | | | | 438,519 | |
| Shares issued to holders as reinvestment | | | | | | | | |
| of dividends – Investor Class | | | 1,216,371 | | | | 624,580 | |
| Shares issued to holders as reinvestment | | | | | | | | |
| of dividends – Institutional Class | | | 296,489 | | | | 216,313 | |
| Shares redeemed – Investor Class | | | (2,404,812 | ) | | | (3,361,999 | ) |
| Shares redeemed – Institutional Class | | | (2,412,721 | ) | | | (2,059,169 | ) |
| Net increase (decrease) in shares outstanding | | | 69,358 | | | | (2,983,716 | ) |
The accompanying notes are an integral part of these financial statements.
| HENNESSY FUNDS | 1-800-966-4354 | |
Financial Statements
For an Investor Class share outstanding throughout each year
PER SHARE DATA:
Net asset value, beginning of year
Income from investment operations:
Net investment income (loss)
Net realized and unrealized gains (losses) on investments
Total from investment operations
Less distributions:
Dividends from net investment income
Dividends from net realized gains
Total distributions
Paid-in capital from redemption fees
Net asset value, end of year
TOTAL RETURN
SUPPLEMENTAL DATA AND RATIOS:
Net assets, end of year (millions)
Ratio of expenses to average net assets
Ratio of net investment income (loss) to average net assets
Portfolio turnover rate(3)
(1) | Calculated based on average shares outstanding method. |
(2) | Amount is less than $0.01. |
(3) | Portfolio turnover is calculated on the basis of the Fund as a whole. |
The accompanying notes are an integral part of these financial statements.
| Year Ended October 31, | |
| 2015 | | | 2014 | | | 2013 | | | 2012 | | | 2011 | |
| | | | | | | | | | | | | |
| $ | 24.13 | | | $ | 25.40 | | | $ | 19.54 | | | $ | 16.48 | | | $ | 18.11 | |
| | | | | | | | | | | | | | | | | | | |
| | | | | | | | | | | | | | | | | | | |
| | 0.03 | (1) | | | (0.10 | ) | | | 0.10 | | | | 0.11 | | | | 0.21 | (1) |
| | 2.99 | | | | 0.49 | | | | 5.88 | | | | 3.24 | | | | (1.66 | ) |
| | 3.02 | | | | 0.39 | | | | 5.98 | | | | 3.35 | | | | (1.45 | ) |
| | | | | | | | | | | | | | | | | | | |
| | | | | | | | | | | | | | | | | | | |
| | — | | | | (0.06 | ) | | | (0.12 | ) | | | (0.29 | ) | | | (0.06 | ) |
| | (3.34 | ) | | | (1.60 | ) | | | — | | | | — | | | | (0.13 | ) |
| | (3.34 | ) | | | (1.66 | ) | | | (0.12 | ) | | | (0.29 | ) | | | (0.19 | ) |
| | — | | | | 0.00 | (2) | | | 0.00 | (2) | | | 0.00 | (2) | | | 0.01 | |
| $ | 23.81 | | | $ | 24.13 | | | $ | 25.40 | | | $ | 19.54 | | | $ | 16.48 | |
| | | | | | | | | | | | | | | | | | | |
| | 14.51 | % | | | 1.40 | % | | | 30.80 | % | | | 20.65 | % | | | (8.12 | )% |
| | | | | | | | | | | | | | | | | | | |
| | | | | | | | | | | | | | | | | | | |
| $ | 218.50 | | | $ | 193.09 | | | $ | 243.42 | | | $ | 167.20 | | | $ | 154.21 | |
| | 1.50 | % | | | 1.44 | % | | | 1.46 | % | | | 1.45 | % | | | 1.52 | % |
| | 0.17 | % | | | (0.36 | )% | | | 0.48 | % | | | 0.56 | % | | | 0.81 | % |
| | 49 | % | | | 47 | % | | | 57 | % | | | 43 | % | | | 70 | % |
The accompanying notes are an integral part of these financial statements.
| HENNESSY FUNDS | 1-800-966-4354 | |
Financial Statements
For an Institutional Class share outstanding throughout each year
PER SHARE DATA:
Net asset value, beginning of year
Income from investment operations:
Net investment income (loss)
Net realized and unrealized gains (losses) on investments
Total from investment operations
Less distributions:
Dividends from net investment income
Dividends from net realized gains
Total distributions
Net asset value, end of year
TOTAL RETURN
SUPPLEMENTAL DATA AND RATIOS:
Net assets, end of year (millions)
Ratio of expenses to average net assets
Ratio of net investment income (loss) to average net assets
Portfolio turnover rate(2)
(1) | Calculated based on average shares outstanding method. |
(2) | Portfolio turnover is calculated on the basis of the Fund as a whole. |
The accompanying notes are an integral part of these financial statements.
| Year Ended October 31, | |
| 2015 | | | 2014 | | | 2013 | | | 2012 | | | 2011 | |
| | | | | | | | | | | | | |
| $ | 14.53 | | | $ | 15.96 | | | $ | 12.34 | | | $ | 10.55 | | | $ | 11.70 | |
| | | | | | | | | | | | | | | | | | | |
| | | | | | | | | | | | | | | | | | | |
| | 0.06 | (1) | | | (0.09 | ) | | | 0.14 | | | | 0.16 | | | | 0.19 | (1) |
| | 1.81 | | | | 0.40 | | | | 3.66 | | | | 1.98 | | | | (1.09 | ) |
| | 1.87 | | | | 0.31 | | | | 3.80 | | | | 2.14 | | | | (0.90 | ) |
| | | | | | | | | | | | | | | | | | | |
| | | | | | | | | | | | | | | | | | | |
| | — | | | | (0.14 | ) | | | (0.18 | ) | | | (0.35 | ) | | | (0.12 | ) |
| | (2.01 | ) | | | (1.60 | ) | | | — | | | | — | | | | (0.13 | ) |
| | (2.01 | ) | | | (1.74 | ) | | | (0.18 | ) | | | 0.35 | | | | (0.25 | ) |
| $ | 14.39 | | | $ | 14.53 | | | $ | 15.96 | | | $ | 12.34 | | | $ | 10.55 | |
| | | | | | | | | | | | | | | | | | | |
| | 14.91 | % | | | 1.70 | % | | | 31.18 | % | | | 20.95 | % | | | (8.00 | )% |
| | | | | | | | | | | | | | | | | | | |
| | | | | | | | | | | | | | | | | | | |
| $ | 25.94 | | | $ | 42.23 | | | $ | 68.80 | | | $ | 43.79 | | | $ | 19.89 | |
| | 1.17 | % | | | 1.12 | % | | | 1.15 | % | | | 1.25 | % | | | 1.34 | % |
| | 0.48 | % | | | (0.04 | )% | | | 0.74 | % | | | 0.72 | % | | | 1.00 | % |
| | 49 | % | | | 47 | % | | | 57 | % | | | 43 | % | | | 70 | % |
| HENNESSY FUNDS | 1-800-966-4354 | |
Financial Statements
Notes to the Financial Statements October 31, 2015 |
1). ORGANIZATION
The Hennessy Small Cap Financial Fund (the “Fund”) is a series of Hennessy Funds Trust (the “Trust”), which was organized as a Delaware statutory trust on September 17, 1992. The Fund is an open-end management investment company registered under the Investment Company Act of 1940, as amended. The Fund is a successor to the FBR Small Cap Financial Fund (the “Predecessor FBR Fund”), a series of The FBR Funds, a Delaware statutory trust, pursuant to a reorganization that took place after the close of business on October 26, 2012. Prior to October 26, 2012, the Fund had no investment operations. As a result of the reorganization, holders of the Investor Class shares of the Predecessor FBR Fund received Investor Class shares of the Fund (the Investor Class shares of the Fund are the successor to the accounting and performance information of the Predecessor FBR Fund), and holders of the Institutional Class shares of the Predecessor FBR Fund received Institutional Class shares of the Fund (the Institutional Class shares of the Fund are the successor to the accounting and performance information of the Predecessor FBR Fund). The investment objective of the Fund is capital appreciation. The Fund is a non-diversified fund.
The Fund offers Investor Class and Institutional Class shares. Each class of shares differs principally in its respective administration, 12b-1 distribution and service, shareholder servicing, and transfer agent expenses and sales charges, if any. Each class has identical rights to earnings, assets, and voting privileges, except for class-specific expenses and exclusive rights to vote on matters affecting only an individual class.
As an investment company, the Fund follows the investment company accounting and reporting guidance of the Financial Accounting Standards Board (“FASB”) Accounting Standard Codification Topic 946 “Financial Services—Investment Companies.”
2). SIGNIFICANT ACCOUNTING POLICIES
The following is a summary of significant accounting policies consistently followed by the Fund in the preparation of the financial statements. These policies are in conformity with U.S. generally accepted accounting principles (“GAAP”).
| a). | Investment Valuation – All investments in securities are recorded at their estimated fair value, as described in Note 3. |
| | |
| b). | Federal Income Taxes – Provision for federal income taxes or excise taxes has not been made since the Fund has elected to be taxed as a “regulated investment company” and intends to distribute substantially all of its taxable income to its shareholders and otherwise comply with the provisions of the Internal Revenue Code of 1986, as amended, applicable to regulated investment companies. Net investment income or loss and realized gains and losses for federal income tax purposes may differ from that reported on the financial statements because of temporary book and tax basis differences. Temporary differences are primarily the result of the treatment of wash sales for tax reporting purposes. The Fund recognizes interest and penalties related to income tax benefits, if any, in the statement of operations as an income tax expense. Distributions from net realized gains for book purposes may include short-term capital gains, which are included as ordinary income to shareholders for tax purposes. |
| | Due to inherent differences in the recognition of income, expenses, and realized gains/losses under GAAP and federal income tax regulations, permanent differences between book and tax basis reporting for the 2015 fiscal year have been identified and appropriately reclassified on the Statement of Assets and Liabilities. The adjustments are as follows: |
| Undistributed | Accumulated | |
| Net Investment | Net Realized | |
Income/(Loss) | Gain/(Loss) | Paid-in Capital |
| $74,725 | $11,450 | $(86,175) |
| c). | Income and Expenses – Dividend income is recognized on the ex-dividend date or as soon as information is available to the Fund. Interest income, which includes the amortization of premium and accretion of discount, is recognized on an accrual basis. The Fund is charged for those expenses that are directly attributable to the portfolio, such as advisory, administration, and certain shareholder service fees. Income, expenses (other than expenses attributable to a specific class), and realized and unrealized gains or losses on investments are allocated to each class of shares based on its respective net assets. |
| | |
| d). | Distributions to Shareholders – Dividends from net investment income for the Fund, if any, are declared and paid annually, usually in December. Distributions of net realized capital gains, if any, are declared and paid annually, usually in December. |
| | |
| e). | Security Transactions – Investment and shareholder transactions are recorded on the trade date. The Fund determines the gain or loss realized from the investment transactions by comparing the original cost of the security lot sold with the net sale proceeds. Discounts and premiums on securities purchased are accreted/amortized over the life of the respective security. |
| | |
| f). | Use of Estimates – The preparation of financial statements in conformity with GAAP requires management to make estimates and assumptions that affect the reported amounts of assets and liabilities and disclosure of contingent assets and liabilities at the date of the financial statements and the reported change in net assets during the reporting period. Actual results could differ from those estimates. |
| | |
| g). | Share Valuation – The net asset value (“NAV”) per share of the Fund is calculated by dividing the sum of the value of the securities held by the Fund, plus cash or other assets, minus all liabilities (including estimated accrued expenses) by the total number of shares outstanding for the Fund, rounded to the nearest cent. The Fund’s shares will not be priced on days the New York Stock Exchange is closed for trading. The offering and redemption price per share for the Fund is equal to the Fund’s NAV per share. |
| | |
| h). | Foreign Currency – Values of investments denominated in foreign currencies, if any, are converted into U.S. dollars using the spot market rate of exchange at the time of valuation. Purchases and sales of investments and income are translated into U.S. dollars using the spot market rate of exchange prevailing on the respective dates of such transactions. The Fund does not isolate the portion of the results of operations resulting from fluctuations in foreign exchange rates on investments from fluctuations resulting from changes in the market prices of securities held. Such fluctuations are included with the net realized and unrealized gain or loss on investments. Foreign investments present additional risks due to currency fluctuations, economic and political factors, lower liquidity, government regulations, differences in accounting standards, and other factors. |
| HENNESSY FUNDS | 1-800-966-4354 | |
| i). | Forward Contracts – The Fund may enter into forward currency contracts to reduce its exposure to changes in foreign currency exchange rates on its foreign holdings and to lock in the U.S. dollar cost of firm purchase and sale commitments for securities denominated in foreign currencies. A forward currency contract is a commitment to purchase or sell a foreign currency at a future date at a negotiated forward rate. The gain or loss arising from the difference between the U.S. dollar cost of the original contract and the value of the foreign currency in U.S. dollars upon closing of such contract is included in net realized gain or loss from foreign currency transactions. During the fiscal year ended October 31, 2015, the Fund did not enter into any forward contracts. |
| | |
| j). | Repurchase Agreements – The Fund may enter into repurchase agreements with member banks or security dealers of the Federal Reserve Board whom the investment advisor deems creditworthy. The repurchase price generally equals the price paid by the Fund plus interest negotiated on the basis of current short-term rates. |
| | |
| | Securities pledged as collateral for repurchase agreements are held by the custodian bank until the respective agreements mature. Provisions of the repurchase agreements ensure that the market value of the collateral, including accrued interest thereon, is sufficient to cover the repurchase amount in the event of default of the counterparty. If the counterparty defaults and the value of the collateral declines or if the counterparty enters an insolvency proceeding, realization of the collateral by the Fund may be delayed or limited. |
| | |
| k). | Accounting for Uncertainty in Income Taxes – The Fund has accounting policies regarding recognition and measurement of tax positions taken or expected to be taken on a tax return. The tax returns of the Fund for the prior three fiscal years are open for examination. The Fund has reviewed all open tax years in major jurisdictions and concluded that there is no impact on the Fund’s net assets and no tax liability resulting from unrecognized tax benefits relating to uncertain income tax positions taken or expected to be taken on a tax return. The Fund’s major tax jurisdictions are U.S. federal and Delaware. |
| | |
| l). | Derivatives – The Fund may invest in, or enter into, derivatives, such as options, futures contracts, options on futures contracts, and swaps, for a variety of reasons, including to hedge certain risks, to provide a substitute for purchasing or selling particular securities, or to increase potential income gain. Derivatives may provide a cheaper, quicker, or more specifically focused way for a Fund to invest than “traditional” securities would. The main purpose of utilizing these derivative instruments is for hedging purposes. |
| | |
| | The Fund follows the financial accounting reporting rules as required by the Derivatives and Hedging Topic of the FASB Accounting Standards Codification. Under such rules, the Fund is required to include enhanced disclosure that enables investors to understand how and why an entity uses derivatives, how derivatives are accounted for, and how derivatives instruments affect an entity’s results of operations and financial position. During the fiscal year ended October 31, 2015, the Fund did not hold any derivative instruments. |
| | |
| m). | New Accounting Pronouncements – In June 2014, the FASB issued Accounting Standards Update (“ASU”) No. 2014-11 “Repurchase-to Maturity Transactions, Repurchase Financings, and Disclosures.” The amendments in this ASU require an entity to modify accounting for repurchase-to-maturity transactions and repurchase financing arrangements, as well as modify required disclosures for repurchase agreements, securities lending transactions, and repurchase-to-maturity transactions |
| | that are accounted for as secured borrowings. The guidance is effective for fiscal years beginning on or after December 15, 2014, and for interim periods within those fiscal years. Management is currently evaluating the impact these changes will have on the Fund’s financial statement disclosures. |
| | |
| | In May 2015, the FASB issued ASU No. 2015-07 “Disclosure for Investments in Certain Entities that Calculate Net Asset Value per Share (or Its Equivalent).” The amendments in ASU No. 2015-07 remove the requirement to categorize within the fair value hierarchy investments measured at NAV and require the disclosure of sufficient information to reconcile the fair value of the remaining assets categorized within the fair value hierarchy to the financial statements. The amendments in ASU No. 2015-07 are effective for fiscal years beginning after December 15, 2015, and interim periods within those fiscal years. Management has reviewed the requirements and believes the adoption of ASU 2015-07 will not have a material impact on the Fund’s financial statements and related disclosures. |
3). SECURITIES VALUATION
The Fund follows authoritative fair valuation accounting standards that establish an authoritative definition of fair value and set out a hierarchy for measuring fair value. These standards require additional disclosures about the various inputs and valuation techniques used to develop the measurements of fair value and a discussion in changes in valuation techniques and related inputs during the period. These inputs are summarized in the three broad levels listed below:
| | Level 1 – | Quoted unadjusted prices for identical instruments in active markets to which the Fund has access at the date of measurement. |
| | | |
| | Level 2 – | Quoted prices for similar instruments in active markets; quoted prices for identical or similar instruments in markets that are not active; and model-derived valuations in which all significant inputs and significant value drivers are observable in active markets. Level 2 inputs are those in markets for which there are few transactions, the prices are not current, the prices are fair value adjusted due to post-market close subsequent events (foreign markets), little public information exists, or instances where prices vary substantially over time or among brokered market makers. These inputs may also include interest rates, prepayment speeds, credit risk curves, default rates, and similar data. |
| | | |
| | Level 3 – | Model-derived valuations in which one or more significant inputs or significant value drivers are unobservable. Unobservable inputs are those inputs that reflect the Fund’s own assumptions about what market participants would use to price the asset or liability based on the best available information. |
Following is a description of the valuation techniques applied to the Fund’s major categories of assets and liabilities measured at fair value on a recurring basis.
Equity Securities – Equity securities, including common stocks, preferred stocks, foreign-issued common stocks, exchange-traded funds, closed-end mutual funds, partnerships, rights, and real estate investment trusts, that are traded on a securities exchange for which a last-quoted sales price is readily available will generally be valued at the last sales price as reported by the primary exchange on which the securities are listed. Securities listed on The NASDAQ Stock Market (“NASDAQ”) will generally be valued at the NASDAQ Official Closing Price, which may differ from the last sales price reported. Securities traded on a securities exchange for which a last-quoted sales price is not readily
| HENNESSY FUNDS | 1-800-966-4354 | |
available will generally be valued at the mean between the bid and ask prices. To the extent these securities are actively traded and valuation adjustments are not applied, they are classified in Level 1 of the fair value hierarchy. Securities traded on foreign exchanges generally are not valued at the same time the Fund calculates its NAV because most foreign markets close well before such time. The earlier close of most foreign markets gives rise to the possibility that significant events, including broad market moves, may have occurred in the interim. In certain circumstances, it may be determined that a security needs to be fair valued because it appears that the value of the security might have been materially affected by events occurring after the close of the market in which the security is principally traded, but before the time the Fund calculates its NAV, such as by a development that affects an entire market or region (e.g., weather-related events) or a potentially global development (e.g., a terrorist attack that may be expected to have an effect on investor expectations worldwide).
Registered Investment Companies – Investments in registered investment companies (e.g., mutual funds) are generally priced at the ending NAV provided by the applicable registered investment company’s service agent and will be classified in Level 1 of the fair value hierarchy.
Debt Securities – Debt securities, including corporate bonds, asset-backed securities, mortgage-backed securities, municipal bonds, U.S. Treasuries, and U.S. government agency issues, are generally valued at market on the basis of valuations furnished by an independent pricing service that utilizes both dealer-supplied valuations and formula-based techniques. The pricing service may consider recently executed transactions in securities of the issuer or comparable issuers, market price quotations (where observable), bond spreads, and fundamental data relating to the issuer. In addition, the model may incorporate market observable data such as reported sales of similar securities, broker quotes, yields, bids, offers, and reference data. Certain securities are valued principally using dealer quotations. These securities are generally classified in Level 2 of the fair value hierarchy.
Short-Term Securities – Short-term equity investments, including money market funds, are valued in the manner specified above. Short-term debt investments are generally valued at amortized cost, which approximates fair market value, if their original term to maturity was 60 days or less, or by amortizing the values as of the 61st day prior to maturity, if their original term to maturity exceeded 60 days. Amortized cost is not used if its use would be inappropriate due to credit or other impairments of the issuer, in which case the security’s fair value would be determined, as described below. Short-term securities are generally classified in Level 1 or Level 2 of the fair market hierarchy depending on the inputs used and market activity levels for specific securities.
The Board of Trustees of the Fund (the “Board”) has adopted fair value pricing procedures that are followed when a price for a security is not readily available or if a significant event has occurred that indicates the closing price of a security no longer represents the true value of that security. Fair value pricing determinations are made in good faith in accordance with these procedures. There are numerous criteria that will be given consideration in determining a fair value of a security. Some of these criteria are trading volume of a security and markets, the value of other like securities, and news events with direct bearing to a security or markets. Fair value pricing results in an estimated price for a security that reflects the amount the Fund might reasonably expect to receive in a current sale. Depending on the relative significance of the valuation inputs, these securities may be classified in either Level 2 or Level 3 of the fair value hierarchy.
The fair valuation of foreign securities may be determined with the assistance of a pricing service using correlations between the movement of prices of such securities and indices of domestic securities and other appropriate indicators, such as closing market prices of relevant American Depositary Receipts or futures contracts. The effect of using fair value pricing is that the Fund’s NAV will reflect the affected portfolio securities’ value as determined in the judgment of the Board or its designee instead of being determined by the market. Using a fair value pricing methodology to price foreign securities may result in a value that is different from a foreign security’s most recent closing price and from the prices used by other investment companies to calculate their NAVs and are generally considered Level 2 prices in the fair valuation hierarchy. Because the Fund may invest in foreign securities, the value of the Fund’s portfolio securities may change on days when you will not be able to purchase or redeem your shares.
The Board has delegated day-to-day valuation matters to a Valuation Committee comprised of one or more representatives from Hennessy Advisors, Inc., the Fund’s investment advisor. The function of the Valuation Committee is to value securities where current and reliable market quotations are not readily available. All actions taken by the Valuation Committee are reviewed by the Board.
The Fund has performed an analysis of all existing investments to determine the significance and character of all inputs to their fair value determination. Various inputs are used in determining the value of the Fund’s investments. The inputs or methodology used for valuing securities are not necessarily an indication of the risk associated with investing in those securities. Details related to the fair valuation hierarchy of the Fund’s securities as of October 31, 2015 are included in the Fund’s Schedule of Investments.
4). INVESTMENT TRANSACTIONS
Purchases and sales of investment securities (excluding government and short-term investments) for the Fund during the fiscal year ended October 31, 2015 were $96,570,966 and $117,067,033, respectively.
There were no purchases or sales/maturities of long-term U.S. Government Securities for the Fund during the fiscal year ended October 31, 2015.
5). INVESTMENT MANAGEMENT FEE AND OTHER TRANSACTIONS WITH AFFILIATES
Hennessy Advisors, Inc. (the “Advisor”) is the investment advisor of the Fund. The Advisor provides the Fund with investment management services under an Investment Advisory Agreement. The Advisor furnishes all investment advice, office space, facilities, and provides most of the personnel needed by the Fund. As compensation for its services, the Advisor is entitled to a monthly fee from the Fund. The fee is based upon the average daily net assets of the Fund at the annual rate of 0.90%. The net investment advisory fees payable by the Fund as of October 31, 2015 were $175,604.
The Advisor contractually agreed to limit the total annual operating expenses of the Fund (excluding interest, taxes, brokerage commissions, dividend expenses, acquired fund fees and expenses, extraordinary legal expenses, or any other extraordinary expenses and, from and after November 1, 2014, 12b-1 fees) to 1.95% and 1.70% of the Fund’s net assets for the Investor Class shares and Institutional Class shares of the Fund, respectively, through February 28, 2015. The expense limitation agreement for the Fund is no longer in effect.
For a period of three years after the year in which the Advisor waived or reimbursed expenses, the Advisor may seek reimbursement from the Fund to the extent that total annual fund operating expenses are less than the expense limitation that was in effect at the time the Advisor waived or reimbursed expenses. During the three years ended
| HENNESSY FUNDS | 1-800-966-4354 | |
October 31, 2015, no expenses were waived or reimbursed by the Advisor and therefore no expenses are subject to potential recovery.
The Board has approved a Shareholder Servicing Agreement for the Investor Class shares of the Fund, effective as of February 28, 2015, which was instituted to compensate the Advisor for the non-investment management services it provides to the Fund. The Shareholder Servicing Agreement provides for a monthly fee paid to the Advisor at an annual rate of 0.10% of the average daily net assets of the Fund attributable to Investor Class shares. Shareholder service fees payable by the Fund as of October 31, 2015 were $17,399.
The Fund has adopted a plan pursuant to Rule 12b-1 under the Investment Company Act of 1940, as amended, that authorizes payments in connection with the distribution of the Fund’s shares at an annual rate of up to 0.25% of the Fund’s average daily net assets attributable to Investor Class shares, although the Fund has only been using up to 0.15% of its average daily net assets attributable to Investor Class shares for such purpose since March 1, 2015. Amounts paid under the plan may be spent on any activities or expenses primarily intended to result in the sale of shares, including but not limited to, advertising, shareholder account servicing, the printing and mailing of prospectuses to other than current shareholders, the printing and mailing of sales literature, and compensation for sales and marketing activities or to financial institutions and others, such as dealers and distributors.
The Fund has entered into agreements with various brokers, dealers, and financial intermediaries in connection with the sale of shares of the Fund. The agreements provide for periodic payments by the Fund to the brokers, dealers, and financial intermediaries for providing certain shareholder maintenance services (sub-transfer agent expenses). These shareholder services include the pre-processing and quality control of new accounts, shareholder correspondence, answering customer inquiries regarding account status, and facilitating shareholder telephone transactions. Fees paid by the Fund to various brokers, dealers, and financial intermediaries during the fiscal year ended October 31, 2015 were $364,506.
U.S. Bancorp Fund Services, LLC (“USBFS”) provides the Fund with administrative, fund accounting, and transfer agent services, including all regulatory reporting, and necessary office equipment and personnel. As administrator, USBFS is responsible for activities such as (i) preparing various federal and state regulatory filings, reports, and returns for the Fund, (ii) preparing reports and materials to be supplied to the Board, (iii) monitoring the activities of the Fund’s custodian, transfer agent, and accountants, and (iv) coordinating the preparation and payment of the Fund’s expenses and reviewing the Fund’s expense accruals. Fees paid to USBFS during the fiscal year ended October 31, 2015 were $198,503.
U.S. Bank, N.A., an affiliate of USBFS, serves as the Fund’s custodian. Quasar Distributors, LLC acts as the Fund’s principal underwriter in a continuous public offering of the Fund’s shares. Quasar Distributors, LLC is an affiliate of USBFS and U.S. Bank, N.A.
6). LINE OF CREDIT
The Fund has an uncommitted line of credit with the other funds in the Hennessy Funds family of funds (the “Hennessy Funds”) in the amount of the lesser of (i) $100,000,000 or (ii) 33.33% of each Hennessy Fund’s net assets, or 30% for the Hennessy Gas Utility Fund and 10% for the Hennessy Balanced Fund, intended to provide short-term financing, if necessary, subject to certain restrictions, in connection with shareholder redemptions. The credit facility is with the Hennessy Funds’ custodian bank, U.S. Bank, N.A. Borrowings under this arrangement bear interest at the bank’s prime rate and are secured by all of the
Fund’s assets (as to its own borrowings only). During the fiscal year ended October 31, 2015, the Fund had an outstanding average daily balance and a weighted average interest rate of $147,044 and 3.25%, respectively. The maximum amount outstanding for the Fund during the period was $5,795,000. At October 31, 2015, the Fund did not have any borrowings outstanding under the line of credit.
7). FEDERAL TAX INFORMATION
As of October 31, 2015, the components of accumulated earnings (losses) for income tax purposes were as follows:
| Cost of investments for tax purposes | | $ | 203,653,547 | |
| Gross tax unrealized appreciation | | $ | 44,784,928 | |
| Gross tax unrealized depreciation | | | (1,108,972 | ) |
| Net tax unrealized appreciation | | $ | 43,675,956 | |
| Undistributed ordinary income | | $ | 1,736,875 | |
| Undistributed long-term capital gains | | | 15,813,323 | |
| Total distributable earnings | | $ | 17,550,198 | |
| Other accumulated loss | | $ | — | |
| Total accumulated gain | | $ | 61,226,154 | |
The difference between book-basis and tax-basis unrealized appreciation is attributable primarily to wash sales.
At October 31, 2015, the Fund had no tax basis capital losses to offset future capital gains.
At October 31, 2015, the Fund did not defer, on a tax basis, any late year ordinary losses.
The tax character of distributions paid during fiscal year 2015 and fiscal year 2014 for the Fund were as follows:
| | | Year Ended | | | Year Ended | |
| | | October 31, 2015 | | | October 31, 2014 | |
| Ordinary income | | $ | — | | | $ | 2,893,627 | |
| Long-term capital gain | | | 31,639,286 | | | | 20,425,349 | |
| | | $ | 31,639,286 | | | $ | 23,318,976 | |
8). EVENTS SUBSEQUENT TO YEAR END
Management has evaluated the Fund’s related events and transactions that occurred subsequent to October 31, 2015, through the date of issuance of the Fund’s financial statements. Other than as disclosed below, management has determined that there were no subsequent events requiring recognition or disclosure in the financial statements.
On December 9, 2015, capital gains were declared and paid to shareholders of record as of December 8, 2015 as follows:
| | Long-term | Short-term |
| Investor Class | $1.44849 | $0.15543 |
| Institutional Class | $0.86773 | $0.09311 |
| HENNESSY FUNDS | 1-800-966-4354 | |
Report of Independent Registered Public Accounting Firm
To the Board of Trustees of Hennessy Funds Trust
And the Shareholders of the Hennessy Small Cap Financial Fund
Novato, CA
We have audited the accompanying statement of assets and liabilities, including the schedule of investments, of the Hennessy Small Cap Financial Fund (the “Fund”), a series of Hennessy Funds Trust (the “Trust”), as of October 31, 2015, and the related statement of operations for the year then ended, the statements of changes in net assets for each of the two years in the period then ended, and the financial highlights for each of the five years in the period then ended. These financial statements and financial highlights are the responsibility of the Funds’ management. Our responsibility is to express an opinion on these financial statements and financial highlights based on our audits.
We conducted our audits in accordance with the standards of the Public Company Accounting Oversight Board (United States). Those standards require that we plan and perform the audits to obtain reasonable assurance about whether the financial statements and financial highlights are free of material misstatement. The Fund is not required to have, nor were we engaged to perform, an audit of its internal control over financial reporting. Our audits included consideration of internal control over financial reporting as a basis for designing audit procedures that are appropriate in the circumstances, but not for the purposes of expressing an opinion on the effectiveness of the Fund’s internal control over financial reporting. Accordingly, we express no such opinion. An audit includes examining, on a test basis, evidence supporting the amounts and disclosures in the financial statements. Our procedures included confirmation of securities owned as of October 31, 2015, by correspondence with the custodian and brokers. An audit also includes assessing the accounting principles used and significant estimates made by management, as well as evaluating the overall financial statement presentation. We believe that our audits provide a reasonable basis for our opinion.
In our opinion, the financial statements and financial highlights referred to above present fairly, in all material respects, the financial position of the Hennessy Small Cap Financial Fund as of October 31, 2015, the results of its operations for the year then ended, the changes in its net assets for each of the two years in the period then ended, and the financial highlights for each of the five years in the period then ended, in conformity with accounting principles generally accepted in the United States of America.
Philadelphia, Pennsylvania
December 21, 2015
Trustees and Officers of the Fund (Unaudited)
The business and affairs of the Fund are managed under the direction of the Board of Trustees of the Trust, and the Board of Trustees elects the Officers of the Trust. Information pertaining to the Trustees and the Officers of the Trust is set forth below. Such persons serve until their successors are duly elected and qualified or until their earlier death, resignation, or removal. Each of the Trustees oversees 16 Hennessy Funds. Unless otherwise indicated, the address of all persons listed below is 7250 Redwood Boulevard, Suite 200, Novato, CA 94945. The Fund’s Statement of Additional Information includes more information about the persons listed below and is available, without charge, upon request by calling 1-800-966-4354.
| | | | Other |
| | | | Directorships |
| Name, Year of Birth, | | | (During Past |
| and Position Held | Length of | Principal Occupation(s) | Five Years) |
with the Trust | Time Served | During Past Five Years | Held by Trustee(1) |
| | | | |
| Disinterested Trustees | | | |
| | | | |
| J. Dennis DeSousa (1936) | Since January | Mr. DeSousa is a real estate investor. | Hennessy SPARX |
| Trustee | 1996 for the | | Funds Trust; |
| | Hennessy Funds | | Hennessy Mutual |
| | | | Funds, Inc.; and |
| | | | The Hennessy |
| | | | Funds, Inc. |
| | | | |
| Robert T. Doyle (1947) | Since January | Mr. Doyle has been the Sheriff of | Hennessy SPARX |
| Trustee | 1996 for the | Marin County, California since 1996. | Funds Trust; |
| | Hennessy Funds | | Hennessy Mutual |
| | | | Funds, Inc.; and |
| | | | The Hennessy |
| | | | Funds, Inc. |
| | | | |
| Gerald P. Richardson (1945) | Since May | Mr. Richardson is an independent | Hennessy SPARX |
| Trustee | 2004 for the | consultant in the securities industry. | Funds Trust; |
| | Hennessy Funds | | Hennessy Mutual |
| | | | Funds, Inc.; and |
| | | | The Hennessy |
| | | | Funds, Inc. |
| | | | |
Interested Trustee(2) | | | |
| | | | |
| Neil J. Hennessy (1956) | Since January | Mr. Hennessy has been employed by | Hennessy Advisors, |
| Trustee, Chairman of | 1996 as a Trustee | Hennessy Advisors, Inc., the Funds’ | Inc.; Hennessy |
| the Board, Chief | for the Hennessy | investment advisor, since 1989. | SPARX Funds Trust; |
| Investment Officer, | Funds and since | He currently serves as President, | Hennessy Mutual |
| Portfolio Manager, | June 2008 as | Chairman and Chief Executive Officer | Funds, Inc.; and |
| and President | an Officer of the | of Hennessy Advisors, Inc. | The Hennessy |
| | Hennessy Funds | | Funds, Inc. |
| HENNESSY FUNDS | 1-800-966-4354 | |
| Name, Year of Birth, | | |
| and Position Held | Length of | Principal Occupation(s) |
| with the Trust | Time Served | During Past Five Years |
| | | |
| Officers | | |
| | | |
| Teresa M. Nilsen (1966) | Since January | Ms. Nilsen has been employed by Hennessy Advisors, Inc., |
| Executive Vice President | 1996 for the | the Funds’ investment advisor, since 1989. She currently |
| and Treasurer | Hennessy Funds | serves as Executive Vice President, Chief Operations Officer, |
| | | Chief Financial Officer, and Secretary of Hennessy Advisors, Inc. |
| | | |
| Daniel B. Steadman (1956) | Since March | Mr. Steadman has been employed by Hennessy Advisors, Inc., |
| Executive Vice President | 2000 for the | the Funds’ investment advisor, since 2000. He currently serves |
| and Secretary | Hennessy Funds | as Executive Vice President and Chief Compliance Officer of |
| | | Hennessy Advisors, Inc. |
| | | |
| Jennifer Cheskiewicz (1977) | Since June | Ms. Cheskiewicz has been employed by Hennessy Advisors, |
| Senior Vice President and | 2013 for the | Inc., the Funds’ investment advisor, since June 2013. She |
| Chief Compliance Officer | Hennessy Funds | currently serves as General Counsel of Hennessy Advisors, Inc. |
| | | |
| | | She previously served as in-house counsel to Carlson Capital, |
| | | L.P., an SEC-registered investment advisor to several private |
| | | funds from February 2010 to May 2013. |
| | | |
| Brian Carlson (1972) | Since December | Mr. Carlson has been employed by Hennessy Advisors, Inc., the |
| Senior Vice President and | 2013 for the | Funds’ investment advisor, since December 2013. |
| Head of Distribution | Hennessy Funds | |
| | | Mr. Carlson was previously a co-founder and principal of |
| | | Trivium Consultants, LLC from February 2011 through |
| | | November 2013. |
| | | |
David Ellison (1958)(3) | Since October | Mr. Ellison has served as a Portfolio Manager of the Hennessy |
| Senior Vice President and | 2012 for the | Small Cap Financial Fund, the Hennessy Large Cap Financial |
| Portfolio Manager | Hennessy Funds | Fund, and the Hennessy Technology Fund since inception. |
| | | |
| | | Mr. Ellison previously served as Director, CIO and President of |
| | | FBR Fund Advisers, Inc. from December 1999 to October 2012. |
| | | |
| Brian Peery (1969) | Since March | Mr. Peery has served as a Portfolio Manager of the Hennessy |
| Senior Vice President and | 2003 as an | Cornerstone Growth Fund, the Hennessy Cornerstone Mid Cap |
| Portfolio Manager | Officer of the | 30 Fund, the Hennessy Cornerstone Large Growth Fund, the |
| | Hennessy Funds | Hennessy Cornerstone Value Fund, the Hennessy Total Return |
| | and since | Fund, and the Hennessy Balanced Fund since October 2014. |
| | February 2011 | From February 2011 through September 2014, he served as |
| | as a Co-Portfolio | Co-Portfolio Manager of the same funds. Mr. Peery has also |
| | Manager or | served as a Portfolio Manager of the Hennessy Gas Utility Fund |
| | Portfolio Manager | since February 2015. |
| | for the | |
| | Hennessy Funds | Mr. Peery has been employed by Hennessy Advisors, Inc., the |
| | | Funds’ investment advisor, since 2002. |
| | | |
| Winsor (Skip) Aylesworth | Since October | Mr. Aylesworth has served as a Portfolio Manager of the |
(1947)(3) | 2012 for the | Hennessy Gas Utility Fund since 1998 and as a Portfolio |
| Vice President and | Hennessy Funds | Manager of the Hennessy Technology Fund since inception. |
| Portfolio Manager | | |
| | Mr. Aylesworth previously served as Executive Vice President |
| | | of The FBR Funds from 1999 to October 2012. |
| Name, Year of Birth, | | |
| and Position Held | Length of | Principal Occupation(s) |
| with the Trust | Time Served | During Past Five Years |
Ryan Kelley (1972)(4) | Since March | Mr. Kelley has served as a Portfolio Manager of the Hennessy |
| Vice President and | 2013 for the | Gas Utility Fund, the Hennessy Small Cap Financial Fund, and |
| Portfolio Manager | Hennessy Funds | the Hennessy Large Cap Financial Fund since October 2014. |
| | | From March 2013 through September 2014, he served as a |
| | | Co-Portfolio Manager of the same funds. Prior to that, |
| | | he was a Portfolio Analyst of the Hennessy Funds. |
(1) | Pursuant to an internal reorganization, the series of Hennessy Mutual Funds, Inc. (“HMFI”), The Hennessy Funds, Inc. (“HFI”), and Hennessy SPARX Funds Trust (“HSFT”) were reorganized into series of Hennessy Funds Trust on February 28, 2014, which mirrored the corresponding series of HFMI, HFI, and HSFT. Subsequent to the reorganization, HFMI, HFI, and HSFT were dissolved. |
(2) | Mr. Hennessy is considered an “interested person,” as defined in the Investment Company Act of 1940, as amended, because he is an officer of the Hennessy Funds. |
(3) | The address of these officers is 101 Federal Street, Suite 1900, Boston, MA 02110. |
(4) | The address of this officer is 1340 Environ Way, Chapel Hill, NC 27517. |
| HENNESSY FUNDS | 1-800-966-4354 | |
Expense Example (Unaudited)
October 31, 2015
As a shareholder of the Fund, you incur two types of costs: (1) transaction costs, including sales charges (loads) on purchase payments, reinvested dividends, or other distributions; redemption fees; and exchange fees; and (2) ongoing costs, including management fees; service fees; and other Fund expenses. This Example is intended to help you understand your ongoing costs (in dollars) of investing in the Fund and to compare these costs with the ongoing costs of investing in other mutual funds. The Example is based on an investment of $1,000 invested at the beginning of the period and held for the entire period from May 1, 2015 through October 31, 2015.
Actual Expenses
The first line of the table below under the “Investor Class” and “Institutional Class” headings provides information about actual account values and actual expenses. Although the Fund charges no sales loads or transaction fees, you will be assessed fees for outgoing wire transfers, returned checks and stop payment orders at prevailing rates charged by U.S. Bancorp Fund Services, LLC, the Fund’s transfer agent. If you request that a redemption be made by wire transfer, currently a $15.00 fee is charged by the Fund’s transfer agent. IRA accounts will be charged a $15.00 annual maintenance fee. The example below includes, but is not limited to, management fees, shareholder servicing fees, fund accounting, custody, and transfer agent fees. However, the example below does not include portfolio trading commissions and related expenses, and other extraordinary expenses as determined under generally accepted accounting principles. You may use the information in this line, together with the amount you invested, to estimate the expenses that you paid over the period. Simply divide your account value by $1,000 (for example, an $8,600 account value divided by $1,000 = 8.6), then multiply the result by the number in the first line of the table under the “Investor Class” and “Institutional Class” headings in the column entitled “Expenses Paid During Period” to estimate the expenses you paid on your account during this period.
Hypothetical Example for Comparison Purposes
The second line of the table below under the “Investor Class” and “Institutional Class” headings provides information about hypothetical account values and hypothetical expenses based on the Fund’s actual expense ratios and an assumed rate of return of 5% per year before expenses, which is not the Fund’s actual return. The hypothetical account values and expenses may not be used to estimate the actual ending account balance or expenses you paid for the period. You may use this information to compare the ongoing costs of investing in the Fund and other funds. To do so, compare this 5% hypothetical example with the 5% hypothetical examples that appear in the shareholder reports of the other funds. Please note that the expenses shown in the table are meant to highlight your ongoing costs only and do not reflect any transactional costs, such as sales charges (loads), or exchange fees. Therefore, the second line of the table under the “Investor Class” and “Institutional Class” headings is useful in comparing ongoing costs only, and will not help you determine the relative total costs of owning different funds. In addition, if these transactional costs were included, your costs would have been higher.
| | | | Expenses Paid |
| | Beginning | Ending | During Period(1) |
| | Account Value | Account Value | May 1, 2015 – |
| | May 1, 2015 | October 31, 2015 | October 31, 2015 |
| Investor Class | | | |
| Actual | $1,000.00 | $1,098.20 | $8.09 |
| Hypothetical (5% return before expenses) | $1,000.00 | $1,017.49 | $7.78 |
| | | | |
| Institutional Class | | | |
| Actual | $1,000.00 | $1,100.90 | $6.30 |
| Hypothetical (5% return before expenses) | $1,000.00 | $1,019.21 | $6.06 |
(1) | Expenses are equal to the Fund’s annualized expense ratio of 1.53% for Investor Class shares or 1.19% for Institutional Class shares, as applicable, multiplied by the average account value over the period, multiplied by 184/365 days (to reflect one-half year period). |
| HENNESSY FUNDS | 1-800-966-4354 | |
How to Obtain a Copy of the Fund’s
Proxy Voting Policy and Proxy Voting Records
A description of the policies and procedures the Fund uses to determine how to vote proxies relating to portfolio securities is available without charge: (1) by calling 1-800-966-4354; (2) on the Hennessy Funds’ website at hennessyfunds.com/proxy-voting/policy.fs; or (3) on the U.S. Securities and Exchange Commission’s website at www.sec.gov. The Fund’s proxy voting record is available without charge on both the Hennessy Funds’ website at hennessyfunds.com/proxy-voting/policy.fs and the SEC’s website at www.sec.gov no later than August 31 for the prior 12 months ending June 30.
Quarterly Filings on Form N-Q
The Fund files its complete schedule of portfolio holdings with the SEC for the first and third quarters of each fiscal year on Form N-Q. The Fund’s Form N-Q will be available on the SEC’s website at www.sec.gov. The Fund’s Form N-Q may be reviewed and copied at the SEC’s Public Reference Room in Washington, DC and information on the operation of the Public Reference Room may be obtained by calling 1-800-SEC-0330. Information included in the Fund’s N-Q will also be available upon request by calling 1-800-966-4354.
Householding
To help keep the Fund’s costs as low as possible, we generally deliver a single copy of most financial reports and prospectuses to shareholders who share an address, even if the accounts are registered under different names. This process, known as “householding,” does not apply to account statements. You may, of course, request an individual copy of a prospectus or financial report at any time. If you would like to receive separate mailings, please call the Administrator at 1-800-261-6950 or 1-414-765-4124 and we will begin individual delivery within 30 days of your request. If your account is held through a financial institution or other intermediary, please contact them directly to request individual delivery.
Privacy Policy
We collect the following non-public personal information about you:
| | • | information we receive from you on or in applications or other forms, correspondence, or conversations, including, but not limited to, your name, address, phone number, social security number, assets, income, and date of birth; and |
| | • | information about your transactions with us, our affiliates, or others, including, but not limited to, your account number and balance, payment history, parties to transactions, cost basis information, and other financial information. |
We do not disclose any non-public personal information about our current or former shareholders to nonaffiliated third parties, except as permitted by law. For example, we are permitted by law to disclose all of the information we collect, as described above, to our Transfer Agent to process your transactions. Furthermore, we restrict access to your non-public personal information to those persons who require such information to provide products or services to you. We maintain physical, electronic, and procedural safeguards that comply with federal standards to guard your non-public personal information.
In the event that you hold shares of the Fund through a financial intermediary, including, but not limited to, a broker-dealer, bank or trust company, the privacy policy of your financial intermediary would govern how your non-public personal information would be shared with nonaffiliated third parties.
| HENNESSY FUNDS | 1-800-966-4354 | |
For information, questions or assistance, please call
The Hennessy Funds
1-800-966-4354 or 1-415-899-1555
INVESTMENT ADVISOR
Hennessy Advisors, Inc.
7250 Redwood Blvd., Suite 200
Novato, California 94945
ADMINISTRATOR,
TRANSFER AGENT,
DIVIDEND PAYING AGENT &
SHAREHOLDER SERVICING AGENT
U.S. Bancorp Fund Services, LLC
P.O. Box 701
Milwaukee, Wisconsin 53201-0701
CUSTODIAN
U.S. Bank N.A.
Custody Operations
1555 North River Center Dr., Suite 302
Milwaukee, Wisconsin 53212
TRUSTEES
Neil J. Hennessy
Robert T. Doyle
J. Dennis DeSousa
Gerald P. Richardson
COUNSEL
Foley & Lardner LLP
777 East Wisconsin Avenue
Milwaukee, Wisconsin 53202-5306
INDEPENDENT REGISTERED
PUBLIC ACCOUNTING FIRM
Tait, Weller & Baker LLP
1818 Market Street, Suite 2400
Philadelphia, Pennsylvania 19103
DISTRIBUTOR
Quasar Distributors, LLC
615 East Michigan Street
Milwaukee, Wisconsin 53202
hennessyfunds.com | 1-800-966-4354
This report has been prepared for shareholders and may be distributed to
others only if preceded or accompanied by a current prospectus.
ANNUAL REPORT
OCTOBER 31, 2015
HENNESSY LARGE CAP
FINANCIAL FUND
Investor Class HLFNX
Institutional Class HILFX
hennessyfunds.com | 1-800-966-4354
(This Page Intentionally Left Blank.)
Contents
| Letter to Shareholders | 2 |
| Performance Overview | 4 |
| Financial Statements | |
| Schedule of Investments | 7 |
| Statement of Assets and Liabilities | 11 |
| Statement of Operations | 12 |
| Statements of Changes in Net Assets | 13 |
| Financial Highlights | 14 |
| Notes to the Financial Statements | 17 |
| Report of Independent Registered Public Accounting Firm | 25 |
| Trustees and Officers of the Fund | 26 |
| Expense Example | 30 |
| Proxy Voting | 32 |
| Quarterly Filings on Form N-Q | 32 |
| Federal Tax Distribution Information | 32 |
| Householding | 32 |
| Privacy Policy | 33 |
| HENNESSY FUNDS | 1-800-966-4354 | |
December 2015
Dear Hennessy Funds Shareholder:
As I look back over the year, I am reminded that the U.S. economy has come a long way since the depths of the recession in 2009. The economy has been expanding steadily for almost six years, the unemployment rate has halved, the housing market has been recovering and capital expenditures have been growing. The financial markets have performed well too, driven largely by strong corporate earnings growth, especially in the early years. The U.S. market, as measured by the S&P 500 Index, has roughly tripled since the bull market began in 2009, and the Index’s earnings per share have increased 260% over this same time period. For the year ended October 31, 2015, the U.S. equity market performed reasonably well, with the S&P 500 posting another advance of 5.2%. However, behind this headline number, the market experienced a great deal of volatility as investors reacted to falling energy prices, a rise in the U.S. Dollar, pressure on export earnings growth, slower growth in China and, most significantly, the likelihood of a rise in the Fed Funds rate for the first time in nearly a decade – the featured topic of conversation around every office water cooler in the financial world this year.
Investors, reporters and friends often ask me “What’s next?” The market has been in a volatile, sideways correction for over a year now, and throughout this period of volatility, I have consistently advised investors to continue to focus on the long-term fundamentals of the market.
In my view, the fundamentals of the market are in good shape. Despite a stronger U.S. Dollar and its impact on export growth, the economy is still growing steadily. Inflation remains low, so we expect the Federal Reserve, once it does begin to raise short-term interest rates, will not likely raise them by very much. New jobs are being created at what I believe is a healthy rate, and average hourly wages are rising in response to a tighter labor market. Higher wages and lower gasoline prices are helping to keep consumer confidence positive.
Notwithstanding what I view as a relatively solid economic environment, however, I think investor sentiment remains restrained. The same factors that contributed to the market volatility this past year are still troubling investors today: the slowdown in the Chinese economy, slower earnings growth here in the U.S., and, of course, the prospect of rising interest rates. As a result of these investor worries, I do not see any solid enthusiasm for the market – no euphoria. Universal optimism about the market often coincides with a peak in stock prices and this absence of euphoria is yet another reason I feel bullish. And finally, I do not believe stocks are expensive. The Dow Jones Industrial Average and the S&P 500 Index have forward PE (price-to-earnings) ratios of approximately 16x and 17x, respectively, close to long-term averages. In my view, these fundamentals taken together signal a continuation of the bull market that began six years ago.
A final positive note: I still do not believe that investors have fully returned to investing in U.S. equities. Assets in domestic equity funds have now reached parity with fixed income/money market funds, with $6.2 trillion in each. I believe that fixed income investments will continue to trickle into equities, which should have a positive effect on the market.
Thank you for your continued confidence and investment in our products. If you have any questions or would like to speak with us directly, please don’t hesitate to call us at (800) 966-4354.
Best regards,
Neil J. Hennessy
President and Chief Investment Officer
Past performance does not guarantee future results.
Mutual fund investing involves risk. Principal loss is possible.
Opinions expressed are those of Neil Hennessy and are subject to change, are not guaranteed and should not be considered investment advice.
The Dow Jones Industrial Average and the S&P 500 Index are unmanaged indices commonly used to measure the performance of U.S. stocks. One cannot invest directly in an index.
Price to earnings (“PE”) is the market price per share divided by earnings per share. Earnings per share is the portion of a company’s profit allocated to each outstanding share of common stock. It serves as an indicator of a company’s profitability.
| HENNESSY FUNDS | 1-800-966-4354 | |
Performance Overview (Unaudited)
CHANGE IN VALUE OF $10,000 INVESTMENT
This graph illustrates the performance of an initial investment of $10,000 made in the Fund ten years ago and assumes the reinvestment of dividends.
AVERAGE ANNUAL TOTAL RETURN FOR PERIODS ENDED OCTOBER 31, 2015
| | One | Five | Ten |
| | Year | Years | Years |
| Hennessy Large Cap Financial Fund – | | | |
| Investor Class (HLFNX) | -2.57% | 10.23% | 4.69% |
| Hennessy Large Cap Financial Fund – | | | |
Institutional Class (HILFX)(1) | -2.41% | 10.26% | 4.71% |
Russell 1000® Financial | | | |
| Services Index | 5.41% | 13.49% | 1.77% |
Russell 1000® Index | 4.86% | 14.32% | 7.98% |
Expense ratios: 1.55% (Investor Class); 1.17% (Institutional Class)
Performance data quoted represents past performance; past performance does not guarantee future results. The investment return and principal value of an investment will fluctuate so that an investor’s shares, when redeemed, may be worth more or less than their original cost. The performance graph and table do not reflect the deduction of taxes that a shareholder would pay on Fund distributions or the redemption of Fund shares. Current performance of the Fund may be lower or higher than the performance quoted. Performance data current to the most recent month end may be obtained by visiting hennessyfunds.com. Performance for periods prior to October 26, 2012 is that of the FBR Large Cap Financial Fund.
The expense ratios presented are from the most recent prospectus.
(1) | The inception date of Institutional Class shares is June 15, 2015. Performance shown prior to the inception of Institutional Class shares reflects the performance of Investor Class shares and includes expenses that are not applicable to and are higher than those of Institutional Class shares. |
PERFORMANCE NARRATIVE
Portfolio Managers David H. Ellison and Ryan Kelley
Performance:
For the twelve-month period ended October 31, 2015, the Investor Class of the Hennessy Large Cap Financial Fund returned -2.57%, underperforming the Russell 1000® Financial
Services Index and the Russell 1000® Index, which returned 5.41% and 4.86% for the same period, respectively.
The Fund’s underperformance versus its benchmark index over the year ended October 31, 2015 was principally due to the Fund’s overweight position in regional banks and diversified global banks, which performed poorly relative to other financial companies over the period. Stock selection also detracted from performance in some other areas, including specialty finance and REITs, where some of our portfolio holdings, including American Express Company, Discover Financial Services and Vornado Realty Trust underperformed. The Fund continues to own Discover Financial Services.
Companies with the strongest performance contributions to the Fund during the twelve-month period were asset managers and credit service companies. Specific contributors to performance included Visa, Inc., The Blackstone Group L.P. and MasterCard, Inc. The Fund continues to hold all of these positions.
Portfolio Strategy:
Traditionally, the Fund does not seek to diversify its investments across all the different sub-industries of the financial services sector. Rather, the Fund tilts its investments more heavily toward regional banks, thrifts and mortgage finance companies. Within these preferred sub-industries, we seek companies with what we believe are high-quality management teams, uncomplicated business models and sustainable earnings growth opportunities. Moreover, the Fund seeks companies expected to do well now, in the current environment, rather than those that appear to promise to increase profitability when interest rates rise or loan demand surges.
Investment Outlook:
While the large financial companies in the U.S. are generally profitable and continue to make improvements to their operations, headwinds persist. Investors in financial stocks are concerned about global growth, additional regulatory burdens, the possibility of damage to credit quality as a result of the drop in energy prices and the impact of continued low interest rates on bank profits. Nevertheless, we believe that the financial industry as a whole, and large banking companies in particular, continue to recover well from the financial crisis. Liquidity, capital, credit, reserves, book value and cost controls all improved throughout the year. As a result, profits, as measured by returns on assets and equity, have not only increased but have become more sustainable in our opinion. Additionally, we expect any upward movement in interest rates to improve lending and investing spreads and add to returns on shareholder equity.
We believe the structure and condition of the financial system in the U.S. today is one of the best we have seen in quite some time and that the outlook for stocks in the Financial sector is bright.
Opinions expressed are those of the Portfolio Managers as of the date written and are subject to change, are not guaranteed, and should not be considered investment advice or an indication of trading intent.
The Russell 1000® Financial Services Index is an unmanaged index commonly used to measure the performance of large-capitalization financial sector stocks. The Russell 1000® Index is an unmanaged index commonly used to measure the performance of U.S. stocks. One cannot invest directly in an index.
The Fund is non-diversified, meaning it may concentrate its assets in fewer individual holdings than a diversified fund, making it more exposed to individual stock volatility than a diversified fund. Investments are focused in the financial services industry; sector funds may be subject to a
| HENNESSY FUNDS | 1-800-966-4354 | |
higher degree of market risk. The Fund invests in medium sized companies, which may have limited liquidity and greater volatility compared to larger companies.
References to specific securities should not be considered a recommendation to buy or sell any security. Fund holdings and sector allocations are subject to change. Please refer to the Schedule of Investments included in this report for additional portfolio information.
Earnings growth is not a measure of the Fund’s future performance. Book value is the net asset value of a company, calculated by total assets minus liabilities. REIT refers to a real estate investment trust.
Financial Statements
Schedule of Investments as of October 31, 2015 |
HENNESSY LARGE CAP FINANCIAL FUND
(% of Net Assets)
| TOP TEN HOLDINGS (EXCLUDING CASH/CASH EQUIVALENTS) | % NET ASSETS |
| SunTrust Banks, Inc. | 4.68% |
| Bank of America Corp. | 4.67% |
| Citigroup, Inc. | 4.58% |
| Citizens Financial Group, Inc. | 4.57% |
| Wells Fargo & Co. | 4.55% |
| Fifth Third Bancorp | 4.47% |
| U.S. Bancorp | 4.47% |
| JPMorgan Chase & Co. | 4.45% |
| Regions Financial Corp. | 4.40% |
| Capital One Financial Corp. | 4.37% |
Note: For presentation purposes, the Fund has grouped some of the industry categories. For purposes of categorizing securities for compliance with section 8(b)(1) of the Investment Company Act of 1940, as amended, the Fund uses more specific industry classifications.
| HENNESSY FUNDS | 1-800-966-4354 | |
| COMMON STOCKS – 91.59% | | Number | | | | | | % of | |
| | | of Shares | | | Value | | | Net Assets | |
| Financials – 84.47% | | | | | | | | | |
| Ally Financial, Inc. (a) | | | 100,000 | | | $ | 1,992,000 | | | | 1.97 | % |
| Bank of America Corp. | | | 281,000 | | | | 4,715,180 | | | | 4.67 | % |
| BB&T Corp. | | | 106,000 | | | | 3,937,900 | | | | 3.90 | % |
| Berkshire Hathaway, Inc., Class B (a) | | | 32,000 | | | | 4,352,640 | | | | 4.31 | % |
| Capital One Financial Corp. | | | 56,000 | | | | 4,418,400 | | | | 4.37 | % |
| Citigroup, Inc. | | | 87,000 | | | | 4,625,790 | | | | 4.58 | % |
| Citizens Financial Group, Inc. | | | 190,000 | | | | 4,617,000 | | | | 4.57 | % |
| Discover Financial Services | | | 76,000 | | | | 4,272,720 | | | | 4.23 | % |
| Fifth Third Bancorp | | | 237,000 | | | | 4,514,850 | | | | 4.47 | % |
| Huntington Bancshares, Inc. | | | 20,000 | | | | 219,400 | | | | 0.22 | % |
| JPMorgan Chase & Co. | | | 70,000 | | | | 4,497,500 | | | | 4.45 | % |
| KeyCorp | | | 335,000 | | | | 4,160,700 | | | | 4.12 | % |
| M&T Bank Corp. | | | 35,000 | | | | 4,194,750 | | | | 4.15 | % |
| Morgan Stanley | | | 130,000 | | | | 4,286,100 | | | | 4.24 | % |
| Regions Financial Corp. | | | 475,000 | | | | 4,441,250 | | | | 4.40 | % |
| SunTrust Banks, Inc. | | | 114,000 | | | | 4,733,280 | | | | 4.68 | % |
| Synchrony Financial (a) | | | 117,000 | | | | 3,598,920 | | | | 3.56 | % |
| The Goldman Sachs Group, Inc. | | | 23,000 | | | | 4,312,500 | | | | 4.27 | % |
| The PNC Financial Services Group, Inc. | | | 48,000 | | | | 4,332,480 | | | | 4.29 | % |
| U.S. Bancorp (c) | | | 107,000 | | | | 4,513,260 | | | | 4.47 | % |
| Wells Fargo & Co. | | | 85,000 | | | | 4,601,900 | | | | 4.55 | % |
| | | | | | | | 85,338,520 | | | | 84.47 | % |
| | | | | | | | | | | | | |
| Information Technology – 7.12% | | | | | | | | | | | | |
| MasterCard, Inc., Class A | | | 23,000 | | | | 2,276,770 | | | | 2.26 | % |
| PayPal Holdings, Inc. (a) | | | 20,000 | | | | 720,200 | | | | 0.71 | % |
| Visa, Inc., Class A | | | 54,000 | | | | 4,189,320 | | | | 4.15 | % |
| | | | | | | | 7,186,290 | | | | 7.12 | % |
| | | | | | | | | | | | | |
| Total Common Stocks | | | | | | | | | | | | |
| (Cost $87,284,600) | | | | | | | 92,524,810 | | | | 91.59 | % |
The accompanying notes are an integral part of these financial statements.
| PARTNERSHIPS – 1.31% | | Number | | | | | | % of | |
| | | of Shares | | | Value | | | Net Assets | |
| Financials – 1.31% | | | | | | | | | |
| Blackstone Group L.P. | | | 40,000 | | | $ | 1,322,400 | | | | 1.31 | % |
| | | | | | | | | | | | | |
| Total Partnerships | | | | | | | | | | | | |
| (Cost $1,200,641) | | | | | | | 1,322,400 | | | | 1.31 | % |
| | | | | | | | | | | | | |
| SHORT-TERM INVESTMENTS – 7.93% | | | | | | | | | | | | |
| | | | | | | | | | | | | |
| Money Market Funds – 7.93% | | | | | | | | | | | | |
| Federated Government Obligations Fund – Class I, 0.01% (b) | | | 3,147,449 | | | | 3,147,449 | | | | 3.12 | % |
| Fidelity Government Portfolio – Institutional Class, 0.01% (b) | | | 4,864,000 | | | | 4,864,000 | | | | 4.81 | % |
| | | | | | | | | | | | | |
| Total Short-Term Investments | | | | | | | | | | | | |
| (Cost $8,011,449) | | | | | | | 8,011,449 | | | | 7.93 | % |
| | | | | | | | | | | | | |
| Total Investments | | | | | | | | | | | | |
| (Cost $96,496,690) – 100.83% | | | | | | | 101,858,659 | | | | 100.83 | % |
| Liabilities in Excess | | | | | | | | | | | | |
| of Other Assets – (0.83)% | | | | | | | (833,846 | ) | | | (0.83 | )% |
TOTAL NET ASSETS – 100.00% | | | | | | $ | 101,024,813 | | | | 100.00 | % |
Percentages are stated as a percent of net assets.
REIT – Real Estate Investment Trust
| (a) | Non-income producing security. |
| (b) | The rate listed is the fund’s 7-day yield as of October 31, 2015. |
| (c) | Investment in affiliated security. Quasar Distributors, LLC, which serves as the Fund’s distributor, is a subsidiary of U.S. Bancorp. Details of transactions with this affiliated company for the year ended October 31, 2015, are as follows: |
| | Issuer | | U.S. Bancorp | |
| | Beginning Cost | | $ | 4,226,794 | |
| | Purchase Cost | | $ | 1,810,455 | |
| | Sales Cost | | $ | 1,570,377 | |
| | Ending Cost | | $ | 4,466,872 | |
| | Dividend Income | | $ | 88,745 | |
| | Realized Gain | | $ | 306,714 | |
| | Shares | | | 107,000 | |
| | Market Value | | $ | 4,513,260 | |
| HENNESSY FUNDS | 1-800-966-4354 | |
Summary of Fair Value Exposure at October 31, 2015
The following is a summary of the inputs used to value the Fund’s net assets as of October 31, 2015 (see Note 3 in the accompanying notes to the financial statements):
| Common Stocks | | Level 1 | | | Level 2 | | | Level 3 | | | Total | |
| Financials | | $ | 85,338,520 | | | $ | — | | | $ | — | | | $ | 85,338,520 | |
| Information Technology | | | 7,186,290 | | | | — | | | | — | | | | 7,186,290 | |
| Total Common Stocks | | $ | 92,524,810 | | | $ | — | | | $ | — | | | $ | 92,524,810 | |
| Partnerships | | | | | | | | | | | | | | | | |
| Financials | | $ | 1,322,400 | | | $ | — | | | $ | — | | | $ | 1,322,400 | |
| Total Partnerships | | $ | 1,322,400 | | | $ | — | | | $ | — | | | $ | 1,322,400 | |
| Short-Term Investments | | | | | | | | | | | | | | | | |
| Money Market Funds | | $ | 8,011,449 | | | $ | — | | | $ | — | | | $ | 8,011,449 | |
| Total Short-Term Investments | | $ | 8,011,449 | | | $ | — | | | $ | — | | | $ | 8,011,449 | |
| Total Investments | | $ | 101,858,659 | | | $ | — | | | $ | — | | | $ | 101,858,659 | |
Transfers between levels are recognized at the end of the reporting period. During the year ended October 31, 2015, the Fund recognized no transfers between levels.
The accompanying notes are an integral part of these financial statements.
Financial Statements
Statement of Assets and Liabilities as of October 31, 2015 |
| ASSETS: | | | |
| Investments in securities, at value (cost $92,029,818) | | $ | 97,345,399 | |
| Investments in affiliated securities, at value (cost $4,466,872) | | | 4,513,260 | |
| Total Investments in securities, at value (cost $96,496,690) | | | 101,858,659 | |
| Dividends and interest receivable | | | 107,874 | |
| Receivable for fund shares sold | | | 73,513 | |
| Return of capital receivable | | | 19,600 | |
| Prepaid expenses and other assets | | | 18,351 | |
| Total Assets | | | 102,077,997 | |
| | | | | |
| LIABILITIES: | | | | |
| Payable for securities purchased | | | 650,392 | |
| Payable for fund shares redeemed | | | 237,650 | |
| Payable to advisor | | | 72,120 | |
| Payable to administrator | | | 15,301 | |
| Payable to auditor | | | 20,300 | |
| Accrued distribution fees | | | 16,668 | |
| Accrued service fees | | | 7,989 | |
| Accrued trustees fees | | | 2,400 | |
| Accrued expenses and other payables | | | 30,364 | |
| Total Liabilities | | | 1,053,184 | |
| NET ASSETS | | $ | 101,024,813 | |
| | | | | |
| NET ASSETS CONSIST OF: | | | | |
| Capital stock | | $ | 85,981,094 | |
| Accumulated net investment income | | | 135,883 | |
| Accumulated net realized gain on investments | | | 9,545,867 | |
| Unrealized net appreciation on investments | | | 5,361,969 | |
| Total Net Assets | | $ | 101,024,813 | |
| | | | | |
| NET ASSETS | | | | |
| Investor Class: | | | | |
| Shares authorized (no par value) | | Unlimited | |
| Net assets applicable to outstanding Investor Class shares | | $ | 100,733,972 | |
| Shares issued and outstanding | | | 5,486,536 | |
| Net asset value, offering price and redemption price per share | | $ | 18.36 | |
| | | | | |
| Institutional Class: | | | | |
| Shares authorized (no par value) | | Unlimited | |
| Net assets applicable to outstanding Institutional Class shares | | $ | 290,841 | |
| Shares issued and outstanding | | | 15,813 | |
| Net asset value, offering price and redemption price per share | | $ | 18.39 | |
The accompanying notes are an integral part of these financial statements.
| HENNESSY FUNDS | 1-800-966-4354 | |
Financial Statements
Statement of Operations for the year ended October 31, 2015 |
| INVESTMENT INCOME: | | | |
| Dividend income from unaffiliated securities | | $ | 1,431,866 | |
| Dividend income from affiliated securities | | | 88,745 | |
| Interest income | | | 365 | |
| Total investment income | | | 1,520,976 | |
| | | | | |
| EXPENSES: | | | | |
| Investment advisory fees (See Note 5) | | | 856,669 | |
| Sub-transfer agent expenses – Investor Class (See Note 5) | | | 193,108 | |
| Sub-transfer agent expenses – Institutional Class (See Note 5) | | | 37 | |
| Distribution fees – Investor Class (See Note 5) | | | 175,128 | |
| Administration, fund accounting, custody and transfer agent fees (See Note 5) | | | 93,699 | |
| Service fees – Investor Class (See Note 5) | | | 62,649 | |
| Federal and state registration fees | | | 25,337 | |
| Compliance expense | | | 22,187 | |
| Audit fees | | | 20,899 | |
| Trustees’ fees and expenses | | | 11,121 | |
| Legal fees | | | 11,000 | |
| Reports to shareholders | | | 8,823 | |
| Interest expense (See Note 6) | | | 2,853 | |
| Other expenses | | | 9,619 | |
| Total expenses | | | 1,493,129 | |
| NET INVESTMENT INCOME | | $ | 27,847 | |
| | | | | |
| REALIZED AND UNREALIZED GAINS (LOSSES): | | | | |
| Net realized gain on: | | | | |
| Unaffiliated investments | | $ | 10,261,059 | |
| Affiliated investments | | | 306,714 | |
| Net change in unrealized depreciation on investments | | | (13,399,391 | ) |
| Net loss on investments | | | (2,831,618 | ) |
| NET DECREASE IN NET ASSETS RESULTING FROM OPERATIONS | | $ | (2,803,771 | ) |
The accompanying notes are an integral part of these financial statements.
Financial Statements
| Statements of Changes in Net Assets |
| | | Year Ended | | | Year Ended | |
| | | October 31, 2015 | | | October 31, 2014 | |
| OPERATIONS: | | | | | | |
| Net investment income (loss) | | $ | 27,847 | | | $ | (8,428 | ) |
| Net realized gain on investments | | | 10,567,773 | | | | 11,397,059 | |
| Net change in unrealized appreciation (depreciation) | | | | | | | | |
| on investments | | | (13,399,391 | ) | | | 423,324 | |
| Net increase (decrease) in net assets | | | | | | | | |
| resulting from operations | | | (2,803,771 | ) | | | 11,811,955 | |
| | | | | | | | | |
| DISTRIBUTIONS TO SHAREHOLDERS FROM: | | | | | | | | |
| Net realized gains – Investor Class | | | (9,953,546 | ) | | | (2,696,057 | ) |
| Total distributions | | | (9,953,546 | ) | | | (2,696,057 | ) |
| | | | | | | | | |
| CAPITAL SHARE TRANSACTIONS: | | | | | | | | |
| Proceeds from shares subscribed – Investor Class | | | 45,802,881 | | | | 42,008,535 | |
| Proceeds from shares subscribed – Institutional Class | | | 352,187 | | | | — | |
| Dividends reinvested – Investor Class | | | 9,642,825 | | | | 2,639,350 | |
| Cost of shares redeemed – Investor Class | | | (40,051,718 | ) | | | (43,989,911 | )(1) |
| Cost of shares redeemed – Institutional Class | | | (38,886 | ) | | | — | |
| Net increase in net assets derived | | | | | | | | |
| from capital share transactions | | | 15,707,289 | | | | 657,974 | |
| TOTAL INCREASE IN NET ASSETS | | | 2,949,972 | | | | 9,773,872 | |
| | | | | | | | | |
| NET ASSETS: | | | | | | | | |
| Beginning of year | | | 98,074,841 | | | | 88,300,969 | |
| End of year | | $ | 101,024,813 | | | $ | 98,074,841 | |
| Undistributed net investment income, end of year | | $ | 135,883 | | | $ | — | |
| | | | | | | | | |
| CHANGES IN SHARES OUTSTANDING: | | | | | | | | |
| Shares sold – Investor Class | | | 2,388,963 | | | | 2,098,171 | |
| Shares sold – Institutional Class | | | 17,958 | | | | — | |
| Shares issued to holders as reinvestment | | | | | | | | |
| of dividends – Investor Class | | | 489,235 | | | | 135,909 | |
| Shares redeemed – Investor Class | | | (2,090,781 | ) | | | (2,180,579 | ) |
| Shares redeemed – Institutional Class | | | (2,145 | ) | | | — | |
| Net increase in shares outstanding | | | 803,230 | | | | 53,501 | |
(1) | Net of redemption fees of $287 related to redemption fees imposed by the FBR Large Cap Financial Fund during a prior year but not received until fiscal year 2014. |
The accompanying notes are an integral part of these financial statements.
| HENNESSY FUNDS | 1-800-966-4354 | |
Financial Statements
For an Investor Class share outstanding throughout each year
PER SHARE DATA:
Net asset value, beginning of year
Income from investment operations:
Net investment income (loss)
Net realized and unrealized gains (losses) on investments
Total from investment operations
Less distributions:
Dividends from net investment income
Dividends from net realized gains
Total distributions
Net asset value, end of year
TOTAL RETURN
Net assets, end of year (millions)
Ratio of expenses to average net assets
Ratio of net investment income (loss) to average net assets
Portfolio turnover rate(3)
(1) | Calculated based on average shares outstanding method. |
(2) | Amount is less than $0.01. |
(3) | Portfolio turnover is calculated on the basis of the Fund as a whole. |
The accompanying notes are an integral part of these financial statements.
| Year Ended October 31, | |
| 2015 | | | 2014 | | | 2013 | | | 2012 | | | 2011 | |
| | | | | | | | | | | | | |
| $ | 20.87 | | | $ | 19.01 | | | $ | 14.16 | | | $ | 11.91 | | | $ | 12.88 | |
| | | | | | | | | | | | | | | | | | | |
| | | | | | | | | | | | | | | | | | | |
| | 0.01 | | | | (0.00 | )(2) | | | (0.03 | ) | | | 0.01 | | | | (0.04 | )(1) |
| | (0.40 | ) | | | 2.44 | | | | 4.89 | | | | 2.24 | | | | (0.93 | ) |
| | (0.39 | ) | | | 2.44 | | | | 4.86 | | | | 2.25 | | | | (0.97 | ) |
| | | | | | | | | | | | | | | | | | | |
| | | | | | | | | | | | | | | | | | | |
| | — | | | | — | | | | (0.01 | ) | | | — | | | | — | |
| | (2.12 | ) | | | (0.58 | ) | | | — | | | | — | | | | — | |
| | (2.12 | ) | | | (0.58 | ) | | | (0.01 | ) | | | — | | | | — | |
| $ | 18.36 | | | $ | 20.87 | | | $ | 19.01 | | | $ | 14.16 | | | $ | 11.91 | |
| | | | | | | | | | | | | | | | | | | |
| | (2.57 | )% | | | 13.04 | % | | | 34.37 | % | | | 18.89 | % | | | (7.53 | )% |
| $ | 100.73 | | | $ | 98.07 | | | $ | 88.30 | | | $ | 64.66 | | | $ | 55.68 | |
| | 1.57 | % | | | 1.49 | % | | | 1.57 | % | | | 1.57 | % | | | 1.61 | % |
| | 0.03 | % | | | (0.01 | )% | | | (0.22 | )% | | | 0.09 | % | | | (0.34 | )% |
| | 74 | % | | | 58 | % | | | 75 | % | | | 93 | % | | | 97 | % |
The accompanying notes are an integral part of these financial statements.
| HENNESSY FUNDS | 1-800-966-4354 | |
Financial Statements
For an Institutional Class share outstanding throughout the period
| | | Period Ended | |
| | | October 31, 2015(1) | |
| PER SHARE DATA: | | | |
| Net asset value, beginning of period | | $ | 19.72 | |
| | | | | |
| Income from investment operations: | | | | |
| Net investment loss | | | 0.01 | |
| Net realized and unrealized gains on investments | | | (1.34 | ) |
| Total from investment operations | | | (1.33 | ) |
| | | | | |
| Net asset value, end of period | | $ | 18.39 | |
| | | | | |
| TOTAL RETURN | | | (6.74 | )%(2) |
| Net assets, end of year (millions) | | $ | 0.29 | |
| Ratio of expenses to average net assets | | | 1.19 | %(3) |
| Ratio of net investment income (loss) to average net assets | | | 0.25 | %(3) |
Portfolio turnover rate(4) | | | 74 | %(2) |
(1) | The Institutional Class shares commenced operations on June 15, 2015. |
(2) | Not annualized. |
(3) | Annualized. |
(4) | Portfolio turnover is calculated on the basis of the Fund as a whole. |
The accompanying notes are an integral part of these financial statements.
Financial Statements
Notes to the Financial Statements October 31, 2015 |
1). ORGANIZATION
The Hennessy Large Cap Financial Fund (the “Fund”) is a series of Hennessy Funds Trust (the “Trust”), which was organized as a Delaware statutory trust on September 17, 1992. The Fund is an open-end management investment company registered under the Investment Company Act of 1940, as amended. The Fund is a successor to the FBR Large Cap Financial Fund (the “Predecessor FBR Fund”), a series of The FBR Funds, a Delaware statutory trust, pursuant to a reorganization that took place after the close of business on October 26, 2012. Prior to October 26, 2012, the Fund had no investment operations. As a result of the reorganization, holders of the Investor Class shares of the Predecessor FBR Fund received Investor Class shares of the Fund (the Investor Class shares of the Fund are the successor to the accounting and performance information of the Predecessor FBR Fund). The Fund did not have Institutional Class shares until June 15, 2015. The investment objective of the Fund is capital appreciation. The Fund is a non-diversified fund.
The Fund offers Investor Class and Institutional Class shares. Each class of shares differs principally in its respective administration, 12b-1 distribution and service, shareholder servicing, and transfer agent expenses and sales charges, if any. Each class has identical rights to earnings, assets, and voting privileges, except for class-specific expenses and exclusive rights to vote on matters affecting only an individual class.
As an investment company, the Fund follows the investment company accounting and reporting guidance of the Financial Accounting Standards Board (“FASB”) Accounting Standard Codification Topic 946 “Financial Services—Investment Companies.”
2). SIGNIFICANT ACCOUNTING POLICIES
The following is a summary of significant accounting policies consistently followed by the Fund in the preparation of the financial statements. These policies are in conformity with U.S. generally accepted accounting principles (“GAAP”).
| a). | Investment Valuation – All investments in securities are recorded at their estimated fair value, as described in Note 3. |
| | |
| b). | Federal Income Taxes – Provision for federal income taxes or excise taxes has not been made since the Fund has elected to be taxed as a “regulated investment company” and intends to distribute substantially all of its taxable income to its shareholders and otherwise comply with the provisions of the Internal Revenue Code of 1986, as amended, applicable to regulated investment companies. Net investment income or loss and realized gains and losses for federal income tax purposes may differ from that reported on the financial statements because of temporary book and tax basis differences. Temporary differences are primarily the result of the treatment of wash sales for tax reporting purposes. The Fund recognizes interest and penalties related to income tax benefits, if any, in the statement of operations as an income tax expense. Distributions from net realized gains for book purposes may include short-term capital gains, which are included as ordinary income to shareholders for tax purposes. |
| | |
| | Due to inherent differences in the recognition of income, expenses, and realized gains/losses under GAAP and federal income tax regulations, permanent differences between book and tax basis reporting for the 2015 fiscal year have been identified |
| HENNESSY FUNDS | 1-800-966-4354 | |
| | and appropriately reclassified on the Statement of Assets and Liabilities. The adjustments are as follows: |
| Undistributed | Accumulated | |
| Net Investment | Net Realized | |
Income/(Loss) | Gain/(Loss) | Paid-in Capital |
| $108,036 | $(108,036) | $— |
| c). | Income and Expenses – Dividend income is recognized on the ex-dividend date or as soon as information is available to the Fund. Interest income, which includes the amortization of premium and accretion of discount, is recognized on an accrual basis. The Fund is charged for those expenses that are directly attributable to the portfolio, such as advisory, administration, and certain shareholder service fees. Income, expenses (other than expenses attributable to a specific class), and realized and unrealized gains or losses on investments are allocated to each class of shares based on its respective net assets. |
| | |
| d). | Distributions to Shareholders – Dividends from net investment income for the Fund, if any, are declared and paid annually, usually in December. Distributions of net realized capital gains, if any, are declared and paid annually, usually in December. |
| | |
| e). | Security Transactions – Investment and shareholder transactions are recorded on the trade date. The Fund determines the gain or loss realized from the investment transactions by comparing the original cost of the security lot sold with the net sale proceeds. Discounts and premiums on securities purchased are accreted/amortized over the life of the respective security. |
| | |
| f). | Use of Estimates – The preparation of financial statements in conformity with GAAP requires management to make estimates and assumptions that affect the reported amounts of assets and liabilities and disclosure of contingent assets and liabilities at the date of the financial statements and the reported change in net assets during the reporting period. Actual results could differ from those estimates. |
| | |
| g). | Share Valuation – The net asset value (“NAV”) per share of the Fund is calculated by dividing the sum of the value of the securities held by the Fund, plus cash or other assets, minus all liabilities (including estimated accrued expenses) by the total number of shares outstanding for the Fund, rounded to the nearest cent. The Fund’s shares will not be priced on days the New York Stock Exchange is closed for trading. The offering and redemption price per share for the Fund is equal to the Fund’s NAV per share. |
| | |
| h). | Foreign Currency – Values of investments denominated in foreign currencies, if any, are converted into U.S. dollars using the spot market rate of exchange at the time of valuation. Purchases and sales of investments and income are translated into U.S. dollars using the spot market rate of exchange prevailing on the respective dates of such transactions. The Fund does not isolate the portion of the results of operations resulting from fluctuations in foreign exchange rates on investments from fluctuations resulting from changes in the market prices of securities held. Such fluctuations are included with the net realized and unrealized gain or loss on investments. Foreign investments present additional risks due to currency fluctuations, economic and political factors, lower liquidity, government regulations, differences in accounting standards, and other factors. |
| | |
| i). | Forward Contracts – The Fund may enter into forward currency contracts to reduce its exposure to changes in foreign currency exchange rates on its foreign holdings and to lock in the U.S. dollar cost of firm purchase and sale commitments for securities denominated in foreign currencies. A forward currency contract is a |
| | commitment to purchase or sell a foreign currency at a future date at a negotiated forward rate. The gain or loss arising from the difference between the U.S. dollar cost of the original contract and the value of the foreign currency in U.S. dollars upon closing of such contract is included in net realized gain or loss from foreign currency transactions. During the fiscal year ended October 31, 2015, the Fund did not enter into any forward contracts. |
| | |
| j). | Repurchase Agreements – The Fund may enter into repurchase agreements with member banks or security dealers of the Federal Reserve Board whom the investment advisor deems creditworthy. The repurchase price generally equals the price paid by the Fund plus interest negotiated on the basis of current short-term rates. |
| | |
| | Securities pledged as collateral for repurchase agreements are held by the custodian bank until the respective agreements mature. Provisions of the repurchase agreements ensure that the market value of the collateral, including accrued interest thereon, is sufficient to cover the repurchase amount in the event of default of the counterparty. If the counterparty defaults and the value of the collateral declines or if the counterparty enters an insolvency proceeding, realization of the collateral by the Fund may be delayed or limited. |
| | |
| k). | Accounting for Uncertainty in Income Taxes – The Fund has accounting policies regarding recognition and measurement of tax positions taken or expected to be taken on a tax return. The tax returns of the Fund for the prior three fiscal years are open for examination. The Fund has reviewed all open tax years in major jurisdictions and concluded that there is no impact on the Fund’s net assets and no tax liability resulting from unrecognized tax benefits relating to uncertain income tax positions taken or expected to be taken on a tax return. The Fund’s major tax jurisdictions are U.S. federal and Delaware. |
| | |
| l). | Derivatives – The Fund may invest in, or enter into, derivatives, such as options, futures contracts, options on futures contracts, and swaps, for a variety of reasons, including to hedge certain risks, to provide a substitute for purchasing or selling particular securities, or to increase potential income gain. Derivatives may provide a cheaper, quicker, or more specifically focused way for a Fund to invest than “traditional” securities would. The main purpose of utilizing these derivative instruments is for hedging purposes. |
| | |
| | The Fund follows the financial accounting reporting rules as required by the Derivatives and Hedging Topic of the FASB Accounting Standards Codification. Under such rules, the Fund is required to include enhanced disclosure that enables investors to understand how and why an entity uses derivatives, how derivatives are accounted for, and how derivatives instruments affect an entity’s results of operations and financial position. During the fiscal year ended October 31, 2015, the Fund did not hold any derivative instruments. |
| | |
| m). | New Accounting Pronouncements – In June 2014, the FASB issued Accounting Standards Update (“ASU”) No. 2014-11 “Repurchase-to Maturity Transactions, Repurchase Financings, and Disclosures.” The amendments in this ASU require an entity to modify accounting for repurchase-to-maturity transactions and repurchase financing arrangements, as well as modify required disclosures for repurchase agreements, securities lending transactions, and repurchase-to-maturity transactions that are accounted for as secured borrowings. The guidance is effective for fiscal years beginning on or after December 15, 2014, and for interim periods within those fiscal years. Management is currently evaluating the impact these changes will have on the Fund’s financial statement disclosures. |
| HENNESSY FUNDS | 1-800-966-4354 | |
| | In May 2015, the FASB issued ASU No. 2015-07 “Disclosure for Investments in Certain Entities that Calculate Net Asset Value per Share (or Its Equivalent).” The amendments in ASU No. 2015-07 remove the requirement to categorize within the fair value hierarchy investments measured at NAV and require the disclosure of sufficient information to reconcile the fair value of the remaining assets categorized within the fair value hierarchy to the financial statements. The amendments in ASU No. 2015-07 are effective for fiscal years beginning after December 15, 2015, and interim periods within those fiscal years. Management has reviewed the requirements and believes the adoption of ASU 2015-07 will not have a material impact on the Fund’s financial statements and related disclosures. |
3). SECURITIES VALUATION
The Fund follows authoritative fair valuation accounting standards that establish an authoritative definition of fair value and set out a hierarchy for measuring fair value. These standards require additional disclosures about the various inputs and valuation techniques used to develop the measurements of fair value and a discussion in changes in valuation techniques and related inputs during the period. These inputs are summarized in the three broad levels listed below:
| | Level 1 – | Quoted unadjusted prices for identical instruments in active markets to which the Fund has access at the date of measurement. |
| | | |
| | Level 2 – | Quoted prices for similar instruments in active markets; quoted prices for identical or similar instruments in markets that are not active; and model-derived valuations in which all significant inputs and significant value drivers are observable in active markets. Level 2 inputs are those in markets for which there are few transactions, the prices are not current, the prices are fair value adjusted due to post-market close subsequent events (foreign markets), little public information exists, or instances where prices vary substantially over time or among brokered market makers. These inputs may also include interest rates, prepayment speeds, credit risk curves, default rates, and similar data. |
| | | |
| | Level 3 – | Model-derived valuations in which one or more significant inputs or significant value drivers are unobservable. Unobservable inputs are those inputs that reflect the Fund’s own assumptions about what market participants would use to price the asset or liability based on the best available information. |
Following is a description of the valuation techniques applied to the Fund’s major categories of assets and liabilities measured at fair value on a recurring basis.
Equity Securities – Equity securities, including common stocks, preferred stocks, foreign-issued common stocks, exchange-traded funds, closed-end mutual funds, partnerships, rights, and real estate investment trusts, that are traded on a securities exchange for which a last-quoted sales price is readily available will generally be valued at the last sales price as reported by the primary exchange on which the securities are listed. Securities listed on The NASDAQ Stock Market (“NASDAQ”) will generally be valued at the NASDAQ Official Closing Price, which may differ from the last sales price reported. Securities traded on a securities exchange for which a last-quoted sales price is not readily available will generally be valued at the mean between the bid and ask prices. To the extent these securities are actively traded and valuation adjustments are not applied, they are classified in Level 1 of the fair value hierarchy. Securities traded on foreign exchanges generally are not valued at the same time the Fund calculates its NAV because most
foreign markets close well before such time. The earlier close of most foreign markets gives rise to the possibility that significant events, including broad market moves, may have occurred in the interim. In certain circumstances, it may be determined that a security needs to be fair valued because it appears that the value of the security might have been materially affected by events occurring after the close of the market in which the security is principally traded, but before the time the Fund calculates its NAV, such as by a development that affects an entire market or region (e.g., weather-related events) or a potentially global development (e.g., a terrorist attack that may be expected to have an effect on investor expectations worldwide).
Registered Investment Companies – Investments in registered investment companies (e.g., mutual funds) are generally priced at the ending NAV provided by the applicable registered investment company’s service agent and will be classified in Level 1 of the fair value hierarchy.
Debt Securities – Debt securities, including corporate bonds, asset-backed securities, mortgage-backed securities, municipal bonds, U.S. Treasuries, and U.S. government agency issues, are generally valued at market on the basis of valuations furnished by an independent pricing service that utilizes both dealer-supplied valuations and formula-based techniques. The pricing service may consider recently executed transactions in securities of the issuer or comparable issuers, market price quotations (where observable), bond spreads, and fundamental data relating to the issuer. In addition, the model may incorporate market observable data such as reported sales of similar securities, broker quotes, yields, bids, offers, and reference data. Certain securities are valued principally using dealer quotations. These securities are generally classified in Level 2 of the fair value hierarchy.
Short-Term Securities – Short-term equity investments, including money market funds, are valued in the manner specified above. Short-term debt investments are generally valued at amortized cost, which approximates fair market value, if their original term to maturity was 60 days or less, or by amortizing the values as of the 61st day prior to maturity, if their original term to maturity exceeded 60 days. Amortized cost is not used if its use would be inappropriate due to credit or other impairments of the issuer, in which case the security’s fair value would be determined, as described below. Short-term securities are generally classified in Level 1 or Level 2 of the fair market hierarchy depending on the inputs used and market activity levels for specific securities.
The Board of Trustees of the Fund (the “Board”) has adopted fair value pricing procedures that are followed when a price for a security is not readily available or if a significant event has occurred that indicates the closing price of a security no longer represents the true value of that security. Fair value pricing determinations are made in good faith in accordance with these procedures. There are numerous criteria that will be given consideration in determining a fair value of a security. Some of these criteria are trading volume of a security and markets, the value of other like securities, and news events with direct bearing to a security or markets. Fair value pricing results in an estimated price for a security that reflects the amount the Fund might reasonably expect to receive in a current sale. Depending on the relative significance of the valuation inputs, these securities may be classified in either Level 2 or Level 3 of the fair value hierarchy.
The fair valuation of foreign securities may be determined with the assistance of a pricing service using correlations between the movement of prices of such securities and indices of domestic securities and other appropriate indicators, such as closing market prices of relevant American Depositary Receipts or futures contracts. The effect of using fair value pricing is that the Fund’s NAV will reflect the affected portfolio securities’ value
| HENNESSY FUNDS | 1-800-966-4354 | |
as determined in the judgment of the Board or its designee instead of being determined by the market. Using a fair value pricing methodology to price foreign securities may result in a value that is different from a foreign security’s most recent closing price and from the prices used by other investment companies to calculate their NAVs and are generally considered Level 2 prices in the fair valuation hierarchy. Because the Fund may invest in foreign securities, the value of the Fund’s portfolio securities may change on days when you will not be able to purchase or redeem your shares.
The Board has delegated day-to-day valuation matters to a Valuation Committee comprised of one or more representatives from Hennessy Advisors, Inc., the Fund’s investment advisor. The function of the Valuation Committee is to value securities where current and reliable market quotations are not readily available. All actions taken by the Valuation Committee are reviewed by the Board.
The Fund has performed an analysis of all existing investments to determine the significance and character of all inputs to their fair value determination. Various inputs are used in determining the value of the Fund’s investments. The inputs or methodology used for valuing securities are not necessarily an indication of the risk associated with investing in those securities. Details related to the fair valuation hierarchy of the Fund’s securities as of October 31, 2015 are included in the Fund’s Schedule of Investments.
4). INVESTMENT TRANSACTIONS
Purchases and sales of investment securities (excluding government and short-term investments) for the Fund during the fiscal year ended October 31, 2015 were $69,391,712 and $68,086,316, respectively.
There were no purchases or sales/maturities of long-term U.S. Government Securities for the Fund during the fiscal year ended October 31, 2015.
5). INVESTMENT MANAGEMENT FEE AND OTHER TRANSACTIONS WITH AFFILIATES
Hennessy Advisors, Inc. (the “Advisor”) is the investment advisor of the Fund. The Advisor provides the Fund with investment management services under an Investment Advisory Agreement. The Advisor furnishes all investment advice, office space, facilities, and provides most of the personnel needed by the Fund. As compensation for its services, the Advisor is entitled to a monthly fee from the Fund. The fee is based upon the average daily net assets of the Fund at the annual rate of 0.90%. The net investment advisory fees payable by the Fund as of October 31, 2015 were $72,120.
The Advisor contractually agreed to limit the total annual operating expenses of the Fund (excluding interest, taxes, brokerage commissions, dividend expenses, acquired fund fees and expenses, extraordinary legal expenses, or any other extraordinary expenses and, from and after November 1, 2014, 12b-1 fees) to 1.95% of the Fund’s net assets for the Investor Class shares through February 28, 2015. The expense limitation agreement for the Fund is no longer in effect.
For a period of three years after the year in which the Advisor waived or reimbursed expenses, the Advisor may seek reimbursement from the Fund to the extent that total annual fund operating expenses are less than the expense limitation that was in effect at the time the Advisor waived or reimbursed expenses. During the three years ended October 31, 2015, no expenses were waived or reimbursed by the Advisor and therefore no expenses are subject to potential recovery.
The Board has approved a Shareholder Servicing Agreement for the Investor Class shares of the Fund, effective as of February 28, 2015, which was instituted to compensate the Advisor for the non-investment management services it provides to the Fund. The
Shareholder Servicing Agreement provides for a monthly fee paid to the Advisor at an annual rate of 0.10% of the average daily net assets of the Fund attributable to Investor Class shares. Shareholder service fees payable by the Fund as of October 31, 2015 were $7,989.
The Fund has adopted a plan pursuant to Rule 12b-1 under the Investment Company Act of 1940, as amended, that authorizes payments in connection with the distribution of the Fund’s shares at an annual rate of up to 0.25% of the Fund’s average daily net assets attributable to Investor Class shares, although the Fund has only been using up to 0.15% of its average daily net assets attributable to Investor Class shares for such purpose since March 1, 2015. Amounts paid under the plan may be spent on any activities or expenses primarily intended to result in the sale of shares, including but not limited to, advertising, shareholder account servicing, the printing and mailing of prospectuses to other than current shareholders, the printing and mailing of sales literature, and compensation for sales and marketing activities or to financial institutions and others, such as dealers and distributors.
The Fund has entered into agreements with various brokers, dealers, and financial intermediaries in connection with the sale of shares of the Fund. The agreements provide for periodic payments by the Fund to the brokers, dealers, and financial intermediaries for providing certain shareholder maintenance services (sub-transfer agent expenses). These shareholder services include the pre-processing and quality control of new accounts, shareholder correspondence, answering customer inquiries regarding account status, and facilitating shareholder telephone transactions. Fees paid by the Fund to various brokers, dealers, and financial intermediaries during the fiscal year ended October 31, 2015 were $193,145.
U.S. Bancorp Fund Services, LLC (“USBFS”) provides the Fund with administrative, fund accounting, and transfer agent services, including all regulatory reporting, and necessary office equipment and personnel. As administrator, USBFS is responsible for activities such as (i) preparing various federal and state regulatory filings, reports, and returns for the Fund, (ii) preparing reports and materials to be supplied to the Board, (iii) monitoring the activities of the Fund’s custodian, transfer agent, and accountants, and (iv) coordinating the preparation and payment of the Fund’s expenses and reviewing the Fund’s expense accruals. Fees paid to USBFS during the fiscal year ended October 31, 2015 were $93,699.
U.S. Bank, N.A., an affiliate of USBFS, serves as the Fund’s custodian. Quasar Distributors, LLC acts as the Fund’s principal underwriter in a continuous public offering of the Fund’s shares. Quasar Distributors, LLC is an affiliate of USBFS and U.S. Bank, N.A.
6). LINE OF CREDIT
The Fund has an uncommitted line of credit with the other funds in the Hennessy Funds family of funds (the “Hennessy Funds”) in the amount of the lesser of (i) $100,000,000 or (ii) 33.33% of each Hennessy Fund’s net assets, or 30% for the Hennessy Gas Utility Fund and 10% for the Hennessy Balanced Fund, intended to provide short-term financing, if necessary, subject to certain restrictions, in connection with shareholder redemptions. The credit facility is with the Hennessy Funds’ custodian bank, U.S. Bank, N.A. Borrowings under this arrangement bear interest at the bank’s prime rate and are secured by all of the Fund’s assets (as to its own borrowings only). During the fiscal year ended October 31, 2015, the Fund had an outstanding average daily balance and a weighted average interest rate of $86,578 and 3.25%, respectively. The maximum amount outstanding for the Fund during the period was $3,893,000. At October 31, 2015, the Fund did not have any borrowings outstanding under the line of credit.
| HENNESSY FUNDS | 1-800-966-4354 | |
7). FEDERAL TAX INFORMATION
As of October 31, 2015, the components of accumulated earnings (losses) for income tax purposes were as follows:
| Cost of investments for tax purposes | | $ | 96,665,852 | |
| Gross tax unrealized appreciation | | $ | 7,731,086 | |
| Gross tax unrealized depreciation | | | (2,538,279 | ) |
| Net tax unrealized appreciation | | $ | 5,192,807 | |
| Undistributed ordinary income | | $ | 135,883 | |
| Undistributed long-term capital gains | | | 9,715,029 | |
| Total distributable earnings | | $ | 9,850,912 | |
| Other accumulated gain | | $ | — | |
| Total accumulated gain | | $ | 15,043,719 | |
The difference between book-basis and tax-basis unrealized appreciation is attributable primarily to wash sales and partnership adjustments.
At October 31, 2015, the Fund had no tax basis capital losses to offset future capital gains.
At October 31, 2015, the Fund did not defer, on a tax basis, any late year ordinary losses.
The tax character of distributions paid during fiscal year 2015 and fiscal year 2014 for the Fund were as follows:
| | | Year Ended | | | Year Ended | |
| | | October 31, 2015 | | | October 31, 2014 | |
| Ordinary income | | $ | 485,376 | | | $ | — | |
| Long-term capital gain | | | 9,468,170 | | | | 2,696,057 | |
| | | $ | 9,953,546 | | | $ | 2,696,057 | |
8). EVENTS SUBSEQUENT TO YEAR END
Management has evaluated the Fund’s related events and transactions that occurred subsequent to October 31, 2015, through the date of issuance of the Fund’s financial statements. Other than as disclosed below, management has determined that there were no subsequent events requiring recognition or disclosure in the financial statements.
On December 9, 2015, capital gains were declared and paid to shareholders of record as of December 8, 2015 as follows:
| | Long-term | |
| Investor Class | $1.69087 | |
| Institutional Class | $1.69707 | |
Report of Independent Registered Public Accounting Firm
To the Board of Trustees of Hennessy Funds Trust
And the Shareholders of the Hennessy Large Cap Financial Fund
Novato, CA
We have audited the accompanying statement of assets and liabilities, including the schedule of investments, of the Hennessy Large Cap Financial Fund (the “Fund”), a series of Hennessy Funds Trust (the “Trust”), as of October 31, 2015, and the related statement of operations for the year then ended, the statements of changes in net assets for each of the two years in the period then ended, and the financial highlights for each of the five years in the period then ended. These financial statements and financial highlights are the responsibility of the Fund’s management. Our responsibility is to express an opinion on these financial statements and financial highlights based on our audits.
We conducted our audits in accordance with the standards of the Public Company Accounting Oversight Board (United States). Those standards require that we plan and perform the audits to obtain reasonable assurance about whether the financial statements and financial highlights are free of material misstatement. The Fund is not required to have, nor were we engaged to perform, an audit of its internal control over financial reporting. Our audits included consideration of internal control over financial reporting as a basis for designing audit procedures that are appropriate in the circumstances, but not for the purposes of expressing an opinion on the effectiveness of the Fund’s internal control over financial reporting. Accordingly, we express no such opinion. An audit includes examining, on a test basis, evidence supporting the amounts and disclosures in the financial statements. Our procedures included confirmation of securities owned as of October 31, 2015, by correspondence with the custodian and brokers. An audit also includes assessing the accounting principles used and significant estimates made by management, as well as evaluating the overall financial statement presentation. We believe that our audits provide a reasonable basis for our opinion.
In our opinion, the financial statements and financial highlights referred to above present fairly, in all material respects, the financial position of the Hennessy Large Cap Financial Fund as of October 31, 2015, the results of its operations for the year then ended, the changes in its net assets for each of the two years in the period then ended, and the financial highlights for each of the five years in the period then ended, in conformity with accounting principles generally accepted in the United States of America.
Philadelphia, Pennsylvania
December 21, 2015
| HENNESSY FUNDS | 1-800-966-4354 | |
Trustees and Officers of the Fund (Unaudited)
The business and affairs of the Fund are managed under the direction of the Board of Trustees of the Trust, and the Board of Trustees elects the Officers of the Trust. Information pertaining to the Trustees and the Officers of the Trust is set forth below. Such persons serve until their successors are duly elected and qualified or until their earlier death, resignation, or removal. Each of the Trustees oversees 16 Hennessy Funds. Unless otherwise indicated, the address of all persons listed below is 7250 Redwood Boulevard, Suite 200, Novato, CA 94945. The Fund’s Statement of Additional Information includes more information about the persons listed below and is available, without charge, upon request by calling 1-800-966-4354.
| | | | Other |
| | | | Directorships |
| Name, Year of Birth, | | | (During Past |
| and Position Held | Length of | Principal Occupation(s) | Five Years) |
with the Trust | Time Served | During Past Five Years | Held by Trustee(1) |
| | | | |
| Disinterested Trustees | | | |
| | | | |
| J. Dennis DeSousa (1936) | Since January | Mr. DeSousa is a real estate investor. | Hennessy SPARX |
| Trustee | 1996 for the | | Funds Trust; |
| | Hennessy Funds | | Hennessy Mutual |
| | | | Funds, Inc.; and |
| | | | The Hennessy |
| | | | Funds, Inc. |
| | | | |
| Robert T. Doyle (1947) | Since January | Mr. Doyle has been the Sheriff of | Hennessy SPARX |
| Trustee | 1996 for the | Marin County, California since 1996. | Funds Trust; |
| | Hennessy Funds | | Hennessy Mutual |
| | | | Funds, Inc.; and |
| | | | The Hennessy |
| | | | Funds, Inc. |
| | | | |
| Gerald P. Richardson (1945) | Since May | Mr. Richardson is an independent | Hennessy SPARX |
| Trustee | 2004 for the | consultant in the securities industry. | Funds Trust; |
| | Hennessy Funds | | Hennessy Mutual |
| | | | Funds, Inc.; and |
| | | | The Hennessy |
| | | | Funds, Inc. |
| | | | |
Interested Trustee(2) | | | |
| | | | |
| Neil J. Hennessy (1956) | Since January | Mr. Hennessy has been employed by | Hennessy Advisors, |
| Trustee, Chairman of | 1996 as a Trustee | Hennessy Advisors, Inc., the Funds’ | Inc.; Hennessy |
| the Board, Chief | for the Hennessy | investment advisor, since 1989. | SPARX Funds Trust; |
| Investment Officer, | Funds and since | He currently serves as President, | Hennessy Mutual |
| Portfolio Manager, | June 2008 as | Chairman and Chief Executive Officer | Funds, Inc.; and |
| and President | an Officer of the | of Hennessy Advisors, Inc. | The Hennessy |
| | Hennessy Funds | | Funds, Inc. |
| Name, Year of Birth, | | |
| and Position Held | Length of | Principal Occupation(s) |
with the Trust | Time Served | During Past Five Years |
| | | |
| Officers | | |
| | | |
| Teresa M. Nilsen (1966) | Since January | Ms. Nilsen has been employed by Hennessy Advisors, Inc., |
| Executive Vice President | 1996 for the | the Funds’ investment advisor, since 1989. She currently |
| and Treasurer | Hennessy Funds | serves as Executive Vice President, Chief Operations Officer, |
| | | Chief Financial Officer, and Secretary of Hennessy Advisors, Inc. |
| | | |
| Daniel B. Steadman (1956) | Since March | Mr. Steadman has been employed by Hennessy Advisors, Inc., |
| Executive Vice President | 2000 for the | the Funds’ investment advisor, since 2000. He currently serves |
| and Secretary | Hennessy Funds | as Executive Vice President and Chief Compliance Officer of |
| | | Hennessy Advisors, Inc. |
| | | |
| Jennifer Cheskiewicz (1977) | Since June | Ms. Cheskiewicz has been employed by Hennessy Advisors, |
| Senior Vice President and | 2013 for the | Inc., the Funds’ investment advisor, since June 2013. She |
| Chief Compliance Officer | Hennessy Funds | currently serves as General Counsel of Hennessy Advisors, Inc. |
| | | |
| | | She previously served as in-house counsel to Carlson Capital, |
| | | L.P., an SEC-registered investment advisor to several private |
| | | funds from February 2010 to May 2013. |
| | | |
| Brian Carlson (1972) | Since December | Mr. Carlson has been employed by Hennessy Advisors, Inc., the |
| Senior Vice President and | 2013 for the | Funds’ investment advisor, since December 2013. |
| Head of Distribution | Hennessy Funds | |
| | | Mr. Carlson was previously a co-founder and principal of |
| | | Trivium Consultants, LLC from February 2011 through |
| | | November 2013. |
| | | |
David Ellison (1958)(3) | Since October | Mr. Ellison has served as a Portfolio Manager of the Hennessy |
| Senior Vice President and | 2012 for the | Small Cap Financial Fund, the Hennessy Large Cap Financial |
| Portfolio Manager | Hennessy Funds | Fund, and the Hennessy Technology Fund since inception. |
| | | |
| | | Mr. Ellison previously served as Director, CIO and President of |
| | | FBR Fund Advisers, Inc. from December 1999 to October 2012. |
| | | |
| Brian Peery (1969) | Since March | Mr. Peery has served as a Portfolio Manager of the Hennessy |
| Senior Vice President and | 2003 as an | Cornerstone Growth Fund, the Hennessy Cornerstone Mid Cap |
| Portfolio Manager | Officer of the | 30 Fund, the Hennessy Cornerstone Large Growth Fund, the |
| | Hennessy Funds | Hennessy Cornerstone Value Fund, the Hennessy Total Return |
| | and since | Fund, and the Hennessy Balanced Fund since October 2014. |
| | February 2011 | From February 2011 through September 2014, he served as |
| | as a Co-Portfolio | Co-Portfolio Manager of the same funds. Mr. Peery has also |
| | Manager or | served as a Portfolio Manager of the Hennessy Gas Utility Fund |
| | Portfolio Manager | since February 2015. |
| | for the | |
| | Hennessy Funds | Mr. Peery has been employed by Hennessy Advisors, Inc., the |
| | | Funds’ investment advisor, since 2002. |
| | | |
| Winsor (Skip) Aylesworth | Since October | Mr. Aylesworth has served as a Portfolio Manager of the |
(1947)(3) | 2012 for the | Hennessy Gas Utility Fund since 1998 and as a Portfolio |
| Vice President and | Hennessy Funds | Manager of the Hennessy Technology Fund since inception. |
| Portfolio Manager | | |
| | | Mr. Aylesworth previously served as Executive Vice President |
| | | of The FBR Funds from 1999 to October 2012. |
| HENNESSY FUNDS | 1-800-966-4354 | |
| Name, Year of Birth, | | |
| and Position Held | Length of | Principal Occupation(s) |
with the Trust | Time Served | During Past Five Years |
| | | |
Ryan Kelley (1972)(4) | Since March | Mr. Kelley has served as a Portfolio Manager of the Hennessy |
| Vice President and | 2013 for the | Gas Utility Fund, the Hennessy Small Cap Financial Fund, and |
| Portfolio Manager | Hennessy Funds | the Hennessy Large Cap Financial Fund since October 2014. |
| | | From March 2013 through September 2014, he served as a |
| | | Co-Portfolio Manager of the same funds. Prior to that, |
| | | he was a Portfolio Analyst of the Hennessy Funds. |
(1) | Pursuant to an internal reorganization, the series of Hennessy Mutual Funds, Inc. (“HMFI”), The Hennessy Funds, Inc. (“HFI”), and Hennessy SPARX Funds Trust (“HSFT”) were reorganized into series of Hennessy Funds Trust on February 28, 2014, which mirrored the corresponding series of HFMI, HFI, and HSFT. Subsequent to the reorganization, HFMI, HFI, and HSFT were dissolved. |
(2) | Mr. Hennessy is considered an “interested person,” as defined in the Investment Company Act of 1940, as amended, because he is an officer of the Hennessy Funds. |
(3) | The address of these officers is 101 Federal Street, Suite 1900, Boston, MA 02110. |
(4) | The address of this officer is 1340 Environ Way, Chapel Hill, NC 27517. |
(This Page Intentionally Left Blank.)-
| HENNESSY FUNDS | 1-800-966-4354 | |
Expense Example (Unaudited)
October 31, 2015
As a shareholder of the Fund, you incur two types of costs: (1) transaction costs, including sales charges (loads) on purchase payments, reinvested dividends, or other distributions; redemption fees; and exchange fees; and (2) ongoing costs, including management fees; service fees; and other Fund expenses. This Example is intended to help you understand your ongoing costs (in dollars) of investing in the Fund and to compare these costs with the ongoing costs of investing in other mutual funds. The Example is based on an investment of $1,000 invested at the beginning of the period and held for the entire period from May 1, 2015 through October 31, 2015.
Actual Expenses
The first line of the table below under the “Investor Class” and “Institutional Class” headings provides information about actual account values and actual expenses. Although the Fund charges no sales loads or transaction fees, you will be assessed fees for outgoing wire transfers, returned checks and stop payment orders at prevailing rates charged by U.S. Bancorp Fund Services, LLC, the Fund’s transfer agent. If you request that a redemption be made by wire transfer, currently a $15.00 fee is charged by the Fund’s transfer agent. IRA accounts will be charged a $15.00 annual maintenance fee. The example below includes, but is not limited to, management fees, shareholder servicing fees, fund accounting, custody, and transfer agent fees. However, the example below does not include portfolio trading commissions and related expenses, and other extraordinary expenses as determined under generally accepted accounting principles. You may use the information in this line, together with the amount you invested, to estimate the expenses that you paid over the period. Simply divide your account value by $1,000 (for example, an $8,600 account value divided by $1,000 = 8.6), then multiply the result by the number in the first line of the table under the “Investor Class” and “Institutional Class” headings in the column entitled “Expenses Paid During Period” to estimate the expenses you paid on your account during this period.
Hypothetical Example for Comparison Purposes
The second line of the table below under the “Investor Class” and “Institutional Class” headings provides information about hypothetical account values and hypothetical expenses based on the Fund’s actual expense ratios and an assumed rate of return of 5% per year before expenses, which is not the Fund’s actual return. The hypothetical account values and expenses may not be used to estimate the actual ending account balance or expenses you paid for the period. You may use this information to compare the ongoing costs of investing in the Fund and other funds. To do so, compare this 5% hypothetical example with the 5% hypothetical examples that appear in the shareholder reports of the other funds. Please note that the expenses shown in the table are meant to highlight your ongoing costs only and do not reflect any transactional costs, such as sales charges (loads), or exchange fees. Therefore, the second line of the table under the “Investor Class” and “Institutional Class” headings is useful in comparing ongoing costs only, and will not help you determine the relative total costs of owning different funds. In addition, if these transactional costs were included, your costs would have been higher.
| | | | Expenses Paid |
| | Beginning | Ending | During Period(1) |
| | Account Value | Account Value | May 1, 2015 – |
| | May 1, 2015 | October 31, 2015 | October 31, 2015 |
| Investor Class | | | |
| Actual | $1,000.00 | $ 967.80 | $8.08 |
| Hypothetical (5% return before expenses) | $1,000.00 | $1,016.99 | $8.29 |
| Institutional Class | | | |
| Actual | $1,000.00 | $ 932.60 | $5.85 |
| Hypothetical (5% return before expenses) | $1,000.00 | $1,019.16 | $6.11 |
(1) | Expenses are equal to the Fund’s annualized expense ratio of 1.63% for Investor Class shares or 1.20% for Institutional Class shares, as applicable, multiplied by the average account value over the period, multiplied by 184/365 days (to reflect one-half year period). |
| HENNESSY FUNDS | 1-800-966-4354 | |
How to Obtain a Copy of the Fund’s
Proxy Voting Policy and Proxy Voting Records
A description of the policies and procedures the Fund uses to determine how to vote proxies relating to portfolio securities is available without charge: (1) by calling 1-800-966-4354; (2) on the Hennessy Funds’ website at hennessyfunds.com/proxy-voting/policy.fs; or (3) on the U.S. Securities and Exchange Commission’s website at www.sec.gov. The Fund’s proxy voting record is available without charge on both the Hennessy Funds’ website at hennessyfunds.com/proxy-voting/policy.fs and the SEC’s website at www.sec.gov no later than August 31 for the prior 12 months ending June 30.
Quarterly Filings on Form N-Q
The Fund files its complete schedule of portfolio holdings with the SEC for the first and third quarters of each fiscal year on Form N-Q. The Fund’s Form N-Q will be available on the SEC’s website at www.sec.gov. The Fund’s Form N-Q may be reviewed and copied at the SEC’s Public Reference Room in Washington, DC and information on the operation of the Public Reference Room may be obtained by calling 1-800-SEC-0330. Information included in the Fund’s N-Q will also be available upon request by calling 1-800-966-4354.
Federal Tax Distribution Information
(Unaudited)
For the fiscal year ended October 31, 2015, certain dividends paid by the Fund may be subject to a maximum tax rate of 23.8%, as provided for by the Jobs and Growth Tax Relief Reconciliation Act of 2003. The percentage of dividends declared from ordinary income designated as qualified dividend income was 100.00%.
For corporate shareholders, the percent of ordinary income distributions that qualified for the corporate dividends received deduction for the fiscal year ended October 31, 2015 was 100.00%.
The percentage of taxable ordinary income distributions that are designated as short-term capital gain distributions under Section 871(k)(2)(C) of the Internal Revenue Code of 1986, as amended, for the Fund was 100.00%.
Householding
To help keep the Fund’s costs as low as possible, we generally deliver a single copy of most financial reports and prospectuses to shareholders who share an address, even if the accounts are registered under different names. This process, known as “householding,” does not apply to account statements. You may, of course, request an individual copy of a prospectus or financial report at any time. If you would like to receive separate mailings, please call the Administrator at 1-800-261-6950 or 1-414-765-4124 and we will begin individual delivery within 30 days of your request. If your account is held through a financial institution or other intermediary, please contact them directly to request individual delivery.
Privacy Policy
We collect the following non-public personal information about you:
| | • | information we receive from you on or in applications or other forms, correspondence, or conversations, including, but not limited to, your name, address, phone number, social security number, assets, income, and date of birth; and |
| | • | information about your transactions with us, our affiliates, or others, including, but not limited to, your account number and balance, payment history, parties to transactions, cost basis information, and other financial information. |
We do not disclose any non-public personal information about our current or former shareholders to nonaffiliated third parties, except as permitted by law. For example, we are permitted by law to disclose all of the information we collect, as described above, to our Transfer Agent to process your transactions. Furthermore, we restrict access to your non-public personal information to those persons who require such information to provide products or services to you. We maintain physical, electronic, and procedural safeguards that comply with federal standards to guard your non-public personal information.
In the event that you hold shares of the Fund through a financial intermediary, including, but not limited to, a broker-dealer, bank or trust company, the privacy policy of your financial intermediary would govern how your non-public personal information would be shared with nonaffiliated third parties.
| HENNESSY FUNDS | 1-800-966-4354 | |
For information, questions or assistance, please call
The Hennessy Funds
1-800-966-4354 or 1-415-899-1555
INVESTMENT ADVISOR
Hennessy Advisors, Inc.
7250 Redwood Blvd., Suite 200
Novato, California 94945
ADMINISTRATOR,
TRANSFER AGENT,
DIVIDEND PAYING AGENT &
SHAREHOLDER SERVICING AGENT
U.S. Bancorp Fund Services, LLC
P.O. Box 701
Milwaukee, Wisconsin 53201-0701
CUSTODIAN
U.S. Bank N.A.
Custody Operations
1555 North River Center Dr., Suite 302
Milwaukee, Wisconsin 53212
TRUSTEES
Neil J. Hennessy
Robert T. Doyle
J. Dennis DeSousa
Gerald P. Richardson
COUNSEL
Foley & Lardner LLP
777 East Wisconsin Avenue
Milwaukee, Wisconsin 53202-5306
INDEPENDENT REGISTERED
PUBLIC ACCOUNTING FIRM
Tait, Weller & Baker LLP
1818 Market Street, Suite 2400
Philadelphia, Pennsylvania 19103
DISTRIBUTOR
Quasar Distributors, LLC
615 East Michigan Street
Milwaukee, Wisconsin 53202
hennessyfunds.com | 1-800-966-4354
This report has been prepared for shareholders and may be distributed to
others only if preceded or accompanied by a current prospectus.
ANNUAL REPORT
OCTOBER 31, 2015
HENNESSY TECHNOLOGY FUND
Investor Class HTECX
Institutional Class HTCIX
hennessyfunds.com | 1-800-966-4354
(This Page Intentionally Left Blank.)
Contents
| Letter to Shareholders | 2 |
| Performance Overview | 4 |
| Financial Statements | |
| Schedule of Investments | 7 |
| Statement of Assets and Liabilities | 11 |
| Statement of Operations | 12 |
| Statements of Changes in Net Assets | 13 |
| Financial Highlights | 14 |
| Notes to the Financial Statements | 18 |
| Report of Independent Registered Public Accounting Firm | 26 |
| Trustees and Officers of the Fund | 27 |
| Expense Example | 30 |
| Proxy Voting | 32 |
| Quarterly Filings on Form N-Q | 32 |
| Householding | 32 |
| Privacy Policy | 33 |
| HENNESSY FUNDS | 1-800-966-4354 | |
December 2015
Dear Hennessy Funds Shareholder:
As I look back over the year, I am reminded that the U.S. economy has come a long way since the depths of the recession in 2009. The economy has been expanding steadily for almost six years, the unemployment rate has halved, the housing market has been recovering and capital expenditures have been growing. The financial markets have performed well too, driven largely by strong corporate earnings growth, especially in the early years. The U.S. market, as measured by the S&P 500 Index, has roughly tripled since the bull market began in 2009, and the Index’s earnings per share have increased 260% over this same time period. For the year ended October 31, 2015, the U.S. equity market performed reasonably well, with the S&P 500 posting another advance of 5.2%. However, behind this headline number, the market experienced a great deal of volatility as investors reacted to falling energy prices, a rise in the U.S. Dollar, pressure on export earnings growth, slower growth in China and, most significantly, the likelihood of a rise in the Fed Funds rate for the first time in nearly a decade – the featured topic of conversation around every office water cooler in the financial world this year.
Investors, reporters and friends often ask me “What’s next?” The market has been in a volatile, sideways correction for over a year now, and throughout this period of volatility, I have consistently advised investors to continue to focus on the long-term fundamentals of the market.
In my view, the fundamentals of the market are in good shape. Despite a stronger U.S. Dollar and its impact on export growth, the economy is still growing steadily. Inflation remains low, so we expect the Federal Reserve, once it does begin to raise short-term interest rates, will not likely raise them by very much. New jobs are being created at what I believe is a healthy rate, and average hourly wages are rising in response to a tighter labor market. Higher wages and lower gasoline prices are helping to keep consumer confidence positive.
Notwithstanding what I view as a relatively solid economic environment, however, I think investor sentiment remains restrained. The same factors that contributed to the market volatility this past year are still troubling investors today: the slowdown in the Chinese economy, slower earnings growth here in the U.S., and, of course, the prospect of rising interest rates. As a result of these investor worries, I do not see any solid enthusiasm for the market – no euphoria. Universal optimism about the market often coincides with a peak in stock prices and this absence of euphoria is yet another reason I feel bullish. And finally, I do not believe stocks are expensive. The Dow Jones Industrial Average and the S&P 500 Index have forward PE (price-to-earnings) ratios of approximately 16x and 17x, respectively, close to long-term averages. In my view, these fundamentals taken together signal a continuation of the bull market that began six years ago.
A final positive note: I still do not believe that investors have fully returned to investing in U.S. equities. Assets in domestic equity funds have now reached parity with fixed income/money market funds, with $6.2 trillion in each. I believe that fixed income investments will continue to trickle into equities, which should have a positive effect on the market.
Thank you for your continued confidence and investment in our products. If you have any questions or would like to speak with us directly, please don’t hesitate to call us at (800) 966-4354.
Best regards,
Neil J. Hennessy
President and Chief Investment Officer
Past performance does not guarantee future results.
Mutual fund investing involves risk. Principal loss is possible.
Opinions expressed are those of Neil Hennessy and are subject to change, are not guaranteed and should not be considered investment advice.
The Dow Jones Industrial Average and the S&P 500 Index are unmanaged indices commonly used to measure the performance of U.S. stocks. One cannot invest directly in an index.
Price to earnings (“PE”) is the market price per share divided by earnings per share. Earnings per share is the portion of a company’s profit allocated to each outstanding share of common stock. It serves as an indicator of a company’s profitability.
| HENNESSY FUNDS | 1-800-966-4354 | |
Performance Overview (Unaudited)
CHANGE IN VALUE OF $10,000 INVESTMENT
This graph illustrates the performance of an initial investment of $10,000 made in the Fund ten years ago and assumes the reinvestment of dividends.
AVERAGE ANNUAL TOTAL RETURN FOR PERIODS ENDED OCTOBER 31, 2015
| | One | Five | Ten |
| | Year | Years | Years |
| Hennessy Technology Fund – | | | |
| Investor Class (HTECX) | 3.36% | 6.91% | 5.49% |
| Hennessy Technology Fund – | | | |
Institutional Class (HTCIX)(1) | 3.73% | 7.21% | 5.64% |
| NASDAQ Composite Index | 10.39% | 16.49% | 10.29% |
| S&P 500 Index | 5.20% | 14.33% | 7.85% |
Expense ratios: 3.03% (Investor Class); 2.66% (Institutional Class)
Performance data quoted represents past performance; past performance does not guarantee future results. The investment return and principal value of an investment will fluctuate so that an investor’s shares, when redeemed, may be worth more or less than their original cost. The performance graph and table do not reflect the deduction of taxes that a shareholder would pay on Fund distributions or the redemption of Fund shares. Current performance of the Fund may be lower or higher than the performance quoted. Performance data current to the most recent month end may be obtained by visiting hennessyfunds.com. Performance for periods prior to October 26, 2012 is that of the FBR Technology Fund.
The expense ratios presented are from the most recent prospectus.
(1) | The inception date of Institutional Class shares is March 12, 2010. Performance shown prior to the inception of Institutional Class shares reflects the performance of Investor Class shares and includes expenses that are not applicable to and are higher than those of Institutional Class shares. |
PERFORMANCE NARRATIVE
Portfolio Managers Winsor H. (Skip) Aylesworth and David H. Ellison
Performance:
For the twelve-month period ended October 31, 2015, the Investor Class of the Hennessy Technology Fund returned 3.36%, underperforming the NASDAQ Composite Index and the S&P 500 Index, which returned 10.39% and 5.20% for the same period, respectively.
Sector allocation accounted for most of the Fund’s underperformance over the year versus its primary benchmark. Computer systems and software applications were the sectors that detracted the most from the Fund’s relative performance. Internet companies devoted to online retail and search contributed most to relative performance.
One of the Fund’s top performers was Amazon.com, Inc., which was up over 100% for the twelve-month period. Now the world’s largest online retailer, Amazon experienced an acceleration in sales and profit growth and a swing to profitability after several quarters of losses. Although about 20% of the Fund’s assets are in Healthcare related companies, only Regeneron Pharmaceuticals, with approximately 36% appreciation for the period, had a significant positive impact on Fund performance. The Fund continues to hold both companies.
The Fund’s exposure to social media had a mixed effect on the Fund’s performance over the period. Facebook, Inc. performed well, with its shares rising about 56% over the year, while Twitter, Inc. (U.S.) performed poorly, posting a significant negative return (-51%). The Fund’s investments in semiconductor companies Qualcomm, Inc. and Micron Technology, Inc. were significant detractors to performance. The Fund continues to hold Facebook and Twitter, but no longer holds positions in Qualcomm or Micron.
Portfolio Strategy:
The Fund’s investment strategy is based on identifying Technology related stocks with a history of growing revenue, profit and tangible book value. We focus on companies that we believe have strong business models and sustainable competitive advantages, difficult characteristics to find sometimes in an industry where innovation moves so quickly. We believe the Fund’s holdings are representative of the Technology sector as a whole, but also meet our goal of offering a conservative way to invest in a highly volatile area of the market.
Investment Outlook:
Notwithstanding the modest rise in the market for the twelve-month period, the year was marked by a great deal of volatility, especially during the second half of the period when uncertainty regarding the timing and magnitude of a rise in short-term interest rates being contemplated by the Federal Reserve dominated investor thinking. In the end, however, confidence in continued economic growth was strong enough to offset investor concerns, with the market staging a dramatic rally in October, the final month of the Fund’s fiscal year. We believe the fundamentals of the market are attractive, and we continue to be optimistic about the possibility of further market advances over the course of the next year.
Opinions expressed are those of the Portfolio Managers as of the date written and are subject to change, are not guaranteed, and should not be considered investment advice or an indication of trading intent.
The NASDAQ Composite Index is a broad-based capitalization-weighted index of all the NASDAQ National Market and Small Cap stocks. The S&P 500 Index is an unmanaged index commonly used to measure the performance of U.S. stocks. One cannot invest directly in an index.
The Fund is non-diversified, meaning it may concentrate its assets in fewer individual holdings than a diversified fund, making it more exposed to individual stock volatility than a diversified fund. Investments are focused in the technology industry; sector funds may be subject to a higher degree of market risk. Investments in foreign securities may involve political, economic and currency risks, greater volatility and differences in accounting methods. The Fund invests in small and medium sized companies, which may have more limited liquidity and greater volatility compared to larger companies.
| HENNESSY FUNDS | 1-800-966-4354 | |
References to specific securities should not be considered a recommendation to buy or sell any security. Fund holdings and sector allocations are subject to change. Please refer to the Schedule of Investments included in this report for additional portfolio information.
Tangible book value is a method of valuing a company by measuring its equity after removing any intangible assets.
Financial Statements
Schedule of Investments as of October 31, 2015 |
HENNESSY TECHNOLOGY FUND
(% of Net Assets)
| TOP TEN HOLDINGS (EXCLUDING CASH/CASH EQUIVALENTS) | % NET ASSETS |
| Alibaba Group Holding Ltd. | 3.94% |
| Microsoft Corp. | 3.80% |
| Alphabet, Inc. | 3.79% |
| Facebook, Inc. | 3.71% |
| Visa, Inc., Class A | 3.71% |
| Apple, Inc. | 3.62% |
| Amazon.com, Inc. | 3.59% |
| Intel Corp. | 3.48% |
| Tencent Holdings Ltd. | 3.46% |
| Gilead Sciences, Inc. | 3.46% |
Note: For presentation purposes, the Fund has grouped some of the industry categories. For purposes of categorizing securities for compliance with section 8(b)(1) of the Investment Company Act of 1940, as amended, the Fund uses more specific industry classifications.
| HENNESSY FUNDS | 1-800-966-4354 | |
| COMMON STOCKS – 92.26% | | Number | | | | | | % of | |
| | | of Shares | | | Value | | | Net Assets | |
| Consumer Discretionary – 7.13% | | | | | | | | | |
| Amazon.com, Inc. (a) | | | 286 | | | $ | 179,007 | | | | 3.59 | % |
| Johnson Controls, Inc. | | | 970 | | | | 43,825 | | | | 0.88 | % |
| Netflix, Inc. (a) | | | 460 | | | | 49,855 | | | | 1.00 | % |
| priceline.com, Inc. (a) | | | 57 | | | | 82,892 | | | | 1.66 | % |
| | | | | | | | 355,579 | | | | 7.13 | % |
| | | | | | | | | | | | | |
| Health Care – 18.14% | | | | | | | | | | | | |
| Alexion Pharmaceuticals, Inc. (a) | | | 292 | | | | 51,392 | | | | 1.03 | % |
| Amgen, Inc. | | | 864 | | | | 136,668 | | | | 2.74 | % |
| Biogen, Inc. (a) | | | 265 | | | | 76,985 | | | | 1.54 | % |
| Celgene Corp. (a) | | | 904 | | | | 110,930 | | | | 2.23 | % |
| DexCom, Inc. (a) | | | 545 | | | | 45,409 | | | | 0.91 | % |
| Gilead Sciences, Inc. | | | 1,593 | | | | 172,251 | | | | 3.46 | % |
| Illumina, Inc. (a) | | | 299 | | | | 42,841 | | | | 0.86 | % |
| Incyte Corp. (a) | | | 400 | | | | 47,012 | | | | 0.94 | % |
| McKesson Corp. | | | 243 | | | | 43,448 | | | | 0.87 | % |
| Medtronic PLC (b) | | | 1,500 | | | | 110,880 | | | | 2.22 | % |
| Regeneron Pharmaceuticals (a) | | | 120 | | | | 66,887 | | | | 1.34 | % |
| | | | | | | | 904,703 | | | | 18.14 | % |
| | | | | | | | | | | | | |
| Industrials – 4.78% | | | | | | | | | | | | |
| 3M Co. | | | 720 | | | | 113,191 | | | | 2.27 | % |
| Danaher Corp. | | | 851 | | | | 79,407 | | | | 1.59 | % |
| Nidec Corp. – ADR (b) | | | 2,430 | | | | 45,878 | | | | 0.92 | % |
| | | | | | | | 238,476 | | | | 4.78 | % |
| | | | | | | | | | | | | |
| Information Technology – 61.37% | | | | | | | | | | | | |
| Adobe Systems, Inc. (a) | | | 530 | | | | 46,990 | | | | 0.94 | % |
| Alibaba Group Holding Ltd. – ADR (a) (b) | | | 2,345 | | | | 196,581 | | | | 3.94 | % |
| Alphabet, Inc., Class C (a) | | | 266 | | | | 189,075 | | | | 3.79 | % |
| Ambarella, Inc. (a) (b) | | | 852 | | | | 42,123 | | | | 0.85 | % |
| Apple, Inc. | | | 1,511 | | | | 180,564 | | | | 3.62 | % |
| Avago Technologies Ltd. | | | 365 | | | | 44,942 | | | | 0.90 | % |
| Baidu, Inc. – ADR (a) (b) | | | 325 | | | | 60,928 | | | | 1.22 | % |
| Broadcom Corp. | | | 920 | | | | 47,288 | | | | 0.95 | % |
| Cirrus Logic, Inc. (a) | | | 1,570 | | | | 48,403 | | | | 0.97 | % |
| Cisco Systems, Inc. | | | 5,365 | | | | 154,780 | | | | 3.11 | % |
The accompanying notes are an integral part of these financial statements.
| COMMON STOCKS | | Number | | | | | | % of | |
| | | of Shares | | | Value | | | Net Assets | |
| Information Technology (Continued) | | | | | | | | | |
| Cognizant Technology Solutions Corp., Class A (a) | | | 650 | | | $ | 44,272 | | | | 0.89 | % |
| eBay, Inc. (a) | | | 1,747 | | | | 48,741 | | | | 0.98 | % |
| Ellie Mae, Inc. (a) | | | 625 | | | | 45,613 | | | | 0.92 | % |
| Facebook, Inc. (a) | | | 1,815 | | | | 185,076 | | | | 3.71 | % |
| FireEye, Inc. (a) | | | 1,641 | | | | 42,912 | | | | 0.86 | % |
| First Solar, Inc. (a) | | | 845 | | | | 48,224 | | | | 0.97 | % |
| Fitbit, Inc. (a) | | | 1,175 | | | | 47,635 | | | | 0.96 | % |
| Infosys Ltd. – ADR (b) | | | 2,440 | | | | 44,310 | | | | 0.89 | % |
| Intel Corp. | | | 5,125 | | | | 173,533 | | | | 3.48 | % |
| LinkedIn Corp., Class A (a) | | | 220 | | | | 52,991 | | | | 1.06 | % |
| MasterCard, Inc., Class A | | | 1,195 | | | | 118,293 | | | | 2.37 | % |
| Mellanox Technologies Ltd. (a) (b) | | | 975 | | | | 45,932 | | | | 0.92 | % |
| Microsoft Corp. | | | 3,600 | | | | 189,504 | | | | 3.80 | % |
| NetEase, Inc. – ADR (b) | | | 325 | | | | 46,972 | | | | 0.94 | % |
| Palo Alto Networks, Inc. (a) | | | 255 | | | | 41,055 | | | | 0.82 | % |
| PayPal Holdings, Inc. (a) | | | 1,372 | | | | 49,406 | | | | 0.99 | % |
| Qorvo, Inc. (a) | | | 975 | | | | 42,832 | | | | 0.86 | % |
| salesforce.com, Inc. (a) | | | 737 | | | | 57,272 | | | | 1.15 | % |
| SAP SE – ADR (b) | | | 1,395 | | | | 109,800 | | | | 2.20 | % |
| Tencent Holdings Ltd. – ADR (b) | | | 9,140 | | | | 172,472 | | | | 3.46 | % |
| Twitter, Inc. (a) | | | 1,490 | | | | 42,405 | | | | 0.85 | % |
| Visa, Inc., Class A | | | 2,385 | | | | 185,028 | | | | 3.71 | % |
| VMware, Inc., Class A (a) | | | 810 | | | | 48,722 | | | | 0.98 | % |
| Wipro Ltd. – ADR (b) | | | 3,420 | | | | 42,340 | | | | 0.85 | % |
| Workday, Inc., Class A (a) | | | 550 | | | | 43,434 | | | | 0.87 | % |
| Zebra Technologies Corp. (a) | | | 545 | | | | 41,911 | | | | 0.84 | % |
| Zillow Group, Inc. (a) | | | 1,355 | | | | 37,520 | | | | 0.75 | % |
| | | | | | | | 3,059,879 | | | | 61.37 | % |
| | | | | | | | | | | | | |
| Telecommunication Services – 0.84% | | | | | | | | | | | | |
| T- Mobile US, Inc. (a) | | | 1,105 | | | | 41,868 | | | | 0.84 | % |
| | | | | | | | | | | | | |
| Total Common Stocks | | | | | | | | | | | | |
| (Cost $4,323,863) | | | | | | | 4,600,505 | | | | 92.26 | % |
The accompanying notes are an integral part of these financial statements.
| HENNESSY FUNDS | 1-800-966-4354 | |
| SHORT-TERM INVESTMENTS – 8.21% | | Number | | | | | | % of | |
| | | of Shares | | | Value | | | Net Assets | |
| Money Market Funds – 8.21% | | | | | | | | | |
| Federated Government Obligations Fund – | | | | | | | | | |
| Class I, 0.01% (c) | | | 159,528 | | | $ | 159,528 | | | | 3.20 | % |
| Fidelity Government Portfolio – | | | | | | | | | | | | |
| Institutional Class, 0.01% (c) | | | 250,000 | | | | 250,000 | | | | 5.01 | % |
| | | | | | | | | | | | | |
| | | | | | | | 409,528 | | | | 8.21 | % |
| | | | | | | | | | | | | |
| Total Short-Term Investments | | | | | | | | | | | | |
| (Cost $409,528) | | | | | | | 409,528 | | | | 8.21 | % |
| | | | | | | | | | | | | |
| Total Investments | | | | | | | | | | | | |
| (Cost $4,733,391) – 100.47% | | | | | | | 5,010,033 | | | | 100.47 | % |
| Liabilities in Excess | | | | | | | | | | | | |
| of Other Assets – (0.47)% | | | | | | | (23,522 | ) | | | (0.47 | )% |
TOTAL NET ASSETS – 100.00% | | | | | | $ | 4,986,511 | | | | 100.00 | % |
Percentages are stated as a percent of net assets.
ADR – American Depositary Receipt
| (a) | Non-income producing security. |
| (b) | U.S. traded security of a foreign corporation. |
| (c) | The rate listed is the fund’s 7-day yield as of October 31, 2015. |
Summary of Fair Value Exposure at October 31, 2015
The following is a summary of the inputs used to value the Fund’s net assets as of October 31, 2015 (see Note 3 in the accompanying notes to the financial statements)
| Common Stocks | | Level 1 | | | Level 2 | | | Level 3 | | | Total | |
| Consumer Discretionary | | $ | 355,579 | | | $ | — | | | $ | — | | | $ | 355,579 | |
| Health Care | | | 904,703 | | | | — | | | | — | | | | 904,703 | |
| Industrials | | | 238,476 | | | | — | | | | — | | | | 238,476 | |
| Information Technology | | | 3,059,879 | | | | — | | | | — | | | | 3,059,879 | |
| Telecommunication Services | | | 41,868 | | | | — | | | | — | | | | 41,868 | |
| Total Common Stocks | | $ | 4,600,505 | | | $ | — | | | $ | — | | | $ | 4,600,505 | |
| Short-Term Investments | | | | | | | | | | | | | | | | |
| Money Market Funds | | $ | 409,528 | | | $ | — | | | $ | — | | | $ | 409,528 | |
| Total Short-Term Investments | | $ | 409,528 | | | $ | — | | | $ | — | | | $ | 409,528 | |
| Total Investments | | $ | 5,010,033 | | | $ | — | | | $ | — | | | $ | 5,010,033 | |
Transfers between levels are recognized at the end of the reporting period. During the year ended October 31, 2015, the Fund recognized no transfers between levels.
The accompanying notes are an integral part of these financial statements.
Financial Statements
Statement of Assets and Liabilities as of October 31, 2015 |
| ASSETS: | | | |
| Investments in securities, at value (cost $4,733,391) | | $ | 5,010,033 | |
| Dividends and interest receivable | | | 613 | |
| Receivable for securities sold | | | 23,782 | |
| Prepaid expenses and other assets | | | 12,283 | |
| Total Assets | | | 5,046,711 | |
| | | | | |
| LIABILITIES: | | | | |
| Payable for securities purchased | | | 13,460 | |
| Payable to advisor | | | 3,652 | |
| Payable to administrator | | | 1,135 | |
| Payable to auditor | | | 20,301 | |
| Accrued distribution fees | | | 7,659 | |
| Accrued service fees | | | 329 | |
| Accrued trustees fees | | | 2,401 | |
| Accrued expenses and other payables | | | 11,263 | |
| Total Liabilities | | | 60,200 | |
| NET ASSETS | | $ | 4,986,511 | |
| | | | | |
| NET ASSETS CONSIST OF: | | | | |
| Capital stock | | $ | 5,095,251 | |
| Accumulated net investment loss | | | (85,399 | ) |
| Accumulated net realized loss on investments | | | (299,983 | ) |
| Unrealized net appreciation on investments | | | 276,642 | |
| Total Net Assets | | $ | 4,986,511 | |
| | | | | |
| NET ASSETS | | | | |
| Investor Class: | | | | |
| Shares authorized (no par value) | | Unlimited | |
| Net assets applicable to outstanding Investor Class shares | | $ | 4,036,453 | |
| Shares issued and outstanding | | | 262,832 | |
| Net asset value, offering price and redemption price per share | | $ | 15.36 | |
| | | | | |
| Institutional Class: | | | | |
| Shares authorized (no par value) | | Unlimited | |
| Net assets applicable to outstanding Institutional Class shares | | $ | 950,058 | |
| Shares issued and outstanding | | | 60,989 | |
| Net asset value, offering price and redemption price per share | | $ | 15.58 | |
The accompanying notes are an integral part of these financial statements.
| HENNESSY FUNDS | 1-800-966-4354 | |
Financial Statements
Statement of Operations for the year ended October 31, 2015 |
| INVESTMENT INCOME: | | | |
Dividend income(1) | | $ | 44,016 | |
| Interest income | | | 23 | |
| Total investment income | | | 44,039 | |
| | | | | |
| EXPENSES: | | | | |
| Investment advisory fees (See Note 5) | | | 47,660 | |
| Federal and state registration fees | | | 28,974 | |
| Compliance expense | | | 22,186 | |
| Audit fees | | | 20,898 | |
| Trustees’ fees and expenses | | | 10,873 | |
| Distribution fees – Investor Class (See Note 5) | | | 8,096 | |
| Sub-transfer agent expenses – Investor Class (See Note 5) | | | 6,637 | |
| Sub-transfer agent expenses – Institutional Class (See Note 5) | | | 186 | |
| Administration, fund accounting, custody and transfer agent fees (See Note 5) | | | 5,326 | |
| Reports to shareholders | | | 4,888 | |
| Service fees – Investor Class (See Note 5) | | | 2,791 | |
| Legal fees | | | 150 | |
| Interest expense (See Note 6) | | | 30 | |
| Other expenses | | | 3,799 | |
| Total expenses before reimbursement by advisor | | | 162,494 | |
| Expense reimbursement by advisor – Investor Class | | | (16,551 | ) |
| Expense reimbursement by advisor – Institutional Class | | | (3,036 | ) |
| Net expenses | | | 142,907 | |
| NET INVESTMENT LOSS | | $ | (98,868 | ) |
| | | | | |
| REALIZED AND UNREALIZED GAINS (LOSSES): | | | | |
| Net realized gain on investments | | $ | 422,069 | |
| Net change in unrealized depreciation on investments | | | (136,502 | ) |
| Net gain on investments | | | 285,567 | |
| NET INCREASE IN NET ASSETS RESULTING FROM OPERATIONS | | $ | 186,699 | |
(1) | Net foreign taxes withheld and issuance fees of $1,556. |
The accompanying notes are an integral part of these financial statements.
Financial Statements
| Statements of Changes in Net Assets |
| | | Year Ended | | | Year Ended | |
| | | October 31, 2015 | | | October 31, 2014 | |
| OPERATIONS: | | | | | | |
| Net investment loss | | $ | (98,868 | ) | | $ | (92,327 | ) |
| Net realized gain on investments | | | 422,069 | | | | 1,045,681 | |
| Net change in unrealized depreciation on investments | | | (136,502 | ) | | | (478,710 | ) |
| Net increase in net assets resulting from operations | | | 186,699 | | | | 474,644 | |
| | | | | | | | | |
| CAPITAL SHARE TRANSACTIONS: | | | | | | | | |
| Proceeds from shares subscribed – Investor Class | | | 406,595 | | | | 1,203,915 | |
| Proceeds from shares subscribed – Institutional Class | | | 59,079 | | | | 118,363 | |
| Cost of shares redeemed – Investor Class | | | (1,513,565 | ) | | | (1,088,682 | )(1) |
| Cost of shares redeemed – Institutional Class | | | (78,903 | ) | | | (462,083 | ) |
| Net decrease in net assets derived | | | | | | | | |
| from capital share transactions | | | (1,126,794 | ) | | | (228,487 | ) |
| TOTAL INCREASE (DECREASE) IN NET ASSETS | | | (940,095 | ) | | | 246,157 | |
| | | | | | | | | |
| NET ASSETS: | | | | | | | | |
| Beginning of year | | | 5,926,606 | | | | 5,680,449 | |
| End of year | | $ | 4,986,511 | | | $ | 5,926,606 | |
| Accumulated net investment loss, end of year | | $ | (85,399 | ) | | $ | (79,279 | ) |
| | | | | | | | | |
| CHANGES IN SHARES OUTSTANDING: | | | | | | | | |
| Shares sold – Investor Class | | | 26,994 | | | | 80,861 | |
| Shares sold – Institutional Class | | | 3,902 | | | | 8,180 | |
| Shares redeemed – Investor Class | | | (100,179 | ) | | | (75,777 | ) |
| Shares redeemed – Institutional Class | | | (5,099 | ) | | | (33,013 | ) |
| Net decrease in shares outstanding | | | (74,382 | ) | | | (19,749 | ) |
(1) | Net of redemption fees of $15 related to redemption fees imposed by the Fund during a prior year but not received until fiscal year 2014. |
The accompanying notes are an integral part of these financial statements.
| HENNESSY FUNDS | 1-800-966-4354 | |
Financial Statements
For an Investor Class share outstanding throughout each year
PER SHARE DATA:
Net asset value, beginning of year
Income from investment operations:
Net investment loss
Net realized and unrealized gains (losses) on investments
Total from investment operations
Net asset value, end of year
TOTAL RETURN
SUPPLEMENTAL DATA AND RATIOS:
Net assets, end of year (millions)
Ratio of expenses to average net assets:
Before expense reimbursement
After expense reimbursement
Ratio of net investment income to average net assets:
Before expense reimbursement
After expense reimbursement
Portfolio turnover rate(2)
(1) | Calculated based on average shares outstanding method. |
(2) | Portfolio turnover is calculated on the basis of the Fund as a whole. |
The accompanying notes are an integral part of these financial statements.
| Year Ended October 31, | |
| 2015 | | | 2014 | | | 2013 | | | 2012 | | | 2011 | |
| | | | | | | | | | | | | |
| $ | 14.86 | | | $ | 13.57 | | | $ | 10.67 | | | $ | 10.86 | | | $ | 11.00 | |
| | | | | | | | | | | | | | | | | | | |
| | | | | | | | | | | | | | | | | | | |
| | (0.38 | ) | | | (0.23 | ) | | | (0.20 | ) | | | (0.15 | ) | | | (0.17 | )(1) |
| | 0.88 | | | | 1.52 | | | | 3.10 | | | | (0.04 | ) | | | 0.03 | |
| | 0.50 | | | | 1.29 | | | | 2.90 | | | | (0.19 | ) | | | (0.14 | ) |
| $ | 15.36 | | | $ | 14.86 | | | $ | 13.57 | | | $ | 10.67 | | | $ | 10.86 | |
| | | | | | | | | | | | | | | | | | | |
| | 3.36 | % | | | 9.51 | % | | | 27.18 | % | | | (1.75 | )% | | | (1.27 | )% |
| | | | | | | | | | | | | | | | | | | |
| | | | | | | | | | | | | | | | | | | |
| $ | 4.04 | | | $ | 4.99 | | | $ | 4.49 | | | $ | 4.44 | | | $ | 5.70 | |
| | | | | | | | | | | | | | | | | | | |
| | 3.13 | % | | | 2.92 | % | | | 3.04 | % | | | 3.20 | % | | | 2.79 | % |
| | 2.75 | % | | | 1.95 | % | | | 1.95 | % | | | 1.95 | % | | | 1.95 | % |
| | | | | | | | | | | | | | | | | | | |
| | (2.30 | )% | | | (2.53 | )% | | | (2.36 | )% | | | (2.39 | )% | | | (2.38 | )% |
| | (1.92 | )% | | | (1.55 | )% | | | (1.27 | )% | | | (1.14 | )% | | | (1.54 | )% |
| | 163 | % | | | 204 | % | | | 164 | % | | | 138 | % | | | 141 | % |
The accompanying notes are an integral part of these financial statements.
| HENNESSY FUNDS | 1-800-966-4354 | |
Financial Statements
For an Institutional Class share outstanding throughout each year
PER SHARE DATA:
Net asset value, beginning of year
Income from investment operations:
Net investment loss
Net realized and unrealized gains (losses) on investments
Total from investment operations
Net asset value, end of year
TOTAL RETURN
SUPPLEMENTAL DATA AND RATIOS:
Net assets, end of year (millions)
Ratio of expenses to average net assets:
Before expense reimbursement
After expense reimbursement
Ratio of net investment income to average net assets:
Before expense reimbursement
After expense reimbursement
Portfolio turnover rate(2)
(1) | Calculated based on average shares outstanding method. |
(2) | Portfolio turnover is calculated on the basis of the Fund as a whole. |
The accompanying notes are an integral part of these financial statements.
| Year Ended October 31, | |
| 2015 | | | 2014 | | | 2013 | | | 2012 | | | 2011 | |
| | | | | | | | | | | | | |
| $ | 15.02 | | | $ | 13.68 | | | $ | 10.73 | | | $ | 10.89 | | | $ | 11.00 | |
| | | | | | | | | | | | | | | | | | | |
| | | | | | | | | | | | | | | | | | | |
| | (0.25 | ) | | | (0.26 | ) | | | (0.12 | ) | | | (0.11 | ) | | | (0.14 | )(1) |
| | 0.81 | | | | 1.60 | | | | 3.07 | | | | (0.05 | ) | | | 0.03 | |
| | 0.56 | | | | 1.34 | | | | 2.95 | | | | (0.16 | ) | | | (0.11 | ) |
| $ | 15.58 | | | $ | 15.02 | | | $ | 13.68 | | | $ | 10.73 | | | $ | 10.89 | |
| | | | | | | | | | | | | | | | | | | |
| | 3.73 | % | | | 9.80 | % | | | 27.49 | % | | | (1.47 | )% | | | (1.00 | )% |
| | | | | | | | | | | | | | | | | | | |
| | | | | | | | | | | | | | | | | | | |
| $ | 0.95 | | | $ | 0.93 | | | $ | 1.19 | | | $ | 0.93 | | | $ | 1.16 | |
| | | | | | | | | | | | | | | | | | | |
| | 2.76 | % | | | 2.60 | % | | | 2.76 | % | | | 4.11 | % | | | 3.45 | % |
| | 2.44 | % | | | 1.70 | % | | | 1.70 | % | | | 1.70 | % | | | 1.70 | % |
| | | | | | | | | | | | | | | | | | | |
| | (1.92 | )% | | | (2.23 | )% | | | (2.10 | )% | | | (3.31 | )% | | | (2.99 | )% |
| | (1.60 | )% | | | (1.33 | )% | | | (1.04 | )% | | | (0.90 | )% | | | (1.24 | )% |
| | 163 | % | | | 204 | % | | | 164 | % | | | 138 | % | | | 141 | % |
The accompanying notes are an integral part of these financial statements.
| HENNESSY FUNDS | 1-800-966-4354 | |
Financial Statements
Notes to the Financial Statements October 31, 2015 |
1). ORGANIZATION
| The Hennessy Technology Fund (the “Fund”) is a series of Hennessy Funds Trust (the “Trust”), which was organized as a Delaware statutory trust on September 17, 1992. The Fund is an open-end management investment company registered under the Investment Company Act of 1940, as amended. The Fund is a successor to the FBR Technology Fund (the “Predecessor FBR Fund”), a series of The FBR Funds, a Delaware statutory trust, pursuant to a reorganization that took place after the close of business on October 26, 2012. Prior to October 26, 2012, the Fund had no investment operations. As a result of the reorganization, holders of the Investor Class shares of the Predecessor FBR Fund received Investor Class shares of the Fund (the Investor Class shares of the Fund are the successor to the accounting and performance information of the Predecessor FBR Fund), and holders of the Institutional Class shares of the Predecessor FBR Fund received Institutional Class shares of the Fund (the Institutional Class shares of the Fund are the successor to the accounting and performance information of the Predecessor FBR Fund). The investment objective of the Fund is capital appreciation. The Fund is a non-diversified fund. |
| | |
| | The Fund offers Investor Class and Institutional Class shares. Each class of shares differs principally in its respective administration, 12b-1 distribution and service, shareholder servicing, and transfer agent expenses and sales charges, if any. Each class has identical rights to earnings, assets, and voting privileges, except for class-specific expenses and exclusive rights to vote on matters affecting only an individual class. |
| | |
| | As an investment company, the Fund follows the investment company accounting and reporting guidance of the Financial Accounting Standards Board (“FASB”) Accounting Standard Codification Topic 946 “Financial Services—Investment Companies.” |
2). SIGNIFICANT ACCOUNTING POLICIES
| The following is a summary of significant accounting policies consistently followed by the Fund in the preparation of the financial statements. These policies are in conformity with U.S. generally accepted accounting principles (“GAAP”). |
| | |
| a). | Investment Valuation – All investments in securities are recorded at their estimated fair value, as described in Note 3. |
| | |
| b). | Federal Income Taxes – Provision for federal income taxes or excise taxes has not been made since the Fund has elected to be taxed as a “regulated investment company” and intends to distribute substantially all of its taxable income to its shareholders and otherwise comply with the provisions of the Internal Revenue Code of 1986, as amended, applicable to regulated investment companies. Net investment income or loss and realized gains and losses for federal income tax purposes may differ from that reported on the financial statements because of temporary book and tax basis differences. Temporary differences are primarily the result of the treatment of wash sales for tax reporting purposes. The Fund recognizes interest and penalties related to income tax benefits, if any, in the statement of operations as an income tax expense. Distributions from net realized gains for book purposes may include short-term capital gains, which are included as ordinary income to shareholders for tax purposes. |
| | Due to inherent differences in the recognition of income, expenses, and realized gains/losses under GAAP and federal income tax regulations, permanent differences between book and tax basis reporting for the 2015 fiscal year have been identified and appropriately reclassified on the Statement of Assets and Liabilities. The adjustments are as follows: |
| Undistributed | Accumulated | |
| Net Investment | Net Realized | |
Income/(Loss) | Gain/(Loss) | Paid-in Capital |
| $92,748 | — | $(92,748) |
| c). | Income and Expenses – Dividend income is recognized on the ex-dividend date or as soon as information is available to the Fund. Interest income, which includes the amortization of premium and accretion of discount, is recognized on an accrual basis. The Fund is charged for those expenses that are directly attributable to the portfolio, such as advisory, administration, and certain shareholder service fees. Income, expenses (other than expenses attributable to a specific class), and realized and unrealized gains or losses on investments are allocated to each class of shares based on its respective net assets. |
| | |
| d). | Distributions to Shareholders – Dividends from net investment income for the Fund, if any, are declared and paid annually, usually in December. Distributions of net realized capital gains, if any, are declared and paid annually, usually in December. |
| | |
| e). | Security Transactions – Investment and shareholder transactions are recorded on the trade date. The Fund determines the gain or loss realized from the investment transactions by comparing the original cost of the security lot sold with the net sale proceeds. Discounts and premiums on securities purchased are accreted/amortized over the life of the respective security. |
| | |
| f). | Use of Estimates – The preparation of financial statements in conformity with GAAP requires management to make estimates and assumptions that affect the reported amounts of assets and liabilities and disclosure of contingent assets and liabilities at the date of the financial statements and the reported change in net assets during the reporting period. Actual results could differ from those estimates. |
| | |
| g). | Share Valuation – The net asset value (“NAV”) per share of the Fund is calculated by dividing the sum of the value of the securities held by the Fund, plus cash or other assets, minus all liabilities (including estimated accrued expenses) by the total number of shares outstanding for the Fund, rounded to the nearest cent. The Fund’s shares will not be priced on days the New York Stock Exchange is closed for trading. The offering and redemption price per share for the Fund is equal to the Fund’s NAV per share. |
| | |
| h). | Foreign Currency – Values of investments denominated in foreign currencies, if any, are converted into U.S. dollars using the spot market rate of exchange at the time of valuation. Purchases and sales of investments and income are translated into U.S. dollars using the spot market rate of exchange prevailing on the respective dates of such transactions. The Fund does not isolate the portion of the results of operations resulting from fluctuations in foreign exchange rates on investments from fluctuations resulting from changes in the market prices of securities held. Such fluctuations are included with the net realized and unrealized gain or loss on investments. Foreign investments present additional risks due to currency fluctuations, economic and political factors, lower liquidity, government regulations, differences in accounting standards, and other factors. |
| HENNESSY FUNDS | 1-800-966-4354 | |
| i). | Forward Contracts – The Fund may enter into forward currency contracts to reduce its exposure to changes in foreign currency exchange rates on its foreign holdings and to lock in the U.S. dollar cost of firm purchase and sale commitments for securities denominated in foreign currencies. A forward currency contract is a commitment to purchase or sell a foreign currency at a future date at a negotiated forward rate. The gain or loss arising from the difference between the U.S. dollar cost of the original contract and the value of the foreign currency in U.S. dollars upon closing of such contract is included in net realized gain or loss from foreign currency transactions. During the fiscal year ended October 31, 2015, the Fund did not enter into any forward contracts. |
| | |
| j). | Repurchase Agreements – The Fund may enter into repurchase agreements with member banks or security dealers of the Federal Reserve Board whom the investment advisor deems creditworthy. The repurchase price generally equals the price paid by the Fund plus interest negotiated on the basis of current short-term rates. |
| | |
| | Securities pledged as collateral for repurchase agreements are held by the custodian bank until the respective agreements mature. Provisions of the repurchase agreements ensure that the market value of the collateral, including accrued interest thereon, is sufficient to cover the repurchase amount in the event of default of the counterparty. If the counterparty defaults and the value of the collateral declines or if the counterparty enters an insolvency proceeding, realization of the collateral by the Fund may be delayed or limited. |
| | |
| k). | Accounting for Uncertainty in Income Taxes – The Fund has accounting policies regarding recognition and measurement of tax positions taken or expected to be taken on a tax return. The tax returns of the Fund for the prior three fiscal years are open for examination. The Fund has reviewed all open tax years in major jurisdictions and concluded that there is no impact on the Fund’s net assets and no tax liability resulting from unrecognized tax benefits relating to uncertain income tax positions taken or expected to be taken on a tax return. The Fund’s major tax jurisdictions are U.S. federal and Delaware. |
| | |
| l). | Derivatives – The Fund may invest in, or enter into, derivatives, such as options, futures contracts, options on futures contracts, and swaps, for a variety of reasons, including to hedge certain risks, to provide a substitute for purchasing or selling particular securities, or to increase potential income gain. Derivatives may provide a cheaper, quicker, or more specifically focused way for a Fund to invest than “traditional” securities would. The main purpose of utilizing these derivative instruments is for hedging purposes. |
| | |
| | The Fund follows the financial accounting reporting rules as required by the Derivatives and Hedging Topic of the FASB Accounting Standards Codification. Under such rules, the Fund is required to include enhanced disclosure that enables investors to understand how and why an entity uses derivatives, how derivatives are accounted for, and how derivatives instruments affect an entity’s results of operations and financial position. During the fiscal year ended October 31, 2015, the Fund did not hold any derivative instruments. |
| | |
| m). | New Accounting Pronouncements – In June 2014, the FASB issued Accounting Standards Update (“ASU”) No. 2014-11 “Repurchase-to Maturity Transactions, Repurchase Financings, and Disclosures.” The amendments in this ASU require an entity to modify accounting for repurchase-to-maturity transactions and repurchase financing arrangements, as well as modify required disclosures for repurchase agreements, securities lending transactions, and repurchase-to-maturity transactions |
| | that are accounted for as secured borrowings. The guidance is effective for fiscal years beginning on or after December 15, 2014, and for interim periods within those fiscal years. Management is currently evaluating the impact these changes will have on the Fund’s financial statement disclosures. |
| | In May 2015, the FASB issued ASU No. 2015-07 “Disclosure for Investments in Certain Entities that Calculate Net Asset Value per Share (or Its Equivalent).” The amendments in ASU No. 2015-07 remove the requirement to categorize within the fair value hierarchy investments measured at NAV and require the disclosure of sufficient information to reconcile the fair value of the remaining assets categorized within the fair value hierarchy to the financial statements. The amendments in ASU No. 2015-07 are effective for fiscal years beginning after December 15, 2015, and interim periods within those fiscal years. Management has reviewed the requirements and believes the adoption of ASU 2015-07 will not have a material impact on the Fund’s financial statements and related disclosures. |
3). SECURITIES VALUATION
The Fund follows authoritative fair valuation accounting standards that establish an authoritative definition of fair value and set out a hierarchy for measuring fair value. These standards require additional disclosures about the various inputs and valuation techniques used to develop the measurements of fair value and a discussion in changes in valuation techniques and related inputs during the period. These inputs are summarized in the three broad levels listed below:
| | Level 1 – | Quoted unadjusted prices for identical instruments in active markets to which the Fund has access at the date of measurement. |
| | | |
| | Level 2 – | Quoted prices for similar instruments in active markets; quoted prices for identical or similar instruments in markets that are not active; and model-derived valuations in which all significant inputs and significant value drivers are observable in active markets. Level 2 inputs are those in markets for which there are few transactions, the prices are not current, the prices are fair value adjusted due to post-market close subsequent events (foreign markets), little public information exists, or instances where prices vary substantially over time or among brokered market makers. These inputs may also include interest rates, prepayment speeds, credit risk curves, default rates, and similar data. |
| | | |
| | Level 3 – | Model-derived valuations in which one or more significant inputs or significant value drivers are unobservable. Unobservable inputs are those inputs that reflect the Fund’s own assumptions about what market participants would use to price the asset or liability based on the best available information. |
Following is a description of the valuation techniques applied to the Fund’s major categories of assets and liabilities measured at fair value on a recurring basis.
Equity Securities – Equity securities, including common stocks, preferred stocks, foreign-issued common stocks, exchange-traded funds, closed-end mutual funds, partnerships, rights, and real estate investment trusts, that are traded on a securities exchange for which a last-quoted sales price is readily available will generally be valued at the last sales price as reported by the primary exchange on which the securities are listed. Securities listed on The NASDAQ Stock Market (“NASDAQ”) will generally be valued at the NASDAQ Official Closing Price, which may differ from the last sales price reported. Securities traded on a securities exchange for which a last-quoted sales price is not readily
| HENNESSY FUNDS | 1-800-966-4354 | |
available will generally be valued at the mean between the bid and ask prices. To the extent these securities are actively traded and valuation adjustments are not applied, they are classified in Level 1 of the fair value hierarchy. Securities traded on foreign exchanges generally are not valued at the same time the Fund calculates its NAV because most foreign markets close well before such time. The earlier close of most foreign markets gives rise to the possibility that significant events, including broad market moves, may have occurred in the interim. In certain circumstances, it may be determined that a security needs to be fair valued because it appears that the value of the security might have been materially affected by events occurring after the close of the market in which the security is principally traded, but before the time the Fund calculates its NAV, such as by a development that affects an entire market or region (e.g., weather-related events) or a potentially global development (e.g., a terrorist attack that may be expected to have an effect on investor expectations worldwide).
Registered Investment Companies – Investments in registered investment companies (e.g., mutual funds) are generally priced at the ending NAV provided by the applicable registered investment company’s service agent and will be classified in Level 1 of the fair value hierarchy.
Debt Securities – Debt securities, including corporate bonds, asset-backed securities, mortgage-backed securities, municipal bonds, U.S. Treasuries, and U.S. government agency issues, are generally valued at market on the basis of valuations furnished by an independent pricing service that utilizes both dealer-supplied valuations and formula-based techniques. The pricing service may consider recently executed transactions in securities of the issuer or comparable issuers, market price quotations (where observable), bond spreads, and fundamental data relating to the issuer. In addition, the model may incorporate market observable data such as reported sales of similar securities, broker quotes, yields, bids, offers, and reference data. Certain securities are valued principally using dealer quotations. These securities are generally classified in Level 2 of the fair value hierarchy.
Short-Term Securities – Short-term equity investments, including money market funds, are valued in the manner specified above. Short-term debt investments are generally valued at amortized cost, which approximates fair market value, if their original term to maturity was 60 days or less, or by amortizing the values as of the 61st day prior to maturity, if their original term to maturity exceeded 60 days. Amortized cost is not used if its use would be inappropriate due to credit or other impairments of the issuer, in which case the security’s fair value would be determined, as described below. Short-term securities are generally classified in Level 1 or Level 2 of the fair market hierarchy depending on the inputs used and market activity levels for specific securities.
The Board of Trustees of the Fund (the “Board”) has adopted fair value pricing procedures that are followed when a price for a security is not readily available or if a significant event has occurred that indicates the closing price of a security no longer represents the true value of that security. Fair value pricing determinations are made in good faith in accordance with these procedures. There are numerous criteria that will be given consideration in determining a fair value of a security. Some of these criteria are trading volume of a security and markets, the value of other like securities, and news events with direct bearing to a security or markets. Fair value pricing results in an estimated price for a security that reflects the amount the Fund might reasonably expect to receive in a current sale. Depending on the relative significance of the valuation inputs, these securities may be classified in either Level 2 or Level 3 of the fair value hierarchy.
The fair valuation of foreign securities may be determined with the assistance of a pricing service using correlations between the movement of prices of such securities and
indices of domestic securities and other appropriate indicators, such as closing market prices of relevant American Depositary Receipts or futures contracts. The effect of using fair value pricing is that the Fund’s NAV will reflect the affected portfolio securities’ value as determined in the judgment of the Board or its designee instead of being determined by the market. Using a fair value pricing methodology to price foreign securities may result in a value that is different from a foreign security’s most recent closing price and from the prices used by other investment companies to calculate their NAVs and are generally considered Level 2 prices in the fair valuation hierarchy. Because the Fund may invest in foreign securities, the value of the Fund’s portfolio securities may change on days when you will not be able to purchase or redeem your shares.
The Board has delegated day-to-day valuation matters to a Valuation Committee comprised of one or more representatives from Hennessy Advisors, Inc., the Fund’s investment advisor. The function of the Valuation Committee is to value securities where current and reliable market quotations are not readily available. All actions taken by the Valuation Committee are reviewed by the Board.
The Fund has performed an analysis of all existing investments to determine the significance and character of all inputs to their fair value determination. Various inputs are used in determining the value of the Fund’s investments. The inputs or methodology used for valuing securities are not necessarily an indication of the risk associated with investing in those securities. Details related to the fair valuation hierarchy of the Fund’s securities as of October 31, 2015 are included in the Fund’s Schedule of Investments.
4). INVESTMENT TRANSACTIONS
Purchases and sales of investment securities (excluding government and short-term investments) for the Fund during the fiscal year ended October 31, 2015 were $8,348,153 and $9,726,549, respectively.
There were no purchases or sales/maturities of long-term U.S. Government Securities for the Fund during the fiscal year ended October 31, 2015.
5). INVESTMENT MANAGEMENT FEE AND OTHER TRANSACTIONS WITH AFFILIATES
Hennessy Advisors, Inc. (the “Advisor”) is the investment advisor of the Fund. The Advisor provides the Fund with investment management services under an Investment Advisory Agreement. The Advisor furnishes all investment advice, office space, facilities, and provides most of the personnel needed by the Fund. As compensation for its services, the Advisor is entitled to a monthly fee from the Fund. The fee is based upon the average daily net assets of the Fund at the annual rate of 0.90%. The net investment advisory fees payable by the Fund as of October 31, 2015 were $3,652.
The Advisor contractually agreed to limit the total annual operating expenses of the Fund (excluding interest, taxes, brokerage commissions, dividend expenses, acquired fund fees and expenses, extraordinary legal expenses, or any other extraordinary expenses and, from and after November 1, 2014, 12b-1 fees) to 1.95% and 1.70% of the Fund’s net assets for the Investor Class shares and Institutional Class shares of the Fund, respectively, through February 28, 2015. The expense limitation agreement for the Fund is no longer in effect.
For a period of three years after the year in which the Advisor waived or reimbursed expenses, the Advisor may seek reimbursement from the Fund to the extent that total annual fund operating expenses are less than the expense limitation that was in effect at the time the Advisor waived or reimbursed expenses. The Advisor waived or reimbursed expenses of $19,587 for the Fund during the fiscal year ended October 31, 2015. As of
| HENNESSY FUNDS | 1-800-966-4354 | |
October 31, 2015, cumulative expenses subject to potential recovery under the aforementioned conditions and year of expiration were as follows:
| | October 31, | October 31, | October 31, | |
| | 2016 | 2017 | 2018 | Total |
| Investor Class | $48,568 | $48,732 | $16,551 | $113,851 |
| Institutional Class | $10,931 | $ 9,989 | $ 3,036 | $ 23,956 |
The Board has approved a Shareholder Servicing Agreement for the Investor Class shares of the Fund, effective as of February 28, 2015, which was instituted to compensate the Advisor for the non-investment management services it provides to the Fund. The Shareholder Servicing Agreement provides for a monthly fee paid to the Advisor at an annual rate of 0.10% of the average daily net assets of the Fund attributable to Investor Class shares. Shareholder service fees payable by the Fund as of October 31, 2015 were $329.
The Fund has adopted a plan pursuant to Rule 12b-1 under the Investment Company Act of 1940, as amended, that authorizes payments in connection with the distribution of the Fund’s shares at an annual rate of up to 0.25% of the Fund’s average daily net assets attributable to Investor Class shares, although the Fund has only been using up to 0.15% of its average daily net assets attributable to Investor Class shares for such purpose since March 1, 2015. Amounts paid under the plan may be spent on any activities or expenses primarily intended to result in the sale of shares, including but not limited to, advertising, shareholder account servicing, the printing and mailing of prospectuses to other than current shareholders, the printing and mailing of sales literature, and compensation for sales and marketing activities or to financial institutions and others, such as dealers and distributors.
The Fund has entered into agreements with various brokers, dealers, and financial intermediaries in connection with the sale of shares of the Fund. The agreements provide for periodic payments by the Fund to the brokers, dealers, and financial intermediaries for providing certain shareholder maintenance services (sub-transfer agent expenses). These shareholder services include the pre-processing and quality control of new accounts, shareholder correspondence, answering customer inquiries regarding account status, and facilitating shareholder telephone transactions. Fees paid by the Fund to various brokers, dealers, and financial intermediaries during the fiscal year ended October 31, 2015 were $6,823.
U.S. Bancorp Fund Services, LLC (“USBFS”) provides the Fund with administrative, fund accounting, and transfer agent services, including all regulatory reporting, and necessary office equipment and personnel. As administrator, USBFS is responsible for activities such as (i) preparing various federal and state regulatory filings, reports, and returns for the Fund, (ii) preparing reports and materials to be supplied to the Board, (iii) monitoring the activities of the Fund’s custodian, transfer agent, and accountants, and (iv) coordinating the preparation and payment of the Fund’s expenses and reviewing the Fund’s expense accruals. Fees paid to USBFS during the fiscal year ended October 31, 2015 were $5,326.
U.S. Bank, N.A., an affiliate of USBFS, serves as the Fund’s custodian. Quasar Distributors, LLC acts as the Fund’s principal underwriter in a continuous public offering of the Fund’s shares. Quasar Distributors, LLC is an affiliate of USBFS and U.S. Bank, N.A.
6). LINE OF CREDIT
The Fund has an uncommitted line of credit with the other funds in the Hennessy Funds family of funds (the “Hennessy Funds”) in the amount of the lesser of (i) $100,000,000 or (ii) 33.33% of each Hennessy Fund’s net assets, or 30% for the Hennessy Gas Utility Fund
and 10% for the Hennessy Balanced Fund, intended to provide short-term financing, if necessary, subject to certain restrictions, in connection with shareholder redemptions. The credit facility is with the Hennessy Funds’ custodian bank, U.S. Bank, N.A. Borrowings under this arrangement bear interest at the bank’s prime rate and are secured by all of the Fund’s assets (as to its own borrowings only). During the fiscal year ended October 31, 2015, the Fund had an outstanding average daily balance and a weighted average interest rate of $910 and 3.25%, respectively. The maximum amount outstanding for the Fund during the period was $106,000. At October 31, 2015, the Fund did not have any borrowings outstanding under the line of credit.
7). FEDERAL TAX INFORMATION
As of October 31, 2015, the components of accumulated earnings (losses) for income tax purposes were as follows:
| Cost of investments for tax purposes | | $ | 4,756,621 | |
| Gross tax unrealized appreciation | | $ | 493,274 | |
| Gross tax unrealized depreciation | | | (239,862 | ) |
| Net tax unrealized appreciation | | $ | 253,412 | |
| Undistributed ordinary income | | $ | — | |
| Undistributed long-term capital gains | | | — | |
| Total distributable earnings | | $ | — | |
| Other accumulated loss | | $ | (362,152 | ) |
| Total accumulated loss | | $ | (108,740 | ) |
The difference between book-basis and tax-basis unrealized appreciation is attributable primarily to capital loss carry overs, wash sales, and partnership adjustments.
At October 31, 2015, the Fund had capital loss carryforwards of $276,753 that expire on October 31, 2017.
During the fiscal year ended October 31, 2015, the capital loss carry forwards utilized for the Fund were $351,125.
Capital losses sustained in the fiscal year ended October 31, 2012 and in future taxable years will not expire and may be carried over by the Fund without limitation; however, they will retain the character of the original loss. Furthermore, any loss incurred during those taxable years will be required to be utilized prior to the losses incurred in taxable years prior to 2012. As a result of this ordering rule, pre-enactment capital loss carryforwards may be more likely to expire unused. Under pre-enactment law, capital losses could be carried forward for eight years, and carried forward as short-term capital losses, irrespective of the character of the original loss.
At October 31, 2015, the Fund deferred, on a tax basis, a late year ordinary loss of $85,399.
The Fund did not pay any distributions during fiscal year 2015 or fiscal year 2014.
8). EVENTS SUBSEQUENT TO YEAR END
Management has evaluated the Fund’s related events and transactions that occurred subsequent to October 31, 2015, through the date of issuance of the Fund’s financial statements. Management has determined that there were no subsequent events requiring recognition or disclosure in the financial statements.
| HENNESSY FUNDS | 1-800-966-4354 | |
Report of Independent Registered Public Accounting Firm
To the Board of Trustees of Hennessy Funds Trust
And the Shareholders of the Hennessy Technology Fund
Novato, CA
We have audited the accompanying statement of assets and liabilities, including the schedule of investments, of the Hennessy Technology Fund (the “Fund”), a series of Hennessy Funds Trust (the “Trust”), as of October 31, 2015, and the related statement of operations for the year then ended, the statements of changes in net assets for each of the two years in the period then ended, and the financial highlights for each of the five years in the period then ended. These financial statements and financial highlights are the responsibility of the Fund’s management. Our responsibility is to express an opinion on these financial statements and financial highlights based on our audits.
We conducted our audits in accordance with the standards of the Public Company Accounting Oversight Board (United States). Those standards require that we plan and perform the audits to obtain reasonable assurance about whether the financial statements and financial highlights are free of material misstatement. The Fund is not required to have, nor were we engaged to perform, an audit of its internal control over financial reporting. Our audits included consideration of internal control over financial reporting as a basis for designing audit procedures that are appropriate in the circumstances, but not for the purposes of expressing an opinion on the effectiveness of the Fund’s internal control over financial reporting. Accordingly, we express no such opinion. An audit includes examining, on a test basis, evidence supporting the amounts and disclosures in the financial statements. Our procedures included confirmation of securities owned as of October 31, 2015, by correspondence with the custodian and brokers. An audit also includes assessing the accounting principles used and significant estimates made by management, as well as evaluating the overall financial statement presentation. We believe that our audits provide a reasonable basis for our opinion.
In our opinion, the financial statements and financial highlights referred to above present fairly, in all material respects, the financial position of the Hennessy Technology Fund as of October 31, 2015, the results of its operations for the year then ended, the changes in its net assets for each of the two years in the period then ended, and the financial highlights for each of the five years in the period then ended, in conformity with accounting principles generally accepted in the United States of America.
Philadelphia, Pennsylvania
December 21, 2015
Trustees and Officers of the Fund (Unaudited)
The business and affairs of the Fund are managed under the direction of the Board of Trustees of the Trust, and the Board of Trustees elects the Officers of the Trust. Information pertaining to the Trustees and the Officers of the Trust is set forth below. Such persons serve until their successors are duly elected and qualified or until their earlier death, resignation, or removal. Each of the Trustees oversees 16 Hennessy Funds. Unless otherwise indicated, the address of all persons listed below is 7250 Redwood Boulevard, Suite 200, Novato, CA 94945. The Fund’s Statement of Additional Information includes more information about the persons listed below and is available, without charge, upon request by calling 1-800-966-4354.
| | | | Other |
| | | | Directorships |
| Name, Year of Birth, | | | (During Past |
| and Position Held | Length of | Principal Occupation(s) | Five Years) |
with the Trust | Time Served | During Past Five Years | Held by Trustee(1) |
| | | | |
| Disinterested Trustees | | | |
| | | | |
| J. Dennis DeSousa (1936) | Since January | Mr. DeSousa is a real estate investor. | Hennessy SPARX |
| Trustee | 1996 for the | | Funds Trust; |
| | Hennessy Funds | | Hennessy Mutual |
| | | | Funds, Inc.; and |
| | | | The Hennessy |
| | | | Funds, Inc. |
| | | | |
| Robert T. Doyle (1947) | Since January | Mr. Doyle has been the Sheriff of | Hennessy SPARX |
| Trustee | 1996 for the | Marin County, California since 1996. | Funds Trust; |
| | Hennessy Funds | | Hennessy Mutual |
| | | | Funds, Inc.; and |
| | | | The Hennessy |
| | | | Funds, Inc. |
| | | | |
| Gerald P. Richardson (1945) | Since May | Mr. Richardson is an independent | Hennessy SPARX |
| Trustee | 2004 for the | consultant in the securities industry. | Funds Trust; |
| | Hennessy Funds | | Hennessy Mutual |
| | | | Funds, Inc.; and |
| | | | The Hennessy |
| | | | Funds, Inc. |
| | | | |
Interested Trustee(2) | | | |
| | | | |
| Neil J. Hennessy (1956) | Since January | Mr. Hennessy has been employed by | Hennessy Advisors, |
| Trustee, Chairman of | 1996 as a Trustee | Hennessy Advisors, Inc., the Funds’ | Inc.; Hennessy |
| the Board, Chief | for the Hennessy | investment advisor, since 1989. | SPARX Funds Trust; |
| Investment Officer, | Funds and since | He currently serves as President, | Hennessy Mutual |
| Portfolio Manager, | June 2008 as | Chairman and Chief Executive Officer | Funds, Inc.; and |
| and President | an Officer of the | of Hennessy Advisors, Inc. | The Hennessy |
| | Hennessy Funds | | Funds, Inc. |
| HENNESSY FUNDS | 1-800-966-4354 | |
| Name, Year of Birth, | | |
| and Position Held | Length of | Principal Occupation(s) |
with the Trust | Time Served | During Past Five Years |
| | | |
| Officers | | |
| | | |
| Teresa M. Nilsen (1966) | Since January | Ms. Nilsen has been employed by Hennessy Advisors, Inc., |
| Executive Vice President | 1996 for the | the Funds’ investment advisor, since 1989. She currently |
| and Treasurer | Hennessy Funds | serves as Executive Vice President, Chief Operations Officer, |
| | | Chief Financial Officer, and Secretary of Hennessy Advisors, Inc. |
| | | |
| Daniel B. Steadman (1956) | Since March | Mr. Steadman has been employed by Hennessy Advisors, Inc., |
| Executive Vice President | 2000 for the | the Funds’ investment advisor, since 2000. He currently serves |
| and Secretary | Hennessy Funds | as Executive Vice President and Chief Compliance Officer of |
| | | Hennessy Advisors, Inc. |
| | | |
| Jennifer Cheskiewicz (1977) | Since June | Ms. Cheskiewicz has been employed by Hennessy Advisors, |
| Senior Vice President and | 2013 for the | Inc., the Funds’ investment advisor, since June 2013. She |
| Chief Compliance Officer | Hennessy Funds | currently serves as General Counsel of Hennessy Advisors, Inc. |
| | | She previously served as in-house counsel to Carlson Capital, |
| | | L.P., an SEC-registered investment advisor to several private |
| | | funds from February 2010 to May 2013. |
| | | |
| Brian Carlson (1972) | Since December | Mr. Carlson has been employed by Hennessy Advisors, Inc., the |
| Senior Vice President and | 2013 for the | Funds’ investment advisor, since December 2013. |
| Head of Distribution | Hennessy Funds | |
| | | Mr. Carlson was previously a co-founder and principal of |
| | | Trivium Consultants, LLC from February 2011 through |
| | | November 2013. |
| | | |
David Ellison (1958)(3) | Since October | Mr. Ellison has served as a Portfolio Manager of the Hennessy |
| Senior Vice President and | 2012 for the | Small Cap Financial Fund, the Hennessy Large Cap Financial |
| Portfolio Manager | Hennessy Funds | Fund, and the Hennessy Technology Fund since inception. |
| | | |
| | | Mr. Ellison previously served as Director, CIO and President of |
| | | FBR Fund Advisers, Inc. from December 1999 to October 2012. |
| | | |
| Brian Peery (1969) | Since March | Mr. Peery has served as a Portfolio Manager of the Hennessy |
| Senior Vice President and | 2003 as an | Cornerstone Growth Fund, the Hennessy Cornerstone Mid Cap |
| Portfolio Manager | Officer of the | 30 Fund, the Hennessy Cornerstone Large Growth Fund, the |
| | Hennessy Funds | Hennessy Cornerstone Value Fund, the Hennessy Total Return |
| | and since | Fund, and the Hennessy Balanced Fund since October 2014. |
| | February 2011 | From February 2011 through September 2014, he served as |
| | as a Co-Portfolio | Co-Portfolio Manager of the same funds. Mr. Peery has also |
| | Manager or | served as a Portfolio Manager of the Hennessy Gas Utility Fund |
| | Portfolio Manager | since February 2015. |
| | for the | |
| | Hennessy Funds | Mr. Peery has been employed by Hennessy Advisors, Inc., the |
| | | Funds’ investment advisor, since 2002. |
| | | |
| Winsor (Skip) Aylesworth | Since October | Mr. Aylesworth has served as a Portfolio Manager of the |
(1947)(3) | 2012 for the | Hennessy Gas Utility Fund since 1998 and as a Portfolio |
| Vice President and | Hennessy Funds | Manager of the Hennessy Technology Fund since inception. |
| Portfolio Manager | | |
| | | Mr. Aylesworth previously served as Executive Vice President |
| | | of The FBR Funds from 1999 to October 2012. |
| | | |
| Name, Year of Birth, | | |
| and Position Held | Length of | Principal Occupation(s) |
with the Trust | Time Served | During Past Five Years |
| | | |
Ryan Kelley (1972)(4) | Since March | Mr. Kelley has served as a Portfolio Manager of the Hennessy |
| Vice President and | 2013 for the | Gas Utility Fund, the Hennessy Small Cap Financial Fund, and |
| Portfolio Manager | Hennessy Funds | the Hennessy Large Cap Financial Fund since October 2014. |
| | | From March 2013 through September 2014, he served as a |
| | | Co-Portfolio Manager of the same funds. Prior to that, |
| | | he was a Portfolio Analyst of the Hennessy Funds. |
(1) | Pursuant to an internal reorganization, the series of Hennessy Mutual Funds, Inc. (“HMFI”), The Hennessy Funds, Inc. (“HFI”), and Hennessy SPARX Funds Trust (“HSFT”) were reorganized into series of Hennessy Funds Trust on February 28, 2014, which mirrored the corresponding series of HFMI, HFI, and HSFT. Subsequent to the reorganization, HFMI, HFI, and HSFT were dissolved. |
(2) | Mr. Hennessy is considered an “interested person,” as defined in the Investment Company Act of 1940, as amended, because he is an officer of the Hennessy Funds. |
(3) | The address of these officers is 101 Federal Street, Suite 1900, Boston, MA 02110. |
(4) | The address of this officer is 1340 Environ Way, Chapel Hill, NC 27517. |
| HENNESSY FUNDS | 1-800-966-4354 | |
Expense Example (Unaudited)
October 31, 2015
As a shareholder of the Fund, you incur two types of costs: (1) transaction costs, including sales charges (loads) on purchase payments, reinvested dividends, or other distributions; redemption fees; and exchange fees; and (2) ongoing costs, including management fees; service fees; and other Fund expenses. This Example is intended to help you understand your ongoing costs (in dollars) of investing in the Fund and to compare these costs with the ongoing costs of investing in other mutual funds. The Example is based on an investment of $1,000 invested at the beginning of the period and held for the entire period from May 1, 2015 through October 31, 2015.
Actual Expenses
The first line of the table below under the “Investor Class” and “Institutional Class” headings provides information about actual account values and actual expenses. Although the Fund charges no sales loads or transaction fees, you will be assessed fees for outgoing wire transfers, returned checks and stop payment orders at prevailing rates charged by U.S. Bancorp Fund Services, LLC, the Fund’s transfer agent. If you request that a redemption be made by wire transfer, currently a $15.00 fee is charged by the Fund’s transfer agent. IRA accounts will be charged a $15.00 annual maintenance fee. The example below includes, but is not limited to, management fees, shareholder servicing fees, fund accounting, custody, and transfer agent fees. However, the example below does not include portfolio trading commissions and related expenses, and other extraordinary expenses as determined under generally accepted accounting principles. You may use the information in this line, together with the amount you invested, to estimate the expenses that you paid over the period. Simply divide your account value by $1,000 (for example, an $8,600 account value divided by $1,000 = 8.6), then multiply the result by the number in the first line of the table under the “Investor Class” and “Institutional Class” headings in the column entitled “Expenses Paid During Period” to estimate the expenses you paid on your account during this period.
Hypothetical Example for Comparison Purposes
The second line of the table below under the “Investor Class” and “Institutional Class” headings provides information about hypothetical account values and hypothetical expenses based on the Fund’s actual expense ratios and an assumed rate of return of 5% per year before expenses, which is not the Fund’s actual return. The hypothetical account values and expenses may not be used to estimate the actual ending account balance or expenses you paid for the period. You may use this information to compare the ongoing costs of investing in the Fund and other funds. To do so, compare this 5% hypothetical example with the 5% hypothetical examples that appear in the shareholder reports of the other funds. Please note that the expenses shown in the table are meant to highlight your ongoing costs only and do not reflect any transactional costs, such as sales charges (loads), or exchange fees. Therefore, the second line of the table under the “Investor Class” and “Institutional Class” headings is useful in comparing ongoing costs only, and will not help you determine the relative total costs of owning different funds. In addition, if these transactional costs were included, your costs would have been higher.
| | | | Expenses Paid |
| | Beginning | Ending | During Period(1) |
| | Account Value | Account Value | May 1, 2015 – |
| | May 1, 2015 | October 31, 2015 | October 31, 2015 |
| Investor Class | | | |
| Actual | $1,000.00 | $1,005.20 | $16.38 |
| Hypothetical (5% return before expenses) | $1,000.00 | $1,008.87 | $16.41 |
| | | | |
| Institutional Class | | | |
| Actual | $1,000.00 | $1,007.10 | $14.27 |
| Hypothetical (5% return before expenses) | $1,000.00 | $1,010.99 | $14.29 |
(1) | Expenses are equal to the Fund’s annualized expense ratio of 3.24% for Investor Class shares or 2.82% for Institutional Class shares, as applicable, multiplied by the average account value over the period, multiplied by 184/365 days (to reflect one-half year period). |
| HENNESSY FUNDS | 1-800-966-4354 | |
How to Obtain a Copy of the Fund’s
Proxy Voting Policy and Proxy Voting Records
A description of the policies and procedures the Fund uses to determine how to vote proxies relating to portfolio securities is available without charge: (1) by calling 1-800-966-4354; (2) on the Hennessy Funds’ website at hennessyfunds.com/proxy-voting/policy.fs; or (3) on the U.S. Securities and Exchange Commission’s website at www.sec.gov. The Fund’s proxy voting record is available without charge on both the Hennessy Funds’ website at hennessyfunds.com/proxy-voting/policy.fs and the SEC’s website at www.sec.gov no later than August 31 for the prior 12 months ending June 30.
Quarterly Filings on Form N-Q
The Fund files its complete schedule of portfolio holdings with the SEC for the first and third quarters of each fiscal year on Form N-Q. The Fund’s Form N-Q will be available on the SEC’s website at www.sec.gov. The Fund’s Form N-Q may be reviewed and copied at the SEC’s Public Reference Room in Washington, DC and information on the operation of the Public Reference Room may be obtained by calling 1-800-SEC-0330. Information included in the Fund’s N-Q will also be available upon request by calling 1-800-966-4354.
Householding
To help keep the Fund’s costs as low as possible, we generally deliver a single copy of most financial reports and prospectuses to shareholders who share an address, even if the accounts are registered under different names. This process, known as “householding,” does not apply to account statements. You may, of course, request an individual copy of a prospectus or financial report at any time. If you would like to receive separate mailings, please call the Administrator at 1-800-261-6950 or 1-414-765-4124 and we will begin individual delivery within 30 days of your request. If your account is held through a financial institution or other intermediary, please contact them directly to request individual delivery.
Privacy Policy
| We collect the following non-public personal information about you: |
| | | |
| | • | information we receive from you on or in applications or other forms, correspondence, or conversations, including, but not limited to, your name, address, phone number, social security number, assets, income, and date of birth; and |
| | | |
| | • | information about your transactions with us, our affiliates, or others, including, but not limited to, your account number and balance, payment history, parties to transactions, cost basis information, and other financial information. |
We do not disclose any non-public personal information about our current or former shareholders to nonaffiliated third parties, except as permitted by law. For example, we are permitted by law to disclose all of the information we collect, as described above, to our Transfer Agent to process your transactions. Furthermore, we restrict access to your non-public personal information to those persons who require such information to provide products or services to you. We maintain physical, electronic, and procedural safeguards that comply with federal standards to guard your non-public personal information.
In the event that you hold shares of the Fund through a financial intermediary, including, but not limited to, a broker-dealer, bank or trust company, the privacy policy of your financial intermediary would govern how your non-public personal information would be shared with nonaffiliated third parties.
| HENNESSY FUNDS | 1-800-966-4354 | |
For information, questions or assistance, please call
The Hennessy Funds
1-800-966-4354 or 1-415-899-1555
INVESTMENT ADVISOR
Hennessy Advisors, Inc.
7250 Redwood Blvd., Suite 200
Novato, California 94945
ADMINISTRATOR,
TRANSFER AGENT,
DIVIDEND PAYING AGENT &
SHAREHOLDER SERVICING AGENT
U.S. Bancorp Fund Services, LLC
P.O. Box 701
Milwaukee, Wisconsin 53201-0701
CUSTODIAN
U.S. Bank N.A.
Custody Operations
1555 North River Center Dr., Suite 302
Milwaukee, Wisconsin 53212
TRUSTEES
Neil J. Hennessy
Robert T. Doyle
J. Dennis DeSousa
Gerald P. Richardson
COUNSEL
Foley & Lardner LLP
777 East Wisconsin Avenue
Milwaukee, Wisconsin 53202-5306
INDEPENDENT REGISTERED
PUBLIC ACCOUNTING FIRM
Tait, Weller & Baker LLP
1818 Market Street, Suite 2400
Philadelphia, Pennsylvania 19103
DISTRIBUTOR
Quasar Distributors, LLC
615 East Michigan Street
Milwaukee, Wisconsin 53202
hennessyfunds.com | 1-800-966-4354
This report has been prepared for shareholders and may be distributed to
others only if preceded or accompanied by a current prospectus.
ANNUAL REPORT
OCTOBER 31, 2015
HENNESSY JAPAN FUND
Investor Class HJPNX
Institutional Class HJPIX
hennessyfunds.com | 1-800-966-4354
(This Page Intentionally Left Blank.)
Contents
| Letter to Shareholders | 2 |
| Performance Overview | 4 |
| Financial Statements | |
| Schedule of Investments | 7 |
| Statement of Assets and Liabilities | 11 |
| Statement of Operations | 12 |
| Statements of Changes in Net Assets | 13 |
| Financial Highlights | 14 |
| Notes to the Financial Statements | 18 |
| Report of Independent Registered Public Accounting Firm | 26 |
| Trustees and Officers of the Fund | 27 |
| Expense Example | 30 |
| Proxy Voting | 32 |
| Quarterly Filings on Form N-Q | 32 |
| Householding | 32 |
| Matters Submitted to a Shareholder Vote | 32 |
| Privacy Policy | 33 |
| HENNESSY FUNDS | 1-800-966-4354 | |
December, 2015
Dear Hennessy Funds Shareholder:
The U.S. market has been in a volatile, sideways correction for over a year now as investors brace themselves for the first rise in short-term interest rates in almost a decade. The Japanese market also experienced some volatility, especially towards the end of the year when fear of slower growth in China, Japan’s largest trading partner, dominated investor thinking. Nevertheless, we continue to believe that as long as the Fed does not raise interest rates too significantly, and low inflation suggests that it won’t, global economies should continue their steady expansion, thereby providing a stable environment for Japan and its program of macroeconomic stimulus and structural reform.
Both the Nikkei 225 Index and the TOPIX Index finished the 12-month period ended October 31, 2015 higher, returning 10.00% and 10.22%, respectively in U.S. Dollar terms. During the year, the Nikkei 225 Index surpassed its old high established in 2007, the first time the index has overtaken a previous high since 1994. The end of this fiscal year marks the third consecutive year that the index has closed in positive territory.
The initial results of Japan’s economic strategy, known as “Abenomics,” were clearly visible this year. The Bank of Japan’s quantitative easing measures, which have caused the yen to weaken, have resulted in an almost three-fold increase in foreign visitors to Japan over the last three years and have caused the balance of trade to move steadily towards a surplus. We believe that tourism will continue to help drive economic strength in Japan, especially in 2020 when Japan will host the Olympics. And while the inflation rate slipped in the second half of the year, real wage growth achieved marked acceleration this year, recording positive growth in five of the last six months. Corporate profits reached a new high, posting growth of 24% in the quarter ended in June, and even capital spending, after years of contraction, is growing again.
Perhaps this year’s most important new reform under Abenomics was the introduction of the Corporate Governance Code in June. This initiative aims to unlock the shareholder value buried within many of Japan’s corporations. The Code provides for the elimination of cross-shareholdings between large Japanese companies, which was often a way to entrench and protect management and majority owners at the expense of general shareholders and the value of their investments. The Code also proposes a reduction in the use of poison pills, opening up inefficiently run companies to the possibility of being taken over. For the first time, listed Japanese companies will need to have two experienced, independent directors sitting on their boards. The Code is not legally binding, but we expect its “comply or explain” implementation approach to be very effective in Japan. Moreover, it appears that the voice of minority shareholders and investors is increasingly being heard in boardrooms. As a consequence of these structural changes, “friendly,” Japanese-style, activist investment strategies, uncommon in Japan in the past, are starting to emerge.
In addition, Japan’s equity market received a boost this year when the Government Pension Investment Fund (GPIF) announced a dramatic asset allocation shift away from Japanese government bond investments towards Japanese and foreign equities. Retail investors’ participation in the market is also growing as the number of participants in the recently introduced Nippon Individual Savings Account program continues to increase.
We remain optimistic about the long-term prospects for Japan and its stock market. In our view Abenomics’ various structural reforms and growth strategies are clearly beginning to deliver tangible results in the form of a strengthening labor market, increased investment, an improving balance of trade and robust growth of corporate profits.
Thank you for your continued confidence and investment in our products. If you have any questions or would like to speak with us directly, please don’t hesitate to call us at (800) 966-4354.
Sincerely,
Neil J. Hennessy
President and Chief Investment Officer
Hennessy Funds
 |  |
| | |
| Tadahiro Fujimura | Masakazu Takeda |
| Portfolio Manager, | Portfolio Manager, |
| Hennessy Japan Small Cap Fund; | Hennessy Japan Fund; |
| Head of Investment & Research | Fund Manager |
| and Sr. Portfolio Manager | SPARX Asset Management Co., Ltd. |
| SPARX Asset Management Co., Ltd. | |
SPARX Asset Management Co., Ltd., located in Tokyo, Japan, is the sub-advisor to the Hennessy Japan Fund and the Hennessy Japan Small Cap Fund.
Past performance does not guarantee future results.
Mutual fund investing involves risk. Principal loss is possible.
Opinions expressed are those of Neil Hennessy, Tadahiro Fujimura and Masakazu Takeda and are subject to change, are not guaranteed and should not be considered investment advice.
The Nikkei 225 and Tokyo Stock Price Index (TOPIX) are unmanaged indices commonly used to measure the performance of Japanese stocks. One cannot invest directly in an index.
| HENNESSY FUNDS | 1-800-966-4354 | |
Performance Overview (Unaudited)
CHANGE IN VALUE OF $10,000 INVESTMENT
This graph illustrates the performance of an initial investment of $10,000 made in the Fund ten years ago and assumes the reinvestment of dividends.
AVERAGE ANNUAL TOTAL RETURN FOR PERIODS ENDED OCTOBER 31, 2015
| | One | Five | Ten |
| | Year | Years | Years |
| Hennessy Japan Fund – | | | |
| Investor Class (HJPNX) | 10.56% | 13.82% | 3.75% |
| Hennessy Japan Fund – | | | |
| Institutional Class (HJPIX) | 10.84% | 14.15% | 3.94% |
| Russell/Nomura Total | | | |
MarketTM Index | 9.79% | 7.32% | 2.33% |
| Tokyo Price Index (TOPIX) | 10.22% | 7.16% | 2.22% |
Expense ratios: 1.64% (Investor Class); 1.44% (Institutional Class)
Performance data quoted represents past performance; past performance does not guarantee future results. The investment return and principal value of an investment will fluctuate so that an investor’s shares, when redeemed, may be worth more or less than their original cost. The performance graph and table do not reflect the deduction of taxes that a shareholder would pay on Fund distributions or the redemption of Fund shares. Current performance of the Fund may be lower or higher than the performance quoted. Performance data current to the most recent month end may be obtained by visiting hennessyfunds.com.
The expense ratios presented are from the most recent prospectus.
PERFORMANCE NARRATIVE
Portfolio Managers Masakazu Takeda, CFA and CMA*, and Yu Shimizu, CMA* SPARX Asset Management Co., Ltd. (sub-advisor)
Performance:
For the twelve-month period ended October 31, 2015, the Investor Class of the Hennessy Japan Fund returned 10.56%, outperforming the Russell/Nomura Total Market™ Index and the Tokyo Stock Price Index (TOPIX), which returned 9.79% and 10.22% for the same period, respectively (in U.S. Dollar terms).
The largest positive contributors to the Fund’s performance among the 33 TOPIX sub-industries were investments in miscellaneous product companies (including baby care product manufacturers and athletic shoe makers), transportation equipment companies and electric appliances makers. Conversely, our investments in the information & communication sector performed negatively during the twelve-month period.
Among the strongest performing stocks in the Fund during the period were Ryohin Keikaku Co. Ltd., a “MUJI” retail store operator, Misumi Group, Inc., a manufacturer and distributor of metal mold components and precision machinery parts, Kao Corporation, a producer of cosmetics, detergents, hygiene products and cooking oils, and Shimano, Inc., a global market share leading bicycle parts manufacturer. Shares of Misumi Group performed well on the back of good earnings. Shares of Kao Corp. gained amid solid earnings growth backed by stable growth in their domestic business and growing Asian sales. Solid earnings and strong franchises have led to steady share appreciation of both Shimano and Ryohin Keikaku. The Fund continues to hold all of these positions.
One of the most significant detractors from the Fund’s performance was SoftBank Group Corp, one of Japan’s three mobile carriers. SoftBank, a new investment for the portfolio added in the third quarter, suffered from negative industry news, the eruption of price wars and the possibility of a Government-ordered plan to reduce wireless fees. The company is headed by its charismatic founder/president, Mr. Masayoshi Son, a 58-year old entrepreneur, who boasts an insatiable ambition to continue growing his firm globally for many years to come. We view the decline in the stock price of Softbank as a good opportunity to make a long-term investment in a company run by someone who we believe to be one of Japan’s best business leaders at an attractive price, and we feel that the potential risk-return profile of this investment is in our favor. The Fund continues to hold this position.
Investment Outlook:
We believe that Japan’s corporate profits will remain robust for the next few years thanks to a favorable exchange rate environment, as exporters today are generating far greater cash flows than they were four to five years ago when the Japanese yen (JPY) exchange rate was below 80 USD/JPY. These exporters had been streamlining their cost structure to stay profitable at rates around 75 USD/JPY, so in the current environment they are awash with cash. It is important to note that a lot of this cash flow is now being invested back into the companies in activities such as overseas capacity expansion, domestic production facility upgrades, and R&D projects. We expect this positive trend to continue to improve the competitive strength of the Japanese corporate sector even with no further depreciation of the JPY. As for domestic-oriented companies, two factors make us optimistic. First, we believe the negative effect of the sales tax increase that took effect in April 2014 is wearing off. Secondly, foreign inbound tourists continue to push up domestic consumption, a strong trend we see continuing in Japan with the yen at current levels.
Overall, we feel confident about the outlook for the Japanese economy, the Japanese stock market and the companies we hold as investments in the Fund. We will continue to seek and hold what we believe are high-quality, globally-oriented Japanese companies with smart management and time-tested business models.
| * | Chartered Member of the Security Analysts Association of Japan |
Opinions expressed are those of the Portfolio Managers as of the date written and are subject to change, are not guaranteed, and should not be considered investment advice or an indication of trading intent.
| HENNESSY FUNDS | 1-800-966-4354 | |
The Russell/Nomura Total Market™ Index contains the top 98% of all stocks listed on Japan’s stock exchange and registered on Japan’s OTC market in terms of market capitalization. The Tokyo Price Index (TOPIX) is a market capitalization-weighted index of all companies listed on the First Section of the Tokyo Stock Exchange. One cannot invest directly in an index.
The Fund may invest in small and medium capitalized companies, which may have more limited liquidity and greater price volatility than large capitalization companies. The Fund invests in the stocks of companies operating in Japan; single-country funds may be subject to a higher degree of risk. The Fund may experience higher fees due to investments in pooled investment vehicles (including ETFs).
References to specific securities should not be considered a recommendation to buy or sell any security. Fund holdings and sector allocations are subject to change. Please refer to the Schedule of Investments included in this report for additional portfolio information.
Earnings growth is not a measure of the Fund’s future performance. Cash flow can be used as an indication of a company’s financial strength and represents earnings before depreciation, amortization, and non-cash charges.
Financial Statements
Schedule of Investments as of October 31, 2015 |
HENNESSY JAPAN FUND
(% of Net Assets)
| TOP TEN HOLDINGS (EXCLUDING CASH/CASH EQUIVALENTS) | % NET ASSETS |
| Shimano, Inc. | 6.70% |
| Terumo Corp. | 6.69% |
| Keyence Corp. | 6.39% |
| Ryohin Keikaku Co., Ltd. | 5.88% |
| Unicharm Corp. | 5.67% |
| Softbank Group Co. | 5.60% |
| Nidec Corp. | 5.47% |
| Misumi Group, Inc. | 5.40% |
| Kao Corp. | 5.37% |
| Asics Corp. | 5.27% |
Note: For presentation purposes, the Fund has grouped some of the industry categories. For purposes of categorizing securities for compliance with Section 8(b)(1) of the Investment Company Act of 1940, as amended, the Fund uses more specific industry classifications.
| HENNESSY FUNDS | 1-800-966-4354 | |
| COMMON STOCKS – 94.07% | | Number | | | | | | % of | |
| | | of Shares | | | Value | | | Net Assets | |
| Consumer Discretionary – 23.60% | | | | | | | | | |
| Asics Corp. | | | 220,600 | | | $ | 6,093,126 | | | | 5.27 | % |
| Isuzu Motors, Ltd. | | | 441,700 | | | | 5,158,845 | | | | 4.46 | % |
| Ryohin Keikaku Co., Ltd. | | | 33,900 | | | | 6,807,020 | | | | 5.88 | % |
| Shimano, Inc. | | | 49,200 | | | | 7,752,374 | | | | 6.70 | % |
| Toyota Motor Corp. | | | 24,400 | | | | 1,494,852 | | | | 1.29 | % |
| | | | | | | | 27,306,217 | | | | 23.60 | % |
| | | | | | | | | | | | | |
| Consumer Staples – 12.99% | | | | | | | | | | | | |
| Kao Corp. | | | 121,100 | | | | 6,217,196 | | | | 5.37 | % |
| Pigeon Corp. | | | 80,500 | | | | 2,255,520 | | | | 1.95 | % |
| Unicharm Corp. | | | 307,000 | | | | 6,556,374 | | | | 5.67 | % |
| | | | | | | | 15,029,090 | | | | 12.99 | % |
| | | | | | | | | | | | | |
| Financials – 3.46% | | | | | | | | | | | | |
| Mizuho Financial Group | | | 596,700 | | | | 1,229,109 | | | | 1.06 | % |
| Sumitomo Mitsui Financial Group, Inc. | | | 69,600 | | | | 2,776,599 | | | | 2.40 | % |
| | | | | | | | 4,005,708 | | | | 3.46 | % |
| | | | | | | | | | | | | |
| Health Care – 11.89% | | | | | | | | | | | | |
| Rohto Pharmaceutical Co., Ltd. | | | 364,400 | | | | 6,012,043 | | | | 5.20 | % |
| Terumo Corp. | | | 261,000 | | | | 7,743,878 | | | | 6.69 | % |
| | | | | | | | 13,755,921 | | | | 11.89 | % |
| | | | | | | | | | | | | |
| Industrials – 25.89% | | | | | | | | | | | | |
| Daikin Industries | | | 85,200 | | | | 5,474,183 | | | | 4.73 | % |
| Kubota Corp. | | | 354,000 | | | | 5,487,517 | | | | 4.74 | % |
| Misumi Group, Inc. | | | 480,000 | | | | 6,250,609 | | | | 5.40 | % |
| Mitsubishi Corp. | | | 318,000 | | | | 5,781,430 | | | | 5.00 | % |
| Nidec Corp. | | | 83,900 | | | | 6,322,377 | | | | 5.47 | % |
| Sumitomo Corp. | | | 57,600 | | | | 629,987 | | | | 0.55 | % |
| | | | | | | | 29,946,103 | | | | 25.89 | % |
| | | | | | | | | | | | | |
| Information Technology – 6.39% | | | | | | | | | | | | |
| Keyence Corp. | | | 14,200 | | | | 7,392,641 | | | | 6.39 | % |
| | | | | | | | | | | | | |
| Materials – 4.25% | | | | | | | | | | | | |
| Fuji Seal International, Inc. | | | 144,800 | | | | 4,916,047 | | | | 4.25 | % |
The accompanying notes are an integral part of these financial statements.
| COMMON STOCKS | | Number | | | | | | % of | |
| | | of Shares | | | Value | | | Net Assets | |
| Telecommunication Services – 5.60% | | | | | | | | | |
| Softbank Group Co. | | | 115,600 | | | $ | 6,476,827 | | | | 5.60 | % |
| | | | | | | | | | | | | |
| Total Common Stocks | | | | | | | | | | | | |
| (Cost $86,628,919) | | | | | | | 108,828,554 | | | | 94.07 | % |
| | | | | | | | | | | | | |
| SHORT-TERM INVESTMENTS – 5.26% | | | | | | | | | | | | |
| | | | | | | | | | | | | |
| Money Market Funds – 5.26% | | | | | | | | | | | | |
| Federated Government Obligations Fund – Class I, 0.01% (a) | | | 449,311 | | | | 449,311 | | | | 0.39 | % |
| Fidelity Government Portfolio – Institutional Class, 0.01% (a) | | | 5,639,000 | | | | 5,639,000 | | | | 4.87 | % |
| | | | | | | | 6,088,311 | | | | 5.26 | % |
| | | | | | | | | | | | | |
| Total Short-Term Investments | | | | | | | | | | | | |
| (Cost $6,088,311) | | | | | | | 6,088,311 | | | | 5.26 | % |
| | | | | | | | | | | | | |
| Total Investments | | | | | | | | | | | | |
| (Cost $92,717,230) – 99.33% | | | | | | | 114,916,865 | | | | 99.33 | % |
| Other Assets in | | | | | | | | | | | | |
| Excess of Liabilities – 0.67% | | | | | | | 771,669 | | | | 0.67 | % |
TOTAL NET ASSETS – 100.00% | | | | | | $ | 115,688,534 | | | | 100.00 | % |
Percentages are stated as a percent of net assets.
| (a) | The rate listed is the fund’s 7-day yield as of October 31, 2015. |
The accompanying notes are an integral part of these financial statements.
| HENNESSY FUNDS | 1-800-966-4354 | |
Summary of Fair Value Exposure at October 31, 2015
The following is a summary of the inputs used to value the Fund’s net assets as of October 31, 2015 (see Note 3 in the accompanying notes to the financial statements):
| Common Stocks | | Level 1 | | | Level 2 | | | Level 3 | | | Total | |
| Consumer Discretionary | | $ | — | | | $ | 27,306,217 | | | $ | — | | | $ | 27,306,217 | |
| Consumer Staples | | | — | | | | 15,029,090 | | | | — | | | | 15,029,089 | |
| Financials | | | — | | | | 4,005,708 | | | | — | | | | 4,005,709 | |
| Health Care | | | — | | | | 13,755,921 | | | | — | | | | 13,755,920 | |
| Industrials | | | — | | | | 29,946,103 | | | | — | | | | 29,946,104 | |
| Information Technology | | | — | | | | 7,392,641 | | | | — | | | | 7,392,641 | |
| Materials | | | — | | | | 4,916,047 | | | | — | | | | 4,916,047 | |
| Telecommunication Services | | | — | | | | 6,476,827 | | | | — | | | | 6,476,827 | |
| Total Common Stocks | | $ | — | | | $ | 108,828,554 | | | $ | — | | | $ | 108,828,554 | |
| Short-Term Investments | | | | | | | | | | | | | | | | |
| Money Market Funds | | $ | 6,088,311 | | | $ | — | | | $ | — | | | $ | 6,088,311 | |
| Total Short-Term Investments | | $ | 6,088,311 | | | $ | — | | | $ | — | | | $ | 6,088,311 | |
| Total Investments | | $ | 6,088,311 | | | $ | 108,828,554 | | | $ | — | | | $ | 114,916,865 | |
Transfers between levels are recognized at the end of the reporting period. During the year ended October 31, 2015, the Fund recognized no transfers between levels.
Transfers between Level 1 and Level 2 relate to the use of a fair valuation pricing service. On days when the fair valuation pricing service is used, non-U.S. dollar denominated securities move from a Level 1 to a Level 2 classification.
The accompanying notes are an integral part of these financial statements.
Financial Statements
Statement of Assets and Liabilities as of October 31, 2015 |
| ASSETS: | | | |
| Investments in securities, at value (cost $92,717,230) | | $ | 114,916,865 | |
| Dividends and interest receivable | | | 551,818 | |
| Receivable for fund shares sold | | | 384,060 | |
| Prepaid expenses and other assets | | | 33,051 | |
| Total Assets | | | 115,885,794 | |
| | | | | |
| LIABILITIES: | | | | |
| Payable for fund shares redeemed | | | 25,289 | |
| Payable to advisor | | | 96,122 | |
| Payable to administrator | | | 18,939 | |
| Payable to auditor | | | 22,099 | |
| Accrued service fees | | | 4,971 | |
| Accrued trustees fees | | | 2,368 | |
| Accrued expenses and other payables | | | 27,472 | |
| Total Liabilities | | | 197,260 | |
| NET ASSETS | | $ | 115,688,534 | |
| | | | | |
| NET ASSETS CONSIST OF: | | | | |
| Capital stock | | $ | 123,373,029 | |
| Accumulated net investment loss | | | (199,598 | ) |
| Accumulated net realized loss on investments | | | (29,678,784 | ) |
| Unrealized net appreciation on investments | | | 22,193,887 | |
| Total Net Assets | | $ | 115,688,534 | |
| | | | | |
| NET ASSETS | | | | |
| Investor Class: | | | | |
| Shares authorized (no par value) | | Unlimited | |
| Net assets applicable to outstanding Investor Class shares | | $ | 61,555,066 | |
| Shares issued and outstanding | | | 2,556,893 | |
| Net asset value, offering price and redemption price per share | | $ | 24.07 | |
| | | | | |
| Institutional Class: | | | | |
| Shares authorized (no par value) | | Unlimited | |
| Net assets applicable to outstanding Institutional Class shares | | $ | 54,133,468 | |
| Shares issued and outstanding | | | 2,205,027 | |
| Net asset value, offering price and redemption price per share | | $ | 24.55 | |
The accompanying notes are an integral part of these financial statements.
| HENNESSY FUNDS | 1-800-966-4354 | |
Financial Statements
Statement of Operations for the year ended October 31, 2015 |
| INVESTMENT INCOME: | | | |
Dividend income(1) | | $ | 1,111,655 | |
| Interest income | | | 2,989 | |
| Total investment income | | | 1,114,644 | |
| | | | | |
| EXPENSES: | | | | |
| Investment advisory fees (See Note 5) | | | 986,467 | |
| Sub-transfer agent expenses – Investor Class (See Note 5) | | | 121,094 | |
| Sub-transfer agent expenses – Institutional Class (See Note 5) | | | 22,792 | |
| Administration, fund accounting, custody and transfer agent fees (See Note 5) | | | 96,772 | |
| Service fees – Investor Class (See Note 5) | | | 56,262 | |
| Federal and state registration fees | | | 36,303 | |
| Audit fees | | | 22,756 | |
| Compliance expense | | | 22,186 | |
| Trustees’ fees and expenses | | | 11,501 | |
| Reports to shareholders | | | 11,132 | |
| Legal fees | | | 2,000 | |
| Other expenses | | | 7,759 | |
| Total expenses | | | 1,397,024 | |
| NET INVESTMENT LOSS | | $ | (282,380 | ) |
| | | | | |
| REALIZED AND UNREALIZED GAINS (LOSSES): | | | | |
| Net realized loss on investments | | $ | (1,416,806 | ) |
| Net change in unrealized appreciation on investments | | | 8,195,283 | |
| Net gain on investments | | | 6,778,477 | |
| NET INCREASE IN NET ASSETS RESULTING FROM OPERATIONS | | $ | 6,496,097 | |
(1) | Net of foreign taxes withheld of $123,420. |
The accompanying notes are an integral part of these financial statements.
Financial Statements
| Statements of Changes in Net Assets |
| | | Year Ended | | | Year Ended | |
| | | October 31, 2015 | | | October 31, 2014 | |
| OPERATIONS: | | | | | | |
| Net investment loss | | $ | (282,380 | ) | | $ | (22,653 | ) |
| Net realized gain (loss) on investments | | | (1,416,806 | ) | | | 35,041 | |
| Net change in unrealized appreciation on investments | | | 8,195,283 | | | | 4,120,841 | |
| Net increase in net assets resulting from operations | | | 6,496,097 | | | | 4,133,229 | |
| | | | | | | | | |
| CAPITAL SHARE TRANSACTIONS: | | | | | | | | |
| Proceeds from shares subscribed – Investor Class | | | 81,988,307 | | | | 36,361,617 | |
| Proceeds from shares subscribed – Institutional Class | | | 51,273,095 | | | | 17,108,322 | |
| Cost of shares redeemed – Investor Class | | | (51,758,304 | ) | | | (42,817,348 | ) |
| Cost of shares redeemed – Institutional Class | | | (25,324,220 | ) | | | (2,165,295 | ) |
| Net increase in net assets derived | | | | | | | | |
| from capital share transactions | | | 56,178,878 | | | | 8,487,296 | |
| TOTAL INCREASE IN NET ASSETS | | | 62,674,975 | | | | 12,620,525 | |
| | | | | | | | | |
| NET ASSETS: | | | | | | | | |
| Beginning of year | | | 53,013,559 | | | | 40,393,034 | |
| End of year | | $ | 115,688,534 | | | $ | 53,013,559 | |
| Accumulated net investment loss, end of year | | $ | (199,598 | ) | | $ | — | |
| | | | | | | | | |
| CHANGES IN SHARES OUTSTANDING: | | | | | | | | |
| Shares sold – Investor Class | | | 3,548,664 | | | | 1,798,658 | |
| Shares sold – Institutional Class | | | 2,147,233 | | | | 815,136 | |
| Shares redeemed – Investor Class | | | (2,244,158 | ) | | | (2,137,867 | ) |
| Shares redeemed – Institutional Class | | | (1,104,942 | ) | | | (106,517 | ) |
| Net increase in shares outstanding | | | 2,346,797 | | | | 369,410 | |
The accompanying notes are an integral part of these financial statements.
| HENNESSY FUNDS | 1-800-966-4354 | |
Financial Statements
For an Investor Class share outstanding throughout each year
PER SHARE DATA:
Net asset value, beginning of year
Income from investment operations:
Net investment loss
Net realized and unrealized gains on investments
Total from investment operations
Less distributions:
Dividends from net investment income
Dividends from return of capital
Total distributions
Net asset value, end of year
TOTAL RETURN
SUPPLEMENTAL DATA AND RATIOS:
Net assets, end of year (millions)
Ratio of expenses to average net assets
Ratio of net investment loss to average net assets
Portfolio turnover rate(1)
(1) | Portfolio turnover is calculated on the basis of the Fund as a whole. |
The accompanying notes are an integral part of these financial statements.
| Year Ended October 31, | |
| 2015 | | | 2014 | | | 2013 | | | 2012 | | | 2011 | |
| | | | | | | | | | | | | |
| $ | 21.77 | | | $ | 19.68 | | | $ | 15.40 | | | $ | 13.99 | | | $ | 12.58 | |
| | | | | | | | | | | | | | | | | | | |
| | | | | | | | | | | | | | | | | | | |
| | (0.10 | ) | | | (0.06 | ) | | | (0.04 | ) | | | (0.02 | ) | | | (0.10 | ) |
| | 2.40 | | | | 2.15 | | | | 4.33 | | | | 1.43 | | | | 1.51 | |
| | 2.30 | | | | 2.09 | | | | 4.29 | | | | 1.41 | | | | 1.41 | |
| | | | | | | | | | | | | | | | | | | |
| | | | | | | | | | | | | | | | | | | |
| | — | | | | — | | | | — | | | | — | | | | — | |
| | — | | | | — | | | | (0.01 | ) | | | — | | | | — | |
| | — | | | | — | | | | (0.01 | ) | | | — | | | | — | |
| $ | 24.07 | | | $ | 21.77 | | | $ | 19.68 | | | $ | 15.40 | | | $ | 13.99 | |
| | | | | | | | | | | | | | | | | | | |
| | 10.56 | % | | | 10.62 | % | | | 27.87 | % | | | 10.08 | % | | | 11.21 | % |
| | | | | | | | | | | | | | | | | | | |
| | | | | | | | | | | | | | | | | | | |
| $ | 61.56 | | | $ | 27.26 | | | $ | 31.32 | | | $ | 10.38 | | | $ | 14.81 | |
| | 1.53 | % | | | 1.70 | % | | | 1.90 | % | | | 2.03 | % | | | 1.86 | % |
| | (0.44 | )% | | | (0.18 | )% | | | (0.35 | )% | | | (0.09 | )% | | | (0.54 | )% |
| | 21 | % | | | 22 | % | | | 6 | % | | | 2 | % | | | 166 | % |
The accompanying notes are an integral part of these financial statements.
| HENNESSY FUNDS | 1-800-966-4354 | |
Financial Statements
For an Institutional Class share outstanding throughout each year
PER SHARE DATA:
Net asset value, beginning of year
Income from investment operations:
Net investment income (loss)
Net realized and unrealized gains on investments
Total from investment operations
Less distributions:
Dividends from net investment income
Dividends from return of capital
Total distributions
Net asset value, end of year
TOTAL RETURN
SUPPLEMENTAL DATA AND RATIOS:
Net assets, end of year (millions)
Ratio of expenses to average net assets
Ratio of net investment income to average net assets
Portfolio turnover rate(1)
(1) | Portfolio turnover is calculated on the basis of the Fund as a whole. |
The accompanying notes are an integral part of these financial statements.
| Year Ended October 31, | |
| 2015 | | | 2014 | | | 2013 | | | 2012 | | | 2011 | |
| | | | | | | | | | | | | |
| $ | 22.15 | | | $ | 19.98 | | | $ | 15.60 | | | $ | 14.14 | | | $ | 12.66 | |
| | | | | | | | | | | | | | | | | | | |
| | | | | | | | | | | | | | | | | | | |
| | (0.02 | ) | | | 0.07 | | | | (0.03 | ) | | | 0.02 | | | | 0.03 | |
| | 2.42 | | | | 2.10 | | | | 4.42 | | | | 1.44 | | | | 1.45 | |
| | 2.40 | | | | 2.17 | | | | 4.39 | | | | 1.46 | | | | 1.48 | |
| | | | | | | | | | | | | | | | | | | |
| | | | | | | | | | | | | | | | | | | |
| | — | | | | — | | | | — | | | | — | | | | — | |
| | — | | | | — | | | | (0.01 | ) | | | — | | | | — | |
| | — | | | | — | | | | (0.01 | ) | | | — | | | | — | |
| $ | 24.55 | | | $ | 22.15 | | | $ | 19.98 | | | $ | 15.60 | | | $ | 14.14 | |
| | | | | | | | | | | | | | | | | | | |
| | 10.84 | % | | | 10.86 | % | | | 28.19 | % | | | 10.33 | % | | | 11.69 | % |
| | | | | | | | | | | | | | | | | | | |
| | | | | | | | | | | | | | | | | | | |
| $ | 54.13 | | | $ | 25.75 | | | $ | 9.07 | | | $ | 8.94 | | | $ | 9.70 | |
| | 1.27 | % | | | 1.50 | % | | | 1.66 | % | | | 1.85 | % | | | 1.64 | % |
| | (0.08 | )% | | | 0.26 | % | | | (0.20 | )% | | | 0.13 | % | | | 0.19 | % |
| | 21 | % | | | 22 | % | | | 6 | % | | | 2 | % | | | 166 | % |
The accompanying notes are an integral part of these financial statements.
| HENNESSY FUNDS | 1-800-966-4354 | |
Financial Statements
Notes to the Financial Statements October 31, 2015 |
1). ORGANIZATION
The Hennessy Japan Fund (the “Fund”) is a series of Hennessy Funds Trust (the “Trust”), which was organized as a Delaware statutory trust on September 17, 1992. The Fund is an open-end management investment company registered under the Investment Company Act of 1940, as amended. The Fund is a successor to a fund with the same name (the “Predecessor Fund”) that was a series of Hennessy SPARX Funds Trust, a Massachusetts business trust, pursuant to a reorganization that took place after the close of business on February 28, 2014. Prior to February 28, 2014, the Fund had no investment operations. As a result of the reorganization, holders of the Investor Class shares of the Predecessor Fund received Investor Class shares of the Fund (the Investor Class shares of the Fund are the successor to the accounting and performance information of the Predecessor Fund), and holders of the Institutional Class shares of the Predecessor Fund received Institutional Class shares of the Fund (the Institutional Class shares of the Fund are the successor to the accounting and performance information of the Predecessor Fund). The investment objective of the Fund is long-term capital appreciation. The Fund is a diversified fund, but may employ a relatively focused investment strategy and may hold securities of fewer issuers than other diversified funds.
| The Fund offers Investor Class and Institutional Class shares. Each class of shares differs principally in its respective administration, shareholder servicing, and transfer agent expenses and sales charges, if any. Each class has identical rights to earnings, assets, and voting privileges, except for class-specific expenses and exclusive rights to vote on matters affecting only an individual class. |
| |
| As an investment company, the Fund follows the investment company accounting and reporting guidance of the Financial Accounting Standards Board (“FASB”) Accounting Standard Codification Topic 946 “Financial Services—Investment Companies.” |
2). SIGNIFICANT ACCOUNTING POLICIES
The following is a summary of significant accounting policies consistently followed by the Fund in the preparation of the financial statements. These policies are in conformity with U.S. generally accepted accounting principles (“GAAP”).
| a). | Investment Valuation – All investments in securities are recorded at their estimated fair value, as described in Note 3. |
| | |
| b). | Federal Income Taxes – Provision for federal income taxes or excise taxes has not been made since the Fund has elected to be taxed as a “regulated investment company” and intends to distribute substantially all of its taxable income to its shareholders and otherwise comply with the provisions of the Internal Revenue Code of 1986, as amended, applicable to regulated investment companies. Net investment income or loss and realized gains and losses for federal income tax purposes may differ from that reported on the financial statements because of temporary book and tax basis differences. Temporary differences are primarily the result of the treatment of wash sales for tax reporting purposes. The Fund recognizes interest and penalties related to income tax benefits, if any, in the statement of operations as an income tax expense. Distributions from net realized gains for book purposes may include short-term capital gains, which are included as ordinary income to shareholders for tax purposes. |
| | Due to inherent differences in the recognition of income, expenses, and realized gains/losses under GAAP and federal income tax regulations, permanent differences between book and tax basis reporting for the 2015 fiscal year have been identified and appropriately reclassified on the Statement of Assets and Liabilities. The adjustments are as follows: |
| Undistributed | Accumulated | |
| Net Investment | Net Realized | |
Income/(Loss) | Gain/(Loss) | Paid-in Capital |
| $82,782 | $4,999,547 | $(5,082,329) |
| c). | Income and Expenses – Dividend income is recognized on the ex-dividend date or as soon as information is available to the Fund. Interest income, which includes the amortization of premium and accretion of discount, is recognized on an accrual basis. The Fund is charged for those expenses that are directly attributable to the portfolio, such as advisory, administration, and certain shareholder service fees. Income, expenses (other than expenses attributable to a specific class), and realized and unrealized gains or losses on investments are allocated to each class of shares based on its respective net assets. |
| | |
| d). | Distributions to Shareholders – Dividends from net investment income for the Fund, if any, are declared and paid annually, usually in December. Distributions of net realized capital gains, if any, are declared and paid annually, usually in December. |
| | |
| e). | Security Transactions – Investment and shareholder transactions are recorded on the trade date. The Fund determines the gain or loss realized from the investment transactions by comparing the original cost of the security lot sold with the net sale proceeds. Discounts and premiums on securities purchased are accreted/amortized over the life of the respective security. |
| | |
| f). | Use of Estimates – The preparation of financial statements in conformity with GAAP requires management to make estimates and assumptions that affect the reported amounts of assets and liabilities and disclosure of contingent assets and liabilities at the date of the financial statements and the reported change in net assets during the reporting period. Actual results could differ from those estimates. |
| | |
| g). | Share Valuation – The net asset value (“NAV”) per share of the Fund is calculated by dividing the sum of the value of the securities held by the Fund, plus cash or other assets, minus all liabilities (including estimated accrued expenses) by the total number of shares outstanding for the Fund, rounded to the nearest cent. The Fund’s shares will not be priced on days the New York Stock Exchange is closed for trading. The offering and redemption price per share for the Fund is equal to the Fund’s NAV per share. |
| | |
| h). | Foreign Currency – Values of investments denominated in foreign currencies are converted into U.S. dollars using the spot market rate of exchange at the time of valuation. Purchases and sales of investments and income are translated into U.S. dollars using the spot market rate of exchange prevailing on the respective dates of such transactions. The Fund does not isolate the portion of the results of operations resulting from fluctuations in foreign exchange rates on investments from fluctuations resulting from changes in the market prices of securities held. Such fluctuations are included with the net realized and unrealized gain or loss on investments. Foreign investments present additional risks due to currency fluctuations, economic and political factors, lower liquidity, government regulations, differences in accounting standards, and other factors. |
| HENNESSY FUNDS | 1-800-966-4354 | |
| i). | Forward Contracts – The Fund may enter into forward currency contracts to reduce its exposure to changes in foreign currency exchange rates on its foreign holdings and to lock in the U.S. dollar cost of firm purchase and sale commitments for securities denominated in foreign currencies. A forward currency contract is a commitment to purchase or sell a foreign currency at a future date at a negotiated forward rate. The gain or loss arising from the difference between the U.S. dollar cost of the original contract and the value of the foreign currency in U.S. dollars upon closing of such contract is included in net realized gain or loss from foreign currency transactions. During the fiscal year ended October 31, 2015, the Fund did not enter into any forward contracts. |
| | |
| j). | Repurchase Agreements – The Fund may enter into repurchase agreements with member banks or security dealers of the Federal Reserve Board whom the investment advisor deems creditworthy. The repurchase price generally equals the price paid by the Fund plus interest negotiated on the basis of current short-term rates. |
| | |
| | Securities pledged as collateral for repurchase agreements are held by the custodian bank until the respective agreements mature. Provisions of the repurchase agreements ensure that the market value of the collateral, including accrued interest thereon, is sufficient to cover the repurchase amount in the event of default of the counterparty. If the counterparty defaults and the value of the collateral declines or if the counterparty enters an insolvency proceeding, realization of the collateral by the Fund may be delayed or limited. |
| | |
| k). | Accounting for Uncertainty in Income Taxes – The Fund has accounting policies regarding recognition and measurement of tax positions taken or expected to be taken on a tax return. The tax returns of the Fund for the prior three fiscal years are open for examination. The Fund has reviewed all open tax years in major jurisdictions and concluded that there is no impact on the Fund’s net assets and no tax liability resulting from unrecognized tax benefits relating to uncertain income tax positions taken or expected to be taken on a tax return. The Fund’s major tax jurisdictions are U.S. federal and Delaware. |
| | |
| l). | Derivatives – The Fund may invest in, or enter into, derivatives, such as options, futures contracts, options on futures contracts, and swaps, for a variety of reasons, including to hedge certain risks, to provide a substitute for purchasing or selling particular securities, or to increase potential income gain. Derivatives may provide a cheaper, quicker, or more specifically focused way for a Fund to invest than “traditional” securities would. The main purpose of utilizing these derivative instruments is for hedging purposes. |
| | |
| | The Fund follows the financial accounting reporting rules as required by the Derivatives and Hedging Topic of the FASB Accounting Standards Codification. Under such rules, the Fund is required to include enhanced disclosure that enables investors to understand how and why an entity uses derivatives, how derivatives are accounted for, and how derivatives instruments affect an entity’s results of operations and financial position. During the fiscal year ended October 31, 2015, the Fund did not hold any derivative instruments. |
| | |
| m). | New Accounting Pronouncements – In June 2014, the FASB issued Accounting Standards Update (“ASU”) No. 2014-11 “Repurchase-to Maturity Transactions, Repurchase Financings, and Disclosures.” The amendments in this ASU require an entity to modify accounting for repurchase-to-maturity transactions and repurchase financing arrangements, as well as modify required disclosures for repurchase agreements, securities lending transactions, and repurchase-to-maturity transactions |
| | that are accounted for as secured borrowings. The guidance is effective for fiscal years beginning on or after December 15, 2014, and for interim periods within those fiscal years. Management is currently evaluating the impact these changes will have on the Fund’s financial statement disclosures. |
| | In May 2015, the FASB issued ASU No. 2015-07 “Disclosure for Investments in Certain Entities that Calculate Net Asset Value per Share (or Its Equivalent).” The amendments in ASU No. 2015-07 remove the requirement to categorize within the fair value hierarchy investments measured at NAV and require the disclosure of sufficient information to reconcile the fair value of the remaining assets categorized within the fair value hierarchy to the financial statements. The amendments in ASU No. 2015-07 are effective for fiscal years beginning after December 15, 2015, and interim periods within those fiscal years. Management has reviewed the requirements and believes the adoption of ASU 2015-07 will not have a material impact on the Fund’s financial statements and related disclosures. |
3). SECURITIES VALUATION
The Fund follows authoritative fair valuation accounting standards that establish an authoritative definition of fair value and set out a hierarchy for measuring fair value. These standards require additional disclosures about the various inputs and valuation techniques used to develop the measurements of fair value and a discussion in changes in valuation techniques and related inputs during the period. These inputs are summarized in the three broad levels listed below:
| | Level 1 – | Quoted unadjusted prices for identical instruments in active markets to which the Fund has access at the date of measurement. |
| | | |
| | Level 2 – | Quoted prices for similar instruments in active markets; quoted prices for identical or similar instruments in markets that are not active; and model-derived valuations in which all significant inputs and significant value drivers are observable in active markets. Level 2 inputs are those in markets for which there are few transactions, the prices are not current, the prices are fair value adjusted due to post-market close subsequent events (foreign markets), little public information exists, or instances where prices vary substantially over time or among brokered market makers. These inputs may also include interest rates, prepayment speeds, credit risk curves, default rates, and similar data. |
| | | |
| | Level 3 – | Model-derived valuations in which one or more significant inputs or significant value drivers are unobservable. Unobservable inputs are those inputs that reflect the Fund’s own assumptions about what market participants would use to price the asset or liability based on the best available information. |
| | Following is a description of the valuation techniques applied to the Fund’s major categories of assets and liabilities measured at fair value on a recurring basis. |
| | |
| | Equity Securities – Equity securities, including common stocks, preferred stocks, foreign-issued common stocks, exchange-traded funds, closed-end mutual funds, partnerships, rights, and real estate investment trusts, that are traded on a securities exchange for which a last-quoted sales price is readily available will generally be valued at the last sales price as reported by the primary exchange on which the securities are listed. Securities listed on The NASDAQ Stock Market (“NASDAQ”) will generally be valued at the NASDAQ Official Closing Price, which may differ from the last sales price reported. Securities traded on a securities exchange for which a last-quoted sales price is not readily |
| HENNESSY FUNDS | 1-800-966-4354 | |
available will generally be valued at the mean between the bid and ask prices. To the extent these securities are actively traded and valuation adjustments are not applied, they are classified in Level 1 of the fair value hierarchy. Securities traded on foreign exchanges generally are not valued at the same time the Fund calculates its NAV because most foreign markets close well before such time. The earlier close of most foreign markets gives rise to the possibility that significant events, including broad market moves, may have occurred in the interim. In certain circumstances, it may be determined that a security needs to be fair valued because it appears that the value of the security might have been materially affected by events occurring after the close of the market in which the security is principally traded, but before the time the Fund calculates its NAV, such as by a development that affects an entire market or region (e.g., weather-related events) or a potentially global development (e.g., a terrorist attack that may be expected to have an effect on investor expectations worldwide).
Registered Investment Companies – Investments in registered investment companies (e.g., mutual funds) are generally priced at the ending NAV provided by the applicable registered investment company’s service agent and will be classified in Level 1 of the fair value hierarchy.
Debt Securities – Debt securities, including corporate bonds, asset-backed securities, mortgage-backed securities, municipal bonds, U.S. Treasuries, and U.S. government agency issues, are generally valued at market on the basis of valuations furnished by an independent pricing service that utilizes both dealer-supplied valuations and formula-based techniques. The pricing service may consider recently executed transactions in securities of the issuer or comparable issuers, market price quotations (where observable), bond spreads, and fundamental data relating to the issuer. In addition, the model may incorporate market observable data such as reported sales of similar securities, broker quotes, yields, bids, offers, and reference data. Certain securities are valued principally using dealer quotations. These securities are generally classified in Level 2 of the fair value hierarchy.
Short-Term Securities – Short-term equity investments, including money market funds, are valued in the manner specified above. Short-term debt investments are generally valued at amortized cost, which approximates fair market value, if their original term to maturity was 60 days or less, or by amortizing the values as of the 61st day prior to maturity, if their original term to maturity exceeded 60 days. Amortized cost is not used if its use would be inappropriate due to credit or other impairments of the issuer, in which case the security’s fair value would be determined, as described below. Short-term securities are generally classified in Level 1 or Level 2 of the fair market hierarchy depending on the inputs used and market activity levels for specific securities.
The Board of Trustees of the Fund (the “Board”) has adopted fair value pricing procedures that are followed when a price for a security is not readily available or if a significant event has occurred that indicates the closing price of a security no longer represents the true value of that security. Fair value pricing determinations are made in good faith in accordance with these procedures. There are numerous criteria that will be given consideration in determining a fair value of a security. Some of these criteria are trading volume of a security and markets, the value of other like securities, and news events with direct bearing to a security or markets. Fair value pricing results in an estimated price for a security that reflects the amount the Fund might reasonably expect to receive in a current sale. Depending on the relative significance of the valuation inputs, these securities may be classified in either Level 2 or Level 3 of the fair value hierarchy.
The fair valuation of foreign securities may be determined with the assistance of a pricing service using correlations between the movement of prices of such securities and indices of domestic securities and other appropriate indicators, such as closing market prices of relevant American Depositary Receipts or futures contracts. The effect of using fair value pricing is that the Fund’s NAV will reflect the affected portfolio securities’ value as determined in the judgment of the Board or its designee instead of being determined by the market. Using a fair value pricing methodology to price foreign securities may result in a value that is different from a foreign security’s most recent closing price and from the prices used by other investment companies to calculate their NAVs and are generally considered Level 2 prices in the fair valuation hierarchy. Because the Fund may invest in foreign securities, the value of the Fund’s portfolio securities may change on days when you will not be able to purchase or redeem your shares.
The Board has delegated day-to-day valuation matters to a Valuation Committee comprised of one or more representatives from Hennessy Advisors, Inc., the Fund’s investment advisor. The function of the Valuation Committee is to value securities where current and reliable market quotations are not readily available. All actions taken by the Valuation Committee are reviewed by the Board.
The Fund has performed an analysis of all existing investments to determine the significance and character of all inputs to their fair value determination. Various inputs are used in determining the value of the Fund’s investments. The inputs or methodology used for valuing securities are not necessarily an indication of the risk associated with investing in those securities. Details related to the fair valuation hierarchy of the Fund’s securities as of October 31, 2015 are included in the Fund’s Schedule of Investments.
4). INVESTMENT TRANSACTIONS
Purchases and sales of investment securities (excluding government and short-term investments) for the Fund during the fiscal year ended October 31, 2015 were $66,075,195 and $17,993,920, respectively.
There were no purchases or sales/maturities of long-term U.S. Government Securities for the Fund during the fiscal year ended October 31, 2015.
5). INVESTMENT MANAGEMENT FEE AND OTHER TRANSACTIONS WITH AFFILIATES
Hennessy Advisors, Inc. (the “Advisor”) is the investment advisor of the Fund. The Advisor provides the Fund with investment management services under an Investment Advisory Agreement. The Advisor furnishes all investment advice, office space, facilities, and provides most of the personnel needed by the Fund. As compensation for its services, the Advisor is entitled to a monthly fee from the Fund. The fee is based upon the average daily net assets of the Fund at the annual rate of 1.00%. The net investment advisory fees payable by the Fund as of October 31, 2015 were $96,122.
The Advisor has delegated the day-to-day management of the Fund to a sub-advisor, SPARX Asset Management Co., Ltd. The Advisor pays the sub-advisor fees for the Fund from its own assets and these fees are not an additional expense of the Fund.
The Board has approved a Shareholder Servicing Agreement for the Investor Class shares of the Fund, which was instituted to compensate the Advisor for the non-investment management services it provides to the Fund. The Shareholder Servicing Agreement provides for a monthly fee paid to the Advisor at an annual rate of 0.10% of the average daily net assets of the Fund attributable to Investor Class shares. Shareholder service fees payable by the Fund as of October 31, 2015 were $4,971.
| HENNESSY FUNDS | 1-800-966-4354 | |
The Fund has entered into agreements with various brokers, dealers, and financial intermediaries in connection with the sale of shares of the Fund. The agreements provide for periodic payments by the Fund to the brokers, dealers, and financial intermediaries for providing certain shareholder maintenance services (sub-transfer agent expenses). These shareholder services include the pre-processing and quality control of new accounts, shareholder correspondence, answering customer inquiries regarding account status, and facilitating shareholder telephone transactions. Fees paid by the Fund to various brokers, dealers, and financial intermediaries during the fiscal year ended October 31, 2015 were $143,886.
U.S. Bancorp Fund Services, LLC (“USBFS”) provides the Fund with administrative, fund accounting, and transfer agent services, including all regulatory reporting, and necessary office equipment and personnel. As administrator, USBFS is responsible for activities such as (i) preparing various federal and state regulatory filings, reports, and returns for the Fund, (ii) preparing reports and materials to be supplied to the Board, (iii) monitoring the activities of the Fund’s custodian, transfer agent, and accountants, and (iv) coordinating the preparation and payment of the Fund’s expenses and reviewing the Fund’s expense accruals. Fees paid to USBFS during the fiscal year ended October 31, 2015 were $96,772.
U.S. Bank, N.A., an affiliate of USBFS, serves as the Fund’s custodian. Quasar Distributors, LLC acts as the Fund’s principal underwriter in a continuous public offering of the Fund’s shares. Quasar Distributors, LLC is an affiliate of USBFS and U.S. Bank, N.A.
6). LINE OF CREDIT
The Fund has an uncommitted line of credit with the other funds in the Hennessy Funds family of funds (the “Hennessy Funds”) in the amount of the lesser of (i) $100,000,000 or (ii) 33.33% of each Hennessy Fund’s net assets, or 30% for the Hennessy Gas Utility Fund and 10% for the Hennessy Balanced Fund, intended to provide short-term financing, if necessary, subject to certain restrictions, in connection with shareholder redemptions. The credit facility is with the Hennessy Funds’ custodian bank, U.S. Bank, N.A. Borrowings under this arrangement bear interest at the bank’s prime rate and are secured by all of the Fund’s assets (as to its own borrowings only). During the fiscal year ended October 31, 2015, the Fund had an outstanding average daily balance and a weighted average interest rate of $5,523 and 3.25%, respectively. The maximum amount outstanding for the Fund during the period was $672,000. At October 31, 2015, the Fund did not have any borrowings outstanding under the line of credit.
7). FEDERAL TAX INFORMATION
As of October 31, 2015, the components of accumulated earnings (losses) for income tax purposes were as follows:
| Cost of investments for tax purposes | | $ | 92,889,189 | |
| Gross tax unrealized appreciation | | $ | 24,599,430 | |
| Gross tax unrealized depreciation | | | (2,571,754 | ) |
| Net tax unrealized appreciation | | $ | 22,027,676 | |
| Undistributed ordinary income | | $ | — | |
| Undistributed long-term capital gains | | | — | |
| Total distributable earnings | | $ | — | |
| Other accumulated loss | | $ | (29,712,171 | ) |
| Total accumulated loss | | $ | (7,684,495 | ) |
The difference between book-basis and tax-basis unrealized appreciation is attributable primarily to wash sales.
At October 31, 2015, the Fund had capital loss carryforwards that expire as follows:
| | $ | 6,231,544 | | 10/31/16 |
| | $ | 15,450,664 | | 10/31/17 |
| | $ | 6,121,138 | | 10/31/18 |
| | $ | 1,274,960 | | Indefinite ST |
| | $ | 428,519 | | Indefinite LT |
During the fiscal year ended October 31, 2015, the capital loss carry forwards utilized for the Fund were $590,302.
Capital losses sustained in the fiscal year ended October 31, 2012 and in future taxable years will not expire and may be carried over by the Fund without limitation; however, they will retain the character of the original loss. Furthermore, any loss incurred during those taxable years will be required to be utilized prior to the losses incurred in taxable years prior to 2012. As a result of this ordering rule, pre-enactment capital loss carryforwards may be more likely to expire unused. Under pre-enactment law, capital losses could be carried forward for eight years, and carried forward as short-term capital losses, irrespective of the character of the original loss.
At October 31, 2015, the Fund deferred, on a tax basis, a post-December late year ordinary loss deferral of $199,598.
The Fund did not pay any distributions during fiscal year 2015 or fiscal year 2014.
8). EVENTS SUBSEQUENT TO YEAR END
Management has evaluated the Fund’s related events and transactions that occurred subsequent to October 31, 2015, through the date of issuance of the Fund’s financial statements. Management has determined that there were no subsequent events requiring recognition or disclosure in the financial statements.
| HENNESSY FUNDS | 1-800-966-4354 | |
Report of Independent Registered Public Accounting Firm
To the Board of Trustees of Hennessy Funds Trust
and the Shareholders of the Hennessy Japan Fund:
We have audited the accompanying statement of assets and liabilities of Hennessy Japan Fund (the Fund), a series of Hennessy Funds Trust, including the schedule of investments, as of October 31, 2015, and the related statement of operations for the year then ended, the statements of changes in net assets for each of the years in the two-year period then ended, and the financial highlights for each of the years in the five-year period then ended. These financial statements and financial highlights are the responsibility of the Fund’s management. Our responsibility is to express an opinion on these financial statements and financial highlights based on our audits.
We conducted our audits in accordance with the standards of the Public Company Accounting Oversight Board (United States). Those standards require that we plan and perform the audit to obtain reasonable assurance about whether the financial statements and financial highlights are free of material misstatement. An audit includes examining, on a test basis, evidence supporting the amounts and disclosures in the financial statements. Our procedures included confirmation of investments owned as of October 31, 2015, by correspondence with the custodian and brokers or by other appropriate auditing procedures. An audit also includes assessing the accounting principles used and significant estimates made by management, as well as evaluating the overall financial statement presentation. We believe that our audits provide a reasonable basis for our opinion.
In our opinion, the financial statements and financial highlights referred to above present fairly, in all material respects, the financial position of the Fund as of October 31, 2015, and the results of its operations for the year then ended, the changes in its net assets for each of the years in the two-year period then ended, and the financial highlights for each of the years in the five-year period then ended, in conformity with U.S. generally accepted accounting principles.
Milwaukee, Wisconsin
December 23, 2015
Trustees and Officers of the Fund (Unaudited)
The business and affairs of the Fund are managed under the direction of the Board of Trustees of the Trust, and the Board of Trustees elects the Officers of the Trust. Information pertaining to the Trustees and the Officers of the Trust is set forth below. Such persons serve until their successors are duly elected and qualified or until their earlier death, resignation, or removal. Each of the Trustees oversees 16 Hennessy Funds. Unless otherwise indicated, the address of all persons listed below is 7250 Redwood Boulevard, Suite 200, Novato, CA 94945. The Fund’s Statement of Additional Information includes more information about the persons listed below and is available, without charge, upon request by calling 1-800-966-4354.
| | | | Other |
| | | | Directorships |
| Name, Year of Birth, | | | (During Past |
| and Position Held | Length of | Principal Occupation(s) | Five Years) |
with the Trust | Time Served | During Past Five Years | Held by Trustee(1) |
| | | | |
| Disinterested Trustees | | | |
| | | | |
| J. Dennis DeSousa (1936) | Since January | Mr. DeSousa is a real estate investor. | Hennessy SPARX |
| Trustee | 1996 for the | | Funds Trust; |
| | Hennessy Funds | | Hennessy Mutual |
| | | | Funds, Inc.; and |
| | | | The Hennessy |
| | | | Funds, Inc. |
| | | | |
| Robert T. Doyle (1947) | Since January | Mr. Doyle has been the Sheriff of | Hennessy SPARX |
| Trustee | 1996 for the | Marin County, California since 1996. | Funds Trust; |
| | Hennessy Funds | | Hennessy Mutual |
| | | | Funds, Inc.; and |
| | | | The Hennessy |
| | | | Funds, Inc. |
| | | | |
| Gerald P. Richardson (1945) | Since May | Mr. Richardson is an independent | Hennessy SPARX |
| Trustee | 2004 for the | consultant in the securities industry. | Funds Trust; |
| | Hennessy Funds | | Hennessy Mutual |
| | | | Funds, Inc.; and |
| | | | The Hennessy |
| | | | Funds, Inc. |
| | | | |
Interested Trustee(2) | | | |
| | | | |
| Neil J. Hennessy (1956) | Since January | Mr. Hennessy has been employed by | Hennessy Advisors, |
| Trustee, Chairman of | 1996 as a Trustee | Hennessy Advisors, Inc., the Funds’ | Inc.; Hennessy |
| the Board, Chief | for the Hennessy | investment advisor, since 1989. | SPARX Funds Trust; |
| Investment Officer, | Funds and since | He currently serves as President, | Hennessy Mutual |
| Portfolio Manager, | June 2008 as | Chairman and Chief Executive Officer | Funds, Inc.; and |
| and President | an Officer of the | of Hennessy Advisors, Inc. | The Hennessy |
| | Hennessy Funds | | Funds, Inc. |
| HENNESSY FUNDS | 1-800-966-4354 | |
| Name, Year of Birth, | | |
| and Position Held | Length of | Principal Occupation(s) |
with the Trust | Time Served | During Past Five Years |
| | | |
| Officers | | |
| | | |
| Teresa M. Nilsen (1966) | Since January | Ms. Nilsen has been employed by Hennessy Advisors, Inc., |
| Executive Vice President | 1996 for the | the Funds’ investment advisor, since 1989. She currently |
| and Treasurer | Hennessy Funds | serves as Executive Vice President, Chief Operations Officer, |
| | | Chief Financial Officer, and Secretary of Hennessy Advisors, Inc. |
| | | |
| Daniel B. Steadman (1956) | Since March | Mr. Steadman has been employed by Hennessy Advisors, Inc., |
| Executive Vice President | 2000 for the | the Funds’ investment advisor, since 2000. He currently serves |
| and Secretary | Hennessy Funds | as Executive Vice President and Chief Compliance Officer of |
| | | Hennessy Advisors, Inc. |
| | | |
| Jennifer Cheskiewicz (1977) | Since June | Ms. Cheskiewicz has been employed by Hennessy Advisors, |
| Senior Vice President and | 2013 for the | Inc., the Funds’ investment advisor, since June 2013. She |
| Chief Compliance Officer | Hennessy Funds | currently serves as General Counsel of Hennessy Advisors, Inc. |
| | | |
| | | |
| | | She previously served as in-house counsel to Carlson Capital, |
| | | L.P., an SEC-registered investment advisor to several private |
| | | funds from February 2010 to May 2013. |
| | | |
| Brian Carlson (1972) | Since December | Mr. Carlson has been employed by Hennessy Advisors, Inc., the |
| Senior Vice President and | 2013 for the | Funds’ investment advisor, since December 2013. |
| Head of Distribution | Hennessy Funds | |
| | | Mr. Carlson was previously a co-founder and principal of |
| | | Trivium Consultants, LLC from February 2011 through |
| | | November 2013. |
| | | |
David Ellison (1958)(3) | Since October | Mr. Ellison has served as a Portfolio Manager of the Hennessy |
| Senior Vice President and | 2012 for the | Small Cap Financial Fund, the Hennessy Large Cap Financial |
| Portfolio Manager | Hennessy Funds | Fund, and the Hennessy Technology Fund since inception. |
| | | |
| | | Mr. Ellison previously served as Director, CIO and President of |
| | | FBR Fund Advisers, Inc. from December 1999 to October 2012. |
| | | |
| Brian Peery (1969) | Since March | Mr. Peery has served as a Portfolio Manager of the Hennessy |
| Senior Vice President and | 2003 as an | Cornerstone Growth Fund, the Hennessy Cornerstone Mid Cap |
| Portfolio Manager | Officer of the | 30 Fund, the Hennessy Cornerstone Large Growth Fund, the |
| | Hennessy Funds | Hennessy Cornerstone Value Fund, the Hennessy Total Return |
| | and since | Fund, and the Hennessy Balanced Fund since October 2014. |
| | February 2011 | From February 2011 through September 2014, he served as |
| | as a Co-Portfolio | Co-Portfolio Manager of the same funds. Mr. Peery has also |
| | Manager or | served as a Portfolio Manager of the Hennessy Gas Utility Fund |
| | Portfolio Manager | since February 2015. |
| | for the | |
| | Hennessy Funds | Mr. Peery has been employed by Hennessy Advisors, Inc., the |
| | | Funds’ investment advisor, since 2002. |
| | | |
| Winsor (Skip) Aylesworth | Since October | Mr. Aylesworth has served as a Portfolio Manager of the |
(1947)(3) | 2012 for the | Hennessy Gas Utility Fund since 1998 and as a Portfolio |
| Vice President and | Hennessy Funds | Manager of the Hennessy Technology Fund since inception. |
| Portfolio Manager | | |
| | | Mr. Aylesworth previously served as Executive Vice President |
| | | of The FBR Funds from 1999 to October 2012. |
| Name, Year of Birth, | | |
| and Position Held | Length of | Principal Occupation(s) |
with the Trust | Time Served | During Past Five Years |
| | | |
Ryan Kelley (1972)(4) | Since March | Mr. Kelley has served as a Portfolio Manager of the Hennessy |
| Vice President and | 2013 for the | Gas Utility Fund, the Hennessy Small Cap Financial Fund, and |
| Portfolio Manager | Hennessy Funds | the Hennessy Large Cap Financial Fund since October 2014. |
| | | From March 2013 through September 2014, he served as a |
| | | Co-Portfolio Manager of the same funds. Prior to that, |
| | | he was a Portfolio Analyst of the Hennessy Funds. |
(1) | Pursuant to an internal reorganization, the series of Hennessy Mutual Funds, Inc. (“HMFI”), The Hennessy Funds, Inc. (“HFI”), and Hennessy SPARX Funds Trust (“HSFT”) were reorganized into series of Hennessy Funds Trust on February 28, 2014, which mirrored the corresponding series of HFMI, HFI, and HSFT. Subsequent to the reorganization, HFMI, HFI, and HSFT were dissolved. |
(2) | Mr. Hennessy is considered an “interested person,” as defined in the Investment Company Act of 1940, as amended, because he is an officer of the Hennessy Funds. |
(3) | The address of these officers is 101 Federal Street, Suite 1900, Boston, MA 02110. |
(4) | The address of this officer is 1340 Environ Way, Chapel Hill, NC 27517. |
| HENNESSY FUNDS | 1-800-966-4354 | |
Expense Example (Unaudited)
October 31, 2015
As a shareholder of the Fund, you incur two types of costs: (1) transaction costs, including sales charges (loads) on purchase payments, reinvested dividends, or other distributions; redemption fees; and exchange fees; and (2) ongoing costs, including management fees; service fees; and other Fund expenses. This Example is intended to help you understand your ongoing costs (in dollars) of investing in the Fund and to compare these costs with the ongoing costs of investing in other mutual funds. The Example is based on an investment of $1,000 invested at the beginning of the period and held for the entire period from May 1, 2015 through October 31, 2015.
Actual Expenses
The first line of the table below under the “Investor Class” and “Institutional Class” headings provides information about actual account values and actual expenses. Although the Fund charges no sales loads or transaction fees, you will be assessed fees for outgoing wire transfers, returned checks and stop payment orders at prevailing rates charged by U.S. Bancorp Fund Services, LLC, the Fund’s transfer agent. If you request that a redemption be made by wire transfer, currently a $15.00 fee is charged by the Fund’s transfer agent. IRA accounts will be charged a $15.00 annual maintenance fee. The example below includes, but is not limited to, management fees, shareholder servicing fees, fund accounting, custody, and transfer agent fees. However, the example below does not include portfolio trading commissions and related expenses, and other extraordinary expenses as determined under generally accepted accounting principles. You may use the information in this line, together with the amount you invested, to estimate the expenses that you paid over the period. Simply divide your account value by $1,000 (for example, an $8,600 account value divided by $1,000 = 8.6), then multiply the result by the number in the first line of the table under the “Investor Class” and “Institutional Class” headings in the column entitled “Expenses Paid During Period” to estimate the expenses you paid on your account during this period.
Hypothetical Example for Comparison Purposes
The second line of the table below under the “Investor Class” and “Institutional Class” headings provides information about hypothetical account values and hypothetical expenses based on the Fund’s actual expense ratios and an assumed rate of return of 5% per year before expenses, which is not the Fund’s actual return. The hypothetical account values and expenses may not be used to estimate the actual ending account balance or expenses you paid for the period. You may use this information to compare the ongoing costs of investing in the Fund and other funds. To do so, compare this 5% hypothetical example with the 5% hypothetical examples that appear in the shareholder reports of the other funds. Please note that the expenses shown in the table are meant to highlight your ongoing costs only and do not reflect any transactional costs, such as sales charges (loads), or exchange fees. Therefore, the second line of the table under the “Investor Class” and “Institutional Class” headings is useful in comparing ongoing costs only, and will not help you determine the relative total costs of owning different funds. In addition, if these transactional costs were included, your costs would have been higher.
| | | | Expenses Paid |
| | Beginning | Ending | During Period(1) |
| | Account Value | Account Value | May 1, 2015 – |
| | May 1, 2015 | October 31, 2015 | October 31, 2015 |
| Investor Class | | | |
| Actual | $1,000.00 | $1,022.50 | $7.80 |
| Hypothetical (5% return before expenses) | $1,000.00 | $1,017.49 | $7.78 |
| | | | |
| Institutional Class | | | |
| Actual | $1,000.00 | $1,024.20 | $6.38 |
| Hypothetical (5% return before expenses) | $1,000.00 | $1,018.90 | $6.36 |
(1) | Expenses are equal to the Fund’s annualized expense ratio of 1.53% for Investor Class shares or 1.25% for Institutional Class shares, as applicable, multiplied by the average account value over the period, multiplied by 184/365 days (to reflect one-half year period). |
| HENNESSY FUNDS | 1-800-966-4354 | |
How to Obtain a Copy of the Fund’s
Proxy Voting Policy and Proxy Voting Records
A description of the policies and procedures the Fund uses to determine how to vote proxies relating to portfolio securities is available without charge: (1) by calling 1-800-966-4354; (2) on the Hennessy Funds’ website at hennessyfunds.com/proxy-voting/policy.fs; or (3) on the U.S. Securities and Exchange Commission’s website at www.sec.gov. The Fund’s proxy voting record is available without charge on both the Hennessy Funds’ website at hennessyfunds.com/proxy-voting/policy.fs and the SEC’s website at www.sec.gov no later than August 31 for the prior 12 months ending June 30.
Quarterly Filings on Form N-Q
The Fund files its complete schedule of portfolio holdings with the SEC for the first and third quarters of each fiscal year on Form N-Q. The Fund’s Form N-Q will be available on the SEC’s website at www.sec.gov. The Fund’s Form N-Q may be reviewed and copied at the SEC’s Public Reference Room in Washington, DC and information on the operation of the Public Reference Room may be obtained by calling 1-800-SEC-0330. Information included in the Fund’s N-Q will also be available upon request by calling 1-800-966-4354.
Householding
To help keep the Fund’s costs as low as possible, we generally deliver a single copy of most financial reports and prospectuses to shareholders who share an address, even if the accounts are registered under different names. This process, known as “householding,” does not apply to account statements. You may, of course, request an individual copy of a prospectus or financial report at any time. If you would like to receive separate mailings, please call the Administrator at 1-800-261-6950 or 1-414-765-4124 and we will begin individual delivery within 30 days of your request. If your account is held through a financial institution or other intermediary, please contact them directly to request individual delivery.
Matters Submitted to a Shareholder Vote
A special meeting of shareholders of the Investor Class shares of the Fund, originally convened on September 15, 2015, and subsequently adjourned to November 30, 2015, has been further adjourned to reconvene on Thursday, January 14, 2016, at which time the shareholders will vote on whether to approve a distribution (Rule 12b-1) plan for the Investor Class shares of the Fund.
Privacy Policy
We collect the following non-public personal information about you:
| | • | information we receive from you on or in applications or other forms, correspondence, or conversations, including, but not limited to, your name, address, phone number, social security number, assets, income, and date of birth; and |
| | • | information about your transactions with us, our affiliates, or others, including, but not limited to, your account number and balance, payment history, parties to transactions, cost basis information, and other financial information. |
We do not disclose any non-public personal information about our current or former shareholders to nonaffiliated third parties, except as permitted by law. For example, we are permitted by law to disclose all of the information we collect, as described above, to our Transfer Agent to process your transactions. Furthermore, we restrict access to your non-public personal information to those persons who require such information to provide products or services to you. We maintain physical, electronic, and procedural safeguards that comply with federal standards to guard your non-public personal information.
In the event that you hold shares of the Fund through a financial intermediary, including, but not limited to, a broker-dealer, bank or trust company, the privacy policy of your financial intermediary would govern how your non-public personal information would be shared with nonaffiliated third parties.
| HENNESSY FUNDS | 1-800-966-4354 | |
For information, questions or assistance, please call
The Hennessy Funds
1-800-966-4354 or 1-415-899-1555
INVESTMENT ADVISOR
Hennessy Advisors, Inc.
7250 Redwood Blvd., Suite 200
Novato, California 94945
ADMINISTRATOR,
TRANSFER AGENT,
DIVIDEND PAYING AGENT &
SHAREHOLDER SERVICING AGENT
U.S. Bancorp Fund Services, LLC
P.O. Box 701
Milwaukee, Wisconsin 53201-0701
CUSTODIAN
U.S. Bank N.A.
Custody Operations
1555 North River Center Dr., Suite 302
Milwaukee, Wisconsin 53212
TRUSTEES
Neil J. Hennessy
Robert T. Doyle
J. Dennis DeSousa
Gerald P. Richardson
COUNSEL
Foley & Lardner LLP
777 East Wisconsin Avenue
Milwaukee, Wisconsin 53202-5306
INDEPENDENT REGISTERED
PUBLIC ACCOUNTING FIRM
KPMG LLP
777 East Wisconsin Avenue
Milwaukee, Wisconsin 53202-5306
DISTRIBUTOR
Quasar Distributors, LLC
615 East Michigan Street
Milwaukee, Wisconsin 53202
hennessyfunds.com | 1-800-966-4354
This report has been prepared for shareholders and may be distributed to
others only if preceded or accompanied by a current prospectus.
ANNUAL REPORT
OCTOBER 31, 2015
HENNESSY JAPAN SMALL CAP FUND
Investor Class HJPSX
Institutional Class HJSIX
hennessyfunds.com | 1-800-966-4354
(This Page Intentionally Left Blank.)
Contents
| Letter to Shareholders | 2 |
| Performance Overview | 4 |
| Financial Statements | |
| Schedule of Investments | 7 |
| Statement of Assets and Liabilities | 12 |
| Statement of Operations | 13 |
| Statements of Changes in Net Assets | 15 |
| Financial Highlights | 16 |
| Notes to the Financial Statements | 19 |
| Report of Independent Registered Public Accounting Firm | 27 |
| Trustees and Officers of the Fund | 28 |
| Expense Example | 32 |
| Proxy Voting | 34 |
| Quarterly Filings on Form N-Q | 34 |
| Federal Tax Distribution Information | 34 |
| Householding | 34 |
| Matters Submitted to a Shareholder Vote | 35 |
| Privacy Policy | 35 |
| HENNESSY FUNDS | 1-800-966-4354 | |
December 2015
Dear Hennessy Funds Shareholder:
The U.S. market has been in a volatile, sideways correction for over a year now as investors brace themselves for the first rise in short-term interest rates in almost a decade. The Japanese market also experienced some volatility, especially towards the end of the year when fear of slower growth in China, Japan’s largest trading partner, dominated investor thinking. Nevertheless, we continue to believe that as long as the Fed does not raise interest rates too significantly, and low inflation suggests that it won’t, global economies should continue their steady expansion, thereby providing a stable environment for Japan and its program of macroeconomic stimulus and structural reform.
Both the Nikkei 225 Index and the TOPIX Index finished the 12-month period ended October 31, 2015 higher, returning 10.00% and 10.22%, respectively in U.S. Dollar terms. During the year, the Nikkei 225 Index surpassed its old high established in 2007, the first time the index has overtaken a previous high since 1994. The end of this fiscal year marks the third consecutive year that the index has closed in positive territory.
The initial results of Japan’s economic strategy, known as “Abenomics,” were clearly visible this year. The Bank of Japan’s quantitative easing measures, which have caused the yen to weaken, have resulted in an almost three-fold increase in foreign visitors to Japan over the last three years and have caused the balance of trade to move steadily towards a surplus. We believe that tourism will continue to help drive economic strength in Japan, especially in 2020 when Japan will host the Olympics. And while the inflation rate slipped in the second half of the year, real wage growth achieved marked acceleration this year, recording positive growth in five of the last six months. Corporate profits reached a new high, posting growth of 24% in the quarter ended in June, and even capital spending, after years of contraction, is growing again.
Perhaps this year’s most important new reform under Abenomics was the introduction of the Corporate Governance Code in June. This initiative aims to unlock the shareholder value buried within many of Japan’s corporations. The Code provides for the elimination of cross-shareholdings between large Japanese companies, which was often a way to entrench and protect management and majority owners at the expense of general shareholders and the value of their investments. The Code also proposes a reduction in the use of poison pills, opening up inefficiently run companies to the possibility of being taken over. For the first time, listed Japanese companies will need to have two experienced, independent directors sitting on their boards. The Code is not legally binding, but we expect its “comply or explain” implementation approach to be very effective in Japan. Moreover, it appears that the voice of minority shareholders and investors is increasingly being heard in boardrooms. As a consequence of these structural changes, “friendly,” Japanese-style, activist investment strategies, uncommon in Japan in the past, are starting to emerge.
In addition, Japan’s equity market received a boost this year when the Government Pension Investment Fund (GPIF) announced a dramatic asset allocation shift away from Japanese government bond investments towards Japanese and foreign equities. Retail investors’ participation in the market is also growing as the number of participants in the recently introduced Nippon Individual Savings Account program continues to increase.
We remain optimistic about the long-term prospects for Japan and its stock market. In our view Abenomics’ various structural reforms and growth strategies are clearly beginning to deliver tangible results in the form of a strengthening labor market, increased investment, an improving balance of trade and robust growth of corporate profits.
Thank you for your continued confidence and investment in our products. If you have any questions or would like to speak with us directly, please don’t hesitate to call us at (800) 966-4354.
Sincerely,
Neil J. Hennessy
President and Chief Investment Officer
Hennessy Funds
| | |
| | |
| Tadahiro Fujimura | Masakazu Takeda |
| Portfolio Manager, | Portfolio Manager, |
| Hennessy Japan Small Cap Fund; | Hennessy Japan Fund; |
| Head of Investment & Research | Fund Manager |
| and Sr. Portfolio Manager | SPARX Asset Management Co., Ltd. |
| SPARX Asset Management Co., Ltd. | |
SPARX Asset Management Co., Ltd., located in Tokyo, Japan, is the sub-advisor to the Hennessy Japan Fund and the Hennessy Japan Small Cap Fund.
Past performance does not guarantee future results.
Mutual fund investing involves risk. Principal loss is possible.
Opinions expressed are those of Neil Hennessy, Tadahiro Fujimura and Masakazu Takeda and are subject to change, are not guaranteed and should not be considered investment advice.
The Nikkei 225 and Tokyo Stock Price Index (TOPIX) are unmanaged indices commonly used to measure the performance of Japanese stocks. One cannot invest directly in an index.
| HENNESSY FUNDS | 1-800-966-4354 | |
Performance Overview (Unaudited)
CHANGE IN VALUE OF $10,000 INVESTMENT
This graph illustrates the performance of an initial investment of $10,000 made in the Fund on its inception date and assumes the reinvestment of dividends.
AVERAGE ANNUAL TOTAL RETURN FOR PERIODS ENDED OCTOBER 31, 2015
| | | | Since |
| | One | Five | Inception |
| | Year | Years | (8/31/2007) |
| Hennessy Japan Small Cap Fund – | | | |
| Investor Class (HJPSX) | 7.37% | 14.56% | 8.33% |
| Hennessy Japan Small Cap Fund – | | | |
Institutional Class (HJSIX)(1) | 7.47% | 14.58% | 8.34% |
Russell/Nomura Small CapTM Index | 11.39% | 10.40% | 4.45% |
| Tokyo Price Index (TOPIX) | 10.22% | 7.16% | 1.09% |
Expense ratios: 2.18% (Investor Class); 1.99% (Institutional Class)
Performance data quoted represents past performance; past performance does not guarantee future results. The investment return and principal value of an investment will fluctuate so that an investor’s shares, when redeemed, may be worth more or less than their original cost. The performance graph and table do not reflect the deduction of taxes that a shareholder would pay on Fund distributions or the redemption of Fund shares. Current performance of the Fund may be lower or higher than the performance quoted. Performance data current to the most recent month end may be obtained by visiting hennessyfunds.com.
The expense ratios presented are from the most recent prospectus.
(1) | The inception date of Institutional Class shares is June 15, 2015. Performance shown prior to the inception of Institutional Class shares reflects the performance of Investor Class shares and includes expenses that are not applicable to and are higher than those of Institutional Class shares. |
PERFORMANCE NARRATIVE
Portfolio Managers Tadahiro Fujimura, CFA and CMA*, and Tetsuya Hirano, CMA* SPARX Asset Management Co., Ltd. (sub-advisor)
Performance:
For the twelve-month period ended October 31, 2015, the Investor Class of the Hennessy Japan Small Cap Fund returned 7.37%, underperforming the Russell/Nomura Small
Cap™ Index and the Tokyo Stock Price Index (TOPIX), which returned 11.39% and 10.22% for the same period, respectively, in U.S. Dollar terms.
The Fund’s underperformance versus its benchmark over the twelve–month period is due, in part, to its overweight position in manufacturers. The Fund’s investments in machinery and electrical equipment manufacturers performed poorly because of a stalling in the growth of Japanese exports and only modest further depreciation of the Japanese yen over the year. In addition, the Fund had little exposure to retailers, a sector that performed well. On the other hand, other domestic-focused companies, such as construction companies, telecommunication companies and service providers all made positive contributions to the Fund’s performance.
Among the strongest performing stocks, Nakano Corporation had the largest positive impact on the Fund’s performance over the period. The market reacted positively to the company’s strong earnings, which were a result of a greater than expected improvement in its profit margin. The stock also benefitted from being compared to more expensively valued rivals. Benefit One, Inc., which provides outsourcing services related to employee benefit programs, boosted the Fund’s performance as well. Benefit One is doing well because Japanese companies are increasingly providing greater health and retirement benefits to their workers in order to remain competitive. In addition, Ryobi Limited, a manufacturer of car engine blocks and tools, contributed positively to the Fund’s performance. One of the most significant detractors from the Fund’s performance was DCM Holdings Co., Ltd., which operates a chain of do-it-yourself stores. Last year, its share price rose due to expectations of a recovery, but it fell dramatically this year because of the market’s disappointment with weaker than expected sales. Koa Corporation, a manufacturer of resistors, also performed poorly as it was forced to revise downward its earnings projections because of stagnant investment in communication base stations throughout the world. Link & Motivation, Inc., which provides human resources consulting services, also declined, penalized by the market due to the discovery of an accounting fraud at one of the company’s acquired subsidiaries. The Fund no longer holds Link & Motivation Inc., but continues to hold the other named stocks.
Investment Outlook:
Notwithstanding the rise in Japanese equities over the last twelve months, the year was marked by some volatility, especially during the second half of the period when uncertainty regarding the timing and magnitude of a rise in short-term interest rates being contemplated by the Federal Reserve unsettled investors around the world, including those in Japan. Prospects of slower growth in China, one of Japan’s major trading partners, also troubled investors in Japan. We are hopeful that the Japanese equity market has largely discounted the impact of both of these negative factors. With regards to the Japanese economy, there are concerns around sluggish production and exports, but consumption, employment and capital expenditures are on a recovery trend. Altogether, we see no reason to be pessimistic. We expect the supply of stocks to tighten for various reasons, including share buybacks, the initial public offerings (IPOs) of Japan Post Holdings, Japan Post Bank, and Japan Post Insurance, and greater purchases of stocks by retail investors as a result of the introduction of Nippon Individual Savings Accounts.
Overall, we feel confident about the outlook for the Japanese economy, the Japanese stock market and the companies we hold in the Fund. Although the manufacturing industry recorded lackluster performance overall this year, we have either maintained or increased the weight of manufacturing stocks in the portfolio as we expect their competitiveness and earnings to improve in the medium term. We have also been increasing exposure to companies whose sales growth in the domestic market is strong in
| HENNESSY FUNDS | 1-800-966-4354 | |
our view. We will look carefully for signs of recovery in the economies of China and other Asian countries, about which investors are pessimistic, and conduct more detailed research on stocks that look fundamentally attractive in various industries, including automotive, machinery and technology. In addition, we will continue to research companies that have recently had IPOs and micro-cap companies.
| * | Chartered Member of the Security Analysts Association of Japan |
Opinions expressed are those of the Portfolio Managers as of the date written and are subject to change, are not guaranteed, and should not be considered investment advice or an indication of trading intent.
The Russell/Nomura Small Cap™ Index contains the bottom 15% of the Russell/Nomura Total Market™ Index, which contains the top 98% of all stocks listed on Japan’s stock exchange and registered on Japan’s OTC market in terms of market capitalization. The Tokyo Price Index (TOPIX) is a market capitalization-weighted index of all companies listed on the First Section of the Tokyo Stock Exchange. One cannot invest directly in an index.
The Fund invests in small and medium capitalized companies, which may have more limited liquidity and greater price volatility than large capitalization companies. The Fund invests in the stocks of companies operating in Japan; single-country funds may be subject to a higher degree of risk. The Fund may experience higher fees due to investments in pooled investment vehicles (including ETFs).
References to specific securities should not be considered a recommendation to buy or sell any security. Fund holdings and sector allocations are subject to change. Please refer to the Schedule of Investments included in this report for additional portfolio information.
Financial Statements
Schedule of Investments as of October 31, 2015 |
HENNESSY JAPAN SMALL CAP FUND
(% of Net Assets)
| TOP TEN HOLDINGS (EXCLUDING CASH/CASH EQUIVALENTS) | % NET ASSETS |
| Amano Corp. | 2.10% |
| Sinfonia Technology Co., Ltd. | 2.09% |
| Daihen Corp. | 2.06% |
| Sumitomo Densetsu Co., Ltd. | 2.01% |
| Toppan Forms Co., Ltd. | 2.01% |
| Kyosan Electric Manufacturing Co., Ltd. | 2.00% |
| Nachi-Fujikoshi Corp. | 1.99% |
| Tokai Tokyo Financial Holdings, Inc. | 1.96% |
| Aichi Steel Corp. | 1.96% |
| Starts Corp., Inc. | 1.95% |
Note: For presentation purposes, the Fund has grouped some of the industry categories. For purposes of categorizing securities for compliance with Section 8(b)(1) of the Investment Company Act of 1940, as amended, the Fund uses more specific industry classifications.
| HENNESSY FUNDS | 1-800-966-4354 | |
| COMMON STOCKS – 90.43% | | Number | | | | | | % of | |
| | | of Shares | | | Value | | | Net Assets | |
| Consumer Discretionary – 14.81% | | | | | | | | | |
| Aeon Fantasy Co., Ltd. | | | 15,700 | | | $ | 255,690 | | | | 1.01 | % |
| DCM Holdings Co., Ltd. | | | 57,600 | | | | 381,578 | | | | 1.51 | % |
| Doshisha Co., Ltd. | | | 24,100 | | | | 443,739 | | | | 1.75 | % |
| Fujibo Holdings, Inc. | | | 112,000 | | | | 206,681 | | | | 0.82 | % |
| Hagihara Industries, Inc. | | | 26,400 | | | | 459,506 | | | | 1.81 | % |
| Haseko Corp. | | | 27,500 | | | | 279,598 | | | | 1.10 | % |
| Komeri Co., Ltd. | | | 16,000 | | | | 342,074 | | | | 1.35 | % |
| PALTAC Corp. | | | 11,500 | | | | 226,212 | | | | 0.89 | % |
| Parco Co., Ltd. | | | 28,800 | | | | 249,685 | | | | 0.99 | % |
| Seiren Co., Ltd. | | | 35,100 | | | | 412,984 | | | | 1.63 | % |
| Starts Corp., Inc. | | | 31,500 | | | | 493,917 | | | | 1.95 | % |
| | | | | | | | 3,751,664 | | | | 14.81 | % |
| | | | | | | | | | | | | |
| Consumer Staples – 2.93% | | | | | | | | | | | | |
| Mitsui Sugar Co., Ltd. | | | 118,000 | | | | 474,578 | | | | 1.87 | % |
| Yamaya Corp. | | | 12,900 | | | | 267,359 | | | | 1.06 | % |
| | | | | | | | 741,937 | | | | 2.93 | % |
| | | | | | | | | | | | | |
| Financials – 4.81% | | | | | | | | | | | | |
| INTELLEX Co., Ltd. | | | 63,200 | | | | 407,298 | | | | 1.61 | % |
| The Tochigi Bank, Inc. | | | 55,000 | | | | 314,173 | | | | 1.24 | % |
| Tokai Tokyo Financial Holdings, Inc. | | | 81,600 | | | | 496,455 | | | | 1.96 | % |
| | | | | | | | 1,217,926 | | | | 4.81 | % |
| | | | | | | | | | | | | |
| Industrials – 35.99% | | | | | | | | | | | | |
| Benefit One, Inc. | | | 16,600 | | | | 290,588 | | | | 1.15 | % |
| Daihen Corp. | | | 105,000 | | | | 522,125 | | | | 2.06 | % |
| Daiichi Jitsugyo, Inc. | | | 77,000 | | | | 328,525 | | | | 1.30 | % |
| Hanwa Co., Ltd. | | | 118,000 | | | | 487,967 | | | | 1.93 | % |
| Hito Communication, Inc. | | | 12,900 | | | | 281,788 | | | | 1.11 | % |
| Kanematsu Corp. | | | 223,000 | | | | 368,225 | | | | 1.45 | % |
| Kito Corp. | | | 31,500 | | | | 248,757 | | | | 0.98 | % |
| Kitz Corp. | | | 86,800 | | | | 399,511 | | | | 1.58 | % |
| Kondotec, Inc. | | | 57,100 | | | | 366,720 | | | | 1.45 | % |
| Miyaji Engineering Group, Inc. | | | 173,000 | | | | 313,233 | | | | 1.24 | % |
| Nachi-Fujikoshi Corp. | | | 112,000 | | | | 502,792 | | | | 1.99 | % |
| Nakano Corp. | | | 73,700 | | | | 452,500 | | | | 1.79 | % |
The accompanying notes are an integral part of these financial statements.
| COMMON STOCKS | | Number | | | | | | % of | |
| | | of Shares | | | Value | | | Net Assets | |
| Industrials (Continued) | | | | | | | | | |
| Nihon Trim Co., Ltd. | | | 10,000 | | | $ | 372,904 | | | | 1.47 | % |
| Nissei ASB Machine Co., Ltd. | | | 20,600 | | | | 420,820 | | | | 1.66 | % |
| Nittoku Engineering Co., Ltd. | | | 49,200 | | | | 450,358 | | | | 1.78 | % |
| Okamura Corp. | | | 51,600 | | | | 478,756 | | | | 1.89 | % |
| Ryobi, Ltd. | | | 101,000 | | | | 372,382 | | | | 1.47 | % |
| Sanko Gosei, Ltd. | | | 66,000 | | | | 215,254 | | | | 0.85 | % |
| Sinfonia Technology Co., Ltd. | | | 307,000 | | | | 530,125 | | | | 2.09 | % |
| Sumitomo Densetsu Co., Ltd. | | | 38,900 | | | | 510,020 | | | | 2.01 | % |
| Takeei Corp. | | | 40,000 | | | | 385,901 | | | | 1.52 | % |
| Tocalo Co., Ltd. | | | 15,300 | | | | 307,122 | | | | 1.21 | % |
| Toppan Forms Co., Ltd. | | | 39,600 | | | | 510,156 | | | | 2.01 | % |
| | | | | | | | 9,116,529 | | | | 35.99 | % |
| | | | | | | | | | | | | |
| Information Technology – 23.77% | | | | | | | | | | | | |
| Aichi Tokei Denki Co., Ltd. | | | 116,000 | | | | 312,092 | | | | 1.23 | % |
| Aiphone Co., Ltd. | | | 26,300 | | | | 404,539 | | | | 1.60 | % |
| Amano Corp. | | | 41,000 | | | | 532,536 | | | | 2.10 | % |
| Anritsu Corp. | | | 36,500 | | | | 239,562 | | | | 0.94 | % |
| Elecom Co., Ltd. | | | 20,000 | | | | 242,564 | | | | 0.96 | % |
| Information Services International – Dentsu, Ltd. | | | 28,100 | | | | 439,046 | | | | 1.73 | % |
| Itfor, Inc. | | | 109,200 | | | | 466,588 | | | | 1.84 | % |
| Koa Corp. | | | 44,700 | | | | 371,813 | | | | 1.47 | % |
| Kyosan Electric Manufacturing Co., Ltd. | | | 180,000 | | | | 506,272 | | | | 2.00 | % |
| Marubun Corp. | | | 35,200 | | | | 253,675 | | | | 1.00 | % |
| Nihon Unisys, Ltd. | | | 42,800 | | | | 470,241 | | | | 1.86 | % |
| Soliton Systems K.K. | | | 31,600 | | | | 268,397 | | | | 1.06 | % |
| TKC Corp. | | | 15,000 | | | | 353,573 | | | | 1.40 | % |
| Towa Corp. | | | 90,500 | | | | 485,716 | | | | 1.92 | % |
| V-cube, Inc. | | | 14,200 | | | | 257,100 | | | | 1.01 | % |
| Yokowo Co., Ltd. | | | 76,500 | | | | 417,359 | | | | 1.65 | % |
| | | | | | | | 6,021,073 | | | | 23.77 | % |
| | | | | | | | | | | | | |
| Materials – 6.98% | | | | | | | | | | | | |
| Aichi Steel Corp. | | | 114,000 | | | | 495,194 | | | | 1.96 | % |
| Asia Pile Holdings Corp. | | | 55,500 | | | | 341,158 | | | | 1.35 | % |
| Fujikura Kasei Co., Ltd. | | | 42,200 | | | | 198,216 | | | | 0.78 | % |
The accompanying notes are an integral part of these financial statements.
| HENNESSY FUNDS | 1-800-966-4354 | |
| COMMON STOCKS | | Number | | | | | | % of | |
| | | of Shares | | | Value | | | Net Assets | |
| Materials (Continued) | | | | | | | | | |
| Hakudo Co., Ltd. | | | 36,200 | | | $ | 405,826 | | | | 1.60 | % |
| Shinagawa Refractories, Ltd. | | | 146,000 | | | | 327,557 | | | | 1.29 | % |
| | | | | | | | 1,767,951 | | | | 6.98 | % |
| | | | | | | | | | | | | |
| Utilities – 1.14% | | | | | | | | | | | | |
| eREX Co., Ltd. | | | 29,800 | | | | 288,480 | | | | 1.14 | % |
| | | | | | | | | | | | | |
| Total Common Stocks | | | | | | | | | | | | |
| (Cost $21,654,505) | | | | | | | 22,905,560 | | | | 90.43 | % |
| | | | | | | | | | | | | |
| SHORT-TERM INVESTMENTS – 11.92% | | | | | | | | | | | | |
| | | | | | | | | | | | | |
| Money Market Funds – 11.92% | | | | | | | | | | | | |
| Federated Government Obligations Fund – Class I, 0.01% (a) | | | 1,255,000 | | | | 1,255,000 | | | | 4.95 | % |
| Federated Treasury Obligations Fund, 0.01% (a) | | | 510,050 | | | | 510,050 | | | | 2.01 | % |
| Fidelity Government Portfolio – Institutional Class, 0.01% (a) | | | 1,255,000 | | | | 1,255,000 | | | | 4.96 | % |
| | | | | | | | | | | | | |
| Total Short-Term Investments | | | | | | | | | | | | |
| (Cost $3,020,050) | | | | | | | 3,020,050 | | | | 11.92 | % |
| | | | | | | | | | | | | |
| Total Investments | | | | | | | | | | | | |
| (Cost $24,674,555) – 102.35% | | | | | | | 25,925,610 | | | | 102.35 | % |
| Liabilities in Excess | | | | | | | | | | | | |
| of Other Assets – (2.35)% | | | | | | | (596,269 | ) | | | (2.35 | )% |
TOTAL NET ASSETS – 100.00% | | | | | | $ | 25,329,341 | | | | 100.00 | % |
Percentages are stated as a percent of net assets.
| (a) | The rate listed is the fund’s 7-day yield as of October 31, 2015. |
The accompanying notes are an integral part of these financial statements.
Summary of Fair Value Exposure at October 31, 2015
The following is a summary of the inputs used to value the Fund’s net assets as of October 31, 2015 (see Note 3 in the accompanying notes to the financial statements):
| Common Stocks | | Level 1 | | | Level 2 | | | Level 3 | | | Total | |
| Consumer Discretionary | | $ | — | | | $ | 3,751,664 | | | $ | — | | | $ | 3,751,664 | |
| Consumer Staples | | | — | | | | 741,937 | | | | — | | | | 741,937 | |
| Financials | | | — | | | | 1,217,926 | | | | — | | | | 1,217,926 | |
| Industrials | | | — | | | | 9,116,529 | | | | — | | | | 9,116,529 | |
| Information Technology | | | — | | | | 6,021,073 | | | | — | | | | 6,021,073 | |
| Materials | | | — | | | | 1,767,951 | | | | — | | | | 1,767,951 | |
| Utilities | | | — | | | | 288,480 | | | | — | | | | 288,480 | |
| Total Common Stocks | | $ | — | | | $ | 22,905,560 | | | $ | — | | | $ | 22,905,560 | |
| Short-Term Investments | | | | | | | | | | | | | | | | |
| Money Market Funds | | $ | 3,020,050 | | | $ | — | | | $ | — | | | $ | 3,020,050 | |
| Total Short-Term Investments | | $ | 3,020,050 | | | $ | — | | | $ | — | | | $ | 3,020,050 | |
| Total Investments | | $ | 3,020,050 | | | $ | 22,905,560 | | | $ | — | | | $ | 25,925,610 | |
Transfers between levels are recognized at the end of the reporting period. During the year ended October 31, 2015, the Fund recognized no significant transfers between levels.
Transfers between Level 1 and Level 2 relate to the use of a fair valuation pricing service. On days when the fair valuation pricing service is used, non-U.S. dollar denominated securities move from a Level 1 to a Level 2 classification.
The accompanying notes are an integral part of these financial statements.
| HENNESSY FUNDS | 1-800-966-4354 | |
Financial Statements
Statement of Assets and Liabilities as of October 31, 2015 |
| ASSETS: | | | |
| Investments in securities, at value (cost $24,674,555) | | $ | 25,925,610 | |
| Dividends and interest receivable | | | 148,594 | |
| Receivable for fund shares sold | | | 67,872 | |
| Receivable for securities sold | | | 20,425 | |
| Prepaid expenses and other assets | | | 20,528 | |
| Total Assets | | | 26,183,029 | |
| | | | | |
| LIABILITIES: | | | | |
| Payable for securities purchased | | | 790,020 | |
| Payable for fund shares redeemed | | | 1,162 | |
| Payable to advisor | | | 22,486 | |
| Payable to administrator | | | 3,775 | |
| Payable to auditor | | | 19,867 | |
| Accrued service fees | | | 1,771 | |
| Accrued trustees fees | | | 2,391 | |
| Accrued expenses and other payables | | | 12,216 | |
| Total Liabilities | | | 853,688 | |
| NET ASSETS | | $ | 25,329,341 | |
| | | | | |
| NET ASSETS CONSIST OF: | | | | |
| Capital stock | | $ | 23,337,029 | |
| Accumulated net investment loss | | | (81,572 | ) |
| Accumulated net realized gain on investments | | | 823,971 | |
| Unrealized net appreciation on investments | | | 1,249,913 | |
| Total Net Assets | | $ | 25,329,341 | |
| | | | | |
| NET ASSETS | | | | |
| Investor Class: | | | | |
| Shares authorized (no par value) | | Unlimited | |
| Net assets applicable to outstanding Investor Class shares | | $ | 22,681,326 | |
| Shares issued and outstanding | | | 2,205,245 | |
| Net asset value, offering price and redemption price per share | | $ | 10.29 | |
| | | | | |
| Institutional Class: | | | | |
| Shares authorized (no par value) | | Unlimited | |
| Net assets applicable to outstanding Institutional Class shares | | $ | 2,648,015 | |
| Shares issued and outstanding | | | 257,187 | |
| Net asset value, offering price and redemption price per share | | $ | 10.30 | |
The accompanying notes are an integral part of these financial statements.
Financial Statements
Statement of Operations for the year ended October 31, 2015 |
| INVESTMENT INCOME: | | | |
Dividend income(1) | | $ | 316,404 | |
| Interest income | | | 104 | |
| Total investment income | | | 316,508 | |
| | | | | |
| EXPENSES: | | | | |
| Investment advisory fees (See Note 5) | | | 219,524 | |
| Sub-transfer agent expenses – Investor Class (See Note 5) | | | 39,962 | |
| Sub-transfer agent expenses – Institutional Class (See Note 5) | | | 129 | |
| Federal and state registration fees | | | 23,638 | |
| Compliance expense | | | 22,186 | |
| Audit fees | | | 20,434 | |
| Administration, fund accounting, custody and transfer agent fees (See Note 5) | | | 18,347 | |
| Service fees – Investor Class (See Note 5) | | | 18,109 | |
| Trustees’ fees and expenses | | | 11,334 | |
| Reports to shareholders | | | 6,355 | |
| Legal fees | | | 1,800 | |
| Interest expense (See Note 6) | | | 855 | |
| Other expenses | | | 5,205 | |
| Total expenses | | | 387,878 | |
| NET INVESTMENT LOSS | | $ | (71,370 | ) |
| | | | | |
| REALIZED AND UNREALIZED GAINS (LOSSES): | | | | |
| Net realized gain on investments | | $ | 980,030 | |
| Net change in unrealized depreciation on investments | | | (324,113 | ) |
| Net gain on investments | | | 655,917 | |
| NET INCREASE IN NET ASSETS RESULTING FROM OPERATIONS | | $ | 584,547 | |
(1) | Net of foreign taxes withheld of $35,784. |
The accompanying notes are an integral part of these financial statements.
| HENNESSY FUNDS | 1-800-966-4354 | |
(This Page Intentionally Left Blank.)
Financial Statements
| Statements of Changes in Net Assets |
| | | Year Ended | | | Year Ended | |
| | | October 31, 2015 | | | October 31, 2014 | |
| OPERATIONS: | | | | | | |
| Net investment loss | | $ | (71,370 | ) | | $ | (67,562 | ) |
| Net realized gain on investments | | | 980,030 | | | | 1,539,731 | |
| Net change in unrealized appreciation (depreciation) | | | | | | | | |
| on investments | | | (324,113 | ) | | | 326,483 | |
| Net increase in net assets resulting from operations | | | 584,547 | | | | 1,798,652 | |
| | | | | | | | | |
| DISTRIBUTIONS TO SHAREHOLDERS FROM: | | | | | | | | |
| Net realized gains – Investor Class | | | (1,537,113 | ) | | | (3,229,364 | ) |
| Total distributions | | | (1,537,113 | ) | | | (3,229,364 | ) |
| | | | | | | | | |
| CAPITAL SHARE TRANSACTIONS: | | | | | | | | |
| Proceeds from shares subscribed – Investor Class | | | 19,602,053 | | | | 22,078,882 | |
| Proceeds from shares subscribed – Institutional Class | | | 3,944,130 | | | | — | |
| Dividends reinvested – Investor Class | | | 1,515,157 | | | | 3,179,599 | |
| Cost of shares redeemed – Investor Class | | | (16,864,362 | ) | | | (19,287,749 | )(1) |
| Cost of shares redeemed – Institutional Class | | | (1,278,434 | ) | | | — | |
| Net increase in net assets derived | | | | | | | | |
| from capital share transactions | | | 6,918,544 | | | | 5,970,732 | |
| TOTAL INCREASE IN NET ASSETS | | | 5,965,978 | | | | 4,540,020 | |
| | | | | | | | | |
| NET ASSETS: | | | | | | | | |
| Beginning of year | | | 19,363,363 | | | | 14,823,343 | |
| End of year | | $ | 25,329,341 | | | $ | 19,363,363 | |
| Accumulated net investment loss, end of year | | $ | (81,572 | ) | | $ | (92,011 | ) |
| | | | | | | | | |
| CHANGES IN SHARES OUTSTANDING: | | | | | | | | |
| Shares sold – Investor Class | | | 1,882,041 | | | | 2,160,787 | |
| Shares sold – Institutional Class | | | 375,953 | | | | — | |
| Shares issued to holders as | | | | | | | | |
| reinvestment of dividends – Investor Class | | | 160,845 | | | | 340,064 | |
| Shares redeemed – Investor Class | | | (1,679,167 | ) | | | (1,926,098 | ) |
| Shares redeemed – Institutional Class | | | (118,766 | ) | | | — | |
| Net increase in shares outstanding | | | 620,906 | | | | 574,753 | |
(1) | Net of redemption fees of $47 related to redemption fees imposed by the Fund during a prior year but not received until the year ended October 31, 2014. |
The accompanying notes are an integral part of these financial statements.
| HENNESSY FUNDS | 1-800-966-4354 | |
Financial Statements
For an Investor Class share outstanding throughout each year
PER SHARE DATA:
Net asset value, beginning of year
Income from investment operations:
Net investment income (loss)
Net realized and unrealized gains (losses) on investments
Total from investment operations
Less distributions:
Dividends from net investment income
Dividends from net realized gains
Total distributions
Net asset value, end of year
TOTAL RETURN
SUPPLEMENTAL DATA AND RATIOS:
Net assets, end of year (millions)
Ratio of expenses to average net assets
Ratio of net investment income (loss) to average net assets
Portfolio turnover rate (1)
(1) | Portfolio turnover is calculated on the basis of the Fund as a whole. |
The accompanying notes are an integral part of these financial statements.
| Year Ended October 31, | |
| 2015 | | | 2014 | | | 2013 | | | 2012 | | | 2011 | |
| | | | | | | | | | | | | |
| $ | 10.51 | | | $ | 11.70 | | | $ | 10.54 | | | $ | 10.09 | | | $ | 9.23 | |
| | | | | | | | | | | | | | | | | | | |
| | | | | | | | | | | | | | | | | | | |
| | (0.02 | ) | | | (0.04 | ) | | | 0.06 | | | | (0.68 | ) | | | 0.06 | |
| | 0.71 | | | | 1.36 | | | | 3.44 | | | | 1.17 | | | | 0.80 | |
| | 0.69 | | | | 1.32 | | | | 3.50 | | | | 0.49 | | | | 0.86 | |
| | | | | | | | | | | | | | | | | | | |
| | | | | | | | | | | | | | | | | | | |
| | — | | | | — | | | | — | | | | (0.04 | ) | | | — | |
| | (0.91 | ) | | | (2.51 | ) | | | (2.34 | ) | | | — | | | | — | |
| | (0.91 | ) | | | (2.51 | ) | | | (2.34 | ) | | | (0.04 | ) | | | — | |
| $ | 10.29 | | | $ | 10.51 | | | $ | 11.70 | | | $ | 10.54 | | | $ | 10.09 | |
| | | | | | | | | | | | | | | | | | | |
| | 7.37 | % | | | 13.99 | % | | | 40.59 | % | | | 4.91 | % | | | 9.32 | % |
| | | | | | | | | | | | | | | | | | | |
| | | | | | | | | | | | | | | | | | | |
| $ | 22.68 | | | $ | 19.36 | | | $ | 14.82 | | | $ | 5.11 | | | $ | 24.08 | |
| | 2.12 | % | | | 2.24 | % | | | 2.39 | % | | | 2.33 | % | | | 2.10 | % |
| | (0.38 | )% | | | (0.39 | )% | | | (0.11 | )% | | | (0.66 | )% | | | 0.17 | % |
| | 75 | % | | | 63 | % | | | 141 | % | | | 49 | % | | | 61 | % |
| | | | | | | | | | | | | | | | | | | |
The accompanying notes are an integral part of these financial statements.
| HENNESSY FUNDS | 1-800-966-4354 | |
Financial Statements
For an Institutional Class share outstanding throughout the period
| | | Period Ended | |
| | | October 31, 2015(1) | |
| PER SHARE DATA: | | | |
| Net asset value, beginning of period | | $ | 10.89 | |
| | | | | |
| Income from investment operations: | | | | |
| Net investment income (loss) | | | (0.01 | ) |
| Net realized and unrealized gains (losses) on investments | | | (0.58 | ) |
| Total from investment operations | | | (0.59 | ) |
| Net asset value, end of period | | $ | 10.30 | |
| | | | | |
| TOTAL RETURN | | | (5.42 | )%(2) |
| | | | | |
| SUPPLEMENTAL DATA AND RATIOS: | | | | |
| Net assets, end of period (millions) | | $ | 2.65 | |
| Ratio of expenses to average net assets | | | 1.86 | %(3) |
| Ratio of net investment (loss) to average net assets | | | (1.04 | )%(3) |
Portfolio turnover rate (4) | | | 75 | %(2) |
(1) | The Institutional Class shares commenced operations on June 15, 2015. |
(2) | Not annualized. |
(3) | Annualized. |
(4) | Portfolio turnover is calculated on the basis of the Fund as a whole. |
The accompanying notes are an integral part of these financial statements.
Financial Statements
Notes to the Financial Statements October 31, 2015 |
1). ORGANIZATION
The Hennessy Japan Small Cap Fund (the “Fund”) is a series of Hennessy Funds Trust (the “Trust”), which was organized as a Delaware statutory trust on September 17, 1992. The Fund is an open-end management investment company registered under the Investment Company Act of 1940, as amended. The Fund is a successor to a fund with the same name (the “Predecessor Fund”) that was a series of Hennessy SPARX Funds Trust, a Massachusetts business trust, pursuant to a reorganization that took place after the close of business on February 28, 2014. Prior to February 28, 2014, the Fund had no investment operations. As a result of the reorganization, holders of the Investor Class shares of the Predecessor Fund received Investor Class shares of the Fund (the Investor Class shares of the Fund are the successor to the accounting and performance information of the Predecessor Fund). The Fund did not have Institutional Class shares until June 15, 2015. The investment objective of the Fund is long-term capital appreciation. The Fund is a diversified fund.
The Fund offers Investor Class and Institutional Class shares. Each class of shares differs principally in its respective administration, shareholder servicing, and transfer agent expenses and sales charges, if any. Each class has identical rights to earnings, assets, and voting privileges, except for class-specific expenses and exclusive rights to vote on matters affecting only an individual class.
As an investment company, the Fund follows the investment company accounting and reporting guidance of the Financial Accounting Standards Board (“FASB”) Accounting Standard Codification Topic 946 “Financial Services—Investment Companies.”
2). SIGNIFICANT ACCOUNTING POLICIES
The following is a summary of significant accounting policies consistently followed by the Fund in the preparation of the financial statements. These policies are in conformity with U.S. generally accepted accounting principles (“GAAP”).
| a). | Investment Valuation – All investments in securities are recorded at their estimated fair value, as described in Note 3. |
| | |
| b). | Federal Income Taxes – Provision for federal income taxes or excise taxes has not been made since the Fund has elected to be taxed as a “regulated investment company” and intends to distribute substantially all of its taxable income to its shareholders and otherwise comply with the provisions of the Internal Revenue Code of 1986, as amended, applicable to regulated investment companies. Net investment income or loss and realized gains and losses for federal income tax purposes may differ from that reported on the financial statements because of temporary book and tax basis differences. Temporary differences are primarily the result of the treatment of wash sales for tax reporting purposes. The Fund recognizes interest and penalties related to income tax benefits, if any, in the statement of operations as an income tax expense. Distributions from net realized gains for book purposes may include short-term capital gains, which are included as ordinary income to shareholders for tax purposes. |
| | |
| | Due to inherent differences in the recognition of income, expenses, and realized gains/losses under GAAP and federal income tax regulations, permanent differences between book and tax basis reporting for the 2015 fiscal year have been identified |
| HENNESSY FUNDS | 1-800-966-4354 | |
| | and appropriately reclassified on the Statement of Assets and Liabilities. The adjustments are as follows: |
| Undistributed | Accumulated | |
| Net Investment | Net Realized | |
Income/(Loss) | Gain/(Loss) | Paid-in Capital |
| $81,809 | $(6,948) | $(74,861) |
| c). | Income and Expenses – Dividend income is recognized on the ex-dividend date or as soon as information is available to the Fund. Interest income, which includes the amortization of premium and accretion of discount, is recognized on an accrual basis. The Fund is charged for those expenses that are directly attributable to the portfolio, such as advisory, administration, and certain shareholder service fees. Income, expenses (other than expenses attributable to a specific class), and realized and unrealized gains or losses on investments are allocated to each class of shares based on its respective net assets. |
| | |
| d). | Distributions to Shareholders – Dividends from net investment income for the Fund, if any, are declared and paid annually, usually in December. Distributions of net realized capital gains, if any, are declared and paid annually, usually in December. |
| | |
| e). | Security Transactions – Investment and shareholder transactions are recorded on the trade date. The Fund determines the gain or loss realized from the investment transactions by comparing the original cost of the security lot sold with the net sale proceeds. Discounts and premiums on securities purchased are accreted/amortized over the life of the respective security. |
| | |
| f). | Use of Estimates – The preparation of financial statements in conformity with GAAP requires management to make estimates and assumptions that affect the reported amounts of assets and liabilities and disclosure of contingent assets and liabilities at the date of the financial statements and the reported change in net assets during the reporting period. Actual results could differ from those estimates. |
| | |
| g). | Share Valuation – The net asset value (“NAV”) per share of the Fund is calculated by dividing the sum of the value of the securities held by the Fund, plus cash or other assets, minus all liabilities (including estimated accrued expenses) by the total number of shares outstanding for the Fund, rounded to the nearest cent. The Fund’s shares will not be priced on days the New York Stock Exchange is closed for trading. The offering and redemption price per share for the Fund is equal to the Fund’s NAV per share. |
| | |
| h). | Foreign Currency – Values of investments denominated in foreign currencies are converted into U.S. dollars using the spot market rate of exchange at the time of valuation. Purchases and sales of investments and income are translated into U.S. dollars using the spot market rate of exchange prevailing on the respective dates of such transactions. The Fund does not isolate the portion of the results of operations resulting from fluctuations in foreign exchange rates on investments from fluctuations resulting from changes in the market prices of securities held. Such fluctuations are included with the net realized and unrealized gain or loss on investments. Foreign investments present additional risks due to currency fluctuations, economic and political factors, lower liquidity, government regulations, differences in accounting standards, and other factors. |
| | |
| i). | Forward Contracts – The Fund may enter into forward currency contracts to reduce its exposure to changes in foreign currency exchange rates on its foreign holdings and to lock in the U.S. dollar cost of firm purchase and sale commitments for securities denominated in foreign currencies. A forward currency contract is a |
| | commitment to purchase or sell a foreign currency at a future date at a negotiated forward rate. The gain or loss arising from the difference between the U.S. dollar cost of the original contract and the value of the foreign currency in U.S. dollars upon closing of such contract is included in net realized gain or loss from foreign currency transactions. During the fiscal year ended October 31, 2015, the Fund did not enter into any forward contracts. |
| | |
| j). | Repurchase Agreements – The Fund may enter into repurchase agreements with member banks or security dealers of the Federal Reserve Board whom the investment advisor deems creditworthy. The repurchase price generally equals the price paid by the Fund plus interest negotiated on the basis of current short-term rates. |
| | |
| | Securities pledged as collateral for repurchase agreements are held by the custodian bank until the respective agreements mature. Provisions of the repurchase agreements ensure that the market value of the collateral, including accrued interest thereon, is sufficient to cover the repurchase amount in the event of default of the counterparty. If the counterparty defaults and the value of the collateral declines or if the counterparty enters an insolvency proceeding, realization of the collateral by the Fund may be delayed or limited. |
| | |
| k). | Accounting for Uncertainty in Income Taxes – The Fund has accounting policies regarding recognition and measurement of tax positions taken or expected to be taken on a tax return. The tax returns of the Fund for the prior three fiscal years are open for examination. The Fund has reviewed all open tax years in major jurisdictions and concluded that there is no impact on the Fund’s net assets and no tax liability resulting from unrecognized tax benefits relating to uncertain income tax positions taken or expected to be taken on a tax return. The Fund’s major tax jurisdictions are U.S. federal and Delaware. |
| | |
| l). | Derivatives – The Fund may invest in, or enter into, derivatives, such as options, futures contracts, options on futures contracts, and swaps, for a variety of reasons, including to hedge certain risks, to provide a substitute for purchasing or selling particular securities, or to increase potential income gain. Derivatives may provide a cheaper, quicker, or more specifically focused way for a Fund to invest than “traditional” securities would. The main purpose of utilizing these derivative instruments is for hedging purposes. |
| | |
| | The Fund follows the financial accounting reporting rules as required by the Derivatives and Hedging Topic of the FASB Accounting Standards Codification. Under such rules, the Fund is required to include enhanced disclosure that enables investors to understand how and why an entity uses derivatives, how derivatives are accounted for, and how derivatives instruments affect an entity’s results of operations and financial position. During the fiscal year ended October 31, 2015, the Fund did not hold any derivative instruments. |
| | |
| m). | New Accounting Pronouncements – In June 2014, the FASB issued Accounting Standards Update (“ASU”) No. 2014-11 “Repurchase-to Maturity Transactions, Repurchase Financings, and Disclosures.” The amendments in this ASU require an entity to modify accounting for repurchase-to-maturity transactions and repurchase financing arrangements, as well as modify required disclosures for repurchase agreements, securities lending transactions, and repurchase-to-maturity transactions that are accounted for as secured borrowings. The guidance is effective for fiscal years beginning on or after December 15, 2014, and for interim periods within those fiscal years. Management is currently evaluating the impact these changes will have on the Fund’s financial statement disclosures. |
| HENNESSY FUNDS | 1-800-966-4354 | |
| | In May 2015, the FASB issued ASU No. 2015-07 “Disclosure for Investments in Certain Entities that Calculate Net Asset Value per Share (or Its Equivalent).” The amendments in ASU No. 2015-07 remove the requirement to categorize within the fair value hierarchy investments measured at NAV and require the disclosure of sufficient information to reconcile the fair value of the remaining assets categorized within the fair value hierarchy to the financial statements. The amendments in ASU No. 2015-07 are effective for fiscal years beginning after December 15, 2015, and interim periods within those fiscal years. Management has reviewed the requirements and believes the adoption of ASU 2015-07 will not have a material impact on the Fund’s financial statements and related disclosures. |
3). SECURITIES VALUATION
The Fund follows authoritative fair valuation accounting standards that establish an authoritative definition of fair value and set out a hierarchy for measuring fair value. These standards require additional disclosures about the various inputs and valuation techniques used to develop the measurements of fair value and a discussion in changes in valuation techniques and related inputs during the period. These inputs are summarized in the three broad levels listed below:
| | Level 1 – | Quoted unadjusted prices for identical instruments in active markets to which the Fund has access at the date of measurement. |
| | | |
| | Level 2 – | Quoted prices for similar instruments in active markets; quoted prices for identical or similar instruments in markets that are not active; and model-derived valuations in which all significant inputs and significant value drivers are observable in active markets. Level 2 inputs are those in markets for which there are few transactions, the prices are not current, the prices are fair value adjusted due to post-market close subsequent events (foreign markets), little public information exists, or instances where prices vary substantially over time or among brokered market makers. These inputs may also include interest rates, prepayment speeds, credit risk curves, default rates, and similar data. |
| | | |
| | Level 3 – | Model-derived valuations in which one or more significant inputs or significant value drivers are unobservable. Unobservable inputs are those inputs that reflect the Fund’s own assumptions about what market participants would use to price the asset or liability based on the best available information. |
Following is a description of the valuation techniques applied to the Fund’s major categories of assets and liabilities measured at fair value on a recurring basis.
Equity Securities – Equity securities, including common stocks, preferred stocks, foreign-issued common stocks, exchange-traded funds, closed-end mutual funds, partnerships, rights, and real estate investment trusts, that are traded on a securities exchange for which a last-quoted sales price is readily available will generally be valued at the last sales price as reported by the primary exchange on which the securities are listed. Securities listed on The NASDAQ Stock Market (“NASDAQ”) will generally be valued at the NASDAQ Official Closing Price, which may differ from the last sales price reported. Securities traded on a securities exchange for which a last-quoted sales price is not readily available will generally be valued at the mean between the bid and ask prices. To the extent these securities are actively traded and valuation adjustments are not applied, they are classified in Level 1 of the fair value hierarchy. Securities traded on foreign exchanges generally are not valued at the same time the Fund calculates its NAV because most
foreign markets close well before such time. The earlier close of most foreign markets gives rise to the possibility that significant events, including broad market moves, may have occurred in the interim. In certain circumstances, it may be determined that a security needs to be fair valued because it appears that the value of the security might have been materially affected by events occurring after the close of the market in which the security is principally traded, but before the time the Fund calculates its NAV, such as by a development that affects an entire market or region (e.g., weather-related events) or a potentially global development (e.g., a terrorist attack that may be expected to have an effect on investor expectations worldwide).
Registered Investment Companies – Investments in registered investment companies (e.g., mutual funds) are generally priced at the ending NAV provided by the applicable registered investment company’s service agent and will be classified in Level 1 of the fair value hierarchy.
Debt Securities – Debt securities, including corporate bonds, asset-backed securities, mortgage-backed securities, municipal bonds, U.S. Treasuries, and U.S. government agency issues, are generally valued at market on the basis of valuations furnished by an independent pricing service that utilizes both dealer-supplied valuations and formula-based techniques. The pricing service may consider recently executed transactions in securities of the issuer or comparable issuers, market price quotations (where observable), bond spreads, and fundamental data relating to the issuer. In addition, the model may incorporate market observable data such as reported sales of similar securities, broker quotes, yields, bids, offers, and reference data. Certain securities are valued principally using dealer quotations. These securities are generally classified in Level 2 of the fair value hierarchy.
Short-Term Securities – Short-term equity investments, including money market funds, are valued in the manner specified above. Short-term debt investments are generally valued at amortized cost, which approximates fair market value, if their original term to maturity was 60 days or less, or by amortizing the values as of the 61st day prior to maturity, if their original term to maturity exceeded 60 days. Amortized cost is not used if its use would be inappropriate due to credit or other impairments of the issuer, in which case the security’s fair value would be determined, as described below. Short-term securities are generally classified in Level 1 or Level 2 of the fair market hierarchy depending on the inputs used and market activity levels for specific securities.
The Board of Trustees of the Fund (the “Board”) has adopted fair value pricing procedures that are followed when a price for a security is not readily available or if a significant event has occurred that indicates the closing price of a security no longer represents the true value of that security. Fair value pricing determinations are made in good faith in accordance with these procedures. There are numerous criteria that will be given consideration in determining a fair value of a security. Some of these criteria are trading volume of a security and markets, the value of other like securities, and news events with direct bearing to a security or markets. Fair value pricing results in an estimated price for a security that reflects the amount the Fund might reasonably expect to receive in a current sale. Depending on the relative significance of the valuation inputs, these securities may be classified in either Level 2 or Level 3 of the fair value hierarchy.
The fair valuation of foreign securities may be determined with the assistance of a pricing service using correlations between the movement of prices of such securities and indices of domestic securities and other appropriate indicators, such as closing market prices of relevant American Depositary Receipts or futures contracts. The effect of using fair value pricing is that the Fund’s NAV will reflect the affected portfolio securities’ value
| HENNESSY FUNDS | 1-800-966-4354 | |
as determined in the judgment of the Board or its designee instead of being determined by the market. Using a fair value pricing methodology to price foreign securities may result in a value that is different from a foreign security’s most recent closing price and from the prices used by other investment companies to calculate their NAVs and are generally considered Level 2 prices in the fair valuation hierarchy. Because the Fund may invest in foreign securities, the value of the Fund’s portfolio securities may change on days when you will not be able to purchase or redeem your shares.
The Board has delegated day-to-day valuation matters to a Valuation Committee comprised of one or more representatives from Hennessy Advisors, Inc., the Fund’s investment advisor. The function of the Valuation Committee is to value securities where current and reliable market quotations are not readily available. All actions taken by the Valuation Committee are reviewed by the Board.
The Fund has performed an analysis of all existing investments to determine the significance and character of all inputs to their fair value determination. Various inputs are used in determining the value of the Fund’s investments. The inputs or methodology used for valuing securities are not necessarily an indication of the risk associated with investing in those securities. Details related to the fair valuation hierarchy of the Fund’s securities as of October 31, 2015 are included in the Fund’s Schedule of Investments.
4). INVESTMENT TRANSACTIONS
Purchases and sales of investment securities (excluding government and short-term investments) for the Fund during the fiscal year ended October 31, 2015 were $16,467,718 and $13,402,162, respectively.
There were no purchases or sales/maturities of long-term U.S. Government Securities for the Fund during the fiscal year ended October 31, 2015.
5). INVESTMENT MANAGEMENT FEE AND OTHER TRANSACTIONS WITH AFFILIATES
Hennessy Advisors, Inc. (the “Advisor”) is the investment advisor of the Fund. The Advisor provides the Fund with investment management services under an Investment Advisory Agreement. The Advisor furnishes all investment advice, office space, facilities, and provides most of the personnel needed by the Fund. As compensation for its services, the Advisor is entitled to a monthly fee from the Fund. The fee is based upon the average daily net assets of the Fund at the annual rate of 1.20%. The net investment advisory fees payable by the Fund as of October 31, 2015 were $22,486.
The Advisor has delegated the day-to-day management of the Fund to a sub-advisor, SPARX Asset Management Co., Ltd. The Advisor pays the sub-advisor fees for the Fund from its own assets and these fees are not an additional expense of the Fund.
The Board has approved a Shareholder Servicing Agreement for the Investor Class shares of the Fund, which was instituted to compensate the Advisor for the non-investment management services it provides to the Fund. The Shareholder Servicing Agreement provides for a monthly fee paid to the Advisor at an annual rate of 0.10% of the average daily net assets of the Fund attributable to Investor Class shares. Shareholder service fees payable by the Fund as of October 31, 2015 were $1,771.
The Fund has entered into agreements with various brokers, dealers, and financial intermediaries in connection with the sale of shares of the Fund. The agreements provide for periodic payments by the Fund to the brokers, dealers, and financial intermediaries for providing certain shareholder maintenance services (sub-transfer agent expenses). These shareholder services include the pre-processing and quality control of new accounts, shareholder correspondence, answering customer inquiries regarding
account status, and facilitating shareholder telephone transactions. Fees paid by the Fund to various brokers, dealers, and financial intermediaries during the fiscal year ended October 31, 2015 were $40,091.
U.S. Bancorp Fund Services, LLC (“USBFS”) provides the Fund with administrative, fund accounting, and transfer agent services, including all regulatory reporting, and necessary office equipment and personnel. As administrator, USBFS is responsible for activities such as (i) preparing various federal and state regulatory filings, reports, and returns for the Fund, (ii) preparing reports and materials to be supplied to the Board, (iii) monitoring the activities of the Fund’s custodian, transfer agent, and accountants, and (iv) coordinating the preparation and payment of the Fund’s expenses and reviewing the Fund’s expense accruals. Fees paid to USBFS during the fiscal year ended October 31, 2015 were $18,347.
U.S. Bank, N.A., an affiliate of USBFS, serves as the Fund’s custodian. Quasar Distributors, LLC acts as the Fund’s principal underwriter in a continuous public offering of the Fund’s shares. Quasar Distributors, LLC is an affiliate of USBFS and U.S. Bank, N.A.
6). LINE OF CREDIT
The Fund has an uncommitted line of credit with the other funds in the Hennessy Funds family of funds (the “Hennessy Funds”) in the amount of the lesser of (i) $100,000,000 or (ii) 33.33% of each Hennessy Fund’s net assets, or 30% for the Hennessy Gas Utility Fund and 10% for the Hennessy Balanced Fund, intended to provide short-term financing, if necessary, subject to certain restrictions, in connection with shareholder redemptions. The credit facility is with the Hennessy Funds’ custodian bank, U.S. Bank, N.A. Borrowings under this arrangement bear interest at the bank’s prime rate and are secured by all of the Fund’s assets (as to its own borrowings only). During the fiscal year ended October 31, 2015, the Fund had an outstanding average daily balance and a weighted average interest rate of $38,784 and 3.25%, respectively. The maximum amount outstanding for the Fund during the period was $1,501,000. At October 31, 2015, the Fund did not have any borrowings outstanding under the line of credit.
7). FEDERAL TAX INFORMATION
As of October 31, 2015, the components of accumulated earnings (losses) for income tax purposes were as follows:
| Cost of investments for tax purposes | | $ | 24,829,568 | |
| Gross tax unrealized appreciation | | $ | 2,290,616 | |
| Gross tax unrealized depreciation | | | (1,194,574 | ) |
| Net tax unrealized appreciation | | $ | 1,096,042 | |
| Undistributed ordinary income | | $ | — | |
| Undistributed long-term capital gains | | | 915,894 | |
| Total distributable earnings | | $ | 915,894 | |
| Other accumulated loss | | $ | (19,624 | ) |
| Total accumulated gain | | $ | 1,992,312 | |
The difference between book-basis and tax-basis unrealized appreciation is attributable primarily to wash sales and passive foreign investment companies.
At October 31, 2015, the Fund had no tax basis capital losses to offset future capital gains.
At October 31, 2015, the Fund deferred, on a tax basis, a post-December late year ordinary loss deferral of $18,482.
| HENNESSY FUNDS | 1-800-966-4354 | |
The tax character of distributions paid during fiscal year 2015 and fiscal year 2014 for the Fund were as follows:
| | | Year Ended | | | Year Ended | |
| | | October 31, 2015 | | | October 31, 2014 | |
| Ordinary income | | $ | 362,445 | | | $ | 2,248,987 | |
| Long-term capital gain | | | 1,174,668 | | | | 980,377 | |
| | | $ | 1,537,113 | | | $ | 3,229,364 | |
8). EVENTS SUBSEQUENT TO YEAR END
Management has evaluated the Fund’s related events and transactions that occurred subsequent to October 31, 2015, through the date of issuance of the Fund’s financial statements. Other than as disclosed below, management has determined that there were no subsequent events requiring recognition or disclosure in the financial statements.
On December 9, 2015, capital gains were declared and paid to shareholders of record as of December 8, 2015 as follows:
| | Long-term | |
| Investor Class | $0.34086 | |
| Institutional Class | $0.34170 | |
Report of Independent Registered Public Accounting Firm
To the Board of Trustees of Hennessy Funds Trust
and the Shareholders of the Hennessy Japan Small Cap Fund:
We have audited the accompanying statement of assets and liabilities of Hennessy Japan Small Cap Fund (the Fund), a series of Hennessy Funds Trust, including the schedule of investments, as of October 31, 2015, and the related statement of operations for the year then ended, the statements of changes in net assets for each of the years in the two-year period then ended, and the financial highlights for each of the years in the five-year period then ended. These financial statements and financial highlights are the responsibility of the Fund’s management. Our responsibility is to express an opinion on these financial statements and financial highlights based on our audits.
We conducted our audits in accordance with the standards of the Public Company Accounting Oversight Board (United States). Those standards require that we plan and perform the audit to obtain reasonable assurance about whether the financial statements and financial highlights are free of material misstatement. An audit includes examining, on a test basis, evidence supporting the amounts and disclosures in the financial statements. Our procedures included confirmation of investments owned as of October 31, 2015, by correspondence with the custodian and brokers or by other appropriate auditing procedures. An audit also includes assessing the accounting principles used and significant estimates made by management, as well as evaluating the overall financial statement presentation. We believe that our audits provide a reasonable basis for our opinion.
In our opinion, the financial statements and financial highlights referred to above present fairly, in all material respects, the financial position of the Fund as of October 31, 2015, and the results of its operations for the year then ended, the changes in its net assets for each of the years in the two-year period then ended, and the financial highlights for each of the years in the five-year period then ended, in conformity with U.S. generally accepted accounting principles.
Milwaukee, Wisconsin
December 23, 2015
| HENNESSY FUNDS | 1-800-966-4354 | |
Trustees and Officers of the Fund (Unaudited)
The business and affairs of the Fund are managed under the direction of the Board of Trustees of the Trust, and the Board of Trustees elects the Officers of the Trust. Information pertaining to the Trustees and the Officers of the Trust is set forth below. Such persons serve until their successors are duly elected and qualified or until their earlier death, resignation, or removal. Each of the Trustees oversees 16 Hennessy Funds. Unless otherwise indicated, the address of all persons listed below is 7250 Redwood Boulevard, Suite 200, Novato, CA 94945. The Fund’s Statement of Additional Information includes more information about the persons listed below and is available, without charge, upon request by calling 1-800-966-4354.
| | | | Other |
| | | | Directorships |
| Name, Year of Birth, | | | (During Past |
| and Position Held | Length of | Principal Occupation(s) | Five Years) |
with the Trust | Time Served | During Past Five Years | Held by Trustee(1) |
| | | | |
| Disinterested Trustees | | | |
| | | | |
| J. Dennis DeSousa (1936) | Since January | Mr. DeSousa is a real estate investor. | Hennessy SPARX |
| Trustee | 1996 for the | | Funds Trust; |
| | Hennessy Funds | | Hennessy Mutual |
| | | | Funds, Inc.; and |
| | | | The Hennessy |
| | | | Funds, Inc. |
| | | | |
| Robert T. Doyle (1947) | Since January | Mr. Doyle has been the Sheriff of | Hennessy SPARX |
| Trustee | 1996 for the | Marin County, California since 1996. | Funds Trust; |
| | Hennessy Funds | | Hennessy Mutual |
| | | | Funds, Inc.; and |
| | | | The Hennessy |
| | | | Funds, Inc. |
| | | | |
| Gerald P. Richardson (1945) | Since May | Mr. Richardson is an independent | Hennessy SPARX |
| Trustee | 2004 for the | consultant in the securities industry. | Funds Trust; |
| | Hennessy Funds | | Hennessy Mutual |
| | | | Funds, Inc.; and |
| | | | The Hennessy |
| | | | Funds, Inc. |
| | | | |
Interested Trustee(2) | | | |
| | | | |
| Neil J. Hennessy (1956) | Since January | Mr. Hennessy has been employed by | Hennessy Advisors, |
| Trustee, Chairman of | 1996 as a Trustee | Hennessy Advisors, Inc., the Funds’ | Inc.; Hennessy |
| the Board, Chief | for the Hennessy | investment advisor, since 1989. | SPARX Funds Trust; |
| Investment Officer, | Funds and since | He currently serves as President, | Hennessy Mutual |
| Portfolio Manager, | June 2008 as | Chairman and Chief Executive Officer | Funds, Inc.; and |
| and President | an Officer of the | of Hennessy Advisors, Inc. | The Hennessy |
| | Hennessy Funds | | Funds, Inc. |
| Name, Year of Birth, | | |
| and Position Held | Length of | Principal Occupation(s) |
with the Trust | Time Served | During Past Five Years |
| | | |
| Officers | | |
| | | |
| Teresa M. Nilsen (1966) | Since January | Ms. Nilsen has been employed by Hennessy Advisors, Inc., |
| Executive Vice President | 1996 for the | the Funds’ investment advisor, since 1989. She currently |
| and Treasurer | Hennessy Funds | serves as Executive Vice President, Chief Operations Officer, |
| | | Chief Financial Officer, and Secretary of Hennessy Advisors, Inc. |
| | | |
| Daniel B. Steadman (1956) | Since March | Mr. Steadman has been employed by Hennessy Advisors, Inc., |
| Executive Vice President | 2000 for the | the Funds’ investment advisor, since 2000. He currently serves |
| and Secretary | Hennessy Funds | as Executive Vice President and Chief Compliance Officer of |
| | | Hennessy Advisors, Inc. |
| | | |
| Jennifer Cheskiewicz (1977) | Since June | Ms. Cheskiewicz has been employed by Hennessy Advisors, |
| Senior Vice President and | 2013 for the | Inc., the Funds’ investment advisor, since June 2013. She |
| Chief Compliance Officer | Hennessy Funds | currently serves as General Counsel of Hennessy Advisors, Inc. |
| | | |
| | | She previously served as in-house counsel to Carlson Capital, |
| | | L.P., an SEC-registered investment advisor to several private |
| | | funds from February 2010 to May 2013. |
| | | |
| Brian Carlson (1972) | Since December | Mr. Carlson has been employed by Hennessy Advisors, Inc., the |
| Senior Vice President and | 2013 for the | Funds’ investment advisor, since December 2013. |
| Head of Distribution | Hennessy Funds | |
| | | Mr. Carlson was previously a co-founder and principal of |
| | | Trivium Consultants, LLC from February 2011 through |
| | | November 2013. |
| | | |
David Ellison (1958)(3) | Since October | Mr. Ellison has served as a Portfolio Manager of the Hennessy |
| Senior Vice President and | 2012 for the | Small Cap Financial Fund, the Hennessy Large Cap Financial |
| Portfolio Manager | Hennessy Funds | Fund, and the Hennessy Technology Fund since inception. |
| | | |
| | | Mr. Ellison previously served as Director, CIO and President of |
| | | FBR Fund Advisers, Inc. from December 1999 to October 2012. |
| | | |
| Brian Peery (1969) | Since March | Mr. Peery has served as a Portfolio Manager of the Hennessy |
| Senior Vice President and | 2003 as an | Cornerstone Growth Fund, the Hennessy Cornerstone Mid Cap |
| Portfolio Manager | Officer of the | 30 Fund, the Hennessy Cornerstone Large Growth Fund, the |
| | Hennessy Funds | Hennessy Cornerstone Value Fund, the Hennessy Total Return |
| | and since | Fund, and the Hennessy Balanced Fund since October 2014. |
| | February 2011 | From February 2011 through September 2014, he served as |
| | as a Co-Portfolio | Co-Portfolio Manager of the same funds. Mr. Peery has also |
| | Manager or | served as a Portfolio Manager of the Hennessy Gas Utility Fund |
| | Portfolio Manager | since February 2015. |
| | for the | |
| | Hennessy Funds | Mr. Peery has been employed by Hennessy Advisors, Inc., the |
| | | Funds’ investment advisor, since 2002. |
| | | |
| Winsor (Skip) Aylesworth | Since October | Mr. Aylesworth has served as a Portfolio Manager of the |
(1947)(3) | 2012 for the | Hennessy Gas Utility Fund since 1998 and as a Portfolio |
| Vice President and | Hennessy Funds | Manager of the Hennessy Technology Fund since inception. |
| Portfolio Manager | | |
| | | Mr. Aylesworth previously served as Executive Vice President |
| | | of The FBR Funds from 1999 to October 2012. |
| | | |
| HENNESSY FUNDS | 1-800-966-4354 | |
| Name, Year of Birth, | | |
| and Position Held | Length of | Principal Occupation(s) |
with the Trust | Time Served | During Past Five Years |
| | | |
Ryan Kelley (1972)(4) | Since March | Mr. Kelley has served as a Portfolio Manager of the Hennessy |
| Vice President and | 2013 for the | Gas Utility Fund, the Hennessy Small Cap Financial Fund, and |
| Portfolio Manager | Hennessy Funds | the Hennessy Large Cap Financial Fund since October 2014. |
| | | From March 2013 through September 2014, he served as a |
| | | Co-Portfolio Manager of the same funds. Prior to that, |
| | | he was a Portfolio Analyst of the Hennessy Funds. |
(1) | Pursuant to an internal reorganization, the series of Hennessy Mutual Funds, Inc. (“HMFI”), The Hennessy Funds, Inc. (“HFI”), and Hennessy SPARX Funds Trust (“HSFT”) were reorganized into series of Hennessy Funds Trust on February 28, 2014, which mirrored the corresponding series of HFMI, HFI, and HSFT. Subsequent to the reorganization, HFMI, HFI, and HSFT were dissolved. |
(2) | Mr. Hennessy is considered an “interested person,” as defined in the Investment Company Act of 1940, as amended, because he is an officer of the Hennessy Funds. |
(3) | The address of these officers is 101 Federal Street, Suite 1900, Boston, MA 02110. |
(4) | The address of this officer is 1340 Environ Way, Chapel Hill, NC 27517. |
(This Page Intentionally Left Blank.)
| HENNESSY FUNDS | 1-800-966-4354 | |
Expense Example (Unaudited)
October 31, 2015
As a shareholder of the Fund, you incur two types of costs: (1) transaction costs, including sales charges (loads) on purchase payments, reinvested dividends, or other distributions; redemption fees; and exchange fees; and (2) ongoing costs, including management fees; service fees; and other Fund expenses. This Example is intended to help you understand your ongoing costs (in dollars) of investing in the Fund and to compare these costs with the ongoing costs of investing in other mutual funds. The Example is based on an investment of $1,000 invested at the beginning of the period and held for the entire period from May 1, 2015 through October 31, 2015.
Actual Expenses
The first line of the table below under the “Investor Class” and “Institutional Class” headings provides information about actual account values and actual expenses. Although the Fund charges no sales loads or transaction fees, you will be assessed fees for outgoing wire transfers, returned checks and stop payment orders at prevailing rates charged by U.S. Bancorp Fund Services, LLC, the Fund’s transfer agent. If you request that a redemption be made by wire transfer, currently a $15.00 fee is charged by the Fund’s transfer agent. IRA accounts will be charged a $15.00 annual maintenance fee. The example below includes, but is not limited to, management fees, shareholder servicing fees, fund accounting, custody, and transfer agent fees. However, the example below does not include portfolio trading commissions and related expenses, and other extraordinary expenses as determined under generally accepted accounting principles. You may use the information in this line, together with the amount you invested, to estimate the expenses that you paid over the period. Simply divide your account value by $1,000 (for example, an $8,600 account value divided by $1,000 = 8.6), then multiply the result by the number in the first line of the table under the “Investor Class” and “Institutional Class” headings in the column entitled “Expenses Paid During Period” to estimate the expenses you paid on your account during this period.
Hypothetical Example for Comparison Purposes
The second line of the table below under the “Investor Class” and “Institutional Class” headings provides information about hypothetical account values and hypothetical expenses based on the Fund’s actual expense ratios and an assumed rate of return of 5% per year before expenses, which is not the Fund’s actual return. The hypothetical account values and expenses may not be used to estimate the actual ending account balance or expenses you paid for the period. You may use this information to compare the ongoing costs of investing in the Fund and other funds. To do so, compare this 5% hypothetical example with the 5% hypothetical examples that appear in the shareholder reports of the other funds. Please note that the expenses shown in the table are meant to highlight your ongoing costs only and do not reflect any transactional costs, such as sales charges (loads), or exchange fees. Therefore, the second line of the table under the “Investor Class” and “Institutional Class” headings is useful in comparing ongoing costs only, and will not help you determine the relative total costs of owning different funds. In addition, if these transactional costs were included, your costs would have been higher.
| | | | Expenses Paid |
| | Beginning | Ending | During Period(1) |
| | Account Value | Account Value | May 1, 2015 – |
| | May 1, 2015 | October 31, 2015 | October 31, 2015 |
| Investor Class | | | |
| Actual | $1,000.00 | $1,006.80 | $10.37 |
| Hypothetical (5% return before expenses) | $1,000.00 | $1,014.87 | $10.41 |
| | | | |
| Institutional Class | | | |
| Actual | $1,000.00 | $ 945.80 | $9.12 |
| Hypothetical (5% return before expenses) | $1,000.00 | $1,015.83 | $9.45 |
(1) | Expenses are equal to the Fund’s annualized expense ratio of 2.05% for Investor Class shares or 1.86% for Institutional Class shares, as applicable, multiplied by the average account value over the period, multiplied by 184/365 days (to reflect one-half year period). |
| HENNESSY FUNDS | 1-800-966-4354 | |
How to Obtain a Copy of the Fund’s
Proxy Voting Policy and Proxy Voting Records
A description of the policies and procedures the Fund uses to determine how to vote proxies relating to portfolio securities is available without charge: (1) by calling 1-800-966-4354; (2) on the Hennessy Funds’ website at hennessyfunds.com/proxy-voting/policy.fs; or (3) on the U.S. Securities and Exchange Commission’s website at www.sec.gov. The Fund’s proxy voting record is available without charge on both the Hennessy Funds’ website at hennessyfunds.com/proxy-voting/policy.fs and the SEC’s website at www.sec.gov no later than August 31 for the prior 12 months ending June 30.
Quarterly Filings on Form N-Q
The Fund files its complete schedule of portfolio holdings with the SEC for the first and third quarters of each fiscal year on Form N-Q. The Fund’s Form N-Q will be available on the SEC’s website at www.sec.gov. The Fund’s Form N-Q may be reviewed and copied at the SEC’s Public Reference Room in Washington, DC and information on the operation of the Public Reference Room may be obtained by calling 1-800-SEC-0330. Information included in the Fund’s N-Q will also be available upon request by calling 1-800-966-4354.
Federal Tax Distribution Information
(Unaudited)
For the fiscal year ended October 31, 2015, certain dividends paid by the Fund may be subject to a maximum tax rate of 23.8%, as provided for by the Jobs and Growth Tax Relief Reconciliation Act of 2003. The percentage of dividends declared from ordinary income designated as qualified dividend income was 91.81%.
For corporate shareholders, the percent of ordinary income distributions that qualified for the corporate dividends received deduction for the fiscal year ended October 31, 2015 was 0.00%.
The percentage of taxable ordinary income distributions that are designated as short-term capital gain distributions under Section 871(k)(2)(C) of the Internal Revenue Code of 1986, as amended, for the Fund was 100.00%.
Householding
To help keep the Fund’s costs as low as possible, we generally deliver a single copy of most financial reports and prospectuses to shareholders who share an address, even if the accounts are registered under different names. This process, known as “householding,” does not apply to account statements. You may, of course, request an individual copy of a prospectus or financial report at any time. If you would like to receive separate mailings, please call the Administrator at 1-800-261-6950 or 1-414-765-4124 and we will begin individual delivery within 30 days of your request. If your account is held through a financial institution or other intermediary, please contact them directly to request individual delivery.
Matters Submitted to a Shareholder Vote
A special meeting of shareholders of the Investor Class shares of the Fund, originally convened on September 15, 2015, and subsequently adjourned to November 30, 2015, has been further adjourned to reconvene on Thursday, January 14, 2016, at which time the shareholders will vote on whether to approve a distribution (Rule 12b-1) plan for the Investor Class shares of the Fund.
Privacy Policy
We collect the following non-public personal information about you:
| | • | information we receive from you on or in applications or other forms, correspondence, or conversations, including, but not limited to, your name, address, phone number, social security number, assets, income, and date of birth; and |
| | | |
| | • | information about your transactions with us, our affiliates, or others, including, but not limited to, your account number and balance, payment history, parties to transactions, cost basis information, and other financial information. |
We do not disclose any non-public personal information about our current or former shareholders to nonaffiliated third parties, except as permitted by law. For example, we are permitted by law to disclose all of the information we collect, as described above, to our Transfer Agent to process your transactions. Furthermore, we restrict access to your non-public personal information to those persons who require such information to provide products or services to you. We maintain physical, electronic, and procedural safeguards that comply with federal standards to guard your non-public personal information.
In the event that you hold shares of the Fund through a financial intermediary, including, but not limited to, a broker-dealer, bank or trust company, the privacy policy of your financial intermediary would govern how your non-public personal information would be shared with nonaffiliated third parties.
| HENNESSY FUNDS | 1-800-966-4354 | |
(This Page Intentionally Left Blank.)
(This Page Intentionally Left Blank.)
For information, questions or assistance, please call
The Hennessy Funds
1-800-966-4354 or 1-415-899-1555
INVESTMENT ADVISOR
Hennessy Advisors, Inc.
7250 Redwood Blvd., Suite 200
Novato, California 94945
ADMINISTRATOR,
TRANSFER AGENT,
DIVIDEND PAYING AGENT &
SHAREHOLDER SERVICING AGENT
U.S. Bancorp Fund Services, LLC
P.O. Box 701
Milwaukee, Wisconsin 53201-0701
CUSTODIAN
U.S. Bank N.A.
Custody Operations
1555 North River Center Dr., Suite 302
Milwaukee, Wisconsin 53212
TRUSTEES
Neil J. Hennessy
Robert T. Doyle
J. Dennis DeSousa
Gerald P. Richardson
COUNSEL
Foley & Lardner LLP
777 East Wisconsin Avenue
Milwaukee, Wisconsin 53202-5306
INDEPENDENT REGISTERED
PUBLIC ACCOUNTING FIRM
KPMG LLP
777 East Wisconsin Avenue
Milwaukee, Wisconsin 53202-5306
DISTRIBUTOR
Quasar Distributors, LLC
615 East Michigan Street
Milwaukee, Wisconsin 53202
hennessyfunds.com | 1-800-966-4354
This report has been prepared for shareholders and may be distributed to
others only if preceded or accompanied by a current prospectus.
The registrant has adopted a code of ethics that applies to the registrant’s principal executive officer and principal financial officer. The registrant amended its code of ethics in December 2014 as previously reported on the Form N-CSR filed by the registrant on January 10, 2015. The registrant has not granted any waivers from any provisions of the code of ethics during the period covered by this report.
A copy of the registrant’s Code of Ethics is filed herewith.
The registrant’s board of directors has determined that it does not have an audit committee financial expert serving on its audit committee. At this time, the registrant believes that the financial and business experience provided by each member of the audit committee together offers the registrant adequate oversight for the registrant’s level of financial complexity.
The audit committee has adopted pre-approval procedures for audit and non-audit services provided to the registrant. Under the procedures, at any regularly scheduled audit committee meeting, the audit committee may pre-approve any audit, audit-related, tax and other non-audit services to be rendered or that may be rendered by a principal accountant to the registrant and certain non-audit services to be rendered by a principal accountant to the investment advisor to the registrant’s series or such advisor’s affiliates that provide ongoing services to the registrant. The audit committee either specifically pre-approves the services or pre-approves a type of a service. No pre-approval is required for non-audit services that meet the following criteria: (1) the aggregate amount of fees to be paid for all such non-audit services is not more than 5% of the total revenues paid by the registrant to the principal accountant in the fiscal year in which the non-audit services are provided; (2) such services were not recognized by the registrant at the time of the engagement to be non-audit services; and (3) such services are promptly brought to the attention of the audit committee and approved prior to the completion of the audit.
The audit committee must pre-approve a principal accountant’s engagements for non-audit services with the investment advisor to the registrant’s series and such advisor’s affiliates that provide ongoing services to the registrant, if the engagement relates directly to the operations and financial reporting of the registrant, unless the aggregate amount of fees to be paid for all such services provided constitutes no more than 5% of the aggregate revenues paid to the principal accountant by the registrant, the investment advisor and such advisor’s affiliates that provide ongoing services to the registrant, during the fiscal year in which the services are to be provided.
If a service has not been pre-approved at a regularly scheduled audit committee meeting, and if, in the opinion of the Chief Compliance Officer of the registrant, a proposed engagement must commence before the next regularly scheduled audit committee meeting, any member of the audit committee is authorized under the procedures to pre-approve the engagement. The Chief Compliance Officer of the registrant will arrange for this interim review, coordinate with the designated member of the audit committee and provide, with the assistance of the principal accountant, information about the service to be pre-approved for the interim period. Any interim pre-approval decisions are reported (for informational purposes) to the audit committee at its next regularly scheduled meeting.
All of the tax services referenced above were pre-approved in accordance with the pre-approval procedures for audit and non-audit services.
The percentage of fees billed by KPMG LLP applicable to non-audit services pursuant to waiver of pre-approval requirement were as follows:
The percentage of fees billed by Tait, Weller & Baker, LLP applicable to non-audit services pursuant to waiver of pre-approval requirement were as follows:
All of the principal accountants’ hours spent on auditing the registrant’s financial statements were attributed to work performed by full‑time permanent employees of the principal accountants.
In assessing the independence of the registrant’s principal accountants, the registrant’s board of trustees noted that the principal accountants have not provided any audit or non-audit services to the investment advisor to the registrant’s series, Hennessy Advisors, Inc., or any entity controlling, controlled by, or under common control with Hennessy Advisors.
Not applicable to registrants who are not listed issuers (as defined in Rule 10A-3 under the Securities Exchange Act of 1934).
Schedule of Investments is included as part of the report to shareholders filed under Item 1 of this Form.
Not applicable to open-end investment companies.
Not applicable to open-end investment companies.
Not applicable to open-end investment companies.
Not Applicable.
Pursuant to the requirements of the Securities Exchange Act of 1934 and the Investment Company Act of 1940, the registrant has duly caused this report to be signed on its behalf by the undersigned, thereunto duly authorized.
Neil J. Hennessy, President
Pursuant to the requirements of the Securities Exchange Act of 1934 and the Investment Company Act of 1940, this report has been signed below by the following persons on behalf of the registrant and in the capacities and on the dates indicated.
Teresa M. Nilsen, Treasurer