UNITED STATES
SECURITIES AND EXCHANGE COMMISSION
Washington, D.C. 20549
FORM N-CSR
CERTIFIED SHAREHOLDER REPORT OF REGISTERED
MANAGEMENT INVESTMENT COMPANIES
Investment Company Act file number (811-07168)
Hennessy Funds Trust
(Exact name of registrant as specified in charter)
7250 Redwood Blvd., Suite 200
Novato, CA 94945
(Address of principal executive offices) (Zip code)
Neil J. Hennessy
7250 Redwood Blvd., Suite 200
Novato, CA 94945
(Name and address of agent for service)
800-966-4354
Registrant's telephone number, including area code
Date of fiscal year end: October 31, 2013
Date of reporting period: October 31, 2013
Item 1. Reports to Stockholders.
ANNUAL REPORT
OCTOBER 31, 2013
| | DOMESTIC EQUITY | Investor | | Institutional | |
| | Hennessy Cornerstone Growth Fund | HFCGX | | | HICGX | |
| | Hennessy Focus Fund | HFCSX | | | HFCIX | |
| | Hennessy Cornerstone Mid Cap 30 Fund | HFMDX | | | HIMDX | |
| | Hennessy Cornerstone Large Growth Fund | HFLGX | | | HILGX | |
| | Hennessy Cornerstone Value Fund | HFCVX | | | HICVX | |
| | Hennessy Large Value Fund | HLVFX | | | HLVIX | |
| | Hennessy Total Return Fund | HDOGX | | | | |
| | | | | | | |
| | BALANCED & FIXED INCOME | | | | | |
| | Hennessy Equity and Income Fund | HEIFX | | | HEIIX | |
| | Hennessy Balanced Fund | HBFBX | | | | |
| | Hennessy Core Bond Fund | HCBFX | | | HCBIX | |
| | | | | | | |
| | SECTOR & SPECIALTY | | | | | |
| | Hennessy Gas Utility Index Fund | GASFX | | | | |
| | Hennessy Small Cap Financial Fund | HSFNX | | | HISFX | |
| | Hennessy Large Cap Financial Fund | HLFNX | | | | |
| | Hennessy Technology Fund | HTECX | | | HTCIX | |
| | Hennessy Japan Fund | HJPNX | | | HJPIX | |
| | Hennessy Japan Small Cap Fund | HJPSX | | | | |
hennessyfunds.com | 1-800-966-4354
(This Page Intentionally Left Blank.)
Contents
| Letter to shareholders | 2 |
| Performance overview | 4-31 |
| Financial statements | |
| Schedules of investments | |
| Domestic Equity | |
| Hennessy Cornerstone Growth Fund | 32 |
| Hennessy Focus Fund | 36 |
| Hennessy Cornerstone Mid Cap 30 Fund | 39 |
| Hennessy Cornerstone Large Growth Fund | 42 |
| Hennessy Cornerstone Value Fund | 45 |
| Hennessy Large Value Fund | 48 |
| Hennessy Total Return Fund | 51 |
| Balanced & Fixed Income | |
| Hennessy Equity and Income Fund | 55 |
| Hennessy Balanced Fund | 61 |
| Hennessy Core Bond Fund | 64 |
| Sector & Specialty | |
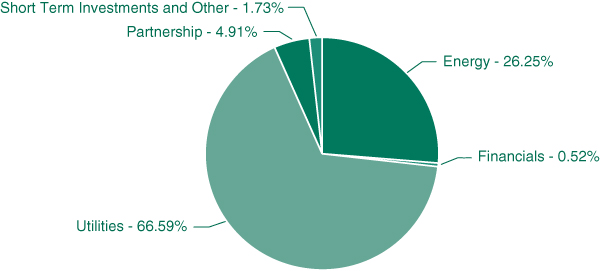
| Hennessy Gas Utility Index Fund | 68 |
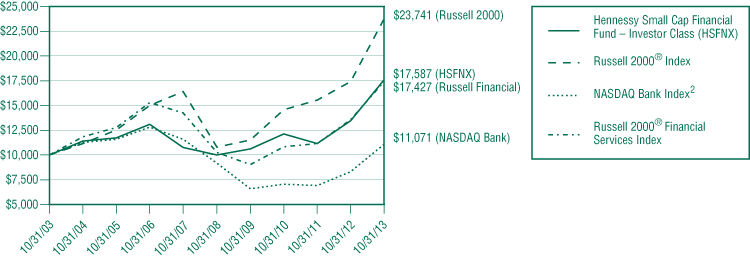
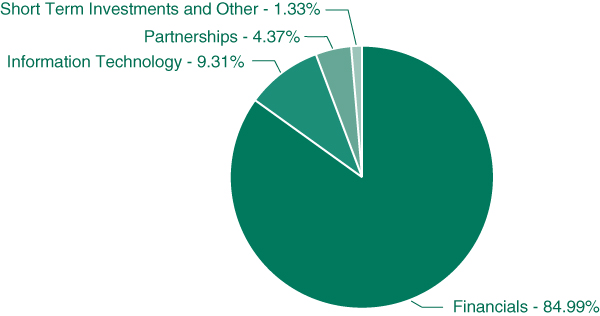
| Hennessy Small Cap Financial Fund | 71 |
| Hennessy Large Cap Financial Fund | 74 |
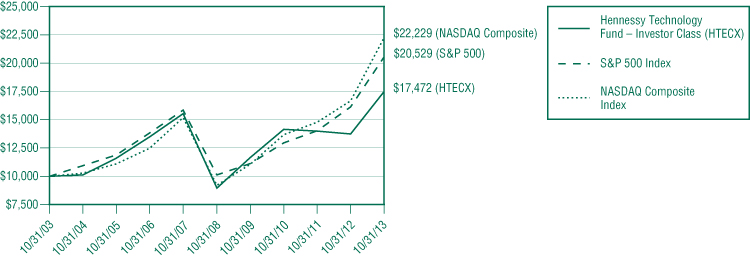
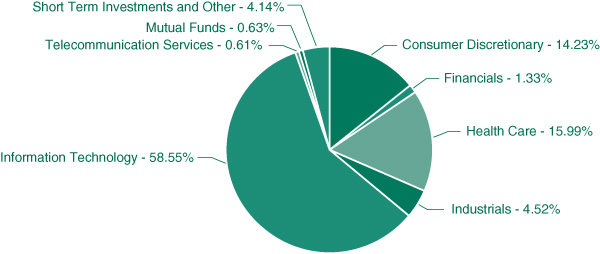
| Hennessy Technology Fund | 77 |
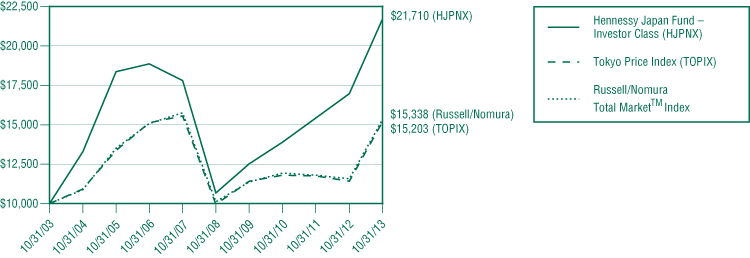
| Hennessy Japan Fund | 80 |
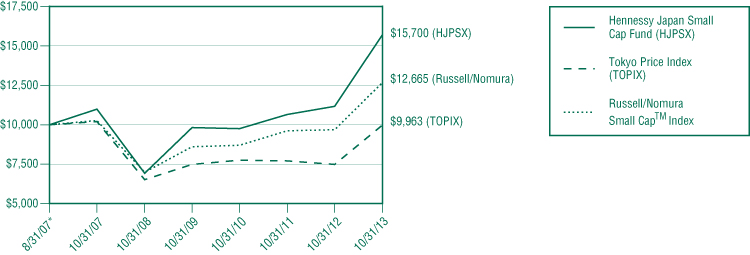
| Hennessy Japan Small Cap Fund | 83 |
| Statements of assets and liabilities | 86 |
| Statements of operations | 90 |
| Statements of changes in net assets | 94 |
| Statements of cash flows – Hennessy Total Return Fund | 102 |
| Financial highlights | 104-134 |
| Notes to the financial statements | 135 |
| Reports of Independent Registered Public Accounting Firms | 146-147 |
| Directors/Trustees and Officers of the Funds | 148 |
| Expense example | 151 |
| Proxy voting policy | 154 |
| Quarterly Filings on Form N-Q | 154 |
| Federal Tax Distribution Information | 154 |
| Householding | 155 |
| Privacy Policy | 156 |
| Board Approval of Continuation of Investment Sub-Advisory Agreements | 157 |
HENNESSY FUNDS 1-800-966-4354
December 2013
Dear Hennessy Funds Shareholder:
Looking back at 2013, it was a year of many highs and lows economically, politically, and socially here in the U.S. and around the globe. The year was marked with some fond memories: we survived two fiscal cliffs, anointed a new Pope, watched the Red Sox don facial hair and keep their town “Boston Strong,” and home prices began to rebound around the country. But the year was also scarred by worsening political partisanship, civil unrest in many countries, flooding in Colorado, wildfires in the West, and the tragedy of the Boston Marathon.
We understand that the economic landscape is still rife with problems. Economic progress and growth are uneven, at best, and unemployment remains high. The hurdles that, in my opinion, are stalling a more robust recovery here in the U.S. are the same ones we’ve faced for several years: we are no closer to receiving the clarity we need from our leaders in Washington on taxes, regulation, and healthcare. Companies are still sitting on record amounts of cash, but they appear reluctant to hire in earnest until they feel they have clear guidelines on these major issues. Instead, these cash-rich companies continue to increase and initiate dividends, buy back stock and participate in accretive mergers and acquisitions. We are seeing these activities spread beyond just large, value-oriented companies to more small and mid-cap and growth-oriented firms. While these activities should benefit the shareholders of these companies, these initiatives are not creating jobs, which I believe is the critical missing piece to a thriving and growing economy.
Even through this slow-growth economy, the U.S. stock market has found ways to carve out healthy returns. For the twelve months ended October 31, 2013, the Dow Jones Industrial Average (DJIA) returned 21.82%, while the S&P 500 Index returned 27.18%. Companies comprising the DJIA and the S&P 500 continue to have strong balance sheets and are generating respectable profits. There are many attractive stocks with strong and improving fundamentals that I believe present compelling investment opportunities. In fact, through the mutual fund portfolios that we manage, we are seeing improvement across asset classes and in many sectors, including financials, natural gas, housing, and consumer discretionary. I believe that innovative business leaders in this country will continue to find ways to make money for their shareholders.
Japan Market
We have witnessed a strong resurgence in the Japanese market over the past year. While some may have been surprised by strength of this recovery, we believe that we are finally seeing the result of the structural and political reforms that have been taking place in Japan for a number of years. The Japan market was among the top performing markets worldwide over the past year, with the Tokyo Price Index (TOPIX) returning over 33% (in USD terms) for the twelve month period ended October 31, 2013, and Japan was by far the highest performing Asian market.
Japan’s prime minister, Shinzo Abe, and his bold monetary, stimulus and growth policies, termed the “Three Arrows” of “Abenomics,” appear to be reversing almost two decades of slow growth and deflation and moving the country into a new cycle of recovery that we believe will be sustainable. The Bank of Japan has undertaken an aggressive Quantitative Easing program, similar to what the Federal Reserve did here in the U.S., causing the Yen to weaken, which in turn has increased the demand for high quality Japanese products throughout the world. However, while the weakening of the Yen may be a catalyst to attract investors to Japan, we have never believed that the Japanese equity market is simply a Yen play.
With anticipated political stability for the next few years and with a strengthening relationship between government and Japanese businesses, we believe that many of the economic growth strategies proposed by Prime Minister Abe will have the support needed to succeed. Despite strong returns over the past year, we do not believe that the Japanese market is currently overvalued, but rather we continue to believe that there remain strong values in high-quality, Japanese companies today and for the long-term.
I am very confident that we are in a long-term, secular bull market fueled by solid economic fundamentals. I am encouraged by the strong returns for the major U.S. and global financial market indices and also by the positive performance of each of the 16 Hennessy Funds over the past twelve months. However, while we have seen consumer and investor confidence on the rise, we still don’t believe that investors have fully returned to investing in equities, and particularly in U.S. equities. When investors do return to equities in earnest, it should bode well for the economy.
At Hennessy we remain focused on investing with fundamentals and committed to our proven investment strategies. Treating clients honestly and ethically, building strong partnerships and managing money for the sole benefit of shareholders are the principles that our business was founded on, and those same principles guide us today, nearly 25 years later. If you have any questions or want to speak with us directly, please don’t hesitate to call us at (800) 966-4354.
Best regards,
Neil J. Hennessy
President and Chief Investment Officer
Past performance does not guarantee future results.
Mutual fund investing involves risk. Principal loss is possible.
Opinions expressed are those of Neil Hennessy and are subject to change, are not guaranteed and should not be considered investment advice.
The Dow Jones Industrial Average and S&P 500 are unmanaged indices commonly used to measure the performance of U.S. stocks. The Tokyo Price Index (TOPIX) is a market capitalization-weighted index of all companies listed on the First Section of the Tokyo Stock Exchange. One cannot invest directly in an index.
HENNESSY FUNDS 1-800-966-4354
Performance Overview (Unaudited)
The opinions expressed in the following commentaries reflect those of the Portfolio Managers as of the date written. Any such opinions are subject to change based on market or other conditions and are not guaranteed. These opinions may not be relied upon as investment advice. Investment decisions for the Hennessy Funds are based on several factors, and may not be relied upon as an indication of trading intent on behalf of any Hennessy Fund. Security positions can and do change.
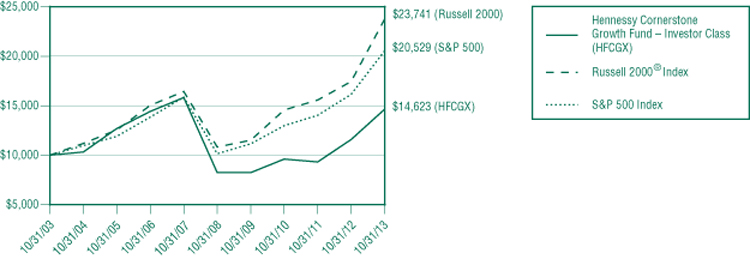
Hennessy Cornerstone Growth Fund (HFCGX/HICGX)
CHANGE IN VALUE OF $10,000 INVESTMENT – INVESTOR CLASS (HFCGX)
This chart assumes an initial gross investment of $10,000 made on October 31, 2003. Returns shown include the reinvestment of all dividends. The table and the graph do not reflect the deduction of taxes that a shareholder would pay on Fund distributions or the redemption of Fund shares.
AVERAGE ANNUAL TOTAL RETURN PERIODS ENDED OCTOBER 31, 2013
| | One Year | Five Years | Ten Years |
| Hennessy Cornerstone Growth Fund – Investor Class (HFCGX) | 26.41% | 12.20% | 3.87% |
Hennessy Cornerstone Growth Fund – Institutional Class (HICGX)1 | 26.81% | 12.57% | 4.06% |
Russell 2000® Index | 36.28% | 17.04% | 9.03% |
| S&P 500 Index | 27.18% | 15.17% | 7.46% |
| Expense ratio: 1.35% (Investor Class) | | | Expense ratio: Gross 1.12%, Net 0.99%2 (Institutional Class) |
Performance data quoted represents past performance; past performance does not guarantee future results. The investment return and principal value of an investment will fluctuate so that an investor’s shares, when redeemed, may be worth more or less than their original cost. Current performance of the Fund may be lower or higher than the performance quoted. Performance data current to the most recent month end may be obtained by visiting hennessyfunds.com.
The expense ratios presented are from the most recent prospectus.
| 1 | Represents the performance of the Institutional Class shares after March 3, 2008 (inception of the share class) and Investor Class for periods prior to that date. |
| 2 | With regard to Institutional Class shares, the investment advisor has contractually agreed to waive a portion of its expenses indefinitely. |
PERFORMANCE NARRATIVE
Portfolio Manager, Neil Hennessy, and Co-Portfolio Manager, Brian Peery
Over the previous twelve months, how did the Fund perform and what factors contributed to this performance?
For the twelve-month period ended October 31, 2013, the Investor Class of the Hennessy Cornerstone Growth Fund returned 26.41%, underperforming the Russell 2000® Index, the S&P 500 Index, and the Morningstar Small Blend Category Average, which returned 36.28%, 27.18%, and 35.17% for the same period, respectively.
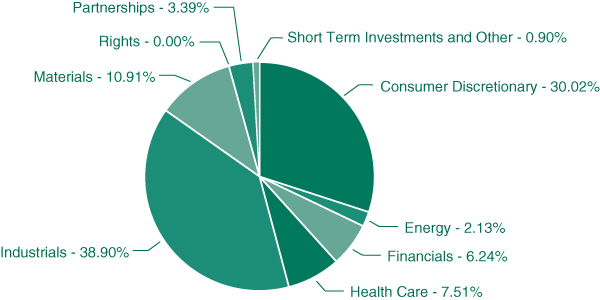
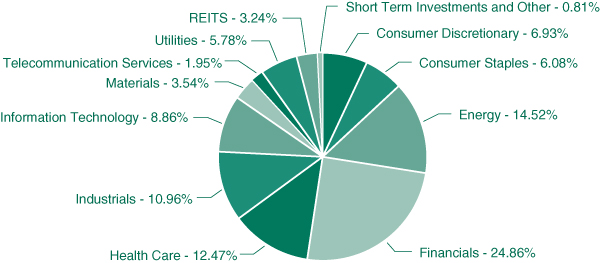
While the Fund had strong absolute performance for the twelve-month period, its performance versus its benchmark was hampered by both asset allocation and stock selection. The Fund’s overweighting in the Consumer Discretionary sector versus the benchmark was the primary driver of the Fund’s relative underperformance for the twelve-month period, due in large part to disappointing levels of consumer spending. This impact was, however, offset in part by favorable stock selection within the Consumer Discretionary sector. The biggest positive contribution to overall Fund performance came from both asset allocation and stock selection in the Financials sector. The largest negative contribution to overall Fund performance came from the Industrials sector, and predominantly from stock selection within the sector.
Delta Air Lines Inc., which was up 175% for the twelve-month period due to stronger than expected revenues and earnings growth, was the single largest contributor to Fund performance during the twelve-month period. The Fund’s single largest performance detractor was InnerWorkings Inc. The managed print services vendor’s stock was down 34% during the twelve-month period as a result of having lowered revenue and profit projections twice. The Fund continues to hold both positions.
Additional Portfolio Manager commentary and related investment outlook:
During the last twelve months, we saw a continued trend of companies beating earnings expectations, but not quite meeting revenue targets. We believe this trend is beginning to abate and that we should see better earnings and revenue numbers in the coming twelve-month period. While top line revenue growth is muted due to a slow growth environment, companies are still doing well. Corporate profits continue to reach new highs due to deferred capital expenditure plans, combined with tempered cost cutting, and we are seeing a broad trend materializing with respect to what companies are doing with their profits to reward shareholders.
Over the last twelve-month period, we have seen a much broader mix of companies choosing to initiate or increase dividends or make accretive acquisitions. While acquisitions may begin to slow due to an increase in asset prices, making it more expensive to grow other than through organic means, we believe that companies will continue to use dividends as a means of rewarding shareholders. As the Federal Reserve continues tapering and we remain in a low interest rate environment, we believe stocks with good growth prospects and earnings will likely lead the way in the coming twelve-month period, as investors seek to capture income while also generating capital gains through stock price appreciation.
We are confident that there are opportunities in the Small-Cap and Mid-Cap space, especially in some of the more cyclical sectors. We believe the cyclical companies, which are those companies most sensitive to economic growth, should do well as the economy continues to improve. The Fund is currently overweight cyclical stocks versus the benchmarks and will remain so until its portfolio is rebalanced later this winter.
The Russell 2000® Index is an unmanaged index commonly used to measure the performance of U.S. small-capitalization stocks. The S&P 500 Index is an unmanaged index commonly used to measure the performance of U.S. stocks. You cannot invest directly in an index. Performance data for an index does not reflect any deductions for fees, expenses or taxes. The Fund invests in small- and medium-capitalization companies, which may have limited liquidity and greater price volatility than large-capitalization companies. Investments in foreign securities involve greater volatility and political, economic and currency risk and differences in accounting methods. References to specific securities should not be considered a recommendation to buy or sell any security. Fund holdings and sector allocations are subject to change. Please refer to the Schedule of Investments included in this report for additional portfolio information.
Each Morningstar category average represents a universe of funds with similar investment objectives. ©Morningstar, Inc. All Rights Reserved. The information contained herein: 1) is proprietary to Morningstar; 2) may not be copied or distributed and 3) is not warranted to be accurate, complete or timely. Neither Morningstar nor its content providers are responsible for any damages or losses arising from any use of this information. Past performance does not guarantee future results.
Hennessy Focus Fund (HFCSX/HFCIX)
CHANGE IN VALUE OF $10,000 INVESTMENT – INVESTOR CLASS (HFCSX)
This chart assumes an initial gross investment of $10,000 made on October 31, 2003. Returns shown include the reinvestment of all dividends. The table and the graph do not reflect the deduction of taxes that a shareholder would pay on Fund distributions or the redemption of Fund shares.
HENNESSY FUNDS 1-800-966-4354
AVERAGE ANNUAL TOTAL RETURN PERIODS ENDED OCTOBER 31, 2013
| | One Year | Five Years | Ten Years |
| Hennessy Focus Fund – Investor Class (HFCSX) | 33.54% | 20.18% | 12.02% |
Hennessy Focus Fund – Institutional Class (HFCIX)1 | 33.94% | 20.57% | 12.22% |
Russell 3000® Index2 | 28.99% | 15.94% | 7.92% |
Russell Midcap® Growth Index | 33.93% | 20.32% | 9.60% |
| Expense ratio: 1.43% (Investor Class) | | | Expense ratio: 1.14% (Institutional Class) |
Performance data quoted represents past performance; past performance does not guarantee future results. The investment return and principal value of an investment will fluctuate so that an investor’s shares, when redeemed, may be worth more or less than their original cost. Current performance of the Fund may be lower or higher than the performance quoted. Performance data current to the most recent month end may be obtained by visiting hennessyfunds.com. Performance for periods prior to October 26, 2012 is that of the FBR Focus Fund.
The expense ratios presented are from the most recent prospectus.
| 1 | Represents the performance of the Institutional Class shares after May 30, 2008 (inception of the share class) and Investor Class for periods prior to that date. |
| 2 | The Fund’s primary index has changed. Previously, the Fund used the Russell 2000® Index, which is a small-capitalization index, as its primary index. The Fund is now compared to the Russell 3000® Index, which is a broader market index than the Russell 2000® Index, because it better reflects both the underlying holdings of the Fund and the investible stock universe for the Fund. The Russell 3000® Index is a combination of the Russell 2000® Index and the Russell 1000® Index, which is a small-capitalization index and a large-capitalization index, respectively. The average annual total returns of the Russell 2000® Index for the one-year, five-year and ten-year periods ended October 31, 2013 were 36.28%, 17.04%, and 9.03%, respectively. |
PERFORMANCE NARRATIVE
BROAD RUN INVESTMENT MANAGEMENT, LLC, SUB-ADVISOR
Portfolio Managers Brian Macauley, CFA, David Rainey, CFA, and Ira Rothberg, CFA, Broad Run Investment Management, LLC (sub-advisor).
Over the previous twelve months, how did the Fund perform and what factors contributed to this performance?
For the twelve-month period ended October 31, 2013, the Investor Class of the Hennessy Focus Fund returned 33.54%, outperforming both the Russell 3000® Index and the Morningstar Mid-Cap Growth Category Average, which returned 28.99% and 32.45% for the same period, respectively, and slightly underperforming the Russell Midcap® Growth Index, which returned 33.93% for the same period.
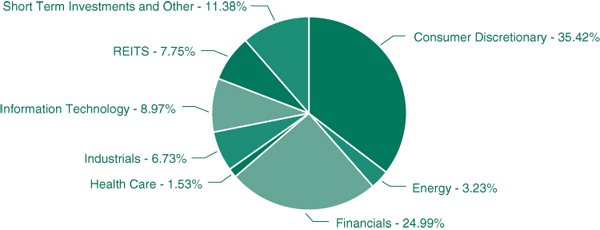
The Fund’s performance during the twelve-month period was the result of improved business prospects for its key holdings, owing to a better overall economic outlook and company-specific developments. Leading contributors to the Fund’s performance were O’Reilly Automotive Inc., Bally Technologies, Inc., and Penn National Gaming Inc. The Fund continues to hold all of these positions. There were no negative contributors to performance this twelve-month period; each of the Fund’s 24 portfolio companies contributed positively to performance.
We invest with a long-term time horizon and encourage shareholders to do the same. Despite the discussion of twelve-month results referenced above, we encourage fellow shareholders to evaluate the Fund’s performance over three-, five-, and ten-year periods since shorter time periods can be influenced by many transitory issues unrelated to the growth in intrinsic value of the Fund’s holdings.
Additional Portfolio Manager commentary and related investment outlook:
We continue to have a positive long-term outlook for the Fund. The Fund’s holdings are predominately a collection of what we believe to be secular growth businesses trading at reasonable valuations. Our expectation is that the Fund will own these businesses for five or even ten-year periods. Over this long-term time horizon, we expect that the Fund’s returns will be determined primarily by the growth in earnings power of these businesses.
We believe that many of the Fund’s largest holdings are well positioned to potentially grow cash earnings per share over the next several years, even if we remain stuck in a low-growth environment. These companies have their own profit drivers that are largely independent of the overall economy. For example, American Tower’s growth is driven by the adoption of data intensive smartphones in the U.S. and a rapidly growing subscriber base across its international markets. Markel’s underwriting discipline, investment acumen, and unique culture have allowed the company to create value in both hard and soft insurance markets. O’Reilly Automotive’s growth is driven by its continued consolidation of the aftermarket auto parts distribution industry.
With the broader market now trading at close to the long-run average price to earnings multiple, we believe that multiple expansion is unlikely to provide the same tailwind that it has over the last few years. Recent market appreciation makes it more difficult to identify compelling investment ideas now as compared to twelve month ago, but as a “focus fund,” we only need to find two dozen good ideas from among the thousands of available opportunities. We continue to like the outlook for the companies in the Fund, and we are finding select opportunities that we believe should enhance the portfolio.
The Russell 3000® Index is an unmanaged index commonly used to measure the performance of U.S. stocks. The Russell Midcap® Growth Index is an unmanaged index commonly used to measure the performance of U.S. medium-capitalization growth stocks. The Russell 2000® Index is an unmanaged index commonly used to measure the performance of U.S. small-capitalization stocks. You cannot invest directly in an index. Performance data for an index does not reflect any deductions for fees, expenses or taxes. The Fund is non-diversified, meaning it concentrates its assets in fewer holdings than a diversified fund and is therefore more exposed to individual stock volatility than a diversified fund. The Fund may invest in small- and medium-capitalization companies, which
may have limited liquidity and greater price volatility than large-capitalization companies. References to specific securities should not be considered a recommendation to buy or sell any security. Fund holdings and sector allocations are subject to change. Please refer to the Schedule of Investments included in this report for additional portfolio information.
Each Morningstar category average represents a universe of funds with similar investment objectives. ©Morningstar, Inc. All Rights Reserved. The information contained herein: 1) is proprietary to Morningstar; 2) may not be copied or distributed and 3) is not warranted to be accurate, complete or timely. Neither Morningstar nor its content providers are responsible for any damages or losses arising from any use of this information. Past performance does not guarantee future results.
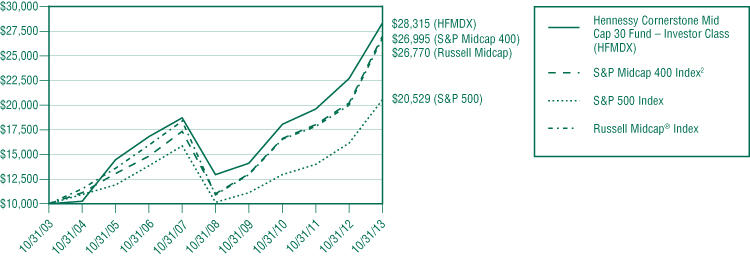
Hennessy Cornerstone Mid Cap 30 Fund (HFMDX/HIMDX)
CHANGE IN VALUE OF $10,000 INVESTMENT – INVESTOR CLASS (HFMDX)
This chart assumes an initial gross investment of $10,000 made on October 31, 2003. Returns shown include the reinvestment of all dividends. The table and the graph do not reflect the deduction of taxes that a shareholder would pay on Fund distributions or the redemption of Fund shares.
AVERAGE ANNUAL TOTAL RETURN PERIODS ENDED OCTOBER 31, 2013
| | One Year | Five Years | Ten Years |
| Hennessy Cornerstone Mid Cap 30 Fund – Investor Class (HFMDX) | 24.78% | 16.95% | 10.97% |
Hennessy Cornerstone Mid Cap 30 Fund – Institutional Class (HIMDX)1 | 25.15% | 17.37% | 11.20% |
Russell Midcap® Index2 | 33.79% | 19.67% | 10.35% |
| S&P 500 Index | 27.18% | 15.17% | 7.46% |
| Expense ratio: 1.38% (Investor Class) | | | Expense ratio: Gross 1.17%, Net 0.99%3 (Institutional Class) |
Performance data quoted represents past performance; past performance does not guarantee future results. The investment return and principal value of an investment will fluctuate so that an investor’s shares, when redeemed, may be worth more or less than their original cost. Current performance of the Fund may be lower or higher than the performance quoted. Performance data current to the most recent month end may be obtained by visiting hennessyfunds.com.
The expense ratios presented are from the most recent prospectus.
| 1 | Represents the performance of the Institutional Class shares after March 3, 2008 (inception of the share class) and Investor Class for periods prior to that date. |
| 2 | The Fund’s primary index has changed. Previously, the Fund used the S&P Midcap 400 Index as its primary index. The Fund is now compared to the Russell Midcap® Index so that the fund complex is consistently benchmarking against the appropriate Russell index when benchmarking against discrete asset classes. The average annual total returns of the S&P Midcap 400 Index for the one-year, five-year and ten-year periods ended October 31, 2013 were 33.48%, 19.63%, and 10.44%, respectively. |
| 3 | With regard to Institutional Class shares, the investment advisor has contractually agreed to waive a portion of its expenses indefinitely. |
HENNESSY FUNDS 1-800-966-4354
PERFORMANCE NARRATIVE
Portfolio Manager, Neil Hennessy, and Co-Portfolio Manager, Brian Peery
Over the previous twelve months, how did the Fund perform and what factors contributed to this performance?
For the twelve-month period ended October 31, 2013, the Investor Class of the Hennessy Cornerstone Mid Cap 30 Fund returned 24.78%, underperforming the Russell Midcap® Index, the S&P 500 Index, and the Morningstar Mid-Cap Blend Category Average, which returned 33.79%, 27.18%, and 32.84% for the same period, respectively.
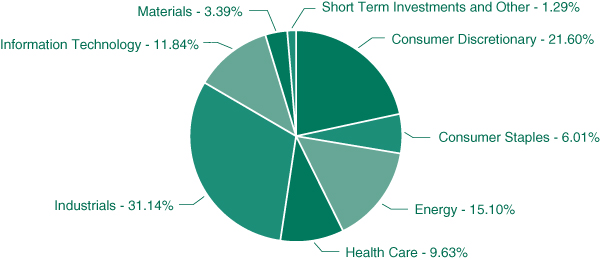
The Fund’s performance benefited from asset allocation and stock selection in the Healthcare and Industrial sectors, but stock selection in the Consumer Discretionary and Energy sectors created the Fund’s relative underperformance to its benchmarks. The best performing stock in the portfolio was PAREXELA International Corporation, which contributed nearly a full percentage of outperformance relative to the benchmark during the time period in which the Fund held the stock. The single largest detractor to performance during the twelve-month period was Axiall Corporation, which experienced lower volumes and profits from its building segments in both the domestic market as well as a slowdown in the Canadian housing market. Both of these stocks were replaced when the Fund was rebalanced in the fall.
Additional Portfolio Manager commentary and related investment outlook:
Prior to the Fund’s recent rebalancing, the portfolio was biased towards a housing recovery. We witnessed a solid resurgence in the Housing sector during the first half of the twelve-month period, but weakness during the second half of the twelve-month period hurt performance in the Fund’s portfolio, with many of the stocks in both the home building and peripheral industries underperforming the Fund’s benchmarks. As a result, the Fund’s overall performance lagged that of its benchmarks when housing related stocks softened upon both builders and suppliers experiencing mixed results during the spring and summer seasons. While we did see money flowing into the Housing sector from consumers who began putting money into their homes after many years of deferral, a stagnant economy, stagnant job market, and rising interest rate environment put a damper on revenues and earnings for the sector.
With the rebalance of the Fund’s portfolio completed during the fall, we identified a new trend emerging from the stocks now held by the Fund. Whereas in the past we have seen sector specific trends, the current portfolio is pointing to broader trends where companies are deploying excess cash by initiating and/or raising dividends, buying back stock and making acquisitions. As of this writing, well over half of the stocks in the Fund’s portfolio pay dividends, with nearly three-quarters of those dividend-paying companies having increased or initiated dividends within the last year.
The Fund’s portfolio also now includes several companies – approximately 60% of the portfolio – that have made recent acquisitions. In the current slow-growth environment where our economy seems to be stalled, companies have been seeking ways to drive earnings in the absence of the top line revenue growth that would be expected to accompany a vibrant economy. As such, a number of companies have been using earnings to make accretive acquisitions. This should help companies over time as they assimilate acquired businesses, eliminate redundancies, and leverage economies of scale. Although this will not necessarily promote job creation, it is likely to benefit shareholders. We expect that acquisitions may begin to slow due to increase in asset prices, making it more expensive to grow other than organic means.
We have also continued to see a number of companies running stock buyback programs, another activity that is not necessarily beneficial to the overall economy but is beneficial to shareholders. Within the Fund’s portfolio, over 40% of the companies currently have a stock buyback program in place, averaging approximately 10% of their total market capitalization.
Although the equity markets have experienced double digit returns this year, we are confident that opportunities still exist. We believe the continued low interest rate environment, coupled with the possibility of improved economic growth prospects, presents an attractive opportunity for equities going forward. As the great bond exodus that pundits are predicting seems to be emerging, the resulting capital flowing out of the bond markets into the equity markets has largely been directed toward foreign investments. Once the economy beings to gather some steam and domestic job creation begins in earnest, we would not be surprised to see money once again flowing back into U.S. companies and acting as a catalyst for another leg of the bull market that we are currently enjoying.
The Russell Midcap® Index is an unmanaged index commonly used to measure the performance of U.S. medium-capitalization stocks. The S&P 500 Index and the S&P Midcap 400 Index are unmanaged indices commonly used to measure the performance of U.S. stocks. You cannot invest directly in an index. Performance data for an index does not reflect any deductions for fees, expenses or taxes. The Fund invests in small- and medium-capitalization companies, which may have limited liquidity and greater price volatility than large-capitalization companies. References to specific securities should not be considered a recommendation to buy or sell any security. Fund holdings and sector allocations are subject to change. Please refer to the Schedule of Investments included in this report for additional portfolio information.
Each Morningstar category average represents a universe of funds with similar investment objectives. ©Morningstar, Inc. All Rights Reserved. The information contained herein: 1) is proprietary to Morningstar; 2) may not be copied or distributed and 3) is not warranted to be accurate, complete or timely. Neither Morningstar nor its content providers are responsible for any damages or losses arising from any use of this information. Past performance does not guarantee future results.
Hennessy Cornerstone Large Growth Fund (HFLGX/HILGX)
CHANGE IN VALUE OF $10,000 INVESTMENT – INVESTOR CLASS (HFLGX)
* Inception date
This chart assumes an initial gross investment of $10,000 made on March 20, 2009 (inception date of the Fund). Returns shown include the reinvestment of all dividends. The table and the graph do not reflect the deduction of taxes that a shareholder would pay on Fund distributions or the redemption of Fund shares.
AVERAGE ANNUAL TOTAL RETURN PERIODS ENDED OCTOBER 31, 2013
| | | | Since Inception |
| | One Year | Three Years | (3/20/09) |
| Hennessy Cornerstone Large Growth Fund – Investor Class (HFLGX) | 27.32% | 14.03% | 22.89% |
| Hennessy Cornerstone Large Growth Fund – Institutional Class (HILGX) | 27.63% | 14.33% | 23.24% |
Russell 1000® Index | 28.40% | 16.83% | 22.77% |
| S&P 500 Index | 27.18% | 16.56% | 22.17% |
| Expense ratio: 1.27% (Investor Class) | | | Expense ratio: Gross 1.41%, Net 0.98%1 (Institutional Class) |
Performance data quoted represents past performance; past performance does not guarantee future results. The investment return and principal value of an investment will fluctuate so that an investor’s shares, when redeemed, may be worth more or less than their original cost. Current performance of the Fund may be lower or higher than the performance quoted. Performance data current to the most recent month end may be obtained by visiting hennessyfunds.com.
The expense ratios presented are from the most recent prospectus.
| 1 | With regard to Institutional Class shares, the investment advisor has contractually agreed to waive a portion of its expenses indefinitely. |
PERFORMANCE NARRATIVE
Portfolio Manager, Neil Hennessy, and Co-Portfolio Manager, Brian Peery
Over the previous twelve months, how did the Fund perform and what factors contributed to this performance?
For the twelve-month period ended October 31, 2013, the Investor Class of the Hennessy Cornerstone Large Growth Fund returned 27.32%, underperforming the Russell 1000® Index, which returned 28.40% for the same period, but outperforming the S&P 500 Index and the Morningstar Large Blend Category Average, which returned 27.18% and 27.16% for the same period, respectively.
The Fund’s performance benefited from stock selection within the Information Technology, Consumer Staples, and Energy sectors, but stock selection within the Consumer Discretionary and Materials sectors hampered its overall relative performance to its benchmarks. In addition, sector allocation contributed positively to the Fund’s overall performance relative to its benchmark. The best performing stock within the portfolio was Delta Air Lines Inc., which was up 175% for the twelve-month period due to stronger than expected revenues and earnings growth. The single largest detractor to performance during the twelve-month period was The Gap, Inc. The Fund continues to hold both positions.
Additional Portfolio Manager commentary and related investment outlook:
During the last twelve months, we saw a continued trend of companies beating earnings expectations, but not quite meeting revenue targets. We believe this trend is beginning to abate and that we should see better earnings and revenue numbers in the coming twelve-month period. While top line revenue growth is muted due to a slow growth environment, companies are still doing well. Corporate profits are continuing to reach new highs due to deferred capital expenditure plans combined with tempered cost cutting.
Over the last twelve-month period, we have seen a much broader mix of companies choosing to initiate or increase dividends, and we believe the financial markets are beginning, and will continue to, reward companies who return money to their shareholders
HENNESSY FUNDS 1-800-966-4354
through dividends. While not part of our selection process for the Fund’s portfolio, 45 of the 50 stocks within the portfolio currently pay dividends. This is a trend we do not believe we would have seen just a few short years ago within this asset class. One of the criteria we use in the stock selection process for the Fund is return on total capital, which demonstrates how effectively a company turns capital into profit and is very useful in predicting the potential returns that will be generated by the business operation itself. With top line revenue growth difficult to achieve in the current environment, we are pleased that the companies selected for inclusion in the Fund’s portfolio through our stock selection methodology appear to be leading their respective industries in creating value for their shareholders.
We believe the attractiveness of equity prices in general, coupled with an extremely low interest rate environment have many investors seeking high quality, dividend-paying growth companies. In our view, the prospect of generating current income while investing in growth companies, provides an exciting potential for investors to replace the income derived from bonds in a low yield environment, while maintaining exposure to appreciation from the underlying stock.
The Russell 1000® Index and the S&P 500 Index are unmanaged indices commonly used to measure the performance of U.S. stocks. You cannot invest directly in an index. Performance data for an index does not reflect any deductions for fees, expenses or taxes. The Fund may invest in medium-capitalization companies, which may have more limited liquidity and greater price volatility than large-capitalization companies. References to specific securities should not be considered a recommendation to buy or sell any security. Fund holdings and sector allocations are subject to change. Please refer to the Schedule of Investments included in this report for additional portfolio information.
Each Morningstar category average represents a universe of funds with similar investment objectives. © Morningstar, Inc. All Rights Reserved. The information contained herein: 1) is proprietary to Morningstar; 2) may not be copied or distributed and 3) is not warranted to be accurate, complete or timely. Neither Morningstar nor its content providers are responsible for any damages or losses arising from any use of this information. Past performance does not guarantee future results.
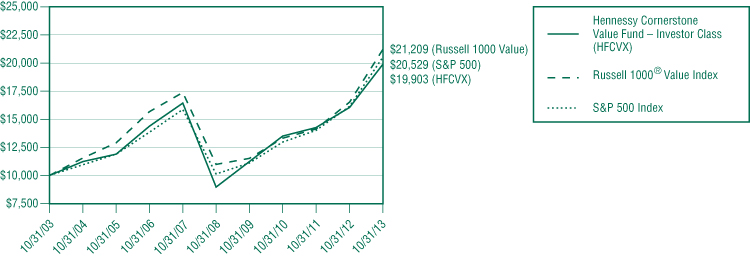
Hennessy Cornerstone Value Fund (HFCVX/HICVX)
CHANGE IN VALUE OF $10,000 INVESTMENT – INVESTOR CLASS (HFCVX)
This chart assumes an initial gross investment of $10,000 made on October 31, 2003. Returns shown include the reinvestment of all dividends. The table and the graph do not reflect the deduction of taxes that a shareholder would pay on Fund distributions or the redemption of Fund shares.
AVERAGE ANNUAL TOTAL RETURN PERIODS ENDED OCTOBER 31, 2013
| | One Year | Five Years | Ten Years |
| Hennessy Cornerstone Value Fund – Investor Class (HFCVX) | 23.84% | 17.30% | 7.13% |
Hennessy Cornerstone Value Fund – Institutional Class (HICVX)1 | 24.13% | 17.65% | 7.30% |
Russell 1000® Value Index | 28.29% | 14.06% | 7.81% |
| S&P 500 Index | 27.18% | 15.17% | 7.46% |
| Expense ratio: 1.26% (Investor Class) | | | Expense ratio: Gross 1.20%, Net 0.98%2 (Institutional Class) |
Performance data quoted represents past performance; past performance does not guarantee future results. The investment return and principal value of an investment will fluctuate so that an investor’s shares, when redeemed, may be worth more or less than their original cost. Current performance of the Fund may be lower or higher than the performance quoted. Performance data current to the most recent month end may be obtained by visiting hennessyfunds.com.
The expense ratios presented are from the most recent prospectus.
| 1 | Represents the performance of the Institutional Class shares after March 3, 2008 (inception of the share class) and Investor Class for periods prior to that date. |
| 2 | With regard to Institutional Class shares, the investment advisor has contractually agreed to waive a portion of its expenses indefinitely. |
PERFORMANCE NARRATIVE
Portfolio Manager, Neil Hennessy, and Co-Portfolio Manager, Brian Peery
Over the previous twelve months, how did the Fund perform and what factors contributed to this performance?
For the twelve-month period ended October 31, 2013, the Investor Class of the Hennessy Cornerstone Value Fund returned 23.84%, underperforming the Russell 1000® Value Index, the S&P 500 Index, and the Morningstar Large Value Category Average, which returned 28.29%, 27.18%, and 26.84% for the same period, respectively.
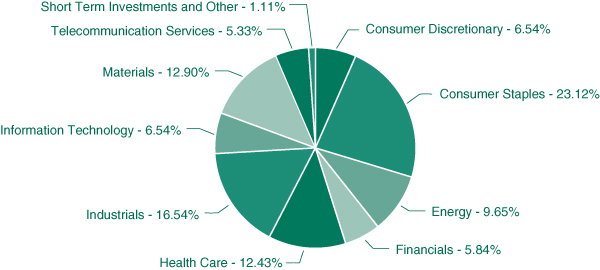
While the Fund had strong absolute performance for the twelve-month period, its performance versus its benchmark was hampered by both asset allocation and stock selection. Relative overweighting in the Consumer Staples sector and stock selection within the Consumer Discretionary and Consumer Staples sectors were the two largest contributors to the Fund’s relative underperformance. Stock selection within most of the other sectors invested in by the Fund contributed positively to performance, but was not enough to overcome the negative performance contributed by Consumer stocks, which made up nearly 30% of the Fund’s portfolio. The best performing stock within the Fund was Bristol-Meyers Squibb, which was up over 63% for the twelve-month period as a result of earnings and revenue growth. The largest detractor to performance during the time period held by the Fund was ExxonMobil, which was roughly flat from the previous twelve-month period as oil prices declined. The Fund continues to hold Bristol-Myers, but no longer holds ExxonMobil.
Additional Portfolio Manager commentary and related investment outlook:
We believe the financial markets are beginning to reward companies who return money to shareholders in the form of higher dividends, and we expect this trend to continue. We continue to believe it is risky to be over invested in bonds and underinvested in equities, especially since there are many companies whose stock yields are currently higher than that of a 10-Year U.S. Treasury. As of the end of October, the Fund’s 30-day SEC Yield was 2.39%. As investors continue to seek out opportunities to generate income while having exposure to the upside potential of the equity markets, we believe that large capitalization, dividend-paying companies should continue to do well.
Until the uncertainty surrounding fiscal policy, taxes and healthcare costs subside, we believe corporate capital expenditures will remain in a holding pattern. As such, we expect large capitalization companies to utilize excess cash to buy back stock, pay dividends, or make accretive acquisitions, all of which should have a positive effect on shareholders.
30-Day SEC Yield is a standardized yield computed by dividing the net investment income per share earned during the past 30-day period by the share price at the end of the period, expressed as an annual percentage rate.
The Russell 1000® Value Index is an unmanaged index commonly used to measure the performance of U.S. large-capitalization value stocks. The S&P 500 Index is an unmanaged index commonly used to measure the performance of U.S. stocks. You cannot invest directly in an index. Performance data for an index does not reflect any deductions for fees, expenses or taxes. The Fund may invest in medium-capitalization companies, which tend to have more limited liquidity and greater price volatility than large-capitalization companies. Investments in foreign securities involve greater volatility and political, economic and currency risk and differences in accounting methods. References to specific securities should not be considered a recommendation to buy or sell any security. Fund holdings and sector allocations are subject to change. Please refer to the Schedule of Investments included in this report for additional portfolio information.
Each Morningstar category average represents a universe of funds with similar investment objectives. © Morningstar, Inc. All Rights Reserved. The information contained herein: 1) is proprietary to Morningstar; 2) may not be copied or distributed and 3) is not warranted to be accurate, complete or timely. Neither Morningstar nor its content providers are responsible for any damages or losses arising from any use of this information. Past performance does not guarantee future results.
HENNESSY FUNDS 1-800-966-4354
Hennessy Large Value Fund (HLVFX/HLVIX)
CHANGE IN VALUE OF $10,000 INVESTMENT – INVESTOR CLASS (HLVFX)
This chart assumes an initial gross investment of $10,000 made on October 31, 2003. Returns shown include the reinvestment of all dividends.
The table and the graph do not reflect the deduction of taxes that a shareholder would pay on Fund distributions or the redemption of Fund shares.
AVERAGE ANNUAL TOTAL RETURN PERIODS ENDED OCTOBER 31, 2013
| | One Year | Five Years | Ten Years |
| Hennessy Large Value Fund – Investor Class (HLVFX) | 25.64% | 12.23% | 6.12% |
Hennessy Large Value Fund – Institutional Class (HLVIX)1 | 26.08% | 12.62% | 6.31% |
Russell 1000® Value Index | 28.29% | 14.06% | 7.81% |
| S&P 500 Index | 27.18% | 15.17% | 7.46% |
| Expense ratio: 1.40% (Investor Class) | | | Expense ratio: Gross 1.22%, Net 0.98%2 (Institutional Class) |
Performance data quoted represents past performance; past performance does not guarantee future results. The investment return and principal value of an investment will fluctuate so that an investor’s shares, when redeemed, may be worth more or less than their original cost. Current performance of the Fund may be lower or higher than the performance quoted. Performance for periods prior to March 20, 2009 reflects the performance of the Tamarack Value Fund, the predecessor to the Hennessy Select Large Value Fund. Performance data current to the most recent month end may be obtained by visiting hennessyfunds.com.
The expense ratios presented are from the most recent prospectus.
| 1 | Represents the performance of the Institutional Class shares after March 20, 2009 (inception of the share class) and Investor Class for periods prior to that date. |
| 2 | With regard to Institutional Class shares, the investment advisor has contractually agreed to waive a portion of its expenses indefinitely. |
PERFORMANCE NARRATIVE
RBC GLOBAL ASSET MANAGEMENT (U.S.) INC., SUB-ADVISOR
Portfolio Managers Stuart Lippe, Barbara Browning, CFA, and Adam Scheiner, CFA, RBC Global Asset Management (U.S.) Inc. (sub-advisor)
Over the previous twelve months, how did the Fund perform and what factors contributed to this performance?
For the twelve-month period ended October 31, 2013, the Investor Class of the Hennessy Large Value Fund returned 25.64%, underperforming the Russell 1000® Value Index, the S&P 500 Index, and the Morningstar Large Value Category Average, which returned 28.29%, 27.18%, and 26.84% for the same period, respectively.
While the Fund had strong absolute performance for the twelve-month period, its relative outperformance was driven by stock selection across a number of sectors, led by Utilities, Health Care, and Materials. Conversely, stock selection in the Information Technology and Consumer Discretionary sectors hampered the Fund’s relative performance versus its benchmark. Sector allocation detracted modestly from performance as the Fund’s sector neutral mandate, by design, limits the impact of sector weighting decisions. We instead make investment decisions at the industry level.
Within the Utilities sector, Dominion Resources, Inc. was a significant contributor to absolute performance for the twelve-month period, with returns of over 26%. Dominion Resources, Inc. received approval from the Department of Energy to export Liquid Natural Gas and also announced the formation of a master limited partnership, which is a tax-advantaged structure for mid-stream assets. The Fund recently realized its profits by selling completely out of the position. Positions in Northeast Utilities and NRG Energy, Inc., which were up over 13% and 18% for the twelve-month period, respectively, also added to absolute performance within the Utilities sector. The Fund no longer owns NRG Energy, Inc., but does still hold Northeast Utilities.
The Healthcare sector was also a significant contributor to relative outperformance for the twelve-month period. The biggest contributor to performance within the Healthcare sector by far was Johnson & Johnson, which was up over 35% during this twelve-month period. The Fund has owned Johnson & Johnson for a long period of time because the Fund’s managers believe it has the best portfolio of any drug company. We strongly believe that pharmaceuticals are a key growth engine and that a consumer turnaround will help the stock as well. Also contributing to the Fund’s performance was McKesson Corporation, a medical distribution company, which beat both earnings and revenue estimates in the most recent quarter. The Fund continues to hold both of these companies.
Stock selection within the Materials sector, and specifically within Chemicals, also contributed positively to performance. Although the Fund is sector neutral, the Fund’s managers do sometimes make industry-specific bets, and being overweight in the Chemicals sector over the past twelve-month period benefited the portfolio. Eastman Chemical Co., LyondellBasell Industries NV, and PPG Industries Inc. were top performers for the portfolio within the Chemicals sector. Eastman Chemical Co. continues to execute and reposition itself as a more specialty chemical company. We believe there is still room for further actions on the portfolio management side, and potential double digit earnings growth through 2015 is also visible. The stock still trades at a discount not only to peers but also to several pure commodity chemical companies, leaving ample room for the revaluation story. LyondellBasell Industries NV is generating significant free cash flow and has been buying back shares, thereby boosting its stock price. Capital projects have had quick paybacks and have been on time and on budget. PPG Industries Inc. is becoming a pure play coatings leader and has significant cash on its balance sheet. The market has also responded positively to share buybacks by PPG Industries Inc., which has pushed its stock price even higher. The Fund has since sold both LyondellBasell Industries NV and PPG Industries Inc. because both stocks reached our price targets, but continues to hold Eastman Chemical Co.
On the negative side of the ledger, the Consumer Discretionary sector detracted from relative performance, although it contributed positively to absolute performance. The relative performance of the Fund was negatively impacted by stocks it did not own, including Best Buy Co., Inc., GameStop Corp., and Twenty-First Century Fox, Inc., which were up over 191%, 148%, and 40%, respectively. Our weak relative performance in the sector was partially offset by our overweight to Time Warner Inc., which was up over 61%, as the company continued to see improving ratings at Turner networks and affiliate fee increases as its multi-year fee deals were renegotiated. It also benefited from the announced separation of its publishing business. The Fund continues to hold Time Warner Inc.
Within the Information Technology sector, the largest detractor from performance (and the second largest detractor from the overall portfolio) was Broadcom Corp., which was down 14% for the twelve-month period, as the company recently had a very disappointing quarter following lower guidance for future results. Its Smartphone Wi-Fi chip business is experiencing increased competition and it is not gaining as much share as it had expected. Hewlett-Packard Company was also a headwind within the Information Technology sector for the portfolio, as the PC environment has suffered multiple quarters of double digit declines. We continue to believe in the longer-term prospects of both companies and maintain their positions in the Fund.
Additional Portfolio Manager commentary and related investment outlook:
Despite the strong performance of the last year, we remain cautiously optimistic that markets can continue their ascent into 2014 (though we expect periods of heightened volatility as investors remain in limbo with regard to the timing and amount of the Federal Reserve Board’s expected tapering). We remain bullish on the market for the next 12 months, with the caveat that at some point we will probably experience a period of volatility and discomfort much greater than we have endured over the past 12 months. The positive forces include the fact that interest rates and inflation are low, money continues to flow out of bond funds, corporate balance sheets are flush with cash, company management teams seem to be more conscious of wasting capital, and many sectors of both the U.S. economy (e.g., automobiles) and the world economy (e.g., Latin America) are still far from their peaks. On the negative side, many stocks are factoring in greater long-term growth than we expect to be realized and we believe stock prices in general have been bid up for macroeconomic reasons. In this environment, we expect the ability to avoid blowups will become an increasingly important skill.
We remain confident in our stock selection process and our ability to find special situation stocks that can outperform regardless of the market environment. While investment decisions are the result of bottom-up stock selection and our sector-neutral mandate requires investment in all ten major sectors, there are a number of industry-based themes that we believe could lead to outperformance in the next twelve-month period. With respect to consumer spending, consumers are spending more of their dollars on housing related, durable goods related, and hard-line retail related (e.g., home and automobile) items, and less on soft-line and multi-line retail-related items (e.g., apparel and shoes) and we are positioning the Fund’s portfolio accordingly. We also expect a continued rebound in capital market activity to positively impact the Fund’s holdings in asset managers and money center banks; increased utilization in the health care industry prompted by health care reform (specifically with regard to managed care) to support our overweight in health care providers and services; and a growing Smartphone market with increased complexity in handheld devices to support semiconductor manufacturers.
The Russell 1000® Value Index is an unmanaged index commonly used to measure the performance of U.S. large-capitalization value stocks. The S&P 500 Index is an unmanaged index commonly used to measure the performance of U.S. stocks. You cannot invest directly in an index. Performance data for an index does not reflect any deductions for fees, expenses or taxes. The Fund may invest in medium-capitalization companies, which may have more limited liquidity and greater price volatility than large-capitalization companies. References to specific securities should not be considered a recommendation to buy or sell any security. Fund holdings and sector allocations are subject to change. Please refer to the Schedule of Investments included in this report for additional portfolio information.
Each Morningstar category average represents a universe of funds with similar investment objectives. © Morningstar, Inc. All Rights Reserved. The information contained herein: 1) is proprietary to Morningstar; 2) may not be copied or distributed and 3) is not warranted to be accurate, complete or timely. Neither Morningstar nor its content providers are responsible for any damages or losses arising from any use of this information. Past performance does not guarantee future results.
HENNESSY FUNDS 1-800-966-4354
Earnings Growth is not indicative of the Fund’s future returns. Free Cash Flow is calculated as operating cash flow minus capital expenditures and represents the cash that a company is able to generate after laying out the money required to maintain or expand its asset base.
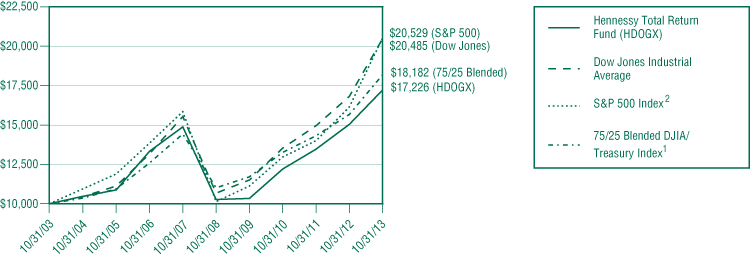
Hennessy Total Return Fund (HDOGX)
CHANGE IN VALUE OF $10,000 INVESTMENT
This chart assumes an initial gross investment of $10,000 made on October 31, 2003. Returns shown include the reinvestment of all dividends. The table and the graph do not reflect the deduction of taxes that a shareholder would pay on Fund distributions or the redemption of Fund shares.
AVERAGE ANNUAL TOTAL RETURN PERIODS ENDED OCTOBER 31, 2013
| | One Year | Five Years | Ten Years |
| Hennessy Total Return Fund (HDOGX) | 14.49% | 10.90% | 5.59% |
75/25 Blended DJIA/Treasury Index1,2 | 16.10% | 10.54% | 6.16% |
| Dow Jones Industrial Average | 21.82% | 13.91% | 7.43% |
Expense ratio: 1.38%
Performance data quoted represents past performance; past performance does not guarantee future results. The investment return and principal value of an investment will fluctuate so that an investor’s shares, when redeemed, may be worth more or less than their original cost. Current performance of the Fund may be lower or higher than the performance quoted. Performance data current to the most recent month end may be obtained by visiting hennessyfunds.com.
The expense ratio presented is from the most recent prospectus.
| 1 | The 75/25 Blended DJIA/Treasury Index consists of 75% common stocks represented by the Dow Jones Industrial Average and 25% short-duration Treasury securities represented by the BofA Merrill Lynch 90-day Treasury Bill Index. |
| 2 | The Fund’s indices have changed. Previously, the Fund used the Dow Jones Industrial Average as its primary index and the S&P 500 Index as its secondary index. The Fund will now use the 75/25 Blended DJIA/Treasury Index as its primary index and the Dow Jones Industrial Average as its secondary index. The Fund changed its primary index to the 75/25 Blended DJIA/Treasury Index because the new index more closely reflects the investment strategy of the Fund. The average annual total returns of the S&P 500 Index for the one-year, five-year and ten-year periods ended October 31, 2013 were 27.18%, 15.17%, and 7.46%, respectively. |
PERFORMANCE NARRATIVE
Portfolio Manager, Neil Hennessy, and Co-Portfolio Manager, Brian Peery
Over the previous twelve months, how did the Fund perform and what factors contributed to this performance?
For the twelve-month period ended October 31, 2013, the Hennessy Total Return Fund returned 14.49%, underperforming the 75/25 Blended DJIA/Treasury Index*, the Dow Jones Industrial Average, and the Morningstar Large Value Category Average, which returned 16.10%, 21.82%, and 26.84% for the same period, respectively.
The Fund’s roughly 25% weighting of U.S. Treasuries was a detriment to overall performance, as yields continued near historic lows. The Fund’s approximately 75% equity weighting was able to capture nearly the weighted return of the entire Dow Jones Industrial Average.
During the twelve-month period ended October 31, 2013, all but one of the Fund’s 17 equity positions had positive returns, with only Merck & Co., Inc. posting a negative return. Hewlett-Packard and E. I. du Pont de Nemours and Company led the way with returns of 74% and 36% for the period, respectively. Although Hewlett-Packard is no longer a member of the Dow Jones Industrial Average, the stock will remain in the Fund until the next rebalancing of the Fund portfolio occurs, at which time the newest “Dogs of the Dow” stocks will replace the stocks that are no longer in the index.
While the Fund’s portfolio may underperform its benchmarks in periods where equities rise sharply, the strategy is geared to capture near market returns with a lower risk profile, since only three quarters of the assets are invested in equities. Conversely, if equity markets were to fall sharply, we would expect the Fund to perform better than its benchmarks due to its 25% exposure to short-term U.S. Treasuries that are held to maturity. Ultimately, the overall goal of this portfolio is to capture near-market upside performance while mitigating some of the potential market downside risk.
Additional Portfolio Manager commentary and related investment outlook:
We continue to believe that the Dow Jones Industrial Average stocks, and in particular the stocks comprising the high dividend-yielding “Dogs of the Dow” (the methodology employed within the Hennessy Total Return Fund), provide an excellent way to gain equity exposure to the markets. With U.S. Treasury yields still trading near historic lows, many investors are seeking high quality, dividend-paying companies as a means of generating current income. We believe that the rotation out of bonds and into equities, where investors have historically received higher yields as well as the potential for capital appreciation, will continue.
As the market reaches new highs and investors become more wary of a potential pullback, we believe that a trend of moving some money away from more risky asset classes and into the perceived “safety” of very large dividend-paying companies will prevail. We believe the Fund is well positioned for the more moderately conservative investor as the equity portion of the portfolio holds what we would deem to be high quality, high dividend-paying companies, while the short duration of the Treasury component (all less than three months) will allow us the ability to roll into higher yielding treasuries, should U.S. Government yields rise.
| * | The 75/25 Blended DJIA/Treasury Index consists of 75% common stocks represented by the Dow Jones Industrial Average and 25% short-duration Treasury securities represented by the BofA Merrill Lynch 90-day U.S. Treasury Bill Index. |
The Dow Jones Industrial Average is unmanaged index commonly used to measure the performance of U.S. stocks. The BofA Merrill Lynch 90-day U.S. Treasury Bill Index is an unmanaged index of Treasury securities maturing in 90 days. The S&P 500 Index is an unmanaged index commonly used to measure the performance of the U.S. stocks. You cannot invest directly in an index. Performance data for an index does not reflect any deductions for fees, expenses or taxes. The Fund is non-diversified, meaning it concentrates its assets in fewer individual holdings than a diversified fund and is therefore more exposed to individual stock volatility than a diversified fund. References to specific securities should not be considered a recommendation to buy or sell any security. Fund holdings and sector allocations are subject to change. Please refer to the Schedule of Investments included in this report for additional portfolio information.
Each Morningstar category average represents a universe of funds with similar investment objectives. © Morningstar, Inc. All Rights Reserved. The information contained herein: 1) is proprietary to Morningstar; 2) may not be copied or distributed and 3) is not warranted to be accurate, complete or timely. Neither Morningstar nor its content providers are responsible for any damages or losses arising from any use of this information. Past performance does not guarantee future results.
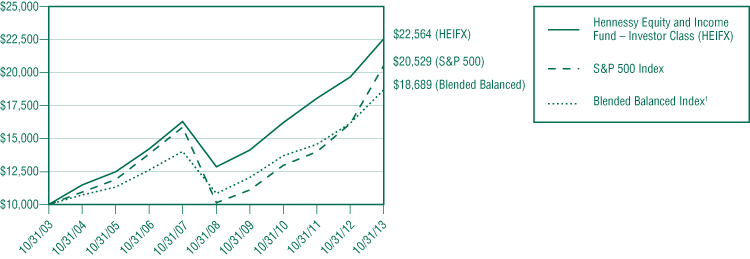
Hennessy Equity and Income Fund (HEIFX/HEIIX)
CHANGE IN VALUE OF $10,000 INVESTMENT – INVESTOR CLASS (HEIFX)
This chart assumes an initial gross investment of $10,000 made on October 31, 2003. Returns shown include the reinvestment of all dividends. The table and the graph do not reflect the deduction of taxes that a shareholder would pay on Fund distributions or the redemption of Fund shares.
HENNESSY FUNDS 1-800-966-4354
AVERAGE ANNUAL TOTAL RETURN PERIODS ENDED OCTOBER 31, 2013
| | One Year | Five Years | Ten Years |
| Hennessy Equity and Income Fund – Investor Class (HEIFX) | 14.72% | 11.91% | 8.48% |
| Hennessy Equity and Income Fund – Institutional Class (HEIIX) | 14.99% | 12.18% | 8.74% |
Blended Balanced Index1 | 15.65% | 11.52% | 6.45% |
| S&P 500 Index | 27.18% | 15.17% | 7.46% |
| Expense ratio: 1.35% (Investor Class) | | | Expense ratio: 1.08% (Institutional Class) |
Performance data quoted represents past performance; past performance does not guarantee future results. The investment return and principal value of an investment will fluctuate so that an investor’s shares, when redeemed, may be worth more or less than their original cost. Current performance of the fund may be lower or higher than the performance quoted. Performance data current to the most recent month end may be obtained by visiting hennessyfunds.com. Performance for periods prior to October 26, 2012 is that of the FBR Balanced Fund from March 12, 2010 to October 25, 2012 and that of the AFBA 5 Star Balanced Fund for periods prior to March 12, 2010.
The expense ratios presented are from the most recent prospectus.
| 1 | The Blended Balanced Index consists of 60% common stocks represented by the S&P 500 Index and 40% bonds represented by the Barclays Capital Intermediate U.S. Government/Credit Index. |
PERFORMANCE NARRATIVE
THE LONDON COMPANY, SUB-ADVISOR (EQUITY PORTION)
FINANCIAL COUNSELORS, INC., SUB-ADVISOR (FIXED INCOME PORTION)
For the twelve-month period ended October 31, 2013, the Investor Class of the Hennessy Equity and Income Fund returned 14.72%, underperforming the Blended Balanced Index*, the S&P 500 Index, and the Morningstar Moderate Allocation Category Average, which returned 15.65%, 27.18%, and 15.85% for the same period, respectively.
Portfolio Managers: Stephen M. Goddard, CFA (Lead Portfolio Manager for the Fund), Jonathan T. Moody, CFA, J. Brian Campbell, CFA, Mark DeVaul, CFA, CPA, The London Company of Virginia, LLC (sub-advisor of the equity portion of the Fund)
Over the previous twelve months, how did the equity portion of the Fund perform and what factors contributed to this performance?
Domestic equity returns for the twelve-month period ended October 31, 2013 were very strong. Slow growth in the domestic economy, rising consumer confidence, and a relative downshift in some of the macroeconomic uncertainties around the globe helped drive the market higher. The market was also led higher by the Health Care, Industrials, and Consumer Discretionary sectors. Relative to its benchmarks, the Fund’s stock selection had a positive effect on performance, but sector selection had a negative effect. Relative underweighting in the Industrials, Consumer Discretionary, and Health Care sectors had a negative impact on performance.
Additional Portfolio Manager commentary on the equity portion of the Fund and the related investment outlook:
While we are aware of macroeconomic factors that may impact the market, our strategy is to focus on stocks from a bottom-up standpoint. Our approach is to own companies with strong returns on capital and flexibility to enhance shareholder value using their balance sheets. Low interest rates and a high equity risk premium enable companies to increase shareholder value by changing the capital structure of the company. Separately, with elevated cash levels on corporate balance sheets and dividend payout ratios below average, we expect investors to reward companies that wisely deploy capital by increasing dividends, repurchasing shares, and undertaking accretive acquisitions. We believe the Fund’s portfolio is well positioned for a slow-growth environment that rewards strong capital allocation.
Portfolio Managers: Gary B. Cloud, CFA and Peter G. Greig, CFA, Financial Counselors, Inc. (sub-advisor of the fixed income portion of the Fund)
Over the previous twelve months, how did the fixed income portion of the Fund perform and what factors contributed to this performance?
A pro-cyclical asset allocation in the Fund helped relative performance due to an overweight position in Corporate bonds and an underweight position in U.S. Treasury securities. Higher yielding fixed income securities in the portfolio boosted the interest income component of total return, adding to relative performance. Fixed income sector asset allocation and the income effect provided the biggest boost to relative returns for the Fund. The amortization and effective duration effect had the largest negative impact on relative Fund performance.
Additional Portfolio Manager commentary on the fixed income portion of the Fund and the related investment outlook:
Investors were caught off guard leading up to the more hawkish rhetoric from the Federal Reserve Board (Fed) and were whipsawed again when the Fed backtracked on tapering bond purchases in September. We believe the prospect of a government shutdown and potential debt default played into and will continue to factor in the Fed’s calculus on the timing of monetary policy direction.
The new year will witness a change of leadership at the Fed and a likely reduction in the size and scope of asset purchases. We hope the Fed learned some valuable lessons from its summer taper talk and will find a less disruptive communication strategy for policy initiatives over the near term.
Looking forward, moderate economic growth, mild inflation and continued purchases by the Fed would be consistent with a range-bound Treasury market for the balance of the year and into early 2014. We are on guard for more upward pressure on interest
rates later in 2014. Any decline below 2.50% should be used as an opportunity to shorten duration. We expect corporate credit to again prove favorable in the final quarter of the year and into 2014.
| * | The Blended Balanced Index consists of 60% common stocks represented by the S&P 500 Index and 40% bonds represented by the Barclays Capital Intermediate U.S. Government/Credit Index. |
The S&P 500 Index is an unmanaged index commonly used to measure the performance of U.S. stocks. The Barclays Capital Intermediate U.S. Government/Credit Index is an unmanaged index commonly used to measure the performance of U.S. bonds. You cannot invest directly in an index. Performance data for an index does not reflect any deductions for fees, expenses or taxes. The Fund may invest in debt securities, which typically decrease in value when interest rates rise. The risk is greater for longer term debt securities. Investments by the Fund in lower-rated and non-rated securities presents a greater risk of loss to principal and interest than higher-rated securities. Investments in Asset-Backed and Mortgage-Backed securities include additional risks that investors should be aware of, including credit risk, prepayment risk, possible illiquidity and default, as well as increased susceptibility to adverse economic developments. Investments in foreign securities may involve greater volatility and political, economic and currency risk and differences in accounting methods. The Fund may invest in IPOs, which may fluctuate considerably due to the absence of a prior public market and may have a magnified impact on the Fund. References to specific securities should not be considered a recommendation to buy or sell any security. Fund holdings and sector allocations are subject to change. Please refer to the Schedule of Investments included in this report for additional portfolio information.
Each Morningstar category average represents a universe of funds with similar investment objectives. © Morningstar, Inc. All Rights Reserved. The information contained herein: 1) is proprietary to Morningstar; 2) may not be copied or distributed and 3) is not warranted to be accurate, complete or timely. Neither Morningstar nor its content providers are responsible for any damages or losses arising from any use of this information. Past performance does not guarantee future results.
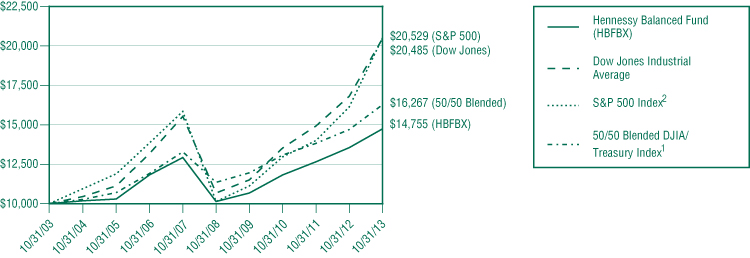
Hennessy Balanced Fund (HBFBX)
CHANGE IN VALUE OF $10,000 INVESTMENT
This chart assumes an initial gross investment of $10,000 made on October 31, 2003. Returns shown include the reinvestment of all dividends. The table and the graph do not reflect the deduction of taxes that a shareholder would pay on Fund distributions or the redemption of Fund shares.
AVERAGE ANNUAL TOTAL RETURN PERIODS ENDED OCTOBER 31, 2013
| | One Year | Five Years | Ten Years |
| Hennessy Balanced Fund (HBFBX) | 8.77% | 7.80% | 3.97% |
50/50 Blended DJIA/Treasury Index1,2 | 10.69% | 7.44% | 4.99% |
| Dow Jones Industrial Average | 21.82% | 13.91% | 7.43% |
Expense ratio: 1.55%
Performance data quoted represents past performance; past performance does not guarantee future results. The investment return and principal value of an investment will fluctuate so that an investor’s shares, when redeemed, may be worth more or less than their original cost. Current performance of the Fund may be lower or higher than the performance quoted. Performance data current to the most recent month end may be obtained by visiting hennessyfunds.com.
The expense ratio presented is from the most recent prospectus.
| 1 | The 50/50 Blended DJIA/Treasury Index consists of 50% common stocks represented by the Dow Jones Industrial Average and 50% short-duration Treasury securities represented by the BofA Merrill Lynch 1-Year Treasury Note Index. |
HENNESSY FUNDS 1-800-966-4354
| 2 | The Fund’s indices have changed. Previously, the Fund used the Dow Jones Industrial Average as its primary index and the S&P 500 Index as its secondary index. The Fund will now use the 50/50 Blended DJIA/Treasury Index as its primary index and the Dow Jones Industrial Average as its secondary index. The Fund changed its primary index to the 50/50 Blended DJIA/Treasury Index because the new index more closely reflects the investment strategy of the Fund. The average annual total returns of the S&P 500 Index for the one-year, five-year and ten-year periods ended October 31, 2013 were 27.18%, 15.17%, and 7.46%, respectively. |
PERFORMANCE NARRATIVE
Portfolio Manager, Neil Hennessy, and Co-Portfolio Manager, Brian Peery
Over the previous twelve months, how did the Fund perform and what factors contributed to this performance?
For the twelve-month period ended October 31, 2013, the Hennessy Balanced Fund returned 8.77%, underperforming the 50/50 Blended DJIA/Treasury Index*, the Dow Jones Industrial Average, and the Morningstar Moderate Allocation Category Average, which returned 10.69%, 21.82%, and 15.85% for the same period, respectively.
The Fund’s relative underperformance to its benchmarks is due primarily to the continued low yields on Treasury Bills. The Fund’s position of approximately 50% in U.S. Treasuries did not allow it to fully capture the performance of the equity markets over the twelve-month period. While the Fund’s portfolio may underperform its benchmarks in periods where equities rise sharply, the strategy is geared to capture near-market returns with a lower risk profile, since only half of the assets of the Fund are invested in equities. Conversely, if equity markets were to fall sharply, we would expect the Fund to perform better than its benchmarks due to its 50% exposure to short-term U.S. Treasuries that are held to maturity. Ultimately, the overall goal of this portfolio is to capture upside performance while mitigating downside risk.
During the twelve-month period ended October 31, 2013, all but one of the Fund’s 13 equity positions had positive returns, with only Merck & Co., Inc. posting a negative return. Cisco Systems, Inc. and Pfizer Inc. led the way with returns of 29% and 25% for the twelve-month period, respectively.
Additional Portfolio Manager commentary and related investment outlook:
We continue to believe that the Dow Jones Industrial Average stocks, and in particular the stocks comprising the high dividend-yielding “Dogs of the Dow” (the methodology employed within the Hennessy Balanced Fund), provide an excellent way to gain equity exposure to the markets. With U.S. Treasury yields still trading near historic lows, many investors are seeking high quality, dividend-paying companies as a means of generating current income. We believe that the rotation out of bonds and into equities, where investors have historically received higher yields as well as the potential for capital appreciation, will continue.
As the overall markets reach new highs and investors become more wary of a potential pullback, we believe that a trend of moving some money away from more risky asset classes and into the perceived “safety” of very large dividend-paying companies will prevail. We believe the Fund is well positioned for the more conservative investor as the equity portion of the portfolio holds what we would deem to be high quality, high-dividend paying companies, while the relatively short duration of the Treasury component (all less than one year) will allow us the ability to roll into higher yielding treasuries in the event U.S. Government yields continue to rise.
| * | The 50/50 Blended DJIA/Treasury Index consists of 50% common stocks represented by the Dow Jones Industrial Average and 50% short duration Treasury securities represented by the BofA Merrill Lynch 1-Year U.S. Treasury Note Index. |
The Dow Jones Industrial Average and S&P 500 Index are unmanaged indices commonly used to measure the performance of U.S. stocks. The BofA Merrill Lynch 1-Year U.S. Treasury Note Index is an unmanaged index comprised of Treasury securities maturing in approximately one year. You cannot invest directly in an index. Performance data for an index does not reflect any deductions for fees, expenses or taxes. The Fund is non-diversified, meaning it concentrates its assets in fewer individual holdings than a diversified fund and is therefore more exposed to individual stock volatility than a diversified fund. References to specific securities should not be considered a recommendation to buy or sell any security. Fund holdings and sector allocations are subject to change. Please refer to the Schedule of Investments included in this report for additional portfolio information.
Each Morningstar category average represents a universe of funds with similar investment objectives. © Morningstar, Inc. All Rights Reserved. The information contained herein: 1) is proprietary to Morningstar; 2) may not be copied or distributed and 3) is not warranted to be accurate, complete or timely. Neither Morningstar nor its content providers are responsible for any damages or losses arising from any use of this information. Past performance does not guarantee future results.
Hennessy Core Bond Fund (HCBFX/HCBIX)
CHANGE IN VALUE OF $10,000 INVESTMENT – INVESTOR CLASS (HCBFX)
This chart assumes an initial gross investment of $10,000 made on October 31, 2003. Returns shown include the reinvestment of all dividends. The table and the graph do not reflect the deduction of taxes that a shareholder would pay on Fund distributions or the redemption of Fund shares.
AVERAGE ANNUAL TOTAL RETURN PERIODS ENDED OCTOBER 31, 2013
| | One Year | Five Years | Ten Years |
| Hennessy Core Bond Fund – Investor Class (HCBFX) | 0.41% | 6.99% | 5.27% |
| Hennessy Core Bond Fund – Institutional Class (HCBIX) | 0.69% | 7.25% | 5.54% |
| Barclays Capital Intermediate U.S. Government/Credit Index | -0.03% | 5.37% | 4.26% |
Expense ratio: Gross 2.22%, Net 1.40%1 (Investor Class) | | | Expense ratio: Gross 1.41%, Net 1.15%1 (Institutional Class) |
Performance data quoted represents past performance; past performance does not guarantee future results. The investment return and principal value of an investment will fluctuate so that an investor’s shares, when redeemed, may be worth more or less than their original cost. Current performance of the fund may be lower or higher than the performance quoted. Performance data current to the most recent month end may be obtained by visiting hennessyfunds.com. Performance for periods prior to October 26, 2012 is that of the FBR Core Bond Fund from March 12, 2010 to October 25, 2012 and that of the AFBA 5 Star Total Return Bond Fund prior to March 12, 2010. Investment performance reflects fee waivers in effect. In the absence of such waivers, total return would be reduced.
The expense ratios presented are from the most recent prospectus.
| 1 | The investment advisor has contractually agreed to waive a portion of its expenses through February 28, 2015. |
PERFORMANCE NARRATIVE
FINANCIAL COUNSELORS, INC., SUB-ADVISOR
Portfolio Managers Gary B. Cloud, CFA, and Peter G. Greig, CFA, Financial Counselors, Inc. (sub-advisor)
Over the previous twelve months, how did the Fund perform and what factors contributed to this performance?
For the twelve-month period ended October 31, 2013, the Investor Class of the Hennessy Core Bond Fund returned 0.41%, outperforming the Barclays Capital Intermediate U.S. Government/Credit Index and the Morningstar Intermediate Term Bond Category Average, which returned -0.03% and -0.40% for the same period, respectively.
A pro-cyclical asset allocation in the Fund helped performance relative to the benchmark due to an overweight position in Corporate bonds and an underweight position in U.S. Treasury securities. Higher yielding fixed income securities in the portfolio boosted the interest income component of total return, adding to performance. Fixed Income sector asset allocation and individual issue selection provided the biggest boost to relative returns for the Fund. The amortization and effective duration effect had the largest negative impact on Fund performance.
Additional Portfolio Manager commentary and related investment outlook:
Investors were caught off guard leading up to the more hawkish rhetoric from the Federal Reserve Board (Fed) and were whipsawed again when the Fed backtracked on tapering bond purchases in September. We believe the prospect of a government shutdown and potential debt default played into and will continue to factor in the Fed’s calculus on the timing of monetary policy direction.
The new year will witness a change of leadership at the Fed and a likely reduction in the size and scope of asset purchases. We hope the Fed learned some valuable lessons from its summer taper talk and will find a less disruptive communication strategy for policy initiatives over the near term.
HENNESSY FUNDS 1-800-966-4354
Looking forward, moderate economic growth, mild inflation and continued purchases by the Fed would be consistent with a range-bound Treasury market for the balance of the year and into early 2014. We are on guard for more upward pressure on interest rates later in 2014. Any decline below 2.50% should be used as an opportunity to shorten duration. We expect corporate credit to again prove favorable in the final quarter of the year and into 2014.
The Barclays Capital Intermediate U.S. Government/Credit Index is an unmanaged index commonly used to measure the performance of U.S. bonds. You cannot invest directly in an index. Performance data for an index does not reflect any deductions for fees, expenses or taxes. The Fund may invest in debt securities, which typically decrease in value when interest rates rise. The risk is greater for longer term debt securities. Investments by the Fund in lower-rated and non-rated securities presents a greater risk of loss to principal and interest than higher-rated securities. Investments in Asset-Backed and Mortgage-Backed securities include additional risks that investors should be aware of including credit risk, prepayment risk, possible illiquidity and default, as well as increased susceptibility to adverse economic developments. Investments in foreign securities may involve greater volatility and political, economic and currency risk and differences in accounting methods. The Fund may invest in IPOs, which may fluctuate considerably due to the absence of a prior public market and may have a magnified impact on the Fund. References to specific securities should not be considered a recommendation to buy or sell any security. Fund holdings and sector allocations are subject to change. Please refer to the Schedule of Investments included in this report for additional portfolio information.
Each Morningstar category average represents a universe of funds with similar investment objectives. © Morningstar, Inc. All Rights Reserved. The information contained herein: 1) is proprietary to Morningstar; 2) may not be copied or distributed and 3) is not warranted to be accurate, complete or timely. Neither Morningstar nor its content providers are responsible for any damages or losses arising from any use of this information. Past performance does not guarantee future results.
Hennessy Gas Utility Index Fund (GASFX)
CHANGE IN VALUE OF $10,000 INVESTMENT
This chart assumes an initial gross investment of $10,000 made on October 31, 2003. Returns shown for GASFX and the S&P 500 Index include the reinvestment of all dividends.1 The table and the graph do not reflect the deduction of taxes that a shareholder would pay on Fund distributions or the redemption of Fund shares.
AVERAGE ANNUAL TOTAL RETURN PERIODS ENDED OCTOBER 31, 2013
| | One Year | Five Years | Ten Years |
| Hennessy Gas Utility Index Fund (GASFX) | 21.70% | 17.45% | 12.94% |
AGA Stock Index1 | 22.58% | 16.46% | 12.02% |
| S&P 500 Index | 27.18% | 15.17% | 7.46% |
Expense ratio: 0.69%
Performance data quoted represents past performance; past performance does not guarantee future results. The investment return and principal value of an investment will fluctuate so that an investor’s shares, when redeemed, may be worth more or less than their original cost. Current performance of the Fund may be lower or higher than the performance quoted. Performance data current to the most recent month end may be obtained by visiting hennessyfunds.com. Performance for periods prior to October 26, 2012 is that of the FBR Gas Utility Index Fund.
The expense ratio presented is from the most recent prospectus.
| 1 | Source: American Gas Association. As calculated by the American Gas Association, the total return of the AGA Stock Index reflects the appreciation or depreciation of the stocks in the AGA Stock Index plus all dividends paid on such stocks, but does not assume that the dividends are reinvested and compounded. |
PERFORMANCE NARRATIVE
Portfolio Manager, Winsor H. Aylesworth, and Co-Portfolio Manager, Ryan Kelley
Over the previous twelve months, how did the Fund perform and what factors contributed to this performance?
For the twelve-month period ended October 31, 2013, the Hennessy Gas Utility Index Fund returned 21.70%, slightly underperforming the American Gas Association (AGA) Stock Index, which returned 22.58%, underperforming the S&P 500 Index, which returned 27.18%, but significantly outperforming the Morningstar Utilities Category Average, which returned 16.38%, for the same period.
Two of the Fund’s best performers for the twelve-month period were Cheniere Energy, Inc. and Equity Transfer Equity, L.P., which were up over 148.3% and 62.5%, respectively. Cheniere Energy, Inc. focuses on Liquid Natural Gas (LNG) and owns ports along the Gulf Coast that can receive and process imports and process and ship exports. It is the first company to be granted a license to export LNG and is currently building out the facilities to handle this export activity. Actual shipments should begin in early 2016. Energy Transfer Equity, L.P. is a Master Limited Partnership (MLP) that joined the AGA Stock Index as a result of its purchase of Southern Union last year. The firm specializes in the storage and transportation of natural gas. It too has been granted a license to export LNG and has benefited from the interest in this new demand driver for the industry. As an MLP, the company pays the bulk of its cash flow out in distributions to avoid paying taxes at the corporate level. This makes it particularly attractive to income-oriented investors. Both Cheniere Energy, Inc. and Energy Transfer Equity, L.P. were two of the Fund’s largest holdings for the twelve-month period and thus their individual success added greatly to the success of the Fund.
Two holdings that detracted from the Fund’s performance were Exelon Corp and Northwest Natural Gas, Inc., which returned -15.2% and -5.3%, respectively. Exelon Corp. is a large Chicago-based utility that serves Chicago, Philadelphia and Baltimore. The company has been hindered by its large exposure to nuclear power and its large merchant utility business, which suffers nationally from overcapacity. The firm anticipates doing better as the economy improves. Northwest Natural Gas, Inc. is a natural gas distributor, pipeline, and storage operator located in the Pacific Northwest. The company has been experiencing rate issues with regulators that have hampered the stock’s performance. We expect the stock to perform better once these rate issues are resolved.
Finally, there was one addition and one deletion to the AGA Stock Index this last twelve-month period. Iberdrola, S.A., a major Spanish utility, was added to the AGA Stock Index in July 2013, while Williams Companies, Inc., an integrated natural gas company, was removed in October 2013. To be included in the AGA Stock Index, a company must be publically traded on an American stock exchange and be a dues-paying member of the AGA.
Additional Portfolio Manager commentary and related investment outlook:
The goal should be for the Fund to match the returns of the AGA Stock Index minus the expenses of the Fund. For this twelve-month period, the Fund met that general expectation while trailing the broader market as represented by the S&P 500 Index. The Fund continued, however, to outperform its peer group of Utility funds as measured by Morningstar. The Fund continues to be the beneficiary of the evolution of the nation’s natural gas industry. Today, the United States, as per the Energy Information Agency has over a 100-year supply of natural gas, which has resulted in historically low and stable prices for this environmentally friendly energy source.
The overall outlook for the natural gas distribution industry, which is the emphasis of the Fund, continues to be strong as America continues to have ample supplies and stable prices fueling new demand initiatives.
Performance for the AGA Stock Index is provided by the American Gas Association. As calculated by the American Gas Association, the total return of the AGA Stock Index reflects the appreciation or depreciation of the stocks in the AGA Stock Index plus all dividends paid on such stocks, but does not assume that the dividends are reinvested and compounded.
The AGA Stock Index is a market capitalization-weighted index, adjusted monthly, consisting of member companies of the AGA. The S&P 500 Index is an unmanaged index commonly used to measure the performance of U.S. stocks. You cannot invest directly in an index. Performance data for an index does not reflect any deductions for fees, expenses or taxes. The Fund is non-diversified, meaning it concentrates its assets in fewer holdings than a diversified fund and is therefore more exposed to individual stock volatility than a diversified fund. Investments are focused in the natural gas distribution and transmission industry, which may be adversely affected by rising interest rates, weather, and the wholesale pricing of alternative fuels. Investments in foreign securities may involve greater volatility and political, economic and currency risk and differences in accounting methods. References to specific securities should not be considered a recommendation to buy or sell any security. Fund holdings and sector allocations are subject to change. Please refer to the Schedule of Investments included in this report for additional portfolio information.
Each Morningstar category average represents a universe of funds with similar investment objectives. © Morningstar, Inc. All Rights Reserved. The information contained herein: 1) is proprietary to Morningstar; 2) may not be copied or distributed and 3) is not warranted to be accurate, complete or timely. Neither Morningstar nor its content providers are responsible for any damages or losses arising from any use of this information. Past performance does not guarantee future results.
Cash Flow can be used as an indication of a company’s financial strength and represents earnings before depreciation, amortization, and non-cash charges.
HENNESSY FUNDS 1-800-966-4354
Hennessy Small Cap Financial Fund (HSFNX/HISFX)
CHANGE IN VALUE OF $10,000 INVESTMENT – INVESTOR CLASS (HSFNX)
This chart assumes an initial gross investment of $10,000 made on October 31, 2003. Returns shown include the reinvestment of all dividends. The table and the graph do not reflect the deduction of taxes that a shareholder would pay on Fund distributions or the redemption of Fund shares.
AVERAGE ANNUAL TOTAL RETURN PERIODS ENDED OCTOBER 31, 2013
| | One Year | Five Years | Ten Years |
| Hennessy Small Cap Financial Fund – Investor Class (HSFNX) | 30.80% | 11.90% | 5.81% |
Hennessy Small Cap Financial Fund – Institutional Class (HISFX)1 | 31.18% | 12.15% | 5.95% |
Russell 2000® Financial Services Index2 | 28.45% | 11.14% | 5.71% |
Russell 2000® Index | 36.28% | 17.04% | 9.03% |
| Expense ratio: 1.51% (Investor Class) | | | Expense ratio: 1.31% (Institutional Class) |
Performance data quoted represents past performance; past performance does not guarantee future results. The investment return and principal value of an investment will fluctuate so that an investor’s shares, when redeemed, may be worth more or less than their original cost. Current performance of the Fund may be lower or higher than the performance quoted. Performance data current to the most recent month end may be obtained by visiting hennessyfunds.com. Performance for periods prior to October 26, 2012 is that of the FBR Small Cap Financial Fund.
The expense ratios presented are from the most recent prospectus.
| 1 | Represents the performance of the Institutional Class shares after May 30, 2008 (inception of the share class) and Investor Class for periods prior to that date. |
| 2 | The Fund’s indices have changed. Previously, the Fund used the Russell 2000® Index as its primary index and the NASDAQ Bank Index as its secondary index. The Fund will now use the Russell 2000® Financial Services Index as its primary index and the Russell 2000® Index as its secondary index. The Fund changed its primary index to the Russell 2000® Financial Services Index because it more closely reflects the types of companies held in the Fund’s portfolio. The average annual total returns of the NASDAQ Bank Index for the one-year, five-year and ten-year periods ended October 31, 2013 were 32.96%, 3.84%, and 1.02%, respectively. |
PERFORMANCE NARRATIVE
Portfolio Manager, David H. Ellison, and Co-Portfolio Manager, Ryan Kelley
Over the previous twelve months, how did the Fund perform and what factors contributed to this performance?
For the twelve-month period ended October 31, 2013, the Investor Class of the Hennessy Small Cap Financial Fund returned 30.80%, outperforming the Russell 2000® Financial Services Index, which returned 28.45% for the same period, underperforming the Russell 2000® Index, which returned 36.28% for the same period, and slightly underperforming the Morningstar Financial Category Average, which returned 31.06% for the same period.
The Fund generally performed in line with its Morningstar category during the twelve-month period. Most of the positive performance of the Fund, and the financial services sector in general, was driven by a better overall national economy in general and more specifically by improved residential and commercial real estate markets.
Companies with the strongest performance contributions to the Fund during the twelve-month period were in the mortgage insurance, consumer debt recovery, and lending businesses. These include MGIC Investment Corp., Encore Capital Group, Inc., and CapitalSource, Inc. The Fund continues to hold all of these positions.
Companies detracting from the Fund’s performance the most during the twelve-month period were in the more traditional lending, mortgage servicing, and specialty finance businesses, and include HomeStreet, Inc., Walter Investment Management Corp., and PennyMac Mortgage Investment Trust. The Fund continues to hold all of these positions.
Additional Portfolio Manager commentary and related investment outlook:
We are now in the fourth year of recovery from the depths of the most recent recession and housing crash. The banking industry just completed another year of recovery as credit, capital, liquidity, and liability structures improved. During the last twelve months, housing has shown real signs of recovery as prices and purchases both increased noticeably. Headwinds do remain as regulatory compliance costs have increased, the demand for loans remains muted by historical standards and concerns about rising rates has tempered enthusiasm for financial companies.
We have positioned the Fund in companies that we believe are prepared to take advantage of further economic recovery. Small capitalization financial companies are focused on housing as it relates to demand, credit, and lending spreads. Our research shows that small banks obtain approximately 80% of their revenues from the lending margin on residential housing. Over the last four years, we have seen poor lending volumes and lending spreads under pressure as interest rates fell. This past year, however, we have started to see increased loan volumes and improved lending spreads on new mortgages as interest rates have increased. Any improvement in loan volumes and lending spreads will be meaningful to earnings growth going forward. Finally, industry consolidation activity has increased over the last six months. We expect this to become a factor in the Fund’s performance in the periods ahead.
We believe there is still much work to be done that will positively impact earnings for these financial companies going forward. Along with loan growth and improved spreads, there are cost containment, fee income growth, reduced credit costs, and valuation benefits from increased consolidation. We strive to position the Fund to give shareholders national exposure to the best opportunities in the small capitalization financial space with attention to earnings growth, earnings quality, and valuation discipline.
The Russell 2000® Financial Services Index is an unmanaged index commonly used to measure the performance of U.S. small-capitalization financial sector stocks. The Russell 2000® Index is an unmanaged index commonly used to measure the performance of U.S. small-capitalization stocks. The NASDAQ Bank Index is a capitalization-weighted index of domestic and foreign common stocks of banks that are traded on the NASDAQ National Market System. You cannot invest directly in an index. Performance data for an index does not reflect any deductions for fees, expenses or taxes. The Fund is non-diversified, meaning it concentrates its assets in fewer holdings than a diversified fund and is therefore more exposed to individual stock volatility than a diversified fund. The Fund invests in smaller-capitalization companies, which involves additional risks such as more limited liquidity and greater volatility than large-capitalization companies. Investors are focused in the financial services industry, which may be adversely affected by regulatory or other market conditions such as rising interest rates. References to specific securities should not be considered a recommendation to buy or sell any security. Fund holdings and sector allocations are subject to change. Please refer to the Schedule of Investments included in this report for additional portfolio information.
Each Morningstar category average represents a universe of funds with similar investment objectives. © Morningstar, Inc. All Rights Reserved. The information contained herein: 1) is proprietary to Morningstar; 2) may not be copied or distributed and 3) is not warranted to be accurate, complete or timely. Neither Morningstar nor its content providers are responsible for any damages or losses arising from any use of this information. Past performance does not guarantee future results.
Hennessy Large Cap Financial Fund (HLFNX)
CHANGE IN VALUE OF $10,000 INVESTMENT
This chart assumes an initial gross investment of $10,000 made on October 31, 2003. Returns shown include the reinvestment of all dividends. The table and the graph do not reflect the deduction of taxes that a shareholder would pay on Fund distributions or the redemption of Fund shares.
HENNESSY FUNDS 1-800-966-4354
AVERAGE ANNUAL TOTAL RETURN PERIODS ENDED OCTOBER 31, 2013
| | One Year | Five Years | Ten Years |
| Hennessy Large Cap Financial Fund (HLFNX) | 34.37% | 11.56% | 4.74% |
Russell 1000® Financial Services Index1 | 31.50% | 9.85% | 1.53% |
Russell 1000® Index1 | 28.40% | 15.84% | 7.83% |
Expense ratio: 1.57%
Performance data quoted represents past performance; past performance does not guarantee future results. The investment return and principal value of an investment will fluctuate so that an investor’s shares, when redeemed, may be worth more or less than their original cost. Current performance of the Fund may be lower or higher than the performance quoted. Performance data current to the most recent month end may be obtained by visiting hennessyfunds.com. Performance for periods prior to October 26, 2012 is that of the FBR Large Cap Financial Fund.
The expense ratio presented is that from the most recent prospectus.
| 1 | The Fund’s indices have changed. Previously, the Fund used the KBW Bank Index as its primary index and the S&P 500 Index as its secondary index. The Fund will now use the Russell 1000® Financial Services Index as its primary index and the Russell 1000® Index as its secondary index. The Fund changed its primary index to the Russell 1000® Financial Services Index because it more closely reflects the types of companies held in the Fund’s portfolio, and the Fund changed its secondary index to the Russell 1000® Index because it more closely reflects the asset size of the holdings of the Fund’s portfolio. The average annual total returns of the KBW Bank Index for the one-year, five-year and ten-year periods ended October 31, 2013 were 32.02%, 3.76%, and -1.12%, respectively. The average annual total returns of the S&P 500 Index for the one-year, five-year and ten-year periods ended October 31, 2013 were 27.18%, 15.17%, and 7.46%, respectively. |
PERFORMANCE NARRATIVE
Portfolio Manager: David H. Ellison, and Co-Portfolio Manager, Ryan Kelley
Over the previous twelve months, how did the Fund perform and what factors contributed to this performance?
For the twelve-month period ended October 31, 2013, the Hennessy Large Cap Financial Fund returned 34.37%, outperforming the Russell 1000® Financial Services Index, the Russell 1000® Index, and the Morningstar Financial Category Average, which returned 31.50%, 28.40%, and 31.06% for the same period, respectively.
The Fund remains concentrated in some of the largest capitalization financial companies, which has remained unchanged for the last eighteen months. These companies continue to see fundamental improvement as they work internally to grow earnings and earnings quality.
Companies with the strongest performance contributions to the Fund during the twelve month period were in the investment banking, asset management, and diversified banking businesses. These include Morgan Stanley, The Blackstone Group L.P., and Bank of America Corporation. The Fund continues to hold all of these positions.
Companies detracting from the Fund’s performance the most during the twelve-month period were in the payment processing, regional banking, and homebuilding businesses. These include Total Systems Services, Inc., M&T Bank Corporation, and Toll Brothers Inc. The Fund no longer holds these positions.
Additional Portfolio Manager commentary and related investment outlook:
Overall industry conditions improved during the period. The residential and commercial real estate markets, investment banking, securities trading, loan demand, commercial service and credit conditions all improved. Balance sheets also improved as companies continue to de-lever, de-complicate and de-risk.
We expect the ongoing improvements to continue as big balance sheets, cost structures, and revenue streams are rationalized. We believe the changes in the “big bank” model will be significant over the next three to five years. These changes are likely to impact the entire industry and eventually make it more stable. Ultimately, we expect book values and earnings streams to become more predictable.
Valuations of the large capitalization financials, as measured by price to book and price to earnings, remain below historical averages. We believe these valuations will recover as they work to get better internally across all business lines while the external economy heals and improves.
The Russell 1000® Financial Services Index is an unmanaged index commonly used to measure the performance of large-capitalization financial sector stocks. The Russell 1000® Index and the S&P 500 Index are unmanaged indices commonly used to measure the performance of U.S. stocks. The KBW Bank Index measures bank stock performance. You cannot invest directly in an index. Performance data for an index does not reflect any deductions for fees, expenses or taxes. The Fund is non-diversified, meaning it concentrates its assets in fewer holdings that a diversified fund and is therefore more exposed to individual stock volatility than a diversified fund. Investors are focused in the financial services industry, which may be adversely affected by regulatory or other market conditions such as rising interest rates. The Fund invests in small- and medium-capitalization companies, which involves additional risks such as more limited liquidity and greater volatility than large-capitalization companies. References to specific securities should not be considered a recommendation to buy or sell any security. Fund holdings and sector allocations are subject to change. Please refer to the Schedule of Investments included in this report for additional portfolio information.
Book value is the value at which a company carries an asset on its balance sheet. Price to book is a ratio used to compare a stock’s market value to its book value and is calculated by dividing the current closing price of such stock by the most recent quarter’s book value per share of such stock. Price to earnings is a ratio used to compare a stock’s market value to its per-share earnings and is
calculated by dividing the current closing price of such stock by the most recent quarter’s earnings per share of such stock. EPS, or Earnings per Share, is an indicator of a company’s profitability and is the portion of a company’s profit allocated to one share of its stock.
Each Morningstar category average represents a universe of funds with similar investment objectives. © Morningstar, Inc. All Rights Reserved. The information contained herein: 1) is proprietary to Morningstar; 2) may not be copied or distributed and 3) is not warranted to be accurate, complete or timely. Neither Morningstar nor its content providers are responsible for any damages or losses arising from any use of this information. Past performance does not guarantee future results.
Hennessy Technology Fund (HTECX/HTCIX)
CHANGE IN VALUE OF $10,000 INVESTMENT – INVESTOR CLASS (HTECX)
This chart assumes an initial gross investment of $10,000 made on October 31, 2003. Returns shown include the reinvestment of all dividends. The table and the graph do not reflect the deduction of taxes that a shareholder would pay on Fund distributions or the redemption of Fund shares.
AVERAGE ANNUAL TOTAL RETURN PERIODS ENDED OCTOBER 31, 2013
| | One Year | Five Years | Ten Years |
| Hennessy Technology Fund – Investor Class (HTECX) | 27.18% | 14.29% | 5.74% |
Hennessy Technology Fund – Institutional Class (HTCIX)1 | 27.49% | 14.47% | 5.82% |
| NASDAQ Composite Index | 33.43% | 19.27% | 8.32% |
| S&P 500 Index | 27.18% | 15.17% | 7.46% |
Expense ratio: Gross 3.21%, Net 1.96%2 (Investor Class) | | | Expense ratio: Gross 4.12%, Net 1.71%2 (Institutional Class) |
Performance data quoted represents past performance; past performance does not guarantee future results. The investment return and principal value of an investment will fluctuate so that an investor’s shares, when redeemed, may be worth more or less than their original cost. Current performance of the Fund may be lower or higher than the performance quoted. Performance data current to the most recent month end may be obtained by visiting hennessyfunds.com. Performance for periods prior to October 26, 2012 is that of the FBR Technology Fund. Investment performance reflects fee waivers in effect. In the absence of such waivers, total return would be reduced.
The expense ratios presented are from the most recent prospectus.
| 1 | Represents the performance of the Institutional Class shares after March 12, 2010 (inception of the share class) and Investor Class for periods prior to that date. |
| 2 | The investment advisor has contractually agreed to waive a portion of its expenses through February 28, 2015. |
PERFORMANCE NARRATIVE
Portfolio Managers Winsor H. Aylesworth and David H. Ellison
Over the previous twelve months, how did the Fund perform and what factors contributed to this performance?
For the twelve-month period ended October 31, 2013, the Investor Class of the Hennessy Technology Fund returned 27.18%, outperforming the S&P 500 Index, which returned 27.18%, but underperforming the NASDAQ Composite Index and the Morningstar Technology Category Average, which returned 33.43% and 31.16% for the same period, respectively.
The Fund had a generally good twelve-month period and matched its broad-based market benchmark, the S&P 500 Index. As the twelve-month period evolved, the market seemed to reward the smaller technology companies with histories of strong revenue and gross profit growth versus the large capitalization, more mature technology companies. As a result, long-time holdings in Apple Inc., Cisco Systems, Inc., Intel Corporation, Google Inc., and Oracle Corporation were eliminated and replaced with Technology companies that fit this profile of growth while maintaining the Fund’s conservative mantra of low debt and history of growing tangible book value.
HENNESSY FUNDS 1-800-966-4354
Most of the holdings of the Fund have had great returns over the last twelve months. This includes names in which we realized profits by selling out of the Fund’s holdings in such names completely. Two stocks still owned by the Fund that contributed significantly to performance are athenahealth, Inc. and 3D Systems Corp., which returned 109% and 118%, respectively, athenahealth, Inc. provides cloud-based services and health record software to the Healthcare industry. With the aging population and the emphasis on managing health care costs, this stock has been and is expected to be in the sweet spot for growth for the foreseeable future. 3D Systems Corp. develops and manufactures equipment for the 3D printing industry and specialty equipment for the healthcare industry. These are again areas where we expect growth to continue. Both of these holdings comprise between one and two percent of the Fund’s total assets.
Every portfolio has some holdings that underperform and do not meet investment expectations. We are always evaluating information to determine if we deem the underperformance to be just a “blip” or whether the stock should be eliminated from the Fund’s portfolio. Two stocks still owned by the Fund with respect to which we hope their recent performance is short-term in nature are LinkedIn Corporation and CommVault Systems, Inc., which returned -9% and -11% for the twelve-month period, respectively. The popular LinkedIn Corporation is an internet social media site that concentrates on business professionals. The stock appears expensive by most commonly used metrics and hence its stock appreciation may be attributed to just taking a pause while sales and profits catch up to the market valuation. CommVault Systems, Inc., as it name implies, is a data protection software company and facilitates cloud date storage systems. Again, like LinkedIn Corporation, the stock appears to be in a pause at it is currently deemed expensive by the market. LinkedIn Corporation currently comprise approximately 4.25% of the Fund’s portfolio, while CommVault Systems, Inc. currently comprises approximately 1.6% of the Fund’s portfolio.
Additional Portfolio Manager commentary and related investment outlook:
The Technology industry continuously entices investors, as it offers potential solutions to the problems of mankind and innovative products for the consumer. As the economy improves, revenues and profits for successful companies should grow along with a company’s tangible book value. As a result, stock prices should improve. We will continue to offer the Fund’s shareholders exposure to this segment following a consistent approach that emphasizes these metrics.
The NASDAQ Composite Index is a broad-based capitalization-weighted index of all the NASDAQ National Market and Small Cap stocks. The S&P 500 Index is an unmanaged index commonly used to measure the performance of U.S. stocks. You cannot invest directly in an index. Performance data for an index does not reflect any deductions for fees, expenses or taxes. The Fund is non-diversified, meaning it concentrates its assets in fewer holdings than a diversified fund and is therefore more exposed to individual stock volatility than a diversified fund. Investments are focused in the technology industry, which may be adversely affected by rapidly changing technology, availability of capital, R&D, government regulation and the relatively high risks of obsolescence caused by scientific and technological advances. Investments in foreign securities may involve greater volatility and political, economic and currency risk and differences in accounting methods. The Fund may invest in IPOs, which may fluctuate considerably due to the absence of a prior public market and may have a magnified impact on the Fund. The Fund invests in small- and medium-capitalization companies, which involves additional risks such as more limited liquidity and greater volatility than large-capitalization companies. References to specific securities should not be considered a recommendation to buy or sell any security. Fund holdings and sector allocations are subject to change. Please refer to the Schedule of Investments included in this report for additional portfolio information.
Each Morningstar category average represents a universe of funds with similar investment objectives. © Morningstar, Inc. All Rights Reserved. The information contained herein: 1) is proprietary to Morningstar; 2) may not be copied or distributed and 3) is not warranted to be accurate, complete or timely. Neither Morningstar nor its content providers are responsible for any damages or losses arising from any use of this information. Past performance does not guarantee future results.
Book Value is the value at which an asset is carried on a balance sheet.
Hennessy Japan Fund (HJPNX/HJPIX)
CHANGE IN VALUE OF $10,000 INVESTMENT – INVESTOR CLASS (HJPNX)
This chart assumes an initial gross investment of $10,000 made on October 31, 2003. Returns shown include the reinvestment of all dividends. The table and the graph do not reflect the deduction of taxes that a shareholder would pay on Fund distributions or the redemption of Fund shares.
AVERAGE ANNUAL TOTAL RETURN PERIODS ENDED OCTOBER 31, 2013
| | One Year | Five Years | Ten Years |
| Hennessy Japan Fund – Investor Class (HJPNX) | 27.87% | 15.27% | 8.06% |
| Hennessy Japan Fund – Institutional Class (HJPIX) | 28.19% | 15.50% | 8.24% |
Russell/Nomura Total MarketTM Index | 32.43% | 8.69% | 4.37% |
| Tokyo Price Index (TOPIX) | 33.14% | 8.85% | 4.28% |
| Expense ratio: 2.04% (Investor Class) | | | Expense ratio: 1.86% (Institutional Class) |
Performance data quoted represents past performance; past performance does not guarantee future results. The investment return and principal value of an investment will fluctuate so that an investor’s shares, when redeemed, may be worth more or less than their original cost. Current performance of the Fund may be lower or higher than the performance quoted. Performance data current to the most recent month end may be obtained by visiting hennessyfunds.com.
The expense ratios presented are from the most recent prospectus.
PERFORMANCE NARRATIVE
SPARX ASSET MANAGEMENT CO., LTD., SUB-ADVISOR
Portfolio Managers: Masakazu Takeda, CMA, and Yu Shimizu, CMA, SPARX Asset Management Co., Ltd. (sub-advisor)
Over the previous twelve months, how did the Fund perform and what factors contributed to this performance?
For the twelve-month period ended October 31, 2013, the Investor Class of the Hennessy Japan Fund returned 27.87%, underperforming the Russell/Nomura Total Market Index, the Tokyo Price Index (TOPIX), and the Morningstar Japan Category Average, which returned 32.43%, 33.14% and 31.87% for the same period, respectively.
The Fund’s performance lagged the broader market during the twelve-month period mainly due to underperformance in December 2012. The Japanese stock markets saw a strong rally on the back of mounting expectations for more aggressive anti-deflationary measures to be undertaken by the new cabinet following the general election in December 2012. The Yen weakened in anticipation of further quantitative easing by the Bank of Japan, which boosted heavy-weight exporters as well as companies in the interest rate sensitive sectors, such as property and banks, all contributing meaningfully to the benchmark indices.
The largest positive contributors to the Fund’s performance among the TOPIX 33 sub-industries were wholesalers, electronic appliance makers, and miscellaneous manufacturing firms. Conversely, there were no major sectors that performed negatively during the twelve-month period.
Among the strongest performing stocks during the twelve-month period were Ryohin Keikaku Co., Ltd., the operator of the “MUJI” brand retail chain, Keyence Corp., the nation’s leading supplier of factory automation related sensors, and Shimano Inc., the global leader in market share for bicycle parts. Shares of Ryohin Keikaku Co., Ltd. jumped over 85% following the positive release of its full year earnings results for fiscal 2012 fiscal, which ended in February 2013. Shares of Keyence Corp. climbed over 98% following robust quarterly earnings results. Finally, Shimano Inc. climbed over 74% due to the positive announcement of its full year earnings results for its 2012 fiscal year, which ended in January 2013, as well as the upward revision of its earnings forecast for fiscal 2013. The
HENNESSY FUNDS 1-800-966-4354
Fund continues to hold all of these positions. There were no major detractors that negatively affected the Fund’s performance during the twelve-month period.
Additional Portfolio Manager commentary and related investment outlook:
Going forward, we will continue to increase our exposure to companies with a distinct manufacturing edge, high-quality craftsmanship, or energy-efficient technologies that may benefit from growing demand from developing countries, such as China. We will also continue to favor general trading firms that span those technologies to the emerging nations.
The Russell/Nomura Total MarketTM Index contains the top 98% of all stocks listed on Japan’s stock exchange and registered on Japan’s OTC market in terms of market capitalization. The Tokyo Price Index (TOPIX) is a market capitalization-weighted index of all companies listed on the First Section of the Tokyo Stock Exchange. The Russell/Nomura Total Market and TOPIX indices are presented in U.S. dollar terms and take into account reinvestment of dividends. You cannot invest directly in an index. Performance data for an index does not reflect any deductions for fees, expenses or taxes. The Fund may invest in small- and medium-capitalization companies, which may have limited liquidity and greater price volatility than large-capitalization companies. Investments in foreign securities involve greater volatility and political, economic and currency risk and differences in accounting methods. The Fund may invest in IPOs, which may fluctuate considerably due to the absence of a prior public market and may have a magnified impact on the Fund. References to specific securities should not be considered a recommendation to buy or sell any security. Fund holdings and sector allocations are subject to change. Please refer to the Schedule of Investments included in this report for additional portfolio information.
Each Morningstar category average represents a universe of funds with similar investment objectives. © Morningstar, Inc. All Rights Reserved. The information contained herein: 1) is proprietary to Morningstar; 2) may not be copied or distributed and 3) is not warranted to be accurate, complete or timely. Neither Morningstar nor its content providers are responsible for any damages or losses arising from any use of this information. Past performance does not guarantee future results.
Hennessy Japan Small Cap Fund (HJPSX)
CHANGE IN VALUE OF $10,000 INVESTMENT
* Inception date
This chart assumes an initial gross investment of $10,000 made on August 31, 2007 (inception date of the Fund). Returns shown include the reinvestment of all dividends. The table and the graph do not reflect the deduction of taxes that a shareholder would pay on Fund distributions or the redemption of Fund shares.
AVERAGE ANNUAL TOTAL RETURN PERIODS ENDED OCTOBER 31, 2013
| | | | Since Inception |
| | One Year | Five Years | (8/31/07) |
| Hennessy Japan Small Cap Fund – Investor Class (HJPSX) | 40.59% | 17.81% | 7.59% |
Russell/Nomura Small CapTM Index | 30.87% | 12.63% | 3.91% |
| Tokyo Price Index (TOPIX) | 33.14% | 8.85% | -0.06% |
Expense ratio: 2.34%
Performance data quoted represents past performance; past performance does not guarantee future results. The investment return and principal value of an investment will fluctuate so that an investor’s shares, when redeemed, may be worth more or less than their original cost. Current performance of the Fund may be lower or higher than the performance quoted. Performance data current to the most recent month end may be obtained by visiting hennessyfunds.com.
The expense ratio presented is from the most recent prospectus.
PERFORMANCE NARRATIVE
SPARX ASSET MANAGEMENT CO., LTD., SUB-ADVISOR
Portfolio Managers Tadahiro Fujimura, CFA and CMA, and Hidehiro Moriya, SPARX Asset Management Co., Ltd. (sub-advisor)
Over the previous twelve months, how did the Fund perform and what factors contributed to this performance?
For the twelve-month period ended October 31, 2013, the Hennessy Japan Small Cap Fund returned 40.59%, significantly outperforming the Russell/Nomura Small Cap Index, the Tokyo Price Index (TOPIX), and the Morningstar Japan Category Average, which returned 30.87%, 33.14%, and 31.87% for the same period, respectively.
The largest positive contributors to the Fund’s performance among the TOPIX 33 sub-industries were electronic appliance makers, service industry firms, and machinery manufacturers. Conversely, there were no major sectors that performed negatively.
Among the strongest performing stocks were shares of Kenedix, Inc., a real estate investment asset manager, Obara Group Inc., a manufacturer of resistance welding machinery for use in welding lines at automakers, and IRISO Electronics Co., Ltd., which mainly manufactures pins and multiple-pin connectors. Shares of Kenedix, Inc. advanced over 389% on the back of an aggressive monetary easing policy by the Bank of Japan. Shares of Obara Group Inc. surged over 183% on the back of an increase in capital expenditures in the automobile industry and on optimism for the future recovery of the semiconductor industry. Finally, shares of IRISO Electronics Co., LTD. advanced over 249% due to an increase in pre-orders of a new game console equipped with its connectors, in addition to a continuous increase in sales of automotive connectors in the U.S. and Asia. The Fund no longer holds Kenedix, Inc. or Obara Group Inc., but does continue to hold IRISO Electronics Co., LTD.
Conversely, the major detractors from the Fund’s performance were FALTEC Co., Ltd., a manufacturer of automobile parts, Nippon Paper Industries Co., Ltd., and Tatsuta Electric Wire and Cable Co., Ltd., the leading manufacturer of electronics wires and cables. Shares of FALTEC Co., Ltd. fell -15%1 due to the slowdown of the Yen’s decline and the weak performance of export-related firms on the back of growing concerns about a slowdown in China. Shares of Nippon Paper Industries Co., Ltd.2 negatively affected performance while in the portfolio, as the recovery of the pulp and paper markets lagged expectations. Finally, shares of Tatsuta Electric Wire and Cable Co., Ltd. fell 13% on concerns that sales of Smartphones will stagnate globally. The Fund no longer holds Nippon Paper Industries Co., Ltd ., but does continue to hold FALTEC Co., Ltd. and Tatsuta Electric Wire and Cable Co., Ltd.
Additional Portfolio Manager commentary and related investment outlook:
We will continue to invest in companies that we expect to generate earnings growth, and we will focus on undervalued smaller-capitalization names that do not trade on Japan’s emerging stock markets, which are many. We also intend to look for laggards within the markets, such as capital investment related companies, including information technology companies.
| 1 | This figure is the stock’s return from March 19, 2013 to October 31, 2013, as FALTEC Co., Ltd. was relisted on the Tokyo Stock Exchange from March 19, 2013. |
| 2 | After the merger with Nippon Paper Group, Inc., Nippon Paper Industries Co., Ltd., was listed on the First Section of the Tokyo Stock Exchange as of April 1, 2013, while Nippon Paper Group, Inc., was delisted as of March 27, 2013. |
HENNESSY FUNDS 1-800-966-4354
The Russell/Nomura Small CapTM Index contains the bottom 15% of the Russell/Nomura Total Market Index, which contains the top 98% of all stocks listed on Japan’s stock exchange and registered on Japan’s OTC market in terms of market capitalization. The Tokyo Price Index (TOPIX) is a market capitalization-weighted index of all companies listed on the First Section of the Tokyo Stock Exchange. The Russell/Nomura Small Cap and TOPIX indices are presented in U.S. dollar terms and take into account reinvestment of dividends. You cannot invest directly in an index. Performance data for an index does not reflect any deductions for fees, expenses or taxes. The Fund invests in small- and medium-capitalization companies, which may have limited liquidity and greater price volatility than large-capitalization companies. Investments in foreign securities involve greater volatility and political, economic and currency risk and differences in accounting methods. References to specific securities should not be considered a recommendation to buy or sell any security. Fund holdings and sector allocations are subject to change. Please refer to the Schedule of Investments included in this report for additional portfolio information.
Each Morningstar category average represents a universe of funds with similar investment objectives. © Morningstar, Inc. All Rights Reserved. The information contained herein: 1) is proprietary to Morningstar; 2) may not be copied or distributed and 3) is not warranted to be accurate, complete or timely. Neither Morningstar nor its content providers are responsible for any damages or losses arising from any use of this information. Past performance does not guarantee future results.
(This Page Intentionally Left Blank.)
HENNESSY FUNDS 1-800-966-4354
Schedules of Investments
HENNESSY CORNERSTONE GROWTH FUND
As of October 31, 2013
(% of Net Assets)
| | TOP TEN EQUITY HOLDINGS | % net assets |
| | Delta Air Lines, Inc. | 3.15% |
| | Fifth & Pacific Companies, Inc. | 2.67% |
| | DXP Enterprises, Inc. | 2.63% |
| | Lithia Motors, Inc. | 2.54% |
| | Worthington Industries, Inc. | 2.41% |
| | Jarden Corp. | 2.39% |
| | Papa John’s International, Inc. | 2.36% |
| | American International Group, Inc. | 2.32% |
| | Avis Budget Group, Inc. | 2.27% |
| | Lennox International, Inc. | 2.26% |
Note: For presentation purposes, the Fund has grouped some of the industry categories. For purposes of categorizing securities for compliance with Section 8(b)(1) of the Investment Company Act of 1940, the Fund uses more specific industry classifications.
| | COMMON STOCKS – 95.71% | | Number | | | | | | % of | |
| | | | of Shares | | | Value | | | Net Assets | |
| | Consumer Discretionary – 30.02% | | | | | | | | | |
| | Brunswick Corp. | | | 117,200 | | | $ | 5,289,236 | | | | 2.14 | % |
| | Cabela’s, Inc. (a) | | | 88,300 | | | | 5,237,956 | | | | 2.12 | % |
| | DineEquity, Inc. | | | 56,500 | | | | 4,636,955 | | | | 1.88 | % |
| | Drew Industries, Inc. | | | 110,700 | | | | 5,563,782 | | | | 2.25 | % |
| | Fifth & Pacific Companies, Inc. (a) | | | 249,400 | | | | 6,606,606 | | | | 2.67 | % |
| | Jarden Corp. (a) | | | 106,500 | | | | 5,895,840 | | | | 2.39 | % |
| | Lithia Motors, Inc. | | | 99,800 | | | | 6,272,430 | | | | 2.54 | % |
| | Lowes Companies, Inc. | | | 108,800 | | | | 5,416,064 | | | | 2.19 | % |
| | Mohawk Industries, Inc. (a) | | | 39,500 | | | | 5,230,590 | | | | 2.12 | % |
| | Papa John’s International, Inc. | | | 77,200 | | | | 5,841,724 | | | | 2.36 | % |
| | Pier 1 Imports, Inc. | | | 189,300 | | | | 3,952,584 | | | | 1.60 | % |
| | PVH Corp. | | | 35,500 | | | | 4,422,235 | | | | 1.79 | % |
| | Service Corp International | | | 271,100 | | | | 4,882,511 | | | | 1.98 | % |
| | The Home Depot, Inc. | | | 63,100 | | | | 4,914,859 | | | | 1.99 | % |
| | | | | | | | | 74,163,372 | | | | 30.02 | % |
| | | | | | | | | | | | | | |
| | Energy – 2.13% | | | | | | | | | | | | |
| | Targa Resources Corp. | | | 67,900 | | | | 5,266,324 | | | | 2.13 | % |
| | | | | | | | | | | | | | |
| | Financials – 6.24% | | | | | | | | | | | | |
| | American International Group, Inc. | | | 111,100 | | | | 5,738,315 | | | | 2.32 | % |
| | Fidelity National Financial, Inc. – Class A | | | 164,800 | | | | 4,639,120 | | | | 1.88 | % |
| | Stewart Information Services Corp. | | | 161,100 | | | | 5,045,652 | | | | 2.04 | % |
| | | | | | | | | 15,423,087 | | | | 6.24 | % |
| | | | | | | | | | | | | | |
| | Health Care – 7.51% | | | | | | | | | | | | |
| | Brookdale Senior Living, Inc. (a) | | | 149,100 | | | | 4,037,628 | | | | 1.64 | % |
| | Catamaran Corp. (a)(b) | | | 79,400 | | | | 3,728,624 | | | | 1.51 | % |
| | CIGNA Corp. | | | 69,700 | | | | 5,365,506 | | | | 2.17 | % |
| | MWI Veterinary Supply, Inc. (a) | | | 34,100 | | | | 5,409,624 | | | | 2.19 | % |
| | | | | | | | | 18,541,382 | | | | 7.51 | % |
| | | | | | | | | | | | | | |
| | Industrials – 38.90% | | | | | | | | | | | | |
| | American Woodmark Corp. (a) | | | 134,200 | | | | 4,552,064 | | | | 1.84 | % |
| | Apogee Enterprises, Inc. | | | 170,237 | | | | 5,325,013 | | | | 2.15 | % |
| | Avis Budget Group, Inc. (a) | | | 178,700 | | | | 5,598,671 | | | | 2.27 | % |
| | Beacon Roofing Supply, Inc. (a) | | | 110,700 | | | | 3,842,397 | | | | 1.55 | % |
| | Carlisle Companies, Inc. | | | 62,700 | | | | 4,557,036 | | | | 1.84 | % |
| | Celadon Group, Inc. | | | 205,700 | | | | 3,813,678 | | | | 1.54 | % |
| | Delta Air Lines, Inc. | | | 294,800 | | | | 7,776,824 | | | | 3.15 | % |
| | DXP Enterprises, Inc. (a) | | | 70,600 | | | | 6,488,140 | | | | 2.63 | % |
| | Emcor Group, Inc. | | | 111,000 | | | | 4,113,660 | | | | 1.67 | % |
| | Hertz Global Holdings, Inc. (a) | | | 218,300 | | | | 5,012,168 | | | | 2.03 | % |
| | Innerworkings, Inc. (a) | | | 308,165 | | | | 2,949,139 | | | | 1.19 | % |
| | Lennox International, Inc. | | | 71,700 | | | | 5,596,902 | | | | 2.26 | % |
| | Steelcase, Inc. | | | 319,300 | | | | 5,233,327 | | | | 2.12 | % |
| | Team, Inc. (a) | | | 94,600 | | | | 3,527,634 | | | | 1.43 | % |
| | Terex Corp. (a) | | | 122,000 | | | | 4,263,900 | | | | 1.73 | % |
| | Toro Co. | | | 93,000 | | | | 5,481,420 | | | | 2.22 | % |
| | Trimas Corp. (a) | | | 136,800 | | | | 5,179,248 | | | | 2.10 | % |
| | UniFirst Corp. | | | 50,600 | | | | 5,202,692 | | | | 2.11 | % |
| | USG Corp. (a) | | | 139,900 | | | | 3,820,669 | | | | 1.55 | % |
| | Valmont Industries, Inc. | | | 26,800 | | | | 3,765,400 | | | | 1.52 | % |
| | | | | | | | | 96,099,982 | | | | 38.90 | % |
| | | | | | | | | | | | | | |
| | Materials – 10.91% | | | | | | | | | | | | |
| | A Schulman, Inc. | | | 132,600 | | | | 4,391,712 | | | | 1.78 | % |
| | Avery Dennison Corp. | | | 106,600 | | | | 5,022,992 | | | | 2.03 | % |
| | Axiall Corp. | | | 71,600 | | | | 2,784,524 | | | | 1.13 | % |
| | Innospec, Inc. | | | 103,500 | | | | 4,767,210 | | | | 1.93 | % |
| | Stepan Co. | | | 68,300 | | | | 4,020,821 | | | | 1.63 | % |
| | Worthington Industries, Inc. | | | 146,900 | | | | 5,955,326 | | | | 2.41 | % |
| | | | | | | | | 26,942,585 | | | | 10.91 | % |
| | Total Common Stocks | | | | | | | | | | | | |
| | (Cost $191,744,801) | | | | | | | 236,436,732 | | | | 95.71 | % |
| | | | | | | | | | | | | | |
| | RIGHTS – 0.00% | | | | | | | | | | | | |
| | Forest Laboratories, Inc. (a)(c) | | | 5,500 | | | | 5,225 | | | | 0.00 | % |
| | | | | | | | | | | | | | |
| | Total Rights | | | | | | | | | | | | |
| | (Cost $0) | | | | | | | 5,225 | | | | 0.00 | % |
| | | | | | | | | | | | | | |
| | PARTNERSHIPS – 3.39% | | | | | | | | | | | | |
| | | | | | | | | | | | | | |
| | Energy – 3.39% | | | | | | | | | | | | |
| | Calumet Specialty Products Partners LP | | | 117,800 | | | | 3,511,618 | | | | 1.42 | % |
| | Genesis Energy LP | | | 95,500 | | | | 4,866,680 | | | | 1.97 | % |
| | | | | | | | | | | | | | |
| | Total Partnerships | | | | | | | | | | | | |
| | (Cost $7,596,453) | | | | | | | 8,378,298 | | | | 3.39 | % |
The accompanying notes are an integral part of these financial statements.
HENNESSY FUNDS 1-800-966-4354
| | SHORT-TERM INVESTMENTS – 0.98% | | Number | | | | | | % of | |
| | | | of Shares | | | Value | | | Net Assets | |
| | Money Market Funds – 0.98% | | | | | | | | | |
| | Fidelity Government Portfolio – | | | | | | | | | |
| | Institutional Class, 0.01% (d) | | | 2,428,560 | | | $ | 2,428,560 | | | | 0.98 | % |
| | | | | | | | | | | | | | |
| | Total Money Market Funds | | | | | | | | | | | | |
| | (Cost $2,428,560) | | | | | | | 2,428,560 | | | | 0.98 | % |
| | | | | | | | | | | | | | |
| | Total Short-Term Investments | | | | | | | | | | | | |
| | (Cost $2,428,560) | | | | | | | 2,428,560 | | | | 0.98 | % |
| | | | | | | | | | | | | | |
| | Total Investments | | | | | | | | | | | | |
| | (Cost $201,769,814) – 100.08% | | | | | | | 247,248,815 | | | | 100.08 | % |
| | | | | | | | | | | | | | |
| | Liabilities in Excess of | | | | | | | | | | | | |
| | Other Assets – (0.08)% | | | | | | | (192,505 | ) | | | (0.08 | )% |
| | TOTAL NET ASSETS – 100.00% | | | | | | $ | 247,056,310 | | | | 100.00 | % |
Percentages are stated as a percent of net assets.
| (a) | Non-income producing security. |
| (b) | U.S. traded security of a foreign corporation. |
| (c) | Security is fair valued in good faith. |
| (d) | The rate listed is the fund’s 7-day yield as of October 31, 2013. |
The accompanying notes are an integral part of these financial statements.
Summary of Fair Value Exposure at October 31, 2013
The following is a summary of the inputs used to value the Fund’s net assets as of October 31, 2013 (See Note 3 in the accompanying notes to the financial statements):
| Common Stock | | Level 1 | | | Level 2 | | | Level 3 | | | Total | |
| Consumer Discretionary | | $ | 74,163,372 | | | $ | — | | | $ | — | | | $ | 74,163,372 | |
| Energy | | | 5,266,324 | | | | — | | | | — | | | | 5,266,324 | |
| Financials | | | 15,423,087 | | | | — | | | | — | | | | 15,423,087 | |
| Health Care | | | 18,541,382 | | | | — | | | | — | | | | 18,541,382 | |
| Industrials | | | 96,099,982 | | | | — | | | | — | | | | 96,099,982 | |
| Materials | | | 26,942,585 | | | | — | | | | — | | | | 26,942,585 | |
| Total Common Stock | | $ | 236,436,732 | | | $ | — | | | $ | — | | | $ | 236,436,732 | |
Rights | | $ | — | | | $ | — | | | $ | 5,225 | * | | $ | 5,225 | |
Partnerships | | | | | | | | | | | | | | | | |
| Energy | | $ | 8,378,298 | | | $ | — | | | $ | — | | | $ | 8,378,298 | |
| Total Partnerships | | $ | 8,378,298 | | | $ | — | | | $ | — | | | $ | 8,378,298 | |
Short-Term Investments | | | | | | | | | | | | | | | | |
| Money Market Funds | | $ | 2,428,560 | | | $ | — | | | $ | — | | | $ | 2,428,560 | |
| Total Short-Term Investments | | $ | 2,428,560 | | | $ | — | | | $ | — | | | $ | 2,428,560 | |
| Total Investments | | $ | 247,243,590 | | | $ | — | | | $ | 5,225 | | | $ | 247,248,815 | |
Transfers between levels are recognized at the end of the reporting period. During the one-year period ended October 31, 2013, the Fund recognized no transfers between levels.
Level 3 Reconciliation Disclosure
Following is a reconciliation of level 3 assets for which significant unobservable inputs were used to determine fair value.
| | | Common Stock | | |
| Balance as of October 31, 2012 | | $ | 5,225 | | |
| Accrued discounts/premiums | | | — | | |
| Realized gain (loss) | | | — | | |
| Change in unrealized appreciation (depreciation) | | | — | | |
| Purchases | | | — | | |
| (Sales) | | | — | | |
| Transfer in and/or out of Level 3 | | | — | | |
| Balance as of October 31, 2013 | | $ | 5,225 | | |
| Net in unrealized appreciation/depreciation during | | | | | |
| the year for level 3 investments held at October 31, 2013 | | $ | 5,225 | | |
* Acquired in merger.
The accompanying notes are an integral part of these financial statements.
HENNESSY FUNDS 1-800-966-4354
HENNESSY FOCUS FUND
As of October 31, 2013
(% of Net Assets)
| | TOP TEN EQUITY HOLDINGS | % net assets |
| | American Tower Corp., Class A | 7.75% |
| | Markel Corp. | 7.39% |
| | O’Reilly Automotive, Inc. | 7.23% |
| | CarMax, Inc. | 6.55% |
| | Bally Technologies, Inc. | 6.47% |
| | Penn National Gaming, Inc. | 6.18% |
| | Google, Inc., Class A | 5.39% |
| | Aon PLC | 5.10% |
| | Twenty First Century Fox, Inc. | 4.67% |
| | The Charles Schwab Corp. | 4.03% |
Note: For presentation purposes, the Fund has grouped some of the industry categories. For purposes of categorizing securities for compliance with Section 8(b)(1) of the Investment Company Act of 1940, the Fund uses more specific industry classifications.
| | COMMON STOCKS – 80.87% | | Number | | | | | | % of | |
| | | | of Shares | | | Value | | | Net Assets | |
| | Consumer Discretionary – 35.42% | | | | | | | | | |
| | Bally Technologies, Inc. (a) | | | 1,169,000 | | | $ | 85,500,660 | | | | 6.47 | % |
| | CarMax, Inc. (a) | | | 1,840,088 | | | | 86,465,735 | | | | 6.55 | % |
| | Dick’s Sporting Goods, Inc. | | | 815,767 | | | | 43,406,962 | | | | 3.29 | % |
| | News Corp (a) | | | 769,326 | | | | 13,540,138 | | | | 1.03 | % |
| | O’Reilly Automotive, Inc. (a) | | | 770,500 | | | | 95,395,605 | | | | 7.23 | % |
| | Penn National Gaming, Inc. (a) | | | 1,393,670 | | | | 81,543,632 | | | | 6.18 | % |
| | Twenty First Century Fox, Inc. | | | 1,807,204 | | | | 61,589,512 | | | | 4.67 | % |
| | | | | | | | | 467,442,244 | | | | 35.42 | % |
| | | | | | | | | | | | | | |
| | Energy – 3.23% | | | | | | | | | | | | |
| | World Fuel Services Corp. | | | 1,118,204 | | | | 42,659,482 | | | | 3.23 | % |
| | | | | | | | | | | | | | |
| | Financials – 24.99% | | | | | | | | | | | | |
| | Aon PLC (b) | | | 851,000 | | | | 67,305,590 | | | | 5.10 | % |
| | Diamond Hill Investment Group, Inc. | | | 83,945 | | | | 9,256,615 | | | | 0.70 | % |
| | Encore Capital Group, Inc. (a) | | | 1,000,000 | | | | 48,850,000 | | | | 3.70 | % |
| | Markel Corp. (a) | | | 184,237 | | | | 97,584,812 | | | | 7.39 | % |
| | Marlin Business Services Corp. | | | 493,638 | | | | 13,609,600 | | | | 1.03 | % |
| | T. Rowe Price Group, Inc. | | | 517,900 | | | | 40,090,639 | | | | 3.04 | % |
| | The Charles Schwab Corp. | | | 2,346,699 | | | | 53,152,732 | | | | 4.03 | % |
| | | | | | | | | 329,849,988 | | | | 24.99 | % |
| | | | | | | | | | | | | | |
| | Health Care – 1.53% | | | | | | | | | | | | |
| | Henry Schein, Inc. (a) | | | 180,000 | | | | 20,237,400 | | | | 1.53 | % |
| �� | | | | | | | | | | | | | |
| | Industrials – 6.73% | | | | | | | | | | | | |
| | American Woodmark Corp. (a) | | | 798,561 | | | | 27,087,189 | | | | 2.05 | % |
| | Roadrunner Transportation | | | | | | | | | | | | |
| | Systems, Inc. (a) | | | 904,200 | | | | 23,961,300 | | | | 1.82 | % |
| | Simpson Manufacturing Company, Inc. | | | 850,000 | | | | 30,132,500 | | | | 2.28 | % |
| | UTi Worldwide, Inc. (b) | | | 500,000 | | | | 7,600,000 | | | | 0.58 | % |
| | | | | | | | | 88,780,989 | | | | 6.73 | % |
| | | | | | | | | | | | | | |
| | Information Technology – 8.97% | | | | | | | | | | | | |
| | Google, Inc., Class A (a) | | | 68,984 | | | | 71,093,531 | | | | 5.39 | % |
| | MICROS Systems, Inc. (a) | | | 871,148 | | | | 47,259,779 | | | | 3.58 | % |
| | | | | | | | | 118,353,310 | | | | 8.97 | % |
| | Total Common Stocks | | | | | | | | | | | | |
| | (Cost $545,373,369) | | | | | | | 1,067,323,413 | | | | 80.87 | % |
| | | | | | | | | | | | | | |
| | REITS – 7.75% | | | | | | | | | | | | |
| | | | | | | | | | | | | | |
| | Financials – 7.75% | | | | | | | | | | | | |
| | American Tower Corp., Class A | | | 1,288,679 | | | | 102,256,678 | | | | 7.75 | % |
| | | | | | | | | | | | | | |
| | Total REITS | | | | | | | | | | | | |
| | (Cost $23,000,882) | | | | | | | 102,256,678 | | | | 7.75 | % |
| | | | | | | | | | | | | | |
| | SHORT-TERM INVESTMENTS – 11.22% | | | | | | | | | | |
| | | | | | | | | | | |
| | Money Market Funds – 11.22% | | | | | | | | | | | | |
| | Federated Government Obligations | | | | | | | | | | | | |
| | Fund – Class I, 0.010% (c) | | | 66,000,000 | | | | 66,000,000 | | | | 5.00 | % |
| | Federated Treasury Obligations | | | | | | | | | | | | |
| | Fund, 0.010% (c) | | | 16,078,278 | | | | 16,078,278 | | | | 1.22 | % |
| | Fidelity Government Portfolio – | | | | | | | | | | | | |
| | Institutional Class, 0.010% (c) | | | 66,000,000 | | | | 66,000,000 | | | | 5.00 | % |
| | | | | | | | | | | | | | |
| | Total Money Market Funds | | | | | | | | | | | | |
| | (Cost $148,078,278) | | | | | | | 148,078,278 | | | | 11.22 | % |
| | | | | | | | | | | | | | |
| | Total Short-Term Investments | | | | | | | | | | | | |
| | (Cost $148,078,278) | | | | | | | 148,078,278 | | | | 11.22 | % |
| | | | | | | | | | | | | | |
| | Total Investments | | | | | | | | | | | | |
| | (Cost $716,452,529) – 99.84% | | | | | | | 1,317,658,369 | | | | 99.84 | % |
| | | | | | | | | | | | | | |
| | Other Assets in Excess | | | | | | | | | | | | |
| | of Liabilities – 0.16% | | | | | | | 2,079,358 | | | | 0.16 | % |
| | TOTAL NET ASSETS – 100.00% | | | | | | $ | 1,319,737,727 | | | | 100.00 | % |
Percentages are stated as a percent of net assets.
| (a) | Non-income producing security. |
| (b) | U.S. traded security of a foreign corporation. |
| (c) | The rate listed is the fund’s 7-day yield as of October 31, 2013. |
The accompanying notes are an integral part of these financial statements.
HENNESSY FUNDS 1-800-966-4354
Summary of Fair Value Exposure at October 31, 2013
The following is a summary of the inputs used to value the Fund’s net assets as of October 31, 2013 (See Note 3 in the accompanying notes to the financial statements):
| Common Stock | | Level 1 | | | Level 2 | | | Level 3 | | | Total | |
| Consumer Discretionary | | $ | 467,442,244 | | | $ | — | | | $ | — | | | $ | 467,442,244 | |
| Energy | | | 42,659,482 | | | | — | | | | — | | | | 42,659,482 | |
| Financials | | | 329,849,988 | | | | — | | | | — | | | | 329,849,988 | |
| Health Care | | | 20,237,400 | | | | — | | | | — | | | | 20,237,400 | |
| Industrials | | | 88,780,989 | | | | — | | | | — | | | | 88,780,989 | |
| Information Technology | | | 118,353,310 | | | | — | | | | — | | | | 118,353,310 | |
| Total Common Stock | | $ | 1,067,323,413 | | | $ | — | | | $ | — | | | $ | 1,067,323,413 | |
REITS | | | | | | | | | | | | | | | | |
| Financials | | $ | 102,256,678 | | | $ | — | | | $ | — | | | $ | 102,256,678 | |
Short-Term Investments | | | | | | | | | | | | | | | | |
| Money Market Funds | | $ | 148,078,278 | | | $ | — | | | $ | — | | | $ | 148,078,278 | |
| Total Short-Term Investments | | $ | 148,078,278 | | | $ | — | | | $ | — | | | $ | 148,078,278 | |
| Total Investments | | $ | 1,317,658,369 | | | $ | — | | | $ | — | | | $ | 1,317,658,369 | |
Transfers between levels are recognized at the end of the reporting period. During the one-year period ended October 31, 2013, the Fund recognized no transfers between levels.
The accompanying notes are an integral part of these financial statements.
HENNESSY CORNERSTONE MID CAP 30 FUND
As of October 31, 2013
(% of Net Assets)
| | TOP TEN EQUITY HOLDINGS | % net assets |
| | Sunpower Corp. | 3.71% |
| | Flowers Foods, Inc. | 3.61% |
| | Brunswick Corp. | 3.55% |
| | Genworth Financial, Inc. | 3.50% |
| | Avis Budget Group, Inc. | 3.49% |
| | Alliant Techsystems, Inc. | 3.46% |
| | Alaska Air Group, Inc. | 3.44% |
| | Swift Transportation Co. | 3.44% |
| | ITT Corp. | 3.42% |
| | Universal Health Services, Inc. | 3.39% |
Note: For presentation purposes, the Fund has grouped some of the industry categories. For purposes of categorizing securities for compliance with Section 8(b)(1) of the Investment Company Act of 1940, the Fund uses more specific industry classifications.
HENNESSY FUNDS 1-800-966-4354
| | COMMON STOCKS – 96.77% | | Number | | | | | | % of | |
| | | | of Shares | | | Value | | | Net Assets | |
| | Consumer Discretionary – 34.79% | | | | | | | | | |
| | American Axle & Manufacturing | | | | | | | | | |
| | Holdings, Inc. (a) | | | 329,300 | | | $ | 6,128,273 | | | | 2.91 | % |
| | Brunswick Corp. | | | 165,900 | | | | 7,487,067 | | | | 3.55 | % |
| | Cracker Barrel Old Country Store, Inc. | | | 63,400 | | | | 6,965,758 | | | | 3.31 | % |
| | Hanesbrands, Inc. | | | 104,300 | | | | 7,104,916 | | | | 3.37 | % |
| | Lear Corp. | | | 91,100 | | | | 7,050,229 | | | | 3.35 | % |
| | Lithia Motors, Inc. | | | 91,400 | | | | 5,744,490 | | | | 2.73 | % |
| | Skechers USA, Inc. (a) | | | 217,200 | | | | 6,329,208 | | | | 3.01 | % |
| | Tenneco, Inc. (a) | | | 129,800 | | | | 6,888,486 | | | | 3.27 | % |
| | The Goodyear Tire & Rubber Co. | | | 291,600 | | | | 6,117,768 | | | | 2.90 | % |
| | Visteon Corp. (a) | | | 86,900 | | | | 6,699,121 | | | | 3.18 | % |
| | Wendy’s Co. | | | 778,000 | | | | 6,760,820 | | | | 3.21 | % |
| | | | | | | | | 73,276,136 | | | | 34.79 | % |
| | | | | | | | | | | | | | |
| | Consumer Staples – 9.61% | | | | | | | | | | | | |
| | Flowers Foods, Inc. | | | 300,300 | | | | 7,609,602 | | | | 3.61 | % |
| | Pilgrim’s Pride Corp. (a) | | | 392,200 | | | | 5,557,474 | | | | 2.64 | % |
| | Safeway, Inc. | | | 202,500 | | | | 7,067,250 | | | | 3.36 | % |
| | | | | | | | | 20,234,326 | | | | 9.61 | % |
| | | | | | | | | | | | | | |
| | Financials – 9.59% | | | | | | | | | | | | |
| | American Equity Investment | | | | | | | | | | | | |
| | Life Holding Co. | | | 310,400 | | | | 6,468,736 | | | | 3.07 | % |
| | AmTrust Financial Services, Inc. | | | 166,100 | | | | 6,371,596 | | | | 3.02 | % |
| | Genworth Financial, Inc. (a) | | | 507,300 | | | | 7,371,069 | | | | 3.50 | % |
| | | | | | | | | 20,211,401 | | | | 9.59 | % |
| | | | | | | | | | | | | | |
| | Health Care – 6.53% | | | | | | | | | | | | |
| | Omnicare, Inc. | | | 119,700 | | | | 6,601,455 | | | | 3.14 | % |
| | Universal Health Services, Inc. | | | 88,700 | | | | 7,145,672 | | | | 3.39 | % |
| | | | | | | | | 13,747,127 | | | | 6.53 | % |
| | | | | | | | | | | | | | |
| | Industrials – 26.69% | | | | | | | | | | | | |
| | Alaska Air Group, Inc. | | | 102,600 | | | | 7,249,716 | | | | 3.44 | % |
| | Alliant Techsystems, Inc. | | | 67,000 | | | | 7,294,290 | | | | 3.46 | % |
| | Avis Budget Group, Inc. (a) | | | 235,000 | | | | 7,362,550 | | | | 3.49 | % |
| | Huntington Ingalls Industries, Inc. | | | 97,700 | | | | 6,990,435 | | | | 3.32 | % |
| | ITT Corp. | | | 181,100 | | | | 7,195,103 | | | | 3.42 | % |
| | Oshkosh Corp. | | | 135,500 | | | | 6,448,445 | | | | 3.06 | % |
| | Swift Transportation Co. (a) | | | 332,100 | | | | 7,236,459 | | | | 3.44 | % |
| | URS Corp. | | | 118,900 | | | | 6,446,758 | | | | 3.06 | % |
| | | | | | | | | 56,223,756 | | | | 26.69 | % |
| | | | | | | | | | | | | | |
| | Information Technology – 9.56% | | | | | | | | | | | | |
| | Ciena Corp. (a) | | | 260,500 | | | | 6,061,836 | | | | 2.88 | % |
| | Computer Sciences Corp. | | | 127,200 | | | | 6,265,872 | | | | 2.97 | % |
| | Sunpower Corp. (a) | | | 258,900 | | | | 7,816,191 | | | | 3.71 | % |
| | | | | | | | | 20,143,899 | | | | 9.56 | % |
| | | | | | | | | | | | | | |
| | Total Common Stocks | | | | | | | | | | | | |
| | (Cost $196,394,296) | | | | | | | 203,836,645 | | | | 96.77 | % |
| | | | | | | | | | | | |
| | SHORT-TERM INVESTMENTS – 3.28% | | | | | | | | | | |
| | | | | | | | | | | |
| | Money Market Funds – 3.28% | | | | | | | | | | | | |
| | Fidelity Government Portfolio – | | | | | | | | | | | | |
| | Institutional Class, 0.01% (b) | | | 6,908,010 | | | | 6,908,010 | | | | 3.28 | % |
| | | | | | | | | | | | | | |
| | Total Money Market Funds | | | | | | | | | | | | |
| | (Cost $6,908,010) | | | | | | | 6,908,010 | | | | 3.28 | % |
| | | | | | | | | | | | | | |
| | Total Short-Term Investments | | | | | | | | | | | | |
| | (Cost $6,908,010) | | | | | | | 6,908,010 | | | | 3.28 | % |
| | | | | | | | | | | | | | |
| | Total Investments | | | | | | | | | | | | |
| | (Cost $203,302,306) – 100.05% | | | | | | | 210,744,655 | | | | 100.05 | % |
| | | | | | | | | | | | | | |
| | Liabilities in Excess | | | | | | | | | | | | |
| | of Other Assets – (0.05)% | | | | | | | (109,608 | ) | | | (0.05 | )% |
| | TOTAL NET ASSETS – 100.00% | | | | | | $ | 210,635,047 | | | | 100.00 | % |
Percentages are stated as a percent of net assets.
| (a) | Non-income producing security. |
| (b) | The rate listed is the fund’s 7-day yield as of October 31, 2013. |
The accompanying notes are an integral part of these financial statements.
Summary of Fair Value Exposure at October 31, 2013
The following is a summary of the inputs used to value the Fund’s net assets as of October 31, 2013 (See Note 3 in the accompanying notes to the financial statements):
| Common Stock | | Level 1 | | | Level 2 | | | Level 3 | | | Total | |
| Consumer Discretionary | | $ | 73,276,136 | | | $ | — | | | $ | — | | | $ | 73,276,136 | |
| Consumer Staples | | | 20,234,326 | | | | — | | | | — | | | | 20,234,326 | |
| Financials | | | 20,211,401 | | | | — | | | | — | | | | 20,211,401 | |
| Health Care | | | 13,747,127 | | | | — | | | | — | | | | 13,747,127 | |
| Industrials | | | 56,223,756 | | | | — | | | | — | | | | 56,223,756 | |
| Information Technology | | | 20,143,899 | | | | — | | | | — | | | | 20,143,899 | |
| Total Common Stock | | $ | 203,836,645 | | | $ | — | | | $ | — | | | $ | 203,836,645 | |
Short-Term Investments | | | | | | | | | | | | | | | | |
| Money Market Funds | | $ | 6,908,010 | | | $ | — | | | $ | — | | | $ | 6,908,010 | |
| Total Short-Term Investments | | $ | 6,908,010 | | | $ | — | | | $ | — | | | $ | 6,908,010 | |
| Total Investments | | $ | 210,744,655 | | | $ | — | | | $ | — | | | $ | 210,744,655 | |
Transfers between levels are recognized at the end of the reporting period. During the one-year period ended October 31, 2013, the Fund recognized no transfers between levels.
The accompanying notes are an integral part of these financial statements.
HENNESSY FUNDS 1-800-966-4354
HENNESSY CORNERSTONE LARGE GROWTH FUND
As of October 31, 2013
(% of Net Assets)
| | TOP TEN EQUITY HOLDINGS | % net assets |
| | Delta Air Lines, Inc. | 3.62% |
| | Western Digital Corp. | 2.85% |
| | The Boeing Co. | 2.72% |
| | Kroger Co. | 2.52% |
| | Halliburton Co. | 2.45% |
| | Viacom, Inc. | 2.42% |
| | HCA Holdings, Inc. | 2.37% |
| | Dollar Tree, Inc. | 2.33% |
| | Lockheed Martin Corp. | 2.30% |
| | Raytheon Co. | 2.22% |
Note: For presentation purposes, the Fund has grouped some of the industry categories. For purposes of categorizing securities for compliance with Section 8(b)(1) of the Investment Company Act of 1940, the Fund uses more specific industry classifications.
| | COMMON STOCKS – 98.71% | | Number | | | | | | % of | |
| | | | of Shares | | | Value | | | Net Assets | |
| | Consumer Discretionary – 21.60% | | | | | | | | | |
| | Advance Auto Parts, Inc. | | | 22,300 | | | $ | 2,211,714 | | | | 2.11 | % |
| | Autozone, Inc. (a) | | | 4,500 | | | | 1,956,105 | | | | 1.86 | % |
| | Bed Bath & Beyond, Inc. (a) | | | 27,900 | | | | 2,157,228 | | | | 2.06 | % |
| | DIRECTV (a) | | | 32,500 | | | | 2,030,925 | | | | 1.93 | % |
| | Dollar Tree, Inc. (a) | | | 41,800 | | | | 2,441,120 | | | | 2.33 | % |
| | Family Dollar Stores, Inc. | | | 24,700 | | | | 1,701,336 | | | | 1.62 | % |
| | Foot Locker, Inc. | | | 49,900 | | | | 1,731,530 | | | | 1.65 | % |
| | Kohl’s Corp. | | | 37,000 | | | | 2,101,600 | | | | 2.00 | % |
| | Nordstrom, Inc. | | | 31,200 | | | | 1,886,664 | | | | 1.80 | % |
| | The Gap, Inc. | | | 51,600 | | | | 1,908,684 | | | | 1.82 | % |
| | Viacom, Inc. | | | 30,500 | | | | 2,540,345 | | | | 2.42 | % |
| | | | | | | | | 22,667,251 | | | | 21.60 | % |
| | | | | | | | | | | | | | |
| | Consumer Staples – 6.01% | | | | | | | | | | | | |
| | Campbell Soup Co. | | | 45,400 | | | | 1,932,678 | | | | 1.84 | % |
| | Dr. Pepper Snapple Group, Inc. | | | 36,600 | | | | 1,733,010 | | | | 1.65 | % |
| | Kroger Co. | | | 61,700 | | | | 2,643,228 | | | | 2.52 | % |
| | | | | | | | | 6,308,916 | | | | 6.01 | % |
| | | | | | | | | | | | | | |
| | Energy – 15.10% | | | | | | | | | | | | |
| | Chevron Corp. | | | 15,100 | | | | 1,811,396 | | | | 1.73 | % |
| | ConocoPhillips | | | 28,100 | | | | 2,059,730 | | | | 1.96 | % |
| | Exxon Mobil Corp. | | | 18,300 | | | | 1,640,046 | | | | 1.56 | % |
| | Halliburton Co. | | | 48,500 | | | | 2,571,955 | | | | 2.45 | % |
| | Helmerich & Payne, Inc. | | | 30,000 | | | | 2,326,500 | | | | 2.22 | % |
| | HollyFrontier Corp. | | | 35,900 | | | | 1,653,554 | | | | 1.57 | % |
| | Marathon Oil Corp. | | | 53,800 | | | | 1,896,988 | | | | 1.81 | % |
| | Marathon Petroleum Corp. | | | 26,300 | | | | 1,884,658 | | | | 1.80 | % |
| | | | | | | | | 15,844,827 | | | | 15.10 | % |
| | | | | | | | | | | | | | |
| | Health Care – 9.63% | | | | | | | | | | | | |
| | Baxter International, Inc. | | | 24,775 | | | | 1,631,929 | | | | 1.55 | % |
| | Cardinal Health, Inc. | | | 38,800 | | | | 2,276,008 | | | | 2.17 | % |
| | Eli Lilly & Co. | | | 33,700 | | | | 1,678,934 | | | | 1.60 | % |
| | HCA Holdings, Inc. | | | 52,700 | | | | 2,484,278 | | | | 2.37 | % |
| | UnitedHealth Group, Inc. | | | 29,900 | | | | 2,040,974 | | | | 1.94 | % |
| | | | | | | | | 10,112,123 | | | | 9.63 | % |
| | | | | | | | | | | | | | |
| | Industrials – 31.14% | | | | | | | | | | | | |
| | 3M Co. | | | 17,600 | | | | 2,214,960 | | | | 2.11 | % |
| | Caterpillar, Inc. | | | 18,400 | | | | 1,533,824 | | | | 1.46 | % |
| | Cummins, Inc. | | | 15,400 | | | | 1,956,108 | | | | 1.86 | % |
| | Deere & Co. | | | 19,000 | | | | 1,554,960 | | | | 1.48 | % |
| | Delta Air Lines, Inc. | | | 144,000 | | | | 3,798,720 | | | | 3.62 | % |
| | Fluor Corp. | | | 28,500 | | | | 2,115,270 | | | | 2.02 | % |
| | General Dynamics Corp. | | | 23,900 | | | | 2,070,457 | | | | 1.97 | % |
| | Joy Global, Inc. | | | 26,900 | | | | 1,526,575 | | | | 1.46 | % |
| | Lockheed Martin Corp. | | | 18,100 | | | | 2,413,454 | | | | 2.30 | % |
| | PACCAR, Inc. | | | 37,000 | | | | 2,057,200 | | | | 1.96 | % |
| | Parker Hannifin Corp. | | | 19,500 | | | | 2,276,040 | | | | 2.17 | % |
| | Raytheon Co. | | | 28,300 | | | | 2,331,071 | | | | 2.22 | % |
| | Rockwell Collins, Inc. | | | 28,700 | | | | 2,004,121 | | | | 1.91 | % |
| | The Boeing Co. | | | 21,900 | | | | 2,857,950 | | | | 2.72 | % |
| | Union Pacific Corp. | | | 13,000 | | | | 1,968,200 | | | | 1.88 | % |
| | | | | | | | | 32,678,910 | | | | 31.14 | % |
| | | | | | | | | | | | | | |
| | Information Technology – 11.84% | | | | | | | | | | | | |
| | Apple, Inc. | | | 3,050 | | | | 1,593,168 | | | | 1.52 | % |
| | Intel Corp. | | | 79,300 | | | | 1,937,299 | | | | 1.85 | % |
| | International Business Machines Corp. | | | 8,500 | | | | 1,523,285 | | | | 1.45 | % |
| | KLA-Tencor Corp. | | | 34,900 | | | | 2,289,440 | | | | 2.18 | % |
| | Western Digital Corp. | | | 43,000 | | | | 2,994,090 | | | | 2.85 | % |
| | Western Union Co. | | | 122,700 | | | | 2,088,354 | | | | 1.99 | % |
| | | | | | | | | 12,425,636 | | | | 11.84 | % |
| | | | | | | | | | | | | | |
| | Materials – 3.39% | | | | | | | | | | | | |
| | CF Industries Holdings, Inc. | | | 8,000 | | | | 1,724,799 | | | | 1.64 | % |
| | Freeport-McMoRan Copper & Gold, Inc. | | | 50,000 | | | | 1,838,000 | | | | 1.75 | % |
| | | | | | | | | 3,562,799 | | | | 3.39 | % |
| | Total Common Stocks | | | | | | | | | | | | |
| | (Cost $77,724,868) | | | | | | | 103,600,462 | | | | 98.71 | % |
| | | | | | | | | | | | | | |
| | SHORT-TERM INVESTMENTS – 1.36% | | | | | | | | | | | | |
| | | | | | | | | | | | | | |
| | Money Market Funds – 1.36% | | | | | | | | | | | | |
| | Fidelity Government Portfolio – | | | | | | | | | | | | |
| | Institutional Class, 0.01% (b) | | | 1,429,687 | | | | 1,429,687 | | | | 1.36 | % |
| | | | | | | | | | | | | | |
| | Total Money Market Funds | | | | | | | | | | | | |
| | (Cost $1,429,687) | | | | | | | 1,429,687 | | | | 1.36 | % |
| | | | | | | | | | | | | | |
| | Total Short-Term Investments | | | | | | | | | | | | |
| | (Cost $1,429,687) | | | | | | | 1,429,687 | | | | 1.36 | % |
| | | | | | | | | | | | | | |
| | Total Investments | | | | | | | | | | | | |
| | (Cost $79,154,555) – 100.07% | | | | | | | 105,030,149 | | | | 100.07 | % |
| | | | | | | | | | | | | | |
| | Liabilities in Excess | | | | | | | | | | | | |
| | of Other Assets – (0.07)% | | | | | | | (69,782 | ) | | | (0.07 | )% |
| | TOTAL NET ASSETS – 100.00% | | | | | | $ | 104,960,367 | | | | 100.00 | % |
Percentages are stated as a percent of net assets.
| (a) | Non-income producing security. |
| (b) | The rate listed is the fund’s 7-day yield as of October 31, 2013. |
The accompanying notes are an integral part of these financial statements.
HENNESSY FUNDS 1-800-966-4354
Summary of Fair Value Exposure at October 31, 2013
The following is a summary of the inputs used to value the Fund’s net assets as of October 31, 2013 (See Note 3 in the accompanying notes to the financial statements):
| Common Stock | | Level 1 | | | Level 2 | | | Level 3 | | | Total | |
| Consumer Discretionary | | $ | 22,667,251 | | | $ | — | | | $ | — | | | $ | 22,667,251 | |
| Consumer Staples | | | 6,308,916 | | | | — | | | | — | | | | 6,308,916 | |
| Energy | | | 15,844,827 | | | | — | | | | — | | | | 15,844,827 | |
| Health Care | | | 10,112,123 | | | | — | | | | — | | | | 10,112,123 | |
| Industrials | | | 32,678,910 | | | | — | | | | — | | | | 32,678,910 | |
| Information Technology | | | 12,425,636 | | | | — | | | | — | | | | 12,425,636 | |
| Materials | | | 3,562,799 | | | | — | | | | — | | | | 3,562,799 | |
| Total Common Stock | | $ | 103,600,462 | | | $ | — | | | $ | — | | | $ | 103,600,462 | |
Short-Term Investments | | | | | | | | | | | | | | | | |
| Money Market Funds | | $ | 1,429,687 | | | $ | — | | | $ | — | | | $ | 1,429,687 | |
| Total Short-Term Investments | | $ | 1,429,687 | | | $ | — | | | $ | — | | | $ | 1,429,687 | |
| Total Investments | | $ | 105,030,149 | | | $ | — | | | $ | — | | | $ | 105,030,149 | |
Transfers between levels are recognized at the end of the reporting period. During the one-year period ended October 31, 2013, the Fund recognized no transfers between levels.
The accompanying notes are an integral part of these financial statements.
HENNESSY CORNERSTONE VALUE FUND
As of October 31, 2013
(% of Net Assets)
| | TOP TEN EQUITY HOLDINGS | % net assets |
| | Raytheon Co. | 2.80% |
| | Lockheed Martin Corp. | 2.74% |
| | Bristol-Myers Squibb Co. | 2.55% |
| | Time Warner Cable, Inc. | 2.39% |
| | General Dynamics Corp. | 2.36% |
| | Ford Motor Co. | 2.35% |
| | EI Du Pont de Nemours & Co. | 2.28% |
| | Microsoft Corp. | 2.27% |
| | Johnson & Johnson | 2.24% |
| | ConocoPhillips | 2.23% |
Note: For presentation purposes, the Fund has grouped some of the industry categories. For purposes of categorizing securities for compliance with Section 8(b)(1) of the Investment Company Act of 1940, the Fund uses more specific industry classifications.
HENNESSY FUNDS 1-800-966-4354
| | COMMON STOCKS – 98.89% | | Number | | | | | | % of | |
| | | | of Shares | | | Value | | | Net Assets | |
| | Consumer Discretionary – 6.54% | | | | | | | | | |
| | Ford Motor Co. | | | 196,900 | | | $ | 3,368,959 | | | | 2.35 | % |
| | McDonald’s Corp. | | | 26,700 | | | | 2,577,084 | | | | 1.80 | % |
| | Time Warner Cable, Inc. | | | 28,400 | | | | 3,412,260 | | | | 2.39 | % |
| | | | | | | | | 9,358,303 | | | | 6.54 | % |
| | | | | | | | | | | | | | |
| | Consumer Staples – 23.12% | | | | | | | | | | | | |
| | Altria Group, Inc. | | | 75,000 | | | | 2,792,250 | | | | 1.95 | % |
| | ConAgra Foods, Inc. | | | 77,500 | | | | 2,465,275 | | | | 1.72 | % |
| | General Mills, Inc. | | | 60,800 | | | | 3,065,536 | | | | 2.14 | % |
| | Kellogg Co. | | | 43,700 | | | | 2,764,025 | | | | 1.93 | % |
| | Kimberly Clark Corp. | | | 28,500 | | | | 3,078,000 | | | | 2.15 | % |
| | Kraft Foods Group, Inc. | | | 55,000 | | | | 2,990,900 | | | | 2.09 | % |
| | Pepsico, Inc. | | | 35,300 | | | | 2,968,377 | | | | 2.08 | % |
| | Philip Morris International, Inc. | | | 29,100 | | | | 2,593,392 | | | | 1.81 | % |
| | Procter & Gamble Co. | | | 33,800 | | | | 2,729,350 | | | | 1.91 | % |
| | Sysco Corp. | | | 79,900 | | | | 2,583,966 | | | | 1.81 | % |
| | Unilever NV – ADR | | | 62,900 | | | | 2,498,388 | | | | 1.75 | % |
| | Unilever PLC – ADR | | | 62,600 | | | | 2,540,934 | | | | 1.78 | % |
| | | | | | | | | 33,070,393 | | | | 23.12 | % |
| | | | | | | | | | | | | | |
| | Energy – 9.65% | | | | | | | | | | | | |
| | BP PLC – ADR | | | 57,300 | | | | 2,664,450 | | | | 1.86 | % |
| | Chevron Corp. | | | 22,000 | | | | 2,639,120 | | | | 1.85 | % |
| | ConocoPhillips | | | 43,600 | | | | 3,195,880 | | | | 2.23 | % |
| | Royal Dutch Shell PLC – ADR | | | 35,200 | | | | 2,447,104 | | | | 1.71 | % |
| | Total SA – ADR | | | 46,700 | | | | 2,857,106 | | | | 2.00 | % |
| | | | | | | | | 13,803,660 | | | | 9.65 | % |
| | | | | | | | | | | | | | |
| | Financials – 5.84% | | | | | | | | | | | | |
| | Banco Santander SA – ADR | | | 310,000 | | | | 2,762,100 | | | | 1.93 | % |
| | HSBC Holdings PLC – ADR | | | 45,100 | | | | 2,482,304 | | | | 1.73 | % |
| | Wells Fargo & Co. | | | 73,000 | | | | 3,116,370 | | | | 2.18 | % |
| | | | | | | | | 8,360,774 | | | | 5.84 | % |
| | | | | | | | | | | | | | |
| | Health Care – 12.43% | | | | | | | | | | | | |
| | Bristol-Myers Squibb Co. | | | 69,500 | | | | 3,650,140 | | | | 2.55 | % |
| | Eli Lilly & Co. | | | 47,300 | | | | 2,356,486 | | | | 1.65 | % |
| | GlaxoSmithKline PLC – ADR | | | 56,100 | | | | 2,952,543 | | | | 2.07 | % |
| | Johnson & Johnson | | | 34,600 | | | | 3,204,306 | | | | 2.24 | % |
| | Merck & Co., Inc. | | | 61,300 | | | | 2,764,017 | | | | 1.93 | % |
| | Pfizer, Inc. | | | 92,800 | | | | 2,847,104 | | | | 1.99 | % |
| | | | | | | | | 17,774,596 | | | | 12.43 | % |
| | | | | | | | | | | | | | |
| | Industrials – 16.54% | | | | | | | | | | | | |
| | General Dynamics Corp. | | | 38,900 | | | | 3,369,907 | | | | 2.36 | % |
| | General Electric Co. | | | 113,300 | | | | 2,961,662 | | | | 2.07 | % |
| | Lockheed Martin Corp. | | | 29,400 | | | | 3,920,196 | | | | 2.74 | % |
| | Norfolk Southern Corp. | | | 36,800 | | | | 3,165,536 | | | | 2.21 | % |
| | Raytheon Co. | | | 48,700 | | | | 4,011,419 | | | | 2.80 | % |
| | United Parcel Service, Inc. | | | 32,100 | | | | 3,153,504 | | | | 2.21 | % |
| | Waste Management, Inc. | | | 70,600 | | | | 3,073,924 | | | | 2.15 | % |
| | | | | | | | | 23,656,148 | | | | 16.54 | % |
| | | | | | | | | | | | | | |
| | Information Technology – 6.54% | | | | | | | | | | | | |
| | Automatic Data Processing, Inc. | | | 42,300 | | | | 3,171,231 | | | | 2.22 | % |
| | Intel Corp. | | | 120,000 | | | | 2,931,600 | | | | 2.05 | % |
| | Microsoft Corp. | | | 91,800 | | | | 3,245,130 | | | | 2.27 | % |
| | | | | | | | | 9,347,961 | | | | 6.54 | % |
| | | | | | | | | | | | | | |
| | Materials – 12.90% | | | | | | | | | | | | |
| | Arcelormittal SA Luxembourg – ADR | | | 146,700 | | | | 2,311,992 | | | | 1.62 | % |
| | EI Du Pont de Nemours & Co. | | | 53,400 | | | | 3,268,080 | | | | 2.28 | % |
| | Freeport-McMoRan Copper & Gold, Inc. | | | 71,700 | | | | 2,635,692 | | | | 1.84 | % |
| | International Paper Co. | | | 60,500 | | | | 2,698,905 | | | | 1.89 | % |
| | Newmont Mining Corp. | | | 58,600 | | | | 1,597,436 | | | | 1.12 | % |
| | Nucor Corp. | | | 54,600 | | | | 2,826,642 | | | | 1.98 | % |
| | The Dow Chemical Co. | | | 78,700 | | | | 3,106,289 | | | | 2.17 | % |
| | | | | | | | | 18,445,036 | | | | 12.90 | % |
| | | | | | | | | | | | | | |
| | Telecommunication Services – 5.33% | | | | | | | | | | | | |
| | AT&T, Inc. | | | 72,200 | | | | 2,613,640 | | | | 1.83 | % |
| | CenturyLink, Inc. | | | 62,300 | | | | 2,109,478 | | | | 1.47 | % |
| | Verizon Communications, Inc. | | | 57,500 | | | | 2,904,324 | | | | 2.03 | % |
| | | | | | | | | 7,627,442 | | | | 5.33 | % |
| | Total Common Stocks | | | | | | | | | | | | |
| | (Cost $109,088,893) | | | | | | | 141,444,313 | | | | 98.89 | % |
| | | | | | | | | | | | | | |
| | SHORT-TERM INVESTMENTS – 1.00% | | | | | | | | | | | | |
| | | | | | | | | | | | | | |
| | Money Market Funds – 1.00% | | | | | | | | | | | | |
| | Fidelity Government Portfolio – | | | | | | | | | | | | |
| | Institutional Class, 0.01% (a) | | | 1,430,869 | | | | 1,430,869 | | | | 1.00 | % |
| | | | | | | | | | | | | | |
| | Total Money Market Funds | | | | | | | | | | | | |
| | (Cost $1,430,869) | | | | | | | 1,430,869 | | | | 1.00 | % |
| | | | | | | | | | | | | | |
| | Total Short-Term Investments | | | | | | | | | | | | |
| | (Cost $1,430,869) | | | | | | | 1,430,869 | | | | 1.00 | % |
| | | | | | | | | | | | | | |
| | Total Investments | | | | | | | | | | | | |
| | (Cost $110,519,762) – 99.89% | | | | | | | 142,875,182 | | | | 99.89 | % |
| | | | | | | | | | | | | | |
| | Other Assets in Excess | | | | | | | | | | | | |
| | of Liabilities – 0.11% | | | | | | | 157,872 | | | | 0.11 | % |
| | TOTAL NET ASSETS – 100.00% | | | | | | $ | 143,033,054 | | | | 100.00 | % |
Percentages are stated as a percent of net assets.
ADR – American Depositary Receipt
| (a) | The rate listed is the fund’s 7-day yield as of October 31, 2013. |
The accompanying notes are an integral part of these financial statements.
Summary of Fair Value Exposure at October 31, 2013
The following is a summary of the inputs used to value the Fund’s net assets as of October 31, 2013 (See Note 3 in the accompanying notes to the financial statements):
| Common Stock | | Level 1 | | | Level 2 | | | Level 3 | | | Total | |
| Consumer Discretionary | | $ | 9,358,303 | | | $ | — | | | $ | — | | | $ | 9,358,303 | |
| Consumer Staples | | | 33,070,393 | | | | — | | | | — | | | | 33,070,393 | |
| Energy | | | 13,803,660 | | | | — | | | | — | | | | 13,803,660 | |
| Financials | | | 8,360,774 | | | | — | | | | — | | | | 8,360,774 | |
| Health Care | | | 17,774,596 | | | | — | | | | — | | | | 17,774,596 | |
| Industrials | | | 23,656,148 | | | | — | | | | — | | | | 23,656,148 | |
| Information Technology | | | 9,347,961 | | | | — | | | | — | | | | 9,347,961 | |
| Materials | | | 18,445,036 | | | | — | | | | — | | | | 18,445,036 | |
| Telecommunication Services | | | 7,627,442 | | | | — | | | | — | | | | 7,627,442 | |
| Total Common Stock | | $ | 141,444,313 | | | $ | — | | | $ | — | | | $ | 141,444,313 | |
Short-Term Investments | | | | | | | | | | | | | | | | |
| Money Market Funds | | $ | 1,430,869 | | | $ | — | | | $ | — | | | $ | 1,430,869 | |
| Total Short-Term Investments | | $ | 1,430,869 | | | $ | — | | | $ | — | | | $ | 1,430,869 | |
| Total Investments | | $ | 142,875,182 | | | $ | — | | | $ | — | | | $ | 142,875,182 | |
Transfers between levels are recognized at the end of the reporting period. During the one-year period ended October 31, 2013, the Fund recognized no transfers between levels.
The accompanying notes are an integral part of these financial statements.
HENNESSY FUNDS 1-800-966-4354
HENNESSY LARGE VALUE FUND
As of October 31, 2013
(% of Net Assets)
| | TOP TEN EQUITY HOLDINGS | % net assets |
| | Wells Fargo & Co. | 4.51% |
| | Chevron Corp. | 4.31% |
| | Johnson & Johnson | 3.78% |
| | General Electric Co. | 3.53% |
| | Pfizer, Inc. | 3.37% |
| | J.P. Morgan Chase & Co. | 3.14% |
| | Exxon Mobil Corp. | 2.92% |
| | Berkshire Hathaway, Inc., Class B | 2.79% |
| | Citigroup, Inc. | 2.57% |
| | Mondelez International, Inc. | 2.56% |
Note: For presentation purposes, the Fund has grouped some of the industry categories. For purposes of categorizing securities for compliance with Section 8(b)(1) of the Investment Company Act of 1940, the Fund uses more specific industry classifications.
| | COMMON STOCKS – 95.95% | | Number | | | | | | % of | |
| | | | of Shares | | | Value | | | Net Assets | |
| | Consumer Discretionary – 6.93% | | | | | | | | | |
| | Abercrombie & Fitch Co., Class A | | | 25,810 | | | $ | 967,359 | | | | 0.67 | % |
| | Ford Motor Co. | | | 127,335 | | | | 2,178,702 | | | | 1.51 | % |
| | Lennar Corp. | | | 22,090 | | | | 785,299 | | | | 0.55 | % |
| | Macy’s, Inc. | | | 28,725 | | | | 1,324,510 | | | | 0.92 | % |
| | The Walt Disney Co. | | | 33,510 | | | | 2,298,451 | | | | 1.60 | % |
| | Time Warner, Inc. | | | 35,055 | | | | 2,409,680 | | | | 1.68 | % |
| | | | | | | | | 9,964,001 | | | | 6.93 | % |
| | | | | | | | | | | | | | |
| | Consumer Staples – 6.08% | | | | | | | | | | | | |
| | Bunge, Ltd. (b) | | | 12,140 | | | | 997,058 | | | | 0.69 | % |
| | CVS Caremark Corp. | | | 32,340 | | | | 2,013,489 | | | | 1.40 | % |
| | Mondelez International, Inc. | | | 109,330 | | | | 3,677,861 | | | | 2.56 | % |
| | Procter & Gamble Co. | | | 25,365 | | | | 2,048,224 | | | | 1.43 | % |
| | | | | | | | | 8,736,632 | | | | 6.08 | % |
| | | | | | | | | | | | | | |
| | Energy – 14.52% | | | | | | | | | | | | |
| | Anadarko Petroleum Corp. | | | 17,165 | | | | 1,635,653 | | | | 1.14 | % |
| | Cameron International Corp. (a) | | | 29,695 | | | | 1,629,068 | | | | 1.13 | % |
| | Chevron Corp. | | | 51,725 | | | | 6,204,931 | | | | 4.31 | % |
| | Exxon Mobil Corp. | | | 46,850 | | | | 4,198,697 | | | | 2.92 | % |
| | Helmerich & Payne, Inc. | | | 21,965 | | | | 1,703,386 | | | | 1.18 | % |
| | Marathon Oil Corp. | | | 49,625 | | | | 1,749,777 | | | | 1.22 | % |
| | Marathon Petroleum Corp. | | | 8,205 | | | | 587,970 | | | | 0.41 | % |
| | Occidental Petroleum Corp. | | | 6,970 | | | | 669,678 | | | | 0.46 | % |
| | Pioneer Natural Resources Co. | | | 9,330 | | | | 1,910,597 | | | | 1.33 | % |
| | Valero Energy Corp. | | | 14,535 | | | | 598,406 | | | | 0.42 | % |
| | | | | | | | | 20,888,163 | | | | 14.52 | % |
| | | | | | | | | | | | | | |
| | Financials – 24.86% | | | | | | | | | | | | |
| | Allstate Corp. | | | 41,865 | | | | 2,221,357 | | | | 1.54 | % |
| | American International Group, Inc. | | | 36,835 | | | | 1,902,528 | | | | 1.32 | % |
| | Berkshire Hathaway, Inc., Class B (a) | | | 34,905 | | | | 4,016,867 | | | | 2.79 | % |
| | BlackRock, Inc. | | | 6,535 | | | | 1,965,793 | | | | 1.37 | % |
| | Citigroup, Inc. | | | 75,730 | | | | 3,694,109 | | | | 2.57 | % |
| | Genworth Financial, Inc. (a) | | | 51,170 | | | | 743,500 | | | | 0.52 | % |
| | Hartford Financial Services Group, Inc. | | | 33,410 | | | | 1,125,917 | | | | 0.78 | % |
| | J.P. Morgan Chase & Co. | | | 87,710 | | | | 4,520,573 | | | | 3.14 | % |
| | MetLife, Inc. | | | 36,950 | | | | 1,748,105 | | | | 1.22 | % |
| | Regions Financial Corp. | | | 80,685 | | | | 776,997 | | | | 0.54 | % |
| | State Street Corp. | | | 32,655 | | | | 2,288,136 | | | | 1.59 | % |
| | The Charles Schwab Corp. | | | 42,595 | | | | 964,777 | | | | 0.67 | % |
| | The Goldman Sachs Group, Inc. | | | 12,245 | | | | 1,969,731 | | | | 1.37 | % |
| | The PNC Financial Services Group, Inc. | | | 18,095 | | | | 1,330,525 | | | | 0.93 | % |
| | Wells Fargo & Co. | | | 152,000 | | | | 6,488,880 | | | | 4.51 | % |
| | | | | | | | | 35,757,795 | | | | 24.86 | % |
| | | | | | | | | | | | | | |
| | Health Care – 12.47% | | | | | | | | | | | | |
| | C.R. Bard, Inc. | | | 15,035 | | | | 2,048,068 | | | | 1.42 | % |
| | CIGNA Corp. | | | 27,645 | | | | 2,128,112 | | | | 1.48 | % |
| | Covidien PLC (b) | | | 32,030 | | | | 2,053,443 | | | | 1.43 | % |
| | Johnson & Johnson | | | 58,625 | | | | 5,429,261 | | | | 3.78 | % |
| | McKesson Corp. | | | 9,115 | | | | 1,425,039 | | | | 0.99 | % |
| | Pfizer, Inc. | | | 157,945 | | | | 4,845,753 | | | | 3.37 | % |
| | | | | | | | | 17,929,676 | | | | 12.47 | % |
| | | | | | | | | | | | | | |
| | Industrials – 10.96% | | | | | | | | | | | | |
| | Caterpillar, Inc. | | | 8,895 | | | | 741,487 | | | | 0.52 | % |
| | Danaher Corp. | | | 20,560 | | | | 1,482,170 | | | | 1.03 | % |
| | Delta Air Lines, Inc. | | | 22,615 | | | | 596,584 | | | | 0.41 | % |
| | Eaton Corp. (b) | | | 15,715 | | | | 1,108,851 | | | | 0.77 | % |
| | General Electric Co. | | | 194,230 | | | | 5,077,172 | | | | 3.53 | % |
| | Honeywell International, Inc. | | | 21,655 | | | | 1,878,138 | | | | 1.31 | % |
| | Ingersoll-Rand PLC (b) | | | 16,910 | | | | 1,141,932 | | | | 0.79 | % |
| | Lockheed Martin Corp. | | | 13,985 | | | | 1,864,760 | | | | 1.30 | % |
| | Ryder System, Inc. | | | 12,525 | | | | 824,521 | | | | 0.57 | % |
| | The ADT Corporation | | | 15,255 | | | | 661,609 | | | | 0.46 | % |
| | WABCO Holdings, Inc. (a) | | | 4,480 | | | | 383,847 | | | | 0.27 | % |
| | | | | | | | | 15,761,071 | | | | 10.96 | % |
| | | | | | | | | | | | | | |
| | Information Technology – 8.86% | | | | | | | | | | | | |
| | Adobe Systems, Inc. (a) | | | 26,595 | | | | 1,441,449 | | | | 1.00 | % |
| | Apple, Inc. | | | 5,745 | | | | 3,000,901 | | | | 2.08 | % |
| | Broadcom Corp. | | | 21,515 | | | | 574,881 | | | | 0.40 | % |
| | Cisco Systems, Inc. | | | 140,730 | | | | 3,166,425 | | | | 2.20 | % |
| | EMC Corp. | | | 42,825 | | | | 1,030,798 | | | | 0.72 | % |
| | LAM Research Corp. (a) | | | 23,545 | | | | 1,276,845 | | | | 0.89 | % |
| | Skyworks Solutions, Inc. (a) | | | 37,825 | | | | 975,128 | | | | 0.68 | % |
| | Texas Instruments, Inc. | | | 30,425 | | | | 1,280,284 | | | | 0.89 | % |
| | | | | | | | | 12,746,711 | | | | 8.86 | % |
| | | | | | | | | | | | | | |
| | Materials – 3.54% | | | | | | | | | | | | |
| | Cytec Industries, Inc. | | | 9,110 | | | | 756,950 | | | | 0.53 | % |
| | Eastman Chemical Co. | | | 19,900 | | | | 1,567,921 | | | | 1.09 | % |
| | Freeport-McMoRan Copper & Gold, Inc. | | | 45,540 | | | | 1,674,051 | | | | 1.16 | % |
| | Huntsman Corp. | | | 47,215 | | | | 1,096,332 | | | | 0.76 | % |
| | | | | | | | | 5,095,254 | | | | 3.54 | % |
| | | | | | | | | | | | | | |
| | Telecommunication Services – 1.95% | | | | | | | | | | | | |
| | AT&T, Inc. | | | 77,390 | | | | 2,801,518 | | | | 1.95 | % |
| | | | | | | | | | | | | | |
| | Utilities – 5.78% | | | | | | | | | | | | |
| | Alliant Energy Corp. | | | 29,920 | | | | 1,562,422 | | | | 1.09 | % |
| | American Water Works Co., Inc. | | | 33,295 | | | | 1,427,357 | | | | 0.99 | % |
| | Northeast Utilities | | | 46,010 | | | | 1,973,369 | | | | 1.37 | % |
| | Sempra Energy | | | 36,750 | | | | 3,349,395 | | | | 2.33 | % |
| | | | | | | | | 8,312,543 | | | | 5.78 | % |
| | Total Common Stocks | | | | | | | | | | | | |
| | (Cost $108,296,878) | | | | | | | 137,993,364 | | | | 95.95 | % |
The accompanying notes are an integral part of these financial statements.
HENNESSY FUNDS 1-800-966-4354
| | REITS – 3.24% | | Number | | | | | | % of | |
| | | | of Shares | | | Value | | | Net Assets | |
| | Financials – 3.24% | | | | | | | | | |
| | Avalonbay Communities, Inc. | | | 9,145 | | | $ | 1,143,582 | | | | 0.79 | % |
| | Simon Property Group, Inc. | | | 12,913 | | | | 1,995,704 | | | | 1.39 | % |
| | Weyerhaeuser Co. | | | 50,200 | | | | 1,526,080 | | | | 1.06 | % |
| | | | | | | | | | | | | | |
| | Total REITS | | | | | | | | | | | | |
| | (Cost $3,622,155) | | | | | | | 4,665,366 | | | | 3.24 | % |
| | | | | | | | | | | | | | |
| | SHORT-TERM INVESTMENTS – 1.54% | | | | | | | | | | | | |
| | | | | | | | | | | | | | |
| | Money Market Funds – 1.54% | | | | | | | | | | | | |
| | Fidelity Government Portfolio – | | | | | | | | | | | | |
| | Institutional Class, 0.01% (c) | | | 2,209,136 | | | | 2,209,136 | | | | 1.54 | % |
| | | | | | | | | | | | | | |
| | Total Money Market Funds | | | | | | | | | | | | |
| | (Cost $2,209,136) | | | | | | | 2,209,136 | | | | 1.54 | % |
| | | | | | | | | | | | | | |
| | Total Short-Term Investments | | | | | | | | | | | | |
| | (Cost $2,209,136) | | | | | | | 2,209,136 | | | | 1.54 | % |
| | | | | | | | | | | | | | |
| | Total Investments | | | | | | | | | | | | |
| | (Cost $114,128,169) – 100.73% | | | | | | | 144,867,866 | | | | 100.73 | % |
| | | | | | | | | | | | | | |
| | Liabilities in Excess | | | | | | | | | | | | |
| | of Other Assets – (0.73)% | | | | | | | (1,046,572 | ) | | | (0.73 | )% |
| | TOTAL NET ASSETS – 100.00% | | | | | | $ | 143,821,294 | | | | 100.00 | % |
Percentages are stated as a percent of net assets.
| (a) | Non-income producing security. |
| (b) | U.S. traded security of a foreign corporation. |
| (c) | The rate listed is the fund’s 7-day yield as of October 31, 2013. |
Summary of Fair Value Exposure at October 31, 2013
The following is a summary of the inputs used to value the Fund’s net assets as of October 31, 2013 (See Note 3 in the accompanying notes to the financial statements):
| Common Stock | | Level 1 | | | Level 2 | | | Level 3 | | | Total | |
| Consumer Discretionary | | $ | 9,964,001 | | | $ | — | | | $ | — | | | $ | 9,964,001 | |
| Consumer Staples | | | 8,736,632 | | | | — | | | | — | | | | 8,736,632 | |
| Energy | | | 20,888,163 | | | | — | | | | — | | | | 20,888,163 | |
| Financials | | | 35,757,795 | | | | — | | | | — | | | | 35,757,795 | |
| Health Care | | | 17,929,676 | | | | — | | | | — | | | | 17,929,676 | |
| Industrials | | | 15,761,071 | | | | — | | | | — | | | | 15,761,071 | |
| Information Technology | | | 12,746,711 | | | | — | | | | — | | | | 12,746,711 | |
| Materials | | | 5,095,254 | | | | — | | | | — | | | | 5,095,254 | |
| Telecommunication Services | | | 2,801,518 | | | | — | | | | — | | | | 2,801,518 | |
| Utilities | | | 8,312,543 | | | | — | | | | — | | | | 8,312,543 | |
| Total Common Stock | | $ | 137,993,364 | | | $ | — | | | $ | — | | | $ | 137,993,364 | |
REITS | | | | | | | | | | | | | | | | |
| Financials | | $ | 4,665,366 | | | $ | — | | | $ | — | | | $ | 4,665,366 | |
| Total REITS | | $ | 4,665,366 | | | $ | — | | | $ | — | | | $ | 4,665,366 | |
Short-Term Investments | | | | | | | | | | | | | | | | |
| Money Market Funds | | $ | 2,209,136 | | | $ | — | | | $ | — | | | $ | 2,209,136 | |
| Total Short-Term Investments | | $ | 2,209,136 | | | $ | — | | | $ | — | | | $ | 2,209,136 | |
| Total Investments | | $ | 144,867,866 | | | $ | — | | | $ | — | | | $ | 144,867,866 | |
Transfers between levels are recognized at the end of the reporting period. During the one-year period ended October 31, 2013, the Fund recognized no transfers between levels.
The accompanying notes are an integral part of these financial statements.
HENNESSY TOTAL RETURN FUND
As of October 31, 2013
(% of Net Assets)
| | TOP TEN HOLDINGS | % net assets |
| | U.S. Treasury Bill, 0.030%, 11/21/2013 | 26.59% |
| | U.S. Treasury Bill, 0.035%, 01/23/2014 | 23.27% |
| | U.S. Treasury Bill, 0.010%, 12/19/2013 | 14.41% |
| | Verizon Communications, Inc. | 7.14% |
| | AT&T, Inc. | 7.13% |
| | Intel Corp. | 6.95% |
| | Pfizer Inc. | 6.94% |
| | General Electric Co. | 6.45% |
| | McDonald’s Corp. | 6.26% |
| | Merck & Co., Inc. | 6.19% |
Note: For presentation purposes, the Fund has grouped some of the industry categories. For purposes of categorizing securities for compliance with Section 8(b)(1) of the Investment Company Act of 1940, the Fund uses more specific industry classifications.
HENNESSY FUNDS 1-800-966-4354
| | COMMON STOCKS – 71.17% | | Number | | | | | | % of | |
| | | | of Shares | | | Value | | | Net Assets | |
| | Consumer Discretionary – 6.26% | | | | | | | | | |
| | McDonald’s Corp. | | | 58,500 | | | $ | 5,646,420 | | | | 6.26 | % |
| | | | | | | | | | | | | | |
| | Consumer Staples – 4.03% | | | | | | | | | | | | |
| | Kraft Foods Group, Inc. | | | 1,534 | | | | 83,419 | | | | 0.09 | % |
| | Mondelez International, Inc. | | | 4,600 | | | | 154,744 | | | | 0.17 | % |
| | Procter & Gamble Co. | | | 42,100 | | | | 3,399,575 | | | | 3.77 | % |
| | | | | | | | | 3,637,738 | | | | 4.03 | % |
| | | | | | | | | | | | | | |
| | Energy – 5.34% | | | | | | | | | | | | |
| | Chevron Corp. | | | 40,200 | | | | 4,822,392 | | | | 5.34 | % |
| | | | | | | | | | | | | | |
| | Financials – 0.53% | | | | | | | | | | | | |
| | J.P. Morgan Chase & Co. | | | 9,300 | | | | 479,322 | | | | 0.53 | % |
| | | | | | | | | | | | | | |
| | Health Care – 15.65% | | | | | | | | | | | | |
| | Johnson & Johnson | | | 24,600 | | | | 2,278,206 | | | | 2.52 | % |
| | Merck & Co., Inc. | | | 123,800 | | | | 5,582,142 | | | | 6.19 | % |
| | Pfizer, Inc. | | | 204,200 | | | | 6,264,856 | | | | 6.94 | % |
| | | | | | | | | 14,125,204 | | | | 15.65 | % |
| | | | | | | | | | | | | | |
| | Industrials – 6.45% | | | | | | | | | | | | |
| | General Electric Co. | | | 222,700 | | | | 5,821,378 | | | | 6.45 | % |
| | | | | | | | | | | | | | |
| | Information Technology – 12.96% | | | | | | | | | | | | |
| | Cisco Systems, Inc. | | | 21,500 | | | | 483,750 | | | | 0.54 | % |
| | Hewlett-Packard Co. | | | 70,600 | | | | 1,720,522 | | | | 1.91 | % |
| | Intel Corp. | | | 256,900 | | | | 6,276,067 | | | | 6.95 | % |
| | Microsoft Corp. | | | 90,900 | | | | 3,213,315 | | | | 3.56 | % |
| | | | | | | | | 11,693,654 | | | | 12.96 | % |
| | | | | | | | | | | | | | |
| | Materials – 5.68% | | | | | | | | | | | | |
| | EI Du Pont de Nemours & Co. | | | 83,700 | | | | 5,122,440 | | | | 5.68 | % |
| | | | | | | | | | | | | | |
| | Telecommunication Services – 14.27% | | | | | | | | | | | | |
| | AT&T, Inc. | | | 177,800 | | | | 6,436,360 | | | | 7.13 | % |
| | Verizon Communications, Inc. | | | 127,500 | | | | 6,440,025 | | | | 7.14 | % |
| | | | | | | | | 12,876,385 | | | | 14.27 | % |
| | Total Common Stocks | | | | | | | | | | | | |
| | (Cost $50,908,938) | | | | | | | 64,224,933 | | | | 71.17 | % |
| | | | | | | | | | | | | | |
| | SHORT-TERM INVESTMENTS – 66.86% | | | | | | | | | | |
| | | | | | | | | | | |
| | Money Market Funds – 2.59% | | | | | | | | | | | | |
| | Fidelity Government Portfolio – | | | | | | | | | | | | |
| | Institutional Class, 0.01% (a) | | | 2,334,784 | | | | 2,334,784 | | | | 2.59 | % |
| | | | | | | | | | | | | | |
| | Total Money Market Funds | | | | | | | | | | | | |
| | (Cost $2,334,784) | | | | | | | 2,334,784 | | | | 2.59 | % |
| | | | | | | | | | | | | | |
| | U.S. Treasury Bills – 64.27% | | | | | | | | | | | | |
| | 0.030%, 11/21/2013 (b) | | | 24,000,000 | | | | 23,999,395 | | | | 26.59 | % |
| | 0.010%, 12/19/2013 (b) | | | 13,000,000 | | | | 12,999,913 | | | | 14.41 | % |
| | 0.035%, 01/23/2014 (b) | | | 21,000,000 | | | | 20,998,299 | | | | 23.27 | % |
| | | | | | | | | | | | | | |
| | Total U.S. Treasury Bills | | | | | | | | | | | | |
| | (Cost $57,998,098) | | | | | | | 57,997,607 | | | | 64.27 | % |
| | | | | | | | | | | | | | |
| | Total Short-Term Investments | | | | | | | | | | | | |
| | (Cost $60,332,882) | | | | | | | 60,332,391 | | | | 66.86 | % |
| | | | | | | | | | | | | | |
| | Total Investments | | | | | | | | | | | | |
| | (Cost $111,241,820) – 138.03% | | | | | | | 124,557,324 | | | | 138.03 | % |
| | | | | | | | | | | | | | |
| | Liabilities in Excess | | | | | | | | | | | | |
| | of Other Assets – (38.03)% | | | | | | | (34,316,202 | ) | | | (38.03 | )% |
| | TOTAL NET ASSETS – 100.00% | | | | | | $ | 90,241,122 | | | | 100.00 | % |
Percentages are stated as a percent of net assets.
| (a) | The rate listed is the fund’s 7-day yield as of October 31, 2013. |
| (b) | The rate listed is discount rate at issue. |
The accompanying notes are an integral part of these financial statements.
Summary of Fair Value Exposure at October 31, 2013
The following is a summary of the inputs used to value the Fund’s net assets as of October 31, 2013 (See Note 3 in the accompanying notes to the financial statements):
| Common Stock | | Level 1 | | | Level 2 | | | Level 3 | | | Total | |
| Consumer Discretionary | | $ | 5,646,420 | | | $ | — | | | $ | — | | | $ | 5,646,420 | |
| Consumer Staples | | | 3,637,738 | | | | — | | | | — | | | | 3,637,738 | |
| Energy | | | 4,822,392 | | | | — | | | | — | | | | 4,822,392 | |
| Financials | | | 479,322 | | | | — | | | | — | | | | 479,322 | |
| Health Care | | | 14,125,204 | | | | — | | | | — | | | | 14,125,204 | |
| Industrials | | | 5,821,378 | | | | — | | | | — | | | | 5,821,378 | |
| Information Technology | | | 11,693,654 | | | | — | | | | — | | | | 11,693,654 | |
| Materials | | | 5,122,440 | | | | — | | | | — | | | | 5,122,440 | |
| Telecommunication Services | | | 12,876,385 | | | | — | | | | — | | | | 12,876,385 | |
| Total Common Stock | | $ | 64,224,933 | | | $ | — | | | $ | — | | | $ | 64,224,933 | |
Short-Term Investments | | | | | | | | | | | | | | | | |
| Money Market Funds | | $ | 2,334,784 | | | $ | — | | | $ | — | | | $ | 2,334,784 | |
| U.S. Treasury Bills | | | — | | | | 57,997,607 | | | | — | | | | 57,997,607 | |
| Total Short-Term Investments | | $ | 2,334,784 | | | $ | 57,997,607 | | | $ | — | | | $ | 60,332,391 | |
| Total Investments | | $ | 66,559,717 | | | $ | 57,997,607 | | | $ | — | | | $ | 124,557,324 | |
Transfers between levels are recognized at the end of the reporting period. During the one-year period ended October 31, 2013, the Fund recognized no transfers between levels.
Reverse repurchase agreements are carried at face value; hence, they are not included in the fair valuation hierarchy. The face vale of the reverse repurchase agreements at October 31, 2013 was $34,181,000. Due to the short term nature of the reverse repurchase agreements, face value approximates fair value. The face value plus interest due at maturity is equal to $34,201,354.
The accompanying notes are an integral part of these financial statements.
HENNESSY FUNDS 1-800-966-4354
Schedule of Reverse Repurchase Agreements
Hennessy Total Return Fund as of October 31, 2013 |
| Face | | | | | | Principal | | Maturity | | Maturity | |
| Value | | Counterparty | | Rate | | Trade Date | | Date | | Amount | |
| $ | 14,392,000 | | UBS Financial Services, Inc. | | 0.21% | | 8/16/13 | | 11/21/13 | | $ | 14,400,143 | |
| | 7,196,000 | | UBS Financial Services, Inc. | | 0.25% | | 9/20/13 | | 12/19/13 | | | 7,200,498 | |
| | 12,593,000 | | UBS Financial Services, Inc. | | 0.21% | | 10/10/13 | | 1/23/14 | | | 12,600,713 | |
| $ | 34,181,000 | | | | | | | | | | $ | 34,201,354 | |
As of October 31, 2013, the fair value of securities held as collateral for reverse repurchase agreements was $57,997,607 as noted on the Schedule of Investments.
The accompanying notes are an integral part of these financial statements.
HENNESSY EQUITY AND INCOME FUND
As of October 31, 2013
(% of Net Assets)
| | TOP TEN HOLDINGS | % net assets |
| | U.S. Treasury Note, 4.125%, 05/15/2015 | 4.46% |
| | Bristol-Myers Squibb Co. | 3.01% |
| | NewMarket Corp. | 2.97% |
| | CarMax, Inc. | 2.71% |
| | Wells Fargo & Co. | 2.50% |
| | Eaton Vance Corp. | 2.45% |
| | BlackRock, Inc. | 2.38% |
| | Albemarle Corp. | 2.30% |
| | Berkshire Hathaway, Inc., Class B | 2.25% |
| | Chevron Corp. | 2.19% |
Note: For presentation purposes, the Fund has grouped some of the industry categories. For purposes of categorizing securities for compliance with Section 8(b)(1) of the Investment Company Act of 1940, the Fund uses more specific industry classifications.
HENNESSY FUNDS 1-800-966-4354
| | COMMON STOCKS – 61.35% | | Number | | | | | | % of | |
| | | | of Shares | | | Value | | | Net Assets | |
| | Consumer Discretionary – 6.50% | | | | | | | | | |
| | CarMax, Inc. (a) | | | 183,519 | | | $ | 8,623,558 | | | | 2.71 | % |
| | Carnival Corp. | | | 161,310 | | | | 5,589,392 | | | | 1.75 | % |
| | Lowes Companies, Inc. | | | 130,366 | | | | 6,489,619 | | | | 2.04 | % |
| | | | | | | | | 20,702,569 | | | | 6.50 | % |
| | | | | | | | | | | | | | |
| | Consumer Staples – 11.79% | | | | | | | | | | | | |
| | Altria Group, Inc. | | | 154,639 | | | | 5,757,210 | | | | 1.81 | % |
| | Brown-Forman Corp., Class B | | | 29,306 | | | | 2,138,752 | | | | 0.67 | % |
| | Energizer Holdings, Inc. | | | 60,752 | | | | 5,960,379 | | | | 1.87 | % |
| | Lorillard, Inc. | | | 67,526 | | | | 3,444,501 | | | | 1.08 | % |
| | Philip Morris International, Inc. | | | 35,703 | | | | 3,181,851 | | | | 1.00 | % |
| | Reynolds American, Inc. | | | 88,571 | | | | 4,549,892 | | | | 1.43 | % |
| | The Coca-Cola Co. | | | 123,501 | | | | 4,886,935 | | | | 1.54 | % |
| | The Hershey Co. | | | 25,648 | | | | 2,545,308 | | | | 0.80 | % |
| | Wal-Mart Stores, Inc. | | | 65,892 | | | | 5,057,211 | | | | 1.59 | % |
| | | | | | | | | 37,522,039 | | | | 11.79 | % |
| | | | | | | | | | | | | | |
| | Energy – 5.74% | | | | | | | | | | | | |
| | Apache Corp. | | | 58,520 | | | | 5,196,576 | | | | 1.63 | % |
| | Chevron Corp. | | | 58,071 | | | | 6,966,197 | | | | 2.19 | % |
| | ConocoPhillips | | | 83,458 | | | | 6,117,472 | | | | 1.92 | % |
| | | | | | | | | 18,280,245 | | | | 5.74 | % |
| | | | | | | | | | | | | | |
| | Financials – 10.41% | | | | | | | | | | | | |
| | Berkshire Hathaway, Inc., Class B (a) | | | 62,319 | | | | 7,171,670 | | | | 2.25 | % |
| | BlackRock, Inc. | | | 25,148 | | | | 7,564,770 | | | | 2.38 | % |
| | Eaton Vance Corp. | | | 186,510 | | | | 7,797,983 | | | | 2.45 | % |
| | Wells Fargo & Co. | | | 186,633 | | | | 7,967,363 | | | | 2.50 | % |
| | White Mountains | | | | | | | | | | | | |
| | Insurance Group Ltd. (b) | | | 4,531 | | | | 2,646,421 | | | | 0.83 | % |
| | | | | | | | | 33,148,207 | | | | 10.41 | % |
| | | | | | | | | | | | | | |
| | Health Care – 4.31% | | | | | | | | | | | | |
| | Bristol-Myers Squibb Co. | | | 182,638 | | | | 9,592,148 | | | | 3.01 | % |
| | Pfizer, Inc. | | | 134,415 | | | | 4,123,852 | | | | 1.30 | % |
| | | | | | | | | 13,716,000 | | | | 4.31 | % |
| | | | | | | | | | | | | | |
| | Industrials – 3.54% | | | | | | | | | | | | |
| | FedEx Corp. | | | 34,138 | | | | 4,472,078 | | | | 1.41 | % |
| | General Dynamics Corp. | | | 78,430 | | | | 6,794,391 | | | | 2.13 | % |
| | | | | | | | | 11,266,469 | | | | 3.54 | % |
| | | | | | | | | | | | | | |
| | Information Technology – 10.50% | | | | | | | | | | | | |
| | Cisco Systems, Inc. | | | 211,336 | | | | 4,755,060 | | | | 1.49 | % |
| | Corning, Inc. | | | 348,927 | | | | 5,963,162 | | | | 1.87 | % |
| | EMC Corp. | | | 228,203 | | | | 5,492,846 | | | | 1.73 | % |
| | Intel Corp. | | | 207,199 | | | | 5,061,872 | | | | 1.59 | % |
| | International Business Machines Corp. | | | 18,435 | | | | 3,303,736 | | | | 1.04 | % |
| | Microsoft Corp. | | | 90,033 | | | | 3,182,667 | | | | 1.00 | % |
| | Visa, Inc., Class A | | | 28,839 | | | | 5,671,766 | | | | 1.78 | % |
| | | | | | | | | 33,431,109 | | | | 10.50 | % |
| | | | | | | | | | | | | | |
| | Materials – 6.46% | | | | | | | | | | | | |
| | Albemarle Corp. | | | 110,635 | | | | 7,322,930 | | | | 2.30 | % |
| | MeadWestvaco Corp. | | | 108,941 | | | | 3,796,594 | | | | 1.19 | % |
| | NewMarket Corp. | | | 30,380 | | | | 9,459,117 | | | | 2.97 | % |
| | | | | | | | | 20,578,641 | | | | 6.46 | % |
| | | | | | | | | | | | | | |
| | Telecommunication Services – 2.10% | | | | | | | | | | | | |
| | Verizon Communications, Inc. | | | 132,348 | | | | 6,684,897 | | | | 2.10 | % |
| | | | | | | | | | | | | | |
| | Total Common Stocks | | | | | | | | | | | | |
| | (Cost $151,475,524) | | | | | | | 195,330,176 | | | | 61.35 | % |
| | | | | | | | | | | | | | |
| | PREFERRED STOCKS – 0.02% | | | | | | | | | | | | |
| | | | | | | | | | | | | | |
| | Financials – 0.02% | | | | | | | | | | | | |
| | Fannie Mae Preferred (a) | | | 10,600 | | | | 75,366 | | | | 0.02 | % |
| | | | | | | | | | | | | | |
| | Total Preferred Stocks | | | | | | | | | | | | |
| | (Cost $265,000) | | | | | | | 75,366 | | | | 0.02 | % |
| | | | | | | | | | | | | | |
| | REITS – 0.10% | | | | | | | | | | | | |
| | | | | | | | | | | | | | |
| | Financials – 0.10% | | | | | | | | | | | | |
| | Apollo Commercial Real | | | | | | | | | | | | |
| | Estate Finance, Inc. | | | 19,000 | | | | 306,090 | | | | 0.10 | % |
| | | | | | | | | | | | | | |
| | Total REITS | | | | | | | | | | | | |
| | (Cost $321,773) | | | | | | | 306,090 | | | | 0.10 | % |
| | | | | | | | | | | | | | |
| | CORPORATE BONDS – 23.67% | | | | | | | | | | | | |
| | | | | | | | | | | | | | |
| | Consumer Discretionary – 1.38% | | | | | | | | | | | | |
| | Amazon.com, Inc. | | | | | | | | | | | | |
| | 0.650%, 11/27/2015 | | | 800,000 | | | | 799,147 | | | | 0.25 | % |
| | Comcast Corp. | | | | | | | | | | | | |
| | 4.950%, 06/15/2016 | | | 600,000 | | | | 662,381 | | | | 0.21 | % |
| | Ford Motor Credit Co. LLC | | | | | | | | | | | | |
| | 3.000%, 06/12/2017 | | | 1,750,000 | | | | 1,823,173 | | | | 0.57 | % |
| | Starbucks Corp. | | | | | | | | | | | | |
| | 6.250%, 08/15/2017 | | | 300,000 | | | | 350,740 | | | | 0.11 | % |
| | The Home Depot, Inc. | | | | | | | | | | | | |
| | 5.400%, 03/01/2016 | | | 700,000 | | | | 775,109 | | | | 0.24 | % |
| | | | | | | | | 4,410,550 | | | | 1.38 | % |
| | | | | | | | | | | | | | |
| | Consumer Staples – 0.52% | | | | | | | | | | | | |
| | Anheuser-Busch InBev Worldwide, Inc. | | | | | | | | | | | | |
| | 7.750%, 01/15/2019 | | | 150,000 | | | | 190,174 | | | | 0.06 | % |
| | CVS Caremark Corp. | | | | | | | | | | | | |
| | 4.750%, 05/18/2020 | | | 400,000 | | | | 445,069 | | | | 0.14 | % |
| | 5.750%, 06/01/2017 | | | 600,000 | | | | 688,455 | | | | 0.22 | % |
| | Wal-Mart Stores, Inc. | | | | | | | | | | | | |
| | 5.000%, 10/25/2040 | | | 300,000 | | | | 317,892 | | | | 0.10 | % |
| | | | | | | | | 1,641,590 | | | | 0.52 | % |
| | | | | | | | | | | | | | |
| | Financials – 13.60% | | | | | | | | | | | | |
| | Aflac, Inc. | | | | | | | | | | | | |
| | 8.500%, 05/15/2019 | | | 650,000 | | | | 846,815 | | | | 0.27 | % |
The accompanying notes are an integral part of these financial statements.
| | CORPORATE BONDS | | Number | | | | | | % of | |
| | | | of Shares | | | Value | | | Net Assets | |
| | Financials (Continued) | | | | | | | | | |
| | American Express Co. | | | | | | | | | |
| | 6.150%, 08/28/2017 | | | 1,550,000 | | | $ | 1,810,995 | | | | 0.57 | % |
| | American Express Credit Corp. | | | | | | | | | | | | |
| | 2.750%, 09/15/2015 | | | 1,150,000 | | | | 1,193,463 | | | | 0.37 | % |
| | American International Group, Inc. | | | | | | | | | | | | |
| | 5.850%, 01/16/2018 | | | 1,075,000 | | | | 1,243,092 | | | | 0.39 | % |
| | American International Group, Inc. | | | | | | | | | | | | |
| | 4.875%, 06/01/2022 | | | 600,000 | | | | 657,913 | | | | 0.21 | % |
| | Associated Banc-Corp | | | | | | | | | | | | |
| | 5.125%, 03/28/2016 | | | 700,000 | | | | 755,478 | | | | 0.24 | % |
| | Associates Corporation | | | | | | | | | | | | |
| | of North America | | | | | | | | | | | | |
| | 6.950%, 11/01/2018 | | | 300,000 | | | | 358,890 | | | | 0.11 | % |
| | Bank New York Mellon Corp. | | | | | | | | | | | | |
| | 1.969%, 06/20/2017 | | | 500,000 | | | | 509,734 | | | | 0.16 | % |
| | Bank of Montreal – ADR (b) | | | | | | | | | | | | |
| | 2.500%, 01/11/2017 | | | 400,000 | | | | 416,114 | | | | 0.13 | % |
| | Bank of Nova Scotia – ADR (b) | | | | | | | | | | | | |
| | 2.550%, 01/12/2017 | | | 1,000,000 | | | | 1,042,836 | | | | 0.33 | % |
| | Capital One Financial Corp. | | | | | | | | | | | | |
| | 4.750%, 07/15/2021 | | | 1,500,000 | | | | 1,617,229 | | | | 0.51 | % |
| | Charles Schwab Corp. | | | | | | | | | | | | |
| | 0.850%, 12/04/2015 | | | 1,000,000 | | | | 1,001,809 | | | | 0.31 | % |
| | Citigroup, Inc. | | | | | | | | | | | | |
| | 6.125%, 11/21/2017 | | | 1,455,000 | | | | 1,690,378 | | | | 0.53 | % |
| | Credit Suisse USA, Inc. | | | | | | | | | | | | |
| | 5.125%, 08/15/2015 | | | 975,000 | | | | 1,051,766 | | | | 0.33 | % |
| | Discover Financial Services | | | | | | | | | | | | |
| | 5.200%, 04/27/2022 | | | 900,000 | | | | 957,140 | | | | 0.30 | % |
| | Fifth Third Bancorp | | | | | | | | | | | | |
| | 3.625%, 01/25/2016 | | | 700,000 | | | | 739,303 | | | | 0.23 | % |
| | First Niagara Financial Group, Inc. | | | | | | | | | | | | |
| | 6.750%, 03/19/2020 | | | 590,000 | | | | 690,622 | | | | 0.22 | % |
| | Franklin Resources, Inc. | | | | | | | | | | | | |
| | 1.375%, 09/15/2017 | | | 1,080,000 | | | | 1,067,890 | | | | 0.34 | % |
| | General Electric Capital Corp. | | | | | | | | | | | | |
| | 1.625%, 04/02/2018 | | | 500,000 | | | | 499,765 | | | | 0.16 | % |
| | 5.000%, 01/08/2016 | | | 500,000 | | | | 544,717 | | | | 0.17 | % |
| | 5.625%, 05/01/2018 | | | 1,050,000 | | | | 1,219,200 | | | | 0.38 | % |
| | Genworth Financial, Inc. | | | | | | | | | | | | |
| | 6.515%, 05/22/2018 | | | 500,000 | | | | 580,267 | | | | 0.18 | % |
| | Goldman Sachs Group, Inc. | | | | | | | | | | | | |
| | 5.350%, 01/15/2016 | | | 500,000 | | | | 546,612 | | | | 0.17 | % |
| | HSBC Finance Corp. | | | | | | | | | | | | |
| | 2.375%, 02/13/2015 | | | 1,000,000 | | | | 1,023,331 | | | | 0.32 | % |
| | 5.000%, 06/30/2015 | | | 1,200,000 | | | | 1,276,177 | | | | 0.40 | % |
| | J.P.Morgan Chase & Co. | | | | | | | | | | | | |
| | 6.000%, 01/15/2018 | | | 1,000,000 | | | | 1,157,687 | | | | 0.36 | % |
| | KeyCorp | | | | | | | | | | | | |
| | 3.750%, 08/13/2015 | | | 900,000 | | | | 945,441 | | | | 0.30 | % |
| | 5.100%, 03/24/2021 | | | 950,000 | | | | 1,055,437 | | | | 0.33 | % |
| | Lazard Group | | | | | | | | | | | | |
| | 6.850%, 06/15/2017 | | | 320,000 | | | | 364,017 | | | | 0.11 | % |
| | Lincoln National Corp. | | | | | | | | | | | | |
| | 6.250%, 02/15/2020 | | | 780,000 | | | | 921,666 | | | | 0.29 | % |
| | Manulife Financial Corp. – ADR (b) | | | | | | | | | | | | |
| | 3.400%, 09/17/2015 | | | 300,000 | | | | 313,154 | | | | 0.10 | % |
| | Merrill Lynch & Company, Inc. | | | | | | | | | | | | |
| | 6.875%, 04/25/2018 | | | 955,000 | | | | 1,135,374 | | | | 0.36 | % |
| | Merrill Lynch & Company, | | | | | | | | | | | | |
| | Inc., Series MTNC | | | | | | | | | | | | |
| | 0.704%, 01/15/2015 | | | 250,000 | | | | 249,765 | | | | 0.08 | % |
| | MetLife, Inc., Series A | | | | | | | | | | | | |
| | 6.817%, 08/15/2018 | | | 100,000 | | | | 121,505 | | | | 0.04 | % |
| | Morgan Stanley | | | | | | | | | | | | |
| | 5.375%, 10/15/2015 | | | 500,000 | | | | 539,775 | | | | 0.17 | % |
| | 5.750%, 01/25/2021 | | | 850,000 | | | | 974,672 | | | | 0.31 | % |
| | 6.625%, 04/01/2018 | | | 250,000 | | | | 293,490 | | | | 0.09 | % |
| | Prudential Financial, Inc. | | | | | | | | | | | | |
| | 5.500%, 03/15/2016 | | | 310,000 | | | | 341,232 | | | | 0.11 | % |
| | Prudential Financial, Inc., Series MTNB | | | | | | | | | | | | |
| | 5.100%, 09/20/2014 | | | 285,000 | | | | 296,295 | | | | 0.09 | % |
| | Qwest Capital Funding, Inc. | | | | | | | | | | | | |
| | 6.500%, 11/15/2018 | | | 700,000 | | | | 764,750 | | | | 0.24 | % |
| | Raymond James Financial, Inc. | | | | | | | | | | | | |
| | 5.625%, 04/01/2024 | | | 700,000 | | | | 745,752 | | | | 0.23 | % |
| | Royal Bank of Canada – ADR (b) | | | | | | | | | | | | |
| | 2.200%, 07/27/2018 | | | 1,000,000 | | | | 1,012,315 | | | | 0.32 | % |
| | Simon Property Group, Inc. | | | | | | | | | | | | |
| | 6.100%, 05/01/2016 | | | 1,010,000 | | | | 1,127,333 | | | | 0.35 | % |
| | St. Paul Travelers, Inc. | | | | | | | | | | | | |
| | 5.500%, 12/01/2015 | | | 275,000 | | | | 301,915 | | | | 0.09 | % |
| | SunTrust Banks, Inc. | | | | | | | | | | | | |
| | 3.600%, 04/15/2016 | | | 250,000 | | | | 265,336 | | | | 0.08 | % |
| | 6.000%, 09/11/2017 | | | 250,000 | | | | 286,811 | | | | 0.09 | % |
| | The Bear Stearns Companies, Inc. | | | | | | | | | | | | |
| | 6.400%, 10/02/2017 | | | 1,350,000 | | | | 1,580,207 | | | | 0.50 | % |
| | The Goldman Sachs Group, Inc. | | | | | | | | | | | | |
| | 5.375%, 03/15/2020 | | | 1,100,000 | | | | 1,238,806 | | | | 0.39 | % |
| | The Hartford Financial | | | | | | | | | | | | |
| | Services Group, Inc. | | | | | | | | | | | | |
| | 5.375%, 03/15/2017 | | | 300,000 | | | | 333,616 | | | | 0.10 | % |
| | The Royal Bank of | | | | | | | | | | | | |
| | Scotland PLC – ADR (b) | | | | | | | | | | | | |
| | 4.375%, 03/16/2016 | | | 400,000 | | | | 428,816 | | | | 0.13 | % |
| | Toronto Dominion Bank – ADR (b) | | | | | | | | | | | | |
| | 2.375%, 10/19/2016 | | | 1,000,000 | | | | 1,040,800 | | | | 0.33 | % |
| | Wells Fargo & Co | | | | | | | | | | | | |
| | 5.625%, 12/11/2017 | | | 1,000,000 | | | | 1,157,546 | | | | 0.36 | % |
| | Westpac Banking Corp. – ADR (b) | | | | | | | | | | | | |
| | 4.200%, 02/27/2015 | | | 500,000 | | | | 524,736 | | | | 0.16 | % |
| | 4.875%, 11/19/2019 | | | 450,000 | | | | 509,126 | | | | 0.16 | % |
| | | | | | | | | 43,368,911 | | | | 13.60 | % |
| | | | | | | | | | | | | | |
| | Health Care – 1.43% | | | | | | | | | | | | |
| | Agilent Technologies, Inc. | | | | | | | | | | | | |
| | 5.000%, 07/15/2020 | | | 650,000 | | | | 709,803 | | | | 0.22 | % |
The accompanying notes are an integral part of these financial statements.
HENNESSY FUNDS 1-800-966-4354
| | CORPORATE BONDS | | Number | | | | | | % of | |
| | | | of Shares | | | Value | | | Net Assets | |
| | Health Care (Continued) | | | | | | | | | |
| | Amgen, Inc. | | | | | | | | | |
| | 2.500%, 11/15/2016 | | | 1,000,000 | | | $ | 1,038,199 | | | | 0.33 | % |
| | Celgene Corp. | | | | | | | | | | | | |
| | 2.300%, 08/15/2018 | | | 1,000,000 | | | | 1,008,303 | | | | 0.32 | % |
| | GlaxoSmithKline Capital, Inc. – ADR (b) | | | | | | | | | | | | |
| | 1.500%, 05/08/2017 | | | 500,000 | | | | 505,208 | | | | 0.16 | % |
| | Merck and Co., Inc. | | | | | | | | | | | | |
| | 6.000%, 09/15/2017 | | | 850,000 | | | | 1,001,150 | | | | 0.31 | % |
| | UnitedHealth Group, Inc. | | | | | | | | | | | | |
| | 5.375%, 03/15/2016 | | | 250,000 | | | | 275,572 | | | | 0.09 | % |
| | | | | | | | | 4,538,235 | | | | 1.43 | % |
| | | | | | | | | | | | | | |
| | Industrials – 0.32% | | | | | | | | | | | | |
| | John Deere Capital Corp. | | | | | | | | | | | | |
| | 1.850%, 09/15/2016 | | | 1,000,000 | | | | 1,027,308 | | | | 0.32 | % |
| | | | | | | | | | | | | | |
| | Information Technology – 2.32% | | | | | | | | | | | | |
| | Altera Corp. | | | | | | | | | | | | |
| | 1.750%, 05/15/2017 | | | 1,000,000 | | | | 994,363 | | | | 0.31 | % |
| | Applied Materials, Inc. | | | | | | | | | | | | |
| | 4.300%, 06/15/2021 | | | 300,000 | | | | 317,586 | | | | 0.10 | % |
| | Corning, Inc. | | | | | | | | | | | | |
| | 6.850%, 03/01/2029 | | | 275,000 | | | | 326,000 | | | | 0.10 | % |
| | EMC Corp. | | | | | | | | | | | | |
| | 1.875%, 06/01/2018 | | | 1,000,000 | | | | 1,004,765 | | | | 0.32 | % |
| | eBay, Inc. | | | | | | | | | | | | |
| | 3.250%, 10/15/2020 | | | 1,000,000 | | | | 1,032,356 | | | | 0.32 | % |
| | Hewlett Packard Co. | | | | | | | | | | | | |
| | 3.000%, 09/15/2016 | | | 1,000,000 | | | | 1,035,539 | | | | 0.33 | % |
| | Juniper Networks, Inc. | | | | | | | | | | | | |
| | 4.600%, 03/15/2021 | | | 1,000,000 | | | | 1,032,199 | | | | 0.33 | % |
| | KLA-Tencor Corp. | | | | | | | | | | | | |
| | 6.900%, 05/01/2018 | | | 650,000 | | | | 771,761 | | | | 0.24 | % |
| | Symantec Corp. | | | | | | | | | | | | |
| | 3.950%, 06/15/2022 | | | 500,000 | | | | 497,518 | | | | 0.16 | % |
| | 4.200%, 09/15/2020 | | | 350,000 | | | | 363,337 | | | | 0.11 | % |
| | | | | | | | | 7,375,424 | | | | 2.32 | % |
| | | | | | | | | | | | | | |
| | Materials – 1.94% | | | | | | | | | | | | |
| | Alcoa, Inc. | | | | | | | | | | | | |
| | 6.150%, 08/15/2020 | | | 625,000 | | | | 673,336 | | | | 0.21 | % |
| | AngloGold Ashanti | | | | | | | | | | | | |
| | Holdings PLC – ADR (b) | | | | | | | | | | | | |
| | 5.125%, 08/01/2022 | | | 1,000,000 | | | | 890,382 | | | | 0.28 | % |
| | El du Pont de Nemours & Co. | | | | | | | | | | | | |
| | 4.750%, 03/15/2015 | | | 315,000 | | | | 332,815 | | | | 0.10 | % |
| | Goldcorp Inc. – ADR (b) | | | | | | | | | | | | |
| | 2.125%, 03/15/2018 | | | 1,250,000 | | | | 1,229,917 | | | | 0.39 | % |
| | International Paper Co. | | | | | | | | | | | | |
| | 9.375%, 05/15/2019 | | | 250,000 | | | | 331,584 | | | | 0.10 | % |
| | Rio Tinto Finance USA PLC – ADR (b) | | | | | | | | | | | | |
| | 1.375%, 06/17/2016 | | | 1,000,000 | | | | 1,006,781 | | | | 0.32 | % |
| | 2.000%, 03/22/2017 | | | 640,000 | | | | 646,995 | | | | 0.20 | % |
| | The Dow Chemical Co. | | | | | | | | | | | | |
| | 4.250%, 11/15/2020 | | | 1,000,000 | | | | 1,070,594 | | | | 0.34 | % |
| | | | | | | | | 6,182,404 | | | | 1.94 | % |
| | | | | | | | | | | | | | |
| | Telecommunication Services – 2.06% | | | | | | | | | | | | |
| | AT&T, Inc. | | | | | | | | | | | | |
| | 2.950%, 05/15/2016 | | | 775,000 | | | | 810,225 | | | | 0.25 | % |
| | 5.800%, 02/15/2019 | | | 800,000 | | | | 929,913 | | | | 0.29 | % |
| | 3.000%, 02/15/2022 | | | 250,000 | | | | 235,589 | | | | 0.07 | % |
| | 5.350%, 09/01/2040 | | | 200,000 | | | | 195,493 | | | | 0.06 | % |
| | CenturyLink, Inc. | | | | | | | | | | | | |
| | 5.150%, 06/15/2017 | | | 400,000 | | | | 427,000 | | | | 0.13 | % |
| | Verizon Communications, Inc. | | | | | | | | | | | | |
| | 0.700%, 11/02/2015 | | | 800,000 | | | | 797,759 | | | | 0.26 | % |
| | 6.350%, 04/01/2019 | | | 600,000 | | | | 709,577 | | | | 0.22 | % |
| | 8.750%, 11/01/2018 | | | 292,000 | | | | 376,845 | | | | 0.12 | % |
| | Vodafone Group PLC – ADR (b) | | | | | | | | | | | | |
| | 1.500%, 02/19/2018 | | | 1,000,000 | | | | 982,943 | | | | 0.31 | % |
| | 5.750%, 03/15/2016 | | | 1,000,000 | | | | 1,108,783 | | | | 0.35 | % |
| | | | | | | | | 6,574,127 | | | | 2.06 | % |
| | | | | | | | | | | | | | |
| | Utilities – 0.10% | | | | | | | | | | | | |
| | Sempra Energy | | | | | | | | | | | | |
| | 6.500%, 06/01/2016 | | | 275,000 | | | | 311,871 | | | | 0.10 | % |
| | | | | | | | | | | | | | |
| | Total Corporate Bonds | | | | | | | | | | | | |
| | (Cost $73,656,666) | | | | | | | 75,430,420 | | | | 23.67 | % |
| | | | | | | | | | | | | | |
| | MORTGAGE BACKED SECURITIES – 4.00% | | | | | | | | | | | | |
| | Federal Home Loan Mortgage Corp. | | | | | | | | | | | | |
| | 3.000%, 05/01/2042 | | | 4,431,222 | | | | 4,365,669 | | | | 1.37 | % |
| | 3.000%, 09/01/2042 | | | 2,840,651 | | | | 2,798,428 | | | | 0.88 | % |
| | 5.000%, 05/01/2020 | | | 139,267 | | | | 148,984 | | | | 0.05 | % |
| | 5.500%, 04/01/2037 | | | 265,773 | | | | 291,484 | | | | 0.09 | % |
| | Federal National Mortgage Association | | | | | | | | | | | | |
| | 2.400%, 11/07/2024 | | | 1,000,000 | | | | 917,144 | | | | 0.29 | % |
| | 3.500%, 01/01/2042 | | | 957,992 | | | | 985,132 | | | | 0.31 | % |
| | 4.000%, 12/01/2041 | | | 1,280,183 | | | | 1,351,863 | | | | 0.42 | % |
| | 4.000%, 10/01/2041 | | | 1,335,885 | | | | 1,410,581 | | | | 0.44 | % |
| | 4.500%, 08/01/2020 | | | 155,763 | | | | 166,019 | | | | 0.05 | % |
| | 6.000%, 10/01/2037 | | | 277,085 | | | | 303,794 | | | | 0.10 | % |
| | | | | | | | | | | | | | |
| | Total Mortgage Backed Securities | | | | | | | | | | | | |
| | (Cost $13,043,798) | | | | | | | 12,739,098 | | | | 4.00 | % |
| | | | | | | | | | | | | | |
| | U.S. GOVERNMENT AGENCY ISSUE – 0.99% | | | | | | | | | | | | |
| | Federal Home Loan Banks | | | | | | | | | | | | |
| | 1.000%, 08/22/2028 | | | 1,000,000 | | | | 999,291 | | | | 0.32 | % |
| | 1.000%, 06/27/2023 | | | 1,500,000 | | | | 1,472,121 | | | | 0.46 | % |
| | 5.750%, 06/15/2037 | | | 600,000 | | | | 667,664 | | | | 0.21 | % |
| | | | | | | | | | | | | | |
| | Total U.S. Government Agency Issue | | | | | | | | | | | | |
| | (Cost $3,197,945) | | | | | | | 3,139,076 | | | | 0.99 | % |
| | | | | | | | | | | | | | |
| | U.S. TREASURY OBLIGATIONS – 5.13% | | | | | | | | | | | | |
| | | | | | | | | | | | | | |
| | U.S. Treasury Bonds – 0.01% | | | | | | | | | | | | |
| | U.S. Treasury Inflation Index Bond | | | | | | | | | | | | |
| | 0.125%, 07/15/2022 | | | 25,426 | | | | 25,193 | | | | 0.01 | % |
| | | | | | | | | | | | | | |
| | Total U.S. Treasury Bonds | | | | | | | | | | | | |
| | (Cost $27,274) | | | | | | | 25,193 | | | | 0.01 | % |
The accompanying notes are an integral part of these financial statements.
| | U.S. TREASURY OBLIGATIONS | | Number | | | | | | % of | |
| | | | of Shares | | | Value | | | Net Assets | |
| | U.S. Treasury Notes – 5.12% | | | | | | | | | |
| | 2.375%, 03/31/2016 | | | 2,005,000 | | | $ | 2,099,925 | | | | 0.66 | % |
| | 4.125%, 05/15/2015 | | | 13,400,000 | | | | 14,200,342 | | | | 4.46 | % |
| | | | | | | | | | | | | | |
| | Total U.S. Treasury Notes | | | | | | | | | | | | |
| | (Cost $16,279,270) | | | | | | | 16,300,267 | | | | 5.12 | % |
| | | | | | | | | | | | | | |
| | Total U.S. Treasury Obligations | | | | | | | | | | | | |
| | (Cost $16,306,544) | | | | | | | 16,325,460 | | | | 5.13 | % |
| | | | | | | | | | | | | | |
| | EXCHANGE TRADED FUNDS – 2.98% | | | | | | | | | | | | |
| | iShares iBoxx $High Yield | | | | | | | | | | | | |
| | Corporation Bond Fund | | | 27,500 | | | | 2,568,500 | | | | 0.81 | % |
| | iShares JP Morgan Emerging Markets ETF | | | 6,500 | | | | 723,775 | | | | 0.23 | % |
| | PowerShares Senior Loan Portfolio | | | 75,000 | | | | 1,862,250 | | | | 0.58 | % |
| | SPDR Barclays Capital High Yield Bond | | | 81,500 | | | | 3,311,345 | | | | 1.04 | % |
| | SPDR Barclays Short Term | | | | | | | | | | | | |
| | High Yield Bond | | | 32,500 | | | | 1,002,950 | | | | 0.32 | % |
| | | | | | | | | | | | | | |
| | Total Exchange Traded Funds | | | | | | | | | | | | |
| | (Cost $9,427,902 ) | | | | | | | 9,468,820 | | | | 2.98 | % |
| | | | | | | | | | | | | | |
| | MUTUAL FUNDS – 0.16% | | | | | | | | | | | | |
| | Calamos Convertible Opportunity | | | | | | | | | | | | |
| | And Income Fund | | | 16,000 | | | | 209,440 | | | | 0.07 | % |
| | NGP Capital Resources Co. | | | 8,000 | | | | 59,520 | | | | 0.02 | % |
| | PennantPark Investment Corp. | | | 19,000 | | | | 213,940 | | | | 0.07 | % |
| | | | | | | | | | | | | | |
| | Total Mutual Funds | | | | | | | | | | | | |
| | (Cost $480,981) | | | | | | | 482,900 | | | | 0.16 | % |
| | | | | | | | | | | | | | |
| | SHORT-TERM INVESTMENTS – 1.28% | | | | | | | | | | |
| | | | | | | | | | | |
| | Money Market Funds – 1.28% | | | | | | | | | | | | |
| | Fidelity Government Portfolio – | | | | | | | | | | | | |
| | Institutional Class, 0.01% (c) | | | 4,059,628 | | | | 4,059,628 | | | | 1.28 | % |
| | | | | | | | | | | | | | |
| | Total Money Market Funds | | | | | | | | | | | | |
| | (Cost $4,059,628) | | | | | | | 4,059,628 | | | | 1.28 | % |
| | | | | | | | | | | | | | |
| | Total Short-Term Investments | | | | | | | | | | | | |
| | (Cost $4,059,628) | | | | | | | 4,059,628 | | | | 1.28 | % |
| | | | | | | | | | | | | | |
| | Total Investments | | | | | | | | | | | | |
| | (Cost $272,235,761) – 99.68% | | | | | | | 317,357,034 | | | | 99.68 | % |
| | | | | | | | | | | | | | |
| | Other Assets in Excess | | | | | | | | | | | | |
| | of Liabilities – 0.32% | | | | | | | 1,009,220 | | | | 0.32 | % |
| | TOTAL NET ASSETS – 100.00% | | | | | | $ | 318,366,254 | | | | 100.00 | % |
Percentages are stated as a percent of net assets.
ADR – American Depositary Receipt
| (a) | Non-income producing security. |
| (b) | U.S. traded security of a foreign corporation. |
| (c) | The rate listed is the fund’s 7-day yield as of October 31, 2013. |
The accompanying notes are an integral part of these financial statements.
HENNESSY FUNDS 1-800-966-4354
Summary of Fair Value Exposure at October 31, 2013
The following is a summary of the inputs used to value the Fund’s net assets as of October 31, 2013 (See Note 3 in the accompanying notes to the financial statements):
| Common Stock | | Level 1 | | | Level 2 | | | Level 3 | | | Total | |
| Consumer Discretionary | | $ | 20,702,569 | | | $ | — | | | $ | — | | | $ | 20,702,569 | |
| Consumer Staples | | | 37,522,039 | | | | — | | | | — | | | | 37,522,039 | |
| Energy | | | 18,280,245 | | | | — | | | | — | | | | 18,280,245 | |
| Financials | | | 33,148,207 | | | | — | | | | — | | | | 33,148,207 | |
| Health Care | | | 13,716,000 | | | | — | | | | — | | | | 13,716,000 | |
| Industrials | | | 11,266,469 | | | | — | | | | — | | | | 11,266,469 | |
| Information Technology | | | 33,431,109 | | | | — | | | | — | | | | 33,431,109 | |
| Materials | | | 20,578,641 | | | | — | | | | — | | | | 20,578,641 | |
| Telecommunication Services | | | 6,684,897 | | | | — | | | | — | | | | 6,684,897 | |
| Total Common Stock | | $ | 195,330,176 | | | $ | — | | | $ | — | | | $ | 195,330,176 | |
Preferred Stock | | $ | 75,366 | | | $ | — | | | $ | — | | | $ | 75,366 | |
REITS | | | | | | | | | | | | | | | | |
| Financials | | $ | 306,090 | | | $ | — | | | $ | — | | | $ | 306,090 | |
Corporate Bonds | | | | | | | | | | | | | | | | |
| Consumer Discretionary | | $ | — | | | $ | 4,410,550 | | | $ | — | | | $ | 4,410,550 | |
| Consumer Staples | | | — | | | | 1,641,590 | | | | — | | | | 1,641,590 | |
| Financials | | | — | | | | 43,368,911 | | | | — | | | | 43,368,911 | |
| Health Care | | | — | | | | 4,538,235 | | | | — | | | | 4,538,235 | |
| Industrials | | | — | | | | 1,027,308 | | | | — | | | | 1,027,308 | |
| Information Technology | | | — | | | | 7,375,424 | | | | — | | | | 7,375,424 | |
| Materials | | | — | | | | 6,182,404 | | | | — | | | | 6,182,404 | |
| Telecommunication Services | | | — | | | | 6,574,127 | | | | — | | | | 6,574,127 | |
| Utilities | | | — | | | | 311,871 | | | | — | | | | 311,871 | |
| Total Corporate Bonds | | $ | — | | | $ | 75,430,420 | | | $ | — | | | $ | 75,430,420 | |
Mortgage Backed Securities | | $ | — | | | $ | 12,739,098 | | | $ | — | | | $ | 12,739,098 | |
U.S. Government Agency Issues | | $ | — | | | $ | 3,139,076 | | | $ | — | | | $ | 3,139,076 | |
U.S. Treasury Obligations | | | | | | | | | | | | | | | | |
| U.S. Treasury Bonds | | $ | — | | | $ | 25,193 | | | $ | — | | | $ | 25,193 | |
| U.S. Treasury Notes | | | — | | | | 16,300,267 | | | | — | | | | 16,300,267 | |
| Total U.S. Treasury Obligations | | $ | — | | | $ | 16,325,460 | | | $ | — | | | $ | 16,325,460 | |
Exchange Traded Funds | | $ | 9,468,820 | | | $ | — | | | $ | — | | | $ | 9,468,820 | |
Mutual Funds | | $ | 482,900 | | | $ | — | | | $ | — | | | $ | 482,900 | |
Short-Term Investments | | | | | | | | | | | | | | | | |
| Money Market Funds | | $ | 4,059,628 | | | $ | — | | | $ | — | | | $ | 4,059,628 | |
| Total Short-Term Investments | | $ | 4,059,628 | | | $ | — | | | $ | — | | | $ | 4,059,628 | |
| Total Investments | | $ | 209,722,980 | | | $ | 107,634,054 | | | $ | — | | | $ | 317,357,034 | |
Transfers between levels are recognized at the end of the reporting period. During the one-year period ended October 31, 2013, the Fund recognized no transfers between levels.
The accompanying notes are an integral part of these financial statements.
HENNESSY BALANCED FUND
As of October 31, 2013
(% of Net Assets)
| | TOP TEN HOLDINGS | % net assets |
| | U.S. Treasury Bills, 0.050%, 02/06/2014 | 13.92% |
| | U.S. Treasury Bills, 0.135%, 08/21/2014 | 8.18% |
| | U.S. Treasury Bills, 0.160%, 06/06/2014 | 6.55% |
| | U.S. Treasury Bills, 0.120%, 09/18/2014 | 6.55% |
| | General Electric Co. | 5.33% |
| | EI Du Pont de Nemours & Co. | 5.24% |
| | AT&T, Inc. | 5.19% |
| | Intel Corp. | 5.05% |
| | U.S. Treasury Bills, 0.135%, 05/29/2014 | 4.91% |
| | Chevron Corp. | 4.76% |
Note: For presentation purposes, the Fund has grouped some of the industry categories. For purposes of categorizing securities for compliance with Section 8(b)(1) of the Investment Company Act of 1940, the Fund uses more specific industry classifications.
HENNESSY FUNDS 1-800-966-4354
| | COMMON STOCKS – 51.53% | | Number | | | | | | % of | |
| | | | of Shares | | | Value | | | Net Assets | |
| | Consumer Discretionary – 3.99% | | | | | | | | | |
| | McDonald’s Corp. | | | 5,050 | | | $ | 487,426 | | | | 3.99 | % |
| | | | | | | | | | | | | | |
| | Consumer Staples – 4.20% | | | | | | | | | | | | |
| | Procter & Gamble Co. | | | 6,350 | | | | 512,762 | | | | 4.20 | % |
| | | | | | | | | | | | | | |
| | Energy – 4.76% | | | | | | | | | | | | |
| | Chevron Corp. | | | 4,850 | | | | 581,806 | | | | 4.76 | % |
| | | | | | | | | | | | | | |
| | Financials – 1.08% | | | | | | | | | | | | |
| | J.P. Morgan Chase & Co. | | | 2,550 | | | | 131,427 | | | | 1.08 | % |
| | | | | | | | | | | | | | |
| | Health Care – 9.10% | | | | | | | | | | | | |
| | Merck & Co., Inc. | | | 12,900 | | | | 581,661 | | | | 4.76 | % |
| | Pfizer, Inc. | | | 17,250 | | | | 529,230 | | | | 4.34 | % |
| | | | | | | | | 1,110,891 | | | | 9.10 | % |
| | | | | | | | | | | | | | |
| | Industrials – 5.33% | | | | | | | | | | | | |
| | General Electric Co. | | | 24,900 | | | | 650,886 | | | | 5.33 | % |
| | | | | | | | | | | | | | |
| | Information Technology – 7.91% | | | | | | | | | | | | |
| | Cisco Systems, Inc. | | | 7,400 | | | | 166,500 | | | | 1.37 | % |
| | Intel Corp. | | | 25,250 | | | | 616,858 | | | | 5.05 | % |
| | Microsoft Corp. | | | 5,150 | | | | 182,052 | | | | 1.49 | % |
| | | | | | | | | 965,410 | | | | 7.91 | % |
| | | | | | | | | | | | | | |
| | Materials – 5.24% | | | | | | | | | | | | |
| | EI Du Pont de Nemours & Co. | | | 10,450 | | | | 639,540 | | | | 5.24 | % |
| | | | | | | | | | | | | | |
| | Telecommunication Services – 9.92% | | | | | | | | | | | | |
| | AT&T, Inc. | | | 17,500 | | | | 633,500 | | | | 5.19 | % |
| | Verizon Communications, Inc. | | | 11,450 | | | | 578,340 | | | | 4.73 | % |
| | | | | | | | | 1,211,840 | | | | 9.92 | % |
| | Total Common Stocks | | | | | | | | | | | | |
| | (Cost $5,334,398) | | | | | | | 6,291,988 | | | | 51.53 | % |
| | | | | | | | | | | | | | |
| | SHORT-TERM INVESTMENTS – 48.71% | | | | | | | | | | |
| | | | | | | | | | | |
| | Money Market Funds – 3.69% | | | | | | | | | | | | |
| | Fidelity Government Portfolio – | | | | | | | | | | | | |
| | Institutional Class, 0.01% (a) | | | 449,965 | | | | 449,965 | | | | 3.69 | % |
| | | | | | | | | | | | | | |
| | Total Money Market Funds | | | | | | | | | | | | |
| | (Cost $449,965) | | | | | | | 449,965 | | | | 3.69 | % |
| | | | | | | | | | | | | | |
| | U.S. Treasury Bills – 45.02% | | | | | | | | | | | | |
| | 0.050%, 02/06/2014 (b) | | | 1,700,000 | | | | 1,699,805 | | | | 13.92 | % |
| | 0.055%, 03/06/2014 (b) | | | 300,000 | | | | 299,945 | | | | 2.46 | % |
| | 0.080%, 05/01/2014 (b) | | | 300,000 | | | | 299,883 | | | | 2.45 | % |
| | 0.135%, 05/29/2014 (b) | | | 600,000 | | | | 599,778 | | | | 4.91 | % |
| | 0.160%, 06/26/2014 (b) | | | 800,000 | | | | 799,664 | | | | 6.55 | % |
| | 0.135%, 08/21/2014 (b) | | | 1,000,000 | | | | 999,400 | | | | 8.18 | % |
| | 0.120%, 09/18/2014 (b) | | | 800,000 | | | | 799,385 | | | | 6.55 | % |
| | | | | | | | | | | | | | |
| | Total U.S. Treasury Bills | | | | | | | | | | | | |
| | (Cost $5,496,913) | | | | | | | 5,497,860 | | | | 45.02 | % |
| | | | | | | | | | | | | | |
| | Total Short-Term Investments | | | | | | | | | | | | |
| | (Cost $5,946,878) | | | | | | | 5,947,825 | | | | 48.71 | % |
| | | | | | | | | | | | | | |
| | Total Investments | | | | | | | | | | | | |
| | (Cost $11,281,276) – 100.24% | | | | | | | 12,239,813 | | | | 100.24 | % |
| | | | | | | | | | | | | | |
| | Liabilities in Excess of | | | | | | | | | | | | |
| | Other Assets – (0.24)% | | | | | | | (29,239 | ) | | | (0.24 | %) |
| | TOTAL NET ASSETS – 100.00% | | | | | | $ | 12,210,574 | | | | 100.00 | % |
Percentages are stated as a percent of net assets.
| (a) | The rate listed is the fund’s 7-day yield as of October 31, 2013. |
| (b) | The rate listed is discount rate at issue. |
The accompanying notes are an integral part of these financial statements.
Summary of Fair Value Exposure at October 31, 2013
The following is a summary of the inputs used to value the Fund’s net assets as of October 31, 2013 (See Note 3 in the accompanying notes to the financial statements):
| Common Stock | | Level 1 | | | Level 2 | | | Level 3 | | | Total | |
| Consumer Discretionary | | $ | 487,426 | | | $ | — | | | $ | — | | | $ | 487,426 | |
| Consumer Staples | | | 512,762 | | | | — | | | | — | | | | 512,762 | |
| Energy | | | 581,806 | | | | — | | | | — | | | | 581,806 | |
| Financials | | | 131,427 | | | | — | | | | — | | | | 131,427 | |
| Health Care | | | 1,110,891 | | | | — | | | | — | | | | 1,110,891 | |
| Industrials | | | 650,886 | | | | — | | | | — | | | | 650,886 | |
| Information Technology | | | 965,410 | | | | — | | | | — | | | | 965,410 | |
| Materials | | | 639,540 | | | | — | | | | — | | | | 639,540 | |
| Telecommunication Services | | | 1,211,840 | | | | — | | | | — | | | | 1,211,840 | |
| Total Common Stock | | $ | 6,291,988 | | | $ | — | | | $ | — | | | $ | 6,291,988 | |
Short-Term Investments | | | | | | | | | | | | | | | | |
| Money Market Funds | | $ | 449,965 | | | $ | — | | | $ | — | | | $ | 449,965 | |
| U.S. Treasury Bills | | | — | | | | 5,497,860 | | | | — | | | | 5,497,860 | |
| Total Short-Term Investments | | $ | 449,965 | | | $ | 5,497,860 | | | $ | — | | | $ | 5,947,825 | |
| Total Investments | | $ | 6,741,953 | | | $ | 5,497,860 | | | $ | — | | | $ | 12,239,813 | |
Transfers between levels are recognized at the end of the reporting period. During the one-year period ended October 31, 2013, the Fund recognized no transfers between levels.
The accompanying notes are an integral part of these financial statements.
HENNESSY FUNDS 1-800-966-4354
HENNESSY CORE BOND FUND
As of October 31, 2013
(% of Net Assets)
| | TOP TEN HOLDINGS | % net assets |
| | Federal National Mortgage Association, 3.000%, 08/01/2042 | 8.29% |
| | Ford Motor Credit Co. LLC, 3.000%, 06/12/2017 | 5.69% |
| | iShares iBoxx $High Yield Corporation Bond Fund | 5.69% |
| | Lazard Group, 6.850%, 06/15/2017 | 5.33% |
| | The Royal Bank of Scotland PLC – ADR 4.375%, 03/16/2016 | 5.02% |
| | U.S. Treasury Note, 4.125%, 05/15/2015 | 4.96% |
| | Manulife Financial Corp. – ADR, 3.400%, 09/17/2015 | 4.89% |
| | Associates Corporation of North America, 6.950%, 11/01/2018 | 4.67% |
| | Sempra Energy, 6.500%, 06/01/2016 | 4.43% |
| | Agilent Technologies, Inc., 5.000%, 07/15/2020 | 4.26% |
Note: For presentation purposes, the Fund has grouped some of the industry categories. For purposes of categorizing securities for compliance with Section 8(b)(1) of the Investment Company Act of 1940, the Fund uses more specific industry classifications.
| | PREFERRED STOCKS – 0.88% | | Number | | | | | | % of | |
| | | | of Shares | | | Value | | | Net Assets | |
| | Financials – 0.88% | | | | | | | | | |
| | Fannie Mae Preferred (a) | | | 7,900 | | | $ | 56,169 | | | | 0.88 | % |
| | | | | | | | | | | | | | |
| | Total Preferred Stocks | | | | | | | | | | | | |
| | (Cost $197,500) | | | | | | | 56,169 | | | | 0.88 | % |
| | | | | | | | | | | | | | |
| | REITS – 1.51% | | | | | | | | | | | | |
| | | | | | | | | | | | | | |
| | Financials – 1.51% | | | | | | | | | | | | |
| | Apollo Commercial Real | | | | | | | | | | | | |
| | Estate Finance, Inc. | | | 6,000 | | | | 96,660 | | | | 1.51 | % |
| | | | | | | | | | | | | | |
| | Total REITS | | | | | | | | | | | | |
| | (Cost $99,679) | | | | | | | 96,660 | | | | 1.51 | % |
| | | | | | | | | | | | | | |
| | CORPORATE BONDS – 66.27% | | | | | | | | | | | | |
| | | | | | | | | | | | | | |
| | Consumer Discretionary – 10.02% | | | | | | | | | | | | |
| | Ford Motor Credit Co. LLC | | | | | | | | | | | | |
| | 3.000%, 06/12/2017 | | | 350,000 | | | | 364,634 | | | | 5.69 | % |
| | Royal Caribbean Cruises Ltd. – ADR (b) | | | | | | | | | | | | |
| | 7.500%, 10/15/2027 | | | 75,000 | | | | 80,625 | | | | 1.26 | % |
| | YUM! Brands, Inc. | | | | | | | | | | | | |
| | 5.300%, 09/15/2019 | | | 175,000 | | | | 196,320 | | | | 3.07 | % |
| | | | | | | | | 641,579 | | | | 10.02 | % |
| | | | | | | | | | | | | | |
| | Financials – 43.50% | | | | | | | | | | | | |
| | American International Group, Inc. | | | | | | | | | | | | |
| | 5.850%, 01/16/2018 | | | 225,000 | | | | 260,182 | | | | 4.06 | % |
| | Associated Banc-Corp | | | | | | | | | | | | |
| | 5.125%, 03/28/2016 | | | 250,000 | | | | 269,813 | | | | 4.21 | % |
| | Associates Corporation | | | | | | | | | | | | |
| | of North America | | | | | | | | | | | | |
| | 6.950%, 11/01/2018 | | | 250,000 | | | | 299,075 | | | | 4.67 | % |
| | Bank of Nova Scotia – ADR (b) | | | | | | | | | | | | |
| | 2.550%, 01/12/2017 | | | 150,000 | | | | 156,425 | | | | 2.44 | % |
| | Citigroup, Inc. | | | | | | | | | | | | |
| | 6.125%, 11/21/2017 | | | 40,000 | | | | 46,471 | | | | 0.73 | % |
| | Discover Financial Services | | | | | | | | | | | | |
| | 5.200%, 04/27/2022 | | | 175,000 | | | | 186,110 | | | | 2.91 | % |
| | Lazard Group | | | | | | | | | | | | |
| | 6.850%, 06/15/2017 | | | 300,000 | | | | 341,266 | | | | 5.33 | % |
| | Manulife Financial Corp. – ADR (b) | | | | | | | | | | | | |
| | 3.400%, 09/17/2015 | | | 300,000 | | | | 313,154 | | | | 4.89 | % |
| | Prudential Financial, Inc. | | | | | | | | | | | | |
| | 5.500%, 03/15/2016 | | | 198,000 | | | | 217,948 | | | | 3.40 | % |
| | Royal Bank of Canada – ADR (b) | | | | | | | | | | | | |
| | 2.200%, 07/27/2018 | | | 150,000 | | | | 151,847 | | | | 2.37 | % |
| | The Hartford Financial | | | | | | | | | | | | |
| | Services Group, Inc. | | | | | | | | | | | | |
| | 5.375%, 03/15/2017 | | | 200,000 | | | | 222,411 | | | | 3.47 | % |
| | The Royal Bank of | | | | | | | | | | | | |
| | Scotland PLC – ADR (b) | | | | | | | | | | | | |
| | 4.375%, 03/16/2016 | | | 300,000 | | | | 321,612 | | | | 5.02 | % |
| | | | | | | | | 2,786,314 | | | | 43.50 | % |
| | | | | | | | | | | | | | |
| | Health Care – 4.26% | | | | | | | | | | | | |
| | Agilent Technologies, Inc. | | | | | | | | | | | | |
| | 5.000%, 07/15/2020 | | | 250,000 | | | | 273,001 | | | | 4.26 | % |
| | | | | | | | | | | | | | |
| | Information Technology – 2.41% | | | | | | | | | | | | |
| | KLA-Tencor Corp. | | | | | | | | | | | | |
| | 6.900%, 05/01/2018 | | | 130,000 | | | | 154,352 | | | | 2.41 | % |
| | | | | | | | | | | | | | |
| | Materials – 1.65% | | | | | | | | | | | | |
| | El du Pont de Nemours & Co. | | | | | | | | | | | | |
| | 4.750%, 03/15/2015 | | | 100,000 | | | | 105,656 | | | | 1.65 | % |
| | | | | | | | | | | | | | |
| | Utilities – 4.43% | | | | | | | | | | | | |
| | Sempra Energy | | | | | | | | | | | | |
| | 6.500%, 06/01/2016 | | | 250,000 | | | | 283,520 | | | | 4.43 | % |
| | | | | | | | | | | | | | |
| | Total Corporate Bonds | | | | | | | | | | | | |
| | (Cost $3,979,857) | | | | | | | 4,244,422 | | | | 66.27 | % |
| | | | | | | | | | | | | | |
| | MORTGAGE BACKED SECURITIES – 8.29% | | | | | | | | | | | | |
| | | | | | | | | | | | | | |
| | U.S. Government Agency Issues – 8.29% | | | | | | | | | | | | |
| | Federal National Mortgage Association | | | | | | | | | | | | |
| | 3.000%, 08/01/2042 | | | 536,906 | | | | 531,270 | | | | 8.29 | % |
| | | | | | | | | | | | | | |
| | Total U.S. Government | | | | | | | | | | | | |
| | Agency Issues | | | | | | | | | | | | |
| | (Cost $553,330) | | | | | | | 531,270 | | | | 8.29 | % |
| | | | | | | | | | | | | | |
| | Total Mortgage Backed Securities | | | | | | | | | | | | |
| | (Cost $553,330) | | | | | | | 531,270 | | | | 8.29 | % |
| | | | | | | | | | | | | | |
| | U.S. TREASURY OBLIGATIONS – 5.17% | | | | | | | | | | | | |
| | | | | | | | | | | | | | |
| | U.S. Treasury Bonds – 0.21% | | | | | | | | | | | | |
| | 6.250%, 08/15/2023 | | | 10,000 | | | | 13,305 | | | | 0.21 | % |
| | | | | | | | | | | | | | |
| | Total U.S. Treasury Bonds | | | | | | | | | | | | |
| | (Cost $14,030) | | | | | | | 13,305 | | | | 0.21 | % |
| | | | | | | | | | | | | | |
| | U.S. Treasury Notes – 4.96% | | | | | | | | | | | | |
| | 4.125%, 05/15/2015 | | | 300,000 | | | | 317,918 | | | | 4.96 | % |
| | | | | | | | | | | | | | |
| | Total U.S. Treasury Notes | | | | | | | | | | | | |
| | (Cost $317,390) | | | | | | | 317,918 | | | | 4.96 | % |
| | | | | | | | | | | | | | |
| | Total U.S. Treasury Obligations | | | | | | | | | | | | |
| | (Cost $331,420) | | | | | | | 331,223 | | | | 5.17 | % |
| | | | | | | | | | | | | | |
| | EXCHANGE TRADED FUNDS – 15.15% | | | | | | | | | | | | |
| | iShares iBoxx $High Yield | | | | | | | | | | | | |
| | Corporation Bond Fund | | | 3,900 | | | | 364,260 | | | | 5.69 | % |
| | iShares JP Morgan Emerging Markets ETF | | | 1,200 | | | | 133,620 | | | | 2.09 | % |
| | PowerShares Senior Loan Portfolio | | | 10,000 | | | | 248,300 | | | | 3.88 | % |
| | SPDR Barclays Capital High Yield Bond | | | 5,500 | | | | 223,465 | | | | 3.49 | % |
| | | | | | | | | | | | | | |
| | Total Exchange Traded Funds | | | | | | | | | | | | |
| | (Cost $959,618) | | | | | | | 969,645 | | | | 15.15 | % |
The accompanying notes are an integral part of these financial statements.
HENNESSY FUNDS 1-800-966-4354
| | SHORT-TERM INVESTMENTS – 1.64% | | Number | | | | | | % of | |
| | | | of Shares | | | Value | | | Net Assets | |
| | Money Market Funds – 1.64% | | | | | | | | | |
| | Fidelity Government Portfolio – | | | | | | | | | |
| | Institutional Class, 0.01% (c) | | | 105,249 | | | $ | 105,249 | | | | 1.64 | % |
| | | | | | | | | | | | | | |
| | Total Money Market Funds | | | | | | | | | | | | |
| | (Cost $105,249) | | | | | | | 105,249 | | | | 1.64 | % |
| | | | | | | | | | | | | | |
| | Total Short-Term Investments | | | | | | | | | | | | |
| | (Cost $105,249) | | | | | | | 105,249 | | | | 1.64 | % |
| | | | | | | | | | | | | | |
| | Total Investments | | | | | | | | | | | | |
| | (Cost $6,226,653) – 98.91% | | | | | | | 6,334,638 | | | | 98.91 | % |
| | | | | | | | | | | | | | |
| | Other Assets in Excess | | | | | | | | | | | | |
| | of Liabilities – 1.09% | | | | | | | 70,033 | | | | 1.09 | % |
| | TOTAL NET ASSETS – 100.00% | | | | | | $ | 6,404,671 | | | | 100.00 | % |
Percentages are stated as a percent of net assets.
ADR – American Depositary Receipt
| (a) | Non-income producing security. |
| (b) | U.S. traded security of a foreign corporation. |
| (c) | The rate listed is the fund’s 7-day yield as of October 31, 2013. |
The accompanying notes are an integral part of these financial statements.
Summary of Fair Value Exposure at October 31, 2013
The following is a summary of the inputs used to value the Fund’s net assets as of October 31, 2013 (See Note 3 in the accompanying notes to the financial statements):
| | | Level 1 | | | Level 2 | | | Level 3 | | | Total | |
| Preferred Stock | | $ | 56,169 | | | $ | — | | | $ | — | | | $ | 56,169 | |
REITS | | | | | | | | | | | | | | | | |
| Financials | | $ | 96,660 | | | $ | — | | | $ | — | | | $ | 96,660 | |
Corporate Bonds | | | | | | | | | | | | | | | | |
| Consumer Discretionary | | $ | — | | | $ | 641,579 | | | $ | — | | | $ | 641,579 | |
| Financials | | | — | | | | 2,786,314 | | | | — | | | | 2,786,314 | |
| Health Care | | | — | | | | 273,001 | | | | — | | | | 273,001 | |
| Information Technology | | | — | | | | 154,352 | | | | — | | | | 154,352 | |
| Materials | | | — | | | | 105,656 | | | | — | | | | 105,656 | |
| Utilities | | | — | | | | 283,520 | | | | — | | | | 283,520 | |
| Total Corporate Bonds | | $ | — | | | $ | 4,244,422 | | | $ | — | | | $ | 4,244,422 | |
Mortgage Backed Securities | | $ | — | | | $ | 531,270 | | | $ | — | | | $ | 531,270 | |
U.S. Treasury Obligations | | | | | | | | | | | | | | | | |
| U.S. Treasury Bonds | | $ | — | | | $ | 13,305 | | | $ | — | | | $ | 13,305 | |
| U.S. Treasury Notes | | | — | | | | 317,918 | | | | — | | | | 317,918 | |
| Total U.S. Treasury Obligations | | $ | — | | | $ | 331,223 | | | $ | — | | | $ | 331,223 | |
Exchange Traded Funds | | $ | 969,645 | | | $ | — | | | $ | — | | | $ | 969,645 | |
Short-Term Investments | | | | | | | | | | | | | | | | |
| Money Market Funds | | $ | 105,249 | | | $ | — | | | $ | — | | | $ | 105,249 | |
| Total Short-Term Investments | | $ | 105,249 | | | $ | — | | | $ | — | | | $ | 105,249 | |
| Total Investments | | $ | 1,227,723 | | | $ | 5,106,915 | | | $ | — | | | $ | 6,334,638 | |
Transfers between levels are recognized at the end of the reporting period. During the one-year period ended October 31, 2013, the Fund recognized no transfers between levels.
The accompanying notes are an integral part of these financial statements.
HENNESSY FUNDS 1-800-966-4354
HENNESSY GAS UTILITY INDEX FUND
As of October 31, 2013
(% of Net Assets)
| | TOP TEN EQUITY HOLDINGS | % net assets |
| | Cheniere Energy, Inc. | 5.05% |
| | TransCanada Corp. | 4.97% |
| | Sempra Energy | 4.96% |
| | National Grid PLC – ADR | 4.94% |
| | Energy Transfer Equity, LP | 4.91% |
| | Spectra Energy Corp. | 4.91% |
| | Kinder Morgan, Inc. | 4.90% |
| | Enbridge, Inc. | 4.84% |
| | Dominion Resources, Inc. | 4.79% |
| | ONEOK, Inc. | 4.64% |
Note: For presentation purposes, the Fund has grouped some of the industry categories. For purposes of categorizing securities for compliance with Section 8(b)(1) of the Investment Company Act of 1940, the Fund uses more specific industry classifications.
| | COMMON STOCKS – 93.36% | | Number | | | | | | % of | |
| | | | of Shares | | | Value | | | Net Assets | |
| | Energy – 26.25% | | | | | | | | | |
| | Cheniere Energy, Inc. (a) | | | 1,501,617 | | | $ | 59,764,357 | | | | 5.05 | % |
| | Enbridge, Inc. (b) | | | 1,319,348 | | | | 57,246,510 | | | | 4.84 | % |
| | Energen Corp. | | | 113,492 | | | | 8,888,693 | | | | 0.75 | % |
| | EQT Corp. | | | 113,960 | | | | 9,756,116 | | | | 0.83 | % |
| | Kinder Morgan, Inc. | | | 1,642,225 | | | | 57,986,965 | | | | 4.90 | % |
| | Spectra Energy Corp. | | | 1,631,115 | | | | 58,018,760 | | | | 4.91 | % |
| | TransCanada Corp. (b) | | | 1,303,827 | | | | 58,815,636 | | | | 4.97 | % |
| | | | | | | | | 310,477,037 | | | | 26.25 | % |
| | | | | | | | | | | | | | |
| | Financials – 0.52% | | | | | | | | | | | | |
| | Berkshire Hathaway, Inc., Class A (a) | | | 36 | | | | 6,227,813 | | | | 0.52 | % |
| | | | | | | | | | | | | | |
| | Utilities – 66.59% | | | | | | | | | | | | |
| | AGL Resources, Inc. | | | 730,416 | | | | 34,957,710 | | | | 2.97 | % |
| | ALLETE, Inc. | | | 2,050 | | | | 103,587 | | | | 0.01 | % |
| | Alliant Energy Corp. | | | 59,854 | | | | 3,125,576 | | | | 0.26 | % |
| | Ameren Corp. | | | 134,890 | | | | 4,880,320 | | | | 0.41 | % |
| | Atmos Energy Corp. | | | 692,762 | | | | 30,668,574 | | | | 2.59 | % |
| | Avista Corp. | | | 81,472 | | | | 2,264,107 | | | | 0.19 | % |
| | Black Hills Corp. | | | 70,459 | | | | 3,573,680 | | | | 0.30 | % |
| | Centerpoint Energy, Inc. | | | 1,183,226 | | | | 29,107,360 | | | | 2.46 | % |
| | Chesapeake Utilities Corp. | | | 54,769 | | | | 2,979,981 | | | | 0.25 | % |
| | CMS Energy Corp. | | | 604,148 | | | | 16,589,904 | | | | 1.40 | % |
| | Consolidated Edison, Inc. | | | 363,886 | | | | 21,185,443 | | | | 1.79 | % |
| | Corning Natural Gas Corp. | | | 17,634 | | | | 313,003 | | | | 0.03 | % |
| | Delta Natural Gas Company, Inc. | | | 48,605 | | | | 1,084,864 | | | | 0.09 | % |
| | Dominion Resources, Inc. | | | 888,596 | | | | 56,647,995 | | | | 4.79 | % |
| | DTE Energy Co. | | | 204,454 | | | | 14,135,950 | | | | 1.20 | % |
| | Duke Energy Corp. | | | 110,837 | | | | 7,950,338 | | | | 0.67 | % |
| | Entergy Corp. | | | 10,700 | | | | 692,504 | | | | 0.06 | % |
| | Exelon Corp. | | | 360,381 | | | | 10,285,274 | | | | 0.87 | % |
| | Gas Natural, Inc. | | | 52,943 | | | | 527,842 | | | | 0.04 | % |
| | Iberdrola SA – ADR (b) | | | 341,190 | | | | 8,563,869 | | | | 0.72 | % |
| | Integrys Energy Group, Inc. | | | 308,488 | | | | 18,102,076 | | | | 1.53 | % |
| | MDU Resources Group, Inc. | | | 507,607 | | | | 15,116,536 | | | | 1.28 | % |
| | MGE Energy, Inc. | | | 25,517 | | | | 1,436,862 | | | | 0.12 | % |
| | National Fuel Gas Co. | | | 356,324 | | | | 25,494,982 | | | | 2.16 | % |
| | National Grid PLC – ADR (b) | | | 928,198 | | | | 58,411,500 | | | | 4.94 | % |
| | New Jersey Resources Corp. | | | 237,142 | | | | 10,915,646 | | | | 0.92 | % |
| | NiSource, Inc. | | | 1,420,631 | | | | 44,778,289 | | | | 3.79 | % |
| | Northeast Utilities | | | 147,475 | | | | 6,325,203 | | | | 0.53 | % |
| | Northwest Natural Gas Co. | | | 185,694 | | | | 8,064,690 | | | | 0.68 | % |
| | Northwestern Corp. | | | 86,998 | | | | 3,987,988 | | | | 0.34 | % |
| | NV Energy, Inc. | | | 45,450 | | | | 1,078,983 | | | | 0.09 | % |
| | ONEOK, Inc. | | | 970,315 | | | | 54,822,798 | | | | 4.64 | % |
| | Pepco Holdings, Inc. | | | 59,904 | | | | 1,154,949 | | | | 0.10 | % |
| | PG&E Corp. | | | 798,799 | | | | 33,429,738 | | | | 2.83 | % |
| | Piedmont Natural Gas Company, Inc. | | | 571,566 | | | | 19,513,263 | | | | 1.65 | % |
| | PPL Corp. | | | 482,035 | | | | 14,764,732 | | | | 1.25 | % |
| | Public Service Enterprise Group, Inc. | | | 738,790 | | | | 24,749,465 | | | | 2.09 | % |
| | Questar Corp. | | | 1,031,115 | | | | 24,396,181 | | | | 2.06 | % |
| | RGC Resources, Inc. | | | 34,310 | | | | 638,852 | | | | 0.05 | % |
| | SCANA Corp. | | | 192,466 | | | | 8,974,690 | | | | 0.76 | % |
| | Sempra Energy | | | 643,940 | | | | 58,688,692 | | | | 4.96 | % |
| | South Jersey Industries, Inc. | | | 163,070 | | | | 9,710,818 | | | | 0.82 | % |
| | Southwest Gas Corp. | | | 323,723 | | | | 17,565,210 | | | | 1.49 | % |
| | TECO Energy, Inc. | | | 226,736 | | | | 3,893,057 | | | | 0.33 | % |
| | The Empire District Electric Co. | | | 21,700 | | | | 488,033 | | | | 0.04 | % |
| | The Laclede Group, Inc. | | | 234,833 | | | | 11,053,589 | | | | 0.93 | % |
| | UGI Corp. | | | 191,435 | | | | 7,919,666 | | | | 0.67 | % |
| | UIL Holdings Corp. | | | 171,433 | | | | 6,603,599 | | | | 0.56 | % |
| | Unitil Corp. | | | 58,523 | | | | 1,768,565 | | | | 0.15 | % |
| | UNS Energy Corp. | | | 18,280 | | | | 904,494 | | | | 0.08 | % |
| | Vectren Corp. | | | 237,416 | | | | 8,290,567 | | | | 0.70 | % |
| | WGL Holdings, Inc. | | | 337,487 | | | | 15,190,290 | | | | 1.28 | % |
| | Wisconsin Energy Corp. | | | 187,460 | | | | 7,893,941 | | | | 0.67 | % |
| | Xcel Energy, Inc. | | | 410,899 | | | | 11,858,545 | | | | 1.00 | % |
| | | | | | | | | 787,624,370 | | | | 66.59 | % |
| | Total Common Stocks | | | | | | | | | | | | |
| | (Cost $805,955,404) | | | | | | | 1,104,329,220 | | | | 93.36 | % |
| | | | | | | | | | | | | | |
| | PARTNERSHIPS – 4.91% | | | | | | | | | | | | |
| | | | | | | | | | | | | | |
| | Energy – 4.91% | | | | | | | | | | | | |
| | Energy Transfer Equity, LP | | | 858,704 | | | | 58,039,803 | | | | 4.91 | % |
| | | | | | | | | | | | | | |
| | Total Partnerships | | | | | | | | | | | | |
| | (Cost $26,607,911) | | | | | | | 58,039,803 | | | | 4.91 | % |
The accompanying notes are an integral part of these financial statements.
HENNESSY FUNDS 1-800-966-4354
| | SHORT-TERM INVESTMENTS – 1.76% | | Number | | | | | | % of | |
| | | | of Shares | | | Value | | | Net Assets | |
| | Money Market Funds – 1.76% | | | | | | | | | |
| | Fidelity Government Portfolio – | | | | | | | | | |
| | Institutional Class, 0.010% (c) | | | 20,792,508 | | | $ | 20,792,508 | | | | 1.76 | % |
| | | | | | | | | | | | | | |
| | Total Money Market Funds | | | | | | | | | | | | |
| | (Cost $20,792,508) | | | | | | | 20,792,508 | | | | 1.76 | % |
| | | | | | | | | | | | | | |
| | Total Short-Term Investments | | | | | | | | | | | | |
| | (Cost $20,792,508) | | | | | | | 20,792,508 | | | | 1.76 | % |
| | | | | | | | | | | | | | |
| | Total Investments | | | | | | | | | | | | |
| | (Cost $853,355,823) – 100.03% | | | | | | | 1,183,161,531 | | | | 100.03 | % |
| | | | | | | | | | | | | | |
| | Liabilities in Excess | | | | | | | | | | | | |
| | of Other Assets – (0.03)% | | | | | | | (370,683 | ) | | | (0.03 | )% |
| | TOTAL NET ASSETS – 100.00% | | | | | | $ | 1,182,790,848 | | | | 100.00 | % |
Percentages are stated as a percent of net assets.
ADR – American Depositary Receipt
| (a) | Non-income producing security. |
| (b) | U.S. traded security of a foreign corporation. |
| (c) | The rate listed is the fund’s 7-day yield as of October 31, 2013. |
Summary of Fair Value Exposure at October 31, 2013
The following is a summary of the inputs used to value the Fund’s net assets as of October 31, 2013 (See Note 3 in the accompanying notes to the financial statements):
| Common Stock | | Level 1 | | | Level 2 | | | Level 3 | | | Total | |
| Energy | | $ | 310,477,037 | | | $ | — | | | $ | — | | | $ | 310,477,037 | |
| Financials | | | 6,227,813 | | | | — | | | | — | | | | 6,227,813 | |
| Utilities | | | 787,311,367 | | | | 313,003 | | | | — | | | | 787,624,370 | |
| Total Common Stock | | $ | 1,104,016,217 | | | $ | 313,003 | | | $ | — | | | $ | 1,104,329,220 | |
Partnerships | | | | | | | | | | | | | | | | |
| Energy | | $ | 58,039,803 | | | $ | — | | | $ | — | | | $ | 58,039,803 | |
| Total Partnerships | | $ | 58,039,803 | | | $ | — | | | $ | — | | | $ | 58,039,803 | |
Short-Term Investments | | | | | | | | | | | | | | | | |
| Money Market Funds | | $ | 20,792,508 | | | $ | — | | | $ | — | | | $ | 20,792,508 | |
| Total Short-Term Investments | | $ | 20,792,508 | | | $ | — | | | $ | — | | | $ | 20,792,508 | |
| Total Investments | | $ | 1,182,848,528 | | | $ | 313,003 | | | $ | — | | | $ | 1,183,161,531 | |
Transfers between levels are recognized at the end of the reporting period. During the one-year period ended October 31, 2013, the Fund recognized no transfers between levels.
The accompanying notes are an integral part of these financial statements.
HENNESSY SMALL CAP FINANCIAL FUND
As of October 31, 2013
(% of Net Assets)
| | TOP TEN EQUITY HOLDINGS | % net assets |
| | Encore Capital Group, Inc. | 3.13% |
| | Genworth Financial, Inc. | 3.12% |
| | Banner Corp. | 3.06% |
| | Radian Group, Inc. | 3.06% |
| | MGIC Investment Corp. | 3.05% |
| | BankUnited, Inc. | 3.01% |
| | HomeStreet, Inc. | 2.98% |
| | Ocwen Financial Corp. | 2.94% |
| | Wintrust Financial Corp. | 2.86% |
| | Nationstar Mortgage Holdings, Inc. | 2.79% |
Note: For presentation purposes, the Fund has grouped some of the industry categories. For purposes of categorizing securities for compliance with Section 8(b)(1) of the Investment Company Act of 1940, the Fund uses more specific industry classifications.
HENNESSY FUNDS 1-800-966-4354
| | COMMON STOCKS – 95.12% | | Number | | | | | | % of | |
| | | | of Shares | | | Value | | | Net Assets | |
| | Consumer Discretionary – 1.58% | | | | | | | | | |
| | KB Home | | | 290,000 | | | $ | 4,921,300 | | | | 1.58 | % |
| | | | | | | | | | | | | | |
| | Financials – 91.44% | | | | | | | | | | | | |
| | Astoria Financial Corp. | | | 660,000 | | | | 8,718,600 | | | | 2.79 | % |
| | Bancorp Inc. Del (a) | | | 420,000 | | | | 6,791,400 | | | | 2.17 | % |
| | BankUnited, Inc. | | | 305,000 | | | | 9,384,850 | | | | 3.01 | % |
| | Banner Corp. | | | 250,000 | | | | 9,565,000 | | | | 3.06 | % |
| | Brookline Bancorp, Inc. | | | 140,000 | | | | 1,241,800 | | | | 0.40 | % |
| | Capital Bank Financial Corp. (a) | | | 170,000 | | | | 3,777,400 | | | | 1.21 | % |
| | CapitalSource, Inc. | | | 440,000 | | | | 5,755,200 | | | | 1.84 | % |
| | Customers Bancorp, Inc. (a) | | | 245,800 | | | | 4,117,150 | | | | 1.32 | % |
| | Encore Capital Group, Inc. (a) | | | 200,000 | | | | 9,770,000 | | | | 3.13 | % |
| | Everbank Financial Corp. | | | 225,000 | | | | 3,402,000 | | | | 1.09 | % |
| | First Bancorp (a) (b) | | | 1,175,000 | | | | 6,521,250 | | | | 2.09 | % |
| | First Connecticut Bancorp, Inc. | | | 165,000 | | | | 2,422,200 | | | | 0.78 | % |
| | First Horizon National Corp. | | | 40,000 | | | | 426,000 | | | | 0.14 | % |
| | First Niagara Financial Group, Inc. | | | 225,000 | | | | 2,481,750 | | | | 0.79 | % |
| | Flagstar Bancorp, Inc. (a) | | | 505,000 | | | | 8,186,050 | | | | 2.62 | % |
| | Flushing Financial Corp. | | | 430,000 | | | | 8,638,700 | | | | 2.77 | % |
| | Forestar Group, Inc. (a) | | | 55,000 | | | | 1,228,150 | | | | 0.39 | % |
| | Fulton Financial Corp. | | | 365,000 | | | | 4,456,650 | | | | 1.43 | % |
| | Genworth Financial, Inc. (a) | | | 670,000 | | | | 9,735,100 | | | | 3.12 | % |
| | Green Dot Corp., Class A (a) | | | 80,000 | | | | 1,716,800 | | | | 0.55 | % |
| | Hingham Institution for Savings | | | 94,000 | | | | 6,835,680 | | | | 2.19 | % |
| | Home Loan Servicing Solutions LTD (b) | | | 210,000 | | | | 4,958,100 | | | | 1.59 | % |
| | HomeStreet, Inc. | | | 490,000 | | | | 9,319,800 | | | | 2.98 | % |
| | Independent Bank Corp – Mich (a) | | | 221,000 | | | | 2,148,120 | | | | 0.69 | % |
| | Independent Bank Corp. | | | 35,000 | | | | 1,255,800 | | | | 0.40 | % |
| | Investors Bancorp, Inc. | | | 175,000 | | | | 4,149,250 | | | | 1.33 | % |
| | KKR Financial Holdings LLC | | | 595,000 | | | | 5,896,450 | | | | 1.89 | % |
| | MBIA, Inc. (a) | | | 595,000 | | | | 6,765,150 | | | | 2.17 | % |
| | MGIC Investment Corp. (a) | | | 1,170,000 | | | | 9,523,800 | | | | 3.05 | % |
| | National Bank Holdings Corp. | | | 135,000 | | | | 2,835,000 | | | | 0.91 | % |
| | Nationstar Mortgage Holdings, Inc. (a) | | | 170,000 | | | | 8,724,400 | | | | 2.79 | % |
| | NorthStar Realty Finance Corp. | | | 765,000 | | | | 7,137,450 | | | | 2.29 | % |
| | OceanFirst Financial Corp. | | | 230,400 | | | | 4,052,736 | | | | 1.30 | % |
| | Ocwen Financial Corp. (a) | | | 163,000 | | | | 9,165,490 | | | | 2.94 | % |
| | PHH Corp. (a) | | | 315,000 | | | | 7,575,750 | | | | 2.43 | % |
| | Popular, Inc. (a) (b) | | | 345,000 | | | | 8,711,250 | | | | 2.79 | % |
| | Portfolio Recovery Associates, Inc. (a) | | | 38,000 | | | | 2,259,100 | | | | 0.72 | % |
| | Provident Financial Services, Inc. | | | 285,000 | | | | 5,340,900 | | | | 1.71 | % |
| | Radian Group, Inc. | | | 655,000 | | | | 9,543,350 | | | | 3.06 | % |
| | RAIT Financial Trust | | | 730,000 | | | | 5,511,500 | | | | 1.77 | % |
| | Rockville Financial, Inc. | | | 195,000 | | | | 2,564,250 | | | | 0.82 | % |
| | Sterling Financial Corp. | | | 270,000 | | | | 7,819,200 | | | | 2.50 | % |
| | Stonegate Mortgage Corp. (a) | | | 85,000 | | | | 1,503,650 | | | | 0.48 | % |
| | Synovus Financial Corp. | | | 2,430,000 | | | | 7,897,500 | | | | 2.52 | % |
| | TCF Financial Corp. | | | 110,000 | | | | 1,669,800 | | | | 0.53 | % |
| | Territorial Bancorp, Inc. | | | 105,000 | | | | 2,290,050 | | | | 0.73 | % |
| | United Financial Bancorp, Inc. | | | 190,294 | | | | 2,983,810 | | | | 0.96 | % |
| | Walter Investment | | | | | | | | | | | | |
| | Management Corp. (a) | | | 225,000 | | | | 8,498,250 | | | | 2.72 | % |
| | Washington Federal, Inc. | | | 305,000 | | | | 6,947,900 | | | | 2.23 | % |
| | Wintrust Financial Corp. | | | 205,000 | | | | 8,919,550 | | | | 2.86 | % |
| | WSFS Financial Corp. | | | 42,000 | | | | 2,940,420 | | | | 0.94 | % |
| | Zions Bancorp. | | | 50,000 | | | | 1,418,500 | | | | 0.45 | % |
| | | | | | | | | 285,498,006 | | | | 91.44 | % |
| | | | | | | | | | | | | | |
| | Information Technology – 2.10% | | | | | | | | | | | | |
| | Alliance Data Systems Corp. (a) | | | 7,000 | | | | 1,659,420 | | | | 0.53 | % |
| | Heartland Payment Systems, Inc. | | | 55,000 | | | | 2,224,750 | | | | 0.71 | % |
| | Total System Services, Inc. | | | 90,000 | | | | 2,684,700 | | | | 0.86 | % |
| | | | | | | | | 6,568,870 | | | | 2.10 | % |
| | Total Common Stocks | | | | | | | | | | | | |
| | (Cost $233,029,429) | | | | | | | 296,988,176 | | | | 95.12 | % |
| | | | | | | | | | | | | | |
| | REITS – 2.13% | | | | | | | | | | | | |
| | | | | | | | | | | | | | |
| | Financials – 2.13% | | | | | | | | | | | | |
| | Gramercy Property Trust, Inc. (a) | | | 215,000 | | | | 982,550 | | | | 0.32 | % |
| | Pennymac Mortgage Investment Trust | | | 245,000 | | | | 5,652,150 | | | | 1.81 | % |
| | | | | | | | | | | | | | |
| | Total REITS | | | | | | | | | | | | |
| | (Cost $6,756,243) | | | | | | | 6,634,700 | | | | 2.13 | % |
| | | | | | | | | | | | | | |
| | MUTUAL FUNDS – 0.58% | | | | | | | | | | | | |
| | American Capital Ltd. (a) | | | 130,000 | | | | 1,821,300 | | | | 0.58 | % |
| | | | | | | | | | | | | | |
| | Total Mutual Funds | | | | | | | | | | | | |
| | (Cost $1,412,812) | | | | | | | 1,821,300 | | | | 0.58 | % |
The accompanying notes are an integral part of these financial statements.
| | SHORT-TERM INVESTMENTS – 2.48% | | Number | | | | | | % of | |
| | | | of Shares | | | Value | | | Net Assets | |
| | Money Market Funds – 2.48% | | | | | | | | | |
| | Fidelity Government Portfolio – | | | | | | | | | |
| | Institutional Class, 0.010% (c) | | | 7,735,181 | | | $ | 7,735,181 | | | | 2.48 | % |
| | | | | | | | | | | | | | |
| | Total Money Market Funds | | | | | | | | | | | | |
| | (Cost $7,735,181) | | | | | | | 7,735,181 | | | | 2.48 | % |
| | | | | | | | | | | | | | |
| | Total Short-Term Investments | | | | | | | | | | | | |
| | (Cost $7,735,181) | | | | | | | 7,735,181 | | | | 2.48 | % |
| | | | | | | | | | | | | | |
| | Total Investments | | | | | | | | | | | | |
| | (Cost $248,933,665) – 100.31% | | | | | | | 313,179,357 | | | | 100.31 | % |
| | | | | | | | | | | | | | |
| | Liabilities in Excess of | | | | | | | | | | | | |
| | Other Assets – (0.31)% | | | | | | | (956,828 | ) | | | (0.31 | )% |
| | TOTAL NET ASSETS – 100.00% | | | | | | $ | 312,222,529 | | | | 100.00 | % |
Percentages are stated as a percent of net assets.
| (a) | Non-income producing security. |
| (b) | U.S. traded security of a foreign corporation. |
| (c) | The rate listed is the fund’s 7-day yield as of October 31, 2013. |
Summary of Fair Value Exposure at October 31, 2013
The following is a summary of the inputs used to value the Fund’s net assets as of October 31, 2013 (See Note 3 in the accompanying notes to the financial statements):
| Common Stock | | Level 1 | | | Level 2 | | | Level 3 | | | Total | |
| Consumer Discretionary | | $ | 4,921,300 | | | $ | — | | | $ | — | | | $ | 4,921,300 | |
| Financials | | | 285,498,006 | | | | — | | | | — | | | | 285,498,006 | |
| Information Technology | | | 6,568,870 | | | | — | | | | — | | | | 6,568,870 | |
| Total Common Stock | | $ | 296,988,176 | | | $ | — | | | $ | — | | | $ | 296,988,176 | |
REITS | | | | | | | | | | | | | | | | |
| Financials | | $ | 6,634,700 | | | $ | — | | | $ | — | | | $ | 6,634,700 | |
| Total REITS | | $ | 6,634,700 | | | $ | — | | | $ | — | | | $ | 6,634,700 | |
Mutual Funds | | | | | | | | | | | | | | | | |
| Mutual Funds | | $ | 1,821,300 | | | $ | — | | | $ | — | | | $ | 1,821,300 | |
| Total Mutual Funds | | $ | 1,821,300 | | | $ | — | | | $ | — | | | $ | 1,821,300 | |
Short-Term Investments | | | | | | | | | | | | | | | | |
| Money Market Funds | | $ | 7,735,181 | | | $ | — | | | $ | — | | | $ | 7,735,181 | |
| Total Short-Term Investments | | $ | 7,735,181 | | | $ | — | | | $ | — | | | $ | 7,735,181 | |
| Total Investments | | $ | 313,179,357 | | | $ | — | | | $ | — | | | $ | 313,179,357 | |
Transfers between levels are recognized at the end of the reporting period. During the one-year period ended October 31, 2013, the Fund recognized no transfers between levels.
The accompanying notes are an integral part of these financial statements.
HENNESSY FUNDS 1-800-966-4354
HENNESSY LARGE CAP FINANCIAL FUND
As of October 31, 2013
(% of Net Assets)
| | TOP TEN EQUITY HOLDINGS | % net assets |
| | American International Group, Inc. | 4.97% |
| | Discover Financial Services | 4.82% |
| | Citigroup, Inc. | 4.75% |
| | Visa, Inc., Class A | 4.68% |
| | J.P. Morgan Chase & Co. | 4.67% |
| | MasterCard, Inc., Class A | 4.63% |
| | Regions Financial Corp. | 4.58% |
| | SunTrust Banks, Inc. | 4.57% |
| | Fifth Third Bancorp | 4.57% |
| | Morgan Stanley | 4.56% |
Note: For presentation purposes, the Fund has grouped some of the industry categories. For purposes of categorizing securities for compliance with Section 8(b)(1) of the Investment Company Act of 1940, the Fund uses more specific industry classifications.
| | COMMON STOCKS – 94.30% | | Number | | | | | | % of | |
| | | | of Shares | | | Value | | | Net Assets | |
| | Financials – 84.99% | | | | | | | | | |
| | American Express Co. | | | 5,000 | | | $ | 409,000 | | | | 0.46 | % |
| | American International Group, Inc. | | | 85,000 | | | | 4,390,250 | | | | 4.97 | % |
| | Bank of America Corp. | | | 281,000 | | | | 3,922,760 | | | | 4.44 | % |
| | Capital One Financial Corp. | | | 57,000 | | | | 3,914,190 | | | | 4.43 | % |
| | CIT Group, Inc. (a) | | | 82,000 | | | | 3,949,120 | | | | 4.47 | % |
| | Citigroup, Inc. | | | 86,000 | | | | 4,195,080 | | | | 4.75 | % |
| | Comerica, Inc. | | | 53,000 | | | | 2,294,900 | | | | 2.60 | % |
| | Discover Financial Services | | | 82,000 | | | | 4,254,160 | | | | 4.82 | % |
| | Fifth Third Bancorp | | | 212,000 | | | | 4,034,360 | | | | 4.57 | % |
| | Huntington Bancshares, Inc. | | | 325,000 | | | | 2,860,000 | | | | 3.24 | % |
| | J.P. Morgan Chase & Co. | | | 80,000 | | | | 4,123,200 | | | | 4.67 | % |
| | KeyCorp | | | 145,000 | | | | 1,816,850 | | | | 2.06 | % |
| | MetLife, Inc. | | | 83,000 | | | | 3,926,730 | | | | 4.45 | % |
| | Morgan Stanley | | | 140,000 | | | | 4,022,200 | | | | 4.56 | % |
| | Prudential Financial, Inc. | | | 39,000 | | | | 3,174,210 | | | | 3.59 | % |
| | Regions Financial Corp. | | | 420,000 | | | | 4,044,600 | | | | 4.58 | % |
| | SunTrust Banks, Inc. | | | 120,000 | | | | 4,036,800 | | | | 4.57 | % |
| | The Goldman Sachs Group, Inc. | | | 23,000 | | | | 3,699,780 | | | | 4.19 | % |
| | The PNC Financial Services Group, Inc. | | | 54,000 | | | | 3,970,620 | | | | 4.50 | % |
| | The Travelers Companies, Inc. | | | 39,000 | | | | 3,365,700 | | | | 3.81 | % |
| | U.S. Bancorp (b) | | | 50,000 | | | | 1,868,000 | | | | 2.12 | % |
| | Wells Fargo & Co. | | | 65,000 | | | | 2,774,850 | | | | 3.14 | % |
| | | | | | | | | 75,047,360 | | | | 84.99 | % |
| | | | | | | | | | | | | | |
| | Information Technology – 9.31% | | | | | | | | | | | | |
| | MasterCard, Inc., Class A | | | 5,700 | | | | 4,087,470 | | | | 4.63 | % |
| | Visa, Inc., Class A | | | 21,000 | | | | 4,130,070 | | | | 4.68 | % |
| | | | | | | | | 8,217,540 | | | | 9.31 | % |
| | Total Common Stocks | | | | | | | | | | | | |
| | (Cost $66,445,357) | | | | | | | 83,264,900 | | | | 94.30 | % |
| | | | | | | | | | | | | | |
| | PARTNERSHIPS – 4.37% | | | | | | | | | | | | |
| | | | | | | | | | | | | | |
| | Financials – 4.37% | | | | | | | | | | | | |
| | Blackstone Group L.P. | | | 147,000 | | | | 3,863,160 | | | | 4.37 | % |
| | | | | | | | | | | | | | |
| | Total Partnerships | | | | | | | | | | | | |
| | (Cost $2,344,667) | | | | | | | 3,863,160 | | | | 4.37 | % |
| | | | | | | | | | | | | | |
| | SHORT-TERM INVESTMENTS – 1.32% | | | | | | | | | | |
| | | | | | | | | | | |
| | Money Market Funds – 1.32% | | | | | | | | | | | | |
| | Fidelity Government Portfolio – | | | | | | | | | | | | |
| | Institutional Class, 0.01% (c) | | | 1,165,263 | | | | 1,165,263 | | | | 1.32 | % |
| | | | | | | | | | | | | | |
| | Total Money Market Funds | | | | | | | | | | | | |
| | (Cost $1,165,263) | | | | | | | 1,165,263 | | | | 1.32 | % |
| | | | | | | | | | | | | | |
| | Total Short-Term Investments | | | | | | | | | | | | |
| | (Cost $1,165,263) | | | | | | | 1,165,263 | | | | 1.32 | % |
| | | | | | | | | | | | | | |
| | Total Investments | | | | | | | | | | | | |
| | (Cost $69,955,287) – 99.99% | | | | | | | 88,293,323 | | | | 99.99 | % |
| | | | | | | | | | | | | | |
| | Other Assets in Excess | | | | | | | | | | | | |
| | of Liabilities – 0.01% | | | | | | | 7,646 | | | | 0.01 | % |
| | TOTAL NET ASSETS – 100.00% | | | | | | $ | 88,300,969 | | | | 100.00 | % |
Percentages are stated as a percent of net assets.
| (a) | Non-income producing security. |
| (b) | Investment in affiliated security. Quasar Distributors, LLC, which serves as the Fund’s distributor, is a subsidiary of U.S. Bancorp. Details of transactions with this affiliated company for the year ended October 31, 2013, are as follows: |
| | Issuer | U.S. Bancorp | |
| | Beginning Cost | $1,688,883 | |
| | Purchase Cost | $1,687,355 | |
| | Sales Cost | $1,636,888 | |
| | Ending Cost | $1,739,350 | |
| | Dividend Income | $46,850 | |
| | Shares | 50,000 | |
| | Market Value | $1,868,000 | |
| (c) | The rate listed is the fund’s 7-day yield as of October 31, 2013. |
The accompanying notes are an integral part of these financial statements.
HENNESSY FUNDS 1-800-966-4354
Summary of Fair Value Exposure at October 31, 2013
The following is a summary of the inputs used to value the Fund’s net assets as of October 31, 2013 (See Note 3 in the accompanying notes to the financial statements):
| Common Stock | | Level 1 | | | Level 2 | | | Level 3 | | | Total | |
| Financials | | $ | 75,047,360 | | | $ | — | | | $ | — | | | $ | 75,047,360 | |
| Information Technology | | | 8,217,540 | | | | — | | | | — | | | | 8,217,540 | |
| Total Common Stock | | $ | 83,264,900 | | | $ | — | | | $ | — | | | $ | 83,264,900 | |
Partnerships | | | | | | | | | | | | | | | | |
| Financials | | $ | 3,863,160 | | | $ | — | | | $ | — | | | $ | 3,863,160 | |
| Total Partnerships | | $ | 3,863,160 | | | $ | — | | | $ | — | | | $ | 3,863,160 | |
Short-Term Investments | | | | | | | | | | | | | | | | |
| Money Market Funds | | $ | 1,165,263 | | | $ | — | | | $ | — | | | $ | 1,165,263 | |
| Total Short-Term Investments | | $ | 1,165,263 | | | $ | — | | | $ | — | | | $ | 1,165,263 | |
| Total Investments | | $ | 88,293,323 | | | $ | — | | | $ | — | | | $ | 88,293,323 | |
Transfers between levels are recognized at the end of the reporting period. During the one-year period ended October 31, 2013, the Fund recognized no transfers between levels.
The accompanying notes are an integral part of these financial statements.
HENNESSY TECHNOLOGY FUND
As of October 31, 2013
(% of Net Assets)
| | TOP TEN EQUITY HOLDINGS | % net assets |
| | Illumina, Inc. | 4.57% |
| | Dover Corp. | 4.52% |
| | Tripadvisor, Inc. | 4.41% |
| | Alexion Pharmaceuticals, Inc. | 4.39% |
| | SanDisk Corp. | 4.39% |
| | salesforce.com, Inc. | 4.37% |
| | priceline.com, Inc. | 4.36% |
| | LinkedIn Corp., Class A | 4.23% |
| | NetFlix, Inc. | 4.17% |
| | Microchip Technology, Inc. | 4.01% |
Note: For presentation purposes, the Fund has grouped some of the industry categories. For purposes of categorizing securities for compliance with Section 8(b)(1) of the Investment Company Act of 1940, the Fund uses more specific industry classifications.
HENNESSY FUNDS 1-800-966-4354
| | COMMON STOCKS – 95.23% | | Number | | | | | | % of | |
| | | | of Shares | | | Value | | | Net Assets | |
| | Consumer Discretionary – 14.23% | | | | | | | | | |
| | Dreamworks Animation SKG Inc. (a) | | | 2,135 | | | $ | 73,103 | | | | 1.29 | % |
| | NetFlix, Inc. (a) | | | 735 | | | | 237,023 | | | | 4.17 | % |
| | priceline.com, Inc. (a) | | | 235 | | | | 247,650 | | | | 4.36 | % |
| | Tripadvisor, Inc. (a) | | | 3,030 | | | | 250,611 | | | | 4.41 | % |
| | | | | | | | | 808,387 | | | | 14.23 | % |
| | | | | | | | | | | | | | |
| | Financials – 1.33% | | | | | | | | | | | | |
| | Zillow, Inc. (a) | | | 950 | | | | 75,648 | | | | 1.33 | % |
| | | | | | | | | | | | | | |
| | Health Care – 15.99% | | | | | | | | | | | | |
| | Alexion Pharmaceuticals, Inc. (a) | | | 2,030 | | | | 249,588 | | | | 4.39 | % |
| | athenahealth, Inc. (a) | | | 1,005 | | | | 134,177 | | | | 2.36 | % |
| | Illumina, Inc. (a) | | | 2,773 | | | | 259,303 | | | | 4.57 | % |
| | MedAssets, Inc. (a) | | | 1,530 | | | | 35,236 | | | | 0.62 | % |
| | Medidata Solutions, Inc. (a) | | | 670 | | | | 73,908 | | | | 1.30 | % |
| | Omnicell, Inc. (a) | | | 1,310 | | | | 30,222 | | | | 0.53 | % |
| | Seattle Genetics, Inc. (a) | | | 3,260 | | | | 125,934 | | | | 2.22 | % |
| | | | | | | | | 908,368 | | | | 15.99 | % |
| | | | | | | | | | | | | | |
| | Industrials – 4.52% | | | | | | | | | | | | |
| | Dover Corp. | | | 2,800 | | | | 257,012 | | | | 4.52 | % |
| | | | | | | | | | | | | | |
| | Information Technology – 58.55% | | | | | | | | | | | | |
| | 3D Systems Corp. (a) | | | 2,742 | | | | 170,662 | | | | 3.00 | % |
| | Alliance Fiber Optic Products, Inc. | | | 1,640 | | | | 30,455 | | | | 0.54 | % |
| | Comm Vault Systems, Inc. (a) | | | 1,255 | | | | 97,990 | | | | 1.73 | % |
| | CoStar Group, Inc. (a) | | | 775 | | | | 137,167 | | | | 2.42 | % |
| | Cree, Inc. (a) | | | 3,510 | | | | 213,233 | | | | 3.75 | % |
| | Dealertrack Technologies Inc. (a) | | | 1,100 | | | | 41,030 | | | | 0.72 | % |
| | Ellie Mae, Inc. (a) | | | 1,010 | | | | 29,189 | | | | 0.51 | % |
| | Envestnet, Inc. (a) | | | 897 | | | | 32,561 | | | | 0.57 | % |
| | Euronet Worldwide, Inc. (a) | | | 1,260 | | | | 54,684 | | | | 0.96 | % |
| | Fleetmatics Group PLC (a)(b) | | | 995 | | | | 31,591 | | | | 0.56 | % |
| | Guidewire Software, Inc. (a) | | | 1,550 | | | | 78,616 | | | | 1.38 | % |
| | IAC Interactivecorp | | | 2,260 | | | | 120,661 | | | | 2.12 | % |
| | Infoblox, Inc. (a) | | | 1,365 | | | | 60,674 | | | | 1.07 | % |
| | J2 Global, Inc. | | | 1,150 | | | | 63,227 | | | | 1.11 | % |
| | LinkedIn Corp., Class A (a) | | | 1,075 | | | | 240,445 | | | | 4.23 | % |
| | Methode Electronics, Inc. | | | 1,130 | | | | 28,905 | | | | 0.51 | % |
| | Microchip Technology, Inc. | | | 5,300 | | | | 227,688 | | | | 4.01 | % |
| | Monotype Imaging Holdings, Inc. | | | 1,180 | | | | 33,300 | | | | 0.59 | % |
| | NetSuite, Inc. (a) | | | 1,955 | | | | 197,220 | | | | 3.47 | % |
| | NIC, Inc. | | | 1,700 | | | | 41,854 | | | | 0.74 | % |
| | PROS Holdings, Inc. (a) | | | 973 | | | | 34,396 | | | | 0.61 | % |
| | Responsys, Inc. (a) | | | 1,875 | | | | 30,637 | | | | 0.54 | % |
| | RF Industries Ltd. | | | 3,875 | | | | 35,611 | | | | 0.63 | % |
| | salesforce.com, Inc. (a) | | | 4,650 | | | | 248,124 | | | | 4.37 | % |
| | SanDisk Corp. | | | 3,590 | | | | 249,505 | | | | 4.39 | % |
| | Semtech Corp. (a) | | | 1,705 | | | | 53,043 | | | | 0.93 | % |
| | Servicenow, Inc. (a) | | | 3,675 | | | | 200,692 | | | | 3.53 | % |
| | SPS Commerce, Inc. (a) | | | 450 | | | | 30,668 | | | | 0.54 | % |
| | SS&C Technologies Holdings, Inc. (a) | | | 2,030 | | | | 79,779 | | | | 1.41 | % |
| | Stratasys Ltd. (a)(b) | | | 1,055 | | | | 119,458 | | | | 2.10 | % |
| | Synchronoss Technologies, Inc. (a) | | | 1,010 | | | | 34,966 | | | | 0.62 | % |
| | Tangoe, Inc. (a) | | | 1,455 | | | | 27,791 | | | | 0.49 | % |
| | The Ultimate Software Group, Inc. (a) | | | 760 | | | | 117,405 | | | | 2.07 | % |
| | TriQuint Semiconductor, Inc. (a) | | | 6,960 | | | | 55,193 | | | | 0.97 | % |
| | Tyler Technologies, Inc. (a) | | | 800 | | | | 77,368 | | | | 1.36 | % |
| | | | | | | | | 3,325,788 | | | | 58.55 | % |
| | | | | | | | | | | | | | |
| | Telecommunication Services – 0.61% | | | | | | | | | | | | |
| | 8x8 Inc. (a) | | | 3,000 | | | | 34,380 | | | | 0.61 | % |
| | | | | | | | | | | | | | |
| | Total Common Stocks | | | | | | | | | | | | |
| | (Cost $4,522,914) | | | | | | | 5,409,583 | | | | 95.23 | % |
| | | | | | | | | | | | | | |
| | MUTUAL FUNDS – 0.63% | | | | | | | | | | | | |
| | Hercules Technology Growth Capital, Inc. | | | 2,320 | | | | 35,821 | | | | 0.63 | % |
| | | | | | | | | | | | | | |
| | Total Mutual Funds | | | | | | | | | | | | |
| | (Cost $30,636) | | | | | | | 35,821 | | | | 0.63 | % |
| | | | | | | | | | | | | | |
| | SHORT-TERM INVESTMENTS- 3.45% | | | | | | | | | | | | |
| | | | | | | | | | | | | | |
| | Money Market Funds – 3.45% | | | | | | | | | | | | |
| | Fidelity Government Portfolio – | | | | | | | | | | | | |
| | Institutional Class, 0.010% (c) | | | 196,206 | | | | 196,206 | | | | 3.45 | % |
| | | | | | | | | | | | | | |
| | Total Money Market Funds | | | | | | | | | | | | |
| | (Cost $196,206) | | | | | | | 196,206 | | | | 3.45 | % |
| | | | | | | | | | | | | | |
| | Total Short-Term Investments | | | | | | | | | | | | |
| | (Cost $196,206) | | | | | | | 196,206 | | | | 3.45 | % |
| | | | | | | | | | | | | | |
| | Total Investments | | | | | | | | | | | | |
| | (Cost $4,749,756) – 99.31% | | | | | | | 5,641,610 | | | | 99.31 | % |
| | | | | | | | | | | | | | |
| | Other Assets in Excess | | | | | | | | | | | | |
| | of Liabilities – 0.69% | | | | | | | 38,839 | | | | 0.69 | % |
| | TOTAL NET ASSETS – 100.00% | | | | | | $ | 5,680,449 | | | | 100.00 | % |
Percentages are stated as a percent of net assets.
| (a) | Non-income producing security. |
| (b) | U.S. traded security of a foreign corporation. |
| (c) | The rate listed is the fund’s 7-day yield as of October 31, 2013. |
The accompanying notes are an integral part of these financial statements.
Summary of Fair Value Exposure at October 31, 2013
The following is a summary of the inputs used to value the Fund’s net assets as of October 31, 2013 (See Note 3 in the accompanying notes to the financial statements):
| Common Stock | | Level 1 | | | Level 2 | | | Level 3 | | | Total | |
| Consumer Discretionary | | $ | 808,387 | | | $ | — | | | $ | — | | | $ | 808,387 | |
| Financials | | | 75,648 | | | | — | | | | — | | | | 75,648 | |
| Health Care | | | 908,368 | | | | — | | | | — | | | | 908,368 | |
| Industrials | | | 257,012 | | | | — | | | | — | | | | 257,012 | |
| Information Technology | | | 3,325,788 | | | | — | | | | — | | | | 3,325,788 | |
| Telecommunication Services | | | 34,380 | | | | — | | | | — | | | | 34,380 | |
| Total Common Stock | | $ | 5,409,583 | | | $ | — | | | $ | — | | | $ | 5,409,583 | |
Mutual Funds | | | | | | | | | | | | | | | | |
| Mutual Funds | | $ | 35,821 | | | $ | — | | | $ | — | | | $ | 35,821 | |
| Total Mutual Funds | | $ | 35,821 | | | $ | — | | | $ | — | | | $ | 35,821 | |
Short-Term Investments | | | | | | | | | | | | | | | | |
| Money Market Funds | | $ | 196,206 | | | $ | — | | | $ | — | | | $ | 196,206 | |
| Total Short-Term Investments | | $ | 196,206 | | | $ | — | | | $ | — | | | $ | 196,206 | |
| Total Investments | | $ | 5,641,610 | | | $ | — | | | $ | — | | | $ | 5,641,610 | |
Transfers between levels are recognized at the end of the reporting period. During the one-year period ended October 31, 2013, the Fund recognized no transfers between levels.
The accompanying notes are an integral part of these financial statements.
HENNESSY FUNDS 1-800-966-4354
HENNESSY JAPAN FUND
As of October 31, 2013
(% of Net Assets)
| | TOP TEN EQUITY HOLDINGS | % net assets |
| | Keyence Corp. | 5.82% |
| | Nidec Corp. | 5.73% |
| | Ryohin Keikaku Co., Ltd. | 5.60% |
| | Rohto Pharmaceutical Co., Ltd. | 5.14% |
| | Misumi Group, Inc. | 5.05% |
| | Kao Corp. | 4.97% |
| | Terumo Corp. | 4.96% |
| | Toyota Motor Corp. | 4.93% |
| | Unicharm Corp. | 4.91% |
| | Mitsubishi Corp. | 4.89% |
Note: For presentation purposes, the Fund has grouped some of the industry categories. For purposes of categorizing securities for compliance with Section 8(b)(1) of the Investment Company Act of 1940, the Fund uses more specific industry classifications.
| | COMMON STOCKS – 95.38% | | Number | | | | | | % of | |
| | | | of Shares | | | Value | | | Net Assets | |
| | Consumer Discretionary – 24.72% | | | | | | | | | |
| | ASICS Corp. | | | 110,800 | | | $ | 1,946,014 | | | | 4.82 | % |
| | Isuzu Motors, Ltd. | | | 294,000 | | | | 1,817,879 | | | | 4.50 | % |
| | Ryohin Keikaku Co., Ltd. | | | 22,700 | | | | 2,260,073 | | | | 5.60 | % |
| | Shimano, Inc. | | | 22,500 | | | | 1,967,863 | | | | 4.87 | % |
| | Toyota Motor Corp. | | | 30,800 | | | | 1,992,149 | | | | 4.93 | % |
| | | | | | | | | 9,983,978 | | | | 24.72 | % |
| | | | | | | | | | | | | | |
| | Consumer Staples – 14.30% | | | | | | | | | | | | |
| | Kao Corp. | | | 60,400 | | | | 2,005,553 | | | | 4.97 | % |
| | Pigeon Corp. | | | 34,800 | | | | 1,787,247 | | | | 4.42 | % |
| | Unicharm Corp. | | | 31,000 | | | | 1,983,016 | | | | 4.91 | % |
| | | | | | | | | 5,775,816 | | | | 14.30 | % |
| | | | | | | | | | | | | | |
| | Financials – 7.70% | | | | | | | | | | | | |
| | Mizuho Financial Group | | | 556,200 | | | | 1,159,575 | | | | 2.87 | % |
| | Sumitomo Mitsui Financial Group, Inc. | | | 40,700 | | | | 1,951,597 | | | | 4.83 | % |
| | | | | | | | | 3,111,172 | | | | 7.70 | % |
| | | | | | | | | | | | | | |
| | Health Care – 11.04% | | | | | | | | | | | | |
| | Mani, Inc. | | | 9,900 | | | | 379,569 | | | | 0.94 | % |
| | Rohto Pharmaceutical Co., Ltd. | | | 143,000 | | | | 2,075,267 | | | | 5.14 | % |
| | Terumo Corp. | | | 41,600 | | | | 2,005,329 | | | | 4.96 | % |
| | | | | | | | | 4,460,165 | | | | 11.04 | % |
| | | | | | | | | | | | | | |
| | Industrials – 26.99% | | | | | | | | | | | | |
| | Daikin Industries | | | 21,200 | | | | 1,213,831 | | | | 3.01 | % |
| | Itochu Corp. | | | 52,500 | | | | 628,954 | | | | 1.56 | % |
| | Komatsu, Ltd. | | | 9,800 | | | | 213,282 | | | | 0.53 | % |
| | Marubeni Corp. | | | 83,000 | | | | 647,422 | | | | 1.60 | % |
| | Misumi Group, Inc. | | | 69,900 | | | | 2,039,490 | | | | 5.05 | % |
| | Mitsubishi Corp. | | | 98,000 | | | | 1,975,348 | | | | 4.89 | % |
| | Nidec Corp. | | | 23,900 | | | | 2,316,353 | | | | 5.73 | % |
| | Sumitomo Corp. | | | 143,900 | | | | 1,865,885 | | | | 4.62 | % |
| | | | | | | | | 10,900,565 | | | | 26.99 | % |
| | | | | | | | | | | | | | |
| | Information Technology – 5.82% | | | | | | | | | | | | |
| | Keyence Corp. | | | 5,500 | | | | 2,349,232 | | | | 5.82 | % |
| | | | | | | | | | | | | | |
| | Materials – 4.81% | | | | | | | | | | | | |
| | Fuji Seal International, Inc. | | | 64,700 | | | | 1,942,382 | | | | 4.81 | % |
| | | | | | | | | | | | | | |
| | Total Common Stocks | | | | | | | | | | | | |
| | (Cost $28,645,614) | | | | | | | 38,523,310 | | | | 95.38 | % |
| | | | | | | | | | | | | | |
| | SHORT-TERM INVESTMENTS – 3.94% | | | | | | | | | | |
| | | | | | | | | | | |
| | Money Market Funds – 3.94% | | | | | | | | | | | | |
| | Fidelity Government Portfolio – | | | | | | | | | | | | |
| | Institutional Class, 0.01% (a) | | | 1,593,133 | | | | 1,593,133 | | | | 3.94 | % |
| | | | | | | | | | | | | | |
| | Total Money Market Funds | | | | | | | | | | | | |
| | (Cost $1,593,133) | | | | | | | 1,593,133 | | | | 3.94 | % |
| | | | | | | | | | | | | | |
| | Total Short-Term Investments | | | | | | | | | | | | |
| | (Cost $1,593,133) | | | | | | | 1,593,133 | | | | 3.94 | % |
| | | | | | | | | | | | | | |
| | Total Investments | | | | | | | | | | | | |
| | (Cost $30,238,747) – 99.32% | | | | | | | 40,116,443 | | | | 99.32 | % |
| | | | | | | | | | | | | | |
| | Other Assets in Excess | | | | | | | | | | | | |
| | of Liabilities – 0.68% | | | | | | | 276,591 | | | | 0.68 | % |
| | TOTAL NET ASSETS – 100.00% | | | | | | $ | 40,393,034 | | | | 100.00 | % |
Percentages are stated as a percent of net assets.
| (a) | The rate listed is the fund’s 7-day yield as of October 31, 2013. |
The accompanying notes are an integral part of these financial statements.
HENNESSY FUNDS 1-800-966-4354
Summary of Fair Value Exposure at October 31, 2013
The following is a summary of the inputs used to value the Fund’s net assets as of October 31, 2013 (See Note 3 in the accompanying notes to the financial statements):
| Common Stock | | Level 1 | | | Level 2 | | | Level 3 | | | Total | |
| Consumer Discretionary | | $ | 9,983,978 | | | $ | — | | | $ | — | | | $ | 9,983,978 | |
| Consumer Staples | | | 5,775,816 | | | | — | | | | — | | | | 5,775,816 | |
| Financials | | | 3,111,172 | | | | — | | | | — | | | | 3,111,172 | |
| Health Care | | | 4,460,165 | | | | — | | | | — | | | | 4,460,165 | |
| Industrials | | | 10,900,565 | | | | — | | | | — | | | | 10,900,565 | |
| Information Technology | | | 2,349,232 | | | | — | | | | — | | | | 2,349,232 | |
| Materials | | | 1,942,382 | | | | — | | | | — | | | | 1,942,382 | |
| Total Common Stock | | $ | 38,523,310 | | | $ | — | | | $ | — | | | $ | 38,523,310 | |
Short-Term Investments | | | | | | | | | | | | | | | | |
| Money Market Funds | | $ | 1,593,133 | | | $ | — | | | $ | — | | | $ | 1,593,133 | |
| Total Short-Term Investments | | $ | 1,593,133 | | | $ | — | | | $ | — | | | $ | 1,593,133 | |
| Total Investments | | $ | 40,116,443 | | | $ | — | | | $ | — | | | $ | 40,116,443 | |
Transfers between levels are recognized at the end of the reporting period. During the one-year period ended October 31, 2013, the Fund recognized no transfers between levels.
The accompanying notes are an integral part of these financial statements.
HENNESSY JAPAN SMALL CAP FUND
As of October 31, 2013
(% of Net Assets)
| | TOP TEN EQUITY HOLDINGS | % net assets |
| | Elecom Co., Ltd. | 2.30% |
| | Yokowo Co., Ltd. | 2.26% |
| | Haseko Corp. | 2.21% |
| | Nissei Build Kogyo Co., Ltd. | 2.16% |
| | Okamura Corp. | 2.14% |
| | SBS Holdings, Inc. | 2.14% |
| | Prestige International, Inc. | 2.04% |
| | Hanwa Co., Ltd. | 1.97% |
| | Tocalo Co., Ltd. | 1.94% |
| | Information Services International – Dentsu, Ltd. | 1.90% |
Note: For presentation purposes, the Fund has grouped some of the industry categories. For purposes of categorizing securities for compliance with Section 8(b)(1) of the Investment Company Act of 1940, the Fund uses more specific industry classifications.
HENNESSY FUNDS 1-800-966-4354
| | COMMON STOCKS – 90.18% | | Number | | | | | | % of | |
| | | | of Shares | | | Value | | | Net Assets | |
| | Consumer Discretionary – 22.57% | | | | | | | | | |
| | Ahresty Corp. | | | 35,000 | | | $ | 276,925 | | | | 1.87 | % |
| | Alpen Co., Ltd. | | | 11,900 | | | | 247,125 | | | | 1.67 | % |
| | Bic Camera Inc. | | | 400 | | | | 196,481 | | | | 1.32 | % |
| | Doshisha Co., Ltd. | | | 18,700 | | | | 270,620 | | | | 1.83 | % |
| | Faltec Co., Ltd. | | | 7,000 | | | | 274,077 | | | | 1.85 | % |
| | Hagihara Industries Inc. | | | 8,800 | | | | 119,833 | | | | 0.81 | % |
| | Haseko Corp. | | | 44,500 | | | | 327,652 | | | | 2.21 | % |
| | Komeri Co., Ltd. | | | 10,000 | | | | 243,568 | | | | 1.64 | % |
| | Nissei Build Kogyo Co., Ltd. | | | 164,000 | | | | 320,228 | | | | 2.16 | % |
| | Nojima Corp. | | | 37,000 | | | | 274,687 | | | | 1.85 | % |
| | Sankyo Seiko Co. | | | 79,000 | | | | 268,341 | | | | 1.81 | % |
| | Seiren Co., Ltd | | | 43,200 | | | | 274,585 | | | | 1.85 | % |
| | T Rad Co., Ltd. | | | 80,000 | | | | 252,212 | | | | 1.70 | % |
| | | | | | | | | 3,346,334 | | | | 22.57 | % |
| | | | | | | | | | | | | | |
| | Consumer Staples – 1.73% | | | | | | | | | | | | |
| | S Foods, Inc. | | | 25,500 | | | | 256,219 | | | | 1.73 | % |
| | | | | | | | | | | | | | |
| | Industrials – 30.23% | | | | | | | | | | | | |
| | Anest Iwata Corp. | | | 55,000 | | | | 269,043 | | | | 1.81 | % |
| | Central Glass Co., Ltd. | | | 80,000 | | | | 277,433 | | | | 1.87 | % |
| | Hanwa Co., Ltd. | | | 63,000 | | | | 292,159 | | | | 1.97 | % |
| | Japan Pulp & Paper Co., Ltd. | | | 85,000 | | | | 274,026 | | | | 1.85 | % |
| | Kato Works Co., Ltd. | | | 30,000 | | | | 205,024 | | | | 1.38 | % |
| | Kito Corp. | | | 12,600 | | | | 197,592 | | | | 1.33 | % |
| | Kitz Corp. | | | 61,200 | | | | 262,650 | | | | 1.77 | % |
| | Kondotec, Inc. | | | 20,000 | | | | 152,141 | | | | 1.03 | % |
| | Kyosan Electric Manufacturing Co., Ltd. | | | 84,000 | | | | 278,491 | | | | 1.88 | % |
| | Miyaji Engineering Group, Inc. | | | 120,000 | | | | 264,823 | | | | 1.79 | % |
| | Nittoku Engineering Co., Ltd. | | | 26,900 | | | | 238,278 | | | | 1.61 | % |
| | Okamura Corp. | | | 44,000 | | | | 317,706 | | | | 2.14 | % |
| | Prestige International, Inc. | | | 32,200 | | | | 301,926 | | | | 2.04 | % |
| | SBS Holdings, Inc. | | | 21,500 | | | | 317,045 | | | | 2.14 | % |
| | Shin Nippon Air Technologies Co., Ltd. | | | 40,100 | | | | 250,803 | | | | 1.69 | % |
| | Tatsuta Electric Wire and Cable Co,. Ltd. | | | 17,900 | | | | 125,972 | | | | 0.85 | % |
| | Teikoku Electric Manufacturing Co., Ltd. | | | 7,200 | | | | 168,998 | | | | 1.14 | % |
| | Tocalo Co., Ltd. | | | 17,600 | | | | 287,456 | | | | 1.94 | % |
| | | | | | | | | 4,481,566 | | | | 30.23 | % |
| | | | | | | | | | | | | | |
| | Information Technology – 22.22% | | | | | | | | | | | | |
| | Aiphone Co., Ltd. | | | 9,600 | | | | 156,892 | | | | 1.06 | % |
| | Asahi Net, Inc. | | | 40,000 | | | | 198,109 | | | | 1.34 | % |
| | Elecom Co., Ltd. | | | 24,100 | | | | 341,415 | | | | 2.30 | % |
| | EM Systems Co., Ltd. | | | 1,800 | | | | 36,538 | | | | 0.25 | % |
| | Hakuto Co., Ltd. | | | 19,900 | | | | 192,058 | | | | 1.29 | % |
| | Information Services | | | | | | | | | | | | |
| | International – Dentsu, Ltd. | | | 25,000 | | | | 281,450 | | | | 1.90 | % |
| | Iriso Electronics | | | 6,800 | | | | 266,938 | | | | 1.80 | % |
| | Macnica, Inc. | | | 10,100 | | | | 273,120 | | | | 1.84 | % |
| | NET One Systems Co., Ltd. | | | 23,100 | | | | 160,923 | | | | 1.09 | % |
| | Nichicon Corp. | | | 12,500 | | | | 130,047 | | | | 0.88 | % |
| | SIIX Corp. | | | 13,900 | | | | 169,350 | | | | 1.14 | % |
| | Sumida Corp. | | | 52,000 | | | | 247,493 | | | | 1.67 | % |
| | Tamura Corp. | | | 70,000 | | | | 183,667 | | | | 1.24 | % |
| | Towa Corp. | | | 30,600 | | | | 175,515 | | | | 1.18 | % |
| | UT Holdings Co., Ltd. | | | 35,400 | | | | 144,725 | | | | 0.98 | % |
| | Yokowo Co., Ltd. | | | 59,200 | | | | 334,742 | | | | 2.26 | % |
| | | | | | | | | 3,292,982 | | | | 22.22 | % |
| | | | | | | | | | | | | | |
| | Materials – 13.43% | | | | | | | | | | | | |
| | Chuetsu Pulp & Paper Co., Ltd. | | | 96,000 | | | | 155,232 | | | | 1.05 | % |
| | Daiken Corp. | | | 100,000 | | | | 271,535 | | | | 1.83 | % |
| | Fujikura Kasei Co., Ltd. | | | 33,500 | | | | 181,928 | | | | 1.23 | % |
| | Harima Chemicals Group, Inc. | | | 29,900 | | | | 147,478 | | | | 1.00 | % |
| | Hodogaya Chemical Co., Ltd. | | | 99,000 | | | | 203,377 | | | | 1.37 | % |
| | JSP Corp. | | | 17,000 | | | | 269,531 | | | | 1.82 | % |
| | Konishi Co., Ltd. | | | 6,000 | | | | 120,696 | | | | 0.81 | % |
| | Riken Technos Corp. | | | 31,000 | | | | 138,401 | | | | 0.93 | % |
| | Tomoku Co., Ltd. | | | 82,000 | | | | 261,019 | | | | 1.76 | % |
| | Yushiro Chemical Industry Co., Ltd. | | | 26,600 | | | | 241,572 | | | | 1.63 | % |
| | | | | | | | | 1,990,769 | | | | 13.43 | % |
| | | | | | | | | | | | | | |
| | Total Common Stocks | | | | | | | | | | | | |
| | (Cost $12,120,555) | | | | | | | 13,367,870 | | | | 90.18 | % |
| | | | | | | | | | | | | | |
| | SHORT-TERM INVESTMENTS – 8.56% | | | | | | | | | | | | |
| | | | | | | | | | | | | | |
| | Money Market Funds – 8.56% | | | | | | | | | | | | |
| | Federated Government Obligations | | | | | | | | | | | | |
| | Fund – Class I, 0.01% (a) | | | 529,394 | | | | 529,394 | | | | 3.57 | % |
| | Fidelity Government Portfolio – | | | | | | | | | | | | |
| | Institutional Class, 0.01% (a) | | | 739,000 | | | | 739,000 | | | | 4.99 | % |
| | | | | | | | | | | | | | |
| | Total Money Market Funds | | | | | | | | | | | | |
| | (Cost $1,268,394) | | | | | | | 1,268,394 | | | | 8.56 | % |
| | | | | | | | | | | | | | |
| | Total Short-Term Investments | | | | | | | | | | | | |
| | (Cost $1,268,394) | | | | | | | 1,268,394 | | | | 8.56 | % |
| | | | | | | | | | | | | | |
| | Total Investments | | | | | | | | | | | | |
| | (Cost $13,388,949) – 98.74% | | | | | | | 14,636,264 | | | | 98.74 | % |
| | | | | | | | | | | | | | |
| | Other Assets in Excess | | | | | | | | | | | | |
| | of Liabilities – 1.26% | | | | | | | 187,079 | | | | 1.26 | % |
| | TOTAL NET ASSETS – 100.00% | | | | | | $ | 14,823,343 | | | | 100.00 | % |
Percentages are stated as a percent of net assets.
| (a) | The rate listed is the fund’s 7-day yield as of October 31, 2013. |
The accompanying notes are an integral part of these financial statements.
Summary of Fair Value Exposure at October 31, 2013
The following is a summary of the inputs used to value the Fund’s net assets as of October 31, 2013 (See Note 3 in the accompanying notes to the financial statements):
| Common Stock | | Level 1 | | | Level 2 | | | Level 3 | | | Total | |
| Consumer Discretionary | | $ | 3,346,334 | | | $ | — | | | $ | — | | | $ | 3,346,334 | |
| Consumer Staples | | | 256,219 | | | | — | | | | — | | | | 256,219 | |
| Industrials | | | 4,481,566 | | | | — | | | | — | | | | 4,481,566 | |
| Information Technology | | | 3,292,982 | | | | — | | | | — | | | | 3,292,982 | |
| Materials | | | 1,990,769 | | | | — | | | | — | | | | 1,990,769 | |
| Total Common Stock | | $ | 13,367,870 | | | $ | — | | | $ | — | | | $ | 13,367,870 | |
Short-Term Investments | | | | | | | | | | | | | | | | |
| Money Market Funds | | $ | 1,268,394 | | | $ | — | | | $ | — | | | $ | 1,268,394 | |
| Total Short-Term Investments | | $ | 1,268,394 | | | $ | — | | | $ | — | | | $ | 1,268,394 | |
| Total Investments | | $ | 14,636,264 | | | $ | — | | | $ | — | | | $ | 14,636,264 | |
Transfers between levels are recognized at the end of the reporting period. During the one-year period ended October 31, 2013, the Fund recognized no transfers between levels.
The accompanying notes are an integral part of these financial statements.
HENNESSY FUNDS 1-800-966-4354
Financial Statements
Statements of Assets and Liabilities as of October 31, 2013 |
| | | | | | | | | | HENNESSY | |
| | | | HENNESSY | | | HENNESSY | | | CORNERSTONE | |
| | | | CORNERSTONE | | | FOCUS | | | MID CAP 30 | |
| | | | GROWTH FUND | | | FUND | | | FUND | |
| ASSETS: | | | | | | | | | | |
| Investments in securities, at value (cost $201,769,814, $716,452,529, | | | | | | | | | | |
| $$203,302,306, $79,154,555, $110,519,762, $114,128,169, $111,241,820, | | | | | | | | | | |
| $272,235,761, $11,281,276 and $6,226,653, respectively) | | | $ | 247,248,815 | | | $ | 1,317,658,369 | | | $ | 210,744,655 | |
| Dividends and interest receivable | | | | 109,614 | | | | 150,028 | | | | 63,240 | |
| Receivable for fund shares sold | | | | 51,117 | | | | 4,252,293 | | | | 200,253 | |
| Receivable for securities sold | | | | — | | | | — | | | | — | |
| Return of capital receivable | | | | 130,593 | | | | — | | | | — | |
| Prepaid expenses and other assets | | | | 25,410 | | | | 43,157 | | | | 23,970 | |
| Due from advisor | | | | — | | | | — | | | | — | |
| Total Assets | | | | 247,565,549 | | | | 1,322,103,847 | | | | 211,032,118 | |
| | | | | | | | | | | | | | |
| LIABILITIES: | | | | | | | | | | | | | |
| Payable for securities purchased | | | | — | | | | — | | | | — | |
| Payable for fund shares redeemed | | | | 99,110 | | | | 519,396 | | | | 84,571 | |
| Payable to advisor | | | | 153,443 | | | | 970,960 | | | | 130,718 | |
| Payable to administrator | | | | 121,199 | | | | 365,955 | | | | 83,207 | |
| Payable to auditor | | | | 23,194 | | | | 19,104 | | | | 19,300 | |
| Distribution payable | | | | — | | | | — | | | | — | |
| Accrued distribution fees | | | | — | | | | 233,830 | | | | — | |
| Accrued service fees | | | | 18,527 | | | | — | | | | 13,287 | |
| Reverse repurchase agreement | | | | — | | | | — | | | | — | |
| Accrued interest payable | | | | 157 | | | | — | | | | 551 | |
| Accrued directors fees | | | | 2,254 | | | | 2,340 | | | | 2,340 | |
| Accrued expenses and other payables | | | | 91,355 | | | | 254,535 | | | | 63,097 | |
| Total Liabilities | | | | 509,239 | | | | 2,366,120 | | | | 397,071 | |
| NET ASSETS | | | $ | 247,056,310 | | | $ | 1,319,737,727 | | | $ | 210,635,047 | |
| | | | | | | | | | | | | | |
| NET ASSETS CONSIST OF: | | | | | | | | | | | | | |
| Capital stock | | | $ | 396,061,021 | | | $ | 703,727,926 | | | $ | 188,696,761 | |
| Accumulated net investment income (loss) | | | | (650,206 | ) | | | (7,643,708 | ) | | | 724,245 | |
| Accumulated net realized gain (loss) on investments | | | | (193,833,506 | ) | | | 22,447,669 | | | | 13,771,692 | |
| Unrealized net appreciation on investments | | | | 45,479,001 | | | | 601,205,840 | | | | 7,442,349 | |
| Total Net Assets | | | $ | 247,056,310 | | | $ | 1,319,737,727 | | | $ | 210,635,047 | |
| | | | | | | | | | | | | | |
| NET ASSETS | | | | | | | | | | | | | |
| Investor Class: | | | | | | | | | | | | | |
| Shares authorized ($.0001 par value) | | | | 25,000,000,000 | | | Unlimited | | | | 25,000,000,000 | |
| Net assets applicable to outstanding Investor Class shares | | | | 220,825,059 | | | | 1,139,846,043 | | | | 159,446,778 | |
| Shares issued and outstanding | | | | 14,113,276 | | | | 17,928,709 | | | | 9,206,589 | |
| Net asset value, offering price and redemption price per share | | | $ | 15.65 | | | $ | 63.58 | | | $ | 17.32 | |
| | | | | | | | | | | | | | |
| Institutional Class: | | | | | | | | | | | | | |
| Shares authorized ($.0001 par value) | | | | 25,000,000,000 | | | Unlimited | | | | 25,000,000,000 | |
| Net assets applicable to outstanding Institutional Class shares | | | | 26,231,251 | | | | 179,891,684 | | | | 51,188,269 | |
| Shares issued and outstanding | | | | 1,645,170 | | | | 2,797,021 | | | | 2,904,753 | |
| Net asset value, offering price and redemption price per share | | | $ | 15.94 | | | $ | 64.32 | | | $ | 17.62 | |
The accompanying notes are an integral part of these financial statements.
| HENNESSY | | | | | | | | | | | | | | | | | | | |
| CORNERSTONE | | | HENNESSY | | | HENNESSY | | | HENNESSY | | | HENNESSY | | | HENNESSY | | | HENNESSY | |
| LARGE GROWTH | | | CORNERSTONE | | | LARGE VALUE | | | TOTAL RETURN | | | EQUITY AND | | | BALANCED | | | CORE BOND | |
| FUND | | | VALUE FUND | | | FUND | | | FUND | | | INCOME FUND | | | FUND | | | FUND | |
| | | | | | | | | | | | | | | | | | | | |
| | | | | | | | | | | | | | | | | | | | |
| | | | | | | | | | | | | | | | | | | | |
| $ | 105,030,149 | | | $ | 142,875,182 | | | $ | 144,867,866 | | | $ | 124,557,324 | | | $ | 317,357,034 | | | $ | 12,239,813 | | | $ | 6,334,638 | |
| | 79,122 | | | | 371,751 | | | | 157,231 | | | | 158,861 | | | | 1,420,714 | | | | 17,838 | | | | 58,542 | |
| | 7,652 | | | | 18,833 | | | | 8,700 | | | | 27,255 | | | | 840,138 | | | | 450 | | | | 25 | |
| | — | | | | — | | | | 1,012,450 | | | | — | | | | 1,401,909 | | | | — | | | | 336,365 | |
| | — | | | | — | | | | — | | | | — | | | | — | | | | — | | | | — | |
| | 16,886 | | | | 17,176 | | | | 17,198 | | | | 17,557 | | | | 32,662 | | | | 8,714 | | | | 18,438 | |
| | — | | | | — | | | | — | | | | — | | | | — | | | | — | | | | 3,218 | |
| | 105,133,809 | | | | 143,282,942 | | | | 146,063,445 | | | | 124,760,997 | | | | 321,052,457 | | | | 12,266,815 | | | | 6,751,226 | |
| | | | | | | | | | | | | | | | | | | | | | | | | | | |
| | | | | | | | | | | | | | | | | | | | | | | | | | | |
| | — | | | | — | | | | 1,992,824 | | | | — | | | | 2,069,063 | | | | — | | | | 310,455 | |
| | 14,659 | | | | 35,197 | | | | 14,469 | | | | 125,225 | | | | 178,552 | | | | 625 | | | | 908 | |
| | 64,781 | | | | 87,507 | | | | 102,212 | | | | 45,343 | | | | 208,677 | | | | 6,199 | | | | — | |
| | 49,069 | | | | 68,466 | | | | 71,879 | | | | 43,546 | | | | 94,340 | | | | 6,783 | | | | 3,607 | |
| | 18,822 | | | | 18,098 | | | | 17,233 | | | | 16,867 | | | | 19,105 | | | | 15,138 | | | | 19,103 | |
| | — | | | | — | | | | — | | | | — | | | | — | | | | — | | | | — | |
| | — | | | | — | | | | — | | | | 52,976 | | | | 59,851 | | | | 15,908 | | | | 1,005 | |
| | 7,402 | | | | 11,491 | | | | 11,997 | | | | 7,557 | | | | — | | | | 1,033 | | | | — | |
| | — | | | | — | | | | — | | | | 34,181,000 | | | | — | | | | — | | | | — | |
| | 70 | | | | — | | | | — | | | | 10,127 | | | | — | | | | — | | | | — | |
| | 2,397 | | | | 2,718 | | | | 2,345 | | | | 1,734 | | | | 2,327 | | | | 1,674 | | | | 2,949 | |
| | 16,242 | | | | 26,411 | | | | 29,192 | | | | 35,500 | | | | 54,288 | | | | 8,881 | | | | 8,528 | |
| | 173,442 | | | | 249,888 | | | | 2,242,151 | | | | 34,519,875 | | | | 2,686,203 | | | | 56,241 | | | | 346,555 | |
| $ | 104,960,367 | | | $ | 143,033,054 | | | $ | 143,821,294 | | | $ | 90,241,122 | | | $ | 318,366,254 | | | $ | 12,210,574 | | | $ | 6,404,671 | |
| | | | | | | | | | | | | | | | | | | | | | | | | | | |
| | | | | | | | | | | | | | | | | | | | | | | | | | | |
| $ | 75,758,061 | | | $ | 140,108,518 | | | $ | 124,538,363 | | | $ | 79,108,723 | | | $ | 262,773,129 | | | $ | 10,847,950 | | | $ | 4,933,105 | |
| | 1,194,434 | | | | 3,048,910 | | | | 904,159 | | | | 66,417 | | | | 247,147 | | | | — | | | | — | |
| | 2,132,278 | | | | (32,479,794 | ) | | | (12,360,925 | ) | | | (2,249,522 | ) | | | 10,224,705 | | | | 404,087 | | | | 1,363,581 | |
| | 25,875,594 | | | | 32,355,420 | | | | 30,739,697 | | | | 13,315,504 | | | | 45,121,273 | | | | 958,537 | | | | 107,985 | |
| $ | 104,960,367 | | | $ | 143,033,054 | | | $ | 143,821,294 | | | $ | 90,241,122 | | | $ | 318,366,254 | | | $ | 12,210,574 | | | $ | 6,404,671 | |
| | | | | | | | | | | | | | | | | | | | | | | | | | | |
| | | | | | | | | | | | | | | | | | | | | | | | | | | |
| | | | | | | | | | | | | | | | | | | | | | | | | | | |
| Unlimited | | | | 25,000,000,000 | | | Unlimited | | | | 100,000,000 | | | Unlimited | | | | 100,000,000 | | | Unlimited | |
| | 88,768,128 | | | | 138,944,368 | | | | 143,484,494 | | | | 90,241,122 | | | | 233,246,991 | | | | 12,210,574 | | | | 3,023,417 | |
| | 6,544,400 | | | | 8,219,722 | | | | 4,674,479 | | | | 6,308,805 | | | | 14,793,859 | | | | 946,287 | | | | 316,201 | |
| $ | 13.56 | | | $ | 16.90 | | | $ | 30.70 | | | $ | 14.30 | | | $ | 15.77 | | | $ | 12.90 | | | $ | 9.56 | |
| | | | | | | | | | | | | | | | | | | | | | | | | | | |
| | | | | | | | | | | | | | | | | | | | | | | | | | | |
| Unlimited | | | | 25,000,000,000 | | | Unlimited | | | | N/A | | | Unlimited | | | | N/A | | | Unlimited | |
| | 16,192,239 | | | | 4,088,686 | | | | 336,800 | | | | N/A | | | | 85,119,263 | | | | N/A | | | | 3,381,254 | |
| | 1,183,218 | | | | 241,657 | | | | 10,925 | | | | N/A | | | | 5,687,071 | | | | N/A | | | | 390,982 | |
| $ | 13.68 | | | $ | 16.92 | | | $ | 30.83 | | | | N/A | | | $ | 14.97 | | | | N/A | | | $ | 8.65 | |
HENNESSY FUNDS 1-800-966-4354
Financial Statements
Statements of Assets and Liabilities as of October 31, 2013 |
| | | | | | HENNESSY | | | HENNESSY | |
| | | HENNESSY | | | SMALL CAP | | | LARGE CAP | |
| | | GAS UTILITY | | | FINANCIAL | | | FINANCIAL | |
| | | INDEX FUND | | | FUND | | | FUND | |
| ASSETS: | | | | | | | | | |
| Investments in securities, at value (cost $853,355,823, $248,933,665, | | | | | | | | | |
| $68,215,937, $4,749,756, $30,238,747 and $13,388,949, respectively) | | $ | 1,183,161,531 | | | $ | 313,179,357 | | | $ | 86,425,323 | |
| Investments in affiliated securities, at value | | | | | | | | | | | | |
| (cost $0, $0, $1,739,350, $0, $0 and $0, respectively) | | | — | | | | — | | | | 1,868,000 | |
| Cash | | | 457,904 | | | | — | | | | — | |
| Dividends and interest receivable | | | 1,859,578 | | | | 135,318 | | | | 35,760 | |
| Receivable for fund shares sold | | | 5,132,160 | | | | 457,182 | | | | 98,819 | |
| Receivable for securities sold | | | 996,711 | | | | 3,102,651 | | | | — | |
| Return of capital receivable | | | 574,116 | | | | — | | | | 33,810 | |
| Prepaid expenses and other assets | | | 43,643 | | | | 19,671 | | | | 9,864 | |
| Due from advisor | | | — | | | | — | | | | — | |
| Total Assets | | | 1,192,225,643 | | | | 316,894,179 | | | | 88,471,576 | |
| | | | | | | | | | | | | |
| LIABILITIES: | | | | | | | | | | | | |
| Payable for securities purchased | | | 6,867,357 | | | | 4,060,740 | | | | — | |
| Payable for fund shares redeemed | | | 1,501,645 | | | | 148,565 | | | | 15,052 | |
| Payable to advisor | | | 385,618 | | | | 236,652 | | | | 66,918 | |
| Payable to administrator | | | 325,829 | | | | 94,836 | | | | 26,688 | |
| Payable to auditor | | | 19,100 | | | | 19,102 | | | | 19,100 | |
| Distribution payable | | | — | | | | — | | | | — | |
| Accrued distribution fees | | | — | | | | 51,542 | | | | 19,265 | |
| Accrued service fees | | | — | | | | — | | | | — | |
| Reverse repurchase agreement | | | — | | | | — | | | | — | |
| Accrued interest payable | | | — | | | | — | | | | — | |
| Accrued directors fees | | | 2,522 | | | | 2,342 | | | | 2,480 | |
| Accrued expenses and other payables | | | 332,724 | | | | 57,871 | | | | 21,104 | |
| Total Liabilities | | | 9,434,795 | | | | 4,671,650 | | | | 170,607 | |
| NET ASSETS | | $ | 1,182,790,848 | | | $ | 312,222,529 | | | $ | 88,300,969 | |
| | | | | | | | | | | | | |
| NET ASSETS CONSIST OF: | | | | | | | | | | | | |
| Capital stock | | $ | 841,855,123 | | | $ | 228,216,302 | | | $ | 69,615,831 | |
| Accumulated net investment income (loss) | | | — | | | | 598,791 | | | | (161,731 | ) |
| Accumulated net realized gain (loss) on investments | | | 11,130,606 | | | | 19,161,744 | | | | 508,833 | |
| Unrealized net appreciation on investments | | | 329,805,119 | | | | 64,245,692 | | | | 18,338,036 | |
| Total Net Assets | | $ | 1,182,790,848 | | | $ | 312,222,529 | | | $ | 88,300,969 | |
| | | | | | | | | | | | | |
| NET ASSETS | | | | | | | | | | | | |
| Investor Class: | | | | | | | | | | | | |
| Shares authorized ($.0001 par value) | | Unlimited | | | Unlimited | | | Unlimited | |
| Net assets applicable to outstanding Investor Class shares | | | 1,182,790,848 | | | | 243,417,158 | | | | 88,300,969 | |
| Shares issued and outstanding | | | 44,317,617 | | | | 9,581,812 | | | | 4,645,618 | |
| Net asset value, offering price and redemption price per share | | $ | 26.69 | | | $ | 25.40 | | | $ | 19.01 | |
| | | | | | | | | | | | | |
| Institutional Class: | | | | | | | | | | | | |
| Shares authorized ($.0001 par value) | | | N/A | | | Unlimited | | | | N/A | |
| Net assets applicable to outstanding Institutional Class shares | | | N/A | | | | 68,805,371 | | | | N/A | |
| Shares issued and outstanding | | | N/A | | | | 4,310,564 | | | | N/A | |
| Net asset value, offering price and redemption price per share | | | N/A | | | $ | 15.96 | | | | N/A | |
The accompanying notes are an integral part of these financial statements.
| | | | | | | HENNESSY | | |
| HENNESSY | | | HENNESSY | | | JAPAN | | |
| TECHNOLOGY | | | JAPAN | | | SMALL CAP | | |
| FUND | | | FUND | | | FUND | | |
| | | | | | | | | |
| | | | | | | | | |
| $ | 5,641,610 | | | $ | 40,116,443 | | | $ | 14,636,264 | | |
| | | | | | | | | | | | |
| | — | | | | — | | | | — | | |
| | — | | | | — | | | | 2,942 | | |
| | 810 | | | | 219,702 | | | | 105,393 | | |
| | 5,712 | | | | 142,689 | | | | 74,674 | | |
| | 63,871 | | | | — | | | | 56,495 | | |
| | — | | | | — | | | | — | | |
| | 18,269 | | | | 21,518 | | | | 14,942 | | |
| | — | | | | — | | | | — | | |
| | 5,730,272 | | | | 40,500,352 | | | | 14,890,710 | | |
| | | | | | | | | | | | |
| | | | | | | | | | | | |
| | 13,956 | | | | — | | | | 14,958 | | |
| | — | | | | 17,800 | | | | 1,029 | | |
| | 2,036 | | | | 32,296 | | | | 14,478 | | |
| | 3,359 | | | | 18,506 | | | | 7,259 | | |
| | 19,102 | | | | 17,176 | | | | 15,469 | | |
| | — | | | | — | | | | — | | |
| | 2,621 | | | | — | | | | — | | |
| | — | | | | 2,521 | | | | 1,206 | | |
| | — | | | | — | | | | — | | |
| | — | | | | 19 | | | | — | | |
| | 2,960 | | | | 2,779 | | | | 2,503 | | |
| | 5,789 | | | | 16,221 | | | | 10,465 | | |
| | 49,823 | | | | 107,318 | | | | 67,367 | | |
| $ | 5,680,449 | | | $ | 40,393,034 | | | $ | 14,823,343 | | |
| | | | | | | | | | | | |
| | | | | | | | | | | | |
| $ | 6,622,217 | | | $ | 63,977,507 | | | $ | 10,522,614 | | |
| | (65,889 | ) | | | (120,450 | ) | | | (16,755 | ) | |
| | (1,767,733 | ) | | | (33,341,786 | ) | | | 3,069,941 | | |
| | 891,854 | | | | 9,877,763 | | | | 1,247,543 | | |
| $ | 5,680,449 | | | $ | 40,393,034 | | | $ | 14,823,343 | | |
| | | | | | | | | | | | |
| | | | | | | | | | | | |
| | | | | | | | | | | | |
| Unlimited | | | Unlimited | | | Unlimited | | |
| | 4,490,097 | | | | 31,320,577 | | | | 14,823,343 | | |
| | 330,933 | | | | 1,591,596 | | | | 1,266,773 | | |
| $ | 13.57 | | | $ | 19.68 | | | $ | 11.70 | | |
| | | | | | | | | | | | |
| | | | | | | | | | | | |
| Unlimited | | | Unlimited | | | | N/A | | |
| | 1,190,352 | | | | 9,072,457 | | | | N/A | | |
| | 87,019 | | | | 454,117 | | | | N/A | | |
| $ | 13.68 | | | $ | 19.98 | | | | N/A | | |
HENNESSY FUNDS 1-800-966-4354
Financial Statements
Statements of Operations as of October 31, 2013 |
| | | | | | | | | HENNESSY | |
| | | HENNESSY | | | HENNESSY | | | CORNERSTONE | |
| | | CORNERSTONE | | | FOCUS | | | MID CAP 30 | |
| | | GROWTH FUND | | | FUND | | | FUND | |
| INVESTMENT INCOME: | | | | | | | | | |
Dividend income(1) | | $ | 2,956,455 | | | $ | 5,578,008 | | | $ | 3,588,703 | |
| Dividend income from affiliated securities | | | — | | | | — | | | | — | |
| Interest income | | | 676 | | | | 6,879 | | | | 627 | |
| Total investment income | | | 2,957,131 | | | | 5,584,887 | | | | 3,589,330 | |
| | | | | | | | | | | | | |
| EXPENSES: | | | | | | | | | | | | |
| Investment advisory fees | | | 2,115,901 | | | | 8,639,619 | | | | 1,466,415 | |
| Administration, fund accounting, custody and transfer agent fees | | | 586,458 | | | | 1,151,949 | | | | 400,145 | |
| Distribution fees – Investor Class (See Note 6) | | | — | | | | 2,175,926 | | | | — | |
| Service fees – Investor Class (See Note 6) | | | 257,378 | | | | — | | | | 152,159 | |
| Federal and state registration fees | | | 48,794 | | | | 51,928 | | | | 50,494 | |
| Audit fees | | | 7,507 | | | | 19,100 | | | | 3,880 | |
| Legal fees | | | 4,502 | | | | 8,001 | | | | 4,500 | |
| Compliance expense | | | 12,581 | | | | 11,746 | | | | 12,508 | |
| Consulting expense | | | 7,477 | | | | 7,346 | | | | 7,463 | |
| Reports to shareholders | | | 57,055 | | | | 171,366 | | | | 30,872 | |
| Directors’ fees and expenses | | | 15,071 | | | | 25,456 | | | | 14,148 | |
| Sub-transfer agent expenses – Investor Class (See Note 6) | | | 452,222 | | | | 1,063,714 | | | | 285,886 | |
| Sub-transfer agent expenses – Institutional Class (See Note 6) | | | 28,603 | | | | 62,848 | | | | 41,052 | |
| Interest expense (See Notes 4 and 7) | | | — | | | | — | | | | — | |
| Other expenses | | | 33,299 | | | | 96,078 | | | | 25,944 | |
| Total expenses before reimbursement from advisor | | | 3,626,848 | | | | 13,485,077 | | | | 2,495,466 | |
| Expense reimbursement by advisor – Investor Class | | | — | | | | — | | | | — | |
| Expense reimbursement from advisor – Institutional Class | | | — | | | | — | | | | — | |
| Administration expense waiver (See Note 6) | | | (37,104 | ) | | | — | | | | (58,453 | ) |
| Net expenses | | | 3,589,744 | | | | 13,485,077 | | | | 2,437,013 | |
| NET INVESTMENT INCOME (LOSS) | | $ | (632,613 | ) | | $ | (7,900,190 | ) | | $ | 1,152,317 | |
| | | | | | | | | | | | | |
| REALIZED AND UNREALIZED GAINS (LOSSES): | | | | | | | | | | | | |
| Net realized gain on investments | | $ | 51,423,472 | | | $ | 22,730,911 | | | $ | 59,762,626 | |
| Affiliated investments | | | — | | | | — | | | | — | |
| Long-term capital gain distributions from regulated investment companies | | | — | | | | — | | | | — | |
| Change in unrealized appreciation on investments | | | 16,444,675 | | | | 258,060,122 | | | | (20,009,895 | ) |
| Net gain (loss) on investments | | | 67,868,147 | | | | 280,791,033 | | | | 39,752,731 | |
| NET INCREASE IN NET ASSETS RESULTING FROM OPERATIONS | | $ | 67,235,534 | | | $ | 272,890,843 | | | $ | 40,905,048 | |
| (1) | Net of foreign taxes withheld of $0, $0, $0, $0 ,$119,502, $1,848, $0, $0, $0, $0, $400,012, $0, $0, $0, $32,481 and $25,107, respectively. |
The accompanying notes are an integral part of these financial statements.
| HENNESSY | | | | | | | | | | | | | | | | | | | |
| CORNERSTONE | | | HENNESSY | | | HENNESSY | | | HENNESSY | | | HENNESSY | | | HENNESSY | | | HENNESSY | |
| LARGE GROWTH | | | CORNERSTONE | | | LARGE VALUE | | | TOTAL RETURN | | | EQUITY AND | | | BALANCED | | | CORE BOND | |
| FUND | | | VALUE FUND | | | FUND | | | FUND | | | INCOME FUND | | | FUND | | | FUND | |
| | | | | | | | | | | | | | | | | | | | |
| $ | 2,357,526 | | | $ | 5,134,787 | | | $ | 3,129,730 | | | $ | 2,025,733 | | | $ | 6,045,075 | | | $ | 264,328 | | | $ | 136,329 | |
| | — | | | | — | | | | — | | | | — | | | | — | | | | — | | | | — | |
| | 252 | | | | 331 | | | | 139 | | | | 28,326 | | | | 2,478,809 | | | | 3,720 | | | | 491,131 | |
| | 2,357,778 | | | | 5,135,118 | | | | 3,129,869 | | | | 2,054,059 | | | | 8,523,884 | | | | 268,048 | | | | 627,460 | |
| | | | | | | | | | | | | | | | | | | | | | | | | | | |
| | | | | | | | | | | | | | | | | | | | | | | | | | | |
| | 750,272 | | | | 995,223 | | | | 1,154,401 | | | | 487,175 | | | | 2,342,811 | | | | 84,997 | | | | 126,942 | |
| | 207,915 | | | | 279,428 | | | | 280,205 | | | | 166,811 | | | | 351,422 | | | | 29,749 | | | | 19,131 | |
| | — | | | | — | | | | — | | | | 121,794 | | | | 511,180 | | | | 21,249 | | | | 9,571 | |
| | 81,066 | | | | 130,928 | | | | 135,573 | | | | 81,196 | | | | — | | | | 14,166 | | | | — | |
| | 42,171 | | | | 40,280 | | | | 40,336 | | | | 27,247 | | | | 70,929 | | | | 23,851 | | | | 42,821 | |
| | 3,178 | | | | 21,810 | | | | 20,759 | | | | 20,259 | | | | 19,102 | | | | 18,760 | | | | 19,102 | |
| | 4,760 | | | | 1,501 | | | | 1,002 | | | | 3,501 | | | | 5,501 | | | | 3,627 | | | | 5,501 | |
| | 12,516 | | | | 12,509 | | | | 12,510 | | | | 12,516 | | | | 12,509 | | | | 12,490 | | | | 12,549 | |
| | 7,473 | | | | 7,350 | | | | 7,345 | | | | 7,345 | | | | 7,345 | | | | 7,345 | | | | 7,342 | |
| | 10,433 | | | | 16,731 | | | | 17,174 | | | | 13,518 | | | | 53,405 | | | | 3,646 | | | | 4,403 | |
| | 13,008 | | | | 13,643 | | | | 13,179 | | | | 9,029 | | | | 17,256 | | | | 8,130 | | | | 14,595 | |
| | 29,187 | | | | 90,616 | | | | 104,444 | | | | 65,681 | | | | 231,859 | | | | 13,082 | | | | 2,272 | |
| | 9,122 | | | | 1,931 | | | | — | | | | N/A | | | | 57,115 | | | | N/A | | | | 14,843 | |
| | — | | | | — | | | | — | | | | 80,034 | | | | — | | | | — | | | | — | |
| | 15,943 | | | | 20,439 | | | | 19,889 | | | | 12,796 | | | | 46,389 | | | | 7,283 | | | | 8,626 | |
| | 1,187,044 | | | | 1,632,389 | | | | 1,806,817 | | | | 1,108,902 | | | | 3,726,823 | | | | 248,375 | | | | 287,698 | |
| | — | | | | — | | | | — | | | | — | | | | (67,819 | ) | | | — | | | | (36,604 | ) |
| | — | | | | — | | | | — | | | | N/A | | | | — | | | | N/A | | | | (74,877 | ) |
| | (23,715 | ) | | | (4,356 | ) | | | (388 | ) | | | — | | | | — | | | | — | | | | — | |
| | 1,163,329 | | | | 1,628,033 | | | | 1,806,429 | | | | 1,108,902 | | | | 3,659,004 | | | | 248,375 | | | | 176,217 | |
| $ | 1,194,449 | | | $ | 3,507,085 | | | $ | 1,323,440 | | | $ | 945,157 | | | $ | 4,864,880 | | | $ | 19,673 | | | $ | 451,243 | |
| | | | | | | | | | | | | | | | | | | | | | | | | | | |
| | | | | | | | | | | | | | | | | | | | | | | | | | | |
| $ | 6,201,807 | | | $ | 12,225,964 | | | $ | 17,493,521 | | | $ | 4,930,184 | | | $ | 13,272,491 | | | $ | 1,673,842 | | | $ | 1,390,074 | |
| | — | | | | — | | | | — | | | | — | | | | — | | | | — | | | | — | |
| | — | | | | — | | | | — | | | | — | | | | — | | | | — | | | | — | |
| | 17,304,019 | | | | 13,004,866 | | | | 11,896,355 | | | | 4,920,747 | | | | 21,344,922 | | | | (684,183 | ) | | | (1,718,510 | ) |
| | 23,505,826 | | | | 25,230,830 | | | | 29,389,876 | | | | 9,850,931 | | | | 34,617,413 | | | | 989,659 | | | | (328,436 | ) |
| $ | 24,700,275 | | | $ | 28,737,915 | | | $ | 30,713,316 | | | $ | 10,796,088 | | | $ | 39,482,293 | | | $ | 1,009,332 | | | $ | 122,807 | |
HENNESSY FUNDS 1-800-966-4354
Financial Statements
Statements of Operations as of October 31, 2013 |
| | | | | | HENNESSY | | | HENNESSY | |
| | | HENNESSY | | | SMALL CAP | | | LARGE CAP | |
| | | GAS UTILITY | | | FINANCIAL | | | FINANCIAL | |
| | | INDEX FUND | | | FUND | | | FUND | |
| INVESTMENT INCOME: | | | | | | | | | |
Dividend income(1) | | $ | 31,189,790 | | | $ | 5,056,488 | | | $ | 880,316 | |
| Dividend income from affiliated securities | | | — | | | | — | | | | 46,850 | |
| Interest income | | | 1,150 | | | | 1,124 | | | | 167 | |
| Total investment income | | | 31,190,940 | | | | 5,057,612 | | | | 927,333 | |
| | | | | | | | | | | | | |
| EXPENSES: | | | | | | | | | | | | |
| Investment advisory fees | | | 3,712,821 | | | | 2,354,715 | | | | 622,343 | |
| Administration, fund accounting, custody and transfer agent fees | | | 1,113,846 | | | | 313,962 | | | | 82,979 | |
| Distribution fees – Investor Class (See Note 6) | | | — | | | | 530,455 | | | | 172,873 | |
| Service fees – Investor Class (See Note 6) | | | — | | | | — | | | | — | |
| Federal and state registration fees | | | 69,652 | | | | 32,731 | | | | 28,972 | |
| Audit fees | | | 19,100 | | | | 19,100 | | | | 19,100 | |
| Legal fees | | | 7,501 | | | | 6,863 | | | | 5,501 | |
| Compliance expense | | | 12,473 | | | | 12,546 | | | | 12,548 | |
| Consulting expense | | | 7,345 | | | | 7,408 | | | | 7,345 | |
| Reports to shareholders | | | 210,740 | | | | 52,714 | | | | 11,079 | |
| Directors’ fees and expenses | | | 25,357 | | | | 17,172 | | | | 14,836 | |
| Sub-transfer agent expenses – Investor Class (See Note 6) | | | 1,820,383 | | | | 258,071 | | | | 91,753 | |
| Sub-transfer agent expenses – Institutional Class (See Note 6) | | | N/A | | | | 30,506 | | | | N/A | |
| Interest expense (See Notes 4 and 7) | | | 79 | | | | — | | | | 75 | |
| Other expenses | | | 458,970 | | | | 34,724 | | | | 12,982 | |
| Total expenses before reimbursement from advisor | | | 7,458,267 | | | | 3,670,967 | | | | 1,082,386 | |
| Expense reimbursement by advisor – Investor Class | | | — | | | | — | | | | — | |
| Expense reimbursement from advisor – Institutional Class | | | N/A | | | | — | | | | N/A | |
| Administration expense waiver (See Note 6) | | | — | | | | — | | | | — | |
| Net expenses | | | 7,458,267 | | | | 3,670,967 | | | | 1,082,386 | |
| NET INVESTMENT INCOME (LOSS) | | $ | 23,732,673 | | | $ | 1,386,645 | | | $ | (155,053 | ) |
| | | | | | | | | | | | | |
| REALIZED AND UNREALIZED GAINS (LOSSES): | | | | | | | | | | | | |
| Net realized gain on investments | | $ | 20,377,887 | | | $ | 27,485,214 | | | $ | 7,710,087 | |
| Affiliated investments | | | — | | | | — | | | | 533,446 | |
| Long-term capital gain distributions from regulated investment companies | | | — | | | | — | | | | 17,820 | |
| Change in unrealized appreciation on investments | | | 131,840,690 | | | | 40,111,802 | | | | 10,739,120 | |
| Net gain (loss) on investments | | | 152,218,577 | | | | 67,597,016 | | | | 19,000,473 | |
| NET INCREASE IN NET ASSETS RESULTING FROM OPERATIONS | | $ | 175,951,250 | | | $ | 68,983,661 | | | $ | 18,845,420 | |
| (1) | Net of foreign taxes withheld of $0, $0, $0, $0 ,$119,502, $1,848, $0, $0, $0, $0, $400,012, $0, $0, $0, $32,481 and $25,107, respectively. |
The accompanying notes are an integral part of these financial statements.
| | | | | | | HENNESSY | | |
| HENNESSY | | | HENNESSY | | | JAPAN | | |
| TECHNOLOGY | | | JAPAN | | | SMALL CAP | | |
| FUND | | | FUND | | | FUND | | |
| | | | | | | | | |
| $ | 37,172 | | | $ | 420,619 | | | $ | 325,666 | | |
| | — | | | | — | | | | — | | |
| | 31 | | | | 273 | | | | 106 | | |
| | 37,203 | | | | 420,892 | | | | 325,772 | | |
| | | | | | | | | | | | |
| | | | | | | | | | | | |
| | 49,272 | | | | 275,793 | | | | 171,427 | | |
| | 6,570 | | | | 57,317 | | | | 29,500 | | |
| | 11,111 | | | | — | | | | — | | |
| | — | | | | 20,032 | | | | 14,286 | | |
| | 25,006 | | | | 35,341 | | | | 24,615 | | |
| | 19,100 | | | | 21,186 | | | | 18,953 | | |
| | 5,361 | | | | 1,501 | | | | 2,001 | | |
| | 12,538 | | | | 12,510 | | | | 12,510 | | |
| | 7,345 | | | | 7,345 | | | | 7,345 | | |
| | 1,975 | | | | 4,074 | | | | 4,637 | | |
| | 14,530 | | | | 12,348 | | | | 11,912 | | |
| | 3,158 | | | | 46,476 | | | | 35,714 | | |
| | 400 | | | | 4,979 | | | | N/A | | |
| | 20 | | | | — | | | | 2,917 | | |
| | 7,307 | | | | 6,303 | | | | 5,027 | | |
| | 163,693 | | | | 505,205 | | | | 340,844 | | |
| | (48,568 | ) | | | — | | | | — | | |
| | (10,931 | ) | | | — | | | | N/A | | |
| | — | | | | — | | | | — | | |
| | 104,194 | | | | 505,205 | | | | 340,844 | | |
| $ | (66,991 | ) | | $ | (84,313 | ) | | $ | (15,072 | ) | |
| | | | | | | | | | | | |
| | | | | | | | | | | | |
| $ | 577,798 | | | $ | 16,814 | | | $ | 3,128,752 | | |
| | — | | | | — | | | | — | | |
| | — | | | | — | | | | — | | |
| | 802,157 | | | | 6,419,308 | | | | 1,109,483 | | |
| | 1,379,955 | | | | 6,436,122 | | | | 4,238,235 | | |
| $ | 1,312,964 | | | $ | 6,351,809 | | | $ | 4,223,163 | | |
HENNESSY FUNDS 1-800-966-4354
Financial Statements
| Statements of Changes in Net Assets |
| | | Hennessy Cornerstone Growth Fund | |
| | | | | | | |
| | | Year Ended | | | Year Ended | |
| | | October 31, 2013 | | | October 31, 2012 | |
| OPERATIONS: | | | | | | |
| Net investment income (loss) | | $ | (632,613 | ) | | $ | (1,428,623 | ) |
| Net realized gain on securities | | | 51,423,472 | | | | 3,675,303 | |
| Long-term capital gain distributions from regulated investment companies | | | — | | | | — | |
| Change in unrealized appreciation (depreciation) on securities | | | 16,444,675 | | | | 43,342,497 | |
| Net increase (decrease) in net assets resulting from operations | | | 67,235,534 | | | | 45,589,177 | |
| | | | | | | | | |
| DISTRIBUTIONS TO SHAREHOLDERS FROM: | | | | | | | | |
| Net investment income | | | | | | | | |
| Investor Class | | | — | | | | — | |
| Institutional Class | | | — | | | | — | |
| Net realized gains | | | | | | | | |
| Investor Class | | | — | | | | — | |
| Institutional Class | | | — | | | | — | |
| Return of capital | | | | | | | | |
| Investor Class | | | — | | | | — | |
| Institutional Class | | | — | | | | — | |
| Total distributions | | | — | | | | — | |
| | | | | | | | | |
| CAPITAL SHARE TRANSACTIONS: | | | | | | | | |
| Proceeds from shares issued in the Reorganization – Investor Class (See Note 9) | | | — | | | | — | |
| Proceeds from shares issued in the Reorganization – Institutional Class (See Note 9) | | | — | | | | 34,071,809 | |
| Proceeds from shares subscribed – Investor Class | | | 41,940,983 | | | | 90,544,279 | |
| Proceeds from shares subscribed – Institutional Class | | | 3,016,344 | | | | 418,215 | |
| Dividends reinvested – Investor Class | | | — | | | | — | |
| Dividends reinvested – Institutional Class | | | — | | | | — | |
| Cost of shares redeemed – Investor Class | | | (147,291,804 | ) | | | (54,063,454 | ) |
| Cost of shares redeemed – Institutional Class | | | (20,555,666 | ) | | | (778,530 | ) |
| Net increase (decrease) in net assets derived from capital share transactions | | | (122,890,143 | ) | | | 70,192,319 | |
| TOTAL INCREASE (DECREASE) IN NET ASSETS | | | (55,654,609 | ) | | | 115,781,496 | |
| | | | | | | | | |
| NET ASSETS: | | | | | | | | |
| Beginning of year | | | 302,710,919 | | | | 186,929,423 | |
| End of year | | $ | 247,056,310 | | | $ | 302,710,919 | |
| Accumulated net investment income (loss), end of year | | $ | (650,206 | ) | | $ | (2,592,872 | ) |
| | | | | | | | | |
| CHANGES IN SHARES OUTSTANDING: | | | | | | | | |
| Shares issued in connection with the Reorganization – Investor Class (See Note 9) | | | — | | | | — | |
| Shares issued in connection with the Reorganization – Institutional Class (See Note 9) | | | — | | | | 2,732,499 | |
| Shares sold – Investor Class | | | 3,204,921 | | | | 7,702,040 | |
| Shares sold – Institutional Class | | | 216,262 | | | | 35,989 | |
| Shares issued to holders as reinvestment of dividends – Investor Class | | | — | | | | — | |
| Shares issued to holders as reinvestment of dividends – Institutional Class | | | — | | | | — | |
| Shares redeemed – Investor Class | | | (10,550,825 | ) | | | (4,743,651 | ) |
| Shares redeemed – Institutional Class | | | (1,522,417 | ) | | | (67,781 | ) |
| Net increase (decrease) in shares outstanding | | | (8,652,059 | ) | | | 5,659,096 | |
The accompanying notes are an integral part of these financial statements.
| Hennessy Focus Fund | | | Hennessy Cornerstone Mid Cap 30 Fund | | | Hennessy Cornerstone Large Growth Fund | |
| | | | | | | | | | | | | | | | | |
| Year Ended | | | Year Ended | | | Year Ended | | | Year Ended | | | Year Ended | | | Year Ended | |
| October 31, 2013 | | | October 31, 2012 | | | October 31, 2013 | | | October 31, 2012 | | | October 31, 2013 | | | October 31, 2012 | |
| | | | | | | | | | | | | | | | | |
| $ | (7,900,190 | ) | | $ | (5,598,569 | ) | | $ | 1,152,317 | | | $ | 1,069,445 | | | $ | 1,194,449 | | | $ | 1,080,454 | |
| $ | 22,730,911 | | | | 63,683,118 | | | | 59,762,626 | | | | 465,078 | | | | 6,201,807 | | | | 171,724 | |
| | — | | | | — | | | | — | | | | — | | | | — | | | | — | |
| | 258,060,122 | | | | 49,854,427 | | | | (20,009,895 | ) | | | 21,872,356 | | | | 17,304,019 | | | | 5,528,323 | |
| | 272,890,843 | | | | 107,938,976 | | | | 40,905,048 | | | | 23,406,879 | | | | 24,700,275 | | | | 6,780,501 | |
| | | | | | | | | | | | | | | | | | | | | | | |
| | | | | | | | | | | | | | | | | | | | | | | |
| | | | | | | | | | | | | | | | | | | | | | | |
| | — | | | | — | | | | (1,650,619 | ) | | | — | | | | (719,396 | ) | | | (557,836 | ) |
| | — | | | | — | | | | (675,237 | ) | | | — | | | | (361,073 | ) | | | (1,312 | ) |
| | | | | | | | | | | | | | | | | | | | | | | |
| | (58,291,075 | ) | | | (63,544,133 | ) | | | — | | | | — | | | | (117,309 | ) | | | (15,350,002 | ) |
| | (5,349,797 | ) | | | (5,298,059 | ) | | | — | | | | — | | | | (52,078 | ) | | | (25,963 | ) |
| | | | | | | | | | | | | | | | | | | | | | | |
| | — | | | | — | | | | — | | | | — | | | | — | | | | — | |
| | — | | | | — | | | | — | | | | — | | | | — | | | | — | |
| | (63,640,872 | ) | | | (68,842,192 | ) | | | (2,325,856 | ) | | | — | | | | (1,249,856 | ) | | | (15,935,113 | ) |
| | | | | | | | | | | | | | | | | | | | | | | |
| | | | | | | | | | | | | | | | | | | | | | | |
| | — | | | | — | | | | — | | | | — | | | | — | | | | — | |
| | — | | | | — | | | | — | | | | 16,374,686 | | | | — | | | | 33,698,161 | |
| | 375,206,953 | | | | 179,555,653 | | | | 57,117,732 | | | | 61,505,408 | | | | 1,740,370 | | | | 2,170,407 | |
| | 127,598,554 | | | | 31,219,319 | | | | 22,736,273 | | | | 4,266,258 | | | | 815,827 | | | | 51,923 | |
| | 56,748,943 | | | | 61,703,733 | | | | 1,616,989 | | | | — | | | | 780,066 | | | | 14,646,437 | |
| | 4,791,826 | | | | 4,808,848 | | | | 657,114 | | | | — | | | | 406,311 | | | | 27,274 | |
| | (188,842,828 | )* | | | (179,761,921 | ) | | | (74,701,969 | ) | | | (81,736,037 | ) | | | (8,522,055 | ) | | | (9,670,991 | ) |
| | (49,900,885 | ) | | | (12,079,868 | ) | | | (22,841,934 | ) | | | (6,640,858 | ) | | | (23,485,757 | ) | | | (16,525 | ) |
| | 325,602,563 | | | | 85,445,764 | | | | (15,415,795 | ) | | | (6,230,543 | ) | | | (28,265,238 | ) | | | 40,906,686 | |
| | 534,852,534 | | | | 124,542,548 | | | | 23,163,397 | | | | 17,176,336 | | | | (4,814,819 | ) | | | 31,752,074 | |
| | | | | | | | | | | | | | | | | | | | | | | |
| | | | | | | | | | | | | | | | | | | | | | | |
| | 784,885,193 | | | | 660,342,645 | | | | 187,471,650 | | | | 170,295,314 | | | | 109,775,186 | | | | 78,023,112 | |
| $ | 1,319,737,727 | | | $ | 784,885,193 | | | $ | 210,635,047 | | | $ | 187,471,650 | | | $ | 104,960,367 | | | $ | 109,775,186 | |
| $ | (7,643,708 | ) | | $ | (5,555,872 | ) | | $ | 724,245 | | | $ | 1,029,849 | | | $ | 1,194,434 | | | $ | 1,080,454 | |
| | | | | | | | | | | | | | | | | | | | | | | |
| | | | | | | | | | | | | | | | | | | | | | | |
| | — | | | | — | | | | — | | | | — | | | | — | | | | — | |
| | — | | | | — | | | | — | | | | 1,154,875 | | | | — | | | | 3,110,613 | |
| | 6,493,694 | | | | 3,675,823 | | | | 3,548,784 | | | | 4,595,496 | | | | 149,494 | | | | 204,448 | |
| | 2,140,491 | | | | 640,920 | | | | 1,394,219 | | | | 312,388 | | | | 68,395 | | | | 4,836 | |
| | 1,149,695 | | | | 1,379,779 | | | | 114,114 | | | | — | | | | 72,353 | | | | 1,455,027 | |
| | 96,221 | | | | 106,958 | | | | 45,696 | | | | — | | | | 37,405 | | | | 2,689 | |
| | (3,380,133 | ) | | | (3,665,085 | ) | | | (4,826,744 | ) | | | (6,262,135 | ) | | | (720,532 | ) | | | (911,650 | ) |
| | (920,448 | ) | | | (246,768 | ) | | | (1,443,416 | ) | | | (512,726 | ) | | | (2,050,571 | ) | | | (1,399 | ) |
| | 5,579,520 | | | | 1,891,627 | | | | (1,167,347 | ) | | | (712,102 | ) | | | (2,443,456 | ) | | | 3,864,564 | |
* Net of redemption fees $1,716.
HENNESSY FUNDS 1-800-966-4354
Financial Statements
| Statements of Changes in Net Assets |
| | | Hennessy Cornerstone Value Fund | |
| | | | | | | |
| | | Year Ended | | | Year Ended | |
| | | October 31, 2013 | | | October 31, 2012 | |
| OPERATIONS: | | | | | | |
| Net investment income (loss) | | $ | 3,507,085 | | | $ | 3,298,953 | |
| Net realized gain on securities | | | 12,225,964 | | | | 3,221,518 | |
| Long-term capital gain distributions from regulated investment companies | | | — | | | | — | |
| Change in unrealized appreciation (depreciation) on securities | | | 13,004,866 | | | | 8,250,584 | |
| Net increase (decrease) in net assets resulting from operations | | | 28,737,915 | | | | 14,771,055 | |
| | | | | | | | | |
| DISTRIBUTIONS TO SHAREHOLDERS FROM: | | | | | | | | |
| Net investment income | | | | | | | | |
| Investor Class | | | (3,262,318 | ) | | | (3,784,445 | ) |
| Institutional Class | | | (77,674 | ) | | | (49,840 | ) |
| Net realized gains | | | | | | | | |
| Investor Class | | | — | | | | — | |
| Institutional Class | | | — | | | | — | |
| Return of capital | | | | | | | | |
| Investor Class | | | — | | | | — | |
| Institutional Class | | | — | | | | — | |
| Total distributions | | | (3,339,992 | ) | | | (3,834,285 | ) |
| | | | | | | | | |
| CAPITAL SHARE TRANSACTIONS: | | | | | | | | |
| Proceeds from shares issued in the Reorganization – Investor Class (See Note 9) | | | — | | | | — | |
| Proceeds from shares issued in the Reorganization – Institutional Class (See Note 9) | | | — | | | | — | |
| Proceeds from shares subscribed – Investor Class | | | 5,921,525 | | | | 16,434,099 | |
| Proceeds from shares subscribed – Institutional Class | | | 2,126,066 | | | | 1,336,353 | |
| Dividends reinvested – Investor Class | | | 2,900,074 | | | | 3,373,717 | |
| Dividends reinvested – Institutional Class | | | 66,521 | | | | 37,743 | |
| Cost of shares redeemed – Investor Class | | | (19,568,045 | ) | | | (21,987,512 | ) |
| Cost of shares redeemed – Institutional Class | | | (1,332,315 | ) | | | (188,855 | ) |
| Net increase (decrease) in net assets derived from capital share transactions | | | (9,886,174 | ) | | | (994,455 | ) |
| TOTAL INCREASE (DECREASE) IN NET ASSETS | | | 15,511,749 | | | | 9,942,315 | |
| | | | | | | | | |
| NET ASSETS: | | | | | | | | |
| Beginning of year | | | 127,521,305 | | | | 117,578,990 | |
| End of year | | $ | 143,033,054 | | | $ | 127,521,305 | |
| Undistributed net investment income (loss), end of year | | $ | 3,048,910 | | | $ | 2,446,268 | |
| | | | | | | | | |
| CHANGES IN SHARES OUTSTANDING: | | | | | | | | |
| Shares issued in connection with the Reorganization – Investor Class (See Note 9) | | | — | | | | — | |
| Shares issued in connection with the Reorganization – Institutional Class (See Note 9) | | | — | | | | — | |
| Shares sold – Investor Class | | | 395,919 | | | | 1,221,855 | |
| Shares sold – Institutional Class | | | 140,683 | | | | 100,889 | |
| Shares issued to holders as reinvestment of dividends – Investor Class | | | 209,090 | | | | 264,813 | |
| Shares issued to holders as reinvestment of dividends – Institutional Class | | | 4,803 | | | | 2,967 | |
| Shares redeemed – Investor Class | | | (1,299,056 | ) | | | (1,636,482 | ) |
| Shares redeemed – Institutional Class | | | (84,166 | ) | | | (14,382 | ) |
| Net increase (decrease) in shares outstanding | | | (632,727 | ) | | | (60,340 | ) |
The accompanying notes are an integral part of these financial statements.
| Hennessy Large Value Fund | | | Hennessy Total Return Fund | | | Hennessy Equity and Income Fund | |
| | | | | | | | | | | | | | | | | |
| Year Ended | | | Year Ended | | | Year Ended | | | Year Ended | | | Year Ended | | | Year Ended | |
| October 31, 2013 | | | October 31, 2012 | | | October 31, 2013 | | | October 31, 2012 | | | October 31, 2013 | | | October 31, 2012 | |
| | | | | | | | | | | | | | | | | |
| $ | 1,323,440 | | | $ | 1,452,637 | | | $ | 945,157 | | | $ | 1,016,797 | | | $ | 4,864,880 | | | $ | 3,387,255 | |
| | 17,493,521 | | | | 9,806,738 | | | | 4,930,184 | | | | 3,337,953 | | | | 13,272,491 | | | | 1,448,410 | |
| | — | | | | — | | | | — | | | | — | | | | — | | | | 3,301 | |
| | 11,896,355 | | | | 7,541,982 | | | | 4,920,747 | | | | 3,331,681 | | | | 21,344,922 | | | | 10,755,082 | |
| | 30,713,316 | | | | 18,801,357 | | | | 10,796,088 | | | | 7,686,431 | | | | 39,482,293 | | | | 15,594,048 | |
| | | | | | | | | | | | | | | | | | | | | | | |
| | | | | | | | | | | | | | | | | | | | | | | |
| | | | | | | | | | | | | | | | | | | | | | | |
| | (1,437,942 | ) | | | (1,007,288 | ) | | | (957,145 | ) | | | (1,013,041 | ) | | | (3,063,016 | ) | | | (1,939,551 | ) |
| | (921 | ) | | | (471 | ) | | | N/A | | | | N/A | | | | (1,937,482 | ) | | | (1,382,811 | ) |
| | | | | | | | | | | | | | | | | | | | | | | |
| | — | | | | — | | | | — | | | | — | | | | — | | | | — | |
| | — | | | | — | | | | N/A | | | | N/A | | | | — | | | | — | |
| | | | | | | | | | | | | | | | | | | | | | | |
| | — | | | | — | | | | — | | | | — | | | | — | | | | — | |
| | — | | | | — | | | | — | | | | — | | | | — | | | | — | |
| | (1,438,863 | ) | | | (1,007,759 | ) | | | (957,145 | ) | | | (1,013,041 | ) | | | (5,000,498 | ) | | | (3,322,362 | ) |
| | | | | | | | | | | | | | | | | | | | | | | |
| | | | | | | | | | | | | | | | | | | | | | | |
| | — | | | | — | | | | — | | | | — | | | | — | | | | — | |
| | — | | | | — | | | | — | | | | — | | | | — | | | | — | |
| | 2,715,396 | | | | 1,325,949 | | | | 21,431,210 | | | | 29,998,535 | | | | 99,856,871 | | | | 186,044,450 | |
| | 440,166 | | | | 13,303 | | | | N/A | | | | N/A | | | | 29,868,131 | | | | 58,487,290 | |
| | 1,378,307 | | | | 961,881 | | | | 873,732 | | | | 923,418 | | | | 2,933,613 | | | | 1,782,862 | |
| | 921 | | | | 471 | | | | N/A | | | | N/A | | | | 1,518,097 | | | | 787,199 | |
| | (14,868,801 | ) | | | (19,010,445 | ) | | | (19,573,550 | ) | | | (24,056,017 | ) | | | (90,377,638 | )* | | | (55,147,222 | ) |
| | (209,593 | ) | | | (289 | ) | | | N/A | | | | N/A | | | | (65,319,830 | )** | | | (10,854,505 | ) |
| | (10,543,604 | ) | | | (16,709,130 | ) | | | 2,731,392 | | | | 6,865,936 | | | | (21,520,756 | ) | | | 181,100,074 | |
| | 18,730,849 | | | | 1,084,468 | | | | 12,570,335 | | | | 13,539,326 | | | | 12,961,039 | | | | 193,371,760 | |
| | | | | | | | | | | | | | | | | | | | | | | |
| | | | | | | | | | | | | | | | | | | | | | | |
| | 125,090,445 | | | | 124,005,977 | | | | 77,670,787 | | | | 64,131,461 | | | | 305,405,215 | | | | 112,033,455 | |
| $ | 143,821,294 | | | $ | 125,090,445 | | | $ | 90,241,122 | | | $ | 77,670,787 | | | $ | 318,366,254 | | | $ | 305,405,215 | |
| $ | 904,159 | | | $ | 1,060,739 | | | $ | 66,417 | | | $ | 78,405 | | | $ | 247,147 | | | $ | 312,645 | |
| | | | | | | | | | | | | | | | | | | | | | | |
| | | | | | | | | | | | | | | | | | | | | | | |
| | — | | | | — | | | | — | | | | — | | | | — | | | | — | |
| | — | | | | — | | | | N/A | | | | N/A | | | | — | | | | — | |
| | 99,185 | | | | 56,881 | | | | 1,551,829 | | | | 2,462,738 | | | | 6,666,051 | | | | 13,582,962 | |
| | 15,876 | | | | 579 | | | | N/A | | | | N/A | | | | 2,087,219 | | | | 4,455,425 | |
| | 55,132 | | | | 43,942 | | | | 64,334 | | | | 74,537 | | | | 200,342 | | | | 129,222 | |
| | 37 | | | | 21 | | | | N/A | | | | N/A | | | | 110,506 | | | | 60,174 | |
| | (538,927 | ) | | | (817,082 | ) | | | (1,451,726 | ) | | | (1,983,914 | ) | | | (6,175,811 | ) | | | (3,976,644 | ) |
| | (7,267 | ) | | | (13 | ) | | | N/A | | | | N/A | | | | (4,674,153 | ) | | | (818,985 | ) |
| | (375,964 | ) | | | (715,672 | ) | | | 164,437 | | | | 553,361 | | | | (1,785,846 | ) | | | 13,432,154 | |
| * | Net of redemption fees $1,077. |
| ** | Net of redemption fees $482. |
HENNESSY FUNDS 1-800-966-4354
Financial Statements
| Statements of Changes in Net Assets |
| | | Hennessy Balanced Fund | |
| | | | | | | |
| | | Year Ended | | | Year Ended | |
| | | October 31, 2013 | | | October 31, 2012 | |
| OPERATIONS: | | | | | | |
| Net investment income (loss) | | $ | 19,673 | | | $ | 78,381 | |
| Net realized gain on securities | | | 1,673,842 | | | | 493,334 | |
| Long-term capital gain distributions from regulated investment companies | | | — | | | | — | |
| Change in unrealized appreciation (depreciation) on securities | | | (684,183 | ) | | | 918,830 | |
| Net increase (decrease) in net assets resulting from operations | | | 1,009,332 | | | | 1,490,545 | |
| | | | | | | | | |
| DISTRIBUTIONS TO SHAREHOLDERS FROM: | | | | | | | | |
| Net investment income | | | | | | | | |
| Investor Class | | | (23,090 | ) | | | (81,724 | ) |
| Institutional Class | | | N/A | | | | N/A | |
| Net realized gains | | | | | | | | |
| Investor Class | | | — | | | | — | |
| Institutional Class | | | N/A | | | | N/A | |
| Return of capital | | | | | | | | |
| Investor Class | | | — | | | | — | |
| Institutional Class | | | — | | | | — | |
| Total distributions | | | (23,090 | ) | | | (81,724 | ) |
| | | | | | | | | |
| CAPITAL SHARE TRANSACTIONS: | | | | | | | | |
| Proceeds from shares issued in the Reorganization – Investor Class (See Note 9) | | | — | | | | — | |
| Proceeds from shares issued in the Reorganization – Institutional Class (See Note 9) | | | — | | | | — | |
| Proceeds from shares subscribed – Investor Class | | | 1,014,696 | | | | 13,386,838 | |
| Proceeds from shares subscribed – Institutional Class | | | N/A | | | | N/A | |
| Dividends reinvested – Investor Class | | | 21,766 | | | | 77,883 | |
| Dividends reinvested – Institutional Class | | | N/A | | | | N/A | |
| Cost of shares redeemed – Investor Class | | | (14,981,906 | ) | | | (7,726,009 | ) |
| Cost of shares redeemed – Institutional Class | | | N/A | | | | N/A | |
| Net increase (decrease) in net assets derived from capital share transactions | | | (13,945,444 | ) | | | 5,738,712 | |
| TOTAL INCREASE (DECREASE) IN NET ASSETS | | | (12,959,202 | ) | | | 7,147,533 | |
| | | | | | | | | |
| NET ASSETS: | | | | | | | | |
| Beginning of year | | | 25,169,776 | | | | 18,022,243 | |
| End of year | | $ | 12,210,574 | | | $ | 25,169,776 | |
| Accumulated net investment income (loss), end of year | | $ | — | | | $ | 2,932 | |
| | | | | | | | | |
| CHANGES IN SHARES OUTSTANDING: | | | | | | | | |
| Shares issued in connection with the Reorganization – Investor Class (See Note 9) | | | — | | | | — | |
| Shares issued in connection with the Reorganization – Institutional Class (See Note 9) | | | N/A | | | | N/A | |
| Shares sold – Investor Class | | | 82,345 | | | | 1,156,321 | |
| Shares sold – Institutional Class | | | N/A | | | | N/A | |
| Shares issued to holders as reinvestment of dividends – Investor Class | | | 1,841 | | | | 6,678 | |
| Shares issued to holders as reinvestment of dividends – Institutional Class | | | N/A | | | | N/A | |
| Shares redeemed – Investor Class | | | (1,256,293 | ) | | | (663,666 | ) |
| Shares redeemed – Institutional Class | | | N/A | | | | N/A | |
| Net increase (decrease) in shares outstanding | | | (1,172,107 | ) | | | 499,333 | |
The accompanying notes are an integral part of these financial statements.
| Hennessy Core Bond Fund | | | Hennessy Gas Utility Index Fund | | | Hennessy Small Cap Financial Fund | |
| | | | | | | | | | | | | | | | | |
| Year Ended | | | Year Ended | | | Year Ended | | | Year Ended | | | Year Ended | | | Year Ended | |
| October 31, 2013 | | | October 31, 2012 | | | October 31, 2013 | | | October 31, 2012 | | | October 31, 2013 | | | October 31, 2012 | |
| | | | | | | | | | | | | | | | | |
| $ | 451,243 | | | $ | 936,641 | | | $ | 23,732,673 | | | $ | 16,503,223 | | | $ | 1,386,645 | | | $ | 1,061,732 | |
| | 1,390,074 | | | | 730,827 | | | | 20,377,887 | | | | 15,896,840 | | | | 27,485,214 | | | | 1,944,040 | |
| | — | | | | 2,641 | | | | — | | | | — | | | | — | | | | — | |
| | (1,718,510 | ) | | | 675,399 | | | | 131,840,690 | | | | 38,631,748 | | | | 40,111,802 | | | | 30,826,479 | |
| | 122,807 | | | | 2,345,508 | | | | 175,951,250 | | | | 71,031,811 | | | | 68,983,661 | | | | 33,832,251 | |
| | | | | | | | | | | | | | | | | | | | | | | |
| | | | | | | | | | | | | | | | | | | | | | | |
| | | | | | | | | | | | | | | | | | | | | | | |
| | (103,816 | ) | | | (79,978 | ) | | | (23,162,526 | ) | | | (16,153,180 | ) | | | (1,118,880 | ) | | | (2,581,343 | ) |
| | (365,266 | ) | | | (855,949 | ) | | | N/A | | | | N/A | | | | (520,872 | ) | | | (600,281 | ) |
| | | | | | | | | | | | | | | | | | | | | | | |
| | (74,517 | ) | | | (35,520 | ) | | | (17,562,108 | ) | | | (3,837,545 | ) | | | — | | | | — | |
| | (670,866 | ) | | | (224,731 | ) | | | N/A | | | | N/A | | | | — | | | | — | |
| | | | | | | | | | | | | | | | | | | | | | | |
| | — | | | | — | | | | — | | | | — | | | | — | | | | — | |
| | — | | | | — | | | | — | | | | — | | | | — | | | | — | |
| | (1,214,465 | ) | | | (1,196,178 | ) | | | (40,724,634 | ) | | | (19,990,725 | ) | | | (1,639,752 | ) | | | (3,181,624 | ) |
| | | | | | | | | | | | | | | | | | | | | | | |
| | | | | | | | | | | | | | | | | | | | | | | |
| | — | | | | — | | | | — | | | | — | | | | — | | | | — | |
| | — | | | | — | | | | — | | | | — | | | | — | | | | — | |
| | 2,098,731 | | | | 750,864 | | | | 575,374,779 | | | | 455,625,004 | | | | 91,423,499 | | | | 35,833,043 | |
| | 1,200,715 | | | | 9,744,071 | | | | N/A | | | | N/A | | | | 25,715,806 | | | | 29,798,695 | |
| | 157,601 | | | | 100,421 | | | | 38,473,417 | | | | 18,728,680 | | | | 1,096,037 | | | | 2,505,214 | |
| | 1,033,843 | | | | 276,637 | | | | N/A | | | | N/A | | | | 123,116 | | | | 541,245 | |
| | (2,623,814 | ) | | | (1,491,425 | ) | | | (313,104,396 | )** | | | (212,356,106 | ) | | | (71,541,810 | )*** | | | (52,499,033 | ) |
| | (31,279,649 | )* | | | (915,194 | ) | | | N/A | | | | N/A | | | | (12,933,095 | ) | | | (9,935,564 | ) |
| | (29,412,573 | ) | | | 8,465,374 | | | | 300,743,800 | | | | 261,997,578 | | | | 33,883,553 | | | | 6,243,600 | |
| | (30,504,231 | ) | | | 9,614,704 | | | | 435,970,416 | | | | 313,038,664 | | | | 101,227,462 | | | | 36,894,227 | |
| | | | | | | | | | | | | | | | | | | | | | | |
| | | | | | | | | | | | | | | | | | | | | | | |
| | 36,908,902 | | | | 27,294,198 | | | | 746,820,432 | | | | 433,781,768 | | | | 210,995,067 | | | | 174,100,840 | |
| $ | 6,404,671 | | | $ | 36,908,902 | | | $ | 1,182,790,848 | | | $ | 746,820,432 | | | $ | 312,222,529 | | | $ | 210,995,067 | |
| $ | — | | | $ | 2,309 | | | $ | — | | | $ | 452,765 | | | $ | 598,791 | | | $ | 715,079 | |
| | | | | | | | | | | | | | | | | | | | | | | |
| | | | | | | | | | | | | | | | | | | | | | | |
| | — | | | | — | | | | — | | | | — | | | | — | | | | — | |
| | — | | | | — | | | | N/A | | | | N/A | | | | — | | | | — | |
| | 213,393 | | | | 77,850 | | | | 23,099,378 | | | | 20,822,498 | | | | 4,155,799 | | | | 2,027,671 | |
| | 135,965 | | | | 1,098,239 | | | | N/A | | | | N/A | | | | 1,761,812 | | | | 2,516,251 | |
| | 16,225 | | | | 10,455 | | | | 1,647,989 | | | | 855,456 | | | | 55,049 | | | | 151,831 | |
| | 116,531 | | | | 31,173 | | | | N/A | | | | N/A | | | | 9,865 | | | | 52,043 | |
| | (271,391 | ) | | | (153,825 | ) | | | (12,830,834 | ) | | | (9,730,123 | ) | | | (3,185,460 | ) | | | (2,981,029 | ) |
| | (3,540,601 | ) | | | (102,473 | ) | | | N/A | | | | N/A | | | | (1,010,378 | ) | | | (904,613 | ) |
| | (3,329,878 | ) | | | 961,419 | | | | 11,916,533 | | | | 11,947,831 | | | | 1,786,687 | | | | 862,154 | |
| * | | Net of redemption fees $26. |
| ** | | Net of redemption fees $4,408. |
| *** | | Net of redemption fees $2,257. |
HENNESSY FUNDS 1-800-966-4354
Financial Statements
| Statements of Changes in Net Assets |
| | | Hennessy Large Cap Financial Fund | |
| | | | | | | |
| | | Year Ended | | | Year Ended | |
| | | October 31, 2013 | | | October 31, 2012 | |
| OPERATIONS: | | | | | | |
| Net investment income (loss) | | $ | (155,053 | ) | | $ | 51,832 | |
| Net realized gain on securities | | | 8,243,533 | | | | (2,869,863 | ) |
| Long-term capital gain distributions from regulated investment companies | | | 17,820 | | | | — | |
| Change in unrealized appreciation (depreciation) on securities | | | 10,739,120 | | | | 13,073,690 | |
| Net increase (decrease) in net assets resulting from operations | | | 18,845,420 | | | | 10,255,659 | |
| | | | | | | | | |
| DISTRIBUTIONS TO SHAREHOLDERS FROM: | | | | | | | | |
| Net investment income | | | | | | | | |
| Investor Class | | | (50,837 | ) | | | — | |
| Institutional Class | | | N/A | | | | N/A | |
| Net realized gains | | | | | | | | |
| Investor Class | | | — | | | | — | |
| Institutional Class | | | N/A | | | | N/A | |
| Return of capital | | | | | | | | |
| Investor Class | | | — | | | | — | |
| Institutional Class | | | — | | | | — | |
| Total distributions | | | (50,837 | ) | | | — | |
| | | | | | | | | |
| CAPITAL SHARE TRANSACTIONS: | | | | | | | | |
| Proceeds from shares issued in the Reorganization – Investor Class (See Note 9) | | | — | | | | — | |
| Proceeds from shares issued in the Reorganization – Institutional Class (See Note 9) | | | N/A | | | | N/A | |
| Proceeds from shares subscribed – Investor Class | | | 43,711,247 | | | | 16,478,942 | |
| Proceeds from shares subscribed – Institutional Class | | | N/A | | | | N/A | |
| Dividends reinvested – Investor Class | | | 49,255 | | | | — | |
| Dividends reinvested – Institutional Class | | | N/A | | | | N/A | |
| Cost of shares redeemed – Investor Class | | | (38,910,007 | )* | | | (17,762,354 | ) |
| Cost of shares redeemed – Institutional Class | | | N/A | | | | N/A | |
| Net increase (decrease) in net assets derived from capital share transactions | | | 4,850,495 | | | | (1,283,412 | ) |
| TOTAL INCREASE (DECREASE) IN NET ASSETS | | | 23,645,078 | | | | 8,972,247 | |
| | | | | | | | | |
| NET ASSETS: | | | | | | | | |
| Beginning of year | | | 64,655,891 | | | | 55,683,644 | |
| End of year | | $ | 88,300,969 | | | $ | 64,655,891 | |
| Accumulated net investment income (loss), end of year | | $ | (161,731 | ) | | $ | 50,837 | |
| | | | | | | | | |
| CHANGES IN SHARES OUTSTANDING: | | | | | | | | |
| Shares issued in connection with the Reorganization – Investor Class (See Note 9) | | | — | | | | — | |
| Shares issued in connection with the Reorganization – Institutional Class (See Note 9) | | | N/A | | | | N/A | |
| Shares sold – Investor Class | | | 2,488,338 | | | | 1,270,324 | |
| Shares sold – Institutional Class | | | N/A | | | | N/A | |
| Shares issued to holders as reinvestment of dividends – Investor Class | | | 3,367 | | | | — | |
| Shares issued to holders as reinvestment of dividends – Institutional Class | | | N/A | | | | N/A | |
| Shares redeemed – Investor Class | | | (2,412,632 | ) | | | (1,379,184 | ) |
| Shares redeemed – Institutional Class | | | N/A | | | | N/A | |
| Net increase (decrease) in shares outstanding | | | 79,073 | | | | (108,860 | ) |
* Net of redemption fees $15.
The accompanying notes are an integral part of these financial statements.
| Hennessy Technology Fund | | | Hennessy Japan Fund | | | Hennessy Japan Small Cap Fund | |
| | | | | | | | | | | | | | | | | |
| Year Ended | | | Year Ended | | | Year Ended | | | Year Ended | | | Year Ended | | | Year Ended | |
| October 31, 2013 | | | October 31, 2012 | | | October 31, 2013 | | | October 31, 2012 | | | October 31, 2013 | | | October 31, 2012 | |
| | | | | | | | | | | | | | | | | |
| $ | (66,991 | ) | | $ | (73,791 | ) | | $ | (84,313 | ) | | $ | 1,984 | | | $ | (15,072 | ) | | $ | (99,955 | ) |
| | 577,798 | | | | 105,389 | | | | 16,814 | | | | (816,325 | ) | | | 3,128,752 | | | | 2,043,302 | |
| | — | | | | — | | | | — | | | | — | | | | — | | | | — | |
| | 802,157 | | | | (96,492 | ) | | | 6,419,308 | | | | 2,653,253 | | | | 1,109,483 | | | | (380,675 | ) |
| | 1,312,964 | | | | (64,894 | ) | | | 6,351,809 | | | | 1,838,912 | | | | 4,223,163 | | | | 1,562,672 | |
| | | | | | | | | | | | | | | | | | | | | | | |
| | | | | | | | | | | | | | | | | | | | | | | |
| | | | | | | | | | | | | | | | | | | | | | | |
| | — | | | | — | | | | — | | | | — | | | | — | | | | (99,101 | ) |
| | — | | | | — | | | | — | | | | — | | | | N/A | | | | N/A | |
| | | | | | | | | | | | | | | | | | | | | | | |
| | — | | | | — | | | | — | | | | — | | | | (1,115,069 | ) | | | — | |
| | — | | | | — | | | | — | | | | — | | | | N/A | | | | N/A | |
| | | | | | | | | | | | | | | | | | | | | | | |
| | — | | | | — | | | | (7,343 | ) | | | — | | | | — | | | | — | |
| | — | | | | — | | | | (5,524 | ) | | | — | | | | — | | | | — | |
| | — | | | | — | | | | (12,867 | ) | | | — | | | | N/A | | | | N/A | |
| | | | | | | | | | | | | | | | | | | | | | | |
| | | | | | | | | | | | | | | | | | | | | | | |
| | — | | | | — | | | | — | | | | — | | | | — | | | | — | |
| | — | | | | — | | | | — | | | | — | | | | — | | | | — | |
| | 633,313 | | | | 1,102,171 | | | | 34,783,512 | | | �� | 6,766,669 | | | | 23,641,290 | | | | 2,526,353 | |
| | 199,069 | | | | 117,282 | | | | 2,373,930 | | | | 157,102 | | | | N/A | | | | N/A | |
| | — | | | | — | | | | 7,134 | | | | — | | | | 1,067,157 | | | | 95,320 | |
| | — | | | | — | | | | 5,425 | | | | — | | | | N/A | | | | N/A | |
| | (1,642,150 | ) | | | (2,317,205 | ) | | | (18,430,840 | ) | | | (12,101,974 | ) | | | (18,099,720 | ) | | | (23,061,781 | ) |
| | (196,791 | ) | | | (318,228 | ) | | | (4,003,290 | ) | | | (1,853,965 | ) | | | N/A | | | | N/A | |
| | (1,006,559 | ) | | | (1,415,980 | ) | | | 14,735,871 | | | | (7,032,168 | ) | | | 6,608,727 | | | | (20,440,108 | ) |
| | 306,405 | | | | (1,480,874 | ) | | | 21,074,813 | | | | (5,193,256 | ) | | | 9,716,821 | | | | (18,976,537 | ) |
| | | | | | | | | | | | | | | | | | | | | | | |
| | | | | | | | | | | | | | | | | | | | | | | |
| | 5,374,044 | | | | 6,854,918 | | | | 19,318,221 | | | | 24,511,477 | | | | 5,106,522 | | | | 24,083,059 | |
| $ | 5,680,449 | | | $ | 5,374,044 | | | $ | 40,393,034 | | | $ | 19,318,221 | | | $ | 14,823,343 | | | $ | 5,106,522 | |
| $ | (65,889 | ) | | $ | (64,030 | ) | | $ | (120,450 | ) | | $ | — | | | $ | (16,755 | ) | | $ | (57,735 | ) |
| | | | | | | | | | | | | | | | | | | | | | | |
| | | | | | | | | | | | | | | | | | | | | | | |
| | — | | | | — | | | | — | | | | — | | | | — | | | | — | |
| | — | | | | — | | | | — | | | | — | | | | N/A | | | | N/A | |
| | 54,289 | | | | 100,084 | | | | 1,961,023 | | | | 460,787 | | | | 2,326,376 | | | | 235,392 | |
| | 16,644 | | | | 10,510 | | | | 126,165 | | | | 10,560 | | | | N/A | | | | N/A | |
| | — | | | | — | | | | 459 | | | | — | | | | 121,406 | | | | 9,570 | |
| | — | | | | — | | | | 344 | | | | — | | | | N/A | | | | N/A | |
| | (139,783 | ) | | | (208,443 | ) | | | (1,043,924 | ) | | | (845,443 | ) | | | (1,665,417 | ) | | | (2,148,260 | ) |
| | (16,569 | ) | | | (29,733 | ) | | | (245,080 | ) | | | (124,185 | ) | | | N/A | | | | N/A | |
| | (85,419 | ) | | | (127,582 | ) | | | 798,987 | | | | (498,281 | ) | | | 782,365 | | | | (1,903,298 | ) |
HENNESSY FUNDS 1-800-966-4354
Statement of Cash Flows
Hennessy Total Return Fund For the Year Ended October 31, 2013 |
| Cash Flows From Operating Activities: | | | |
| | | | |
| Net increase in net assets from operations | | $ | 10,796,088 | |
| Adjustments to reconcile net increase in net assets from operations to net cash provided by operating activities: | | | | |
| Purchase of investment securities | | | (343,530,006 | ) |
| Proceeds on sale of securities | | | 335,327,129 | |
| Decrease in other receivables, net | | | 217,022 | |
| Increase in other assets | | | (837 | ) |
| Decrease in accrued expenses and other payables | | | (95,652 | ) |
| Net accretion of discount on securities | | | (28,060 | ) |
| Net realized gain on investments | | | (4,930,184 | ) |
| Unrealized appreciation on securities | | | (4,920,747 | ) |
| Net cash used in operating activities | | $ | (7,165,247 | ) |
| | | | | |
| Cash Flows From Financing Activities: | | | | |
| | | | | |
| Increase in reverse repurchase agreements | | $ | 5,391,000 | |
| Proceeds on shares sold | | | 21,431,210 | |
| Payment on shares repurchased | | | (19,573,550 | ) |
| Cash dividends paid, net of dividends reinvested | | | (83,413 | ) |
| Net cash provided by financing activities | | $ | 7,165,247 | |
| | | | | |
| Cash at beginning of year | | | — | |
| Cash at end of year | | | — | |
| Net increase (decrease) in cash | | $ | — | |
| | | | | |
| Cash paid for interest | | $ | 79,970 | |
The accompanying notes are an integral part of these financial statements.
(This Page Intentionally Left Blank.)
HENNESSY FUNDS 1-800-966-4354
Financial Highlights
| Hennessy Cornerstone Growth Fund |
For an Investor Class share outstanding throughout each year
| | | Year Ended October 31, | |
| | | 2013 | | | 2012 | | | 2011 | | | 2010 | | | 2009 | |
| PER SHARE DATA: | | | | | | | | | | | | | | | |
| Net asset value, beginning of year | | $ | 12.38 | | | $ | 9.97 | | | $ | 10.28 | | | $ | 8.81 | | | $ | 8.80 | |
| | | | | | | | | | | | | | | | | | | | | |
| Income from investment operations: | | | | | | | | | | | | | | | | | | | | |
| Net investment loss | | | (0.11 | ) | | | (0.07 | ) | | | (0.08 | ) | | | (0.10 | ) | | | (0.04 | ) |
| Net realized and unrealized gains (losses) on securities | | | 3.38 | | | | 2.48 | | | | (0.23 | ) | | | 1.57 | | | | 0.05 | |
| Total from investment operations | | | 3.27 | | | | 2.41 | | | | (0.31 | ) | | | 1.47 | | | | 0.01 | |
| | | | | | | | | | | | | | | | | | | | | |
| Less Distributions: | | | | | | | | | | | | | | | | | | | | |
| Dividends from net investment income | | | — | | | | — | | | | — | | | | — | | | | — | |
| Dividends from net realized gains | | | — | | | | — | | | | — | | | | — | | | | — | |
| Total distributions | | | — | | | | — | | | | — | | | | — | | | | — | |
| Net asset value, end of year | | $ | 15.65 | | | $ | 12.38 | | | $ | 9.97 | | | $ | 10.28 | | | $ | 8.81 | |
| | | | | | | | | | | | | | | | | | | | | |
| TOTAL RETURN | | | 26.41 | % | | | 24.17 | % | | | (3.02 | )% | | | 16.69 | % | | | 0.11 | % |
| | | | | | | | | | | | | | | | | | | | | |
| SUPPLEMENTAL DATA AND RATIOS: | | | | | | | | | | | | | | | | | | | | |
| Net assets, end of year (millions) | | $ | 220.83 | | | $ | 265.60 | | | $ | 184.40 | | | $ | 207.11 | | | $ | 228.96 | |
| Ratio of expenses to average net assets | | | 1.29 | % | | | 1.34 | % | | | 1.33 | % | | | 1.34 | % | | | 1.36 | % |
| Ratio of net investment loss to average net assets | | | (0.26 | )% | | | (0.66 | )% | | | (0.78 | )% | | | (0.89 | )% | | | (0.42 | )% |
Portfolio turnover rate(1) | | | 105 | % | | | 90 | % | | | 106 | % | | | 103 | % | | | 108 | % |
(1) Portfolio turnover is calculated on the basis of the Fund as a whole.
The accompanying notes are an integral part of these financial statements.
Financial Highlights
| Hennessy Cornerstone Growth Fund |
For an Institutional Class share outstanding throughout each year
| | | Year Ended October 31, | |
| | | 2013 | | | 2012 | | | 2011 | | | 2010 | | | 2009 | |
| PER SHARE DATA: | | | | | | | | | | | | | | | |
| Net asset value, beginning of year | | $ | 12.57 | | | $ | 10.09 | | | $ | 10.37 | | | $ | 8.86 | | | $ | 8.82 | |
| | | | | | | | | | | | | | | | | | | | | |
| Income from investment operations: | | | | | | | | | | | | | | | | | | | | |
| Net investment income (loss) | | | 0.01 | | | | (0.04 | ) | | | (0.05 | ) | | | (0.07 | ) | | | — | |
| Net realized and unrealized gains (losses) on securities | | | 3.36 | | | | 2.52 | | | | (0.23 | ) | | | 1.58 | | | | 0.04 | |
| Total from investment operations | | | 3.37 | | | | 2.48 | | | | (0.28 | ) | | | 1.51 | | | | 0.04 | |
| | | | | | | | | | | | | | | | | | | | | |
| Less Distributions: | | | | | | | | | | | | | | | | | | | | |
| Dividends from net investment income | | | — | | | | — | | | | — | | | | — | | | | — | |
| Dividends from net realized gains | | | — | | | | — | | | | — | | | | — | | | | — | |
| Total distributions | | | — | | | | — | | | | — | | | | — | | | | — | |
| Net asset value, end of year | | $ | 15.94 | | | $ | 12.57 | | | $ | 10.09 | | | $ | 10.37 | | | $ | 8.86 | |
| | | | | | | | | | | | | | | | | | | | | |
| TOTAL RETURN | | | 26.81 | % | | | 24.58 | % | | | (2.70 | )% | | | 17.04 | % | | | 0.45 | % |
| | | | | | | | | | | | | | | | | | | | | |
| SUPPLEMENTAL DATA AND RATIOS: | | | | | | | | | | | | | | | | | | | | |
| Net assets, end of year (millions) | | $ | 26.23 | | | $ | 37.11 | | | $ | 2.53 | | | $ | 3.12 | | | $ | 4.68 | |
| Ratio of expenses to average net assets | | | | | | | | | | | | | | | | | | | | |
| Before expense reimbursement | | | 1.11 | % | | | 1.11 | % | | | 1.09 | % | | | 1.09 | % | | | 1.11 | % |
| After expense reimbursement | | | 0.98 | % | | | 0.98 | % | | | 0.98 | % | | | 0.98 | % | | | 0.98 | % |
| Ratio of net investment income (loss) to average net assets | | | | | | | | | | | | | | | | | | | | |
| Before expense reimbursement | | | (0.01 | )% | | | (0.51 | )% | | | (0.55 | )% | | | (0.64 | )% | | | (0.17 | )% |
| After expense reimbursement | | | 0.12 | % | | | (0.38 | )% | | | (0.44 | )% | | | (0.53 | )% | | | (0.04 | )% |
Portfolio turnover rate(1) | | | 105 | % | | | 90 | % | | | 106 | % | | | 103 | % | | | 108 | % |
(1) Portfolio turnover is calculated on the basis of the Fund as a whole.
The accompanying notes are an integral part of these financial statements.
HENNESSY FUNDS 1-800-966-4354
Financial Highlights
For an Investor Class share outstanding throughout each year
| | | Year Ended October 31, | |
| | | 2013 | | | 2012 | | | 2011 | | | 2010 | | | 2009 | |
| PER SHARE DATA: | | | | | | | | | | | | | | | |
| Net asset value, beginning of year | | $ | 51.78 | | | $ | 49.80 | | | $ | 47.57 | | | $ | 37.56 | | | $ | 37.40 | |
| | | | | | | | | | | | | | | | | | | | | |
| Income from investment operations: | | | | | | | | | | | | | | | | | | | | |
| Net investment income (loss) | | | (0.32 | ) | | | (0.39 | ) | | | (0.50 | )(1) | | | (0.64 | ) | | | (0.42 | ) |
| Net realized and unrealized gains (losses) on securities | | | 16.44 | | | | 7.61 | | | | 4.44 | | | | 10.65 | | | | 5.76 | |
| Total from investment operations | | | 16.12 | | | | 7.22 | | | | 3.94 | | | | 10.01 | | | | 5.34 | |
| | | | | | | | | | | | | | | | | | | | | |
| Less Distributions: | | | | | | | | | | | | | | | | | | | | |
| Dividends from net investment income | | | — | | | | — | | | | — | | | | — | | | | — | |
| Dividends from net realized gains | | | (4.32 | ) | | | (5.24 | ) | | | (1.72 | ) | | | — | | | | (5.19 | ) |
| Total distributions | | | (4.32 | ) | | | (5.24 | ) | | | (1.72 | ) | | | — | | | | (5.19 | ) |
| Paid-in capital from redemption fees | | | 0.00 | (2) | | | 0.00 | (2) | | | 0.01 | | | | 0.00 | (2) | | | 0.01 | |
| Net asset value, end of year | | $ | 63.58 | | | $ | 51.78 | | | $ | 49.80 | | | $ | 47.57 | | | $ | 37.56 | |
| | | | | | | | | | | | | | | | | | | | | |
| TOTAL RETURN | | | 33.54 | % | | | 16.17 | % | | | 8.35 | % | | | 26.65 | % | | | 17.74 | % |
| | | | | | | | | | | | | | | | | | | | | |
| SUPPLEMENTAL DATA AND RATIOS: | | | | | | | | | | | | | | | | | | | | |
| Net assets, end of year (millions) | | | 1,139.85 | | | $ | 707.61 | | | $ | 611.34 | | | $ | 670.84 | | | $ | 759.77 | |
| Ratio of expenses to average net assets | | | 1.43 | % | | | 1.41 | % | | | 1.44 | % | | | 1.51 | % | | | 1.43 | % |
| Ratio of net investment loss to average net assets | | | (0.85 | )% | | | (0.79 | )% | | | (1.01 | )% | | | (1.31 | )% | | | (1.16 | )% |
Portfolio turnover rate(3) | | | 4 | % | | | 13 | % | | | 13 | % | | | 5 | % | | | 5 | % |
| (1) | Calculated based on average shares outstanding method. |
| (2) | Amount is less than $0.01. |
| (3) | Portfolio turnover is calculated on the basis of the Fund as a whole. |
The accompanying notes are an integral part of these financial statements.
Financial Highlights
For an Institutional Class share outstanding throughout each year*
| | | Year Ended October 31, | |
| | | 2013 | | | 2012 | | | 2011 | | | 2010 | | | 2009 | |
| PER SHARE DATA: | | | | | | | | | | | | | | | |
| Net asset value, beginning of year | | $ | 52.19 | | | $ | 50.02 | | | $ | 47.64 | | | $ | 37.84 | | | $ | 130.93 | |
| | | | | | | | | | | | | | | | | | | | | |
| Income from investment operations: | | | | | | | | | | | | | | | | | | | | |
| Net investment income (loss) | | | (0.13 | ) | | | (0.22 | ) | | | (0.37 | )(1) | | | (0.41 | ) | | | (0.25 | ) |
| Net realized and unrealized gains (losses) on securities | | | 16.58 | | | | 7.63 | | | | 4.47 | | | | 10.58 | | | | 0.59 | |
| Total from investment operations | | | 16.45 | | | | 7.41 | | | | 4.10 | | | | 10.17 | | | | 0.34 | |
| | | | | | | | | | | | | | | | | | | | | |
| Less Distributions: | | | | | | | | | | | | | | | | | | | | |
| Dividends from net investment income | | | — | | | | — | | | | — | | | | (0.37 | ) | | | — | |
| Dividends from net realized gains | | | (4.32 | ) | | | (5.24 | ) | | | (1.72 | ) | | | — | | | | (93.45 | ) |
| Total distributions | | | (4.32 | ) | | | (5.24 | ) | | | (1.72 | ) | | | (0.37 | ) | | | (93.45 | ) |
| Paid-in capital from redemption fees | | | — | | | | 0.00 | (2) | | | 0.00 | (2) | | | 0.00 | (2) | | | 0.02 | |
| Net asset value, end of year | | $ | 64.32 | | | $ | 52.19 | | | $ | 50.02 | | | $ | 47.64 | | | $ | 37.84 | |
| | | | | | | | | | | | | | | | | | | | | |
| TOTAL RETURN | | | 33.94 | % | | | 16.51 | % | | | 8.53 | % | | | 27.32 | % | | | 18.15 | % |
| | | | | | | | | | | | | | | | | | | | | |
| SUPPLEMENTAL DATA AND RATIOS: | | | | | | | | | | | | | | | | | | | | |
| Net assets, end of year (millions) | | $ | 179.89 | | | $ | 77.28 | | | $ | 49.01 | | | $ | 36.81 | | | $ | 34.23 | |
| Ratio of expenses to average net assets | | | 1.13 | % | | | 1.12 | % | | | 1.15 | % | | | 1.26 | % | | | 1.15 | % |
| Ratio of net investment income (loss) to average net assets | | | (0.52 | )% | | | (0.52 | )% | | | (0.76 | )% | | | (1.06 | )% | | | (0.88 | )% |
Portfolio turnover rate(3) | | | 4 | % | | | 13 | % | | | 13 | % | | | 5 | % | | | 5 | % |
| * | Per share amounts have been restated on a retroactive basis to reflect a 1:18 reverse stock split effective December 10, 2010. |
| (1) | Calculated based on average shares outstanding method. |
| (2) | Amount is less than $0.01. |
| (3) | Portfolio turnover is calculated on the basis of the Fund as a whole. |
The accompanying notes are an integral part of these financial statements.
HENNESSY FUNDS 1-800-966-4354
Financial Highlights
| Hennessy Cornerstone Mid Cap 30 Fund |
For an Investor Class share outstanding throughout each year
| | | Year Ended October 31, | |
| | | 2013 | | | 2012 | | | 2011 | | | 2010 | | | 2009 | |
| PER SHARE DATA: | | | | | | | | | | | | | | | |
| Net asset value, beginning of year | | $ | 14.06 | | | $ | 12.15 | | | $ | 11.18 | | | $ | 8.73 | | | $ | 8.02 | |
| | | | | | | | | | | | | | | | | | | | | |
| Income from investment operations: | | | | | | | | | | | | | | | | | | | | |
| Net investment income (loss) | | | 0.09 | | | | 0.08 | | | | (0.09 | ) | | | (0.03 | ) | | | (0.02 | ) |
| Net realized and unrealized gains (losses) on investments | | | 3.35 | | | | 1.83 | | | | 1.06 | | | | 2.48 | | | | 0.73 | |
| Total from investment operations | | | 3.44 | | | | 1.91 | | | | 0.97 | | | | 2.45 | | | | 0.71 | |
| | | | | | | | | | | | | | | | | | | | | |
| Less Distributions: | | | | | | | | | | | | | | | | | | | | |
| Dividends from net investment income | | | (0.18 | ) | | | — | | | | — | | | | — | | | | — | |
| Dividends from net realized gains | | | — | | | | — | | | | — | | | | — | | | | — | |
| Total distributions | | | (0.18 | ) | | | — | | | | — | | | | — | | | | — | |
| Net asset value, end of year | | $ | 17.32 | | | $ | 14.06 | | | $ | 12.15 | | | $ | 11.18 | | | $ | 8.73 | |
| | | | | | | | | | | | | | | | | | | | | |
| TOTAL RETURN | | | 24.78 | % | | | 15.72 | % | | | 8.68 | % | | | 28.06 | % | | | 8.85 | % |
| | | | | | | | | | | | | | | | | | | | | |
| SUPPLEMENTAL DATA AND RATIOS: | | | | | | | | | | | | | | | | | | | | |
| Net assets, end of year (millions) | | $ | 159.45 | | | $ | 145.85 | | | $ | 146.23 | | | $ | 123.20 | | | $ | 128.36 | |
| Ratio of expenses to average net assets | | | 1.31 | % | | | 1.37 | % | | | 1.36 | % | | | 1.39 | % | | | 1.39 | % |
| Ratio of net investment income (loss) to average net assets | | | 0.51 | % | | | 0.59 | % | | | (0.79 | )% | | | (0.26 | )% | | | (0.20 | )% |
Portfolio turnover rate(1) | | | 212 | % | | | 25 | % | | | 107 | % | | | 87 | % | | | 90 | % |
(1) Portfolio turnover is calculated on the basis of the Fund as a whole.
The accompanying notes are an integral part of these financial statements.
Financial Highlights
| Hennessy Cornerstone Mid Cap 30 Fund |
For an Institutional Class share outstanding throughout each year
| | | Year Ended October 31, | |
| | | 2013 | | | 2012 | | | 2011 | | | 2010 | | | 2009 | |
| PER SHARE DATA: | | | | | | | | | | | | | | | |
| Net asset value, beginning of year | | $ | 14.31 | | | $ | 12.32 | | | $ | 11.29 | | | $ | 8.78 | | | $ | 8.04 | |
| | | | | | | | | | | | | | | | | | | | | |
| Income from investment operations: | | | | | | | | | | | | | | | | | | | | |
| Net investment income (loss) | | | 0.14 | | | | 0.09 | | | | (0.05 | ) | | | 0.02 | | | | 0.02 | |
| Net realized and unrealized gains (losses) on investments | | | 3.41 | | | | 1.90 | | | | 1.08 | | | | 2.49 | | | | 0.72 | |
| Total from investment operations | | | 3.55 | | | | 1.99 | | | | 1.03 | | | | 2.51 | | | | 0.74 | |
| | | | | | | | | | | | | | | | | | | | | |
| Less Distributions: | | | | | | | | | | | | | | | | | | | | |
| Dividends from net investment income | | | (0.24 | ) | | | — | | | | — | | | | — | | | | — | |
| Dividends from net realized gains | | | — | | | | — | | | | — | | | | — | | | | — | |
| Total distributions | | | (0.24 | ) | | | — | | | | — | | | | — | | | | — | |
| Net asset value, end of year | | $ | 17.62 | | | $ | 14.31 | | | $ | 12.32 | | | $ | 11.29 | | | $ | 8.78 | |
| | | | | | | | | | | | | | | | | | | | | |
| TOTAL RETURN | | | 25.15 | % | | | 16.15 | % | | | 9.12 | % | | | 28.59 | % | | | 9.20 | % |
| | | | | | | | | | | | | | | | | | | | | |
| SUPPLEMENTAL DATA AND RATIOS: | | | | | | | | | | | | | | | | | | | | |
| Net assets, end of year (millions) | | $ | 51.19 | | | $ | 41.62 | | | $ | 24.06 | | | $ | 21.38 | | | $ | 27.44 | |
| Ratio of expenses to average net assets | | | | | | | | | | | | | | | | | | | | |
| Before expense reimbursement | | | 1.11 | % | | | 1.16 | % | | | 1.14 | % | | | 1.16 | % | | | 1.15 | % |
| After expense reimbursement | | | 0.98 | % | | | 0.98 | % | | | 0.98 | % | | | 0.98 | % | | | 0.98 | % |
| Ratio of net investment income (loss) to average net assets | | | | | | | | | | | | | | | | | | | | |
| Before expense reimbursement | | | 0.71 | % | | | 0.90 | % | | | (0.41 | )% | | | (0.03 | )% | | | 0.04 | % |
| After expense reimbursement | | | 0.84 | % | | | 1.08 | % | | | (0.57 | )% | | | 0.15 | % | | | 0.21 | % |
Portfolio turnover rate(1) | | | 212 | % | | | 25 | % | | | 107 | % | | | 87 | % | | | 90 | % |
(1) Portfolio turnover is calculated on the basis of the Fund as a whole.
The accompanying notes are an integral part of these financial statements.
HENNESSY FUNDS 1-800-966-4354
Financial Highlights
| Hennessy Cornerstone Large Growth Fund |
| For an Investor Class share outstanding throughout each year |
| | | | | | | | | | | | | | | One Month | | | | |
| | | | | | | | | | | | | | | Ended | | | Year Ended | |
| | | Year Ended October 31, | | | October 31, | | | September 30, | |
| | | 2013 | | | 2012 | | | 2011 | | | 2010 | | | 2009(1) | | | 2009(2) | |
| PER SHARE DATA: | | | | | | | | | | | | | | | | | | |
| Net asset value, beginning of year | | $ | 10.77 | | | $ | 12.37 | | | $ | 11.70 | | | $ | 9.49 | | | $ | 9.60 | | | $ | 10.09 | |
| | | | | | | | | | | | | | | | | | | | | | | | | |
| Income from investment operations: | | | | | | | | | | | | | | | | | | | | | | | | |
| Net investment income (loss) | | | 0.14 | | | | 0.13 | | | | 0.09 | | | | 0.09 | | | | — | (3) | | | 0.05 | |
| Net realized and unrealized gains (losses) on securities | | | 2.77 | | | | 0.80 | | | | 0.69 | | | | 2.17 | | | | (0.11 | ) | | | (0.54 | ) |
| Total from investment operations | | | 2.91 | | | | 0.93 | | | | 0.78 | | | | 2.26 | | | | (0.11 | ) | | | (0.49 | ) |
| | | | | | | | | | | | | | | | | | | | | | | | | |
| Less Distributions: | | | | | | | | | | | | | | | | | | | | | | | | |
| Dividends from net investment income | | | (0.10 | ) | | | (0.07 | ) | | | (0.09 | ) | | | (0.05 | ) | | | — | | | | — | |
| Dividends from net realized gains | | | (0.02 | ) | | | (2.46 | ) | | | (0.02 | ) | | | — | | | | — | | | | — | |
| Total distributions | | | (0.12 | ) | | | (2.53 | ) | | | (0.11 | ) | | | (0.05 | ) | | | — | | | | — | |
| Net asset value, end of year | | $ | 13.56 | | | $ | 10.77 | | | $ | 12.37 | | | $ | 11.70 | | | $ | 9.49 | | | $ | 9.60 | |
| | | | | | | | | | | | | | | | | | | | | | | | | |
| TOTAL RETURN | | | 27.32 | % | | | 9.14 | % | | | 6.70 | % | | | 23.88 | % | | | (1.15 | )%(4) | | | (4.86 | )% |
| | | | | | | | | | | | | | | | | | | | | | | | | |
| SUPPLEMENTAL DATA AND RATIOS: | | | | | | | | | | | | | | | | | | | | | | | | |
| Net assets, end of year (millions) | | $ | 88.77 | | | $ | 75.83 | | | $ | 77.88 | | | $ | 78.83 | | | $ | 69.41 | | | $ | 70.61 | |
| Ratio of expenses to average net assets | | | | | | | | | | | | | | | | | | | | | | | | |
| Before expense reimbursement/recoupment | | | 1.19 | % | | | 1.27 | % | | | 1.26 | % | | | 1.30 | % | | | 1.26 | %(5) | | | 1.40 | % |
| After expense reimbursement/recoupment | | | 1.19 | % | | | 1.27 | % | | | 1.30 | % | | | 1.30 | % | | | 1.30 | %(5) | | | 1.17 | % |
| Ratio of net investment income to average net assets | | | | | | | | | | | | | | | | | | | | | | | | |
| Before expense reimbursement/recoupment | | | 1.10 | % | | | 1.35 | % | | | 0.72 | % | | | 0.84 | % | | | (0.01 | )%(5) | | | 0.36 | % |
| After expense reimbursement/recoupment | | | 1.10 | % | | | 1.35 | % | | | 0.68 | % | | | 0.84 | % | | | (0.05 | )%(5) | | | 0.59 | % |
Portfolio turnover rate(6) | | | 73 | % | | | 0 | % | | | 70 | % | | | 83 | % | | | 0 | %(4) | | | 116 | % |
| (1) | For the one month ended October 31, 2009. Effective October 31, 2009, the Fund changed its fiscal year end to October 31 from September 30. |
| (2) | The financial highlights set forth for periods prior to March 20, 2009 represent the historical financial highlights of the Tamarack Large Cap Growth Fund, Class S shares. The assets of the Tamarack Large Cap Growth Fund were acquired by the Hennessy Cornerstone Large Growth Fund on March 20, 2009. At the time, RBC Global Asset Management (U.S.), Inc. (formerly known as Voyageur Asset Management Inc.) ceased to be investment advisor and Hennessy Advisors, Inc. became investment advisor. The return of the Tamarack Large Cap Growth Fund, Class S shares during the period October 1, 2008 through March 20, 2009 was (33.30)%. The return of the Hennessy Cornerstone Large Growth Fund, Original Class shares during the period March 20, 2009 through September 30, 2009 was 42.64%. |
| (3) | Amount is less than $0.01 or ($0.01) per share. |
| (4) | Not annualized. |
| (5) | Annualized. |
| (6) | Portfolio turnover is calculated on the basis of the Fund as a whole. |
The accompanying notes are an integral part of these financial statements.
Financial Highlights
| Hennessy Cornerstone Large Growth Fund |
For an Institutional Class share outstanding throughout each year
| | | | | | | | | | | | | | | One Month | | | | |
| | | | | | | | | | | | | | | Ended | | | Period Ended | |
| | | Year Ended October 31, | | | October 31, | | | September 30, | |
| | | 2013 | | | 2012 | | | 2011 | | | 2010 | | | 2009(1) | | | 2009(2) | |
| PER SHARE DATA: | | | | | | | | | | | | | | | | | | |
| Net asset value, beginning of year | | $ | 10.85 | | | $ | 12.44 | | | $ | 11.76 | | | $ | 9.51 | | | $ | 9.61 | | | $ | 6.73 | |
| | | | | | | | | | | | | | | | | | | | | | | | | |
| Income from investment operations: | | | | | | | | | | | | | | | | | | | | | | | | |
| Net investment income | | | 0.09 | | | | 0.07 | | | | 0.08 | | | | 0.10 | | | | — | (3) | | | 0.03 | |
| Net realized and unrealized gains (losses) on securities | | | 2.88 | | | | 0.89 | | | | 0.74 | | | | 2.20 | | | | (0.10 | ) | | | 2.85 | |
| Total from investment operations | | | 2.97 | | | | 0.96 | | | | 0.82 | | | | 2.30 | | | | (0.10 | ) | | | 2.88 | |
| | | | | | | | | | | | | | | | | | | | | | | | | |
| Less Distributions: | | | | | | | | | | | | | | | | | | | | | | | | |
| Dividends from net investment income | | | (0.12 | ) | | | (0.09 | ) | | | (0.12 | ) | | | (0.05 | ) | | | — | | | | — | |
| Dividends from net realized gains | | | (0.02 | ) | | | (2.46 | ) | | | (0.02 | ) | | | — | | | | — | | | | — | |
| Total distributions | | | (0.14 | ) | | | (2.55 | ) | | | (0.14 | ) | | | (0.05 | ) | | | — | | | | — | |
| Net asset value, end of year | | $ | 13.68 | | | $ | 10.85 | | | $ | 12.44 | | | $ | 11.76 | | | $ | 9.51 | | | $ | 9.61 | |
| | | | | | | | | | | | | | | | | | | | | | | | | |
| TOTAL RETURN | | | 27.63 | % | | | 9.43 | % | | | 6.99 | % | | | 24.26 | % | | | (1.04 | )%(4) | | | 42.79 | %(4) |
| | | | | | | | | | | | | | | | | | | | | | | | | |
| SUPPLEMENTAL DATA AND RATIOS: | | | | | | | | | | | | | | | | | | | | | | | | |
| Net assets, end of year (millions) | | $ | 16.19 | | | $ | 33.94 | | | $ | 0.14 | | | $ | 0.07 | | | $ | 0.04 | | | $ | 0.04 | |
| Ratio of expenses to average net assets | | | | | | | | | | | | | | | | | | | | | | | | |
| Before expense reimbursement | | | 1.10 | % | | | 1.41 | % | | | 1.14 | % | | | 1.16 | % | | | 1.14 | %(5) | | | 16.51 | %(5) |
| After expense reimbursement | | | 0.98 | % | | | 0.98 | % | | | 0.98 | % | | | 0.98 | % | | | 0.98 | %(5) | | | 0.98 | %(5) |
| Ratio of net investment income to average net assets | | | | | | | | | | | | | | | | | | | | | | | | |
| Before expense reimbursement | | | 1.38 | % | | | 6.44 | % | | | 0.81 | % | | | 0.90 | % | | | 0.12 | %(5) | | | (14.54 | )%(5) |
| After expense reimbursement | | | 1.50 | % | | | 6.87 | % | | | 0.97 | % | | | 1.08 | % | | | 0.28 | %(5) | | | 0.99 | %(5) |
Portfolio turnover rate(6) | | | 73 | % | | | 0 | % | | | 70 | % | | | 83 | % | | | 0 | %(4) | | | 116 | %(4) |
| (1) | For the one month ended October 31, 2009. Effective October 31, 2009, the Fund changed its fiscal year end to October 31 from September 30. |
| (2) | Institutional Class shares commenced operations on March 20, 2009. |
| (3) | Amount is less than $0.01 or ($0.01) per share. |
| (4) | Not annualized. |
| (5) | Annualized. |
| (6) | Portfolio turnover is calculated on the basis of the Fund as a whole. |
The accompanying notes are an integral part of these financial statements.
HENNESSY FUNDS 1-800-966-4354
Financial Highlights
| Hennessy Cornerstone Value Fund |
For an Investor Class share outstanding throughout each year
| | | Year Ended October 31, | |
| | | 2013 | | | 2012 | | | 2011 | | | 2010 | | | 2009 | |
| PER SHARE DATA: | | | | | | | | | | | | | | | |
| Net asset value, beginning of year | | $ | 14.02 | | | $ | 12.84 | | | $ | 12.53 | | | $ | 10.63 | | | $ | 9.05 | |
| | | | | | | | | | | | | | | | | | | | | |
| Income from investment operations: | | | | | | | | | | | | | | | | | | | | |
| Net investment income | | | 0.42 | | | | 0.37 | | | | 0.45 | | | | 0.29 | | | | 0.24 | |
| Net realized and unrealized gains (losses) on investments | | | 2.84 | | | | 1.23 | | | | 0.23 | | | | 1.81 | | | | 1.87 | |
| Total from investment operations | | | 3.26 | | | | 1.60 | | | | 0.68 | | | | 2.10 | | | | 2.11 | |
| | | | | | | | | | | | | | | | | | | | | |
| Less Distributions: | | | | | | | | | | | | | | | | | | | | |
| Dividends from net investment income | | | (0.38 | ) | | | (0.42 | ) | | | (0.37 | ) | | | (0.20 | ) | | | (0.53 | ) |
| Dividends from net realized gains | | | — | | | | — | | | | — | | | | — | | | | — | |
| Total distributions | | | (0.38 | ) | | | (0.42 | ) | | | (0.37 | ) | | | (0.20 | ) | | | (0.53 | ) |
| Net asset value, end of year | | $ | 16.90 | | | $ | 14.02 | | | $ | 12.84 | | | $ | 12.53 | | | $ | 10.63 | |
| | | | | | | | | | | | | | | | | | | | | |
| TOTAL RETURN | | | 23.84 | % | | | 12.79 | % | | | 5.58 | % | | | 19.98 | % | | | 25.51 | % |
| | | | | | | | | | | | | | | | | | | | | |
| SUPPLEMENTAL DATA AND RATIOS: | | | | | | | | | | | | | | | | | | | | |
| Net assets, end of year (millions) | | $ | 138.94 | | | $ | 124.99 | | | $ | 116.41 | | | $ | 155.87 | | | $ | 145.91 | |
| Ratio of expenses to average net assets | | | 1.22 | % | | | 1.26 | % | | | 1.31 | % | | | 1.29 | % | | | 1.27 | % |
| Ratio of net investment income to average net assets | | | 2.60 | % | | | 2.67 | % | | | 2.94 | % | | | 2.33 | % | | | 3.19 | % |
Portfolio turnover rate(1) | | | 41 | % | | | 47 | % | | | 40 | % | | | 91 | % | | | 59 | % |
(1) Portfolio turnover is calculated on the basis of the Fund as a whole.
The accompanying notes are an integral part of these financial statements.
Financial Highlights
| Hennessy Cornerstone Value Fund |
For an Institutional Class share outstanding throughout each year
| | | Year Ended October 31, | |
| | | 2013 | | | 2012 | | | 2011 | | | 2010 | | | 2009 | |
| PER SHARE DATA: | | | | | | | | | | | | | | | |
| Net asset value, beginning of year | | $ | 14.04 | | | $ | 12.86 | | | $ | 12.54 | | | $ | 10.63 | | | $ | 9.06 | |
| | | | | | | | | | | | | | | | | | | | | |
| Income from investment operations: | | | | | | | | | | | | | | | | | | | | |
| Net investment income | | | 0.50 | | | | 0.45 | | | | 0.36 | | | | 0.30 | | | | 0.30 | |
| Net realized and unrealized gains (losses) on investments | | | 2.80 | | | | 1.19 | | | | 0.37 | | | | 1.83 | | | | 1.83 | |
| Total from investment operations | | | 3.30 | | | | 1.64 | | | | 0.73 | | | | 2.13 | | | | 2.13 | |
| | | | | | | | | | | | | | | | | | | | | |
| Less Distributions: | | | | | | | | | | | | | | | | | | | | |
| Dividends from net investment income | | | (0.42 | ) | | | (0.46 | ) | | | (0.41 | ) | | | (0.22 | ) | | | (0.56 | ) |
| Dividends from net realized gains | | | — | | | | — | | | | — | | | | — | | | | — | |
| Total distributions | | | (0.42 | ) | | | (0.46 | ) | | | (0.41 | ) | | | (0.22 | ) | | | (0.56 | ) |
| Net asset value, end of year | | $ | 16.92 | | | $ | 14.04 | | | $ | 12.86 | | | $ | 12.54 | | | $ | 10.63 | |
| | | | | | | | | | | | | | | | | | | | | |
| TOTAL RETURN | | | 24.13 | % | | | 13.13 | % | | | 6.00 | % | | | 20.31 | % | | | 25.87 | % |
| | | | | | | | | | | | | | | | | | | | | |
| SUPPLEMENTAL DATA AND RATIOS: | | | | | | | | | | | | | | | | | | | | |
| Net assets, end of year (millions) | | $ | 4.09 | | | $ | 2.53 | | | $ | 1.17 | | | $ | 1.35 | | | $ | 1.11 | |
| Ratio of expenses to average net assets | | | | | | | | | | | | | | | | | | | | |
| Before expense reimbursement | | | 1.10 | % | | | 1.20 | % | | | 1.14 | % | | | 1.10 | % | | | 1.13 | % |
| After expense reimbursement | | | 0.98 | % | | | 0.98 | % | | | 0.98 | % | | | 0.98 | % | | | 0.98 | % |
| Ratio of net investment income to average net assets | | | | | | | | | | | | | | | | | | | | |
| Before expense reimbursement | | | 2.64 | % | | | 2.72 | % | | | 3.04 | % | | | 2.52 | % | | | 3.33 | % |
| After expense reimbursement | | | 2.76 | % | | | 2.94 | % | | | 3.20 | % | | | 2.64 | % | | | 3.48 | % |
Portfolio turnover rate(1) | | | 41 | % | | | 47 | % | | | 40 | % | | | 91 | % | | | 59 | % |
(1) Portfolio turnover is calculated on the basis of the Fund as a whole.
The accompanying notes are an integral part of these financial statements.
HENNESSY FUNDS 1-800-966-4354
Financial Highlights
| Hennessy Large Value Fund |
For an Investor Class share outstanding throughout each year
| | | | | | | | | | | | | | | | | | One Month | |
| | | | | | | | | | | | | | | Ended | | | Year Ended | |
| | | Year Ended October 31, | | | October 31, | | | September 30, | |
| | | 2013 | | | 2012 | | | 2011 | | | 2010 | | | 2009(1) | | | 2009(2) | |
| PER SHARE DATA: | | | | | | | | | | | | | | | | | | |
| Net asset value, beginning of year | | $ | 24.71 | | | $ | 21.47 | | | $ | 20.57 | | | $ | 18.88 | | | $ | 19.49 | | | $ | 21.80 | |
| | | | | | | | | | | | | | | | | | | | | | | | | |
| Income from investment operations: | | | | | | | | | | | | | | | | | | | | | | | | |
| Net investment income (loss) | | | 0.28 | | | | 0.28 | | | | 0.22 | | | | 0.14 | | | | 0.01 | | | | 0.31 | |
| Net realized and unrealized gains (losses) on securities | | | 6.00 | | | | 3.14 | | | | 0.89 | | | | 1.78 | | | | (0.62 | ) | | | (2.21 | ) |
| Total from investment operations | | | 6.28 | | | | 3.42 | | | | 1.11 | | | | 1.92 | | | | (0.61 | ) | | | (1.90 | ) |
| | | | | | | | | | | | | | | | | | | | | | | | | |
| Less Distributions: | | | | | | | | | | | | | | | | | | | | | | | | |
| Dividends from net investment income | | | (0.29 | ) | | | (0.18 | ) | | | (0.21 | ) | | | (0.23 | ) | | | — | | | | (0.41 | ) |
| Dividends from net realized gains | | | — | | | | — | | | | — | | | | — | | | | — | | | | — | |
| Total distributions | | | (0.29 | ) | | | (0.18 | ) | | | (0.21 | ) | | | (0.23 | ) | | | — | | | | (0.41 | ) |
| Net asset value, end of year | | $ | 30.70 | | | $ | 24.71 | | | $ | 21.47 | | | $ | 20.57 | | | $ | 18.88 | | | $ | 19.49 | |
| | | | | | | | | | | | | | | | | | | | | | | | | |
| TOTAL RETURN | | | 25.64 | % | | | 16.07 | % | | | 5.36 | % | | | 10.22 | % | | | (3.13 | )%(3) | | | (8.43 | )% |
| | | | | | | | | | | | | | | | | | | | | | | | | |
| SUPPLEMENTAL DATA AND RATIOS: | | | | | | | | | | | | | | | | | | | | | | | | |
| Net assets, end of year (millions) | | $ | 143.48 | | | $ | 125.00 | | | $ | 123.97 | | | $ | 131.54 | | | $ | 132.77 | | | $ | 138.34 | |
| Ratio of expenses to average net assets | | | | | | | | | | | | | | | | | | | | | | | | |
| Before expense reimbursement | | | 1.33 | % | | | 1.40 | % | | | 1.38 | % | | | 1.41 | % | | | 1.37 | %(5) | | | 1.42 | % |
| After expense reimbursement | | | 1.33 | % | | | 1.40 | % | | | 1.38 | % | | | 1.38 | % | | | 1.30 | %(5) | | | 1.17 | % |
| Ratio of net investment income to average net assets | | | | | | | | | | | | | | | | | | | | | | | | |
| Before expense reimbursement | | | 0.98 | % | | | 1.16 | % | | | 0.97 | % | | | 0.64 | % | | | 0.28 | %(5) | | | 1.46 | % |
| After expense reimbursement | | | 0.98 | % | | | 1.16 | % | | | 0.97 | % | | | 0.67 | % | | | 0.35 | %(5) | | | 1.71 | % |
Portfolio turnover rate(4) | | | 91 | % | | | 111 | % | | | 149 | % | | | 146 | % | | | 10 | %(4) | | | 142 | % |
| (1) | For the one month ended October 31, 2009. Effective October 31, 2009, the Fund changed its fiscal year end to October 31 from September 30. |
| (2) | The financial highlights set forth for periods prior to March 20, 2009 represent the historical financial highlights of the Tamarack Value Fund, Class S shares. The assets of the Tamarack Value Fund were acquired by the Hennessy Large Value Fund (formerly known as Hennessy Select Large Value Fund) on March 20, 2009. Prior to the reorganization, Tamarack Value Fund also offered Class A, Class C and R shares. At that time, RBC Global Asset Management (U.S.), Inc., (formerly known as Voyageur Asset Management Inc.) ceased to be investment advisor and Hennessy Advisors, Inc. became investment advisor. The return of the Tamarack Value Fund, Class S shares during the period October 1, 2008 through March 20, 2009 was (33.09)%. The return of the Hennessy Select Large Value Fund, Original Class shares during the period March 20, 2009 through September 30, 2009 was 36.84%. |
| (3) | Not annualized. |
| (4) | Portfolio turnover is calculated on the basis of the Fund as a whole. |
| (5) | Annualized. |
The accompanying notes are an integral part of these financial statements.
Financial Highlights
| Hennessy Large Value Fund |
For an Institutional Class share outstanding throughout each year
| | | | | | | | | | | | | | | One Month | | | | |
| | | | | | | | | | | | | | | Ended | | | Period Ended | |
| | | Year Ended October 31, | | | October 31, | | | September 30, | |
| | | 2013 | | | 2012 | | | 2011 | | | 2010 | | | 2009(1) | | | 2009(2) | |
| PER SHARE DATA: | | | | | | | | | | | | | | | | | | |
| Net asset value, beginning of year | | $ | 24.83 | | | $ | 21.56 | | | $ | 20.65 | | | $ | 18.92 | | | $ | 19.53 | | | $ | 14.25 | |
| | | | | | | | | | | | | | | | | | | | | | | | | |
| Income from investment operations: | | | | | | | | | | | | | | | | | | | | | | | | |
| Net investment income (loss) | | | 0.49 | | | | 0.39 | | | | 0.27 | | | | 0.21 | | | | — | (3) | | | 0.08 | |
| Net realized and unrealized gains (losses) on securities | | | 5.90 | | | | 3.15 | | | | 0.92 | | | | 1.80 | | | | (0.61 | ) | | | 5.20 | |
| Total from investment operations | | | 6.39 | | | | 3.54 | | | | 1.19 | | | | 2.01 | | | | (0.61 | ) | | | 5.28 | |
| | | | | | | | | | | | | | | | | | | | | | | | | |
| Less Distributions: | | | | | | | | | | | | | | | | | | | | | | | | |
| Dividends from net investment income | | | (0.39 | ) | | | (0.27 | ) | | | (0.28 | ) | | | (0.28 | ) | | | — | | | | — | |
| Dividends from net realized gains | | | — | | | | — | | | | — | | | | — | | | | — | | | | — | |
| Total distributions | | | (0.39 | ) | | | (0.27 | ) | | | (0.28 | ) | | | (0.28 | ) | | | — | | | | — | |
| Net asset value, end of year | | $ | 30.83 | | | $ | 24.83 | | | $ | 21.56 | | | $ | 20.65 | | | $ | 18.92 | | | $ | 19.53 | |
| | | | | | | | | | | | | | | | | | | | | | | | | |
| TOTAL RETURN | | | 26.08 | % | | | 16.58 | % | | | 5.76 | % | | | 10.65 | % | | | (3.12 | )%(4) | | | 37.05 | %(4) |
| | | | | | | | | | | | | | | | | | | | | | | | | |
| SUPPLEMENTAL DATA AND RATIOS: | | | | | | | | | | | | | | | | | | | | | | | | |
| Net assets, end of year (millions) | | $ | 0.34 | | | $ | 0.06 | | | $ | 0.04 | | | $ | 0.04 | | | $ | 0.03 | | | $ | 0.03 | |
| Ratio of expenses to average net assets | | | | | | | | | | | | | | | | | | | | | | | | |
| Before expense reimbursement | | | 1.14 | % | | | 1.22 | % | | | 1.21 | % | | | 1.22 | % | | | 1.20 | %(5) | | | 26.18 | %(5) |
| After expense reimbursement | | | 0.98 | % | | | 0.98 | % | | | 0.98 | % | | | 0.98 | % | | | 0.98 | %(5) | | | 0.98 | %(5) |
| Ratio of net investment income to average net assets | | | | | | | | | | | | | | | | | | | | | | | | |
| Before expense reimbursement | | | 1.07 | % | | | 1.29 | % | | | 1.13 | % | | | 0.80 | % | | | 0.44 | %(5) | | | (24.06 | )%(5) |
| After expense reimbursement | | | 1.23 | % | | | 1.53 | % | | | 1.36 | % | | | 1.04 | % | | | 0.66 | %(5) | | | 1.14 | %(5) |
Portfolio turnover rate(6) | | | 91 | % | | | 111 | % | | | 149 | % | | | 146 | % | | | 10 | %(4) | | | 142 | %(4) |
| (1) | For the one month ended October 31, 2009. Effective October 31, 2009, the Fund changed its fiscal year end to October 31 from September 30. |
| (2) | Institutional Class shares commenced operations on March 20, 2009. |
| (3) | Amount is less than $0.01 or $(0.01). |
| (4) | Not annualized. |
| (5) | Annualized. |
| (6) | Portfolio turnover is calculated on the basis of the Fund as a whole. |
The accompanying notes are an integral part of these financial statements.
HENNESSY FUNDS 1-800-966-4354
Financial Highlights
| Hennessy Total Return Fund |
For an Investor Class share outstanding throughout each year
| | | Year Ended October 31, | |
| | | 2013 | | | 2012 | | | 2011 | | | 2010 | | | 2009 | |
| PER SHARE DATA: | | | | | | | | | | | | | | | |
| Net asset value, beginning of year | | $ | 12.64 | | | $ | 11.47 | | | $ | 10.57 | | | $ | 9.10 | | | $ | 9.22 | |
| | | | | | | | | | | | | | | | | | | | | |
| Income from investment operations: | | | | | | | | | | | | | | | | | | | | |
| Net investment income | | | 0.16 | | | | 0.18 | | | | 0.18 | | | | 0.16 | | | | 0.18 | |
| Net realized and unrealized gains (losses) on securities | | | 1.66 | | | | 1.17 | | | | 0.89 | | | | 1.48 | | | | (0.14 | ) |
| Total from investment operations | | | 1.82 | | | | 1.35 | | | | 1.07 | | | | 1.64 | | | | 0.04 | |
| | | | | | | | | | | | | | | | | | | | | |
| Less Distributions: | | | | | | | | | | | | | | | | | | | | |
| Dividends from net investment income | | | (0.16 | ) | | | (0.18 | ) | | | (0.17 | ) | | | (0.17 | ) | | | (0.16 | ) |
| Dividends from realized capital gains | | | — | | | | — | | | | — | | | | — | | | | — | |
| Total distributions | | | (0.16 | ) | | | (0.18 | ) | | | (0.17 | ) | | | (0.17 | ) | | | (0.16 | ) |
| Net asset value, end of year | | $ | 14.30 | | | $ | 12.64 | | | $ | 11.47 | | | $ | 10.57 | | | $ | 9.10 | |
| | | | | | | | | | | | | | | | | | | | | |
| TOTAL RETURN | | | 14.49 | % | | | 11.78 | % | | | 10.22 | % | | | 18.09 | % | | | 0.69 | % |
| | | | | | | | | | | | | | | | | | | | | |
| SUPPLEMENTAL DATA AND RATIOS: | | | | | | | | | | | | | | | | | | | | |
| Net assets, end of year (millions) | | $ | 90.24 | | | $ | 77.67 | | | $ | 64.13 | | | $ | 69.08 | | | $ | 52.38 | |
| Gross ratio of expenses, including interest expense, to average net assets | | | 1.37 | % | | | 1.37 | % | | | 1.34 | % | | | 1.33 | % | | | 1.56 | % |
| Ratio of interest expense to average net assets | | | 0.10 | % | | | 0.08 | % | | | 0.10 | % | | | 0.08 | % | | | 0.29 | % |
| Net ratio of expenses, excluding interest expense, to average net assets | | | 1.27 | % | | | 1.29 | % | | | 1.24 | % | | | 1.25 | % | | | 1.27 | % |
| Ratio of net investment income to average net assets | | | 1.16 | % | | | 1.44 | % | | | 1.56 | % | | | 1.62 | % | | | 2.12 | % |
| Portfolio turnover rate | | | 31 | % | | | 22 | % | | | 21 | % | | | 41 | % | | | 41 | % |
The accompanying notes are an integral part of these financial statements.
(This Page Intentionally Left Blank.)
HENNESSY FUNDS 1-800-966-4354
Financial Highlights
| Hennessy Equity and Income Fund |
For an Investor Class share outstanding throughout each year
| | | | | | | | | | | | For the | | | | | | | |
| | | | | | | | | | | | Period | | | | | | | |
| | | | | | | | | | | | April 1, | | | | | | | |
| | | | | | | | | | | | 2010 to | | | | | | | |
| | | Year Ended October 31, | | | October 31, | | | Year Ended March 31, | |
| | | 2013 | | | 2012 | | | 2011 | | | 2010(1) | | | 2010 | | | 2009 | |
| PER SHARE DATA: | | | | | | | | | | | | | | | | | | |
| Net asset value, beginning of year | | $ | 13.96 | | | $ | 12.99 | | | $ | 11.93 | | | $ | 11.52 | | | $ | 8.92 | | | $ | 12.27 | |
| | | | | | | | | | | | | | | | | | | | | | | | | |
| Income from investment operations: | | | | | | | | | | | | | | | | | | | | | | | | |
| Net investment income | | | 0.23 | | | | 0.18 | | | | 0.29 | (2) | | | 0.17 | (2) | | | 0.29 | (2) | | | 0.32 | (2) |
| Net realized and unrealized gains (losses) on securities | | | 1.81 | | | | 0.99 | | | | 1.04 | | | | 0.40 | | | | 2.61 | | | | (3.23 | ) |
| Total from investment operations | | | 2.04 | | | | 1.17 | | | | 1.33 | | | | 0.57 | | | | 2.90 | | | | (2.91 | ) |
| | | | | | | | | | | | | | | | | | | | | | | | | |
| Less Distributions: | | | | | | | | | | | | | | | | | | | | | | | | |
| Dividends from net investment income | | | (0.23 | ) | | | (0.20 | ) | | | (0.27 | ) | | | (0.16 | ) | | | (0.30 | ) | | | (0.25 | ) |
| Dividends from realized capital gains | | | — | | | | 0.00 | | | | — | | | | — | | | | — | | | | (0.17 | ) |
| Return of capital | | | — | | | | — | | | | — | | | | — | | | | — | | | | (0.03 | ) |
| Total distributions | | | (0.23 | ) | | | (0.20 | ) | | | (0.27 | ) | | | (0.16 | ) | | | (0.30 | ) | | | (0.45 | ) |
| Paid-in capital from redemption fees | | | 0.00 | (3) | | | 0.00 | (3) | | | 0.00 | (3) | | | 0.00 | (3) | | | 0.00 | (3) | | | 0.01 | |
| Net asset value, end of year | | $ | 15.77 | | | $ | 13.96 | | | $ | 12.99 | | | $ | 11.93 | | | $ | 11.52 | | | $ | 8.92 | |
| | | | | | | | | | | | | | | | | | | | | | | | | |
| TOTAL RETURN | | | 14.72 | % | | | 9.01 | % | | | 11.30 | % | | | 5.04 | %(4) | | | 32.76 | % | | | (24.28 | )% |
| | | | | | | | | | | | | | | | | | | | | | | | | |
| SUPPLEMENTAL DATA AND RATIOS: | | | | | | | | | | | | | | | | | | | | | | | | |
| Net assets, end of year (millions) | | $ | 233.25 | | | $ | 196.92 | | | $ | 56.75 | | | $ | 41.50 | | | $ | 46.81 | | | $ | 18.86 | |
| Ratio of expenses to average net assets | | | | | | | | | | | | | | | | | | | | | | | | |
| Before expense reimbursement | | | 1.36 | % | | | 1.33 | % | | | 1.54 | % | | | 1.60 | %(5) | | | 1.69 | % | | | 1.84 | % |
| After expense reimbursement | | | 1.33 | % | | | 1.24 | % | | | 1.24 | % | | | 1.24 | %(5) | | | 1.25 | % | | | 1.32 | % |
| Ratio of net investment income to average net assets | | | | | | | | | | | | | | | | | | | | | | | | |
| Before expense reimbursement | | | 1.51 | % | | | 1.37 | % | | | 2.03 | % | | | 2.21 | %(5) | | | 2.26 | % | | | 2.50 | % |
| After expense reimbursement | | | 1.54 | % | | | 1.46 | % | | | 2.33 | % | | | 2.56 | %(5) | | | 2.70 | % | | | 3.03 | % |
Portfolio turnover rate(6) | | | 52 | % | | | 34 | % | | | 35 | % | | | 27 | %(4) | | | 26 | % | | | 32 | % |
| (1) | For the seven-month period ended October 31, 2010. Effective October 31, 2010, the Fund changed its fiscal year end from March 31 to October 31. |
| (2) | Calculated based on average shares outstanding method. |
| (3) | Amount is less than $0.01. |
| (4) | Not annualized. |
| (5) | Annualized. |
| (6) | Portfolio turnover is calculated on the basis of the Fund as a whole. |
The accompanying notes are an integral part of these financial statements.
Financial Highlights
| Hennessy Equity and Income Fund |
For an Institutional Class share outstanding throughout each year
| | | | | | | | | | | | For the | | | | | | | |
| | | | | | | | | | | | Period | | | | | | | |
| | | | | | | | | | | | April 1, | | | | | | | |
| | | | | | | | | | | | 2010 to | | | | | | | |
| | | Year Ended October 31, | | | October 31, | | | Year Ended March 31, | |
| | | 2013 | | | 2012 | | | 2011 | | | 2010(1) | | | 2010 | | | 2009 | |
| PER SHARE DATA: | | | | | | | | | | | | | | | | | | |
| Net asset value, beginning of year | | $ | 13.29 | | | $ | 12.38 | | | $ | 11.38 | | | $ | 10.99 | | | $ | 8.52 | | | $ | 11.75 | |
| | | | | | | | | | | | | | | | | | | | | | | | | |
| Income from investment operations: | | | | | | | | | | | | | | | | | | | | | | | | |
| Net investment income (loss) | | | 0.25 | | | | 0.22 | | | | 0.32 | (2) | | | 0.18 | (2) | | | 0.30 | (2) | | | 0.33 | (2) |
| Net realized and unrealized gains (losses) on investments | | | 1.72 | | | | 0.92 | | | | 0.99 | | | | 0.38 | | | | 2.50 | | | | (3.10 | ) |
| Total from investment operations | | | 1.97 | | | | 1.14 | | | | 1.31 | | | | 0.56 | | | | 2.80 | | | | (2.77 | ) |
| | | | | | | | | | | | | | | | | | | | | | | | | |
| Less Distributions: | | | | | | | | | | | | | | | | | | | | | | | | |
| Dividends from net investment income | | | (0.29 | ) | | | (0.23 | ) | | | (0.31 | ) | | | (0.17 | ) | | | (0.33 | ) | | | (0.26 | ) |
| Dividends from net realized gains | | | — | | | | — | | | | — | | | | — | | | | — | | | | (0.17 | ) |
| Return of Capital | | | — | | | | — | | | | — | | | | — | | | | — | | | | (0.04 | ) |
| Total distributions | | | (0.29 | ) | | | (0.23 | ) | | | (0.31 | ) | | | (0.17 | ) | | | (0.33 | ) | | | (0.47 | ) |
| Paid-in capital from redemption fees | | | 0.00 | (3) | | | — | (3) | | | — | (3) | | | 0.00 | (3) | | | 0.00 | (3) | | | 0.01 | |
| Net asset value, end of year | | $ | 14.97 | | | $ | 13.29 | | | $ | 12.38 | | | $ | 11.38 | | | $ | 10.99 | | | $ | 8.52 | |
| | | | | | | | | | | | | | | | | | | | | | | | | |
| TOTAL RETURN | | | 14.99 | % | | | 9.23 | % | | | 11.62 | % | | | 5.19 | %(4) | | | 33.10 | % | | | (24.13 | )% |
| | | | | | | | | | | | | | | | | | | | | | | | | |
| SUPPLEMENTAL DATA AND RATIOS: | | | | | | | | | | | | | | | | | | | | | | | | |
| Net assets, end of year (millions) | | $ | 85.12 | | | $ | 108.49 | | | $ | 55.28 | | | $ | 42.17 | | | $ | 39.40 | | | $ | 31.13 | |
| Ratio of expenses to average net assets | | | | | | | | | | | | | | | | | | | | | | | | |
| Before expense reimbursement | | | 1.06 | % | | | 1.06 | % | | | 1.12 | % | | | 1.20 | %(5) | | | 1.43 | % | | | 1.58 | % |
| After expense reimbursement | | | 1.06 | % | | | 0.99 | % | | | 0.99 | % | | | 0.99 | %(5) | | | 0.99 | % | | | 1.07 | % |
| Ratio of net investment income to average net assets | | | | | | | | | | | | | | | | | | | | | | | | |
| Before expense reimbursement | | | 1.95 | % | | | 1.68 | % | | | 2.56 | % | | | 2.60 | %(5) | | | 2.57 | % | | | 2.73 | % |
| After expense reimbursement | | | 1.95 | % | | | 1.75 | % | | | 2.69 | % | | | 2.82 | %(5) | | | 3.01 | % | | | 3.24 | % |
Portfolio turnover rate(6) | | | 52 | % | | | 34 | % | | | 35 | % | | | 27 | %(4) | | | 26 | % | | | 32 | % |
| (1) | For the seven-month period ended October 31, 2010. Effective October 31, 2010, the Fund changed its fiscal year end from March 31 to October 31. |
| (2) | Calculated based on average shares outstanding method. |
| (3) | Amount is less than $0.01. |
| (4) | Not annualized. |
| (5) | Annualized. |
| (6) | Portfolio turnover is calculated on the basis of the Fund as a whole. |
The accompanying notes are an integral part of these financial statements.
HENNESSY FUNDS 1-800-966-4354
Financial Highlights
For an Investor Class share outstanding throughout each year
| | | Year Ended October 31, | |
| | | 2013 | | | 2012 | | | 2011 | | | 2010 | | | 2009 | |
| PER SHARE DATA: | | | | | | | | | | | | | | | |
| Net asset value, beginning of year | | $ | 11.88 | | | $ | 11.13 | | | $ | 10.43 | | | $ | 9.48 | | | $ | 9.11 | |
| | | | | | | | | | | | | | | | | | | | | |
| Income from investment operations: | | | | | | | | | | | | | | | | | | | | |
| Net investment income | | | 0.02 | | | | 0.04 | | | | 0.05 | | | | 0.05 | | | | 0.10 | |
| Net realized and unrealized gains (losses) on securities | | | 1.02 | | | | 0.75 | | | | 0.70 | | | | 0.95 | | | | 0.38 | |
| Total from investment operations | | | 1.04 | | | | 0.79 | | | | 0.75 | | | | 1.00 | | | | 0.48 | |
| | | | | | | | | | | | | | | | | | | | | |
| Less Distributions: | | | | | | | | | | | | | | | | | | | | |
| Dividends from net investment income | | | (0.02 | ) | | | (0.04 | ) | | | (0.05 | ) | | | (0.05 | ) | | | (0.11 | ) |
| Dividends from realized capital gains | | | — | | | | — | | | | — | | | | — | | | | — | |
| Total distributions | | | (0.02 | ) | | | (0.04 | ) | | | (0.05 | ) | | | (0.05 | ) | | | (0.11 | ) |
| Net asset value, end of year | | $ | 12.90 | | | $ | 11.88 | | | $ | 11.13 | | | $ | 10.43 | | | $ | 9.48 | |
| | | | | | | | | | | | | | | | | | | | | |
| TOTAL RETURN | | | 8.77 | % | | | 7.13 | % | | | 7.16 | % | | | 10.53 | % | | | 5.46 | % |
| | | | | | | | | | | | | | | | | | | | | |
| SUPPLEMENTAL DATA AND RATIOS: | | | | | | | | | | | | | | | | | | | | |
| Net assets, end of year (millions) | | $ | 12.21 | | | $ | 25.17 | | | $ | 18.02 | | | $ | 12.50 | | | $ | 11.47 | |
| Ratio of net expenses to average net assets | | | 1.75 | % | | | 1.54 | % | | | 1.61 | % | | | 1.65 | % | | | 1.73 | % |
| Ratio of net investment income to average net assets | | | 0.14 | % | | | 0.34 | % | | | 0.42 | % | | | 0.45 | % | | | 1.17 | % |
| Portfolio turnover rate | | | 22 | % | | | 17 | % | | | 39 | % | | | 57 | % | | | 46 | % |
The accompanying notes are an integral part of these financial statements.
(This Page Intentionally Left Blank.)
HENNESSY FUNDS 1-800-966-4354
Financial Highlights
For an Investor Class share outstanding throughout each year
| | | | | | | | | | | | For the | | | | | | | |
| | | | | | | | | | | | Period April 1, | | | | | | | |
| | | | | | | | | | | | 2010 to | | | | | | | |
| | | Year Ended October 31, | | | October 31, | | | Year Ended March 31, | |
| | | 2013 | | | 2012 | | | 2011 | | | 2010(1) | | | 2010 | | | 2009 | |
| PER SHARE DATA: | | | | | | | | | | | | | | | | | | |
| Net asset value, beginning of year | | $ | 9.97 | | | $ | 9.56 | | | $ | 9.82 | | | $ | 9.39 | | | $ | 8.75 | | | $ | 9.16 | |
| | | | | | | | | | | | | | | | | | | | | | | | | |
| Income from investment operations: | | | | | | | | | | | | | | | | | | | | | | | | |
| Net investment income (loss) | | | 0.27 | | | | 0.28 | | | | 0.35 | (2) | | | 0.23 | (2) | | | 0.38 | (2) | | | 0.35 | (2) |
| Net realized and unrealized gains (losses) on investments | | | (0.23 | ) | | | 0.41 | | | | (0.14 | ) | | | 0.42 | | | | 0.69 | | | | (0.44 | ) |
| Total from investment operations | | | 0.04 | | | | 0.69 | | | | 0.21 | | | | 0.65 | | | | 1.07 | | | | (0.09 | ) |
| | | | | | | | | | | | | | | | | | | | | | | | | |
| Less Distributions: | | | | | | | | | | | | | | | | | | | | | | | | |
| Dividends from net investment income | | | (0.27 | ) | | | (0.20 | ) | | | (0.32 | ) | | | (0.22 | ) | | | (0.38 | ) | | | (0.32 | ) |
| Dividends from net realized gains | | | (0.18 | ) | | | (0.08 | ) | | | (0.15 | ) | | | — | | | | (0.05 | ) | | | — | |
| Total distributions | | | (0.45 | ) | | | (0.28 | ) | | | (0.47 | ) | | | (0.22 | ) | | | (0.43 | ) | | | (0.32 | ) |
| Paid-in capital from redemption fees | | | — | | | | 0.00 | (3) | | | 0.00 | (3) | | | 0.00 | (3) | | | 0.00 | (3) | | | 0.00 | (3) |
| Net asset value, end of year | | $ | 9.56 | | | $ | 9.97 | | | $ | 9.56 | | | $ | 9.82 | | | $ | 9.39 | | | $ | 8.75 | |
| | | | | | | | | | | | | | | | | | | | | | | | | |
| TOTAL RETURN | | | 0.41 | % | | | 7.38 | % | | | 2.35 | % | | | 6.98 | %(4) | | | 12.33 | % | | | (0.93 | )% |
| | | | | | | | | | | | | | | | | | | | | | | | | |
| SUPPLEMENTAL DATA AND RATIOS: | | | | | | | | | | | | | | | | | | | | | | | | |
| Net assets, end of year (millions) | | $ | 3.02 | | | $ | 3.57 | | | $ | 4.05 | | | $ | 4.45 | | | $ | 4.62 | | | $ | 2.06 | |
| Ratio of expenses to average net assets | | | | | | | | | | | | | | | | | | | | | | | | |
| Before expense reimbursement | | | 2.26 | % | | | 2.12 | % | | | 2.38 | % | | | 2.10 | %(5) | | | 1.93 | % | | | 2.14 | % |
| After expense reimbursement | | | 1.30 | % | | | 1.30 | % | | | 1.30 | % | | | 1.30 | %(5) | | | 1.31 | % | | | 1.33 | % |
| Ratio of net investment income to average net assets | | | | | | | | | | | | | | | | | | | | | | | | |
| Before expense reimbursement | | | 1.70 | % | | | 2.01 | % | | | 2.58 | % | | | 3.37 | %(5) | | | 3.49 | % | | | 3.21 | % |
| After expense reimbursement | | | 2.66 | % | | | 2.83 | % | | | 3.66 | % | | | 4.17 | %(5) | | | 4.11 | % | | | 4.02 | % |
Portfolio turnover rate(6) | | | 74 | % | | | 75 | % | | | 57 | % | | | 46 | %(4) | | | 28 | % | | | 39 | % |
| (1) | For the seven-month period ended October 31, 2010. Effective October 31, 2010, the Fund changed its fiscal year end from March 31 to October 31. |
| (2) | Calculated based on average shares outstanding method. |
| (3) | Amount is less than $0.01. |
| (4) | Not annualized. |
| (5) | Annualized. |
| (6) | Portfolio turnover is calculated on the basis of the Fund as a whole. |
The accompanying notes are an integral part of these financial statements.
Financial Highlights
For an Institutional Class share outstanding throughout each year
| | | | | | | | | | | | For the | | | | | | | |
| | | | | | | | | | | | Period | | | | | | | |
| | | | | | | | | | | | April 1, | | | | | | | |
| | | | | | | | | | | | 2010 to | | | | | | | |
| | | Year Ended October 31, | | | October 31, | | | Year Ended March 31, | |
| | | 2013 | | | 2012 | | | 2011 | | | 2010(1) | | | 2010 | | | 2009 | |
| PER SHARE DATA: | | | | | | | | | | | | | | | | | | |
| Net asset value, beginning of year | | $ | 9.06 | | | $ | 8.77 | | | $ | 9.05 | | | $ | 8.67 | | | $ | 8.11 | | | $ | 8.52 | |
| | | | | | | | | | | | | | | | | | | | | | | | | |
| Income from investment operations: | | | | | | | | | | | | | | | | | | | | | | | | |
| Net investment income (loss) | | | 0.19 | | | | 0.27 | | | | 0.34 | (2) | | | 0.23 | (2) | | | 0.37 | (2) | | | 0.35 | (2) |
| Net realized and unrealized gains (losses) on investments | | | (0.13 | ) | | | 0.38 | | | | (0.12 | ) | | | 0.38 | | | | 0.64 | | | | (0.42 | ) |
| Total from investment operations | | | 0.06 | | | | 0.65 | | | | 0.22 | | | | 0.61 | | | | 1.01 | | | | (0.07 | ) |
| | | | | | | | | | | | | | | | | | | | | | | | | |
| Less Distributions: | | | | | | | | | | | | | | | | | | | | | | | | |
| Dividends from net investment income | | | (0.29 | ) | | | (0.28 | ) | | | (0.35 | ) | | | (0.23 | ) | | | (0.40 | ) | | | (0.34 | ) |
| Dividends from net realized gains | | | (0.18 | ) | | | (0.08 | ) | | | (0.15 | ) | | | — | | | | (0.05 | ) | | | — | |
| Total distributions | | | (0.47 | ) | | | (0.36 | ) | | | (0.50 | ) | | | (0.23 | ) | | | (0.45 | ) | | | (0.34 | ) |
| Paid-in capital from redemption fees | | | 0.00 | (3) | | | 0.00 | (3) | | | 0.00 | (3) | | | 0.00 | (3) | | | 0.00 | (3) | | | 0.00 | (3) |
| Net asset value, end of year | | $ | 8.65 | | | $ | 9.06 | | | $ | 8.77 | | | $ | 9.05 | | | $ | 8.67 | | | $ | 8.11 | |
| | | | | | | | | | | | | | | | | | | | | | | | | |
| TOTAL RETURN | | | 0.69 | % | | | 7.63 | % | | | 2.62 | % | | | 7.15 | %(4) | | | 12.62 | % | | | (0.74 | )% |
| | | | | | | | | | | | | | | | | | | | | | | | | |
| SUPPLEMENTAL DATA AND RATIOS: | | | | | | | | | | | | | | | | | | | | | | | | |
| Net assets, end of year (millions) | | $ | 3.38 | | | $ | 33.34 | | | $ | 23.25 | | | $ | 24.25 | | | $ | 23.89 | | | $ | 22.05 | |
| Ratio of expenses to average net assets | | | | | | | | | | | | | | | | | | | | | | | | |
| Before expense reimbursement | | | 1.67 | % | | | 1.31 | % | | | 1.43 | % | | | 1.47 | %(5) | | | 1.69 | % | | | 1.89 | % |
| After expense reimbursement | | | 1.05 | % | | | 1.05 | % | | | 1.05 | % | | | 1.05 | %(5) | | | 1.06 | % | | | 1.08 | % |
| Ratio of net investment income to average net assets | | | | | | | | | | | | | | | | | | | | | | | | |
| Before expense reimbursement | | | 2.28 | % | | | 2.74 | % | | | 3.54 | % | | | 4.00 | %(5) | | | 3.74 | % | | | 3.46 | % |
| After expense reimbursement | | | 2.90 | % | | | 3.00 | % | | | 3.92 | % | | | 4.41 | %(5) | | | 4.37 | % | | | 4.27 | % |
Portfolio turnover rate(6) | | | 74 | % | | | 75 | % | | | 57 | % | | | 46 | %(4) | | | 28 | % | | | 39 | % |
| (1) | For the seven-month period ended October 31, 2010. Effective October 31, 2010, the Fund changed its fiscal year end from March 31 to October 31. |
| (2) | Calculated based on average shares outstanding method. |
| (3) | Amount is less than $0.01. |
| (4) | Not annualized. |
| (5) | Annualized. |
| (6) | Portfolio turnover is calculated on the basis of the Fund as a whole. |
The accompanying notes are an integral part of these financial statements.
HENNESSY FUNDS 1-800-966-4354
Financial Highlights
| Hennessy Gas Utility Index Fund |
For an Investor Class share outstanding throughout each year
| | | Year Ended October 31, | |
| | | 2013 | | | 2012 | | | 2011 | | | 2010 | | | 2009 | |
| PER SHARE DATA: | | | | | | | | | | | | | | | |
| Net asset value, beginning of year | | $ | 23.05 | | | $ | 21.21 | | | $ | 17.83 | | | $ | 15.13 | | | $ | 15.26 | |
| | | | | | | | | | | | | | | | | | | | | |
| Income from investment operations: | | | | | | | | | | | | | | | | | | | | |
| Net investment income | | | 0.62 | | | | 0.58 | | | | 0.51 | (1) | | | 0.58 | | | | 0.49 | |
| Net realized and unrealized gains (losses) on securities | | | 4.18 | | | | 1.99 | | | | 3.59 | | | | 2.72 | | | | 0.60 | |
| Total from investment operations | | | 4.80 | | | | 2.57 | | | | 4.10 | | | | 3.30 | | | | 1.09 | |
| | | | | | | | | | | | | | | | | | | | | |
| Less Distributions: | | | | | | | | | | | | | | | | | | | | |
| Dividends from net investment income | | | (0.61 | ) | | | (0.58 | ) | | | (0.51 | ) | | | (0.58 | ) | | | (0.49 | ) |
| Dividends from realized capital gains | | | (0.55 | ) | | | (0.16 | ) | | | (0.21 | ) | | | (0.02 | ) | | | (0.74 | ) |
| Total distributions | | | (1.16 | ) | | | (0.74 | ) | | | (0.72 | ) | | | (0.60 | ) | | | (1.23 | ) |
| Paid-in capital from redemption fees | | | 0.00 | (2) | | | 0.01 | | | | 0.00 | (2) | | | 0.00 | (2) | | | 0.01 | |
| Net asset value, end of year | | $ | 26.69 | | | $ | 23.05 | | | $ | 21.21 | | | $ | 17.83 | | | $ | 15.13 | |
| | | | | | | | | | | | | | | | | | | | | |
| TOTAL RETURN | | | 21.70 | % | | | 12.41 | % | | | 23.54 | % | | | 22.25 | % | | | 8.18 | % |
| | | | | | | | | | | | | | | | | | | | | |
| SUPPLEMENTAL DATA AND RATIOS: | | | | | | | | | | | | | | | | | | | | |
| Net assets, end of year (millions) | | $ | 1,182.79 | | | $ | 746.82 | | | $ | 433.78 | | | $ | 244.04 | | | $ | 193.68 | |
| Ratio of expenses to average net assets | | | | | | | | | | | | | | | | | | | | |
| Before expense reimbursement | | | 0.80 | % | | | 0.69 | % | | | 0.71 | % | | | 0.77 | % | | | 0.76 | % |
| After expense reimbursement | | | 0.80 | % | | | 0.69 | % | | | 0.71 | % | | | 0.76 | % | | | 0.76 | % |
| Ratio of net investment income to average net assets | | | | | | | | | | | | | | | | | | | | |
| Before expense reimbursement | | | 2.56 | % | | | 2.72 | % | | | 2.68 | % | | | 3.50 | % | | | 3.51 | % |
| After expense reimbursement | | | 2.56 | % | | | 2.72 | % | | | 2.68 | % | | | 3.51 | % | | | 3.51 | % |
| Portfolio turnover rate | | | 18 | % | | | 16 | % | | | 17 | % | | | 16 | % | | | 26 | % |
| (1) | Calculated based on average shares outstanding method. |
| (2) | Amount is less than $0.01. |
The accompanying notes are an integral part of these financial statements.
(This Page Intentionally Left Blank.)
HENNESSY FUNDS 1-800-966-4354
Financial Highlights
| Hennessy Small Cap Financial Fund |
For an Investor Class share outstanding throughout each year
| | | Year Ended October 31, | |
| | | 2013 | | | 2012 | | | 2011 | | | 2010 | | | 2009 | |
| PER SHARE DATA: | | | | | | | | | | | | | | | |
| Net asset value, beginning of year | | $ | 19.54 | | | $ | 16.48 | | | $ | 18.11 | | | $ | 15.91 | | | $ | 15.22 | |
| | | | | | | | | | | | | | | | | | | | | |
| Income from investment operations: | | | | | | | | | | | | | | | | | | | | |
| Net investment income (loss) | | | 0.10 | | | | 0.11 | | | | 0.21 | (1) | | | 0.08 | | | | 0.06 | |
| Net realized and unrealized gains (losses) on securities | | | 5.88 | | | | 3.24 | | | | (1.66 | ) | | | 2.17 | | | | 0.81 | |
| Total from investment operations | | | 5.98 | | | | 3.35 | | | | (1.45 | ) | | | 2.25 | | | | 0.87 | |
| | | | | | | | | | | | | | | | | | | | | |
| Less Distributions: | | | | | | | | | | | | | | | | | | | | |
| Dividends from net investment income | | | (0.12 | ) | | | (0.29 | ) | | | (0.06 | ) | | | (0.07 | ) | | | (0.19 | ) |
| Dividends from net realized gains | | | — | | | | — | | | | (0.13 | ) | | | — | | | | — | |
| Total distributions | | | (0.12 | ) | | | (0.29 | ) | | | (0.19 | ) | | | (0.07 | ) | | | (0.19 | ) |
| Paid-in capital from redemption fees | | | 0.00 | (2) | | | 0.00 | (2) | | | 0.01 | | | | 0.02 | | | | 0.01 | |
| Net asset value, end of year | | $ | 25.40 | | | $ | 19.54 | | | $ | 16.48 | | | $ | 18.11 | | | $ | 15.91 | |
| | | | | | | | | | | | | | | | | | | | | |
| TOTAL RETURN | | | 30.80 | % | | | 20.65 | % | | | (8.12 | )% | | | 14.27 | % | | | 5.89 | % |
| | | | | | | | | | | | | | | | | | | | | |
| SUPPLEMENTAL DATA AND RATIOS: | | | | | | | | | | | | | | | | | | | | |
| Net assets, end of year (millions) | | $ | 243.42 | | | $ | 167.20 | | | $ | 154.21 | | | $ | 216.75 | | | $ | 187.56 | |
| Ratio of expenses to average net assets | | | 1.46 | % | | | 1.45 | % | | | 1.52 | % | | | 1.51 | % | | | 1.51 | % |
| Ratio of net investment income to average net assets | | | 0.48 | % | | | 0.56 | % | | | 0.81 | % | | | 0.35 | % | | | 0.50 | % |
Portfolio turnover rate(3) | | | 57 | % | | | 43 | % | | | 70 | % | | | 89 | % | | | 118 | % |
| (1) | Calculated based on average shares outstanding method. |
| (2) | Amount is less than $0.01. |
| (3) | Portfolio turnover is calculated on the basis of the Fund as a whole. |
The accompanying notes are an integral part of these financial statements.
Financial Highlights
| Hennessy Small Cap Financial Fund |
For an Institutional Class share outstanding throughout each year
| | | Year Ended October 31, | |
| | | 2013 | | | 2012 | | | 2011 | | | 2010 | | | 2009 | |
| PER SHARE DATA: | | | | | | | | | | | | | | | |
| Net asset value, beginning of year | | $ | 12.34 | | | $ | 10.55 | | | $ | 11.70 | | | $ | 10.34 | | | $ | 9.96 | |
| | | | | | | | | | | | | | | | | | | | | |
| Income from investment operations: | | | | | | | | | | | | | | | | | | | | |
| Net investment income | | | 0.14 | | | | 0.16 | | | | 0.19 | (1) | | | 0.09 | | | | 0.19 | |
| Net realized and unrealized gains (losses) on securities | | | 3.66 | | | | 1.98 | | | | (1.09 | ) | | | 1.40 | | | | 0.40 | |
| Total from investment operations | | | 3.80 | | | | 2.14 | | | | (0.90 | ) | | | 1.49 | | | | 0.59 | |
| | | | | | | | | | | | | | | | | | | | | |
| Less Distributions: | | | | | | | | | | | | | | | | | | | | |
| Dividends from net investment income | | | (0.18 | ) | | | (0.35 | ) | | | (0.12 | ) | | | (0.13 | ) | | | (0.21 | ) |
| Dividends from net realized gains | | | — | | | | — | | | | (0.13 | ) | | | — | | | | — | |
| Total distributions | | | (0.18 | ) | | | (0.35 | ) | | | (0.25 | ) | | | (0.13 | ) | | | (0.21 | ) |
| Paid-in capital from redemption fees | | | — | | | | 0.00 | (2) | | | — | | | | 0.00 | (2) | | | — | |
| Net asset value, end of year | | $ | 15.96 | | | $ | 12.34 | | | $ | 10.55 | | | $ | 11.70 | | | $ | 10.34 | |
| | | | | | | | | | | | | | | | | | | | | |
| TOTAL RETURN | | | 31.18 | % | | | 20.95 | % | | | (8.00 | )% | | | 14.52 | % | | | 6.14 | % |
| | | | | | | | | | | | | | | | | | | | | |
| SUPPLEMENTAL DATA AND RATIOS: | | | | | | | | | | | | | | | | | | | | |
| Net assets, end of year (millions) | | $ | 68.80 | | | $ | 43.79 | | | $ | 19.89 | | | $ | 25.01 | | | $ | 10.64 | |
| Ratio of expenses to average net assets | | | 1.15 | % | | | 1.25 | % | | | 1.34 | % | | | 1.23 | % | | | 1.56 | % |
| Ratio of net investment income to average net assets | | | 0.74 | % | | | 0.72 | % | | | 1.00 | % | | | 0.61 | % | | | 0.04 | % |
Portfolio turnover rate(3) | | | 57 | % | | | 43 | % | | | 70 | % | | | 89 | % | | | 118 | % |
| (1) | Calculated based on average shares outstanding method. |
| (2) | Amount is less than $0.01. |
| (3) | Portfolio turnover is calculated on the basis of the Fund as a whole. |
The accompanying notes are an integral part of these financial statements.
HENNESSY FUNDS 1-800-966-4354
Financial Highlights
| Hennessy Large Cap Financial Fund |
For an Investor Class share outstanding throughout each year
| | | Year Ended October 31, | |
| | | 2013 | | | 2012 | | | 2011 | | | 2010 | | | 2009 | |
| PER SHARE DATA: | | | | | | | | | | | | | | | |
| Net asset value, beginning of year | | $ | 14.16 | | | $ | 11.91 | | | $ | 12.88 | | | $ | 12.61 | | | $ | 11.14 | |
| | | | | | | | | | | | | | | | | | | | | |
| Income from investment operations: | | | | | | | | | | | | | | | | | | | | |
| Net investment income (loss) | | | (0.03 | ) | | | 0.01 | | | | (0.04 | )(1) | | | (0.08 | ) | | | 0.00 | (2) |
| Net realized and unrealized gains (losses) on investments | | | 4.89 | | | | 2.24 | | | | (0.93 | ) | | | 0.35 | | | | 1.58 | |
| Total from investment operations | | | 4.86 | | | | 2.25 | | | | (0.97 | ) | | | 0.27 | | | | 1.58 | |
| | | | | | | | | | | | | | | | | | | | | |
| Less Distributions: | | | | | | | | | | | | | | | | | | | | |
| Dividends from net investment income | | | (0.01 | ) | | | — | | | | — | | | | — | | | | (0.10 | ) |
| Distribution in excess of net investment income | | | — | | | | — | | | | — | | | | — | | | | (0.02 | ) |
| Dividends from net realized gains | | | — | | | | — | | | | — | | | | — | | | | — | |
| Total distributions | | | (0.01 | ) | | | — | | | | — | | | | — | | | | (0.12 | ) |
| Paid-in capital from redemption fees | | | 0.00 | (2) | | | 0.00 | (2) | | | 0.00 | (2) | | | 0.00 | (2) | | | 0.01 | |
| Net asset value, end of year | | $ | 19.01 | | | $ | 14.16 | | | $ | 11.91 | | | $ | 12.88 | | | $ | 12.61 | |
| | | | | | | | | | | | | | | | | | | | | |
| TOTAL RETURN | | | 34.37 | % | | | 18.89 | % | | | (7.53 | )% | | | 2.14 | % | | | 14.52 | % |
| | | | | | | | | | | | | | | | | | | | | |
| SUPPLEMENTAL DATA AND RATIOS: | | | | | | | | | | | | | | | | | | | | |
| Net assets, end of year (millions) | | $ | 88.30 | | | $ | 64.66 | | | $ | 55.68 | | | $ | 48.72 | | | $ | 37.20 | |
| Ratio of expenses to average net assets | | | | | | | | | | | | | | | | | | | | |
| Before expense reimbursement | | | 1.57 | % | | | 1.57 | % | | | 1.61 | % | | | 1.78 | % | | | 1.81 | % |
| After expense reimbursement | | | 1.57 | % | | | 1.57 | % | | | 1.61 | % | | | 1.78 | % | | | 1.81 | % |
| Ratio of net investment income/(loss) to average net assets | | | | | | | | | | | | | | | | | | | | |
| Before expense reimbursement | | | (0.22 | )% | | | 0.09 | % | | | (0.34 | )% | | | (0.73 | )% | | | (0.08 | )% |
| After expense reimbursement | | | (0.22 | )% | | | 0.09 | % | | | (0.34 | )% | | | (0.73 | )% | | | (0.08 | )% |
| Portfolio turnover rate | | | 75 | % | | | 93 | % | | | 97 | % | | | 150 | % | | | 220 | % |
| (1) | Calculated based on average shares outstanding method. |
| (2) | Amount is less than $0.01. |
The accompanying notes are an integral part of these financial statements.
(This Page Intentionally Left Blank.)
HENNESSY FUNDS 1-800-966-4354
Financial Highlights
For an Investor Class share outstanding throughout each year
| | | Year Ended October 31, | |
| | | 2013 | | | 2012 | | | 2011 | | | 2010 | | | 2009 | |
| PER SHARE DATA: | | | | | | | | | | | | | | | |
| Net asset value, beginning of year | | $ | 10.67 | | | $ | 10.86 | | | $ | 11.00 | | | $ | 9.05 | | | $ | 6.96 | |
| | | | | | | | | | | | | | | | | | | | | |
| Income from investment operations: | | | | | | | | | | | | | | | | | | | | |
| Net investment income (loss) | | | (0.20 | ) | | | (0.15 | ) | | | (0.17 | )(1) | | | (0.14 | ) | | | (0.08 | ) |
| Net realized and unrealized gains (losses) on investments | | | 3.10 | | | | (0.04 | ) | | | 0.03 | | | | 2.08 | | | | 2.16 | |
| Total from investment operations | | | 2.90 | | | | (0.19 | ) | | | (0.14 | ) | | | 1.94 | | | | 2.08 | |
| | | | | | | | | | | | | | | | | | | | | |
| Less Distributions: | | | | | | | | | | | | | | | | | | | | |
| Dividends from net investment income | | | — | | | | — | | | | — | | | | — | | | | — | |
| Dividends from net realized gains | | | — | | | | — | | | | — | | | | — | | | | — | |
| Total distributions | | | — | | | | — | | | | — | | | | — | | | | — | |
| Paid-in capital from redemption fees | | | — | | | | 0.00 | (2) | | | 0.00 | (2) | | | 0.01 | | | | 0.01 | |
| Net asset value, end of year | | $ | 13.57 | | | $ | 10.67 | | | $ | 10.86 | | | $ | 11.00 | | | $ | 9.05 | |
| | | | | | | | | | | | | | | | | | | | | |
| TOTAL RETURN | | | 27.18 | % | | | (1.75 | )% | | | (1.27 | )% | | | 21.55 | % | | | 30.03 | % |
| | | | | | | | | | | | | | | | | | | | | |
| SUPPLEMENTAL DATA AND RATIOS: | | | | | | | | | | | | | | | | | | | | |
| Net assets, end of year (millions) | | $ | 4.49 | | | $ | 4.44 | | | $ | 5.70 | | | $ | 8.21 | | | $ | 8.39 | |
| Ratio of expenses to average net assets | | | | | | | | | | | | | | | | | | | | |
| Before expense reimbursement | | | 3.04 | % | | | 3.20 | % | | | 2.79 | % | | | 2.50 | % | | | 3.00 | % |
| After expense reimbursement | | | 1.95 | % | | | 1.95 | % | | | 1.95 | % | | | 1.95 | % | | | 1.95 | % |
| Ratio of net investment income/(loss) to average net assets | | | | | | | | | | | | | | | | | | | | |
| Before expense reimbursement | | | (2.36 | )% | | | (2.39 | )% | | | (2.38 | )% | | | (1.64 | )% | | | (2.10 | )% |
| After expense reimbursement | | | (1.27 | )% | | | (1.14 | )% | | | (1.54 | )% | | | (1.10 | )% | | | (1.05 | )% |
Portfolio turnover rate(3) | | | 164 | % | | | 138 | % | | | 141 | % | | | 353 | % | | | 211 | % |
| (1) | Calculated based on average shares outstanding method. |
| (2) | Amount is less than $0.01. |
| (3) | Portfolio turnover is calculated on the basis of the Fund as a whole. |
The accompanying notes are an integral part of these financial statements.
Financial Highlights
For an Institutional Class share outstanding throughout each year
| | | | | | | | | | | | Period | |
| | | | | | | | | | | | Ended | |
| | | Year Ended October 31, | | | October 31, | |
| | | 2013 | | | 2012 | | | 2011 | | | 2010(1) | |
| PER SHARE DATA: | | | | | | | | | | | | |
| Net asset value, beginning of year | | $ | 10.73 | | | $ | 10.89 | | | $ | 11.00 | | | $ | 10.46 | |
| | | | | | | | | | | | | | | | | |
| Income from investment operations: | | | | | | | | | | | | | | | | |
| Net investment income (loss) | | | (0.12 | ) | | | (0.11 | ) | | | (0.14 | )(2) | | | (0.07 | ) |
| Net realized and unrealized gains (losses) on investments | | | 3.07 | | | | (0.05 | ) | | | 0.03 | | | | 0.61 | |
| Total from investment operations | | | 2.95 | | | | (0.16 | ) | | | (0.11 | ) | | | 0.54 | |
| Paid-in capital from redemption fees | | | — | | | | 0.00 | (3) | | | 0.00 | (3) | | | 0.00 | (3) |
| Net asset value, end of year | | $ | 13.68 | | | $ | 10.73 | | | $ | 10.89 | | | $ | 11.00 | |
| | | | | | | | | | | | | | | | | |
| TOTAL RETURN | | | 27.49 | % | | | (1.47 | )% | | | (1.00 | )% | | | 5.16 | %(4) |
| | | | | | | | | | | | | | | | | |
| SUPPLEMENTAL DATA AND RATIOS: | | | | | | | | | | | | | | | | |
| Net assets, end of year (millions) | | $ | 1.19 | | | $ | 0.93 | | | $ | 1.16 | | | $ | 4.61 | |
| Ratio of expenses to average net assets | | | | | | | | | | | | | | | | |
| Before expense reimbursement | | | 2.76 | % | | | 4.11 | % | | | 3.45 | % | | | 2.34 | %(5) |
| After expense reimbursement | | | 1.70 | % | | | 1.70 | % | | | 1.70 | % | | | 1.70 | %(5) |
| Ratio of net investment income/(loss) to average net assets | | | | | | | | | | | | | | | | |
| Before expense reimbursement | | | (2.10 | )% | | | (3.31 | )% | | | (2.99 | )% | | | (1.41 | )%(5) |
| After expense reimbursement | | | (1.04 | )% | | | (0.90 | )% | | | (1.24 | )% | | | (0.77 | )%(5) |
Portfolio turnover rate(6) | | | 164 | % | | | 138 | % | | | 141 | % | | | 353 | %(4) |
| (1) | Institutional Class shares commenced operations on March 12, 2010. |
| (2) | Calculated based on average shares outstanding method. |
| (3) | Amount is less than $0.01. |
| (4) | Not annualized. |
| (5) | Annualized. |
| (6) | Portfolio turnover is calculated on the basis of the Fund as a whole. |
The accompanying notes are an integral part of these financial statements.
HENNESSY FUNDS 1-800-966-4354
Financial Highlights
For an Investor Class share outstanding throughout each year
| | | Year Ended October 31, | |
| | | 2013 | | | 2012 | | | 2011 | | | 2010 | | | 2009(1) | |
| PER SHARE DATA: | | | | | | | | | | | | | | | |
| Net asset value, beginning of year | | $ | 15.40 | | | $ | 13.99 | | | $ | 12.58 | | | $ | 11.38 | | | $ | 9.73 | |
| | | | | | | | | | | | | | | | | | | | | |
| Income from investment operations: | | | | | | | | | | | | | | | | | | | | |
| Net investment income (loss) | | | (0.04 | ) | | | (0.02 | ) | | | (0.10 | ) | | | (0.04 | ) | | | 0.02 | |
| Net realized and unrealized gains (losses) on securities | | | 4.33 | | | | 1.43 | | | | 1.51 | | | | 1.25 | | | | 1.66 | |
| Total from investment operations | | | 4.29 | | | | 1.41 | | | | 1.41 | | | | 1.21 | | | | 1.68 | |
| | | | | | | | | | | | | | | | | | | | | |
| Less Distributions: | | | | | | | | | | | | | | | | | | | | |
| Dividends from net investment income | | | — | | | | — | | | | — | | | | (0.01 | ) | | | (0.03 | ) |
| Dividends from net realized gains | | | — | | | | — | | | | — | | | | — | | | | — | |
| Return of capital | | | (0.01 | ) | | | — | | | | — | | | | (0.01 | ) | | | — | |
| Total distributions | | | (0.01 | ) | | | — | | | | — | | | | (0.02 | ) | | | (0.03 | ) |
| Paid-in capital from redemption fees | | | — | | | | — | | | | — | | | | 0.01 | | | | 0.00 | (2) |
| Net asset value, end of year | | $ | 19.68 | | | $ | 15.40 | | | $ | 13.99 | | | $ | 12.58 | | | $ | 11.38 | |
| | | | | | | | | | | | | | | | | | | | | |
| TOTAL RETURN | | | 27.87 | % | | | 10.08 | % | | | 11.21 | % | | | 11.04 | % | | | 17.36 | % |
| | | | | | | | | | | | | | | | | | | | | |
| SUPPLEMENTAL DATA AND RATIOS: | | | | | | | | | | | | | | | | | | | | |
| Net assets, end of year (millions) | | $ | 31.32 | | | $ | 10.38 | | | $ | 14.81 | | | $ | 20.01 | | | $ | 28.29 | |
| Ratio of expenses to average net assets | | | | | | | | | | | | | | | | | | | | |
| Before expense reimbursement | | | 1.90 | % | | | 2.03 | % | | | 1.86 | % | | | 1.71 | % | | | 1.75 | % |
| After expense reimbursement | | | 1.90 | % | | | 2.03 | % | | | 1.86 | % | | | 1.59 | % | | | 1.24 | % |
| Ratio of net investment income (loss) to average net assets | | | | | | | | | | | | | | | | | | | | |
| Before expense reimbursement | | | (0.35 | )% | | | (0.09 | )% | | | (0.54 | )% | | | (0.27 | )% | | | (0.34 | )% |
| After expense reimbursement | | | (0.35 | )% | | | (0.09 | )% | | | (0.54 | )% | | | (0.15 | )% | | | 0.17 | % |
Portfolio turnover rate(3) | | | 6 | % | | | 2 | % | | | 166 | % | | | 8 | % | | | 17 | % |
| (1) | The financial highlights set forth for periods prior to September 17, 2009 represent the historical financial highlights of the SPARX Japan Fund. On September 17, 2009, Hennessy Advisors, Inc. became the investment advisor to the Fund and the Fund changed its name to Hennessy Select SPARX Japan Fund. In addition, the Investor Class shares were redesignated Original Class shares. In October 2012, the Fund changed its name to Hennessy Japan Fund and redesignated the Original Class shares to Investor Class shares. |
| (2) | Amount is less than $0.01. |
| (3) | Portfolio turnover is calculated on the basis of the Fund as a whole. |
The accompanying notes are an integral part of these financial statements.
Financial Highlights
For an Institutional Class share outstanding throughout each year
| | | Year Ended October 31, | |
| | | 2013 | | | 2012 | | | 2011 | | | 2010 | | | 2009(1) | |
| PER SHARE DATA: | | | | | | | | | | | | | | | |
| Net asset value, beginning of year | | $ | 15.60 | | | $ | 14.14 | | | $ | 12.66 | | | $ | 11.44 | | | $ | 9.78 | |
| | | | | | | | | | | | | | | | | | | | | |
| Income from investment operations: | | | | | | | | | | | | | | | | | | | | |
| Net investment income (loss) | | | (0.03 | ) | | | 0.02 | | | | 0.03 | | | | 0.01 | | | | 0.03 | |
| Net realized and unrealized gains (losses) on securities | | | 4.42 | | | | 1.44 | | | | 1.45 | | | | 1.23 | | | | 1.66 | |
| Total from investment operations | | | 4.39 | | | | 1.46 | | | | 1.48 | | | | 1.24 | | | | 1.69 | |
| | | | | | | | | | | | | | | | | | | | | |
| Less Distributions: | | | | | | | | | | | | | | | | | | | | |
| Dividends from net investment income | | | — | | | | — | | | | — | | | | (0.01 | ) | | | (0.03 | ) |
| Dividends from net realized gains | | | — | | | | — | | | | — | | | | — | | | | — | |
| Return of capital | | | (0.01 | ) | | | — | | | | — | | | | (0.01 | ) | | | — | |
| Total distributions | | | (0.01 | ) | | | — | | | | — | | | | (0.02 | ) | | | (0.03 | ) |
| Paid-in capital from redemption fees | | | — | | | | — | | | | — | | | | — | | | | 0.00 | (2) |
| Net asset value, end of year | | $ | 19.98 | | | $ | 15.60 | | | $ | 14.14 | | | $ | 12.66 | | | $ | 11.44 | |
| | | | | | | | | | | | | | | | | | | | | |
| TOTAL RETURN | | | 28.19 | % | | | 10.33 | % | | | 11.69 | % | | | 11.07 | % | | | 17.37 | % |
| | | | | | | | | | | | | | | | | | | | | |
| SUPPLEMENTAL DATA AND RATIOS: | | | | | | | | | | | | | | | | | | | | |
| Net assets, end of year (millions) | | $ | 9.07 | | | $ | 8.94 | | | $ | 9.70 | | | $ | 23.57 | | | $ | 25.55 | |
| Ratio of expenses to average net assets | | | | | | | | | | | | | | | | | | | | |
| Before expense reimbursement | | | 1.66 | % | | | 1.85 | % | | | 1.64 | % | | | 1.45 | % | | | 1.75 | % |
| After expense reimbursement | | | 1.66 | % | | | 1.85 | % | | | 1.64 | % | | | 1.40 | % | | | 1.24 | % |
| Ratio of net investment income (loss) to average net assets | | | | | | | | | | | | | | | | | | | | |
| Before expense reimbursement | | | (0.20 | )% | | | 0.13 | % | | | 0.19 | % | | | 0.02 | % | | | (0.34 | )% |
| After expense reimbursement | | | (0.20 | )% | | | 0.13 | % | | | 0.19 | % | | | 0.07 | % | | | 0.17 | % |
Portfolio turnover rate(3) | | | 6 | % | | | 2 | % | | | 166 | % | | | 8 | % | | | 17 | % |
| (1) | The financial highlights set forth for periods prior to September 17, 2009 represent the historical financial highlights of the SPARX Japan Fund. On September 17, 2009 Hennessy Advisors, Inc. became the investment advisor to the Fund and the Fund changed its name to Hennessy Select SPARX Japan Fund. In October 2012, the Fund changed its name to Hennessy Japan Fund. |
| (2) | Amount is less than $0.01 or $(0.01). |
| (3) | Portfolio turnover is calculated on the basis of the Fund as a whole. |
The accompanying notes are an integral part of these financial statements.
HENNESSY FUNDS 1-800-966-4354
Financial Highlights
| Hennessy Japan Small Cap Fund |
For an Investor Class share outstanding throughout each year
| | | Year Ended October 31, | |
| | | 2013 | | | 2012 | | | 2011 | | | 2010 | | | 2009(1) | |
| PER SHARE DATA: | | | | | | | | | | | | | | | |
| Net asset value, beginning of year | | $ | 10.54 | | | $ | 10.09 | | | $ | 9.23 | | | $ | 9.74 | | | $ | 6.87 | |
| | | | | | | | | | | | | | | | | | | | | |
| Income from investment operations: | | | | | | | | | | | | | | | | | | | | |
| Net investment income (loss) | | | 0.06 | | | | (0.68 | ) | | | 0.06 | | | | — | (2) | | | 0.07 | |
| Net realized and unrealized gains (losses) on securities | | | 3.44 | | | | 1.17 | | | | 0.80 | | | | (0.10 | ) | | | 2.80 | |
| Total from investment operations | | | 3.50 | | | | 0.49 | | | | 0.86 | | | | (0.10 | ) | | | 2.87 | |
| | | | | | | | | | | | | | | | | | | | | |
| Less Distributions: | | | | | | | | | | | | | | | | | | | | |
| Dividends from net investment income | | | — | | | | (0.04 | ) | | | — | | | | (0.42 | ) | | | — | |
| Dividends from net realized gains | | | (2.34 | ) | | | — | | | | — | | | | — | | | | — | |
| Total distributions | | | (2.34 | ) | | | (0.04 | ) | | | — | | | | (0.42 | ) | | | — | |
| Paid-in capital from redemption fees | | | — | | | | — | | | | — | | | | 0.01 | | | | 0.00 | (2) |
| Net asset value, end of year | | $ | 11.70 | | | $ | 10.54 | | | $ | 10.09 | | | $ | 9.23 | | | $ | 9.74 | |
| | | | | | | | | | | | | | | | | | | | | |
| TOTAL RETURN | | | 40.59 | % | | | 4.91 | % | | | 9.32 | % | | | (0.72 | )% | | | 41.78 | % |
| | | | | | | | | | | | | | | | | | | | | |
| SUPPLEMENTAL DATA AND RATIOS: | | | | | | | | | | | | | | | | | | | | |
| Net assets, end of year (millions) | | $ | 14.82 | | | $ | 5.11 | | | $ | 24.08 | | | $ | 15.17 | | | $ | 16.20 | |
| Ratio of expenses to average net assets | | | | | | | | | | | | | | | | | | | | |
| Before expense reimbursement | | | 2.39 | % | | | 2.33 | % | | | 2.10 | % | | | 2.14 | % | | | 3.10 | % |
| After expense reimbursement | | | 2.39 | % | | | 2.33 | % | | | 2.10 | % | | | 2.01 | % | | | 1.60 | % |
| Ratio of net investment income (loss) to average net assets | | | | | | | | | | | | | | | | | | | | |
| Before expense reimbursement | | | (0.11 | )% | | | (0.66 | )% | | | 0.17 | % | | | (0.14 | )% | | | (0.86 | )% |
| After expense reimbursement | | | (0.11 | )% | | | (0.66 | )% | | | 0.17 | % | | | (0.01 | )% | | | 0.64 | % |
| Portfolio turnover rate | | | 141 | % | | | 49 | % | | | 61 | % | | | 100 | % | | | 138 | % |
| (1) | The financial highlights set forth for periods prior to September 17, 2009 represent the historical financial highlights of the SPARX Japan Smaller Companies Fund. On September 17, 2009 Hennessy Advisors, Inc. became the investment advisor to the Fund and the Fund changed its name to Hennessy Select SPARX Japan Smaller Companies Fund. In addition, the Original Class shares were redesignated Investor Class shares. In October 2012, the Fund changed its name to Hennessy Japan Small Cap Fund and redesignated the Original Class shares to Investor Class shares. |
| (2) | Amount is less than $0.01 or $(0.01). |
The accompanying notes are an integral part of these financial statements.
Notes to the Financial Statements
October 31, 2013
1). ORGANIZATION
The Hennessy Cornerstone Growth Fund (the “Growth Fund”), the Hennessy Cornerstone Mid Cap 30 Fund (the “Mid Cap 30 Fund”) and the Hennessy Cornerstone Value Fund (the “Value Fund”) (collectively, the “HMFI Funds”) are each a series of Hennessy Mutual Funds, Inc., which was organized as a Maryland corporation on May 20, 1996. The HMFI Funds are open-end, diversified management investment companies registered under the Investment Company Act of 1940, as amended (the “1940 Act”). The investment objective of both the Growth Fund and Mid Cap 30 Fund is long-term growth of capital. The investment objective of the Value Fund is total return, consisting of capital appreciation and current income.
The Hennessy Focus Fund (the “Focus Fund”), the Hennessy Cornerstone Large Growth Fund (the “Large Growth Fund”), the Hennessy Large Value Fund (the “Large Value Fund”), the Hennessy Equity and Income Fund (the “Equity and Income Fund”), the Hennessy Core Bond Fund (the “Core Bond Fund”), the Hennessy Gas Utility Index Fund (the “Gas Fund”), the Hennessy Small Cap Financial Fund (the “Small Cap Financial Fund”), the Hennessy Large Cap Financial Fund (the “Large Cap Financial Fund”) and the Hennessy Technology Fund (the “Technology Fund”) (collectively, the “HFT Funds”), are each a series of the Hennessy Funds Trust, which was organized as a Delaware statutory trust on September 17, 1992. The Focus Fund, the Equity and Income Fund, the Core Bond Fund, the Gas Fund, the Small Cap Financial Fund, the Large Cap Financial Fund and the Technology Fund are each a successor to a series of The FBR Funds, a Delaware statutory trust, pursuant to a reorganization that took place after the close of business on October 26, 2012. The Focus Fund, the Equity and Income Fund, the Core Bond Fund, the Gas Fund, the Small Cap Financial Fund, the Large Cap Financial Fund and the Technology Fund are the successors to the FBR Focus Fund, the FBR Balanced Fund, the FBR Core Bond Fund, the FBR Gas Utility Index Fund, the FBR Small Cap Financial Fund, the FBR Large Cap Financial Fund and the FBR Technology Fund, respectively (each, a “Predecessor FBR Fund” and collectively, the “Predecessor FBR Funds”). Prior to October 26, 2012, each successor HFT Fund had no investment operations. As a result of the reorganization, holders of the Investor Class shares of the Predecessor FBR Funds received Investor Class shares of the corresponding HFT Fund (the Investor Class shares of each HFT Fund are the successor to the accounting and performance information of the corresponding Predecessor FBR Fund), and holders of the Institutional Class shares of the Predecessor FBR Funds received Institutional Class shares of the corresponding HFT Fund (the Institutional Class shares of each HFT Fund are the successor to the accounting and performance information of the corresponding Predecessor FBR Fund). The Large Growth Fund, the Large Value Fund, the Equity and Income Fund and the Core Bond Fund are open-end, diversified management investment companies registered under the 1940 Act. The Focus Fund, the Gas Fund, the Small Cap Financial Fund, the Large Cap Financial Fund and the Technology Fund are open-end, non-diversified management investment companies registered under the 1940 Act. The investment objective of the Large Growth Fund is long-term growth of capital. The investment objective of the Large Value Fund is long-term growth of capital and current income. The investment objective of the Focus Fund, the Small Cap Financial Fund, the Large Cap Financial Fund and the Technology Fund is capital appreciation. The investment objective of the Gas Fund is income and capital appreciation. The investment objective of the Equity and Income Fund is long-term capital growth and current income. The investment objective of the Core Bond Fund is current income with capital growth as a secondary objective.
The Hennessy Balanced Fund (the “Balanced Fund”) and the Hennessy Total Return Fund (the “Total Return Fund”) (together, the “HFI Funds”) are each a series of Hennessy Funds, Inc., which was organized as a Maryland corporation on January 11, 1996. The HFI Funds are open-end, non-diversified management investment companies registered under the 1940 Act. The investment objective of the Balanced Fund is a combination of capital appreciation and current income. The investment objective of the Total Return Fund is total return, consisting of capital appreciation and current income.
The Hennessy Japan Fund (the “Japan Fund”) and the Hennessy Japan Small Cap Fund (the “Japan Small Cap Fund”) (together, the “HSFT Funds”) are each a series of Hennessy SPARX Funds Trust, which was organized as a Massachusetts business trust on July 24, 1995. The HSFT Funds are open-end, diversified management investment companies registered under the 1940 Act. Although each of the HSFT Funds will be considered a “diversified” mutual fund, they may employ relatively focused investment strategies and may hold securities of fewer issuers than other diversified funds. The investment objective of the HSFT Funds is long-term capital appreciation.
The Growth Fund, the Focus Fund, the Mid Cap 30 Fund, the Large Growth Fund, the Value Fund, the Large Value Fund, the Equity and Income Fund, the Core Bond Fund, the Small Cap Financial Fund, the Technology Fund and the Japan Fund offer Investor and Institutional Class shares. Prior to October 26, 2012, the Investor Class shares were known as Original Class shares. Each class of shares differs principally in its respective administration, 12b-1 distribution and service fees, shareholder servicing and transfer agent expenses and sales charges, if any. Each class has identical rights to earnings, assets and voting privileges, except for class-specific expenses and exclusive rights to vote on matters affecting only individual classes. The Total Return Fund, the Balanced Fund, the Gas Fund, the Large Cap Financial Fund and the Japan Small Cap Fund offer only Investor Class shares.
The HMFI Funds, HFT Funds, HFI Funds and HSFT Funds collectively comprise the Hennessy Funds (each, a “Fund”, and collectively the “Funds”).
HENNESSY FUNDS 1-800-966-4354
2). SIGNIFICANT ACCOUNTING POLICIES
The following is a summary of significant accounting policies consistently followed by the Funds in the preparation of the financial statements. These policies are in conformity with U.S. generally accepted accounting principles (“GAAP”).
| a). | Investment Valuation – All investments in securities are recorded at their estimated fair value, as described in Note 3. |
| b). | Federal Income Taxes – Provision for Federal income taxes or excise taxes has not been made since the Funds have elected to be taxed as “regulated investment companies” and intend to distribute substantially all taxable income to shareholders and otherwise comply with the provisions of the Internal Revenue Code applicable to regulated investment companies. Net investment income or loss and realized gains and losses for federal income tax purposes may differ from that reported on the financial statements because of temporary book and tax basis differences. Temporary differences are primarily the result of the treatment of wash sales for tax reporting purposes. Distributions from net realized gains for book purposes may include short-term capital gains, which are included as ordinary income to shareholders for tax purposes. |
| | Due to inherent differences in the recognition of income, expenses, and realized gains/losses under U.S. generally accepted accounting principles and federal income tax purposes, permanent differences between book and tax basis reporting for the 2013 fiscal year have been identified and appropriately reclassified on the Statement of Assets and Liabilities. |
| | | Accumulated Net | | Accumulated Net | | Paid In | |
| | | Investment Income/(Loss) | | Realized Gain/(Loss) | | Capital | |
| | Growth Fund | | $ | 2,575,279 | | | | $ | (751,860 | ) | | | $ | (1,823,419 | ) | |
| | Focus Fund | | $ | 5,812,354 | | | | $ | (570 | ) | | | $ | (5,811,784 | ) | |
| | Mid Cap 30 Fund | | $ | 867,935 | | | | $ | (865,389 | ) | | | $ | (2,546 | ) | |
| | Large Growth Fund | | $ | — | | | | $ | — | | | | $ | — | | |
| | Value Fund | | $ | 435,549 | | | | $ | (435,534 | ) | | | $ | (15 | ) | |
| | Large Value Fund | | $ | (41,157 | ) | | | $ | 41,157 | | | | $ | — | | |
| | Total Return Fund | | $ | — | | | | $ | — | | | | $ | — | | |
| | Equity and Income Fund | | $ | 70,120 | | | | $ | (67,594 | ) | | | $ | (2,526 | ) | |
| | Balanced Fund | | $ | 485 | | | | $ | (485 | ) | | | $ | — | | |
| | Core Bond Fund | | $ | 15,530 | | | | $ | (15,772 | ) | | | $ | 242 | | |
| | Gas Fund | | $ | (1,022,912 | ) | | | $ | 8,210,897 | | | | $ | (7,187,985 | ) | |
| | Small Cap Financial Fund | | $ | 136,819 | | | | $ | (311,480 | ) | | | $ | 174,661 | | |
| | Large Cap Financial Fund | | $ | (6,678 | ) | | | $ | (78,581 | ) | | | $ | 85,259 | | |
| | Technology Fund | | $ | 65,132 | | | | $ | — | | | | $ | (65,132 | ) | |
| | Japan Fund | | $ | (23,270 | ) | | | $ | 77,845 | | | | $ | (54,575 | ) | |
| | Japan Small Cap Fund | | $ | 56,052 | | | | $ | (56,052 | ) | | | $ | — | | |
| | The permanent differences primarily relate to Net Operating Losses, 988 currency transactions, partnership sales adjustments, and PFIC sale adjustments. |
| c). | Income and Expenses – Dividend income is recognized on the ex-dividend date or as soon as information is available to the Funds. Interest income, which includes the amortization of premium and accretion of discount, is recognized on an accrual basis. Income, expenses (other than expenses attributable to a specific class) and realized and unrealized gains or losses on investments are allocated to each class of shares based on its respective net assets. |
| d). | Distributions to Shareholders – Dividends from net investment income for the Growth Fund, the Focus Fund, the Mid Cap 30 Fund, the Large Growth Fund, the Value Fund, the Large Value Fund, the Small Cap Financial Fund, the Large Cap Financial Fund, the Technology Fund, the Japan Fund and the Japan Small Cap Fund, if any, are declared and paid out annually, usually in November or December of each year. Dividends from net investment income for the Total Return Fund, the Equity and Income Fund, the Balanced Fund and the Gas Fund are declared and paid on a calendar quarter basis. The Core Bond Fund declares and pays net investment income, if any, monthly. Distributions of net realized capital gains, if any, are declared and paid annually, usually in November or December of each year, for all of the Funds. |
| e). | Security Transactions – Investment and shareholder transactions are recorded on the trade date. The Funds determine the gain or loss realized from the investment transactions by comparing the original cost of the security lot sold with the net sale proceeds. Discounts and premiums on securities purchased are accreted/amortized over the life of the respective security. |
| f). | Use of Estimates – The preparation of financial statements in conformity with GAAP requires management to make estimates and assumptions that affect the reported amounts of assets and liabilities and disclosure of contingent assets and liabilities at the date of the financial statements and the reported change in net assets during the reporting period. Actual results could differ from those estimates. |
| g). | Share Valuation – The net asset value (“NAV”) per share of each Fund is calculated by dividing the sum of the value of the securities held by such Fund, plus cash or other assets, minus all liabilities (including estimated accrued expenses) by the total number of shares outstanding for such Fund, rounded to the nearest cent. The Funds’ shares will not be priced on days on which the New York Stock Exchange is closed for trading. The offering and redemption price per share for each Fund is equal to each Fund’s net asset value per share. |
| h). | Foreign Currency – Values of investments denominated in foreign currencies are converted into U.S. dollars using the spot market rate of exchange at the time of valuation. Purchases and sales of investments and income are translated into U.S. dollars using the |
| | spot market rate of exchange prevailing on the respective dates of such transactions. The effect of changes in foreign exchange rates on realized and unrealized security gains and losses is reflected as a component of such gains or losses. Foreign investments present additional risks due to currency fluctuations, economic and political factors, lower liquidity, government regulations, differences in accounting standards and other factors. |
| i). | Forward Contracts – The Funds may enter into forward currency contracts to reduce their exposure to changes in foreign currency exchange rates on their foreign holdings and to lock in the U.S. dollar cost of firm purchase and sale commitments for securities denominated in foreign currencies. A forward currency contract is a commitment to purchase or sell a foreign currency at a future date at a negotiated forward rate. The gain or loss arising from the difference between the U.S. dollar cost of the original contract and the value of the foreign currency in U.S. dollars upon closing of such contract is included in net realized gain or loss from foreign currency transactions. During the year ended October 31, 2013, the Funds did not enter into any forward contracts. |
| j). | Repurchase Agreements – The Funds may enter into repurchase agreements with member banks or security dealers of the Federal Reserve Board whom the investment advisor deems creditworthy. The repurchase price generally equals the price paid by the Fund plus interest negotiated on the basis of current short-term rates. |
| | Securities pledged as collateral for repurchase agreements are held by the custodian bank until the respective agreements mature. Provisions of the repurchase agreements ensure that the market value of the collateral, including accrued interest thereon, is sufficient, in the event of default of the counterparty. If the counterparty defaults and the value of the collateral declines or if the counterparty enters an insolvency proceeding, realization of the collateral by the Fund may be delayed or limited. |
| k). | Accounting for Uncertainty in Income Taxes – The Funds have adopted accounting policies regarding recognition and measurement of tax positions taken or expected to be taken on a tax return. The Funds have reviewed all open tax years in major jurisdictions and concluded that there is no impact on the Funds’ net assets and no tax liability resulting from unrecognized tax benefits relating to uncertain income tax positions taken or expected to be taken on a tax return. The Funds’ major tax jurisdictions are U.S. Federal, Maryland, Delaware and Massachusetts. As of October 31, 2013, open Federal and state tax years for the Funds include the tax years ended October 31, 2010 through 2013. |
| l). | Derivatives – The Funds may invest in, or enter into, derivatives, such as options, futures contracts, options on futures contracts and swaps, for a variety of reasons, including to hedge certain risks, to provide a substitute for purchasing or selling particular securities or to increase potential income gain. Derivatives may provide a cheaper, quicker or more specifically focused way for a Fund to invest than “traditional” securities would. The main purpose of utilizing these derivative instruments is for hedging purposes. |
| | The Funds have adopted the financial accounting reporting rules as required by the Derivatives and Hedging Topic of the FASB Accounting Standards Codification. The Funds are required to include enhanced disclosure that enables investors to understand how and why an entity uses derivatives, how derivatives are accounted for and how derivatives instruments affect an entity’s results of operations and financial position. During the year ended October 31, 2013, the Funds did not hold any derivative instruments. |
| m). | Events Subsequent to the Fiscal Period End – The Funds have adopted financial reporting rules regarding subsequent events that require an entity to recognize in the financial statements the effects of all subsequent events that provide additional evidence about conditions that existed at the date of the balance sheet. Management has evaluated the Funds’ related events and transactions that occurred subsequent to October 31, 2013 through the date of issuance of the Funds’ financial statements. There were no events or transactions that occurred during this period that materially impacted the amounts or disclosures in the Funds’ financial statements. |
| n). | New Accounting Pronouncements – In December 2011, FASB issued Accounting Standards Update (“ASU”) No. 2011-11 related to disclosures about offsetting assets and liabilities. The amendments in this ASU require an entity to disclose information about offsetting and related arrangements to enable users of its financial statements to understand the effect of those arrangements on its financial position. The ASU is effective for annual reporting periods beginning on or after January 1, 2013 and interim periods within those annual periods. The guidance requires retrospective applications for all comparative periods presented. Management is currently evaluating the impact ASU No. 2011-11 will have on the financial statements disclosures. |
3). SECURITIES VALUATION
The Funds have adopted authoritative fair valuation accounting standards that establish an authoritative definition of fair value and set out a hierarchy for measuring fair value. These standards require additional disclosures about the various inputs and valuation techniques used to develop the measurements of fair value and a discussion in changes in valuation techniques and related inputs during the period. These inputs are summarized in the three broad levels listed below:
| | Level 1 – | Quoted unadjusted prices for identical instruments in active markets to which the Fund has access at the date of measurement. |
| | Level 2 – | Quoted prices for similar instruments in active markets; quoted prices for identical or similar instruments in markets that are not active; and model-derived valuations in which all significant inputs and significant value drivers are observable in active markets. Level 2 inputs are those in markets for which there are few transactions, the prices are not current, the prices are fair value adjusted due to post market close subsequent events (foreign markets), little public information exists or instances where prices vary substantially over time or among brokered market makers. These inputs may also include interest rates, prepayment speeds, credit risk curves, default rates and similar data. |
| | Level 3 – | Model-derived valuations in which one or more significant inputs or significant value drivers are unobservable. Unobservable inputs are those inputs that reflect the Funds’ own assumptions about what market participants would use to price the asset or liability based on the best available information. |
HENNESSY FUNDS 1-800-966-4354
Following is a description of the valuation techniques applied to the Funds’ major categories of assets and liabilities measured at fair value on a recurring basis.
Equity Securities – Equity securities, including common stocks, preferred stocks, foreign issued common stocks, exchange traded funds, closed-end mutual funds and real estate investment trusts, which are traded on a securities exchange for which a last-quoted sales price is readily available will be valued at the last sales price as reported by the primary exchange on which the securities are listed. Securities listed on the Nasdaq National Market System (“Nasdaq”) will be valued at the Nasdaq Official Closing Price, which may differ from the last sales price reported. Securities traded on a securities exchange for which a last-quoted sales price is not readily available will be valued at the mean between the bid and ask prices. To the extent these securities are actively traded and valuation adjustments are not applied, they are categorized in Level 1 of the fair value hierarchy.
Investment Companies – Investments in investment companies (e.g., mutual funds and exchange traded funds) are generally priced at the ending net asset value (“NAV”) provided by the service agent of the Funds and will be classified in Level 1 of the fair value hierarchy.
Debt Securities – Debt securities, such as corporate bonds, asset backed securities, mortgage backed securities, municipal bonds, U.S. Treasuries and U.S. government agency issues are valued at market on the basis of valuations furnished by an independent pricing service that utilizes both dealer-supplied valuations and formula-based techniques. The pricing service may consider recently executed transactions in securities of the issuer or comparable issuers, market price quotations (where observable), bond spreads and fundamental data relating to the issuer. In addition, the model may incorporate market observable data such as reported sales of similar securities, broker quotes, yields, bids, offers, and reference data. Certain securities are valued principally using dealer quotations. These securities will generally be classified in level 2 of the fair value hierarchy.
Short-Term Securities – Short-term equity investments, including money market funds, are valued in the manner specified above. Short-term debt investments are valued at amortized cost, if their original maturity was 60 days or less, or by amortizing the values as of the 61st day prior to maturity, if their original term to maturity exceeded 60 days. Short-term securities are generally in Level 1 or Level 2 of the fair market hierarchy depending on the inputs used and market activity levels for specific securities.
The Board of Directors/Trustees of the Funds (the “Board”) has adopted fair value pricing procedures that are followed when a price for a security is not readily available or if a significant event has occurred that indicates the closing price of a security no longer represents the true value of that security. Fair value pricing determinations are made in good faith in accordance with these procedures. There are numerous criteria that will be given consideration in determining a fair value of a security. Some of these criteria are trading volume of security and markets, value of other like securities and news events with direct bearing to security or market. Fair value pricing results in an estimated price that reasonably reflects the current market conditions in order to rate the portfolio holdings such that shareholder transactions receive a fair net asset value. Depending on the relative significance of the valuation inputs, these securities may be classified in either Level 2 or Level 3 of the fair value hierarchy.
Fair valuing of foreign securities may be determined with the assistance of a pricing service using correlations between the movement of prices of such securities and indices of domestic securities and other appropriate indicators, such as closing market prices of relevant American Depositary Receipts or futures contracts. The effect of using fair value pricing is that the Funds’ NAVs will reflect the affected portfolio securities’ value as determined in the judgment of the Board or its designee instead of being determined by the market. Using a fair value pricing methodology to price securities may result in a value that is different from a security’s most recent closing price and from the prices used by other investment companies to calculate their net asset values and are considered Level 2 prices in the fair valuation hierarchy. Because the Funds invest in foreign securities, the value of the Funds’ portfolio securities may change on days when you will not be able to purchase or redeem your shares. Depending on the relative significance of the valuation inputs, these securities may be classified in either Level 2 or Level 3 of the fair value hierarchy.
The Board has delegated day-to-day valuation issues to a Valuation Committee comprised of one or more representatives from Hennessy Advisors, Inc., the Funds’ investment advisor. The function of the Valuation Committee is to value securities where current and reliable market quotations are not readily available. All actions taken by the Valuation Committee are reviewed by the Board.
The Funds have performed an analysis of all existing investments to determine the significance and character of all inputs to their fair value determination. Various inputs are used in determining the value of each Fund’s investments. The inputs or methodology used for valuing securities are not necessarily an indication of the risk associated with investing in those securities. Details related to the fair valuation hierarchy of the Funds’ securities as of October 31, 2013 are included with each Fund’s Schedule of Investments.
4). REVERSE REPURCHASE AGREEMENTS
The Total Return Fund may enter into reverse repurchase agreements with the same parties with whom it may enter into repurchase agreements. Under a reverse repurchase agreement, the Fund sells securities and agrees to repurchase them at a mutually agreed upon date and price. Reverse repurchase agreements are regarded as a form of secured borrowing by the Fund. Securities sold under reverse repurchase agreements are reflected as a liability on the Statement of Assets and Liabilities. Interest payments made are recorded as a component of interest expense on the Statement of Operations.
For the year ended October 31, 2013, the average daily balance and average interest rate in effect for reverse repurchase agreements were $31,509,723 and 0.25%, respectively. At October 31, 2013, the interest rate in effect for the outstanding reverse repurchase agreements, which were scheduled to mature on November 21, 2013, ($14,392,000), December 19, 2013 ($7,196,000), and January 23, 2014 ($12,593,000), were 0.21%, 0.25% and 0.21%, respectively. Outstanding reverse repurchase agreements at October 31, 2013 were equal to 37.88% of the Total Return Fund’s net assets.
5). INVESTMENT TRANSACTIONS
Purchases and sales of investment securities (excluding government and short-term investments) during the year ended October 31, 2013, were as follows:
| | | | Growth | | | Focus | | | Mid Cap 30 | | | Large Growth | |
| | | | Fund | | | Fund | | | Fund | | | Fund | |
| | Purchase | | $ | 292,040,641 | | | $ | 215,782,744 | | | $ | 406,961,666 | | | $ | 71,640,034 | |
| | Sales | | $ | 396,503,335 | | | $ | 35,687,356 | | | $ | 425,539,686 | | | $ | 98,286,856 | |
| | | | | | | | | | | | | | | | | |
| | | | | | | | | | | | | | | | Equity and | |
| | | | Value | | | Large Value | | | Total Return | | | Income | |
| | | | Fund | | | Fund | | | Fund | | | Fund | |
| | Purchase | | $ | 53,943,492 | | | $ | 121,551,798 | | | $ | 19,829,847 | | | $ | 90,416,455 | |
| | Sales | | $ | 63,900,416 | | | $ | 132,592,613 | | | $ | 17,672,095 | | | $ | 74,942,474 | |
| | | | | | | | | | | | | | | | | |
| | | | | | | | | | | | | | | | Small Cap | |
| | | | Balanced | | | Core Bond | | | Gas | | | Financial | |
| | | | Fund | | | Fund | | | Fund | | | Fund | |
| | Purchase | | $ | 1,659,763 | | | $ | 2,078,035 | | | $ | 438,897,976 | | | $ | 186,709,969 | |
| | Sales | | $ | 9,197,705 | | | $ | 16,961,327 | | | $ | 165,542,940 | | | $ | 143,155,219 | |
| | | | | | | | | | | | | | | | | |
| | | | Large Cap | | | | | | | | | | | | | |
| | | | Financial | | | Technology | | | Japan | | | Japan Small | |
| | | | Fund | | | Fund | | | Fund | | | Cap Fund | |
| | Purchase | | $ | 55,523,224 | | | $ | 8,495,515 | | | $ | 16,233,110 | | | $ | 22,726,128 | |
| | Sales | | $ | 50,790,490 | | | $ | 9,425,008 | | | $ | 1,520,475 | | | $ | 18,795,146 | |
Purchases and sales/maturities of long-term U.S. Government Securities for the Equity and Income Fund were $57,477,270 and $94,230,323, respectively, for the year ended October 31, 2013. Purchases and sales/maturities of long-term U.S. Government Securities for the Balanced Fund were $0 and $8,200,000, respectively, for the year ended October 31, 2013. Purchases and sales/maturities of long-term U.S. Government Securities for the Core Bond Fund were $10,086,670 and $24,504,891, respectively, for the year ended October 31, 2013. There were no purchases or sales/maturities of long-term U.S. Government Securities for the Growth Fund, the Focus Fund, the Mid Cap 30 Fund, the Large Growth Fund, the Value Fund, the Large Value Fund, the Total Return Fund, the Gas Fund, the Small Cap Financial Fund, the Large Cap Financial Fund, the Technology Fund, the Japan Fund or the Japan Small Cap Fund for the year ended October 31, 2013.
6). INVESTMENT MANAGEMENT FEE AND OTHER TRANSACTIONS WITH AFFILIATES
Hennessy Advisors, Inc. (the “Advisor”) is the investment advisor of the Funds. The Advisor provides the Funds with investment management services under an Investment Advisory Agreement. The Advisor furnishes all investment advice, office space, facilities, and provides most of the personnel needed by the Funds. As compensation for its services, the Advisor is entitled to a monthly fee from each Fund. The fee is based upon the average daily net assets of the Funds at the annual rate of:
| | Growth Fund | 0.74% | | Core Bond Fund | 0.80% | |
| | Focus Fund | 0.90% | | Balanced Fund | 0.60% | |
| | Mid Cap 30 Fund | 0.74% | | Gas Fund | 0.40% | |
| | Large Growth Fund | 0.74% | | Small Cap Financial Fund | 0.90% | |
| | Value Fund | 0.74% | | Large Cap Financial Fund | 0.90% | |
| | Large Value Fund | 0.85% | | Technology Fund | 0.90% | |
| | Total Return Fund | 0.60% | | Japan Fund | 1.00% | |
| | Equity and Income Fund | 0.80% | | Japan Small Cap Fund | 1.20% | |
Net investment advisory fees payable for the Funds as of October 31, 2013, were:
| | Growth Fund | | $ | 153,443 | | Balanced Fund | | $ | 6,199 | |
| | Focus Fund | | $ | 970,960 | | Core Bond Fund | | $ | 0 | |
| | Mid Cap 30 Fund | | $ | 130,718 | | Gas Fund | | $ | 385,618 | |
| | Large Growth Fund | | $ | 64,781 | | Small Cap Financial Fund | | $ | 236,652 | |
| | Value Fund | | $ | 87,507 | | Large Cap Financial Fund | | $ | 66,918 | |
| | Large Value Fund | | $ | 102,212 | | Technology Fund | | $ | 4,281 | |
| | Total Return Fund | | $ | 45,343 | | Japan Fund | | $ | 32,296 | |
| | Equity and Income Fund | | $ | 208,677 | | Japan Small Cap Fund | | $ | 14,478 | |
The Advisor has delegated the day-to-day management of the Focus Fund to a sub-advisor, Broad Run Investment Management, LLC. The Advisor has delegated the day-to-day management of the Large Value Fund to RBC Global Asset Management (U.S.), Inc. The Advisor has delegated the day-to-day management of the Equity and Income Fund to Financial Counselors, Inc. (“FCI”) and The London Company of Virginia, LLC. The Advisor has delegated the day-to-day management of the Core Bond Fund to FCI. The Advisor has delegated the day-to-day management of the Japan Fund and the Japan Small Cap Fund to SPARX Asset Management Co., Ltd. The Advisor pays the sub-advisor fees for each of the Funds from its own assets and these fees are not an additional expense of the Funds.
HENNESSY FUNDS 1-800-966-4354
The Advisor has agreed to waive its fees and absorb expenses to the extent that the total annual operating expenses (excluding all Federal, state and local taxes, interest, brokerage commissions, acquired fund fees and expenses and other costs incurred in connection with the purchase and sale of securities and extraordinary items) exceed 0.98% of the Funds’ net assets for the Institutional Class shares of the Growth Fund, the Mid Cap 30 Fund, the Large Growth Fund, the Value Fund and the Large Value Fund. The expense limitation agreement for the Institutional Class shares can only be terminated by the Board. For a period of three years after the year in which the Advisor waives or reimburses expenses, the Advisor may seek reimbursement from the Funds to the extent that total annual Fund operating expenses are less than the expense limitation in effect at the time of the reimbursement. During the three years ended October 31, 2013, no Advisor fees were waived and therefore no expenses are subject to potential recovery.
The Advisor has contractually agreed to limit each class of shares of the Focus Fund, the Equity and Income Fund, the Core Bond Fund, the Gas Fund, the Small Cap Financial Fund, the Large Cap Financial Fund and the Technology Fund total operating expenses and to maintain these limitations with regard to each class of shares of each Fund through February 28, 2015. The following are the limits for the Funds, based on average daily net assets (excluding interest, taxes, brokerage commissions, dividend expenses, acquired fund fees and expenses, extraordinary legal expenses, or any other extraordinary expenses, and for the Equity and Income Fund and the Core Bond Fund, also excluding 12b-1 fees):
| | | | Investor Class | | | Institutional Class | |
| | Focus Fund | | | 1.95 | % | | | | | 1.70 | % | | |
| | Equity and Income Fund | | | 1.08 | %* | | | | | 1.08 | % | | |
| | Core Bond Fund | | | 1.05 | %* | | | | | 1.05 | % | | |
| | Gas Fund | | | 0.85 | % | | | | | N/A | | | |
| | Small Cap Financial Fund | | | 1.95 | % | | | | | 1.70 | % | | |
| | Large Cap Financial Fund | | | 1.95 | % | | | | | N/A | | | |
| | Technology Fund | | | 1.95 | % | | | | | 1.70 | % | | |
| | * | Amount shown excludes the 12b-1 fee. Including the 12b-1 fee, the amounts are 1.33% and 1.30% for the Equity and Income Fund and Core Bond Fund, respectively. |
For a period of three years after the year in which the Advisor waives or reimburses expenses, the Advisor may seek reimbursement from the Funds to the extent that total annual Fund operating expenses are less than the expense limitation in effect at the time of the reimbursement. The Advisor waived or reimbursed expenses of $67,819, $111,480 and $59,499 for the Equity and Income Fund, the Core Bond Fund and the Technology Fund, respectively, during the one-year period ended October 31, 2013. As of October 31, 2013, cumulative expenses subject to potential recovery to the aforementioned conditions and year of expiration are as follows:
| | | Oct. 31, 2015 | | Oct. 31, 2016 | | Total |
| | Equity and Income Fund – Inv. Class | | $ | 0 | | | | $ | 67,819 | | | | $ | 67,819 | |
| | Equity and Income Fund – Inst. Class | | $ | 0 | | | | $ | 0 | | | | $ | 0 | |
| | Core Bond Fund – Inv. Class | | $ | 755 | | | | $ | 36,603 | | | | $ | 37,358 | |
| | Core Bond Fund – Inst. Class | | $ | 4 | | | | $ | 74,877 | | | | $ | 74,881 | |
| | Technology Fund – Inv. Class | | $ | 619 | | | | $ | 48,568 | | | | $ | 49,187 | |
| | Technology Fund – Inst. Class | | $ | 151 | | | | $ | 10,931 | | | | $ | 11,082 | |
The Board has approved a Shareholder Servicing Agreement for the Investor Class shares of each of the Growth Fund, the Mid Cap 30 Fund, the Large Growth Fund, the Value Fund, the Large Value Fund, the Total Return Fund, the Balanced Fund, the Japan Fund and the Japan Small Cap Fund, which was instituted to compensate the Advisor for the non-investment management services it provides to such Funds. The Plan provides for a monthly fee paid to the Advisor at an annual rate of 0.10% of the average daily net assets of such Funds attributable to Investor Class shares.
Service fees payable for the Funds that have a Shareholder Servicing Agreement with the Advisor as of October 31, 2013 were:
| | Growth Fund | | $ | 18,527 | | Total Return Fund | | $ | 7,557 | | |
| | Mid Cap 30 Fund | | $ | 13,287 | | Balanced Fund | | $ | 1,033 | | |
| | Large Growth Fund | | $ | 7,402 | | Japan Fund | | $ | 2,521 | | |
| | Value Fund | | $ | 11,491 | | Japan Small Cap Fund | | $ | 1,206 | | |
| | Large Value Fund | | $ | 11,997 | | | | | | | |
The Total Return Fund and the Balanced Fund have adopted a plan pursuant to Rule 12b-1 that authorizes payments in connection with the distribution of each such Fund’s shares at an annual rate not to exceed 0.15% of each such Fund’s average daily net assets. The Focus Fund, the Equity and Income Fund, the Core Bond Fund, the Small Cap Financial Fund, the Large Cap Financial Fund and the Technology Fund have adopted a plan pursuant to Rule 12b-1 that authorizes payments in connection with the distribution of these Funds’ shares at an annual rate of up to 0.25% of each such Fund’s average daily net assets attributable to Investor Class shares. Amounts paid under the plan may be spent on any activities or expenses primarily intended to result in the sale of shares, including but not limited to, advertising, compensation for sales and marketing activities or financial institutions and others such as dealers and distributors, shareholder account servicing, the printing and mailing of prospectuses to other than current shareowners and the printing and mailing of sales literature. The Gas Fund has adopted a plan pursuant to Rule 12b-1 but it will not be implemented prior to October 26, 2014.
The Funds have entered into agreements with various brokers, dealers and financial intermediaries in connection with the sale of shares of the Funds. The agreements provide for periodic payments by the Funds to the brokers, dealers and financial intermediaries
for providing certain shareholder maintenance services (sub-transfer agent expenses). These shareholder services include the pre-processing and quality control of new accounts, shareholder correspondence, answering customer inquiries regarding account status and facilitating shareholder telephone transactions. Fees paid by the Funds to various brokers, dealers and financial intermediaries for the year ended October 31, 2013 were:
| | Growth Fund | | $ | 480,825 | | | Balanced Fund | | $ | 13,082 | | |
| | Focus Fund | | $ | 1,126,562 | | | Core Bond Fund | | $ | 17,115 | | |
| | Mid Cap 30 Fund | | $ | 326,938 | | | Gas Fund | | $ | 1,820,383 | | |
| | Large Growth Fund | | $ | 38,309 | | | Small Cap Financial Fund | | $ | 288,577 | | |
| | Value Fund | | $ | 92,547 | | | Large Cap Financial Fund | | $ | 91,753 | | |
| | Large Value Fund | | $ | 104,444 | | | Technology Fund | | $ | 3,558 | | |
| | Total Return Fund | | $ | 65,681 | | | Japan Fund | | $ | 51,455 | | |
| | Equity and Income Fund | | $ | 288,974 | | | Japan Small Cap Fund | | $ | 35,714 | | |
U.S. Bancorp Fund Services, LLC (the “Administrator”) acts as the Funds’ Administrator under an Administration Agreement. Administrative services under this agreement include custody, distribution, fund accounting, fund administration and transfer agent services. In addition, the Administrator does the following: prepares various federal and state regulatory filings, reports and returns for the Funds; prepares reports and materials to be supplied to the Board; monitors the activities of the Funds’ custodian, transfer agent and accountants; and coordinates the preparation and payment of the Funds’ expenses and reviews the Funds’ expense accruals. Fees paid to the Administrator for the year ended October 31, 2013 were:
| | Growth Fund | | $ | 586,458 | | | Balanced Fund | | $ | 29,749 | | |
| | Focus Fund | | $ | 1,151,949 | | | Core Bond Fund | | $ | 19,131 | | |
| | Mid Cap 30 Fund | | $ | 400,145 | | | Gas Fund | | $ | 1,113,846 | | |
| | Large Growth Fund | | $ | 207,915 | | | Small Cap Financial Fund | | $ | 313,962 | | |
| | Value Fund | | $ | 279,428 | | | Large Cap Financial Fund | | $ | 82,979 | | |
| | Large Value Fund | | $ | 280,205 | | | Technology Fund | | $ | 6,570 | | |
| | Total Return Fund | | $ | 166,811 | | | Japan Fund | | $ | 57,317 | | |
| | Equity and Income Fund | | $ | 351,422 | | | Japan Small Cap Fund | | $ | 29,500 | | |
The Administrator has voluntarily waived all or a portion of its administration fees allocated to the Institutional Class shares of the Growth Fund, the Mid Cap 30 Fund, the Large Growth Fund, the Value Fund and the Large Value Fund. The administration fees voluntarily waived by the Administrator during the year ended October 31, 2013 were $37,104, $58,453, $23,715, $4,356 and $388, respectively.
Quasar Distributors, LLC (the “Distributor”) acts as the Funds’ principal underwriter in a continuous public offering of the Funds’ shares. The Distributor is an affiliated company of U.S. Bank, N.A., the Fund’s Administrator.
7). LINE OF CREDIT
The Funds have a line of credit in the amount of the lesser of (i) $100,000,000 or (ii) 33.33% of each Fund’s net assets, or 30% for the Gas Fund and 10% for the Balanced Fund, intended to provide short-term financing, if necessary, subject to certain restrictions, in connection with shareholder redemptions. The credit facility is with its custodian bank, U.S. Bank, N.A. Borrowings under this arrangement bear interest at the bank’s prime rate. During the year ended October 31, 2013, the Gas Fund had an outstanding average daily balance and a weighted average interest rate of $2,430 and 3.25%, respectively. The maximum amount outstanding for the Gas Fund during the period was $887,000. During the year ended October 31, 2013, the Large Cap Financial Fund had an outstanding average daily balance and a weighted average interest rate of $2,310 and 3.25%, respectively. The maximum amount outstanding for the Large Cap Financial Fund during the period was $339,000. During the year ended October 31, 2013, the Technology Fund had an outstanding average daily balance and a weighted average interest rate of $923 and 3.25%, respectively. The maximum amount outstanding for the Technology Fund during the period was $60,000. During the year ended October 31, 2013, the Japan Small Cap Fund had an outstanding average daily balance and a weighted average interest rate of $96,288 and 3.25%, respectively. The maximum amount outstanding for the Japan Small Cap Fund during the period was $3,395,000.
8). FEDERAL TAX INFORMATION
As of October 31, 2013, the components of accumulated earnings (losses) for income tax purposes were as follows:
| | | | Growth | | | Focus | | | Mid Cap 30 | | | Large Growth | |
| | | | Fund | | | Fund | | | Fund | | | Fund | |
| | Cost of investments for tax purposes | | $ | 201,929,450 | | | $ | 716,452,529 | | | $ | 203,302,306 | | | $ | 79,154,555 | |
| | Gross tax unrealized appreciation | | $ | 49,734,271 | | | $ | 605,898,829 | | | $ | 11,718,602 | | | $ | 26,254,879 | |
| | Gross tax unrealized depreciation | | | (4,414,906 | ) | | | (4,692,989 | ) | | | (4,276,253 | ) | | | (379,285 | ) |
| | Net tax unrealized appreciation/depreciation | | $ | 45,319,365 | | | $ | 601,205,840 | | | $ | 7,442,349 | | | $ | 25,875,594 | |
| | Undistributed ordinary income | | $ | — | | | $ | — | | | $ | 724,245 | | | $ | 1,205,676 | |
| | Undistributed long-term capital gains | | | — | | | | 22,447,669 | | | | 15,252,709 | | | | 5,166,795 | |
| | Total distributable earnings | | $ | — | | | $ | 22,447,669 | | | $ | 15,976,954 | | | $ | 6,372,471 | |
| | Other accumulated gain/(loss) | | $ | (194,324,076 | ) | | $ | (7,643,708 | ) | | $ | (1,481,017 | ) | | $ | (3,045,759 | ) |
| | Total accumulated gain/(loss) | | $ | (149,004,711 | ) | | $ | 616,009,801 | | | $ | 21,938,286 | | | $ | 29,202,306 | |
HENNESSY FUNDS 1-800-966-4354
| | | | | | | | | | | | | Equity and | |
| | | | Value | | | Large Value | | | Total Return | | | Income | |
| | | | Fund | | | Fund | | | Fund | | | Fund | |
| | Cost of investments for tax purposes | | $ | 110,932,811 | | | $ | 114,439,789 | | | $ | 111,406,807 | | | $ | 272,312,225 | |
| | Gross tax unrealized appreciation | | $ | 34,383,174 | | | $ | 31,694,757 | | | $ | 13,388,054 | | | $ | 47,145,367 | |
| | Gross tax unrealized depreciation | | | (2,440,803 | ) | | | (1,266,680 | ) | | | (237,537 | ) | | | (2,100,558 | ) |
| | Net tax unrealized appreciation/depreciation | | $ | 31,942,371 | | | $ | 30,428,077 | | | $ | 13,150,517 | | | $ | 45,044,809 | |
| | Undistributed ordinary income | | $ | 3,048,910 | | | $ | 904,159 | | | $ | 66,417 | | | $ | 247,147 | |
| | Undistributed long-term capital gains | | | — | | | | — | | | | — | | | | 10,301,169 | |
| | Total distributable earnings | | $ | 3,048,910 | | | $ | 904,159 | | | $ | 66,417 | | | $ | 10,548,316 | |
| | Other accumulated gain/(loss) | | $ | (32,066,745 | ) | | $ | (12,049,305 | ) | | $ | (2,084,535 | ) | | $ | — | |
| | Total accumulated gain/(loss) | | $ | 2,924,536 | | | $ | 19,282,931 | | | $ | 11,132,399 | | | $ | 55,593,125 | |
| | | | | | | | | | | | | | | | | | |
| | | | | | | | | | | | | | | | Small Cap | |
| | | | Balanced | | | Core Bond | | | Gas | | | Financial | |
| | | | Fund | | | Fund | | | Fund | | | Fund | |
| | Cost of investments for tax purposes | | $ | 11,290,839 | | | $ | 6,227,313 | | | $ | 869,739,852 | | | $ | 252,322,381 | |
| | Gross tax unrealized appreciation | | $ | 970,611 | | | $ | 283,915 | | | $ | 338,296,903 | | | $ | 68,513,862 | |
| | Gross tax unrealized depreciation | | | (21,637 | ) | | | (176,590 | ) | | | (24,875,224 | ) | | | (7,656,886 | ) |
| | Net tax unrealized appreciation/depreciation | | $ | 948,974 | | | $ | 107,325 | | | $ | 313,421,679 | | | $ | 60,856,976 | |
| | Undistributed ordinary income | | | — | | | | 14,283 | | | | 9,951,374 | | | | 3,301,727 | |
| | Undistributed long-term capital gains | | $ | 413,650 | | | $ | 1,349,958 | | | $ | 17,563,261 | | | $ | 19,847,524 | |
| | Total distributable earnings | | $ | 413,650 | | | $ | 1,364,241 | | | $ | 27,514,635 | | | $ | 23,149,251 | |
| | Other accumulated gain/(loss) | | $ | — | | | $ | — | | | $ | (589 | ) | | $ | — | |
| | Total accumulated gain/(loss) | | $ | 1,362,624 | | | $ | 1,471,566 | | | $ | 340,935,725 | | | $ | 84,006,227 | |
| | | | | | | | | | | | | | | | | | |
| | | | Large Cap | | | | | | | | | | | | | |
| | | | Financial | | | Technology | | | Japan | | | Japan Small | |
| | | | Fund | | | Fund | | | Fund | | | Cap Fund | |
| | Cost of investments for tax purposes | | $ | 72,142,471 | | | $ | 4,760,318 | | | $ | 30,288,033 | | | $ | 13,565,109 | |
| | Gross tax unrealized appreciation | | $ | 18,631,889 | | | $ | 964,717 | | | $ | 10,246,685 | | | $ | 1,595,870 | |
| | Gross tax unrealized depreciation | | | (2,481,037 | ) | | | (83,425 | ) | | | (418,275 | ) | | | (524,715 | ) |
| | Net tax unrealized appreciation/depreciation | | $ | 16,150,852 | | | $ | 881,292 | | | $ | 9,828,410 | | | $ | 1,071,155 | |
| | Undistributed ordinary income | | | — | | | | — | | | | — | | | | 2,248,979 | |
| | Undistributed long-term capital gains | | $ | 2,696,017 | | | $ | — | | | $ | — | | | $ | 980,367 | |
| | Total distributable earnings | | $ | 2,696,017 | | | $ | — | | | $ | — | | | $ | 3,229,346 | |
| | Other accumulated gain/(loss) | | $ | (161,731 | ) | | $ | (1,823,060 | ) | | $ | (33,412,883 | ) | | $ | 228 | |
| | Total accumulated gain/(loss) | | $ | 18,685,138 | | | $ | (941,768 | ) | | $ | (23,584,473 | ) | | $ | 4,300,729 | |
The difference between book-basis and tax-basis unrealized appreciation is attributable primarily to capital loss carry overs, wash sales, and partnership adjustments.
At October 31, 2013, the Funds had capital loss carryforwards that expire as follows:
| | Growth Fund | | $ | 10,518,607 | | 10/31/16 | |
| | | | | 183,155,263 | | 10/31/17 | |
| | Mid Cap 30 Fund | | | 1,481,017 | | 10/31/16 | |
| | Large Growth Fund | | | 3,045,759 | | 10/31/16 | |
| | Value Fund | | | 32,066,745 | | 10/31/17 | |
| | Large Value Fund | | | 12,049,003 | | 10/31/17 | |
| | Total Return Fund | | | 2,084,535 | | 10/31/17 | |
| | Technology Fund | | | 1,757,171 | | 10/31/17 | |
| | Japan Fund | | | 4,786,618 | | 10/31/15 | |
| | | | | 6,231,544 | | 10/31/16 | |
| | | | | 15,450,664 | | 10/31/17 | |
| | | | | 6,121,138 | | 10/31/18 | |
| | | | | 362,390 | | Indefinite ST | |
| | | | | 340,146 | | Indefinite LT | |
At October 31, 2013, the Focus Fund, the Equity and Income Fund, the Balanced Fund, the Core Bond Fund, the Gas Fund, the Small Cap Financial Fund, the Large Cap Financial Fund and the Japan Small Cap Fund had no tax basis capital losses to offset future capital gains.
During the year ended October 31, 2013, the capital loss carry forwards utilized for each Fund were as follows:
| | Growth Fund | | $ | 50,322,514 | | Equity and Income Fund | | $ | 2,832,320 | | |
| | Mid Cap 30 Fund | | $ | 43,512,280 | | Balanced Fund | | $ | 1,233,401 | | |
| | Large Growth Fund | | $ | 1,015,253 | | Small Cap Financial Fund | | $ | 3,656,683 | | |
| | Value Fund | | $ | 11,775,111 | | Large Cap Financial Fund | | $ | 3,634,977 | | |
| | Large Value Fund | | $ | 17,419,429 | | Technology Fund | | $ | 448,592 | | |
| | Total Return Fund | | $ | 4,924,652 | | Japan Fund | | $ | 812,229 | | |
Capital losses sustained in the year ended October 31, 2012 and in future taxable years will not expire and may be carried over by the Fund without limitation; however, they will retain the character of the original loss. Furthermore, any losses incurred during those taxable years will be required to be utilized prior to the losses incurred in the pre-enactment taxable years. As a result of this ordering rule, pre-enactment capital loss carryforwards may be more likely to expire unused. Under pre-enactment law, capital losses could be carried forward for eight years, and carried forward as short-term capital losses, irrespective of the character of the original loss.
At October 31, 2013, the following Funds deferred, on a tax basis, post-December losses of:
| | | Post-December Late Year | | Post-December | |
| | | Ordinary Loss Deferral | | Loss Deferral | |
| | Growth Fund | | $ | (650,206 | ) | | | | — | | |
| | Focus Fund | | $ | (7,643,708 | ) | | | | — | | |
| | Mid Cap 30 Fund | | | — | | | | | — | | |
| | Large Growth Fund | | | — | | | | | — | | |
| | Value Fund | | | — | | | | | — | | |
| | Large Value Fund | | | — | | | | | — | | |
| | Total Return Fund | | | — | | | | | — | | |
| | Equity and Income Fund | | | — | | | | | — | | |
| | Balanced Fund | | | — | | | | | — | | |
| | Core Bond Fund | | | — | | | | | — | | |
| | Gas Fund | | | — | | | | | — | | |
| | Small Cap Financial Fund | | | — | | | | | — | | |
| | Large Cap Financial Fund | | $ | (161,731 | ) | | | | — | | |
| | Technology Fund | | $ | (65,889 | ) | | | | — | | |
| | Japan Fund | | $ | (120,450 | ) | | | | — | | |
| | Japan Small Cap Fund | | $ | — | | | | | — | | |
The tax character of distributions paid during 2013 and 2012 for the Funds were as follows:
| | | | Year Ended | | | | Year Ended | | |
| | Growth Fund | | October 31, 2013 | | | | October 31, 2012 | | |
| | Ordinary Income | | $ | — | | | | $ | — | | |
| | Long-term capital gain | | | — | | | | | — | | |
| | | | $ | — | | | | $ | — | | |
| | | | | | | | | | |
| | | | Year Ended | | | | Year Ended | | |
| | Focus Fund | | October 31, 2013 | | | | October 31, 2012 | | |
| | Ordinary Income | | $ | — | | | | $ | — | | |
| | Long-term capital gain | | | 63,640,872 | | | | | 68,842,192 | | |
| | | | $ | 63,640,872 | | | | $ | 68,842,192 | | |
| | | | | | | | | | |
| | | | Year Ended | | | | Year Ended | | |
| | Mid Cap 30 Fund | | October 31, 2013 | | | | October 31, 2012 | | |
| | Ordinary Income | | $ | 2,325,856 | | | | $ | — | | |
| | Long-term capital gain | | | — | | | | | — | | |
| | | | $ | 2,325,856 | | | | $ | — | | |
| | | | | | | | | | |
| | | | Year Ended | | | | Year Ended | | |
| | Large Growth Fund | | October 31, 2013 | | | | October 31, 2012 | | |
| | Ordinary Income | | $ | 1,080,469 | | | | $ | 559,148 | | |
| | Long-term capital gain | | | 169,387 | | | | | 15,375,965 | | |
| | | | $ | 1,249,856 | | | | $ | 15,935,113 | | |
| | | | | | | | | | |
| | | | Year Ended | | | | Year Ended | | |
| | Value Fund | | October 31, 2013 | | | | October 31, 2012 | | |
| | Ordinary Income | | $ | 3,339,992 | | | | $ | 3,834,285 | | |
| | Long-term capital gain | | | — | | | | | — | | |
| | | | $ | 3,339,992 | | | | $ | 3,834,285 | | |
HENNESSY FUNDS 1-800-966-4354
| | | | Year Ended | | | | Year Ended | | |
| | Large Value Fund | | October 31, 2013 | | | | October 31, 2012 | | |
| | Ordinary Income | | $ | 1,438,863 | | | | $ | 1,007,759 | | |
| | Long-term capital gain | | | — | | | | | — | | |
| | | | $ | 1,438,863 | | | | $ | 1,007,759 | | |
| | | | | | | | | | |
| | | | Year Ended | | | | Year Ended | | |
| | Total Return Fund | | October 31, 2013 | | | | October 31, 2012 | | |
| | Ordinary Income | | $ | 957,145 | | | | $ | 1,013,041 | | |
| | Long-term capital gain | | | — | | | | | — | | |
| | | | $ | 957,145 | | | | $ | 1,013,041 | | |
| | | | | | | | | | |
| | | | Year Ended | | | | Year Ended | | |
| | Equity and Income Fund | | October 31, 2013 | | | | October 31, 2012 | | |
| | Ordinary Income | | $ | 5,000,498 | | | | $ | 3,322,362 | | |
| | Long-term capital gain | | | — | | | | | — | | |
| | | | $ | 5,000,498 | | | | $ | 3,322,362 | | |
| | | | | | | | | | |
| | | | Year Ended | | | | Year Ended | | |
| | Balanced Fund | | October 31, 2013 | | | | October 31, 2012 | | |
| | Ordinary Income | | $ | 22,605 | | | | $ | 81,724 | | |
| | Long-term capital gain | | | 485 | | | | | — | | |
| | | | $ | 23,090 | | | | $ | 81,724 | | |
| | | | | | | | | | |
| | | | Year Ended | | | | Year Ended | | |
| | Core Bond Fund | | October 31, 2013 | | | | October 31, 2012 | | |
| | Ordinary Income | | $ | 846,010 | | | | $ | 1,054,980 | | |
| | Long-term capital gain | | | 368,455 | | | | | 141,198 | | |
| | | | $ | 1,214,465 | | | | $ | 1,196,178 | | |
| | | | | | | | | | |
| | | | Year Ended | | | | Year Ended | | |
| | Gas Fund | | October 31, 2013 | | | | October 31, 2012 | | |
| | Ordinary Income | | $ | 25,896,541 | | | | $ | 18,087,340 | | |
| | Long-term capital gain | | | 14,828,093 | | | | | 1,903,385 | | |
| | | | $ | 40,724,634 | | | | $ | 19,990,725 | | |
| | | | | | | | | | |
| | | | Year Ended | | | | Year Ended | | |
| | Small Cap Financial Fund | | October 31, 2013 | | | | October 31, 2012 | | |
| | Ordinary Income | | $ | 1,639,752 | | | | $ | 3,181,624 | | |
| | Long-term capital gain | | | — | | | | | — | | |
| | | | $ | 1,639,752 | | | | $ | 3,181,624 | | |
| | | | | | | | | | |
| | | | Year Ended | | | | Year Ended | | |
| | Large Cap Financial Fund | | October 31, 2013 | | | | October 31, 2012 | | |
| | Ordinary Income | | $ | 50,837 | | | | $ | — | | |
| | Long-term capital gain | | | — | | | | | — | | |
| | | | $ | 50,837 | | | | $ | — | | |
| | | | | | | | | | |
| | | | Year Ended | | | | Year Ended | | |
| | Technology Fund | | October 31, 2013 | | | | October 31, 2012 | | |
| | Ordinary Income | | $ | — | | | | $ | — | | |
| | Long-term capital gain | | | — | | | | | — | | |
| | | | $ | — | | | | $ | — | | |
| | | | | | | | | | |
| | | | Year Ended | | | | Year Ended | | |
| | Japan Fund | | October 31, 2013 | | | | October 31, 2012 | | |
| | Ordinary Income | | $ | — | | | | $ | — | | |
| | Long-term capital gain | | | — | | | | | — | | |
| | Return of capital | | | 12,867 | | | | | — | | |
| | | | $ | 12,867 | | | | $ | — | | |
| | | | | | | | | | |
| | | | Year Ended | | | | Year Ended | | |
| | Japan Small Cap Fund | | October 31, 2013 | | | | October 31, 2012 | | |
| | Ordinary Income | | $ | — | | | | $ | 99,101 | | |
| | Long-term capital gain | | | 1,115,069 | | | | | — | | |
| | | | $ | 1,115,069 | | | | $ | 99,101 | | |
9). FUND REORGANIZATIONS
On October 25, 2012, the shareholders of the FBR Small Cap Fund, the FBR Mid Cap Fund and the FBR Large Cap Fund approved the agreement and plan of reorganization providing for the transfer of assets and the assumption of liabilities of such funds by each of the Hennessy Cornerstone Growth Fund, the Hennessy Cornerstone Mid Cap 30 Fund and the Hennessy Cornerstone Large Growth Fund, respectively. The reorganization was effective as of the close of business on October 26, 2012. The following tables illustrate the specifics of each Fund’s reorganization:
| | FBR Small Cap | | Shares issued to Shareholders | Hennessy Cornerstone | | |
| | Fund Net Assets | | of FBR Small Cap Fund | Growth Fund Net Assets | Combined Net Assets | Tax Status of Transfer |
| | $34,071,809(1) | | 2,732,499 | $265,131,165 | $299,202,974 | Non-taxable |
| | (1) | Includes accumulated realized losses and unrealized appreciation in the amounts of ($5,680,576) and $1,928,859 respectively. |
| | FBR Mid Cap | | Shares issued to Shareholders | Hennessy Cornerstone | | |
| | Fund Net Assets | | of FBR Mid Cap Fund | Mid Cap 30 Fund Net Assets | Combined Net Assets | Tax Status of Transfer |
| | $16,374,686(1) | | 1,154,875 | $171,822,952 | $188,197,638 | Non-taxable |
| | (1) | Includes accumulated realized losses and unrealized appreciation in the amounts of ($3,572,309) and $2,496,269 respectively. |
| | FBR Large Cap | | Shares issued to Shareholders | Hennessy Cornerstone | | |
| | Fund Net Assets | | of FBR Large Cap Fund | Large Growth Fund Net Assets | Combined Net Assets | Tax Status of Transfer |
| | $33,698,161(1) | | 3,110,613 | $75,963,129 | $109,661,290 | Non-taxable |
| | (1) | Includes accumulated realized losses and unrealized appreciation in the amounts of ($8,751,401) and $4,423,584 respectively. |
Assuming the reorganization had been completed on November 1, 2011, the beginning of the annual reporting period of each of the respective Funds, the pro forma results of operations (unaudited) for the year ended October 31, 2012, would have been as follows:
| | | Hennessy Cornerstone | | Hennessy Cornerstone | | Hennessy Cornerstone | |
| | | Growth Fund | | Mid Cap 30 Fund | | Large Growth Fund | |
| | Net investment income/(loss) | | $ | (1,277,452 | ) | | | $ | 1,183,817 | | | | $ | 1,514,359 | | |
| | Net realized gain/(loss) on investments | | $ | 6,068,686 | | | | $ | 415,390 | | | | $ | 501,406 | | |
| | Change in unrealized appreciation/depreciation on investments | | $ | 46,095,075 | | | | $ | 22,755,030 | | | | $ | 7,914,251 | | |
| | Net increase/(decrease) in net assets resulting from operations | | $ | 50,886,309 | | | | $ | 24,354,237 | | | | $ | 9,930,016 | | |
Because the combined investment portfolios have been managed as a single integrated portfolio since the reorganization was completed, it is not practicable to separate the amounts of revenue and earnings for the respective FBR Funds that have been included in each of the Funds’ statement of operations since October 26, 2012.
10). EVENTS SUBSEQUENT TO YEAR-END
Agreement and Plan of Reorganization
On December 11, 2013, the Board approved an Agreement and Plan of Reorganization (the “Agreement”), of the Hennessy Cornerstone Growth Fund, the Hennessy Cornerstone Mid Cap 30 Fund, the Hennessy Cornerstone Value Fund, the Hennessy Total Return Fund, the Hennessy Balanced Fund, the Hennessy Japan Fund and the Hennessy Japan Small Cap Fund (each a “New Fund” and, collectively, the “New Funds”), each of which will be a successor to the corresponding series of the same name of Hennessy Mutual Funds, Inc. (the Hennessy Cornerstone Growth Fund, the Hennessy Cornerstone Mid Cap 30 Fund and the Hennessy Cornerstone Value Fund), The Hennessy Funds, Inc. (the Hennessy Total Return Fund and the Hennessy Balanced Fund) and Hennessy SPARX Funds Trust (the Hennessy Japan Fund and the Hennessy Japan Small Cap Fund) (each a “Predecessor Fund” and, collectively, the “Predecessor Funds”). The Agreement provides for the transfer of assets of each Predecessor Fund to each respective New Fund and the assumption of the liabilities of each Predecessor Fund by each New Fund. Each New Fund will have the same investment objective and substantially similar principal investment strategies as its corresponding Predecessor Fund. The transaction is expected to close in February 2014.
Capital Gains Distributions
On December 10, 2013, the following capital gains distributions were declared for shareholders of record on December 9, 2013. The distributions were paid on December 10, 2013.
| | Short-term Capital Gains | Rate/Share ($) | | Long-term Capital Gains | Rate/Share ($) | |
| | Large Growth Fund | $0.00147 | | Focus Fund | $1.06512 | |
| | Core Bond Fund | $0.01968 | | Mid Cap 30 Fund | $1.29175 | |
| | Gas Fund | $0.21812 | | Large Growth Fund | $0.67490 | |
| | Small Cap Financial Fund | $0.16499 | | Equity and Income Fund | $0.49682 | |
| | Japan Small Cap Fund | $1.75115 | | Balanced Fund | $0.44207 | |
| | | | | Core Bond Fund | $1.85995 | |
| | | | | Gas Fund | $0.38497 | |
| | | | | Small Cap Financial Fund | $1.43869 | |
| | | | | Large Cap Financial Fund | $0.57670 | |
| | | | | Japan Small Cap Fund | $0.76336 | |
HENNESSY FUNDS 1-800-966-4354
Report of Independent Registered Public Accounting Firm
The Shareholders and Board of Directors/Trustees of
Hennessy Mutual Funds, Inc., The Hennessy Funds, Inc.,
Hennessy Funds Trust, and Hennessy SPARX Funds Trust:
We have audited the accompanying statements of assets and liabilities of the Hennessy Cornerstone Growth Fund, Hennessy Cornerstone Mid Cap 30 Fund, Hennessy Cornerstone Large Growth Fund, Hennessy Cornerstone Value Fund, Hennessy Large Value Fund, Hennessy Total Return Fund, Hennessy Balanced Fund, Hennessy Japan Fund, and Hennessy Japan Small Cap Fund (the Funds), including the schedules of investments, as of October 31, 2013, and the related statements of operations for the year then ended, the statements of changes in net assets for each of the years in the two-year period then ended, statement of cash flows for the year then ended for the Hennessy Total Return Fund, and the financial highlights for each of the years or periods presented in the five-year period then ended (each of the years in the four-year period ended October 31, 2013, month ended October 31, 2009, and year ended September 30, 2009 for Hennessy Cornerstone Large Growth Fund and Hennessy Large Value Fund). These financial statements and financial highlights are the responsibility of management. Our responsibility is to express an opinion on these financial statements and financial highlights based on our audits.
We conducted our audits in accordance with generally accepted auditing standards as established by the Auditing Standards Board (United States) and in accordance with the auditing standards of the Public Company Accounting Oversight Board (United States). Those standards require that we plan and perform the audit to obtain reasonable assurance about whether the financial statements are free of material misstatement. An audit includes examining, on a test basis, evidence supporting the amounts and disclosures in the financial statements. Our procedures included confirmation of securities owned as of October 31, 2013, by correspondence with custodians or brokers, or by other appropriate auditing procedures. An audit also includes assessing the accounting principles used and significant estimates made by management, as well as evaluating the overall financial statement presentation. We believe that our audits provide a reasonable basis for our opinion.
In our opinion, the financial statements and financial highlights referred to above present fairly, in all material respects, the financial position of the Hennessy Cornerstone Growth Fund, Hennessy Cornerstone Mid Cap 30 Fund, Hennessy Cornerstone Large Growth Fund, Hennessy Cornerstone Value Fund, Hennessy Large Value Fund, Hennessy Total Return Fund, Hennessy Balanced Fund, Hennessy Japan Fund, and Hennessy Japan Small Cap Fund as of October 31, 2013, and the results of their operations, changes in their net assets, cash flows of the Hennessy Total Return Fund, and the financial highlights for each of the years or periods described in the first paragraph above, in conformity with U.S. generally accepted accounting principles.
December 30, 2013
Milwaukee, Wisconsin
Report of Independent Registered Public Accounting Firm
To the Board of Trustees and Shareholders
Hennessy Funds Trust
Novato, CA
We have audited the accompanying statements of assets and liabilities, including the schedules of investments, of the Hennessy Focus Fund, Hennessy Equity and Income Fund, Hennessy Core Bond Fund, Hennessy Gas Utility Index Fund, Hennessy Small Cap Financial Fund, Hennessy Large Cap Financial Fund, and Hennessy Technology Fund (the “Funds”), each a series of Hennessy Funds Trust as of October 31, 2013, and the related statements of operations for the year then ended, the statements of changes in net assets for each of the two years in the period then ended and the financial highlights for each of the five years in the period then ended, except for the Hennessy Equity and Income Fund and the Hennessy Core Bond Fund which includes the statements of operations for the year then ended, statements of changes in net assets for each of the two years in the period then ended and financial highlights for each of the three years in the period then ended, and the financial highlights for the seven month period ended October 31, 2010 and the year ended March 31, 2010. With respect to the Hennessy Equity and Income Fund and Hennessy Core Bond Fund, the financial highlights for the year ended March 31, 2009 have been audited by other auditors, whose reports dated May 27, 2009 expressed unqualified opinions on such financial highlights. These financial statements and financial highlights are the responsibility of the Funds’ management. Our responsibility is to express an opinion on these financial statements and financial highlights based on our audits.
We conducted our audits in accordance with standards of the Public Company Accounting Oversight Board (United States). Those standards require that we plan and perform the audits to obtain reasonable assurance about whether the financial statements and financial highlights are free of material misstatement. The Funds are not required to have, nor were we engaged to perform, an audit of the Funds’ internal control over financial reporting. Our audits included consideration of internal control over financial reporting as a basis for designing audit procedures that are appropriate in the circumstances, but not for the purposes of expressing an opinion on the effectiveness of the Funds’ internal control over financial reporting. Accordingly, we express no such opinion. An audit includes examining, on a test basis, evidence supporting the amounts and disclosures in the financial statements. Our procedures included confirmation of securities owned as of October 31, 2013, by correspondence with the custodian and brokers or by other appropriate auditing procedures where replies from brokers were not received . An audit also includes assessing the accounting principles used and significant estimates made by management, as well as evaluating the overall financial statement presentation. We believe that our audits provide a reasonable basis for our opinion.
In our opinion, the financial statements and financial highlights referred to above present fairly, in all material respects, the financial position of the Hennessy Focus Fund, Hennessy Equity and Income Fund, Hennessy Core Bond Fund, Hennessy Gas Utility Index Fund, Hennessy Small Cap Financial Fund, Hennessy Large Cap Financial Fund, and Hennessy Technology Fund, as of October 31, 2013, the results of their operations, the changes in their net assets, and the financial highlights for the periods referred to above in conformity with accounting principles generally accepted in the United States of America.
Philadelphia, Pennsylvania
December 23, 2013
HENNESSY FUNDS 1-800-966-4354
Directors/Trustees and Officers of the Funds (Unaudited)
The business and affairs of the Funds are managed under the direction of the Funds’ Board of Directors/Trustees. Information pertaining to the Directors and Officers of the Funds is set forth below. The Funds’ Statement of Additional Information includes additional information about the Funds’ Directors/Trustees and Officers and is available, without charge, upon request by calling 1-800-966-4354.
| | | | | Number of | |
| | | | | Portfolios | Other |
| | | | | in the Fund | Directorships |
| | Position(s) | Term of Office | | Complex | (During Past |
| | Held with | and Length of | Principal Occupation(s) | Overseen | 5 Years) Held |
| Name, Address, and Age | the Fund | Time Served | During Past 5 Years | by Trustee | by Trustee |
| Disinterested Trustees (as defined below) | | | | |
| J. Dennis DeSousa | Trustee | Indefinite, until | Mr. DeSousa is a real estate investor. | 16 | None. |
| Age: 77 | | successor elected | | | |
| Address: | | | | | |
| c/o Hennessy Advisors, Inc. | | Served since January 1996 | | | |
| 7250 Redwood Blvd. | | HMFI and HFI; since July | | | |
| Suite 200 | | 2005 HFT; and since | | | |
| Novato, CA 94945 | | September 2009 HSFT | | | |
| | | | | | |
| Robert T. Doyle | Trustee | Indefinite, until | Mr. Doyle has been the Sheriff of | 16 | None. |
| Age: 66 | | successor elected | Marin County, California since 1996. | | |
| Address: | | | | | |
| c/o Hennessy Advisors, Inc. | | Served since January 1996 | | | |
| 7250 Redwood Blvd. | | HMFI and HFI; since July | | | |
| Suite 200 | | 2005 HFT; and since | | | |
| Novato, CA 94945 | | September 2009 HSFT | | | |
| | | | | | |
| Gerald P. Richardson | Trustee | Indefinite, until | Mr. Richardson is an independent | 16 | None. |
| Age: 68 | | successor elected | consultant in the securities industry. | | |
| Address: | | | | | |
| c/o Hennessy Advisors, Inc. | | Served since May 2004 | | | |
| 7250 Redwood Blvd. | | HMFI and HFI; since July | | | |
| Suite 200 | | 2005 HFT; and since | | | |
| Novato, CA 94945 | | September 2009 HSFT | | | |
| | | | | | |
| “Interested Persons” (as defined in the 1940 Act) | | | | |
Neil J. Hennessy(1) | Trustee, | Trustee: | Mr. Hennessy has been employed by | 16 | Director of |
| Age: 57 | President, Chief | Indefinite, until | Hennessy Advisors, Inc., the Funds’ | | Hennessy |
| Address: | Investment | successor elected | investment advisor, since 1989. He | | Advisors, Inc. |
| c/o Hennessy Advisors, Inc. | Officer, Portfolio | | currently serves as President, Chairman | | |
| 7250 Redwood Blvd. | Manager and | Served since January 1996 | and Chief Executive Officer of | | |
| Suite 200 | Chairman of | HMFI and HFI; since July | Hennessy Advisors, Inc. | | |
| Novato, CA 94945 | the Board | 2005 HFT; and since | | | |
| | | September 2009 HSFT | | | |
| | | | | | |
| | | Officer: | | | |
| | | 1 year term | | | |
| | | | | | |
| | | Served since June 2008 | | | |
| | | HMFI, HFI and HFT; and | | | |
| | | since September 2009 HSFT | | | |
| | | | | | |
| Jennifer L. Cheskiewicz | Senior Vice | 1 year term | Ms. Cheskiewicz has been employed by | N/A | N/A |
| Age: 36 | President and | | Hennessy Advisors, Inc., the Funds’ | | |
| Address: | Chief Compliance | Since June 2013 | investment advisor, since June 2013. She | | |
| c/o Hennessy Advisors, Inc. | Officer | HMFI, HFI, HFT and HSFT | served as in-house counsel to Carlson | | |
| 7250 Redwood Blvd. | | | Capital, L.P., an SEC-registered investment | | |
| Suite 200 | | | advisor to several private funds from | | |
| Novato, CA 94945 | | | February 2010 to May 2013. Prior to that, | | |
| | | | she was an attorney with Gibson, Dunn & | | |
| | | | Crutcher LLP from September 2005 through | | |
| | | | February 2010. She currently serves as | | |
| | | | General Counsel of Hennessy Advisors, Inc. | | |
(1) All Officers of the Hennessy Funds and employees of the Manager are Interested Persons of the Fund.
| | | | | Number of | |
| | | | | Portfolios | Other |
| | | | | in the Fund | Directorships |
| | Position(s) | Term of Office | | Complex | (During Past |
| | Held with | and Length of | Principal Occupation(s) | Overseen | 5 Years) Held |
| Name, Address, and Age | the Fund | Time Served | During Past 5 Years | by Trustee | by Trustee |
| Interested Persons | | | | | |
Teresa M. Nilsen(1) | Executive | 1 year term | Ms. Nilsen has been employed by Hennessy | N/A | N/A |
| Age: 47 | Vice President | | Advisors, Inc., the Funds’ investment advisor, | | |
| Address: | and Treasurer | Since January 1996 | since 1989. She currently serves as Executive | | |
| c/o Hennessy Advisors, Inc. | | HMFI and HFI; since July | Vice President, Chief Operations Officer, | | |
| 7250 Redwood Blvd. | | 2005 HFT; and since | Chief Financial Officer and Secretary of | | |
| Suite 200 | | September 2009 HSFT | Hennessy Advisors, Inc. | | |
| Novato, CA 94945 | | | | | |
| | | | | | |
Daniel B. Steadman(1) | Executive | 1 year term | Mr. Steadman has been employed by | N/A | N/A |
| Age: 57 | Vice President | | Hennessy Advisors, Inc., the Funds’ | | |
| Address: | and Secretary | Since March 2000 | investment advisor, since 2000. He | | |
| c/o Hennessy Advisors, Inc. | | HMFI and HFI; since | currently serves as Executive Vice President | | |
| 7250 Redwood Blvd. | | July 2005 HFT; and since | and Chief Compliance Officer of Hennessy | | |
| Suite 200 | | September 2009 HSFT | Advisors, Inc. | | |
| Novato, CA 94945 | | | | | |
| | | | | | |
Brian Carlson(1) | Senior Vice | 1 year term | Mr. Carlson has been employed by Hennessy | N/A | N/A |
| Age: 41 | President and | | Advisors, Inc., the Funds’ investment advisor, | | |
| c/o Hennessy Advisors, Inc. | Head of | Since December 2013 | since December 2013. | | |
| 7250 Redwood Blvd. | Distribution | | | | |
| Suite 200 | | | Mr. Carlson was previously a co-founder and | | |
| Novato, CA 94945 | | | principal of Trivium Consultants, LLC from | | |
| | | | February 2011 through November 2013. | | |
| | | | Prior to that, he was the Senior Managing | | |
| | | | Director of NRP Financial, Inc. from | | |
| | | | August 2007 through February 2011. | | |
| | | | | | |
David Ellison(1) | Senior | 1 year term | Mr. Ellison has served as Portfolio Manager | N/A | N/A |
| Age: 55 | Vice President & | | of the Hennessy Large Cap Financial Fund | | |
| Address: | Chief Investment | Since October 2012 | (formerly the FBR Large Cap Financial Fund), | | |
| 100 Federal Street | Officer | | the Hennessy Small Cap Financial Fund | | |
| 29th Floor | | | (formerly the FBR Small Cap Financial Fund), | | |
| Boston, MA 02110 | | | and the Hennessy Technology Fund (formerly | | |
| | | | the FBR Technology Fund) since inception. | | |
| | | | | | |
| | | | Mr. Ellison previously served as Director, CIO | | |
| | | | & President of FBR Advisers, Inc. from | | |
| | | | December 1999 to October 2012. | | |
| | | | | | |
Brian Peery(1) | Vice President | 1 year term | Mr. Peery has been employed by Hennessy | N/A | N/A |
| Age: 44 | and Co-Portfolio | | Advisors, Inc., the Funds’ investment advisor, | | |
| Address: | Manager | As Vice President, since | since 2002. | | |
| c/o Hennessy Advisors, Inc. | | March 2003 HMFI and HFI; | | | |
| 7250 Redwood Blvd. | | since July 2005 HFT; and | | | |
| Suite 200 | | since September 2009 HSFT | | | |
| Novato, CA 94945 | | | | | |
| | | As Co-Portfolio Manager, | | | |
| | | since February 2011 | | | |
| | | HMFI, HFI, HFT and HSFT | | | |
| | | | | | |
Winsor (Skip) Aylesworth(1) | Vice President & | 1 year term | Mr. Aylesworth has been Portfolio Manager | N/A | N/A |
| Age: 65 | Portfolio Manager | | of the Hennessy Gas Utility Index Fund | | |
| Address: | | Since October 2012 | (formerly the FBR Gas Utility Index Fund) | | |
| 100 Federal Street | | | since 1998 and Portfolio Manager of the | | |
| 29th Floor | | | Hennessy Technology Fund (formerly the | | |
| Boston, MA 02110 | | | FBR Technology Fund) since inception. | | |
| | | | | | |
| | | | Mr. Aylesworth previously served as | | |
| | | | Executive Vice President of the FBR Funds | | |
| | | | from 1999 to October 2012. | | |
(1) All Officers of the Hennessy Funds and employees of the Manager are Interested Persons of the Fund.
HENNESSY FUNDS 1-800-966-4354
| | | | | Number of | |
| | | | | Portfolios | Other |
| | | | | in the Fund | Directorships |
| | Position(s) | Term of Office | | Complex | (During Past |
| | Held with | and Length of | Principal Occupation(s) | Overseen | 5 Years) Held |
| Name, Address, and Age | the Fund | Time Served | During Past 5 Years | by Trustee | by Trustee |
Ryan Kelley(1) | Vice President | 1 year term | Mr. Kelley has been Co-Portfolio Manager of | N/A | N/A |
| Age: 41 | and Co-Portfolio | | the Hennessy Gas Utility Index Fund (formerly | | |
| Address: | Manager | Since March 2013 | the FBR Gas Utility Index Fund), Hennessy | | |
| c/o Hennessy Advisors, Inc. | | | Small Cap Financial Fund (formerly the FBR | | |
| 100 Federal Street | | | Small Cap Financial Fund), and the Hennessy | | |
| 29th Floor | | | Large Cap Financial Fund (formerly the FBR | | |
| Boston, MA 02110 | | | Large Cap Financial Fund) since March 2013. | | |
| | | | Prior to that, he was a Portfolio Analyst of the | | |
| | | | Hennessy Funds. | | |
| | | | | | |
| | | | Mr. Kelley previously served as Portfolio | | |
| | | | Manager of the FBR Funds from | | |
| | | | January 2008 to October 2012. | | |
(1) All Officers of the Hennessy Funds and employees of the Manager are Interested Persons of the Fund.
Expense Example (Unaudited)
October 31, 2013
As a shareholder of the Funds, you incur two types of costs: (1) transaction costs, including sales charges (loads) on purchase payments, reinvested dividends, or other distributions; redemption fees; and exchange fees; and (2) ongoing costs, including management fees; service fees; and other Fund expenses. This Example is intended to help you understand your ongoing costs (in dollars) of investing in each of the Funds and to compare these costs with the ongoing costs of investing in other mutual funds. The Example is based on an investment of $1,000 invested at the beginning of the period and held for the entire period from May 1, 2013 through October 31, 2013.
Actual Expenses
The first set of lines of the table below provide information about actual account values and actual expenses. Although the Funds charge no sales loads or transaction fees, you will be assessed fees for outgoing wire transfers, returned checks and stop payment orders at prevailing rates charged by U.S. Bancorp Fund Services, LLC, the Funds’ transfer agent. If you request that a redemption be made by wire transfer, currently a $15.00 fee is charged by the Funds’ transfer agent. IRA accounts will be charged a $15.00 annual maintenance fee. The example below includes, but is not limited to, management fees, shareholder servicing fees, fund accounting, custody and transfer agent fees. However, the example below does not include portfolio trading commissions and related expenses, and other extraordinary expenses as determined under generally accepted accounting principles. You may use the information within these lines, together with the amount you invested, to estimate the expenses that you paid over the six-month period. Simply divide your account value by $1,000 (for example, an $8,600 account value divided by $1,000 = 8.6), then multiply the result by the number in the first line under the heading entitled “Expenses Paid During Period” to estimate the expenses you paid on your account during this period.
Hypothetical Example for Comparison Purposes
The second set of lines within the table below provide information about hypothetical account values and hypothetical expenses based on the Funds’ actual expense ratios and an assumed rate of return of 5% per year before expenses, which is not the Funds’ actual return. The hypothetical account values and expenses may not be used to estimate the actual ending account balance or expenses you paid for the period. You may use this information to compare the ongoing costs of investing in the Funds and other funds. To do so, compare this 5% hypothetical example with the 5% hypothetical examples that appear in the shareholder reports of the other funds. Please note that the expenses shown in the table are meant to highlight your ongoing costs only and do not reflect any transactional costs, such as sales charges (loads), or exchange fees. Therefore, the second line of the table is useful in comparing ongoing costs only, and will not help you determine the relative total costs of owning different funds. In addition, if these transactional costs were included, your costs would have been higher.
HENNESSY FUNDS 1-800-966-4354
| | Beginning | Ending | Expenses Paid |
| | Account Value | Account Value | During Period(1) |
| Investor Class | 5/1/13 | 10/31/13 | 5/1/13 – 10/31/13 |
| | | | |
| Actual | | | |
| Growth Fund – Investor Class | $1,000.00 | $1,130.80 | $ 6.93 |
| Focus Fund – Investor Class | $1,000.00 | $1,126.30 | $ 7.77 |
| Mid Cap 30 Fund – Investor Class | $1,000.00 | $1,062.60 | $ 6.81 |
| Large Growth Fund – Investor Class | $1,000.00 | $1,140.50 | $ 6.42 |
| Value Fund – Investor Class | $1,000.00 | $1,084.00 | $ 6.30 |
| Large Value Fund – Investor Class | $1,000.00 | $1,089.80 | $ 7.01 |
| Total Return Fund – Investor Class | $1,000.00 | $1,028.50 | $ 6.44 |
| Equity and Income Fund – Investor Class | $1,000.00 | $1,044.10 | $ 6.85 |
| Balanced Fund – Investor Class | $1,000.00 | $1,016.50 | $ 9.05 |
| Core Bond Fund – Investor Class | $1,000.00 | $ 990.40 | $ 6.52 |
| Gas Fund – Investor Class | $1,000.00 | $1,032.10 | $ 4.25 |
| Small Cap Financial Fund – Investor Class | $1,000.00 | $1,152.50 | $ 8.03 |
| Large Cap Financial Fund – Investor Class | $1,000.00 | $1,148.60 | $ 8.39 |
| Technology Fund – Investor Class | $1,000.00 | $1,168.80 | $10.66 |
| Japan Fund – Investor Class | $1,000.00 | $1,067.80 | $ 9.64 |
| Japan Small Cap Fund – Investor Class | $1,000.00 | $1,033.60 | $11.99 |
| | | | |
| Hypothetical (5% return before expenses) | | | |
| Growth Fund – Investor Class | $1,000.00 | $1,018.70 | $ 6.56 |
| Focus Fund – Investor Class | $1,000.00 | $1,017.90 | $ 7.37 |
| Mid Cap 30 Fund – Investor Class | $1,000.00 | $1,018.60 | $ 6.67 |
| Large Growth Fund – Investor Class | $1,000.00 | $1,019.21 | $ 6.06 |
| Value Fund – Investor Class | $1,000.00 | $1,019.16 | $ 6.11 |
| Large Value Fund – Investor Class | $1,000.00 | $1,018.50 | $ 6.77 |
| Total Return Fund – Investor Class | $1,000.00 | $1,018.85 | $ 6.41 |
| Equity and Income Fund – Investor Class | $1,000.00 | $1,018.50 | $ 6.77 |
| Balanced Fund – Investor Class | $1,000.00 | $1,016.23 | $ 9.05 |
| Core Bond Fund – Investor Class | $1,000.00 | $1,018.65 | $ 6.61 |
| Gas Fund – Investor Class | $1,000.00 | $1,021.02 | $ 4.23 |
| Small Cap Financial Fund – Investor Class | $1,000.00 | $1,017.74 | $ 7.53 |
| Large Cap Financial Fund – Investor Class | $1,000.00 | $1,017.39 | $ 7.88 |
| Technology Fund – Investor Class | $1,000.00 | $1,015.38 | $ 9.91 |
| Japan Fund – Investor Class | $1,000.00 | $1,015.88 | $ 9.40 |
| Japan Small Cap Fund – Investor Class | $1,000.00 | $1,013.41 | $11.88 |
| (1) | Expenses are equal to the Growth Fund’s expense ratio of 1.29%, the Focus Fund’s expense ratio of 1.45%, the Mid Cap 30 Fund’s expense ratio of 1.31%, the Large Growth Fund’s expense ratio of 1.19%, the Value Fund’s expense ratio of 1.20%, the Large Value Fund’s expense ratio of 1.33%, the Total Return Fund’s expense ratio of 1.26%, the Equity and Income Fund’s expense ratio of 1.33%, the Balanced Fund’s expense ratio of 1.78%, the Core Bond Fund’s Expense ratio of 1.30%, the Gas Fund’s expense ratio of 0.83%, the Small Cap Financial Fund’s expense ratio of 1.48%, the Large Cap Financial Fund’s expense ratio of 1.55%, the Technology Fund’s expense ratio of 1.95%, the Japan Fund’s expense ratio of 1.85%, and the Japan Small Cap Fund’s expense ratio of 2.34% multiplied by the average account value over the period, multiplied by 184/365 days (to reflect one-half year period). |
| | Beginning | Ending | Expenses Paid |
| | Account Value | Account Value | During Period(2) |
| Institutional Class | 5/1/13 | 10/31/13 | 5/1/13 – 10/31/13 |
| | | | |
| Actual | | | |
| Growth Fund – Institutional Class | $1,000.00 | $1,132.10 | $ 5.27 |
| Focus Fund – Institutional Class Class | $1,000.00 | $1,128.20 | $ 6.06 |
| Mid Cap 30 Fund – Institutional Class | $1,000.00 | $1,064.70 | $ 5.10 |
| Large Growth Fund – Institutional Class | $1,000.00 | $1,141.90 | $ 5.29 |
| Value Fund – Institutional Class | $1,000.00 | $1,085.30 | $ 5.15 |
| Large Value Fund – Institutional Class | $1,000.00 | $1,091.70 | $ 5.17 |
| Equity and Income Fund – Institutional Class | $1,000.00 | $1,045.50 | $ 5.62 |
| Core Bond Fund – Institutional Class | $1,000.00 | $ 992.40 | $ 5.27 |
| Small Cap Financial Fund – Institutional Class | $1,000.00 | $1,154.80 | $ 6.25 |
| Technology Fund – Institutional Class | $1,000.00 | $1,170.20 | $ 9.30 |
| Japan Fund – Institutional Class | $1,000.00 | $1,069.60 | $ 8.14 |
| | | | |
| Hypothetical (5% return before expenses) | | | |
| Growth Fund – Institutional Class | $1,000.00 | $1,020.27 | $ 4.99 |
| Focus Fund – Institutional Class Class | $1,000.00 | $1,019.51 | $ 5.75 |
| Mid Cap 30 Fund – Institutional Class | $1,000.00 | $1,020.27 | $ 4.99 |
| Large Growth Fund – Institutional Class | $1,000.00 | $1,020.27 | $ 4.99 |
| Value Fund – Institutional Class | $1,000.00 | $1,020.27 | $ 4.99 |
| Large Value Fund – Institutional Class | $1,000.00 | $1,020.27 | $ 4.99 |
| Equity and Income Fund – Institutional Class | $1,000.00 | $1,019.71 | $ 5.55 |
| Core Bond Fund – Institutional Class | $1,000.00 | $1,019.91 | $ 5.35 |
| Small Cap Financial Fund – Institutional Class | $1,000.00 | $1,019.41 | $ 5.85 |
| Technology Fund – Institutional Class | $1,000.00 | $1,016.64 | $ 8.64 |
| Japan Fund – Institutional Class | $1,000.00 | $1,017.34 | $ 7.93 |
| (2) | Expenses are equal to the Growth Fund’s expense ratio of 0.98%, the Focus Fund’s expense ratio of 1.13%, the Mid Cap 30 Fund’s expense ratio of 0.98%, the Large Growth Fund’s expense ratio of 0.98%, the Value Fund’s expense ratio of 0.98%, the Large Value Fund’s expense ratio of 0.98%, the Equity and Income Fund’s expense ratio of 1.09%, the Core Bond Fund’s expense ratio of 1.05%, the Small Cap Financial Fund’s expense ratio of 1.15%, the Technology Fund’s expense ratio of 1.70%, and the Japan Fund’s expense ratio of 1.56%, multiplied by the average account value over the period, multiplied by 184/365 days (to reflect one-half year period). |
HENNESSY FUNDS 1-800-966-4354
How to Obtain a Copy of the Funds’ Proxy Voting Policy and Proxy Voting Records
A description of the policies and procedures that the Funds use to determine how to vote proxies relating to portfolio securities is available without charge: (1) by calling 1-800-966-4354; (2) on the Hennessy Funds website at hennessyfunds.com; or (3) on the U.S. Securities and Exchange Commission’s website at www.sec.gov. Hennessy Funds’ proxy voting record is available on the SEC’s website at www.sec.gov no later than August 31 for the prior 12 months ending June 30.
Quarterly Filings on Form N-Q
The Funds file their complete schedule of portfolio holdings with the SEC for the first and third quarters of each fiscal year on Form N-Q. The Funds’ Form N-Q will be available on the SEC’s website at www.sec.gov. The Funds’ Form N-Q may be reviewed and copied at the SEC’s Public Reference Room in Washington, DC and information on the operation of the Public Reference Room may be obtained by calling 1-800-SEC-0330. Information included in the Funds’ N-Q will also be available upon request by calling 1-800-966-4354.
Federal Tax Distribution Information (Unaudited)
For the fiscal year ended October 31, 2013, certain dividends paid by the Funds may be subject to a maximum tax rate of 15%, as provided for by the Jobs and Growth Tax Relief Reconciliation Act of 2003.
The percentage of dividends declared from ordinary income designated as qualified dividend income was as follows:
| | Growth Fund | 0.00% | |
| | Focus Fund | 0.00% | |
| | Mid Cap 30 Fund | 100.00% | |
| | Large Growth Fund | 100.00% | |
| | Value Fund | 100.00% | |
| | Large Value Fund | 100.00% | |
| | Total Return Fund | 100.00% | |
| | Equity and Income Fund | 99.15% | |
| | Balanced Fund | 100.00% | |
| | Core Bond Fund | 11.09% | |
| | Gas Fund | 96.62% | |
| | Small Cap Financial Fund | 95.82% | |
| | Large Cap Financial Fund | 100.00% | |
| | Technology Fund | 0.00% | |
| | Japan Fund | 0.00% | |
| | Japan Small Cap Fund | 0.00% | |
For corporate shareholders, the percent of ordinary income distributions qualifying for the corporate dividends received deduction for the fiscal year ended October 31, 2013, was as follows:
| | Growth Fund | 0.00% | |
| | Focus Fund | 0.00% | |
| | Mid Cap 30 Fund | 100.00% | |
| | Large Growth Fund | 100.00% | |
| | Value Fund | 100.00% | |
| | Large Value Fund | 100.00% | |
| | Total Return Fund | 100.00% | |
| | Equity and Income Fund | 99.15% | |
| | Balanced Fund | 100.00% | |
| | Core Bond Fund | 10.99% | |
| | Gas Fund | 81.42% | |
| | Small Cap Financial Fund | 91.25% | |
| | Large Cap Financial Fund | 100.00% | |
| | Technology Fund | 0.00% | |
| | Japan Fund | 0.00% | |
| | Japan Small Cap Fund | 0.00% | |
The percentage of taxable ordinary income distributions that are designated as short-term capital gain distributions under Internal Revenue Section 871(k)(2)(C) for each Fund were as follows:
| | Growth Fund | 0.00% | |
| | Focus Fund | 0.00% | |
| | Mid Cap 30 Fund | 0.00% | |
| | Large Growth Fund | 0.00% | |
| | Value Fund | 0.00% | |
| | Large Value Fund | 0.00% | |
| | Total Return Fund | 0.00% | |
| | Equity and Income Fund | 0.00% | |
| | Balanced Fund | 0.00% | |
| | Core Bond Fund | 45.46% | |
| | Gas Fund | 12.43% | |
| | Small Cap Financial Fund | 0.00% | |
| | Large Cap Financial Fund | 0.00% | |
| | Technology Fund | 0.00% | |
| | Japan Fund | 0.00% | |
| | Japan Small Cap Fund | 0.00% | |
Householding
To help keep the Funds’ costs as low as possible, we generally deliver a single copy of most financial reports and prospectuses to shareholders who share an address, even if the accounts are registered under different names. This process, known as “householding,” does not apply to account statements. You may, of course, request an individual copy of a prospectus or financial report at any time. If you would like to receive separate mailings, please call the Administrator at 1-800-261-6950 or 1-414-765-4124 and we will begin individual delivery within 30 days of your request. If your account is held through a financial institution or other intermediary, please contact them directly to request individual delivery.
HENNESSY FUNDS 1-800-966-4354
Privacy Policy
We collect the following non-public personal information about you:
| | • | information we receive from you on or in applications or other forms, correspondence, or conversations, including, but not limited to, your name, address, phone number, social security number, assets, income and date of birth; |
| | | and |
| | • | information about your transactions with us, our affiliates, or others, including, but not limited to, your account number and balance, payment history, parties to transactions, cost basis information and other financial information. |
We do not disclose any non-public personal information about our current or former shareholders to nonaffiliated third parties, except as permitted by law. For example, we are permitted by law to disclose all of the information we collect, as described above, to our Transfer Agent to process your transactions. Furthermore, we restrict access to your non-public personal information to those persons who require such information to provide products or services to you. We maintain physical, electronic and procedural safeguards that comply with federal standards to guard your non-public personal information.
In the event that you hold shares of the Fund through a financial intermediary, including, but not limited to, a broker-dealer, bank or trust company, the privacy policy of your financial intermediary would govern how your non-public personal information would be shared with nonaffiliated third parties.
Board Approval of Continuation of Investment Sub-Advisory Agreements
At its meeting on September 4, 2013, the Board unanimously approved the continuation of the investment sub-advisory agreements of the following funds (for purposes of this section only, each a “Fund” and, collectively, the “Funds”):
| | • | Hennessy Focus Fund; sub-advised by Broad Run Investment Management (“Broad Run”); |
| | • | Hennessy Equity and Income Fund; sub-advised by The London Company (“TLC”) and FCI Advisors (“FCI”); and |
| | • | Hennessy Core Bond Fund; sub-advised by FCI. |
The Board noted that each of the sub-advisors of the Funds perform certain services. In assessing these services the Board considered that Hennessy Advisors, Inc., as the investment advisor to the Funds, oversees the activities of the sub-advisors, including oversight of the sub-advisors’ compliance with each applicable investment sub-advisory agreement, adherence to each applicable Fund’s investment objective, investment strategy and investment restrictions, and compliance with applicable regulatory requirements, with the aim of mitigating regulatory and litigation risks for the Funds. The Board then considered that each of the sub-advisors act as portfolio managers to each applicable fund, managing the composition of the portfolio of such fund, including the purchase, retention and disposition thereof, in accordance with its investment objectives, policies and restrictions. The Board also considered information such as the following with regard to the sub-advisors:
Broad Run:
| | • | Assets under management are $781 million. |
| | • | Broad Run conducts rigorous fundamental research on investment prospects relying on numerous inputs including, but not limited to, company SEC filings, annual reports, company investor presentations, company websites, brokerage research, management meetings, trade shows, trade publications, data services, financial publications, investment newsletters/websites, competitor/customer cold calls and buy-side interviews. |
| | • | Broad Run selects its approved broker dealers based on research capabilities, trading and execution capabilities, financial stability, service levels and commission rate. |
| | • | Broad Run currently charges 29 bps on the assets managed for the Focus Fund. |
TLC:
| | • | Assets under management are $6.7 billion. |
| | • | TLC utilizes a differentiated conservative investment process focused on bottom up, fundamental analysis, utilizing a proprietary balance sheet optimization model and following a strict sell discipline. TLC primarily seeks the following characteristics through a screening process: high return on capital, consistent free cash flow generation, predictability and stability and conservative valuations. |
| | • | Broker dealers must be added to TLC’s internal “approved list” before TLC can begin trading with them. Prior to adding a broker dealer to the “approved list,” the broker dealer must first be vetted and have its recent financials reviewed by a principal. Broker dealers are reviewed at least quarterly by the Best Execution Committee for execution, anonymity, liquidity discovery, back office capacity and other factors. |
| | • | TLC currently charges 33 bps on the assets managed for the Equity and Income Fund. |
FCI:
| | • | Assets under management are $4.9 billion. |
| | • | FCI’s investment process includes looking at the duration of securities to determine which positions it believes will deliver the highest return potential to the portfolio. |
| | • | FCI selects brokers and dealers based on the full range and quality of the broker’s or dealer’s services. |
| | • | FCI has a quoted rate of 27 bps on assets managed for the Core Bond Fund and the Equity and Income Fund but has agreed to a temporary fee reduction to 15 bps for the Core Bond Fund, which expires on October 31, 2013. |
The Board also: (i) compared the performance of each Fund to benchmark indices over various periods of time and concluded that the performance of each Fund warranted the continuation of the sub-advisory agreements for the Funds; (ii) compared the expense ratios of funds similar in asset size and investment objective to each of the Funds and concluded the actual expenses of each Fund were reasonable and warranted continuation of the sub-advisory agreements for the Funds ; (iii) considered the fees charged by each sub-advisor to other accounts similar in asset size and investment objective to each of the Funds and concluded the sub-advisory fees of each Fund were reasonable and warranted continuation of the sub-advisory agreements for the Funds; (iv) considered the profitability of the Sub-Advisors with respect to the Sub-Advised Funds and concluded the profits were reasonable and not excessive when compared to profitability guidelines set forth in relevant court cases; and (v) considered the high level of professionalism and knowledge of each Sub-Advisor.
The Board reviewed the Funds’ expense ratios and comparable expense ratios for funds similar to the Funds. The Board used data from Morningstar as presented in the charts in the materials provided in advance to the Board showing funds similar in nature to the Funds (e.g., US OE Moderate Allocation and US OE Intermediate Term Bond). The Board determined that the expense ratios of the Funds fall within the range of the ratios of other funds in their classification. The Board also referenced each sub-advisor’s Form ADV, each sub-advisor’s Code of Ethics and copies of the current sub-advisory agreement with each sub advisor. The factors were viewed in their totality by the Board, with no single factor being the principal or determinative factor in the Board’s determination of whether to approve the continuation of the sub advisory agreements with each sub advisor. The Board was also assisted in its review, consideration and discussion of the sub-advisory agreements by a memorandum prepared by legal counsel that summarized the Board’s obligations.
Based on the factors discussed above, the Board, including all of the Directors/Trustees who are not “interested persons” (as defined in the Investment Company Act of 1940, as amended) of the Funds, approved the continuation of the sub-advisory agreements for the Funds, having concluded that each of the sub-advisory agreements for the Funds was fair and reasonable and in the best interests of each applicable Fund and its shareholders.
HENNESSY FUNDS 1-800-966-4354
For information, questions or assistance, please call
The Hennessy Funds
1-800-966-4354 or 1-415-899-1555
INVESTMENT ADVISOR
Hennessy Advisors, Inc.
7250 Redwood Blvd., Suite 200
Novato, California 94945
ADMINISTRATOR,
TRANSFER AGENT,
DIVIDEND PAYING AGENT &
SHAREHOLDER SERVICING AGENT
U.S. Bancorp Fund Services, LLC
P.O. Box 701
Milwaukee, Wisconsin 53201-0701
CUSTODIAN
U.S. Bank N.A.
Custody Operations
1555 North River Center Dr., Suite 302
Milwaukee, Wisconsin 53212
DIRECTORS/TRUSTEES
Neil J. Hennessy
Robert T. Doyle
J. Dennis DeSousa
Gerald P. Richardson
COUNSEL
Foley & Lardner LLP
777 East Wisconsin Avenue
Milwaukee, Wisconsin 53202-5306
INDEPENDENT REGISTERED
PUBLIC ACCOUNTING FIRMS
KPMG LLP
777 East Wisconsin Avenue
Milwaukee, Wisconsin 53202-5306
Tait, Weller & Baker LLP
1818 Market Street, Suite 2400
Philadelphia, Pennsylvania 19103
DISTRIBUTOR
Quasar Distributors, LLC
615 East Michigan Street
Milwaukee, Wisconsin 53202
hennessyfunds.com | 1-800-966-4354
This report has been prepared for shareholders and may be distributed to
others only if preceded or accompanied by a current prospectus.
Item 2. Code of Ethics.
The registrant has adopted a code of ethics that applies to the registrant’s principal executive officer and principal financial officer. The registrant amended and restated its code of ethics in its entirety in October 2013. The registrant has not granted any waivers from any provisions of the code of ethics during the period covered by this report.
A copy of the registrant’s Code of Ethics is filed herewith.
Item 3. Audit Committee Financial Expert.
The registrant’s board of directors has determined that it does not have an audit committee financial expert serving on its audit committee. At this time, the registrant believes that the experience provided by each member of the audit committee together offers the registrant adequate oversight for the registrant’s level of financial complexity.
Item 4. Principal Accountant Fees and Services.
The registrant has engaged its principal accountants to perform audit services, audit-related services, tax services and other services during the past two fiscal years. “Audit services” refer to performing an audit of the registrant's annual financial statements or services that are normally provided by the accountants in connection with statutory and regulatory filings or engagements for those fiscal years. “Audit-related services” refer to the assurance and related services by the principal accountants that are reasonably related to the performance of the audit. “Tax services” refer to professional services rendered by the principal accountants for tax compliance, tax advice, and tax planning. The following table details the aggregate fees billed or expected to be billed for each of the last two fiscal years for audit fees, audit-related fees, tax fees and other fees by the principal accountants.
| | FYE 10/31/2013 | FYE 10/31/2012 |
| Audit Fees | $143,300 | $144,800 |
| Audit-Related Fees | - | - |
| Tax Fees | $29,956 | $29,600 |
| All Other Fees | - | - |
The audit committee has adopted pre-approval policies and procedures that require the audit committee to pre-approve all audit and non-audit services of the registrant, including services provided to any entity affiliated with the registrant.
The percentage of fees billed by KPMG, LLP applicable to non-audit services pursuant to waiver of pre-approval requirement were as follows:
| | FYE 10/31/2013 | FYE 10/31/2012 |
| Audit-Related Fees | 0% | 0% |
| Tax Fees | 0% | 0% |
| All Other Fees | 0% | 0% |
The percentage of fees billed by Tait, Weller & Baker, LLP applicable to non-audit services pursuant to waiver of pre-approval requirement were as follows:
| | FYE 10/31/2013 | FYE 10/31/2012 |
| Audit-Related Fees | 0% | 0% |
| Tax Fees | 0% | 0% |
| All Other Fees | 0% | 0% |
All of the principal accountants’ hours spent on auditing the registrant’s financial statements were attributed to work performed by full-time permanent employees of the principal accountants.
The following table indicates the non-audit fees billed or expected to be billed by the registrant’s accountants for services to the registrant and to the registrant’s investment adviser (and any other controlling entity, etc.—not sub-adviser) for the last two years. The audit committee of the board of trustees/directors has considered whether the provision of non-audit services that were rendered to the registrant's investment adviser is compatible with maintaining the principal accountants' independence and has concluded that the provision of such non-audit services by the accountants have not compromised the accountants’ independence.
| Non-Audit Related Fees | FYE 10/31/2013 | FYE 10/31/2012 |
| Registrant | - | - |
| Registrant’s Investment Adviser | - | - |
Item 5. Audit Committee of Listed Registrants.
Not applicable to registrants who are not listed issuers (as defined in Rule 10A-3 under the Securities Exchange Act of 1934).
Item 6. Investments.
Schedule of Investments is included as part of the report to shareholders filed under Item 1 of this Form.
Item 7. Disclosure of Proxy Voting Policies and Procedures for Closed-End Management Investment Companies.
Not applicable to open-end investment companies.
Item 8. Portfolio Managers of Closed-End Management Investment Companies.
Not applicable to open-end investment companies.
Item 9. Purchases of Equity Securities by Closed-End Management Investment Company and Affiliated Purchasers.
Not applicable to open-end investment companies.
Item 10. Submission of Matters to a Vote of Security Holders.
Not Applicable.
Item 11. Controls and Procedures.
| (a) | The Registrant’s President and Treasurer have reviewed the Registrant's disclosure controls and procedures (as defined in Rule 30a-3(c) under the Investment Company Act of 1940 (the “Act”)) as of a date within 90 days of the filing of this report, as required by Rule 30a-3(b) under the Act and Rules 13a-15(b) or 15d-15(b) under the Securities Exchange Act of 1934. Based on their review, such officers have concluded that the disclosure controls and procedures are effective in ensuring that information required to be disclosed in this report is appropriately recorded, processed, summarized and reported and made known to them by others within the Registrant and by the Registrant’s service provider. |
| (b) | There were no changes in the Registrant's internal control over financial reporting (as defined in Rule 30a-3(d) under the Act) that occurred during the second fiscal quarter of the period covered by this report that has materially affected, or is reasonably likely to materially affect, the Registrant's internal control over financial reporting. |
Item 12. Exhibits.
| (a) | (1) Any code of ethics or amendment thereto, that is the subject of the disclosure required by Item 2, to the extent that the registrant intends to satisfy Item 2 requirements through filing of an exhibit. Filed herewith |
(2) A separate certification for each principal executive and principal financial officer pursuant to Rule 30a-2(a) under the Act and Section 302 of the Sarbanes-Oxley Act of 2002. Filed herewith.
(3) Any written solicitation to purchase securities under Rule 23c-1 under the Act sent or given during the period covered by the report by or on behalf of the registrant to 10 or more persons. Not applicable to open-end investment companies.
| (b) | Certifications pursuant to Rule 30a-2(b) under the Act and Section 906 of the Sarbanes-Oxley Act of 2002. Furnished herewith. |
SIGNATURES
Pursuant to the requirements of the Securities Exchange Act of 1934 and the Investment Company Act of 1940, the registrant has duly caused this report to be signed on its behalf by the undersigned, thereunto duly authorized.
(Registrant) Hennessy Funds Trust
By (Signature and Title)* /s/Neil J. Hennessy
Neil J. Hennessy, President
Date January 9, 2014
Pursuant to the requirements of the Securities Exchange Act of 1934 and the Investment Company Act of 1940, this report has been signed below by the following persons on behalf of the registrant and in the capacities and on the dates indicated.
By (Signature and Title)* /s/Neil J. Hennessy
Neil J. Hennessy, President
Date January 9, 2014
By (Signature and Title)* /s/Teresa M. Nilsen
Teresa M. Nilsen, Treasurer
Date January 9, 2014