UNITED STATES
SECURITIES AND EXCHANGE COMMISSION
Washington, D.C. 20549
Amendment No. 1 to
FORM N-CSR/A
CERTIFIED SHAREHOLDER REPORT OF REGISTERED
MANAGEMENT INVESTMENT COMPANIES
Investment Company Act file number (811-07168)
Hennessy Funds Trust
(Exact name of registrant as specified in charter)
7250 Redwood Blvd., Suite 200
Novato, CA 94945
(Address of principal executive offices) (Zip code)
Neil J. Hennessy
7250 Redwood Blvd., Suite 200
Novato, CA 94945
(Name and address of agent for service)
800-966-4354
Registrant's telephone number, including area code
Date of fiscal year end: October 31, 2011
Date of reporting period: October 31, 2011
Explanatory Paragraph
On January 6, 2012, the undersigned registrant filed its Certified Shareholder Report on Form N-CSR for the annual period ended October 31, 2011. The registrant hereby amends the original Certified Shareholder Report on Form N-CSR by amending and restating Item 1, “Report to Stockholders,” in its entirety to correct certain Expense Example information for the Funds’ Institutional Class shares contained in the Report. This amendment also amends and restates Item 12, “Exhibits,” in its entirety to reflect the filing of new certifications pursuant to Section 302 and Section 906 of the Sarbanes-Oxley Act of 2002.
This amendment does not reflect events occurring after the filing of the original Certified Shareholder Report on Form N-CSR for the annual period ended October 31, 2011 and, other than amending and restating Item 1, “Report to Stockholders,” and Item 12, “Exhibits,” does not modify or update the disclosures in the original Certified Shareholder Report on Form N-CSR in any way.
Item 1. Reports to Stockholders.
HENNESSY FUNDS
ANNUAL REPORT
OCTOBER 31, 2011
Hennessy Cornerstone Growth Fund
Hennessy Focus 30 Fund
Hennessy Cornerstone Large Growth Fund
Hennessy Cornerstone Value Fund
Hennessy Total Return Fund
Hennessy Balanced Fund
Contents
| Letter to shareholders | 1 |
| Performance overview (unaudited) | |
| Hennessy Cornerstone Growth Fund | 4 |
| Hennessy Focus 30 Fund | 7 |
| Hennessy Cornerstone Large Growth Fund | 9 |
| Hennessy Cornerstone Value Fund | 11 |
| Hennessy Total Return Fund | 13 |
| Hennessy Balanced Fund | 14 |
| Financial statements | |
| Schedules of investments | |
| Hennessy Cornerstone Growth Fund | 15 |
| Hennessy Focus 30 Fund | 22 |
| Hennessy Cornerstone Large Growth Fund | 26 |
| Hennessy Cornerstone Value Fund | 30 |
| Hennessy Total Return Fund | 35 |
| Hennessy Balanced Fund | 40 |
| Statements of assets and liabilities | 44 |
| Statements of operations | 46 |
| Statements of changes in net assets | 48 |
| Statement of cash flows – Hennessy Total Return Fund | 55 |
| Financial highlights | |
| Hennessy Cornerstone Growth Fund | 56 |
| Hennessy Focus 30 Fund | 60 |
| Hennessy Cornerstone Large Growth Fund | 64 |
| Hennessy Cornerstone Value Fund | 68 |
| Hennessy Total Return Fund | 72 |
| Hennessy Balanced Fund | 74 |
| Notes to the financial statements | 77 |
| Report of Independent Registered Public Accounting Firm | 89 |
| Directors/Trustees and Officers of the Funds | 90 |
| Expense example | 9 |
| Proxy voting policy | 98 |
| Quarterly Filings on Form N-Q | 98 |
| Federal Tax Distribution Information | 98 |
| Privacy Policy | 99 |
WWW.HENNESSYFUNDS.COM
December, 2011
Dear Hennessy Funds Shareholder:
It has been three years since the beginning of the current financial crisis, and I don’t know about you, but I am ready for the roller coaster ride to come to an end. Volatility, fear and a lack of actionable direction from our leaders in Washington continue to plague the investing landscape. Investors who have been pummeled with negative economic news remain scared, so it’s no surprise that confidence is at an all time low. In markets like these there is an expression that investors are “climbing the wall of worry.” We have had such bad news for so long that I think we are at the top of the wall and investors are now “clinging to the wall of worry,” hanging on for dear life.
With all the news headlines and financial data bombarding the average investor daily, it is difficult for many to comprehend what is really happening. I want to take a step back from all of the media “noise” and share my thoughts on the financial markets. First, let’s take a look at the recent hyper-volatility. Before August 4th of this year, there were no days that the market closed up or down 300 points. Since August 4th we’ve had 13 days of plus or minus 300 point swings on the Dow Jones. I don’t see that anything has fundamentally changed since August 4th. I truly believe that this volatility is a direct result of the emotions that are currently driving investing decisions. This past August investors pulled more money out of equity mutual funds than at any time since the crash in March of 2008. What is sad is that the S&P 500 and the Dow Jones, among other indices, have gained significantly since their lows three years ago, and many investors may have missed out on those returns by letting emotion guide them to poor decisions. I don’t think the media machine will slow down, but I do believe its time for all of us to filter out all the negative noise, look at the fundamentals and get back to investing basics.
If investors could separate what is happening in Washington politics and what is happening in the European Union from what is happening with U.S. companies, they would see that companies in the U.S. have been, in fact, doing very well. I believe the only major stumbling block that we have, and that we’ve had for some time, is a lack of clarity coming from Washington on taxes, healthcare and regulation. That lack of clarity is preventing companies from hiring. Many U.S. companies are sitting on mountains of cash, over $2 trillion in the S&P 500 companies alone, and rather than using that cash to hire, they have been deploying capital in other areas:
| HENNESSY FUNDS | 1-800-966-4354 |
| | • | | Initiating dividends |
| | • | | Increasing dividends |
| | • | | Stock buy backs |
| | • | | Internal infrastructure |
| | • | | Acquisitions |
Despite the issues facing the economy and the markets, for the twelve-month period ended October 31, 2011, the major indices saw moderate growth, returning approximately 8-10%. Mid-cap stocks led both their large- and small-cap counterparts during the period, and growth stocks outperformed value stocks. The problems with Washington remain, and will likely only get worse as we move into another election period. Therefore, I am expecting another year with slow to moderate growth. That doesn’t mean there aren’t great stocks to buy – there are. Quality names, particularly those paying strong dividends, have continued to perform well. If you look at the 30 companies in the Dow Jones, they are yielding 3.19% as of November 30, 2011, which is higher than a 10-year U.S. Treasury bond.
We know there are obstacles that the economy will continue to struggle through, but we also see that several of the key fundamentals appear stronger today than they were during the financial crisis three years ago. No matter what metric investors might look at, the numbers would tell you that the U.S. market is currently undervalued. If you look at price-to-book, price-to-sales, price-to-earnings or price-to-cash-flow, the market is far below its historical norm of the past five or ten years. I’m not going back thirty years, just five or ten. It might surprise some, but corporate profits are actually at an all-time high. As investors regain their confidence and return to investing based on facts and fundamentals, I believe we should return to solid, long-term market gains.
Despite the volatile markets, we remain steadfastly focused on long-term investing and adherence to our proven investment formulas. Thank you for your continued confidence and investment in Hennessy Funds. If you have any questions or want to speak with us directly, please don’t hesitate to call us at (800) 966-4354.
Best regards,
Neil J. Hennessy
Portfolio Manager & Chief Investment Officer
Past performance does not guarantee future results.
Mutual fund investing involves risk. Principal loss is possible.
WWW.HENNESSYFUNDS.COM
Small and medium-capitalization companies tend to have limited liquidity and greater price volatility than large-capitalization companies.
Opinions expressed are those of Neil Hennessy and are subject to change, are not guaranteed and should not be considered investment advice.
The Dow Jones Industrial Average and the S&P 500 Index are unmanaged indices of common stocks comprised of major industrial companies and assumes reinvestment of dividends. You cannot invest directly in an index.
The Price to Book Ratio compares a stock’s market value to the value of total assets less total liabilities.
The Price to Sales Ratio is a tool for calculating a stock’s valuation relative to other companies, calculated by dividing a stock’s current price by its revenue per share.
The Price to Earnings Ratio reflects the multiple of earnings at which a stock sells.
The Price to Cash Flow Ratio takes the current Price divided by Cash Flow per share for the trailing twelve months.
| HENNESSY FUNDS | 1-800-966-4354 |
Hennessy Cornerstone Growth Fund
Original Class Shares (HFCGX)
AVERAGE ANNUAL TOTAL RETURN PERIODS ENDED OCTOBER 31, 2011
| | | | | | Since Inception |
| | | One Year | Five Years | Ten Years | (11/1/96) |
| | Hennessy Cornerstone | | | | |
| | Growth Fund – Original Class | -3.02% | -8.37% | 3.73% | 7.12% |
| | Russell 2000 Index | 6.71% | 0.68% | 7.02% | 6.72% |
| | S&P 500 Index | 8.09% | 0.25% | 3.69% | 5.78% |
Gross expense ratio: 1.34%
Performance data quoted represents past performance; past performance does not guarantee future results. The investment return and principal value of an investment will fluctuate so that an investor’s shares, when redeemed, may be worth more or less than their original cost. Current performance of the Fund may be lower or higher than the performance quoted. Performance data current to the most recent month end may be obtained by visiting www.hennessyfunds.com. The gross expense ratio presented is that from the most recent prospectus.
PERFORMANCE NARRATIVE
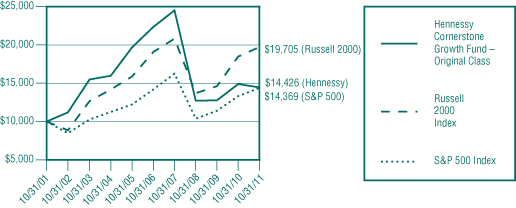
The Hennessy Cornerstone Growth Fund fell -3.02% for the twelve-month period ended October 31, 2011, underperforming the Russell 2000 Index, which returned 6.71%, and the S&P 500 Index, which returned 8.09% for the same period. The Fund’s underperformance to the Russell 2000 Index is primarily due to specific stock selection within the Information Technology and Consumer Discretionary sectors. This decline offset positive stock selection and sector allocation within Energy stocks, which outperformed alongside Materials stocks as oil and commodities prices rebounded from last year. Despite positive effects from our underweight position in the Financials sector relative to the S&P 500, stock selection within that sector contributed to the Fund’s underperformance. Information Technology stock Power One (down over 50%) was the largest negative contributor. The solar power converter company managed to top analysts’ earnings expectation by 20% in January, but they never recovered after the company lowered top line revenue expectations for 2011. Our investment in Grupo Financiero Galicia (down nearly 45%), an Argentinian commercial bank and the country’s largest consumer lender, was hurt by lower than expected results coupled with a decline in the value of their dollar-denominated government bond holdings. CPY Corporation, a portrait photography company, was the worst performing stock in the portfolio during the period (down nearly 80%) as the company’s customer base was disproportionally affected by the weak economy. The biggest gainer in the Fund was PriceSmart (up 100%), an international provider of bulk merchandise in Latin America and Asia under the PriceCostco and PriceSmart brands, which continued to post exceptional earnings throughout the year.
WWW.HENNESSYFUNDS.COM
CHANGE IN VALUE OF $10,000 INVESTMENT
This chart assumes an initial gross investment of $10,000 made on October 31, 2001. Returns shown include the reinvestment of all dividends. Returns shown do not reflect the deduction of taxes that a shareholder would pay on Fund distributions or the redemption of Fund shares.
| HENNESSY FUNDS | 1-800-966-4354 |
Hennessy Cornerstone Growth Fund
Institutional Class Shares (HICGX)
AVERAGE ANNUAL TOTAL RETURN PERIODS ENDED OCTOBER 31, 2011
| | | | Since Inception |
| | | One Year | (3/3/08) |
| | Hennessy Cornerstone | | |
| | Growth Fund – Institutional Class | -2.70% | -7.43% |
| | Russell 2000 Index | 6.71% | 3.66% |
| | S&P 500 Index | 8.09% | 0.56% |
Gross expense ratio: 1.09%. Net expense ratio: 0.98%. The expense ratio is contractually capped at 0.98% indefinitely.
Performance data quoted represents past performance; past performance does not guarantee future results. The investment return and principal value of an investment will fluctuate so that an investor’s shares, when redeemed, may be worth more or less than their original cost. Current performance of the Fund may be lower or higher than the performance quoted. Performance data current to the most recent month end may be obtained by visiting www.hennessyfunds.com. Investment performance reflects fee waivers in effect. In the absence of such waivers, total return would be reduced. The expense ratios presented are that from the most recent prospectus.
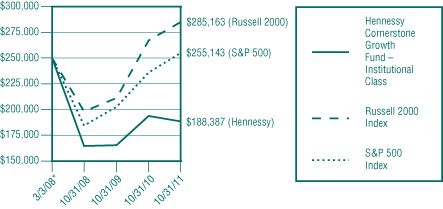
CHANGE IN VALUE OF $250,000 INVESTMENT
* Inception date
This chart assumes an initial gross investment of $250,000 (minimum investment) made on March 3, 2008 (inception date of share class). Returns shown include the reinvestment of all dividends. Returns shown do not reflect the deduction of taxes that a shareholder would pay on Fund distributions or the redemption of Fund shares.
The S&P 500 Index and Russell 2000 Index are unmanaged indices commonly used to measure the performance of U.S. Stocks. You cannot invest directly in an index. Small and medium-capitalization companies tend to have limited liquidity and greater price volatility than large-capitalization companies. Investments in foreign securities involve greater volatility and political, economic and currency risk and differences in accounting methods. References to specific securities should not be considered a recommendation to buy or sell any security. Fund holdings and sector allocations are subject to change. Please refer to the included Schedule of Investments.
WWW.HENNESSYFUNDS.COM
Hennessy Focus 30 Fund
Original Class Shares (HFTFX)
AVERAGE ANNUAL TOTAL RETURN PERIODS ENDED OCTOBER 31, 2011
| | | | | Since Inception |
| | | One Year | Five Years | (9/17/03) |
| | Hennessy Focus 30 Fund – | | | |
| | Original Class | 8.68% | 3.13% | 9.23% |
| | S&P Midcap 400 Index | 8.55% | 4.01% | 8.13% |
| | S&P 500 Index | 8.09% | 0.25% | 4.57% |
Gross expense ratio: 1.40%
Performance data quoted represents past performance; past performance does not guarantee future results. The investment return and principal value of an investment will fluctuate so that an investor’s shares, when redeemed, may be worth more or less than their original cost. Current performance of the Fund may be lower or higher than the performance quoted. Performance data current to the most recent month end may be obtained by visiting www.hennessyfunds.com. The gross expense ratio presented is that from the most recent prospectus.
PERFORMANCE NARRATIVE
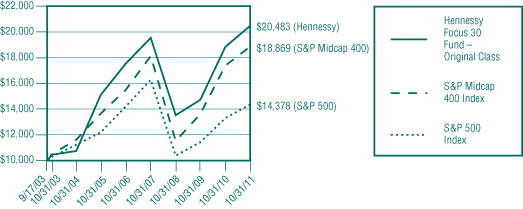
The Hennessy Focus 30 Fund returned 8.68% for the twelve-month period ended October 31, 2011, outperforming both the S&P Midcap 400 and the S&P 500 Index, which returned 8.55% and 8.09% respectively for the same period. The Fund’s overweight position in the Consumer Discretionary sector, combined with stock selection was a primary reason for the portfolio’s outperformance over the past year. This allocation helped to overcome the negative contribution from stock selection within the Industrials sector. We had three stocks within the Consumer Discretionary sector that were up over 50% during the period: Ulta Salon Cosmetics (123%), Tractor Supply (84%) and Dollar Tree (58%). Their relative outperformance demonstrated what we have been saying for quite some time, that consumer spending is not dead and that lower-end retailers and do-it-yourself retailers would be able to grow during the recovery as consumers looked to get more value for their dollar. The worst performing stock was specialty chemical company Ferro (down 55%), which reported disappointing earnings on the back of weakness in their solar panel business. Ferro is no longer a holding in the Fund.
CHANGE IN VALUE OF $10,000 INVESTMENT
This chart assumes an initial gross investment of $10,000 made on September 17, 2003 (inception). Returns shown include the reinvestment of all dividends. Returns shown do not reflect the deduction of taxes that a shareholder would pay on Fund distributions or the redemption of Fund shares.
| HENNESSY FUNDS | 1-800-966-4354 |
Hennessy Focus 30 Fund
Institutional Class Shares (HIFTX)
AVERAGE ANNUAL TOTAL RETURN PERIODS ENDED OCTOBER 31, 2011
| | | | Since Inception |
| | | One Year | (3/3/08) |
| | Hennessy Focus 30 Fund – Institutional Class | 9.12% | 2.76% |
| | S&P Midcap 400 Index | 8.55% | 4.86% |
| | S&P 500 Index | 8.09% | 0.56% |
Gross expense ratio: 1.17%. Net expense ratio: 0.99% (includes 0.01% acquired fund fees and expenses). The expense ratio is contractually capped at 0.98% indefinitely (not including acquired fund fees and expenses).
Performance data quoted represents past performance; past performance does not guarantee future results. The investment return and principal value of an investment will fluctuate so that an investor’s shares, when redeemed, may be worth more or less than their original cost. Current performance of the Fund may be lower or higher than the performance quoted. Performance data current to the most recent month end may be obtained by visiting www.hennessyfunds.com. Investment performance reflects fee waivers in effect. In the absence of such waivers, total return would be reduced. The expense ratios presented are that from the most recent prospectus.
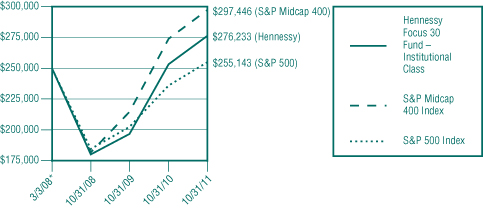
CHANGE IN VALUE OF $250,000 INVESTMENT
* Inception date
This chart assumes an initial gross investment of $250,000 (minimum investment) made on March 3, 2008 (inception date of share class). Returns shown include the reinvestment of all dividends. Returns shown do not reflect the deduction of taxes that a shareholder would pay on Fund distributions or the redemption of Fund shares.
The S&P 500 Index and S&P Midcap 400 Index are unmanaged indices commonly used to measure the performance of U.S. Stocks. You cannot invest directly in an index. Small and medium-capitalization companies tend to have limited liquidity and greater price volatility than large-capitalization companies. References to specific securities should not be considered a recommendation to buy or sell any security. Fund holdings and sector allocations are subject to change. Please refer to the included Schedule of Investments.
WWW.HENNESSYFUNDS.COM
Hennessy Cornerstone Large Growth Fund
Original Class Shares (HFLGX)
AVERAGE ANNUAL TOTAL RETURN PERIODS ENDED OCTOBER 31, 2011
| | | | Since Inception |
| | | One Year | (3/20/09) |
| | Hennessy Cornerstone Large | | |
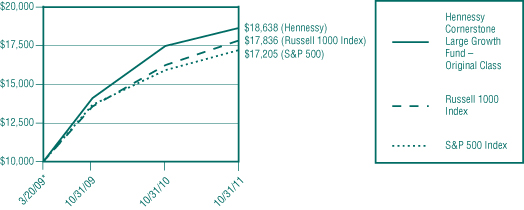
| | Growth Fund – Original Class* | 6.70% | 26.87% |
| | Russell 1000 Index | 8.01% | 23.75% |
| | S&P 500 Index | 8.09% | 23.05% |
Gross expense ratio: 1.30%.
Performance data quoted represents past performance; past performance does not guarantee future results. The investment return and principal value of an investment will fluctuate so that an investor’s shares, when redeemed, may be worth more or less than their original cost. Current performance of the Fund may be lower or higher than the performance quoted. Performance data current to the most recent month end may be obtained by visiting www.hennessyfunds.com. The gross expense ratio presented is that from the most recent prospectus.
| * | On March 20, 2009, the Tamarack Large Cap Growth Fund was reorganized into the Hennessy Cornerstone Large Growth Fund. At that time, the Fund began utilizing a purely quantitative formula to choose stocks for the portfolio, which differs from the investment strategy employed by the previous investment manager. Accordingly, performance is being reported for the period after the reorganization. |
PERFORMANCE NARRATIVE
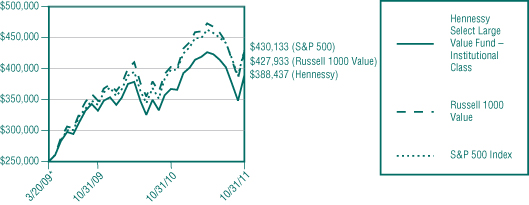
The Hennessy Cornerstone Large Growth Fund returned 6.70% for the twelve-month period ended October 31, 2011, underperforming both the Russell 1000 Index and the S&P 500 Index, which returned 8.01% and 8.09% respectively for the same period. The largest contributor to the Fund’s performance during the year was our allocation and stock selection in the Financials sectors, while allocation and stock selection in the Energy sector were negative contributors to overall performance. Our relative underweighting of the Financials sector versus both the Russell 1000 and S&P 500 helped performance of the Fund, as did the selection of credit rating agency Moody’s Corporation (up 42%). That stock has performed well in large part due to double digit earnings and top line revenue growth. The single largest negative contributor to the Fund’s overall performance was Cablevision Systems (down 41%) as the company faced increasingly stiff competition from incumbent telephone companies and satellite service providers. We continue to hold shares in the company though at much reduced levels because of its spin-off of AMC Networks in June of this year.
CHANGE IN VALUE OF $10,000 INVESTMENT
* Inception date
This chart assumes an initial gross investment of $10,000 made on March 20, 2009 (inception). Returns shown include the reinvestment of all dividends. Returns shown do not reflect the deduction of taxes that a shareholder would pay on Fund distributions or the redemption of Fund shares.
| HENNESSY FUNDS | 1-800-966-4354 |
Hennessy Cornerstone Large Growth Fund
Institutional Class Shares (HILGX)
AVERAGE ANNUAL TOTAL RETURN PERIODS ENDED OCTOBER 31, 2011
| | | | Since Inception |
| | | One Year | (3/20/09) |
| | Hennessy Cornerstone Large | | |
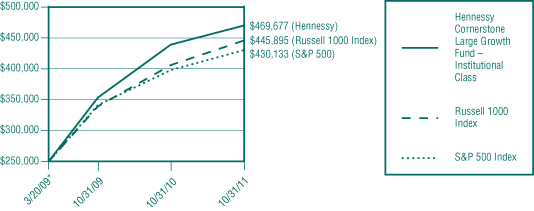
| | Growth Fund – Institutional Class | 6.99% | 27.25% |
| | Russell 1000 Index | 8.01% | 23.75% |
| | S&P 500 Index | 8.09% | 23.05% |
Gross expense ratio: 1.16%. Net expense ratio: 0.98%. The expense ratio is contractually capped at 0.98% indefinitely.
Performance data quoted represents past performance; past performance does not guarantee future results. The investment return and principal value of an investment will fluctuate so that an investor’s shares, when redeemed, may be worth more or less than their original cost. Current performance of the Fund may be lower or higher than the performance quoted. Performance data current to the most recent month end may be obtained by visiting www.hennessyfunds.com. Investment performance reflects fee waivers in effect. In the absence of such waivers, total return would be reduced. The expense ratios presented are that from the most recent prospectus.
CHANGE IN VALUE OF $250,000 INVESTMENT
* Inception date
This chart assumes an initial gross investment of $250,000 (minimum investment) made on March 20, 2009 (inception date). Returns shown include the reinvestment of all dividends. Returns shown do not reflect the deduction of taxes that a shareholder would pay on Fund distributions or the redemption of Fund shares.
The S&P 500 and Russell 1000 are unmanaged indices commonly used to measure the performance of U.S. stocks. One cannot invest directly in an index. The Fund may invest in medium-capitalization companies, which tend to have limited liquidity and greater price volatility than large-capitalization companies. References to specific securities should not be considered a recommendation to buy or sell any security. Fund holdings and sector allocations are subject to change. Please refer to the included Schedule of Investments.
WWW.HENNESSYFUNDS.COM
Hennessy Cornerstone Value Fund
Original Class Shares (HFCVX)
AVERAGE ANNUAL TOTAL RETURN PERIODS ENDED OCTOBER 31, 2011
| | | | | | Since Inception |
| | | One Year | Five Years | Ten Years | (11/1/96) |
| | Hennessy Cornerstone | | | | |
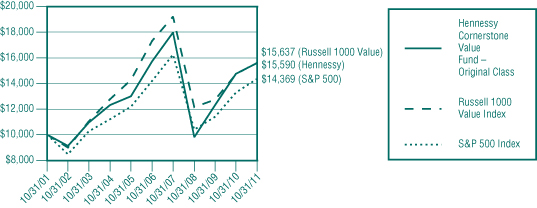
| | Value Fund – Original Class | 5.58% | -0.20% | 4.54% | 5.28% |
| | Russell 1000 Value Index | 6.16% | -2.05% | 4.57% | 6.56% |
| | S&P 500 Index | 8.09% | 0.25% | 3.69% | 5.78% |
Gross expense ratio: 1.30%
Performance data quoted represents past performance; past performance does not guarantee future results. The investment return and principal value of an investment will fluctuate so that an investor’s shares, when redeemed, may be worth more or less than their original cost. Current performance of the Fund may be lower or higher than the performance quoted. Performance data current to the most recent month end may be obtained by visiting www.hennessyfunds.com. The gross expense ratio presented is that from the most recent prospectus.
PERFORMANCE NARRATIVE
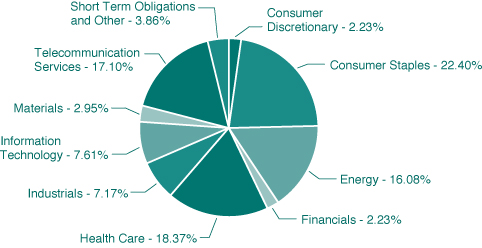
The Hennessy Cornerstone Value Fund returned 5.58% for the twelve-month period ended October 31, 2011, underperforming the Russell 1000 Value Index, which returned 6.16%, and the S&P 500 Index, which returned 8.09% for the same period. The Fund’s performance was aided by both asset allocation and stock selection in the Financial and Consumer Staples sectors. Stock selection in the Telecom Service sector and the portfolio’s underweight position in the Utilities sectors hurt its relative performance. Russian mobile telephone provider, Mobile Telesystems (down 31%), was the largest negative contributor within the Telecom Services sector. The largest single negative performing stock was Companhia Siderurgica (down 41%), a manufacturer of iron and steel in Brazil. The company remains in the Fund as it meets all of our selection criteria and is currently yielding over 7.5%. Our relative underweight position in Financials helped Fund performance and the one stock we did own in the sector, Marsh & McLennan (up 26%), was bolstered by increases in both top line revenues and earnings. Within the Consumer Staples sector, both our overweighting of the sector relative to the benchmarks and stocks like Philip Morris (up 25%), ConAgra Foods (up 17%) and Diageo (up 16%) helped the overall performance of the Fund. The best performing stock in the portfolio during the period was Intel (up 26%), which has been able to significantly increase both revenues and earnings over the last year.
CHANGE IN VALUE OF $10,000 INVESTMENT
This chart assumes an initial gross investment of $10,000 made on October 31, 2001. Returns shown include the reinvestment of all dividends. Returns shown do not reflect the deduction of taxes that a shareholder would pay on Fund distributions or the redemption of Fund shares.
| HENNESSY FUNDS | 1-800-966-4354 |
Hennessy Cornerstone Value Fund
Institutional Class Shares (HICVX)
AVERAGE ANNUAL TOTAL RETURN PERIODS ENDED OCTOBER 31, 2011
| | | | Since Inception |
| | | One Year | (3/3/08) |
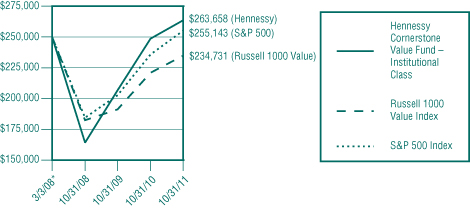
| | Hennessy Cornerstone Value Fund – Institutional Class | 6.00% | 1.46% |
| | Russell 1000 Value Index | 6.16% | -1.71% |
| | S&P 500 Index | 8.09% | 0.56% |
Gross expense ratio: 1.11%. Net expense ratio: 0.99% (includes 0.01% acquired fund fees and expenses). The expense ratio is contractually capped at 0.98% indefinitely (not including acquired fund fees and expenses).
Performance data quoted represents past performance; past performance does not guarantee future results. The investment return and principal value of an investment will fluctuate so that an investor’s shares, when redeemed, may be worth more or less than their original cost. Current performance of the Fund may be lower or higher than the performance quoted. Performance data current to the most recent month end may be obtained by visiting www.hennessyfunds.com. Investment performance reflects fee waivers in effect. In the absence of such waivers, total return would be reduced. The expense ratios presented are that from the most recent prospectus.
CHANGE IN VALUE OF $250,000 INVESTMENT
* Inception date
This chart assumes an initial gross investment of $250,000 (minimum investment) made on March 3, 2008 (inception date of share class). Returns shown include the reinvestment of all dividends. Returns shown do not reflect the deduction of taxes that a shareholder would pay on Fund distributions or the redemption of Fund shares.
The Russell 1000 Value Index and S&P 500 Index are unmanaged indices commonly used to measure the performance of U.S. Stocks. You cannot invest directly in an index. The Fund may invest in medium-capitalization companies which tend to have limited liquidity and greater price volatility than large-capitalization companies. Investments in foreign securities involve greater volatility and political, economic and currency risk and differences in accounting methods. References to specific securities should not be considered a recommendation to buy or sell any security. Fund holdings and sector allocations are subject to change. Please refer to the included Schedule of Investments.
WWW.HENNESSYFUNDS.COM
Hennessy Total Return Fund
Original Class Shares (HDOGX)
AVERAGE ANNUAL TOTAL RETURN PERIODS ENDED OCTOBER 31, 2011
| | | | | | Since Inception |
| | | One Year | Five Years | Ten Years | (7/29/98) |
| | Hennessy Total Return Fund | 10.22% | 0.21% | 4.06% | 3.13% |
| | Dow Jones Industrial Average | 10.39% | 2.55% | 5.36% | 4.57% |
| | S&P 500 Index | 8.09% | 0.25% | 3.69% | 2.63% |
Gross expense ratio: 1.34%
Expenses net of interest expense: 1.26%
Performance data quoted represents past performance; past performance does not guarantee future results. The investment return and principal value of an investment will fluctuate so that an investor’s shares, when redeemed, may be worth more or less than their original cost. Current performance of the Fund may be lower or higher than the performance quoted. Performance data current to the most recent month end may be obtained by visiting www.hennessyfunds.com. The gross expense ratio presented is that from the most recent prospectus.
PERFORMANCE NARRATIVE
The Hennessy Total Return Fund returned 10.22% for the twelve-month period ended October 31, 2011, slightly underperforming the Dow Jones Industrial Average, which returned 10.39%, but outperforming the S&P 500 Index, which returned 8.09%, for the same period. While there were continued low yields on Treasury Bills, which make up approximately 25% of the Fund’s assets, the Fund’s 75% equity weighting was able to capture nearly the full move of the Dow Jones Industrial Average, and it was able to outperform the broader equity market index of the S&P 500 over the year. The Fund’s largest holdings, Intel, Verizon and Pfizer, were all positive contributors to the Fund’s performance.
CHANGE IN VALUE OF $10,000 INVESTMENT
This chart assumes an initial gross investment of $10,000 made on October 31, 2001. Returns shown include the reinvestment of all dividend and other distributions. Returns shown do not reflect the deduction of taxes that a shareholder would pay on Fund distributions or the redemption of Fund shares.
The Dow Jones Industrial Average and S&P 500 Index are unmanaged indices commonly used to measure the performance of U.S. Stocks. You cannot invest directly in an index. The Hennessy Total Return Fund is non-diversified, meaning it may concentrate its assets in fewer individual holdings than a diversified fund, making it more exposed to individual stock volatility than a diversified fund. References to specific securities should not be considered a recommendation to buy or sell any security. Fund holdings are subject to change. Please refer to the included Schedule of Investments.
| HENNESSY FUNDS | 1-800-966-4354 |
Hennessy Balanced Fund
Original Class Shares (HBFBX)
AVERAGE ANNUAL TOTAL RETURN PERIODS ENDED OCTOBER 31, 2011
| | | | | | Since Inception |
| | | One Year | Five Years | Ten Years | (3/8/96) |
| | Hennessy Balanced Fund | 7.16% | 1.36% | 2.96% | 3.98% |
| | Dow Jones Industrial Average | 10.39% | 2.55% | 5.36% | 7.45% |
| | S&P 500 Index | 8.09% | 0.25% | 3.69% | 6.34% |
Gross expense ratio: 1.66%
Performance data quoted represents past performance; past performance does not guarantee future results. The investment return and principal value of an investment will fluctuate so that an investor’s shares, when redeemed, may be worth more or less than their original cost. Current performance of the Fund may be lower or higher than the performance quoted. Performance data current to the most recent month end may be obtained by visiting www.hennessyfunds.com. The gross expense ratio presented is that from the most recent prospectus.
PERFORMANCE NARRATIVE
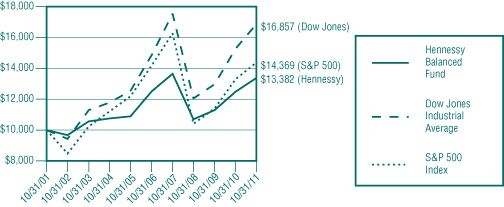
The Hennessy Balanced Fund returned 7.16% for the twelve-month period ended October 31, 2011, lagging both the Dow Jones Industrial Average, which returned 10.39%, and the S&P 500 Index, which returned 8.09% for the same period. The Fund’s relative underperformance to the indices is due primarily to the continued low yields on Treasury Bills. The Fund’s position of approximately 50% in Treasuries did not allow it to fully capture the performance of the equity markets over the year. While the portfolio may underperform the indices in periods where equities rise sharply, the strategy is geared to capture near market returns with a lower risk profile, since only half of the assets are invested in equities. The Fund’s largest holdings, Intel, Verizon and Pfizer, were all positive contributors to the Fund’s performance.
CHANGE IN VALUE OF $10,000 INVESTMENT
This chart assumes an initial gross investment of $10,000, made on October 31, 2001. Returns shown include the reinvestment of all dividend and other distributions. Returns shown do not reflect the deduction of taxes that a shareholder would pay on Fund distributions or the redemption of Fund shares.
The Dow Jones Industrial Average and S&P 500 Index are unmanaged indices commonly used to measure the performance of U.S. Stocks. You cannot invest directly in an index. The Hennessy Balanced Fund is non-diversified, meaning it may concentrate its assets in fewer individual holdings than a diversified fund, making it more exposed to individual stock volatility than a diversified fund. References to specific securities should not be considered a recommendation to buy or sell any security. Fund holdings are subject to change. Please refer to the included Schedule of Investments.
WWW.HENNESSYFUNDS.COM
Schedules of Investments
HENNESSY CORNERSTONE GROWTH FUND
As of October 31, 2011
(% of Net Assets)
| TOP TEN EQUITY HOLDINGS | % of net assets |
| PriceSmart, Inc. | 4.09% |
| Tractor Supply Co. | 3.12% |
| Western Refining, Inc. | 3.07% |
| Atlas Energy, L.P. | 3.03% |
| Dillards, Inc. | 2.93% |
| Buckeye Technologies, Inc. | 2.72% |
| Atlas Pipeline Partners, L.P. | 2.64% |
| Innospec, Inc. | 2.62% |
| Sauer-Danfross, Inc. | 2.32% |
| Titan International, Inc. | 2.29% |
| HENNESSY FUNDS | 1-800-966-4354 |
| COMMON STOCKS – 93.46% | | Number | | | | | | % of Net | |
| | | of Shares | | | Value | | | Assets | |
| Consumer Discretionary – 31.42% | | | | | | | | | |
| Aarons, Inc. | | | 20,300 | | | $ | 543,228 | | | | 0.29 | % |
| Ann, Inc. (a) | | | 131,700 | | | | 3,508,488 | | | | 1.88 | % |
| AutoNation, Inc. (a) | | | 14,300 | | | | 556,842 | | | | 0.30 | % |
| Borg Warner, Inc. (a) | | | 52,700 | | | | 4,031,023 | | | | 2.16 | % |
| Cabelas, Inc. (a) | | | 20,500 | | | | 510,860 | | | | 0.27 | % |
| CBS Corp. | | | 20,250 | | | | 522,653 | | | | 0.28 | % |
| Chicos FAS, Inc. | | | 36,000 | | | | 444,960 | | | | 0.24 | % |
| Cost Plus, Inc. (a) | | | 342,600 | | | | 2,703,114 | | | | 1.45 | % |
| CPI Corp. | | | 123,400 | | | | 736,698 | | | | 0.39 | % |
| Dillards, Inc. | | | 106,400 | | | | 5,482,792 | | | | 2.93 | % |
| DineEquity, Inc. (a) | | | 63,500 | | | | 2,981,960 | | | | 1.59 | % |
| Dish Network Corp. (a) | | | 18,150 | | | | 438,686 | | | | 0.23 | % |
| Dominos Pizza, Inc. (a) | | | 21,900 | | | | 701,457 | | | | 0.38 | % |
| DSW, Inc. | | | 10,300 | | | | 539,102 | | | | 0.29 | % |
| Education Management Corp. (a) | | | 21,400 | | | | 425,004 | | | | 0.23 | % |
| Finish Line, Inc. | | | 24,800 | | | | 498,480 | | | | 0.27 | % |
| Foot Locker, Inc. | | | 24,000 | | | | 524,640 | | | | 0.28 | % |
| Genesco, Inc. (a) | | | 10,300 | | | | 607,082 | | | | 0.32 | % |
| Krispy Kreme Doughnuts, Inc. (a) | | | 482,700 | | | | 3,407,862 | | | | 1.82 | % |
| Libbey, Inc. (a) | | | 243,900 | | | | 3,087,774 | | | | 1.65 | % |
| Lithia Motors, Inc. | | | 27,800 | | | | 571,846 | | | | 0.31 | % |
| Mens Wearhouse, Inc. | | | 16,650 | | | | 514,152 | | | | 0.28 | % |
| Oxford Industries, Inc. | | | 15,350 | | | | 606,325 | | | | 0.32 | % |
| Penske Automotive Group, Inc. | | | 23,800 | | | | 485,282 | | | | 0.26 | % |
| Pier 1 Imports, Inc. (a) | | | 334,800 | | | | 4,188,348 | | | | 2.24 | % |
| Quiksilver, Inc. (a) | | | 694,700 | | | | 2,327,245 | | | | 1.24 | % |
| Ruby Tuesday, Inc. (a) | | | 258,100 | | | | 2,165,459 | | | | 1.16 | % |
| Sally Beauty Holdings, Inc. (a) | | | 31,900 | | | | 612,161 | | | | 0.33 | % |
| Sonic Automotive, Inc. | | | 37,850 | | | | 555,259 | | | | 0.30 | % |
| Tenneco, Inc. (a) | | | 85,400 | | | | 2,794,288 | | | | 1.49 | % |
| The Goodyear Tire & Rubber Co. (a) | | | 31,300 | | | | 449,468 | | | | 0.24 | % |
| Tractor Supply Co. | | | 82,100 | | | | 5,824,174 | | | | 3.12 | % |
The accompanying notes are an integral part of these financial statements.
WWW.HENNESSYFUNDS.COM
| COMMON STOCKS | | Number | | | | | | % of Net | |
| | | of Shares | | | Value | | | Assets | |
| Consumer Discretionary (Continued) | | | | | | | | | |
| TRW Automotive Holdings Corp. (a) | | | 67,300 | | | $ | 2,833,330 | | | | 1.52 | % |
| Tuesday Morning Corp. (a) | | | 639,300 | | | | 2,314,266 | | | | 1.24 | % |
| Valuevision Media, Inc. (a) | | | 70,100 | | | | 229,928 | | | | 0.12 | % |
| | | | | | | | 58,724,236 | | | | 31.42 | % |
| Consumer Staples – 5.66% | | | | | | | | | | | | |
| Corn Products International, Inc. | | | 10,000 | | | | 485,000 | | | | 0.26 | % |
| PriceSmart, Inc. | | | 100,600 | | | | 7,649,624 | | | | 4.09 | % |
| SunOpta, Inc. (a)(b) | | | 469,300 | | | | 2,449,746 | | | | 1.31 | % |
| | | | | | | | 10,584,370 | | | | 5.66 | % |
| Energy – 3.91% | | | | | | | | | | | | |
| Crosstex Energy, Inc. | | | 43,400 | | | | 565,502 | | | | 0.30 | % |
| CVR Energy, Inc. (a) | | | 21,300 | | | | 527,388 | | | | 0.28 | % |
| HollyFrontier Corp. | | | 15,600 | | | | 478,764 | | | | 0.26 | % |
| Western Refining, Inc. (a) | | | 358,800 | | | | 5,733,624 | | | | 3.07 | % |
| | | | | | | | 7,305,278 | | | | 3.91 | % |
| Financials – 6.87% | | | | | | | | | | | | |
| AmTrust Financial Services, Inc. | | | 23,700 | | | | 601,506 | | | | 0.32 | % |
| Ashford Hospitality Trust, Inc. | | | 346,000 | | | | 3,079,400 | | | | 1.65 | % |
| Cash America International, Inc. | | | 9,850 | | | | 539,287 | | | | 0.29 | % |
| DFC Global Corp. (a) | | | 25,550 | | | | 560,056 | | | | 0.30 | % |
| Grupo Financiero Galicia SA – ADR (b) | | | 228,100 | | | | 1,884,106 | | | | 1.01 | % |
| iStar Financial, Inc. (a) | | | 505,600 | | | | 3,433,024 | | | | 1.84 | % |
| Newcastle Investment Corp. | | | 596,100 | | | | 2,736,099 | | | | 1.46 | % |
| | | | | | | | 12,833,478 | | | | 6.87 | % |
| Health Care – 1.84% | | | | | | | | | | | | |
| Amerigroup Corp. (a) | | | 7,700 | | | | 428,351 | | | | 0.23 | % |
| Coventry Health Care, Inc. (a) | | | 15,250 | | | | 485,102 | | | | 0.26 | % |
| Healthspring, Inc. (a) | | | 12,300 | | | | 663,462 | | | | 0.35 | % |
| MedCath Corp. (a) | | | 259,500 | | | | 1,868,400 | | | | 1.00 | % |
| | | | | | | | 3,445,315 | | | | 1.84 | % |
| Industrials – 22.80% | | | | | | | | | | | | |
| AAR Corp. | | | 18,400 | | | | 366,712 | | | | 0.20 | % |
The accompanying notes are an integral part of these financial statements.
| HENNESSY FUNDS | 1-800-966-4354 |
| COMMON STOCKS | | Number | | | | | | % of Net | |
| | | of Shares | | | Value | | | Assets | |
| Industrials (Continued) | | | | | | | | | |
| Air Transport Services Group, Inc. (a) | | | 441,700 | | | $ | 2,447,018 | | | | 1.31 | % |
| Altra Holdings, Inc. (a) | | | 22,250 | | | | 327,075 | | | | 0.17 | % |
| Amerco (a) | | | 33,700 | | | | 2,551,427 | | | | 1.36 | % |
| Cascade Corp. | | | 10,500 | | | | 452,550 | | | | 0.24 | % |
| Commercial Vehicle Group, Inc. (a) | | | 201,200 | | | | 2,219,236 | | | | 1.19 | % |
| Dycom Industries, Inc. (a) | | | 32,400 | | | | 629,532 | | | | 0.34 | % |
| EnPro Industries, Inc. (a) | | | 11,400 | | | | 392,616 | | | | 0.21 | % |
| Greenbrier Companies, Inc. | | | 154,100 | | | | 2,867,801 | | | | 1.53 | % |
| Interface, Inc. | | | 226,900 | | | | 2,958,776 | | | | 1.58 | % |
| Macquarie Infrastructure Co. LLC | | | 21,200 | | | | 559,044 | | | | 0.30 | % |
| Mueller Industries, Inc. | | | 12,250 | | | | 495,513 | | | | 0.27 | % |
| NACCO Industries, Inc. | | | 32,900 | | | | 2,701,090 | | | | 1.44 | % |
| Sauer-Danfoss, Inc. | | | 112,200 | | | | 4,344,384 | | | | 2.32 | % |
| Sykes Enterprises, Inc. (a) | | | 27,400 | | | | 436,482 | | | | 0.23 | % |
| The Timken Co. | | | 73,900 | | | | 3,112,668 | | | | 1.67 | % |
| Titan International, Inc. | | | 190,200 | | | | 4,279,500 | | | | 2.29 | % |
| Trimas Corp. (a) | | | 179,300 | | | | 3,494,557 | | | | 1.87 | % |
| United Continental Holdings, Inc. (a) | | | 135,200 | | | | 2,612,064 | | | | 1.40 | % |
| United Rentals, Inc. (a) | | | 150,100 | | | | 3,513,841 | | | | 1.88 | % |
| US Airways Group, Inc. (a) | | | 322,900 | | | | 1,863,133 | | | | 1.00 | % |
| | | | | | | | 42,625,019 | | | | 22.80 | % |
| Information Technology – 5.21% | | | | | | | | | | | | |
| DDi Corp. | | | 302,900 | | | | 2,783,651 | | | | 1.49 | % |
| Kemet Corp. (a) | | | 274,200 | | | | 2,528,124 | | | | 1.35 | % |
| Newport Corp. (a) | | | 206,500 | | | | 2,860,025 | | | | 1.53 | % |
| Power One, Inc. (a) | | | 316,800 | | | | 1,568,160 | | | | 0.84 | % |
| | | | | | | | 9,739,960 | | | | 5.21 | % |
| Materials – 12.88% | | | | | | | | | | | | |
| Buckeye Technologies, Inc. | | | 168,000 | | | | 5,080,320 | | | | 2.72 | % |
| Innophos Holdings, Inc. | | | 11,350 | | | | 499,286 | | | | 0.27 | % |
| Innospec, Inc. | | | 162,200 | | | | 4,898,440 | | | | 2.62 | % |
| LSB Industries, Inc. (a) | | | 12,700 | | | | 449,961 | | | | 0.24 | % |
The accompanying notes are an integral part of these financial statements.
WWW.HENNESSYFUNDS.COM
| COMMON STOCKS | | Number | | | | | | % of Net | |
| | | of Shares | | | Value | | | Assets | |
| Materials (Continued) | | | | | | | | | |
| Materion Corp. (a) | | | 91,900 | | | $ | 2,429,836 | | | | 1.30 | % |
| Mercer International, Inc. (a) | | | 519,700 | | | | 3,575,536 | | | | 1.91 | % |
| Quaker Chemical Corp. | | | 85,400 | | | | 2,971,066 | | | | 1.59 | % |
| Rockwood Holdings, Inc. (a) | | | 9,750 | | | | 448,890 | | | | 0.24 | % |
| TPC Group, Inc. (a) | | | 139,300 | | | | 2,767,891 | | | | 1.48 | % |
| Universal Stainless & Alloy (a) | | | 11,900 | | | | 448,035 | | | | 0.24 | % |
| W.R. Grace & Co. (a) | | | 12,150 | | | | 507,749 | | | | 0.27 | % |
| | | | | | | | 24,077,010 | | | | 12.88 | % |
| Telecommunication Services – 2.33% | | | | | | | | | | | | |
| General Communication, Inc. (a) | | | 283,000 | | | | 2,674,350 | | | | 1.43 | % |
| IDT Corp. | | | 122,500 | | | | 1,408,750 | | | | 0.75 | % |
| MetroPCS Communications, Inc. (a) | | | 32,900 | | | | 279,650 | | | | 0.15 | % |
| | | | | | | | 4,362,750 | | | | 2.33 | % |
| Utilities – 0.54% | | | | | | | | | | | | |
| Genie Energy Ltd. (a) | | | 122,500 | | | | 1,016,750 | | | | 0.54 | % |
| | | | | | | | | | | | | |
Total Common Stocks (Cost $194,792,944) | | | | | | | 174,714,166 | | | | 93.46 | % |
| | | | | | | | | | | | | |
| PARTNERSHIPS – 5.67% | | | | | | | | | | | | |
| Energy – 5.67% | | | | | | | | | | | | |
| Atlas Energy, L.P. | | | 238,400 | | | | 5,657,232 | | | | 3.03 | % |
| Atlas Pipeline Partners, L.P. | | | 141,900 | | | | 4,938,120 | | | | 2.64 | % |
| | | | | | | | 10,595,352 | | | | 5.67 | % |
Total Partnerships (Cost $6,753,604) | | | | | | | 10,595,352 | | | | 5.67 | % |
The accompanying notes are an integral part of these financial statements.
| HENNESSY FUNDS | 1-800-966-4354 |
| SHORT-TERM INVESTMENTS – 1.20% | | Number | | | | | | % of Net | |
| | | of Shares | | | Value | | | Assets | |
| Demand Notes# – 0.43% | | | | | | | | | |
| American Family Financial Services, 0.10% | | | 805,690 | | | $ | 805,690 | | | | 0.43 | % |
Total Demand Notes (Cost $805,690) | | | | | | | 805,690 | | | | 0.43 | % |
| | | | | | | | | | | | | |
| Money Market Funds – 0.77% | | | | | | | | | | | | |
| Fidelity Government Portfolio – | | | | | | | | | | | | |
| Institutional Class, 0.01% (c) | | | 1,432,022 | | | | 1,432,022 | | | | 0.77 | % |
| | | | | | | | | | | | | |
| Total Money Markets | | | | | | | | | | | | |
| (Cost $1,432,022) | | | | | | | 1,432,022 | | | | 0.77 | % |
| | | | | | | | | | | | | |
| Total Short-Term Investments | | | | | | | | | | | | |
| (Cost $2,237,712) | | | | | | | 2,237,712 | | | | 1.20 | % |
| | | | | | | | | | | | | |
Total Investments – 100.33% | | | | | | | | | | | | |
| (Cost $203,784,260) | | | | | | | 187,547,230 | | | | 100.33 | % |
| | | | | | | | | | | | | |
| Liabilities in Excess of Other Assets – (0.33)% | | | | | | | (617,807 | ) | | | (0.33 | )% |
TOTAL NET ASSETS – 100.00% | | | | | | $ | 186,929,423 | | | | 100.00 | % |
Percentages are stated as a percent of net assets.
| (a) | | Non-income producing security. |
| (b) | | U.S. traded security of a foreign corporation. |
| (c) | | The rate listed is the fund’s 7-day yield as of October 31, 2011. |
| # | | Variable rate demand notes are considered short-term obligations and are payable on demand. Interest rates change periodically on specified dates. Interest rates listed are as of October 31, 2011. |
The accompanying notes are an integral part of these financial statements.
WWW.HENNESSYFUNDS.COM
Summary of Fair Value Exposure at October 31, 2011
The following is a summary of the inputs used to value the Fund’s net assets as of October 31, 2011 (See Note 3 in the accompanying notes to the financial statements):
| Common Stock | | Level 1 | | | Level 2 | | | Level 3 | | | Total | |
| Consumer Discretionary | | $ | 58,724,236 | | | $ | — | | | $ | — | | | $ | 58,724,236 | |
| Consumer Staples | | | 10,584,370 | | | | — | | | | — | | | | 10,584,370 | |
| Energy | | | 7,305,278 | | | | — | | | | — | | | | 7,305,278 | |
| Financials | | | 12,833,478 | | | | — | | | | — | | | | 12,833,478 | |
| Health Care | | | 3,445,315 | | | | — | | | | — | | | | 3,445,315 | |
| Industrials | | | 42,625,019 | | | | — | | | | — | | | | 42,625,019 | |
| Information Technology | | | 9,739,960 | | | | — | | | | — | | | | 9,739,960 | |
| Materials | | | 24,077,010 | | | | — | | | | — | | | | 24,077,010 | |
| Telecommunication Services | | | 4,362,750 | | | | — | | | | — | | | | 4,362,750 | |
| Utilities | | | 1,016,750 | | | | — | | | | — | | | | 1,016,750 | |
| Total Common Stock | | $ | 174,714,166 | | | $ | — | | | $ | — | | | $ | 174,714,166 | |
| Partnerships | | | | | | | | | | | | | | | | |
| Energy | | $ | 10,595,352 | | | | — | | | | — | | | $ | 10,595,352 | |
| Total Partnerships | | $ | 10,595,352 | | | $ | — | | | $ | — | | | $ | 10,595,352 | |
| Short-Term Investments | | | | | | | | | | | | | | | | |
| Money Market Funds | | $ | 1,432,022 | | | $ | — | | | | — | | | $ | 1,432,022 | |
| Demand Notes | | | — | | | | 805,690 | | | | — | | | | 805,690 | |
| Total Short-Term Investments | | $ | 1,432,022 | | | $ | 805,690 | | | $ | — | | | $ | 2,237,712 | |
| Total Investments in Securities | | $ | 186,741,540 | | | $ | 805,690 | | | $ | — | | | $ | 187,547,230 | |
Transfers between levels are recognized at the end of the reporting period. During the period ended October 31, 2011, the Fund recognized no transfers between levels.
The accompanying notes are an integral part of these financial statements.
| HENNESSY FUNDS | 1-800-966-4354 |
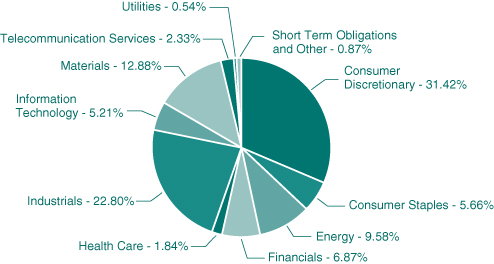
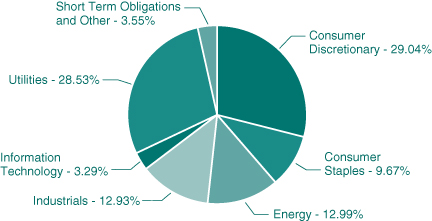
As of October 31, 2011
(% of Net Assets)
| TOP TEN EQUITY HOLDINGS | % of net assets |
| Triumph Group, Inc. | 3.56% |
| PriceSmart, Inc. | 3.36% |
| Sally Beauty Holdings, Inc. | 3.36% |
| Casey’s General Stores, Inc. | 3.33% |
| World Fuel Services Corp. | 3.30% |
| Oneok Partners, L.P. | 3.29% |
| Jabil Circuit, Inc. | 3.29% |
| Towers Watson & Co. | 3.28% |
| New Jersey Resources Corp. | 3.27% |
| LKQ Corp. | 3.26% |
WWW.HENNESSYFUNDS.COM
| | COMMON STOCKS – 89.97% | | Number | | | | | | % of | |
| | | | of Shares | | | Value | | | Net Assets | |
| | Consumer Discretionary – 29.04% | | | | | | | | | |
| | Dominos Pizza, Inc. (a) | | | 171,600 | | | $ | 5,496,348 | | | | 3.23 | % |
| | Family Dollar Stores, Inc. | | | 92,300 | | | | 5,411,549 | | | | 3.18 | % |
| | Genesco, Inc. (a) | | | 94,000 | | | | 5,540,360 | | | | 3.25 | % |
| | Genuine Parts Co. | | | 95,400 | | | | 5,478,822 | | | | 3.22 | % |
| | HSN, Inc. | | | 152,300 | | | | 5,432,541 | | | | 3.19 | % |
| | LKQ Corp. (a) | | | 190,300 | | | | 5,552,954 | | | | 3.26 | % |
| | Petsmart, Inc. | | | 113,900 | | | | 5,347,605 | | | | 3.14 | % |
| | Ross Stores, Inc. | | | 62,400 | | | | 5,474,352 | | | | 3.21 | % |
| | Sally Beauty Holdings, Inc. (a) | | | 298,300 | | | | 5,724,377 | | | | 3.36 | % |
| | | | | | | | | 49,458,908 | | | | 29.04 | % |
| | Consumer Staples – 9.67% | | | | | | | | | | | | |
| | Casey’s General Stores, Inc. | | | 114,300 | | | | 5,663,565 | | | | 3.33 | % |
| | Dr. Pepper Snapple Group, Inc. | | | 135,700 | | | | 5,081,965 | | | | 2.98 | % |
| | PriceSmart, Inc. | | | 75,300 | | | | 5,725,812 | | | | 3.36 | % |
| | | | | | | | | 16,471,342 | | | | 9.67 | % |
| | Energy – 6.51% | | | | | | | | | | | | |
| | Tesoro Corp. | | | 210,800 | | | | 5,468,152 | | | | 3.21 | % |
| | World Fuel Services Corp. | | | 140,800 | | | | 5,610,880 | | | | 3.30 | % |
| | | | | | | | | 11,079,032 | | | | 6.51 | % |
| | Industrials – 12.93% | | | | | | | | | | | | |
| | Mueller Industries, Inc. | | | 122,300 | | | | 4,947,035 | | | | 2.90 | % |
| | Teledyne Technologies, Inc. (a) | | | 99,700 | | | | 5,430,659 | | | | 3.19 | % |
| | Towers Watson & Co. | | | 85,132 | | | | 5,593,173 | | | | 3.28 | % |
| | Triumph Group, Inc. | | | 104,200 | | | | 6,054,020 | | | | 3.56 | % |
| | | | | | | | | 22,024,887 | | | | 12.93 | % |
| | Information Technology – 3.29% | | | | | | | | | | | | |
| | Jabil Circuit, Inc. | | | 272,300 | | | | 5,598,488 | | | | 3.29 | % |
| | | | | | | | | | | | | | |
| | Utilities – 28.53% | | | | | | | | | | | | |
| | Alliant Energy Corp. | | | 131,100 | | | | 5,346,258 | | | | 3.14 | % |
| | Centerpoint Energy, Inc. | | | 257,500 | | | | 5,366,300 | | | | 3.15 | % |
| | CMS Energy Corp. | | | 259,700 | | | | 5,406,954 | | | | 3.18 | % |
| | New Jersey Resources Corp. | | | 118,600 | | | | 5,576,572 | | | | 3.27 | % |
| | NiSource, Inc. | | | 239,300 | | | | 5,286,137 | | | | 3.10 | % |
The accompanying notes are an integral part of these financial statements.
| HENNESSY FUNDS | 1-800-966-4354 |
| | COMMON STOCKS | | Number | | | | | | % of | |
| | | | of Shares | | | Value | | | Net Assets | |
| | Utilities (Continued) | | | | | | | | | |
| | Pinnacle West Capital Corp. | | | 117,400 | | | $ | 5,351,092 | | | | 3.14 | % |
| | Scana Corp. | | | 128,000 | | | | 5,411,840 | | | | 3.18 | % |
| | UIL Holdings Corp. | | | 161,200 | | | | 5,493,696 | | | | 3.23 | % |
| | Westar Energy, Inc. | | | 196,400 | | | | 5,353,864 | | | | 3.14 | % |
| | | | | | | | | 48,592,713 | | | | 28.53 | % |
| | | | | | | | | | | | | | |
| | Total Common Stocks (Cost $150,319,554) | | | | | | | 153,225,370 | | | | 89.97 | % |
| | | | | | | | | | | | | | |
| | PARTNERSHIPS – 6.48% | | | | | | | | | | | | |
| | Energy – 6.48% | | | | | | | | | | | | |
| | Oneok Partners, L.P. | | | 112,100 | | | | 5,605,000 | | | | 3.29 | % |
| | Sunoco Logistics Partners, L.P. | | | 55,200 | | | | 5,425,056 | | | | 3.19 | % |
| | | | | | | | | | | | | | |
| | | | | | | | | 11,030,056 | | | | 6.48 | % |
| | | | | | | | | | | | | | |
| | Total Partnerships (Cost $10,852,253) | | | | | | | 11,030,056 | | | | 6.48 | % |
| | | | | | | | | | | | | | |
| | SHORT-TERM INVESTMENTS – 3.49% | | | | | | | | | | | | |
| | | | | | | | | | | | | | |
| | Demand Notes# – 0.44% | | | | | | | | | | | | |
| | American Family Financial Services, 0.10% | | | 747,860 | | | | 747,860 | | | | 0.44 | % |
| | | | | | | | | | | | | | |
| | Total Demand Notes (Cost $967,368) | | | | | | | 747,860 | | | | 0.44 | % |
| | | | | | | | | | | | | | |
| | Money Market Funds – 3.05% | | | | | | | | | | | | |
| | Fidelity Government Portfolio – | | | | | | | | | | | | |
| | Institutional Class, 0.01% (b) | | | 5,194,180 | | | | 5,194,180 | | | | 3.05 | % |
| | | | | | | | | | | | | | |
| | Total Money Market Funds | | | | | | | | | | | | |
| | (Cost $4,974,672) | | | | | | | 5,194,180 | | | | 3.05 | % |
| | | | | | | | | | | | | | |
| | Total Short-Term Investments | | | | | | | | | | | | |
| | (Cost $5,942,040) | | | | | | | 5,942,040 | | | | 3.49 | % |
| | | | | | | | | | | | | | |
| | Total Investments – 99.94% | | | | | | | | | | | | |
| | (Cost $167,113,847) | | | | | | | 170,197,466 | | | | 99.94 | % |
| | | | | | | | | | | | | | |
| | Other Assets in Excess of Liabilities – 0.06% | | | | | | | 97,848 | | | | 0.06 | % |
| | TOTAL NET ASSETS – 100.00% | | | | | | $ | 170,295,314 | | | | 100.00 | % |
Percentages are stated as a percent of net assets.
| | | |
| (a) | | Non-income producing security. |
| (b) | | The rate listed is the fund’s 7-day yield as of October 31, 2011. |
| # | | Variable rate demand notes are considered short-term obligations and are payable on demand. Interest rates change periodically on specified dates. Interest rates listed are as of October 31, 2011. |
The accompanying notes are an integral part of these financial statements.
WWW.HENNESSYFUNDS.COM
Summary of Fair Value Exposure at October 31, 2011
The following is a summary of the inputs used to value the Fund’s net assets as of October 31, 2011 (See Note 3 in the accompanying notes to the financial statements):
| Common Stock | | Level 1 | | | Level 2 | | | Level 3 | | | Total | |
| Consumer Discretionary | | $ | 49,458,908 | | | $ | — | | | $ | — | | | $ | 49,458,908 | |
| Consumer Staples | | | 16,471,342 | | | | — | | | | — | | | | 16,471,342 | |
| Energy | | | 11,079,032 | | | | — | | | | — | | | | 11,079,032 | |
| Industrials | | | 22,024,887 | | | | — | | | | — | | | | 22,024,887 | |
| Information Technology | | | 5,598,488 | | | | — | | | | — | | | | 5,598,488 | |
| Utilities | | | 48,592,713 | | | | — | | | | — | | | | 48,592,713 | |
| Total Common Stock | | $ | 153,225,370 | | | $ | — | | | $ | — | | | $ | 153,225,370 | |
| Partnerships | | | | | | | | | | | | | | | | |
| Energy | | $ | 11,030,056 | | | $ | — | | | $ | — | | | $ | 11,030,056 | |
| Total Partnerships | | $ | 11,030,056 | | | $ | — | | | $ | — | | | $ | 11,030,056 | |
| Short-Term Investments | | | | | | | | | | | | | | | | |
| Money Market Funds | | $ | 5,194,180 | | | $ | — | | | $ | — | | | | 5,194,180 | |
| Demand Notes | | | — | | | | 747,860 | | | | — | | | | 747,860 | |
| Total Short-Term Investments | | $ | 5,194,180 | | | $ | 747,860 | | �� | $ | — | | | $ | 5,942,040 | |
| Total Investments in Securities | | $ | 169,449,606 | | | $ | 747,860 | | | $ | — | | | $ | 170,197,466 | |
Transfers between levels are recognized at the end of the reporting period. During the period ended October 31, 2011, the Fund recognized no transfers between levels.
Level 3 Reconciliation Disclosure
Following is a reconciliation of Level 3 assets for which significant unobservable inputs were used to determine fair value.
| | | Warrants(1) | |
| Balance as of 10/31/10 | | $ | — | |
| Accrued discounts/premiums | | | — | |
| Realized gain (loss) | | | — | |
| Change in unrealized appreciation (depreciation) | | | — | |
| Purchases | | | — | |
| (Sales) | | | — | |
| Transfer in and/or out of Level 3 | | | — | |
| Balance as of 10/31/11 | | $ | — | |
| Change in unrealized appreciation/depreciation during | | | | |
| the year for level 3 investments held at October 31, 2011 | | $ | — | |
| (1) | The Lantronix, Inc. warrants held on October 31, 2010 expired in February 2011. |
The accompanying notes are an integral part of these financial statements.
| HENNESSY FUNDS | 1-800-966-4354 |
LARGE GROWTH FUND
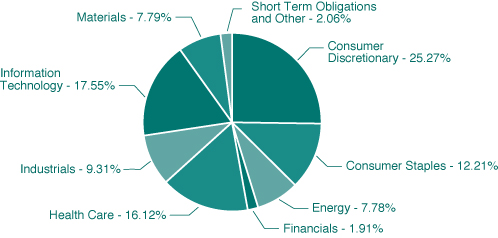
As of October 31, 2011
(% of Net Assets)
| | TOP TEN EQUITY HOLDINGS | % of net assets |
| | Newmont Mining Corp. | 2.69% |
| | Apollo Group, Inc. | 2.43% |
| | TJX Companies, Inc. | 2.37% |
| | International Business Machines Corp. | 2.34% |
| | Humana, Inc. | 2.33% |
| | Mattel, Inc. | 2.29% |
| | Microsoft Corp. | 2.26% |
| | Intel Corp. | 2.25% |
| | Nordstrom, Inc. | 2.24% |
| | Kimberly Clark Corp. | 2.22% |
WWW.HENNESSYFUNDS.COM
| | COMMON STOCKS – 97.94% | | Number of | | | | | | % of | |
| | | | Shares | | | Value | | | Net Assets | |
| | Consumer Discretionary – 25.27% | | | | | | | | | |
| | Advance Auto Parts, Inc. | | | 24,400 | | | $ | 1,587,708 | | | | 2.04 | % |
| | AMC Networks, Inc. (a) | | | 11,925 | | | | 388,994 | | | | 0.50 | % |
| | Apollo Group, Inc. (a) | | | 40,100 | | | | 1,898,735 | | | | 2.43 | % |
| | Autoliv, Inc. | | | 21,700 | | | | 1,253,609 | | | | 1.61 | % |
| | Best Buy Co., Inc. | | | 55,100 | | | | 1,445,273 | | | | 1.85 | % |
| | Cablevision Systems Corp. | | | 35,700 | | | | 516,579 | | | | 0.66 | % |
| | DIRECTV (a) | | | 33,900 | | | | 1,541,094 | | | | 1.98 | % |
| | Dish Network Corp. (a) | | | 57,200 | | | | 1,382,524 | | | | 1.77 | % |
| | Limited Brands, Inc. | | | 40,000 | | | | 1,708,400 | | | | 2.19 | % |
| | Mattel, Inc. | | | 63,400 | | | | 1,790,416 | | | | 2.29 | % |
| | Nordstrom, Inc. | | | 34,400 | | | | 1,743,736 | | | | 2.24 | % |
| | The Gap, Inc. | | | 73,300 | | | | 1,385,370 | | | | 1.78 | % |
| | TJX Companies, Inc. | | | 31,400 | | | | 1,850,402 | | | | 2.37 | % |
| | TRW Automotive Holdings Corp. (a) | | | 29,000 | | | | 1,220,900 | | | | 1.56 | % |
| | | | | | | | | 19,713,740 | | | | 25.27 | % |
| | Consumer Staples – 12.21% | | | | | | | | | | | | |
| | Campbell Soup Co. | | | 49,800 | | | | 1,655,850 | | | | 2.12 | % |
| | General Mills, Inc. | | | 43,200 | | | | 1,664,496 | | | | 2.13 | % |
| | Kimberly Clark Corp. | | | 24,800 | | | | 1,728,808 | | | | 2.22 | % |
| | Sysco Corp. | | | 53,800 | | | | 1,491,336 | | | | 1.91 | % |
| | Walgreen Co. | | | 38,000 | | | | 1,261,600 | | | | 1.62 | % |
| | Wal-Mart Stores, Inc. | | | 30,400 | | | | 1,724,288 | | | | 2.21 | % |
| | | | | | | | | 9,526,378 | | | | 12.21 | % |
| | Energy – 7.78% | | | | | | | | | | | | |
| | Chevron Corp. | | | 16,400 | | | | 1,722,820 | | | | 2.21 | % |
| | Cimarex Energy Co. | | | 18,100 | | | | 1,158,400 | | | | 1.48 | % |
| | Diamond Offshore Drilling, Inc. | | | 24,000 | | | | 1,572,960 | | | | 2.02 | % |
| | Exxon Mobil Corp. | | | 20,700 | | | | 1,616,463 | | | | 2.07 | % |
| | | | | | | | | 6,070,643 | | | | 7.78 | % |
| | Financials – 1.91% | | | | | | | | | | | | |
| | The Progressive Corp. | | | 78,400 | | | | 1,490,384 | | | | 1.91 | % |
| | | | | | | | | | | | | | |
| | Health Care – 16.12% | | | | | | | | | | | | |
| | Aetna, Inc. | | | 39,200 | | | | 1,558,592 | | | | 2.00 | % |
The accompanying notes are an integral part of these financial statements.
| HENNESSY FUNDS | 1-800-966-4354 |
| | COMMON STOCKS | | Number of | | | | | | % of | |
| | | | Shares | | | Value | | | Net Assets | |
| | Health Care (Continued) | | | | | | | | | |
| | CIGNA Corp. | | | 35,100 | | | $ | 1,556,334 | | | | 1.99 | % |
| | Eli Lilly & Co. | | | 43,800 | | | | 1,627,608 | | | | 2.09 | % |
| | Forest Laboratories, Inc. (a) | | | 49,900 | | | | 1,561,870 | | | | 2.00 | % |
| | Gilead Sciences, Inc. (a) | | | 41,100 | | | | 1,712,226 | | | | 2.19 | % |
| | HCA Holdings, Inc. (a) | | | 48,500 | | | | 1,137,325 | | | | 1.46 | % |
| | Humana, Inc. | | | 21,400 | | | | 1,816,646 | | | | 2.33 | % |
| | UnitedHealth Group, Inc. | | | 33,500 | | | | 1,607,665 | | | | 2.06 | % |
| | | | | | | | | 12,578,266 | | | | 16.12 | % |
| | Industrials – 9.31% | | | | | | | | | | | | |
| | General Dynamics Corp. | | | 22,400 | | | | 1,437,856 | | | | 1.84 | % |
| | Lockheed Martin Corp. | | | 21,100 | | | | 1,601,490 | | | | 2.05 | % |
| | Raytheon Co. | | | 34,000 | | | | 1,502,460 | | | | 1.93 | % |
| | The Boeing Co. | | | 21,200 | | | | 1,394,748 | | | | 1.79 | % |
| | The Timken Co. | | | 31,600 | | | | 1,330,992 | | | | 1.70 | % |
| | | | | | | | | 7,267,546 | | | | 9.31 | % |
| | Information Technology – 17.55% | | | | | | | | | | | | |
| | Applied Materials, Inc. | | | 112,400 | | | | 1,384,768 | | | | 1.77 | % |
| | Dell, Inc. (a) | | | 100,200 | | | | 1,584,162 | | | | 2.03 | % |
| | Harris Corp. | | | 34,300 | | | | 1,294,825 | | | | 1.66 | % |
| | Hewlett-Packard Co. | | | 40,800 | | | | 1,085,688 | | | | 1.39 | % |
| | Intel Corp. | | | 71,600 | | | | 1,757,064 | | | | 2.25 | % |
| | International Business Machines Corp. | | | 9,900 | | | | 1,827,837 | | | | 2.34 | % |
| | LAM Research Corp. (a) | | | 35,500 | | | | 1,526,145 | | | | 1.96 | % |
| | Microsoft Corp. | | | 66,100 | | | | 1,760,243 | | | | 2.26 | % |
| | Texas Instruments, Inc. | | | 48,000 | | | | 1,475,040 | | | | 1.89 | % |
| | | | | | | | | 13,695,772 | | | | 17.55 | % |
| | Materials – 7.79% | | | | | | | | | | | | |
| | Cliffs Natural Resources Inc. | | | 19,600 | | | | 1,337,112 | | | | 1.72 | % |
| | Eastman Chemical Co. | | | 31,600 | | | | 1,241,564 | | | | 1.59 | % |
| | Freeport-McMoRan Copper & Gold, Inc. | | | 34,700 | | | | 1,397,022 | | | | 1.79 | % |
| | Newmont Mining Corp. | | | 31,400 | | | | 2,098,462 | | | | 2.69 | % |
| | | | | | | | | | | | | | |
| | | | | | | | | 6,074,160 | | | | 7.79 | % |
| | | | | | | | | | | | | | |
| | Total Common Stocks (Cost $77,797,221) | | | | | | | 76,416,889 | | | | 97.94 | % |
The accompanying notes are an integral part of these financial statements.
WWW.HENNESSYFUNDS.COM
| | SHORT-TERM INVESTMENTS – 2.20% | | Number | | | | | | % of | |
| | | | of Shares | | | Value | | | Net Assets | |
| | Money Market Funds – 2.20% | | | | | | | | | |
| | Fidelity Government Portfolio – | | | | | | | | | |
| | Institutional Class, 0.01% (b) | | | 1,719,591 | | | $ | 1,719,591 | | | | 2.20 | % |
| | | | | | | | | | | | | | |
| | Total Short-Term Investments | | | | | | | | | | | | |
| | (Cost $1,719,591) | | | | | | | 1,719,591 | | | | 2.20 | % |
| | | | | | | | | | | | | | |
| | Total Investments – 100.14% | | | | | | | | | | | | |
| | (Cost $79,516,812) | | | | | | | 78,136,480 | | | | 100.14 | % |
| | | | | | | | | | | | | | |
| | Liabilities in Excess of Other Assets – (0.14)% | | | | | | | (113,368 | ) | | | (0.14 | )% |
| | TOTAL NET ASSETS – 100.00% | | | | | | $ | 78,023,112 | | | | 100.00 | % |
Percentages are stated as a percent of net assets.
| | | | |
| | (a) | | Non-income producing security. |
| | (b) | | The rate listed is the fund’s 7-day yield as of October 31, 2011. |
Summary of Fair Value Exposure at October 31, 2011
The following is a summary of the inputs used to value the Fund’s net assets as of October 31, 2011 (See Note 3 in the accompanying notes to the financial statements):
| | Common Stock | | Level 1 | | | Level 2 | | | Level 3 | | | Total | |
| | Consumer Discretionary | | $ | 19,713,740 | | | $ | — | | | $ | — | | | $ | 19,713,740 | |
| | Consumer Staples | | | 9,526,378 | | | | — | | | | — | | | | 9,526,378 | |
| | Energy | | | 6,070,643 | | | | — | | | | — | | | | 6,070,643 | |
| | Financials | | | 1,490,384 | | | | — | | | | — | | | | 1,490,384 | |
| | Health Care | | | 12,578,266 | | | | — | | | | — | | | | 12,578,266 | |
| | Industrials | | | 7,267,546 | | | | — | | | | — | | | | 7,267,546 | |
| | Information Technology | | | 13,695,772 | | | | — | | | | — | | | | 13,695,772 | |
| | Materials | | | 6,074,160 | | | | — | | | | — | | | | 6,074,160 | |
| | Total Common Stock | | $ | 76,416,889 | | | $ | — | | | $ | — | | | $ | 76,416,889 | |
| | Short-Term Investments | | | | | | | | | | | | | | | | |
| | Money Market Funds | | $ | 1,719,591 | | | $ | — | | | $ | — | | | $ | 1,719,591 | |
| | Total Investments in Securities | | $ | 78,136,480 | | | $ | — | | | $ | — | | | $ | 78,136,480 | |
Transfers between levels are recognized at the end of the reporting period. During the period ended October 31, 2011, the Fund recognized no transfers between levels.
The accompanying notes are an integral part of these financial statements.
| HENNESSY FUNDS | 1-800-966-4354 |
HENNESSY CORNERSTONE VALUE FUND
As of October 31, 2011
(% of Net Assets)
| | TOP TEN EQUITY HOLDINGS | % of net assets |
| | Chevron Corp. | 2.31% |
| | BCE, Inc. | 2.24% |
| | Marsh & McLennan Companies, Inc. | 2.23% |
| | Bristol-Myers Squibb Co. | 2.23% |
| | Mattel, Inc. | 2.23% |
| | Statoil ASA – ADR | 2.22% |
| | Philips Morris International, Inc. | 2.19% |
| | ConAgra Foods, Inc. | 2.18% |
| | Intel Corp. | 2.14% |
| | Automatic Data Processing, Inc. | 2.14% |
WWW.HENNESSYFUNDS.COM
| | COMMON STOCKS – 94.21% | | Number | | | | | | % of Net | |
| | | | of Shares | | | Value | | | Assets | |
| | Consumer Discretionary – 2.23% | | | | | | | | | |
| | Mattel, Inc. | | | 92,800 | | | $ | 2,620,672 | | | | 2.23 | % |
| | | | | | | | | | | | | | |
| | Consumer Staples – 22.40% | | | | | | | | | | | | |
| | Altria Group, Inc. | | | 88,500 | | | | 2,438,175 | | | | 2.07 | % |
| | Campbell Soup Co. | | | 63,000 | | | | 2,094,750 | | | | 1.78 | % |
| | ConAgra Foods, Inc. | | | 101,100 | | | | 2,560,863 | | | | 2.18 | % |
| | Diageo PLC – ADR (b) | | | 29,300 | | | | 2,428,384 | | | | 2.07 | % |
| | General Mills, Inc. | | | 60,900 | | | | 2,346,477 | | | | 2.00 | % |
| | H.J. Heinz Co. | | | 45,400 | | | | 2,426,176 | | | | 2.06 | % |
| | Kellogg Co. | | | 44,800 | | | | 2,428,608 | | | | 2.07 | % |
| | Kimberly Clark Corp. | | | 35,100 | | | | 2,446,821 | | | | 2.08 | % |
| | Kraft Foods, Inc. | | | 71,000 | | | | 2,497,780 | | | | 2.12 | % |
| | Philip Morris International, Inc. | | | 36,800 | | | | 2,571,216 | | | | 2.19 | % |
| | Sysco Corp. | | | 75,600 | | | | 2,095,632 | | | | 1.78 | % |
| | | | | | | | | 26,334,882 | | | | 22.40 | % |
| | Energy – 14.15% | | | | | | | | | | | | |
| | Chevron Corp. | | | 25,800 | | | | 2,710,290 | | | | 2.31 | % |
| | ConocoPhillips | | | 35,200 | | | | 2,451,680 | | | | 2.09 | % |
| | ENI SPA – ADR (b) | | | 49,300 | | | | 2,170,186 | | | | 1.85 | % |
| | Petrochina Co. Ltd. – ADR (b) | | | 16,900 | | | | 2,190,409 | | | | 1.86 | % |
| | Royal Dutch Shell PLC – ADR (b) | | | 33,400 | | | | 2,368,394 | | | | 2.01 | % |
| | Statoil ASA – ADR (b) | | | 102,800 | | | | 2,614,204 | | | | 2.22 | % |
| | Total SA – ADR (b) | | | 40,700 | | | | 2,128,610 | | | | 1.81 | % |
| | | | | | | | | 16,633,773 | | | | 14.15 | % |
| | Financials – 2.23% | | | | | | | | | | | | |
| | Marsh & McLennan Companies, Inc. | | | 85,800 | | | | 2,627,196 | | | | 2.23 | % |
| | | | | | | | | | | | | | |
| | Health Care – 18.37% | | | | | | | | | | | | |
| | Abbott Labs | | | 45,400 | | | | 2,445,698 | | | | 2.08 | % |
| | Bristol-Myers Squibb Co. | | | 83,000 | | | | 2,621,970 | | | | 2.23 | % |
| | Eli Lilly & Co. | | | 63,100 | | | | 2,344,796 | | | | 1.99 | % |
| | GlaxoSmithKline PLC – ADR (b) | | | 55,700 | | | | 2,494,803 | | | | 2.12 | % |
| | Johnson & Johnson | | | 34,100 | | | | 2,195,699 | | | | 1.87 | % |
| | Merck & Co., Inc. | | | 63,300 | | | | 2,183,850 | | | | 1.86 | % |
| | Pfizer, Inc. | | | 130,500 | | | | 2,513,430 | | | | 2.14 | % |
The accompanying notes are an integral part of these financial statements.
| HENNESSY FUNDS | 1-800-966-4354 |
| | COMMON STOCKS | | Number | | | | | | % of Net | |
| | | | of Shares | | | Value | | | Assets | |
| | Health Care (Continued) | | | | | | | | | |
| | Roche Holdings Ltd. – ADR (b) | | | 60,300 | | | $ | 2,466,270 | | | | 2.10 | % |
| | Sanofi Aventis – ADR (b) | | | 65,000 | | | | 2,323,750 | | | | 1.98 | % |
| | | | | | | | | 21,590,266 | | | | 18.37 | % |
| | Industrials – 7.17% | | | | | | | | | | | | |
| | Lockheed Martin Corp. | | | 31,500 | | | | 2,390,850 | | | | 2.03 | % |
| | Pitney Bowes, Inc. | | | 93,700 | | | | 1,909,606 | | | | 1.62 | % |
| | Raytheon Co. | | | 47,000 | | | | 2,076,930 | | | | 1.77 | % |
| | Waste Management, Inc. | | | 62,500 | | | | 2,058,125 | | | | 1.75 | % |
| | | | | | | | | 8,435,511 | | | | 7.17 | % |
| | Information Technology – 7.61% | | | | | | | | | | | | |
| | Automatic Data Processing, Inc. | | | 48,100 | | | | 2,517,073 | | | | 2.14 | % |
| | Intel Corp. | | | 102,600 | | | | 2,517,804 | | | | 2.14 | % |
| | Nokia Corp. – ADR (b) | | | 212,000 | | | | 1,426,760 | | | | 1.21 | % |
| | Taiwan Semiconductor | | | | | | | | | | | | |
| | Manufacturing Ltd. – ADR (b) | | | 197,600 | | | | 2,493,712 | | | | 2.12 | % |
| | | | | | | | | 8,955,349 | | | | 7.61 | % |
| | Materials – 2.95% | | | | | | | | | | | | |
| | Companhia Siderurgica Nacional – ADR (b) | | | 128,600 | | | | 1,203,696 | | | | 1.02 | % |
| | EI Du Pont de Nemours & Co. | | | 47,200 | | | | 2,268,904 | | | | 1.93 | % |
| | | | | | | | | 3,472,600 | | | | 2.95 | % |
| | Telecommunication Services – 17.10% | | | | | | | | | | | | |
| | AT&T, Inc. | | | 76,300 | | | | 2,236,353 | | | | 1.90 | % |
| | BCE, Inc. (b) | | | 66,600 | | | | 2,638,026 | | | | 2.24 | % |
| | CenturyLink, Inc. | | | 51,600 | | | | 1,819,416 | | | | 1.55 | % |
| | China Mobile Ltd. – ADR (b) | | | 42,600 | | | | 2,026,056 | | | | 1.72 | % |
| | France Telecom – ADR (b) | | | 95,500 | | | | 1,717,090 | | | | 1.46 | % |
| | KT Corp. – ADR (b) | | | 99,700 | | | | 1,662,996 | | | | 1.41 | % |
| | Mobile Telesystems OJSC – ADR (b) | | | 102,100 | | | | 1,459,009 | | | | 1.24 | % |
| | Telefonica de Argentina (a)(c)(d)(e) | | | 100 | | | | – | | | | 0.00 | % |
| | Telefonica SA – ADR (b) | | | 88,900 | | | | 1,899,793 | | | | 1.62 | % |
| | Verizon Communications, Inc. | | | 66,700 | | | | 2,466,566 | | | | 2.10 | % |
| | Vodafone Group PLC – ADR (b) | | | 78,400 | | | | 2,182,656 | | | | 1.86 | % |
| | | | | | | | | | | | | | |
| | | | | | | | | 20,107,961 | | | | 17.10 | % |
| | | | | | | | | | | | | | |
| | Total Common Stocks (Cost $99,905,689) | | | | | | | 110,778,210 | | | | 94.21 | % |
The accompanying notes are an integral part of these financial statements.
WWW.HENNESSYFUNDS.COM
| | PARTNERSHIPS – 1.93% | | Number | | | | | | % of Net | |
| | | | of Shares | | | Value | | | Assets | |
| | Energy – 1.93% | | | | | | | | | |
| | Enterprise Products Partners LP | | | 50,500 | | | $ | 2,263,915 | | | | 1.93 | % |
| | | | | | | | | | | | | | |
| | Total Partnerships (Cost $2,036,466) | | | | | | | 2,263,915 | | | | 1.93 | % |
| | | | | | | | | | | | | | |
| | | | | | | | | | | | | | |
| | SHORT-TERM INVESTMENTS – 3.69% | | | | | | | | | | | | |
| | Money Market Funds – 3.69% | | | | | | | | | | | | |
| | Fidelity Government Portfolio – | | | | | | | | | | | | |
| | Institutional Class, 0.01% (f) | | | 4,341,118 | | | | 4,341,118 | | | | 3.69 | % |
| | | | | | | | | | | | | | |
| | Total Money Market Funds | | | | | | | | | | | | |
| | (Cost $4,341,118) | | | | | | | 4,341,118 | | | | 3.69 | % |
| | | | | | | | | | | | | | |
| | Total Short-Term Investments | | | | | | | | | | | | |
| | (Cost $4,341,118) | | | | | | | 4,341,118 | | | | 3.69 | % |
| | | | | | | | | | | | | | |
| | Total Investments – 99.83% | | | | | | | | | | | | |
| | (Cost $106,283,273) | | | | | | | 117,383,243 | | | | 99.83 | % |
| | | | | | | | | | | | | | |
| | Other Assets in Excess of Liabilities – 0.17% | | | | | | | 195,747 | | | | 0.17 | % |
| | TOTAL NET ASSETS – 100.00% | | | | | | $ | 117,578,990 | | | | 100.00 | % |
Percentages are stated as a percent of net assets.
| | | | |
| | (a) | | Non-income producing security. |
| | (b) | | U.S. traded security of a foreign corporation. |
| | (c) | | Illiquid security. |
| | (d) | | Foreign issued security. |
| | (e) | | Security is fair valued. |
| | (f) | | The rate listed is the fund’s 7-day yield as of October 31, 2011. |
The accompanying notes are an integral part of these financial statements.
| HENNESSY FUNDS | 1-800-966-4354 |
Summary of Fair Value Exposure at October 31, 2011
The following is a summary of the inputs used to value the Fund’s net assets as of October 31, 2011 (See Note 3 in the accompanying notes to the financial statements):
| Common Stock | | Level 1 | | | Level 2 | | | Level 3 | | | Total | |
| Consumer Discretionary | | $ | 2,620,672 | | | $ | — | | | $ | — | | | $ | 2,620,672 | |
| Consumer Staples | | | 26,334,882 | | | | — | | | | — | | | | 26,334,882 | |
| Energy | | | 16,633,773 | | | | — | | | | — | | | | 16,633,773 | |
| Financials | | | 2,627,196 | | | | — | | | | — | | | | 2,627,196 | |
| Health Care | | | 21,590,266 | | | | — | | | | — | | | | 21,590,266 | |
| Industrials | | | 8,435,511 | | | | — | | | | — | | | | 8,435,511 | |
| Information Technology | | | 8,955,349 | | | | — | | | | — | | | | 8,955,349 | |
| Materials | | | 3,472,600 | | | | — | | | | — | | | | 3,472,600 | |
| Telecommunication Services | | | 20,107,961 | | | | — | | | | — | (1) | | | 20,107,961 | |
| Total Common Stock | | $ | 110,778,210 | | | $ | — | | | $ | — | | | $ | 110,778,210 | |
| Partnerships | | | | | | | | | | | | | | | | |
| Energy | | $ | 2,263,915 | | | $ | — | | | $ | — | | | $ | 2,263,915 | |
| Short-Term Investments | | | | | | | | | | | | | | | | |
| Money Market Funds | | $ | 4,341,118 | | | $ | — | | | $ | — | | | $ | 4,341,118 | |
| Total Short-Term Investments | | $ | 4,341,118 | | | $ | — | | | $ | — | | | $ | 4,341,118 | |
| Total Investments in Securities | | $ | 117,383,243 | | | $ | — | | | $ | — | | | $ | 117,383,243 | |
Transfers between levels are recognized at the end of the reporting period. During the period ended October 31, 2011, the Fund recognized no transfers between levels.
| (1) | If Telefonica de Argentina would have had a value, it would have been a Level 3 fair value. The security has been fair valued at $0 during the entire reporting period. |
Level 3 Reconciliation Disclosure
Following is a reconciliation of Level 3 assets for which significant unobservable inputs were used to determine fair value.
| | | Common Stock | |
| Balance as of 10/31/10 | | $ | — | |
| Accrued discounts/premiums | | | — | |
| Realized gain (loss) | | | — | |
| Change in unrealized appreciation | | | | |
| (depreciation) | | | — | |
| Purchases | | | — | |
| (Sales) | | | — | |
| Transfer in and/or out of Level 3 | | | — | |
| Balance as of 10/31/11 | | $ | — | |
| Change in unrealized appreciation/depreciation during | | | | |
| the year for level 3 investments held at October 31, 2011 | | $ | — | |
The accompanying notes are an integral part of these financial statements.
WWW.HENNESSYFUNDS.COM
HENNESSY TOTAL RETURN FUND
As of October 31, 2011
(% of Net Assets)
| | TOP TEN EQUITY HOLDINGS | % of net assets |
| | Intel Corp. | 7.76% |
| | Verizon Communications, Inc. | 7.09% |
| | Pfizer, Inc. | 6.77% |
| | Merck & Co., Inc. | 6.43% |
| | EI Du Pont de Nemours & Co. | 6.40% |
| | Johnson & Johnson | 6.40% |
| | AT&T, Inc. | 6.35% |
| | Kraft Foods, Inc. | 5.57% |
| | General Electric Co. | 5.30% |
| | Proctor & Gamble Co. | 4.56% |
| HENNESSY FUNDS | 1-800-966-4354 |
| | COMMON STOCKS – 72.97% | | Number | | | | | | % of Net | |
| | | | of Shares | | | Value | | | Assets | |
| | Consumer Discretionary – 3.97% | | | | | | | | | |
| | McDonald’s Corp. | | | 27,400 | | | $ | 2,544,090 | | | | 3.97 | % |
| | | | | | | | | | | | | | |
| | Consumer Staples – 10.13% | | | | | | | | | | | | |
| | Kraft Foods, Inc. | | | 101,600 | | | | 3,574,288 | | | | 5.57 | % |
| | Procter & Gamble Co. | | | 45,700 | | | | 2,924,343 | | | | 4.56 | % |
| | | | | | | | | 6,498,631 | | | | 10.13 | % |
| | Energy – 4.19% | | | | | | | | | | | | |
| | Chevron Corp. | | | 25,600 | | | | 2,689,280 | | | | 4.19 | % |
| | | | | | | | | | | | | | |
| | Financials – 2.18% | | | | | | | | | | | | |
| | Travelers Companies, Inc. | | | 24,000 | | | | 1,400,400 | | | | 2.18 | % |
| | | | | | | | | | | | | | |
| | Health Care – 19.60% | | | | | | | | | | | | |
| | Johnson & Johnson | | | 63,700 | | | | 4,101,643 | | | | 6.40 | % |
| | Merck & Co., Inc. | | | 119,500 | | | | 4,122,750 | | | | 6.43 | % |
| | Pfizer, Inc. | | | 225,500 | | | | 4,343,130 | | | | 6.77 | % |
| | | | | | | | | 12,567,523 | | | | 19.60 | % |
| | Industrials – 5.30% | | | | | | | | | | | | |
| | General Electric Co. | | | 203,500 | | | | 3,400,485 | | | | 5.30 | % |
| | | | | | | | | | | | | | |
| | Information Technology – 7.76% | | | | | | | | | | | | |
| | Intel Corp. | | | 202,900 | | | | 4,979,166 | | | | 7.76 | % |
| | | | | | | | | | | | | | |
| | Materials – 6.40% | | | | | | | | | | | | |
| | EI Du Pont de Nemours & Co. | | | 85,400 | | | | 4,105,178 | | | | 6.40 | % |
| | | | | | | | | | | | | | |
| | Telecommunication Services – 13.44% | | | | | | | | | | | | |
| | AT&T, Inc. | | | 138,900 | | | | 4,071,159 | | | | 6.35 | % |
| | Verizon Communications, Inc. | | | 122,900 | | | | 4,544,842 | | | | 7.09 | % |
| | | | | | | | | | | | | | |
| | | | | | | | | 8,616,001 | | | | 13.44 | % |
| | | | | | | | | | | | | | |
| | Total Common Stocks (Cost $41,737,327) | | | | | | | 46,800,754 | | | | 72.97 | % |
The accompanying notes are an integral part of these financial statements.
WWW.HENNESSYFUNDS.COM
| | SHORT-TERM INVESTMENTS – 54.92% | | Number | | | | | | % of Net | |
| | | | of Shares | | | Value | | | Assets | |
| | Money Market Funds – 1.90% | | | | | | | | | |
| | Fidelity Government Portfolio – | | | | | | | | | |
| | Institutional Class, 0.01% (a) | | | 1,216,359 | | | $ | 1,216,359 | | | | 1.90 | % |
| | | | | | | | | | | | | | |
| | Total Money Market Funds | | | | | | | | | | | | |
| | (Cost $1,216,359) | | | | | | | 1,216,359 | | | | 1.90 | % |
| | | | | | | | | | | | | | |
| | U.S. Treasury Bills* – 53.02% | | | | | | | | | | | | |
| | 0.010%, 11/10/11 (b) | | | 11,000,000 | | | | 11,000,000 | | | | 17.15 | % |
| | 0.005%, 12/15/11 (b) | | | 10,000,000 | | | | 10,000,000 | | | | 15.60 | % |
| | 0.030%, 01/19/12 (b) | | | 13,000,000 | | | | 12,999,649 | | | | 20.27 | % |
| | | | | | | | | | | | | | |
| | Total U.S. Treasury Bills | | | | | | | | | | | | |
| | (Cost $34,000,000) | | | | | | | 33,999,649 | | | | 53.02 | % |
| | | | | | | | | | | | | | |
| | Total Short-Term Investments | | | | | | | | | | | | |
| | (Cost $35,216,359) | | | | | | | 35,216,008 | | | | 54.92 | % |
| | | | | | | | | | | | | | |
| | Total Investments – 127.89% | | | | | | | | | | | | |
| | (Cost $76,953,686) | | | | | | | 82,016,762 | | | | 127.89 | % |
| | | | | | | | | | | | | | |
| | Liabilities in Excess of Other Assets – (27.89)% | | | | | | | (17,885,301 | ) | | | (27.89 | )% |
| | TOTAL NET ASSETS – 100.00% | | | | | | $ | 64,131,461 | | | | 100.00 | % |
Percentages are stated as a percent of net assets.
| | | | |
| | (a) | | The rate listed is the fund’s 7-day yield as of October 31, 2011. |
| | (b) | | The rate listed is discount rate at issue. |
| | * | | Collateral or partial collateral for securities sold subject to repurchase. |
The accompanying notes are an integral part of these financial statements.
| HENNESSY FUNDS | 1-800-966-4354 |
Summary of Fair Value Exposure at October 31, 2011
The following is a summary of the inputs used to value the Fund’s net assets as of October 31, 2011 (See Note 3 in the accompanying notes to the financial statements):
| Common Stock | | Level 1 | | | Level 2 | | | Level 3 | | | Total | |
| Consumer Discretionary | | $ | 2,544,090 | | | $ | — | | | $ | — | | | $ | 2,544,090 | |
| Consumer Staples | | | 6,498,631 | | | | — | | | | — | | | | 6,498,631 | |
| Energy | | | 2,689,280 | | | | — | | | | — | | | | 2,689,280 | |
| Financials | | | 1,400,400 | | | | — | | | | — | | | | 1,400,400 | |
| Health Care | | | 12,567,523 | | | | — | | | | — | | | | 12,567,523 | |
| Industrials | | | 3,400,485 | | | | — | | | | — | | | | 3,400,485 | |
| Information Technology | | | 4,979,166 | | | | — | | | | — | | | | 4,979,166 | |
| Materials | | | 4,105,178 | | | | — | | | | — | | | | 4,105,178 | |
| Telecommunication Services | | | 8,616,001 | | | | — | | | | — | | | | 8,616,001 | |
| Total Common Stock | | $ | 46,800,754 | | | $ | — | | | $ | — | | | $ | 46,800,754 | |
| Short-Term Investments | | | | | | | | | | | | | | | | |
| U.S. Treasury Bills | | $ | — | | | $ | 33,999,649 | | | $ | — | | | $ | 33,999,649 | |
| Money Market Funds | | | 1,216,359 | | | | — | | | | — | | | | 1,216,359 | |
| Total Short-Term Investments | | $ | 1,216,359 | | | $ | 33,999,649 | | | $ | — | | | $ | 35,216,008 | |
| Total Investments in Securities | | $ | 48,017,113 | | | $ | 33,999,649 | | | $ | — | | | $ | 82,016,762 | |
Transfers between levels are recognized at the end of the reporting period. During the period ended October 31, 2011, the Fund recognized no transfers between levels.
Reverse repurchase agreements are carried at face value, hence, are not included in the fair valuation hierarchy. The face value of the reverse repurchase agreements at October 31, 2011, was $18,897,000. Due to the short term nature of the reverse repurchase agreements, face value approximates fair value. The face value plus interest due at maturity is equal to $18,909,493.
The accompanying notes are an integral part of these financial statements.
WWW.HENNESSYFUNDS.COM
Schedule of Reverse Repurchase Agreements
Hennessy Total Return Fund as of October 31, 2011 |
| Face | | | Principal | Maturity | Maturity |
| Value | Counterparty | Rate | Trade Date | Date | Amount |
| $ 5,397,000 | UBS Financial Services, Inc. | 0.30% | 8/26/11 | 11/10/11 | $ 5,400,418 |
| $ 4,500,000 | UBS Financial Services, Inc. | 0.30% | 9/30/11 | 12/15/11 | 4,502,850 |
| $ 9,000,000 | UBS Financial Services, Inc. | 0.30% | 10/28/11 | 1/19/12 | 9,006,225 |
| $18,897,000 | | | | | $18,909,493 |
As of October 31, 2011, the fair value of securities held as collateral for reverse repurchase agreements was $33,999,649 as noted on the Schedule of Investments.
The accompanying notes are an integral part of these financial statements.
| HENNESSY FUNDS | 1-800-966-4354 |
As of October 31, 2011
(% of Net Assets)
| | TOP TEN EQUITY HOLDINGS | % of net assets |
| | Intel Corp. | 5.00% |
| | Merck & Co., Inc. | 4.87% |
| | Pfizer, Inc. | 4.82% |
| | Kraft Foods, Inc. | 4.51% |
| | EI Du Pont de Nemours & Co. | 4.51% |
| | Verizon Communications, Inc. | 4.49% |
| | Johnson & Johnson | 4.45% |
| | AT&T, Inc. | 4.39% |
| | Proctor & Gamble Co. | 3.12% |
| | McDonald’s Corp. | 3.04% |
WWW.HENNESSYFUNDS.COM
| | COMMON STOCKS – 47.77% | | Number | | | | | | % of Net | |
| | | | of Shares | | | Value | | | Assets | |
| | Consumer Discretionary – 3.04% | | | | | | | | | |
| | McDonald’s Corp. | | | 5,900 | | | $ | 547,815 | | | | 3.04 | % |
| | | | | | | | | | | | | | |
| | Consumer Staples – 7.63% | | | | | | | | | | | | |
| | Kraft Foods, Inc. | | | 23,100 | | | | 812,658 | | | | 4.51 | % |
| | Procter & Gamble Co. | | | 8,800 | | | | 563,112 | | | | 3.12 | % |
| | | | | | | | | 1,375,770 | | | | 7.63 | % |
| | Energy – 1.87% | | | | | | | | | | | | |
| | Chevron Corp. | | | 3,200 | | | | 336,160 | | | | 1.87 | % |
| | | | | | | | | | | | | | |
| | Financials – 0.49% | | | | | | | | | | | | |
| | Travelers Companies, Inc. | | | 1,500 | | | | 87,525 | | | | 0.49 | % |
| | | | | | | | | | | | | | |
| | Health Care – 14.14% | | | | | | | | | | | | |
| | Johnson & Johnson | | | 12,450 | | | | 801,656 | | | | 4.45 | % |
| | Merck & Co., Inc. | | | 25,450 | | | | 878,025 | | | | 4.87 | % |
| | Pfizer, Inc. | | | 45,100 | | | | 868,626 | | | | 4.82 | % |
| | | | | | | | | 2,548,307 | | | | 14.14 | % |
| | Industrials – 2.21% | | | | | | | | | | | | |
| | General Electric Co. | | | 23,850 | | | | 398,533 | | | | 2.21 | % |
| | | | | | | | | | | | | | |
| | Information Technology – 5.00% | | | | | | | | | | | | |
| | Intel Corp. | | | 36,700 | | | | 900,618 | | | | 5.00 | % |
| | | | | | | | | | | | | | |
| | Materials – 4.51% | | | | | | | | | | | | |
| | EI Du Pont de Nemours & Co. | | | 16,900 | | | | 812,383 | | | | 4.51 | % |
| | | | | | | | | | | | | | |
| | Telecommunication Services – 8.88% | | | | | | | | | | | | |
| | AT&T, Inc. | | | 27,000 | | | | 791,370 | | | | 4.39 | % |
| | Verizon Communications, Inc. | | | 21,900 | | | | 809,862 | | | | 4.49 | % |
| | | | | | | | | 1,601,232 | | | | 8.88 | % |
| | | | | | | | | | | | | | |
| | Total Common Stocks (Cost $7,884,849) | | | | | | | 8,608,343 | | | | 47.77 | % |
| | | | | | | | | | | | | | |
| | U.S. TREASURY NOTES – 3.89% | | Principal | | | | | | | % of Net | |
| | | | Amount | | | Value | | | Assets | |
| | 0.750%, 11/30/2011 | | $ | 700,000 | | | $ | 700,492 | | | | 3.89 | % |
| | | | | | | | | | | | | | |
| | Total U.S. Treasury Notes | | | | | | | | | | | | |
| | (Cost $700,242) | | | | | | | 700,492 | | | | 3.89 | % |
The accompanying notes are an integral part of these financial statements.
| HENNESSY FUNDS | 1-800-966-4354 |
| | SHORT-TERM INVESTMENTS – 48.55% | | Number | | | | | | % of Net | |
| | | | of Shares | | | Value | | | Assets | |
| | Money Market Funds – 13.05% | | | | | | | | | |
| | Federated Government Obligations | | | | | | | | | |
| | Fund – Class I, 0.01% (a) | | | 905,000 | | | $ | 905,000 | | | | 5.02 | % |
| | Federated Treasury Obligations | | | | | | | | | | | | |
| | Fund, 0.01% (a) | | | 542,614 | | | | 542,614 | | | | 3.01 | % |
| | Fidelity Government Portfolio – | | | | | | | | | | | | |
| | Institutional Class, 0.01% (a) | | | 905,000 | | | | 905,000 | | | | 5.02 | % |
| | | | | | | | | | | | | | |
| | Total Money Market Funds | | | | | | | | | | | | |
| | (Cost $2,352,614) | | | | | | | 2,352,614 | | | | 13.05 | % |
| | | | | | | | | | | | | | |
| | | | Principal | | | | | | | % of Net | |
| | | | Amount | | | Value | | | Assets | |
| | U.S. Treasury Bills – 35.50% | | | | | | | | | | | | |
| | 0.015%, 11/17/2011 (b) | | $ | 700,000 | | | | 699,939 | | | | 3.88 | % |
| | 0.005%, 12/15/2011 (b) | | | 2,000,000 | | | | 1,999,951 | | | | 11.10 | % |
| | 0.005%, 02/09/2012 (b) | | | 1,900,000 | | | | 1,899,934 | | | | 10.54 | % |
| | 0.055%, 05/03/2012 (b) | | | 200,000 | | | | 199,946 | | | | 1.11 | % |
| | 0.180%, 05/31/2012 (b) | | | 300,000 | | | | 299,899 | | | | 1.66 | % |
| | 0.100%, 08/23/2012 (b) | | | 700,000 | | | | 699,485 | | | | 3.88 | % |
| | 0.090%, 09/20/2012 (b) | | | 600,000 | | | | 599,517 | | | | 3.33 | % |
| | | | | | | | | | | | | | |
| | Total U.S. Treasury Bills | | | | | | | | | | | | |
| | (Cost $6,398,525) | | | | | | | 6,398,671 | | | | 35.50 | % |
| | | | | | | | | | | | | | |
| | Total Short-Term Investments | | | | | | | | | | | | |
| | (Cost $8,751,139) | | | | | | | 8,751,285 | | | | 48.55 | % |
| | | | | | | | | | | | | | |
| | Total Investments – 100.21% | | | | | | | | | | | | |
| | (Cost $17,336,230) | | | | | | | 18,060,120 | | | | 100.21 | % |
| | | | | | | | | | | | | | |
| | Liabilities in Excess of Other Assets – (0.21)% | | | | | | | (37,877 | ) | | | (0.21 | )% |
| | TOTAL NET ASSETS – 100.00% | | | | | | $ | 18,022,243 | | | | 100.00 | % |
Percentages are stated as a percent of net assets.
| | | | |
| | (a) | | The rate listed is the fund’s 7-day yield as of October 31, 2011. |
| | (b) | | The rate listed is discount rate at issue. |
The accompanying notes are an integral part of these financial statements.
WWW.HENNESSYFUNDS.COM
Summary of Fair Value Exposure at October 31, 2011
The following is a summary of the inputs used to value the Fund’s net assets as of October 31, 2011 (See Note 3 in the accompanying notes to the financial statements):
| Common Stock | | Level 1 | | | Level 2 | | | Level 3 | | | Total | |
| Consumer Discretionary | | $ | 547,815 | | | $ | — | | | $ | — | | | $ | 547,815 | |
| Consumer Staples | | | 1,375,770 | | | | — | | | | — | | | | 1,375,770 | |
| Energy | | | 336,160 | | | | — | | | | — | | | | 336,160 | |
| Financials | | | 87,525 | | | | — | | | | — | | | | 87,525 | |
| Health Care | | | 2,548,307 | | | | — | | | | — | | | | 2,548,307 | |
| Industrials | | | 398,533 | | | | — | | | | — | | | | 398,533 | |
| Information Technology | | | 900,618 | | | | — | | | | — | | | | 900,618 | |
| Materials | | | 812,383 | | | | — | | | | — | | | | 812,383 | |
| Telecommunication Services | | | 1,601,232 | | | | — | | | | — | | | | 1,601,232 | |
| Total Common Stock | | $ | 8,608,343 | | | $ | — | | | $ | — | | | $ | 8,608,343 | |
| U.S. Treasury Notes | | $ | — | | | $ | 700,492 | | | $ | — | | | $ | 700,492 | |
| Short-Term Investments | | | | | | | | | | | | | | | | |
| U.S. Treasury Bills | | $ | — | | | $ | 6,398,671 | | | $ | — | | | $ | 6,398,671 | |
| Money Market Funds | | | 2,352,614 | | | | — | | | | — | | | | 2,352,614 | |
| Total Short-Term Investments | | $ | 2,352,614 | | | $ | 6,398,671 | | | $ | — | | | $ | 8,751,285 | |
| Total Investments in Securities | | $ | 10,960,957 | | | $ | 7,099,163 | | | $ | — | | | $ | 18,060,120 | |
Transfers between levels are recognized at the end of the reporting period. During the period ended October 31, 2011, the Fund recognized no transfers between levels.
The accompanying notes are an integral part of these financial statements.
| HENNESSY FUNDS | 1-800-966-4354 |
Financial Statements
Statements of Assets and Liabilities as of October 31, 2011 |
ASSETS:
Investments in securities, at value (cost $203,784,260, $167,113,847, $79,516,812,
$106,283,273, $76,953,686 and $17,336,230 respectively)
Cash
Dividends and interest receivable
Receivable for fund shares sold
Receivable for securities sold
Return of capital receivable
Prepaid expenses and other assets
Total Assets
LIABILITIES:
Payable for securities purchased
Payable for fund shares redeemed
Payable to Advisor
Payable to Administrator
Reverse repurchase agreement
Accrued interest payable
Accrued directors’ fees
Accrued service fees
Accrued expenses and other payables
Total Liabilities
NET ASSETS
NET ASSETS CONSIST OF:
Capital stock
Accumulated net investment income (loss)
Accumulated net realized gain (loss) on investments
Unrealized net appreciation (depreciation) on investments
Total Net Assets
NET ASSETS
Original Class:
Shares authorized ($.0001 par value)
Net assets applicable to outstanding Original Class shares
Shares issued and outstanding
Net asset value, offering price and redemption price per share
Institutional Class:
Shares authorized ($.0001 par value)
Net assets applicable to outstanding Institutional Class shares
Shares issued and outstanding
Net asset value, offering price and redemption price per share
The accompanying notes are an integral part of these financial statements.
WWW.HENNESSYFUNDS.COM
| | | | | | | | | | | | | | | | | |
| | | | | | | HENNESSY | | | | | | | | | | |
| HENNESSY | | | HENNESSY | | | CORNERSTONE | | | HENNESSY | | | HENNESSY | | | HENNESSY | |
| CORNERSTONE | | | FOCUS 30 | | | LARGE GROWTH | | | CORNERSTONE | | | TOTAL RETURN | | | BALANCED | |
| GROWTH FUND | | | FUND | | | FUND | | | VALUE FUND | | | FUND | | | FUND | |
| | | | | | | | | | | | | | | | | |
| | | | | | | | | | | | | | | | | |
| $ | 187,547,230 | | | $ | 170,197,466 | | | $ | 78,136,480 | | | $ | 117,383,243 | | | $ | 82,016,762 | | | $ | 18,060,120 | |
| | — | | | | — | | | | — | | | | 38,331 | | | | — | | | | — | |
| | 5,660 | | | | 224,718 | | | | 76,175 | | | | 220,878 | | | | 145,185 | | | | 29,403 | |
| | 22,217 | | | | 299,444 | | | | 42,188 | | | | 127,467 | | | | 1,008,001 | | | | 11,874 | |
| | — | | | | 219,494 | | | | — | | | | — | | | | — | | | | — | |
| | — | | | | — | | | | — | | | | 30,931 | | | | — | | | | — | |
| | 26,341 | | | | 21,511 | | | | 18,517 | | | | 24,821 | | | | 16,660 | | | | 10,079 | |
| | 187,601,448 | | | | 170,962,633 | | | | 78,273,360 | | | | 117,825,671 | | | | 83,186,608 | | | | 18,111,476 | |
| | | | | | | | | | | | | | | | | | | | | | | |
| | | | | | | | | | | | | | | | | | | | | | | |
| | — | | | | 219,508 | | | | — | | | | — | | | | — | | | | — | |
| | 379,071 | | | | 194,566 | | | | 97,304 | | | | 70,016 | | | | 31,019 | | | | 38,912 | |
| | 108,464 | | | | 103,419 | | | | 77,222 | | | | 71,917 | | | | 31,160 | | | | 8,731 | |
| | 73,246 | | | | 65,372 | | | | 32,140 | | | | 45,181 | | | | 25,537 | | | | 7,100 | |
| | — | | | | — | | | | — | | | | — | | | | 18,897,000 | | | | — | |
| | — | | | | — | | | | — | | | | — | | | | 5,379 | | | | — | |
| | 1,172 | | | | 1,304 | | | | 1,691 | | | | 1,251 | | | | 1,591 | | | | 1,513 | |
| | 14,440 | | | | 11,976 | | | | 6,414 | | | | 9,623 | | | | 5,193 | | | | 1,455 | |
| | 95,632 | | | | 71,174 | | | | 35,477 | | | | 48,693 | | | | 58,268 | | | | 31,522 | |
| | 672,025 | | | | 667,319 | | | | 250,248 | | | | 246,681 | | | | 19,055,147 | | | | 89,233 | |
| $ | 186,929,423 | | | $ | 170,295,314 | | | $ | 78,023,112 | | | $ | 117,578,990 | | | $ | 64,131,461 | | | $ | 18,022,243 | |
| | | | | | | | | | | | | | | | | | | | | | | |
| | | | | | | | | | | | | | | | | | | | | | | |
| $ | 448,416,244 | | | $ | 210,797,468 | | | $ | 63,468,363 | | | $ | 150,947,442 | | | $ | 69,511,395 | | | $ | 19,054,682 | |
| | 16,688 | | | | — | | | | 559,148 | | | | 3,329,807 | | | | 74,649 | | | | 6,275 | |
| | (245,266,479 | ) | | | (43,585,773 | ) | | | 15,375,933 | | | | (47,798,229 | ) | | | (10,517,659 | ) | | | (1,762,604 | ) |
| | (16,237,030 | ) | | | 3,083,619 | | | | (1,380,332 | ) | | | 11,099,970 | | | | 5,063,076 | | | | 723,890 | |
| $ | 186,929,423 | | | $ | 170,295,314 | | | $ | 78,023,112 | | | $ | 117,578,990 | | | $ | 64,131,461 | | | $ | 18,022,243 | |
| | | | | | | | | | | | | | | | | | | | | | | |
| | | | | | | | | | | | | | | | | | | | | | | |
| | | | | | | | | | | | | | | | | | | | | | | |
| | 25,000,000,000 | | | | 25,000,000,000 | | | Unlimited | | | | 25,000,000,000 | | | | 100,000,000 | | | | 100,000,000 | |
| | 184,400,490 | | | | 146,234,302 | | | | 77,883,119 | | | | 116,410,424 | | | | 64,131,461 | | | | 18,022,243 | |
| | 18,500,791 | | | | 12,037,074 | | | | 6,295,260 | | | | 9,063,583 | | | | 5,591,007 | | | | 1,619,061 | |
| $ | 9.97 | | | $ | 12.15 | | | $ | 12.37 | | | $ | 12.84 | | | $ | 11.47 | | | $ | 11.13 | |
| | | | | | | | | | | | | | | | | | | | | | | |
| | 25,000,000,000 | | | | 25,000,000,000 | | | Unlimited | | | | 25,000,000,000 | | | | N/A | | | | N/A | |
| | 2,528,933 | | | | 24,061,012 | | | | 139,993 | | | | 1,168,566 | | | | N/A | | | | N/A | |
| | 250,618 | | | | 1,953,717 | | | | 11,250 | | | | 90,863 | | | | N/A | | | | N/A | |
| $ | 10.09 | | | $ | 12.32 | | | $ | 12.44 | | | $ | 12.86 | | | | N/A | | | | N/A | |
| HENNESSY FUNDS | 1-800-966-4354 |
Financial Statements
Statements of Operations Year Ended October 31, 2011 |
INVESTMENT INCOME:
Dividend income(1)
Interest income
Total investment income
EXPENSES:
Investment advisory fees
Administration, fund accounting, custody and transfer agent fees
Distribution fees – Original Class (See Note 6)
Service fees – Original Class (See Note 6)
Federal and state registration fees
Audit fees
Legal fees
Compliance expense
Reports to shareholders
Directors’ fees and expenses
Sub-transfer agent expenses – Original Class (See Note 6)
Sub-transfer agent expenses – Institutional Class (See Note 6)
Interest expense (See Notes 4 and 7)
Other
Total expenses before reimbursement from advisor
Expense recoupment by advisor – Original Class
Administration expense waiver – Institutional Class (See Note 6)
Net expenses
NET INVESTMENT INCOME (LOSS)
REALIZED AND UNREALIZED GAINS (LOSSES):
Net realized gain (loss) on investments
Change in unrealized appreciation (depreciation) on investments
Net gain (loss) on investments
NET INCREASE (DECREASE) IN NET ASSETS RESULTING FROM OPERATIONS
(1) Net of foreign taxes withheld of $3,569, $0, $0, $390,180, $0 and $0 respectively.
The accompanying notes are an integral part of these financial statements.
WWW.HENNESSYFUNDS.COM
| | | | | | | | | | | | | | | | | |
| | | | | | | | | | | | | | | | | |
| | | | | | | HENNESSY | | | | | | | | | | |
| HENNESSY | | | HENNESSY | | | CORNERSTONE | | | HENNESSY | | | HENNESSY | | | HENNESSY | |
| CORNERSTONE | | | FOCUS 30 | | | LARGE GROWTH | | | CORNERSTONE | | | TOTAL RETURN | | | BALANCED | |
| GROWTH FUND | | | FUND | | | FUND | | | VALUE FUND | | | FUND | | | FUND | |
| | | | | | | | | | | | | | | | | |
| $ | 1,067,594 | | | $ | 916,158 | | | $ | 1,622,590 | | | $ | 5,847,950 | | | $ | 1,873,970 | | | $ | 264,004 | |
| | 2,739 | | | | 1,980 | | | | 370 | | | | 2,485 | | | | 26,705 | | | | 11,974 | |
| | 1,070,333 | | | | 918,138 | | | | 1,622,960 | | | | 5,850,435 | | | | 1,900,675 | | | | 275,978 | |
| | | | | | | | | | | | | | | | | | | | | | | |
| | | | | | | | | | | | | | | | | | | | | | | |
| | 1,444,144 | | | | 1,193,413 | | | | 605,779 | | | | 1,016,889 | | | | 392,389 | | | | 81,461 | |
| | 497,644 | | | | 411,243 | | | | 208,748 | | | | 350,415 | | | | 166,765 | | | | 34,621 | |
| | — | | | | — | | | | — | | | | — | | | | 98,097 | | | | 20,365 | |
| | 192,440 | | | | 138,039 | | | | 81,764 | | | | 136,248 | | | | 65,398 | | | | 13,577 | |
| | 32,932 | | | | 35,188 | | | | 42,301 | | | | 41,143 | | | | 25,339 | | | | 25,763 | |
| | 24,499 | | | | 19,251 | | | | 19,002 | | | | 21,637 | | | | 19,599 | | | | 16,988 | |
| | 4,989 | | | | 5,801 | | | | 5,258 | | | | 47,501 | | | | 5,501 | | | | 5,001 | |
| | 8,293 | | | | 8,294 | | | | 8,287 | | | | 8,294 | | | | 8,287 | | | | 8,318 | |
| | 52,958 | | | | 41,481 | | | | 15,002 | | | | 31,239 | | | | 13,714 | | | | 2,024 | |
| | 9,131 | | | | 10,294 | | | | 12,751 | | | | 11,056 | | | | 6,701 | | | | 7,101 | |
| | 293,659 | | | | 242,829 | | | | 24,557 | | | | 113,824 | | | | — | | | | — | |
| | 396 | | | | 12,773 | | | | 10 | | | | 51 | | | | N/A | | | | N/A | |
| | 728 | | | | 2,263 | | | | — | | | | 7,226 | | | | 69,537 | | | | — | |
| | 25,529 | | | | 18,561 | | | | 10,826 | | | | 18,613 | | | | 7,947 | | | | 3,124 | |
| | 2,587,342 | | | | 2,139,430 | | | | 1,034,285 | | | | 1,804,136 | | | | 879,274 | | | | 218,343 | |
| | — | | | | — | | | | 29,682 | | | | — | | | | — | | | | — | |
| | (3,015 | ) | | | (36,294 | ) | | | (155 | ) | | | (1,773 | ) | | | — | | | | — | |
| | 2,584,327 | | | | 2,103,136 | | | | 1,063,812 | | | | 1,802,363 | | | | 879,274 | | | | 218,343 | |
| $ | (1,513,994 | ) | | $ | (1,184,998 | ) | | $ | 559,148 | | | $ | 4,048,072 | | | $ | 1,021,401 | | | $ | 57,635 | |
| | | | | | | | | | | | | | | | | | | | | | | |
| | | | | | | | | | | | | | | | | | | | | | | |
| $ | 39,880,443 | | | $ | 21,853,896 | | | $ | 15,375,964 | | | $ | 10,696,825 | | | $ | 3,288,471 | | | $ | 498,835 | |
| | (41,240,390 | ) | | | (10,298,635 | ) | | | (10,653,411 | ) | | | (7,231,439 | ) | | | 2,165,518 | | | | 310,456 | |
| | (1,359,947 | ) | | | 11,555,261 | | | | 4,722,553 | | | | 3,465,386 | | | | 5,453,989 | | | | 809,291 | |
| $ | (2,873,941 | ) | | $ | 10,370,263 | | | $ | 5,281,701 | | | $ | 7,513,458 | | | $ | 6,475,390 | | | $ | 866,926 | |
| HENNESSY FUNDS | 1-800-966-4354 |
Financial Statements
| Statements of Changes in Net Assets |
OPERATIONS:
Net investment loss
Net realized gain on securities
Change in unrealized appreciation (depreciation) on securities
Net increase (decrease) in net assets resulting from operations
CAPITAL SHARE TRANSACTIONS:
Proceeds from shares issued in the acquisition – Original Class (See Note 9)
Proceeds from shares issued in the acquisition – Institutional Class (See Note 9)
Proceeds from shares subscribed – Original Class
Proceeds from shares subscribed – Institutional Class
Cost of shares redeemed – Original Class
Cost of shares redeemed – Institutional Class
Net increase (decrease) in net assets derived from capital share transactions
TOTAL INCREASE (DECREASE) IN NET ASSETS
NET ASSETS:
Beginning of year
End of year
Accumulated net investment income (loss), end of period
CHANGES IN SHARES OUTSTANDING:
Shares issued in connection with acquisition – Original Class (See Note 9)
Shares issued in connection with acquisition – Institutional Class (See Note 9)
Shares sold – Original Class
Shares sold – Institutional Class
Shares redeemed – Original Class
Shares redeemed – Institutional Class
Net increase (decrease) in shares outstanding
The accompanying notes are an integral part of these financial statements.
WWW.HENNESSYFUNDS.COM
| Hennessy Cornerstone | | | | | | | |
| Growth Fund | | | Hennessy Focus 30 Fund | |
| Year Ended | | | Year Ended | | | Year Ended | | | Year Ended | |
| October 31, 2011 | | | October 31, 2010 | | | October 31, 2011 | | | October 31, 2010 | |
| | | | | | | | | | | |
| $ | (1,513,994 | ) | | $ | (1,966,127 | ) | | $ | (1,184,998 | ) | | $ | (285,570 | ) |
| | 39,880,443 | | | | 14,472,259 | | | | 21,853,896 | | | | 23,675,034 | |
| | (41,240,390 | ) | | | 22,544,637 | | | | (10,298,635 | ) | | | 13,440,791 | |
| | (2,873,941 | ) | | | 35,050,769 | | | | 10,370,263 | | | | 36,830,255 | |
| | | | | | | | | | | | | | | |
| | | | | | | | | | | | | | | |
| | 25,825,466 | | | | — | | | | — | | | | — | |
| | 339,345 | | | | — | | | | — | | | | — | |
| | 5,686,546 | | | | 7,339,703 | | | | 59,931,720 | | | | 9,963,583 | |
| | 120,828 | | | | 101,206 | | | | 7,761,938 | | | | 1,798,787 | |
| | (51,326,442 | ) | | | (63,688,140 | ) | | | (45,594,300 | ) | | | (45,927,136 | ) |
| | (1,075,812 | ) | | | (2,208,458 | ) | | | (6,751,235 | ) | | | (13,886,035 | ) |
| | (20,430,069 | ) | | | (58,455,689 | ) | | | 15,348,123 | | | | (48,050,801 | ) |
| | (23,304,010 | ) | | | (23,404,920 | ) | | | 25,718,386 | | | | (11,220,546 | ) |
| | | | | | | | | | | | | | | |
| | | | | | | | | | | | | | | |
| | 210,233,433 | | | | 233,638,353 | | | | 144,576,928 | | | | 155,797,474 | |
| $ | 186,929,423 | | | $ | 210,233,433 | | | $ | 170,295,314 | | | $ | 144,576,928 | |
| $ | 16,688 | | | $ | — | | | $ | — | | | $ | — | |
| | | | | | | | | | | | | | | |
| | | | | | | | | | | | | | | |
| | 2,524,476 | | | | — | | | | — | | | | — | |
| | 32,783 | | | | — | | | | — | | | | — | |
| | 536,989 | | | | 762,956 | | | | 4,688,679 | | | | 981,821 | |
| | 11,197 | | | | 9,629 | | | | 598,584 | | | | 182,320 | |
| | (4,705,581 | ) | | | (6,593,042 | ) | | | (3,673,362 | ) | | | (4,668,242 | ) |
| | (94,611 | ) | | | (236,335 | ) | | | (538,511 | ) | | | (1,414,793 | ) |
| | (1,694,747 | ) | | | (6,056,792 | ) | | | 1,075,390 | | | | (4,918,894 | ) |
| HENNESSY FUNDS | 1-800-966-4354 |
Financial Statements
| Statements of Changes in Net Assets |
OPERATIONS:
Net investment income
Net realized gain on securities
Change in unrealized appreciation (depreciation) on securities
Net increase in net assets resulting from operations
DISTRIBUTIONS TO SHAREHOLDERS FROM:
Net investment income
Original Class
Institutional Class
Net realized gains
Original Class
Institutional Class
Total distributions
CAPITAL SHARE TRANSACTIONS:
Proceeds from shares subscribed – Original Class
Proceeds from shares subscribed – Institutional Class
Dividends reinvested – Original Class
Dividends reinvested – Institutional Class
Cost of shares redeemed – Original Class
Cost of shares redeemed – Institutional Class
Net decrease in net assets derived from capital share transactions
TOTAL INCREASE (DECREASE) IN NET ASSETS
NET ASSETS:
Beginning of year
End of year
Accumulated net investment income, end of period
CHANGES IN SHARES OUTSTANDING:
Shares sold – Original Class
Shares sold – Institutional Class
Shares issued to holders as reinvestment of dividends – Original Class
Shares issued to holders as reinvestment of dividends – Institutional Class
Shares redeemed – Original Class
Shares redeemed – Institutional Class
Net decrease in shares outstanding
The accompanying notes are an integral part of these financial statements.
WWW.HENNESSYFUNDS.COM
| Hennessy Cornerstone | | | Hennessy Cornerstone | |
| Large Growth Fund | | | Value Fund | |
| Year Ended | | | Year Ended | | | Year Ended | | | Year Ended | |
| October 31, 2011 | | | October 31, 2010 | | | October 31, 2011 | | | October 31, 2010 | |
| | | | | | | | | | | |
| $ | 559,148 | | | $ | 631,108 | | | $ | 4,048,072 | | | $ | 3,555,372 | |
| | 15,375,964 | | | | 21,551,713 | | | | 10,696,825 | | | | 18,520,349 | |
| | (10,653,411 | ) | | | (6,245,779 | ) | | | (7,231,439 | ) | | | 6,342,542 | |
| | 5,281,701 | | | | 15,937,042 | | | | 7,513,458 | | | | 28,418,263 | |
| | | | | | | | | | | | | | | |
| | (626,839 | ) | | | (358,186 | ) | | | (4,238,610 | ) | | | (2,734,232 | ) |
| | (968 | ) | | | (235 | ) | | | (44,764 | ) | | | (23,987 | ) |
| | | | | | | | | | | | | | | |
| | (109,149 | ) | | | — | | | | — | | | | — | |
| | (99 | ) | | | — | | | | — | | | | — | |
| | (737,055 | ) | | | (358,421 | ) | | | (4,283,374 | ) | | | (2,758,219 | ) |
| | | | | | | | | | | | | | | |
| | 1,432,151 | | | | 993,869 | | | | 10,694,626 | | | | 49,512,976 | |
| | 88,409 | | | | 19,385 | | | | 83,602 | | | | 131,171 | |
| | 671,356 | | | | 322,821 | | | | 3,846,379 | | | | 2,464,535 | |
| | 1,067 | | | | 235 | | | | 25,543 | | | | 14,973 | |
| | (7,591,682 | ) | | | (7,463,986 | ) | | | (57,199,244 | ) | | | (67,467,108 | ) |
| | (21,081 | ) | | | (2,812 | ) | | | (323,943 | ) | | | (106,415 | ) |
| | (5,419,780 | ) | | | (6,130,488 | ) | | | (42,873,037 | ) | | | (15,449,868 | ) |
| | (875,134 | ) | | | 9,448,133 | | | | (39,642,953 | ) | | | 10,210,176 | |
| | | | | | | | | | | | | | | |
| | 78,898,246 | | | | 69,450,113 | | | | 157,221,943 | | | | 147,011,767 | |
| $ | 78,023,112 | | | $ | 78,898,246 | | | $ | 117,578,990 | | | $ | 157,221,943 | |
| $ | 559,148 | | | $ | 627,807 | | | $ | 3,329,807 | | | $ | 3,560,233 | |
| | | | | | | | | | | | | | | |
| | 113,003 | | | | 94,024 | | | | 847,873 | | | | 4,255,144 | |
| | 7,307 | | | | 1,859 | | | | 6,843 | | | | 11,283 | |
| | 55,671 | | | | 31,251 | | | | 312,206 | | | | 216,187 | |
| | 88 | | | | 23 | | | | 2,077 | | | | 1,315 | |
| | (610,123 | ) | | | (699,229 | ) | | | (4,539,225 | ) | | | (5,758,045 | ) |
| | (1,715 | ) | | | (278 | ) | | | (25,568 | ) | | | (9,166 | ) |
| | (435,769 | ) | | | (572,350 | ) | | | (3,395,794 | ) | | | (1,283,282 | ) |
| HENNESSY FUNDS | 1-800-966-4354 |
Financial Statements
| Statements of Changes in Net Assets |
OPERATIONS:
Net investment income
Net realized gain on securities
Change in unrealized appreciation (depreciation) on securities
Net increase in net assets resulting from operations
DISTRIBUTIONS TO SHAREHOLDERS FROM:
Net investment income
Original Class
Net realized gains
Original Class
Total distributions
CAPITAL SHARE TRANSACTIONS:
Proceeds from shares subscribed – Original Class
Dividends reinvested – Original Class
Cost of shares redeemed – Original Class
Net decrease in net assets derived from capital share transactions
TOTAL INCREASE (DECREASE) IN NET ASSETS
NET ASSETS:
Beginning of year
End of year
Accumulated net investment income (loss), end of period
CHANGES IN SHARES OUTSTANDING:
Shares sold – Original Class
Shares issued to holders as reinvestment of dividends – Original Class
Shares redeemed – Original Class
Net increase (decrease) in shares outstanding
The accompanying notes are an integral part of these financial statements.
WWW.HENNESSYFUNDS.COM
| | | | | |
| Hennessy Total Return Fund | | | Hennessy Balanced Fund | |
| Year Ended | | | Year Ended | | | Year Ended | | | Year Ended | |
| October 31, 2011 | | | October 31, 2010 | | | October 31, 2011 | | | October 31, 2010 | |
| | | | | | | | | | | |
| $ | 1,021,401 | | | $ | 912,419 | | | $ | 57,635 | | | $ | 54,804 | |
| | 3,288,471 | | | | 5,573,895 | | | | 498,835 | | | | 1,256,664 | |
| | 2,165,518 | | | | 3,246,579 | | | | 310,456 | | | | (115,945 | ) |
| | 6,475,390 | | | | 9,732,893 | | | | 866,926 | | | | 1,195,523 | |
| | | | | | | | | | | | | | | |
| | (1,003,505 | ) | | | (942,536 | ) | | | (55,526 | ) | | | (55,545 | ) |
| | | | | | | | | | | | | | | |
| | — | | | | — | | | | — | | | | — | |
| | (1,003,505 | ) | | | (942,536 | ) | | | (55,526 | ) | | | (55,545 | ) |
| | | | | | | | | | | | | | | |
| | 11,718,225 | | | | 16,112,008 | | | | 8,374,392 | | | | 1,313,838 | |
| | 905,737 | | | | 869,098 | | | | 53,435 | | | | 54,019 | |
| | (23,040,187 | ) | | | (9,075,344 | ) | | | (3,720,748 | ) | | | (1,475,154 | ) |
| | (10,416,225 | ) | | | 7,905,762 | | | | 4,707,079 | | | | (107,297 | ) |
| | (4,944,340 | ) | | | 16,696,119 | | | | 5,518,479 | | | | 1,032,681 | |
| | | | | | | | | | | | | | | |
| | 69,075,801 | | | | 52,379,682 | | | | 12,503,764 | | | | 11,471,083 | |
| $ | 64,131,461 | | | $ | 69,075,801 | | | $ | 18,022,243 | | | $ | 12,503,764 | |
| $ | 74,649 | | | $ | 56,753 | | | $ | 6,275 | | | $ | 4,166 | |
| | | | | | | | | | | | | | | |
| | 1,061,206 | | | | 1,607,841 | | | | 760,081 | | | | 130,219 | |
| | 81,262 | | | | 87,092 | | | | 4,931 | | | | 5,440 | |
| | (2,087,396 | ) | | | (916,937 | ) | | | (344,283 | ) | | | (147,584 | ) |
| | (944,928 | ) | | | 777,996 | | | | 420,729 | | | | (11,925 | ) |
| HENNESSY FUNDS | 1-800-966-4354 |
(This Page Intentionally Left Blank.)
WWW.HENNESSYFUNDS.COM
Statement of Cash Flows
Hennessy Total Return Fund For the Year Ended October 31, 2011 |
| Cash Flows From Operating Activities: | | | |
| | | | |
| Net increase in net assets from operations | | $ | 6,475,390 | |
| Adjustments to reconcile net increase in net assets from | | | | |
| operations to net cash provided by operating activities: | | | | |
| Purchase of investment securities | | | (240,529,678 | ) |
| Proceeds on sale of securities | | | 257,185,311 | |
| Increase in other receivables, net | | | (833,618 | ) |
| Decrease in other assets | | | 2,063 | |
| Decrease in accrued expenses and other payables | | | (10,059 | ) |
| Net accretion of discount on securities | | | (26,190 | ) |
| Net realized gain on investments | | | (3,288,471 | ) |
| Unrealized appreciation on securities | | | (2,165,518 | ) |
| Net cash provided by operating activities | | $ | 16,809,230 | |
| | | | | |
| Cash Flows From Financing Activities: | | | | |
| | | | | |
| Decrease in reverse repurchase agreements | | $ | (5,389,500 | ) |
| Proceeds on shares sold | | | 11,718,225 | |
| Payment on shares repurchased | | | (23,040,187 | ) |
| Cash dividends paid | | | (97,768 | ) |
| Net cash used in financing activities | | $ | (16,809,230 | ) |
| | | | | |
| Cash at beginning of year | | | — | |
| Cash at end of year | | | — | |
| Net increase (decrease) in cash | | $ | — | |
| | | | | |
| Cash paid for interest | | $ | 70,065 | |
The accompanying notes are an integral part of these financial statements.
| HENNESSY FUNDS | 1-800-966-4354 |
Financial Highlights
| Hennessy Cornerstone Growth Fund |
For an Original Class share outstanding throughout each year
PER SHARE DATA:
Net asset value, beginning of year
Income from investment operations:
Net investment income (loss)
Net realized and unrealized gains (losses) on securities
Total from investment operations
Less Distributions:
Dividends from net investment income
Dividends from net realized gains
Total distributions
Net asset value, end of year
TOTAL RETURN
SUPPLEMENTAL DATA AND RATIOS:
Net assets, end of year (millions)
Ratio of expenses to average net assets:
Ratio of net investment loss to average net assets
Portfolio turnover rate(1)
| (1) | Portfolio turnover is calculated on the basis of the Fund as a whole. |
The accompanying notes are an integral part of these financial statements.
WWW.HENNESSYFUNDS.COM
| Year Ended October 31, | |
| 2011 | | | 2010 | | | 2009 | | | 2008 | | | 2007 | |
| | | | | | | | | | | | | | |
| $ | 10.28 | | | $ | 8.81 | | | $ | 8.80 | | | $ | 19.41 | | | $ | 20.77 | |
| | | | | | | | | | | | | | | | | | | |
| | | | | | | | | | | | | | | | | | | |
| | (0.08 | ) | | | (0.10 | ) | | | (0.04 | ) | | | (0.05 | ) | | | (0.07 | ) |
| | (0.23 | ) | | | 1.57 | | | | 0.05 | | | | (8.32 | ) | | | 1.82 | |
| | (0.31 | ) | | | 1.47 | | | | 0.01 | | | | (8.37 | ) | | | 1.75 | |
| | | | | | | | | | | | | | | | | | | |
| | | | | | | | | | | | | | | | | | | |
| | — | | | | — | | | | — | | | | — | | | | — | |
| | — | | | | — | | | | — | | | | (2.24 | ) | | | (3.11 | ) |
| | — | | | | — | | | | — | | | | (2.24 | ) | | | (3.11 | ) |
| $ | 9.97 | | | $ | 10.28 | | | $ | 8.81 | | | $ | 8.80 | | | $ | 19.41 | |
| | | | | | | | | | | | | | | | | | | |
| | (3.02 | )% | | | 16.69 | % | | | 0.11 | % | | | (48.00 | )% | | | 9.65 | % |
| | | | | | | | | | | | | | | | | | | |
| | | | | | | | | | | | | | | | | | | |
| $ | 184.40 | | | $ | 207.11 | | | $ | 228.96 | | | $ | 312.50 | | | $ | 990.43 | |
| | 1.33 | % | | | 1.34 | % | | | 1.36 | % | | | 1.25 | % | | | 1.20 | % |
| | (0.78 | )% | | | (0.89 | )% | | | (0.42 | )% | | | (0.29 | )% | | | (0.32 | )% |
| | 106 | % | | | 103 | % | | | 108 | % | | | 103 | % | | | 97 | % |
The accompanying notes are an integral part of these financial statements.
| HENNESSY FUNDS | 1-800-966-4354 |
Financial Highlights
| Hennessy Cornerstone Growth Fund |
For an Institutional Class share outstanding throughout each period
PER SHARE DATA:
Net asset value, beginning of period
Income from investment operations:
Net investment income (loss)
Net realized and unrealized gains (losses) on securities
Total from investment operations
Less Distributions:
Dividends from net investment income
Dividends from net realized gains
Total distributions
Net asset value, end of period
TOTAL RETURN
SUPPLEMENTAL DATA AND RATIOS:
Net assets, end of period (millions)
Ratio of expenses to average net assets:
Before expense reimbursement
After expense reimbursement
Ratio of net investment income (loss) to average net assets
Before expense reimbursement
After expense reimbursement
Portfolio turnover rate(4)
| (1) | | Institutional Class shares commenced operations on March 3, 2008. |
| (2) | | Not Annualized. |
| (3) | | Annualized. |
| (4) | | Portfolio turnover is calculated on the basis of the Fund as a whole. |
The accompanying notes are an integral part of these financial statements.
WWW.HENNESSYFUNDS.COM
| | | | | | | | | | Period Ended | |
| Year Ended October 31, | | | October 31, | |
| 2011 | | | 2010 | | | 2009 | | | 2008(1) | |
| | | | | | | | | | | |
| $ | 10.37 | | | $ | 8.86 | | | $ | 8.82 | | | $ | 13.29 | |
| | | | | | | | | | | | | | | |
| | (0.05 | ) | | | (0.07 | ) | | | — | | | | 0.01 | |
| | (0.23 | ) | | | 1.58 | | | | 0.04 | | | | (4.48 | ) |
| | (0.28 | ) | | | 1.51 | | | | 0.04 | | | | (4.47 | ) |
| | | | | | | | | | | | | | | |
| | — | | | | — | | | | — | | | | — | |
| | — | | | | — | | | | — | | | | — | |
| | — | | | | — | | | | — | | | | — | |
| $ | 10.09 | | | $ | 10.37 | | | $ | 8.86 | | | $ | 8.82 | |
| | | | | | | | | | | | | | | |
| | (2.70 | )% | | | 17.04 | % | | | 0.45 | % | | | (34.13 | )%(2) |
| | | | | | | | | | | | | | | |
| $ | 2.53 | | | $ | 3.12 | | | $ | 4.68 | | | $ | 5.09 | |
| | | | | | | | | | | | | | | |
| | 1.09 | % | | | 1.09 | % | | | 1.11 | % | | | 1.12 | %(3) |
| | 0.98 | % | | | 0.98 | % | | | 0.98 | % | | | 0.98 | %(3) |
| | | | | | | | | | | | | | | |
| | (0.55 | )% | | | (0.64 | )% | | | (0.17 | )% | | | 0.15 | %(3) |
| | (0.44 | )% | | | (0.53 | )% | | | (0.04 | )% | | | 0.29 | %(3) |
| | 106 | % | | | 103 | % | | | 108 | % | | | 103 | %(2) |
| HENNESSY FUNDS | 1-800-966-4354 |
Financial Highlights
For an Original Class share outstanding throughout each year
PER SHARE DATA:
Net asset value, beginning of year
Income from investment operations:
Net investment income (loss)
Net realized and unrealized gains (losses) on investments
Total from investment operations
Less Distributions:
Dividends from net investment income
Dividends from net realized gains
Total distributions
Net asset value, end of year
TOTAL RETURN
SUPPLEMENTAL DATA AND RATIOS:
Net assets, end of year (millions)
Ratio of expenses to average net assets:
Ratio of net investment loss to average net assets:
Portfolio turnover rate(1)
| (1) | Portfolio turnover is calculated on the basis of the Fund as a whole. |
The accompanying notes are an integral part of these financial statements.
WWW.HENNESSYFUNDS.COM
| Year Ended October 31, | |
| 2011 | | | 2010 | | | 2009 | | | 2008 | | | 2007 | |
| | | | | | | | | | | | | | |
| $ | 11.18 | | | $ | 8.73 | | | $ | 8.02 | | | $ | 13.67 | | | $ | 12.39 | |
| | | | | | | | | | | | | | | | | | | |
| | (0.09 | ) | | | (0.03 | ) | | | (0.02 | ) | | | (0.06 | ) | | | (0.09 | ) |
| | 1.06 | | | | 2.48 | | | | 0.73 | | | | (3.57 | ) | | | 1.47 | |
| | 0.97 | | | | 2.45 | | | | 0.71 | | | | (3.63 | ) | | | 1.38 | |
| | | | | | | | | | | | | | | | | | | |
| | — | | | | — | | | | — | | | | — | | | | — | |
| | — | | | | — | | | | — | | | | (2.02 | ) | | | (0.10 | ) |
| | — | | | | — | | | | — | | | | (2.02 | ) | | | (0.10 | ) |
| $ | 12.15 | | | $ | 11.18 | | | $ | 8.73 | | | $ | 8.02 | | | $ | 13.67 | |
| | | | | | | | | | | | | | | | | | | |
| | 8.68 | % | | | 28.06 | % | | | 8.85 | % | | | (30.81 | )% | | | 11.30 | % |
| | | | | | | | | | | | | | | | | | | |
| $ | 146.23 | | | $ | 123.20 | | | $ | 128.36 | | | $ | 167.32 | | | $ | 233.37 | |
| | 1.36 | % | | | 1.39 | % | | | 1.39 | % | | | 1.27 | % | | | 1.23 | % |
| | (0.79 | )% | | | (0.26 | )% | | | (0.20 | )% | | | (0.62 | )% | | | (0.61 | )% |
| | 107 | % | | | 87 | % | | | 90 | % | | | 123 | % | | | 112 | % |
| HENNESSY FUNDS | 1-800-966-4354 |
Financial Highlights
For an Institutional Class share outstanding throughout each period
PER SHARE DATA:
Net asset value, beginning of period
Income from investment operations:
Net investment income (loss)
Net realized and unrealized gains (losses) on investments
Total from investment operations
Less Distributions:
Dividends from net investment income
Dividends from net realized gains
Total distributions
Net asset value, end of period
TOTAL RETURN
SUPPLEMENTAL DATA AND RATIOS:
Net assets, end of period (millions)
Ratio of expenses to average net assets:
Before expense reimbursement
After expense reimbursement
Ratio of net investment income (loss) to average net assets:
Before expense reimbursement
After expense reimbursement
Portfolio turnover rate(4)
| (1) | | Institutional Class shares commenced operations on March 3, 2008. |
| (2) | | Not Annualized. |
| (3) | | Annualized. |
| (4) | | Portfolio turnover is calculated on the basis of the Fund as a whole. |
The accompanying notes are an integral part of these financial statements.
WWW.HENNESSYFUNDS.COM
| Year Ended October 31, | | | Period Ended | |
| | | | | | | | | | October 31, | |
| 2011 | | | 2010 | | | 2009 | | | 2008(1) | |
| | | | | | | | | | | |
| $ | 11.29 | | | $ | 8.78 | | | $ | 8.04 | | | $ | 11.15 | |
| | | | | | | | | | | | | | | |
| | (0.05 | ) | | | 0.02 | | | | 0.02 | | | | (0.02 | ) |
| | 1.08 | | | | 2.49 | | | | 0.72 | | | | (3.09 | ) |
| | 1.03 | | | | 2.51 | | | | 0.74 | | | | (3.11 | ) |
| | | | | | | | | | | | | | | |
| | — | | | | — | | | | — | | | | — | |
| | — | | | | — | | | | — | | | | — | |
| | — | | | | — | | | | — | | | | — | |
| $ | 12.32 | | | $ | 11.29 | | | $ | 8.78 | | | $ | 8.04 | |
| | | | | | | | | | | | | | | |
| | 9.12 | % | | | 28.59 | % | | | 9.20 | % | | | (27.89 | )%(2) |
| | | | | | | | | | | | | | | |
| $ | 24.06 | | | $ | 21.38 | | | $ | 27.44 | | | $ | 26.78 | |
| | | | | | | | | | | | | | | |
| | 1.14 | % | | | 1.16 | % | | | 1.15 | % | | | 1.13 | %(3) |
| | 0.98 | % | | | 0.98 | % | | | 0.98 | % | | | 0.98 | %(3) |
| | | | | | | | | | | | | | | |
| | (0.57 | )% | | | (0.03 | )% | | | 0.04 | % | | | (0.28 | )%(3) |
| | (0.41 | )% | | | 0.15 | % | | | 0.21 | % | | | (0.13 | )%(3) |
| | 107 | % | | | 87 | % | | | 90 | % | | | 123 | %(2) |
| HENNESSY FUNDS | 1-800-966-4354 |
Financial Highlights
| Hennessy Cornerstone Large Growth Fund |
For an Original Class share outstanding throughout each period
PER SHARE DATA:
Net asset value, beginning of period
Income from investment operations:
Net investment income (loss)
Net realized and unrealized gains (losses) on securities
Total from investment operations
Less Distributions:
Dividends from net investment income
Dividends from net realized gains
Total distributions
Net asset value, end of period
TOTAL RETURN
SUPPLEMENTAL DATA AND RATIOS:
Net assets, end of period (millions)
Ratio of expenses to average net assets:
Before expense reimbursement/recoupment
After expense reimbursement/recoupment
Ratio of net investment income to average net assets
Before expense reimbursement/recoupment
After expense reimbursement/recoupment
Portfolio turnover rate(7)
| (1) | | For the one month period ended October 31, 2009. Effective October 31, 2009, the Fund changed its fiscal year end to October 31st from September 30th. |
| (2) | | The financial highlights set forth for periods prior to March 20, 2009 represent the historical financial highlights of the Tamarack Large Cap Growth Fund, Class S shares. The assets of the Tamarack Large Cap Growth Fund were acquired by the Hennessy Cornerstone Large Growth Fund on March 20, 2009. At the time RBC Global Asset Management (U.S.), Inc. (formerly known as Voyageur Asset Management Inc.) ceased to be investment advisor and Hennessy Advisors, Inc. became investment advisor. The return of the Tamarack Large Cap Growth Fund, Class S shares during the period October 1, 2008 through March 20, 2009 was (33.30)%. The return of the Hennessy Cornerstone Large Growth Fund, Original Class shares during the period March 20, 2009 through September 30, 2009 was 42.64%. |
| (3) | | Amount is less than $0.01 or ($0.01) per share. |
| (4) | | Per share net investment income (loss) has been calculated using the average daily shares method. |
| (5) | | Not annualized. |
| (6) | | Annualized. |
| (7) | | Portfolio turnover is calculated on the basis of the Fund as a whole. |
The accompanying notes are an integral part of these financial statements.
WWW.HENNESSYFUNDS.COM
| Year Ended October 31, | | | One Month Ended October 31, | | | Year Ended September 30, | |
| 2011 | | | 2010 | | | 2009(1) | | | 2009(2) | | | 2008(2) | | | 2007(2) | |
| | | | | | | | | | | | | | | | | |
| $ | 11.70 | | | $ | 9.49 | | | $ | 9.60 | | | $ | 10.09 | | | $ | 12.61 | | | $ | 10.98 | |
| | | | | | | | | | | | | | | | | | | | | | | |
| | 0.09 | | | | 0.09 | | | | — | (3) | | | 0.05 | | | | — | (3)(4) | | | — | (3) |
| | 0.69 | | | | 2.17 | | | | (0.11 | ) | | | (0.54 | ) | | | (2.52 | ) | | | 1.63 | |
| | 0.78 | | | | 2.26 | | | | (0.11 | ) | | | (0.49 | ) | | | (2.52 | ) | | | 1.63 | |
| | | | | | | | | | | | | | | | | | | | | | | |
| | (0.09 | ) | | | (0.05 | ) | | | — | | | | — | | | | — | | | | — | |
| | (0.02 | ) | | | — | | | | — | | | | — | | | | — | | | | — | |
| | (0.11 | ) | | | (0.05 | ) | | | — | | | | — | | | | — | | | | — | |
| $ | 12.37 | | | $ | 11.70 | | | $ | 9.49 | | | $ | 9.60 | | | $ | 10.09 | | | $ | 12.61 | |
| | 6.70 | % | | | 23.88 | % | | | (1.15 | )%(5) | | | (4.86 | )% | | | (19.98 | )% | | | 14.85 | % |
| | | | | | | | | | | | | | | | | | | | | | | |
| $ | 77.88 | | | $ | 78.83 | | | $ | 69.41 | | | $ | 70.61 | | | $ | 80.91 | | | $ | 113.15 | |
| | | | | | | | | | | | | | | | | | | | | | | |
| | 1.26 | % | | | 1.30 | % | | | 1.26 | %(6) | | | 1.40 | % | | | 1.16 | % | | | 1.18 | % |
| | 1.30 | % | | | 1.30 | % | | | 1.30 | %(6) | | | 1.17 | % | | | 0.98 | % | | | 1.00 | % |
| | | | | | | | | | | | | | | | | | | | | | | |
| | 0.72 | % | | | 0.84 | % | | | (0.01 | )%(6) | | | 0.36 | % | | | (0.19 | )% | | | (0.19 | )% |
| | 0.68 | % | | | 0.84 | % | | | (0.05 | )%(6) | | | 0.59 | % | | | (0.01 | )% | | | (0.01 | )% |
| | 70 | % | | | 83 | % | | | 0 | %(5) | | | 116 | % | | | 38 | % | | | 25 | % |
| HENNESSY FUNDS | 1-800-966-4354 |
Financial Highlights
| Hennessy Cornerstone Large Growth Fund |
For an Institutional Class share outstanding throughout each period
PER SHARE DATA:
Net asset value, beginning of period
Income from investment operations:
Net investment income
Net realized and unrealized gains (losses) on securities
Total from investment operations
Less Distributions:
Dividends from net investment income
Dividends from net realized gains
Total distributions
Net asset value, end of period
TOTAL RETURN
SUPPLEMENTAL DATA AND RATIOS:
Net assets, end of period (millions)
Ratio of expenses to average net assets:
Before expense reimbursement
After expense reimbursement
Ratio of net investment income to average net assets
Before expense reimbursement
After expense reimbursement
Portfolio turnover rate(6)
| (1) | | For the one month period ended October 31, 2009. Effective October 31, 2009, the Fund changed its fiscal year end to October 31st from September 30th. |
| (2) | | Institutional Class shares commenced operations on March 20, 2009. |
| (3) | | Amount is less than $0.01 or ($0.01) per share. |
| (4) | | Not annualized. |
| (5) | | Annualized. |
| (6) | | Portfolio turnover is calculated on the basis of the Fund as a whole. |
The accompanying notes are an integral part of these financial statements.
WWW.HENNESSYFUNDS.COM
| | | | | | | One Month Ended | | | Period Ended | |
| Year Ended October 31, | | | October 31, | | | September 30, | |
| 2011 | | | 2010 | | | 2009(1) | | | 2009(2) | |
| | | | | | | | | | | |
| $ | 11.76 | | | $ | 9.51 | | | $ | 9.61 | | | $ | 6.73 | |
| | | | | | | | | | | | | | | |
| | 0.08 | | | | 0.10 | | | | — | (3) | | | 0.03 | |
| | 0.74 | | | | 2.20 | | | | (0.10 | ) | | | 2.85 | |
| | 0.82 | | | | 2.30 | | | | (0.10 | ) | | | 2.88 | |
| | | | | | | | | | | | | | | |
| | (0.12 | ) | | | (0.05 | ) | | | — | | | | — | |
| | (0.02 | ) | | | — | | | | — | | | | — | |
| | (0.14 | ) | | | (0.05 | ) | | | — | | | | — | |
| $ | 12.44 | | | $ | 11.76 | | | $ | 9.51 | | | $ | 9.61 | |
| | | | | | | | | | | | | | | |
| | 6.99 | % | | | 24.26 | % | | | (1.04 | )%(4) | | | 42.79 | %(4) |
| | | | | | | | | | | | | | | |
| $ | 0.14 | | | $ | 0.07 | | | $ | 0.04 | | | $ | 0.04 | |
| | | | | | | | | | | | | | | |
| | 1.14 | % | | | 1.16 | % | | | 1.14 | %(5) | | | 16.51 | %(5) |
| | 0.98 | % | | | 0.98 | % | | | 0.98 | %(5) | | | 0.98 | %(5) |
| | | | | | | | | | | | | | | |
| | 0.81 | % | | | 0.90 | % | | | 0.12 | %(5) | | | (14.54 | )%(5) |
| | 0.97 | % | | | 1.08 | % | | | 0.28 | %(5) | | | 0.99 | %(5) |
| | 70 | % | | | 83 | % | | | 0 | %(4) | | | 116 | %(4) |
| HENNESSY FUNDS | 1-800-966-4354 |
Financial Highlights
| Hennessy Cornerstone Value Fund |
For an Original Class share outstanding throughout each year
PER SHARE DATA:
Net asset value, beginning of year
Income from investment operations:
Net investment income (loss)
Net realized and unrealized gains (losses) on investments
Total from investment operations
Less Distributions:
Dividends from net investment income
Dividends from net realized gains
Total distributions
Net asset value, end of year
TOTAL RETURN
SUPPLEMENTAL DATA AND RATIOS:
Net assets, end of year (millions)
Ratio of expenses to average net assets
Ratio of net investment income to average net assets
Portfolio turnover rate(1)
(1) Portfolio turnover is calculated on the basis of the Fund as a whole.
The accompanying notes are an integral part of these financial statements.
WWW.HENNESSYFUNDS.COM
| Year Ended October 31, | |
| 2011 | | | 2010 | | | 2009 | | | 2008 | | | 2007 | |
| | | | | | | | | | | | | | |
| $ | 12.53 | | | $ | 10.63 | | | $ | 9.05 | | | $ | 17.06 | | | $ | 15.27 | |
| | | | | | | | | | | | | | | | | | | |
| | 0.45 | | | | 0.29 | | | | 0.24 | | | | 0.55 | | | | 0.46 | |
| | 0.23 | | | | 1.81 | | | | 1.87 | | | | (8.15 | ) | | | 1.68 | |
| | 0.68 | | | | 2.10 | | | | 2.11 | | | | (7.60 | ) | | | 2.14 | |
| | | | | | | | | | | | | | | | | | | |
| | (0.37 | ) | | | (0.20 | ) | | | (0.53 | ) | | | (0.41 | ) | | | (0.35 | ) |
| | — | | | | — | | | | — | | | | — | | | | — | |
| | (0.37 | ) | | | (0.20 | ) | | | (0.53 | ) | | | (0.41 | ) | | | (0.35 | ) |
| $ | 12.84 | | | $ | 12.53 | | | $ | 10.63 | | | $ | 9.05 | | | | 17.06 | |
| | | | | | | | | | | | | | | | | | | |
| | 5.58 | % | | | 19.98 | % | | | 25.51 | % | | | (45.50 | )% | | | 14.26 | % |
| | | | | | | | | | | | | | | | | | | |
| $ | 116.41 | | | $ | 155.87 | | | $ | 145.91 | | | $ | 97.10 | | | $ | 204.50 | |
| | 1.31 | % | | | 1.29 | % | | | 1.27 | % | | | 1.20 | % | | | 1.17 | % |
| | 2.94 | % | | | 2.33 | % | | | 3.19 | % | | | 3.92 | % | | | 2.64 | % |
| | 40 | % | | | 91 | % | | | 59 | % | | | 53 | % | | | 40 | % |
| HENNESSY FUNDS | 1-800-966-4354 |
Financial Highlights
| Hennessy Cornerstone Value Fund |
For an Institutional Class share outstanding throughout each period
PER SHARE DATA:
Net asset value, beginning of period
Income from investment operations:
Net investment income (loss)
Net realized and unrealized gains (losses) on investments
Total from investment operations
Less Distributions:
Dividends from net investment income
Dividends from net realized gains
Total distributions
Net asset value, end of period
TOTAL RETURN
SUPPLEMENTAL DATA AND RATIOS:
Net assets, end of period (millions)
Ratio of expenses to average net assets
Before expense reimbursement
After expense reimbursement
Ratio of net investment income to average net assets
Before expense reimbursement
After expense reimbursement
Portfolio turnover rate(4)
| (1) | | Institutional Class shares commenced operations on March 3, 2008. |
| (2) | | Not Annualized. |
| (3) | | Annualized. |
| (4) | | Portfolio turnover is calculated on the basis of the Fund as a whole. |
The accompanying notes are an integral part of these financial statements.
WWW.HENNESSYFUNDS.COM
| | | | | | | | | | Period Ended | |
| Year Ended October 31, | | | October 31, | |
| 2011 | | | 2010 | | | 2009 | | | 2008(1) | |
| | | | | | | | | | | |
| $ | 12.54 | | | $ | 10.63 | | | $ | 9.06 | | | $ | 13.79 | |
| | | | | | | | | | | | | | | |
| | 0.36 | | | | 0.30 | | | | 0.30 | | | | 0.34 | |
| | 0.37 | | | | 1.83 | | | | 1.83 | | | | (5.07 | ) |
| | 0.73 | | | | 2.13 | | | | 2.13 | | | | (4.73 | ) |
| | | | | | | | | | | | | | | |
| | (0.41 | ) | | | (0.22 | ) | | | (0.56 | ) | | | — | |
| | — | | | | — | | | | — | | | | — | |
| | (0.41 | ) | | | (0.22 | ) | | | (0.56 | ) | | | — | |
| $ | 12.86 | | | $ | 12.54 | | | $ | 10.63 | | | $ | 9.06 | |
| | | | | | | | | | | | | | | |
| | 6.00 | % | | | 20.31 | % | | | 25.87 | % | | | (34.30 | )%(2) |
| | | | | | | | | | | | | | | |
| $ | 1.17 | | | $ | 1.35 | | | $ | 1.11 | | | $ | 0.87 | |
| | | | | | | | | | | | | | | |
| | 1.14 | % | | | 1.10 | % | | | 1.13 | % | | | 1.14 | %(3) |
| | 0.98 | % | | | 0.98 | % | | | 0.98 | % | | | 0.98 | %(3) |
| | | | | | | | | | | | | | | |
| | 3.04 | % | | | 2.52 | % | | | 3.33 | % | | | 4.94 | %(3) |
| | 3.20 | % | | | 2.64 | % | | | 3.48 | % | | | 5.10 | %(3) |
| | 40 | % | | | 91 | % | | | 59 | % | | | 53 | %(2) |
| HENNESSY FUNDS | 1-800-966-4354 |
Financial Highlights
| Hennessy Total Return Fund |
For an Original Class share outstanding throughout each year
PER SHARE DATA:
Net asset value, beginning of year
Income from investment operations:
Net investment income
Net realized and unrealized gains (losses) on securities
Total from investment operations
Less Distributions:
Dividends from net investment income
Dividends from realized capital gains
Total distributions
Net asset value, end of year
TOTAL RETURN
SUPPLEMENTAL DATA AND RATIOS:
Net assets, end of year (millions)
Gross ratio of expenses, including interest expense, to average net assets
Ratio of interest expense to average net assets
Net ratio of expenses, excluding interest expense, to average net assets
Ratio of net investment income to average net assets
Portfolio turnover rate
The accompanying notes are an integral part of these financial statements.
WWW.HENNESSYFUNDS.COM
| Year Ended October 31, | |
| 2011 | | | 2010 | | | 2009 | | | 2008 | | | 2007 | |
| | | | | | | | | | | | | | |
| $ | 10.57 | | | $ | 9.10 | | | $ | 9.22 | | | $ | 13.73 | | | $ | 12.61 | |
| | | | | | | | | | | | | | | | | | | |
| | 0.18 | | | | 0.16 | | | | 0.18 | | | | 0.28 | | | | 0.33 | |
| | 0.89 | | | | 1.48 | | | | (0.14 | ) | | | (4.49 | ) | | | 1.13 | |
| | 1.07 | | | | 1.64 | | | | 0.04 | | | | (4.21 | ) | | | 1.46 | |
| | | | | | | | | | | | | | | | | | | |
| | (0.17 | ) | | | (0.17 | ) | | | (0.16 | ) | | | (0.30 | ) | | | (0.34 | ) |
| | — | | | | — | | | | — | | | | — | | | | — | |
| | (0.17 | ) | | | (0.17 | ) | | | (0.16 | ) | | | (0.30 | ) | | | (0.34 | ) |
| $ | 11.47 | | | $ | 10.57 | | | $ | 9.10 | | | $ | 9.22 | | | $ | 13.73 | |
| | | | | | | | | | | | | | | | | | | |
| | 10.22 | % | | | 18.09 | % | | | 0.69 | % | | | (30.97 | )% | | | 11.70 | % |
| | | | | | | | | | | | | | | | | | | |
| $ | 64.13 | | | $ | 69.08 | | | $ | 52.38 | | | $ | 58.22 | | | $ | 96.31 | |
| | 1.34 | % | | | 1.33 | % | | | 1.56 | % | | | 2.36 | % | | | 3.04 | % |
| | 0.10 | % | | | 0.08 | % | | | 0.29 | % | | | 1.16 | % | | | 1.88 | % |
| | 1.24 | % | | | 1.25 | % | | | 1.27 | % | | | 1.20 | % | | | 1.16 | % |
| | 1.56 | % | | | 1.62 | % | | | 2.12 | % | | | 2.43 | % | | | 2.48 | % |
| | 21 | % | | | 41 | % | | | 41 | % | | | 16 | % | | | 12 | % |
| HENNESSY FUNDS | 1-800-966-4354 |
Financial Highlights
For an Original Class share outstanding throughout each year
PER SHARE DATA:
Net asset value, beginning of year
Income from investment operations:
Net investment income
Net realized and unrealized gains (losses) on securities
Total from investment operations
Less Distributions:
Dividends from net investment income
Dividends from realized capital gains
Total distributions
Net asset value, end of year
TOTAL RETURN
SUPPLEMENTAL DATA AND RATIOS:
Net assets, end of year (millions)
Ratio of net expenses to average net assets
Ratio of net investment income to average net assets
Portfolio turnover rate
The accompanying notes are an integral part of these financial statements.
WWW.HENNESSYFUNDS.COM
| Year Ended October 31, | |
| 2011 | | | 2010 | | | 2009 | | | 2008 | | | 2007 | |
| | | | | | | | | | | | | | |
| $ | 10.43 | | | $ | 9.48 | | | $ | 9.11 | | | $ | 12.51 | | | $ | 11.83 | |
| | | | | | | | | | | | | | | | | | | |
| | 0.05 | | | | 0.05 | | | | 0.10 | | | | 0.25 | | | | 0.38 | |
| | 0.70 | | | | 0.95 | | | | 0.38 | | | | (2.80 | ) | | | 0.69 | |
| | 0.75 | | | | 1.00 | | | | 0.48 | | | | (2.55 | ) | | | 1.07 | |
| | | | | | | | | | | | | | | | | | | |
| | (0.05 | ) | | | (0.05 | ) | | | (0.11 | ) | | | (0.26 | ) | | | (0.39 | ) |
| | — | | | | — | | | | — | | | | (0.59 | ) | | | — | |
| | (0.05 | ) | | | (0.05 | ) | | | (0.11 | ) | | | (0.85 | ) | | | (0.39 | ) |
| $ | 11.13 | | | $ | 10.43 | | | $ | 9.48 | | | $ | 9.11 | | | $ | 12.51 | |
| | | | | | | | | | | | | | | | | | | |
| | 7.16 | % | | | 10.53 | % | | | 5.46 | % | | | (21.55 | )% | | | 9.16 | % |
| | | | | | | | | | | | | | | | | | | |
| $ | 18.02 | | | $ | 12.50 | | | $ | 11.47 | | | $ | 11.46 | | | $ | 16.82 | |
| | 1.61 | % | | | 1.65 | % | | | 1.73 | % | | | 1.56 | % | | | 1.36 | % |
| | 0.42 | % | | | 0.45 | % | | | 1.17 | % | | | 2.31 | % | | | 2.86 | % |
| | 39 | % | | | 57 | % | | | 46 | % | | | 13 | % | | | 35 | % |
| HENNESSY FUNDS | 1-800-966-4354 |
(This Page Intentionally Left Blank.)
WWW.HENNESSYFUNDS.COM
Notes to the Financial Statements
October 31, 2011
The Hennessy Mutual Funds, Inc. was organized as a Maryland corporation on May 20, 1996 and consists of three separate series: Hennessy Cornerstone Growth Fund (the “Growth Fund”), Hennessy Cornerstone Value Fund (the “Value Fund”) and the Hennessy Focus 30 Fund (the “Focus 30 Fund”). These Funds are open-end, diversified management investment companies registered under the Investment Company Act of 1940, as amended (the “1940 Act”). The investment objective of the Growth and Focus 30 Funds is long-term growth of capital. The investment objective of the Value Fund is total return, consisting of capital appreciation and current income.
The Hennessy Funds, Inc. was organized as a Maryland corporation on January 11, 1996 and consists of two separate series: Hennessy Balanced Fund (the “Balanced Fund”) and Hennessy Total Return Fund (the “Total Return Fund”). The Balanced and Total Return Funds are open-end, non-diversified management investment companies registered under the 1940 Act. The investment objective of the Balanced Fund is a combination of capital appreciation and current income. The investment objective of the Total Return Fund is total return, consisting of capital appreciation and current income.
The Hennessy Funds Trust (the “Trust”) was organized as a Delaware Statutory Trust on September 17, 1992 and consists of two series: Hennessy Select Large Value Fund and Hennessy Cornerstone Large Growth Fund (the “Large Growth Fund”). The financial results of the Hennessy Select Large Value Fund are not contained in this report. The Large Growth Fund is an open-end, diversified management investment company registered under the 1940 Act. The investment objective of the Large Growth Fund is long-term growth of capital.
The Growth, Focus 30, Large Growth, Value, Total Return and Balanced Funds collectively represent the Hennessy Cornerstone Series Funds (the “Funds”).
The Growth, Focus 30, Large Growth and Value Funds offer Original and Institutional Class shares. Each class of shares differs principally in its respective administration, shareholder servicing and transfer agent expenses and sales charges, if any. Each class has identical rights to earnings, assets and voting privileges, except for class-specific expenses and exclusive rights to vote on matters affecting only individual classes. The Balanced and Total Return Funds offer only Original Class shares.
| 2). | SIGNIFICANT ACCOUNTING POLICIES |
The following is a summary of significant accounting policies consistently followed by the Funds in the preparation of the financial statements. These policies are in conformity with U.S. generally accepted accounting principles (“GAAP”).
| HENNESSY FUNDS | 1-800-966-4354 |
| a). | Investment Valuation – All investments in securities are recorded at their estimated fair value, as described in Note 3. |
| b). | Federal Income Taxes – Provision for Federal income taxes or excise taxes has not been made since the Funds have elected to be taxed as “regulated investment companies” and intend to distribute substantially all taxable income to shareholders and otherwise comply with the provisions of the Internal Revenue Code applicable to regulated investment companies. Net investment income or loss and realized gains and losses for federal income tax purposes may differ from that reported on the financial statements because of temporary book and tax basis differences. Temporary differences are primarily the result of the treatment of wash sales for tax reporting purposes. Distributions from net realized gains for book purposes may include short-term capital gains, which are included as ordinary income to shareholders for tax purposes. |
Due to inherent differences in the recognition of income, expenses, and realized gains/losses under U.S. generally accepted accounting principles and federal income tax purposes, permanent differences between book and tax basis reporting for the 2011 fiscal year have been identified and appropriately reclassified on the Statements of Assets and Liabilities.
| | | | Accumulated Net | | | Accumulated Net | | | Paid In | |
| | | | Investment Income/(Loss) | | | Realized Gain/(Loss) | | | Capital | |
| | Growth Fund | | | 1,530,682 | | | | (7,146,713 | ) | | | 5,616,031 | |
| | Focus 30 Fund | | | 1,184,998 | | | | — | | | | (1,184,998 | ) |
| | Large Growth Fund | | | — | | | | — | | | | — | |
| | Value Fund | | | 4,876 | | | | (4,866 | ) | | | (10 | ) |
| | Total Return Fund | | | — | | | | — | | | | — | |
| | Balanced Fund | | | — | | | | — | | | | — | |
The permanent differences primarily relate to net operating losses, reclassification on the sale of PTP securities, capital loss carryovers acquired in mergers and capital loss carryovers due to expiration.
| c). | Income and Expenses – Dividend income is recognized on the ex-dividend date or as soon as information is available to the Funds and interest income is recognized on an accrual basis. Income, expenses (other than expenses attributable to a specific class), and realized and unrealized gains or losses on investments are allocated to each class of shares based on its respective net assets. |
| d). | Distributions to Shareholders – Dividends from net investment income for the Growth, Focus 30, Large Growth and Value Funds, if any, are declared and paid out annually, usually in November or December of each year. Dividends from net investment income for the Total Return and Balanced Funds are declared and paid on a calendar quarter basis. Distributions of net realized capital gains, if any, are declared and paid annually, usually in November or December of each year, for all of the Funds. |
| e). | Security Transactions – Investment and shareholder transactions are recorded on the trade date. The Funds determine the gain or loss realized from the investment transactions by comparing the original cost of the security lot sold with the net sale proceeds. Discounts and premiums on securities purchased are accreted/amortized over the life of the respective security. |
WWW.HENNESSYFUNDS.COM
| f). | Use of Estimates – The preparation of financial statements in conformity with GAAP requires management to make estimates and assumptions that affect the reported amounts of assets and liabilities and disclosure of contingent assets and liabilities at the date of the financial statements and the reported change in net assets during the reporting period. Actual results could differ from those estimates. |
| g). | Share Valuation – The net asset value (“NAV”) per share of each Fund is calculated by dividing the sum of the value of the securities held by each Fund, plus cash or other assets, minus all liabilities (including estimated accrued expenses) by the total number of shares outstanding for each Fund, rounded to the nearest cent. The Funds’ shares will not be priced on the days on which the New York Stock Exchange is closed for trading. The offering and redemption price per share for each Fund is equal to each Fund’s net asset value per share. |
| h). | Repurchase Agreements – Each Fund may enter into repurchase agreements with member banks or security dealers of the Federal Reserve whom the investment advisor deems creditworthy. The repurchase price generally equals the price paid by the Fund plus interest negotiated on the basis of current short-term rates. |
Securities pledged as collateral for repurchase agreements are held by the custodian bank until the respective agreements mature. Provisions of the repurchase agreements ensure that the market value of the collateral, including accrued interest thereon, is sufficient, in the event of default of the counterparty. If the counterparty defaults and the value of the collateral declines or if the counterparty enters an insolvency proceeding, realization of the collateral by the Fund may be delayed or limited.
| i). | Accounting for Uncertainty in Income Taxes – The Funds have adopted accounting policies regarding recognition and measurement of tax positions taken or expected to be taken on a tax return. The Funds have reviewed all open tax years and major jurisdictions and concluded that there is no impact on the Funds’ net assets and no tax liability resulting from unrecognized tax benefits relating to uncertain income tax positions taken or expected to be taken on a tax return. As of October 31, 2011, open Federal and state tax years for the Large Growth Fund include the tax year ended September 30, 2009, tax period ended October 31, 2009 and tax years ended October 31, 2010 and October 31, 2011. As of October 31, 2011, open Federal and state tax years for the Growth, Focus, Value, Total Return and Balanced Fund include the tax years ended October 31, 2009 through 2011. |
| j). | Derivatives – The Funds may invest in, or enter into, derivatives, such as options, futures contracts, options on futures contracts and swaps, for a variety of reasons, including to hedge certain risks, to provide a substitute for purchasing or selling particular securities or to increase potential income gain. Derivatives may provide a cheaper, quicker or more specifically focused way for a Fund to invest than “traditional” securities would. The main purpose of utilizing these derivative instruments is for hedging purposes. |
| HENNESSY FUNDS | 1-800-966-4354 |
The Funds have adopted the financial accounting reporting rules as required by the Derivatives and Hedging Topic of the FASB Accounting Standards Codification (“FASB ASC”). The Funds are required to include enhanced disclosure that enables investors to understand how and why an entity uses derivatives, how derivatives are accounted for, and how derivatives instruments affect an entity’s results of operations and financial position. During the year ended October 31, 2011, the Funds did not hold any derivative instruments.
| k). | Events Subsequent to the Fiscal Period End – The Funds have adopted financial reporting rules regarding subsequent events which requires an entity to recognize in the financial statements the effects of all subsequent events that provide additional evidence about conditions that existed at the date of the balance sheet. Management has evaluated the Funds’ related events and transactions that occurred subsequent to October 31, 2011, through the date of issuance of the Funds’ financial statements. There were no events or transactions that occurred during this period that materially impacted the amounts or disclosures in the Fund’s financial statements. |
| l). | New Accounting Pronouncements – In April 2011, FASB issued ASU No. 2011-03 “Reconsideration of Effective Control for Repurchase Agreements”. ASU 2011-03 amends FASB ASC Topic 860, Transfers and Servicing, specifically the criteria required to determine whether a repurchase agreement (repo) and similar agreements should be accounted for as sales of financial assets or secured borrowings with commitments. ASU No. 2011-03 changes the assessment of effective control by focusing on the transferor’s contractual rights and obligations and removing the criterion to assess its ability to exercise those rights or honor those obligations. This could result in changes to the way entities account for certain transactions including repurchase agreements, mortgage dollar rolls and reverse repurchase agreements. The ASU will become effective on a prospective basis for new transfers and modifications to existing transactions as of the beginning of the first interim or annual period beginning on or after December 15, 2011. Management continues to evaluate the application of this pronouncement to the Funds, and is not in a position at this time to evaluate the significance of its impact, if any, on the Funds’ financial statements. |
In May 2011, the Financial Accounting Standards Board (“FASB”) issued ASU No. 2011-04 “Amendments to Achieve Common Fair Value Measurement and Disclosure Requirements” in GAAP and the International Financial Reporting Standards (“IFRSs”). ASU No. 2011-04 amends FASB ASC Topic 820, Fair Value Measurements and Disclosures, to establish common requirements for measuring fair value and for disclosing information about fair value measurements in accordance with GAAP and IFRSs. ASU No. 2011-04 is effective for fiscal years beginning after December 15, 2011 and for interim periods within those fiscal years. Management is currently evaluating the impact of these amendments and does not believe they will have a material impact on the Funds’ financial statements.
WWW.HENNESSYFUNDS.COM
The Funds have adopted authoritative fair valuation accounting standards which establish an authoritative definition of fair value and set out a hierarchy for measuring fair value. These standards require additional disclosures about the various inputs and valuation techniques used to develop the measurements of fair value and a discussion in changes in valuation techniques and related inputs during the period. These inputs are summarized in the three broad levels listed below:
| | Level 1 – | Quoted unadjusted prices for identical instruments in active markets to which the Fund has access at the date of measurement. |
| | | |
| | Level 2 – | Quoted prices for similar instruments in active markets; quoted prices for identical or similar instruments in markets that are not active; and model-derived valuations in which all significant inputs and significant value drivers are observable in active markets. Level 2 inputs are those in markets for which there are few transactions, the prices are not current, little public information exists or instances where prices vary substantially over time or among brokered market makers. |
| | | |
| | Level 3 – | Model-derived valuations in which one or more significant inputs or significant value drivers are unobservable. Unobservable inputs are those inputs that reflect the Funds’ own assumptions that market participant’s would use to price the asset or liability based on the best available information. |
Following is a description of the valuation techniques applied to the Funds’ major categories of assets and liabilities measured at fair value on a recurring basis.
Equity Securities – Equity securities, including common stocks, preferred stocks, foreign issued common stocks, exchange traded funds, closed-end mutual funds and real estate investment trust, which are traded on a securities exchange for which a last-quoted sales price is readily available will be valued at the last sales price as reported by the primary exchange on which the securities are listed. Securities listed on the Nasdaq National Market System (“Nasdaq”) will be valued at the Nasdaq Official Closing Price, which may differ from the last sales price reported. Securities traded on a securities exchange for which a last-quoted sales price is not readily available will be valued at the mean between the bid and ask prices. To the extent these securities are actively traded and valuation adjustments are not applied, they are categorized in Level 1 of the fair value hierarchy.
The Board of Directors/Trustees of the Funds has adopted fair value pricing procedures that are followed when a price for a security is not readily available or if a significant event has occurred that indicates the closing price of a security no longer represents the true value of that security. Fair value pricing determinations are made in good faith in accordance with these procedures. There are numerous criteria that will be given consideration in determining a fair value of a security. Some of these criteria are: trading volume of security and markets, value of other like securities and news events with direct bearing to security or market. Fair value pricing results in an estimated price that reasonably reflects the current
| HENNESSY FUNDS | 1-800-966-4354 |
market conditions in order to rate the portfolio holdings such that shareholder transactions receive a fair net asset value. Depending on the relative significance of the valuation inputs, these securities may be classified in either Level 2 or Level 3 of the fair value hierarchy.
Mutual Funds – Investments in mutual funds are generally priced at the ending net asset value (NAV) provided by the service agent of the Funds and will be classified as Level 1 securities.
U.S. Government Securities – U.S. government securities are normally valued using a model that incorporates market observable data such as reported sales of similar securities, broker quotes, yields, bids, offers, and reference data. Certain securities are valued principally using prices furnished by a pricing service. U.S. government securities are generally categorized in Level 1 or Level 2 of the fair value hierarchy depending on the inputs used and market activity levels for specific securities.
Short-Term Securities – Short-term equity investments, including money market funds, are valued in the manner specified above. Short-term debt investments are valued at amortized cost, if their original maturity was 60 days or less, or by amortizing the values as of the 61st day prior to maturity, if their original term to maturity exceeded 60 days. Short-term securities are generally in Level 1 or Level 2 of the fair market hierarchy depending on the inputs used and market activity levels for specific securities.
The Funds have performed an analysis of all existing investments to determine the significance and character of all inputs to their fair value determination. Various inputs are used in determining the value of each Fund’s investments. The inputs or methodology used for valuing securities are not necessarily an indication of the risk associated with investing in those securities. Details related to the fair valuation hierarchy of the Funds’ securities as of October 31, 2011 are included with each Fund’s Schedule of Investments.
| 4). | REVERSE REPURCHASE AGREEMENTS |
The Total Return Fund may enter into reverse repurchase agreements with the same parties with whom it may enter into repurchase agreements. Under a reverse repurchase agreement, the Fund sells securities and agrees to repurchase them at a mutually agreed upon date and price. Under the 1940 Act, reverse repurchase agreements will be regarded as a form of borrowing by the Fund unless, at the time it enters into a reverse repurchase agreement, it establishes and maintains a segregated account with its custodian containing securities from its portfolio having a value not less than the repurchase price (including accrued interest). The Total Return Fund has established and maintained such an account for its reverse repurchase agreements.
Reverse repurchase agreements involve the risk that the market value of the securities retained in lieu of sale by the Fund may decline below the price of the securities the Fund has sold but is obligated to repurchase. In the event the buyer or its trustee or receiver may receive an extension of time to determine whether to enforce the Fund’s obligation to repurchase the securities, and the Fund’s use of the proceeds of the reverse repurchase agreement may effectively be restricted pending such decision. Also, the Fund would bear the risk of loss to the extent that the proceeds of the reverse repurchase agreements are less than the value of the securities subject to such agreements.
WWW.HENNESSYFUNDS.COM
For the year ended October 31, 2011, the average daily balance and average interest rate in effect for reverse repurchase agreements were $21,508,195 and 0.32%, respectively. At October 31, 2011, the interest rate in effect for the outstanding reverse repurchase agreements, scheduled to mature on November 10, 2011 ($5,397,000), December 15, 2011 ($4,500,000) and January 19, 2012 ($9,000,000) were 0.30%, 0.30% and 0.30%, respectively. Outstanding reverse repurchase agreements at October 31, 2011 were equal to 29.47% of the Total Return Fund’s total net assets.
| 5). | INVESTMENT TRANSACTIONS |
Purchases and sales of investment securities (excluding government and short-term investments) during the year ended October 31, 2011 were as follows:
| | Growth | Focus 30 | Large Growth | Value | Total Return | Balanced |
| | Fund | Fund | Fund | Fund | Fund | Fund |
| Purchases | $206,855,039 | $177,801,458 | $56,325,761 | $53,546,648 | $10,232,161 | $4,187,327 |
| Sales | $249,925,864 | $167,072,013 | $62,087,796 | $96,810,637 | $16,706,904 | $2,642,165 |
Purchases of long-term U.S. Government Securities for the Balanced Fund were $703,142 and there were no sales. There were no purchases or sales/maturities of long-term U.S. Government Securities for the Growth, Focus 30, Large Growth, Value or Total Return Funds.
| 6). | INVESTMENT MANAGEMENT FEE AND OTHER TRANSACTIONS WITH AFFILIATES |
Hennessy Advisors, Inc. (the “Advisor”) is the Advisor of the Funds. The Advisor provides the Funds with investment management services under a Management Agreement. The Advisor furnishes all investment advice, office space, facilities, and provides most of the personnel needed by the Funds. As compensation for its services, the Advisor is entitled to a monthly fee from each Fund. The fee is based upon the average daily net assets of the Funds at the annual rate of:
| Growth Fund | 0.74% |
| Focus 30 Fund | 0.74% |
| Large Growth Fund | 0.74% |
| Value Fund | 0.74% |
| Total Return Fund | 0.60% |
| Balanced Fund | 0.60% |
The Advisor has agreed to waive its fees and absorb expenses to the extent that the total annual operating expenses (excluding all Federal, state and local taxes, interest, brokerage commissions, acquired fund fees and expenses and other costs incurred in connection with the purchase and sale of securities and extraordinary items) do not exceed 0.98% of the Funds’ net assets for the Institutional Class shares in the Growth, Focus 30, Large Growth and Value Funds. The expense limitation agreement for the Institutional Class shares can only be terminated by the Board of Directors/Trustees. For a period of three years after the year in which the Advisor waives or reimburses expenses, the Advisor may seek reimbursement from the Funds to the extent that total annual Fund operating expenses are less than the expense limitation in effect at the time of the reimbursement.
| HENNESSY FUNDS | 1-800-966-4354 |
The Advisor previously contractually agreed to limit the expenses of certain Funds. These agreements have since either expired or have been terminated by the Board of Directors/Trustees. However, for a period of three years after the year in which the Advisor waives or reimburses expenses, the Advisor may seek reimbursement from the Fund to the extent that total annual fund operating expenses are less than the expense limitation in effect at the time of the waiver or reimbursement. The Advisor recouped $29,682 of previously reimbursed Original Class expenses for the Large Growth Fund for the year ended October 31, 2011. As of October 31, 2011, cumulative expenses subject to potential recovery to the aforementioned conditions and year of expiration are as follows:
| | | Oct. 31, 2012 | | | Oct. 31,2013 | | | Oct. 31,2014 | | | Total | |
| Growth Fund – Institutional Class | | $ | 6,062 | | | $ | — | | | $ | — | | | $ | 6,062 | |
| Focus 30 Fund – Institutional Class | | $ | 43,673 | | | $ | — | | | $ | — | | | $ | 43,673 | |
| Large Growth Fund – Institutional Class | | $ | 5 | | | $ | — | | | $ | — | | | $ | 5 | |
| Value Fund – Institutional Class | | $ | 1,298 | | | $ | — | | | $ | — | | | $ | 1,298 | |
The Board of Directors/Trustees has approved a Shareholder Servicing Plan for the Original Class shares of each of the Funds which was instituted to compensate the Advisor for the non-investment management services it provides to the Funds. The Plan provides for a monthly fee paid to the Advisor at an annual rate of 0.10% of the average daily net assets of the Funds.
The Growth, Focus 30, Large Growth and Value Funds have entered into agreements with various brokers, dealers and financial intermediaries in connection with the sale of shares of the Funds. The agreements provide for periodic payments by the Funds to the brokers, dealers and financial intermediaries for providing certain shareholder maintenance services (sub-transfer agent expenses). These shareholder services include: the pre-processing and quality control of new accounts, shareholder correspondence, answering customer inquiries regarding account status and facilitating shareholder telephone transactions. Fees paid by the Growth, Focus 30, Large Growth and Value Funds to various brokers, dealers and financial intermediaries for the year ended October 31, 2011, were $294,055, $255,602, $24,567 and $113,875, respectively.
The Total Return and Balanced Funds have adopted a plan pursuant to Rule 12b-1 which authorizes payments in connection with the distribution of the Total Return and Balanced Fund shares at an annual rate not to exceed 0.15% of each Fund’s average daily net assets. Amounts paid under the Plan may be spent on any activities or expenses primarily intended to result in the sale of shares, including but not limited to, advertising, compensation for sales and marketing activities or financial institutions and others such as dealers and distributors, shareholder account servicing, the printing and mailing of prospectuses to other than current shareowners and the printing and mailing of sales literature.
U.S. Bancorp Fund Services, LLC (the “Administrator”) acts as the Funds’ administrator under an Administration Agreement. Administrative services under this agreement include custody, distribution, fund accounting, fund administration and transfer agent services. In addition, the Administrator prepares various federal and state regulatory filings, reports and returns for the Funds; prepares reports and materials to be supplied to the directors; monitors the activities of the Funds’ custodian, transfer agent and accountants;
WWW.HENNESSYFUNDS.COM
coordinates the preparation and payment of the Funds’ expenses and reviews the Funds’ expense accruals. Fees paid to U.S. Bancorp Fund Services, LLC for the year ended October 31, 2011, were $497,644, $411,243, $208,748, $350,415, $166,765, and $34,621 for Growth, Focus 30, Large Growth, Value, Total Return and Balanced Funds, respectively. The Administrator has voluntarily waived all or a portion of its administration fees allocated to the Institutional Class shares of the Growth, Focus 30, Large Growth and Value Funds. The administration fees voluntarily waived by the Administrator during the year ended October 31, 2011 were $3,015, $36,294, $155 and $1,773, respectively.
Quasar Distributors, LLC (the “Distributor”) acts as the Funds’ principal underwriter in a continuous public offering of the Funds’ shares. The Distributor is an affiliated company of U.S. Bank, N.A.
The Growth, Focus 30, and Value Funds have $40,000,000, $25,000,000 and $10,000,000 lines of credit, respectively, intended to provide short-term financing, if necessary, subject to certain restrictions, in connection with shareholder redemptions. The credit facility is with its custodian bank, U.S. Bank, N.A. Borrowings under this arrangement bear interest at the bank’s prime rate. During the year ended October 31, 2011, the Growth Fund had an outstanding average daily balance and a weighted average interest rate of $7,312 and 3.25%, respectively. The maximum amount outstanding for the Growth Fund during the period was $661,000. During the year ended October 31, 2011, the Focus 30 Fund had an outstanding average daily balance and a weighted average interest rate of $53,512 and 3.25%, respectively. The maximum amount outstanding for the Focus 30 Fund during the period was $3,586,000. During the year ended October 31, 2011, the Value Fund had an outstanding average daily balance and a weighted average interest rate of $164,578 and 3.25%, respectively. The maximum amount outstanding for the Value Fund during the period was $10,000,000.
| 8). | FEDERAL TAX INFORMATION |
As of October 31, 2011, the components of accumulated earnings (losses) for income tax purposes were as follows:
| | | | | | | | | Large | |
| | | Growth | | | Focus 30 | | | Growth | |
| | | Fund | | | Fund | | | Fund | |
| Tax cost of Investments | | $ | 203,767,572 | | | $ | 167,113,847 | | | $ | 79,516,812 | |
| Unrealized Appreciation | | | 19,602,977 | | | | 4,725,071 | | | | 6,865,675 | |
| Unrealized Depreciation | | | (35,823,319 | ) | | | (1,641,452 | ) | | | (8,246,007 | ) |
| Net unrealized appreciation (depreciation) | | | (16,220,342 | ) | | | 3,083,619 | | | | (1,380,332 | ) |
| Undistributed Ordinary Income | | $ | — | | | $ | — | | | $ | 559,148 | |
| Undistributed Long-Term Gains | | | — | | | | — | | | | 15,375,933 | |
| Distributable earnings | | $ | — | | | $ | — | | | $ | 15,935,081 | |
| Accumulated capital loss | | $ | (245,266,479 | ) | | $ | (43,585,773 | ) | | $ | — | |
| Total accumulated earnings/(loss) | | $ | (261,486,821 | ) | | $ | (40,502,154 | ) | | $ | 14,554,749 | |
| HENNESSY FUNDS | 1-800-966-4354 |
| | | | | | Total | | | | |
| | | Value | | | Return | | | Balanced | |
| | | Fund | | | Fund | | | Fund | |
| Tax cost of Investments | | $ | 107,366,724 | | | $ | 77,141,489 | | | $ | 17,362,733 | |
| Unrealized Appreciation | | | 15,529,521 | | | | 6,362,263 | | | | 986,813 | |
| Unrealized Depreciation | | | (5,513,002 | ) | | | (1,486,990 | ) | | | (289,426 | ) |
| Net unrealized appreciation (depreciation) | | | 10,016,519 | | | | 4,875,273 | | | | 697,387 | |
| Undistributed Ordinary Income | | $ | 3,329,870 | | | $ | 74,649 | | | $ | 6,275 | |
| Undistributed Long-Term Gains | | | — | | | | — | | | | — | |
| Distributable earnings | | $ | 3,329,870 | | | $ | 74,649 | | | $ | 6,275 | |
| Accumulated capital loss | | $ | (46,714,841 | ) | | $ | (10,329,856 | ) | | $ | (1,736,101 | ) |
| Total accumulated loss | | $ | (33,368,452 | ) | | $ | (5,379,934 | ) | | $ | (1,032,439 | ) |
The difference between book-basis and tax-basis unrealized appreciation is attributable primarily to wash sales and partnership adjustments.
At October 31, 2011, the Growth Fund had tax basis capital losses of $245,266,479, to offset future capital gains. Of such losses, $1,008,985 expire October 31, 2012, $1,008,985 expire October 31, 2013, $1,008,985 expire October 31, 2014, $1,008,985 expire October 31, 2015, $63,120,201 expire October 31, 2016 and $178,110,338 expire October 31, 2017.
At October 31, 2011, the Focus 30 Fund had tax basis capital losses of $43,585,773, to offset future capital gains. Of such losses, $2,450,635 expire October 31, 2016 and $41,135,138 expire October 31, 2017.
At October 31, 2011, the Large Growth Fund had no tax basis capital losses to offset future capital gains.
At October 31, 2011, the Value Fund had tax basis capital losses of $46,714,841, to offset future capital gains. The losses expire on October 31, 2017.
At October 31, 2011, the Total Return Fund had tax basis capital losses of $10,329,856, to offset future capital gains. The losses expire on October 31, 2017.
At October 31, 2011, the Balanced Fund had tax basis capital losses of $1,736,101, to offset future capital gains. The losses expire on October 31, 2017.
The tax character of distributions paid during 2011 and 2010 for the Funds were as follows:
| | | Year Ended | | | Year Ended | |
| Growth Fund | | October 31, 2011 | | | October 31, 2010 | |
| Ordinary income | | $ | — | | | $ | — | |
| Long-term capital gain | | | — | | | | — | |
| | | $ | — | | | $ | — | |
| | | | | | | |
| | | Year Ended | | | Year Ended | |
| Focus 30 Fund | | October 31, 2011 | | | October 31, 2010 | |
| Ordinary income | | $ | — | | | $ | — | |
| Long-term capital gain | | | — | | | | — | |
| | | $ | — | | | $ | — | |
WWW.HENNESSYFUNDS.COM
| | | Year Ended | | | Year Ended | |
| Large Growth Fund | | October 31, 2011 | | | October 31, 2010 | |
| Ordinary income | | $ | 627,807 | | | $ | 358,421 | |
| Long-term capital gain | | $ | 109,248 | | | | — | |
| | | $ | 737,055 | | | $ | 358,421 | |
| | | | | | | |
| | | Year Ended | | | Year Ended | |
| Value Fund | | October 31, 2011 | | | October 31, 2010 | |
| Ordinary income | | $ | 4,283,374 | | | $ | 2,758,219 | |
| Long-term capital gain | | | — | | | | — | |
| | | $ | 4,283,374 | | | $ | 2,758,219 | |
| | | | | | | |
| | | Year Ended | | | Year Ended | |
| Total Return Fund | | October 31, 2011 | | | October 31, 2010 | |
| Ordinary income | | $ | 1,003,505 | | | $ | 942,536 | |
| Long-term capital gain | | | — | | | | — | |
| | | $ | 1,003,505 | | | $ | 942,536 | |
| | | | | | | |
| | | Year Ended | | | Year Ended | |
| Balanced Fund | | October 31, 2011 | | | October 31, 2010 | |
| Ordinary income | | $ | 55,526 | | | $ | 55,545 | |
| Long-term capital gain | | | — | | | | — | |
| | | $ | 55,526 | | | $ | 55,545 | |
On August 31, 2011, the Board of Directors/Trustees of the Corporation and the Trust approved and declared advisable the acquisition of the Hennessy Cornerstone Growth Fund, Series II (“Growth II Fund”) by the Hennessy Cornerstone Growth Fund (“Growth Fund”). The purpose of the acquisition was to combine two funds managed by Hennessy Advisors, Inc. with comparable investment objectives and strategies. The acquisition provided for the transfer of assets of the Growth II Fund to the Growth Fund and the assumption of the liabilities of the Growth II Fund by the Growth Fund. Following the acquisition, the Growth Fund will hold the assets of the Growth Fund II that it acquired until the Growth Fund rebalances its portfolio in the winter, pursuant to its customary procedures. For financial reporting purposes, assets received and shares issued by the Growth Fund were recorded at fair value; however, the cost basis of the investments received from the Growth II Fund was carried forward to align ongoing reporting of the Growth Fund’s realized and unrealized gains and losses with amounts distributable to shareholders for tax purposes. The acquisition was effective as of the close of business on October 28, 2011. The following table illustrates the specifics of the acquisition:
| | | Shares issued to | | | |
| | Growth II Fund | Shareholders of | Growth Fund | Combined | Tax Status |
| | Net Assets | Growth II Fund | Net Assets | Net Assets | of Transfer |
| | $26,164,811(1) | 2,557,259 | $166,323,192 | $192,488,003 | Non-taxable |
| (1) | Includes accumulated realized losses and unrealized depreciation in the amounts of ($47,367,221) and ($1,807,380) respectively. |
| HENNESSY FUNDS | 1-800-966-4354 |
Assuming the acquisition had been completed on November 1, 2010, the beginning of the annual reporting period of the Growth Fund, the Growth Fund’s pro forma of operations (unaudited) for the year ended October 31, 2011, are as follows:
| Net investment loss | | $ | (1,610,798 | ) |
| Net realized gain on investments | | $ | 46,803,124 | |
| Change in unrealized depreciation on investments | | $ | (45,923,349 | ) |
| Net decrease in net assets resulting from operations | | $ | (731,023 | ) |
Because the combined investment portfolios have been managed as a single integrated portfolio since the acquisition was completed, it is not practicable to separate the amounts of revenue and earnings of the Growth II Fund that have been included in the Growth Fund’s statement of operations since October 28, 2011.
| 10). | THE REGULATED INVESTMENT COMPANY MODERNIZATION ACT |
On December 22, 2010, The Regulated Investment Company Modernization Act of 2010 (“Modernization Act”) was signed into law. In general, the provisions of the Modernization Act will be effective for the Funds’ fiscal year ending October 31, 2012. Under the Modernization Act, new capital losses may now be carried forward indefinitely, and retain the character of the original loss. However, any losses incurred during those future taxable years will be required to be utilized prior to the losses incurred in the pre-enactment taxable years. As a result of this ordering rule, pre-enactment capital loss carryforwards may be more likely to expire unused. Under pre-enactment law, capital losses could be carried forward for eight years, and carried forward as short-term capital losses, irrespective of the character of the original loss. Relevant information regarding the impact of the Modernization Act on the Funds will be disclosed in the Federal Tax Information section of the financial statement notes in the Funds’ Annual Report for the fiscal year ending October 31, 2012.
WWW.HENNESSYFUNDS.COM
Report of Independent Registered Public Accounting Firm
The Shareholders and Board of Directors of Hennessy Mutual Funds, Inc., The Hennessy Funds, Inc., and Hennessy Funds Trust:
We have audited the accompanying statements of assets and liabilities of the Hennessy Cornerstone Growth Fund, Hennessy Focus 30 Fund, Hennessy Cornerstone Large Growth Fund, Hennessy Cornerstone Value Fund, Hennessy Total Return Fund and Hennessy Balanced Fund, including the schedules of investments, as of October 31, 2011, and the related statements of operations for the year then ended, statement of cash flows for the year then ended for the Hennessy Total Return Fund, statements of changes in net assets for each of the years in the two- year period then ended, and the financial highlights for each of the periods presented in the five-year period then ended (years ended October 31, 2011 and October 31, 2010, month ended October 31, 2009 and year ended September 30, 2009 for Hennessy Cornerstone Large Growth Fund). These financial statements and financial highlights are the responsibility of management. Our responsibility is to express an opinion on these financial statements and financial highlights based on our audits. The financial highlights for the periods presented through September 30, 2008 of the Hennessy Cornerstone Large Growth Fund were audited by other auditors whose report dated November 26, 2008 expressed an unqualified opinion on that statement and those financial highlights.
We conducted our audits in accordance with the standards of the Public Company Accounting Oversight Board (United States). Those standards require that we plan and perform the audit to obtain reasonable assurance about whether the financial statements and financial highlights are free of material misstatement. An audit includes examining, on a test basis, evidence supporting the amounts and disclosures in the financial statements. Our procedures included confirmation of securities owned as of October 31, 2011 by correspondence with the custodian and brokers or by other appropriate auditing procedures. An audit also includes assessing the accounting principles used and significant estimates made by management, as well as evaluating the overall financial statement presentation. We believe that our audits provide a reasonable basis for our opinion.
In our opinion, the financial statements and financial highlights referred to above present fairly, in all material respects, the financial position of Hennessy Cornerstone Growth Fund, Hennessy Focus 30 Fund, Hennessy Cornerstone Large Growth Fund, Hennessy Cornerstone Value Fund, Hennessy Total Return Fund and Hennessy Balanced Fund as of October 31, 2011, and the results of their operations, the changes in their net assets and the financial highlights for each of the periods described in the first paragraph above, in conformity with U.S. generally accepted accounting principles.
Milwaukee, Wisconsin
December 22, 2011
| HENNESSY FUNDS | 1-800-966-4354 |
Directors/Trustees and Officers of the Funds (Unaudited)
The business and affairs of the Funds are managed under the direction of the Funds’ Board of Directors/Trustees. Information pertaining to the Directors and Officers of the Funds is set forth below. The Funds’ Statement of Additional Information includes additional information about the Funds’ Directors/Trustees and Officers and is available, without charge, upon request by calling 1-800-966-4354.
| | Position(s) | Term of Office |
| | Held with | and Length of |
| Name, Age and Address | the Funds | Time Served |
| “Disinterested Persons” | | |
| J. Dennis DeSousa | Director/Trustee | Indefinite, until |
| Age: 75 | | successor elected |
| Address: | | |
| c/o Hennessy Advisors, Inc. | | HMFI: Since January 1996 |
| 7250 Redwood Blvd. | | HFI: Since January 1996 |
| Suite 200 | | HFT: Since July 2005 |
| Novato, CA 94945 | | |
| | | |
| Robert T. Doyle | Director/Trustee | Indefinite, until |
| Age: 64 | | successor elected |
| Address: | | |
| c/o Hennessy Advisors, Inc. | | HMFI: Since January 1996 |
| 7250 Redwood Blvd. | | HFI: Since January 1996 |
| Suite 200 | | HFT: Since July 2005 |
| Novato, CA 94945 | | |
| | | |
| Gerald P. Richardson | Director/Trustee | Indefinite, until |
| Age: 66 | | successor elected |
| Address: | | |
| c/o Hennessy Advisors, Inc. | | HMFI: Since May 2004 |
| 7250 Redwood Blvd. | | HFI: Since May 2004 |
| Suite 200 | | HFT: Since July 2005 |
| Novato, CA 94945 | | |
| | | |
| “Interested Persons” (as defined in the 1940 Act) | | |
Neil J. Hennessy(1) | Director/Trustee, | Director/Trustee: |
| Age: 55 | President, | Indefinite, until |
| Address: | and Chairman | successor elected |
| c/o Hennessy Advisors, Inc. | of the Board | |
| 7250 Redwood Blvd. | | HMFI: Since January 1996 |
| Suite 200 | | HFI: Since January 1996 |
| Novato, CA 94945 | | HFT: Since July 2005 |
| | | |
| | | Officer (Chairman of the Board): |
| | | 1 year term |
| | | |
| | | HMFI: Since June 2008 |
| | | HFI: Since June 2008 |
| | | HFT: Since June 2008 |
Key:
| HMFI = Hennessy Mutual Funds, Inc. | HFT = Hennessy Funds Trust |
| HFI = Hennessy Funds, Inc. | HSFT = Hennessy SPARX Funds Trust |
| | |
WWW.HENNESSYFUNDS.COM
| | Number of Portfolios in the | Other Directorships |
| Principal Occupation(s) | Fund Complex Overseen | Held by |
| During Past 5 Years | by Director/Trustee | Director/Trustee |
| | | |
| Mr. DeSousa is a real estate investor. | 9 | HSFT |
| | | |
| | | |
| Mr. Doyle has been the Sheriff of Marin | 9 | HSFT |
| County, California since 1996. | | |
| | | |
| | | |
| Mr. Richardson is an independent | 9 | HSFT |
| consultant in the securities industries. | | |
| | | |
| | | |
| Mr. Hennessy has been employed by | 9 | HSFT |
| Hennessy Advisors, Inc., the Funds’ | | Director of Hennessy |
| investment advisor, since 1989. He currently | | Advisors, Inc. |
| serves as President, Chairman, CEO, Portfolio | | |
| Manager and CIO of Hennessy Advisors, Inc. | | |
| HENNESSY FUNDS | 1-800-966-4354 |
| | Position(s) | Term of Office |
| | Held with | and Length of |
| Name, Age and Address | the Funds | Time Served |
| Joe Fahy | Chief Compliance | 1 year term |
| Age: 33 | Officer | |
| Address: | | HMFI: Since June 2010 |
| c/o Hennessy Advisors, Inc. | | HFI: Since June 2010 |
| 7250 Redwood Blvd. | | HFT: Since June 2010 |
| Suite 200 | | |
| Novato, CA 94945 | | |
| | | |
Teresa M. Nilsen(1) | Executive Vice | 1 year term |
| Age: 45 | President and | |
| Address: | Treasurer | HMFI: Since January 1996 |
| c/o Hennessy Advisors, Inc. | | HFI: Since January 1996 |
| 7250 Redwood Blvd. | | HFT: Since July 2005 |
| Suite 200 | | |
| Novato, CA 94945 | | |
| | | |
Daniel B. Steadman(1) | Executive Vice | 1 year term |
| Age: 55 | President and | |
| Address: | Secretary | HMFI: Since March 2000 |
| c/o Hennessy Advisors, Inc. | | HFI: Since March 2000 |
| 7250 Redwood Blvd. | | HFT: Since July 2005 |
| Suite 200 | | |
| Novato, CA 94945 | | |
WWW.HENNESSYFUNDS.COM
| | Number of Portfolios in the | |
| Principal Occupation(s) | Fund Complex Overseen | Other Directorships |
| During Past 5 Years | by Director/Trustee | Held by Director |
| Mr. Fahy has been employed by Hennessy | N/A | None. |
| Advisors, Inc., the Funds’ investment | | |
| advisor, since 2005. | | |
| | | |
| | | |
| Ms Nilsen has been employed by Hennessy | N/A | Director of Hennessy |
| Advisors, Inc., the Funds’ investment advisor, | | Advisors, Inc. |
| since 1989. She currently serves as Executive | | |
| Vice President, Chief Operations Officer, | | |
| Chief Financial Officer and Secretary of | | |
| Hennessy Advisors, Inc. | | |
| | | |
| | | |
| Mr. Steadman has been employed by | N/A | Director of Hennessy |
| Hennessy Advisors, Inc., the Funds’ | | Advisors, Inc. |
| investment advisor, since 2000. He currently | | |
| serves as Executive Vice President and Chief | | |
| Compliance Officer of Hennessy Advisors, Inc. | | |
HENNESSY FUNDS1-800-966-4354
| | Position(s) | Term of Office |
| | Held with | and Length of |
| Name, Age and Address | the Funds | Time Served |
Tania A. Kelley(1) | Vice President | 1 year term |
| Age: 46 | of Marketing | |
| Address: | | HMFI: Since October 2003 |
| c/o Hennessy Advisors, Inc. | | HFI: Since October 2003 |
| 7250 Redwood Blvd. | | HFT: Since July 2005 |
| Suite 200 | | |
| Novato, CA 94945 | | |
| | | |
Ana Miner(1) | Vice President | 1 year term |
| Age: 53 | of Operations | |
| Address: | | HMFI: Since March 2000 |
| c/o Hennessy Advisors, Inc. | | HFI: Since March 2000 |
| 7250 Redwood Blvd. | | HFT: Since July 2005 |
| Suite 200 | | |
| Novato, CA 94945 | | |
| | | |
Brian Peery(1) | Co-Portfolio | Officer (Vice President): |
| Age: 42 | Manager and | 1 year term |
| Address: | Vice President | |
| c/o Hennessy Advisors, Inc. | | HMFI: Since March 2003 |
| 7250 Redwood Blvd. | | HFI: Since March 2003 |
| Suite 200 | | HFT: Since July 2005 |
| Novato, CA 94945 | | |
__________
(1) | All officers of the Hennessy Funds and employees of the Advisor are Interested Persons of the Hennessy Funds. |
Key:
HMFI = Hennessy Mutual Funds, Inc.
HFI = Hennessy Funds, Inc.
HFT = Hennessy Funds Trust
WWW.HENNESSYFUNDS.COM
| | Number of Portfolios in the | |
| Principal Occupation(s) | Fund Complex Overseen | Other Directorships |
| During Past 5 Years | by Director/Trustee | Held by Director |
| Ms. Kelley has been employed by | N/A | None. |
| Hennessy Advisors, Inc., the Funds’ | | |
| investment advisor, since October 2003. | | |
| | | |
| | | |
| Ms. Miner has been employed by | N/A | None. |
| Hennessy Advisors, Inc., the Funds’ | | |
| investment advisor, since 1998. | | |
| | | |
| | | |
| Mr. Peery has been employed by | N/A | None. |
| Hennessy Advisors, Inc., the Funds’ | | |
| investment advisor, since June 2002. | | |
| HENNESSY FUNDS | 1-800-966-4354 |
Expense Example (Unaudited)
October 31, 2011
As a shareholder of the Funds, you incur two types of costs: (1) transaction costs, including sales charges (loads) on purchase payments, reinvested dividends, or other distributions; redemption fees; and exchange fees; and (2) ongoing costs, including management fees; service fees; and other Fund expenses. This Example is intended to help you understand your ongoing costs (in dollars) of investing in each of the Funds and to compare these costs with the ongoing costs of investing in other mutual funds. The Example is based on an investment of $1,000 invested at the beginning of the period and held for the entire period from May 1, 2011 through October 31, 2011.
Actual Expenses
The first set of lines of the table below provide information about actual account values and actual expenses. Although the Funds charge no sales loads or transaction fees, you will be assessed fees for outgoing wire transfers, returned checks and stop payment orders at prevailing rates charged by U.S. Bancorp Fund Services, LLC, the Funds’ transfer agent. If you request that a redemption be made by wire transfer, currently a $15.00 fee is charged by the Funds’ transfer agent. IRA accounts will be charged a $15.00 annual maintenance fee. The example below includes, but is not limited to, management fees, shareholder servicing fees, fund accounting, custody and transfer agent fees. However, the example below does not include portfolio trading commissions and related expenses, interest expense or dividends on short positions taken by the Fund and other extraordinary expenses as determined under generally accepted accounting principles. You may use the information within these lines, together with the amount you invested, to estimate the expenses that you paid over the six-month period. Simply divide your account value by $1,000 (for example, an $8,600 account value divided by $1,000 = 8.6), then multiply the result by the number in the first line under the heading entitled “Expenses Paid During Period” to estimate the expenses you paid on your account during this period.
Hypothetical Example for Comparison Purposes
The second set of lines within the table below provide information about hypothetical account values and hypothetical expenses based on the Funds’ actual expense ratios and an assumed rate of return of 5% per year before expenses, which is not the Funds’ actual return. The hypothetical account values and expenses may not be used to estimate the actual ending account balance or expenses you paid for the period. You may use this information to compare the ongoing costs of investing in the Funds and other funds. To do so, compare this 5% hypothetical example with the 5% hypothetical examples that appear in the shareholder reports of the other funds. Please note that the expenses shown in the table are meant to highlight your ongoing costs only and do not reflect any transactional costs, such as sales charges (loads), or exchange fees. Therefore, the second line of the table is useful in comparing ongoing costs only, and will not help you determine the relative total costs of owning different funds. In addition, if these transactional costs were included, your costs would have been higher.
WWW.HENNESSYFUNDS.COM
| | | Beginning | | | Ending | | | Expenses Paid | |
| | | Account Value | | | Account Value | | | During Period(1) | |
| Original Class | | 5/1/11 | | | 10/31/11 | | | 5/1/11 – 10/31/11 | |
| | | | | | | | | | |
| Actual | | | | | | | | | |
| Growth Fund – Original Class | | $ | 1,000.00 | | | $ | 807.90 | | | $ | 6.06 | |
| Focus 30 Fund – Original Class | | $ | 1,000.00 | | | $ | 885.60 | | | $ | 6.42 | |
| Large Growth Fund – Original Class | | $ | 1,000.00 | | | $ | 807.90 | | | $ | 5.92 | |
| Value Fund – Original Class | | $ | 1,000.00 | | | $ | 955.40 | | | $ | 6.56 | |
| Total Return Fund – Original Class | | $ | 1,000.00 | | | $ | 996.60 | | | $ | 6.79 | |
| Balanced Fund – Original Class | | $ | 1,000.00 | | | $ | 996.50 | | | $ | 7.75 | |
| Hypothetical (5% return | | | | | | | | | | | | |
| before expenses) | | | | | | | | | | | | |
| Growth Fund – Original Class | | $ | 1,000.00 | | | $ | 1,018.50 | | | $ | 6.77 | |
| Focus 30 Fund – Original Class | | $ | 1,000.00 | | | $ | 1,018.40 | | | $ | 6.87 | |
| Large Growth Fund – Original Class | | $ | 1,000.00 | | | $ | 1,018.65 | | | $ | 6.61 | |
| Value Fund – Original Class | | $ | 1,000.00 | | | $ | 1,018.50 | | | $ | 6.77 | |
| Total Return Fund – Original Class | | $ | 1,000.00 | | | $ | 1,018.40 | | | $ | 6.87 | |
| Balanced Fund – Original Class | | $ | 1,000.00 | | | $ | 1,017.44 | | | $ | 7.83 | |
(1) | | Expenses are equal to the Growth Fund’s expense ratio of 1.33%, the Focus 30 Fund’s expense ratio of 1.35%, the Large Growth Fund’s expense ratio of 1.30%, the Value Fund’s expense ratio of 1.33%, the Total Return Fund’s expense ratio of 1.35%, and the Balanced Fund’s expense ratio of 1.54%, multiplied by the average account value over the period, multiplied by 184/365 days (to reflect one-half year period). |
| | | Beginning | | | Ending | | | Expenses Paid | |
| | | Account Value | | | Account Value | | | During Period(2) | |
| Institutional Class | | 5/1/11 | | | 10/31/11 | | | 5/1/11 – 10/31/11 | |
| | | | | | | | | | |
| Actual | | | | | | | | | |
| Growth Fund – Institutional Class | | $ | 1,000.00 | | | $ | 809.10 | | | $ | 4.47 | |
| Focus 30 Fund – Institutional Class | | $ | 1,000.00 | | | $ | 887.00 | | | $ | 4.66 | |
| Large Growth Fund – Institutional Class | | $ | 1,000.00 | | | $ | 918.80 | | | $ | 4.74 | |
| Value Fund – Institutional Class | | $ | 1,000.00 | | | $ | 956.80 | | | $ | 4.88 | |
| Hypothetical (5% return | | | | | | | | | | | | |
| before expenses) | | | | | | | | | | | | |
| Growth Fund – Institutional Class | | $ | 1,000.00 | | | $ | 1,020.27 | | | $ | 4.99 | |
| Focus 30 Fund – Institutional Class | | $ | 1,000.00 | | | $ | 1,020.27 | | | $ | 4.99 | |
| Large Growth Fund – Institutional Class | | $ | 1,000.00 | | | $ | 1,020.27 | | | $ | 4.99 | |
| Value Fund – Institutional Class | | $ | 1,000.00 | | | $ | 1,020.21 | | | $ | 5.04 | |
| (2) | | Expenses are equal to the Growth, Focus 30, and Large Growth Fund’s expense ratio of 0.98%, and the Value Fund’s expense ratio of 0.99%, multiplied by the average account value over the period, multiplied by 184/365 days (to reflect one-half year period). |
HENNESSY FUNDS1-800-966-4354
How to Obtain a Copy of the Funds’ Proxy Voting Policy and Proxy Voting Records
A description of the policies and procedures that the Funds use to determine how to vote proxies relating to portfolio securities is available without charge: (1) by calling 1-800-966-4354; (2) on the Hennessy Funds website at www.hennessyfunds.com; or (3) on the U.S. Securities and Exchange Commission’s website at www.sec.gov. Hennessy Funds’ proxy voting record is available on the SEC’s website at www.sec.gov no later than August 31 for the prior 12 months ending June 30.
Quarterly Filings on Form N-Q
The Funds file their complete schedule of portfolio holdings with the SEC for the first and third quarters of each fiscal year on Form N-Q. The Funds’ Form N-Q will be available on the SEC’s website at www.sec.gov. The Funds’ Form N-Q may be reviewed and copied at the SEC’s Public Reference Room in Washington, DC and information on the operation of the Public Reference Room may be obtained by calling 1-800-SEC-0330. Information included in the Funds’ N-Q will also be available upon request by calling 1-800-966-4354.
Federal Tax Distribution Information (Unaudited)
The Large Growth, Value, Total Return and Balanced Fund designated 100%, 100%, 100% and 100%, respectively, of the dividend declared from net investment income during the year ended October 31, 2011, as qualified dividend income under the Jobs Growth and Tax Reconciliation Act of 2003.
For the year ended October 31, 2011, 100%, 98.20%, 100% and 100% of the ordinary income distributions paid by the Large Growth, Value, Total Return and Balanced Funds, respectively, qualify for the dividends received deduction available to corporate shareholders. A portion of the dividend income received by the Value Fund was from American Depositary Receipts which does not qualify for the dividend received deduction available to corporate shareholders.
WWW.HENNESSYFUNDS.COM
Privacy Policy
We collect the following non-public personal information about you:
| | • | | information we receive from you on or in applications or other forms, correspondence, or conversations, including, but not limited to, your name, address, phone number, social security number, assets, income and date of birth; |
| | | | |
| | | | and |
| | | | |
| | • | | information about your transactions with us, our affiliates, or others, including, but not limited to, your account number and balance, payment history, parties to transactions, cost basis information and other financial information. |
We do not disclose any non-public personal information about our current or former shareholders to nonaffiliated third parties, except as permitted by law. For example, we are permitted by law to disclose all of the information we collect, as described above, to our Transfer Agent to process your transactions. Furthermore, we restrict access to your non-public personal information to those persons who require such information to provide products or services to you. We maintain physical, electronic and procedural safeguards that comply with federal standards to guard your non-public personal information.
In the event that you hold shares of the Fund through a financial intermediary, including, but not limited to, a broker-dealer, bank or trust company, the privacy policy of your financial intermediary would govern how your non-public personal information would be shared with nonaffiliated third parties.
| HENNESSY FUNDS | 1-800-966-4354 |
(This Page Intentionally Left Blank.)
WWW.HENNESSYFUNDS.COM
(This Page Intentionally Left Blank.)
| HENNESSY FUNDS | 1-800-966-4354 |
For information, questions
or assistance, please call
The Hennessy Funds
1-800-966-4354 or 1-415-899-1555
INVESTMENT ADVISOR
Hennessy Advisors, Inc.
7250 Redwood Blvd., Suite 200
Novato, California 94945
ADMINISTRATOR, TRANSFER
AGENT, DIVIDEND PAYING
AGENT & SHAREHOLDER
SERVICING AGENT
U.S. Bancorp Fund Services, LLC
P.O. Box 701
Milwaukee, Wisconsin 53201-0701
CUSTODIAN
U.S. Bank N.A.
Custody Operations
1555 North River Center Dr., Suite 302
Milwaukee, Wisconsin 53212
DIRECTORS/TRUSTEES
Neil J. Hennessy
Robert T. Doyle
J. Dennis DeSousa
Gerald P. Richardson
COUNSEL
Foley & Lardner LLP
777 East Wisconsin Avenue
Milwaukee, Wisconsin 53202-5306
INDEPENDENT REGISTERED
PUBLIC ACCOUNTING FIRM
KPMG LLP
777 East Wisconsin Avenue
Milwaukee, Wisconsin 53202-5306
DISTRIBUTOR
Quasar Distributors, LLC
615 East Michigan Street
Milwaukee, Wisconsin 53202
WWW.HENNESSYFUNDS.COM
This report has been prepared for shareholders and may be distributed to others only if preceded or accompanied by a current prospectus.
HENNESSY FUNDS
ANNUAL REPORT
OCTOBER 31, 2011
Hennessy Select Large Value Fund
Hennessy Select SPARX Japan Fund
Hennessy Select SPARX Japan Smaller Companies Fund
Contents
| Letter to shareholders | 1 |
| Performance overview (unaudited) | |
| Hennessy Select Large Value Fund | 5 |
| Hennessy Select SPARX Japan Fund | 8 |
| Hennessy Select SPARX Japan Smaller Companies Fund | 11 |
| Financial statements | |
| Schedules of investments | |
| Hennessy Select Large Value Fund | 13 |
| Hennessy Select SPARX Japan Fund | 18 |
| Hennessy Select SPARX Japan Smaller Companies Fund | 22 |
| Statements of assets and liabilities | 28 |
| Statements of operations | 30 |
| Statements of changes in net assets | 32 |
| Financial highlights | |
| Hennessy Select Large Value Fund | 34 |
| Hennessy Select SPARX Japan Fund | 38 |
| Hennessy Select SPARX Japan Smaller Companies Fund | 42 |
| Notes to the financial statements | 44 |
| Report of Independent Registered Public Accounting Firm | 55 |
| Trustees and Officers of the Funds | 56 |
| Expense example | 62 |
| Proxy voting policy | 64 |
| Quarterly Filings on Form N-Q | 64 |
| Federal Tax Distribution Information | 64 |
| Privacy Policy | 65 |
WWW.HENNESSYFUNDS.COM
December, 2011
Dear Hennessy Funds Shareholder:
It has been three years since the beginning of the current financial crisis, and I don’t know about you, but I am ready for the roller coaster ride to come to an end. Volatility, fear and a lack of actionable direction from our leaders in Washington continue to plague the investing landscape. Investors who have been pummeled with negative economic news remain scared, so it’s no surprise that confidence is at an all time low. In markets like these there is an expression that investors are “climbing the wall of worry.” We have had such bad news for so long that I think we are at the top of the wall and investors are now “clinging to the wall of worry,” hanging on for dear life.
With all the news headlines and financial data bombarding the average investor daily, it is difficult for many to comprehend what is really happening. I want to take a step back from all of the media “noise” and share my thoughts on the financial markets. First, let’s take a look at the recent hyper-volatility. Before August 4th of this year, there were no days that the market closed up or down 300 points. Since August 4th we’ve had 13 days of plus or minus 300 point swings on the Dow Jones. I don’t see that anything has fundamentally changed since August 4th. I truly believe that this volatility is a direct result of the emotions that are currently driving investing decisions. This past August investors pulled more money out of equity mutual funds than at any time since the crash in March of 2008. What is sad is that the S&P 500 and the Dow Jones, among other indices, have gained significantly since their lows three years ago, and many investors may have missed out on those returns by letting emotion guide them to poor decisions. I don’t think the media machine will slow down, but I do believe its time for all of us to filter out all the negative noise, look at the fundamentals and get back to investing basics.
If investors could separate what is happening in Washington politics and what is happening in the European Union from what is happening with U.S. companies, they would see that companies in the U.S. have been, in fact, doing very well. I believe the only major stumbling block that we have, and that we’ve had for some time, is a lack of clarity coming from Washington on taxes, healthcare and regulation. That lack of clarity is preventing companies from hiring. Many U.S. companies are sitting on mountains of cash, over $2 trillion in the S&P 500 companies alone, and rather than using that cash to hire, they have been deploying capital in other areas:
| HENNESSY FUNDS | 1-800-966-4354 |
| | • | | Initiating dividends |
| | • | | Increasing dividends |
| | • | | Stock buy backs |
| | • | | Internal infrastructure |
| | • | | Acquisitions |
Overview of the U.S. Market
Despite the issues facing the economy and the markets, for the twelve-month period ended October 31, 2011, the major U.S. indices saw moderate growth, returning approximately 8-10%. Mid-cap stocks led both their large- and small-cap counterparts during the period, and growth stocks outperformed value stocks. The problems with Washington remain, and will likely only get worse as we move into another election period. Therefore, I am expecting another year with slow to moderate growth. That doesn’t mean there aren’t great stocks to buy – there are. Quality names, particularly those paying strong dividends, have continued to perform well. If you look at the 30 companies in the Dow Jones, they are yielding 3.19% as of November 30, 2011, which is higher than a 10-year U.S. Treasury bond.
We know there are obstacles that the economy will continue to struggle through, but we also see that several of the key fundamentals appear stronger today than they were during the financial crisis three years ago. No matter what metric investors might look at, the numbers would tell you that the U.S. market is currently undervalued. If you look at price-to-book, price-to-sales, price-to-earnings or price-to-cash-flow, the market is far below its historical norm of the past five or ten years. I’m not going back thirty years, just five or ten. It might surprise some, but corporate profits are actually at an all-time high. As investors regain their confidence and return to investing based on facts and fundamentals, I believe we should return to solid, long-term market gains.
Overview of the Japan Market
During the twelve-month period ended October 31, 2011, the performance of the Japanese stock market was mixed. The Nikkei 225 returned 2.80% while The TOPIX Index lost -0.60% for the period. Small-cap stocks significantly outperformed the overall market, with the MSCI Japan Small Cap Index returning 9.35% for the twelve months, while the overall MSCI Japan index fell -2.17%.
Early in this fiscal year, the Japanese equity market rose following better-than-expected U.S. and Japanese economic data and positive reports on Japan’s gross domestic product. Then, stocks fell sharply in
WWW.HENNESSYFUNDS.COM
March following Japan’s biggest earthquake and subsequent tsunami, and the Nikkei 225 dropped below 8,500 for the first time in two years. The equity market continued to be plagued by fears related to the impact of the damaged nuclear power plants and the halt in production among Japanese manufacturers. In May, the Nikkei 225 temporarily surpassed the 10,000 mark only to fall again due to persistent uncertainty following the earthquake and a murky economic outlook for the U.S. and Europe.
The Japanese market slid alongside other global markets in August, September and October. The Japanese market, like the U.S., now appears significantly undervalued on virtually any metric. With a price to sales ratio of just .5 and a price to book of 1X, I would argue that there is no place for this market to go than up, and we continue to believe that Japan offers an excellent investment opportunity for the long term. Despite some concerns to the contrary, supply chains and production are very near pre-earthquake levels, and Japan has come together as a nation to rebound quickly from this terrible disaster. We also expect a number of domestic sectors to benefit in the short term from the earthquake reconstruction.
By the end of the fiscal year (October 31, 2011) the Japanese Yen had appreciated to 76 versus the U.S. Dollar, surpassing its post-World War II record high. Given this, more and more Japanese export-oriented companies are strategically expanding overseas and/or participating in M&A activities. While the Yen’s current level is negative for exporters, we feel that the recent decline in their share prices has made them attractive investments given their positive long-term earnings growth outlook. Looking at the longer term, I believe that at some point in time the currency will peak and fall significantly, driving the Japanese market higher.
Despite the volatility of the global financial markets, we remain steadfastly focused on long-term investing and adherence to our proven investment strategies. Thank you for your continued confidence and investment in the Hennessy Funds. If you have any questions or want to speak with us directly, please don’t hesitate to call us at (800) 966-4354.
Best regards,
Neil J. Hennessy
Portfolio Manager & Chief Investment Officer
| HENNESSY FUNDS | 1-800-966-4354 |
Past performance does not guarantee future results.
Mutual fund investing involves risk. Principal loss is possible.
Small and medium-capitalization companies tend to have limited liquidity and greater price volatility than large-capitalization companies. Investments in foreign securities involve greater volatility and political, economic and current risk and differences in accounting methods.
The Price to Book Ratio compares a stock’s market value to the value of total assets less total liabilities.
The Price to Sales Ratio is a tool for calculating a stock’s valuation relative to other companies, calculated by dividing a stock’s current price by its revenue per share.
The Price to Earnings Ratio reflects the multiple of earnings at which a stock sells.
The Price to Cash Flow Ratio takes the current Price divided by Cash Flow per share for the trailing twelve months.
Opinions expressed are those of Neil Hennessy and are subject to change, are not guaranteed and should not be considered investment advice.
The Dow Jones Industrial Average and the S&P 500 are unmanaged indices of common stocks comprised of major industrial companies and assume reinvestment of dividends. The Tokyo Stock Price Index (TOPIX) is a market capitalization-weighted index of all companies listed on the First Section of the Tokyo Stock Exchange. The Nikkei 225 is a stock market index for the Tokyo Stock Exchange (TSE). The MSCI Japan Index is a market capitalization-weighted index of Japanese equities. The MSCI Japan Small Cap Index represents the universe of small capitalization companies in the Japanese equity markets. The MSCI Japan, Nikkei 225 and TOPIX indices are presented in U.S. Dollar terms and take into account reinvestment of dividends.
You cannot invest directly in an index.
WWW.HENNESSYFUNDS.COM
Hennessy Select Large Value Fund
Original Class Shares (HSVFX)
AVERAGE ANNUAL TOTAL RETURN PERIODS ENDED OCTOBER 31, 2011
| | | One | Five | Ten | Since Inception |
| | | Year | Years | Years | (9/30/84) |
| | Hennessy Select Large Value | | | | |
| | Fund – Original Class | 5.36% | -2.19% | 2.84% | 9.27% |
| | Russell 1000 Value Index | 6.16% | -2.05% | 4.57% | 10.66% |
| | S&P 500 Index | 8.09% | 0.25% | 3.69% | 10.39% |
Gross expense ratio: 1.41%.
Performance data quoted represents past performance; past performance does not guarantee future results. The performance for periods prior to March 20, 2009 reflects the performance of the Tamarack Value Fund, the predecessor to the Hennessy Select Large Value Fund. The investment return and principal value of an investment will fluctuate so that an investor’s shares, when redeemed, may be worth more or less than their original cost. Current performance of the Fund may be lower or higher than the performance quoted. Performance data current to the most recent month end may be obtained by visiting www.hennessyfunds.com. The gross expense ratio presented is that from the most recent prospectus.
PERFORMANCE NARRATIVE FROM RBC GLOBAL
ASSET MANAGEMENT (U.S.) INC., SUB-ADVISOR
The Hennessy Select Large Value Fund returned 5.36% for the twelve-month period ended October 31, 2011, underperforming the Russell 1000 Value Index, which returned 6.16%, and the S&P 500 Index, which returned 8.09%, for the same period. Over the past twelve months, The Hennessy Select Large Value portfolio had its best relative performance from the worst performing sector in the Russell 1000 Value Index (Financials), and conversely, the portfolio had its worst relative performance from the best performing sector in the Index (Energy).
While the Energy sector was the best performing sector in the Russell 1000 Value Index, gaining 21%, Energy was the portfolio’s worst performing sector. The Energy sector gained on a rise in oil prices over the year from a little below $80 to approximately $100. This is not the best scenario for our portfolio, which concentrates on finding positively changing fundamentals in individual companies, and not on medium-term commodity price movement. In addition, the companies in which we expected to find positively changing fundamentals disappointed. For example, EOG Resources, Inc. has been undergoing a restructuring to become more of an oil company and less of a natural gas company. That restructuring did not go as well as hoped, and the stock dropped significantly. We sold out of the position, but not before it negatively affected performance of the portfolio.
The Financial sector was the worst performing sector in the Russell 1000 Value Index, losing -6.40%. However, the portfolio had its best performance in that sector. European debt concerns, as well as concerns about domestic financial markets, held back performance among Financial stocks. The portfolio fortunately avoided the worst of that. Bank of America lost 40% over the last twelve months. We held the stock for only part of the year and showed a significantly lower loss of 12%. In addition, the portfolio owned positions in industries less affected by the general financial problems. For example, our positions in the REIT industry were a positive contributor to Fund performance. Simon Properties gained 38%, Host Hotels gained 25%, and Boston Properties gained 17% while in the portfolio during the period.
| HENNESSY FUNDS | 1-800-966-4354 |
As we look forward, we strongly believe that stock markets around the world, including the U.S., are undervalued. Companies continue to post very good earnings almost unnoticed while a number of different macroeconomic risks capture most investors’ attention. We continue to be excited at the opportunities in undervalued companies undergoing positive fundamental change.
Hennessy Select Large Value Fund
Original Class Shares
CHANGE IN VALUE OF $10,000 INVESTMENT
This chart assumes an initial gross investment of $10,000 made on October 31, 2001. Returns shown include the reinvestment of all dividends. Returns shown do not reflect the deduction of taxes that a shareholder would pay on Fund distributions or the redemption of Fund shares.
WWW.HENNESSYFUNDS.COM
Hennessy Select Large Value Fund
Institutional Class Shares (HSVIX)
AVERAGE ANNUAL TOTAL RETURN PERIODS ENDED OCTOBER 31, 2011
| | | | Since Inception |
| | | One Year | (3/20/09) |
| | Hennessy Select Large Value | | |
| | Fund – Institutional Class | 5.76% | 18.34% |
| | Russell 1000 Value Index | 6.16% | 22.81% |
| | S&P 500 Index | 8.09% | 23.05% |
Gross expense ratio: 1.22%. Net expense ratio: 0.98%. The expense ratio is contractually capped at 0.98% indefinitely.
Performance data quoted represents past performance; past performance does not guarantee future results. The investment return and principal value of an investment will fluctuate so that an investor’s shares, when redeemed, may be worth more or less than their original cost. Current performance of the Fund may be lower or higher than the performance quoted. Performance data current to the most recent month end may be obtained by visiting www.hennessyfunds.com. Investment performance reflects fee waivers in effect. In the absence of such waivers, total return would be reduced. The gross and net expense ratios presented are those from the most recent prospectus.
CHANGE IN VALUE OF $250,000 INVESTMENT
* Inception date
This chart assumes an initial gross investment of $250,000 (minimum investment) made on March 20, 2009 (inception date of share class). Returns shown include the reinvestment of all dividends. Returns shown do not reflect the deduction of taxes that a shareholder would pay on Fund distributions or the redemption of Fund shares.
The S&P 500 and Russell 1000 Value are unmanaged indices commonly used to measure the performance of U.S. stocks. The Russell 1000 Value measures large-cap, value-oriented stocks. One cannot invest directly in an index.
The Fund may invest in medium-capitalization companies, which tend to have limited liquidity and greater price volatility than large-capitalization companies.
The Fund’s composition and sector weightings are shown as a percentage of the Fund’s total net assets. Portfolio composition and sector weightings are subject to change at any time and should not be considered a recommendation to buy or sell a particular security. Please refer to the Schedule of Investments within this Annual Report for additional portfolio information, including percentages of holdings.
| HENNESSY FUNDS | 1-800-966-4354 |
Hennessy Select SPARX Japan Fund
Original Class Shares (SPXJX)
AVERAGE ANNUAL TOTAL RETURN PERIODS ENDED OCTOBER 31, 2011
| | | One | Five | Since Inception |
| | | Year | Years | (10/31/03) |
| | Hennessy Select SPARX Japan Fund | | | |
| | – Original Class | 11.21% | -3.94% | 5.57% |
| | MSCI Japan Index | -2.17% | -5.14% | 2.24% |
| | TOPIX | -0.60% | -5.06% | 1.86% |
Gross expense ratio: 1.73%.
Performance data quoted represents past performance; past performance does not guarantee future results. The investment return and principal value of an investment will fluctuate so that an investor’s shares, when redeemed, may be worth more or less than their original cost. Current performance of the Fund may be lower or higher than the performance quoted. Performance data current to the most recent month end may be obtained by visiting www.hennessyfunds.com. The gross expense ratio presented is that from the most recent prospectus.
PERFORMANCE NARRATIVE FROM SPARX ASSET
MANAGEMENT CO, LTD., SUB-ADVISOR
The Hennessy Select SPARX Japan Fund returned 11.21% for the twelve-month period ended October 31, 2011, significantly outperforming both the MSCI Japan Index and the TOPIX, which lost -2.17% and -0.60% respectively for the same period. The largest positive contributors to the Fund’s performance among the TOPIX 33 sub-industries were retailers, wholesalers and miscellaneous manufacturing firms. Conversely, banks, iron & steel makers and auto-related firms were among the worst performers.
Among the strongest performing stocks during the twelve-month period were Ryohin Keikaku Co., Ltd., operator of the “MUJI brand” retail chain store, ASICS Corporation, a high performance sporting goods maker, and Keyence Corporation, Japan’s unique precision machinery parts distributor. Shares of Ryohin Keikaku jumped 31% on the back of a series of upbeat broker reports citing the company’s improved domestic gross margin and overseas profitability. Shares of ASICS climbed 22% during the period on expectations that robust overseas sales are likely to drive increased earnings. Keyence shares rose 2% after the company in May announced a 36% and 56% increase in revenue and operating profit, respectively, for the fiscal year ended March, 2011.
Japanese air conditioner maker Daikin Industries, Ltd. and the nation’s leading lenders, Mizuho Financial Group, Inc. and Sumitomo Mitsui Financial Group, Inc. were among the major detractors to Fund performance during the period. Shares of Daikin Industries fell -17% after it was revealed in January that the firm may buy U.S. rival Goodman Global. This announcement raised financing concerns and prompted investors to sell the stock on speculation that the firm may need to issue stock to pay for the acquisition. Shares of Mizuho and Sumitomo Mitsui fell -5% and -6% respectively on expectations that profits may fall based on poor demand for loans and a tough global growth environment.
WWW.HENNESSYFUNDS.COM
Hennessy Select SPARX Japan Fund
Original Class Shares (SPXJX)
CHANGE IN VALUE OF $10,000 INVESTMENT
This chart assumes an initial gross investment of $10,000 made on October 31, 2003. Returns shown include the reinvestment of all dividends. Returns shown do not reflect the deduction of taxes that a shareholder would pay on Fund distributions or the redemption of Fund shares.
| HENNESSY FUNDS | 1-800-966-4354 |
Hennessy Select SPARX Japan Fund
Institutional Class Shares (SPARX)
AVERAGE ANNUAL TOTAL RETURN PERIODS ENDED OCTOBER 31, 2011
| | | One | Five | Since Inception |
| | | Year | Years | (10/31/03) |
| | Hennessy Select SPARX | | | |
| | Japan Fund – Institutional Class | 11.69% | -3.82% | 5.72% |
| | MSCI Japan Index | -2.14% | -5.14% | 2.24% |
| | TOPIX | -0.60% | -5.06% | 1.86% |
Gross expense ratio: 1.47%.
Performance data quoted represents past performance; past performance does not guarantee future results. The investment return and principal value of an investment will fluctuate so that an investor’s shares, when redeemed, may be worth more or less than their original cost. Current performance of the Fund may be lower or higher than the performance quoted. Performance data current to the most recent month end may be obtained by visiting www.hennessyfunds.com. The gross expense ratio presented is that from the most recent prospectus.
CHANGE IN VALUE OF $250,000 INVESTMENT
This chart assumes an initial gross investment of $250,000 (minimum investment) made on October 31, 2003. Returns shown include the reinvestment of all dividends. Returns shown do not reflect the deduction of taxes that a shareholder would pay on Fund distributions or the redemption of Fund shares.
The MSCI Japan Index is a market capitalization-weighted index of Japanese equities. The Tokyo Stock Price Index (TOPIX) is a market capitalization-weighted index of all companies listed on the First Section of the Tokyo Stock Exchange. The MSCI Japan and TOPIX indices are presented in U.S. Dollar terms and take into account reinvestment of dividends. One cannot invest directly in an index.
Small and medium-capitalization companies tend to have limited liquidity and greater price volatility than large-capitalization companies. Investments in foreign securities involve greater volatility and political, economic and currency risk and differences in accounting methods.
The Fund’s composition and sector weightings are shown as a percentage of the Fund’s total net assets. Portfolio composition and sector weightings are subject to change at any time and should not be considered a recommendation to buy or sell a particular security. Please refer to the Schedule of Investments within this Annual Report for additional portfolio information, including percentages of holdings.
WWW.HENNESSYFUNDS.COM
Hennessy Select SPARX Japan Smaller Companies
Fund (SPJSX)
AVERAGE ANNUAL TOTAL RETURN PERIODS ENDED OCTOBER 31, 2011
| | | One | Three | Since Inception |
| | | Year | Years | (8/31/07) |
| | Hennessy Select SPARX Japan | | | |
| | Smaller Companies Fund – Original Class | 9.32% | 15.45% | 1.51% |
| | MSCI Japan Small Cap Index | 9.35% | 11.38% | -2.43% |
| | TOPIX | -0.60% | 5.58% | -6.20% |
Gross expense ratio: 2.15%.
Performance data quoted represents past performance; past performance does not guarantee future results. The investment return and principal value of an investment will fluctuate so that an investor’s shares, when redeemed, may be worth more or less than their original cost. Current performance of the Fund may be lower or higher than the performance quoted. Performance data current to the most recent month end may be obtained by visiting www.hennessyfunds.com. The gross expense ratio presented is that from the most recent prospectus.
PERFORMANCE NARRATIVE FROM SPARX ASSET
MANAGEMENT CO, LTD., SUB-ADVISOR
The Hennessy Select SPARX Japan Smaller Companies Fund returned 9.32% for the twelve-month period ended October 31, 2011, on par with the MSCI Japan Small Cap Index, which returned 9.35%, and significantly outperformed the TOPIX, which lost -0.60%, for the same period. The largest positive contributors to the Fund’s performance among the TOPIX 33 sub-industries, were information & communication firms, electronic appliance makers and service industry firms. Conversely, chemical manufacturers, precision instrument makers and wholesalers were among the worst performers.
Among the strongest performing stocks during the twelve-month period were Weathernews, Inc., the world’s largest meteorological forecasting and news content provider, Elecom Co., Ltd., a manufacturer of PC peripheral equipment, and Takeei Corporation, a disposal and recycling company for construction-related industrial waste. Weathernews surged 107% on the back of growing expectations that the firm should benefit from the increasing number of subscribers for their smart phone-related services. Elecom jumped 105% on expectations that demand for its smart phone-related digital products should increase given an expanding smart phone market. Takeei shares climbed 85% on expectations for improved business performance due to post-earthquake reconstruction demand.
Endo Manufacturing Co., Ltd., a producer of cast steel products, such as golf clubs, NPC Inc., which manufactures solar-panel equipment and vacuum packaging machines, and Roland DG Corporation, an internationally known electronic musical instrument maker were the biggest detractors to Fund performance during the period. Shares of Endo Manufacturing declined -8% as investors worried about a cut in production levels due to the flooding in Thailand. Shares of NPC dropped -62% as investors remained worried about the firm’s earnings outlook given the tough competition in the solar light market and the downturn in the European economy. Shares of Roland DG slid -25% on speculation about the company’s earnings outlook due to weakening demand from Europe.
| HENNESSY FUNDS | 1-800-966-4354 |
Hennessy Select SPARX Japan Smaller Companies
Fund (SPJSX)
CHANGE IN VALUE OF $10,000 INVESTMENT
This chart assumes an initial gross investment of $10,000 made on August 31, 2007 (inception). Returns shown include the reinvestment of all dividends. Returns shown do not reflect the deduction of taxes that a shareholder would pay on Fund distributions or the redemption of Fund shares.
The MSCI Japan Small Cap Index represents the universe of small capitalization companies in the Japanese equity markets. The Tokyo Stock Price Index (TOPIX) is a market capitalization-weighted index of all companies listed on the First Section of the Tokyo Stock Exchange. The MSCI Japan Small Cap and TOPIX indices are presented in U.S. Dollar terms and take into account reinvestment of dividends. One cannot invest directly in an index.
Small and medium-capitalization companies tend to have limited liquidity and greater price volatility than large-capitalization companies. Investments in foreign securities involve greater volatility and political, economic and currency risk and differences in accounting methods.
The Fund’s composition and sector weightings are shown as a percentage of the Fund’s total net assets. Portfolio composition and sector weightings are subject to change at any time and should not be considered a recommendation to buy or sell a particular security. Please refer to the Schedule of Investments within this Annual Report for additional portfolio information, including percentages of holdings.
WWW.HENNESSYFUNDS.COM
Schedules of Investments
LARGE VALUE FUND
As of October 31, 2011
(% of Net Assets)
| TOP TEN EQUITY HOLDINGS | % of net assets |
| Chevron Corp. | 3.99% |
| Intel Corp. | 3.38% |
| Wells Fargo & Co. | 3.27% |
| Pfizer, Inc. | 2.90% |
| J.P. Morgan Chase & Co. | 2.78% |
| Verizon Communications, Inc. | 2.52% |
| Citigroup, Inc. | 2.48% |
| Kraft Foods, Inc. | 2.25% |
| Comcast Corp. | 2.04% |
| Exxon Mobil Corp. | 1.94% |
| HENNESSY FUNDS | 1-800-966-4354 |
| | COMMON STOCKS – 98.67% | | Number | | | | | | % of | |
| | | | of Shares | | | Value | | | Net Assets | |
| | Consumer Discretionary – 9.62% | | | | | | | | | |
| | CBS Corp. | | | 59,210 | | | $ | 1,528,210 | | | | 1.23 | % |
| | Comcast Corp. | | | 108,010 | | | | 2,532,835 | | | | 2.04 | % |
| | Johnson Controls, Inc. | | | 43,680 | | | | 1,438,382 | | | | 1.16 | % |
| | Macy’s, Inc. | | | 60,900 | | | | 1,859,277 | | | | 1.50 | % |
| | The Home Depot, Inc. | | | 48,720 | | | | 1,744,176 | | | | 1.41 | % |
| | TJX Companies, Inc. | | | 23,750 | | | | 1,399,587 | | | | 1.13 | % |
| | Wyndham Worldwide Corp. | | | 42,410 | | | | 1,427,945 | | | | 1.15 | % |
| | | | | | | | | 11,930,412 | | | | 9.62 | % |
| | Consumer Staples – 7.58% | | | | | | | | | | | | |
| | Coca-Cola Co. | | | 7,440 | | | | 508,301 | | | | 0.41 | % |
| | Corn Products International, Inc. | | | 33,470 | | | | 1,623,295 | | | | 1.31 | % |
| | CVS Caremark Corp. | | | 59,905 | | | | 2,174,552 | | | | 1.76 | % |
| | Kraft Foods, Inc. | | | 79,385 | | | | 2,792,764 | | | | 2.25 | % |
| | Philip Morris International, Inc. | | | 32,875 | | | | 2,296,976 | | | | 1.85 | % |
| | | | | | | | | 9,395,888 | | | | 7.58 | % |
| | Energy – 12.97% | | | | | | | | | | | | |
| | Anadarko Petroleum Corp. | | | 23,430 | | | | 1,839,255 | | | | 1.48 | % |
| | Baker Hughes, Inc. | | | 23,955 | | | | 1,389,150 | | | | 1.12 | % |
| | Chevron Corp. | | | 47,140 | | | | 4,952,057 | | | | 3.99 | % |
| | Devon Energy Corp. | | | 25,670 | | | | 1,667,267 | | | | 1.35 | % |
| | Exxon Mobil Corp. | | | 30,875 | | | | 2,411,029 | | | | 1.94 | % |
| | Marathon Oil Corp. | | | 55,015 | | | | 1,432,040 | | | | 1.16 | % |
| | Occidental Petroleum Corp. | | | 16,125 | | | | 1,498,657 | | | | 1.21 | % |
| | Rowan Companies, Inc. | | | 25,985 | | | | 896,223 | | | | 0.72 | % |
| | | | | | | | | 16,085,678 | | | | 12.97 | % |
| | Financials – 23.94% | | | | | | | | | | | | |
| | Ace Ltd. (b) | | | 28,860 | | | | 2,082,249 | | | | 1.68 | % |
| | Affiliated Managers Group, Inc. (a) | | | 14,030 | | | | 1,299,318 | | | | 1.05 | % |
| | Aflac, Inc. | | | 27,280 | | | | 1,230,055 | | | | 0.99 | % |
| | Capital One Financial Corp. | | | 38,535 | | | | 1,759,508 | | | | 1.42 | % |
| | Chubb Corp. | | | 30,410 | | | | 2,038,991 | | | | 1.64 | % |
| | Citigroup, Inc. | | | 97,185 | | | | 3,070,074 | | | | 2.48 | % |
| | Digital Realty Trust, Inc. | | | 23,080 | | | | 1,438,576 | | | | 1.16 | % |
The accompanying notes are an integral part of these financial statements.
WWW.HENNESSYFUNDS.COM
| | COMMON STOCKS | | Number | | | | | | % of | |
| | | | of Shares | | | Value | | | Net Assets | |
| | Financials (Continued) | | | | | | | | | |
| | Host Hotels & Resorts, Inc. | | | 92,970 | | | $ | 1,326,682 | | | | 1.07 | % |
| | IntercontinentalExchange, Inc. (a) | | | 9,300 | | | | 1,207,884 | | | | 0.97 | % |
| | J.P. Morgan Chase & Co. | | | 99,225 | | | | 3,449,061 | | | | 2.78 | % |
| | Metlife, Inc. | | | 55,350 | | | | 1,946,106 | | | | 1.57 | % |
| | Morgan Stanley | | | 52,225 | | | | 921,250 | | | | 0.74 | % |
| | PNC Financial Services Group, Inc. | | | 22,935 | | | | 1,231,839 | | | | 0.99 | % |
| | Simon Property Group, Inc. | | | 13,973 | | | | 1,794,692 | | | | 1.45 | % |
| | The Charles Schwab Corp. | | | 47,645 | | | | 585,080 | | | | 0.47 | % |
| | The Goldman Sachs Group, Inc. | | | 2,320 | | | | 254,156 | | | | 0.21 | % |
| | Wells Fargo & Co. | | | 156,235 | | | | 4,048,049 | | | | 3.27 | % |
| | | | | | | | | 29,683,570 | | | | 23.94 | % |
| | Health Care – 11.78% | | | | | | | | | | | | |
| | Abbott Labs | | | 20,240 | | | | 1,090,329 | | | | 0.88 | % |
| | Baxter International, Inc. | | | 39,225 | | | | 2,156,590 | | | | 1.74 | % |
| | Celgene Corp. (a) | | | 8,585 | | | | 556,566 | | | | 0.45 | % |
| | CIGNA Corp. | | | 41,855 | | | | 1,855,851 | | | | 1.50 | % |
| | McKesson Corp. | | | 18,995 | | | | 1,549,042 | | | | 1.25 | % |
| | Merck & Co., Inc. | | | 29,907 | | | | 1,031,792 | | | | 0.83 | % |
| | Pfizer, Inc. | | | 186,605 | | | | 3,594,012 | | | | 2.90 | % |
| | Thermo Electron Corp. (a) | | | 15,415 | | | | 774,912 | | | | 0.62 | % |
| | Watson Pharmaceuticals, Inc. (a) | | | 29,725 | | | | 1,996,331 | | | | 1.61 | % |
| | | | | | | | | 14,605,425 | | | | 11.78 | % |
| | Industrials – 8.75% | | | | | | | | | | | | |
| | CSX Corp. | | | 37,725 | | | | 837,872 | | | | 0.68 | % |
| | Eaton Corp. | | | 29,890 | | | | 1,339,670 | | | | 1.08 | % |
| | General Electric Co. | | | 140,900 | | | | 2,354,439 | | | | 1.90 | % |
| | Honeywell International, Inc. | | | 42,230 | | | | 2,212,852 | | | | 1.78 | % |
| | KBR, Inc. | | | 22,470 | | | | 627,138 | | | | 0.51 | % |
| | The Boeing Co. | | | 14,405 | | | | 947,705 | | | | 0.76 | % |
| | The Timken Co. | | | 30,945 | | | | 1,303,403 | | | | 1.05 | % |
| | Tyco International Ltd. (b) | | | 6,910 | | | | 314,750 | | | | 0.25 | % |
| | Union Pacific Corp. | | | 9,180 | | | | 914,053 | | | | 0.74 | % |
| | | | | | | | | 10,851,882 | | | | 8.75 | % |
The accompanying notes are an integral part of these financial statements.
| HENNESSY FUNDS | 1-800-966-4354 |
| | COMMON STOCKS | | Number | | | | | | % of | |
| | | | of Shares | | | Value | | | Net Assets | |
| | Information Technology – 9.10% | | | | | | | | | |
| | Ebay, Inc. (a) | | | 56,090 | | | $ | 1,785,345 | | | | 1.44 | % |
| | Hewlett-Packard Co. | | | 80,825 | | | | 2,150,753 | | | | 1.73 | % |
| | Intel Corp. | | | 170,590 | | | | 4,186,279 | | | | 3.38 | % |
| | International Business Machines Corp. | | | 7,615 | | | | 1,405,957 | | | | 1.13 | % |
| | Mastercard, Inc. | | | 2,735 | | | | 949,701 | | | | 0.76 | % |
| | Yahoo!, Inc. (a) | | | 52,090 | | | | 814,688 | | | | 0.66 | % |
| | | | | | | | | 11,292,723 | | | | 9.10 | % |
| | Materials – 2.44% | | | | | | | | | | | | |
| | Freeport-McMoRan Copper & Gold, Inc. | | | 15,375 | | | | 618,998 | | | | 0.50 | % |
| | Newmont Mining Corp. | | | 13,810 | | | | 922,922 | | | | 0.74 | % |
| | Solutia, Inc. (a) | | | 49,445 | | | | 803,481 | | | | 0.65 | % |
| | The Dow Chemical Co. | | | 24,355 | | | | 679,017 | | | | 0.55 | % |
| | | | | | | | | 3,024,418 | | | | 2.44 | % |
| | Telecommunication Services – 5.12% | | | | | | | | | | | | |
| | AT&T, Inc. | | | 67,160 | | | | 1,968,460 | | | | 1.59 | % |
| | CenturyLink, Inc. | | | 35,647 | | | | 1,256,913 | | | | 1.01 | % |
| | Verizon Communications, Inc. | | | 84,600 | | | | 3,128,508 | | | | 2.52 | % |
| | | | | | | | | 6,353,881 | | | | 5.12 | % |
| | Utilities – 7.37% | | | | | | | | | | | | |
| | American Electric Power, Inc. | | | 44,900 | | | | 1,763,672 | | | | 1.42 | % |
| | FirstEnergy Corp. | | | 37,380 | | | | 1,680,605 | | | | 1.36 | % |
| | PPL Corp. | | | 53,715 | | | | 1,577,610 | | | | 1.27 | % |
| | Southern Co. | | | 45,355 | | | | 1,959,336 | | | | 1.58 | % |
| | Xcel Energy, Inc. | | | 83,350 | | | | 2,154,597 | | | | 1.74 | % |
| | | | | | | | | 9,135,820 | | | | 7.37 | % |
| | | | | | | | | | | | | | |
| | Total Common Stocks (Cost $111,058,337) | | | | | | | 122,359,697 | | | | 98.67 | % |
The accompanying notes are an integral part of these financial statements.
WWW.HENNESSYFUNDS.COM
| | SHORT-TERM INVESTMENTS – 1.14% | | Number | | | | | | % of | |
| | | | of Shares | | | Value | | | Net Assets | |
| | Money Market Funds – 1.14% | | | | | | | | | |
| | Fidelity Government Portfolio – | | | | | | | | | |
| | Institutional Class, 0.01% (c) | | | 1,409,669 | | | $ | 1,409,669 | | | | 1.14 | % |
| | | | | | | | | | | | | | |
| | Total Money Market Funds | | | | | | | | | | | | |
| | (Cost $1,409,669) | | | | | | | 1,409,669 | | | | 1.14 | % |
| | | | | | | | | | | | | | |
| | Total Investments – 99.81% | | | | | | | | | | | | |
| | (Cost $112,468,006) | | | | | | | 123,769,366 | | | | 99.81 | % |
| | | | | | | | | | | | | | |
| | Other Assets in Excess of Liabilities – 0.19% | | | | | | | 236,611 | | | | 0.19 | % |
| | TOTAL NET ASSETS – 100.00% | | | | | | $ | 124,005,977 | | | | 100.00 | % |
Percentages are stated as a percent of net assets.
| | | | |
| | (a) | | Non-income producing security. |
| | (b) | | U.S. traded security of a foreign issuer. |
| | (c) | | The rate listed is the fund’s 7-day yield as of October 31, 2011. |
Summary of Fair Value Exposure at October 31, 2011
The following is a summary of the inputs used to value the Fund’s net assets as of October 31, 2011 (See Note 3 in the accompanying notes to the financial statements):
| | Common Stock | | Level 1 | | | Level 2 | | | Level 3 | | | Total | |
| | Consumer Discretionary | | $ | 11,930,412 | | | $ | — | | | $ | — | | | $ | 11,930,412 | |
| | Consumer Staples | | | 9,395,888 | | | | — | | | | — | | | | 9,395,888 | |
| | Energy | | | 16,085,678 | | | | — | | | | — | | | | 16,085,678 | |
| | Financials | | | 29,683,570 | | | | — | | | | — | | | | 29,683,570 | |
| | Health Care | | | 14,605,425 | | | | — | | | | — | | | | 14,605,425 | |
| | Industrials | | | 10,851,882 | | | | — | | | | — | | | | 10,851,882 | |
| | Information Technology | | | 11,292,723 | | | | — | | | | — | | | | 11,292,723 | |
| | Materials | | | 3,024,418 | | | | — | | | | — | | | | 3,024,418 | |
| | Telecommunication Services | | | 6,353,881 | | | | — | | | | — | | | | 6,353,881 | |
| | Utilities | | | 9,135,820 | | | | — | | | | — | | | | 9,135,820 | |
| | Total Common Stock | | $ | 122,359,697 | | | $ | — | | | $ | — | | | $ | 122,359,697 | |
| | Short-Term Investments | | $ | 1,409,669 | | | $ | — | | | $ | — | | | $ | 1,409,669 | |
| | Total Investments in Securities | | $ | 123,769,366 | | | $ | — | | | $ | — | | | $ | 123,769,366 | |
Transfers between levels are recognized at the end of the reporting period. During the period ended October 31, 2011, the Fund recognized no transfers between levels.
The accompanying notes are an integral part of these financial statements.
| HENNESSY FUNDS | 1-800-966-4354 |
HENNESSY SELECT SPARX
JAPAN FUND
As of October 31, 2011
(% of Net Assets)
| TOP TEN EQUITY HOLDINGS | % of net assets |
| Kao Corp. | 5.21% |
| Keyence Corp. | 5.18% |
| Shimano, Inc. | 5.06% |
| Sumitomo Corp. | 5.06% |
| Daikin Industries | 5.03% |
| Misumi Group, Inc. | 4.87% |
| Ryohin Keikaku Co., Ltd. | 4.75% |
| Mitsubishi Corp. | 4.67% |
| Terumo Corp. | 4.54% |
| Mani, Inc. | 4.45% |
WWW.HENNESSYFUNDS.COM
| | COMMON STOCKS – 87.05% | | Number | | | | | | % of | |
| | | | of Shares | | | Value | | | Net Assets | |
| | Consumer Discretionary – 18.24% | | | | | | | | | |
| | Asics Corp. | | | 81,400 | | | $ | 1,079,133 | | | | 4.40 | % |
| | Isuzu Motors, Ltd. | | | 81,000 | | | | 343,344 | | | | 1.40 | % |
| | Ryohin Keikaku Co., Ltd. | | | 24,500 | | | | 1,162,701 | | | | 4.75 | % |
| | Shimano, Inc. | | | 25,100 | | | | 1,240,699 | | | | 5.06 | % |
| | Toyota Motor Corp. | | | 19,400 | | | | 644,095 | | | | 2.63 | % |
| | | | | | | | | 4,469,972 | | | | 18.24 | % |
| | Consumer Staples – 7.95% | | | | | | | | | | | | |
| | Kao Corp. | | | 48,700 | | | | 1,277,613 | | | | 5.21 | % |
| | Unicharm Corp. | | | 15,000 | | | | 671,759 | | | | 2.74 | % |
| | | | | | | | | 1,949,372 | | | | 7.95 | % |
| | Financials – 5.14% | | | | | | | | | | | | |
| | Mizuho Financial Group | | | 422,500 | | | | 591,369 | | | | 2.41 | % |
| | Sumitomo Mitsui Financial Group, Inc. | | | 23,900 | | | | 668,041 | | | | 2.73 | % |
| | | | | | | | | 1,259,410 | | | | 5.14 | % |
| | Health Care – 13.27% | | | | | | | | | | | | |
| | Mani, Inc. | | | 31,000 | | | | 1,090,938 | | | | 4.45 | % |
| | Rohto Pharmaceutical Co., Ltd. | | | 91,000 | | | | 1,048,315 | | | | 4.28 | % |
| | Terumo Corp. | | | 21,900 | | | | 1,112,740 | | | | 4.54 | % |
| | | | | | | | | 3,251,993 | | | | 13.27 | % |
| | Industrials – 27.14% | | | | | | | | | | | | |
| | Daikin Industries | | | 41,700 | | | | 1,234,058 | | | | 5.03 | % |
| | Itochu Corp. | | | 90,400 | | | | 894,096 | | | | 3.65 | % |
| | Komatsu, Ltd. | | | 13,100 | | | | 323,895 | | | | 1.32 | % |
| | Marubeni Corp. | | | 107,000 | | | | 622,801 | | | | 2.54 | % |
| | Misumi Group, Inc. | | | 57,400 | | | | 1,194,340 | | | | 4.87 | % |
| | Mitsubishi Corp. | | | 55,600 | | | | 1,143,523 | | | | 4.67 | % |
| | Sumitomo Corp. | | | 100,100 | | | | 1,239,353 | | | | 5.06 | % |
| | | | | | | | | 6,652,066 | | | | 27.14 | % |
| | Information Technology – 5.18% | | | | | | | | | | | | |
| | Keyence Corp. | | | 5,000 | | | | 1,271,054 | | | | 5.18 | % |
| | | | | | | | | | | | | | |
| | Materials – 10.13% | | | | | | | | | | | | |
| | Fuji Seal International, Inc. | | | 57,400 | | | | 1,086,334 | | | | 4.43 | % |
| | Sumitomo Metal Industries | | | 300,000 | | | | 564,180 | | | | 2.30 | % |
The accompanying notes are an integral part of these financial statements.
| HENNESSY FUNDS | 1-800-966-4354 |
| | COMMON STOCKS | | Number | | | | | | % of | |
| | | | of Shares | | | Value | | | Net Assets | |
| | Materials (Continued) | | | | | | | | | |
| | Sumitomo Metal Mining, Co., Ltd. | | | 44,000 | | | $ | 605,682 | | | | 2.47 | % |
| | Taiyo Nippon Sanso Corp. | | | 32,000 | | | | 227,395 | | | | 0.93 | % |
| | | | | | | | | 2,483,591 | | | | 10.13 | % |
| | | | | | | | | | | | | | |
| | Total Common Stocks (Cost $20,528,239) | | | | | | | 21,337,458 | | | | 87.05 | % |
| | | | | | | | | | | | | | |
| | SHORT-TERM INVESTMENTS – 11.48% | | | | | | | | | | | | |
| | | | | | | | | | | | | | |
| | Money Market Funds – 11.48% | | | | | | | | | | | | |
| | Federated Treasury Obligations Fund | | | | | | | | | | | | |
| | 0.01% (a) | | | 318,233 | | | | 318,233 | | | | 1.30 | % |
| | Federated Government Obligations Fund | | | | | | | | | | | | |
| | 0.01% (a) | | | 1,232,210 | | | | 1,232,210 | | | | 5.03 | % |
| | Fidelity Government Portfolio – | | | | | | | | | | | | |
| | Institutional Class, 0.01% (a) | | | 1,264,000 | | | | 1,264,000 | | | | 5.15 | % |
| | | | | | | | | | | | | | |
| | Total Short-Term Investments | | | | | | | | | | | | |
| | (Cost $2,814,443) | | | | | | | 2,814,443 | | | | 11.48 | % |
| | | | | | | | | | | | | | |
| | Total Investments – 98.53% | | | | | | | | | | | | |
| | (Cost $23,342,682) | | | | | | | 24,151,901 | | | | 98.53 | % |
| | | | | | | | | | | | | | |
| | Other Assets in Excess of Liabilities – 1.47% | | | | | | | 359,576 | | | | 1.47 | % |
| | TOTAL NET ASSETS – 100.00% | | | | | | $ | 24,511,477 | | | | 100.00 | % |
Percentages are stated as a percent of net assets.
| | (a) | The rate listed is the fund’s 7-day yield as of October 31, 2011. |
The accompanying notes are an integral part of these financial statements.
WWW.HENNESSYFUNDS.COM
Summary of Fair Value Exposure at October 31, 2011
The following is a summary of the inputs used to value the Fund’s net assets as of October 31, 2011 (See Note 3 in the accompanying notes to the financial statements):
| | Common Stock | | Level 1 | | | Level 2 | | | Level 3 | | | Total | |
| | Consumer Discretionary | | $ | — | | | $ | 4,469,972 | | | $ | — | | | $ | 4,469,972 | |
| | Consumer Staples | | | — | | | | 1,949,372 | | | | — | | | | 1,949,372 | |
| | Financials | | | — | | | | 1,259,410 | | | | — | | | | 1,259,410 | |
| | Health Care | | | — | | | | 3,251,993 | | | | — | | | | 3,251,993 | |
| | Industrials | | | — | | | | 6,652,066 | | | | — | | | | 6,652,066 | |
| | Information Technology | | | — | | | | 1,271,054 | | | | — | | | | 1,271,054 | |
| | Materials | | | — | | | | 2,483,591 | | | | — | | | | 2,483,591 | |
| | Total Common Stock | | $ | — | | | $ | 21,337,458 | | | $ | — | | | $ | 21,337,458 | |
| | Short-Term Investments | | $ | 2,814,443 | | | $ | — | | | $ | — | | | $ | 2,814,443 | |
| | Total Investments in Securities | | $ | 2,814,443 | | | $ | 21,337,458 | | | $ | — | | | $ | 24,151,901 | |
Transfers between levels are recognized at the end of the reporting period. During the period ended October 31, 2011, the Fund recognized significant transfers between Levels 1 and 2.
Transfers between Level 1 and Level 2 relate to the use of a fair valuation pricing service. On days when the fair valuation pricing service is used, non-U.S. dollar denominated securities move from a Level 1 to a Level 2 classification.
The accompanying notes are an integral part of these financial statements.
| HENNESSY FUNDS | 1-800-966-4354 |
HENNESSY SELECT SPARX
JAPAN SMALLER COMPANIES FUND
As of October 31, 2011
(% of Net Assets)
| TOP TEN EQUITY HOLDINGS | % of net assets |
| Nitto Boseki Co., Ltd. | 2.89% |
| Topre Corp. | 2.68% |
| Nippon Yusoki Co., Ltd. | 2.42% |
| NEC Capital Solutions Ltd. | 2.40% |
| Daiso Co., Ltd. | 2.34% |
| Arc Land Sakamoto Co., Ltd. | 2.30% |
| Macnica, Inc. | 2.29% |
| Mirait Holdings Corp. | 2.28% |
| ASKUL Corp. | 2.20% |
| Tokyo Tekko Co., Ltd. | 2.19% |
WWW.HENNESSYFUNDS.COM
| | COMMON STOCKS – 98.51% | | Number | | | | | | % of | |
| | | | of Shares | | | Value | | | Net Assets | |
| | Consumer Discretionary – 25.29% | | | | | | | | | |
| | Accordia Golf Co., Ltd. | | | 579 | | | $ | 426,282 | | | | 1.77 | % |
| | Arc Land Sakamoto Co., Ltd. | | | 30,200 | | | | 552,858 | | | | 2.30 | % |
| | ASKUL Corp. | | | 37,100 | | | | 528,951 | | | | 2.20 | % |
| | Doshisha Co., Ltd. | | | 20,200 | | | | 501,844 | | | | 2.08 | % |
| | Endo Manufacturing Co., Ltd. | | | 57,600 | | | | 243,916 | | | | 1.01 | % |
| | Hagihara Industries Inc. | | | 29,300 | | | | 436,459 | | | | 1.81 | % |
| | Haruyama Trading Co., Ltd. | | | 69,400 | | | | 313,841 | | | | 1.30 | % |
| | Nippon Seiki Co., Ltd. | | | 38,000 | | | | 381,783 | | | | 1.58 | % |
| | Nissin Kogyo Co., Ltd. | | | 23,400 | | | | 329,742 | | | | 1.37 | % |
| | Press Kogyo Co., Ltd. | | | 24,000 | | | | 112,215 | | | | 0.47 | % |
| | Sanden Corp. | | | 95,000 | | | | 325,839 | | | | 1.35 | % |
| | Seiko Holdings | | | 210,000 | | | | 519,732 | | | | 2.16 | % |
| | Tohokushinsha Film Corp. | | | 72,400 | | | | 368,290 | | | | 1.53 | % |
| | Topre Corp. | | | 66,700 | | | | 645,925 | | | | 2.68 | % |
| | Village Vanguard Co., Ltd. | | | 250 | | | | 403,797 | | | | 1.68 | % |
| | | | | | | | | 6,091,474 | | | | 25.29 | % |
| | Consumer Staples – 1.96% | | | | | | | | | | | | |
| | Cawachi Ltd. | | | 24,800 | | | | 471,338 | | | | 1.96 | % |
| | | | | | | | | | | | | | |
| | Financials – 1.53% | | | | | | | | | | | | |
| | Anicom Holdings, Inc. (a) | | | 47,200 | | | | 367,537 | | | | 1.53 | % |
| | | | | | | | | | | | | | |
| | Health Care – 1.77% | | | | | | | | | | | | |
| | Message Co., Ltd. | | | 132 | | | | 426,873 | | | | 1.77 | % |
| | | | | | | | | | | | | | |
| | Industrials – 35.58% | | | | | | | | | | | | |
| | Aichi Corp. | | | 111,200 | | | | 442,357 | | | | 1.84 | % |
| | Anest Iwata Corp. | | | 64,000 | | | | 262,570 | | | | 1.09 | % |
| | Asunaro Aoki Construction, Ltd. | | | 69,000 | | | | 349,157 | | | | 1.45 | % |
| | Benefit One, Inc. | | | 332 | | | | 223,293 | | | | 0.93 | % |
| | Iwatani Corp. | | | 140,000 | | | | 483,058 | | | | 2.01 | % |
| | Juki Corp. | | | 201,000 | | | | 449,095 | | | | 1.86 | % |
| | Kyosan Electric Manufacturing Co., Ltd. | | | 94,000 | | | | 415,445 | | | | 1.73 | % |
| | Mirait Holdings Corp. | | | 71,800 | | | | 549,241 | | | | 2.28 | % |
| | Morita Holdings Corp. | | | 86,000 | | | | 463,203 | | | | 1.92 | % |
The accompanying notes are an integral part of these financial statements.
| HENNESSY FUNDS | 1-800-966-4354 |
| | COMMON STOCKS | | Number | | | | | | % of | |
| | | | of Shares | | | Value | | | Net Assets | |
| | Industrials (Continued) | | | | | | | | | |
| | NEC Capital Solutions Ltd. | | | 40,300 | | | $ | 577,985 | | | | 2.40 | % |
| | Nippon Yusoki Co., Ltd. | | | 217,000 | | | | 582,753 | | | | 2.42 | % |
| | Nitto Boseki Co., Ltd. | | | 233,000 | | | | 697,220 | | | | 2.89 | % |
| | Nitto Kogyo Corp. | | | 38,700 | | | | 447,532 | | | | 1.86 | % |
| | NPC, Inc. | | | 12,200 | | | | 105,005 | | | | 0.44 | % |
| | Prestige International, Inc. | | | 30,200 | | | | 256,668 | | | | 1.07 | % |
| | Sankyu, Inc. | | | 90,000 | | | | 356,352 | | | | 1.48 | % |
| | SBS Holdings, Inc. | | | 282 | | | | 229,098 | | | | 0.95 | % |
| | Shin Nippon Air Technologies Co., Ltd. | | | 89,200 | | | | 455,683 | | | | 1.89 | % |
| | Takeei Corp. | | | 11,100 | | | | 210,803 | | | | 0.87 | % |
| | Toshin Group Co., Ltd. | | | 12,000 | | | | 266,501 | | | | 1.11 | % |
| | Weathernews, Inc. | | | 14,400 | | | | 450,828 | | | | 1.87 | % |
| | Yushin Precision Equipment Co., Ltd. | | | 15,300 | | | | 295,109 | | | | 1.22 | % |
| | | | | | | | | 8,568,956 | | | | 35.58 | % |
| | Information Technology – 21.51% | | | | | | | | | | | | |
| | Dwango Co. | | | 184 | | | | 325,998 | | | | 1.35 | % |
| | Information Services International – Dentsu, Ltd. | | | 57,400 | | | | 506,054 | | | | 2.10 | % |
| | ITC Networks Corp. | | | 75,500 | | | | 463,857 | | | | 1.93 | % |
| | Macnica, Inc. | | | 26,100 | | | | 551,515 | | | | 2.29 | % |
| | Megachips Corp. | | | 15,000 | | | | 206,941 | | | | 0.86 | % |
| | Micronics Japan Co., Ltd. | | | 39,000 | | | | 224,816 | | | | 0.93 | % |
| | Nifty Corp. | | | 304 | | | | 352,754 | | | | 1.47 | % |
| | Nippon Chemi-con Corp. | | | 102,000 | | | | 388,534 | | | | 1.61 | % |
| | Roland DG Corp. | | | 27,800 | | | | 291,866 | | | | 1.21 | % |
| | SIIX Corp. | | | 28,100 | | | | 358,885 | | | | 1.49 | % |
| | SRA Holdings, Inc. | | | 52,400 | | | | 501,459 | | | | 2.08 | % |
| | Tamura Corp. | | | 173,000 | | | | 443,108 | | | | 1.84 | % |
| | UKC Holdings Corp. | | | 39,200 | | | | 378,156 | | | | 1.57 | % |
| | Yamaichi Electronics Co., Ltd. (a) | | | 77,000 | | | | 186,959 | | | | 0.78 | % |
| | | | | | | | | 5,180,902 | | | | 21.51 | % |
| | Materials – 10.87% | | | | | | | | | | | | |
| | Daiso Co., Ltd. | | | 168,000 | | | | 563,134 | | | | 2.34 | % |
| | Fujikura Kasei Co., Ltd. | | | 80,100 | | | | 376,559 | | | | 1.56 | % |
The accompanying notes are an integral part of these financial statements.
WWW.HENNESSYFUNDS.COM
| | COMMON STOCKS | | Number | | | | | | % of | |
| | | | of Shares | | | Value | | | Net Assets | |
| | Materials (Continued) | | | | | | | | | |
| | NOF Corp. | | | 92,000 | | | $ | 431,274 | | | | 1.79 | % |
| | Okura Industrial Co., Ltd. | | | 80,000 | | | | 295,964 | | | | 1.23 | % |
| | Tokyo Tekko Co., Ltd. | | | 186,000 | | | | 526,000 | | | | 2.19 | % |
| | Wood One Co., Ltd. | | | 115,000 | | | | 423,843 | | | | 1.76 | % |
| | | | | | | | | 2,616,774 | | | | 10.87 | % |
| | | | | | | | | | | | | | |
| | Total Common Stocks (Cost $23,201,682) | | | | | | | 23,723,854 | | | | 98.51 | % |
| | | | | | | | | | | | | | |
| | SHORT-TERM INVESTMENTS – 0.68% | | | | | | | | | | | | |
| | | | | | | | | | | | | | |
| | Money Market Funds – 0.68% | | | | | | | | | | | | |
| | Fidelity Government Portfolio – | | | | | | | | | | | | |
| | Institutional Class, 0.01% (b) | | | 164,798 | | | | 164,798 | | | | 0.68 | % |
| | | | | | | | | | | | | | |
| | Total Short-Term Investments | | | | | | | | | | | | |
| | (Cost $164,798) | | | | | | | 164,798 | | | | 0.68 | % |
| | | | | | | | | | | | | | |
| | Total Investments – 99.19% | | | | | | | | | | | | |
| | (Cost $23,366,480) | | | | | | | 23,888,652 | | | | 99.19 | % |
| | | | | | | | | | | | | | |
| | Other Assets in Excess of Liabilities – 0.81% | | | | | | | 194,407 | | | | 0.81 | % |
| | TOTAL NET ASSETS – 100.00% | | | | | | $ | 24,083,059 | | | | 100.00 | % |
Percentages are stated as a percent of net assets.
| | (a) | Non-income producing security. |
| | (b) | The rate listed is the fund’s 7-day yield as of October 31, 2011. |
The accompanying notes are an integral part of these financial statements.
| HENNESSY FUNDS | 1-800-966-4354 |
Summary of Fair Value Exposure at October 31, 2011
The following is a summary of the inputs used to value the Fund’s net assets as of October 31, 2011 (See Note 3 in the accompanying notes to the financial statements):
| | Common Stock | | Level 1 | | | Level 2 | | | Level 3 | | | Total | |
| | Consumer Discretionary | | $ | — | | | $ | 6,091,474 | | | $ | — | | | $ | 6,091,474 | |
| | Consumer Staples | | | — | | | | 471,338 | | | | — | | | | 471,338 | |
| | Financials | | | — | | | | 367,537 | | | | — | | | | 367,537 | |
| | Health Care | | | — | | | | 426,873 | | | | — | | | | 426,873 | |
| | Industrials | | | — | | | | 8,568,956 | | | | — | | | | 8,568,956 | |
| | Information Technology | | | — | | | | 5,180,902 | | | | — | | | | 5,180,902 | |
| | Materials | | | — | | | | 2,616,774 | | | | — | | | | 2,616,774 | |
| | Total Common Stock | | $ | — | | | $ | 23,723,854 | | | $ | — | | | $ | 23,723,854 | |
| | Short-Term Investments | | $ | 164,798 | | | $ | — | | | $ | — | | | $ | 164,798 | |
| | Total Investments in Securities | | $ | 164,798 | | | $ | 23,723,854 | | | $ | — | | | $ | 23,888,652 | |
Transfers between levels are recognized at the end of the reporting period. During the period ended October 31, 2011, the Fund recognized significant transfers between Levels 1 and 2.
Transfers between Level 1 and Level 2 relate to the use of a fair valuation pricing service. On days when the fair valuation pricing service is used, non-U.S. dollar denominated securities move from a Level 1 to a Level 2 classification.
The accompanying notes are an integral part of these financial statements.
WWW.HENNESSYFUNDS.COM
(This Page Intentionally Left Blank.)
| HENNESSY FUNDS | 1-800-966-4354 |
Financial Statements
Statements of Assets and Liabilities as of October 31, 2011 |
Investments in securities, at value (cost $112,468,006, $23,342,682 and $23,366,480, respectively)
Dividends and interest receivable
Receivable for fund shares sold
Receivable for securities sold
Prepaid expenses and other assets
Total Assets
LIABILITIES:
Payable for securities purchased
Payable for fund shares redeemed
Payable to advisor
Payable to administrator
Payable to auditor
Payable to trustees
Accrued service fees
Accrued expenses and other payables
Total Liabilities
NET ASSETS
NET ASSETS CONSIST OF:
Capital stock
Accumulated net investment income (loss)
Accumulated net realized loss on investments
Unrealized net appreciation on investments and foreign currency related transactions
Total Net Assets
NET ASSETS
Original Class:
Shares authorized (no par value, $0.001 and $0.001 par value, respectively)
Net assets applicable to outstanding Original Class shares
Shares issued and outstanding
Net asset value, offering price and redemption price per share
Institutional Class:
Shares authorized (no par value and $0.001 par value, respectively)
Net assets applicable to outstanding Institutional Class shares
Shares issued and outstanding
Net asset value, offering price and redemption price per share
The accompanying notes are an integral part of these financial statements.
WWW.HENNESSYFUNDS.COM
| | | | | | | | |
| | | | | | | | |
| | | | | | | HENNESSY | |
| HENNESSY | | | HENNESSY | | | SELECT SPARX | |
| SELECT LARGE | | | SELECT SPARX | | | JAPAN SMALLER | |
| VALUE FUND | | | JAPAN FUND | | | COMPANIES FUND | |
| | | | | | | | |
| $ | 123,769,366 | | | $ | 24,151,901 | | | $ | 23,888,652 | |
| | 94,743 | | | | 217,773 | | | | 167,069 | |
| | 2,340 | | | | 190,489 | | | | 4,377 | |
| | 2,681,174 | | | | — | | | | 95,997 | |
| | 18,645 | | | | 23,510 | | | | 12,854 | |
| | 126,566,268 | | | | 24,583,673 | | | | 24,168,949 | |
| | | | | | | | | | | |
| | 2,306,633 | | | | — | | | | — | |
| | 64,980 | | | | 5,098 | | | | 14,776 | |
| | 85,994 | | | | 20,968 | | | | 26,316 | |
| | 50,354 | | | | 10,148 | | | | 11,193 | |
| | 21,891 | | | | 22,237 | | | | 19,985 | |
| | 1,488 | | | | 1,489 | | | | 1,478 | |
| | 10,114 | | | | 1,214 | | | | 2,193 | |
| | 18,837 | | | | 11,042 | | | | 9,949 | |
| | 2,560,291 | | | | 72,196 | | | | 85,890 | |
| | | | | | | | | | | |
| $ | 124,005,977 | | | $ | 24,511,477 | | | $ | 24,083,059 | |
| | | | | | | | | | | |
| $ | 151,791,179 | | | $ | 56,331,162 | | | $ | 24,452,367 | |
| | 634,102 | | | | — | | | | (190,480 | ) |
| | (39,720,664 | ) | | | (32,624,887 | ) | | | (697,563 | ) |
| | 11,301,360 | | | | 805,202 | | | | 518,735 | |
| $ | 124,005,977 | | | $ | 24,511,477 | | | $ | 24,083,059 | |
| | | | | | | | | | | |
| Unlimited | | | Unlimited | | | Unlimited | |
| | 123,969,491 | | | | 14,807,612 | | | | 24,083,059 | |
| | 5,775,348 | | | | 1,058,694 | | | | 2,387,706 | |
| $ | 21.47 | | | $ | 13.99 | | | $ | 10.09 | |
| | | | | | | | | | | |
| Unlimited | | | Unlimited | | | | N/A | |
| | 36,486 | | | | 9,703,865 | | | | | |
| | 1,692 | | | | 686,313 | | | | | |
| $ | 21.56 | | | $ | 14.14 | | | | | |
| HENNESSY FUNDS | 1-800-966-4354 |
Financial Statements
Statements of Operations Year Ended October 31, 2011 |
Dividend income(1)
Interest income
Total investment income
EXPENSES:
Investment advisory fees
Administration, fund accounting, custody and transfer agent fees
Service fees – Original Class (See Note 5)
Federal and state registration fees
Audit fees
Legal fees
Compliance expense
Reports to shareholders
Trustees’ fees and expenses
Sub-transfer agent expenses – Original Class (See Note 5)
Sub-transfer agent expenses – Institutional Class (See Note 5)
Interest expense (See Note 6)
Other
Total expenses before reimbursement/waiver
Administration expense waiver – Institutional Class (See Note 5)
Net expenses
NET INVESTMENT INCOME (LOSS)
REALIZED AND UNREALIZED GAINS (LOSSES):
Net realized gain on investments
Change in unrealized depreciation on investments
NET REALIZED GAIN (LOSS) AND UNREALIZED GAIN (LOSS) ON INVESTMENTS
NET INCREASE (DECREASE) IN NET ASSETS RESULTING FROM OPERATIONS
| (1) | Net of foreign taxes withheld of $0, $35,297 and $40,652, respectively. |
The accompanying notes are an integral part of these financial statements.
WWW.HENNESSYFUNDS.COM
| | | | | | | | |
| | | | | | | | |
| | | | | | | HENNESSY | |
| HENNESSY | | | HENNESSY | | | SELECT SPARX | |
| SELECT LARGE | | | SELECT SPARX | | | JAPAN SMALLER | |
| VALUE FUND | | | JAPAN FUND | | | COMPANIES FUND | |
| | | | | | | | |
| $ | 3,121,778 | | | $ | 468,947 | | | $ | 548,160 | |
| | 240 | | | | 346 | | | | 198 | |
| | 3,122,018 | | | | 469,293 | | | | 548,358 | |
| | | | | | | | | | | |
| | 1,129,883 | | | | 310,543 | | | | 290,179 | |
| | 338,965 | | | | 79,189 | | | | 61,663 | |
| | 132,887 | | | | 19,263 | | | | 24,182 | |
| | 37,038 | | | | 9,408 | | | | 21,648 | |
| | 23,290 | | | | 20,498 | | | | 16,896 | |
| | 7,991 | | | | 9,501 | | | | 9,501 | |
| | 8,294 | | | | 8,293 | | | | 8,294 | |
| | 27,992 | | | | 11,001 | | | | 6,500 | |
| | 12,297 | | | | 11,501 | | | | 12,101 | |
| | 102,973 | | | | 41,849 | | | | 43,767 | |
| | — | | | | 445 | | | | N/A | |
| | — | | | | 10,234 | | | | — | |
| | 16,625 | | | | 19,795 | | | | 12,174 | |
| | 1,838,235 | | | | 551,520 | | | | 506,905 | |
| | (92 | ) | | | — | | | | N/A | |
| | 1,838,143 | | | | 551,520 | | | | 506,905 | |
| $ | 1,283,875 | | | $ | (82,227 | ) | | $ | 41,453 | |
| | | | | | | | | | | |
| $ | 11,600,606 | | | $ | 1,052,378 | | | $ | 1,413,091 | |
| | (5,464,551 | ) | | | (4,618,650 | ) | | | (331,017 | ) |
| | 6,136,055 | | | | (3,566,272 | ) | | | 1,082,074 | |
| | | | | | | | | | | |
| $ | 7,419,930 | | | $ | (3,648,499 | ) | | $ | 1,123,527 | |
| HENNESSY FUNDS | 1-800-966-4354 |
Financial Statements
| Statements of Changes in Net Assets |
Net investment income (loss)
Net realized gain (loss)
Change in unrealized appreciation (depreciation)
Net increase (decrease) in net assets resulting from operations
DISTRIBUTIONS TO SHAREHOLDERS FROM:
Net investment income – Original Class
Net investment income – Institutional Class
Return of capital – Original Class
Return of capital – Institutional Class
Total distributions
CAPITAL SHARE TRANSACTIONS:
Proceeds from shares subscribed – Original Class
Proceeds from shares subscribed – Institutional Class
Dividends reinvested – Original Class
Dividends reinvested – Institutional Class
Cost of shares redeemed – Original Class
Cost of shares redeemed – Institutional Class
Redemption fees retained – Original Class
Redemption fees retained – Institutional Class
Net increase (decrease) in net assets derived from capital share transactions
TOTAL INCREASE (DECREASE) IN NET ASSETS
NET ASSETS:
Beginning of year
End of year
Accumulated net investment income (loss), end of period
CHANGES IN SHARES OUTSTANDING:
Shares sold – Original Class
Shares sold – Institutional Class
Shares issued to holders as reinvestment of dividends – Original Class
Shares issued to holders as reinvestment of dividends – Institutional Class
Shares redeemed – Original Class
Shares redeemed – Institutional Class
Net increase (decrease) in shares outstanding
The accompanying notes are an integral part of these financial statements.
WWW.HENNESSYFUNDS.COM
| | | | | | | | | | | | | | |
| | | | | | | | | | | | | | |
| | | | | | | Hennessy Select SPARX | |
| Hennessy Select Large | | | Hennessy Select SPARX | | | Japan Smaller | |
| Value Fund | | | Japan Fund | | | Companies Fund | |
| | | | | | | | | | | | | | | | | |
| Year Ended October 31, | | | Year Ended October 31, | | | Year Ended October 31, | |
| 2011 | | | 2010 | | | 2011 | | | 2010 | | | 2011 | | | 2010 | |
| | | | | | | | | | | | | | | | | |
| $ | 1,283,875 | | | $ | 899,788 | | | $ | (82,227 | ) | | $ | (28,134 | ) | | $ | 41,453 | | | $ | (1,744 | ) |
| | 11,600,606 | | | | 11,884,038 | | | | 1,052,378 | | | | (6,199,173 | ) | | | 1,413,091 | | | | 1,822,388 | |
| | (5,464,551 | ) | | | 378,192 | | | | (4,618,650 | ) | | | 11,415,124 | | | | (331,017 | ) | | | (2,019,798 | ) |
| | 7,419,930 | | | | 13,162,018 | | | | (3,648,499 | ) | | | 5,187,817 | | | | 1,123,527 | | | | (199,154 | ) |
| | | | | | | | | | | | | | | | | | | | | | | |
| | (1,291,601 | ) | | | (1,607,669 | ) | | | — | | | | (30,697 | ) | | | — | | | | (675,389 | ) |
| | (582 | ) | | | (468 | ) | | | — | | | | (22,666 | ) | | | N/A | | | | N/A | |
| | — | | | | — | | | | — | | | | (28,764 | ) | | | — | | | | — | |
| | — | | | | — | | | | — | | | | (21,239 | ) | | | N/A | | | | N/A | |
| | (1,292,183 | ) | | | (1,608,137 | ) | | | — | | | | (103,366 | ) | | | — | | | | (675,389 | ) |
| | | | | | | | | | | | | | | | | | | | | | | |
| | 1,847,792 | | | | 1,644,633 | | | | 68,660,478 | | | | 12,134,525 | | | | 18,301,075 | | | | 3,996,704 | |
| | 10,610 | | | | 10,259 | | | | 1,179,768 | | | | 9,038,569 | | | | N/A | | | | N/A | |
| | 1,235,299 | | | | 1,542,668 | | | | — | | | | 58,305 | | | | — | | | | 654,011 | |
| | 528 | | | | 468 | | | | — | | | | 42,669 | | | | N/A | | | | N/A | |
| | (16,781,736 | ) | | | (15,965,046 | ) | | | (68,498,891 | ) | | | (23,363,751 | ) | | | (10,506,632 | ) | | | (4,829,993 | ) |
| | (12,669 | ) | | | (5,496 | ) | | | (16,765,426 | ) | | | (13,290,361 | ) | | | N/A | | | | N/A | |
| | — | | | | — | | | | 222 | | | | 36,375 | | | | 32 | | | | 18,198 | |
| | — | | | | — | | | | — | | | | — | | | | N/A | | | | N/A | |
| | (13,700,176 | ) | | | (12,772,514 | ) | | | (15,423,849 | ) | | | (15,343,669 | ) | | | 7,794,475 | | | | (161,080 | ) |
| | (7,572,429 | ) | | | (1,218,633 | ) | | | (19,072,348 | ) | | | (10,259,218 | ) | | | 8,918,002 | | | | (1,035,623 | ) |
| | | | | | | | | | | | | | | | | | | | | | | |
| | 131,578,406 | | | | 132,797,039 | | | | 43,583,825 | | | | 53,843,043 | | | | 15,165,057 | | | | 16,200,680 | |
| $ | 124,005,977 | | | $ | 131,578,406 | | | $ | 24,511,477 | | | $ | 43,583,825 | | | $ | 24,083,059 | | | $ | 15,165,057 | |
| | | | | | | | | | | | | | | | | | | | | | | |
| $ | 634,102 | | | $ | 682,446 | | | $ | — | | | $ | — | | | $ | (190,480 | ) | | $ | (217,495 | ) |
| | | | | | | | | | | | | | | | | | | | | | | |
| | 84,224 | | | | 81,862 | | | | 4,803,522 | | | | 1,011,968 | | | | 1,751,882 | | | | 424,911 | |
| | 497 | | | | 514 | | | | 80,655 | | | | 740,046 | | | | N/A | | | | N/A | |
| | 56,743 | | | | 76,941 | | | | — | | | | 4,983 | | | | — | | | | 74,659 | |
| | 24 | | | | 23 | | | | — | | | | 3,628 | | | | N/A | | | | N/A | |
| | (759,938 | ) | | | (795,699 | ) | | | (5,335,288 | ) | | | (1,911,383 | ) | | | (1,007,763 | ) | | | (519,710 | ) |
| | (615 | ) | | | (278 | ) | | | (1,256,328 | ) | | | (1,114,529 | ) | | | N/A | | | | N/A | |
| | (619,065 | ) | | | (636,637 | ) | | | (1,707,439 | ) | | | (1,265,287 | ) | | | 744,119 | | | | (20,140 | ) |
| | | | | | | | | | | | | | | | | | | | | | | |
| HENNESSY FUNDS | 1-800-966-4354 |
Financial Highlights
| Hennessy Select Large Value Fund |
For an Original Class share outstanding throughout each period
PER SHARE DATA:
Net asset value, beginning of period
Income from investment operations:
Net investment income
Net realized and unrealized gains (losses) on securities
Total from investment operations
Less Distributions:
Dividends from net investment income
Dividends from net realized gains
Total distributions
Net asset value, end of period
TOTAL RETURN
SUPPLEMENTAL DATA AND RATIOS:
Net assets, end of period (millions)
Ratio of expenses to average net assets:
Before expense reimbursement
After expense reimbursement
Ratio of net investment income to average net assets
Before expense reimbursement
After expense reimbursement
Portfolio turnover rate(6)
| (1) | | For the one month ended October 31, 2009. Effective October 31, 2009, the Fund changed its fiscal year end to October 31st from September 30th. |
| (2) | | The financial highlights set forth for periods prior to March 20, 2009 represent the historical financial highlights of the Tamarack Value Fund, Class S shares. The assets of the Tamarack Value Fund were acquired by the Hennessy Select Large Value Fund on March 20, 2009. Prior to the reorganization, Tamarack Value Fund also offered Class A, Class C and R shares. At that time RBC Global Asset Management (U.S.), Inc., (formerly known as Voyageur Asset Management Inc.) ceased to be investment advisor and Hennessy Advisors, Inc. became investment advisor. The return of the Tamarack Value Fund, Class S shares during the period October 1, 2008 through March 20, 2009 was (33.09)%. The return of the Hennessy Select Large Value Fund, Original Class shares during the period March 20, 2009 through September 30, 2009 was 36.84%. |
| (3) | | Per share net investment income (loss) has been calculated using the average daily shares method. |
| (4) | | Not Annualized. |
| (5) | | Annualized. |
| (6) | | Portfolio turnover is calculated on the basis of the Fund as a whole. |
The accompanying notes are an integral part of these financial statements.
WWW.HENNESSYFUNDS.COM
| | | | | | | | | | | | | | | | | |
| | | | | | | | | | | | | | | | | |
| | | | | | | One Month | | | | | | | | | | |
| | | | Ended | | | | |
| Year Ended October 31, | | | October 31, | | | Year Ended September 30, | |
| 2011 | | | 2010 | | | 2009(1) | | | 2009(2) | | | 2008(2) | | | 2007(2) | |
| | | | | | | | | | | | | | | | | |
| $ | 20.57 | | | $ | 18.88 | | | $ | 19.49 | | | $ | 21.80 | | | $ | 43.12 | | | $ | 41.74 | |
| | | | | | | | | | | | | | | | | | | | | | | |
| | 0.22 | | | | 0.14 | | | | 0.01 | | | | 0.31 | | | | 0.42 | (3) | | | 0.58 | (3) |
| | 0.89 | | | | 1.78 | | | | (0.62 | ) | | | (2.21 | ) | | | (7.43 | ) | | | 5.04 | |
| | 1.11 | | | | 1.92 | | | | (0.61 | ) | | | (1.90 | ) | | | (7.01 | ) | | | 5.62 | |
| | | | | | | | | | | | | | | | | | | | | | | |
| | (0.21 | ) | | | (0.23 | ) | | | — | | | | (0.41 | ) | | | (0.78 | ) | | | (0.63 | ) |
| | — | | | | — | | | | — | | | | — | | | | (13.53 | ) | | | (3.61 | ) |
| | (0.21 | ) | | | (0.23 | ) | | | — | | | | (0.41 | ) | | | (14.31 | ) | | | (4.24 | ) |
| $ | 21.47 | | | $ | 20.57 | | | $ | 18.88 | | | $ | 19.49 | | | $ | 21.80 | | | $ | 43.12 | |
| | | | | | | | | | | | | | | | | | | | | | | |
| | 5.36 | % | | | 10.22 | % | | | (3.13 | )%(4) | | | (8.43 | )% | | | (22.42 | )% | | | 14.19 | % |
| | | | | | | | | | | | | | | | | | | | | | | |
| $ | 123.97 | | | $ | 131.54 | | | $ | 132.77 | | | $ | 138.34 | | | $ | 174.23 | | | $ | 269.37 | |
| | | | | | | | | | | | | | | | | | | | | | | |
| | 1.38 | % | | | 1.41 | % | | | 1.37 | %(5) | | | 1.42 | % | | | 1.22 | % | | | 1.26 | % |
| | 1.38 | % | | | 1.38 | % | | | 1.30 | %(5) | | | 1.17 | % | | | 1.02 | % | | | 1.03 | % |
| | | | | | | | | | | | | | | | | | | | | | | |
| | 0.97 | % | | | 0.64 | % | | | 0.28 | %(5) | | | 1.46 | % | | | 1.32 | % | | | 1.13 | % |
| | 0.97 | % | | | 0.67 | % | | | 0.35 | %(5) | | | 1.71 | % | | | 1.52 | % | | | 1.36 | % |
| | 149 | % | | | 146 | % | | | 10 | %(4) | | | 142 | % | | | 162 | % | | | 136 | % |
| HENNESSY FUNDS | 1-800-966-4354 |
Financial Highlights
| Hennessy Select Large Value Fund |
For an Institutional Class share outstanding throughout each period
PER SHARE DATA:
Net asset value, beginning of period
Income from investment operations:
Net investment income (loss)
Net realized and unrealized gains (losses) on securities
Total from investment operations
Less Distributions:
Dividends from net investment income
Dividends from net realized gains
Total distributions
Net asset value, end of period
TOTAL RETURN
SUPPLEMENTAL DATA AND RATIOS:
Net assets, end of period (millions)
Ratio of expenses to average net assets:
Before expense reimbursement
After expense reimbursement
Ratio of net investment income to average net assets
Before expense reimbursement
After expense reimbursement
Portfolio turnover rate(6)
| (1) | | For the one month ended October 31, 2009. Effective October 31, 2009, the Fund changed its fiscal year end to October 31st from September 30th. |
| (2) | | Institutional Class shares commenced operations on March 20, 2009. |
| (3) | | Amount is less than $0.01 or $(0.01). |
| (4) | | Not annualized. |
| (5) | | Annualized. |
| (6) | | Portfolio turnover is calculated on the basis of the Fund as a whole. |
The accompanying notes are an integral part of these financial statements.
WWW.HENNESSYFUNDS.COM
| | | | | | | | | | | |
| | | | | | | | | | | |
| | | | | | | One Month | | | | |
| | | | | | | Ended | | | Period Ended | |
| Year Ended October 31, | | | October 31, | | | September 30, | |
| 2011 | | | 2010 | | | 2009(1) | | | 2009(2) | |
| | | | | | | | | | | |
| $ | 20.65 | | | $ | 18.92 | | | $ | 19.53 | | | $ | 14.25 | |
| | | | | | | | | | | | | | | |
| | 0.27 | | | | 0.21 | | | | — | (3) | | | 0.08 | |
| | 0.92 | | | | 1.80 | | | | (0.61 | ) | | | 5.20 | |
| | 1.19 | | | | 2.01 | | | | (0.61 | ) | | | 5.28 | |
| | | | | | | | | | | | | | | |
| | (0.28 | ) | | | (0.28 | ) | | | — | | | | — | |
| | — | | | | — | | | | — | | | | — | |
| | (0.28 | ) | | | (0.28 | ) | | | — | | | | — | |
| $ | 21.56 | | | $ | 20.65 | | | $ | 18.92 | | | $ | 19.53 | |
| | | | | | | | | | | | | | | |
| | 5.76 | % | | | 10.65 | % | | | (3.12 | )%(4) | | | 37.05 | %(4) |
| | | | | | | | | | | | | | | |
| $ | 0.04 | | | $ | 0.04 | | | $ | 0.03 | | | $ | 0.03 | |
| | | | | | | | | | | | | | | |
| | 1.21 | % | | | 1.22 | % | | | 1.20 | %(5) | | | 26.18 | %(5) |
| | 0.98 | % | | | 0.98 | % | | | 0.98 | %(5) | | | 0.98 | %(5) |
| | | | | | | | | | | | | | | |
| | 1.13 | % | | | 0.80 | % | | | 0.44 | %(5) | | | (24.06 | )%(5) |
| | 1.36 | % | | | 1.04 | % | | | 0.66 | %(5) | | | 1.14 | %(5) |
| | 149 | % | | | 146 | % | | | 10 | %(4) | | | 142 | %(4) |
| HENNESSY FUNDS | 1-800-966-4354 |
Financial Highlights
| Hennessy Select SPARX Japan Fund |
For an Original Class share outstanding throughout each year
PER SHARE DATA:
Net asset value, beginning of year
Income from investment operations:
Net investment income (loss)
Net realized and unrealized gains (losses) on securities
Total from investment operations
Less Distributions:
Dividends from net investment income
Dividends from net realized gains
Return of capital
Total distributions
Redemption fees retained
Net asset value, end of year
TOTAL RETURN
SUPPLEMENTAL DATA AND RATIOS:
Net assets, end of year (millions)
Ratio of expenses to average net assets:
Before expense reimbursement
After expense reimbursement
Ratio of net investment income (loss) to average net assets
Before expense reimbursement
After expense reimbursement
Portfolio turnover rate(3)
| (1) | | The financial highlights set forth for periods prior to September 17, 2009 represent the historical financial highlights of the SPARX Japan Fund. On September 17, 2009 Hennessy Advisors, Inc., became the investment advisor to the Fund and the Fund changed its name to Hennessy Select SPARX Japan Fund. In addition, the Investor Class shares were redesignated Original Class shares. |
| (2) | | Amount is less than $0.01. |
| (3) | | Portfolio turnover is calculated on the basis of the Fund as a whole. |
The accompanying notes are an integral part of these financial statements.
WWW.HENNESSYFUNDS.COM
| | | | | | | | | | | | | | |
| | | | | | | | | | | | | | |
| Year Ended October 31, | |
| 2011 | | | 2010 | | | 2009(1) | | | 2008(1) | | | 2007(1) | |
| | | | | | | | | | | | | | |
| $ | 12.58 | | | $ | 11.38 | | | $ | 9.73 | | | $ | 16.24 | | | $ | 17.20 | |
| | | | | | | | | | | | | | | | | | | |
| | (0.10 | ) | | | (0.04 | ) | | | 0.02 | | | | 0.05 | | | | (0.03 | ) |
| | 1.51 | | | | 1.25 | | | | 1.66 | | | | (6.56 | ) | | | (0.93 | ) |
| | 1.41 | | | | 1.21 | | | | 1.68 | | | | (6.51 | ) | | | (0.96 | ) |
| | | | | | | | | | | | | | | | | | | |
| | — | | | | (0.01 | ) | | | (0.03 | ) | | | — | | | | — | |
| | — | | | | — | | | | — | | | | — | | | | — | |
| | — | | | | (0.01 | ) | | | — | | | | — | | | | — | |
| | — | | | | (0.02 | ) | | | (0.03 | ) | | | — | | | | — | |
| | — | | | | 0.01 | | | | — | (2) | | | — | (2) | | | — | |
| $ | 13.99 | | | $ | 12.58 | | | $ | 11.38 | | | $ | 9.73 | | | $ | 16.24 | |
| | | | | | | | | | | | | | | | | | | |
| | 11.21 | % | | | 11.04 | % | | | 17.36 | % | | | (40.09 | )% | | | (5.58 | )% |
| | | | | | | | | | | | | | | | | | | |
| $ | 14.81 | | | $ | 20.01 | | | $ | 28.29 | | | $ | 15.86 | | | $ | 19.54 | |
| | | | | | | | | | | | | | | | | | | |
| | 1.86 | % | | | 1.71 | % | | | 1.75 | % | | | 1.72 | % | | | 1.87 | % |
| | 1.86 | % | | | 1.59 | % | | | 1.24 | % | | | 1.25 | % | | | 1.45 | % |
| | | | | | | | | | | | | | | | | | | |
| | (0.54 | )% | | | (0.27 | )% | | | (0.34 | )% | | | (0.10 | )% | | | (0.62 | )% |
| | (0.54 | )% | | | (0.15 | )% | | | 0.17 | % | | | 0.37 | % | | | (0.20 | )% |
| | 166 | % | | | 8 | % | | | 17 | % | | | 35 | % | | | 111 | % |
| HENNESSY FUNDS | 1-800-966-4354 |
Financial Highlights
| Hennessy Select SPARX Japan Fund |
For an Institutional Class share outstanding throughout each year
PER SHARE DATA:
Net asset value, beginning of year
Income from investment operations:
Net investment income (loss)
Net realized and unrealized gains (losses) on securities
Total from investment operations
Less Distributions:
Dividends from net investment income
Dividends from net realized gains
Return of capital
Total distributions
Redemption fees retained
Net asset value, end of year
TOTAL RETURN
SUPPLEMENTAL DATA AND RATIOS:
Net assets, end of year (millions)
Ratio of expenses to average net assets:
Before expense reimbursement
After expense reimbursement
Ratio of net investment income (loss) to average net assets
Before expense reimbursement
After expense reimbursement
Portfolio turnover rate(3)
| (1) | | The financial highlights set forth for periods prior to September 17, 2009 represent the historical financial highlights of the SPARX Japan Fund. On September 17, 2009 Hennessy Advisors, Inc., became the investment advisor to the Fund and the Fund changed its name to Hennessy Select SPARX Japan Fund. |
| (2) | | Amount is less than $0.01 or $(0.01). |
| (3) | | Portfolio turnover is calculated on the basis of the Fund as a whole. |
The accompanying notes are an integral part of these financial statements.
WWW.HENNESSYFUNDS.COM
| | | | | | | | | | | | | | |
| | | | | | | | | | | | | | |
| Year Ended October 31, | |
| 2011 | | | 2010 | | | 2009(1) | | | 2008(1) | | | 2007(1) | |
| | | | | | | | | | | | | | |
| $ | 12.66 | | | $ | 11.44 | | | $ | 9.78 | | | $ | 16.33 | | | $ | 17.27 | |
| | | | | | | | | | | | | | | | | | | |
| | 0.03 | | | | 0.01 | | | | 0.03 | | | | 0.05 | | | | — | (2) |
| | 1.45 | | | | 1.23 | | | | 1.66 | | | | (6.60 | ) | | | (0.94 | ) |
| | 1.48 | | | | 1.24 | | | | 1.69 | | | | (6.55 | ) | | | (0.94 | ) |
| | | | | | | | | | | | | | | | | | | |
| | — | | | | (0.01 | ) | | | (0.03 | ) | | | — | | | | — | |
| | — | | | | — | | | | — | | | | — | | | | — | |
| | — | | | | (0.01 | ) | | | — | | | | — | | | | — | |
| | — | | | | (0.02 | ) | | | (0.03 | ) | | | — | | | | — | |
| | — | | | | — | | | | — | (2) | | | — | (2) | | | — | |
| $ | 14.14 | | | $ | 12.66 | | | $ | 11.44 | | | $ | 9.78 | | | $ | 16.33 | |
| | | | | | | | | | | | | | | | | | | |
| | 11.69 | % | | | 11.07 | % | | | 17.37 | % | | | (40.11 | )% | | | (5.44 | )% |
| | | | | | | | | | | | | | | | | | | |
| $ | 9.70 | | | $ | 23.57 | | | $ | 25.55 | | | $ | 37.03 | | | $ | 82.94 | |
| | | | | | | | | | | | | | | | | | | |
| | 1.64 | % | | | 1.45 | % | | | 1.75 | % | | | 1.72 | % | | | 1.67 | % |
| | 1.64 | % | | | 1.40 | % | | | 1.24 | % | | | 1.25 | % | | | 1.25 | % |
| | | | | | | | | | | | | | | | | | | |
| | 0.19 | % | | | 0.02 | % | | | (0.34 | )% | | | (0.10 | )% | | | (0.42 | )% |
| | 0.19 | % | | | 0.07 | % | | | 0.17 | % | | | 0.37 | % | | | 0.00 | % |
| | 166 | % | | | 8 | % | | | 17 | % | | | 35 | % | | | 111 | % |
| HENNESSY FUNDS | 1-800-966-4354 |
Financial Highlights
| Hennessy Select SPARX Japan Smaller Companies Fund |
For an Original Class share outstanding throughout each period
PER SHARE DATA:
Net asset value, beginning of period
Income from investment operations:
Net investment income (loss)
Net realized and unrealized gains (losses) on securities
Total from investment operations
Less Distributions:
Dividends from net investment income
Dividends from net realized gains
Total distributions
Redemption fees retained
Net asset value, end of period
TOTAL RETURN
SUPPLEMENTAL DATA AND RATIOS:
Net assets, end of period (millions)
Ratio of expenses to average net assets:
Before expense reimbursement
After expense reimbursement
Ratio of net investment income (loss) to average net assets
Before expense reimbursement
After expense reimbursement
Portfolio turnover rate
| (1) | | The financial highlights set forth for periods prior to September 17, 2009 represent the historical financial highlights of the SPARX Japan Smaller Companies Fund. On September 17, 2009 Hennessy Advisors, Inc., became the investment advisor to the Fund and the Fund changed its name to Hennessy Select SPARX Japan Smaller Companies Fund. In addition, the Investor Class shares were redesignated Original Class shares. |
| (2) | | The Fund commenced operations on August 31, 2007 |
| (3) | | Amount is less than $0.01 or $(0.01). |
| (4) | | Calculated based on average shares outstanding. |
| (5) | | Not annualized. |
| (6) | | Annualized. |
The accompanying notes are an integral part of these financial statements.
WWW.HENNESSYFUNDS.COM
| | | | | | | | | | | | | | |
| | | | | | | | | | | | | | |
| | | | | | | | | | | | | Period Ended | |
| Year Ended October 31, | | | October 31, | |
| 2011 | | | 2010 | | | 2009(1) | | | 2008(1) | | | 2007(1)(2) | |
| | | | | | | | | | | | | | |
| $ | 9.23 | | | $ | 9.74 | | | $ | 6.87 | | | $ | 10.98 | | | $ | 10.00 | |
| | | | | | | | | | | | | | | | | | | |
| | 0.06 | | | | — | (3) | | | 0.07 | | | | 0.02 | (4) | | | — | (3) |
| | 0.80 | | | | (0.10 | ) | | | 2.80 | | | | (4.08 | ) | | | 0.98 | |
| | 0.86 | | | | (0.10 | ) | | | 2.87 | | | | (4.06 | ) | | | 0.98 | |
| | | | | | | | | | | | | | | | | | | |
| | — | | | | (0.42 | ) | | | — | | | | (0.07 | ) | | | — | |
| | — | | | | — | | | | — | | | | — | | | | — | |
| | — | | | | (0.42 | ) | | | — | | | | (0.07 | ) | | | — | |
| | — | | | | 0.01 | | | | — | (3) | | | 0.02 | | | | — | |
| $ | 10.09 | | | $ | 9.23 | | | $ | 9.74 | | | $ | 6.87 | | | $ | 10.98 | |
| | | | | | | | | | | | | | | | | | | |
| | 9.32 | % | | | (0.72 | )% | | | 41.78 | % | | | (37.00 | )% | | | 9.80 | %(5) |
| | | | | | | | | | | | | | | | | | | |
| $ | 24.08 | | | $ | 15.17 | | | $ | 16.20 | | | $ | 11.74 | | | $ | 5.58 | |
| | | | | | | | | | | | | | | | | | | |
| | 2.10 | % | | | 2.14 | % | | | 3.10 | % | | | 4.47 | % | | | 9.73 | %(6) |
| | 2.10 | % | | | 2.01 | % | | | 1.60 | % | | | 1.60 | % | | | 1.60 | %(6) |
| | | | | | | | | | | | | | | | | | | |
| | 0.17 | % | | | (0.14 | )% | | | (0.86 | )% | | | (2.60 | )% | | | (8.15 | )%(6) |
| | 0.17 | % | | | (0.01 | )% | | | 0.64 | % | | | 0.26 | % | | | (0.02 | )%(6) |
| | 61 | % | | | 100 | % | | | 138 | % | | | 55 | % | | | 13 | %(5) |
| HENNESSY FUNDS | 1-800-966-4354 |
Notes to the Financial Statements
October 31, 2011
The Hennessy Select Large Value Fund (the “Large Value Fund”) is organized as a separate investment portfolio or series of Hennessy Funds Trust, a Delaware statutory trust that was organized on September 17, 1992. The Large Value Fund is an open-end, diversified management investment company registered under the Investment Company Act of 1940, as amended (the “1940 Act”). The investment objective of the Large Value Fund is long-term growth of capital and current income.
The Hennessy Select SPARX Japan Fund (the “Japan Fund”) and the Hennessy Select SPARX Japan Smaller Companies Fund (the “Japan Smaller Companies Fund”) are organized as separate investment portfolios or series of Hennessy SPARX Funds Trust, a Massachusetts business trust that was organized on July 24, 1995. The Japan Fund and the Japan Smaller Companies Fund are open-end, diversified management investment companies registered under the 1940 Act. Although these Funds will each be considered a “diversified” mutual fund, the Funds may employ a relatively focused investment strategy and may hold securities of fewer issuers than other diversified funds. The investment objective of the Japan Fund and the Japan Smaller Companies Fund is long-term capital appreciation.
The Large Value Fund, Japan Fund and Japan Smaller Companies Fund collectively represent the Hennessy Select Series Funds (the “Funds”).
The Large Value Fund and Japan Fund offer Original and Institutional Class shares. Each class of shares differs principally in its respective administration, shareholder servicing and transfer agent expenses and sales charges, if any. Each class has identical rights to earnings, assets and voting privileges, except for class-specific expenses and exclusive rights to vote on matters affecting only individual classes. The Japan Smaller Companies Fund offers only Original Class shares.
| 2). | SIGNIFICANT ACCOUNTING POLICIES |
The following is a summary of significant accounting policies consistently followed by the Funds in the preparation of the financial statements. These policies are in conformity with U.S. generally accepted accounting principles (“GAAP”).
| a). | Investment Valuation – All investments in securities are recorded at their estimated fair value, as described in Note 3. |
| b). | Federal Income Taxes – Provision for Federal income taxes or excise taxes has not been made since the Funds have elected to be taxed as a “regulated investment company” and intend to distribute substantially all taxable income to shareholders and otherwise comply with the provisions of the Internal Revenue Code applicable to regulated investment companies. Net investment income or loss and realized gains and losses for federal income |
WWW.HENNESSYFUNDS.COM
tax purposes may differ from that reported on the financial statements because of temporary book and tax basis differences. Temporary differences are primarily the result of the treatment of wash sales for tax reporting purposes. Distributions from net realized gains for book purposes may include short-term capital gains, which are included as ordinary income to shareholders for tax purposes.
Due to inherent differences in the recognition of income, expenses, and realized gains/losses under U.S. generally accepted accounting principles and federal income tax purposes, permanent differences between book and tax basis reporting for the 2011 fiscal year have been identified and appropriately reclassified on the Statements of Assets and Liabilities.
| | | | Accumulated Net | | | Accumulated Net | | | Paid In | |
| | | | Investment Income/(Loss) | | | Realized Gain/(Loss) | | | Capital | |
| | Large Value Fund | | | (40,036 | ) | | | 40,036 | | | | — | |
| | Japan Fund | | | 82,227 | | | | 486,720 | | | | (568,947 | ) |
| | Japan Smaller Companies Fund | | | (14,438 | ) | | | 14,438 | | | | — | |
The permanent differences primarily relate to net operating losses, foreign currency reclassifications, REITs and sales of passive foreign investment companies.
| c). | Income and Expenses – Dividend income is recognized on the ex-dividend date or as soon as information is available to the Funds and interest income is recognized on an accrual basis. Income, expenses (other than expenses attributable to a specific class), and realized and unrealized gains or losses on investments are allocated to each class of shares based on its respective net assets. |
| d). | Distributions to Shareholders – Dividends from net investment income and distributions of net realized capital gains for the Funds, if any, are declared and paid out annually, usually in November or December of each year. |
| e). | Security Transactions – Investment and shareholder transactions are recorded on the trade date. The Funds determine the gain or loss realized from the investment transactions by comparing the original cost of the security lot sold with the net sale proceeds. Discounts and premiums on securities purchased are accreted/amortized over the life of the respective security. |
Foreign securities are recorded in the financial statements after translation to U.S. dollars based on the applicable exchange rate at the end of the period. The Funds do not isolate that portion of the results of operations resulting from changes in the currency exchange rate from the fluctuations resulting from changes in the market prices of investments.
| f). | Use of Estimates – The preparation of financial statements in conformity with GAAP requires management to make estimates and assumptions that affect the reported amounts of assets and liabilities and disclosure of contingent assets and liabilities at the date of the financial statements and the reported change in net assets during the reporting period. Actual results could differ from those estimates. |
| g). | Share Valuation – The net asset value (“NAV”) per share of each Fund is calculated by dividing the sum of the value of the securities held, plus cash or other assets, minus all liabilities (including estimated accrued expenses) |
| HENNESSY FUNDS | 1-800-966-4354 |
by the total number of shares outstanding, rounded to the nearest cent. The Funds’ shares will not be priced on the days on which the New York Stock Exchange is closed for trading. The offering and redemption price per share for each Fund is equal to each Fund’s net asset value per share. The Japan Fund and Japan Smaller Companies Funds charged a 2.00% redemption fee on shares held less than 60 days through January 29, 2010. These fees were retained by each Fund and treated as additional paid-in-capital and allocated to each respective class of shares (if applicable).
| h). | Foreign Currency – Values of investments denominated in foreign currencies are converted into U.S. dollars using the spot market rate of exchange at the time of valuation. Purchases and sales of investments and income are translated into U.S. dollars using the spot market rate of exchange prevailing on the respective dates of such transactions. The effect of changes in foreign exchange rates on realized and unrealized security gains and losses is reflected as a component of such gains or losses. Foreign investments present additional risks due to currency fluctuations, economic and political factors, lower liquidity, government regulations, differences in accounting standards and other factors. |
| i). | Forward Contracts – The Funds may enter into forward currency contracts to reduce their exposure to changes in foreign currency exchange rates on their foreign holdings and to lock in the U.S. dollar cost of firm purchase and sale commitments for securities denominated in foreign currencies. A forward currency contract is a commitment to purchase or sell a foreign currency at a future date at a negotiated forward rate. The gain or loss arising from the difference between the U.S. dollar cost of the original contract and the value of the foreign currency in U.S. dollars upon closing of such contract is included in net realized gain or loss from foreign currency transactions. During the year ended October 31, 2011, the Funds did not enter into any forward contracts. |
| j). | Repurchase Agreements – The Funds may enter into repurchase agreements with member banks or security dealers of the Federal Reserve whom the investment advisor deems creditworthy. The repurchase price generally equals the price paid by the Fund plus interest negotiated on the basis of current short-term rates. |
Securities pledged as collateral for repurchase agreements are held by the custodian bank until the respective agreements mature. Provisions of the repurchase agreements ensure that the market value of the collateral, including accrued interest thereon, is sufficient, in the event of default of the counterparty. If the counterparty defaults and the value of the collateral declines or if the counterparty enters an insolvency proceeding, realization of the collateral by the Fund may be delayed or limited.
| k). | Accounting for Uncertainty in Income Taxes – The Funds have adopted financial reporting rules regarding recognition and measurement of tax positions taken or expected to be taken on a tax return. The Funds have reviewed all open tax years and major jurisdictions and concluded that there is no impact on the Funds’ net assets and no tax liability resulting from unrecognized tax benefits relating to uncertain income tax positions taken or expected to be taken on a tax return. As of October 31, 2011, |
WWW.HENNESSYFUNDS.COM
open Federal and state tax years for the Large Value Fund include the tax year ended September 30, 2009, the tax period ended October 31, 2009 and the tax years ended October 31, 2010 and October 31, 2011. As of October 31, 2011, open Federal and state tax years for the Japan Fund and Japan Smaller Companies Fund include the tax years ended October 31, 2009 through 2011.
| l). | Derivatives – The Funds may invest in, or enter into, derivatives, such as options, futures contracts, options on futures contracts and swaps, for a variety of reasons, including to hedge certain risks, to provide a substitute for purchasing or selling particular securities or to increase potential income gain. Derivatives may provide a cheaper, quicker or more specifically focused way for a Fund to invest than “traditional” securities would. The main purpose of utilizing these derivative instruments is for hedging purposes. |
The Funds have adopted the financial accounting reporting rules as required by the Derivatives and Hedging Topic of the FASB Accounting Standards Codification (“FASB ASC”). The Funds are required to include enhanced disclosure that enables investors to understand how and why an entity uses derivatives, how derivatives are accounted for, and how derivatives instruments affect any entity’s results of operations and financial position. During the year ended October 31, 2011, the Funds did not hold any derivative instruments.
| m). | Events Subsequent to the Fiscal Period End – The Funds have adopted financial reporting rules regarding subsequent events which requires an entity to recognize in the financial statements the effects of all subsequent events that provide additional evidence about conditions that existed at the date of the balance sheet. Management has evaluated the Funds’ related events and transactions that occurred subsequent to October 31, 2011, through the date of issuance of the Funds’ financial statements. There were no events or transactions that occurred during this period that materially impacted the amounts or disclosures in the Funds’ financial statements. |
| n). | New Accounting Pronouncement – In May 2011, the Financial Accounting Standards Board (“FASB”) issued ASU No. 2011-04 “Amendments to Achieve Common Fair Value Measurement and Disclosure Requirements” in GAAP and the International Financial Reporting Standards (“IFRSs”). ASU No. 2011-04 amends FASB ASC Topic 820, Fair Value Measurements and Disclosures, to establish common requirements for measuring fair value and for disclosing information about fair value measurements in accordance with GAAP and IFRSs. ASU No. 2011-04 is effective for fiscal years beginning after December 15, 2011 and for interim periods within those fiscal years. Management is currently evaluating the impact of these amendments and does not believe they will have a material impact on the Funds’ financial statements. |
The Funds have adopted authoritative fair valuation accounting standards which establish an authoritative definition of fair value and set out a hierarchy for measuring fair value. These standards require additional disclosures about the
| HENNESSY FUNDS | 1-800-966-4354 |
various inputs and valuation techniques used to develop the measurements of fair value and a discussion in changes in valuation techniques and related inputs during the period. These inputs are summarized in the three broad levels listed below:
| | Level 1 – | Quoted unadjusted prices for identical instruments in active markets to which the Fund has access at the date of measurement. |
| | | |
| | Level 2 – | Quoted prices for similar instruments in active markets; quoted prices for identical or similar instruments in markets that are not active; and model-derived valuations in which all significant inputs and significant value drivers are observable in active markets. Level 2 inputs are those in markets for which there are few transactions, the prices are not current, the prices are fair value adjusted due to post market close subsequent events (foreign markets), little public information exists or instances where prices vary substantially over time or among brokered market makers. |
| | | |
| | Level 3 – | Model-derived valuations in which one or more significant inputs or significant value drivers are unobservable. Unobservable inputs are those inputs that reflect the Funds’ own assumptions that market participant’s would use to price the asset or liability based on the best available information. |
Following is a description of the valuation techniques applied to the Funds’ major categories of assets and liabilities measured at fair value on a recurring basis.
Equity Securities – Equity securities, including common stocks, preferred stocks, foreign issued common stocks, exchange traded funds, closed-end mutual funds and real estate investment trusts, which are traded on a securities exchange for which a last-quoted sales price is readily available will be valued at the last sales price as reported by the primary exchange on which the securities are listed. Securities listed on the Nasdaq National Market System (“Nasdaq”) will be valued at the Nasdaq Official Closing Price, which may differ from the last sales price reported. Securities traded on a securities exchange for which a last-quoted sales price is not readily available will be valued at the mean between the bid and ask prices. To the extent these securities are actively traded and valuation adjustments are not applied, they are categorized in Level 1 of the fair value hierarchy.
Mutual Funds – Investments in mutual funds are generally priced at the ending net asset value (NAV) provided by the service agent of the Funds and will be classified as Level 1 securities.
The Board of Trustees of the Funds has adopted fair value pricing procedures that are followed when a price for a security is not readily available or if a significant event has occurred that indicates the closing price of a security no longer represents the true value of that security. Fair value pricing determinations are made in good faith in accordance with these procedures. There are numerous criteria that will be given consideration in determining a fair value of a security. Some of these criteria are: trading volume of security and markets, value of other like securities and news events with direct bearing to
WWW.HENNESSYFUNDS.COM
security or market. Fair value pricing results in an estimated price that reasonably reflects the current market conditions in order to rate the portfolio holdings such that shareholder transactions receive a fair net asset value.
Fair valuing of foreign securities may be determined with the assistance of a pricing service using correlations between the movement of prices of such securities and indices of domestic securities and other appropriate indicators, such as closing market prices of relevant American Depositary Receipts or futures contracts. The effect of using fair value pricing is that the Funds’ NAV will reflect the affected portfolio securities’ value as determined in the judgment of the Board of Trustees or its designee instead of being determined by the market. Using a fair value pricing methodology to price securities may result in a value that is different from a security’s most recent closing price and from the prices used by other investment companies to calculate their net asset values and are considered Level 2 prices in the fair valuation hierarchy. Because the Funds invest in foreign securities, the value of the Funds’ portfolio securities may change on days when investors will not be able to purchase or redeem your shares. Depending on the relative significance of the valuation inputs, these securities may be classified in either Level 2 or Level 3 of the fair value hierarchy.
Short-Term Securities – Short-term equity investments, including money market funds are valued in the manner specified above. Short-term debt investments are valued at amortized cost, if their original maturity was 60 days or less, or by amortizing the values as of the 61st day prior to maturity, if their original term to maturity exceeded 60 days. Short-term securities are generally in Level 1 or Level 2 of the fair valued hierarchy depending on the inputs used and market activity levels for specific securities.
The Funds have performed an analysis of all existing investments to determine the significance and character of all inputs to their fair value determination. Various inputs are used in determining the value of each Fund’s investments. The inputs or methodology used for valuing securities are not necessarily an indication of the risk associated with investing in those securities. Details related to the fair valuation hierarchy of the Funds’ securities as of October 31, 2011 are included with each Fund’s Schedule of Investments.
| 4). | INVESTMENT TRANSACTIONS |
Purchases and sales of investment securities (excluding government and short-term investments) during the following fiscal periods were as follows:
| | | | Purchases | | | Sales | |
| | Large Value Fund | | $ | 197,150,032 | | | $ | 210,077,997 | |
| | Japan Fund | | $ | 49,251,276 | | | $ | 67,598,254 | |
| | Japan Smaller Companies Fund | | $ | 21,965,464 | | | $ | 14,081,064 | |
There were no purchases or sales/maturities of long term U.S. Government securities in the Funds during the year ended October 31, 2011.
| 5). | INVESTMENT MANAGEMENT FEE AND OTHER TRANSACTIONS WITH AFFILIATES |
Hennessy Advisors, Inc. (the “Advisor”) is the advisor of the Funds. The Advisor provides the Funds with investment management services under an Investment Advisory Agreement. The Advisor furnishes all investment advice, office space, facilities, and provides most of the personnel needed by the Funds. As
| HENNESSY FUNDS | 1-800-966-4354 |
compensation for its services, the Advisor is entitled to a monthly fee from each Fund. The fee is based upon the average daily net assets of the Funds at the annual rate of:
| Large Value Fund | 0.85% |
| Japan Fund | 1.00% |
| Japan Smaller Companies Fund | 1.20% |
The Advisor has delegated the day to day management of the Large Value Fund to a Sub-Advisor, RBC Global Asset Management (U.S.), Inc. (“RBC”). The Advisor has delegated the day to day management of the Japan and Japan Smaller Companies Funds to a Sub-Advisor, SPARX Asset Management Co. Ltd. (“SPARX”). The Advisor pays the Sub-Advisor fees for each of the Funds from its own assets and these fees are not an additional expense of the Funds.
The Advisor has agreed to absorb expenses to the extent that the total annual operating expenses (excluding all Federal, state and local taxes, interest, brokerage commissions, acquired fund fees and expenses and other costs incurred in connection with the purchase and sale of securities and extraordinary items) do not exceed 0.98% of the Large Value Fund’s net assets for the Institutional Class shares. The expense limitation agreement for the Institutional Class shares of the Large Value Fund can only be terminated by the Board of Trustees. For a period of three years after the year in which the Advisor waives or reimburses expenses, the Advisor may seek reimbursement from the Fund to the extent that total annual fund operating expenses are less than the expense limitation in effect at the time of the waiver or reimbursement. The Advisor did not reimburse any expenses during the year ended October 31, 2011.
The Advisor previously contractually agreed to limit the expenses of certain Funds. These agreements have since either expired or have been terminated by the Board of Trustees. However, for a period of three years after the year in which the Advisor waives or reimburses expenses, the Advisor may seek reimbursement from the Fund to the extent that total annual fund operating expenses are less than the expense limitation in effect at the time of the waiver or reimbursement. As of October 31, 2011, cumulative expenses subject to potential recovery to the aforementioned conditions and their year of expiration are as follows:
| | | | Oct. 31, 2012 | | | Oct. 31, 2013 | | | Oct. 31, 2014 | | | Total | |
| | Large Value Fund – Orig. Class | | $ | 7,641 | | | $ | 38,444 | | | $ | — | | | $ | 46,085 | |
| | Large Value Fund – Inst. Class | | $ | 6 | | | $ | — | | | $ | — | | | $ | 6 | |
| | Japan Fund – Orig. Class | | $ | — | | | $ | 37,425 | | | $ | — | | | $ | 37,425 | |
| | Japan Fund – Inst. Class | | $ | — | | | $ | 12,915 | | | $ | — | | | $ | 12,915 | |
| | Japan Smaller Companies | | | | | | | | | | | | | | | | |
| | Fund – Orig. Class | | $ | — | | | $ | 19,527 | | | $ | — | | | $ | 19,527 | |
The Board of Trustees has approved a Shareholder Servicing Plan for the Original Class shares of the Funds which was instituted to compensate the Advisor for the non-investment management services it provides to the Fund. The Plan provides for a monthly fee paid to the Advisor at an annual rate of 0.10% of the average daily net assets of the Original Class shares of the Funds.
WWW.HENNESSYFUNDS.COM
The Funds have entered into agreements with various brokers, dealers and financial intermediaries in connection with the sale of shares of the Funds. The agreements provide for periodic payments by the Funds to the brokers, dealers and financial intermediaries for providing certain shareholder maintenance services (sub-transfer agent expenses). These shareholder services include: the pre-processing and quality control of new accounts, shareholder correspondence, answering customer inquiries regarding account status and facilitating shareholder telephone transactions. Fees paid by the Large Value, Japan and Japan Smaller Companies Funds to various brokers, dealers and financial intermediaries for the year ended October 31, 2011, were $102,973, $42,294, and $43,767, respectively.
U.S. Bancorp Fund Services, LLC (the “Administrator”) acts as the Funds’ administrator under an Administration Agreement. Administrative services under this agreement include custody, distribution, fund accounting, fund administration and transfer agent services. In addition, the Administrator prepares various federal and state regulatory filings, reports and returns for the Fund; prepares reports and materials to be supplied to the directors; monitors the activities of the Funds’ custodian, transfer agent and accountants; coordinates the preparation and payment of the Funds’ expenses and reviews the Funds’ expense accruals. Fees paid to U.S. Bancorp Fund Services, LLC for the year ended October 31, 2011, were $338,965, $79,189 and $61,663, for the Large Value, Japan and Japan Smaller Companies Funds, respectively. The Administrator has voluntarily waived all or a portion of its administration fees allocated to the Institutional Class shares of the Large Value Fund. The administration fees voluntarily waived by the Administrator during the year ended October 31, 2011 were $92.
Quasar Distributors, LLC (“Quasar”) acts as the Funds’ principal underwriter in a continuous public offering of the Funds’ shares. Quasar is an affiliated company of U.S. Bank, N.A.
The SPARX Japan and SPARX Japan Smaller Companies Funds have $22,000,000 and $3,000,000 lines of credit, respectively, intended to provide short-term financing, if necessary, subject to certain restrictions, in connection with shareholder redemptions. The credit facility is with its custodian bank, U.S. Bank, N.A. Borrowings under this arrangement bear interest at the bank’s prime rate. During the year ended October 31, 2011, the SPARX Japan Fund had an outstanding average daily balance and a weighted average interest rate of $316,077 and 3.25%, respectively. The maximum amount outstanding for the SPARX Japan Fund during the period was $15,000,000. During the year ended October 31, 2011, the SPARX Japan Smaller Companies Fund had no line of credit activity.
| HENNESSY FUNDS | 1-800-966-4354 |
| 7). | FEDERAL TAX INFORMATION |
The following balances for the Funds are as of October 31, 2011, the Funds’ most recent fiscal year end:
| | | | | | | | | Japan | |
| | | Large | | | | | | Smaller | |
| | | Value | | | Japan | | | Companies | |
| | | Fund | | | Fund | | | Fund | |
| Cost of investments for tax purposes | | $ | 112,973,309 | | | $ | 23,377,605 | | | $ | 23,659,233 | |
| Gross tax unrealized appreciation | | | 14,651,304 | | | | 2,404,887 | | | | 2,120,467 | |
| Gross tax unrealized depreciation | | | (3,855,248 | ) | | | (1,630,590 | ) | | | (1,891,048 | ) |
| Net tax unrealized appreciation | | | | | | | | | | | | |
| (depreciation) on investments | | $ | 10,796,057 | | | $ | 774,296 | | | $ | 229,419 | |
| Undistributed ordinary income | | $ | 634,102 | | | $ | — | | | $ | 99,101 | |
| Undistributed long-term capital gains | | | — | | | | — | | | | — | |
| Total distributable earnings | | $ | 634,102 | | | $ | — | | | $ | 99,101 | |
| Other accumulated gains (losses) | | $ | (39,215,361 | ) | | $ | (32,593,981 | ) | | $ | (697,828 | ) |
| Total accumulated earnings (losses) | | $ | (27,785,202 | ) | | $ | (31,819,685 | ) | | $ | (369,308 | ) |
At October 31, 2011, the Large Value Fund had tax basis capital losses of $39,195,490, to offset future capital gains. Of such losses, $8,250,940 expire October 31, 2016 and $30,944,550 expire on October 31, 2017.
At October 31, 2011, the Japan Fund had tax basis capital losses of $32,589,964, to offset future capital gains. Of such losses, $4,786,618 expire October 31, 2015, $6,231,544 expire on October 31, 2016, $15,450,664 expire October 31, 2017 and $6,121,138 expire October 31, 2018.
At October 31, 2011, the Japan Smaller Companies Fund had tax basis capital losses of $694,391, to offset future capital gains. The losses expire on October 31, 2017.
The tax character of distributions paid during 2011 and 2010 for the Funds were as follows:
| | | | Year Ended | | | Year Ended | |
| | Large Value Fund | | October 31, 2011 | | | October 31, 2010 | |
| | Ordinary income | | $ | 1,292,183 | | | $ | 1,608,137 | |
| | Long-term capital gain | | | — | | | | — | |
| | | | $ | 1,292,183 | | | $ | 1,608,137 | |
| | | | | | | | |
| | | | Year Ended | | | Year Ended | |
| | Japan Fund | | October 31, 2011 | | | October 31, 2010 | |
| | Ordinary income | | $ | — | | | $ | 53,363 | |
| | Long-term capital gain | | | — | | | | — | |
| | Return of capital | | | — | | | | 50,003 | |
| | | | $ | — | | | $ | 103,366 | |
WWW.HENNESSYFUNDS.COM
| | | | Year Ended | | | Year Ended | |
| | Japan Smaller Companies Fund | | October 31, 2011 | | | October 31, 2010 | |
| | Ordinary income | | $ | — | | | $ | 675,389 | |
| | Long-term capital gain | | | — | | | | — | |
| | | | $ | — | | | $ | 675,389 | |
| 8). | THE REGULATED INVESTMENT COMPANY MODERNIZATION ACT |
On December 22, 2010, The Regulated Investment Company Modernization Act of 2010 (“Modernization Act”) was signed into law. In general, the provisions of the Modernization Act will be effective for the Funds’ fiscal year ending October 31, 2012. Under the Modernization Act, new capital losses may now be carried forward indefinitely, and retain the character of the original loss. However, any losses incurred during those future taxable years will be required to be utilized prior to the losses incurred in the pre-enactment taxable years. As a result of this ordering rule, pre-enactment capital loss carryforwards may be more likely to expire unused. Under pre-enactment law, capital losses could be carried forward for eight years, and carried forward as short-term capital losses, irrespective of the character of the original loss. Relevant information regarding the impact of the Modernization Act on the Funds will be disclosed in the Federal Tax Information section of the financial statement notes in the Funds’ Annual Report for the fiscal year ending October 31, 2012.
| HENNESSY FUNDS | 1-800-966-4354 |
(This Page Intentionally Left Blank.)
WWW.HENNESSYFUNDS.COM
Report of Independent Registered Public Accounting Firm
The Shareholders and Board of Trustees of
Hennessy Funds Trust and Hennessy SPARX Funds Trust:
We have audited the accompanying statements of assets and liabilities of the Hennessy Select Large Value Fund, Hennessy Select SPARX Japan Fund and Hennessy Select SPARX Japan Smaller Companies Fund, including the schedules of investments, as of October 31, 2011, and the related statements of operations for the year then ended, and the statements of changes in net assets for the two year period then ended, and the financial highlights for each of the periods presented in the three-year period then ended (years ended October 31, 2011 and October 31, 2010, month ended October 31, 2009 and year ended September 30, 2009 for Hennessy Select Large Value Fund). These financial statements and financial highlights are the responsibility of management. Our responsibility is to express an opinion on these financial statements and financial highlights based on our audits. The financial highlights for the periods presented through September 30, 2008 of the Hennessy Select Large Value Fund were audited by other auditors whose report dated November 26, 2008 expressed an unqualified opinion on those financial highlights. The financial highlights for the periods presented through October 31, 2008 of the Hennessy Select SPARX Japan Fund and Hennessy Select SPARX Japan Smaller Companies Fund were audited by other auditors whose report dated December 10, 2008 expressed an unqualified opinion on those financial highlights.
We conducted our audits in accordance with the standards of the Public Company Accounting Oversight Board (United States). Those standards require that we plan and perform the audit to obtain reasonable assurance about whether the financial statements and financial highlights are free of material misstatement. An audit includes examining, on a test basis, evidence supporting the amounts and disclosures in the financial statements. Our procedures included confirmation of securities owned as of October 31, 2011 by correspondence with the custodian and brokers or by other appropriate auditing procedures. An audit also includes assessing the accounting principles used and significant estimates made by management, as well as evaluating the overall financial statement presentation. We believe that our audits provide a reasonable basis for our opinion.
In our opinion, the financial statements and financial highlights referred to above present fairly, in all material respects, the financial position of Hennessy Select Large Value Fund, Hennessy Select SPARX Japan Fund and Hennessy Select SPARX Japan Smaller Companies Fund as of October 31, 2011, and the results of their operations, the changes in their net assets and the financial highlights for each of the periods described in the first paragraph above, in conformity with U.S. generally accepted accounting principles.
Milwaukee, Wisconsin
December 22, 2011
| HENNESSY FUNDS | 1-800-966-4354 |
Trustees and Officers of the Funds (Unaudited)
The business and affairs of the Funds are managed under the direction of the Funds’ Board of Trustees. Information pertaining to the Trustees and Officers of the Funds is set forth below. The Funds’ Statement of Additional Information includes additional information about the Funds’ Trustees and Officers and is available, without charge, upon request by calling 1-800-966-4354.
| | Position(s) | Term of Office |
| | Held with | and Length of |
| Name, Age and Address | the Funds | Time Served |
| “Disinterested Persons” | | |
| J. Dennis DeSousa | Trustee | Indefinite, until |
| Age: 75 | | successor elected |
| Address: | | |
| c/o Hennessy Advisors, Inc. | | HFT: Served since July 2005 |
| 7250 Redwood Blvd. | | HSFT: Served since September 2009 |
| Suite 200 | | |
| Novato, CA 94945 | | |
| | | |
| Robert T. Doyle | Trustee | Indefinite, until |
| Age: 64 | | successor elected |
| Address: | | |
| c/o Hennessy Advisors, Inc. | | HFT: Served since July 2005 |
| 7250 Redwood Blvd. | | HSFT: Served since September 2009 |
| Suite 200 | | |
| Novato, CA 94945 | | |
| | | |
| Gerald P. Richardson | Trustee | Indefinite, until |
| Age: 66 | | successor elected |
| Address: | | |
| c/o Hennessy Advisors, Inc. | | HFT: Served since July 2005 |
| 7250 Redwood Blvd. | | HSFT: Served since September 2009 |
| Suite 200 | | |
| Novato, CA 94945 | | |
| | | |
| “Interested Persons” (as defined in the 1940 Act) | | |
Neil J. Hennessy(1) | Trustee, | Director/Trustee: |
| Age: 55 | President, | Indefinite, until |
| Address: | and Chairman | successor elected |
| c/o Hennessy Advisors, Inc. | of the Board | |
| 7250 Redwood Blvd. | | HFT: Served since July 2005 |
| Suite 200 | | HSFT: Served since September 2009 |
| Novato, CA 94945 | | |
| | | Officer (Chairman of the Board): |
| | | 1 year term |
| | | |
| | | HFT: Served since June 2008 |
| | | HSFT: Served since September 2009 |
Key:
| HFT = Hennessy Funds Trust | HMFI = Hennessy Mutual Funds, Inc. |
| HSFT = Hennessy SPARX Funds Trust | HFI = Hennessy Funds, Inc. |
WWW.HENNESSYFUNDS.COM
| | Number of Portfolios | |
| Principal Occupation(s) | in the Fund Complex | Other Directorships |
| During Past 5 Years | Overseen by Trustee | Held by Trustee |
| | | �� |
| Mr. DeSousa is a real estate investor. | 9 | HMFI |
| | | HFI |
| | | |
| | | |
| | | |
| | | |
| | | |
| | | |
| Mr. Doyle has been the Sheriff of Marin | 9 | HMFI |
| County, California since 1996. | | HFI |
| | | |
| | | |
| | | |
| | | |
| | | |
| | | |
| Mr. Richardson is an independent | 9 | HMFI |
| consultant in the securities industries. | | HFI |
| | | |
| | | |
| | | |
| | | |
| | | |
| | | |
| | | |
| Mr. Hennessy has been employed by | 9 | HMFI, HFI |
| Hennessy Advisors, Inc. the Funds’ | | Director of Hennessy |
| investment advisor, since 1989. He currently | | Advisors, Inc. |
| serves as President, Chairman, CEO, Portfolio | | |
| Manager and CIO of Hennessy Advisors, Inc. | | |
| HENNESSY FUNDS | 1-800-966-4354 |
| | Position(s) | Term of Office |
| | Held with | and Length of |
| Name, Age and Address | the Funds | Time Served |
Joseph T. Fahy(1) | Chief Compliance | 1 year term |
| Age: 33 | Officer | |
| Address: | | HFT: Since June 2010 |
| c/o Hennessy Advisors, Inc. | | HSFT: Since June 2010 |
| 7250 Redwood Blvd. | | |
| Suite 200 | | |
| Novato, CA 94945 | | |
| | | |
Teresa M. Nilsen(1) | Executive Vice | 1 year term |
| Age: 45 | President and | |
| Address: | Treasurer | HFT: Since July 2005 |
| c/o Hennessy Advisors, Inc. | | HSFT: Since September 2009 |
| 7250 Redwood Blvd. | | |
| Suite 200 | | |
| Novato, CA 94945 | | |
| | | |
Daniel B. Steadman(1) | Executive Vice | 1 year term |
| Age: 55 | President and | |
| Address: | Secretary | HFT: Since July 2005 |
| c/o Hennessy Advisors, Inc. | | HSFT: Since September 2009 |
| 7250 Redwood Blvd. | | |
| Suite 200 | | |
| Novato, CA 94945 | | |
WWW.HENNESSYFUNDS.COM
| | Number of Portfolios | |
| Principal Occupation(s) | in the Fund Complex | Other Directorships |
| During Past 5 Years | Overseen by Trustee | Held by Trustee |
| Mr. Fahy has been employed by Hennessy | N/A | None. |
| Advisors, Inc. the Funds’ investment | | |
| advisor, since 2005. | | |
| | | |
| | | |
| | | |
| | | |
| | | |
| Ms. Nilsen has been employed by Hennessy | N/A | Director of Hennessy |
| Advisors, Inc., the Funds’ investment advisor, | | Advisors, Inc. |
| since 1989. She currently serves as Executive | | |
| Vice President, Chief Operations Officer, | | |
| Chief Financial Officer and Secretary of | | |
| Hennessy Advisors, Inc. | | |
| | | |
| | | |
| Mr. Steadman has been employed by | N/A | Director of Hennessy |
| Hennessy Advisors, Inc., the Funds’ | | Advisors, Inc. |
| investment advisor, since 2000. He currently | | |
| serves as Executive Vice President and Chief | | |
| Compliance Officer of Hennessy Advisors, Inc. | | |
| HENNESSY FUNDS | 1-800-966-4354 |
| | Position(s) | Term of Office |
| | Held with | and Length of |
| Name, Age and Address | the Funds | Time Served |
Tania A. Kelley(1) | Vice President | 1 year term |
| Age: 46 | of Marketing | |
| Address: | | HFT: Since July 2005 |
| c/o Hennessy Advisors, Inc. | | HSFT: Since September 2009 |
| 7250 Redwood Blvd. | | |
| Suite 200 | | |
| Novato, CA 94945 | | |
| | | |
Ana Miner(1) | Vice President | 1 year term |
| Age: 53 | of Operations | |
| Address: | | HFT: Since July 2005 |
| c/o Hennessy Advisors, Inc. | | HSFT: Since September 2009 |
| 7250 Redwood Blvd. | | |
| Suite 200 | | |
| Novato, CA 94945 | | |
| | | |
Brian Peery(1) | Co-Portfolio | Officer (Vice President): |
| Age: 42 | Manager and | 1 year term |
| Address: | Vice President | |
| c/o Hennessy Advisors, Inc. | | HFT: Since July 2005 |
| 7250 Redwood Blvd. | | HSFT: Since September 2009 |
| Suite 200 | | |
| Novato, CA 94945 | | |
__________
(1) | All officers of the Hennessy Funds and employees of the Advisor are Interested Persons of the Hennessy Funds. |
WWW.HENNESSYFUNDS.COM
| | Number of Portfolios | |
| Principal Occupation(s) | in the Fund Complex | Other Directorships |
| During Past 5 Years | Overseen by Trustee | Held by Trustee |
| Ms. Kelley has been employed by | N/A | None. |
| Hennessy Advisors, Inc., the Funds’ | | |
| investment advisor, since 2003. | | |
| | | |
| | | |
| | | |
| | | |
| | | |
| Ms. Miner has been employed by | N/A | None. |
| Hennessy Advisors, Inc., the Funds’ | | |
| investment advisor, since 1998. | | |
| | | |
| | | |
| | | |
| | | |
| | | |
| Mr. Peery has been employed by | N/A | None. |
| Hennessy Advisors, Inc., the Funds’ | | |
| investment advisor, since 2002. | | |
| HENNESSY FUNDS | 1-800-966-4354 |
Expense Example (Unaudited)
October 31, 2011
As a shareholder of the Funds, you incur two types of costs: (1) transaction costs, including sales charges (loads) on purchase payments, reinvested dividends, or other distributions; redemption fees; and exchange fees; and (2) ongoing costs, including management fees; service fees; and other Fund expenses. This Example is intended to help you understand your ongoing costs (in dollars) of investing in each of the Funds and to compare these costs with the ongoing costs of investing in other mutual funds. The Example is based on an investment of $1,000 invested at the beginning of the period and held for the entire period from May 1, 2011 through October 31, 2011.
Actual Expenses
The first set of lines of the table below provide information about actual account values and actual expenses. Although the Funds charge no sales loads or transaction fees, you will be assessed fees for outgoing wire transfers, returned checks and stop payment orders at prevailing rates charged by U.S. Bancorp Fund Services, LLC, the Funds’ transfer agent. If you request that a redemption be made by wire transfer, currently a $15.00 fee is charged by the Funds’ transfer agent. IRA accounts will be charged a $15.00 annual maintenance fee (not to exceed $30 per social security number). The example below includes, but is not limited to, management fees, shareholder servicing fees, fund accounting, custody and transfer agent fees. However, the example below does not include portfolio trading commissions and related expenses, interest expense or dividends on short positions taken by the Fund and other extraordinary expenses as determined under generally accepted accounting principles. You may use the information within these lines, together with the amount you invested, to estimate the expenses that you paid over the six-month period. Simply divide your account value by $1,000 (for example, an $8,600 account value divided by $1,000 = 8.6), then multiply the result by the number in the first line under the heading entitled “Expenses Paid During Period” to estimate the expenses you paid on your account during this period.
Hypothetical Example for Comparison Purposes
The second set of lines within the table below provide information about hypothetical account values and hypothetical expenses based on the Funds’ actual expense ratios and an assumed rate of return of 5% per year before expenses, which is not the Funds’ actual return. The hypothetical account values and expenses may not be used to estimate the actual ending account balance or expenses you paid for the period. You may use this information to compare the ongoing costs of investing in the Funds and other funds. To do so, compare this 5% hypothetical example with the 5% hypothetical examples that appear in the shareholder reports of the other funds. Please note that the expenses shown in the table are meant to highlight your ongoing costs only and do not reflect any transactional costs, such as sales charges (loads), or exchange fees. Therefore, the second line of the table is useful in comparing ongoing costs only, and will not help you determine the relative total costs of owning different funds. In addition, if these transactional costs were included, your costs would have been higher.
WWW.HENNESSYFUNDS.COM
| | | Beginning | | | Ending | | | Expenses Paid | |
| | | Account Value | | | Account Value | | | During Period(1) | |
| Original Class | | 5/1/11 | | | 10/31/11 | | | 5/1/11 – 10/31/11 | |
| | | | | | | | | | |
| Actual | | | | | | | | | |
| Large Value Fund – Original Class | | $ | 1,000.00 | | | $ | 909.70 | | | $ | 6.64 | |
| Japan Fund – Original Class | | $ | 1,000.00 | | | $ | 942.70 | | | $ | 8.67 | |
| Japan Smaller Companies | | | | | | | | | | | | |
| Fund – Original Class | | $ | 1,000.00 | | | $ | 955.50 | | | $ | 10.30 | |
| Hypothetical (5% return | | | | | | | | | | | | |
| before expenses) | | | | | | | | | | | | |
| Large Value Fund – Original Class | | $ | 1,000.00 | | | $ | 1,018.25 | | | $ | 7.02 | |
| Japan Fund – Original Class | | $ | 1,000.00 | | | $ | 1,016.28 | | | $ | 9.00 | |
| Japan Smaller Companies | | | | | | | | | | | | |
| Fund – Original Class | | $ | 1,000.00 | | | $ | 1,014.67 | | | $ | 10.61 | |
| (1) | Expenses are equal to the Large Value Fund’s expense ratio of 1.38%, the Japan Fund’s expense ratio of 1.77%, and the Smaller Companies Fund’s expense ratio of 2.09%, multiplied by the average account value over the period, multiplied by 184/365 days (to reflect one-half year period.) |
| | | Beginning | | | Ending | | | Expenses Paid | |
| | | Account Value | | | Account Value | | | During Period(2) | |
| Institutional Class | | 5/1/11 | | | 10/31/11 | | | 5/1/11 – 10/31/11 | |
| | | | | | | | | | |
| Actual | | | | | | | | | |
| Large Value Fund – Institutional Class | | $ | 1,000.00 | | | $ | 911.20 | | | $ | 4.72 | |
| Japan Fund – Institutional Class | | $ | 1,000.00 | | | $ | 943.90 | | | $ | 7.59 | |
| Hypothetical (5% return | | | | | | | | | | | | |
| before expenses) | | | | | | | | | | | | |
| Large Value Fund – Institutional Class | | $ | 1,000.00 | | | $ | 1,020.27 | | | $ | 4.99 | |
| Japan Fund – Institutional Class | | $ | 1,000.00 | | | $ | 1,017.39 | | | $ | 7.88 | |
| (2) | Expenses are equal to the Large Value Fund’s expense ratio of 0.98%, and the Japan Fund’s expense ratio of 1.55%, multiplied by the average account value over the period, multiplied by 184/365 days (to reflect one-half year period.) |
| HENNESSY FUNDS | 1-800-966-4354 |
How to Obtain a Copy of the Funds’ Proxy Voting Policy and Proxy Voting Records
A description of the policies and procedures that the Funds use to determine how to vote proxies relating to portfolio securities is available without charge: (1) by calling 1-800-966-4354; (2) on the Hennessy Funds website at www.hennessyfunds.com; or (3) on the U.S. Securities and Exchange Commission’s website at www.sec.gov. Hennessy Funds’ proxy voting record is available on the SEC’s website at www.sec.gov no later than August 31 for the prior 12 months ending June 30.
Quarterly Filings on Form N-Q
The Funds file their complete schedule of portfolio holdings with the SEC for the first and third quarters of each fiscal year on Form N-Q. The Funds’ Form N-Q will be available on the SEC’s website at www.sec.gov. The Funds’ Form N-Q may be reviewed and copied at the SEC’s Public Reference Room in Washington, DC and information on the operation of the Public Reference Room may be obtained by calling 1-800-SEC-0330. Information included in the Funds’ N-Q will also be available upon request by calling 1-800-966-4354.
Federal Tax Distribution Information (Unaudited)
The Large Value, Japan and Japan Smaller Companies Funds designate 100%, 0% and 0%, respectively, of the dividends declared from net investment income during the year ended October 31, 2011, as qualified dividend income under the Jobs Growth and Tax Reconciliation Act of 2003.
For the year ended October 31, 2011, 100%, 0% and 0%, of the ordinary distributions paid by the Large Value, Japan and Japan Smaller Companies Funds qualify for the dividend received deduction available to corporate shareholders. All of the dividend income received by the Japan and Japan Smaller Companies Funds was from foreign investments which does not qualify for the dividend received deduction available to corporate shareholders.
For the year ended October 31, 2011, the Hennessy Select SPARX Japan Smaller Companies Fund earned foreign source income and paid foreign taxes which they intend to pass through to their shareholders pursuant to Section 853 of the Internal Revenue Code as follows:
| | | | Foreign Source Income | | | Foreign Taxes | |
| | | | Earned (per share) | | | Paid (per share) | |
| | Japan | | 0.246 | | | 0.017 | |
WWW.HENNESSYFUNDS.COM
Privacy Policy
We collect the following non-public personal information about you:
| | • | | information we receive from you on or in applications or other forms, correspondence, or conversations, including, but not limited to, your name, address, phone number, social security number, assets, income and date of birth; |
| | | | |
| | | | and |
| | | | |
| | • | | information about your transactions with us, our affiliates, or others, including, but not limited to, your account number and balance, payment history, parties to transactions, cost basis information and other financial information. |
We do not disclose any non-public personal information about our current or former shareholders to nonaffiliated third parties, except as permitted by law. For example, we are permitted by law to disclose all of the information we collect, as described above, to our Transfer Agent to process your transactions. Furthermore, we restrict access to your non-public personal information to those persons who require such information to provide products or services to you. We maintain physical, electronic and procedural safeguards that comply with federal standards to guard your non-public personal information.
In the event that you hold shares of the Fund through a financial intermediary, including, but not limited to, a broker-dealer, bank or trust company, the privacy policy of your financial intermediary would govern how your non-public personal information would be shared with nonaffiliated third parties.
| HENNESSY FUNDS | 1-800-966-4354 |
For information, questions
or assistance, please call
The Hennessy Funds
1-800-966-4354 or 1-415-899-1555
INVESTMENT ADVISOR
Hennessy Advisors, Inc.
7250 Redwood Blvd., Suite 200
Novato, California 94945
ADMINISTRATOR, TRANSFER
AGENT, DIVIDEND PAYING
AGENT & SHAREHOLDER
SERVICING AGENT
U.S. Bancorp Fund Services, LLC
P.O. Box 701
Milwaukee, Wisconsin 53201-0701
CUSTODIAN
U.S. Bank N.A.
Custody Operations
1555 North River Center Dr., Suite 302
Milwaukee, Wisconsin 53212
TRUSTEES
Neil J. Hennessy
Robert T. Doyle
J. Dennis DeSousa
Gerald P. Richardson
COUNSEL
Foley & Lardner LLP
777 East Wisconsin Avenue
Milwaukee, Wisconsin 53202-5306
INDEPENDENT REGISTERED
PUBLIC ACCOUNTING FIRM
KPMG LLP
777 East Wisconsin Avenue, 15th Floor
Milwaukee, Wisconsin 53202
DISTRIBUTOR
Quasar Distributors, LLC
615 East Michigan Street
Milwaukee, Wisconsin 53202
WWW.HENNESSYFUNDS.COM
This report has been prepared for shareholders and may be distributed to others only if preceded or accompanied by a current prospectus.
Item 12. Exhibits.
| (a) | (1) Any code of ethics or amendment thereto, that is the subject of the disclosure required by Item 2, to the extent that the registrant intends to satisfy Item 2 requirements through filing an exhibit. Filed herewith |
(2) A separate certification for each principal executive and principal financial officer pursuant to Section 302 of the Sarbanes-Oxley Act of 2002. Filed herewith.
(3) Any written solicitation to purchase securities under Rule 23c-1 under the Act sent or given during the period covered by the report by or on behalf of the registrant to 10 or more persons. Not applicable to open-end investment companies.
| (b) | Certifications pursuant to Section 906 of the Sarbanes-Oxley Act of 2002. Furnished herewith. |
SIGNATURES
Pursuant to the requirements of the Securities Exchange Act of 1934 and the Investment Company Act of 1940, the registrant has duly caused this report to be signed on its behalf by the undersigned, thereunto duly authorized.
(Registrant) Hennessy Funds Trust
By (Signature and Title)* /s/Neil J. Hennessy
Neil J. Hennessy, President
Pursuant to the requirements of the Securities Exchange Act of 1934 and the Investment Company Act of 1940, this report has been signed below by the following persons on behalf of the registrant and in the capacities and on the dates indicated.
By (Signature and Title)* /s/Neil J. Hennessy
Neil J. Hennessy, President
By (Signature and Title)* /s/Teresa M. Nilsen
Teresa M. Nilsen, Treasurer