UNITED STATES
SECURITIES AND EXCHANGE COMMISSION
Washington, D.C. 20549
FORM N-CSR
CERTIFIED SHAREHOLDER REPORT OF REGISTERED
MANAGEMENT INVESTMENT COMPANIES
Investment Company Act file number (811-07168)
Hennessy Funds Trust
(Exact name of registrant as specified in charter)
7250 Redwood Blvd., Suite 200
Novato, CA 94945
(Address of principal executive offices) (Zip code)
Neil J. Hennessy
Hennessy Advisors, Inc.
7250 Redwood Blvd., Suite 200
Novato, CA 94945
(Name and address of agent for service)
800-966-4354
Registrant's telephone number, including area code
Date of fiscal year end: October 31, 2010
Date of reporting period: October 31, 2010
Item 1. Reports to Stockholders.
HENNESSY FUNDS
ANNUAL REPORT
OCTOBER 31, 2010
Hennessy Cornerstone Growth Fund
Hennessy Cornerstone Growth Fund, Series II
Hennessy Focus 30 Fund
Hennessy Cornerstone Large Growth Fund
Hennessy Cornerstone Value Fund
Hennessy Total Return Fund
Hennessy Balanced Fund
Contents
| Letter to shareholders | 1 |
| Performance overview | |
| Hennessy Cornerstone Growth Fund | 4 |
| Hennessy Cornerstone Growth Fund, Series II | 6 |
| Hennessy Focus 30 Fund | 8 |
| Hennessy Cornerstone Large Growth Fund | 10 |
| Hennessy Cornerstone Value Fund | 12 |
| Hennessy Total Return Fund | 14 |
| Hennessy Balanced Fund | 15 |
| Financial statements | |
| Schedules of investments | |
| Hennessy Cornerstone Growth Fund | 17 |
| Hennessy Cornerstone Growth Fund, Series II | 22 |
| Hennessy Focus 30 Fund | 27 |
| Hennessy Cornerstone Large Growth Fund | 31 |
| Hennessy Cornerstone Value Fund | 36 |
| Hennessy Total Return Fund | 41 |
| Hennessy Balanced Fund | 45 |
| Statements of assets and liabilities | 50 |
| Statements of operations | 52 |
| Statements of changes in net assets | 54 |
| Statement of cash flows – Hennessy Total Return Fund | 65 |
| Financial highlights | |
| Hennessy Cornerstone Growth Fund | 66 |
| Hennessy Cornerstone Growth Fund, Series II | 70 |
| Hennessy Focus 30 Fund | 74 |
| Hennessy Cornerstone Large Growth Fund | 78 |
| Hennessy Cornerstone Value Fund | 82 |
| Hennessy Total Return Fund | 86 |
| Hennessy Balanced Fund | 88 |
| Notes to the financial statements | 91 |
| Report of Independent Registered Public Accounting Firm | 102 |
| Directors and Officers of the Funds | 104 |
| Expense example | 110 |
| Proxy voting policy | 112 |
| Quarterly Filings on Form N-Q | 112 |
| Federal Tax Distribution Information | 112 |
| Privacy Policy | 113 |
Dear Hennessy Funds Shareholder:
As I look back over the twelve-month period ended October 31, 2010, two themes emerge. First, the majority of individual investors have exhibited extremely low confidence in the financial markets. Throughout the year I talk to many of our clients, and some truly believe the markets are still in a free fall. What I hear that really troubles me are the following misconceptions about our economy:
• Despite the fact that the Dow Jones Industrial Average and S&P 500 Index each gained well over 20% in 2009 and are up approximately 8% year-to-date in 2010 (through 11/30/10), many people believe that the stock market has been down the past two years.
• American corporations are profitable, yet investors believe they are losing money.
• While 90% of Americans remain employed, people sense that everyone is losing their job.
Second, the crisis of confidence we experienced following the lows in 2009 and throughout this past year has now become a crisis of clarity. I believe we are in dire need of clarity on healthcare, taxes and regulation from our leaders in Washington for this recovery to gain momentum.
Right now, we are experiencing slow economic growth, home values continue to be unstable and unemployment is approaching multi-decade highs of 10% or more. Companies are continuing to slash costs, close unprofitable business lines, eliminate employees and hoard cash at record levels – there is $3.2 trillion in cash, in fact, among the S&P 500 companies alone. Why? I believe that the ambiguity coming from our government leaders has paralyzed American businesses, both large and small, leaving them few attractive options for deploying cash reserves.
As a business person, it feels as though every proposal coming out of Washington is focused on short-term political gain rather than on the long-term strength of our country and the economy. The rhetoric and lack of actionable direction out of Congress and the White House is having a devastating effect on our economy. The current environment has crippled businesses that need to feel confident that government is on their side.
For the twelve-month period ending October 31, 2010, the major U.S. indices returned approximately 17-18%. Small and mid-cap stocks
HENNESSY FUNDS 1-800-966-4354
significantly outperformed their large-cap brethren during the period. For the relatively small number of investors who did return to the equity market, I believe that there was a return to quality stocks, those that exhibit strong value and long term growth potential. While the markets have remained extremely volatile, I believe that the recession is firmly behind us and that the underlying economy is fundamentally sound.
What can we look forward to in the year ahead? Well, I know that for business to lead the U.S. to economic stability, we will need to have strong leadership from Washington. The Fed has shown its commitment and consistent policy to keep rates low. I am convinced that, with clarity from our government, companies will begin to gain confidence, begin to reinvest in their business models, begin to hire, and all of that will lead to an expanded economic recovery for the foreseeable future. If you look at the third calendar year of all the Presidential terms since 1950, the Dow Jones Industrial Average has returned on average 18% during those periods. While I am not sure we will hit that level in 2011, the third year of the Obama presidency, I do believe we may se e moderate growth in the range of 8-12%. If there are any major surprises, I think they may well be to the upside.
We maintain our focus on long-term investing and on building value for each of our shareholders. At Hennessy Funds, we serve our shareholders directly, so that we can provide answers to shareholder questions and concerns. Please don’t hesitate to contact us at 800-966-4354 if we can answer any questions or can be of service.
Best regards,
Neil J. Hennessy
Portfolio Manager & Chief Investment Officer
Past performance does not guarantee future results.
Mutual fund investing involves risk. Principal loss is possible.
Small and medium-capitalization companies tend to have limited liquidity and greater price volatility than large-capitalization companies. Investments in foreign securities involve greater volatility and political, economic and current risk and differences in accounting methods.
Opinions expressed are those of Neil Hennessy and are subject to change, are not guaranteed and should not be considered investment advice.
The Dow Jones Industrial Average and the S&P 500 are an unmanaged index of common stocks comprised of major industrial companies and assumes reinvestment of dividends. The Tokyo Stock Price Index (TOPIX) is a market capitalization-weighted index of all companies listed on the First Section of the Tokyo Stock Exchange. The Nikkei 225 is a stock market index for the Tokyo Stock Exchange (TSE). You cannot invest directly in an index.
(This Page Intentionally Left Blank.)
HENNESSY FUNDS 1-800-966-4354
Hennessy Cornerstone Growth Fund
Original Class Shares (HFCGX)
AVERAGE ANNUAL TOTAL RETURN PERIODS ENDED OCTOBER 31, 2010
| | | | | Since Inception |
| | One Year | Five Years | Ten Years | (11/1/96) |
| Hennessy Cornerstone | | | | |
| Growth Fund – Original Class | 16.69% | -5.43% | 2.94% | 7.88% |
| Russell 2000 Index | 26.58% | 3.07% | 4.89% | 6.72% |
| S&P 500 Index | 16.52% | 1.73% | -0.02% | 5.62% |
Gross expense ratio: 1.36%
Performance data quoted represents past performance; past performance does not guarantee future results. The investment return and principal value of an investment will fluctuate so that an investor’s shares, when redeemed, may be worth more or less than their original cost. Current performance of the Fund may be lower or higher than the performance quoted. Performance data current to the most recent month end may be obtained by visiting www.hennessyfunds.com. The gross expense ratio presented is that from the most recent prospectus.
PERFORMANCE NARRATIVE
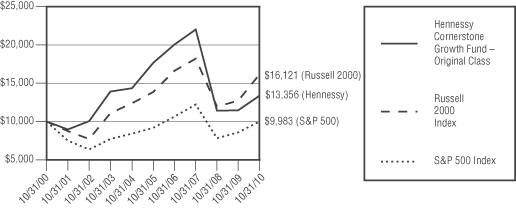
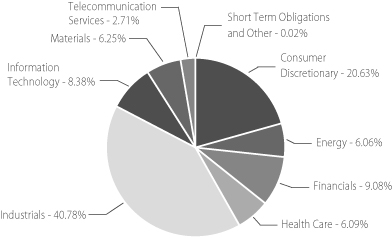
The Hennessy Cornerstone Growth Fund returned 16.69% for the twelve-month period ended October 31, 2010, underperforming the Russell 2000 benchmark, which returned 26.58%, while slightly outperforming the S&P 500 benchmark, which returned 16.52% for the same period. The Fund’s underperformance to the Russell 2000 Index is primarily due to an underweight sector allocation in Information Technology and Industrials and an overweight sector allocation in Consumer Staples. This offset a positive sector allocation in Consumer Discretionary stocks, which outperformed as the economy rebounded, and an underweight position in Financials stocks, which underperformed for the past twelve months, despite rallying significantly off their lows of March 6, 2009. Within the Information Technology sector, both Glob al Cash Access Holdings (down over 50%) and Unisys Corp. (down over 20%) hindered the performance of the portfolio. Global Cash Access Holdings announced the loss of their largest customer in July of 2010, which pressured the stock severely, while Unisys Corp. produced lower than expected first quarter earnings due to currency related losses. In the Industrials sector, Gencorp, Inc. (down over 30%) suffered after they announced plans to refinance existing debt.
CHANGE IN VALUE OF $10,000 INVESTMENT
This chart assumes an initial gross investment of $10,000 made on October 31, 2000. Returns shown include the reinvestment of all dividends. Returns shown do not reflect the deduction of taxes that a shareholder would pay on Fund distributions or the redemption of Fund shares.
PERFORMANCE OVERVIEW — HENNESSY CORNERSTONE GROWTH FUND
Hennessy Cornerstone Growth Fund
Institutional Class Shares (HICGX)
AVERAGE ANNUAL TOTAL RETURN PERIODS ENDED OCTOBER 31, 2010
| | | Since Inception |
| | One Year | 3/3/08 |
| Hennessy Cornerstone | | |
| Growth Fund – Institutional Class | 17.04% | -9.15% |
| Russell 2000 Index | 26.58% | 2.54% |
| S&P 500 Index | 16.52% | -2.13% |
Gross expense ratio: 1.11%. Net expense ratio: 0.98%. The expense ratio is contractually capped at 0.98% indefinitely.
Performance data quoted represents past performance; past performance does not guarantee future results. The investment return and principal value of an investment will fluctuate so that an investor’s shares, when redeemed, may be worth more or less than their original cost. Current performance of the Fund may be lower or higher than the performance quoted. Performance data current to the most recent month end may be obtained by visiting www.hennessyfunds.com. Investment performance reflects fee waivers in effect. In the absence of such waivers, total return would be reduced. The expense ratios presented are that from the most recent prospectus.
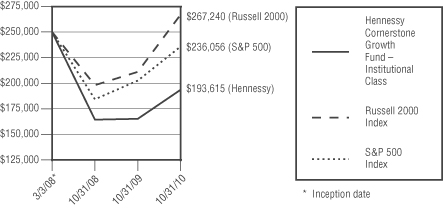
CHANGE IN VALUE OF $250,000 INVESTMENT
This chart assumes an initial gross investment of $250,000 (minimum investment) made on March 3, 2008 (inception date of share class). Returns shown include the reinvestment of all dividends. Returns shown do not reflect the deduction of taxes that a shareholder would pay on Fund distributions or the redemption of Fund shares.
The S&P 500 Index and Russell 2000 Index are unmanaged indices commonly used to measure the performance of U.S. Stocks. You cannot invest directly in an index. Small and medium-capitalization companies tend to have limited liquidity and greater price volatility than large-capitalization companies. Investments in foreign securities involve greater volatility and political, economic and currency risk and differences in accounting methods. References to specific securities should not be considered a recommendation to buy or sell any security. Fund holdings and sector allocations are subject to change. Please refer to the included Schedule of Investments.
HENNESSY FUNDS 1-800-966-4354
Original Class Shares (HENLX)
AVERAGE ANNUAL TOTAL RETURN PERIODS ENDED OCTOBER 31, 2010
| | | | Since Inception |
| | One Year | Five Years | 7/1/05 |
| Hennessy Cornerstone Growth | | | |
| Fund, Series II – Original Class | 26.15% | -6.59% | -6.92% |
| Russell 2000 Growth Index | 28.67% | 3.99% | 4.11% |
| S&P 500 Index | 16.52% | 1.73% | 1.93% |
Gross expense ratio: 1.70%.
Performance data quoted represents past performance; past performance does not guarantee future results. The investment return and principal value of an investment will fluctuate so that an investor’s shares, when redeemed, may be worth more or less than their original cost. Current performance of the Fund may be lower or higher than the performance quoted. Performance data current to the most recent month end may be obtained by visiting www.hennessyfunds.com. The gross expense ratio presented is that from the most recent prospectus.
PERFORMANCE NARRATIVE
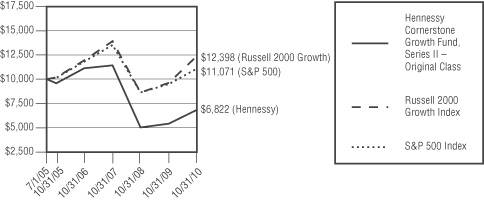
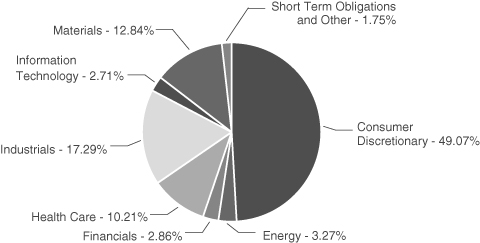
The Hennessy Cornerstone Growth Fund, Series II, returned 26.15% for the twelve-month period ended October 31, 2010, slightly underperforming the Russell 2000 Growth benchmark, which returned 28.67%, but significantly outperforming the S&P 500, which returned 16.52% for the same period. The Fund’s underperformance of the Russell 2000 Growth Index was primarily the result of security selection after the rebalance (which occurred in the summer), specifically in the Information Technology and Consumer Discretionary sectors. Information Technology stock Ultra Clean Holdings, Inc. was down over 30% on worse than expected third quarter earnings and lower guidance for the fourth quarter. Consumer Discretionary stocks Skechers USA, Inc. and Media General (both down over 45%) also hampered the performance of the por tfolio. Skechers USA, Inc. fell on a downgrade due to sluggish demand for their Shape-ups toning sneakers, while Media General announced worse than expected third quarter earnings due to higher interest expense related to the company’s new financing structure and a non-cash tax expense. After the rebalance, the weak overall security selection in the Fund more than offset positive overweight sector allocations in Industrials and Financials. Prior to the rebalance, an underweight position in Health Care stocks (which underperformed) and an overweight position in Consumer Dictionary stocks positively impacted the Fund. Pep Boys-Manny Moe & Jack reported strong third and fourth quarter results, achieving their commitment to return to profitability in 2009.
CHANGE IN VALUE OF $10,000 INVESTMENT
This chart assumes an initial gross investment of $10,000 made on July 1, 2005 (inception). Returns shown include the reinvestment of all dividends. Returns shown do not reflect the deduction of taxes that a shareholder would pay on Fund distributions or the redemption of Fund shares.
PERFORMANCE OVERVIEW — HENNESSY CORNERSTONE GROWTH FUND, SERIES II
Hennessy Cornerstone Growth Fund, Series II
Institutional Class Shares (HINLX)
AVERAGE ANNUAL TOTAL RETURN PERIODS ENDED OCTOBER 31, 2010
| | | Since Inception |
| | One Year | 3/3/08 |
| Hennessy Cornerstone Growth | | |
| Fund, Series II – Institutional Class | 26.94% | -10.59% |
| Russell 2000 Growth Index | 26.58% | 2.54% |
| S&P 500 Index | 16.52% | -2.13% |
Gross expense ratio: 1.46%. Net expense ratio: 0.98%. The expense ratio is contractually capped at 0.98% indefinitely.
Performance data quoted represents past performance; past performance does not guarantee future results. The investment return and principal value of an investment will fluctuate so that an investor’s shares, when redeemed, may be worth more or less than their original cost. Current performance of the Fund may be lower or higher than the performance quoted. Performance data current to the most recent month end may be obtained by visiting www.hennessyfunds.com. Investment performance reflects fee waivers in effect. In the absence of such waivers, total return would be reduced. The expense ratios presented are that from the most recent prospectus.
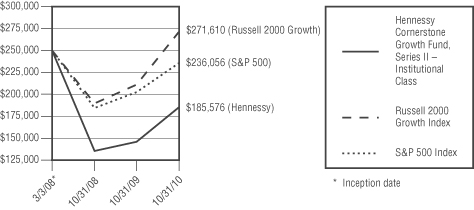
CHANGE IN VALUE OF $250,000 INVESTMENT
This chart assumes an initial gross investment of $250,000 (minimum investment) made on March 3, 2008 (date of share class inception). Returns shown include the reinvestment of all dividends. Returns shown do not reflect the deduction of taxes that a shareholder would pay on Fund distributions or the redemption of Fund shares.
The Russell 2000 Growth Index and S&P 500 Index are unmanaged indices commonly used to measure the performance of U.S. Stocks. You cannot invest directly in an index. Small and medium-capitalization companies tend to have limited liquidity and greater price volatility than large-capitalization companies. Investments in foreign securities involve greater volatility and political, economic and currency risk and differences in accounting methods. References to specific securities should not be considered a recommendation to buy or sell any security. Fund holdings and sector allocations are subject to change. Please refer to the included Schedule of Investments.
HENNESSY FUNDS 1-800-966-4354
Original Class Shares (HFTFX)
AVERAGE ANNUAL TOTAL RETURN PERIODS ENDED OCTOBER 31, 2010
| | | | Since Inception |
| | One Year | Five Years | (9/17/03) |
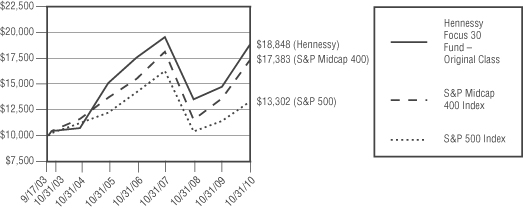
| Hennessy Focus 30 Fund – | | | |
| Original Class | 28.06% | 4.52% | 9.31% |
| S&P Midcap 400 Index | 27.64% | 4.93% | 8.07% |
| S&P 500 Index | 16.52% | 1.73% | 4.09% |
Gross expense ratio: 1.39%
Performance data quoted represents past performance; past performance does not guarantee future results. The investment return and principal value of an investment will fluctuate so that an investor’s shares, when redeemed, may be worth more or less than their original cost. Current performance of the Fund may be lower or higher than the performance quoted. Performance data current to the most recent month end may be obtained by visiting www.hennessyfunds.com. The gross expense ratio presented is that from the most recent prospectus.
PERFORMANCE NARRATIVE
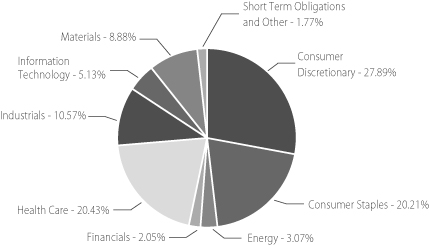
The Hennessy Focus 30 Fund returned 28.06% for the twelve-month period ended October 31, 2010, outperforming both the S&P Midcap 400 and the S&P 500, which returned 27.64% and 16.52% respectively for the same period. The overweight Consumer Discretionary sector allocation was a primary reason for the portfolio’s outperformance over the past year. This allocation helped to overcome the underweight Information Technology sector allocation. This was the case for the periods both pre and post rebalance of the portfolio, which occurred in the fall of 2010. In addition, an increase in Industrial sector stocks, which was made after the rebalance, drove the more recent performance of the Fund higher. The strongest performing stock in the portfolio prior to rebalance was Virgin Media, Inc. This equity gained over 55% on news of a stock buyback program and strong second quarter results, which were both released in July of 2010. The worst performing stock before the rebalance was Tetra Tech, Inc., falling -21% on lower than expected first quarter earnings and cuts to their 2010 outlook. Solid performance for both Dollar Tree, Inc. (a keeper from the current rebalance) and Darden Restaurants, Inc., which returned over 70% and over 45% respectively, confirmed that consumer spending was not dead and that lower-end retailers were able to grow during the recovery as consumers looked to get more value for their dollar.
CHANGE IN VALUE OF $10,000 INVESTMENT
This chart assumes an initial gross investment of $10,000 made on September 17, 2003 (inception). Returns shown include the reinvestment of all dividends. Returns shown do not reflect the deduction of taxes that a shareholder would pay on Fund distributions or the redemption of Fund shares.
PERFORMANCE OVERVIEW — HENNESSY FOCUS 30 FUND
Hennessy Focus 30 Fund
Institutional Class Shares (HIFTX)
AVERAGE ANNUAL TOTAL RETURN PERIODS ENDED OCTOBER 31, 2010
| | | Since Inception |
| | One Year | 3/3/08 |
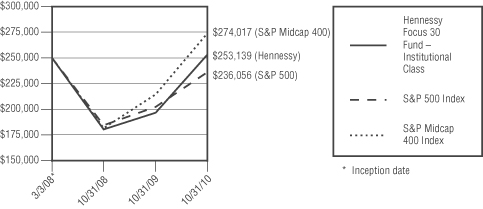
| Hennessy Focus 30 Fund – Institutional Class | 28.59% | 0.47% |
| S&P Midcap 400 Index | 27.64% | 3.50% |
| S&P 500 Index | 16.52% | -2.13% |
Gross expense ratio: 1.15%. Net expense ratio: 0.98%. The expense ratio is contractually capped at 0.98% indefinitely.
Performance data quoted represents past performance; past performance does not guarantee future results. The investment return and principal value of an investment will fluctuate so that an investor’s shares, when redeemed, may be worth more or less than their original cost. Current performance of the Fund may be lower or higher than the performance quoted. Performance data current to the most recent month end may be obtained by visiting www.hennessyfunds.com. Investment performance reflects fee waivers in effect. In the absence of such waivers, total return would be reduced. The expense ratios presented are that from the most recent prospectus.
CHANGE IN VALUE OF $250,000 INVESTMENT
This chart assumes an initial gross investment of $250,000 (minimum investment) made on March 3, 2008 (inception date of share class). Returns shown include the reinvestment of all dividends. Returns shown do not reflect the deduction of taxes that a shareholder would pay on Fund distributions or the redemption of Fund shares.
The S&P 500 Index and S&P Midcap 400 Index are unmanaged indices commonly used to measure the performance of U.S. Stocks. You cannot invest directly in an index. Small and medium-capitalization companies tend to have limited liquidity and greater price volatility than large-capitalization companies. References to specific securities should not be considered a recommendation to buy or sell any security. Fund holdings and sector allocations are subject to change. Please refer to the included Schedule of Investments.
HENNESSY FUNDS �� 1-800-966-4354
Original Class Shares (HFLGX)
AVERAGE ANNUAL TOTAL RETURN PERIODS ENDED OCTOBER 31, 2010
| | | Since Inception |
| | One Year | (3/20/09) |
| Hennessy Cornerstone Large | | |
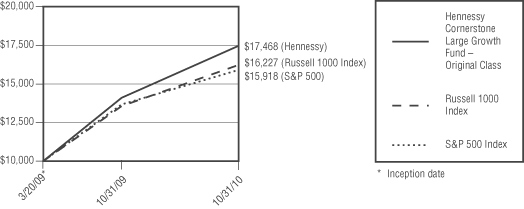
| Growth Fund – Original Class* | 23.88% | 41.21% |
| Russell 1000 Index | 17.67% | 34.61% |
| S&P 500 Index | 16.52% | 33.32% |
Gross expense ratio: 1.30%. The expense ratio was capped at 1.30% through March, 2010.
Performance data quoted represents past performance; past performance does not guarantee future results. The investment return and principal value of an investment will fluctuate so that an investor’s shares, when redeemed, may be worth more or less than their original cost. Current performance of the Fund may be lower or higher than the performance quoted. Performance data current to the most recent month end may be obtained by visiting www.hennessyfunds.com. The gross expense ratio presented is that from the most recent prospectus.
| * | On March 20, 2009, the Tamarack Large Cap Growth Fund was reorganized into the Hennessy Cornerstone Large Growth Fund. At that time, the Fund began utilizing a purely quantitative formula to choose stocks for the portfolio, which differs from the investment strategy employed by the previous investment manager. Accordingly, performance is being reported for the period after the reorganization. |
PERFORMANCE NARRATIVE
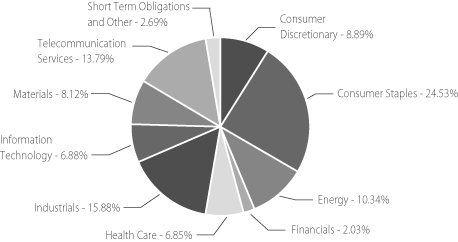
The Hennessy Cornerstone Large Growth Fund returned 23.88% for the twelve-month period ended October 31, 2010, outperforming both the Russell 1000 and the S&P 500, which returned 17.67% and 16.52% respectively for the same period. Prior to the rebalance in the winter, an underweight allocation in the Financial sector and an overweight allocation in the Consumer Dictionary sector were significant reasons for the portfolio’s outperformance and helped to overcome an underweight sector allocation in the Telecomm and Information Technology. AutoZone, Inc. was one of the strongest performers post rebalance, due to strong Q3, 2010 earnings and strong same store sales. Apollo Group, Inc. had weak performance due to decreases on their enrollment forecast as well as issues on financial aid reform for the f or-profit education industry. Prior to the rebalance, an overweight sector allocation in Industrials drove performance. Cummins, Inc., which reported strong Q4, 2009 earnings, was a strong performing stock in the portfolio.
CHANGE IN VALUE OF $10,000 INVESTMENT
This chart assumes an initial gross investment of $10,000 made on March 20, 2009 (inception). Returns shown include the reinvestment of all dividends. Returns shown do not reflect the deduction of taxes that a shareholder would pay on Fund distributions or the redemption of Fund shares.
PERFORMANCE OVERVIEW — HENNESSY CORNERSTONE LARGE GROWTH FUND
Hennessy Cornerstone Large Growth Fund
Institutional Class Shares (HILGX)
AVERAGE ANNUAL TOTAL RETURN PERIODS ENDED OCTOBER 31, 2010
| | | Since Inception |
| | One Year | (3/20/09) |
| Hennessy Cornerstone Large | | |
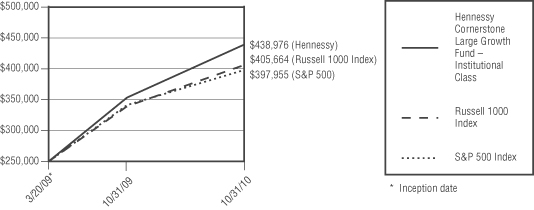
| Growth Fund – Institutional Class | 24.26% | 41.66% |
| Russell 1000 Index | 17.67% | 34.61% |
| S&P 500 Index | 16.52% | 33.32% |
Gross expense ratio: 1.14%. Net expense ratio: 0.98%. The expense ratio is contractually capped at 0.98% indefinitely.
Performance data quoted represents past performance; past performance does not guarantee future results. The investment return and principal value of an investment will fluctuate so that an investor’s shares, when redeemed, may be worth more or less than their original cost. Current performance of the Fund may be lower or higher than the performance quoted. Performance data current to the most recent month end may be obtained by visiting www.hennessyfunds.com. Investment performance reflects fee waivers in effect. In the absence of such waivers, total return would be reduced. The expense ratios presented are that from the most recent prospectus.
CHANGE IN VALUE OF $250,000 INVESTMENT
This chart assumes an initial gross investment of $250,000 (minimum investment) made on March 20, 2009 (inception date). Returns shown include the reinvestment of all dividends. Returns shown do not reflect the deduction of taxes that a shareholder would pay on Fund distributions or the redemption of Fund shares.
The S&P 500 and Russell 1000 are unmanaged indices commonly used to measure the performance of U.S. stocks. One cannot invest directly in an index. Medium-capitalization companies tend to have limited liquidity and greater price volatility than large-capitalization companies. Growth stocks typically are more volatile than value stocks; however value stocks have a lower expected growth rate in earnings and sales. References to specific securities should not be considered a recommendation to buy or sell any security. Fund holdings and sector allocations are subject to change. Please refer to the included Schedule of Investments.
HENNESSY FUNDS 1-800-966-4354
Original Class Shares (HFCVX)
AVERAGE ANNUAL TOTAL RETURN PERIODS ENDED OCTOBER 31, 2010
| | | | | Since Inception |
| | One Year | Five Years | Ten Years | (11/1/96) |
| Hennessy Cornerstone | | | | |
| Value Fund – Original Class | 19.98% | 2.56% | 4.31% | 5.26% |
| Russell 1000 Value Index | 15.71% | 0.62% | 2.64% | 6.59% |
| S&P 500 Index | 16.52% | 1.73% | -0.02% | 5.62% |
Gross expense ratio: 1.27%
Performance data quoted represents past performance; past performance does not guarantee future results. The investment return and principal value of an investment will fluctuate so that an investor’s shares, when redeemed, may be worth more or less than their original cost. Current performance of the Fund may be lower or higher than the performance quoted. Performance data current to the most recent month end may be obtained by visiting www.hennessyfunds.com. The gross expense ratio presented is that from the most recent prospectus.
PERFORMANCE NARRATIVE
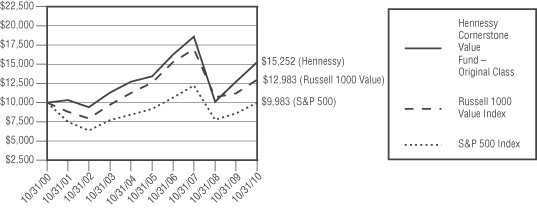
The Hennessy Cornerstone Value Fund returned 19.98% for the twelve-month period ended October 31, 2010, outperforming its benchmark, the Russell 1000 Value, which returned 15.71%, and the S&P 500, which returned 16.52% for the same period. The Fund’s outperformance was the result of strong security selection across a number of sectors, specifically Consumer Staples, Consumer Discretionary, Telecom, Health Care and Materials. The positive effects of security selection were augmented by an underweight sector allocation in Financials and Health Care and an overweight sector allocation in Industrials and Telecom. The top performing stock in the portfolio during the period was Limited Brands, Inc. (+66%), which reported strong sales in the summer and raised their second quarter earnings guidance. Both Du Pont and Boeing also had strong performance while in the portfolio.
CHANGE IN VALUE OF $10,000 INVESTMENT
This chart assumes an initial gross investment of $10,000 made on October 31, 2010. Returns shown include the reinvestment of all dividends. Returns shown do not reflect the deduction of taxes that a shareholder would pay on Fund distributions or the redemption of Fund shares.
PERFORMANCE OVERVIEW — HENNESSY CORNERSTONE VALUE FUND
Hennessy Cornerstone Value Fund
Institutional Class Shares (HICVX)
AVERAGE ANNUAL TOTAL RETURN PERIODS ENDED OCTOBER 31, 2010
| | | Since Inception |
| | One Year | 3/3/08 |
| Hennessy Cornerstone Value Fund – Institutional Class | 20.31% | -0.19% |
| Russell 1000 Value Index | 15.71% | -4.51% |
| S&P 500 Index | 16.52% | -2.13% |
Gross expense ratio: 1.13%. Net expense ratio: 0.98%. The expense ratio is contractually capped at 0.98% indefinitely.
Performance data quoted represents past performance; past performance does not guarantee future results. The investment return and principal value of an investment will fluctuate so that an investor’s shares, when redeemed, may be worth more or less than their original cost. Current performance of the Fund may be lower or higher than the performance quoted. Performance data current to the most recent month end may be obtained by visiting www.hennessyfunds.com. Investment performance reflects fee waivers in effect. In the absence of such waivers, total return would be reduced. The expense ratios presented are that from the most recent prospectus.
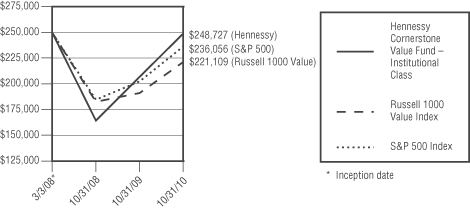
CHANGE IN VALUE OF $250,000 INVESTMENT
This chart assumes an initial gross investment of $250,000 (minimum investment) made on March 3, 2008 (inception date of share class). Returns shown include the reinvestment of all dividends. Returns shown do not reflect the deduction of taxes that a shareholder would pay on Fund distributions or the redemption of Fund shares.
The Russell 1000 Value Index and S&P 500 Index are unmanaged indices commonly used to measure the performance of U.S. Stocks. You cannot invest directly in an index. The Fund may invest in medium-capitalization companies which tend to have limited liquidity and greater price volatility than large-capitalization companies. Investments in foreign securities involve greater volatility and political, economic and currency risk and differences in accounting methods. References to specific securities should not be considered a recommendation to buy or sell any security. Fund holdings and sector allocations are subject to change. Please refer to the included Schedule of Investments.
HENNESSY FUNDS 1-800-966-4354
Original Class Shares (HDOGX)
AVERAGE ANNUAL TOTAL RETURN PERIODS ENDED OCTOBER 31, 2010
| | | | | Since Inception |
| | One Year | Five Years | Ten Years | (7/29/98) |
| Hennessy Total Return Fund | 18.09% | 2.35% | 2.81% | 2.57% |
| Dow Jones Industrial Average | 17.62% | 4.01% | 2.53% | 4.11% |
| S&P 500 Index | 16.52% | 1.73% | -0.02% | 2.20% |
Gross expense ratio: 1.56%
Expenses net of interest expense: 1.27%
Performance data quoted represents past performance; past performance does not guarantee future results. The investment return and principal value of an investment will fluctuate so that an investor’s shares, when redeemed, may be worth more or less than their original cost. Current performance of the Fund may be lower or higher than the performance quoted. Performance data current to the most recent month end may be obtained by visiting www.hennessyfunds.com. The gross expense ratio presented is that from the most recent prospectus.
PERFORMANCE NARRATIVE
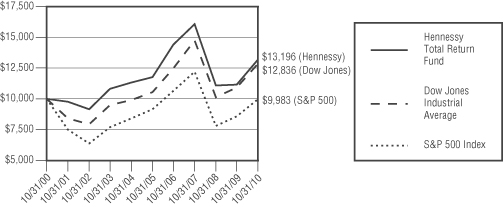
The Hennessy Total Return Fund returned 18.09% for the twelve-month period ended October 31, 2010, outperforming both the Dow Jones Industrial Average, which returned 17.62%, and the S&P 500 Index, which returned 16.52% for the same period. While there were continued low yields on Treasury Bills, which make up approximately 25% of the Fund’s assets, the Fund’s 75% equity weighting was able to capture the full move of the equity markets over the year. The Fund’s largest holdings (Du Pont, McDonald’s and Home Depot) were positive contributors to the Fund’s outperformance.
CHANGE IN VALUE OF $10,000 INVESTMENT
This chart assumes an initial gross investment of $10,000 made on October 31, 2000. Returns shown include the reinvestment of all dividend and other distributions. Returns shown do not reflect the deduction of taxes that a shareholder would pay on Fund distributions or the redemption of Fund shares.
The Dow Jones Industrial Average and S&P 500 Index are unmanaged indices commonly used to measure the performance of U.S. Stocks. You cannot invest directly in an index. The Hennessy Total Return Fund is non-diversified, meaning it may concentrate its assets in fewer individual holdings than a diversified fund, making it more exposed to individual stock volatility than a diversified fund. References to specific securities should not be considered a recommendation to buy or sell any security. Fund holdings are subject to change. Please refer to the included Schedule of Investments.
PERFORMANCE OVERVIEW — HENNESSY TOTAL RETURN FUND AND HENNESSY BALANCED FUND
Hennessy Balanced Fund
Original Class Shares (HBFBX)
AVERAGE ANNUAL TOTAL RETURN PERIODS ENDED OCTOBER 31, 2010
| | | | | Since Inception |
| | One Year | Five Years | Ten Years | (3/8/96) |
| Hennessy Balanced Fund | 10.53% | 2.79% | 2.23% | 3.77% |
| Dow Jones Industrial Average | 17.62% | 4.01% | 2.53% | 7.25% |
| S&P 500 Index | 16.52% | 1.73% | -0.02% | 6.22% |
Gross expense ratio: 1.73%
Performance data quoted represents past performance; past performance does not guarantee future results. The investment return and principal value of an investment will fluctuate so that an investor’s shares, when redeemed, may be worth more or less than their original cost. Current performance of the Fund may be lower or higher than the performance quoted. Performance data current to the most recent month end may be obtained by visiting www.hennessyfunds.com. The gross expense ratio presented is that from the most recent prospectus.
PERFORMANCE NARRATIVE
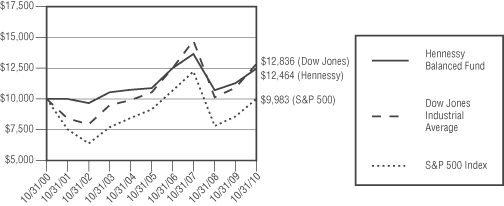
The Hennessy Balanced Fund returned 10.53% for the twelve-month period ended October 31, 2010, lagging both the Dow Jones Industrial Average, which returned 17.62%, and the S&P 500 Index, which returned 16.52% for the same period. The Fund’s relative underperformance to its benchmarks is due primarily to the continued low yields on Treasury Bills. The Fund’s position of approximately 50% in Treasuries did not allow it to capture the strong performance of the equity markets over the year. In addition, compared to the benchmark indices, the Fund’s largest underperforming holdings (Pfizer and Chevron) were concentrated more heavily within the Fund and were also a drag on relative performance. While the portfolio may underperform the indices in periods where equities rise sharply, the str ategy is geared to capture near market returns with a lower risk profile, since only half of the assets are invested in equities. Conversely, if equity markets were to fall sharply, we would expect the Fund to perform better than the indices. Ultimately, the overall goal of this portfolio is to capture upside performance while mitigating downside risk.
CHANGE IN VALUE OF $10,000 INVESTMENT
This chart assumes an initial gross investment of $10,000, made on October 31, 2000. Returns shown include the reinvestment of all dividend and other distributions. Returns shown do not reflect the deduction of taxes that a shareholder would pay on Fund distributions or the redemption of Fund shares.
HENNESSY FUNDS 1-800-966-4354
The Dow Jones Industrial Average and S&P 500 Index are unmanaged indices commonly used to measure the performance of U.S. Stocks. You cannot invest directly in an index. The Hennessy Balanced Fund is non-diversified, meaning it may concentrate its assets in fewer individual holdings than a diversified fund, making it more exposed to individual stock volatility than a diversified fund. References to specific securities should not be considered a recommendation to buy or sell any security. Fund holdings are subject to change. Please refer to the included Schedule of Investments.
SCHEDULE OF INVESTMENTS — HENNESSY CORNERSTONE GROWTH FUND
Schedules of Investments
HENNESSY CORNERSTONE GROWTH FUND
(% of Net Assets)
| TOP TEN EQUITY HOLDINGS | % of net assets |
| Ulta Salon Cosmetics & Fragrance, Inc. | 2.95% |
| KapStone Paper & Packaging Corp. | 2.84% |
| Sanmina-SCI Corp. | 2.74% |
| Ford Motor Co. | 2.74% |
| Virgin Media, Inc. | 2.70% |
| CarMax, Inc. | 2.69% |
| Brunswick Corp. | 2.58% |
| SXC Health Solutions Corp. | 2.51% |
| Cardtronics, Inc. | 2.50% |
| Cooper Companies, Inc. | 2.50% |
HENNESSY FUNDS 1-800-966-4354
| | COMMON STOCKS – 98.26% | | Number | | | | | | % of Net | |
| | | | of Shares | | | Value | | | Assets | |
| | Consumer Discretionary – 28.62% | | | | | | | | | |
| | American Axle & Manufacturing | | | | | | | | | |
| | Holdings, Inc. (a) | | | 529,300 | | | $ | 4,880,146 | | | | 2.32 | % |
| | Big 5 Sporting Goods Corp. | | | 219,700 | | | | 2,970,344 | | | | 1.41 | % |
| | Brunswick Corp. | | | 342,400 | | | | 5,416,768 | | | | 2.58 | % |
| | CarMax, Inc. (a) | | | 182,100 | | | | 5,643,279 | | | | 2.69 | % |
| | Ford Motor Co. (a) | | | 407,700 | | | | 5,760,801 | | | | 2.74 | % |
| | H.H. Gregg, Inc. (a) | | | 175,100 | | | | 4,034,304 | | | | 1.92 | % |
| | Jo-Ann Stores, Inc. (a) | | | 111,700 | | | | 4,831,025 | | | | 2.30 | % |
| | Kirkland’s, Inc. (a) | | | 233,100 | | | | 3,135,195 | | | | 1.49 | % |
| | Knology, Inc. (a) | | | 357,000 | | | | 5,194,350 | | | | 2.47 | % |
| | La-Z-Boy, Inc. (a) | | | 384,300 | | | | 2,986,011 | | | | 1.42 | % |
| | Lumber Liquidators Holdings, Inc. (a) | | | 142,600 | | | | 3,433,808 | | | | 1.63 | % |
| | Ulta Salon Cosmetics & Fragrance, Inc. (a) | | | 201,800 | | | | 6,193,242 | | | | 2.95 | % |
| | Virgin Media, Inc. | | | 223,500 | | | | 5,683,605 | | | | 2.70 | % |
| | | | | | | | | 60,162,878 | | | | 28.62 | % |
| | Consumer Staples – 6.79% | | | | | | | | | | | | |
| | Cia Brasileira de Distribuicao | | | | | | | | | | | | |
| | Grupo Pao de Acucar – ADR (b) | | | 108,400 | | | | 4,293,724 | | | | 2.04 | % |
| | Cott Corp. (a)(b) | | | 443,700 | | | | 3,638,340 | | | | 1.73 | % |
| | Nu Skin Enterprises, Inc. | | | 132,600 | | | | 4,057,560 | | | | 1.93 | % |
| | Revlon, Inc. (a) | | | 199,500 | | | | 2,278,290 | | | | 1.09 | % |
| | | | | | | | | 14,267,914 | | | | 6.79 | % |
| | Energy – 12.84% | | | | | | | | | | | | |
| | Acergy SA – ADR (b) | | | 239,600 | | | | 4,832,732 | | | | 2.30 | % |
| | Calumet Specialty Products | | | 193,300 | | | | 4,212,007 | | | | 2.00 | % |
| | DCP Midstream Partners LP | | | 146,400 | | | | 5,223,552 | | | | 2.49 | % |
| | Massey Energy Corp. | | | 96,000 | | | | 4,038,720 | | | | 1.92 | % |
| | Patriot Coal Corp. (a) | | | 286,500 | | | | 3,864,885 | | | | 1.84 | % |
| | Regency Energy Partners LP | | | 190,100 | | | | 4,817,134 | | | | 2.29 | % |
| | | | | | | | | 26,989,030 | | | | 12.84 | % |
| | Financials – 7.93% | | | | | | | | | | | | |
| | Advance America Cash Advance Centers, Inc. | | | 610,200 | | | | 3,044,898 | | | | 1.45 | % |
| | Cardtronics, Inc. (a) | | | 310,000 | | | | 5,254,500 | | | | 2.50 | % |
The accompanying notes are an integral part of these financial statements.
SCHEDULE OF INVESTMENTS — HENNESSY CORNERSTONE GROWTH FUND
| | COMMON STOCKS | | Number | | | | | | % of Net | |
| | | | of Shares | | | Value | | | Assets | |
| | Financials (Continued) | | | | | | | | | |
| | Encore Capital Group, Inc. (a) | | | 204,800 | | | $ | 4,161,536 | | | | 1.98 | % |
| | XL Capital Ltd. (b) | | | 199,500 | | | | 4,219,425 | | | | 2.00 | % |
| | | | | | | | | 16,680,359 | | | | 7.93 | % |
| | Health Care – 8.81% | | | | | | | | | | | | |
| | CIGNA Corp. | | | 110,100 | | | | 3,874,419 | | | | 1.84 | % |
| | Cooper Companies, Inc. | | | 106,300 | | | | 5,244,842 | | | | 2.50 | % |
| | Providence Service Corp. (a) | | | 250,800 | | | | 4,120,644 | | | | 1.96 | % |
| | SXC Health Solutions Corp. (a)(b) | | | 135,600 | | | | 5,282,976 | | | | 2.51 | % |
| | | | | | | | | 18,522,881 | | | | 8.81 | % |
| | Industrials – 4.69% | | | | | | | | | | | | |
| | Bucyrus International, Inc. | | | 69,800 | | | | 4,757,568 | | | | 2.26 | % |
| | GenCorp, Inc. (a) | | | 437,300 | | | | 2,129,651 | | | | 1.02 | % |
| | M&F Worldwide Corp. (a) | | | 110,300 | | | | 2,964,864 | | | | 1.41 | % |
| | | | | | | | | 9,852,083 | | | | 4.69 | % |
| | Information Technology – 11.48% | | | | | | | | | | | | |
| | Advanced Micro Devices, Inc. (a) | | | 503,200 | | | | 3,688,456 | | | | 1.76 | % |
| | Global Cash Access Holdings, Inc. (a) | | | 489,200 | | | | 1,780,688 | | | | 0.85 | % |
| | GSI Commerce, Inc. (a) | | | 156,900 | | | | 3,831,498 | | | | 1.82 | % |
| | Sanmina-SCI Corp. (a) | | | 437,300 | | | | 5,763,614 | | | | 2.74 | % |
| | Tech Data Corp. (a) | | | 86,700 | | | | 3,727,233 | | | | 1.77 | % |
| | Telvent GIT SA (a)(b) | | | 109,000 | | | | 2,765,330 | | | | 1.31 | % |
| | Unisys Corp. (a) | | | 112,400 | | | | 2,590,820 | | | | 1.23 | % |
| | | | | | | | | 24,147,639 | | | | 11.48 | % |
| | Materials – 13.54% | | | | | | | | | | | | |
| | Braskem SA – ADR (b) | | | 249,200 | | | | 5,195,820 | | | | 2.47 | % |
| | Huntsman Corp. | | | 370,300 | | | | 5,128,655 | | | | 2.44 | % |
| | KapStone Paper & Packaging Corp. (a) | | | 465,600 | | | | 5,959,680 | | | | 2.84 | % |
| | NewMarket Corp. | | | 33,700 | | | | 3,994,124 | | | | 1.90 | % |
| | Omnova Solutions, Inc. (a) | | | 545,800 | | | | 4,355,484 | | | | 2.07 | % |
| | Schweitzer-Mauduit International, Inc. | | | 59,700 | | | | 3,831,546 | | | | 1.82 | % |
| | | | | | | | | 28,465,309 | | | | 13.54 | % |
The accompanying notes are an integral part of these financial statements.
HENNESSY FUNDS 1-800-966-4354
| | COMMON STOCKS | | Number | | | | | | % of Net | |
| | | | of Shares | | | Value | | | Assets | |
| | Telecommunication Services – 3.56% | | | | | | | | | |
| | Tim Participacoes SA – ADR (b) | | | 130,300 | | | $ | 4,203,478 | | | | 2.00 | % |
| | Vivo Participacoes SA – ADR (b) | | | 114,600 | | | | 3,282,144 | | | | 1.56 | % |
| | | | | | | | | 7,485,622 | | | | 3.56 | % |
| | | | | | | | | | | | | | |
| | Total Common Stocks (Cost $179,762,975) | | | | | | | 206,573,715 | | | | 98.26 | % |
| | | | | | | | | | | | | | |
| | SHORT-TERM INVESTMENT – 1.87% | | | | | | | | | | | | |
| | Money Market Funds – 1.87% | | | | | | | | | | | | |
| | Fidelity Government Portfolio – | | | | | | | | | | | | |
| | Institutional Class, 0.06% (c) | | | 3,933,218 | | | | 3,933,218 | | | | 1.87 | % |
| | | | | | | | | | | | | | |
| | Total Money Market Funds | | | | | | | | | | | | |
| | (Cost $3,933,218) | | | | | | | 3,933,218 | | | | 1.87 | % |
| | | | | | | | | | | | | | |
| | Total Short-Term Investments | | | | | | | | | | | | |
| | (Cost $3,933,218) | | | | | | | 3,933,218 | | | | 1.87 | % |
| | | | | | | | | | | | | | |
| | Total Investments – 100.13% | | | | | | | | | | | | |
| | (Cost 183,696,193) | | | | | | | 210,506,933 | | | | 100.13 | % |
| | | | | | | | | | | | | | |
| | Liabilities in Excess of Other Assets – (0.13)% | | | | | | | (273,500 | ) | | | (0.13 | )% |
| | TOTAL NET ASSETS – 100.00% | | | | | | $ | 210,233,433 | | | | 100.00 | % |
| (a) | Non-income producing security. |
| (b) | Foreign issued security. |
| (c) | The rate listed is the Fund’s 7-day yield as of October 31, 2010. |
The accompanying notes are an integral part of these financial statements.
SCHEDULE OF INVESTMENTS — HENNESSY CORNERSTONE GROWTH FUND
Summary of Fair Value Exposure at October 31, 2010
The Fund has adopted authoritative fair valuation accounting standards which establish an authoritative definition of fair value and set out a hierarchy for measuring fair value. These standards require additional disclosures about the various inputs and valuation techniques used to develop the measurements of fair value and a discussion in changes in valuation techniques and related inputs during the period. These inputs are summarized in the three broad levels listed below.
The Fund has performed an analysis of all existing investments to determine the significance and character of all inputs to their fair value determination.
| Level 1 – | Quoted unadjusted prices for identical instruments in active markets to which the Fund has access at the date of measurement. |
| Level 2 – | Quoted prices for similar instruments in active markets; quoted prices for identical or similar instruments in markets that are not active; and model-derived valuations in which all significant inputs and significant value drivers are observable in active markets. Level 2 inputs are those in markets for which there are few transactions, the prices are not current, little public information exists or instances where prices vary substantially over time or among brokered market makers. |
| Level 3 – | Model derived valuations in which one or more significant inputs or significant value drivers are unobservable. Unobservable inputs are those inputs that reflect the Fund’s own assumptions that market participants would use to price the asset or liability based on the best available information. |
The inputs or methodology used for valuing securities are not an indication of the risk associated with investing in those securities.
The following is a summary of the inputs used to value the Fund’s net assets as of October 31, 2010:
| Common Stock | | Level 1 | | | Level 2 | | | Level 3 | | | Total | |
| Consumer Discretionary | | $ | 60,162,878 | | | $ | — | | | $ | — | | | $ | 60,162,878 | |
| Consumer Staples | | | 14,267,914 | | | | — | | | | — | | | | 14,267,914 | |
| Energy | | | 26,989,030 | | | | — | | | | — | | | | 26,989,030 | |
| Financials | | | 16,680,359 | | | | — | | | | — | | | | 16,680,359 | |
| Health Care | | | 18,522,881 | | | | — | | | | — | | | | 18,522,881 | |
| Industrials | | | 9,852,083 | | | | — | | | | — | | | | 9,852,083 | |
| Information Technology | | | 24,147,639 | | | | — | | | | — | | | | 24,147,639 | |
| Materials | | | 28,465,309 | | | | — | | | | — | | | | 28,465,309 | |
| Telecommunication Services | | | 7,485,622 | | | | — | | | | — | | | | 7,485,622 | |
| Total Common Stock | | $ | 206,573,715 | | | $ | — | | | $ | — | | | $ | 206,573,715 | |
| Short-Term Investments | | $ | 3,933,218 | | | $ | — | | | $ | — | | | $ | 3,933,218 | |
| Total Investments in Securities | | $ | 210,506,933 | | | $ | — | | | $ | — | | | $ | 210,506,933 | |
The accompanying notes are an integral part of these financial statements.
HENNESSY FUNDS 1-800-966-4354
HENNESSY CORNERSTONE
GROWTH FUND, SERIES II
(% of Net Assets)
| TOP TEN EQUITY HOLDINGS | % of net assets |
| Banco Macro SA – ADR | 2.95% |
| TRW Automotive Holdings Corp. | 2.75% |
| IDT Corp. | 2.71% |
| Power One, Inc. | 2.56% |
| United Continental Holdings, Inc. | 2.55% |
| Clearwater Paper Corp. | 2.51% |
| Trimas Corp. | 2.48% |
| Enterprise Group Holdings LP | 2.47% |
| Cardtronics, Inc. | 2.45% |
| Loral Space & Communications, Inc. | 2.44% |
SCHEDULE OF INVESTMENTS — HENNESSY CORNERSTONE GROWTH FUND, SERIES II
| | COMMON STOCKS – 99.98% | | Number | | | | | | % of Net | |
| | | | of Shares | | | Value | | | Assets | |
| | Consumer Discretionary – 20.63% | | | | | | | | | |
| | Brown Shoe, Inc. | | | 33,500 | | | $ | 393,625 | | | | 1.29 | % |
| | Crocs, Inc. (a) | | | 49,100 | | | | 683,963 | | | | 2.24 | % |
| | Libbey, Inc. (a) | | | 41,500 | | | | 551,535 | | | | 1.80 | % |
| | Lifetime Brands, Inc. (a) | | | 35,300 | | | | 453,252 | | | | 1.48 | % |
| | Media General, Inc. (a) | | | 51,900 | | | | 285,969 | | | | 0.93 | % |
| | Select Comfort Corp. (a) | | | 59,100 | | | | 491,121 | | | | 1.60 | % |
| | Sinclair Broadcast Group, Inc. – Class A (a) | | | 84,300 | | | | 673,557 | | | | 2.20 | % |
| | Skechers USA, Inc. (a) | | | 14,000 | | | | 272,160 | | | | 0.89 | % |
| | TRW Automotive Holdings Corp. (a) | | | 18,400 | | | | 840,696 | | | | 2.75 | % |
| | Ulta Salon Cosmetics & Fragrance, Inc. (a) | | | 22,500 | | | | 690,525 | | | | 2.26 | % |
| | Valassis Communications, Inc. (a) | | | 16,200 | | | | 534,600 | | | | 1.75 | % |
| | Whirlpool Corp. | | | 5,800 | | | | 439,814 | | | | 1.44 | % |
| | | | | | | | | 6,310,817 | | | | 20.63 | % |
| | Energy – 6.06% | | | | | | | | | | | | |
| | Callon Petroleum Co. (a) | | | 91,300 | | | | 450,109 | | | | 1.47 | % |
| | Enterprise Group Holdings LP | | | 11,800 | | | | 755,200 | | | | 2.47 | % |
| | Inergy Holdings LP | | | 21,500 | | | | 649,300 | | | | 2.12 | % |
| | | | | | | | | 1,854,609 | | | | 6.06 | % |
| | Financials – 9.08% | | | | | | | | | | | | |
| | American International Group, Inc. (a) | | | 15,200 | | | | 638,552 | | | | 2.09 | % |
| | Banco Macro SA – ADR (b) | | | 18,100 | | | | 902,285 | | | | 2.95 | % |
| | Cardtronics, Inc. (a) | | | 44,300 | | | | 750,885 | | | | 2.45 | % |
| | Zions Bancorporation | | | 23,500 | | | | 485,510 | | | | 1.59 | % |
| | | | | | | | | 2,777,232 | | | | 9.08 | % |
| | Health Care – 6.09% | | | | | | | | | | | | |
| | Hill Rom Holdings, Inc. | | | 18,000 | | | | 697,500 | | | | 2.28 | % |
| | SXC Health Solutions Corp. (a)(b) | | | 15,206 | | | | 592,426 | | | | 1.94 | % |
| | Universal American Corp. | | | 35,700 | | | | 574,056 | | | | 1.87 | % |
| | | | | | | | | 1,863,982 | | | | 6.09 | % |
| | Industrials – 40.78% | | | | | | | | | | | | |
| | Air Transport Services Group Inc. (a) | | | 107,000 | | | | 719,040 | | | | 2.35 | % |
| | Alamo Group, Inc. | | | 24,900 | | | | 597,600 | | | | 1.95 | % |
| | Alaska Air Group, Inc. (a) | | | 11,800 | | | | 623,040 | | | | 2.04 | % |
The accompanying notes are an integral part of these financial statements.
HENNESSY FUNDS 1-800-966-4354
| | COMMON STOCKS | | Number | | | | | | % of Net | |
| | | | of Shares | | | Value | | | Assets | |
| | Industrials (Continued) | | | | | | | | | |
| | ArvinMeritor, Inc. (a) | | | 37,400 | | | $ | 620,092 | | | | 2.03 | % |
| | Cascade Corp. | | | 14,300 | | | | 506,077 | | | | 1.65 | % |
| | Commercial Vehicle Group, Inc. (a) | | | 47,800 | | | | 641,954 | | | | 2.10 | % |
| | Consolidated Graphics, Inc. (a) | | | 12,100 | | | | 563,255 | | | | 1.84 | % |
| | Diamond Management & | | | | | | | | | | | | |
| | Technology Consultants, Inc. | | | 51,100 | | | | 637,217 | | | | 2.08 | % |
| | Esterline Technologies Corp. (a) | | | 11,000 | | | | 664,840 | | | | 2.17 | % |
| | Gardner Denver, Inc. | | | 11,500 | | | | 664,930 | | | | 2.17 | % |
| | Interface, Inc. | | | 46,200 | | | | 664,818 | | | | 2.17 | % |
| | Macquarie Infrastructure Company, Inc. (a) | | | 40,100 | | | | 725,008 | | | | 2.37 | % |
| | NACCO Industries, Inc. | | | 5,800 | | | | 575,708 | | | | 1.88 | % |
| | Owens Corning (a) | | | 17,400 | | | | 470,496 | | | | 1.54 | % |
| | Pacer International, Inc. (a) | | | 77,900 | | | | 433,903 | | | | 1.42 | % |
| | Standex International Corp. | | | 21,000 | | | | 565,530 | | | | 1.85 | % |
| | Tennant Co. | | | 16,200 | | | | 543,510 | | | | 1.78 | % |
| | Trimas Corp. (a) | | | 47,900 | | | | 758,257 | | | | 2.48 | % |
| | US Airways Group, Inc. (a) | | | 61,200 | | | | 721,548 | | | | 2.36 | % |
| | United Continental Holdings, Inc. (a) | | | 26,800 | | | | 778,272 | | | | 2.55 | % |
| | | | | | | | | 12,475,095 | | | | 40.78 | % |
| | Information Technology – 8.38% | | | | | | | | | | | | |
| | Lionbridge Technologies, Inc. (a) | | | 111,400 | | | | 557,000 | | | | 1.82 | % |
| | Loral Space & Communications, Inc. (a) | | | 13,400 | | | | 745,442 | | | | 2.44 | % |
| | Power One, Inc. (a) | | | 75,300 | | | | 783,873 | | | | 2.56 | % |
| | Ultra Clean Holdings, Inc. (a) | | | 63,300 | | | | 476,649 | | | | 1.56 | % |
| | | | | | | | | 2,562,964 | | | | 8.38 | % |
| | Materials – 6.25% | | | | | | | | | | | | |
| | Clearwater Paper Corp. (a) | | | 9,500 | | | | 767,125 | | | | 2.51 | % |
| | Neenah Paper, Inc. | | | 28,700 | | | | 440,545 | | | | 1.44 | % |
| | Quaker Chemical Corp. | | | 19,300 | | | | 702,906 | | | | 2.30 | % |
| | | | | | | | | 1,910,576 | | | | 6.25 | % |
| | Telecommunication Services – 2.71% | | | | | | | | | | | | |
| | IDT Corp. (a) | | | 56,500 | | | | 829,420 | | | | 2.71 | % |
| | | | | | | | | | | | | | |
| | Total Common Stocks (Cost $27,709,116) | | | | | | | 30,584,695 | | | | 99.98 | % |
The accompanying notes are an integral part of these financial statements.
SCHEDULE OF INVESTMENTS — HENNESSY CORNERSTONE GROWTH FUND, SERIES II
| | SHORT-TERM INVESTMENTS – 0.37% | | Principal | | | | | | % of Net | |
| | | | Amount | | | Value | | | Assets | |
| | Demand Notes# – 0.37% | | | | | | | | | |
| | American Family Financial Services, 0.10% | | $ | 114,233 | | | $ | 114,233 | | | | 0.37 | % |
| | | | | | | | | | | | | | |
| | Total Demand Notes | | | | | | | | | | | | |
| | (Cost $114,233) | | | | | | | 114,233 | | | | 0.37 | % |
| | | | | | | | | | | | | | |
| | Total Short-Term Investments | | | | | | | | | | | | |
| | (Cost $114,233) | | | | | | | 114,233 | | | | 0.37 | % |
| | | | | | | | | | | | | | |
| | Total Investments – 100.35% | | | | | | | | | | | | |
| | (Cost 27,823,349) | | | | | | | 30,698,928 | | | | 100.35 | % |
| | | | | | | | | | | | | | |
| | Liabilities in Excess of Other Assets – (0.35)% | | | | | | | (105,634 | ) | | | (0.35 | )% |
| | TOTAL NET ASSETS – 100.00% | | | | | | $ | 30,593,294 | | | | 100.00 | % |
| (a) | Non-income producing security. |
| (b) | Foreign issued security. |
| # | Variable rate demand notes are considered short-term obligations and are payable on demand. Interest rates change periodically on specified dates. Interest rates listed are as of October 31, 2010. |
The accompanying notes are an integral part of these financial statements.
HENNESSY FUNDS 1-800-966-4354
The Fund has adopted authoritative fair valuation accounting standards which establish an authoritative definition of fair value and set out a hierarchy for measuring fair value. These standards require additional disclosures about the various inputs and valuation techniques used to develop the measurements of fair value and a discussion in changes in valuation techniques and related inputs during the period. These inputs are summarized in the three broad levels listed below.
The Fund has performed an analysis of all existing investments to determine the significance and character of all inputs to their fair value determination.
| Level 1 – | Quoted unadjusted prices for identical instruments in active markets to which the Fund has access at the date of measurement. |
| Level 2 – | Quoted prices for similar instruments in active markets; quoted prices for identical or similar instruments in markets that are not active; and model-derived valuations in which all significant inputs and significant value drivers are observable in active markets. Level 2 inputs are those in markets for which there are few transactions, the prices are not current, little public information exists or instances where prices vary substantially over time or among brokered market makers. |
| Level 3 – | Model derived valuations in which one or more significant inputs or significant value drivers are unobservable. Unobservable inputs are those inputs that reflect the Fund’s own assumptions that market participants would use to price the asset or liability based on the best available information. |
The inputs or methodology used for valuing securities are not an indication of the risk associated with investing in those securities.
The following is a summary of the inputs used to value the Fund’s net assets as of October 31, 2010:
| Common Stock | | Level 1 | | | Level 2 | | | Level 3 | | | Total | |
| Consumer Discretionary | | $ | 6,310,817 | | | $ | — | | | $ | — | | | $ | 6,310,817 | |
| Energy | | | 1,854,609 | | | | — | | | | — | | | | 1,854,609 | |
| Financials | | | 2,777,232 | | | | — | | | | — | | | | 2,777,232 | |
| Health Care | | | 1,863,982 | | | | — | | | | — | | | | 1,863,982 | |
| Industrials | | | 12,475,095 | | | | — | | | | — | | | | 12,475,095 | |
| Information Technology | | | 2,562,964 | | | | — | | | | — | | | | 2,562,964 | |
| Materials | | | 1,910,576 | | | | — | | | | — | | | | 1,910,576 | |
| Telecommunication Services | | | 829,420 | | | | — | | | | — | | | | 829,420 | |
| Total Common Stock | | $ | 30,584,695 | | | $ | — | | | $ | — | | | $ | 30,584,695 | |
| Short-Term Investments | | $ | — | | | $ | 114,233 | | | $ | — | | | $ | 114,233 | |
| Total Investments in Securities | | $ | 30,584,695 | | | $ | 114,233 | | | $ | — | | | $ | 30,698,928 | |
The accompanying notes are an integral part of these financial statements.
SCHEDULE OF INVESTMENTS — HENNESSY FOCUS 30 FUND
HENNESSY FOCUS 30 FUND
(% of Net Assets)
| TOP TEN EQUITY HOLDINGS | % of net assets |
| United Continental Holdings, Inc. | 3.92% |
| U.S. Airways Group, Inc. | 3.87% |
| Healthspring, Inc. | 3.78% |
| TRW Automotive Holdings Corp. | 3.77% |
| Crocs, Inc. | 3.59% |
| Tenneco, Inc. | 3.52% |
| Borgwarner, Inc. | 3.51% |
| Autoliv, Inc. | 3.49% |
| ArvinMeritor, Inc. | 3.43% |
| Polyone Corp. | 3.41% |
HENNESSY FUNDS 1-800-966-4354
| | COMMON STOCKS – 98.25% | | Number | | | | | | % of Net | |
| | | | of Shares | | | Value | | | Assets | |
| | Consumer Discretionary – 49.07% | | | | | | | | | |
| | Advance Auto Parts, Inc. | | | 73,900 | | | $ | 4,802,022 | | | | 3.32 | % |
| | Autoliv, Inc. | | | 70,800 | | | | 5,048,040 | | | | 3.49 | % |
| | Borgwarner, Inc. (a) | | | 90,400 | | | | 5,072,344 | | | | 3.51 | % |
| | Crocs, Inc. (a) | | | 372,500 | | | | 5,188,925 | | | | 3.59 | % |
| | Dollar Tree, Inc. (a) | | | 90,300 | | | | 4,633,293 | | | | 3.21 | % |
| | Family Dollar Stores, Inc. | | | 99,500 | | | | 4,593,915 | | | | 3.18 | % |
| | HSN, Inc. (a) | | | 142,900 | | | | 4,278,426 | | | | 2.96 | % |
| | Jo-Ann Stores, Inc. (a) | | | 97,400 | | | | 4,212,550 | | | | 2.91 | % |
| | Tenneco, Inc. (a) | | | 156,000 | | | | 5,088,720 | | | | 3.52 | % |
| | Tractor Supply Co. | | | 113,936 | | | | 4,511,866 | | | | 3.12 | % |
| | TRW Automotive Holdings Corp. (a) | | | 119,300 | | | | 5,450,817 | | | | 3.77 | % |
| | Ulta Salon Cosmetics & Fragrance, Inc. (a) | | | 154,900 | | | | 4,753,881 | | | | 3.29 | % |
| | Valassis Communications, Inc. (a) | | | 129,200 | | | | 4,263,600 | | | | 2.95 | % |
| | Williams Sonoma, Inc. | | | 140,000 | | | | 4,531,800 | | | | 3.13 | % |
| | Wyndham Worldwide Corp. | | | 157,000 | | | | 4,513,750 | | | | 3.12 | % |
| | | | | | | | | 70,943,949 | | | | 49.07 | % |
| | Energy – 3.27% | | | | | | | | | | | | |
| | Complete Production Services, Inc. (a) | | | 202,000 | | | | 4,732,860 | | | | 3.27 | % |
| | | | | | | | | | | | | | |
| | Financials – 2.86% | | | | | | | | | | | | |
| | Jones Lang Lasalle, Inc. | | | 53,000 | | | | 4,137,180 | | | | 2.86 | % |
| | | | | | | | | | | | | | |
| | Health Care – 10.21% | | | | | | | | | | | | |
| | Amerigroup Corp. (a) | | | 112,000 | | | | 4,673,760 | | | | 3.23 | % |
| | Healthspring, Inc. (a) | | | 187,300 | | | | 5,467,287 | | | | 3.78 | % |
| | Magellan Health Services, Inc. (a) | | | 96,300 | | | | 4,622,400 | | | | 3.20 | % |
| | | | | | | | | 14,763,447 | | | | 10.21 | % |
| | Industrials – 17.29% | | | | | | | | | | | | |
| | Applied Industrial Technologies, Inc. | | | 145,200 | | | | 4,415,532 | | | | 3.05 | % |
| | ArvinMeritor, Inc. (a) | | | 298,700 | | | | 4,952,446 | | | | 3.43 | % |
| | Toro Co. | | | 77,000 | | | | 4,370,520 | | | | 3.02 | % |
| | U.S. Airways Group, Inc. (a) | | | 474,800 | | | | 5,597,892 | | | | 3.87 | % |
| | United Continental Holdings, Inc. (a) | | | 195,000 | | | | 5,662,800 | | | | 3.92 | % |
| | | | | | | | | 24,999,190 | | | | 17.29 | % |
The accompanying notes are an integral part of these financial statements.
SCHEDULE OF INVESTMENTS — HENNESSY FOCUS 30 FUND
| | COMMON STOCKS | | Number | | | | | | % of Net | |
| | | | of Shares | | | Value | | | Assets | |
| | Information Technology – 2.71% | | | | | | | | | |
| | Lexmark International (a) | | | 102,900 | | | $ | 3,913,287 | | | | 2.71 | % |
| | | | | | | | | | | | | | |
| | Materials – 12.84% | | | | | | | | | | | | |
| | Ferro Corp. (a) | | | 347,900 | | | | 4,773,188 | | | | 3.30 | % |
| | Lubrizol Corp. | | | 40,800 | | | | 4,181,592 | | | | 2.89 | % |
| | Polyone Corp. (a) | | | 381,200 | | | | 4,925,104 | | | | 3.41 | % |
| | Rockwood Holdings, Inc. (a) | | | 138,200 | | | | 4,687,744 | | | | 3.24 | % |
| | | | | | | | | 18,567,628 | | | | 12.84 | % |
| | | | | | | | | | | | | | |
| | Total Common Stocks (Cost $128,675,287) | | | | | | | 142,057,541 | | | | 98.25 | % |
| | | | | | | | | | | | | | |
| | WARRANTS – 0.00% | | | | | | | | | | | | |
| | Lantronix, Inc., Warrant Ω | | | | | | | | | | | | |
| | Expiration: February, 2011, Exercise Price: $0.85 | | | 158 | | | | 0 | | | | 0.00 | % |
| | | | | | | | | | | | | | |
| | Total Warrants (Cost $0) | | | | | | | 0 | | | | 0.00 | % |
| | | | | | | | | | | | | | |
| | SHORT-TERM INVESTMENT – 1.48% | | | | | | | | | | | | |
| | Money Market Funds – 1.48% | | | | | | | | | | | | |
| | Fidelity Government Portfolio – | | | | | | | | | | | | |
| | Institutional Class, 0.06% (b) | | | 2,133,285 | | | | 2,133,285 | | | | 1.48 | % |
| | | | | | | | | | | | | | |
| | Total Money Market Funds | | | | | | | | | | | | |
| | (Cost $2,133,285) | | | | | | | 2,133,285 | | | | 1.48 | % |
| | | | | | | | | | | | | | |
| | Total Short-Term Investments | | | | | | | | | | | | |
| | (Cost $2,133,285) | | | | | | | 2,133,285 | | | | 1.48 | % |
| | | | | | | | | | | | | | |
| | Total Investments – 99.73% | | | | | | | | | | | | |
| | (Cost 130,808,572) | | | | | | | 144,190,826 | | | | 99.73 | % |
| | | | | | | | | | | | | | |
| | Liabilities in Excess of Other Assets – 0.27% | | | | | | | 386,102 | | | | 0.27 | % |
| | TOTAL NET ASSETS – 100.00% | | | | | | $ | 144,576,928 | | | | 100.00 | % |
| (a) | Non-income producing security. |
| (b) | The rate listed is the Fund’s 7-day yield as of October 31, 2010. |
The accompanying notes are an integral part of these financial statements.
HENNESSY FUNDS 1-800-966-4354
The Fund has adopted authoritative fair valuation accounting standards which establish an authoritative definition of fair value and set out a hierarchy for measuring fair value. These standards require additional disclosures about the various inputs and valuation techniques used to develop the measurements of fair value and a discussion in changes in valuation techniques and related inputs during the period. These inputs are summarized in the three broad levels listed below.
The Fund has performed an analysis of all existing investments to determine the significance and character of all inputs to their fair value determination.
| Level 1 – | Quoted unadjusted prices for identical instruments in active markets to which the Fund has access at the date of measurement. |
| Level 2 – | Quoted prices for similar instruments in active markets; quoted prices for identical or similar instruments in markets that are not active; and model-derived valuations in which all significant inputs and significant value drivers are observable in active markets. Level 2 inputs are those in markets for which there are few transactions, the prices are not current, little public information exists or instances where prices vary substantially over time or among brokered market makers. |
| Level 3 – | Model derived valuations in which one or more significant inputs or significant value drivers are unobservable. Unobservable inputs are those inputs that reflect the Fund’s own assumptions that market participants would use to price the asset or liability based on the best available information. |
The inputs or methodology used for valuing securities are not an indication of the risk associated with investing in those securities.
The following is a summary of the inputs used to value the Fund’s net assets as of October 31, 2010:
| Common Stock | | Level 1 | | | Level 2 | | | Level 3 | | | Total | |
| Consumer Discretionary | | $ | 70,943,949 | | | $ | — | | | $ | — | | | $ | 70,943,949 | |
| Energy | | | 4,732,860 | | | | — | | | | — | | | | 4,732,860 | |
| Financials | | | 4,137,180 | | | | — | | | | — | | | | 4,137,180 | |
| Health Care | | | 14,763,447 | | | | — | | | | — | | | | 14,763,447 | |
| Industrials | | | 24,999,190 | | | | — | | | | — | | | | 24,999,190 | |
| Information Technology | | | 3,913,287 | | | | — | | | | — | | | | 3,913,287 | |
| Materials | | | 18,567,628 | | | | — | | | | — | | | | 18,567,628 | |
| Total Common Stock | | $ | 142,057,541 | | | $ | — | | | $ | — | | | $ | 142,057,541 | |
| Warrants | | $ | — | | | $ | — | | | $ | — | (1) | | $ | — | |
| Short-Term Investments | | $ | 2,133,285 | | | $ | — | | | $ | — | | | $ | 2,133,285 | |
| Total Investments in Securities | | $ | 144,190,826 | | | $ | — | | | $ | — | | | $ | 144,190,826 | |
| (1) | If the Lantronix, Inc. warrant would have had a value, it would have been a Level 3 fair value. The warrant has been fair valued at $0 during the entire reporting period. |
The accompanying notes are an integral part of these financial statements.
SCHEDULE OF INVESTMENTS — HENNESSY CORNERSTONE LARGE GROWTH FUND
HENNESSY CORNERSTONE
LARGE GROWTH FUND
(% of Net Assets)
| TOP TEN EQUITY HOLDINGS | % of net assets |
| Liberty Global, Inc. | 2.60% |
| Humana, Inc. | 2.52% |
| AutoZone, Inc. | 2.47% |
| Dollar Tree, Inc. | 2.37% |
| Freeport-McMoRan Copper & Gold, Inc. | 2.34% |
| Forest Laboratories, Inc. | 2.30% |
| Altria Group, Inc. | 2.29% |
| Philip Morris International, Inc. | 2.28% |
| DIRECTV | 2.27% |
| Crown Holdings, Inc. | 2.25% |
HENNESSY FUNDS 1-800-966-4354
| | COMMON STOCKS – 98.23% | | Number | | | | | | % of | |
| | | | of Shares | | | Value | | | Net Assets | |
| | Consumer Discretionary – 27.89% | | | | | | | | | |
| | Apollo Group, Inc. (a) | | | 24,000 | | | $ | 899,520 | | | | 1.14 | % |
| | AutoZone, Inc. (a) | | | 8,200 | | | | 1,948,566 | | | | 2.47 | % |
| | Best Buy Co., Inc. | | | 32,000 | | | | 1,375,360 | | | | 1.74 | % |
| | DIRECTV (a) | | | 41,200 | | | | 1,790,552 | | | | 2.27 | % |
| | Dish Network Corp. | | | 67,500 | | | | 1,340,550 | | | | 1.70 | % |
| | Dollar Tree, Inc. (a) | | | 36,400 | | | | 1,867,684 | | | | 2.37 | % |
| | Family Dollar Stores, Inc. | | | 37,900 | | | | 1,749,843 | | | | 2.22 | % |
| | The Gap, Inc. | | | 59,100 | | | | 1,123,491 | | | | 1.42 | % |
| | Liberty Global, Inc. (a) | | | 54,200 | | | | 2,048,218 | | | | 2.60 | % |
| | Mattel, Inc. | | | 63,900 | | | | 1,490,787 | | | | 1.89 | % |
| | Ross Stores, Inc. | | | 26,000 | | | | 1,533,740 | | | | 1.94 | % |
| | The McGraw-Hill Companies, Inc. | | | 44,200 | | | | 1,664,130 | | | | 2.11 | % |
| | TJX Companies, Inc. | | | 31,600 | | | | 1,450,124 | | | | 1.84 | % |
| | Yum Brands, Inc. | | | 34,700 | | | | 1,719,732 | | | | 2.18 | % |
| | | | | | | | | 22,002,297 | | | | 27.89 | % |
| | Consumer Staples – 20.21% | | | | | | | | | | | | |
| | Altria Group, Inc. | | | 71,100 | | | | 1,807,362 | | | | 2.29 | % |
| | Campbell Soup Co. | | | 42,300 | | | | 1,533,375 | | | | 1.94 | % |
| | Clorox Co. | | | 23,300 | | | | 1,550,615 | | | | 1.96 | % |
| | General Mills, Inc. | | | 42,800 | | | | 1,606,712 | | | | 2.04 | % |
| | H.J. Heinz Co. | | | 32,700 | | | | 1,605,897 | | | | 2.03 | % |
| | Kellogg Co. | | | 28,400 | | | | 1,427,384 | | | | 1.81 | % |
| | Kimberly – Clark Corp. | | | 24,500 | | | | 1,551,830 | | | | 1.97 | % |
| | Lorillard, Inc. | | | 19,200 | | | | 1,638,528 | | | | 2.08 | % |
| | Philip Morris International, Inc. | | | 30,700 | | | | 1,795,950 | | | | 2.28 | % |
| | Sysco Corp. | | | 48,500 | | | | 1,428,810 | | | | 1.81 | % |
| | | | | | | | | 15,946,463 | | | | 20.21 | % |
| | Energy – 3.07% | | | | | | | | | | | | |
| | Consol Energy, Inc. | | | 34,300 | | | | 1,260,868 | | | | 1.60 | % |
| | Diamond Offshore Drilling | | | 17,600 | | | | 1,164,416 | | | | 1.47 | % |
| | | | | | | | | 2,425,284 | | | | 3.07 | % |
| | Financials – 2.05% | | | | | | | | | | | | |
| | Moody’s Corp. | | | 59,800 | | | | 1,618,188 | | | | 2.05 | % |
The accompanying notes are an integral part of these financial statements.
SCHEDULE OF INVESTMENTS — HENNESSY CORNERSTONE LARGE GROWTH FUND
| | COMMON STOCKS | | Number | | | | | | % of | |
| | | | of Shares | | | Value | | | Net Assets | |
| | Health Care – 20.43% | | | | | | | | | |
| | Baxter International, Inc. | | | 31,300 | | | $ | 1,593,170 | | | | 2.02 | % |
| | Becton, Dickinson & Co. | | | 19,600 | | | | 1,480,192 | | | | 1.88 | % |
| | Bristol-Myers Squibb Co. | | | 61,400 | | | | 1,651,660 | | | | 2.09 | % |
| | Cardinal Health, Inc. | | | 41,600 | | | | 1,443,104 | | | | 1.83 | % |
| | CIGNA Corp. | | | 45,900 | | | | 1,615,221 | | | | 2.05 | % |
| | Eli Lilly & Co. | | | 42,600 | | | | 1,499,520 | | | | 1.90 | % |
| | Forest Laboratories, Inc. (a) | | | 55,000 | | | | 1,817,750 | | | | 2.30 | % |
| | Humana, Inc. (a) | | | 34,100 | | | | 1,987,689 | | | | 2.52 | % |
| | Johnson & Johnson | | | 23,100 | | | | 1,470,777 | | | | 1.86 | % |
| | Laboratory Corp. of America Holdings (a) | | | 19,200 | | | | 1,561,344 | | | | 1.98 | % |
| | | | | | | | | 16,120,427 | | | | 20.43 | % |
| | Industrials – 10.57% | | | | | | | | | | | | |
| | Flowserve Corp. | | | 12,800 | | | | 1,280,000 | | | | 1.62 | % |
| | Fluor Corp. | | | 28,500 | | | | 1,373,415 | | | | 1.74 | % |
| | Honeywell International, Inc. | | | 31,700 | | | | 1,493,387 | | | | 1.90 | % |
| | Joy Global, Inc. | | | 24,600 | | | | 1,745,370 | | | | 2.21 | % |
| | Lockheed Martin Corp. | | | 17,600 | | | | 1,254,704 | | | | 1.59 | % |
| | Raytheon Co. | | | 25,800 | | | | 1,188,864 | | | | 1.51 | % |
| | | | | | | | | 8,335,740 | | | | 10.57 | % |
| | Information Technology – 5.13% | | | | | | | | | | | | |
| | International Business Machines Corp. | | | 11,500 | | | | 1,651,400 | | | | 2.09 | % |
| | SAIC, Inc. (a) | | | 82,500 | | | | 1,282,050 | | | | 1.63 | % |
| | Western Digital Corp. (a) | | | 34,700 | | | | 1,111,094 | | | | 1.41 | % |
| | | | | | | | | 4,044,544 | | | | 5.13 | % |
| | Materials – 8.88% | | | | | | | | | | | | |
| | Crown Holdings, Inc. (a) | | | 55,200 | | | | 1,776,888 | | | | 2.25 | % |
| | FMC Corp. | | | 23,300 | | | | 1,703,230 | | | | 2.16 | % |
| | Freeport-McMoRan Copper & Gold, Inc. | | | 19,500 | | | | 1,846,260 | | | | 2.34 | % |
| | Lubrizol Corp. | | | 16,400 | | | | 1,680,836 | | | | 2.13 | % |
| | | | | | | | | 7,007,214 | | | | 8.88 | % |
| | | | | | | | | | | | | | |
| | Total Common Stocks (Cost $68,227,078) | | | | | | | 77,500,157 | | | | 98.23 | % |
The accompanying notes are an integral part of these financial statements.
HENNESSY FUNDS 1-800-966-4354
| | SHORT-TERM INVESTMENTS – 1.85% | | Number | | | | | | % of | |
| | | | of Shares | | | Value | | | Net Assets | |
| | Money Market Funds – 1.85% | | | | | | | | | |
| | Fidelity Government Portfolio – | | | | | | | | | |
| | Institutional Class, 0.06% (b) | | | 1,458,228 | | | $ | 1,458,228 | | | | 1.85 | % |
| | | | | | | | | | | | | | |
| | Total Money Market Funds | | | | | | | | | | | | |
| | (Cost $1,458,228) | | | | | | | 1,458,228 | | | | 1.85 | % |
| | | | | | | | | | | | | | |
| | Total Short-Term Investments | | | | | | | | | | | | |
| | (Cost $1,458,228) | | | | | | | 1,458,228 | | | | 1.85 | % |
| | | | | | | | | | | | | | |
| | Total Investments – 100.08% | | | | | | | | | | | | |
| | (Cost 69,685,306) | | | | | | | 78,958,385 | | | | 100.08 | % |
| | | | | | | | | | | | | | |
| | Liabilities in Excess of Other Assets – (0.08)% | | | | | | | (60,139 | ) | | | (0.08 | )% |
| | TOTAL NET ASSETS – 100.00% | | | | | | $ | 78,898,246 | | | | 100.00 | % |
Percentages are stated as a percent of net assets.
| (a) | Non-income producing security. |
| (b) | The rate listed is the Fund’s 7-day yield as of October 31, 2010. |
The accompanying notes are an integral part of these financial statements.
SCHEDULE OF INVESTMENTS — HENNESSY CORNERSTONE LARGE GROWTH FUND
Summary of Fair Value Exposure at October 31, 2010
The Fund has adopted authoritative fair valuation accounting standards which establish an authoritative definition of fair value and set out a hierarchy for measuring fair value. These standards require additional disclosures about the various inputs and valuation techniques used to develop the measurements of fair value and a discussion in changes in valuation techniques and related inputs during the period. These inputs are summarized in the three broad levels listed below.
The Fund has performed an analysis of all existing investments to determine the significance and character of all inputs to their fair value determination.
| Level 1 – | Quoted unadjusted prices for identical instruments in active markets to which the Fund has access at the date of measurement. |
| Level 2 – | Quoted prices for similar instruments in active markets; quoted prices for identical or similar instruments in markets that are not active; and model-derived valuations in which all significant inputs and significant value drivers are observable in active markets. Level 2 inputs are those in markets for which there are few transactions, the prices are not current, little public information exists or instances where prices vary substantially over time or among brokered market makers. |
| Level 3 – | Model derived valuations in which one or more significant inputs or significant value drivers are unobservable. Unobservable inputs are those inputs that reflect the Fund’s own assumptions that market participants would use to price the asset or liability based on the best available information. |
The inputs or methodology used for valuing securities are not an indication of the risk associated with investing in those securities.
The following is a summary of the inputs used to value the Fund’s net assets as of October 31, 2010:
| Common Stock | | Level 1 | | | Level 2 | | | Level 3 | | | Total | |
| Consumer Discretionary | | $ | 22,002,297 | | | $ | — | | | $ | — | | | $ | 22,002,297 | |
| Consumer Staples | | | 15,946,463 | | | | — | | | | — | | | | 15,946,463 | |
| Energy | | | 2,425,284 | | | | — | | | | — | | | | 2,425,284 | |
| Financials | | | 1,618,188 | | | | — | | | | — | | | | 1,618,188 | |
| Health Care | | | 16,120,427 | | | | — | | | | — | | | | 16,120,427 | |
| Industrials | | | 8,335,740 | | | | — | | | | — | | | | 8,335,740 | |
| Information Technology | | | 4,044,544 | | | | — | | | | — | | | | 4,044,544 | |
| Materials | | | 7,007,214 | | | | — | | | | — | | | | 7,007,214 | |
| Total Common Stock | | $ | 77,500,157 | | | $ | — | | | $ | — | | | $ | 77,500,157 | |
| Short-Term Investments | | $ | 1,458,228 | | | $ | — | | | $ | — | | | $ | 1,458,228 | |
| Total Investments in Securities | | $ | 78,958,385 | | | $ | — | | | $ | — | | | $ | 78,958,385 | |
The accompanying notes are an integral part of these financial statements.
HENNESSY FUNDS 1-800-966-4354
HENNESSY CORNERSTONE VALUE FUND
(% of Net Assets)
| TOP TEN EQUITY HOLDINGS | % of net assets |
| Limited Brands, Inc. | 2.73% |
| EI Du Pont de Nemours & Co. | 2.61% |
| Eaton Corp. | 2.47% |
| Hershey Co. | 2.46% |
| PPG Industries, Inc. | 2.33% |
| Boeing Co. | 2.32% |
| Emerson Electric Co. | 2.31% |
| Altria Group, Inc. | 2.27% |
| BCE, Inc. | 2.27% |
| McDonald’s Corp. | 2.20% |
SCHEDULE OF INVESTMENTS — HENNESSY CORNERSTONE VALUE FUND
| | COMMON STOCKS – 97.31% | | Number | | | | | | % of Net | |
| | | | of Shares | | | Value | | | Assets | |
| | Consumer Discretionary – 8.89% | | | | | | | | | |
| | Home Depot, Inc. | | | 96,500 | | | $ | 2,979,920 | | | | 1.90 | % |
| | Limited Brands, Inc. | | | 146,200 | | | | 4,296,818 | | | | 2.73 | % |
| | Mattel, Inc. | | | 138,800 | | | | 3,238,204 | | | | 2.06 | % |
| | McDonald’s Corp. | | | 44,500 | | | | 3,460,765 | | | | 2.20 | % |
| | | | | | | | | 13,975,707 | | | | 8.89 | % |
| | Consumer Staples – 24.53% | | | | | | | | | | | | |
| | Altria Group, Inc. | | | 140,700 | | | | 3,576,594 | | | | 2.27 | % |
| | Campbell Soup Co. | | | 83,700 | | | | 3,034,125 | | | | 1.93 | % |
| | ConAgra Foods, Inc. | | | 124,700 | | | | 2,804,503 | | | | 1.78 | % |
| | Diageo PLC – ADR (c) | | | 40,500 | | | | 2,997,000 | | | | 1.91 | % |
| | Hershey Co. | | | 78,300 | | | | 3,875,067 | | | | 2.46 | % |
| | H.J. Heinz Co. | | | 65,800 | | | | 3,231,438 | | | | 2.06 | % |
| | Kimberly Clark Corp. | | | 43,600 | | | | 2,761,624 | | | | 1.76 | % |
| | Kraft Foods, Inc. | | | 102,300 | | | | 3,301,221 | | | | 2.10 | % |
| | Philip Morris International, Inc. | | | 56,800 | | | | 3,322,800 | | | | 2.11 | % |
| | Reynolds American, Inc. | | | 52,000 | | | | 3,374,800 | | | | 2.15 | % |
| | Sara Lee Corp. | | | 231,500 | | | | 3,317,395 | | | | 2.11 | % |
| | Sysco Corp. | | | 100,900 | | | | 2,972,514 | | | | 1.89 | % |
| | | | | | | | | 38,569,081 | | | | 24.53 | % |
| | Energy – 10.34% | | | | | | | | | | | | |
| | BP PLC – ADR (c) | | | 49,200 | | | | 2,008,836 | | | | 1.28 | % |
| | Chevron Corp. | | | 35,900 | | | | 2,965,699 | | | | 1.88 | % |
| | ENI SPA – ADR (c) | | | 56,700 | | | | 2,547,531 | | | | 1.62 | % |
| | Marathon Oil Corp. | | | 89,400 | | | | 3,179,958 | | | | 2.02 | % |
| | Royal Dutch Shell PLC – ADR (c) | | | 47,600 | | | | 3,090,668 | | | | 1.97 | % |
| | Total SA – ADR (c) | | | 45,300 | | | | 2,467,944 | | | | 1.57 | % |
| | | | | | | | | 16,260,636 | | | | 10.34 | % |
| | Financials – 2.03% | | | | | | | | | | | | |
| | Marsh & McLennan Companies, Inc. | | | 127,400 | | | | 3,182,452 | | | | 2.03 | % |
| | | | | | | | | | | | | | |
| | Health Care – 6.85% | | | | | | | | | | | | |
| | Bristol-Myers Squibb Co. | | | 107,200 | | | | 2,883,680 | | | | 1.83 | % |
| | GlaxoSmithKline PLC – ADR (c) | | | 66,100 | | | | 2,580,544 | | | | 1.64 | % |
The accompanying notes are an integral part of these financial statements.
HENNESSY FUNDS 1-800-966-4354
| | COMMON STOCKS | | Number | | | | | | % of Net | |
| | | | of Shares | | | Value | | | Assets | |
| | Health Care (Continued) | | | | | | | | | |
| | Merck & Co., Inc. | | | 73,900 | | | $ | 2,681,092 | | | | 1.71 | % |
| | Pfizer, Inc. | | | 151,000 | | | | 2,627,400 | | | | 1.67 | % |
| | | | | | | | | 10,772,716 | | | | 6.85 | % |
| | Industrials – 15.88% | | | | | | | | | | | | |
| | Boeing Co. | | | 51,700 | | | | 3,652,088 | | | | 2.32 | % |
| | Eaton Corp. | | | 43,700 | | | | 3,881,871 | | | | 2.47 | % |
| | Emerson Electric Co. | | | 66,200 | | | | 3,634,380 | | | | 2.31 | % |
| | Lockheed Martin Corp. | | | 36,200 | | | | 2,580,698 | | | | 1.64 | % |
| | Pitney Bowes, Inc. | | | 121,100 | | | | 2,656,934 | | | | 1.69 | % |
| | RR Donnelley & Sons Co. | | | 127,800 | | | | 2,357,910 | | | | 1.50 | % |
| | United Parcel Service, Inc. | | | 47,700 | | | | 3,212,118 | | | | 2.04 | % |
| | Waste Management, Inc. | | | 83,800 | | | | 2,993,336 | | | | 1.91 | % |
| | | | | | | | | 24,969,335 | | | | 15.88 | % |
| | Information Technology – 6.88% | | | | | | | | | | | | |
| | Automatic Data Processing, Inc. | | | 65,300 | | | | 2,900,626 | | | | 1.84 | % |
| | Intel Corp. | | | 140,800 | | | | 2,825,856 | | | | 1.80 | % |
| | Nokia Corp. – ADR (c) | | | 222,000 | | | | 2,370,960 | | | | 1.51 | % |
| | Taiwan Semiconductor | | | | | | | | | | | | |
| | Manufacturing Ltd. – ADR (c) | | | 248,800 | | | | 2,714,408 | | | | 1.73 | % |
| | | | | | | | | 10,811,850 | | | | 6.88 | % |
| | Materials – 8.12% | | | | | | | | | | | | |
| | EI Du Pont de Nemours & Co. | | | 86,700 | | | | 4,099,176 | | | | 2.61 | % |
| | MeadWestvaco Corp. | | | 100,500 | | | | 2,585,865 | | | | 1.65 | % |
| | Nucor Corp. | | | 63,100 | | | | 2,411,682 | | | | 1.53 | % |
| | PPG Industries, Inc. | | | 47,800 | | | | 3,666,260 | | | | 2.33 | % |
| | | | | | | | | 12,762,983 | | | | 8.12 | % |
| | Telecommunication Services – 13.79% | | | | | | | | | | | | |
| | AT&T, Inc. | | | 101,200 | | | | 2,884,200 | | | | 1.83 | % |
| | BCE, Inc. (c) | | | 106,500 | | | | 3,568,815 | | | | 2.27 | % |
| | China Mobile Ltd. – ADR (c) | | | 60,200 | | | | 3,092,474 | | | | 1.97 | % |
| | Frontier Communications Corp. | | | 20,200 | | | | 177,356 | | | | 0.11 | % |
| | Mobile Telesystems OJSC – ADR (c) | | | 143,200 | | | | 3,100,280 | | | | 1.97 | % |
| | Telefonica De Argentina – ADR (a)(c) Ω | | | 100 | | | | — | | | | 0.00 | % |
The accompanying notes are an integral part of these financial statements.
SCHEDULE OF INVESTMENTS — HENNESSY CORNERSTONE VALUE FUND
| | COMMON STOCKS | | Number | | | | | | % of Net | |
| | | | of Shares | | | Value | | | Assets | |
| | Telecommunication Services (Continued) | | | | | | | | | |
| | Telefonica SA – ADR (c) | | | 33,600 | | | $ | 2,726,304 | | | | 1.74 | % |
| | Verizon Communications, Inc. | | | 84,300 | | | | 2,737,221 | | | | 1.74 | % |
| | Vodafone Group PLC – ADR (c) | | | 123,600 | | | | 3,400,236 | | | | 2.16 | % |
| | | | | | | | | 21,686,886 | | | | 13.79 | % |
| | | | | | | | | | | | | | |
| | Total Common Stocks (Cost $134,660,237) | | | | | | | 152,991,646 | | | | 97.31 | % |
| | | | | | | | | | | | | | |
| | SHORT-TERM INVESTMENT – 2.63% | | | | | | | | | | | | |
| | Money Market Funds – 2.63% | | | | | | | | | | | | |
| | Fidelity Government Portfolio – | | | | | | | | | | | | |
| | Institutional Class, 0.06% (b) | | | 4,143,318 | | | | 4,143,318 | | | | 2.63 | % |
| | | | | | | | | | | | | | |
| | Total Money Market Funds | | | | | | | | | | | | |
| | (Cost $4,143,318) | | | | | | | 4,143,318 | | | | 2.63 | % |
| | | | | | | | | | | | | | |
| | Total Short-Term Investment | | | | | | | | | | | | |
| | (Cost $4,143,318) | | | | | | | 4,143,318 | | | | 2.63 | % |
| | | | | | | | | | | | | | |
| | Total Investments – 99.94% | | | | | | | | | | | | |
| | (Cost 138,803,555) | | | | | | | 157,134,964 | | | | 99.94 | % |
| | | | | | | | | | | | | | |
| | Other Assets in Excess of Liabilities – 0.06% | | | | | | | 86,979 | | | | 0.06 | % |
| | TOTAL NET ASSETS – 100.00% | | | | | | $ | 157,221,943 | | | | 100.00 | % |
| (a) | Non-income producing security. |
| (b) | The rate listed is the Fund’s 7-day yield as of October 31, 2010. |
| (c) | Foreign issued security. |
The accompanying notes are an integral part of these financial statements.
HENNESSY FUNDS 1-800-966-4354
Summary of Fair Value Exposure at October 31, 2010
The Fund has adopted authoritative fair valuation accounting standards which establish an authoritative definition of fair value and set out a hierarchy for measuring fair value. These standards require additional disclosures about the various inputs and valuation techniques used to develop the measurements of fair value and a discussion in changes in valuation techniques and related inputs during the period. These inputs are summarized in the three broad levels listed below.
The Fund has performed an analysis of all existing investments to determine the significance and character of all inputs to their fair value determination.
| Level 1 – | Quoted unadjusted prices for identical instruments in active markets to which the Fund has access at the date of measurement. |
| Level 2 – | Quoted prices for similar instruments in active markets; quoted prices for identical or similar instruments in markets that are not active; and model-derived valuations in which all significant inputs and significant value drivers are observable in active markets. Level 2 inputs are those in markets for which there are few transactions, the prices are not current, little public information exists or instances where prices vary substantially over time or among brokered market makers. |
| Level 3 – | Model derived valuations in which one or more significant inputs or significant value drivers are unobservable. Unobservable inputs are those inputs that reflect the Fund’s own assumptions that market participants would use to price the asset or liability based on the best available information. |
The inputs or methodology used for valuing securities are not an indication of the risk associated with investing in those securities.
The following is a summary of the inputs used to value the Fund’s net assets as of October 31, 2010:
| Common Stock | | Level 1 | | | Level 2 | | | Level 3 | | | Total | |
| Consumer Discretionary | | $ | 13,975,707 | | | $ | — | | | $ | — | | | $ | 13,975,707 | |
| Consumer Staples | | | 38,569,081 | | | | — | | | | — | | | | 38,569,081 | |
| Energy | | | 16,260,636 | | | | — | | | | — | | | | 16,260,636 | |
| Financials | | | 3,182,452 | | | | — | | | | — | | | | 3,182,452 | |
| Health Care | | | 10,772,716 | | | | — | | | | — | | | | 10,772,716 | |
| Industrials | | | 24,969,335 | | | | — | | | | — | | | | 24,969,335 | |
| Information Technology | | | 10,811,850 | | | | — | | | | — | | | | 10,811,850 | |
| Materials | | | 12,762,983 | | | | — | | | | — | | | | 12,762,983 | |
| Telecommunication Services | | | 21,686,886 | | | | — | | | | — | (1) | | | 21,686,886 | |
| Total Common Stock | | $ | 152,991,646 | | | $ | — | | | $ | — | | | $ | 152,991,646 | |
| Short-Term Investments | | $ | 4,143,318 | | | $ | — | | | $ | — | | | $ | 4,143,318 | |
| Total Investments in Securities | | $ | 157,134,964 | | | $ | — | | | $ | — | | | $ | 157,134,964 | |
| (1) | If Telefonica de Argentina would have had a value, it would have been a Level 3 fair value. The security has been fair valued at $0 during the entire reporting period. |
The accompanying notes are an integral part of these financial statements.
SCHEDULE OF INVESTMENTS — HENNESSY TOTAL RETURN FUND
HENNESSY TOTAL RETURN FUND
(% of Net Assets)
| TOP TEN EQUITY HOLDINGS | % of net assets |
| EI Du Pont de Nemours & Co. | 7.30% |
| Chevron Corp. | 7.19% |
| Kraft Foods, Inc. | 6.70% |
| Verizon Communications, Inc. | 6.68% |
| Pfizer, Inc. | 6.63% |
| AT&T, Inc. | 6.50% |
| Merck & Co., Inc. | 6.25% |
| Johnson & Johnson | 5.74% |
| Intel Corp. | 4.79% |
| McDonald’s Corp. | 4.71% |
HENNESSY FUNDS 1-800-966-4354
| | COMMON STOCKS – 69.50% | | Number | | | | | | % of Net | |
| | | | of Shares | | | Value | | | Assets | |
| | Consumer Discretionary – 8.36% | | | | | | | | | |
| | Home Depot, Inc. | | | 81,600 | | | $ | 2,519,808 | | | | 3.65 | % |
| | McDonald’s Corp. | | | 41,800 | | | | 3,250,786 | | | | 4.71 | % |
| | | | | | | | | 5,770,594 | | | | 8.36 | % |
| | Consumer Staples – 9.89% | | | | | | | | | | | | |
| | Coca-Cola Co. | | | 35,900 | | | | 2,201,388 | | | | 3.19 | % |
| | Kraft Foods, Inc. | | | 143,400 | | | | 4,627,518 | | | | 6.70 | % |
| | | | | | | | | 6,828,906 | | | | 9.89 | % |
| | Energy – 7.19% | | | | | | | | | | | | |
| | Chevron Corp. | | | 60,100 | | | | 4,964,861 | | | | 7.19 | % |
| | | | | | | | | | | | | | |
| | Health Care – 18.62% | | | | | | | | | | | | |
| | Johnson & Johnson | | | 62,300 | | | | 3,966,641 | | | | 5.74 | % |
| | Merck & Co., Inc. | | | 119,000 | | | | 4,317,320 | | | | 6.25 | % |
| | Pfizer, Inc. | | | 263,200 | | | | 4,579,680 | | | | 6.63 | % |
| | | | | | | | | 12,863,641 | | | | 18.62 | % |
| | Information Technology – 4.79% | | | | | | | | | | | | |
| | Intel Corp. | | | 165,000 | | | | 3,311,550 | | | | 4.79 | % |
| | | | | | | | | | | | | | |
| | Materials – 7.30% | | | | | | | | | | | | |
| | EI Du Pont de Nemours & Co. | | | 106,700 | | | | 5,044,776 | | | | 7.30 | % |
| | | | | | | | | | | | | | |
| | Telecommunication Services – 13.35% | | | | | | | | | | | | |
| | AT&T, Inc. | | | 157,500 | | | | 4,488,750 | | | | 6.50 | % |
| | Frontier Communications Corp. | | | 13,776 | | | | 120,954 | | | | 0.17 | % |
| | Verizon Communications, Inc. | | | 142,100 | | | | 4,613,987 | | | | 6.68 | % |
| | | | | | | | | 9,223,691 | | | | 13.35 | % |
| | | | | | | | | | | | | | |
| | Total Common Stocks (Cost $45,110,938) | | | | | | | 48,008,019 | | | | 69.50 | % |
| | | | | | | | | | | | | | |
| | SHORT-TERM INVESTMENT – 65.41% | | | | | | | | | | | | |
| | Money Market Funds – 4.62% | | | | | | | | | | | | |
| | Fidelity Government Portfolio – | | | | | | | | | | | | |
| | Institutional Class, 0.06% (a) | | | 3,190,272 | | | | 3,190,272 | | | | 4.62 | % |
| | | | | | | | | | | | | | |
| | Total Money Market Funds | | | | | | | | | | | | |
| | (Cost $3,190,272) | | | | | | | 3,190,272 | | | | 4.62 | % |
The accompanying notes are an integral part of these financial statements.
SCHEDULE OF INVESTMENTS — HENNESSY TOTAL RETURN FUND
| | SHORT-TERM INVESTMENT | | Principal | | | | | | % of Net | |
| | | | Value | | | Value | | | Assets | |
| | U.S. Treasury Bills* – 60.79% | | | | | | | | | |
| | 0.14%, 11/12/2010 (b) | | $ | 14,000,000 | | | $ | 13,999,465 | | | | 20.27 | % |
| | 0.12%, 12/16/2010 (b) | | | 14,000,000 | | | | 13,997,638 | | | | 20.26 | % |
| | 0.13%, 1/20/2011 (b) | | | 14,000,000 | | | | 13,996,822 | | | | 20.26 | % |
| | | | | | | | | | | | | | |
| | Total U.S. Treasury Bills | | | | | | | | | | | | |
| | (Cost $41,993,448) | | | | | | | 41,993,925 | | | | 60.79 | % |
| | | | | | | | | | | | | | |
| | Total Short-Term Investments | | | | | | | | | | | | |
| | (Cost $45,183,720) | | | | | | | 45,184,197 | | | | 65.41 | % |
| | | | | | | | | | | | | | |
| | Total Investments – 134.91% | | | | | | | | | | | | |
| | (Cost 90,294,658) | | | | | | | 93,192,216 | | | | 134.91 | % |
| | | | | | | | | | | | | | |
| | Liabilities in Excess of Other Assets – (34.91)% | | | | | | | (24,116,415 | ) | | | (34.91 | )% |
| | TOTAL NET ASSETS – 100.00% | | | | | | $ | 69,075,801 | | | | 100.00 | % |
| (a) | The rate listed is the Fund’s 7-day yield as of October 31, 2010. |
| (b) | The rate listed is discount rate at issue. |
| * | Collateral or partial collateral for reverse repurchase agreements. |
The accompanying notes are an integral part of these financial statements.
HENNESSY FUNDS 1-800-966-4354
Summary of Fair Value Exposure at October 31, 2010
The Fund has adopted authoritative fair valuation accounting standards which establish an authoritative definition of fair value and set out a hierarchy for measuring fair value. These standards require additional disclosures about the various inputs and valuation techniques used to develop the measurements of fair value and a discussion in changes in valuation techniques and related inputs during the period. These inputs are summarized in the three broad levels listed below.
The Fund has performed an analysis of all existing investments to determine the significance and character of all inputs to their fair value determination.
| Level 1 – | Quoted unadjusted prices for identical instruments in active markets to which the Fund has access at the date of measurement. |
| Level 2 – | Quoted prices for similar instruments in active markets; quoted prices for identical or similar instruments in markets that are not active; and model-derived valuations in which all significant inputs and significant value drivers are observable in active markets. Level 2 inputs are those in markets for which there are few transactions, the prices are not current, little public information exists or instances where prices vary substantially over time or among brokered market makers. |
| Level 3 – | Model derived valuations in which one or more significant inputs or significant value drivers are unobservable. Unobservable inputs are those inputs that reflect the Fund’s own assumptions that market participants would use to price the asset or liability based on the best available information. |
The inputs or methodology used for valuing securities are not an indication of the risk associated with investing in those securities.
The following is a summary of the inputs used to value the Fund’s net assets as of October 31, 2010:
| Common Stock | | Level 1 | | | Level 2 | | | Level 3 | | | Total | |
| Consumer Discretionary | | $ | 5,770,594 | | | $ | — | | | $ | — | | | $ | 5,770,594 | |
| Consumer Staples | | | 6,828,906 | | | | — | | | | — | | | | 6,828,906 | |
| Energy | | | 4,964,861 | | | | — | | | | — | | | | 4,964,861 | |
| Health Care | | | 12,863,641 | | | | — | | | | — | | | | 12,863,641 | |
| Information Technology | | | 3,311,550 | | | | — | | | | — | | | | 3,311,550 | |
| Materials | | | 5,044,776 | | | | — | | | | — | | | | 5,044,776 | |
| Telecommunication Services | | | 9,223,691 | | | | — | | | | — | | | | 9,223,691 | |
| Total Common Stock | | $ | 48,008,019 | | | $ | — | | | $ | — | | | $ | 48,008,019 | |
| Short-Term Investments | | $ | 3,190,272 | | | $ | 41,993,925 | | | $ | — | | | $ | 45,184,197 | |
| Total Investments in Securities | | $ | 51,198,291 | | | $ | 41,993,925 | | | $ | — | | | $ | 93,192,216 | |
The accompanying notes are an integral part of these financial statements.
SCHEDULE OF INVESTMENTS — HENNESSY BALANCED FUND
HENNESSY BALANCED FUND
(% of Net Assets)
| TOP TEN EQUITY HOLDINGS | % of net assets |
| EI Du Pont de Nemours & Co. | 5.97% |
| AT&T, Inc. | 5.06% |
| Chevron Corp. | 4.99% |
| Verizon Communications, Inc. | 4.99% |
| Kraft Foods, Inc. | 4.89% |
| McDonald’s Corp. | 4.70% |
| Pfizer, Inc. | 4.48% |
| Merck & Co., Inc. | 4.25% |
| Home Depot, Inc. | 4.10% |
| Coca-Cola Co. | 2.80% |
HENNESSY FUNDS 1-800-966-4354
| | COMMON STOCKS – 50.06% | | Number | | | | | | % of Net | |
| | | | of Shares | | | Value | | | Assets | |
| | Consumer Discretionary – 8.80% | | | | | | | | | |
| | Home Depot, Inc. | | | 16,600 | | | $ | 512,608 | | | | 4.10 | % |
| | McDonald’s Corp. | | | 7,550 | | | | 587,163 | | | | 4.70 | % |
| | | | | | | | | 1,099,771 | | | | 8.80 | % |
| | Consumer Staples – 7.69% | | | | | | | | | | | | |
| | Coca-Cola Co. | | | 5,700 | | | | 349,524 | | | | 2.80 | % |
| | Kraft Foods, Inc. | | | 18,950 | | | | 611,517 | | | | 4.89 | % |
| | | | | | | | | 961,041 | | | | 7.69 | % |
| | Energy – 4.99% | | | | | | | | | | | | |
| | Chevron Corp. | | | 7,550 | | | | 623,706 | | | | 4.99 | % |
| | | | | | | | | | | | | | |
| | Health Care – 9.77% | | | | | | | | | | | | |
| | Johnson & Johnson | | | 2,050 | | | | 130,523 | | | | 1.04 | % |
| | Merck & Co., Inc. | | | 14,650 | | | | 531,502 | | | | 4.25 | % |
| | Pfizer, Inc. | | | 32,200 | | | | 560,280 | | | | 4.48 | % |
| | | | | | | | | 1,222,305 | | | | 9.77 | % |
| | Industrials – 1.19% | | | | | | | | | | | | |
| | Caterpillar, Inc. | | | 1,900 | | | | 149,340 | | | | 1.19 | % |
| | | | | | | | | | | | | | |
| | Information Technology – 1.32% | | | | | | | | | | | | |
| | Intel Corp. | | | 8,250 | | | | 165,577 | | | | 1.32 | % |
| | | | | | | | | | | | | | |
| | Materials – 5.97% | | | | | | | | | | | | |
| | EI Du Pont de Nemours & Co. | | | 15,800 | | | | 747,024 | | | | 5.97 | % |
| | | | | | | | | | | | | | |
| | Telecommunication Services – 10.33% | | | | | | | | | | | | |
| | AT&T, Inc. | | | 22,200 | | | | 632,700 | | | | 5.06 | % |
| | Frontier Communications Corp. | | | 3,996 | | | | 35,085 | | | | 0.28 | % |
| | Verizon Communications, Inc. | | | 19,200 | | | | 623,424 | | | | 4.99 | % |
| | | | | | | | | 1,291,209 | | | | 10.33 | % |
| | | | | | | | | | | | | | |
| | Total Common Stocks (Cost $5,848,677) | | | | | | | 6,259,973 | | | | 50.06 | % |
The accompanying notes are an integral part of these financial statements.
SCHEDULE OF INVESTMENTS — HENNESSY BALANCED FUND
| | SHORT-TERM INVESTMENTS – 49.68% | | Shares/Principal | | | | | | % of Net | |
| | | | Amount | | | Value | | | Assets | |
| | Money Market Funds – 5.72% | | | | | | | | | |
| | Federated Government | | | | | | | | | |
| | Obligation – Class I. 0.05% (a) | | | 329,047 | | | $ | 329,047 | | | | 2.63 | % |
| | Fidelity Government Portfolio – | | | | | | | | | | | | |
| | Institutional Class, 0.06% (a) | | | 386,232 | | | | 386,232 | | | | 3.09 | % |
| | | | | | | | | | | | | | |
| | Total Money Market Funds (Cost $715,279) | | | | | | | 715,279 | | | | 5.72 | % |
| | | | | | | | | | | | | | |
| | U.S. Treasury Bills – 43.96% | | | | | | | | | | | | |
| | 1.25%, 11/30/2010 | | $ | 1,100,000 | | | | 1,101,075 | | | | 8.81 | % |
| | 4.25%, 01/15/2011 | | | 700,000 | | | | 705,934 | | | | 5.65 | % |
| | 5.00%, 02/15/2011 | | | 1,300,000 | | | | 1,318,231 | | | | 10.54 | % |
| | 0.87%, 04/30/2011 | | | 200,000 | | | | 200,719 | | | | 1.60 | % |
| | 0.87%, 05/31/2011 | | | 300,000 | | | | 301,242 | | | | 2.41 | % |
| | 5.00%, 08/15/2011 | | | 900,000 | | | | 933,962 | | | | 7.47 | % |
| | 4.50%, 09/30/2011 | | | 900,000 | | | | 934,980 | | | | 7.48 | % |
| | | | | | | | | | | | | | |
| | Total U.S. Treasury Bills | | | | | | | | | | | | |
| | (Cost $5,494,005) | | | | | | | 5,496,143 | | | | 43.96 | % |
| | | | | | | | | | | | | | |
| | Total Short-Term Investments | | | | | | | | | | | | |
| | (Cost $6,209,284) | | | | | | | 6,211,422 | | | | 49.68 | % |
| | | | | | | | | | | | | | |
| | Total Investments – 99.74% | | | | | | | | | | | | |
| | (Cost 12,057,961) | | | | | | | 12,471,395 | | | | 99.74 | % |
| | | | | | | | | | | | | | |
| | Other Assets in Excess of Liabilities – 0.26% | | | | | | | 32,369 | | | | 0.26 | % |
| | TOTAL NET ASSETS – 100.00% | | | | | | $ | 12,503,764 | | | | 100.00 | % |
| (a) | The rate listed is the Fund’s 7-day yield as of October 31, 2010. |
| (b) | The rate listed is the discount rate at issue. |
The accompanying notes are an integral part of these financial statements.
HENNESSY FUNDS 1-800-966-4354
The Fund has adopted authoritative fair valuation accounting standards which establish an authoritative definition of fair value and set out a hierarchy for measuring fair value. These standards require additional disclosures about the various inputs and valuation techniques used to develop the measurements of fair value and a discussion in changes in valuation techniques and related inputs during the period. These inputs are summarized in the three broad levels listed below.
The Fund has performed an analysis of all existing investments to determine the significance and character of all inputs to their fair value determination.
| Level 1 – | Quoted unadjusted prices for identical instruments in active markets to which the Fund has access at the date of measurement. |
| Level 2 – | Quoted prices for similar instruments in active markets; quoted prices for identical or similar instruments in markets that are not active; and model-derived valuations in which all significant inputs and significant value drivers are observable in active markets. Level 2 inputs are those in markets for which there are few transactions, the prices are not current, little public information exists or instances where prices vary substantially over time or among brokered market makers. |
| Level 3 – | Model derived valuations in which one or more significant inputs or significant value drivers are unobservable. Unobservable inputs are those inputs that reflect the Fund’s own assumptions that market participants would use to price the asset or liability based on the best available information. |
The inputs or methodology used for valuing securities are not an indication of the risk associated with investing in those securities.
The following is a summary of the inputs used to value the Fund’s net assets as of October 31, 2010:
| Common Stock | | Level 1 | | | Level 2 | | | Level 3 | | | Total | |
| Consumer Discretionary | | $ | 1,099,771 | | | $ | — | | | $ | — | | | $ | 1,099,771 | |
| Consumer Staples | | | 961,041 | | | | — | | | | — | | | | 961,041 | |
| Energy | | | 623,706 | | | | — | | | | — | | | | 623,706 | |
| Health Care | | | 1,222,305 | | | | — | | | | — | | | | 1,222,305 | |
| Industrials | | | 149,340 | | | | — | | | | — | | | | 149,340 | |
| Information Technology | | | 165,577 | | | | — | | | | — | | | | 165,577 | |
| Materials | | | 747,024 | | | | — | | | | — | | | | 747,024 | |
| Telecommunication Services | | | 1,291,209 | | | | — | | | | — | | | | 1,291,209 | |
| Total Common Stock | | $ | 6,259,973 | | | $ | — | | | $ | — | | | $ | 6,259,973 | |
| Short-Term Investments | | $ | 715,279 | | | $ | 5,496,143 | | | $ | — | | | $ | 6,211,422 | |
| Total Investments in Securities | | $ | 6,975,252 | | | $ | 5,496,143 | | | $ | — | | | $ | 12,471,395 | |
The accompanying notes are an integral part of these financial statements.
SCHEDULE OF INVESTMENTS — HENNESSY BALANCED FUND
(This Page Intentionally Left Blank.)
HENNESSY FUNDS 1-800-966-4354
Financial Statements
Statements of Assets and Liabilities as of October 31, 2010 |
| | | HENNESSY | |
| | | CORNERSTONE | |
| | | GROWTH FUND | |
| ASSETS: | | | |
| Investments in securities, at value (cost $183,696,193, $27,823,349, | | | |
| $130,808,572, $69,685,306, $138,803,555, $90,294,658 and $12,057,961, respectively) | | $ | 210,506,933 | |
| Dividends and interest receivable | | | 158,430 | |
| Receivable for fund shares sold | | | 59,709 | |
| Prepaid expenses and other assets | | | 32,880 | |
| Total Assets | | | 210,757,952 | |
| | | | | |
| LIABILITIES: | | | | |
| Payable for fund shares redeemed | | | 112,556 | |
| Payable to advisor | | | 131,685 | |
| Payable to administrator | | | 168,448 | |
| Reverse repurchase agreement | | | — | |
| Accrued interest payable | | | 87 | |
| Accrued service fees | | | 17,533 | |
| Accrued expenses and other payables | | | 94,210 | |
| Total Liabilities | | | 524,519 | |
| NET ASSETS | | $ | 210,233,433 | |
| | | | | |
| NET ASSETS CONSIST OF: | | | | |
| Capital stock | | $ | 461,422,902 | |
| Accumulated net investment income | | | — | |
| Accumulated net realized gain (loss) on investments | | | (278,000,209 | ) |
| Unrealized net appreciation (depreciation) on investments | | | 26,810,740 | |
| Total Net Assets | | $ | 210,233,433 | |
| | | | | |
| NET ASSETS | | | | |
| Original Class: | | | | |
| Shares authorized ($.0001 par value) | | | 25,000,000,000 | |
| Net assets applicable to outstanding Original Class shares | | | 207,108,776 | |
| Shares issued and outstanding | | | 20,144,907 | |
| Net asset value, offering price and redemption price per share | | $ | 10.28 | |
| | | | | |
| Institutional Class: | | | | |
| Shares authorized ($.0001 par value) | | | 25,000,000,000 | |
| Net assets applicable to outstanding Institutional Class shares | | | 3,124,657 | |
| Shares issued and outstanding | | | 301,249 | |
| Net asset value, offering price and redemption price per share | | $ | 10.37 | |
The accompanying notes are an integral part of these financial statements.
FINANCIAL STATEMENTS — STATEMENTS OF ASSETS AND LIABILITIES
| HENNESSY | | | | | | HENNESSY | | | | | | | | | | |
| CORNERSTONE | | | HENNESSY | | | CORNERSTONE | | | HENNESSY | | | HENNESSY | | | HENNESSY | |
| GROWTH FUND, | | | FOCUS 30 | | | LARGE GROWTH | | | CORNERSTONE | | | TOTAL RETURN | | | BALANCED | |
| SERIES II | | | FUND | | | FUND | | | VALUE FUND | | | FUND | | | FUND | |
| | | | | | | | | | | | | | | | | |
| | | | | | | | | | | | | | | | | |
| $ | 30,698,928 | | | $ | 144,190,826 | | | $ | 78,958,385 | | | $ | 157,134,964 | | | $ | 93,192,216 | | | $ | 12,471,395 | |
| | 6,790 | | | | 21,181 | | | | 95,783 | | | | 389,961 | | | | 133,409 | | | | 63,750 | |
| | 735 | | | | 695,614 | | | | 5,554 | | | | 108,528 | | | | 186,159 | | | | 6 | |
| | 11,339 | | | | 18,346 | | | | 27,742 | | | | 31,719 | | | | 18,723 | | | | 15,635 | |
| | 30,717,792 | | | | 144,925,967 | | | | 79,087,464 | | | | 157,665,172 | | | | 93,530,507 | | | | 12,550,786 | |
| | | | | | | | | | | | | | | | | | | | | | | |
| | | | | | | | | | | | | | | | | | | | | | | |
| | 37,749 | | | | 78,653 | | | | 50,101 | | | | 155,147 | | | | 1,616 | | | | — | |
| | 19,204 | | | | 90,085 | | | | 37,441 | | | | 99,743 | | | | 34,925 | | | | 6,248 | |
| | 24,757 | | | | 104,316 | | | | 63,813 | | | | 124,215 | | | | 52,116 | | | | 10,131 | |
| | — | | | | — | | | | — | | | | — | | | | 24,286,500 | | | | — | |
| | 9 | | | | 23 | | | | — | | | | 710 | | | | 5,907 | | | | — | |
| | 2,565 | | | | 10,361 | | | | 6,665 | | | | 13,365 | | | | 5,821 | | | | 1,041 | |
| | 40,214 | | | | 65,601 | | | | 31,198 | | | | 50,049 | | | | 67,821 | | | | 29,602 | |
| | 124,498 | | | | 349,039 | | | | 189,218 | | | | 443,229 | | | | 24,454,706 | | | | 47,022 | |
| $ | 30,593,294 | | | $ | 144,576,928 | | | $ | 78,898,246 | | | $ | 157,221,943 | | | $ | 69,075,801 | | | $ | 12,503,764 | |
| | | | | | | | | | | | | | | | | | | | | | | |
| | | | | | | | | | | | | | | | | | | | | | | |
| $ | 82,007,618 | | | $ | 196,634,343 | | | $ | 68,888,143 | | | $ | 193,820,489 | | | $ | 79,927,620 | | | $ | 14,347,603 | |
| | — | | | | — | | | | 627,807 | | | | 3,560,233 | | | | 56,753 | | | | 4,166 | |
| | (54,289,903 | ) | | | (65,439,669 | ) | | | 109,217 | | | | (58,490,188 | ) | | | (13,806,130 | ) | | | (2,261,439 | ) |
| | 2,875,579 | | | | 13,382,254 | | | | 9,273,079 | | | | 18,331,409 | | | | 2,897,558 | | | | 413,434 | |
| $ | 30,593,294 | | | $ | 144,576,928 | | | $ | 78,898,246 | | | $ | 157,221,943 | | | $ | 69,075,801 | | | $ | 12,503,764 | |
| | | | | | | | | | | | | | | | | | | | | | | |
| | | | | | | | | | | | | | | | | | | | | | | |
| | | | | | | | | | | | | | | | | | | | | | | |
| Unlimited | | | | 25,000,000,000 | | | Unlimited | | | | 25,000,000,000 | | | | 100,000,000 | | | | 100,000,000 | |
| | 30,168,031 | | | | 123,199,892 | | | | 78,832,745 | | | | 155,873,562 | | | | 69,075,801 | | | | 12,503,764 | |
| | 2,156,291 | | | | 11,021,757 | | | | 6,736,709 | | | | 12,442,729 | | | | 6,535,935 | | | | 1,198,332 | |
| $ | 13.99 | | | $ | 11.18 | | | $ | 11.70 | | | $ | 12.53 | | | $ | 10.57 | | | $ | 10.43 | |
| | | | | | | | | | | | | | | | | | | | | | | |
| Unlimited | | | | 25,000,000,000 | | | Unlimited | | | | 25,000,000,000 | | | | N/A | | | | N/A | |
| | 425,263 | | | | 21,377,036 | | | | 65,501 | | | | 1,348,381 | | | | N/A | | | | N/A | |
| | 29,875 | | | | 1,893,644 | | | | 5,570 | | | | 107,511 | | | | N/A | | | | N/A | |
| $ | 14.23 | | | $ | 11.29 | | | $ | 11.76 | | | $ | 12.54 | | | | N/A | | | | N/A | |
HENNESSY FUNDS 1-800-966-4354
Statements of Operations Year Ended October 31, 2010 |
| | | HENNESSY | |
| | | CORNERSTONE | |
| | | GROWTH FUND | |
| INVESTMENT INCOME: | | | |
| Dividend income(1) | | $ | 975,320 | |
| Interest income | | | 3,480 | |
| Total investment income | | | 978,800 | |
| | | | | |
| EXPENSES: | | | | |
| Investment advisory fees | | | 1,639,511 | |
| Administration, fund accounting, custody and transfer agent fees | | | 564,967 | |
| Distribution fees – Original Class (See Note 5) | | | — | |
| Service fees – Original Class (See Note 5) | | | 217,567 | |
| Federal and state registration fees | | | 30,546 | |
| Audit and tax fees | | | 29,851 | |
| Legal fees | | | 9,005 | |
| Compliance expense | | | 6,345 | |
| Reports to shareholders | | | 65,198 | |
| Directors’ fees and expenses | | | 10,479 | |
| Sub-transfer agent expenses – Original Class (See Note 5) | | | 345,279 | |
| Sub-transfer agent expenses – Institutional Class (See Note 5) | | | 399 | |
| Interest expense (See Note 3 and 6) | | | 325 | |
| Other | | | 29,695 | |
| Total expenses before reimbursement from advisor | | | 2,949,167 | |
| Expense recoupment by advisor – Original Class | | | — | |
| Expense reimbursement from advisor – Institutional Class | | | — | |
| Administrative expense waiver – Institutional Class (See Note 5) | | | (4,240 | ) |
| Net expenses | | | 2,944,927 | |
| NET INVESTMENT INCOME (LOSS) | | $ | (1,966,127 | ) |
| | | | | |
| REALIZED AND UNREALIZED GAINS (LOSSES): | | | | |
| Net realized gain (loss)on | | | | |
| Unaffiliated investments | | $ | 14,472,259 | |
| Affiliated investments | | | — | |
| Change in unrealized appreciation (depreciation) on investments | | | 22,544,637 | |
| Net gain (loss) on investments | | | 37,016,896 | |
| NET INCREASE (DECREASE) IN NET ASSETS RESULTING FROM OPERATIONS | | $ | 35,050,769 | |
| (1) | Net of foreign taxes withheld of $13,890, $0, $0, $0, $235,546, $0 and $0, respectively. |
The accompanying notes are an integral part of these financial statements.
FINANCIAL STATEMENTS — STATEMENTS OF OPERATIONS
| HENNESSY | | | | | | HENNESSY | | | | | | | | | | |
| CORNERSTONE | | | HENNESSY | | | CORNERSTONE | | | HENNESSY | | | HENNESSY | | | HENNESSY | |
| GROWTH FUND, | | | FOCUS 30 | | | LARGE GROWTH | | | CORNERSTONE | | | TOTAL RETURN | | | BALANCED | |
| SERIES II | | | FUND | | | FUND | | | VALUE FUND | | | FUND | | | FUND | |
| | | | | | | | | | | | | | | | | |
| $ | 262,516 | | | $ | 1,645,162 | | | $ | 1,602,581 | | | $ | 5,516,504 | | | $ | 1,628,753 | | | $ | 234,984 | |
| | 1,560 | | | | 2,713 | | | | 988 | | | | 2,413 | | | | 31,995 | | | | 19,576 | |
| | 264,076 | | | | 1,647,875 | | | | 1,603,569 | | | | 5,518,917 | | | | 1,660,748 | | | | 254,560 | |
| | | | | | | | | | | | | | | | | | | | | | | |
| | | | | | | | | | | | | | | | | | | | | | | |
| | 231,029 | | | | 1,083,048 | | | | 553,644 | | | | 1,130,082 | | | | 337,824 | | | | 72,662 | |
| | 79,611 | | | | 373,213 | | | | 201,287 | | | | 389,420 | | | | 143,575 | | | | 30,882 | |
| | — | | | | — | | | | — | | | | — | | | | 84,456 | | | | 18,166 | |
| | 30,890 | | | | 122,675 | | | | 74,763 | | | | 151,486 | | | | 56,304 | | | | 12,110 | |
| | 32,841 | | | | 34,151 | | | | 45,692 | | | | 32,443 | | | | 18,887 | | | | 18,810 | |
| | 25,422 | | | | 24,008 | | | | 22,630 | | | | 26,774 | | | | 24,987 | | | | 23,965 | |
| | 9,741 | | | | 5,739 | | | | 10,998 | | | | 6,248 | | | | 4,746 | | | | 3,741 | |
| | 6,378 | | | | 6,337 | | | | 6,337 | | | | 6,337 | | | | 6,337 | | | | 6,337 | |
| | 7,477 | | | | 52,215 | | | | 14,682 | | | | 37,537 | | | | 10,496 | | | | 1,951 | |
| | 10,550 | | | | 10,701 | | | | 10,001 | | | | 10,201 | | | | 8,002 | | | | 7,501 | |
| | 58,057 | | | | 224,870 | | | | 17,428 | | | | 152,745 | | | | — | | | | — | |
| | 218 | | | | 14,413 | | | | — | | | | 83 | | | | — | | | | — | |
| | 500 | | | | 1,404 | | | | — | | | | 4,444 | | | | 43,181 | | | | — | |
| | 12,304 | | | | 23,829 | | | | 14,146 | | | | 17,153 | | | | 9,534 | | | | 3,631 | |
| | 505,018 | | | | 1,976,603 | | | | 971,608 | | | | 1,964,953 | | | | 748,329 | | | | 199,756 | |
| | — | | | | — | | | | 951 | | | | — | | | | — | | | | — | |
| | (531 | ) | | | — | | | | — | | | | — | | | | — | | | | — | |
| | (844 | ) | | | (43,158 | ) | | | (98 | ) | | | (1,408 | ) | | | — | | | | — | |
| | 503,643 | | | | 1,933,445 | | | | 972,461 | | | | 1,963,545 | | | | 748,329 | | | | 199,756 | |
| $ | (239,567 | ) | | $ | (285,570 | ) | | $ | 631,108 | | | $ | 3,555,372 | | | $ | 912,419 | | | $ | 54,804 | |
| | | | | �� | | | | | | | | | | | | | | | | | | |
| | | | | | | | | | | | | | | | | | | | | | | |
| | | | | | | | | | | | | | | | | | | | | | | |
| $ | 7,072,147 | | | $ | 23,675,034 | | | $ | 21,551,713 | | | $ | 18,686,758 | | | $ | 5,573,895 | | | $ | 1,256,664 | |
| | — | | | | — | | | | — | | | | (166,409 | ) | | | — | | | | — | |
| | 377,453 | | | | 13,440,791 | | | | (6,245,779 | ) | | | 6,342,542 | | | | 3,246,579 | | | | (115,945 | ) |
| | 7,449,600 | | | | 37,115,825 | | | | 15,305,934 | | | | 24,862,891 | | | | 8,820,474 | | | | 1,140,719 | |
| $ | 7,210,033 | | | $ | 36,830,255 | | | $ | 15,937,042 | | | $ | 28,418,263 | | | $ | 9,732,893 | | | $ | 1,195,523 | |
HENNESSY FUNDS 1-800-966-4354
| Statements of Changes in Net Assets |
| | Hennessy Cornerstone Growth Fund |
| | | Year Ended | | | Year Ended | |
| | | October 31, 2010 | | | October 31, 2009 | |
| OPERATIONS: | | | | | | |
| Net investment income (loss) | | $ | (1,966,127 | ) | | $ | (1,059,159 | ) |
| Net realized gain (loss) on securities | | | 14,472,259 | | | | (175,588,612 | ) |
| Change in unrealized appreciation (depreciation) on securities | | | 22,544,637 | | | | 171,339,271 | |
| Net increase (decrease) in net assets resulting from operations | | | 35,050,769 | | | | (5,308,500 | ) |
| | | | | | | | | |
| CAPITAL SHARE TRANSACTIONS: | | | | | | | | |
| Proceeds from shares subscribed – Original Class | | | 7,339,703 | | | | 13,769,357 | |
| Proceeds from shares subscribed – Institutional Class | | | 101,206 | | | | 135,313 | |
| Dividends reinvested – Original Class | | | — | | | | — | |
| Dividends reinvested – Institutional Class | | | — | | | | — | |
| Cost of shares redeemed – Original Class | | | (63,688,140 | ) | | | (92,048,170 | ) |
| Cost of shares redeemed – Institutional Class | | | (2,208,458 | ) | | | (498,966 | ) |
| Net increase (decrease) in net assets | | | | | | | | |
| derived from capital share transactions | | | (58,455,689 | ) | | | (78,642,466 | ) |
| TOTAL INCREASE (DECREASE) IN NET ASSETS | | | (23,404,920 | ) | | | (83,950,966 | ) |
| | | | | | | | | |
| NET ASSETS: | | | | | | | | |
| Beginning of period | | | 233,638,353 | | | | 317,589,319 | |
| End of period | | $ | 210,233,433 | | | $ | 233,638,353 | |
| Accumulated net investment income (loss), end of period | | $ | — | | | $ | — | |
| | | | | | | | | |
| CHANGES IN SHARES OUTSTANDING: | | | | | | | | |
| Shares sold – Original Class | | | 762,956 | | | | 1,670,446 | |
| Shares sold – Institutional Class | | | 9,629 | | | | 16,333 | |
| Shares issued to holders as reinvestment of dividends | | | | | | | | |
| Original Class | | | — | | | | — | |
| Institutional Class | | | — | | | | — | |
| Shares redeemed – Original Class | | | (6,593,042 | ) | | | (11,189,297 | ) |
| Shares redeemed – Institutional Class | | | (236,335 | ) | | | (65,345 | ) |
| Net increase (decrease) in shares outstanding | | | (6,056,792 | ) | | | (9,567,863 | ) |
The accompanying notes are an integral part of these financial statements.
FINANCIAL STATEMENTS — STATEMENTS OF CHANGES IN NET ASSETS
| Hennessy Cornerstone | | | | | | |
| Growth Fund, Series II | | Hennessy Focus 30 Fund |
| | Year Ended | | | Year Ended | | | Year Ended | | | Year Ended | |
| | October 31, 2010 | | | October 31, 2009 | | | October 31, 2010 | | | October 31, 2009 | |
| | | | | | | | | | | | |
| | $ | (239,567 | ) | | $ | (130,836 | ) | | $ | (285,570 | ) | | $ | (225,481 | ) |
| | | 7,072,147 | | | | (25,002,829 | ) | | | 23,675,034 | | | | (41,135,146 | ) |
| | | 377,453 | | | | 26,641,700 | | | | 13,440,791 | | | | 51,687,206 | |
| | | 7,210,033 | | | | 1,508,035 | | | | 36,830,255 | | | | 10,326,579 | |
| | | | | | | | | | | | | | | | |
| | | | | | | | | | | | | | | | |
| | | 2,100,537 | | | | 884,541 | | | | 9,963,583 | | | | 28,044,578 | |
| | | 213,468 | | | | 229,027 | | | | 1,798,787 | | | | 3,182,769 | |
| | | — | | | | — | | | | — | | | | — | |
| | | — | | | | — | | | | — | | | | — | |
| | | (8,878,696 | ) | | | (8,829,446 | ) | | | (45,927,136 | ) | | | (75,221,408 | ) |
| | | (149,711 | ) | | | (21,810 | ) | | | (13,886,035 | ) | | | (4,641,964 | ) |
| | | | | | | | | | | | | | | | |
| | | (6,714,402 | ) | | | (7,737,688 | ) | | | (48,050,801 | ) | | | (48,636,025 | ) |
| | | 495,631 | | | | (6,229,653 | ) | | | (11,220,546 | ) | | | (38,309,446 | ) |
| | | | | | | | | | | | | | | | |
| | | | | | | | | | | | | | | | |
| | | 30,097,663 | | | | 36,327,316 | | | | 155,797,474 | | | | 194,106,920 | |
| | $ | 30,593,294 | | | $ | 30,097,663 | | | $ | 144,576,928 | | | $ | 155,797,474 | |
| | $ | — | | | $ | — | | | $ | — | | | $ | — | |
| | | | | | | | | | | | | | | | |
| | | | | | | | | | | | | | | | |
| | | 159,641 | | | | 90,535 | | | | 981,821 | | | | 3,800,184 | |
| | | 16,034 | | | | 21,589 | | | | 182,320 | | | | 412,433 | |
| | | | | | | | | | | | | | | | |
| | | — | | | | — | | | | — | | | | — | |
| | | — | | | | — | | | | — | | | | — | |
| | | (692,223 | ) | | | (904,443 | ) | | | (4,668,242 | ) | | | (9,945,713 | ) |
| | | (11,474 | ) | | | (2,266 | ) | | | (1,414,793 | ) | | | (619,087 | ) |
| | | (528,022 | ) | | | (794,585 | ) | | | (4,918,894 | ) | | | (6,352,183 | ) |
HENNESSY FUNDS 1-800-966-4354
Financial Statements
| Statements of Changes in Net Assets |
| OPERATIONS: | |
| Net investment income (loss) | |
| Net realized gain (loss) | |
| Change in unrealized appreciation (depreciation) | |
| Net increase (decrease) in net assets resulting from operations | |
| DISTRIBUTIONS TO SHAREHOLDERS FROM: | |
| Net investment income – Original Class | |
| Net investment income – Institutional Class | |
| Net realized gains – Original Class | |
| Net realized gains – Institutional Class | |
| Total distributions | |
| CAPITAL SHARE TRANSACTIONS: | |
| Proceeds from shares issued in the reorganization | |
| Proceeds from shares subscribed – Original Class | |
| Proceeds from shares subscribed – Institutional Class | |
| Proceeds from shares subscribed – Predecessor Class A | |
| Proceeds from shares subscribed – Predecessor Class I | |
| Proceeds from shares subscribed – Predecessor Class C | |
| Proceeds from shares subscribed – Predecessor Class S | |
| Dividends reinvested – Original Class | |
| Dividends reinvested – Institutional Class | |
| Cost of shares redeemed – Original Class | |
| Cost of shares redeemed – Institutional Class | |
| Cost of shares redeemed – Predecessor Class A | |
| Cost of shares redeemed – Predecessor Class I | |
| Cost of shares redeemed – Predecessor Class C | |
| Cost of shares redeemed – Predecessor Class R | |
| Cost of shares redeemed – Predecessor Class S | |
| Cost of shares redeemed in the reorganization – Predecessor Class A (See Note 8) | |
| Cost of shares redeemed in the reorganization – Predecessor Class I (See Note 8) | |
| Cost of shares redeemed in the reorganization – Predecessor Class C (See Note 8) | |
| Cost of shares redeemed in the reorganization – Predecessor Class R (See Note 8) | |
| Cost of shares redeemed in the reorganization – Predecessor Class S (See Note 8) | |
| Net increase (decrease) in net assets derived from capital share transactions | |
| TOTAL INCREASE (DECREASE) IN NET ASSETS | |
| NET ASSETS: | |
| Beginning of period | |
| End of period | |
| Accumulated net investment income (loss), end of period | |
| * | For the one month ended October 31, 2009. Effective October 31, 2009, the Fund changed its fiscal year end to October 31st from September 30th. |
The accompanying notes are an integral part of these financial statements.
FINANCIAL STATEMENTS — STATEMENTS OF CHANGES IN NET ASSETS
| Hennessy Cornerstone | |
| Large Growth Fund | |
| Year Ended | | | One Month Ended | | | Year Ended | |
| October 31, 2010 | | | October 31, 2009* | | | September 30, 2009 | |
| | | | | | | | |
| $ | 631,108 | | | $ | (3,301 | ) | | $ | 356,226 | |
| | 21,551,713 | | | | 810,847 | | | | (21,384,860 | ) |
| | (6,245,779 | ) | | | (1,552,441 | ) | | | 14,850,433 | |
| | 15,937,042 | | | | (744,895 | ) | | | (6,178,201 | ) |
| | | | | | | | | | | |
| | (358,186 | ) | | | — | | | | — | |
| | (235 | ) | | | — | | | | — | |
| | — | | | | — | | | | — | |
| | — | | | | — | | | | — | |
| | (358,421 | ) | | | — | | | | — | |
| | | | | | | | | | | |
| | — | | | | — | | | | 51,980,253 | |
| | 993,869 | | | | 92,349 | | | | 399,858 | |
| | 19,385 | | | | 914 | | | | 30,524 | |
| | — | | | | — | | | | 354,913 | |
| | — | | | | — | | | | 1,450 | |
| | — | | | | — | | | | — | |
| | — | | | | — | | | | 226,710 | |
| | 322,821 | | | | — | | | | — | |
| | 235 | | | | — | | | | — | |
| | (7,463,986 | ) | | | (549,997 | ) | | | (3,502,412 | ) |
| | (2,812 | ) | | | — | | | | — | |
| | — | | | | — | | | | (394,647 | ) |
| | — | | | | — | | | | (103,571 | ) |
| | — | | | | — | | | | (1,916 | ) |
| | — | | | | — | | | | (1,961 | ) |
| | — | | | | — | | | | (4,936,283 | ) |
| | — | | | | — | | | | (2,045,574 | ) |
| | — | | | | — | | | | (293,648 | ) |
| | — | | | | — | | | | (81,763 | ) |
| | — | | | | — | | | | (3,654 | ) |
| | — | | | | — | | | | (49,555,614 | ) |
| | (6,130,488 | ) | | | (456,734 | ) | | | (7,927,335 | ) |
| | 9,448,133 | | | | (1,201,629 | ) | | | (14,105,536 | ) |
| | | | | | | | | | | |
| | 69,450,113 | | | | 70,651,742 | | | | 84,757,278 | |
| $ | 78,898,246 | | | $ | 69,450,113 | | | $ | 70,651,742 | |
| $ | 627,807 | | | $ | 358,421 | | | $ | 358,421 | |
HENNESSY FUNDS 1-800-966-4354
Financial Statements
| Statements of Changes in Net Assets |
| CHANGES IN SHARES OUTSTANDING: | |
| Shares issued in connection with reorganization | |
| Shares sold – Original Class | |
| Shares sold – Institutional Class | |
| Shares sold – Predecessor Class A | |
| Shares sold – Predecessor Class I | |
| Shares sold – Predecessor Class C | |
| Shares sold – Predecessor Class S | |
| Shares issued to holders as reinvestment of dividends – Original Class | |
| Shares issued to holders as reinvestment of dividends – Institutional Class | |
| Shares redeemed – Original Class | |
| Shares redeemed – Institutional Class | |
| Shares redeemed – Predecessor Class A | |
| Shares redeemed – Predecessor Class I | |
| Shares redeemed – Predecessor Class C | |
| Shares redeemed – Predecessor Class R | |
| Shares redeemed – Predecessor Class S | |
| Shares redeemed in the reorganization – Predecessor Class A | |
| Shares redeemed in the reorganization – Predecessor Class I | |
| Shares redeemed in the reorganization – Predecessor Class C | |
| Shares redeemed in the reorganization – Predecessor Class R | |
| Shares redeemed in the reorganization – Predecessor Class S | |
| Net increase (decrease) in shares outstanding | |
| * | For the one month ended October 31, 2009. Effective October 31, 2009, the Fund changed its fiscal year end to October 31st from September 30th. |
The accompanying notes are an integral part of these financial statements.
FINANCIAL STATEMENTS — STATEMENTS OF CHANGES IN NET ASSETS
| Hennessy Cornerstone | |
| Large Growth Fund | |
| Year Ended | | | One Month Ended | | | Year Ended | |
| October 31, 2010 | | | October 31, 2009* | | | September 30, 2009 | |
| | | | | | | | |
| | — | | | | — | | | | 7,722,854 | |
| | 94,024 | | | | 9,537 | | | | 47,603 | |
| | 1,859 | | | | 93 | | | | 3,873 | |
| | — | | | | — | | | | 49,665 | |
| | — | | | | — | | | | 198 | |
| | — | | | | — | | | | — | |
| | — | | | | — | | | | 30,610 | |
| | 31,251 | | | | — | | | | — | |
| | 23 | | | | — | | | | — | |
| | (699,229 | ) | | | (55,752 | ) | | | (413,579 | ) |
| | (278 | ) | | | — | | | | — | |
| | — | | | | — | | | | (55,087 | ) |
| | — | | | | — | | | | (14,533 | ) |
| | — | | | | — | | | | (317 | ) |
| | — | | | | — | | | | (316 | ) |
| | — | | | | — | | | | (685,035 | ) |
| | — | | | | — | | | | (309,689 | ) |
| | — | | | | — | | | | (43,625 | ) |
| | — | | | | — | | | | (12,829 | ) |
| | — | | | | — | | | | (560 | ) |
| | — | | | | — | | | | (7,362,580 | ) |
| | (572,350 | ) | | | (46,122 | ) | | | (1,043,347 | ) |
HENNESSY FUNDS 1-800-966-4354
Financial Statements
| Statements of Changes in Net Assets |
| | Hennessy Cornerstone Value Fund |
| | | Year Ended | | | Year Ended | |
| | | October 31, 2010 | | | October 31, 2009 | |
| OPERATIONS: | | | | | | |
| Net investment income (loss) | | $ | 3,555,372 | | | $ | 3,055,816 | |
| Net realized gain (loss) on securities | | | 18,520,349 | | | | (56,656,130 | ) |
| Change in unrealized appreciation (depreciation) on securities | | | 6,342,542 | | | | 74,246,459 | |
| Net increase (decrease) in net assets resulting from operations | | | 28,418,263 | | | | 20,646,145 | |
| | | | | | | | | |
| DISTRIBUTIONS TO SHAREHOLDERS FROM: | | | | | | | | |
| Net investment income | | | | | | | | |
| Original Class | | | (2,734,232 | ) | | | (5,597,237 | ) |
| Institutional Class | | | (23,987 | ) | | | (55,214 | ) |
| Net realized gains | | | | | | | | |
| Original Class | | | — | | | | — | |
| Institutional Class | | | — | | | | — | |
| Total distributions | | | (2,758,219 | ) | | | (5,652,451 | ) |
| | | | | | | | | |
| CAPITAL SHARE TRANSACTIONS: | | | | | | | | |
| Proceeds from shares subscribed – Original Class | | | 49,512,976 | | | | 43,322,159 | |
| Proceeds from shares subscribed – Institutional Class | | | 131,171 | | | | 39,402 | |
| Dividends reinvested – Original Class | | | 2,464,535 | | | | 4,981,771 | |
| Dividends reinvested – Institutional Class | | | 14,973 | | | | 33,372 | |
| Cost of shares redeemed – Original Class | | | (67,467,108 | ) | | | (14,327,901 | ) |
| Cost of shares redeemed – Institutional Class | | | (106,415 | ) | | | (10,708 | ) |
| Net increase (decrease) in net assets | | | | | | | | |
| derived from capital share transactions | | | (15,449,868 | ) | | | 34,038,095 | |
| | | | | | | | | |
| TOTAL INCREASE (DECREASE) IN NET ASSETS | | | 10,210,176 | | | | 49,031,789 | |
| | | | | | | | | |
| NET ASSETS: | | | | | | | | |
| Beginning of period | | | 147,011,767 | | | | 97,979,978 | |
| End of period | | $ | 157,221,943 | | | $ | 147,011,767 | |
| | | | | | | | | |
| Accumulated net investment income (loss), end of period | | $ | 3,560,233 | | | $ | 2,611,157 | |
The accompanying notes are an integral part of these financial statements.
FINANCIAL STATEMENTS — STATEMENTS OF CHANGES IN NET ASSETS
Hennessy Total Return Fund | | | Hennessy Balanced Fund | |
| Year Ended | | | Year Ended | | | Year Ended | | | Year Ended | |
| October 31, 2010 | | | October 31, 2009 | | | October 31, 2010 | | | October 31, 2009 | |
| | | | | | | | | | | |
| $ | 912,419 | | | $ | 1,043,226 | | | $ | 54,804 | | | $ | 123,592 | |
| | 5,573,895 | | | | (17,884,613 | ) | | | 1,256,664 | | | | (2,906,301 | ) |
| | 3,246,579 | | | | 16,495,364 | | | | (115,945 | ) | | | 3,283,017 | |
| | 9,732,893 | | | | (346,023 | ) | | | 1,195,523 | | | | 500,308 | |
| | | | | | | | | | | | | | | |
| | | | | | | | | | | | | | | |
| | | | | | | | | | | | | | | |
| | (942,536 | ) | | | (956,356 | ) | | | (55,545 | ) | | | (138,030 | ) |
| | N/A | | | | N/A | | | | N/A | | | | N/A | |
| | | | | | | | | | | | | | | |
| | — | | | | — | | | | — | | | | — | |
| | N/A | | | | N/A | | | | N/A | | | | N/A | |
| | (942,536 | ) | | | (956,356 | ) | | | (55,545 | ) | | | (138,030 | ) |
| | | | | | | | | | | | | | | |
| | | | | | | | | | | | | | | |
| | 16,112,008 | | | | 657,981 | | | | 1,313,838 | | | | 795,947 | |
| | N/A | | | | N/A | | | | N/A | | | | N/A | |
| | 869,098 | | | | 884,126 | | | | 54,019 | | | | 134,495 | |
| | N/A | | | | N/A | | | | N/A | | | | N/A | |
| | (9,075,344 | ) | | | (6,082,697 | ) | | | (1,475,154 | ) | | | (1,280,181 | ) |
| | N/A | | | | N/A | | | | N/A | | | | N/A | |
| | | | | | | | | | | | | | | |
| | 7,905,762 | | | | (4,540,590 | ) | | | (107,297 | ) | | | (349,739 | ) |
| | | | | | | | | | | | | | | |
| | 16,696,119 | | | | (5,842,969 | ) | | | 1,032,681 | | | | 12,539 | |
| | | | | | | | | | | | | | | |
| | | | | | | | | | | | | | | |
| | 52,379,682 | | | | 58,222,651 | | | | 11,471,083 | | | | 11,458,544 | |
| $ | 69,075,801 | | | $ | 52,379,682 | | | $ | 12,503,764 | | | $ | 11,471,083 | |
| | | | | | | | | | | | | | | |
| $ | 56,753 | | | $ | 86,870 | | | $ | 4,166 | | | $ | 4,907 | |
HENNESSY FUNDS 1-800-966-4354
Financial Statements
| Statements of Changes in Net Assets |
| | | Hennessy Cornerstone Value Fund | |
| | | Year Ended | | | Year Ended | |
| | | October 31, 2010 | | | October 31, 2009 | |
| CHANGES IN SHARES OUTSTANDING: | | | | | | |
| Shares sold | | | | | | |
| Original Class | | | 4,255,144 | | | | 4,111,585 | |
| Institutional Class | | | 11,283 | | | | 4,670 | |
| Shares issued to holders as reinvestment of dividends | | | | | | | | |
| Original Class | | | 216,187 | | | | 638,689 | |
| Institutional Class | | | 1,315 | | | | 4,290 | |
| Shares redeemed | | | | | | | | |
| Original Class | | | (5,758,045 | ) | | | (1,749,104 | ) |
| Institutional Class | | | (9,166 | ) | | | (1,328 | ) |
| Net increase (decrease) in shares outstanding | | | (1,283,282 | ) | | | 3,008,802 | |
The accompanying notes are an integral part of these financial statements.
FINANCIAL STATEMENTS — STATEMENTS OF CHANGES IN NET ASSETS
Hennessy Total Return Fund | | | Hennessy Balanced Fund | |
| Year Ended | | | Year Ended | | | Year Ended | | | Year Ended | |
| October 31, 2010 | | | October 31, 2009 | | | October 31, 2010 | | | October 31, 2009 | |
| | | | | | | | | | | |
| | | | | | | | | | | |
| | 1,607,841 | | | | 79,969 | | | | 130,219 | | | | 91,298 | |
| | N/A | | | | N/A | | | | N/A | | | | N/A | |
| | | | | | | | | | | | | | | |
| | 87,092 | | | | 110,321 | | | | 5,440 | | | | 16,328 | |
| | N/A | | | | N/A | | | | N/A | | | | N/A | |
| | | | | | | | | | | | | | | |
| | (916,937 | ) | | | (746,373 | ) | | | (147,584 | ) | | | (155,366 | ) |
| | N/A | | | | N/A | | | | N/A | | | | N/A | |
| | 777,996 | | | | (556,083 | ) | | | (11,925 | ) | | | (47,740 | ) |
HENNESSY FUNDS 1-800-966-4354
(This Page Intentionally Left Blank.)
FINANCIAL STATEMENTS — STATEMENT OF CASH FLOWS
Statement of Cash Flows
Hennessy Total Return Fund For the Year Ended October 31, 2010 |
| Cash Flows From Operating Activities: | | | |
| | | | |
| Net decrease in net assets from operations | | $ | 9,732,893 | |
| Adjustments to reconcile net decrease in net assets from | | | | |
| operations to net cash provided by operating activities | | | | |
| Purchase of investment securities | | | (236,571,947 | ) |
| Proceeds on sale of securities | | | 218,496,033 | |
| Decrease in receivable for securities sold | | | 3,506,069 | |
| Increase in other receivables, net | | | (166,542 | ) |
| Increase in other assets | | | (6,678 | ) |
| Decrease in payable for securities purchased | | | (3,009,279 | ) |
| Decrease in accrued expenses and other payables | | | (945 | ) |
| Net accretion of discount on securities | | | (28,856 | ) |
| Net realized gain on investments | | | (5,573,895 | ) |
| Unrealized appreciation on securities | | | (3,246,579 | ) |
| Net cash used by operating activities | | $ | (16,869,726 | ) |
| | | | | |
| Cash Flows From Financing Activities: | | | | |
| | | | | |
| Increase in reverse repurchase agreements | | $ | 9,906,500 | |
| Proceeds on shares sold | | | 16,112,008 | |
| Payment on shares repurchased | | | (9,075,344 | ) |
| Cash dividends paid | | | (73,438 | ) |
| Net cash provided by financing activities | | $ | 16,869,726 | |
| | | | | |
| Cash at beginning of year | | | — | |
| Cash at end of year | | | — | |
| Net increase (decrease) in cash | | $ | — | |
| | | | | |
| Cash paid for interest | | $ | 50,724 | |
The accompanying notes are an integral part of these financial statements.
HENNESSY FUNDS 1-800-966-4354
Financial Highlights
| Hennessy Cornerstone Growth Fund |
For an Original Class share outstanding throughout each year
| PER SHARE DATA: | |
| Net asset value, beginning of year | |
| | |
| Income from investment operations: | |
| Net investment gain (loss) | |
| Net realized and unrealized gains (losses) on securities | |
| Total from investment operations | |
| | |
| Less Distributions: | |
| Dividends from net investment income | |
| Dividends from net realized gains | |
| Total distributions | |
| Net asset value, end of year | |
| | |
| TOTAL RETURN | |
| | |
| SUPPLEMENTAL DATA AND RATIOS: | |
| Net assets, end of period (millions) | |
| Ratio of expenses to average net assets | |
| Ratio of net investment income (loss) to average net assets | |
| Portfolio turnover rate(1) | |
| (1) | Portfolio turnover is calculated on the basis of the Fund as a whole. |
The accompanying notes are an integral part of these financial statements.
FINANCIAL HIGHLIGHTS — HENNESSY CORNERSTONE GROWTH FUND
| Year Ended October 31, | |
| 2010 | | | 2009 | | | 2008 | | | 2007 | | | 2006 | |
| | | | | | | | | | | | | | |
| $ | 8.81 | | | $ | 8.80 | | | $ | 19.41 | | | $ | 20.77 | | | $ | 19.49 | |
| | | | | | | | | | | | | | | | | | | |
| | | | | | | | | | | | | | | | | | | |
| | (0.10 | ) | | | (0.04 | ) | | | (0.05 | ) | | | (0.07 | ) | | | (0.04 | ) |
| | 1.57 | | | | 0.05 | | | | (8.32 | ) | | | 1.82 | | | | 2.55 | |
| | 1.47 | | | | 0.01 | | | | (8.37 | ) | | | 1.75 | | | | 2.51 | |
| | | | | | | | | | | | | | | | | | | |
| | | | | | | | | | | | | | | | | | | |
| | — | | | | — | | | | — | | | | — | | | | — | |
| | — | | | | — | | | | (2.24 | ) | | | (3.11 | ) | | | (1.23 | ) |
| | — | | | | — | | | | (2.24 | ) | | | (3.11 | ) | | | (1.23 | ) |
| $ | 10.28 | | | $ | 8.81 | | | $ | 8.80 | | | $ | 19.41 | | | $ | 20.77 | |
| | | | | | | | | | | | | | | | | | | |
| | 16.69 | % | | | 0.11 | % | | | (48.00 | )% | | | 9.65 | % | | | 13.59 | % |
| | | | | | | | | | | | | | | | | | | |
| | | | | | | | | | | | | | | | | | | |
| $ | 207.11 | | | $ | 228.96 | | | $ | 312.50 | | | $ | 990.43 | | | $ | 1,250.67 | |
| | 1.34 | % | | | 1.36 | % | | | 1.25 | % | | | 1.20 | % | | | 1.21 | % |
| | (0.89 | )% | | | (0.42 | )% | | | (0.29 | )% | | | (0.32 | )% | | | (0.20 | )% |
| | 103 | % | | | 108 | % | | | 103 | % | | | 97 | % | | | 90 | % |
HENNESSY FUNDS 1-800-966-4354
Financial Highlights
| Hennessy Cornerstone Growth Fund |
For an Institutional Class share outstanding throughout each period
| PER SHARE DATA: | |
| Net asset value, beginning of period | |
| | |
| Income from investment operations: | |
| Net investment gain (loss) | |
| Net realized and unrealized gains (losses) on securities | |
| Total from investment operations | |
| | |
| Less Distributions: | |
| Dividends from net investment income | |
| Dividends from net realized gains | |
| Total distributions | |
| Net asset value, end of period | |
| | |
| TOTAL RETURN | |
| | |
| SUPPLEMENTAL DATA AND RATIOS: | |
| Net assets, end of period (millions) | |
| Ratio of expenses to average net assets | |
| Before expense reimbursement | |
| After expense reimbursement(4) | |
| Ratio of net investment income (loss) to average net assets | |
| Before expense reimbursement | |
| After expense reimbursement(4) | |
| Portfolio turnover rate(5) | |
| (1) | Institutional Class shares commenced operations on March 3, 2008. |
| (4) | The Advisor and/or Administrator reimbursed expenses in order to cap the Institutional Class share expenses. Please refer to Note 5 for more information. |
| (5) | Portfolio turnover is calculated on the basis of the Fund as a whole. |
The accompanying notes are an integral part of these financial statements.
FINANCIAL HIGHLIGHTS — HENNESSY CORNERSTONE GROWTH FUND
| | | | | | | Period Ended | |
| Year Ended October 31, | | | October 31, | |
| 2010 | | | 2009 | | | 2008(1) | |
| | | | | | | | |
| $ | 8.86 | | | $ | 8.82 | | | $ | 13.29 | |
| | | | | | | | | | | |
| | | | | | | | | | | |
| | (0.07 | ) | | | — | | | | 0.01 | |
| | 1.58 | | | | 0.04 | | | | (4.48 | ) |
| | 1.51 | | | | 0.04 | | | | (4.47 | ) |
| | | | | | | | | | | |
| | | | | | | | | | | |
| | — | | | | — | | | | — | |
| | — | | | | — | | | | — | |
| | — | | | | — | | | | — | |
| $ | 10.37 | | | $ | 8.86 | | | $ | 8.82 | |
| | | | | | | | | | | |
| | 17.04 | % | | | 0.45 | % | | | (34.13 | )%(2) |
| | | | | | | | | | | |
| | | | | | | | | | | |
| $ | 3.12 | | | $ | 4.68 | | | $ | 5.09 | |
| | | | | | | | | | | |
| | 1.09 | % | | | 1.11 | % | | | 1.12 | %(3) |
| | 0.98 | % | | | 0.98 | % | | | 0.98 | %(3) |
| | | | | | | | | | | |
| | (0.64 | )% | | | (0.17 | )% | | | 0.15 | %(3) |
| | (0.53 | )% | | | (0.04 | )% | | | 0.29 | %(3) |
| | 103 | % | | | 108 | % | | | 103 | %(2) |
HENNESSY FUNDS 1-800-966-4354
| Hennessy Cornerstone Growth Fund, Series II |
For an Original Class share outstanding throughout each period
| PER SHARE DATA: | |
| Net asset value, beginning of period | |
| | |
| Income from investment operations: | |
| Net investment gain (loss) | |
| Net realized and unrealized gains (losses) on securities | |
| Total from investment operations | |
| | |
| Less Distributions: | |
| Dividends from net investment income | |
| Dividends from net realized gains | |
| Total distributions | |
| Net asset value, end of period | |
| | |
| TOTAL RETURN | |
| | |
| SUPPLEMENTAL DATA AND RATIOS: | |
| Net assets, end of period (millions) | |
| Ratio of expenses to average net assets | |
| Ratio of net investment income (loss) to average net assets | |
| Portfolio turnover rate(5) | |
| (1) | For the four months ended October 31, 2006. Effective October 31, 2006 the Fund changed its fiscal year end to October 31st from June 30th. |
| (2) | Net investment loss per share is calculated using average shares outstanding. |
| (5) | Portfolio turnover is calculated on the basis of the Fund as a whole. |
The accompanying notes are an integral part of these financial statements.
FINANCIAL HIGHLIGHTS — HENNESSY CORNERSTONE GROWTH FUND, SERIES II
| | | | | | | | | | | | | Period Ended | | | Year Ended | |
| Year Ended October 31, | | | October 31, | | | June 30, | |
| 2010 | | | 2009 | | | 2008 | | | 2007 | | | 2006(1) | | | 2006 | |
| | | | | | | | | | | | | | | | | |
| $ | 11.09 | | | $ | 10.35 | | | $ | 30.32 | | | $ | 30.75 | | | $ | 32.19 | | | $ | 31.29 | |
| | | | | | | | | | | | | | | | | | | | | | | |
| | (0.11 | ) | | | (0.05 | ) | | | (0.09 | ) | | | (0.25 | ) | | | (0.03 | ) | | | (0.07 | )(2) |
| | 3.01 | | | | 0.79 | | | | (13.75 | ) | | | 1.02 | | | | (1.41 | ) | | | 4.65 | |
| | 2.90 | | | | 0.74 | | | | (13.84 | ) | | | 0.77 | | | | (1.44 | ) | | | 4.58 | |
| | | | | | | | | | | | | | | | | | | | | | | |
| | — | | | | — | | | | — | | | | — | | | | — | | | | — | |
| | — | | | | — | | | | (6.13 | ) | | | (1.20 | ) | | | — | | | | (3.68 | ) |
| | — | | | | — | | | | (6.13 | ) | | | (1.20 | ) | | | — | | | | (3.68 | ) |
| $ | 13.99 | | | $ | 11.09 | | | $ | 10.35 | | | $ | 30.32 | | | $ | 30.75 | | | $ | 32.19 | |
| | 26.15 | % | | | 7.15 | % | | | (55.79 | )% | | | 2.60 | % | | | (4.47 | )%(3) | | | 16.48 | % |
| | | | | | | | | | | | | | | | | | | | | | | |
| | | | | | | | | | | | | | | | | | | | | | | |
| $ | 30.17 | | | $ | 29.81 | | | $ | 36.27 | | | $ | 138.58 | | | $ | 244.19 | | | $ | 279.30 | |
| | 1.62 | % | | | 1.70 | % | | | 1.37 | % | | | 1.27 | % | | | 1.25 | %(4) | | | 1.25 | % |
| | (0.77 | )% | | | (0.43 | )% | | | (0.40 | )% | | | (0.59 | )% | | | (0.24 | )%(4) | | | (0.22 | )% |
| | 95 | % | | | 94 | % | | | 75 | % | | | 86 | % | | | 93 | %(3) | | | 109 | % |
HENNESSY FUNDS 1-800-966-4354
Financial Highlights
| Hennessy Cornerstone Growth Fund, Series II |
For an Institutional Class share outstanding throughout each period
| PER SHARE DATA: | |
| Net asset value, beginning of period | |
| | |
| Income from investment operations: | |
| Net investment gain (loss) | |
| Net realized and unrealized gains (losses) on securities | |
| Total from investment operations | |
| | |
| Less Distributions: | |
| Dividends from net investment income | |
| Dividends from net realized gains | |
| Total distributions | |
| Net asset value, end of period | |
| | |
| TOTAL RETURN | |
| | |
| SUPPLEMENTAL DATA AND RATIOS: | |
| Net assets, end of period (millions) | |
| Ratio of expenses to average net assets | |
| Before expense reimbursement | |
| After expense reimbursement(4) | |
| Ratio of net investment income (loss) to average net assets | |
| Before expense reimbursement | |
| After expense reimbursement(4) | |
| Portfolio turnover rate(5) | |
| (1) | Institutional Class shares commenced operations on March 3, 2008. |
| (4) | The Advisor and/or Administrator reimbursed expenses in order to cap the Institutional Class share expenses. Please refer to Note 5 for more information. |
| (5) | Portfolio turnover is calculated on the basis of the Fund as a whole. |
The accompanying notes are an integral part of these financial statements.
FINANCIAL HIGHLIGHTS — HENNESSY CORNERSTONE GROWTH FUND, SERIES II
| | | | | | | Period Ended | |
| Year Ended October 31, | | | October 31, | |
| 2010 | | | 2009 | | | 2008(1) | |
| | | | | | | | |
| $ | 11.21 | | | $ | 10.39 | | | $ | 19.17 | |
| | | | | | | | | | | |
| | | | | | | | | | | |
| | (0.01 | ) | | | 0.02 | | | | 0.02 | |
| | 3.03 | | | | 0.80 | | | | (8.80 | ) |
| | 3.02 | | | | 0.82 | | | | (8.78 | ) |
| | | | | | | | | | | |
| | | | | | | | | | | |
| | — | | | | — | | | | — | |
| | — | | | | — | | | | — | |
| | — | | | | — | | | | — | |
| $ | 14.23 | | | $ | 11.21 | | | $ | 10.39 | |
| | | | | | | | | | | |
| | 26.94 | % | | | 7.89 | % | | | (45.80 | )%(2) |
| | | | | | | | | | | |
| | | | | | | | | | | |
| $ | 0.43 | | | $ | 0.28 | | | $ | 0.06 | |
| | | | | | | | | | | |
| | 1.40 | % | | | 1.46 | % | | | 1.22 | %(3) |
| | 0.98 | % | | | 0.98 | % | | | 0.98 | %(3) |
| | | | | | | | | | | |
| | (0.53 | )% | | | (0.19 | )% | | | 0.17 | %(3) |
| | (0.11 | )% | | | 0.29 | % | | | 0.41 | %(3) |
| | 95 | % | | | 94 | % | | | 75 | %(2) |
HENNESSY FUNDS 1-800-966-4354
Financial Highlights
For an Original Class share outstanding throughout each year
| PER SHARE DATA: | |
| Net asset value, beginning of year | |
| | |
| Income from investment operations: | |
| Net investment income (loss) | |
| Net realized and unrealized gains (losses) on investments | |
| Total from investment operations | |
| | |
| Less Distributions: | |
| Dividends from net investment income | |
| Dividends from net realized gains | |
| Total distributions | |
| Redemption fees retained | |
| Net asset value, end of year | |
| | |
| TOTAL RETURN | |
| | |
| SUPPLEMENTAL DATA AND RATIOS: | |
| Net assets, end of period (millions) | |
| Ratio of net expenses to average net assets | |
| Ratio of net investment loss to average net assets | |
| Portfolio turnover rate(2) | |
| (1) | Amount is less than $0.01. |
| (2) | Portfolio turnover is calculated on the basis of the Fund as a whole. |
The accompanying notes are an integral part of these financial statements.
FINANCIAL HIGHLIGHTS — HENNESSY FOCUS 30 FUND
| Year Ended October 31, | |
| 2010 | | | 2009 | | | 2008 | | | 2007 | | | 2006 | |
| | | | | | | | | | | | | | |
| $ | 8.73 | | | $ | 8.02 | | | $ | 13.67 | | | $ | 12.39 | | | $ | 12.21 | |
| | | | | | | | | | | | | | | | | | | |
| | | | | | | | | | | | | | | | | | | |
| | (0.03 | ) | | | (0.02 | ) | | | (0.06 | ) | | | (0.09 | ) | | | (0.08 | ) |
| | 2.48 | | | | 0.73 | | | | (3.57 | ) | | | 1.47 | | | | 1.86 | |
| | 2.45 | | | | 0.71 | | | | (3.63 | ) | | | 1.38 | | | | 1.78 | |
| | | | | | | | | | | | | | | | | | | |
| | | | | | | | | | | | | | | | | | | |
| | — | | | | — | | | | — | | | | — | | | | — | |
| | — | | | | — | | | | (2.02 | ) | | | (0.10 | ) | | | (1.61 | ) |
| | — | | | | — | | | | (2.02 | ) | | | (0.10 | ) | | | (1.61 | ) |
| | — | | | | — | | | | — | (1) | | | — | (1) | | | 0.01 | |
| $ | 11.18 | | | $ | 8.73 | | | $ | 8.02 | | | $ | 13.67 | | | $ | 12.39 | |
| | | | | | | | | | | | | | | | | | | |
| | 28.06 | % | | | 8.85 | % | | | (30.81 | )% | | | 11.30 | % | | | 16.18 | % |
| | | | | | | | | | | | | | | | | | | |
| | | | | | | | | | | | | | | | | | | |
| $ | 123.20 | | | $ | 128.36 | | | $ | 167.32 | | | $ | 233.37 | | | $ | 240.63 | |
| | 1.39 | % | | | 1.39 | % | | | 1.27 | % | | | 1.23 | % | | | 1.21 | % |
| | (0.26 | )% | | | (0.20 | )% | | | (0.62 | )% | | | (0.61 | )% | | | (0.65 | )% |
| | 87 | % | | | 90 | % | | | 123 | % | | | 112 | % | | | 124 | % |
HENNESSY FUNDS 1-800-966-4354
Financial Highlights
For an Institutional Class share outstanding throughout each period
| PER SHARE DATA: | |
| Net asset value, beginning of period | |
| | |
| Income from investment operations: | |
| Net investment income (loss) | |
| Net realized and unrealized gains (losses) on investments | |
| Total from investment operations | |
| | |
| Less Distributions: | |
| Dividends from net investment income | |
| Dividends from net realized gains | |
| Total distributions | |
| Net asset value, end of period | |
| | |
| TOTAL RETURN | |
| | |
| SUPPLEMENTAL DATA AND RATIOS: | |
| Net assets, end of period (millions) | |
| Ratio of net expenses to average net assets | |
| Before expense reimbursement | |
| After expense reimbursement(4) | |
| Ratio of net investment income (loss) to average net assets | |
| Before expense reimbursement | |
| After expense reimbursement(4) | |
| Portfolio turnover rate(5) | |
| (1) | Institutional Class shares commenced operations on March 3, 2008. |
| (4) | The Advisor and/or Administrator reimbursed expenses in order to cap the Institutional Class share expenses. Please refer to Note 5 for more information. |
| (5) | Portfolio turnover is calculated on the basis of the Fund as a whole. |
The accompanying notes are an integral part of these financial statements.
FINANCIAL HIGHLIGHTS — HENNESSY FOCUS 30 FUND
| | | | | | | Period Ended | |
| Year Ended October 31, | | | October 31, | |
| 2010 | | | 2009 | | | 2008(1) | |
| | | | | | | | |
| $ | 8.78 | | | $ | 8.04 | | | $ | 11.15 | |
| | | | | | | | | | | |
| | | | | | | | | | | |
| | 0.02 | | | | 0.02 | | | | (0.02 | ) |
| | 2.49 | | | | 0.72 | | | | (3.09 | ) |
| | 2.51 | | | | 0.74 | | | | (3.11 | ) |
| | | | | | | | | | | |
| | | | | | | | | | | |
| | — | | | | — | | | | — | |
| | — | | | | — | | | | — | |
| | — | | | | — | | | | — | |
| $ | 11.29 | | | $ | 8.78 | | | $ | 8.04 | |
| | | | | | | | | | | |
| | 28.59 | % | | | 9.20 | % | | | (27.89 | )%(2) |
| | | | | | | | | | | |
| | | | | | | | | | | |
| $ | 21.38 | | | $ | 27.44 | | | $ | 26.78 | |
| | | | | | | | | | | |
| | 1.16 | % | | | 1.15 | % | | | 1.13 | %(3) |
| | 0.98 | % | | | 0.98 | % | | | 0.98 | %(3) |
| | | | | | | | | | | |
| | (0.03 | )% | | | 0.04 | % | | | (0.28 | )%(3) |
| | 0.15 | % | | | 0.21 | % | | | (0.13 | )%(3) |
| | 87 | % | | | 90 | % | | | 123 | %(2) |
HENNESSY FUNDS 1-800-966-4354
Financial Highlights
| Hennessy Cornerstone Large Growth Fund |
For an Original Class share outstanding throughout each period
| PER SHARE DATA: | |
| Net asset value, beginning of period | |
| | |
| Income from investment operations: | |
| Net investment income (loss) | |
| Net realized and unrealized gains (losses) on securities | |
| Total from investment operations | |
| | |
| Less Distributions: | |
| Dividends from net investment income | |
| Dividends from net realized gains | |
| Total distributions | |
| Net asset value, end of period | |
| | |
| TOTAL RETURN | |
| | |
| SUPPLEMENTAL DATA AND RATIOS: | |
| Net assets, end of period (millions) | |
| Ratio of expenses to average net assets | |
| Before expense reimbursement/recoupment | |
| After expense reimbursement/recoupment(7) | |
| Ratio of net investment income (loss) to average net assets | |
| Before expense reimbursement/recoupment | |
| After expense reimbursement/recoupment(7) | |
| Portfolio turnover rate(8) | |
| (1) | For the one month period ended October 31, 2009. Effective October 31, 2009, the Fund changed its fiscal year end to October 31st from September 30th. |
| (2) | The financial highlights set forth for periods prior to March 20, 2009 represent the historical financial highlights of the Tamarack Large Cap Growth Fund, Class S shares. The assets of the Tamarack Large Cap Growth Fund were acquired by the Hennessy Cornerstone Large Growth Fund on March 20, 2009. At the time RBC Global Asset Management (U.S.), Inc. (formerly known as Voyageur Asset Management, Inc.) ceased to be investment advisor and Hennessy Advisors, Inc. became investment advisor. The return of the Tamarack Large Cap Growth Fund, Class S shares during the period October 1, 2008 through March 20, 2009 was (33.30)%. The return of the Hennessy Cornerstone Large Growth Fund, Original Class shares during the period March 20, 2009 through September 30, 2009 was 42.64%. |
| (3) | Amount is less than $0.01 or ($0.01) per share. |
| (4) | Per share net investment income (loss) has been calculated using the average daily shares method. |
| (7) | The Advisor and/or Administrator reimbursed expenses in order to cap the Original Class share expenses. Please refer to Note 5 for more information. |
| (8) | Portfolio turnover is calculated on the basis of the Fund as a whole. |
The accompanying notes are an integral part of these financial statements.
FINANCIAL HIGHLIGHTS — HENNESSY CORNERSTONE LARGE GROWTH FUND
| Year Ended | | | One Month Ended | | | | | | | | | | | | | |
| October 31, | | | October 31, | | | Year Ended September 30, | |
| 2010 | | | 2009(1) | | | 2009(2) | | | 2008 | | | 2007 | | | 2006 | |
| | | | | | | | | | | | | | | | | |
| $ | 9.49 | | | $ | 9.60 | | | $ | 10.09 | | | $ | 12.61 | | | $ | 10.98 | | | $ | 10.75 | |
| | | | | | | | | | | | | | | | | | | | | | | |
| | 0.09 | | | | — | (3) | | | 0.05 | | | | — | (3)(4) | | | — | (3) | | | — | (3) |
| | 2.17 | | | | (0.11 | ) | | | (0.54 | ) | | | (2.52 | ) | | | 1.63 | | | | 0.23 | |
| | 2.26 | | | | (0.11 | ) | | | (0.49 | ) | | | (2.52 | ) | | | 1.63 | | | | 0.23 | |
| | | | | | | | | | | | | | | | | | | | | | | |
| | (0.05 | ) | | | — | | | | — | | | | — | | | | — | | | | — | (3) |
| | — | | | | — | | | | — | | | | — | | | | — | | | | — | |
| | (0.05 | ) | | | — | | | | — | | | | — | | | | — | | | | — | |
| $ | 11.70 | | | $ | 9.49 | | | $ | 9.60 | | | $ | 10.09 | | | $ | 12.61 | | | $ | 10.98 | |
| | 23.88 | % | | | (1.15 | )%(5) | | | (4.86 | )% | | | (19.98 | )% | | | 14.85 | % | | | 2.18 | % |
| | | | | | | | | | | | | | | | | | | | | | | |
| | | | | | | | | | | | | | | | | | | | | | | |
| $ | 78.83 | | | $ | 69.41 | | | $ | 70.61 | | | $ | 80.91 | | | $ | 113.15 | | | $ | 125.25 | |
| | | | | | | | | | | | | | | | | | | | | | | |
| | 1.30 | % | | | 1.26 | %(6) | | | 1.40 | % | | | 1.16 | % | | | 1.18 | % | | | 1.18 | % |
| | 1.30 | % | | | 1.30 | %(6) | | | 1.17 | % | | | 0.98 | % | | | 1.00 | % | | | 1.00 | % |
| | | | | | | | | | | | | | | | | | | | | | | |
| | 0.84 | % | | | (0.01 | )%(6) | | | 0.36 | % | | | (0.19 | )% | | | (0.19 | )% | | | (0.20 | )% |
| | 0.84 | % | | | (0.05 | )%(6) | | | 0.59 | % | | | (0.01 | )% | | | (0.01 | )% | | | (0.02 | )% |
| | 83 | % | | | 0 | %(5) | | | 116 | % | | | 38 | % | | | 25 | % | | | 35 | % |
HENNESSY FUNDS 1-800-966-4354
| Hennessy Cornerstone Large Growth Fund |
For an Institutional Class share outstanding throughout each period
| PER SHARE DATA: | |
| Net asset value, beginning of period | |
| | |
| Income from investment operations: | |
| Net investment income | |
| Net realized and unrealized gains (losses) on securities | |
| Total from investment operations | |
| | |
| Less Distributions: | |
| Dividends from net investment income | |
| Dividends from net realized gains | |
| Total distributions | |
| Net asset value, end of period | |
| | |
| TOTAL RETURN | |
| | |
| SUPPLEMENTAL DATA AND RATIOS: | |
| Net assets, end of period (millions) | |
| Ratio of expenses to average net assets | |
| Before expense reimbursement | |
| After expense reimbursement(5) | |
| Ratio of net investment income (loss) to average net assets | |
| Before expense reimbursement | |
| After expense reimbursement(5) | |
| Portfolio turnover rate(6) | |
| (1) | For the one month period ended October 31, 2009. Effective October 31, 2009, the Fund changed its fiscal year end to October 31st from September 30th. |
| (2) | Institutional Class shares commenced operations on March 20, 2009. |
| (5) | The Advisor and/or Administrator reimbursed expenses in order to cap the Institutional Class share expenses. Please refer to Note 5 for more information. |
| (6) | Portfolio turnover is calculated on the basis of the Fund as a whole. |
The accompanying notes are an integral part of these financial statements.
FINANCIAL HIGHLIGHTS — HENNESSY CORNERSTONE LARGE GROWTH FUND
| Year Ended | | | One Month Ended | | | Period Ended | |
| October 31, | | | October 31, | | | September 30, | |
| 2010 | | | 2009(1) | | | 2009(2) | |
| | | | | | | | |
| $ | 9.51 | | | $ | 9.61 | | | $ | 6.73 | |
| | | | | | | | | | | |
| | | | | | | | | | | |
| | 0.10 | | | | — | | | | 0.03 | |
| | 2.20 | | | | (0.10 | ) | | | 2.85 | |
| | 2.30 | | | | (0.10 | ) | | | 2.88 | |
| | | | | | | | | | | |
| | | | | | | | | | | |
| | (0.05 | ) | | | — | | | | — | |
| | — | | | | — | | | | — | |
| | (0.05 | ) | | | — | | | | — | |
| $ | 11.76 | | | $ | 9.51 | | | $ | 9.61 | |
| | | | | | | | | | | |
| | 24.26 | % | | | (1.04 | )%(3) | | | 42.79 | %(3) |
| | | | | | | | | | | |
| | | | | | | | | | | |
| $ | 0.07 | | | $ | 0.04 | | | $ | 0.04 | |
| | | | | | | | | | | |
| | 1.16 | % | | | 1.14 | %(4) | | | 16.51 | %(4) |
| | 0.98 | % | | | 0.98 | %(4) | | | 0.98 | %(4) |
| | | | | | | | | | | |
| | 0.90 | % | | | 0.12 | %(4) | | | (14.54 | )%(4) |
| | 1.08 | % | | | 0.28 | %(4) | | | 0.99 | %(4) |
| | 83 | % | | | 0 | %(3) | | | 116 | %(3) |
HENNESSY FUNDS 1-800-966-4354
Financial Highlights
| Hennessy Cornerstone Value Fund |
For an Original Class share outstanding throughout each year
| PER SHARE DATA: | |
| Net asset value, beginning of year | |
| | |
| Income from investment operations: | |
| Net investment income (loss) | |
| Net realized and unrealized gains (losses) on investments | |
| Total from investment operations | |
| | |
| Less Distributions: | |
| Dividends from net investment income | |
| Dividends from net realized gains | |
| Total distributions | |
| Net asset value, end of year | |
| | |
| TOTAL RETURN | |
| | |
| SUPPLEMENTAL DATA AND RATIOS: | |
| Net assets, end of period (millions) | |
| Ratio of net expenses to average net assets | |
| Ratio of net investment income to average net assets | |
| Portfolio turnover rate(1) | |
| (1) | Portfolio turnover is calculated on the basis of the Fund as a whole. |
The accompanying notes are an integral part of these financial statements.
FINANCIAL HIGHLIGHTS — HENNESSY CORNERSTONE VALUE FUND
| Year Ended October 31, | |
| 2010 | | | 2009 | | | 2008 | | | 2007 | | | 2006 | |
| | | | | | | | | | | | | | |
| $ | 10.63 | | | $ | 9.05 | | | $ | 17.06 | | | $ | 15.27 | | | $ | 12.95 | |
| | | | | | | | | | | | | | | | | | | |
| | | | | | | | | | | | | | | | | | | |
| | 0.29 | | | | 0.24 | | | | 0.55 | | | | 0.46 | | | | 0.30 | |
| | 1.81 | | | | 1.87 | | | | (8.15 | ) | | | 1.68 | | | | 2.36 | |
| | 2.10 | | | | 2.11 | | | | (7.60 | ) | | | 2.14 | | | | 2.66 | |
| | | | | | | | | | | | | | | | | | | |
| | | | | | | | | | | | | | | | | | | |
| | (0.20 | ) | | | (0.53 | ) | | | (0.41 | ) | | | (0.35 | ) | | | (0.34 | ) |
| | — | | | | — | | | | — | | | | — | | | | — | |
| | (0.20 | ) | | | (0.53 | ) | | | (0.41 | ) | | | (0.35 | ) | | | (0.34 | ) |
| $ | 12.53 | | | $ | 10.63 | | | $ | 9.05 | | | $ | 17.06 | | | $ | 15.27 | |
| | | | | | | | | | | | | | | | | | | |
| | 19.98 | % | | | 25.51 | % | | | (45.50 | )% | | | 14.26 | % | | | 21.00 | % |
| | | | | | | | | | | | | | | | | | | |
| | | | | | | | | | | | | | | | | | | |
| $ | 155.87 | | | $ | 145.91 | | | $ | 97.10 | | | $ | 204.50 | | | $ | 256.80 | |
| | 1.29 | % | | | 1.27 | % | | | 1.20 | % | | | 1.17 | % | | | 1.15 | % |
| | 2.33 | % | | | 3.19 | % | | | 3.92 | % | | | 2.64 | % | | | 2.49 | % |
| | 91 | % | | | 59 | % | | | 53 | % | | | 40 | % | | | 35 | % |
HENNESSY FUNDS 1-800-966-4354
Financial Highlights
| Hennessy Cornerstone Value Fund |
For an Institutional Class share outstanding throughout each period
| PER SHARE DATA: | |
| Net asset value, beginning of period | |
| | |
| Income from investment operations: | |
| Net investment income (loss) | |
| Net realized and unrealized gains (losses) on investments | |
| Total from investment operations | |
| | |
| Less Distributions: | |
| Dividends from net investment income | |
| Dividends from net realized gains | |
| Total distributions | |
| Net asset value, end of period | |
| | |
| TOTAL RETURN | |
| | |
| SUPPLEMENTAL DATA AND RATIOS: | |
| Net assets, end of period (millions) | |
| Ratio of net expenses to average net assets | |
| Before expense reimbursement | |
| After expense reimbursement(4) | |
| Ratio of net investment income to average net assets | |
| Before expense reimbursement | |
| After expense reimbursement(4) | |
| Portfolio turnover rate(5) | |
| (1) | Institutional Class shares commenced operations on March 3, 2008. |
| (4) | The Advisor and/or Administrator reimbursed expenses in order to cap the Institutional Class share expenses. Please refer to Note 5 for more information. |
| (5) | Portfolio turnover is calculated on the basis of the Fund as a whole. |
The accompanying notes are an integral part of these financial statements.
FINANCIAL HIGHLIGHTS — HENNESSY CORNERSTONE VALUE FUND
| | | | | | | Period Ended | |
| Year Ended October 31, | | | October 31, | |
| 2010 | | | 2009 | | | 2008(1) | |
| | | | | | | | |
| $ | 10.63 | | | $ | 9.06 | | | $ | 13.79 | |
| | | | | | | | | | | |
| | | | | | | | | | | |
| | 0.30 | | | | 0.30 | | | | 0.34 | |
| | 1.83 | | | | 1.83 | | | | (5.07 | ) |
| | 2.13 | | | | 2.13 | | | | (4.73 | ) |
| | | | | | | | | | | |
| | | | | | | | | | | |
| | (0.22 | ) | | | (0.56 | ) | | | — | |
| | — | | | | — | | | | — | |
| | (0.22 | ) | | | (0.56 | ) | | | — | |
| $ | 12.54 | | | $ | 10.63 | | | $ | 9.06 | |
| | | | | | | | | | | |
| | 20.31 | % | | | 25.87 | % | | | (34.30 | )%(2) |
| | | | | | | | | | | |
| | | | | | | | | | | |
| $ | 1.35 | | | $ | 1.11 | | | $ | 0.87 | |
| | | | | | | | | | | |
| | 1.10 | % | | | 1.13 | % | | | 1.14 | %(3) |
| | 0.98 | % | | | 0.98 | % | | | 0.98 | %(3) |
| | | | | | | | | | | |
| | 2.52 | % | | | 3.33 | % | | | 4.94 | %(3) |
| | 2.64 | % | | | 3.48 | % | | | 5.10 | %(3) |
| | 91 | % | | | 59 | % | | | 53 | %(2) |
HENNESSY FUNDS 1-800-966-4354
Financial Highlights
| Hennessy Total Return Fund |
For an Original Class share outstanding throughout each year
| PER SHARE DATA: | |
| Net asset value, beginning of year | |
| | |
| Income from investment operations: | |
| Net investment income | |
| Net realized and unrealized gains (losses) on securities | |
| Total from investment operations | |
| | |
| Less Distributions: | |
| Dividends from net investment income | |
| Dividends from realized capital gains | |
| Total distributions | |
| Net asset value, end of year | |
| | |
| TOTAL RETURN | |
| | |
| SUPPLEMENTAL DATA AND RATIOS: | |
| Net assets, end of period (millions) | |
| Gross ratio of expenses, including interest expense, to average net asset | |
| Ratio of interest expense to average net assets | |
| Net ratio of expenses, excluding interest expense, to average net assets | |
| Ratio of net investment income (loss) to average net assets | |
| Portfolio turnover rate | |
The accompanying notes are an integral part of these financial statements.
FINANCIAL HIGHLIGHTS — HENNESSY TOTAL RETURN FUND
| Year Ended October 31, | |
| 2010 | | | 2009 | | | 2008 | | | 2007 | | | 2006 | |
| | | | | | | | | | | | | | |
| $ | 9.10 | | | $ | 9.22 | | | $ | 13.73 | | | $ | 12.61 | | | $ | 10.57 | |
| | | | | | | | | | | | | | | | | | | |
| | | | | | | | | | | | | | | | | | | |
| | 0.16 | | | | 0.18 | | | | 0.28 | | | | 0.33 | | | | 0.31 | |
| | 1.48 | | | | (0.14 | ) | | | (4.49 | ) | | | 1.13 | | | | 2.03 | |
| | 1.64 | | | | 0.04 | | | | (4.21 | ) | | | 1.46 | | | | 2.34 | |
| | | | | | | | | | | | | | | | | | | |
| | | | | | | | | | | | | | | | | | | |
| | (0.17 | ) | | | (0.16 | ) | | | (0.30 | ) | | | (0.34 | ) | | | (0.30 | ) |
| | — | | | | — | | | | — | | | | — | | | | — | |
| | (0.17 | ) | | | (0.16 | ) | | | (0.30 | ) | | | (0.34 | ) | | | (0.30 | ) |
| $ | 10.57 | | | $ | 9.10 | | | $ | 9.22 | | | $ | 13.73 | | | $ | 12.61 | |
| | | | | | | | | | | | | | | | | | | |
| | 18.09 | % | | | 0.69 | % | | | (30.97 | )% | | | 11.70 | % | | | 22.48 | % |
| | | | | | | | | | | | | | | | | | | |
| | | | | | | | | | | | | | | | | | | |
| $ | 69.08 | | | $ | 52.38 | | | $ | 58.22 | | | $ | 96.31 | | | $ | 113.26 | |
| | 1.33 | % | | | 1.56 | % | | | 2.36 | % | | | 3.04 | % | | | 2.80 | % |
| | 0.08 | % | | | 0.29 | % | | | 1.16 | % | | | 1.88 | % | | | 1.64 | % |
| | 1.25 | % | | | 1.27 | % | | | 1.20 | % | | | 1.16 | % | | | 1.16 | % |
| | 1.62 | % | | | 2.12 | % | | | 2.43 | % | | | 2.48 | % | | | 2.79 | % |
| | 41 | % | | | 41 | % | | | 16 | % | | | 12 | % | | | 24 | % |
HENNESSY FUNDS 1-800-966-4354
Financial Highlights
For an Original Class share outstanding throughout each year
| PER SHARE DATA: | |
| Net asset value, beginning of year | |
| | |
| Income from investment operations: | |
| Net investment income | |
| Net realized and unrealized gains (losses) on securities | |
| Total from investment operations | |
| | |
| Less Distributions: | |
| Dividends from net investment income | |
| Dividends from realized capital gains | |
| Total distributions | |
| Redemption fees retained(1) | |
| Net asset value, end of year | |
| | |
| TOTAL RETURN | |
| | |
| SUPPLEMENTAL DATA AND RATIOS: | |
| Net assets, end of period (millions) | |
| Ratio of net expenses to average net assets | |
| Ratio of net investment income to average net assets | |
| Portfolio turnover rate | |
| (1) | Amount is less than $0.01. |
The accompanying notes are an integral part of these financial statements.
FINANCIAL HIGHLIGHTS — HENNESSY BALANCED FUND
| Year Ended October 31, | |
| 2010 | | | 2009 | | | 2008 | | | 2007 | | | 2006 | |
| | | | | | | | | | | | | | |
| $ | 9.48 | | | $ | 9.11 | | | $ | 12.51 | | | $ | 11.83 | | | $ | 10.56 | |
| | | | | | | | | | | | | | | | | | | |
| | | | | | | | | | | | | | | | | | | |
| | 0.05 | | | | 0.10 | | | | 0.25 | | | | 0.38 | | | | 0.30 | |
| | 0.95 | | | | 0.38 | | | | (2.80 | ) | | | 0.69 | | | | 1.25 | |
| | 1.00 | | | | 0.48 | | | | (2.55 | ) | | | 1.07 | | | | 1.55 | |
| | | | | | | | | | | | | | | | | | | |
| | | | | | | | | | | | | | | | | | | |
| | (0.05 | ) | | | (0.11 | ) | | | (0.26 | ) | | | (0.39 | ) | | | (0.28 | ) |
| | — | | | | — | | | | (0.59 | ) | | | — | | | | — | |
| | (0.05 | ) | | | (0.11 | ) | | | (0.85 | ) | | | (0.39 | ) | | | (0.28 | ) |
| | — | | | | — | | | | — | | | | — | | | | — | |
| $ | 10.43 | | | $ | 9.48 | | | $ | 9.11 | | | $ | 12.51 | | | $ | 11.83 | |
| | | | | | | | | | | | | | | | | | | |
| | 10.53 | % | | | 5.46 | % | | | (21.55 | )% | | | 9.16 | % | | | 14.92 | % |
| | | | | | | | | | | | | | | | | | | |
| | | | | | | | | | | | | | | | | | | |
| $ | 12.50 | | | $ | 11.47 | | | $ | 11.46 | | | $ | 16.82 | | | $ | 26.14 | |
| | 1.65 | % | | | 1.73 | % | | | 1.56 | % | | | 1.36 | % | | | 1.34 | % |
| | 0.45 | % | | | 1.17 | % | | | 2.31 | % | | | 2.86 | % | | | 2.75 | % |
| | 57 | % | | | 46 | % | | | 13 | % | | | 35 | % | | | 88 | % |
HENNESSY FUNDS 1-800-966-4354
(This Page Intentionally Left Blank.)
NOTES TO THE FINANCIAL STATEMENTS
Notes to the Financial Statements
October 31, 2010
1). ORGANIZATION
The Hennessy Mutual Funds, Inc. was organized as a Maryland corporation on May 20, 1996 and consists of three separate series: Hennessy Cornerstone Growth Fund (the “Growth Fund”), Hennessy Cornerstone Value Fund (the “Value Fund”) and the Hennessy Focus 30 Fund (the “Focus 30 Fund”). These Funds are open-end, diversified management investment companies registered under the Investment Company Act of 1940, as amended. The investment objective of the Growth and Focus 30 Funds is long-term growth of capital. The investment objective of the Value Fund is total return, consisting of capital appreciation and current income.
The Hennessy Funds, Inc. was organized as a Maryland corporation on January 11, 1996 and consists of two separate series: Hennessy Balanced Fund (the “Balanced Fund”) and Hennessy Total Return Fund (the “Total Return Fund”). The Balanced and Total Return Funds are open-end, non-diversified management investment companies registered under the Investment Company Act of 1940, as amended. The investment objective of the Balanced Fund is a combination of capital appreciation and current income. The investment objective of the Total Return Fund is total return, consisting of capital appreciation and current income.
The Hennessy Funds Trust (the “Trust”) was organized as a Delaware Statutory Trust on September 17, 1992 and consists of three series: Hennessy Cornerstone Growth Fund, Series II (the “Growth II Fund”), Hennessy Select Large Value Fund and Hennessy Large Growth Fund (the “Large Growth Fund”). The financial results of the Hennessy Select Large Value Fund are not contained in this report. The Large Growth Fund is the successor to the Tamarack Large Cap Growth Fund pursuant to a reorganization that took place on March 20, 2009. As a result of the reorganization, holders of the Class A, Class C, Class I, Class R and Class S shares of the Tamarack Large Cap Growth Fund received Original Class shares of the Hennessy Cornerstone Large Growth Fund. The Growth II and Large Growth Funds are open-end, diversified management investment companies registered under the Investment Company Act of 1940, as amended. The investment objective of the Growth II and Large Growth Funds is long-term growth of capital.
The Growth, Growth II, Focus 30, Large Growth, Value, Total Return and Balanced Funds collectively represent the Hennessy Cornerstone Series Funds (the “Funds”).
The Growth, Growth II, Focus 30, Large Growth and Value Funds offer Original and Institutional Class shares. Each class of shares differs principally in its respective administration, shareholder servicing and transfer agent expenses and sales charges, if any. Each class has identical rights to earnings, assets and voting privileges, except for class-specific expenses and exclusive rights to vote on matters affecting only individual classes. The Balanced and Total Return Funds offer only Original Class shares.
HENNESSY FUNDS 1-800-966-4354
2). SIGNIFICANT ACCOUNTING POLICIES
The following is a summary of significant accounting policies consistently followed by the Funds in the preparation of the financial statements. These policies are in conformity with U.S. generally accepted accounting principles (“GAAP”).
a). Investment Valuation – Securities which are traded on a national or recognized stock exchange are valued at the last sale price on the securities exchange on which such securities are primarily traded. Exchange-traded securities for which there were no transactions that day and debt securities are valued at the most recent bid prices. Instruments with a remaining maturity of 60 days or less are valued on an amortized cost basis. When a price for an underlying security is not readily available or if a significant event has occurred that indicates the closing price of a security no longer represents the true value of that security, fair value pricing procedures have been adopted by the Board of Directors of the Funds. Fair value pricing determinations are made in good faith in accordance with these procedures. There are numerous criteria that will be given consideration in determining a fair value of a security. Some of these criteria are: trading volume of security and markets, value of other like securities and news events with direct bearing to security or market. Fair value pricing results in an estimated price that reasonably reflects the current market conditions in order to rate the portfolio holdings such that shareholder transactions receive a fair net asset value.
b). Federal Income Taxes – Provision for federal income taxes or excise taxes has not been made since the Funds have elected to be taxed as “regulated investment companies” and intend to distribute substantially all taxable income to shareholders and otherwise comply with the provisions of the Internal Revenue Code applicable to regulated investment companies. Net investment income and realized gains and losses for federal income tax purposes may differ from that reported on the financial statements because of temporary book and tax basis differences. Temporary differences are primarily the result of the treatment of wash sales for tax reporting purposes. Distributions from net realized gains for book purposes may include short-term capital gains, which are includ ed as ordinary income to shareholders for tax purposes.
Due to inherent differences in the recognition of income, expenses, and realized gains/losses under U.S. generally accepted accounting principles and federal income tax purposes, permanent differences between book and tax basis reporting for the 2010 fiscal year have been identified and appropriately reclassified on the Statement of Assets and Liabilities.
| | | Accumulated Net | | | Accumulated Net | | | Paid In | |
| | | Investment Income/(Loss) | | | Realized Gain/(Loss) | | | Capital | |
| Growth Fund | | | 1,966,127 | | | | — | | | | (1,966,127 | ) |
| Growth II Fund | | | 239,567 | | | | 37,758 | | | | (277,325 | ) |
| Focus 30 Fund | | | 285,570 | | | | — | | | | (285,570 | ) |
| Large Growth Fund | | | (3,301 | ) | | | — | | | | 3,301 | |
| Value Fund | | | 151,923 | | | | 8,454,304 | | | | (8,606,227 | ) |
| Total Return Fund | | | — | | | | — | | | | — | |
| Balanced Fund | | | — | | | | 1 | | | | (1 | ) |
NOTES TO THE FINANCIAL STATEMENTS
The permanent differences primarily relate to net operating losses and capital loss carryovers lost due to expiration.
c). Income and Expenses – Dividend income is recognized on the ex-dividend date or as soon as information is available to the Funds and interest income is recognized on an accrual basis. Income, expenses (other than expenses attributable to a specific class), and realized and unrealized gains or losses on investments are allocated to each class of shares based on its respective net assets.
d). Distributions to Shareholders – Dividends from net investment income for the Growth, Growth II, Focus 30, Large Growth and Value Funds, if any, are declared and paid out annually, usually in November or December of each year. Dividends from net investment income for the Total Return and Balanced Funds are declared and paid on a calendar quarter basis. Distributions of net realized capital gains, if any, are declared and paid annually, usually in November or December of each year, for all of the Funds.
e). Security Transactions – Investment and shareholder transactions are recorded on the trade date. The Funds determine the gain or loss realized from the investment transactions by comparing the original cost of the security lot sold with the net sale proceeds. Discounts and premiums on securities purchased are accreted/amortized over the life of the respective security.
f). Use of Estimates – The preparation of financial statements in conformity with GAAP requires management to make estimates and assumptions that affect the reported amounts of assets and liabilities and disclosure of contingent assets and liabilities at the date of the financial statements and the reported change in net assets during the reporting period. Actual results could differ from those estimates.
g). Share Valuation – The net asset value (“NAV”) per share of each Fund is calculated by dividing the sum of the value of the securities held by each Fund, plus cash or other assets, minus all liabilities (including estimated accrued expenses) by the total number of shares outstanding for each Fund, rounded to the nearest cent. The Funds’ shares will not be priced on the days on which the New York Stock Exchange is closed for trading. The offering and redemption price per share for each Fund is equal to each Fund’s net asset value per share. The Funds charged a 1.50% redemption fee on shares held less than 90 days through August 29, 2008. These fees were deducted from the redemption proceeds otherwise payable to the shareholder. These fees were retain ed by each Fund and treated as additional paid-in capital and allocated to each respective class of shares (if applicable).
h). Repurchase Agreements – Each Fund may enter into repurchase agreements with member banks or security dealers of the Federal Reserve whom the investment advisor deems creditworthy. The repurchase price generally equals the price paid by the Fund plus interest negotiated on the basis of current short-term rates.
Securities pledged as collateral for repurchase agreements are held by the custodian bank until the respective agreements mature. Provisions of the repurchase agreements ensure that the market value of the collateral, including accrued interest thereon, is sufficient, in the event of default of the
HENNESSY FUNDS 1-800-966-4354
counterparty. If the counterparty defaults and the value of the collateral declines or if the counterparty enters an insolvency proceeding, realization of the collateral by the Fund may be delayed or limited.
i). Accounting for Uncertainty in Income Taxes – The Funds have adopted accounting policies regarding recognition and measurement of tax positions taken or expected to be taken on a tax return. The Funds have reviewed all open tax years and major jurisdictions and concluded that there is no impact on the Funds’ net assets and no tax liability resulting from unrecognized tax benefits relating to uncertain income tax positions taken or expected to be taken on a tax return. As of October 31, 2010, open Federal and state tax years for the Large Growth Fund include the tax years ended September 30, 2006 through 2009, tax period ended October 31, 2009 and tax year ended October 31, 2010. As of October 31, 2010, open Federal and state tax years for the Growth, Growth II, Focus, Value, Total Return and Balanced Fund include the tax years ended October 31, 2006 through 2010.
j). Derivatives – The Funds have adopted the financial accounting reporting rules as required by the Derivatives and Hedging Topic of the FASB Accounting Standards Codification (“FASB ASC”). The Funds are required to include enhanced disclosure that enables investors to understand how and why an entity uses derivatives, how derivatives are accounted for, and how derivatives instruments affect an entity’s results of operations and financial position. During the year ended October 31, 2010, the Funds did not hold any derivative instruments.
k). Events Subsequent to the Fiscal Period End – The Funds have adopted financial reporting rules regarding subsequent events which requires an entity to recognize in the financial statements the effects of all subsequent events that provide additional evidence about conditions that existed at the date of the balance sheet. Management has evaluated the Funds’ related events and transactions that occurred subsequent to October 31, 2010, through the date of issuance of the Funds’ financial statements. There were no events or transactions that occurred during this period that materially impacted the amounts or disclosures in the Fund’s financial statements.
l). New Accounting Pronouncement – In January 2010, the FASB issued Accounting Standards Update “Improving Disclosures about Fair Value Measurements” (“ASU”). The ASU requires enhanced disclosures about a) transfers into and out of Levels 1 and 2, and b) purchases, sales, issuances, and settlements on a gross basis relating to Level 3 measurements. The first disclosure is effective for the first reporting period beginning after December 15, 2009, and for interim periods within those fiscal years. There were no significant transfers into and out of Levels 1 and 2 during the current period presented.
The second disclosure will become effective for fiscal years beginning after December 15, 2010, and for interim periods within those fiscal years. Management is currently evaluating the impact this disclosure may have on the Funds’ financial statements.
NOTES TO THE FINANCIAL STATEMENTS
3). REVERSE REPURCHASE AGREEMENTS
The Total Return Fund has entered into reverse repurchase agreements with UBS Financial Services, Inc., under which the Total Return Fund sells securities and agrees to repurchase them later at a mutually agreed upon price. For the year ended October 31, 2010, the average daily balance and average interest rate in effect for reverse repurchase agreements was $15,986,585 and 0.27%, respectively. At October 31, 2010, the interest rate in effect for the outstanding reverse repurchase agreements, scheduled to mature on November 12, 2010 ($8,095,500), December 16, 2010 ($8,095,500) and January 20, 2011 ($8,095,500) was 0.25%, 0.27% and 0.28%, respectively. Outstanding reverse repurchase agreements at October 31, 2010 were equal to 35.16% of the Total Return Fund’s total net assets.
4). INVESTMENT TRANSACTIONS
Purchases and sales of investment securities (excluding government and short-term investments) during the year ended October 31, 2010 were as follows:
| | Growth | Growth II | Focus 30 | Large Growth | Value | Total Return | Balanced |
| | Fund | Fund | Fund | Fund | Fund | Fund | Fund |
| Purchases | $222,005,020 | $28,540,554 | $123,045,769 | $59,719,722 | $133,524,233 | $18,045,167 | $3,469,353 |
| Sales | $275,222,280 | $34,258,858 | $170,434,597 | $63,859,319 | $148,035,849 | $16,768,290 | $4,101,266 |
Purchases and Sales/Maturities of long-term U.S. Government Securities for the Total Return Fund were $143,971,145 and $138,402,000, respectively. Purchases and Sales/Maturities of long-term U.S. Government Securities for the Balanced Fund were $5,583,512 and $5,200,000, respectively. There were no purchases or Sales/Maturities of long-term U.S. Government Securities for the Growth, Growth II, Focus 30, Large Growth or Value Funds.
5). INVESTMENT MANAGEMENT FEE AND OTHER TRANSACTIONS WITH AFFILIATES
Hennessy Advisors, Inc. (the “Advisor”) is the Advisor of the Funds. The Advisor provides the Funds with investment management services under a Management Agreement. The Advisor furnishes all investment advice, office space, facilities, and provides most of the personnel needed by the Funds. As compensation for its services, the Advisor is entitled to a monthly fee from each Fund. The fee is based upon the average daily net assets of the Funds at the annual rate of:
| Growth Fund | 0.74% |
| Growth II Fund | 0.74% |
| Focus 30 Fund | 0.74% |
| Large Growth Fund | 0.74% |
| Value Fund | 0.74% |
| Total Return Fund | 0.60% |
| Balanced Fund | 0.60% |
The Advisor has agreed to waive its fees and absorb expenses to the extent that the total annual operating expenses (excluding all Federal, state and local taxes, interest, brokerage commissions, acquired fund fees and expenses and other costs incurred in connection with the purchase and sale of securities and extraordinary items) do not exceed 0.98% of the Funds’ net assets for the Institutional Class shares in the Growth, Growth II, Focus 30, Large Growth and
HENNESSY FUNDS 1-800-966-4354
Value Funds or 1.30% of the Original Class shares of the Large Growth Fund. The expense limitation agreement for the Original Class shares of the Large Growth Fund expired on March 31, 2010. The expense limitation agreement for the Institutional Class shares can only be terminated by the Board of Directors/Trustees. For a period of three years after the year in which the Advisor waives or reimburses expenses, the Advisor may seek reimbursement from the Funds to the extent that total annual Fund operating expenses are less than the expense limitation in effect at the time of the reimbursement. The Advisor reimbursed Institutional Class expenses of $531 for the Growth II for the year ended October 31, 2010.
The Advisor recouped $951 of previously reimbursed Original Class expenses for the Large Growth Fund for the year ended October 31, 2010.
As of October 31, 2010, cumulative expenses subject to potential recovery to the aforementioned conditions and year of expiration are as follows:
| | | Oct. 31, 2011 | | | Oct. 31, 2012 | | | Oct. 31, 2013 | | | Total | |
| Growth Fund – Institutional Class | | $ | 7,464 | | | $ | 6,062 | | | $ | — | | | $ | 13,526 | |
| Growth II Fund – Institutional Class | | $ | 137 | | | $ | 706 | | | $ | 531 | | | $ | 1,374 | |
| Focus 30 Fund – Institutional Class | | $ | 35,499 | | | $ | 43,673 | | | $ | — | | | $ | 79,172 | |
| Large Growth Fund – Original Class | | $ | 37,372 | | | $ | — | | | $ | — | | | $ | 37,372 | |
| Large Growth Fund – Institutional Class | | $ | 2,051 | | | $ | 5 | | | $ | — | | | $ | 2,056 | |
| Value Fund – Institutional Class | | $ | 1,056 | | | $ | 1,298 | | | $ | — | | | $ | 2,354 | |
The Board of Directors/Trustees has approved a Shareholder Servicing Plan for the Original Class shares of the Growth, Growth II, Focus 30, Large Growth, Value, Total Return and Balanced Funds which was instituted to compensate the Advisor for the non-investment management services it provides to the Funds. The Plan provides for a monthly fee paid to the Advisor at an annual rate of 0.10% of the average daily net assets of the Funds.
The Growth, Growth II, Focus 30, Large Growth and Value Funds have entered into agreements with various brokers, dealers and financial intermediaries in connection with the sale of shares of the Funds. The agreements provide for periodic payments by the Funds to the brokers, dealers and financial intermediaries for providing certain shareholder maintenance services (sub-transfer agent expenses). These shareholder services include: the pre-processing and quality control of new accounts, shareholder correspondence, answering customer inquiries regarding account status and facilitating shareholder telephone transactions. Fees paid by the Growth, Growth II, Focus 30, Large Growth and Value Funds to various brokers, dealers and financial intermediaries for the ye ar ended October 31, 2010, were $345,678, $58,275, $239,283, $17,428 and $152,828, respectively.
The Total Return and Balanced Funds have adopted a plan pursuant to Rule 12b-1 which authorizes payments in connection with the distribution of the Total Return and Balanced Fund shares at an annual rate not to exceed 0.15% of each Fund’s average daily net assets. Amounts paid under the Plan may be spent on any activities or expenses primarily intended to result in the sale of shares, including but not limited to, advertising, compensation for sales and marketing activities or financial institutions and others such as dealers and distributors, shareholder account servicing, the printing and mailing of prospectuses to other than current shareowners and the printing and mailing of sales literature.
NOTES TO THE FINANCIAL STATEMENTS
U.S. Bancorp Fund Services, LLC (the “Administrator”) acts as the Funds’ administrator under an Administration Agreement. Administrative services under this agreement include custody, distribution, fund accounting, fund administration and transfer agent services. In addition, the Administrator prepares various federal and state regulatory filings, reports and returns for the Funds; prepares reports and materials to be supplied to the directors; monitors the activities of the Funds’ custodian, transfer agent and accountants; coordinates the preparation and payment of the Funds’ expenses and reviews the Funds’ expense accruals. Fees paid to U.S. Bancorp Fund Services, LLC for the year ended October 31, 2010, were $564,967, $79,611, $373,213, $201 ,287, $389,420, $143,575 and $30,882 for Growth, Growth II, Focus 30, Large Growth, Value, Total Return and Balanced Funds, respectively. The Administrator has voluntarily waived all or a portion of its administration fees allocated to the Institutional Class shares of the Growth, Growth II, Focus 30, Large Growth and Value Funds. The administration fees voluntarily waived by the Administrator during the year ended October 31, 2010 were $4,240, $844, $43,158, $98, and $1,408, respectively.
Quasar Distributors, LLC (the “Distributor”) acts as the Funds’ principal underwriter in a continuous public offering of the Funds’ shares. The Distributor is an affiliated company of U.S. Bank, N.A.
6). LINE OF CREDIT
The Growth, Growth II, Focus 30, and Value Funds have $40,000,000, $1,500,000, $25,000,000 and $10,000,000 lines of credit, respectively, intended to provide short-term financing, if necessary, subject to certain restrictions, in connection with shareholder redemptions. The credit facility is with its custodian bank, U.S. Bank, N.A. During the year ended October 31, 2010, the Growth Fund had an outstanding average daily balance and a weighted average interest rate of $756 and 3.25%, respectively. The maximum amount outstanding for the Growth Fund during the period was $212,000. During the year ended October 31, 2010, the Focus 30 Fund had an outstanding average daily balance and a weighted average interest rate of $26,740 and 3.25%, respectively. The maximum amount outstanding for the Focus 30 Fund during the period was $3,419, 000. During the year ended October 31, 2010, the Value Fund had an outstanding average daily balance and a weighted average interest rate of $98,162 and 3.25%, respectively. The maximum amount outstanding for the Value Fund during the period was $6,061,000. During the year ended October 31, 2010, the Growth II Fund had no line of credit activity.
HENNESSY FUNDS 1-800-966-4354
As of October 31, 2010, the components of accumulated earnings (losses) for income tax purposes were as follows:
| | | Growth | | | Growth II | | | Focus 30 | |
| | | Fund | | | Fund | | | Fund | |
| Cost of investments for tax purposes | | $ | 183,696,546 | | | $ | 27,823,349 | | | $ | 130,808,572 | |
| Gross tax unrealized appreciation | | | 39,262,640 | | | | 4,577,908 | | | | 14,422,821 | |
| Gross tax unrealized depreciation | | | (12,452,253 | ) | | | (1,702,329 | ) | | | (1,040,567 | ) |
| Net tax unrealized | | | | | | | | | | | | |
| appreciation (depreciation) | | | 26,810,387 | | | | 2,875,579 | | | | 13,382,254 | |
| Undistributed ordinary income | | $ | — | | | $ | — | | | $ | — | |
| Undistributed long-term capital gains | | | — | | | | — | | | | — | |
| Total distributable earnings | | $ | — | | | $ | — | | | $ | — | |
| Other accumulated gains/(loss) | | $ | (277,999,856 | ) | | $ | (54,289,903 | ) | | $ | (65,439,669 | ) |
| Total accumulated earnings/(loss) | | $ | (251,189,469 | ) | | $ | (51,414,324 | ) | | $ | (52,057,415 | ) |
| | | Large | | | | | | Total | | | | |
| | | Growth | | | Value | | | Return | | | Balanced | |
| | | Fund | | | Fund | | | Fund | | | Fund | |
| Cost of investments | | | | | | | | | | | | |
| for tax purposes | | $ | 69,685,306 | | | $ | 139,773,894 | | | $ | 90,484,010 | | | $ | 12,061,922 | |
| Gross tax | | | | | | | | | | | | | | | | |
| unrealized appreciation | | | 10,972,375 | | | | 21,871,148 | | | | 4,762,248 | | | | 747,143 | |
| Gross tax | | | | | | | | | | | | | | | | |
| unrealized depreciation | | | (1,699,296 | ) | | | (4,510,078 | ) | | | (2,054,042 | ) | | | (337,670 | ) |
| Net tax unrealized | | | | | | | | | | | | | | | | |
| appreciation (depreciation) | | $ | 9,273,079 | | | $ | 17,361,070 | | | $ | 2,708,206 | | | $ | 409,473 | |
| Undistributed ordinary income | | $ | 627,807 | | | $ | 3,560,233 | | | $ | 56,753 | | | $ | 4,166 | |
| Undistributed long-term | | | | | | | | | | | | | | | | |
| capital gains | | | 109,217 | | | | — | | | | — | | | | — | |
| Total distributable earnings | | $ | 737,024 | | | $ | 3,560,233 | | | $ | 56,753 | | | $ | 4,166 | |
| Other accumulated gains/(loss) | | $ | — | | | $ | (57,519,849 | ) | | $ | (13,616,778 | ) | | $ | (2,257,478 | ) |
| Total accumulated | | | | | | | | | | | | | | | | |
| earnings/(loss) | | $ | 10,010,103 | | | $ | (36,598,546 | ) | | $ | (10,851,819 | ) | | $ | (1,843,839 | ) |
The difference between book-basis and tax-basis unrealized appreciation is attributable primarily to wash sales and partnership adjustments.
At October 31, 2010, the Growth Fund had tax basis capital losses of $277,999,856, to offset future capital gains. Of such losses, $100,898,505 expire October 31, 2016 and $177,101,351 expire October 31, 2017.
At October 31, 2010, the Growth II Fund had tax basis capital losses of $54,289,903, to offset future capital gains. Of such losses, $29,176,218 expire October 31, 2016 and $25,113,685 expire October 31, 2017.
At October 31, 2010, the Focus 30 Fund had tax basis capital losses of $65,439,669, to offset future capital gains. Of such losses, $24,304,531 expire October 31, 2016 and $41,135,138 expire October 31, 2017.
NOTES TO THE FINANCIAL STATEMENTS
At October 31, 2010, the Large Growth Fund had no tax basis capital losses to offset future capital gains.
At October 31, 2010, the Value Fund had tax basis capital losses of $57,519,849, to offset future capital gains. Of such losses, $712,595 expire October 31, 2011 and $56,807,254 expire on October 31, 2017.
At October 31, 2010, the Total Return Fund had tax basis capital losses of $13,616,778, which may be carried over to offset future capital gains. Of such $13,616,778 expire October 31, 2017.
At October 31, 2010, the Balanced Fund had tax basis capital losses of $2,257,478, to offset future capital gains. Of such losses, $2,257,478 expire October 31, 2017.
The tax character of distributions paid during 2010 and 2009 for the Funds were as follows:
| | | | Year Ended | | | Year Ended | | | | |
| | Growth Fund | | October 31, 2010 | | | October 31, 2009 | | | | |
| | Ordinary income | | $ | — | | | $ | — | | | | |
| | Long-term capital gain | | | — | | | | — | | | | |
| | | | $ | — | | | $ | — | | | | |
| | | | | | | | | | | |
| | | | Year Ended | | | Year Ended | | | | |
| | Growth II Fund | | October 31, 2010 | | | October 31, 2009 | | | | |
| | Ordinary income | | $ | — | | | $ | — | | | | |
| | Long-term capital gain | | | — | | | | — | | | | |
| | | | $ | — | | | $ | — | | | | |
| | | | | | | | | | | |
| | | | Year Ended | | | Year Ended | | | | |
| | Focus 30 Fund | | October 31, 2010 | | | October 31, 2009 | | | | |
| | Ordinary income | | $ | — | | | $ | — | | | | |
| | Long-term capital gain | | | — | | | | — | | | | |
| | | | $ | — | | | $ | — | | | | |
| | | | | | | | | | | |
| | | | Year Ended | | | One Month Ended | | | Year Ended | |
| | Large Growth Fund | | October 31, 2010 | | | October 31, 2009* | | | September 30, 2009 | |
| | Ordinary income | | $ | 358,421 | | | $ | — | | | $ | — | |
| | Long-term capital gain | | | — | | | | — | | | | — | |
| | | | $ | 358,421 | | | $ | — | | | $ | — | |
| * | The Large Growth Fund changed its fiscal year end to October 31 from September 30. |
| | | | Year Ended | | | Year Ended | | | | | |
| | Value Fund | | October 31, 2010 | | | October 31, 2009 | | | | | |
| | Ordinary income | | $ | 2,758,219 | | | $ | 5,652,451 | | | | | |
| | Long-term capital gain | | | — | | | | — | | | | | |
| | | | $ | 2,758,219 | | | $ | 5,652,451 | | | | | |
| | | | | | | | | | | | |
| | | | Year Ended | | | Year Ended | | | | | |
| | Total Return Fund | | October 31, 2010 | | | October 31, 2009 | | | | | |
| | Ordinary income | | $ | 942,536 | | | $ | 956,356 | | | | | |
| | Long-term capital gain | | | — | | | | — | | | | | |
| | | | $ | 942,536 | | | $ | 956,356 | | | | | |
HENNESSY FUNDS 1-800-966-4354
| | | | Year Ended | | | Year Ended | | |
| | Balanced Fund | | October 31, 2010 | | | October 31, 2009 | | |
| | Ordinary income | | $ | 55,545 | | | $ | 138,030 | | |
| | Long-term capital gain | | | — | | | | — | | |
| | | | $ | 55,545 | | | $ | 138,030 | | |
8). FUND REORGANIZATION
On March 20, 2009 the shareholders of the Tamarack Large Cap Growth Fund approved the agreement and plan of reorganization providing for the transfer of assets of the Tamarack Large Cap Growth Fund to the Hennessy Cornerstone Large Growth Fund and the assumption of the liabilities of the Tamarack Large Cap Growth Fund by the Hennessy Cornerstone Large Growth Fund. The following table illustrates the specifics of the reorganization:
| | Shares issued to | | | |
| Acquired Fund | Shareholders of | Acquiring Fund | Combined | Tax Status |
| Net Assets | Acquired Fund | Net Assets | Net Assets | of Transfer |
| $51,980,253(1) | 7,722,854 | — | $51,980,253 | Non-taxable |
| (1) | Includes accumulated realized losses and unrealized depreciation in the amounts of ($13,369,709) and ($16,139,531) respectively. |
NOTES TO THE FINANCIAL STATEMENTS
(This Page Intentionally Left Blank.)
HENNESSY FUNDS 1-800-966-4354
Report of Independent Registered Public Accounting Firm
The Shareholders and Board of Directors of The Hennessy Mutual Funds, Inc., The Hennessy Funds, Inc., and The Hennessy Funds Trust:
We have audited the accompanying statements of assets and liabilities of the Hennessy Cornerstone Growth Fund, Hennessy Cornerstone Growth Fund, Series II, Hennessy Focus 30 Fund, Hennessy Cornerstone Large Growth Fund, Hennessy Cornerstone Value Fund, Hennessy Total Return Fund and Hennessy Balanced Fund, including the schedules of investments, as of October 31, 2010, and the related statements of operations for the year then ended, statement of cash flows for the year then ended for the Hennessy Total Return Fund, statements of changes in net assets for each of the periods presented in the two-year period then ended (year ended October 31, 2010, month ended October 31, 2009 and year ended September 30, 2009 for Hennessy Cornerstone Large Growth Fund), and the financial highlights for each of the periods presented in the five-year period then ended (year ended October 31, 2010, month ended October 31, 2009 and year ended September 30, 2009 for Hennessy Cornerstone Large Growth Fund; years ended October 31, 2007 through 2010, period ended October 31, 2006 and year ended June 30, 2006 for the Hennessy Cornerstone Growth Fund, Series II). These financial statements and financial highlights are the responsibility of management. Our responsibility is to express an opinion on these financial statements and financial highlights based on our audits. The financial highlights for the periods presented through September 30, 2008 of the Hennessy Cornerstone Large Growth Fund were audited by other auditors whose report dated November 26, 2008 expressed an unqualified opinion on that statement and those financial highlights.
We conducted our audits in accordance with the standards of the Public Company Accounting Oversight Board (United States). Those standards require that we plan and perform the audit to obtain reasonable assurance about whether the financial statements and financial highlights are free of material misstatement. An audit includes examining, on a test basis, evidence supporting the amounts and disclosures in the financial statements. Our procedures included confirmation of securities owned as of October 31, 2010 by correspondence with the custodian and brokers or by other appropriate auditing procedures. An audit also includes assessing the accounting principles used and significant estimates made by management, as well as evaluating the overall financial statement presentation. We believe that our audits provide a reasonable basi s for our opinion.
In our opinion, the financial statements and financial highlights referred to above present fairly, in all material respects, the financial position of the Hennessy Cornerstone Growth Fund, Hennessy Cornerstone Growth Fund, Series II, Hennessy Focus 30 Fund, Hennessy Cornerstone Large Growth Fund, Hennessy Cornerstone Value Fund, Hennessy Total Return Fund and Hennessy Balanced Fund as of October 31, 2010, and the results of their operations, the changes in
REPORT OF INDEPENDENT REGISTERED PUBLIC ACCOUNTING FIRM
their net assets and the financial highlights for each of the periods described in the first paragraph above, in conformity with U.S. generally accepted accounting principles.
Milwaukee, Wisconsin
December 22, 2010
HENNESSY FUNDS 1-800-966-4354
Directors and Officers of the Funds
The business and affairs of the Funds are managed under the direction of the Funds’ Board of Directors. Information pertaining to the Directors and Officers of the Funds is set forth below. The Funds’ Statement of Additional Information includes additional information about the Funds’ Directors and Officers and is available, without charge, upon request by calling 1-800-966-4354.
| | Position(s) | Term of Office |
| | Held with | and Length of |
| Name, Age and Address | the Companies | Time Served |
| “Disinterested Persons” | | |
| J. Dennis DeSousa | Director/Trustee | Indefinite, until |
| Age: 74 | | successor elected |
| Address: | | |
| c/o Hennessy Advisors, Inc. | | HMFI: Since January 1996 |
| 7250 Redwood Blvd. | | HFI: Since January 1996 |
| Suite 200 | | HFT: Since July 2005 |
| Novato, CA 94945 | | |
| | | |
| Robert T. Doyle | Director/Trustee | Indefinite, until |
| Age: 63 | | successor elected |
| Address: | | |
| c/o Hennessy Advisors, Inc. | | HMFI: Since January 1996 |
| 7250 Redwood Blvd. | | HFI: Since January 1996 |
| Suite 200 | | HFT: Since July 2005 |
| Novato, CA 94945 | | |
| | | |
| Gerald P. Richardson | Director/Trustee | Indefinite, until |
| Age: 65 | | successor elected |
| Address: | | |
| c/o Hennessy Advisors, Inc. | | HMFI: Since May 2004 |
| 7250 Redwood Blvd. | | HFI: Since May 2004 |
| Suite 200 | | HFT: Since July 2005 |
| Novato, CA 94945 | | |
| | | |
| “Interested Persons” (as defined in the 1940 Act) | | |
Neil J. Hennessy(1) | Director/Trustee, | Director/Trustee: |
| Age: 54 | President | Indefinite, until |
| Address: | and Chairman | successor elected |
| c/o Hennessy Advisors, Inc. | of the Board | |
| 7250 Redwood Blvd. | | HMFI: Since January 2006 |
| Suite 200 | | HFI: Since January 2006 |
| Novato, CA 94945 | | HFT: Since July 2005 |
| | | |
| | | Officer (Chairman of the Board): |
| | | 1 year term |
| | | |
| | | HMFI: Since June 2008 |
| | | HFI: Since June 2008 |
| | | HFT: Since June 2008 |
DIRECTORS AND OFFICERS OF THE FUNDS
| | Number of Portfolios in the | |
| Principal Occupation(s) | Fund Complex Overseen | Other Directorships |
| During Past 5 Years | by Director/Trustee | Held by Director |
| | | |
| Currently a real estate investor. | 10 | None. |
| | | |
| | | |
| | | |
| | | |
| | | |
| | | |
| | | |
| Currently the Sheriff of Marin County, | 10 | None. |
| California (since 1996) and has been | | |
| employed in the Marin County Sheriff’s | | |
| Office in various capacities since 1969. | | |
| | | |
| | | |
| | | |
| | | |
| Formerly the Chief Executive Officer and | 10 | None. |
| owner of ORBIS Payment Services. | | |
| Mr. Richardson is now an independent | | |
| consultant in the securities industries. | | |
| | | |
| | | |
| | | |
| | | |
| | | |
| President, Chairman, CEO and Co-Portfolio | 10 | Director of Hennessy |
| Manager of Hennessy Advisors, Inc., the | | Advisors, Inc. |
| Hennessy Funds’ investment advisor, since | | |
| 1989; President of HMFI and HFI from 1996 | | |
| through June 2008, and President of HFT | | |
| from 2005 through June 2008. | | |
HENNESSY FUNDS 1-800-966-4354
| | Position(s) | Term of Office |
| | Held with | and Length of |
| Name, Age and Address | the Companies | Time Served |
Frank Ingarra, Jr.(1) | Co-Portfolio | 1 year term |
| Age: 39 | Manager and | |
| Address: | Vice President | HMFI: Since August 2002 |
| c/o Hennessy Advisors, Inc. | | HFI: Since August 2002 |
| 7250 Redwood Blvd. | | HFT: Since July 2005 |
| Suite 200 | | |
| Novato, CA 94945 | | |
| | | |
| Joe Fahy | Chief Compliance | 1 year term |
| Age: 33 | Officer | |
| Address: | | HMFI: Since June 2010 |
| c/o Hennessy Advisors, Inc. | | HFI: Since June 2010 |
| 7250 Redwood Blvd. | | HFT: Since June 2010 |
| Suite 200 | | |
| Novato, CA 94945 | | |
| | | |
Teresa M. Nilsen(1) | Executive Vice | 1 year term |
| Age: 44 | President and | |
| Address: | Treasurer | HMFI: Since January 1996 |
| c/o Hennessy Advisors, Inc. | | HFI: Since January 1996 |
| 7250 Redwood Blvd. | | HFT: Since July 2005 |
| Suite 200 | | |
| Novato, CA 94945 | | |
| | | |
| | | |
| | | |
Daniel B. Steadman(1) | Executive Vice | 1 year term |
| Age: 54 | President and | |
| Address: | Secretary | HMFI: Since March 2000 |
| c/o Hennessy Advisors, Inc. | | HFI: Since March 2000 |
| 7250 Redwood Blvd. | | HFT: Since July 2005 |
| Suite 200 | | |
| Novato, CA 94945 | | |
DIRECTORS AND OFFICERS OF THE FUNDS
| | Number of Portfolios in the | |
| Principal Occupation(s) | Fund Complex Overseen | Other Directorships |
| During Past 5 Years | by Director/Trustee | Held by Director |
| Mr. Ingarra Co-Portfolio Manager for | N/A | None. |
| Hennessy Advisors, Inc., the Funds’ | | |
| investment advisor. Mr. Ingarra has been | | |
| with the Hennessy Funds and Hennessy | | |
| Advisors, Inc. since 2004. He is Vice | | |
| President of the Hennessy Funds. | | |
| | | |
| | | |
| Chief Compliance Officer for the Hennessy | N/A | None. |
| Funds since 2010. Mr. Fahy has been with | | |
| the Hennessy Funds since 2005 and has | | |
| held a number of roles in the Sales and | | |
| Finance Departments. | | |
| | | |
| | | |
| | | |
| Currently Executive Vice President, Chief | N/A | Director of Hennessy |
| Financial Officer and Secretary of Hennessy | | Advisors, Inc. |
| Advisors, Inc., the Funds’ investment advisor; | | |
| Ms. Nilsen has been the corporate secretary | | |
| and a financial officer of Hennessy Advisors, | | |
| Inc. since 1989; Ms. Nilsen has been an | | |
| officer of The Hennessy Funds since 1996, | | |
| currently she is Executive Vice President | | |
| and Treasurer. | | |
| | | |
| Executive Vice President of Hennessy | N/A | Director of Hennessy |
| Advisors, Inc., the Funds’ investment advisor, | | Advisors, Inc. |
| from 2000 to the present; Mr. Steadman has | | |
| been Executive Vice President and Secretary | | |
| of The Hennessy Funds since 2000. | | |
HENNESSY FUNDS 1-800-966-4354
| | Position(s) | Term of Office |
| | Held with | and Length of |
| Name, Age and Address | the Companies | Time Served |
Tania A. Kelley(1) | Vice President | 1 year term |
| Age: 45 | of Marketing | |
| Address: | | HMFI: Since October 2003 |
| c/o Hennessy Advisors, Inc. | | HFI: Since October 2003 |
| 7250 Redwood Blvd. | | HFT: Since July 2005 |
| Suite 200 | | |
| Novato, CA 94945 | | |
| | | |
Ana Miner(1) | Vice President | 1 year term |
| Age: 52 | of Operations | |
| Address: | | HMFI: Since March 2000 |
| c/o Hennessy Advisors, Inc. | | HFI: Since March 2000 |
| 7250 Redwood Blvd. | | HFT: Since July 2005 |
| Suite 200 | | |
| Novato, CA 94945 | | |
| | | |
Brian Peery(1) | Vice President | 1 year term |
| Age: 41 | of Sales | |
| Address: | | HMFI: Since March 2003 |
| c/o Hennessy Advisors, Inc. | | HFI: Since March 2003 |
| 7250 Redwood Blvd. | | HFT: Since July 2005 |
| Suite 200 | | |
| Novato, CA 94945 | | |
| (1) | All officers of the Hennessy Funds and employees of the Advisor are Interested Persons of the Hennessy Funds. |
Key:
HMFI = Hennessy Mutual Funds, Inc.
HFI = Hennessy Funds, Inc.
HFT = Hennessy Funds Trust
DIRECTORS AND OFFICERS OF THE FUNDS
| | Number of Portfolios in the | |
| Principal Occupation(s) | Fund Complex Overseen | Other Directorships |
| During Past 5 Years | by Director/Trustee | Held by Director |
| Has been employed by Hennessy | N/A | None. |
| Advisors, Inc., the Funds’ investment | | |
| advisor, since October 2003. | | |
| | | |
| | | |
| | | |
| | | |
| | | |
| Has been employed by Hennessy | N/A | None. |
| Advisors, Inc., the Funds’ investment | | |
| advisor, since 1998. | | |
| | | |
| | | |
| | | |
| | | |
| | | |
| Has been employed by Hennessy | N/A | None. |
| Advisors, Inc., the Funds’ investment | | |
| advisor, since June 2002. | | |
HENNESSY FUNDS 1-800-966-4354
Expense Example
October 31, 2010
As a shareholder of the Funds, you incur two types of costs: (1) transaction costs, including sales charges (loads) on purchase payments, reinvested dividends, or other distributions; redemption fees; and exchange fees; and (2) ongoing costs, including management fees; service fees; and other Fund expenses. This Example is intended to help you understand your ongoing costs (in dollars) of investing in each of the Funds and to compare these costs with the ongoing costs of investing in other mutual funds. The Example is based on an investment of $1,000 invested at the beginning of the period and held for the entire period from May 1, 2010 through October 31, 2010.
Actual Expenses
The first set of lines of the table below provide information about actual account values and actual expenses. Although the Funds charge no sales loads or transaction fees, you will be assessed fees for outgoing wire transfers, returned checks and stop payment orders at prevailing rates charged by U.S. Bancorp Fund Services, LLC, the Funds’ transfer agent. If you request that a redemption be made by wire transfer, currently a $15.00 fee is charged by the Funds’ transfer agent. IRA accounts will be charged a $15.00 annual maintenance fee. The example below includes, but is not limited to, management fees, shareholder servicing fees, fund accounting, custody and transfer agent fees. However, the example below does not include portfolio trading commissions and related expenses, interest expense or dividends on short positions taken by the Fund and other extraordinary expenses as determined under generally accepted accounting principles. You may use the information within these lines, together with the amount you invested, to estimate the expenses that you paid over the six-month period. Simply divide your account value by $1,000 (for example, an $8,600 account value divided by $1,000 = 8.6), then multiply the result by the number in the first line under the heading entitled “Expenses Paid During Period” to estimate the expenses you paid on your account during this period.
Hypothetical Example for Comparison Purposes
The second set of lines within the table below provide information about hypothetical account values and hypothetical expenses based on the Funds’ actual expense ratios and an assumed rate of return of 5% per year before expenses, which is not the Funds’ actual return. The hypothetical account values and expenses may not be used to estimate the actual ending account balance or expenses you paid for the period. You may use this information to compare the ongoing costs of investing in the Funds and other funds. To do so, compare this 5% hypothetical example with the 5% hypothetical examples that appear in the shareholder reports of the other funds. Please note that the expenses shown in the table are meant to highlight your ongoing costs only and do not reflect any transactional costs, such as sales charges (loads), o r exchange fees. Therefore, the second line of the table is useful in comparing ongoing costs only, and will not help you determine the relative total costs of owning different funds. In addition, if these transactional costs were included, your costs would have been higher.
EXPENSE EXAMPLE
| | | Beginning | | | Ending | | | Expenses Paid | |
| | | Account Value | | | Account Value | | | During Period(1) | |
| Original Class | | 5/1/10 | | | 10/31/10 | | | 5/1/10 – 10/31/10 | |
| | | | | | | | | | |
| Actual | | | | | | | | | |
| Growth Fund – Original Class | | $ | 1,000.00 | | | $ | 969.80 | | | $ | 6.65 | |
| Growth II Fund – Original Class | | $ | 1,000.00 | | | $ | 986.60 | | | $ | 8.06 | |
| Focus 30 Fund – Original Class | | $ | 1,000.00 | | | $ | 1,054.70 | | | $ | 7.15 | |
| Large Growth Fund – Original Class | | $ | 1,000.00 | | | $ | 1,046.50 | | | $ | 6.71 | |
| Value Fund – Original Class | | $ | 1,000.00 | | | $ | 1,044.20 | | | $ | 6.80 | |
| Total Return Fund – Original Class | | $ | 1,000.00 | | | $ | 1,056.50 | | | $ | 7.00 | |
| Balanced Fund – Original Class | | $ | 1,000.00 | | | $ | 1,041.30 | | | $ | 8.49 | |
| | | | | | | | | | | | | |
| Hypothetical (5% return | | | | | | | | | | | | |
| before expenses) | | | | | | | | | | | | |
| Growth Fund – Original Class | | $ | 1,000.00 | | | $ | 1,018.45 | | | $ | 6.82 | |
| Growth II Fund – Original Class | | $ | 1,000.00 | | | $ | 1,017.09 | | | $ | 8.19 | |
| Focus 30 Fund – Original Class | | $ | 1,000.00 | | | $ | 1,018.25 | | | $ | 7.02 | |
| Large Growth Fund – Original Class | | $ | 1,000.00 | | | $ | 1,018.65 | | | $ | 6.61 | |
| Value Fund – Original Class | | $ | 1,000.00 | | | $ | 1,018.55 | | | $ | 6.72 | |
| Total Return Fund – Original Class | | $ | 1,000.00 | | | $ | 1,018.40 | | | $ | 6.87 | |
| Balanced Fund – Original Class | | $ | 1,000.00 | | | $ | 1,016.89 | | | $ | 8.39 | |
| (1) | Expenses are equal to the Growth Fund’s expense ratio of 1.34%, the Growth II Fund’s expense ratio of 1.61%, the Focus 30 Fund’s expense ratio of 1.38%, the Large Growth Fund’s expense ratio of 1.30%, the Value Fund’s expense ratio of 1.32%, the Total Return Fund’s expense ratio of 1.35%, and the Balanced Fund’s expense ratio of 1.65%, multiplied by the average account value over the period, multiplied by 184/365 days (to reflect one-half year period). |
| | | Beginning | | | Ending | | | Expenses Paid | |
| | | Account Value | | | Account Value | | | During Period(2) | |
| Institutional Class | | 5/1/10 | | | 10/31/10 | | | 5/1/10 – 10/31/10 | |
| | | | | | | | | | |
| Actual | | | | | | | | | |
| Growth Fund – Institutional Class | | $ | 1,000.00 | | | $ | 995.62 | | | $ | 4.93 | |
| Growth II Fund – Institutional Class | | $ | 1,000.00 | | | $ | 998.38 | | | $ | 4.94 | |
| Focus 30 Fund – Institutional Class | | $ | 1,000.00 | | | $ | 1,008.89 | | | $ | 4.96 | |
| Large Growth Fund – Institutional Class | | $ | 1,000.00 | | | $ | 1,007.49 | | | $ | 4.96 | |
| Value Fund – Institutional Class | | $ | 1,000.00 | | | $ | 1,007.01 | | | $ | 4.96 | |
| | | | | | | | | | | | | |
| Hypothetical (5% return | | | | | | | | | | | | |
| before expenses) | | | | | | | | | | | | |
| Growth Fund – Institutional Class | | $ | 1,000.00 | | | $ | 1,003.16 | | | $ | 4.95 | |
| Growth II Fund – Institutional Class | | $ | 1,000.00 | | | $ | 1,003.16 | | | $ | 4.95 | |
| Focus 30 Fund – Institutional Class | | $ | 1,000.00 | | | $ | 1,003.16 | | | $ | 4.95 | |
| Large Growth Fund – Institutional Class | | $ | 1,000.00 | | | $ | 1,003.16 | | | $ | 4.95 | |
| Value Fund – Institutional Class | | $ | 1,000.00 | | | $ | 1,003.16 | | | $ | 4.95 | |
| (2) | Expenses are equal to the Growth, Growth II, Focus 30, Large Growth, and Value Fund’s expense ratio of 0.98%, multiplied by the average account value over the period, multiplied by 184/365 days (to reflect one-half year period). |
HENNESSY FUNDS 1-800-966-4354
A description of the policies and procedures that the Funds use to determine how to vote proxies relating to portfolio securities is available without charge: (1) by calling 1-800-966-4354; (2) on the Hennessy Funds website at www.hennessyfunds.com; or (3) on the U.S. Securities and Exchange Commission’s website at www.sec.gov. Hennessy Funds’ proxy voting record is available on the SEC’s website at www.sec.gov no later than August 31 for the prior 12 months ending June 30.
Quarterly Filings on Form N-Q
The Funds file their complete schedule of portfolio holdings with the SEC for the first and third quarters of each fiscal year on Form N-Q. The Funds’ Form N-Q will be available on the SEC’s website at www.sec.gov. The Funds’ Form N-Q may be reviewed and copied at the SEC’s Public Reference Room in Washington, DC and information on the operation of the Public Reference Room may be obtained by calling 1-800-SEC-0330. Information included in the Funds’ N-Q will also be available upon request by calling 1-800-966-4354.
Federal Tax Distribution Information (Unaudited)
The Large Growth, Value, Total Return and Balanced Fund designated 100%, 100%, 100% and 100%, respectively, of the dividend declared from net investment income during the year ended October 31, 2010, as qualified dividend income under the Jobs Growth and Tax Reconciliation Act of 2003.
For the year ended October 31, 2010, 100%, 77.80%, 100% and 100% of the ordinary income distributions paid by the Large Growth, Value, Total Return and Balanced Funds, respectively, qualify for the dividends received deduction available to corporate shareholders. A portion of the dividend income received by the Value Fund was from American Depositary Receipts which does not qualify for the dividend received deduction available to corporate shareholders.
PRIVACY POLICY
Privacy Policy
We collect the following non-public personal information about you:
• information we receive from you on or in applications or other forms, correspondence, or conversations, including, but not limited to, your name, address, phone number, social security number, assets, income and date of birth;
and
• information about your transactions with us, our affiliates, or others, including, but not limited to, your account number and balance, payment history, parties to transactions, cost basis information and other financial information.
We do not disclose any non-public personal information about our current or former shareholders to nonaffiliated third parties, except as permitted by law. For example, we are permitted by law to disclose all of the information we collect, as described above, to our Transfer Agent to process your transactions. Furthermore, we restrict access to your non-public personal information to those persons who require such information to provide products or services to you. We maintain physical, electronic and procedural safeguards that comply with federal standards to guard your non-public personal information.
In the event that you hold shares of the Fund through a financial intermediary, including, but not limited to, a broker-dealer, bank or trust company, the privacy policy of your financial intermediary would govern how your non-public personal information would be shared with nonaffiliated third parties.
HENNESSY FUNDS 1-800-966-4354
For information, questions
or assistance, please call
The Hennessy Funds
1-800-966-4354 or 1-415-899-1555
INVESTMENT ADVISOR
Hennessy Advisors, Inc.
7250 Redwood Blvd., Suite 200
Novato, California 94945
ADMINISTRATOR, TRANSFER
AGENT, DIVIDEND PAYING
AGENT & SHAREHOLDER
SERVICING AGENT
U.S. Bancorp Fund Services, LLC
P.O. Box 701
Milwaukee, Wisconsin 53201-0701
CUSTODIAN
U.S. Bank N.A.
Custody Operations
1555 North River Center Dr., Suite 302
Milwaukee, Wisconsin 53212
TRUSTEES
Neil J. Hennessy
Robert T. Doyle
J. Dennis DeSousa
Gerald P. Richardson
COUNSEL
Foley & Lardner LLP
777 East Wisconsin Avenue
Milwaukee, Wisconsin 53202-5306
INDEPENDENT REGISTERED
PUBLIC ACCOUNTING FIRM
KPMG LLP
303 East Wacker Drive
Chicago, Illinois 60601
DISTRIBUTOR
Quasar Distributors, LLC
615 East Michigan Street
Milwaukee, Wisconsin 53202
WWW.HENNESSYFUNDS.COM
This report has been prepared for shareholders and may be distributed
to others only if preceded or accompanied by a current prospectus.
HENNESSY FUNDS
ANNUAL REPORT
OCTOBER 31, 2010
Hennessy Select Large Value Fund
Hennessy Select SPARX Japan Fund
Hennessy Select SPARX Japan Smaller Companies Fund
Contents
| Letter to shareholders | 1 |
| Performance overview | |
| Hennessy Select Large Value Fund | 6 |
| Hennessy Select SPARX Japan Fund | 9 |
| Hennessy Select SPARX Japan Smaller Companies Fund | 12 |
| Financial statements | |
| Schedules of investments | |
| Hennessy Select Large Value Fund | 14 |
| Hennessy Select SPARX Japan Fund | 20 |
| Hennessy Select SPARX Japan Smaller Companies Fund | 24 |
| Statements of assets and liabilities | 30 |
| Statements of operations | 32 |
| Statements of changes in net assets | 34 |
| Financial highlights | |
| Hennessy Select Large Value Fund | 40 |
| Hennessy Select SPARX Japan Fund | 44 |
| Hennessy Select SPARX Japan Smaller Companies Fund | 48 |
| Notes to the financial statements | 50 |
| Report of Independent Registered Public Accounting Firm | 59 |
| Directors and Officers of the Funds | 60 |
| Expense example | 66 |
| Proxy voting policy | 68 |
| Quarterly Filings on Form N-Q | 68 |
| Federal Tax Distribution Information | 68 |
| Privacy Policy | 69 |
LETTER TO SHAREHOLDERS
December, 2010
Dear Hennessy Funds Shareholder:
As I look back over the twelve-month period ended October 31, 2010, two themes emerge. First, the majority of individual investors have exhibited extremely low confidence in the financial markets. Throughout the year I talk to many of our clients, and some truly believe the markets are still in a free fall. What I hear that really troubles me are the following misconceptions about our economy:
• Despite the fact that the Dow Jones Industrial Average and S&P 500 Index each gained well over 20% in 2009 and are up approximately 8% year-to-date in 2010 (through 11/30/10), many people believe that the stock market has been down the past two years.
• American corporations are profitable, yet investors believe they are losing money.
• While 90% of Americans remain employed, people sense that everyone is losing their job.
Second, the crisis of confidence we experienced following the lows in 2009 and throughout this past year has now become a crisis of clarity. I believe we are in dire need of clarity on healthcare, taxes and regulation from our leaders in Washington for this recovery to gain momentum.
Right now, we are experiencing slow economic growth, home values continue to be unstable and unemployment is approaching multi-decade highs of 10% or more. Companies are continuing to slash costs, close unprofitable business lines, eliminate employees and hoard cash at record levels – there is $3.2 trillion in cash, in fact, among the S&P 500 companies alone. Why? I believe that the ambiguity coming from our government leaders has paralyzed American businesses, both large and small, leaving them few attractive options for deploying cash reserves.
As a business person, it feels as though every proposal coming out of Washington is focused on short-term political gain rather than on the long-term strength of our country and the economy. The rhetoric and lack of actionable direction out of Congress and the White House is having a devastating effect on our economy. The current environment has crippled businesses that need to feel confident that government is on their side.
HENNESSY FUNDS 1-800-966-4354
Overview of the U.S. Market
For the twelve-month period ending October 31, 2010, the major U.S. indices returned approximately 17-18%. Small and mid-cap stocks significantly outperformed their large-cap brethren during the period. For the relatively small number of investors who did return to the equity market, I believe that there was a return to quality stocks, those that exhibit strong value and long term growth potential. While the markets have remained extremely volatile, I believe that the recession is firmly behind us and that the underlying economy is fundamentally sound.
What can we look forward to in the year ahead? Well, I know that for business to lead the U.S. to economic stability, we will need to have strong leadership from Washington. The Fed has shown its commitment and consistent policy to keep rates low. I am convinced that, with clarity from our government, companies will begin to gain confidence, begin to reinvest in their business models, begin to hire, and all of that will lead to an expanded economic recovery for the foreseeable future. If you look at the third calendar year of all the Presidential terms since 1950, the Dow Jones Industrial Average has returned on average 18% during those periods. While I am not sure we will hit that level in 2011, the third year of the Obama presidency, I do believe we may se e moderate growth in the range of 8-12%. If there are any major surprises, I think they may well be to the upside.
Overview of the Japan Market
For the twelve-month period ended October 31, 2010, the Nikkei 225 Stock Average and the TOPIX index (with dividends) rose +4.09% and +3.10% respectively. The period began on a negative note as investors remained skeptical about Japan’s economic outlook. Investors also rushed to sell Japanese equities due to unfavorable currency movements and after the Cabinet Office, in its November 2009 economic report, said that the Japanese economy was back in deflation.
In December, 2009, Japan’s stock indices bounced back after the Bank of Japan (BOJ) introduced a new lending facility to supply about 10 trillion Japanese Yen (JPY), which is approximately USD $120 billion in capital and the Japanese government unveiled a stimulus package worth JPY 24 trillion of which JPY 7.2 trillion would be allocated toward actual spending.
Come 2010, the year started off on a positive note as Japanese stocks resumed their upward momentum in the first-half of the month underscoring hopes for an economic recovery in the year. However, the mood turned sour thereafter on concerns about Greece’s bloated budget
deficit and a stronger JPY, prompting investors to sell their equity positions. Stock-related losses were soon mitigated in February after the government announced that Japan’s economy grew a faster than expected 1.1% in the October to December period. By March, media reports that the BOJ was considering further monetary easing caused the JPY to fall, triggering a rally in the Japanese equity market.
The month of April was somewhat directionless due to a mixed bag of data. In May and June, there was a huge sell off in the Japanese equity market due to persistent fears in the Euro-zone that sent worldwide equity markets into a tailspin and Nikkei 225 to a 6-month low. The market also fell after China’s announcement in June that it would allow their currency, the RMB, more flexibility. This encouraged buying of the JPY, causing it to rapidly appreciate against the USD and EURO. Japanese stocks gained momentum and rose slightly in July as doubts about Europe’s credibility receded.
The equity market extended gains in early August on the back of favorable April – June earnings results and the better than expected results of the stress tests on the major European banks. Then, at the end of August, the Japanese equity market declined to the lowest level since the beginning of this year as worries of an economic slowdown in the U.S. and the strengthening value of the JPY outweighed the positive news that had supported the market earlier that month. The market rebounded in September driven by cheap valuations, the foreign exchange intervention by the Japanese government and the BOJ and strong overseas markets.
Come early October, the equity market extended its gains as investors cheered the BOJ policy board’s decision to set its overnight call rate target to a range of 0%-0.1% and its plans to purchase exchange traded funds (ETF) and Japanese real-estate investment trusts (J-REIT). The rally was only temporary after the JPY strengthened against the USD, touching the 80/USD level, its highest level in more than 15 years.
In the near-term, we believe that the Japanese equity market may be range-bound as investors are likely to sit on the sidelines as they await more clarity on the economic outlook. While the sentiment in the Japanese equity market is likely to improve going into next year thanks to an increase in corporate earnings and favorable economic data, investors are yet to confirm the strength of the U.S. economic recovery. We feel that demand from abroad can strengthen significantly from here as emerging economies will continue to lead global growth going into 2011. Therefore, we intend to remain biased towards companies that we believe will continue to benefit from growth outside of Japan, especially in the emerging economies like China. We will also continue to invest in
HENNESSY FUNDS 1-800-966-4354
companies producing high-quality and value-added products combined with superior craftsmanship or energy-efficient technologies.
We maintain our focus on long-term investing and on building value for each of our shareholders. At Hennessy Funds, we serve our shareholders directly, so that we can provide answers to shareholder questions and concerns. Please don’t hesitate to contact us at 800-966-4354 if we can answer any questions or can be of service.
Best regards,
Neil J. Hennessy
Portfolio Manager & Chief Investment Officer
Past performance does not guarantee future results.
Mutual fund investing involves risk. Principal loss is possible.
Small and medium-capitalization companies tend to have limited liquidity and greater price volatility than large-capitalization companies. Investments in foreign securities involve greater volatility and political, economic and current risk and differences in accounting methods.
Opinions expressed are those of Neil Hennessy and are subject to change, are not guaranteed and should not be considered investment advice.
The Dow Jones Industrial Average and the S&P 500 are unmanaged indices of common stocks comprised of major industrial companies and assume reinvestment of dividends. The Tokyo Stock Price Index (TOPIX) is a market capitalization-weighted index of all companies listed on the First Section of the Tokyo Stock Exchange. The Nikkei 225 is a stock market index for the Tokyo Stock Exchange (TSE). You cannot invest directly in an index.
LETTER TO SHAREHOLDERS
(This Page Intentionally Left Blank.)
HENNESSY FUNDS 1-800-966-4354
Hennessy Select Large Value Fund
Original Class Shares (HSFVX)
AVERAGE ANNUAL TOTAL RETURN PERIODS ENDED OCTOBER 31, 2010
| | One | Five | Ten | Since Inception |
| | Year | Years | Years | (9/30/84) |
| Hennessy Select Large Value | | | | |
| Fund – Original Class | 10.22% | -0.86% | 1.84% | 9.42% |
| Russell 1000 Value Index | 15.71% | 0.62% | 2.64% | 10.84% |
| S&P 500 Index | 16.52% | 1.73% | -0.02% | 10.47% |
Gross expense ratio: 1.37%. The expense ratio was capped at 1.30% through March, 2010.
Performance data quoted represents past performance; past performance does not guarantee future results. The performance for periods prior to March 20, 2009 reflects the performance of the Tamarack Value Fund, the predecessor to the Hennessy Select Large Value Fund. The investment return and principal value of an investment will fluctuate so that an investor’s shares, when redeemed, may be worth more or less than their original cost. Current performance of the Fund may be lower or higher than the performance quoted. Performance data current to the most recent month end may be obtained by visiting www.hennessyfunds.com. The gross expense ratio presented is that from the most recent prospectus.
PERFORMANCE NARRATIVE FROM RBC GLOBAL
ASSET MANAGEMENT (U.S.), SUB-ADVISOR
For the twelve month period ended October 31, 2010 the Hennessy Select Large Value Fund gained 10.22%, versus 15.71% for the Russell 1000 Value Index and 16.52% for the S&P 500.
Two main factors have held performance below its benchmark. First, individual stock selection in three sectors, Technology, Energy, and Financials, hurt results. Second, the last year has been an extraordinarily poor period for large value stocks.
Within the Technology sector, our positions in Microsoft, Hewlett Packard and Western Digital adversely affected results. Hewlett Packard ran into difficulties regarding its CEO, Mark Hurd. Western Digital did not achieve the profitability we expected. We have sold out of both stocks. We still hold Microsoft, which continues to grow earnings smartly but is out of favor as investors gravitate to companies involved in mobile technologies.
Within the Energy sector, Anadarko was adversely affected by their partial ownership of the BP oil well that exploded in the Gulf. While we had redeemed 70% of our position before the spill, our remaining position weakened results. Compounding matters, once we sold the stock and sold the rest of our position, it bounced back strongly.
Within the Financials sector, positions in Goldman Sachs and PNC have both produced underperforming results. The Goldman difficulties in the early part of the year are well known as the SEC sued the company for fraud in the mortgage market. The suit has since been settled and we continue to own Goldman. While the economy has realized an improvement in credit conditions, PNC has not shown the leverage to improvement in credit that we expected and is rumored to be an acquirer of banks, which may dilute earnings. So, we have sold the stock. The portfolio’s performance in Financials was also hampered by the strength of the Real Estate Investment Trust (REIT) industry. While we did well in the stocks we owned in that industry, gaining 42%, the same as the industry as a whole, we averaged about 1% less exposure to the market in REITs. Even that small difference hurt performance because the returns were so strong.
PERFORMANCE OVERVIEW — HENNESSY SELECT LARGE VALUE FUND
Regarding specific stock selection, Materials has been, relative to the market, our best performing sector. Our somewhat defensive position in Pactiv, a container company with improving margins and increasing takeover expectations, has been beneficial, gaining 36% before it was sold. Eastman Chemical has also been helpful gaining 21% before we took profits and sold the stock.
The second main factor adversely affecting performance has been the extraordinary difference in return between large-cap value stocks and mid-cap value stocks. Our benchmark index, the Russell 1000 Value, can be broken into two other indices, the Russell Top 200 Value Index and the Russell Midcap Value Index. True to our name and our mandate, we tend to emphasize the top 200 names rather than the mid-cap names. For the twelve-month period the Top 200 Value Index has returned 14%, while the next 800 stocks (the Russell Midcap Value Index) gained 27%, nearly twice as much. Clearly, there has been far more opportunity in the middle range value stocks and our overweight in the larger names did not serve us well during this period.
While over time mid-cap value stocks have tended to do better than large-cap value stocks, albeit with greater risk, differences of this magnitude are unlikely to be sustainable, in our view. Returns from the larger names are likely to do better, relative to the mid-sized names, over the next twelve months than over the last twelve.
Hennessy Select Large Value Fund
Original Class Shares
CHANGE IN VALUE OF $10,000 INVESTMENT
This chart assumes an initial gross investment of $10,000 made on October 31, 2000. Returns shown include the reinvestment of all dividends. Returns shown do not reflect the deduction of taxes that a shareholder would pay on Fund distributions or the redemption of Fund shares.
HENNESSY FUNDS 1-800-966-4354
Institutional Class Shares (HSVIX)
AVERAGE ANNUAL TOTAL RETURN PERIODS ENDED OCTOBER 31, 2010
| | | Since Inception |
| | One Year | (3/20/09) |
| Hennessy Select Large Value | | |
| Fund – Institutional Class | 10.65% | 26.87% |
| Russell 1000 Value Index | 15.71% | 34.39% |
| S&P 500 Index | 16.52% | 33.32% |
Gross expense ratio: 1.19%. Net expense ratio: 0.98%. The expense ratio is contractually capped at 0.98% indefinitely.
Performance data quoted represents past performance; past performance does not guarantee future results. The investment return and principal value of an investment will fluctuate so that an investor’s shares, when redeemed, may be worth more or less than their original cost. Current performance of the Fund may be lower or higher than the performance quoted. Performance data current to the most recent month end may be obtained by visiting www.hennessyfunds.com. Investment performance reflects fee waivers in effect. In the absence of such waivers, total return would be reduced. The gross and net expense ratios presented are those from the most recent prospectus.
CHANGE IN VALUE OF $250,000 INVESTMENT
This chart assumes an initial gross investment of $250,000 (minimum investment) made on March 20, 2009 (inception date of share class). Returns shown include the reinvestment of all dividends. Returns shown do not reflect the deduction of taxes that a shareholder would pay on Fund distributions or the redemption of Fund shares.
The S&P 500 and Russell 1000 Value are unmanaged indices commonly used to measure the performance of U.S. stocks. The Russell 1000 Value measures large-cap, value-oriented stocks. The Russell Top 200 Value Index measures large-cap, value-oriented stocks, while the Russell Midcap Value Index measures mid-cap, value oriented stocks. One cannot invest directly in an index.
Medium-capitalization companies tend to have limited liquidity and greater price volatility than large-capitalization companies. Growth stocks typically are more volatile than value stocks; however, value stocks have a lower expected growth rate in earnings and sales.
The Fund’s composition and sector weightings are shown as a percentage of the Fund’s total net assets. Portfolio composition and sector weightings are subject to change at any time and should not be considered a recommendation to buy or sell a particular security. Please refer to the Schedule of Investments within this Annual Report for additional portfolio information, including percentages of holdings.
Current and future portfolio holdings are subject to risk.
PERFORMANCE OVERVIEW — HENNESSY SELECT SPARX JAPAN FUND
Hennessy Select SPARX Japan Fund
Original Class Shares (SPXJX)
AVERAGE ANNUAL TOTAL RETURN PERIODS ENDED OCTOBER 31, 2010
| | One | Five | Since Inception |
| | Year | Years | (10/31/03) |
| Hennessy Select SPARX Japan Fund | | | |
| – Original Class | 11.04% | -5.43% | 4.82% |
| MSCI Japan Index | 4.92% | -1.75% | 2.89% |
| TOPIX | 3.10% | -2.65% | 2.22% |
Gross expense ratio: 1.57%. The expense ratio was capped at 1.25% through February, 2010.
Performance data quoted represents past performance; past performance does not guarantee future results. The investment return and principal value of an investment will fluctuate so that an investor’s shares, when redeemed, may be worth more or less than their original cost. Current performance of the Fund may be lower or higher than the performance quoted. Performance data current to the most recent month end may be obtained by visiting www.hennessyfunds.com. The gross expense ratio presented is that from the most recent prospectus, as supplemented on June 4, 2010.
PERFORMANCE NARRATIVE FROM SPARX ASSET MANAGEMENT CO., SUB-ADVISOR
For the twelve-month period ended October 31, 2010, the Hennessy Select SPARX Japan Fund returned 11.04%, significantly outperforming the MSCI Japan Index, which returned 4.92%, and the TOPIX Index, which returned 3.10% for the same period. The biggest contributors to the Fund’s performance among the TOPIX 33 sub-industries included shares of wholesalers, auto-related firms and electronic appliance makers. On the other hand, chemical manufacturers, retailers and banks were among the worst performers.
As for individual stocks, among the chief positive contributors to the Fund’s performance were Japan’s leading maker of trucks and diesel engines Isuzu Motors Ltd., and the general trading firms such as Misumi Group Inc. and Itochu Corporation. Shares of these three companies gained 57%, 10% and 20% respectively as concerns over a possible economic slowdown in China eased and the secular growth trend in ASEAN economies remained intact.
On the other hand, the worst performance within the portfolio came from Fuji Seal International, Inc., the world’s leading shrink label supplier for food and beverage products, and drug maker Rohto Pharmaceutical Co., Ltd. Fuji Seal fell -11.4% on increasing concerns over a possible slowdown in the global economic recovery and the recent JPY appreciation against the USD to a more than 15-year high. Rohto’s stock price dipped -14.2% as investors showed little interest in defensive stocks but instead bought cyclical stocks as the Japanese equity market and the economy showed some signs of a recovery.
HENNESSY FUNDS 1-800-966-4354
Original Class Shares (SPXJX)
CHANGE IN VALUE OF $10,000 INVESTMENT
This chart assumes an initial gross investment of $10,000 made on October 31, 2003. Returns shown include the reinvestment of all dividends. Returns shown do not reflect the deduction of taxes that a shareholder would pay on Fund distributions or the redemption of Fund shares.
PERFORMANCE OVERVIEW — HENNESSY SELECT SPARX JAPAN FUND
Hennessy Select SPARX Japan Fund
Institutional Class Shares (SPARX)
AVERAGE ANNUAL TOTAL RETURN PERIODS ENDED OCTOBER 31, 2010
| | One | Five | Since Inception |
| | Year | Years | (10/31/03) |
| Hennessy Select SPARX | | | |
| Japan Fund – Institutional Class | 11.07% | -5.35% | 4.92% |
| MSCI Japan Index | 4.92% | -1.75% | 2.89% |
| TOPIX | 3.10% | -2.65% | 2.22% |
Gross expense ratio: 1.47%. The expense ratio was capped at 1.25% through February, 2010.
Performance data quoted represents past performance; past performance does not guarantee future results. The investment return and principal value of an investment will fluctuate so that an investor’s shares, when redeemed, may be worth more or less than their original cost. Current performance of the Fund may be lower or higher than the performance quoted. Performance data current to the most recent month end may be obtained by visiting www.hennessyfunds.com. The gross expense ratio presented is that from the most recent prospectus.
CHANGE IN VALUE OF $250,000 INVESTMENT
This chart assumes an initial gross investment of $250,000 (minimum investment) made on October 31, 2003. Returns shown include the reinvestment of all dividends. Returns shown do not reflect the deduction of taxes that a shareholder would pay on Fund distributions or the redemption of Fund shares.
The MSCI Japan Index is a market capitalization-weighted index of Japanese equities. The Tokyo Stock Price Index (TOPIX) is a market capitalization-weighted index of all companies listed on the First Section of the Tokyo Stock Exchange. The MSCI Japan and TOPIX indices are presented in U.S. Dollar terms and take into account reinvestment of dividends. One cannot invest directly in an index.
Small and medium-capitalization companies tend to have limited liquidity and greater price volatility than large-capitalization companies. Investments in foreign securities involve greater volatility and political, economic and currency risk and differences in accounting methods.
The Fund’s composition and sector weightings are shown as a percentage of the Fund’s total net assets. Portfolio composition and sector weightings are subject to change at any time and should not be considered a recommendation to buy or sell a particular security. Please refer to the Schedule of Investments within this Annual Report for additional portfolio information, including percentages of holdings.
HENNESSY FUNDS 1-800-966-4354
Hennessy Select SPARX Japan Smaller Companies
Fund (SPJSX)
AVERAGE ANNUAL TOTAL RETURN PERIODS ENDED OCTOBER 31, 2010
| | One | Three | Since Inception |
| | Year | Years | (8/31/07) |
| Hennessy Select SPARX Japan | | | |
| Smaller Companies Fund – Original Class | -0.72% | -3.93% | -0.84% |
| MSCI Japan Small Cap Index | 1.27% | -7.12% | -5.88% |
| TOPIX | 3.10% | -8.90% | -7.92% |
Gross expense ratio: 2.00%. The expense ratio was capped at 1.60% through February, 2010.
Performance data quoted represents past performance; past performance does not guarantee future results. The investment return and principal value of an investment will fluctuate so that an investor’s shares, when redeemed, may be worth more or less than their original cost. Current performance of the Fund may be lower or higher than the performance quoted. Performance data current to the most recent month end may be obtained by visiting www.hennessyfunds.com. The gross expense ratio presented is that from the most recent prospectus, as supplemented on June 4, 2010.
PERFORMANCE NARRATIVE FROM SPARX ASSET MANAGEMENT CO., SUB-ADVISOR
During the twelve-month period ended October 31, 2010, the Hennessy Select SPARX Japan Smaller Companies Fund fell -0.72%, underperforming the MSCI Japan Small Cap Index, which returned 1.27%, and the TOPIX Index, which returned 3.10%, for the same period. The biggest detractors to the Fund’s performance among the TOPIX 33 sub-industries included shares of information & communication-related firms, electronic appliance makers and construction firms. On the other hand, airlines, precision instrument makers and insurers were among the best performers.
As for the individual stocks, the top detractor during the period was Risa Partners, Inc. a provider of real estate-related and financial due diligence services. Its shares slumped -60% during the period amid the continued deterioration in Japan’s real estate market and concerns about bank loan restrictions to property-related firms. Another poor performing stock was Yamaichi Electronics Co., Ltd., a leading manufacturer of integrated circuit sockets for use in semiconductor quality inspections and circuit board assembly. Its shares fell -18% during the period as the firm announced in August, 2010 that it planned to raise capital by selling new and existing shares to invest in its solar panel business. Separately, shares of Japan Wind Development Co., Ltd., the country’s No. 3 w ind power company, also dropped -77% during the period mainly after the stock was put on monitoring by the Tokyo Stock Exchange (TSE) on fears that the firm was unlikely to meet the TSE July deadline to file its annual securities report because it changed its auditor.
On the other hand, the best performance within the portfolio during the period came from shares of Skymark Airlines Inc., Japan’s fourth-largest airline company, which advanced 327%. Shares of the domestic discount carrier rose on the back of increasing expectations that profitability would improve and the firm would benefit from industry-wide structural changes such as the Open Skies treaty and the expansion of landing slots at Haneda airport. Another positive performer was SBS Holdings, Inc., which offers delivery and third party logistics services in Tokyo. Its shares climbed 23% as the firm announced favorable earnings results for its fiscal first half ending December 2010. Finally, shares of Honeys Co., Ltd., a retailer of casual wear and fashion accessories for young women, gain ed +82% during the period as a brokerage firm started coverage on the firm and cited expectations of increased profits after a profit decline last fiscal year.
PERFORMANCE OVERVIEW — HENNESSY SELECT SPARX JAPAN SMALLER COMPANIES FUND
Hennessy Select SPARX Japan Smaller Companies
Fund (SPJSX)
CHANGE IN VALUE OF $10,000 INVESTMENT
This chart assumes an initial gross investment of $10,000 made on August 31, 2007. Returns shown include the reinvestment of all dividends. Returns shown do not reflect the deduction of taxes that a shareholder would pay on Fund distributions or the redemption of Fund shares.
The MSCI Japan Small Cap Index represents the universe of small capitalization companies in the Japanese equity markets. The Tokyo Stock Price Index (TOPIX) is a market capitalization-weighted index of all companies listed on the First Section of the Tokyo Stock Exchange. The MSCI Japan Small Cap and TOPIX indices are presented in U.S. Dollar terms and take into account reinvestment of dividends. One cannot invest directly in an index.
Small and medium-capitalization companies tend to have limited liquidity and greater price volatility than large-capitalization companies. Investments in foreign securities involve greater volatility and political, economic and currency risk and differences in accounting methods.
The Fund’s composition and sector weightings are shown as a percentage of the Fund’s total net assets. Portfolio composition and sector weightings are subject to change at any time and should not be considered a recommendation to buy or sell a particular security. Please refer to the Schedule of Investments within this Annual Report for additional portfolio information, including percentages of holdings.
HENNESSY FUNDS 1-800-966-4354
HENNESSY SELECT
LARGE VALUE FUND
(% of Net Assets)
| | TOP TEN EQUITY HOLDINGS | % of net assets |
| | J.P. Morgan Chase & Co. | 2.80% |
| | Microsoft Corp. | 2.64% |
| | UnitedHealth Group, Inc. | 2.59% |
| | The Goldman Sachs Group, Inc. | 2.56% |
| | PepsiCo., Inc. | 2.47% |
| | U.S. Bancorp | 2.45% |
| | ConocoPhillips | 2.45% |
| | Verizon Communications, Inc. | 2.38% |
| | Amgen, Inc. | 2.37% |
| | The Walt Disney Co. | 2.09% |
SCHEDULE OF INVESTMENTS — HENNESSY SELECT LARGE VALUE FUND
| | COMMON STOCKS – 98.16% | | Number | | | | | | % of | |
| | | | of Shares | | | Value | | | Net Assets | |
| | Consumer Discretionary – 7.66% | | | | | | | | | |
| | CBS Corp. | | | 85,930 | | | $ | 1,454,795 | | | | 1.10 | % |
| | Comcast Corp. | | | 35,790 | | | | 736,558 | | | | 0.56 | % |
| | Limited Brands, Inc. | | | 50,525 | | | | 1,484,930 | | | | 1.13 | % |
| | Macys, Inc. | | | 58,255 | | | | 1,377,148 | | | | 1.05 | % |
| | Stanley Black & Decker, Inc. | | | 16,495 | | | | 1,022,195 | | | | 0.78 | % |
| | The Walt Disney Co. | | | 76,385 | | | | 2,758,263 | | | | 2.09 | % |
| | Wyndham Worldwide Corp. | | | 43,340 | | | | 1,246,025 | | | | 0.95 | % |
| | | | | | | | | 10,079,914 | | | | 7.66 | % |
| | Consumer Staples – 10.04% | | | | | | | | | | | | |
| | Archer-Daniels-Midland Co. | | | 48,890 | | | | 1,629,015 | | | | 1.24 | % |
| | Avon Products, Inc. | | | 48,275 | | | | 1,469,974 | | | | 1.12 | % |
| | Kraft Foods, Inc. – Class A | | | 47,655 | | | | 1,537,827 | | | | 1.17 | % |
| | Kroger Co. | | | 61,845 | | | | 1,360,590 | | | | 1.03 | % |
| | PepsiCo, Inc. | | | 49,725 | | | | 3,247,042 | | | | 2.47 | % |
| | Philip Morris International, Inc. | | | 37,540 | | | | 2,196,090 | | | | 1.67 | % |
| | Wal-Mart Stores, Inc. | | | 32,580 | | | | 1,764,859 | | | | 1.34 | % |
| | | | | | | | | 13,205,397 | | | | 10.04 | % |
| | Energy – 9.25% | | | | | | | | | | | | |
| | Apache Corp. | | | 15,495 | | | | 1,565,305 | | | | 1.19 | % |
| | Chevron Corp. | | | 24,265 | | | | 2,004,532 | | | | 1.52 | % |
| | ConocoPhillips | | | 54,135 | | | | 3,215,619 | | | | 2.45 | % |
| | Devon Energy Corp. | | | 35,040 | | | | 2,278,301 | | | | 1.73 | % |
| | Exxon Mobil Corp. | | | 18,435 | | | | 1,225,374 | | | | 0.93 | % |
| | QEP Resources, Inc. | | | 57,000 | | | | 1,882,710 | | | | 1.43 | % |
| | | | | | | | | 12,171,841 | | | | 9.25 | % |
| | Financials – 26.08% | | | | | | | | | | | | |
| | American Express Co. | | | 37,935 | | | | 1,572,785 | | | | 1.20 | % |
| | Bank of America Corp. | | | 184,540 | | | | 2,111,138 | | | | 1.60 | % |
| | Bank of New York Mellon Corp. | | | 47,500 | | | | 1,190,350 | | | | 0.91 | % |
| | Berkshire Hathaway, Inc – Class B (a) | | | 34,085 | | | | 2,711,802 | | | | 2.06 | % |
| | Boston Properties, Inc. | | | 14,050 | | | | 1,210,970 | | | | 0.92 | % |
| | Citigroup, Inc. (a) | | | 533,425 | | | | 2,224,382 | | | | 1.69 | % |
| | CME Group, Inc. | | | 4,095 | | | | 1,186,117 | | | | 0.90 | % |
The accompanying notes are an integral part of these financial statements.
HENNESSY FUNDS 1-800-966-4354
| | COMMON STOCKS | | Number | | | | | | % of | |
| | | | of Shares | | | Value | | | Net Assets | |
| | Financials (Continued) | | | | | | | | | |
| | Digital Realty Trust, Inc. | | | 22,010 | | | $ | 1,314,657 | | | | 1.00 | % |
| | Franklin Resources, Inc. | | | 14,350 | | | | 1,645,945 | | | | 1.25 | % |
| | Huntington Bancshares, Inc. | | | 63,520 | | | | 360,158 | | | | 0.27 | % |
| | J.P. Morgan Chase & Co. | | | 97,795 | | | | 3,680,026 | | | | 2.80 | % |
| | MetLife, Inc. | | | 28,530 | | | | 1,150,615 | | | | 0.87 | % |
| | Morgan Stanley | | | 28,660 | | | | 712,774 | | | | 0.54 | % |
| | Prudential Financial, Inc. | | | 18,310 | | | | 962,740 | | | | 0.73 | % |
| | Simon Property Group, Inc. | | | 19,613 | | | | 1,883,240 | | | | 1.43 | % |
| | The Goldman Sachs Group, Inc. | | | 20,950 | | | | 3,371,903 | | | | 2.56 | % |
| | The Progressive Corp. | | | 87,585 | | | | 1,853,299 | | | | 1.41 | % |
| | U.S. Bancorp (d) | | | 133,070 | | | | 3,217,633 | | | | 2.45 | % |
| | Wells Fargo & Co. | | | 74,930 | | | | 1,954,174 | | | | 1.49 | % |
| | | | | | | | | 34,314,708 | | | | 26.08 | % |
| | Health Care – 13.93% | | | | | | | | | | | | |
| | Abbott Laboratories | | | 38,650 | | | | 1,983,518 | | | | 1.51 | % |
| | Amgen, Inc. (a) | | | 54,535 | | | | 3,118,857 | | | | 2.37 | % |
| | Johnson & Johnson | | | 13,600 | | | | 865,912 | | | | 0.66 | % |
| | Life Technologies Corp. (a) | | | 54,545 | | | | 2,737,068 | | | | 2.08 | % |
| | Merck & Co., Inc. | | | 51,187 | | | | 1,857,064 | | | | 1.41 | % |
| | Pfizer, Inc. | | | 154,620 | | | | 2,690,388 | | | | 2.04 | % |
| | St. Jude Medical, Inc. (a) | | | 43,730 | | | | 1,674,859 | | | | 1.27 | % |
| | UnitedHealth Group, Inc. | | | 94,475 | | | | 3,405,824 | | | | 2.59 | % |
| | | | | | | | | 18,333,490 | | | | 13.93 | % |
| | Industrials – 8.72% | | | | | | | | | | | | |
| | Cummins, Inc. | | | 13,510 | | | | 1,190,230 | | | | 0.90 | % |
| | Eaton Corp. | | | 15,050 | | | | 1,336,891 | | | | 1.02 | % |
| | General Electric Co. | | | 168,710 | | | | 2,702,734 | | | | 2.05 | % |
| | Illinois Tool Works, Inc. | | | 25,495 | | | | 1,165,122 | | | | 0.89 | % |
| | Terex Corp. (a) | | | 30,035 | | | | 674,286 | | | | 0.51 | % |
| | Union Pacific Corp. | | | 29,995 | | | | 2,629,962 | | | | 2.00 | % |
| | United Technologies Corp. | | | 23,680 | | | | 1,770,554 | | | | 1.35 | % |
| | | | | | | | | 11,469,779 | | | | 8.72 | % |
The accompanying notes are an integral part of these financial statements.
SCHEDULE OF INVESTMENTS — HENNESSY SELECT LARGE VALUE FUND
| | COMMON STOCKS | | Number | | | | | | % of | |
| | | | of Shares | | | Value | | | Net Assets | |
| | Information Technology – 6.07% | | | | | | | | | |
| | Accenture PLC – Class A (b) | | | 23,550 | | | $ | 1,052,921 | | | | 0.80 | % |
| | eBay, Inc. (a) | | | 24,590 | | | | 733,028 | | | | 0.56 | % |
| | Microsoft Corp. | | | 130,605 | | | | 3,479,317 | | | | 2.64 | % |
| | Oracle Corp. | | | 52,930 | | | | 1,556,142 | | | | 1.18 | % |
| | Texas Instruments, Inc. | | | 39,420 | | | | 1,165,649 | | | | 0.89 | % |
| | | | | | | | | 7,987,057 | | | | 6.07 | % |
| | Materials – 4.36% | | | | | | | | | | | | |
| | Eastman Chemical Co. | | | 25,375 | | | | 1,993,714 | | | | 1.51 | % |
| | Freeport-McMoRan Copper & Gold, Inc. | | | 9,190 | | | | 870,109 | | | | 0.67 | % |
| | International Paper Co. | | | 63,785 | | | | 1,612,485 | | | | 1.22 | % |
| | Walter Energy, Inc. | | | 14,440 | | | | 1,270,142 | | | | 0.96 | % |
| | | | | | | | | 5,746,450 | | | | 4.36 | % |
| | Telecommunication Services – 5.27% | | | | | | | | | | | | |
| | AT&T, Inc. | | | 81,120 | | | | 2,311,920 | | | | 1.76 | % |
| | Qwest Communications International, Inc. | | | 224,955 | | | | 1,484,703 | | | | 1.13 | % |
| | Verizon Communications, Inc. | | | 96,605 | | | | 3,136,764 | | | | 2.38 | % |
| | | | | | | | | 6,933,387 | | | | 5.27 | % |
| | Utilities – 6.78% | | | | | | | | | | | | |
| | American Electric Power, Inc. | | | 57,385 | | | | 2,148,494 | | | | 1.63 | % |
| | Dominion Resources, Inc. | | | 39,895 | | | | 1,733,836 | | | | 1.32 | % |
| | Exelon Corp. | | | 45,390 | | | | 1,852,820 | | | | 1.41 | % |
| | NextEra Energy, Inc. | | | 32,620 | | | | 1,795,405 | | | | 1.36 | % |
| | PG&E Corp. | | | 29,075 | | | | 1,390,367 | | | | 1.06 | % |
| | | | | | | | | 8,920,922 | | | | 6.78 | % |
| | | | | | | | | | | | | | |
| | Total Common Stocks (Cost $112,397,034) | | | | | | | 129,162,945 | | | | 98.16 | % |
The accompanying notes are an integral part of these financial statements.
HENNESSY FUNDS 1-800-966-4354
| | SHORT-TERM INVESTMENT – 1.55% | | Number | | | | | | % of | |
| | | | of Shares | | | Value | | | Net Assets | |
| | Money Market Fund – 1.55% | | | | | | | | | |
| | Fidelity Government Portfolio – | | | | | | | | | |
| | Institutional Class, 0.06% (c) | | | 2,039,765 | | | $ | 2,039,765 | | | | 1.55 | % |
| | | | | | | | | | | | | | |
| | Total Short-Term Investments | | | | | | | | | | | | |
| | (Cost $2,039,765) | | | | | | | 2,039,765 | | | | 1.55 | % |
| | | | | | | | | | | | | | |
| | Total Investments – 99.71% | | | | | | | | | | | | |
| | (Cost 114,436,799) | | | | | | | 131,202,710 | | | | 99.71 | % |
| | | | | | | | | | | | | | |
| | Other Assets in Excess of Liabilities – 0.29% | | | | | | | 375,696 | | | | 0.29 | % |
| | TOTAL NET ASSETS – 100.00% | | | | | | $ | 131,578,406 | | | | 100.00 | % |
Percentages are stated as a percent of net assets.
| (a) | Non-income producing security. |
| (b) | Foreign issued security. |
| (c) | The rate listed is the Fund’s 7-day yield as of October 31, 2010. |
| (d) | Investment in affiliated security. Quasar Distributors, LLC, which serves as the Funds’ distributor, is a subsidiary of U.S. Bancorp. Details of transactions with this affiliated company for the year ended October 31, 2010 were as follows: |
| | | Beginning | Purchase | Sales | Ending | Dividend | | Market |
| | Issuer | Cost | Cost | Cost | Cost | Income | Shares | Value |
| | U.S. Bancorp | $2,245,916 | $611,248 | $652,305 | $2,204,859 | $24,188 | 133,070 | $3,217,633 |
Summary of Fair Value Exposure at October 31, 2010
The Fund has adopted authoritative fair valuation accounting standards which establish an authoritative definition of fair value and set out a hierarchy for measuring fair value. These standards require additional disclosures about the various inputs and valuation techniques used to develop the measurements of fair value and a discussion in changes in valuation techniques and related inputs during the period. These inputs are summarized in the three broad levels listed below.
The Fund has performed an analysis of all existing investments to determine the significance and character of all inputs to their fair value determination.
| Level 1 – | Quoted unadjusted prices for identical instruments in active markets to which the Fund has access at the date of measurement. |
| Level 2 – | Quoted prices for similar instruments in active markets; quoted prices for identical or similar instruments in markets that are not active; and model-derived valuations in which all significant inputs and significant value drivers are observable in active markets. Level 2 inputs are those in markets for which there are few transactions, the prices are not current, little public information exists or instances where prices vary substantially over time or among brokered market makers. |
| Level 3 – | Model derived valuations in which one or more significant inputs or significant value drivers are unobservable. Unobservable inputs are those inputs that reflect the Fund’s own assumptions that market participants would use to price the asset or liability based on the best available information. |
The accompanying notes are an integral part of these financial statements.
SCHEDULE OF INVESTMENTS — HENNESSY SELECT LARGE VALUE FUND
The inputs or methodology used for valuing securities are not an indication of the risk associated with investing in those securities.
The following is a summary of the inputs used to value the Fund’s net assets as of October 31, 2010:
| Common Stock | | Level 1 | | | Level 2 | | | Level 3 | | | Total | |
| Consumer Discretionary | | $ | 10,079,914 | | | $ | — | | | $ | — | | | $ | 10,079,914 | |
| Consumer Staples | | | 13,205,397 | | | | — | | | | — | | | | 13,205,397 | |
| Energy | | | 12,171,841 | | | | — | | | | — | | | | 12,171,841 | |
| Financials | | | 34,314,708 | | | | — | | | | — | | | | 34,314,708 | |
| Health Care | | | 18,333,490 | | | | — | | | | — | | | | 18,333,490 | |
| Industrials | | | 11,469,779 | | | | — | | | | — | | | | 11,469,779 | |
| Information Technology | | | 7,987,057 | | | | — | | | | — | | | | 7,987,057 | |
| Materials | | | 5,746,450 | | | | — | | | | — | | | | 5,746,450 | |
| Telecommunication Services | | | 6,933,387 | | | | — | | | | — | | | | 6,933,387 | |
| Utilities | | | 8,920,922 | | | | | | | | | | | | 8,920,922 | |
| Total Common Stock | | $ | 129,162,945 | | | $ | — | | | $ | — | | | $ | 129,162,945 | |
| Short-Term Investments | | $ | 2,039,765 | | | $ | — | | | $ | — | | | $ | 2,039,765 | |
| Total Investments in Securities | | $ | 131,202,710 | | | $ | — | | | $ | — | | | $ | 131,202,710 | |
The accompanying notes are an integral part of these financial statements.
HENNESSY FUNDS 1-800-966-4354
HENNESSY SELECT SPARX
JAPAN FUND
(% of Net Assets)
| | TOP TEN EQUITY HOLDINGS | % of net assets |
| | Keyence Corp. | 10.47% |
| | Asics Corp. | 8.67% |
| | Mitsubishi Corp. | 8.57% |
| | Misumi Group, Inc. | 7.89% |
| | Kao Corp. | 7.48% |
| | Fuji Seal International, Inc. | 7.20% |
| | Rohto Pharmaceutical Co., Ltd. | 6.31% |
| | Marubeni Corp. | 5.77% |
| | Ryohin Keikaku Co., Ltd. | 4.60% |
| | Itochu Corp. | 4.37% |
SCHEDULE OF INVESTMENTS — HENNESSY SELECT SPARX JAPAN FUND
| | COMMON STOCKS – 97.97% | | Number | | | | | | % of | |
| | | | of Shares | | | Value | | | Net Assets | |
| | Consumer Discretionary – 19.92% | | | | | | | | | |
| | Asics Corp. | | | 350,000 | | | $ | 3,779,670 | | | | 8.67 | % |
| | Isuzu Motors, Ltd. | | | 308,000 | | | | 1,186,528 | | | | 2.72 | % |
| | Ryohin Keikaku Co., Ltd. | | | 56,400 | | | | 2,001,720 | | | | 4.60 | % |
| | Shimano, Inc. | | | 34,300 | | | | 1,713,508 | | | | 3.93 | % |
| | | | | | | | | 8,681,426 | | | | 19.92 | % |
| | Consumer Staples – 11.63% | | | | | | | | | | | | |
| | Kao Corp. | | | 128,400 | | | | 3,259,863 | | | | 7.48 | % |
| | Unicharm Corp. | | | 47,400 | | | | 1,811,296 | | | | 4.15 | % |
| | | | | | | | | 5,071,159 | | | | 11.63 | % |
| | Health Care – 8.97% | | | | | | | | | | | | |
| | Mani, Inc. | | | 15,000 | | | | 588,107 | | | | 1.35 | % |
| | Rohto Pharmaceutical Co., Ltd. | | | 222,000 | | | | 2,750,516 | | | | 6.31 | % |
| | Terumo Corp. | | | 11,300 | | | | 573,637 | | | | 1.31 | % |
| | | | | | | | | 3,912,260 | | | | 8.97 | % |
| | Industrials – 33.91% | | | | | | | | | | | | |
| | Itochu Corp. | | | 217,000 | | | | 1,903,840 | | | | 4.37 | % |
| | Komatsu, Ltd. | | | 54,900 | | | | 1,345,382 | | | | 3.09 | % |
| | Marubeni Corp. | | | 400,000 | | | | 2,515,223 | | | | 5.77 | % |
| | Misumi Group, Inc. | | | 160,500 | | | | 3,440,568 | | | | 7.89 | % |
| | Mitsubishi Corp. | | | 155,400 | | | | 3,736,783 | | | | 8.57 | % |
| | Sumitomo Corp. | | | 144,900 | | | | 1,836,684 | | | | 4.22 | % |
| | | | | | | | | 14,778,480 | | | | 33.91 | % |
| | Information Technology – 10.47% | | | | | | | | | | | | |
| | Keyence Corp. | | | 18,400 | | | | 4,561,700 | | | | 10.47 | % |
The accompanying notes are an integral part of these financial statements.
HENNESSY FUNDS 1-800-966-4354
| | COMMON STOCKS | | Number | | | | | | % of | |
| | | | of Shares | | | Value | | | Net Assets | |
| | Materials – 13.07% | | | | | | | | | |
| | Fuji Seal International, Inc. | | | 155,100 | | | $ | 3,139,778 | | | | 7.20 | % |
| | Sumitomo Metal Mining Co., Ltd. | | | 83,000 | | | | 1,318,180 | | | | 3.03 | % |
| | Taiyo Nippon Sanso Corp. | | | 154,000 | | | | 1,238,200 | | | | 2.84 | % |
| | | | | | | | | 5,696,158 | | | | 13.07 | % |
| | | | | | | | | | | | | | |
| | Total Common Stocks (Cost $37,336,119) | | | | | | | 42,701,183 | | | | 97.97 | % |
| | | | | | | | | | | | | | |
| | Total Investments – 97.97% | | | | | | | | | | | | |
| | (Cost 37,336,119) | | | | | | | 42,701,183 | | | | 97.97 | % |
| | | | | | | | | | | | | | |
| | Other Assets in Excess of Liabilities – 2.03% | | | | | | | 882,642 | | | | 2.03 | % |
| | TOTAL NET ASSETS – 100.00% | | | | | | $ | 43,583,825 | | | | 100.00 | % |
Percentages are stated as a percent of net assets.
Summary of Fair Value Exposure at October 31, 2010
The Fund has adopted authoritative fair valuation accounting standards which establish an authoritative definition of fair value and set out a hierarchy for measuring fair value. These standards require additional disclosures about the various inputs and valuation techniques used to develop the measurements of fair value and a discussion in changes in valuation techniques and related inputs during the period. These inputs are summarized in the three broad levels listed below.
The Fund has performed an analysis of all existing investments to determine the significance and character of all inputs to their fair value determination.
| Level 1 – | Quoted unadjusted prices for identical instruments in active markets to which the Fund has access at the date of measurement. |
| Level 2 – | Quoted prices for similar instruments in active markets; quoted prices for identical or similar instruments in markets that are not active; and model-derived valuations in which all significant inputs and significant value drivers are observable in active markets. Level 2 inputs are those in markets for which there are few transactions, the prices are not current, the prices are fair value adjusted due to post market close subsequent events (foreign markets), little public information exists or instances where prices vary substantially over time or among brokered market makers. |
| Level 3 – | Model derived valuations in which one or more significant inputs or significant value drivers are unobservable. Unobservable inputs are those inputs that reflect the Fund’s own assumptions that market participants would use to price the asset or liability based on the best available information. |
The inputs or methodology used for valuing securities are not an indication of the risk associated with investing in those securities.
The accompanying notes are an integral part of these financial statements.
SCHEDULE OF INVESTMENTS — HENNESSY SELECT SPARX JAPAN FUND
The following is a summary of the inputs used to value the Fund’s net assets as of October 31, 2010:
| Common Stock | | Level 1 | | | Level 2 | | | Level 3 | | | Total | |
| Consumer Discretionary | | $ | 8,681,426 | | | $ | — | | | $ | — | | | $ | 8,681,426 | |
| Consumer Staples | | | 5,071,159 | | | | — | | | | — | | | | 5,071,159 | |
| Health Care | | | 3,912,260 | | | | — | | | | — | | | | 3,912,260 | |
| Industrials | | | 14,778,480 | | | | — | | | | — | | | | 14,778,480 | |
| Information Technology | | | 4,561,700 | | | | — | | | | — | | | | 4,561,700 | |
| Materials | | | 5,696,158 | | | | — | | | | — | | | | 5,696,158 | |
| Total Common Stock | | $ | 42,701,183 | | | $ | — | | | $ | — | | | $ | 42,701,183 | |
| Short-Term Investments | | $ | — | | | $ | — | | | $ | — | | | $ | — | |
| Total Investments in Securities | | $ | 42,701,183 | | | $ | — | | | $ | — | | | $ | 42,701,183 | |
The accompanying notes are an integral part of these financial statements.
HENNESSY FUNDS 1-800-966-4354
HENNESSY SELECT SPARX
JAPAN SMALLER COMPANIES FUND
(% of Net Assets)
| | TOP TEN EQUITY HOLDINGS | % of net assets |
| | Toshin Group Co., Ltd. | 2.41% |
| | Suruga Bank, Ltd. | 2.38% |
| | NPC, Inc. | 2.38% |
| | Yamaichi Electronics Co., Ltd. | 2.29% |
| | ASKUL Corp. | 2.24% |
| | SBS Holdings, Inc. | 2.23% |
| | Paramount Bed Co., Ltd. | 2.22% |
| | H.I.S. Co., Ltd. | 2.18% |
| | Prestige International, Inc. | 2.14% |
| | Adeka Corp. | 2.12% |
SCHEDULE OF INVESTMENTS — HENNESSY SELECT SPARX JAPAN SMALLER COMPANIES FUND
| | COMMON STOCKS – 96.90% | | Number | | | | | | % of | |
| | | | of Shares | | | Value | | | Net Assets | |
| | Consumer Discretionary – 21.14% | | | | | | | | | |
| | ASKUL Corp. | | | 16,300 | | | $ | 338,680 | | | | 2.24 | % |
| | Bals Corp. | | | 288 | | | | 292,760 | | | | 1.93 | % |
| | Fujitsu General Ltd. | | | 59,000 | | | | 283,745 | | | | 1.87 | % |
| | H.I.S. Co., Ltd. | | | 15,500 | | | | 330,148 | | | | 2.18 | % |
| | Meiwa Estate Co., Ltd. | | | 36,500 | | | | 212,732 | | | | 1.40 | % |
| | Nippon Seiki Co., Ltd. | | | 27,000 | | | | 273,456 | | | | 1.80 | % |
| | Otsuka Kagu, Ltd. | | | 29,500 | | | | 315,273 | | | | 2.08 | % |
| | Press Kogyo Co., Ltd. | | | 80,000 | | | | 302,224 | | | | 1.99 | % |
| | Seria Co., Ltd. | | | 144 | | | | 250,528 | | | | 1.65 | % |
| | Tohokushinsha Film Corp. | | | 57,900 | | | | 243,918 | | | | 1.61 | % |
| | Village Vanguard Co., Ltd. | | | 58 | | | | 209,022 | | | | 1.38 | % |
| | Wowow, Inc. | | | 94 | | | | 153,611 | | | | 1.01 | % |
| | | | | | | | | 3,206,097 | | | | 21.14 | % |
| | Consumer Staples – 1.58% | | | | | | | | | | | | |
| | Cawachi Ltd. | | | 13,600 | | | | 240,328 | | | | 1.58 | % |
| | | | | | | | | | | | | | |
| | Financials – 8.33% | | | | | | | | | | | | |
| | Anicom Holdings, Inc. (a) | | | 7,400 | | | | 266,683 | | | | 1.76 | % |
| | NEC Capital Solutions Ltd. | | | 22,600 | | | | 290,398 | | | | 1.91 | % |
| | RISA Partners, Inc. | | | 343 | | | | 123,611 | | | | 0.81 | % |
| | Suruga Bank, Ltd. | | | 40,000 | | | | 360,880 | | | | 2.38 | % |
| | Tokyo Tomin Bank, Ltd. | | | 23,600 | | | | 222,598 | | | | 1.47 | % |
| | | | | | | | | 1,264,170 | | | | 8.33 | % |
| | Health Care – 4.25% | | | | | | | | | | | | |
| | Message Co., Ltd. | | | 121 | | | | 308,252 | | | | 2.03 | % |
| | Paramount Bed Co., Ltd. | | | 13,200 | | | | 335,946 | | | | 2.22 | % |
| | | | | | | | | 644,198 | | | | 4.25 | % |
| | Industrials – 33.28% | | | | | | | | | | | | |
| | Anest Iwata Corp. | | | 93,000 | | | | 256,568 | | | | 1.69 | % |
| | Asunaro Aoki Construction., Ltd. | | | 58,500 | | | | 261,712 | | | | 1.73 | % |
| | Benefit One, Inc. | | | 332 | | | | 258,273 | | | | 1.70 | % |
| | Ichinen Holdings Co., Ltd. | | | 29,100 | | | | 130,185 | | | | 0.86 | % |
| | Kito Corp. | | | 148 | | | | 133,342 | | | | 0.88 | % |
| | Kyosan Electric Manufacturing Co., Ltd. | | | 64,000 | | | | 268,821 | | | | 1.77 | % |
The accompanying notes are an integral part of these financial statements.
HENNESSY FUNDS 1-800-966-4354
| | COMMON STOCKS | | Number | | | | | | % of | |
| | | | of Shares | | | Value | | | Net Assets | |
| | Industrials (Continued) | | | | | | | | | |
| | Nippon Yusoki Co., Ltd. | | | 140,000 | | | $ | 300,981 | | | | 1.98 | % |
| | Nitto Kogyo Corp. | | | 27,200 | | | | 247,088 | | | | 1.63 | % |
| | NPC, Inc. | | | 15,600 | | | | 360,582 | | | | 2.38 | % |
| | Prestige International, Inc. | | | 178 | | | | 324,501 | | | | 2.14 | % |
| | SBS Holdings, Inc. | | | 352 | | | | 339,008 | | | | 2.23 | % |
| | Senko Co., Ltd. | | | 96,000 | | | | 292,283 | | | | 1.93 | % |
| | Shin Nippon Air Technologies Co., Ltd. | | | 36,200 | | | | 205,135 | | | | 1.35 | % |
| | Skymark Airlines Inc. | | | 26,900 | | | | 289,826 | | | | 1.91 | % |
| | Takeei Corp. | | | 25,000 | | | | 242,326 | | | | 1.60 | % |
| | Teraoka Seisakusho Co., Ltd. | | | 71,500 | | | | 318,094 | | | | 2.10 | % |
| | Toshin Group Co., Ltd. | | | 13,800 | | | | 365,279 | | | | 2.41 | % |
| | UKC Holdings Corp. | | | 15,000 | | | | 154,343 | | | | 1.02 | % |
| | Yushin Precision Equipment Co., Ltd. | | | 16,500 | | | | 298,135 | | | | 1.97 | % |
| | | | | | | | | 5,046,482 | | | | 33.28 | % |
| | Information Technology – 12.81% | | | | | | | | | | | | |
| | Elecom Co., Ltd. | | | 35,400 | | | | 301,782 | | | | 1.99 | % |
| | Macnica, Inc. | | | 15,200 | | | | 292,214 | | | | 1.93 | % |
| | Nippon Chemi-con Corp. | | | 36,000 | | | | 144,054 | | | | 0.95 | % |
| | SRA Holdings, Inc. | | | 28,100 | | | | 266,787 | | | | 1.76 | % |
| | Tamura Corp. | | | 109,000 | | | | 269,554 | | | | 1.78 | % |
| | Works Applications Co., Ltd. | | | 430 | | | | 180,080 | | | | 1.19 | % |
| | Yamaichi Electronics Co., Ltd. (a) | | | 127,800 | | | | 347,809 | | | | 2.29 | % |
| | Yokowo Co., Ltd. | | | 27,400 | | | | 139,945 | | | | 0.92 | % |
| | | | | | | | | 1,942,225 | | | | 12.81 | % |
| | Materials – 11.59% | | | | | | | | | | | | |
| | Adeka Corp. | | | 30,000 | | | | 320,616 | | | | 2.12 | % |
| | Aichi Corp. | | | 62,600 | | | | 224,822 | | | | 1.48 | % |
| | Fujikura Kasei Co., Ltd. | | | 48,900 | | | | 293,509 | | | | 1.94 | % |
| | Ohara, Inc. | | | 18,200 | | | | 219,838 | | | | 1.45 | % |
| | Tokyo Rope Manufacturing Co., Ltd. | | | 81,000 | | | | 217,423 | | | | 1.43 | % |
| | Tokyo Tekko Co., Ltd. | | | 128,000 | | | | 256,094 | | | | 1.69 | % |
| | Wood One Co., Ltd. | | | 83,000 | | | | 224,855 | | | | 1.48 | % |
| | | | | | | | | 1,757,157 | | | | 11.59 | % |
The accompanying notes are an integral part of these financial statements.
SCHEDULE OF INVESTMENTS — HENNESSY SELECT SPARX JAPAN SMALLER COMPANIES FUND
| | COMMON STOCKS | | Number | | | | | | % of | |
| | | | of Shares | | | Value | | | Net Assets | |
| | Telecommunication Services – 3.51% | | | | | | | | | |
| | ITC Networks Corp. | | | 46,800 | | | $ | 226,817 | | | | 1.50 | % |
| | MIRAIT Holdings Corp. | | | 46,400 | | | | 305,029 | | | | 2.01 | % |
| | | | | | | | | 531,846 | | | | 3.51 | % |
| | Utilities – 0.41% | | | | | | | | | | | | |
| | Japan Wind Development Co., Ltd. (a) | | | 60 | | | | 62,334 | | | | 0.41 | % |
| | | | | | | | | | | | | | |
| | Total Common Stocks (Cost $13,850,924) | | | | | | | 14,694,837 | | | | 96.90 | % |
| | | | | | | | | | | | | | |
| | SHORT-TERM INVESTMENTS – 5.01% | | | | | | | | | | | | |
| | Money Market Funds – 5.01% | | | | | | | | | | | | |
| | Federated Government Obligations – | | | | | | | | | | | | |
| | Institutional Class, 0.05% (b) | | | 4,404 | | | | 4,404 | | | | 0.03 | % |
| | Fidelity Government Portfolio – | | | | | | | | | | | | |
| | Institutional Class, 0.06% (b) | | | 755,884 | | | | 755,884 | | | | 4.98 | % |
| | | | | | | | | | | | | | |
| | Total Short-Term Investments | | | | | | | | | | | | |
| | (Cost $760,288) | | | | | | | 760,288 | | | | 5.01 | % |
| | | | | | | | | | | | | | |
| | Total Investments – 101.91% | | | | | | | | | | | | |
| | (Cost 14,611,212) | | | | | | | 15,455,125 | | | | 101.91 | % |
| | | | | | | | | | | | | | |
| | Liabilities in Excess of Other Assets – (1.91)% | | | | | | | (290,068 | ) | | | (1.91 | )% |
| | TOTAL NET ASSETS – 100.00% | | | | | | $ | 15,165,057 | | | | 100.00 | % |
Percentages are stated as a percent of net assets.
| (a) | Non-income producing security. |
| (b) | The rate listed is the Fund’s 7-day yield as of October 31, 2010. |
The accompanying notes are an integral part of these financial statements.
HENNESSY FUNDS 1-800-966-4354
The Fund has adopted authoritative fair valuation accounting standards which establish an authoritative definition of fair value and set out a hierarchy for measuring fair value. These standards require additional disclosures about the various inputs and valuation techniques used to develop the measurements of fair value and a discussion in changes in valuation techniques and related inputs during the period. These inputs are summarized in the three broad levels listed below.
The Fund has performed an analysis of all existing investments to determine the significance and character of all inputs to their fair value determination.
| Level 1 – | Quoted unadjusted prices for identical instruments in active markets to which the Fund has access at the date of measurement. |
| Level 2 – | Quoted prices for similar instruments in active markets; quoted prices for identical or similar instruments in markets that are not active; and model-derived valuations in which all significant inputs and significant value drivers are observable in active markets. Level 2 inputs are those in markets for which there are few transactions, the prices are not current, the prices are fair value adjusted due to post market close subsequent events (foreign markets), little public information exists or instances where prices vary substantially over time or among brokered market makers. |
| Level 3 – | Model derived valuations in which one or more significant inputs or significant value drivers are unobservable. Unobservable inputs are those inputs that reflect the Fund’s own assumptions that market participants would use to price the asset or liability based on the best available information. |
The inputs or methodology used for valuing securities are not an indication of the risk associated with investing in those securities.
The following is a summary of the inputs used to value the Fund’s net assets as of October 31, 2010:
| Common Stock | | Level 1 | | | Level 2 | | | Level 3 | | | Total | |
| Consumer Discretionary | | $ | 3,206,097 | | | $ | — | | | $ | — | | | $ | 3,206,097 | |
| Consumer Staples | | | 240,328 | | | | — | | | | — | | | | 240,328 | |
| Financials | | | 1,264,170 | | | | — | | | | — | | | | 1,264,170 | |
| Health Care | | | 644,198 | | | | — | | | | — | | | | 644,198 | |
| Industrials | | | 5,046,482 | | | | — | | | | — | | | | 5,046,482 | |
| Information Technology | | | 1,942,225 | | | | — | | | | — | | | | 1,942,225 | |
| Materials | | | 1,757,157 | | | | — | | | | — | | | | 1,757,157 | |
| Telecommunication Services | | | 531,846 | | | | | | | | | | | | 531,846 | |
| Utilities | | | 62,334 | | | | — | | | | — | | | | 62,334 | |
| Total Common Stock | | $ | 14,694,837 | | | $ | — | | | $ | — | | | $ | 14,694,837 | |
| Short-Term Investments | | $ | 760,288 | | | $ | — | | | $ | — | | | $ | 760,288 | |
| Total Investments in Securities | | $ | 15,455,125 | | | $ | — | | | $ | — | | | $ | 15,455,125 | |
The accompanying notes are an integral part of these financial statements.
SCHEDULE OF INVESTMENTS — HENNESSY SELECT SPARX JAPAN SMALLER COMPANIES FUND
(This Page Intentionally Left Blank.)
HENNESSY FUNDS 1-800-966-4354
Financial Statements
Statements of Assets and Liabilities as of October 31, 2010 |
| ASSETS: | |
| Investments in unaffiliated securities, at value | |
| (cost $112,231,940, $37,336,119, and $14,611,212 respectively) | |
| Investments in affiliated securities, at value (cost $2,204,859, $0, and $0 respectively) | |
| Dividends and interest receivable | |
| Receivable for fund shares sold | |
| Receivable for securities sold | |
| Prepaid expenses and other assets | |
| Total Assets | |
| | |
| LIABILITIES: | |
| Due to custodian | |
| Payable for securities purchased | |
| Payable for fund shares redeemed | |
| Payable to advisor | |
| Payable to administrator | |
| Payable to auditor | |
| Accrued service fees | |
| Accrued expenses and other payables | |
| Total Liabilities | |
| | |
| NET ASSETS | |
| | |
| NET ASSETS CONSIST OF: | |
| Capital stock | |
| Accumulated net investment income (loss) | |
| Accumulated net realized loss on investments | |
| Unrealized net appreciation on investments and foreign currency related transactions | |
| Total Net Assets | |
| | |
| NET ASSETS | |
| Original Class: | |
| Shares authorized (no par value, $0.001 and $0.001 par value, respectively) | |
| Net assets applicable to outstanding Original Class shares | |
| Shares issued and outstanding | |
| Net asset value, offering price and redemption price per share | |
| | |
| Institutional Class: | |
| Shares authorized (no par value and $0.001 par value, respectively) | |
| Net assets applicable to outstanding Institutional Class shares | |
| Shares issued and outstanding | |
| Net asset value, offering price and redemption price per share | |
The accompanying notes are an integral part of these financial statements.
FINANCIAL STATEMENTS – STATEMENTS OF ASSETS AND LIABILITIES
| | | | | | | HENNESSY | |
| HENNESSY | | | HENNESSY | | | SELECT SPARX | |
| SELECT LARGE | | | SELECT SPARX | | | JAPAN SMALLER | |
| VALUE FUND | | | JAPAN FUND | | | COMPANIES FUND | |
| | | | | | | | |
| | | | | | | | |
| $ | 127,985,077 | | | $ | 42,701,183 | | | $ | 15,455,125 | |
| | 3,217,633 | | | | — | | | | — | |
| | 174,672 | | | | 395,724 | | | | 83,501 | |
| | 4,277 | | | | 65,862 | | | | 4,022 | |
| | 2,507,765 | | | | 1,813,890 | | | | 205,562 | |
| | 25,970 | | | | 5,290 | | | | 11,646 | |
| | 133,915,394 | | | | 44,981,949 | | | | 15,759,856 | |
| | | | | | | | | | | |
| | | | | | | | | | | |
| | 75,921 | | | | 816,312 | | | | — | |
| | 1,820,864 | | | | — | | | | 536,685 | |
| | 178,865 | | | | 450,432 | | | | 2,437 | |
| | 95,164 | | | | 41,346 | | | | 15,532 | |
| | 109,317 | | | | 46,038 | | | | 13,012 | |
| | 17,117 | | | | 20,255 | | | | 18,606 | |
| | 11,193 | | | | 2,039 | | | | 1,294 | |
| | 28,547 | | | | 21,702 | | | | 7,233 | |
| | 2,336,988 | | | | 1,398,124 | | | | 594,799 | |
| | | | | | | | | | | |
| $ | 131,578,406 | | | $ | 43,583,825 | | | $ | 15,165,057 | |
| | | | | | | | | | | |
| | | | | | | | | | | |
| $ | 165,491,355 | | | $ | 72,323,958 | | | $ | 16,657,892 | |
| | 682,446 | | | | — | | | | (217,495 | ) |
| | (51,361,306 | ) | | | (34,163,985 | ) | | | (2,125,092 | ) |
| | 16,765,911 | | | | 5,423,852 | | | | 849,752 | |
| $ | 131,578,406 | | | $ | 43,583,825 | | | $ | 15,165,057 | |
| | | | | | | | | | | |
| | | | | | | | | | | |
| | | | | | | | | | | |
| Unlimited | | | Unlimited | | | Unlimited | |
| | 131,541,526 | | | | 20,011,835 | | | | 15,165,057 | |
| | 6,394,319 | | | | 1,590,460 | | | | 1,643,587 | |
| $ | 20.57 | | | $ | 12.58 | | | $ | 9.23 | |
| | | | | | | | | | | |
| | | | | | | | | | | |
| Unlimited | | | Unlimited | | | | N/A | |
| | 36,880 | | | | 23,571,990 | | | | | |
| | 1,786 | | | | 1,861,986 | | | | | |
| $ | 20.65 | | | $ | 12.66 | | | | | |
HENNESSY FUNDS 1-800-966-4354
Statements of Operations Year Ended October 31, 2010 |
| INVESTMENT INCOME: | |
Dividend income from unaffiliated securities(1) | |
| Dividend income from affiliated securities | |
| Interest income | |
| Total investment income | |
| | |
| EXPENSES: | |
| Investment advisory fees | |
| Administration, fund accounting, custody and transfer agent fees | |
| Service fees – Original Class (See Note 4) | |
| Federal and state registration fees | |
| Audit and tax fees | |
| Legal fees | |
| Compliance expense | |
| Reports to shareholders | |
| Directors’ fees and expenses | |
| Sub-transfer agent expenses – Original Class (See Note 4) | |
| Sub-transfer agent expenses – Institutional Class (See Note 4) | |
| Other | |
| Total expenses before reimbursement from advisor | |
| | |
| Expense reimbursement from advisor | |
| Original Class | |
| Institutional Class | |
| Administration expense waiver – Institutional Class (See Note 4) | |
| Net expenses | |
| NET INVESTMENT INCOME (LOSS) | |
| | |
| REALIZED AND UNREALIZED GAINS (LOSSES): | |
| Net realized gain (loss) on: | |
| Investments from unaffiliated securities | |
| Investments from affiliated securities | |
| Foreign currency transactions | |
| Change in unrealized appreciation (depreciation) on | |
| Investments in securities | |
| Foreign currency translation | |
| NET REALIZED GAIN (LOSS) AND UNREALIZED GAIN (LOSS) ON INVESTMENTS | |
| NET INCREASE (DECREASE) IN NET ASSETS RESULTING FROM OPERATIONS | |
| (1) | Net of foreign taxes withheld of $0, $60,287,& $23,047, respectively. |
The accompanying notes are an integral part of these financial statements.
FINANCIAL STATEMENTS – STATEMENTS OF OPERATIONS
| | | | | | | HENNESSY | |
| HENNESSY | | | HENNESSY | | | SELECT SPARX | |
| SELECT LARGE | | | SELECT SPARX | | | JAPAN SMALLER | |
| VALUE FUND | | | JAPAN FUND | | | COMPANIES FUND | |
| | | | | | | | |
| $ | 2,721,782 | | | $ | 800,957 | | | $ | 306,193 | |
| | 24,188 | | | | — | | | | — | |
| | 1,021 | | | | 1,790 | | | | 266 | |
| | 2,746,991 | | | | 802,747 | | | | 306,459 | |
| | | | | | | | | | | |
| | | | | | | | | | | |
| | 1,140,958 | | | | 552,830 | | | | 184,064 | |
| | 358,366 | | | | 140,972 | | | | 39,113 | |
| | 134,195 | | | | 12,089 | | | | 6,390 | |
| | 38,156 | | | | 34,477 | | | | 20,286 | |
| | 22,156 | | | | 15,250 | | | | 13,620 | |
| | 10,501 | | | | 6,001 | | | | 12,105 | |
| | 6,337 | | | | 6,337 | | | | 6,337 | |
| | 38,251 | | | | 10,002 | | | | 3,000 | |
| | 9,997 | | | | 10,001 | | | | 10,001 | |
| | 103,577 | | | | 78,304 | | | | 27,948 | |
| | — | | | | 10,084 | | | | N/A | |
| | 23,236 | | | | 4,874 | | | | 4,866 | |
| | 1,885,730 | | | | 881,221 | | | | 327,730 | |
| | | | | | | | | | | |
| | (38,444 | ) | | | (37,425 | ) | | | (19,527 | ) |
| | — | | | | (12,915 | ) | | | N/A | |
| | (83 | ) | | | — | | | | — | |
| | 1,847,203 | | | | 830,881 | | | | 308,203 | |
| $ | 899,788 | | | $ | (28,134 | ) | | $ | (1,744 | ) |
| | | | | | | | | | | |
| | | | | | | | | | | |
| | | | | | | | | | | |
| $ | 11,919,305 | | | $ | (6,191,424 | ) | | $ | 1,823,146 | |
| | (35,267 | ) | | | — | | | | — | |
| | — | | | | (7,749 | ) | | | (758 | ) |
| | | | | | | | | | | |
| | 378,192 | | | | 11,361,263 | | | | (2,022,397 | ) |
| | — | | | | 53,861 | | | | 2,599 | |
| | 12,262,230 | | | | 5,215,951 | | | | (197,410 | ) |
| | | | | | | | | | | |
| $ | 13,162,018 | | | $ | 5,187,817 | | | $ | (199,154 | ) |
HENNESSY FUNDS 1-800-966-4354
Financial Statements
| Statements of Changes in Net Assets |
| OPERATIONS: | |
| Net investment income (loss) | |
| Net realized gain (loss) | |
| Change in unrealized appreciation (depreciation) | |
| Net increase (decrease) in net assets resulting from operations | |
| DISTRIBUTIONS TO SHAREHOLDERS FROM: | |
| Net investment income – Original Class | |
| Net investment income – Institutional Class | |
| Net investment income – Class A | |
| Net investment income – Class C | |
| Net investment income – Class R | |
| Net investment income – Class S | |
| Total distributions | |
| CAPITAL SHARE TRANSACTIONS: | |
| Proceeds from shares issued in the reorganization | |
| Proceeds from shares subscribed – Original Class | |
| Proceeds from shares subscribed – Institutional Class | |
| Proceeds from shares subscribed – Predecessor Class A | |
| Proceeds from shares subscribed – Predecessor Class C | |
| Proceeds from shares subscribed – Predecessor Class S | |
| Dividends reinvested – Original Class | |
| Dividends reinvested – Institutional Class | |
| Dividends reinvested – Predecessor Class A | |
| Dividends reinvested – Predecessor Class C | |
| Dividends reinvested – Predecessor Class R | |
| Dividends reinvested – Predecessor Class S | |
| Cost of shares redeemed – Original Class | |
| Cost of shares redeemed – Institutional Class | |
| Cost of shares redeemed – Predecessor Class A | |
| Cost of shares redeemed – Predecessor Class C | |
| Cost of shares redeemed – Predecessor Class R | |
| Cost of shares redeemed – Predecessor Class S | |
| Cost of shares redeemed in the reorganization – Predecessor Class A (See Note 6) | |
| Cost of shares redeemed in the reorganization – Predecessor Class C (See Note 6) | |
| Cost of shares redeemed in the reorganization – Predecessor Class S (See Note 6) | |
| Net increase (decrease) in net assets derived from capital share transactions | |
| TOTAL INCREASE (DECREASE) IN NET ASSETS | |
| NET ASSETS: | |
| Beginning of period | |
| End of period | |
| Accumulated net investment income, end of period | |
The accompanying notes are an integral part of these financial statements.
FINANCIAL STATEMENTS – STATEMENTS OF CHANGES IN NET ASSETS
| Hennessy Select Large Value Fund |
| | | | | | | | |
| Year Ended | | | One Month Ended | | | Year Ended | |
| October 31, 2010 | | | October 31, 2009* | | | September 30, 2009 | |
| | | | | | | | |
| $ | 899,788 | | | $ | 40,481 | | | $ | 2,147,657 | |
| | 11,884,038 | | | | 2,121,192 | | | | (38,033,622 | ) |
| | 378,192 | | | | (6,438,340 | ) | | | 17,930,480 | |
| | 13,162,018 | | | | (4,276,667 | ) | | | (17,955,485 | ) |
| | | | | | | | | | | |
| | (1,607,669 | ) | | | — | | | | — | |
| | (468 | ) | | | — | | | | — | |
| | — | | | | — | | | | (2,447 | ) |
| | — | | | | — | | | | (250 | ) |
| | — | | | | — | | | | (47 | ) |
| | — | | | | — | | | | (3,119,888 | ) |
| | (1,608,137 | ) | | | — | | | | (3,122,632 | ) |
| | | | | | | | | | | |
| | — | | | | — | | | | 106,344,111 | |
| | 1,644,633 | | | | 148,751 | | | | 913,870 | |
| | 10,259 | | | | 3,402 | | | | 22,275 | |
| | — | | | | — | | | | 4,294 | |
| | — | | | | — | | | | 300 | |
| | — | | | | — | | | | 1,105,178 | |
| | 1,542,668 | | | | — | | | | — | |
| | 468 | | | | — | | | | — | |
| | — | | | | — | | | | 2,160 | |
| | — | | | | — | | | | 250 | |
| | — | | | | — | | | | 47 | |
| | — | | | | — | | | | 2,990,948 | |
| | (15,965,046 | ) | | | (1,443,405 | ) | | | (7,303,823 | ) |
| | (5,496 | ) | | | — | | | | — | |
| | — | | | | — | | | | (206,038 | ) |
| | — | | | | — | | | | (2,369 | ) |
| | — | | | | — | | | | (2,172 | ) |
| | — | | | | — | | | | (12,805,550 | ) |
| | — | | | | — | | | | (130,787 | ) |
| | — | | | | — | | | | (14,058 | ) |
| | — | | | | — | | | | (106,199,266 | ) |
| | (12,772,514 | ) | | | (1,291,252 | ) | | | (15,280,630 | ) |
| | (1,218,633 | ) | | | (5,567,919 | ) | | | (36,358,747 | ) |
| | | | | | | | | | | |
| | 132,797,039 | | | | 138,364,958 | | | | 174,723,705 | |
| $ | 131,578,406 | | | $ | 132,797,039 | | | $ | 138,364,958 | |
| $ | 682,446 | | | $ | 1,390,728 | | | $ | 1,350,367 | |
HENNESSY FUNDS 1-800-966-4354
Financial Statements
| Statements of Changes in Net Assets |
| CHANGES IN SHARES OUTSTANDING: | |
| Shares issued in connection with reorganization | |
| Shares sold | |
| Original Class | |
| Institutional Class | |
| Predecessor Class A | |
| Predecessor Class C | |
| Predecessor Class R | |
| Predecessor Class S | |
| Shares issued to holders as reinvestment of dividends | |
| Original Class | |
| Institutional Class | |
| Predecessor Class A | |
| Predecessor Class C | |
| Predecessor Class R | |
| Predecessor Class S | |
| Shares redeemed | |
| Original Class | |
| Institutional Class | |
| Predecessor Class A | |
| Predecessor Class C | |
| Predecessor Class R | |
| Predecessor Class S | |
| Shares redeemed in the reorganization | |
| Predecessor Class A | |
| Predecessor Class C | |
| Predecessor Class S | |
| Net decrease in shares outstanding | |
| * | For the one month ended October 31, 2009. Effective October 31, 2009, the Fund changed its fiscal year end to October 31st from September 30th. |
The accompanying notes are an integral part of these financial statements.
FINANCIAL STATEMENTS – STATEMENTS OF CHANGES IN NET ASSETS
| Hennessy Select Large Value Fund | |
| | | | | | | | |
| Year Ended | | | One Month Ended | | | Year Ended | |
| October 31, 2010 | | | October 31, 2009* | | | September 30, 2009 | |
| | | | | | | | |
| | — | | | | — | | | | 7,462,745 | |
| | | | | | | | | | | |
| | 81,862 | | | | 7,564 | | | | 56,201 | |
| | 514 | | | | 172 | | | | 1,355 | |
| | — | | | | — | | | | 272 | |
| | — | | | | — | | | | 20 | |
| | — | | | | — | | | | — | |
| | — | | | | — | | | | 68,408 | |
| | | | | | | | | | | |
| | 76,941 | | | | — | | | | — | |
| | 23 | | | | — | | | | — | |
| | — | | | | — | | | | 134 | |
| | — | | | | — | | | | 16 | |
| | — | | | | — | | | | 3 | |
| | — | | | | — | | | | 187,051 | |
| | | | | | | | | | | |
| | (795,699 | ) | | | (72,961 | ) | | | (422,334 | ) |
| | (278 | ) | | | — | | | | — | |
| | — | | | | — | | | | (12,588 | ) |
| | — | | | | — | | | | (176 | ) |
| | — | | | | — | | | | (164 | ) |
| | — | | | | — | | | | (796,220 | ) |
| | | | | | | | | | | |
| | — | | | | — | | | | (9,127 | ) |
| | — | | | | — | | | | (1,000 | ) |
| | — | | | | — | | | | (7,452,580 | ) |
| | (636,637 | ) | | | (65,225 | ) | | | (917,984 | ) |
HENNESSY FUNDS 1-800-966-4354
Financial Statements
| Statements of Changes in Net Assets |
| OPERATIONS: | |
| Net investment income (loss) | |
| Net realized gain (loss) on securities | |
| Change in unrealized appreciation (depreciation) on securities | |
| Net increase (decrease) in net assets resulting from operations | |
| | |
| DISTRIBUTIONS TO SHAREHOLDERS FROM: | |
| Net investment income – Original Class | |
| Net investment income – Institutional Class | |
| Return of capital – Original Class | |
| Return of capital – Institutional Class | |
| Total distributions | |
| | |
| CAPITAL SHARE TRANSACTIONS: | |
| Proceeds from shares subscribed – Original Class | |
| Proceeds from shares subscribed – Institutional Class | |
| Dividends reinvested – Original Class | |
| Dividends reinvested – Institutional Class | |
| Cost of shares redeemed – Original Class | |
| Cost of shares redeemed – Institutional Class | |
| Redemption fees retained – Original Class | |
| Redemption fees retained – Institutional Class | |
| Net decrease in net assets derived from capital share transactions | |
| TOTAL INCREASE (DECREASE) IN NET ASSETS | |
| | |
| NET ASSETS: | |
| Beginning of year | |
| End of year | |
| | |
| Accumulated net investment income (loss), end of period | |
| | |
| CHANGES IN SHARES OUTSTANDING: | |
| Shares sold – Original Class | |
| Shares sold – Institutional Class | |
| Shares issued to holders as reinvestment of dividends – Original Class | |
| Shares issued to holders as reinvestment of dividends – Institutional Class | |
| Shares redeemed – Original Class | |
| Shares redeemed – Institutional Class | |
| Net decrease in shares outstanding | |
The accompanying notes are an integral part of these financial statements.
FINANCIAL STATEMENTS – STATEMENTS OF CHANGES IN NET ASSETS
| Hennessy Select SPARX | | | Hennessy Select SPARX | |
| Japan Fund | | | Japan Smaller Companies Fund | |
| Year Ended | | | Year Ended | | | Year Ended | | | Year Ended | |
| October 31, 2010 | | | October 31, 2009 | | | October 31, 2010 | | | October 31, 2009 | |
| | | | | | | | | | | |
| $ | (28,134 | ) | | $ | 90,895 | | | $ | (1,744 | ) | | $ | 108,317 | |
| | (6,199,173 | ) | | | (12,474,339 | ) | | | 1,822,388 | | | | (3,569,270 | ) |
| | 11,415,124 | | | | 21,195,083 | | | | (2,019,798 | ) | | | 8,342,323 | |
| | 5,187,817 | | | | 8,811,639 | | | | (199,154 | ) | | | 4,881,370 | |
| | | | | | | | | | | | | | | |
| | | | | | | | | | | | | | | |
| | (30,697 | ) | | | (65,133 | ) | | | (675,389 | ) | | | — | |
| | (22,666 | ) | | | (110,045 | ) | | | N/A | | | | N/A | |
| | (28,764 | ) | | | — | | | | — | | | | — | |
| | (21,239 | ) | | | — | | | | N/A | | | | N/A | |
| | (103,366 | ) | | | (175,178 | ) | | | (675,389 | ) | | | — | |
| | | | | | | | | | | | | | | |
| | | | | | | | | | | | | | | |
| | 12,134,525 | | | | 14,425,238 | | | | 3,996,704 | | | | 10,635,183 | |
| | 9,038,569 | | | | 2,861,706 | | | | N/A | | | | N/A | |
| | 58,305 | | | | 63,659 | | | | 654,011 | | | | — | |
| | 42,669 | | | | 103,942 | | | | N/A | | | | N/A | |
| | (23,363,751 | ) | | | (5,945,945 | ) | | | (4,829,993 | ) | | | (11,060,855 | ) |
| | (13,290,361 | ) | | | (19,199,363 | ) | | | N/A | | | | N/A | |
| | 36,375 | | | | 2,875 | | | | 18,198 | | | | 3,412 | |
| | — | | | | 4,035 | | | | N/A | | | | N/A | |
| | (15,343,669 | ) | | | (7,683,853 | ) | | | (161,080 | ) | | | (422,260 | ) |
| | (10,259,218 | ) | | | 952,608 | | | | (1,035,623 | ) | | | 4,459,110 | |
| | | | | | | | | | | | | | | |
| | | | | | | | | | | | | | | |
| | 53,843,043 | | | | 52,890,435 | | | | 16,200,680 | | | | 11,741,570 | |
| $ | 43,583,825 | | | $ | 53,843,043 | | | $ | 15,165,057 | | | $ | 16,200,680 | |
| | | | | | | | | | | | | | | |
| $ | — | | | $ | 53,363 | | | $ | (217,495 | ) | | $ | 237,889 | |
| | | | | | | | | | | | | | | |
| | | | | | | | | | | | | | | |
| | 1,011,968 | | | | 1,434,814 | | | | 424,911 | | | | 1,477,631 | |
| | 740,046 | | | | 275,108 | | | | N/A | | | | N/A | |
| | 4,983 | | | | 6,211 | | | | 74,659 | | | | — | |
| | 3,628 | | | | 10,082 | | | | N/A | | | | N/A | |
| | (1,911,383 | ) | | | (585,989 | ) | | | (519,710 | ) | | | (1,523,006 | ) |
| | (1,114,529 | ) | | | (1,837,630 | ) | | | N/A | | | | N/A | |
| | (1,265,287 | ) | | | (697,404 | ) | | | (20,140 | ) | | | (45,375 | ) |
HENNESSY FUNDS 1-800-966-4354
Financial Highlights
| Hennessy Select Large Value Fund |
For an Original Class share outstanding throughout each period
| PER SHARE DATA: | |
| Net asset value, beginning of period | |
| | |
| Income from investment operations: | |
| Net investment income | |
| Net realized and unrealized gains (losses) on securities | |
| Total from investment operations | |
| | |
| Less Distributions: | |
| Dividends from net investment income | |
| Dividends from net realized gains | |
| Total distributions | |
| Net asset value, end of period | |
| | |
| TOTAL RETURN | |
| SUPPLEMENTAL DATA AND RATIOS: | |
| Net assets, end of period (millions) | |
| Ratio of expenses to average net assets | |
| Before expense reimbursement | |
After expense reimbursement(6) | |
| Ratio of net investment income to average net assets | |
| Before expense reimbursement | |
After expense reimbursement(6) | |
Portfolio turnover rate(7) | |
| (1) | For the one month ended October 31, 2009. Effective October 31, 2009, the Fund changed its fiscal year end to October 31st from September 30th. |
| (2) | The financial highlights set forth for periods prior to March 20, 2009 represent the historical financial highlights of the Tamarack Value Fund, Class S shares. The assets of the Tamarack Value Fund were acquired by the Hennessy Select Large Value Fund on March 20, 2009. Prior to the reorganization, Tamarack Value Fund also offered Class A, Class C and R shares. At that time RBC Global Asset Management (U.S.), Inc., (formerly known as Voyageur Asset Management, Inc.) ceased to be investment advisor and Hennessy Advisors, Inc. became investment advisor. The return of the Tamarack Value Fund, Class S shares during the period October 1, 2008 through March 20, 2009 was (33.09)%. The return of the Hennessy Select Large Value Fund, Original Class shares during the period March 20, 2009 through September 30, 2009 was 36.84%. |
| (3) | Per share net investment income (loss) has been calculated using the average daily shares method. |
| (6) | The Advisor agreed to reimburse expenses in order to cap the Original Class share expenses. Please refer to Note 4 for more information. |
| (7) | Portfolio turnover is calculated on the basis of the Fund as a whole. |
The accompanying notes are an integral part of these financial statements.
FINANCIAL HIGHLIGHTS — HENNESSY SELECT LARGE VALUE FUND
| | | | One Month | | | | | | | | | | | | | |
| Year Ended | | | Ended | | | | | | | | | | | | | |
| October 31, | | | October 31, | | | Year Ended September 30, | |
| 2010 | | | 2009(1) | | | 2009(2) | | | 2008(2) | | | 2007(2) | | | 2006(2) | |
| | | | | | | | | | | | | | | | | |
| $ | 18.88 | | | $ | 19.49 | | | $ | 21.80 | | | $ | 43.12 | | | $ | 41.74 | | | $ | 45.78 | |
| | | | | | | | | | | | | | | | | | | | | | | |
| | 0.14 | | | | 0.01 | | | | 0.31 | | | | 0.42 | (3) | | | 0.58 | (3) | | | 0.55 | (3) |
| | 1.78 | | | | (0.62 | ) | | | (2.21 | ) | | | (7.43 | ) | | | 5.04 | | | | 3.07 | |
| | 1.92 | | | | (0.61 | ) | | | (1.90 | ) | | | (7.01 | ) | | | 5.62 | | | | 3.62 | |
| | | | | | | | | | | | | | | | | | | | | | | |
| | (0.23 | ) | | | — | | | | (0.41 | ) | | | (0.78 | ) | | | (0.63 | ) | | | (0.61 | ) |
| | — | | | | — | | | | — | | | | (13.53 | ) | | | (3.61 | ) | | | (7.05 | ) |
| | (0.23 | ) | | | — | | | | (0.41 | ) | | | (14.31 | ) | | | (4.24 | ) | | | (7.66 | ) |
| $ | 20.57 | | | $ | 18.88 | | | $ | 19.49 | | | $ | 21.80 | | | $ | 43.12 | | | $ | 41.74 | |
| | 10.22 | % | | | (3.13 | )%(4) | | | (8.43 | )% | | | (22.42 | )% | | | 14.19 | % | | | 9.10 | % |
| | | | | | | | | | | | | | | | | | | | | | | |
| $ | 131.54 | | | $ | 132.77 | | | $ | 138.34 | | | $ | 174.23 | | | $ | 269.37 | | | $ | 291.66 | |
| | | | | | | | | | | | | | | | | | | | | | | |
| | 1.41 | % | | | 1.37 | %(5) | | | 1.42 | % | | | 1.22 | % | | | 1.26 | % | | | 1.22 | % |
| | 1.38 | % | | | 1.30 | %(5) | | | 1.17 | % | | | 1.02 | % | | | 1.03 | % | | | 1.05 | % |
| | | | | | | | | | | | | | | | | | | | | | | |
| | 0.64 | % | | | 0.28 | %(5) | | | 1.46 | % | | | 1.32 | % | | | 1.13 | % | | | 1.16 | % |
| | 0.67 | % | | | 0.35 | %(5) | | | 1.71 | % | | | 1.52 | % | | | 1.36 | % | | | 1.33 | % |
| | 146 | % | | | 10 | %(4) | | | 142 | % | | | 162 | % | | | 136 | % | | | 38 | % |
HENNESSY FUNDS 1-800-966-4354
Financial Highlights
| Hennessy Select Large Value Fund |
For an Institutional Class share outstanding throughout each period
| PER SHARE DATA: | |
| Net asset value, beginning of period | |
| | |
| Income from investment operations: | |
| Net investment income (loss) | |
| Net realized and unrealized gains (losses) on securities | |
| Total from investment operations | |
| | |
| Less Distributions: | |
| Dividends from net investment income | |
| Dividends from net realized gains | |
| Total distributions | |
| Net asset value, end of period | |
| | |
| TOTAL RETURN | |
| | |
| SUPPLEMENTAL DATA AND RATIOS: | |
| Net assets, end of period (millions) | |
| Ratio of expenses to average net assets | |
| Before expense reimbursement | |
After expense reimbursement(6) | |
| Ratio of net investment income to average net assets | |
| Before expense reimbursement | |
After expense reimbursement(6) | |
Portfolio turnover rate(7) | |
| (1) | For the one month ended October 31, 2009. Effective October 31, 2009, the Fund changed its fiscal year end to October 31st from September 30th. |
| (2) | Institutional Class shares commenced operations on March 20, 2009. |
| (3) | Amount is less than $0.01 or $(0.01). |
| (6) | The Advisor and/or Administrator reimbursed expenses in order to cap the Institutional Class share expenses. Please refer to Note 4 for more information. |
| (7) | Portfolio turnover is calculated on the basis of the Fund as a whole. |
The accompanying notes are an integral part of these financial statements.
FINANCIAL HIGHLIGHTS — HENNESSY SELECT LARGE VALUE FUND
| | | | One Month | | | | |
| Year Ended | | | Ended | | | Period Ended | |
| October 31, | | | October 31, | | | September 30, | |
| 2010 | | | 2009(1) | | | 2009(2) | |
| | | | | | | | |
| $ | 18.92 | | | $ | 19.53 | | | $ | 14.25 | |
| | | | | | | | | | | |
| | | | | | | | | | | |
| | 0.21 | | | | — | (3) | | | 0.08 | |
| | 1.80 | | | | (0.61 | ) | | | 5.20 | |
| | 2.01 | | | | (0.61 | ) | | | 5.28 | |
| | | | | | | | | | | |
| | | | | | | | | | | |
| | (0.28 | ) | | | — | | | | — | |
| | — | | | | — | | | | — | |
| | (0.28 | ) | | | — | | | | — | |
| $ | 20.65 | | | $ | 18.92 | | | $ | 19.53 | |
| | | | | | | | | | | |
| | 10.65 | % | | | (3.12 | )%(4) | | | 37.05 | %(4) |
| | | | | | | | | | | |
| | | | | | | | | | | |
| $ | 0.04 | | | $ | 0.03 | | | $ | 0.03 | |
| | | | | | | | | | | |
| | 1.22 | % | | | 1.20 | %(5) | | | 26.18 | %(5) |
| | 0.98 | % | | | 0.98 | %(5) | | | 0.98 | %(5) |
| | | | | | | | | | | |
| | 0.80 | % | | | 0.44 | %(5) | | | (24.06 | )%(5) |
| | 1.04 | % | | | 0.66 | %(5) | | | 1.14 | %(5) |
| | 146 | % | | | 10 | %(4) | | | 142 | %(4) |
HENNESSY FUNDS 1-800-966-4354
Financial Highlights
| Hennessy Select SPARX Japan Fund |
For an Original Class share outstanding throughout each year
| PER SHARE DATA: | |
| Net asset value, beginning of year | |
| | |
| Income from investment operations: | |
| Ratio of net investment income (loss) | |
| Net realized and unrealized gains (losses) on securities | |
| Total from investment operations | |
| | |
| Less Distributions: | |
| Dividends from net investment income | |
| Dividends from net realized gains | |
| Return of capital | |
| Total distributions | |
| Redemption fees retained | |
| Net asset value, end of year | |
| | |
| TOTAL RETURN | |
| | |
| SUPPLEMENTAL DATA AND RATIOS: | |
| Net assets, end of period (millions) | |
| Ratio of expenses to average net assets | |
| Before expense reimbursement | |
After expense reimbursement(4) | |
| Ratio of net investment income (loss) to average net assets | |
| Before expense reimbursement | |
After expense reimbursement(4) | |
Portfolio turnover rate(5) | |
| (1) | The financial highlights set forth for periods prior to September 17, 2009 represent the historical financial highlights of the SPARX Japan Fund. On September 17, 2009 Hennessy Advisors, Inc., became the investment advisor to the Fund and the Fund changed its name to Hennessy Select SPARX Japan Fund. In addition, the Investor Class shares were redesignated Original Class shares. |
| (2) | Amount is less than $0.01. |
| (3) | Calculated based on average shares outstanding. |
| (4) | The Advisor agreed to reimburse expenses in order to cap the Original Class share expenses. Please refer to Note 4 for more information. |
| (5) | Portfolio turnover is calculated on the basis of the Fund as a whole. |
The accompanying notes are an integral part of these financial statements.
FINANCIAL HIGHLIGHTS — HENNESSY SELECT SPARX JAPAN FUND
| Year Ended October 31, | |
| 2010 | | | 2009(1) | | | 2008 | | | 2007 | | | 2006 | |
| | | | | | | | | | | | | | |
| $ | 11.38 | | | $ | 9.73 | | | $ | 16.24 | | | $ | 17.20 | | | $ | 17.41 | |
| | | | | | | | | | | | | | | | | | | |
| | | | | | | | | | | | | | | | | | | |
| | (0.04 | ) | | | 0.02 | | | | 0.05 | | | | (0.03 | ) | | | (0.10 | )(3) |
| | 1.25 | | | | 1.66 | | | | (6.56 | ) | | | (0.93 | ) | | | 0.60 | |
| | 1.21 | | | | 1.68 | | | | (6.51 | ) | | | (0.96 | ) | | | 0.50 | |
| | | | | | | | | | | | | | | | | | | |
| | | | | | | | | | | | | | | | | | | |
| | (0.01 | ) | | | (0.03 | ) | | | — | | | | — | | | | (0.55 | ) |
| | — | | | | — | | | | — | | | | — | | | | (0.17 | ) |
| | (0.01 | ) | | | — | | | | — | | | | — | | | | — | |
| | (0.02 | ) | | | (0.03 | ) | | | — | | | | — | | | | (0.72 | ) |
| | 0.01 | | | | — | (2) | | | — | (2) | | | — | | | | 0.01 | |
| $ | 12.58 | | | $ | 11.38 | | | $ | 9.73 | | | $ | 16.24 | | | $ | 17.20 | |
| | | | | | | | | | | | | | | | | | | |
| | 11.04 | % | | | 17.36 | % | | | (40.09 | )% | | | (5.58 | )% | | | 2.64 | % |
| | | | | | | | | | | | | | | | | | | |
| | | | | | | | | | | | | | | | | | | |
| $ | 20.01 | | | $ | 28.29 | | | $ | 15.86 | | | $ | 19.54 | | | $ | 26.23 | |
| | | | | | | | | | | | | | | | | | | |
| | 1.71 | % | | | 1.75 | % | | | 1.72 | % | | | 1.87 | % | | | 2.22 | % |
| | 1.59 | % | | | 1.24 | % | | | 1.25 | % | | | 1.45 | % | | | 1.50 | % |
| | | | | | | | | | | | | | | | | | | |
| | (0.27 | )% | | | (0.34 | )% | | | (0.10 | )% | | | (0.62 | )% | | | (1.27 | )% |
| | (0.15 | )% | | | 0.17 | % | | | 0.37 | % | | | (0.20 | )% | | | (0.55 | )% |
| | 8 | % | | | 17 | % | | | 35 | % | | | 111 | % | | | 89 | % |
HENNESSY FUNDS 1-800-966-4354
Financial Highlights
| Hennessy Select SPARX Japan Fund |
For an Institutional Class share outstanding throughout each year
| PER SHARE DATA: | |
| Net asset value, beginning of year | |
| | |
| Income from investment operations: | |
| Ratio of net investment income (loss) | |
| Net realized and unrealized gains (losses) on securities | |
| Total from investment operations | |
| | |
| Less Distributions: | |
| Dividends from net investment income | |
| Dividends from net realized gains | |
| Return of capital | |
| Total distributions | |
| Redemption fees retained | |
| Net asset value, end of year | |
| | |
| TOTAL RETURN | |
| | |
| SUPPLEMENTAL DATA AND RATIOS: | |
| Net assets, end of period (millions) | |
| Ratio of expenses to average net assets | |
| Before expense reimbursement | |
After expense reimbursement(4) | |
| Ratio of net investment income (loss) to average net assets | |
| Before expense reimbursement | |
After expense reimbursement(4) | |
Portfolio turnover rate(5) | |
| (1) | The financial highlights set forth for periods prior to September 17, 2009 represent the historical financial highlights of the SPARX Japan Fund. On September 17, 2009 Hennessy Advisors, Inc., became the investment advisor to the Fund and the Fund changed its name to Hennessy Select SPARX Japan Fund. |
| (2) | Amount is less than $0.01 or $(0.01). |
| (3) | Calculated based on average shares outstanding. |
| (4) | The Advisor agreed to reimburse expenses in order to cap the Institutional Class share expenses. Please refer to Note 4 for more information. |
| (5) | Portfolio turnover is calculated on the basis of the Fund as a whole. |
The accompanying notes are an integral part of these financial statements.
FINANCIAL HIGHLIGHTS — HENNESSY SELECT SPARX JAPAN FUND
| Year Ended October 31, | |
| 2010 | | | 2009(1) | | | 2008 | | | 2007 | | | 2006 | |
| | | | | | | | | | | | | | |
| $ | 11.44 | | | $ | 9.78 | | | $ | 16.33 | | | $ | 17.27 | | | $ | 17.44 | |
| | | | | | | | | | | | | | | | | | | |
| | | | | | | | | | | | | | | | | | | |
| | 0.01 | | | | 0.03 | | | | 0.05 | | | | — | (2) | | | (0.06 | )(3) |
| | 1.23 | | | | 1.66 | | | | (6.60 | ) | | | (0.94 | ) | | | 0.61 | |
| | 1.24 | | | | 1.69 | | | | (6.55 | ) | | | (0.94 | ) | | | 0.55 | |
| | | | | | | | | | | | | | | | | | | |
| | | | | | | | | | | | | | | | | | | |
| | (0.01 | ) | | | (0.03 | ) | | | — | | | | — | | | | (0.56 | ) |
| | — | | | | — | | | | — | | | | — | | | | (0.17 | ) |
| | (0.01 | ) | | | — | | | | — | | | | — | | | | — | |
| | (0.02 | ) | | | (0.03 | ) | | | — | | | | — | | | | (0.73 | ) |
| | — | | | | — | (2) | | | — | (2) | | | — | | | | 0.01 | |
| $ | 12.66 | | | $ | 11.44 | | | $ | 9.78 | | | $ | 16.33 | | | $ | 17.27 | |
| | | | | | | | | | | | | | | | | | | |
| | 11.07 | % | | | 17.37 | % | | | (40.11 | )% | | | (5.44 | )% | | | 2.90 | % |
| | | | | | | | | | | | | | | | | | | |
| | | | | | | | | | | | | | | | | | | |
| $ | 23.57 | | | $ | 25.55 | | | $ | 37.03 | | | $ | 82.94 | | | $ | 105.15 | |
| | | | | | | | | | | | | | | | | | | |
| | 1.45 | % | | | 1.75 | % | | | 1.72 | % | | | 1.67 | % | | | 1.66 | % |
| | 1.40 | % | | | 1.24 | % | | | 1.25 | % | | | 1.25 | % | | | 1.25 | % |
| | | | | | | | | | | | | | | | | | | |
| | 0.02 | % | | | (0.34 | )% | | | (0.10 | )% | | | (0.42 | )% | | | (0.71 | )% |
| | 0.07 | % | | | 0.17 | % | | | 0.37 | % | | | 0.00 | % | | | (0.30 | )% |
| | 8 | % | | | 17 | % | | | 35 | % | | | 111 | % | | | 89 | % |
HENNESSY FUNDS 1-800-966-4354
Financial Highlights
| Hennessy Select SPARX Japan Smaller Companies Fund |
For an Original Class share outstanding throughout each period
| PER SHARE DATA: | |
| Net asset value, beginning of period | |
| | |
| Income from investment operations: | |
| Ratio of net investment income (loss) | |
| Net realized and unrealized gains (losses) on securities | |
| Total from investment operations | |
| | |
| Less Distributions: | |
| Dividends from net investment income | |
| Dividends from net realized gains | |
| Total distributions | |
| Redemption fees retained | |
| Net asset value, end of period | |
| | |
| TOTAL RETURN | |
| | |
| SUPPLEMENTAL DATA AND RATIOS: | |
| Net assets, end of period (millions) | |
| Ratio of expenses to average net assets | |
| Before expense reimbursement | |
After expense reimbursement(7) | |
| Ratio of net investment income (loss) to average net assets | |
| Before expense reimbursement | |
After expense reimbursement(7) | |
| Portfolio turnover rate | |
| (1) | The financial highlights set forth for periods prior to September 17, 2009 represent the historical financial highlights of the SPARX Japan Fund. On September 17, 2009 Hennessy Advisors, Inc., became the investment advisor to the Fund and the Fund changed its name to Hennessy Select SPARX Japan Smaller Companies Fund. In addition, the Investor Class shares were redesignated Original Class shares. |
| (2) | The Fund commenced operations on August 31, 2007 |
| (3) | Calculated based on average shares outstanding. |
| (4) | Amount is less than $0.01 or $(0.01). |
| (7) | The Advisor agreed to reimburse expenses in order to cap the Original Class share expenses. Please refer to Note 4 for more information. |
The accompanying notes are an integral part of these financial statements.
FINANCIAL HIGHLIGHTS — HENNESSY SELECT SPARX JAPAN SMALLER COMPANIES FUND
| | | | | | | | | | Period Ended | |
| Year Ended October 31, | | | October 31, | |
| 2010 | | | 2009(1) | | | 2008 | | | 2007(2) | |
| | | | | | | | | | | |
| $ | 9.74 | | | $ | 6.87 | | | $ | 10.98 | | | $ | 10.00 | |
| | | | | | | | | | | | | | | |
| | — | (4) | | | 0.07 | | | | 0.02 | (3) | | | — | (4) |
| | (0.10 | ) | | | 2.80 | | | | (4.08 | ) | | | 0.98 | |
| | (0.10 | ) | | | 2.87 | | | | (4.06 | ) | | | 0.98 | |
| | | | | | | | | | | | | | | |
| | (0.42 | ) | | | — | | | | (0.07 | ) | | | — | |
| | — | | | | — | | | | — | | | | — | |
| | (0.42 | ) | | | — | | | | (0.07 | ) | | | — | |
| | 0.01 | | | | — | (4) | | | 0.02 | | | | — | |
| $ | 9.23 | | | $ | 9.74 | | | $ | 6.87 | | | $ | 10.98 | |
| | (0.72 | )% | | | 41.78 | % | | | (37.00 | )% | | | 9.80 | %(5) |
| | | | | | | | | | | | | | | |
| | | | | | | | | | | | | | | |
| $ | 15.17 | | | $ | 16.20 | | | $ | 11.74 | | | $ | 5.58 | |
| | | | | | | | | | | | | | | |
| | 2.14 | % | | | 3.10 | % | | | 4.47 | % | | | 9.73 | %(6) |
| | 2.01 | % | | | 1.60 | % | | | 1.60 | % | | | 1.60 | %(6) |
| | | | | | | | | | | | | | | |
| | (0.14 | )% | | | (0.86 | )% | | | (2.60 | )% | | | (8.15 | )%(6) |
| | (0.01 | )% | | | 0.64 | % | | | 0.26 | % | | | (0.02 | )%(6) |
| | 100 | % | | | 138 | % | | | 55 | % | | | 13 | %(5) |
HENNESSY FUNDS 1-800-966-4354
Notes to the Financial Statements
October 31, 2010
1). ORGANIZATION
The Hennessy Select Large Value Fund (the “Large Value Fund”) is organized as a separate investment portfolio or series of Hennessy Funds Trust, a Delaware statutory trust that was organized on September 17, 1992. The Select Large Value Fund is the successor to the Tamarack Value Fund (the “Predecessor Tamarack Fund”) pursuant to a reorganization that took place on March 20, 2009. As a result of the reorganization, holders of the Class A, Class C, Class R and Class S shares of the Tamarack Value Fund received Original Class shares of the Hennessy Select Large Value Fund. The Large Value Fund is an open-end, diversified management investment company registered under the Investment Company Act of 1940, as amended. The investment objective of the Large Value Fund is long-ter m growth of capital and current income.
The Hennessy Select SPARX Japan Fund (the “Japan Fund”) and the Hennessy Select SPARX Japan Smaller Companies Fund (the “Japan Smaller Companies Fund”) are organized as separate investment portfolios or series of Hennessy SPARX Funds Trust, a Massachusetts business trust that was organized on July 24, 1995. The Japan Fund and the Japan Smaller Companies Fund are open-end, diversified management investment companies registered under the Investment Company Act of 1940, as amended. Although these Funds will each be considered a “diversified” mutual fund, the funds may employ a relatively focused investment strategy and may hold securities of fewer issuers than other diversified funds. The investment objective of the Japan Fun d and the Japan Smaller Companies Fund is long-term capital appreciation.
The Large Value Fund, Japan Fund and Japan Smaller Companies Fund collectively represent the Hennessy Select Series Funds (the “Funds”).
The Large Value Fund and Japan Fund offer Original and Institutional Class shares. Each class of shares differs principally in its respective administration, shareholder servicing and transfer agent expenses and sales charges, if any. Each class has identical rights to earnings, assets and voting privileges, except for class-specific expenses and exclusive rights to vote on matters affecting only individual classes. The Japan Smaller Companies Fund offers only Original Class shares.
2). SIGNIFICANT ACCOUNTING POLICIES
The following is a summary of significant accounting policies consistently followed by the Funds in the preparation of the financial statements. These policies are in conformity with U.S. generally accepted accounting principles (“GAAP”).
a). Investment Valuation – Securities which are traded on a national or recognized stock exchange are valued at the last sale price on the securities exchange on which such securities are primarily traded. Exchange-traded securities for which there were no transactions that day and debt securities are valued at the most recent bid prices. Instruments with a remaining
NOTES TO THE FINANCIAL STATEMENTS
maturity of 60 days or less are valued on an amortized cost basis. When a price for an underlying security is not readily available or if a significant event has occurred that indicates the closing price of a security no longer represents the true value of that security, fair value pricing procedures have been adopted by the Board of Trustees of the Funds. Fair value pricing determinations are made in good faith in accordance with these procedures. There are numerous criteria that will be given consideration in determining a fair value of a security. Some of these criteria are: trading volume of security and markets, value of other like securities and news events with direct bearing to security or market. Fair value pricing results in an estimated price that reasonably reflects the current market conditions in order to rate the portfolio holdings such that shareholder transactions receive a fair net asset value.
Fair valuing of foreign securities may be determined with the assistance of a pricing service using correlations between the movement of prices of such securities and indices of domestic securities and other appropriate indicators, such as closing market prices of relevant American Depositary Receipts or futures contracts. The effect of using fair value pricing is that the Funds’ NAV will reflect the affected portfolio securities’ value as determined in the judgment of the Board of Trustees or its designee instead of being determined by the market. Using a fair value pricing methodology to price securities may result in a value that is different from a security’s most recent closing price and from the prices used by other investment companies to calculate their net asset values and are considered level 2 prices in the fair valuation hierarchy. Because the Funds invest in foreign securities, the value of the Funds’ portfolio securities may change on days when you will not be able to purchase or redeem your shares.
Foreign securities are recorded in the financial statements after translation to U.S. dollars based on the applicable exchange rate at the end of the period. The Funds do not isolate that portion of the results of operations resulting from changes in the currency exchange rate from the fluctuations resulting from changes in the market prices of investments.
b). Federal Income Taxes – Provision for federal income taxes or excise taxes has not been made since the Funds have elected to be taxed as a “regulated investment company” and intend to distribute substantially all taxable income to shareholders and otherwise comply with the provisions of the Internal Revenue Code applicable to regulated investment companies. Net investment income and realized gains and losses for federal income tax purposes may differ from that reported on the financial statements because of temporary book and tax basis differences. Temporary differences are primarily the result of the treatment of wash sales for tax reporting purposes. Distributions from net realized gains for book purposes may include short-term capital gains, which are includ ed as ordinary income to shareholders for tax purposes.
Due to inherent differences in the recognition of income, expenses, and realized gains/losses under U.S. generally accepted accounting principles and federal income tax purposes, permanent differences between book and tax basis reporting for the 2010 fiscal year have been identified and appropriately reclassified on the Statement of Assets and Liabilities.
| | | | Accumulated Net | | | Accumulated Net | | | Paid In | |
| | | | Investment Income/(Loss) | | | Realized Gain/(Loss) | | | Capital | |
| | Large Value Fund | | | 67 | | | | (67 | ) | | | — | |
| | Japan Fund | | | 28,134 | | | | 42,728 | | | | (70,862 | ) |
| | Japan Smaller Companies Fund | | | 221,749 | | | | (128,951 | ) | | | (92,798 | ) |
The permanent differences primarily relate to foreign currency gain (loss) reclasses and adjustments related to passive foreign investment companies.
| c). | Income and Expenses – Dividend income is recognized on the ex-dividend date or as soon as information is available to the Funds and interest income is recognized on an accrual basis. Income, expenses (other than expenses attributable to a specific class), and realized and unrealized gains or losses on investments are allocated to each class of shares based on its respective net assets. |
d). Distributions to Shareholders – Dividends from net investment income and distributions of net realized capital gains for the Funds, if any, are declared and paid out annually, usually in November or December of each year.
e). Security Transactions – Investment and shareholder transactions are recorded on the trade date. The Funds determine the gain or loss realized from the investment transactions by comparing the original cost of the security lot sold with the net sale proceeds. Discounts and premiums on securities purchased are accreted/amortized over the life of the respective security.
f). Use of Estimates – The preparation of financial statements in conformity with GAAP requires management to make estimates and assumptions that affect the reported amounts of assets and liabilities and disclosure of contingent assets and liabilities at the date of the financial statements and the reported change in net assets during the reporting period. Actual results could differ from those estimates.
g). Share Valuation – The net asset value (“NAV”) per share of each Fund is calculated by dividing the sum of the value of the securities held, plus cash or other assets, minus all liabilities (including estimated accrued expenses) by the total number of shares outstanding, rounded to the nearest cent. The Funds’ shares will not be priced on the days on which the New York Stock Exchange is closed for trading. The offering and redemption price per share for each Fund is equal to each Fund’s net asset value per share. The Japan Fund and Japan Smaller Companies Funds charged a 2.00% redemption fee on shares held less than 60 days through January 29, 2010. These fees were retained by each Fund and treated as additional paid-in-capital and allocated to each respective class of shares (if applicable).
h). Foreign Currency – Values of investments denominated in foreign currencies are converted into U.S. dollars using the spot market rate of exchange at the time of valuation. Purchases and sales of investments and income are translated into U.S. dollars using the spot market rate of
NOTES TO THE FINANCIAL STATEMENTS
exchange prevailing on the respective dates of such transactions. The effect of changes in foreign exchange rates on realized and unrealized security gains and losses is reflected as a component of such gains or losses. Foreign investments present additional risks due to currency fluctuations, economic and political factors, lower liquidity, government regulations, differences in accounting standards and other factors.
i). Forward Contracts – The Funds may enter into forward currency contracts to reduce their exposure to changes in foreign currency exchange rates on their foreign holdings and to lock in the U.S. dollar cost of firm purchase and sale commitments for securities denominated in foreign currencies. A forward currency contract is a commitment to purchase or sell a foreign currency at a future date at a negotiated forward rate. The gain or loss arising from the difference between the U.S. dollar cost of the original contract and the value of the foreign currency in U.S. dollars upon closing of such contract is included in net realized gain or loss from foreign currency transactions.
The Funds may invest in, or enter into, derivatives, such as options, futures contracts, options on futures contracts and swaps, for a variety of reasons, including to hedge certain risks, to provide a substitute for purchasing or selling particular securities or to increase potential income gain. Derivatives may provide a cheaper, quicker or more specifically focused way for a Fund to invest than “traditional” securities would. The main purpose of utilizing these derivative instruments is for hedging purposes.
j). Repurchase Agreements – The Funds may enter into repurchase agreements with member banks or security dealers of the Federal Reserve whom the investment advisor deems creditworthy. The repurchase price generally equals the price paid by the Fund plus interest negotiated on the basis of current short-term rates.
Securities pledged as collateral for repurchase agreements are held by the custodian bank until the respective agreements mature. Provisions of the repurchase agreements ensure that the market value of the collateral, including accrued interest thereon, is sufficient, in the event of default of the counterparty. If the counterparty defaults and the value of the collateral declines or if the counterparty enters an insolvency proceeding, realization of the collateral by the Fund may be delayed or limited.
k). Accounting for Uncertainty in Income Taxes – The Funds have adopted financial reporting rules regarding recognition and measurement of tax positions taken or expected to be taken on a tax return. The Funds have reviewed all open tax years and major jurisdictions and concluded that there is no impact on the Funds’ net assets and no tax liability resulting from unrecognized tax benefits relating to uncertain income tax positions taken or expected to be taken on a tax return. As of October 31, 2010, open Federal and state tax years for the Large Value Fund include the tax years ended September 30, 2007 through 2009 and the tax period ended October 31, 2009. As of October 31, 2010, open Federal and state tax years
HENNESSY FUNDS 1-800-966-4354
for the Japan Fund and Japan Smaller Companies Fund include the tax years ended October 31, 2007 through 2009.
l). Derivatives – The Funds have adopted the financial accounting reporting rules as required by the Derivatives and Hedging Topic of the FASB Accounting Standards Codification (“FASB ASC”). The Funds are required to include enhanced disclosure that enables investors to understand how and why an entity uses derivatives, how derivatives are accounted for, and how derivatives instruments affect any entity’s results of operations and financial position. During the year ended October 31, 2010, the Funds did not hold any derivative instruments.
m). Events Subsequent to the Fiscal Period End – The Funds have adopted financial reporting rules regarding subsequent events which requires an entity to recognize in the financial statements the effects of all subsequent events that provide additional evidence about conditions that existed at the date of the balance sheet. Management has evaluated the Funds’ related events and transactions that occurred subsequent to October 31, 2010, through the date of issuance of the Funds’ financial statements. There were no events or transactions that occurred during this period that materially impacted the amounts or disclosures in the Funds’ financial statements.
n.) New Accounting Pronouncement – In January 2010, the FASB issued Accounting Standards Update “Improving Disclosures about Fair Value Measurements” (“ASU”). The ASU requires enhanced disclosures about a) transfers into and out of Levels 1 and 2, and b) purchases, sales, issuances, and settlements on a gross basis relating to Level 3 measurements. The first disclosure is effective for the first reporting period beginning after December 15, 2009, and for interim periods within those fiscal years. There were no significant transfers into and out of Levels 1 and 2 during the current period presented.
The second disclosure will become effective for fiscal years beginning after December 15, 2010, and for interim periods within those fiscal years. Management is currently evaluating the impact this disclosure may have on the Fund’s financial statements.
3). INVESTMENT TRANSACTIONS
Purchases and sales of investment securities (excluding government and short-term investments) during the following fiscal periods were as follows:
| | | Purchases | | | Sales | |
| Large Value Fund | | $ | 191,272,857 | | | $ | 204,001,648 | |
| Japan Fund | | $ | 3,972,415 | | | $ | 18,576,720 | |
| Japan Smaller Companies Fund | | $ | 14,859,631 | | | $ | 15,653,359 | |
There were no purchases or sales of long term U.S. Government securities in the Funds during the year ended October 31, 2010.
4). INVESTMENT MANAGEMENT FEE AND OTHER TRANSACTIONS WITH AFFILIATES
Hennessy Advisors, Inc. (the “Advisor”) is the advisor of the Funds. The Advisor provides the Funds with investment management services under an Investment Advisory Agreement. The Advisor furnishes all investment advice, office space, facilities, and provides most of the personnel needed by the Funds. As
NOTES TO THE FINANCIAL STATEMENTS
compensation for its services, the Advisor is entitled to a monthly fee from each Fund. The fee is based upon the average daily net assets of the Funds at the annual rate of:
| Large Value Fund | 0.85% |
| Japan Fund | 1.00% |
| Japan Smaller Companies Fund | 1.20% |
The Advisor has delegated the day to day management of the Large Value Fund to a Sub-Advisor, RBC Global Asset Management (U.S.), Inc. (“RBC”). The Advisor has delegated the day to day management of the Japan and Japan Smaller Companies Funds to a Sub-Advisor, SPARX Asset Management Co. Ltd. (“SPARX”). The Advisor pays the Sub-Advisor fees for each of the Funds from its own assets and these fees are not an additional expense of the Funds.
The Advisor had agreed to absorb expenses to the extent that the total annual operating expenses (excluding all Federal, state and local taxes, interest, brokerage commissions, acquired fund fees and expenses and other costs incurred in connection with the purchase and sale of securities and extraordinary items) do not exceed 1.30% and 0.98% of the Large Value Fund’s net assets for the Original Class and Institutional Class shares, respectively. This expense limitation agreement for the Original Class shares of the Large Value Fund expired on March 31, 2010. The expense limitation agreement for the Institutional Class shares of the Large Value Fund can only be terminated by the Board of Trustees. Additionally, the Advisor had agreed to waive its fees a nd absorb expenses to the extent that the total annual operating expenses (excluding all federal, state and local taxes, interest, brokerage commissions, acquired fund fees and expenses and other costs incurred in connection with the purchase and sale of securities and extraordinary items) did not exceed 1.25% of the Japan Fund’s net assets for both the Original Class shares and Institutional Class shares and 1.60% of the net assets of the Japan Smaller Companies Fund, Original Class shares. These expense limitation agreements for the Japan Fund and the Japan Smaller Companies Fund expired on February 28, 2010. For a period of three years after the year in which the Advisor waives or reimburses expenses, the Advisor may seek reimbursement from the Fund to the extent that total annual fund operating expenses are less than the expense limitation in effect at the time of the waiver or reimbursement. The Advisor reimbursed expenses of $38,444, $50,340 and $19,527 for the Large Value, Japan and Japan Smaller Companies Funds, respectively, for the year ended October 31, 2010. As of October 31, 2010, cumulative expenses subject to potential recovery to the aforementioned conditions and year of expiration are as follows:
| | | | Oct. 31, 2011 | | | Oct. 31, 2012 | | | Oct. 31, 2013 | | | Total | |
| | Large Value Fund – Orig. Class | | $ | 91,061 | | | $ | 7,641 | | | $ | 38,444 | | | $ | 137,146 | |
| | Large Value Fund – Inst. Class | | $ | 2,239 | | | $ | 6 | | | $ | — | | | $ | 2,245 | |
| | Japan Fund – Orig. Class | | $ | — | | | $ | — | | | $ | 37,425 | | | $ | 37,425 | |
| | Japan Fund – Inst. Class | | $ | — | | | $ | — | | | $ | 12,915 | | | $ | 12,915 | |
| | Japan Smaller Companies Fund – Orig. Class | | $ | — | | | $ | — | | | $ | 19,527 | | | $ | 19,527 | |
The Board of Trustees has approved a Shareholder Servicing Plan for the Original Class shares of the Large Value Fund which was instituted to compensate the Advisor for the non-investment management services it provides to the Fund. The Plan provides for a monthly fee paid to the Advisor at an annual rate of
HENNESSY FUNDS 1-800-966-4354
0.10% of the average daily net assets of the Original Class shares of the Large Value Fund. On June 1, 2010, the Japan and Japan Smaller Companies Funds adopted a shareholder servicing plan which provides a monthly fee paid to the Advisor at an annual rate of 0.10% of the average daily net assets of the Original Class shares of the Japan and Japan Smaller Companies Funds, respectively.
The Funds have entered into agreements with various brokers, dealers and financial intermediaries in connection with the sale of shares of the Funds. The agreements provide for periodic payments by the Funds to the brokers, dealers and financial intermediaries for providing certain shareholder maintenance services (sub-transfer agent expenses). These shareholder services include: the pre-processing and quality control of new accounts, shareholder correspondence, answering customer inquiries regarding account status and facilitating shareholder telephone transactions. Fees paid by the Large Value, Japan and Japan Smaller Companies Funds to various brokers, dealers and financial intermediaries for the year ended October 31, 2010, were $103,577, $88,388, and $2 7,948, respectively.
U.S. Bancorp Fund Services, LLC (the “Administrator”) acts as the Funds’ administrator under an Administration Agreement. Administrative services under this agreement include custody, distribution, fund accounting, fund administration and transfer agent services. In addition, the Administrator prepares various federal and state regulatory filings, reports and returns for the Fund; prepares reports and materials to be supplied to the directors; monitors the activities of the Funds’ custodian, transfer agent and accountants; coordinates the preparation and payment of the Funds’ expenses and reviews the Funds’ expense accruals. Fees paid to U.S. Bancorp Fund Services, LLC for the year ended October 31, 2010, were $358,366, $140,972 and $39,113, for the Large Value, Japan and Japan Smaller Companies Funds, respectively. The Administrator has voluntarily waived all or a portion of its administration fees allocated to the Institutional Class shares of the Large Value Fund. The administration fees voluntarily waived by the Administrator during the year ended October 31, 2010 were $83.
Quasar Distributors, LLC (“Quasar”) acts as the Funds’ principal underwriter in a continuous public offering of the Funds’ shares. Quasar is an affiliated company of U.S. Bank, N.A.
NOTES TO THE FINANCIAL STATEMENTS
5). FEDERAL TAX INFORMATION
The following balances for the Funds are as of October 31, 2010:
| | | | | | | | | Japan | |
| | | Large | | | | | | Smaller | |
| | | Value | | | Japan | | | Companies | |
| | | Fund | | | Fund | | | Fund | |
| Cost of investments for tax purposes | | $ | 115,270,414 | | | $ | 37,383,357 | | | $ | 14,831,609 | |
| Gross tax unrealized appreciation | | | 18,200,874 | | | | 7,183,919 | | | | 1,979,812 | |
| Gross tax unrealized depreciation | | | (2,268,578 | ) | | | (1,866,093 | ) | | | (1,356,296 | ) |
| Net tax unrealized appreciation | | | | | | | | | | | | |
| (depreciation) on investments | | | 15,932,296 | | | | 5,317,826 | | | | 623,516 | |
| Undistributed ordinary income | | $ | 682,446 | | | $ | — | | | $ | — | |
| Undistributed long-term capital gains | | $ | — | | | $ | — | | | $ | — | |
| Total distributable earnings | | $ | 682,446 | | | $ | — | | | $ | — | |
| Other accumulated gains (losses) | | $ | (50,527,691 | ) | | $ | (34,057,959 | ) | | $ | (2,116,351 | ) |
| Total accumulated earnings (losses) | | $ | (33,912,949 | ) | | $ | (28,740,133 | ) | | $ | (1,492,835 | ) |
At October 31, 2010, the Large Value Fund had tax basis capital losses of $50,527,691, to offset future capital gains. Of such losses, $19,583,141 expire October 31, 2016 and $30,944,550 expire on October 31, 2017. Additionally, the Large Value Fund had no post-October loss deferrals as of October 31, 2010.
At October 31, 2010, the Japan Fund had tax basis capital losses of $34,116,747, to offset future capital gains. Of such losses, $967,738 expire October 31, 2014, $5,345,663 expire on October 31, 2015, $6,231,544 expire October 31, 2016, $15,450,664 expire October 31, 2017, and $6,121,138 expire October 31, 2018. Additionally, the Japan Fund had no post-October loss deferrals as of October 31, 2010.
At October 31, 2010, the Japan Smaller Companies Fund had tax basis capital losses of $2,122,189, to offset future capital gains. The losses expire on October 31, 2017. Additionally, the Japan Smaller Companies Fund had no post-October loss deferrals as of October 31, 2010.
The tax character of distributions paid during 2010 and 2009 for the Funds were as follows:
| | | | Year Ended | | | One Month Ended | | | Year Ended | |
| | Large Value Fund | | October 31, 2010 | | | October 31, 2009* | | | September 30, 2009 | |
| | Ordinary income | | $ | 1,608,137 | | | $ | — | | | $ | 3,122,632 | |
| | Long-term capital gain | | | — | | | | — | | | | — | |
| | | | $ | 1,608,137 | | | $ | — | | | $ | 3,122,632 | |
| * | The Large Value Fund changed its fiscal year end to October 31 from September 30. |
| | | | Year Ended | | | Year Ended | | |
| | Japan Fund | | October 31, 2010 | | | October 31, 2009 | | |
| | Ordinary income | | $ | 53,363 | | | $ | 175,178 | | |
| | Long-term capital gain | | | — | | | | — | | |
| | Return of capital | | | 50,003 | | | | — | | |
| | | | $ | 103,366 | | | $ | 175,178 | | |
HENNESSY FUNDS 1-800-966-4354
| | Japan Smaller | | Year Ended | | | Year Ended | | |
| | Companies Fund | | October 31, 2010 | | | October 31, 2009 | | |
| | Ordinary income | | $ | 675,389 | | | $ | — | | |
| | Long-term capital gain | | | — | | | | — | | |
| | | | $ | 675,389 | | | $ | — | | |
6). FUND REORGANIZATION
On March 20, 2009 the shareholders of the Tamarack Value Fund approved the agreement and plan of reorganization providing for the transfer of assets of the Tamarack Value Fund to the Hennessy Select Large Value Fund and the assumption of the liabilities of the Tamarack Value Fund by the Hennessy Select Large Value Fund. The following table illustrates the specifics of the reorganization:
| Acquired | Shares issued to | Acquiring | | |
| Fund | Shareholders of | Fund | Combined | Tax Status |
| Net Assets | Acquired Fund | Net Assets | Net Assets | of Transfer |
| $106,344,111(1) | 7,462,745 | — | $106,344,111 | Non-taxable |
| (1) | Includes accumulated realized losses and unrealized depreciation in the amounts of ($22,268,596) and ($20,869,681) respectively. |
REPORT OF INDEPENDENT REGISTERED PUBLIC ACCOUNTING FIRM
Report of Independent Registered Public Accounting Firm
The Shareholders and Board of Directors of
The Hennessy Funds Trust and The Hennessy SPARX Funds Trust:
We have audited the accompanying statements of assets and liabilities of the Hennessy Select Large Value Fund, Hennessy Select SPARX Japan Fund and Hennessy Select SPARX Japan Smaller Companies Fund, including the schedules of investments, as of October 31, 2010, and the related statements of operations for the year then ended, and the statements of changes in net assets and the financial highlights for each of the periods presented in the two-year period then ended (year ended October 31, 2010, month ended October 31, 2009 and year ended September 30, 2009 for Hennessy Select Large Value Fund). These financial statements and financial highlights are the responsibility of management. Our responsibility is to express an opinion on these financial statements and financial highlights based on our audits. The financial highlights for the peri ods presented through September 30, 2008 of the Hennessy Select Large Value Fund were audited by other auditors whose report dated November 26, 2008 expressed an unqualified opinion on those financial highlights. The financial highlights for the periods presented through October 30, 2008 of the Hennessy Select SPARX Japan Fund and Hennessy Select SPARX Japan Smaller Companies Fund were audited by other auditors whose report dated December 10, 2008 expressed an unqualified opinion on those financial highlights.
We conducted our audits in accordance with the standards of the Public Company Accounting Oversight Board (United States). Those standards require that we plan and perform the audit to obtain reasonable assurance about whether the financial statements and financial highlights are free of material misstatement. An audit includes examining, on a test basis, evidence supporting the amounts and disclosures in the financial statements. Our procedures included confirmation of securities owned as of October 31, 2010 by correspondence with the custodian and brokers or by other appropriate auditing procedures. An audit also includes assessing the accounting principles used and significant estimates made by management, as well as evaluating the overall financial statement presentation. We believe that our audits provide a reasonable basi s for our opinion.
In our opinion, the financial statements and financial highlights referred to above present fairly, in all material respects, the financial position of the Hennessy Select Large Value Fund, Hennessy Select SPARX Japan Fund and Hennessy Select SPARX Japan Smaller Companies Fund as of October 31, 2010, and the results of their operations, the changes in their net assets and the financial highlights for each of the periods described in the first paragraph above, in conformity with U.S. generally accepted accounting principles.
Milwaukee, Wisconsin
December 22, 2010
HENNESSY FUNDS 1-800-966-4354
The business and affairs of the Funds are managed under the direction of the Funds’ Board of Directors. Information pertaining to the Directors and Officers of the Funds is set forth below. The Funds’ Statement of Additional Information includes additional information about the Funds’ Directors and Officers and is available, without charge, upon request by calling 1-800-966-4354.
| | Position(s) | Term of Office |
| | Held with | and Length of |
| Name, Age and Address | the Companies | Time Served |
| “Disinterested Persons” | | |
| J. Dennis DeSousa | Director/Trustee | Indefinite, until |
| Age: 74 | | successor elected |
| Address: | | |
| c/o Hennessy Advisors, Inc. | | HFT: Served since July 2005 |
| 7250 Redwood Blvd. | | HSFT: Served since September 2009 |
| Suite 200 | | |
| Novato, CA 94945 | | |
| | | |
| Robert T. Doyle | Director/Trustee | Indefinite, until |
| Age: 63 | | successor elected |
| Address: | | |
| c/o Hennessy Advisors, Inc. | | HFT: Served since July 2005 |
| 7250 Redwood Blvd. | | HSFT: Served since September 2009 |
| Suite 200 | | |
| Novato, CA 94945 | | |
| | | |
| Gerald P. Richardson | Director/Trustee | Indefinite, until |
| Age: 65 | | successor elected |
| Address: | | |
| c/o Hennessy Advisors, Inc. | | HFT: Served since July 2005 |
| 7250 Redwood Blvd. | | HSFT: Served since September 2009 |
| Suite 200 | | |
| Novato, CA 94945 | | |
| | | |
| “Interested Persons” (as defined in the 1940 Act) | | |
Neil J. Hennessy(1) | Director/Trustee | Director/Trustee: |
| Age: 54 | President | Indefinite, until |
| Address: | and Chairman | successor elected |
| c/o Hennessy Advisors, Inc. | of the Board | |
| 7250 Redwood Blvd. | | HFT: Served since July 2005 |
| Suite 200 | | HSFT: Served since September 2009 |
| Novato, CA 94945 | | |
| | | Officer (Chairman of the Board): |
| | | 1 year term |
| | | |
| | | HFT: Served since June 2008 |
| | | HSFT: Served since September 2009 |
Key:
HFT = Hennessy Funds Trust
HSFT = Hennessy SPARX Funds Trust
DIRECTORS AND OFFICERS OF THE FUNDS
| | Number of Portfolios in the | |
| Principal Occupation(s) | Fund Complex Overseen | Other Directorships |
| During Past 5 Years | by Director/Trustee | Held by Director |
| | | |
| Currently a real estate investor. | 10 | None. |
| | | |
| | | |
| | | |
| | | |
| | | |
| | | |
| | | |
| Currently the Sheriff of Marin County, | 10 | None. |
| California (since 1996) and has been | | |
| employed in the Marin County Sheriff’s | | |
| Office in various capacities since 1969. | | |
| | | |
| | | |
| | | |
| | | |
| Formerly the Chief Executive Officer and | 10 | None. |
| owner of ORBIS Payment Services. | | |
| Mr. Richardson is now an independent | | |
| consultant in the securities industries. | | |
| | | |
| | | |
| | | |
| | | |
| | | |
| President, Chairman, CEO and Co-Portfolio | 10 | Director of Hennessy |
| Manager of Hennessy Advisors, Inc., the | | Advisors, Inc. |
| Hennessy Funds’ investment advisor, since | | |
| 1989; President of HMFI and HFI from 1996 | | |
| through June 2008, and President of HFT | | |
| from 2005 through June 2008. | | |
HENNESSY FUNDS 1-800-966-4354
| | Position(s) | Term of Office |
| | Held with | and Length of |
| Name, Age and Address | the Companies | Time Served |
Frank Ingarra, Jr.(1) | Co-Portfolio | 1 year term |
| Age: 39 | Manager and | |
| Address: | Vice President | HFT: Since July 2005 |
| c/o Hennessy Advisors, Inc. | | HSFT: Since September 2009 |
| 7250 Redwood Blvd. | | |
| Suite 200 | | |
| Novato, CA 94945 | | |
| | | |
Joseph T. Fahy(1) | Chief Compliance | 1 year term |
| Age: 33 | Officer | |
| Address: | | HFT: Since June 2010 |
| c/o Hennessy Advisors, Inc. | | HSFT: Since June 2010 |
| 7250 Redwood Blvd. | | |
| Suite 200 | | |
| Novato, CA 94945 | | |
| | | |
Teresa M. Nilsen(1) | Executive Vice | 1 year term |
| Age: 44 | President and | |
| Address: | Treasurer | HFT: Since July 2005 |
| c/o Hennessy Advisors, Inc. | | HSFT: Since September 2009 |
| 7250 Redwood Blvd. | | |
| Suite 200 | | |
| Novato, CA 94945 | | |
| | | |
| | | |
| | | |
Daniel B. Steadman(1) | Executive Vice | 1 year term |
| Age: 54 | President and | |
| Address: | Secretary | HFT: Since July 2005 |
| c/o Hennessy Advisors, Inc. | | HSFT: Since September 2009 |
| 7250 Redwood Blvd. | | |
| Suite 200 | | |
| Novato, CA 94945 | | |
DIRECTORS AND OFFICERS OF THE FUNDS
| | Number of Portfolios in the | |
| Principal Occupation(s) | Fund Complex Overseen | Other Directorships |
| During Past 5 Years | by Director/Trustee | Held by Director |
| Mr. Ingarra Co-Portfolio Manager for | N/A | None. |
| Hennessy Advisors, Inc., the Funds’ | | |
| investment advisor. Mr. Ingarra has been | | |
| with the Hennessy Funds and Hennessy | | |
| Advisors, Inc. since 2004. He is Vice | | |
| President of the Hennessy Funds. | | |
| | | |
| | | |
| Chief Compliance Officer for the Hennessy | N/A | None. |
| Funds since 2010. Mr. Fahy has been with | | |
| the Hennessy Funds since 2005 and has | | |
| held a number of roles in the Sales and | | |
| Finance Departments. | | |
| | | |
| | | |
| | | |
| Currently Executive Vice President, Chief | N/A | Director of Hennessy |
| Financial Officer and Secretary of Hennessy | | Advisors, Inc. |
| Advisors, Inc., the Funds’ investment advisor; | | |
| Ms. Nilsen has been the corporate secretary | | |
| and a financial officer of Hennessy Advisors, | | |
| Inc. since 1989; Ms. Nilsen has been an | | |
| officer of The Hennessy Funds since 1996, | | |
| currently she is Executive Vice President | | |
| and Treasurer. | | |
| | | |
| Executive Vice President of Hennessy | N/A | Director of Hennessy |
| Advisors, Inc., the Funds’ investment advisor, | | Advisors, Inc. |
| from 2000 to the present; Mr. Steadman has | | |
| been Executive Vice President and Secretary | | |
| of The Hennessy Funds since 2000. | | |
HENNESSY FUNDS 1-800-966-4354
| | Position(s) | Term of Office |
| | Held with | and Length of |
| Name, Age and Address | the Companies | Time Served |
Tania A. Kelley(1) | Vice President | 1 year term |
| Age: 45 | of Marketing | |
| Address: | | HFT: Since July 2005 |
| c/o Hennessy Advisors, Inc. | | HSFT: Since September 2009 |
| 7250 Redwood Blvd. | | |
| Suite 200 | | |
| Novato, CA 94945 | | |
| | | |
Ana Miner(1) | Vice President | 1 year term |
| Age: 52 | of Operations | |
| Address: | | HFT: Since July 2005 |
| c/o Hennessy Advisors, Inc. | | HSFT: Since September 2009 |
| 7250 Redwood Blvd. | | |
| Suite 200 | | |
| Novato, CA 94945 | | |
| | | |
Brian Peery(1) | Vice President | 1 year term |
| Age: 41 | of Sales | |
| Address: | | HFT: Since July 2005 |
| c/o Hennessy Advisors, Inc. | | HSFT: Since September 2009 |
| 7250 Redwood Blvd. | | |
| Suite 200 | | |
| Novato, CA 94945 | | |
| (1) | All officers of the Hennessy Funds and employees of the Advisor are Interested Persons of the Hennessy Funds. |
DIRECTORS AND OFFICERS OF THE FUNDS
| | Number of Portfolios in the | |
| Principal Occupation(s) | Fund Complex Overseen | Other Directorships |
| During Past 5 Years | by Director/Trustee | Held by Director |
| Has been employed by Hennessy | N/A | None. |
| Advisors, Inc., the Funds’ investment | | |
| advisor, since October 2003. | | |
| | | |
| | | |
| | | |
| | | |
| | | |
| Has been employed by Hennessy | N/A | None. |
| Advisors, Inc., the Funds’ investment | | |
| advisor, since 1998. | | |
| | | |
| | | |
| | | |
| | | |
| | | |
| Has been employed by Hennessy | N/A | None. |
| Advisors, Inc., the Funds’ investment | | |
| advisor, since June 2002. | | |
HENNESSY FUNDS 1-800-966-4354
October 31, 2010
As a shareholder of the Funds, you incur two types of costs: (1) transaction costs, including sales charges (loads) on purchase payments, reinvested dividends, or other distributions; redemption fees; and exchange fees; and (2) ongoing costs, including management fees; service fees; and other Fund expenses. This Example is intended to help you understand your ongoing costs (in dollars) of investing in each of the Funds and to compare these costs with the ongoing costs of investing in other mutual funds. The Example is based on an investment of $1,000 invested at the beginning of the period and held for the entire period from May 1, 2010 through October 31, 2010.
Actual Expenses
The first set of lines of the table below provide information about actual account values and actual expenses. Although the Funds charge no sales loads or transaction fees, you will be assessed fees for outgoing wire transfers, returned checks and stop payment orders at prevailing rates charged by U.S. Bancorp Fund Services, LLC, the Funds’ transfer agent. If you request that a redemption be made by wire transfer, currently a $15.00 fee is charged by the Funds’ transfer agent. IRA accounts will be charged a $15.00 annual maintenance fee (not to exceed $30 per social security number). The example below includes, but is not limited to, management fees, shareholder servicing fees, fund accounting, custody and transfer agent fees. However, the example below does not include portfolio trading commissions and r elated expenses, interest expense or dividends on short positions taken by the Fund and other extraordinary expenses as determined under generally accepted accounting principles. You may use the information within these lines, together with the amount you invested, to estimate the expenses that you paid over the six-month period. Simply divide your account value by $1,000 (for example, an $8,600 account value divided by $1,000 = 8.6), then multiply the result by the number in the first line under the heading entitled “Expenses Paid During Period” to estimate the expenses you paid on your account during this period.
Hypothetical Example for Comparison Purposes
The second set of lines within the table below provide information about hypothetical account values and hypothetical expenses based on the Funds’ actual expense ratios and an assumed rate of return of 5% per year before expenses, which is not the Funds’ actual return. The hypothetical account values and expenses may not be used to estimate the actual ending account balance or expenses you paid for the period. You may use this information to compare the ongoing costs of investing in the Funds and other funds. To do so, compare this 5% hypothetical example with the 5% hypothetical examples that appear in the shareholder reports of the other funds. Please note that the expenses shown in the table are meant to highlight your ongoing costs only and do not reflect any transactional costs, such as sales charges (loads), o r exchange fees. Therefore, the second line of the table is useful in comparing ongoing costs only, and will not help you determine the relative total costs of owning different funds. In addition, if these transactional costs were included, your costs would have been higher.
| | | Beginning | | | Ending | | | Expenses Paid | |
| | | Account Value | | | Account Value | | | During Period(1) | |
| Original Class | | 5/1/10 | | | 10/31/10 | | | 5/1/10 – 10/31/10 | |
| | | | | | | | | | |
| Actual | | | | | | | | | |
| Large Value Fund – Original Class | | $ | 1,000.00 | | | $ | 967.10 | | | $ | 7.09 | |
| Japan Fund – Original Class | | $ | 1,000.00 | | | $ | 1,037.90 | | | $ | 9.09 | |
| Japan Smaller Companies | | | | | | | | | | | | |
| Fund – Original Class | | $ | 1,000.00 | | | $ | 926.70 | | | $ | 10.64 | |
| | | | | | | | | | | | | |
| Hypothetical (5% return | | | | | | | | | | | | |
| before expenses) | | | | | | | | | | | | |
| Large Value Fund – Original Class | | $ | 1,000.00 | | | $ | 1,018.00 | | | $ | 7.27 | |
| Japan Fund – Original Class | | $ | 1,000.00 | | | $ | 1,016.28 | | | $ | 9.00 | |
| Japan Smaller Companies | | | | | | | | | | | | |
| Fund – Original Class | | $ | 1,000.00 | | | $ | 1,014.77 | | | $ | 11.12 | |
| (1) | Expenses are equal to the Large Value Fund’s expense ratio of 1.43%, the Japan Fund’s expense ratio of 1.77%, and the Smaller Companies Fund’s expense ratio of 2.19%, multiplied by the average account value over the period, multiplied by 184/365 days (to reflect one-half year period). |
| | | Beginning | | | Ending | | | Expenses Paid | |
| | | Account Value | | | Account Value | | | During Period(2) | |
| Institutional Class | | 5/1/10 | | | 10/31/10 | | | 5/1/10 – 10/31/10 | |
| | | | | | | | | | |
| Actual | | | | | | | | | |
| Large Value Fund – Institutional Class | | $ | 1,000.00 | | | $ | 995.25 | | | $ | 4.93 | |
| Japan Fund – Institutional Class | | $ | 1,000.00 | | | $ | 1,037.60 | | | $ | 7.60 | |
| | | | | | | | | | | | | |
| Hypothetical (5% return | | | | | | | | | | | | |
| before expenses) | | | | | | | | | | | | |
| Large Value Fund – Institutional Class | | $ | 1,000.00 | | | $ | 1,003.16 | | | $ | 4.95 | |
| Japan Fund – Institutional Class | | $ | 1,000.00 | | | $ | 1,017.74 | | | $ | 7.53 | |
| (2) | Expenses are equal to the Large Value Fund’s expense ratio of 0.98%, and the Japan Fund’s expense ratio of 1.48%, multiplied by the average account value over the period, multiplied by 184/365 days (to reflect one-half year period). |
HENNESSY FUNDS 1-800-966-4354
A description of the policies and procedures that the Funds use to determine how to vote proxies relating to portfolio securities is available without charge: (1) by calling 1-800-966-4354; (2) on the Hennessy Funds website at www.hennessyfunds.com; or (3) on the U.S. Securities and Exchange Commission’s website at www.sec.gov. Hennessy Funds’ proxy voting record is available on the SEC’s website at www.sec.gov no later than August 31 for the prior 12 months ending June 30.
Quarterly Filings on Form N-Q
The Fund files its complete schedule of portfolio holdings with the SEC for the first and third quarters of each fiscal year on Form N-Q. The Fund’s Form N-Q will be available on the SEC’s website at www.sec.gov. The Fund’s Form N-Q may be reviewed and copied at the SEC’s Public Reference Room in Washington, DC and information on the operation of the Public Reference Room may be obtained by calling 1-800-SEC-0330. Information included in the Fund’s N-Q will also be available upon request by calling 1-800-966-4354.
Federal Tax Distribution Information (Unaudited)
The Large Value, Japan and Japan Smaller Companies Funds designate 100%, 100% and 100%, respectively, of the dividends declared from net investment income during the year ended October 31, 2010, as qualified dividend income under the Jobs Growth and Tax Reconciliation Act of 2003.
For the year ended October 31, 2010, 100%, 0% and 0%, of the ordinary distributions paid by the Large Value, Japan and Japan Smaller Companies Funds qualify for the dividend received deduction available to corporate shareholders. All of the dividend income received by the Japan and Japan Smaller Companies Funds was from foreign investments which does not qualify for the dividend received deduction available to corporate shareholders.
ADDITIONAL INFORMATION AND PRIVACY POLICY
Privacy Policy
We collect the following non-public personal information about you:
• information we receive from you on or in applications or other forms, correspondence, or conversations, including, but not limited to, your name, address, phone number, social security number, assets, income and date of birth;
and
• information about your transactions with us, our affiliates, or others, including, but not limited to, your account number and balance, payment history, parties to transactions, cost basis information and other financial information.
We do not disclose any non-public personal information about our current or former shareholders to nonaffiliated third parties, except as permitted by law. For example, we are permitted by law to disclose all of the information we collect, as described above, to our Transfer Agent to process your transactions. Furthermore, we restrict access to your non-public personal information to those persons who require such information to provide products or services to you. We maintain physical, electronic and procedural safeguards that comply with federal standards to guard your non-public personal information.
In the event that you hold shares of the Fund through a financial intermediary, including, but not limited to, a broker-dealer, bank or trust company, the privacy policy of your financial intermediary would govern how your non-public personal information would be shared with nonaffiliated third parties.
HENNESSY FUNDS 1-800-966-4354
For information, questions
or assistance, please call
The Hennessy Funds
1-800-966-4354 or 1-415-899-1555
INVESTMENT ADVISOR
Hennessy Advisors, Inc.
7250 Redwood Blvd., Suite 200
Novato, California 94945
ADMINISTRATOR, TRANSFER
AGENT, DIVIDEND PAYING
AGENT & SHAREHOLDER
SERVICING AGENT
U.S. Bancorp Fund Services, LLC
P.O. Box 701
Milwaukee, Wisconsin 53201-0701
CUSTODIAN
U.S. Bank N.A.
Custody Operations
1555 North River Center Dr., Suite 302
Milwaukee, Wisconsin 53212
TRUSTEES
Neil J. Hennessy
Robert T. Doyle
J. Dennis DeSousa
Gerald P. Richardson
COUNSEL
Foley & Lardner LLP
777 East Wisconsin Avenue
Milwaukee, Wisconsin 53202-5306
INDEPENDENT REGISTERED
PUBLIC ACCOUNTING FIRM
KPMG LLP
777 East Wisconsin Avenue, 15th Floor
Milwaukee, Wisconsin 53202
DISTRIBUTOR
Quasar Distributors, LLC
615 East Michigan Street
Milwaukee, Wisconsin 53202
WWW.HENNESSYFUNDS.COM
This report has been prepared for shareholders and may be distributed
to others only if preceded or accompanied by a current prospectus.
Item 2. Code of Ethics.
The registrant has adopted a code of ethics that applies to the registrant’s principal executive officer and principal financial officer. The registrant has made the following substantive amendments to its code of ethics during the last annual period: Amended the code of ethics to include the addition of Hennessy SPARX Funds Trust. The registrant has not granted any waivers from any provisions of the code of ethics during the period covered by this report.
A copy of the registrant’s Code of Ethics is filed herewith.
Item 3. Audit Committee Financial Expert.
The registrant’s board of directors has determined that it does not have an audit committee financial expert serving on its audit committee. At this time, the registrant believes that the experience provided by each member of the audit committee together offers the registrant adequate oversight for the registrant’s level of financial complexity.
Item 4. Principal Accountant Fees and Services.
The registrant has engaged its principal accountant to perform audit services, audit-related services, tax services and other services during the past two fiscal years. “Audit services” refer to performing an audit of the registrant's annual financial statements or services that are normally provided by the accountant in connection with statutory and regulatory filings or engagements for those fiscal years. “Audit-related services” refer to the assurance and related services by the principal accountant that are reasonably related to the performance of the audit. “Tax services” refer to professional services rendered by the principal accountant for tax compliance, tax advice, and tax planning. There were no other services provided by the principal accountant.&# 160; The following table details the aggregate fees billed or expected to be billed for each of the last two fiscal years for audit fees, audit-related fees, tax fees and other fees by the principal accountant.
| | FYE 10/31/2010 | FYE 10/31/2009 |
| Audit Fees | $45,000 | $31,250 |
| Audit-Related Fees | - | - |
| Tax Fees | 9,900 | 6,250 |
| All Other Fees | - | - |
The audit committee has adopted pre-approval policies and procedures that require the audit committee to pre-approve all audit and non-audit services of the registrant, including services provided to any entity affiliated with the registrant.
The percentage of fees billed by KPMG, LLP applicable to non-audit services pursuant to waiver of pre-approval requirement were as follows:
| | FYE 10/31/2010 | FYE 10/31/2009 |
| Audit-Related Fees | 0% | 0% |
| Tax Fees | 0% | 0% |
| All Other Fees | 0% | 0% |
All of the principal accountant’s hours spent on auditing the registrant’s financial statements were attributed to work performed by full-time permanent employees of the principal accountant. (If more than 50 percent of the accountant’s hours were spent to audit the registrant's financial statements for the most recent fiscal year, state how many hours were attributed to work performed by persons other than the principal accountant's full-time, permanent employees.)
The following table indicates the non-audit fees billed or expected to be billed by the registrant’s accountant for services to the registrant and to the registrant’s investment adviser (and any other controlling entity, etc.—not sub-adviser) for the last two years. The audit committee of the board of trustees/directors has considered whether the provision of non-audit services that were rendered to the registrant's investment adviser is compatible with maintaining the principal accountant's independence and has concluded that the provision of such non-audit services by the accountant has not compromised the accountant’s independence.
| Non-Audit Related Fees | FYE 10/31/2010 | FYE 10/31/2009 |
| Registrant | $- | $- |
| Registrant’s Investment Adviser | - | - |
Item 5. Audit Committee of Listed Registrants.
Not applicable to registrants who are not listed issuers (as defined in Rule 10A-3 under the Securities Exchange Act of 1934).
Item 6. Investments.
| (a) | Schedule of Investments is included as part of the report to shareholders filed under Item 1 of this Form. |
Item 7. Disclosure of Proxy Voting Policies and Procedures for Closed-End Management Investment Companies.
Not applicable to open-end investment companies.
Item 8. Portfolio Managers of Closed-End Management Investment Companies.
Not applicable to open-end investment companies.
Item 9. Purchases of Equity Securities by Closed-End Management Investment Company and Affiliated Purchasers.
Not applicable to open-end investment companies.
Item 10. Submission of Matters to a Vote of Security Holders.
Not Applicable.
Item 11. Controls and Procedures.
| (a) | The Registrant’s Chief Executive Officer and Treasurer have reviewed the Registrant's disclosure controls and procedures (as defined in Rule 30a-3(c) under the Investment Company Act of 1940 (the “Act”)) as of a date within 90 days of the filing of this report, as required by Rule 30a-3(b) under the Act and Rules 13a-15(b) or 15d-15(b) under the Securities Exchange Act of 1934. Based on their review, such officers have concluded that the disclosure controls and procedures are effective in ensuring that information required to be disclosed in this report is appropriately recorded, processed, summarized and reported and made known to them by others within the Registrant and by the Registrant’s service provider. |
| (b) | There were no changes in the Registrant's internal control over financial reporting (as defined in Rule 30a-3(d) under the Act) that occurred during the second fiscal quarter of the period covered by this report that has materially affected, or is reasonably likely to materially affect, the Registrant's internal control over financial reporting. |
Item 12. Exhibits.
| (a) | (1) Any code of ethics or amendment thereto, that is the subject of the disclosure required by Item 2, to the extent that the registrant intends to satisfy Item 2 requirements through filing an exhibit. Filed herewith |
(2) A separate certification for each principal executive and principal financial officer pursuant to Section 302 of the Sarbanes-Oxley Act of 2002. Filed herewith.
(3) Any written solicitation to purchase securities under Rule 23c-1 under the Act sent or given during the period covered by the report by or on behalf of the registrant to 10 or more persons. Not applicable to open-end investment companies.
| (b) | Certifications pursuant to Section 906 of the Sarbanes-Oxley Act of 2002. Furnished herewith. |
SIGNATURES
Pursuant to the requirements of the Securities Exchange Act of 1934 and the Investment Company Act of 1940, the registrant has duly caused this report to be signed on its behalf by the undersigned, thereunto duly authorized.
(Registrant) Hennessy Funds Trust.
By (Signature and Title)* /s/Neil J. Hennessy
Neil J. Hennessy, Principal Executive Officer
Date December 17, 2010
Pursuant to the requirements of the Securities Exchange Act of 1934 and the Investment Company Act of 1940, this report has been signed below by the following persons on behalf of the registrant and in the capacities and on the dates indicated.
By (Signature and Title) /s/Neil J. Hennessy
Neil J. Hennessy, Principal Executive Officer
Date December 17, 2010
By (Signature and Title) /s/Teresa M. Nilsen
Teresa M. Nilsen, Treasurer
Date December 17, 2010
* Print the name and title of each signing officer under his or her signature.