UNITED STATES
SECURITIES AND EXCHANGE COMMISSION
Washington, D.C. 20549
FORM N-CSR
CERTIFIED SHAREHOLDER REPORT OF REGISTERED
MANAGEMENT INVESTMENT COMPANIES
Investment Company Act file number (811-07168)
Hennessy Funds Trust
(Exact name of registrant as specified in charter)
7250 Redwood Blvd., Suite 200
Novato, CA 94945
(Address of principal executive offices) (Zip code)
Neil J. Hennessy
Hennessy Advisors, Inc.
7250 Redwood Blvd., Suite 200
Novato, CA 94945
(Name and address of agent for service)
800-966-4354
Registrant's telephone number, including area code
Date of fiscal year end: October 31, 2009
Date of reporting period: October 31, 2009
Item 1. Reports to Stockholders.
HENNESSY FUNDS
ANNUAL REPORT
OCTOBER 31, 2009
Hennessy Cornerstone Growth Fund
Hennessy Cornerstone Growth Fund, Series II
Hennessy Focus 30 Fund
Hennessy Cornerstone Large Growth Fund
Hennessy Cornerstone Value Fund
Hennessy Total Return Fund
Hennessy Balanced Fund

| Letter to shareholders | 1 |
| Performance overview | |
| Hennessy Cornerstone Growth Fund | 4 |
| Hennessy Cornerstone Growth Fund, Series II | 6 |
| Hennessy Focus 30 Fund | 8 |
| Hennessy Cornerstone Large Growth Fund | 10 |
| Hennessy Cornerstone Value Fund | 12 |
| Hennessy Total Return Fund | 14 |
| Hennessy Balanced Fund | 15 |
| Summaries of investments | |
| Hennessy Cornerstone Growth Fund | 17 |
| Hennessy Cornerstone Growth Fund, Series II | 22 |
| Hennessy Focus 30 Fund | 27 |
| Hennessy Cornerstone Large Growth Fund | 31 |
| Hennessy Cornerstone Value Fund | 36 |
| Hennessy Total Return Fund | 41 |
| Hennessy Balanced Fund | 45 |
| Financial statements | |
| Statements of assets and liabilities | 50 |
| Statements of operations | 52 |
| Statements of changes in net assets | 54 |
| Financial highlights | |
| Hennessy Cornerstone Growth Fund | 64 |
| Hennessy Cornerstone Growth Fund, Series II | 66 |
| Hennessy Focus 30 Fund | 68 |
| Hennessy Cornerstone Large Growth Fund | 70 |
| Hennessy Cornerstone Value Fund | 72 |
| Hennessy Total Return Fund | 74 |
| Hennessy Balanced Fund | 76 |
| Statement of cash flows – Hennessy Total Return Fund | 78 |
| Notes to the financial statements | 79 |
| Report of Independent Registered Public Accounting Firm | 90 |
| Directors and Officers of the Funds | 92 |
| Expense example | 98 |
| Proxy voting policy | 100 |
December, 2009
Dear Hennessy Funds Shareholder:
The past year is one that I believe many investors will be glad to have behind them. At the beginning of the Fund’s fiscal year (November, 2008) the economy and financial markets were in chaos, and it felt as though they were on the brink of collapse following the AIG bailout, Lehman Brothers failure and the mega mergers between some of the country’s largest banks and investment houses. Many investors saw their portfolios and 401K’s cut nearly in half, while at the same time watched the values of their homes tumble; there was truly nowhere for investors to hide from the financial fallout. In my 30 years in the business, I have never witnessed the crisis of confidence we experienced in late February/March of this year. Even the most seasoned, disciplined and long-term investors I know simply had had enough and were pulling money out of the stock market.
Since their lows in March, the major indices have rallied back roughly 50-60%. There is certainly some ground to make up for the markets to return to their pre-recession levels, but I believe we are now in the midst of a recovery and that we should see steady, sustainable growth in the coming years. I actually believe the recovery began in November of 2008, with the first injection of government TARP (Trouble Asset Relief Program) spending. Like anything that is broken, a fix takes time to work, however, I believe that investors had seen such staggering losses that they were not willing to take a wait and see approach with this government stimulus. While the markets will no doubt have their ups and downs, I am confident that the lows of March should be behind us.
While the markets are in recovery, in my opinion, investor confidence is not. The magnitude of the most recent downturn has left investors feeling overwhelmed and distraught, and fear has kept many people on the sidelines, causing them to miss the recent rally. I believe there are several key factors that could push the stock market higher:
| • | During the past year companies have seen their stock prices crushed, and many have taken this as an opportunity to cut costs and position their balance sheets for the future. Companies have de-leveraged themselves, laid off employees, closed unprofitable business lines and taken any available write-offs. As these companies emerge leaner, we expect to see their quarterly |
HENNESSY FUNDS 1-800-966-4354
| | earnings steadily improving, as any additional revenue falls to their bottom lines. |
| • | The Federal Reserve appears to remain committed to very low interest rates. With 30-year U.S. Treasury yields hovering in the 4% range, investors may need to look to the market for more aggressive returns to try to stay ahead of inflation, and I believe this should drive increased investment in high-quality equities. |
| • | The price to sales ratio, one of the tools we use to determine a stock’s value, has returned to normalized historical levels. Over the past ten years the price to sales ratio of the Dow Jones Industrial Average has averaged $1.23. At the market low on March 9th the price to sales ratio of the Dow had dropped to just $0.60, meaning that investors were able to buy a dollar of revenue for just sixty cents. As of the end of September, 2009, this ratio had rebounded to $1.21 and is again within its historical norm. I believe this ratio will hold steady and that stock prices should rise proportionally with any increase in sales. |
| • | U.S. investors are holding an estimated $9 trillion on the sidelines. Once investor confidence starts to build, I believe this will encourage equity investing. Confidence should beget more widespread confidence and investing may beget further investing. |
| • | Banks are steadily regaining strength, with many already paying back their TARP loans. They have begun to lend again to credit-worthy consumers, who in turn have been able to purchase homes and other big ticket items. |
| • | I believe that companies with strong balance sheets will consider increasing or beginning to pay dividends as a way to increase the attractiveness of their stocks. Should shareholders receive dividend payments and see their investments rise in value, I believe that may spur confidence and increased consumer spending and investing. |
During the past decade, the tech bubble and the housing bubble created large financial gains. Many consumers were allowed, maybe even encouraged, to borrow more heavily than they should have and live beyond their means. In the past year, investors across the globe have learned a lesson about leverage and its downside, and I believe the markets have now made a move back to “normal”, where growth is based on fundamentals, and will be driven by increases in personal income and consumer spending, which should result in increases in
LETTER TO SHAREHOLDERS
corporate earnings. Using history as my guide, I believe the markets should return to a more normalized annual return. Since 1980, even with several major corrections along the way and including the most recent downturn, the Dow Jones Industrial Average has produced a 12% average annual return. While this may not be the 35% return investors were getting in the late 1990’s, I do believe a more normalized growth rate is sustainable for the foreseeable future.
I continue to believe that historical performance data has shown how patience, discipline and a long-term investing view can be rewarded. Many of the savviest investors, who realize that sometimes the best time to invest is when things look the worst, have already benefitted from the recent rally since the market lows in March.
We maintain our focus on long-term investing and on building value for all of our shareholders. At Hennessy Funds, we serve our shareholders directly, so that we can provide answers to shareholder questions and concerns. Please don’t hesitate to contact us at 800-966-4354 if we can answer any questions or can be of service.
Best regards,
Neil J. Hennessy
Portfolio Manager & Chief Investment Officer
Past performance does not guarantee future results.
Mutual fund investing involves risk. Principal loss is possible.
Price-to-sales ratio is a tool for calculating a stock’s valuation relative to other companies. It is calculated by dividing a stock’s current price by its revenue per share.
Opinions expressed are those of Neil Hennessy and are subject to change, are not guaranteed and should not be considered investment advice.
The Dow Jones Industrial Average is an unmanaged index of common stocks comprised of major industrial companies and assumes reinvestment of dividends. You cannot invest directly in an index.
HENNESSY FUNDS 1-800-966-4354
Hennessy Cornerstone Growth Fund
Original Class Shares
AVERAGE ANNUAL TOTAL RETURN PERIODS ENDED OCTOBER 31, 2009
| | | | | | Since Inception |
| | | One Year | Five Years | Ten Years | (11/1/96) |
| | Hennessy Cornerstone | | | | |
| | Growth Fund – Original Class | 0.11% | -4.40% | 4.97% | 7.23% |
| | Russell 2000 Index | 6.46% | 0.59% | 4.11% | 5.32% |
| | S&P 500 Index | 9.80% | 0.33% | -0.95% | 4.82% |
Gross expense ratio: 1.25%
Performance data quoted represents past performance; past performance does not guarantee future results. The investment return and principal value of an investment will fluctuate so that an investor’s shares, when redeemed, may be worth more or less than their original cost. Current performance of the fund may be lower or higher than the performance quoted. Performance data current to the most recent month end may be obtained by visiting www.hennessyfunds.com. The gross expense ratio presented is that from the most recent prospectus.
PERFORMANCE NARRATIVE
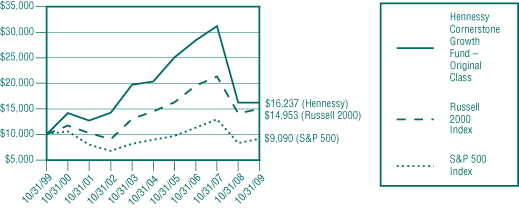
The Hennessy Cornerstone Growth Fund returned 0.11% for the twelve-month period ending October 31, 2009, underperforming its benchmark, the Russell 2000, which returned 6.46%, and the S&P 500, which returned 9.80%. The underperformance is primarily due to individual security selection after the rebalance (which occurred in the winter), which offset the positive overall sector allocation in the Fund. Post rebalance, the portfolio maintained an overweight position in Consumer Discretionary stocks which outperformed as the economy rebounded, but also held an underweight position in Financials, which underperformed despite the sharp rally in Financials within the broader market off the March lows. Post rebalance, performance of the portfolio was hampered by Consumer Discretionary stock Hot Topic, which was down over 10%, Industrial stock Aceto Corp., which was down over 30%, and Information Technology stock Mantech International Corp., which was down over 15%.
CHANGE IN VALUE OF $10,000 INVESTMENT
This chart assumes an initial gross investment of $10,000 made on October 31, 1999. Returns shown include the reinvestment of all dividends. Returns shown do not reflect the deduction of taxes that a shareholder would pay on fund distributions or the redemption of fund shares.
PERFORMANCE OVERVIEW — HENNESSY CORNERSTONE GROWTH FUND
Hennessy Cornerstone Growth Fund
Institutional Class Shares
AVERAGE ANNUAL TOTAL RETURN PERIODS ENDED OCTOBER 31, 2009
| | | | Since Inception |
| | | One Year | 3/3/08 |
| | Hennessy Cornerstone | | |
| | Growth Fund – Institutional Class | 0.45% | -21.99% |
| | Russell 2000 Index | 6.46% | -9.66% |
| | S&P 500 Index | 9.80% | -11.88% |
Gross expense ratio: 1.12%. Net expense ratio: 0.98%. The expense ratio is contractually capped at 0.98% indefinitely.
Performance data quoted represents past performance; past performance does not guarantee future results. The investment return and principal value of an investment will fluctuate so that an investor’s shares, when redeemed, may be worth more or less than their original cost. Current performance of the fund may be lower or higher than the performance quoted. Performance data current to the most recent month end may be obtained by visiting www.hennessyfunds.com. Investment performance reflects fee waivers in effect. In the absence of such waivers, total return would be reduced. The gross expense ratio presented is that from the most recent prospectus.
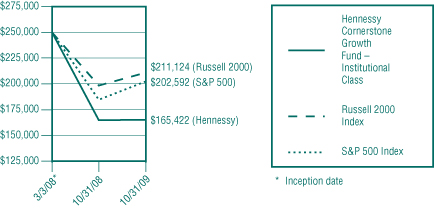
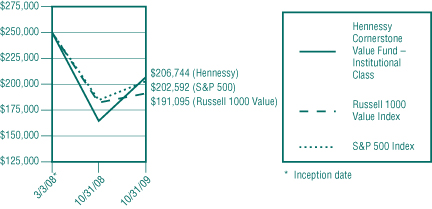
CHANGE IN VALUE OF $250,000 INVESTMENT
This chart assumes an initial gross investment of $250,000 (minimum investment) made on March 3, 2008 (inception date of share class). Returns shown include the reinvestment of all dividends. Returns shown do not reflect the deduction of taxes that a shareholder would pay on fund distributions or the redemption of fund shares.
The S&P 500 Index and Russell 2000 Index are unmanaged indices commonly used to measure the performance of U.S. Stocks. You cannot invest directly in an index. Small and medium-capitalization companies tend to have limited liquidity and greater price volatility than large-capitalization companies. Investments in foreign securities involve greater volatility and political, economic and currency risk and differences in accounting methods. References to specific securities should not be considered a recommendation to buy or sell any security. Fund holdings and sector allocations are subject to change. Please refer to the included Schedule of Investments.
HENNESSY FUNDS 1-800-966-4354
Hennessy Cornerstone Growth Fund, Series II
Original Class Shares
AVERAGE ANNUAL TOTAL RETURN PERIODS ENDED OCTOBER 31, 2009
| | | | Since Inception |
| | | One Year | 7/1/05 |
| | Hennessy Cornerstone Growth | | |
| | Fund, Series II – Original Class | 7.15% | -13.22% |
| | Russell 2000 Growth Index | 11.34% | -0.85% |
| | S&P 500 Index | 9.80% | -1.17% |
Gross expense ratio: 1.37%.
Performance data quoted represents past performance; past performance does not guarantee future results. The investment return and principal value of an investment will fluctuate so that an investor’s shares, when redeemed, may be worth more or less than their original cost. Current performance of the fund may be lower or higher than the performance quoted. Performance data current to the most recent month end may be obtained by visiting www.hennessyfunds.com. The gross expense ratio presented is that from the most recent prospectus.
PERFORMANCE NARRATIVE
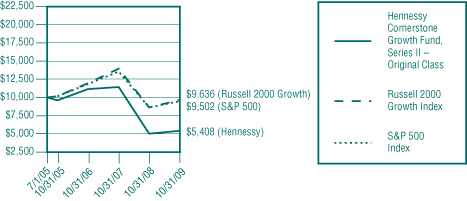
The Hennessy Cornerstone Growth Fund, Series II returned 7.15% for the twelve-month period ending October 31, 2009, trailing its benchmark, the Russell 2000 Growth Index, which returned 11.34%, and the S&P 500, which returned 9.80%. The underperformance of the Fund versus its benchmark was primarily the result of individual security selection after the rebalance (which occurred in the summer), particularly in the Consumer Discretionary Sector. Within that sector, Spartan Motors was a particularly poor performer, down over 50% after the rebalance, as was Isle of Capri, which was down over 40%. The poor overall security selection in the Fund post rebalance offset positive sector allocation during that same period, particularly an overweight position in the Consumer Discretionary sector, which outperformed over the period. Prior to the rebalance, an underweight position in Health Care stocks (which underperformed) positively impacted the Fund’s performance, while overweight positions in Materials and Energy (which both underperformed) negatively impacted performance. Prior to the rebalance Energy stock Interoil Corp., was up over 70%, Materials stock Schnitzer Steel was up over 100% and Industrials stock Aecom Technology Corp. was up over 60%.
CHANGE IN VALUE OF $10,000 INVESTMENT
This chart assumes an initial gross investment of $10,000 made on July 1, 2005 (inception). Returns shown include the reinvestment of all dividends. Returns shown do not reflect the deduction of taxes that a shareholder would pay on fund distributions or the redemption of fund shares.
PERFORMANCE OVERVIEW — HENNESSY CORNERSTONE GROWTH FUND, SERIES II
Hennessy Cornerstone Growth Fund, Series II
Institutional Class Shares
AVERAGE ANNUAL TOTAL RETURN PERIODS ENDED OCTOBER 31, 2009
| | | | Since Inception |
| | | One Year | 3/3/08 |
| | Hennessy Cornerstone Growth | | |
| | Fund, Series II – Institutional Class | 7.89% | -27.58% |
| | Russell 2000 Growth Index | 11.34% | -9.67% |
| | S&P 500 Index | 9.80% | -11.88% |
Gross expense ratio: 1.22%. Net expense ratio: 0.98%. The expense ratio is contractually capped at 0.98% indefinitely.
Performance data quoted represents past performance; past performance does not guarantee future results. The investment return and principal value of an investment will fluctuate so that an investor’s shares, when redeemed, may be worth more or less than their original cost. Current performance of the fund may be lower or higher than the performance quoted. Performance data current to the most recent month end may be obtained by visiting www.hennessyfunds.com. Investment performance reflects fee waivers in effect. In the absence of such waivers, total return would be reduced. The gross expense ratio presented is that from the most recent prospectus.
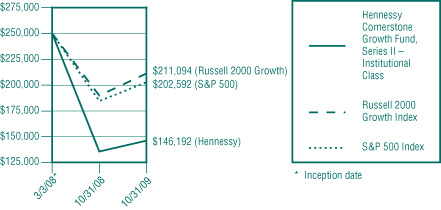
CHANGE IN VALUE OF $250,000 INVESTMENT
This chart assumes an initial gross investment of $250,000 (minimum investment) made on March 3, 2008 (date of share class inception). Returns shown include the reinvestment of all dividends. Returns shown do not reflect the deduction of taxes that a shareholder would pay on fund distributions or the redemption of fund shares.
The Russell 2000 Growth Index and S&P 500 Index are unmanaged indices commonly used to measure the performance of U.S. Stocks. You cannot invest directly in an index. Small and medium-capitalization companies tend to have limited liquidity and greater price volatility than large-capitalization companies. Investments in foreign securities involve greater volatility and political, economic and currency risk and differences in accounting methods. References to specific securities should not be considered a recommendation to buy or sell any security. Fund holdings and sector allocations are subject to change. Please refer to the included Schedule of Investments.
HENNESSY FUNDS 1-800-966-4354
Hennessy Focus 30 Fund
Original Class Shares
AVERAGE ANNUAL TOTAL RETURN PERIODS ENDED OCTOBER 31, 2009
| | | | | Since Inception |
| | | One Year | Five Years | (9/17/03) |
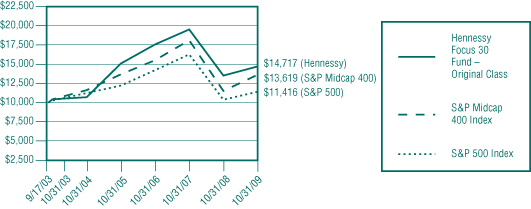
| | Hennessy Focus 30 Fund – Original Class | 8.85% | 6.52% | 6.52% |
| | S&P Midcap 400 Index | 18.18% | 3.24% | 5.18% |
| | S&P 500 Index | 9.80% | 0.33% | 2.19% |
Gross expense ratio: 1.27%
Performance data quoted represents past performance; past performance does not guarantee future results. The investment return and principal value of an investment will fluctuate so that an investor’s shares, when redeemed, may be worth more or less than their original cost. Current performance of the fund may be lower or higher than the performance quoted. Performance data current to the most recent month end may be obtained by visiting www.hennessyfunds.com. The gross expense ratio presented is that from the most recent prospectus.
PERFORMANCE NARRATIVE
The Hennessy Focus 30 Fund returned 8.85% for the twelve-month period ending October 31, 2009, underperforming both its benchmark, the S&P Midcap 400, which returned 18.18%, and the S&P 500, which returned 9.80%. The Fund’s underperformance relative to its benchmark was primarily attributable to individual stock selection prior to the rebalance, which occurred in the fall of 2009. The contribution to the portfolio’s performance from strong security selection in the Financials sector as well as the positive overall sector allocation prior to the rebalance (specifically an overweight position in the Consumer Discretionary sector) was overshadowed by weak security selection, chiefly in the Industrial and Utilities sectors. In the Industrial sector, Teledyne Technologies Inc. (down over 20% prior to the rebalance) and Hub Group Inc. (down over 25%) both suffered. Within the Utilities sector, Piedmont Natural Gas (down over 20%) and Hawaiian Electric Industries, Inc. (down over 30%) both negatively impacted the performance of the Fund. These weak performers offset some strong holdings prior to the rebalance, specifically in Financials, such as Odyssey Re Holdings (up over 50%), which benefitted from strong operating results and an acquisition bid announced prior to the rebalance. Following the rebalance, the Fund has outperformed its benchmark, with the outperformance resulting from strong security selection, specifically in the Materials, Energy, Health Care, and Financial sectors. Materials stock Newmarket Corp. is up over 5% since the rebalance, as is Energy stock Linn Energy and generic pharmaceutical maker, Mylan Inc. Americredit, the sole Financial stock in the Fund, has performed well, up over 10% since the rebalance.
CHANGE IN VALUE OF $10,000 INVESTMENT
This chart assumes an initial gross investment of $10,000 made on September 17, 2003 (inception). Returns shown include the reinvestment of all dividends. Returns shown do not reflect the deduction of taxes that a shareholder would pay on fund distributions or the redemption of fund shares.
PERFORMANCE OVERVIEW — HENNESSY FOCUS 30 FUND
Hennessy Focus 30 Fund
Institutional Class Shares
AVERAGE ANNUAL TOTAL RETURN PERIODS ENDED OCTOBER 31, 2009
| | | | Since Inception |
| | | One Year | 3/3/08 |
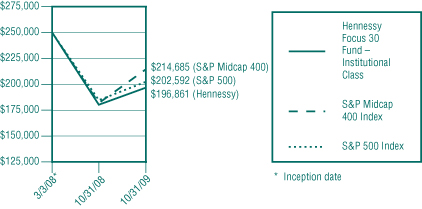
| | Hennessy Focus 30 Fund – Institutional Class | 9.20% | -13.38% |
| | S&P Midcap 400 Index | 18.18% | -8.75% |
| | S&P 500 Index | 9.80% | -11.88% |
Gross expense ratio: 1.13%. Net expense ratio: 0.98%. The expense ratio is contractually capped at 0.98% indefinitely.
Performance data quoted represents past performance; past performance does not guarantee future results. The investment return and principal value of an investment will fluctuate so that an investor’s shares, when redeemed, may be worth more or less than their original cost. Current performance of the fund may be lower or higher than the performance quoted. Performance data current to the most recent month end may be obtained by visiting www.hennessyfunds.com. Investment performance reflects fee waivers in effect. In the absence of such waivers, total return would be reduced. The gross expense ratio presented is that from the most recent prospectus.
CHANGE IN VALUE OF $250,000 INVESTMENT
This chart assumes an initial gross investment of $250,000 (minimum investment) made on March 3, 2008 (inception date of share class). Returns shown include the reinvestment of all dividends. Returns shown do not reflect the deduction of taxes that a shareholder would pay on fund distributions or the redemption of fund shares.
The S&P 500 Index and S&P Midcap 400 Index are unmanaged indices commonly used to measure the performance of U.S. Stocks. You cannot invest directly in an index. Small and medium-capitalization companies tend to have limited liquidity and greater price volatility than large-capitalization companies. References to specific securities should not be considered a recommendation to buy or sell any security. Fund holdings and sector allocations are subject to change. Please refer to the included Schedule of Investments.
HENNESSY FUNDS 1-800-966-4354
Hennessy Cornerstone Large Growth Fund
Original Class Shares
CUMULATIVE TOTAL RETURN PERIODS ENDED OCTOBER 31, 2009
| | | | Since Inception |
| | | One Month | (3/20/09) |
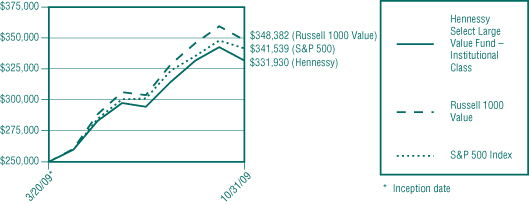
| | Hennessy Cornerstone Large | | |
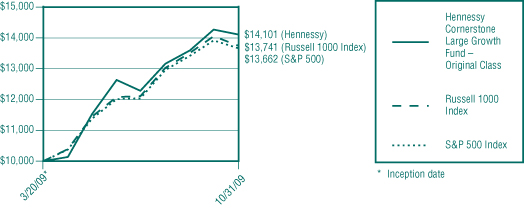
| | Growth Fund – Original Class* | -1.15% | 41.01% |
| | Russell 1000 Index | -2.21% | 37.41% |
| | S&P 500 Index | -1.86% | 36.62% |
Gross expense ratio: 1.33%. Net expense ratio: 1.30%. The expense ratio is contractually capped at 1.30% through March, 2010.
Performance data quoted represents past performance; past performance does not guarantee future results. The investment return and principal value of an investment will fluctuate so that an investor’s shares, when redeemed, may be worth more or less than their original cost. Current performance of the fund may be lower or higher than the performance quoted. Performance data current to the most recent month end may be obtained by visiting www.hennessyfunds.com. Investment performance reflects fee waivers in effect. In the absence of such waivers, total return would be reduced. The gross expense ratio presented is that from the most recent prospectus.
| * | On March 20, 2009, the Tamarack Large Cap Growth Fund was reorganized into the Hennessy Cornerstone Large Growth Fund. At that time, the Fund began utilizing a purely quantitative formula to choose stocks for the portfolio, which differs from the investment strategy employed by the previous investment manager. Accordingly, performance is being reported for the period after the reorganization. |
PERFORMANCE NARRATIVE
The Hennessy Cornerstone Large Growth Fund has changed its fiscal year end from September 30th to October 31st, effective with this report for the period ending October 31, 2009. Therefore, the following narrative describes performance for the one-month period since the Fund’s last published annual report (for the twelve-month period ending September 30, 2009). The Hennessy Cornerstone Large Growth Fund returned -1.15% for the one-month period ending October 31, 2009, outperforming both its benchmark, the Russell 1000 Index, which returned -2.21%, and the S&P 500, which returned -1.86% . The Fund’s outperformance for the period was primarily the result of positive sector allocation, particularly an overweight position in the Energy sector. McGraw-Hill Companies was the strongest performing stock in the portfolio for the period, gaining 14%.
CHANGE IN VALUE OF $10,000 INVESTMENT
This chart assumes an initial gross investment of $10,000 made on March 20, 2009 (inception). Returns shown include the reinvestment of all dividends. Returns shown do not reflect the deduction of taxes that a shareholder would pay on fund distributions or the redemption of fund shares.
Hennessy Cornerstone Large Growth Fund
Institutional Class Shares
CUMULATIVE TOTAL RETURN PERIODS ENDED OCTOBER 31, 2009
| | | | Since Inception |
| | | One Month | (3/20/09) |
| | Hennessy Cornerstone Large | | |
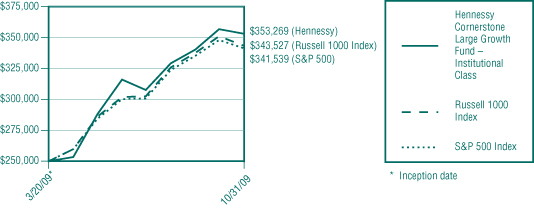
| | Growth Fund – Institutional Class | -1.04% | 41.31% |
| | Russell 1000 Index | -2.21% | 37.41% |
| | S&P 500 Index | -1.86% | 36.62% |
Gross expense ratio: 1.15%. Net expense ratio: 0.98%. The expense ratio is contractually capped at 0.98% indefinitely.
Performance data quoted represents past performance; past performance does not guarantee future results. The investment return and principal value of an investment will fluctuate so that an investor’s shares, when redeemed, may be worth more or less than their original cost. Current performance of the fund may be lower or higher than the performance quoted. Performance data current to the most recent month end may be obtained by visiting www.hennessyfunds.com. Investment performance reflects fee waivers in effect. In the absence of such waivers, total return would be reduced. The gross expense ratio presented is that from the most recent prospectus.
CHANGE IN VALUE OF $250,000 INVESTMENT
This chart assumes an initial gross investment of $250,000 (minimum investment) made on March 20, 2009 (inception date). Returns shown include the reinvestment of all dividends. Returns shown do not reflect the deduction of taxes that a shareholder would pay on fund distributions or the redemption of fund shares.
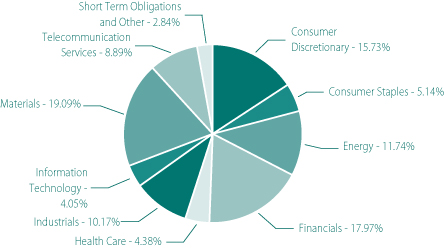
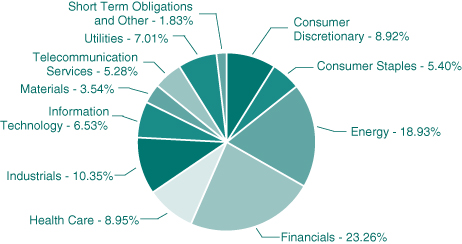
The S&P 500 and Russell 1000 are unmanaged indices commonly used to measure the performance of U.S. stocks. One cannot invest directly in an index. Medium-capitalization companies tend to have limited liquidity and greater price volatility than large-capitalization companies. Growth stocks typically are more volatile than value stocks; however value stocks have a lower expected growth rate in earnings and sales. The Fund’s composition and sector weightings are shown as a percentage of the Fund’s total net assets. Portfolio composition and sector weightings are subject to change at any time and should not be considered a recommendation to buy or sell a particular security. Please refer to the Summary of Investments within this Annual Report for additional portfolio information, including percentages of holdings.
HENNESSY FUNDS 1-800-966-4354
Hennessy Cornerstone Value Fund
Original Class Shares
AVERAGE ANNUAL TOTAL RETURN PERIODS ENDED OCTOBER 31, 2009
| | | | | | Since Inception |
| | | One Year | Five Years | Ten Years | (11/1/96) |
| | Hennessy Cornerstone | | | | |
| | Value Fund – Original Class | 25.51% | -0.01% | 2.66% | 4.20% |
| | Russell 1000 Value Index | 4.78% | -0.05% | 1.70% | 5.92% |
| | S&P 500 Index | 9.80% | 0.33% | -0.95% | 4.82% |
Gross expense ratio: 1.20%
Performance data quoted represents past performance; past performance does not guarantee future results. The investment return and principal value of an investment will fluctuate so that an investor’s shares, when redeemed, may be worth more or less than their original cost. Current performance of the fund may be lower or higher than the performance quoted. Performance data current to the most recent month end may be obtained by visiting www.hennessyfunds.com. The gross expense ratio presented is that from the most recent prospectus.
PERFORMANCE NARRATIVE
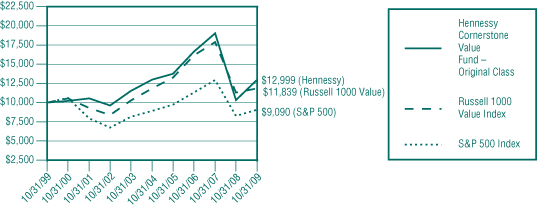
The Hennessy Cornerstone Value Fund returned 25.51% for the twelve-month period ending October 31, 2009, outperforming its benchmark, the Russell 1000 Value, which returned 4.78%, and the S&P 500, which returned 9.80%. The Fund’s strong outperformance of its benchmark is primarily attributable to strong security selection across a number of sectors, namely Materials, Consumer Discretionary, Telecom, Industrials, Financials and Energy. The positive effects of security selection were augmented by positive overall sector allocation, specifically in Materials, where an overweight position benefited from the sector’s outperformance in 2009. After the rebalance (which occurred in the winter), the best performing stocks within the Materials sector were Rio Tinto, which gained over 140%, and Southern Copper Corp., which gained over 110%. Within the Consumer Discretionary sector, Macy’s Inc. (up over 90%) and Limited Brands Inc. (up over 80%) both contributed to the portfolio’s performance. Telecom stock Vimpelcom gained over 90% after the rebalance, Industrial stock RR Donnelly & Sons gained over 50% and Energy stock CNOOC Ltd. gained over 70%. Financial stocks led the rally of 2009 as credit losses slowed, credit markets improved substantially and unprecedented liquidity was injected by the Fed. Morgan Stanley was one beneficiary of this, which gained over 90% after the rebalance. The effects of strong security selection were augmented by positive overall sector allocation, specifically in Materials, where an overweight position benefited from the sector’s outperformance in 2009.
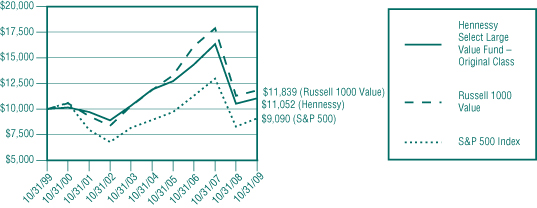
CHANGE IN VALUE OF $10,000 INVESTMENT
This chart assumes an initial gross investment of $10,000 made on October 31, 1999. Returns shown include the reinvestment of all dividends. Returns shown do not reflect the deduction of taxes that a shareholder would pay on fund distributions or the redemption of fund shares.
PERFORMANCE OVERVIEW — HENNESSY CORNERSTONE VALUE FUND
Hennessy Cornerstone Value Fund
Institutional Class Shares
AVERAGE ANNUAL TOTAL RETURN PERIODS ENDED OCTOBER 31, 2009
| | | | Since Inception |
| | | One Year | 3/3/08 |
| | Hennessy Cornerstone Value Fund – Institutional Class | 25.87% | -10.80% |
| | Russell 1000 Value Index | 4.78% | -14.92% |
| | S&P 500 Index | 9.80% | -11.88% |
Gross expense ratio: 1.14%. Net expense ratio: 0.98%. The expense ratio is contractually capped at 0.98% indefinitely.
Performance data quoted represents past performance; past performance does not guarantee future results. The investment return and principal value of an investment will fluctuate so that an investor’s shares, when redeemed, may be worth more or less than their original cost. Current performance of the fund may be lower or higher than the performance quoted. Performance data current to the most recent month end may be obtained by visiting www.hennessyfunds.com. Investment performance reflects fee waivers in effect. In the absence of such waivers, total return would be reduced. The gross expense ratio presented is that from the most recent prospectus.
CHANGE IN VALUE OF $250,000 INVESTMENT
This chart assumes an initial gross investment of $250,000 (minimum investment) made on March 3, 2008 (inception date of share class). Returns shown include the reinvestment of all dividends. Returns shown do not reflect the deduction of taxes that a shareholder would pay on fund distributions or the redemption of fund shares.
The Russell 1000 Value Index and S&P 500 Index are unmanaged indices commonly used to measure the performance of U.S. Stocks. You cannot invest directly in an index. The Fund may invest in medium-capitalization companies which tend to have limited liquidity and greater price volatility than large-capitalization companies. Investments in foreign securities involve greater volatility and political, economic and currency risk and differences in accounting methods. References to specific securities should not be considered a recommendation to buy or sell any security. Fund holdings and sector allocations are subject to change. Please refer to the included Schedule of Investments.
HENNESSY FUNDS 1-800-966-4354
Original Class Shares
AVERAGE ANNUAL TOTAL RETURN PERIODS ENDED OCTOBER 31, 2009
| | | | | | Since Inception |
| | | One Year | Five Years | Ten Years | (7/29/98) |
| | Hennessy Total Return Fund | 0.69% | -0.26% | 1.03% | 1.30% |
| | Dow Jones Industrial Average | 7.71% | 1.95% | 1.25% | 2.99% |
| | S&P 500 Index | 9.80% | 0.33% | -0.95% | 1.01% |
Gross expense ratio: 2.36%
Expenses net of interest expense: 1.20%
Performance data quoted represents past performance; past performance does not guarantee future results. The investment return and principal value of an investment will fluctuate so that an investor’s shares, when redeemed, may be worth more or less than their original cost. Current performance of the fund may be lower or higher than the performance quoted. Performance data current to the most recent month end may be obtained by visiting www.hennessyfunds.com. The gross expense ratio presented is that from the most recent prospectus.
PERFORMANCE NARRATIVE
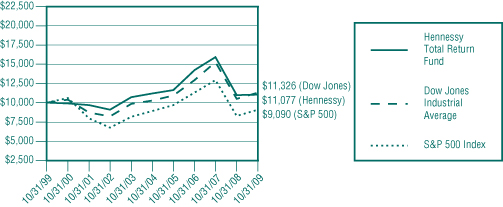
The Hennessy Total Return Fund returned 0.69% for the twelve-month period ending October 31, 2009, lagging both the Dow Jones Industrial Average, which returned 7.71%, and the S&P 500 Index, which returned 9.80%. Citigroup, AIG, and General Motors significantly contributed to the Fund’s underperformance, as each saw severe stock price declines over the course of the twelve-month period and were eventually removed from the Dow Jones index. The Fund’s 25% position in short-term Treasury Bills hampered overall performance as Treasury yields remained relatively low throughout the twelve-month period, lagging performance of the stock market.
CHANGE IN VALUE OF $10,000 INVESTMENT
This chart assumes an initial gross investment of $10,000 made on October 31, 1999. Performance reflects fee waivers in effect. In the absence of fee waivers, total return would be reduced. Returns shown include the reinvestment of all dividend and other distributions. Returns shown do not reflect the deduction of taxes that a shareholder would pay on fund distributions or the redemption of fund shares.
The Dow Jones Industrial Average and S&P 500 Index are unmanaged indices commonly used to measure the performance of U.S. Stocks. You cannot invest directly in an index. The Hennessy Total Return Fund is non-diversified, meaning it may concentrate its assets in fewer individual holdings than a diversified fund, making it more exposed to individual stock volatility than a diversified fund. References to specific securities should not be considered a recommendation to buy or sell any security. Fund holdings are subject to change. Please refer to the included Schedule of Investments. Current or future portfolio holdings are subject to risk.
PERFORMANCE OVERVIEW — HENNESSY TOTAL RETURN FUND AND HENNESSY BALANCED FUND
Hennessy Balanced Fund
Original Class Shares
AVERAGE ANNUAL TOTAL RETURN PERIODS ENDED OCTOBER 31, 2009
| | | | | | Since Inception |
| | | One Year | Five Years | Ten Years | (3/8/96) |
| | Hennessy Balanced Fund | 5.46% | 0.97% | 1.22% | 3.29% |
| | Dow Jones Industrial Average | 7.71% | 1.95% | 1.25% | 6.53% |
| | S&P 500 Index | 9.80% | 0.33% | -0.95% | 5.51% |
Gross expense ratio: 1.56%
Performance data quoted represents past performance; past performance does not guarantee future results. The investment return and principal value of an investment will fluctuate so that an investor’s shares, when redeemed, may be worth more or less than their original cost. Current performance of the fund may be lower or higher than the performance quoted. Performance data current to the most recent month end may be obtained by visiting www.hennessyfunds.com. The gross expense ratio presented is that from the most recent prospectus.
PERFORMANCE NARRATIVE
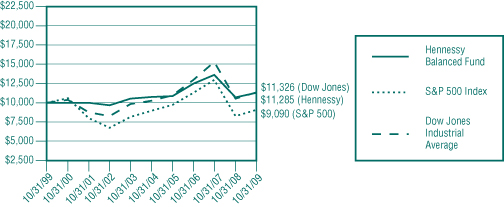
The Hennessy Balanced Fund returned 5.46% for the twelve-month period ending October 31, 2009, lagging both the Dow Jones Industrial Average, which returned 7.71%, and the S&P 500 Index, which returned 9.80%. Citigroup, AIG, and General Motors significantly contributed to the Fund’s underperformance, as each saw severe stock price declines over the course of the twelve-month period and were eventually removed from the Dow Jones index. The Fund’s 50% position in short-term Treasury Bills hampered overall performance as Treasury yields remained relatively low throughout the twelve-month period, lagging performance of the stock market.
CHANGE IN VALUE OF $10,000 INVESTMENT
This chart assumes an initial gross investment of $10,000, made on October 31, 1999. Returns shown include the reinvestment of all dividend and other distributions. Returns shown do not reflect the deduction of taxes that a shareholder would pay on fund distributions or the redemption of fund shares.
The Dow Jones Industrial Average and S&P 500 Index are unmanaged indices commonly used to measure the performance of U.S. Stocks. You cannot invest directly in an index. The Hennessy Balanced Fund is non-diversified, meaning it may concentrate its assets in fewer individual holdings than a diversified fund, making it more exposed to individual stock volatility than a diversified fund. References to specific securities should not be considered a recommendation to buy or sell any security. Fund holdings are subject to change. Please refer to the included Schedule of Investments. Current or future portfolio holdings are subject to risk.
HENNESSY FUNDS 1-800-966-4354
(This Page Intentionally Left Blank.)
SUMMARY OF INVESTMENTS — HENNESSY CORNERSTONE GROWTH FUND
Summaries of Investments
The following summaries of investment portfolios are designed to help investors better understand each fund’s principal holdings. Each summary is as of October 31, 2009.
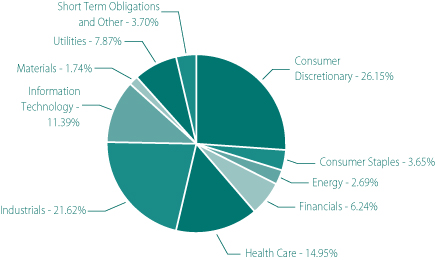
HENNESSY CORNERSTONE GROWTH FUND
(% of Net Assets)
| | TOP TEN EQUITY HOLDINGS | % of net assets |
| | SXC Health Solutions Corp. | 4.79% |
| | NetFlix, Inc. | 3.51% |
| | World Fuel Services Corp. | 2.69% |
| | Emergency Medical Services Corp. | 2.57% |
| | Carter’s, Inc. | 2.40% |
| | American Italian Pasta Co. | 2.38% |
| | Monro Muffler, Inc. | 2.38% |
| | Viasat, Inc. | 2.37% |
| | Panera Bread Co. | 2.25% |
| | Applied Signal Technology Inc. | 2.24% |
HENNESSY FUNDS 1-800-966-4354
| | COMMON STOCKS – 96.30% | | Number | | | | | | % of Net | | |
| | | | of Shares | | | Value | | | Assets | | |
| | Consumer Discretionary – 26.15% | | | | | | | | | | |
| | Aaron’s, Inc. | | | 172,000 | | | $ | 4,308,600 | | | | 1.84 | % | |
| | Autozone, Inc. (a) | | | 32,800 | | | | 4,438,168 | | | | 1.90 | % | |
| | Carter’s, Inc. (a) | | | 237,700 | | | | 5,609,720 | | | | 2.40 | % | |
| | Corinthian Colleges, Inc. (a) | | | 279,600 | | | | 4,434,456 | | | | 1.90 | % | |
| | Dollar Tree, Inc. (a) | | | 109,800 | | | | 4,955,274 | | | | 2.12 | % | |
| | Family Dollar Stores, Inc. | | | 175,600 | | | | 4,969,480 | | | | 2.13 | % | |
| | FGX International Holdings, Ltd. (a)(b) | | | 333,200 | | | | 4,394,908 | | | | 1.88 | % | |
| | HOT Topic, Inc. (a) | | | 493,800 | | | | 3,802,260 | | | | 1.63 | % | |
| | Monro Muffler, Inc. | | | 179,500 | | | | 5,562,705 | | | | 2.38 | % | |
| | National Presto Inds, Inc. | | | 59,500 | | | | 5,172,335 | | | | 2.21 | % | |
| | NetFlix, Inc. (a) | | | 153,200 | | | | 8,188,540 | | | | 3.51 | % | |
| | Panera Bread Co. (a) | | | 87,600 | | | | 5,254,248 | | | | 2.25 | % | |
| | | | | | | | | 61,090,694 | | | | 26.15 | % | |
| | Consumer Staples – 3.65% | | | | | | | | | | | | | |
| | American Italian Pasta Co. (a) | | | 204,900 | | | | 5,567,133 | | | | 2.38 | % | |
| | Nash Finch Co. | | | 102,000 | | | | 2,955,960 | | | | 1.27 | % | |
| | | | | | | | | 8,523,093 | | | | 3.65 | % | |
| | Energy – 2.69% | | | | | | | | | | | | | |
| | World Fuel Services Corp. | | | 123,700 | | | | 6,290,145 | | | | 2.69 | % | |
| | | | | | | | | | | | | | | |
| | Financials – 6.24% | | | | | | | | | | | | | |
| | Amerisafe, Inc. (a) | | | 223,000 | | | | 4,134,420 | | | | 1.77 | % | |
| | First Bancorp PR (b) | | | 410,900 | | | | 776,601 | | | | 0.33 | % | |
| | Nelnet, Inc. (a) | | | 319,500 | | | | 4,482,585 | | | | 1.92 | % | |
| | Stifel Financial Corp. (a) | | | 99,800 | | | | 5,185,608 | | | | 2.22 | % | |
| | | | | | | | | 14,579,214 | | | | 6.24 | % | |
| | Health Care – 14.95% | | | | | | | | | | | | | |
| | Cantel Medical Corp. (a) | | | 312,000 | | | | 5,010,720 | | | | 2.15 | % | |
| | Emergency Medical Services Corp. (a) | | | 125,000 | | | | 6,002,500 | | | | 2.57 | % | |
| | Ensign Group, Inc. | | | 273,500 | | | | 4,042,330 | | | | 1.73 | % | |
| | Gentiva Health Services, Inc. (a) | | | 156,500 | | | | 3,756,000 | | | | 1.61 | % | |
| | PSS World Med, Inc. (a) | | | 243,200 | | | | 4,917,504 | | | | 2.10 | % | |
| | SXC Health Solutions Corp. (a)(b) | | | 245,200 | | | | 11,200,736 | | | | 4.79 | % | |
| | | | | | | | | 34,929,790 | | | | 14.95 | % | |
The accompanying notes are an integral part of these financial statements.
SUMMARY OF INVESTMENTS — HENNESSY CORNERSTONE GROWTH FUND
| | COMMON STOCKS | | Number | | | | | | % of Net | | |
| | | | of Shares | | | Value | | | Assets | | |
| | Industrials – 21.62% | | | | | | | | | | |
| | Aaon, Inc. | | | 219,200 | | | $ | 3,947,792 | | | | 1.69 | % | |
| | Aceto Corp. | | | 457,300 | | | | 2,533,442 | | | | 1.08 | % | |
| | Aecom Technology Corp Delaware Co. (a) | | | 149,000 | | | | 3,760,760 | | | | 1.61 | % | |
| | Applied Signal Technology, Inc. | | | 255,200 | | | | 5,229,048 | | | | 2.24 | % | |
| | Baker Michael Corp. (a) | | | 124,000 | | | | 4,426,800 | | | | 1.89 | % | |
| | Beacon Roofing Supply, Inc. (a) | | | 329,800 | | | | 4,735,928 | | | | 2.03 | % | |
| | Granite Construction, Inc. | | | 104,200 | | | | 2,975,952 | | | | 1.27 | % | |
| | Insituform Technologies, Inc. (a) | | | 232,500 | | | | 4,929,000 | | | | 2.11 | % | |
| | Stanley, Inc. (a) | | | 126,400 | | | | 3,570,800 | | | | 1.53 | % | |
| | Tetra Tech, Inc. (a) | | | 189,600 | | | | 4,878,408 | | | | 2.09 | % | |
| | Trex, Inc. (a) | | | 278,100 | | | | 4,424,571 | | | | 1.89 | % | |
| | VSE Corp. | | | 116,700 | | | | 5,110,293 | | | | 2.19 | % | |
| | | | | | | | | 50,522,794 | | | | 21.62 | % | |
| | Information Technology – 11.39% | | | | | | | | | | | | | |
| | CACI International, Inc. (a) | | | 101,500 | | | | 4,833,430 | | | | 2.07 | % | |
| | CSG Systems International, Inc. (a) | | | 262,000 | | | | 4,281,080 | | | | 1.83 | % | |
| | Mantech International Corp. – Class A (a) | | | 84,500 | | | | 3,706,170 | | | | 1.59 | % | |
| | NCI, Inc. (a) | | | 151,900 | | | | 4,087,629 | | | | 1.75 | % | |
| | SAIC, Inc. (a) | | | 235,000 | | | | 4,161,850 | | | | 1.78 | % | |
| | Viasat, Inc. (a) | | | 190,100 | | | | 5,541,415 | | | | 2.37 | % | |
| | | | | | | | | 26,611,574 | | | | 11.39 | % | |
| | Materials – 1.74% | | | | | | | | | | | | | |
| | Zep, Inc. | | | 237,100 | | | | 4,054,410 | | | | 1.74 | % | |
| | | | | | | | | | | | | | | |
| | Utilities – 7.87% | | | | | | | | | | | | | |
| | Laclede Group, Inc. | | | 97,700 | | | | 3,000,367 | | | | 1.28 | % | |
| | New Jersey Resource Corp. | | | 116,300 | | | | 4,093,760 | | | | 1.75 | % | |
| | NSTAR | | | 125,500 | | | | 3,884,225 | | | | 1.66 | % | |
| | Piedmont Natural Gas Co. | | | 144,500 | | | | 3,363,960 | | | | 1.44 | % | |
| | South Jersey Industries, Inc. | | | 114,900 | | | | 4,054,821 | | | | 1.74 | % | |
| | | | | | | | | 18,397,133 | | | | 7.87 | % | |
| | | | | | | | | | | | | | | |
| | Total Common Stocks (Cost $220,732,744) | | | | | | | 224,998,847 | | | | 96.30 | % | |
The accompanying notes are an integral part of these financial statements.
HENNESSY FUNDS 1-800-966-4354
| | SHORT-TERM INVESTMENTS – 1.42% | | Number | | | | | | % of | | |
| | | | of Shares | | | Value | | | Net Assets | | |
| | Money Market Funds – 1.42% | | | | | | | | | | |
| | Fidelity Government Portfolio, 0.0623% (c) | | $ | 3,310,638 | | | $ | 3,310,638 | | | | 1.42 | % | |
| | | | | | | | | | | | | | | |
| | Total Money Market Funds | | | | | | | | | | | | | |
| | (Cost $3,310,638) | | | | | | | 3,310,638 | | | | 1.42 | % | |
| | | | | | | | | | | | | | | |
| | Total Short-Term Investments | | | | | | | | | | | | | |
| | (Cost $3,310,638) | | | | | | | 3,310,638 | | | | 1.42 | % | |
| | | | | | | | | | | | | | | |
| | Total Investments – 97.72% | | | | | | | | | | | | | |
| | (Cost $224,043,382) | | | | | | | 228,309,485 | | | | 97.72 | % | |
| | | | | | | | | | | | | | | |
| | Other Assets in Excess of Liabilities – 2.28% | | | | | | | 5,328,868 | | | | 2.28 | % | |
| | TOTAL NET ASSETS – 100.00% | | | | | | $ | 233,638,353 | | | | 100.00 | % | |
Percentages are stated as a percent of net assets.
(a)Non Income Producing
(b)Foreign Issued Security
(c)The rate listed is the Fund’s 7-day yield as of October 31, 2009.
Summary of Fair Value Exposure at October 31, 2009
The Fund has adopted authoritative fair valuation accounting standards which establish an authoritative definition of fair value and set out a hierarchy for measuring fair value. These standards require additional disclosures about the various inputs and valuation techniques used to develop the measurements of fair value and a discussion in changes in valuation techniques and related inputs during the period. These inputs are summarized in the three broad levels listed below.
The Fund has performed an analysis of all existing investments to determine the significance and character of all inputs to their fair value determination.
| | Level 1 – | Quoted unadjusted prices for identical instruments in active markets to which the fund has access at the date of measurement |
| | Level 2 – | Quoted prices for similar instruments in active markets; quoted prices for identical or similar instruments in markets that are not active; and model-derived valuations in which all significant inputs and significant value drivers are observable in active markets. Level 2 inputs are those in markets for which there are few transactions, the prices are not current, little public information exists or instances where prices vary substantially over time or among brokered market makers. |
| | Level 3 – | Model derived valuations in which one or more significant inputs or significant value drivers are unobservable. Unobservable inputs are those inputs that reflect the fund’s own assumptions that market participants would use to price the asset or liability based on the best available information. |
The inputs or methodology used for valuing securities are not an indication of the risk associated with investing in those securities.
The accompanying notes are an integral part of these financial statements.
SUMMARY OF INVESTMENTS — HENNESSY CORNERSTONE GROWTH FUND
The following is a summary of the inputs used to value the Fund’s net assets as of October 31, 2009:
| | | | Level 1 | | | Level 2 | | | Level 3 | | | Total | |
| | Equity | | | | | | | | | | | | |
| | Consumer Discretionary | | $ | 61,090,694 | | | $ | — | | | $ | — | | | $ | 61,090,694 | |
| | Consumer Staples | | | 8,523,093 | | | | — | | | | — | | | | 8,523,093 | |
| | Energy | | | 6,290,145 | | | | — | | | | — | | | | 6,290,145 | |
| | Financials | | | 14,579,214 | | | | — | | | | — | | | | 14,579,214 | |
| | Health Care | | | 34,929,790 | | | | — | | | | — | | | | 34,929,790 | |
| | Industrials | | | 50,522,794 | | | | — | | | | — | | | | 50,522,794 | |
| | Information Technology | | | 26,611,574 | | | | — | | | | — | | | | 26,611,574 | |
| | Materials | | | 4,054,410 | | | | — | | | | — | | | | 4,054,410 | |
| | Utilities | | | 18,397,133 | | | | — | | | | — | | | | 18,397,133 | |
| | Total Equity | | $ | 224,998,847 | | | $ | — | | | $ | — | | | | 224,998,847 | |
| | Short-Term Investments | | $ | 3,310,638 | | | $ | — | | | $ | — | | | | 3,310,638 | |
| | Total Investments in Securities | | $ | 228,309,485 | | | $ | — | | | $ | — | | | $ | 228,309,485 | |
The accompanying notes are an integral part of these financial statements.
HENNESSY FUNDS 1-800-966-4354
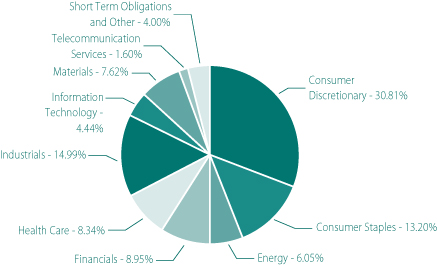
HENNESSY CORNERSTONE
GROWTH FUND, SERIES II
(% of Net Assets)
| | TOP TEN EQUITY HOLDINGS | % of net assets |
| | Schweitzer-Mauduit International, Inc. | 3.53% |
| | Dollar Thrifty Automotive Group Co. | 3.42% |
| | SXC Health Solutions Corp. | 3.22% |
| | Evercore Partners, Inc. | 3.01% |
| | Cott Corp. | 2.79% |
| | Madden Steven Ltd. | 2.73% |
| | Kirklands, Inc. | 2.44% |
| | Jos. A Bank Clothiers, Inc. | 2.38% |
| | Peet’s Coffee & Tea, Inc. | 2.34% |
| | APAC Customer Services, Inc. | 2.27% |
SUMMARY OF INVESTMENTS — HENNESSY CORNERSTONE GROWTH FUND, SERIES II
| | COMMON STOCKS – 96.00% | | Number | | | | | | % of Net | | |
| | | | of Shares | | | Value | | | Assets | | |
| | Consumer Discretionary – 30.81% | | | | | | | | | | |
| | 99 Cents Only Stores (a) | | | 39,900 | | | $ | 453,663 | | | | 1.51 | % | |
| | Aaron’s, Inc. | | | 17,600 | | | | 440,880 | | | | 1.46 | % | |
| | Carter’s, Inc. (a) | | | 22,800 | | | | 538,080 | | | | 1.79 | % | |
| | Fuqi International, Inc. (a) | | | 30,900 | | | | 633,141 | | | | 2.10 | % | |
| | H H Gregg, Inc. (a) | | | 33,800 | | | | 557,362 | | | | 1.85 | % | |
| | Isle Of Capri Casinos, Inc. (a) | | | 43,700 | | | | 338,675 | | | | 1.13 | % | |
| | Jos A Bank Clothiers, Inc. (a) | | | 17,500 | | | | 717,150 | | | | 2.38 | % | |
| | Kirklands, Inc. (a) | | | 58,300 | | | | 733,414 | | | | 2.44 | % | |
| | Lincoln Educational Services Corp. (a) | | | 28,800 | | | | 570,816 | | | | 1.90 | % | |
| | Madden Steven Ltd. (a) | | | 20,300 | | | | 822,150 | | | | 2.73 | % | |
| | National Presto Industries, Inc. | | | 6,900 | | | | 599,817 | | | | 1.99 | % | |
| | P F Changs China Bistro, Inc. (a) | | | 17,100 | | | | 499,149 | | | | 1.66 | % | |
| | Peet’s Coffee & Tea, Inc. (a) | | | 20,700 | | | | 703,800 | | | | 2.34 | % | |
| | Pep Boys Manny Moe & Jack | | | 56,600 | | | | 496,382 | | | | 1.65 | % | |
| | Spartan Motors, Inc. | | | 50,000 | | | | 249,500 | | | | 0.83 | % | |
| | Sturm Ruger & Co., Inc. | | | 42,800 | | | | 454,536 | | | | 1.51 | % | |
| | Texas Roadhouse, Inc. (a) | | | 48,900 | | | | 463,083 | | | | 1.54 | % | |
| | | | | | | | | 9,271,598 | | | | 30.81 | % | |
| | Consumer Staples – 13.20% | | | | | | | | | | | | | |
| | Calavo Growers, Inc. | | | 26,900 | | | | 480,165 | | | | 1.60 | % | |
| | Central Garden & Pet Co. (a) | | | 56,200 | | | | 531,652 | | | | 1.77 | % | |
| | Coca Cola Bottling Co. Consolidated | | | 9,600 | | | | 431,136 | | | | 1.43 | % | |
| | Cott Corp. (a)(b) | | | 106,100 | | | | 838,190 | | | | 2.79 | % | |
| | J & J Snack Foods Corp. | | | 15,000 | | | | 587,550 | | | | 1.95 | % | |
| | Lancaster Colony Corp. | | | 12,100 | | | | 587,818 | | | | 1.95 | % | |
| | United Natural Foods, Inc. (a) | | | 21,400 | | | | 515,954 | | | | 1.71 | % | |
| | | | | | | | | 3,972,465 | | | | 13.20 | % | |
| | Energy – 6.05% | | | | | | | | | | | | | |
| | Nustar Energy LP | | | 10,500 | | | | 563,430 | | | | 1.87 | % | |
| | Sunoco Logistics Partners LP | | | 10,100 | | | | 590,345 | | | | 1.96 | % | |
| | World Fuel Services Corp. | | | 13,100 | | | | 666,135 | | | | 2.22 | % | |
| | | | | | | | | 1,819,910 | | | | 6.05 | % | |
The accompanying notes are an integral part of these financial statements.
HENNESSY FUNDS 1-800-966-4354
| | COMMON STOCKS | | Number | | | | | | % of Net | | |
| | | | of Shares | | | Value | | | Assets | | |
| | Financials – 8.95% | | | | | | | | | | |
| | Encore Cap Group, Inc. (a) | | | 44,300 | | | $ | 663,171 | | | | 2.20 | % | |
| | Evercore Partners, Inc. | | | 27,700 | | | | 904,128 | | | | 3.01 | % | |
| | First Horizon National Corp. (a) | | | 43,300 | | | | 512,239 | | | | 1.70 | % | |
| | Stifel Financial Corp. (a) | | | 11,800 | | | | 613,128 | | | | 2.04 | % | |
| | | | | | | | | 2,692,666 | | | | 8.95 | % | |
| | Health Care – 8.34% | | | | | | | | | | | | | |
| | Bio-reference Labs, Inc. (a) | | | 17,200 | | | | 556,076 | | | | 1.85 | % | |
| | Cantel Medical Corp. (a) | | | 33,600 | | | | 539,616 | | | | 1.79 | % | |
| | Rehabcare Group, Inc. (a) | | | 23,800 | | | | 446,250 | | | | 1.48 | % | |
| | SXC Health Solutions Corp. (a)(b) | | | 21,200 | | | | 968,416 | | | | 3.22 | % | |
| | | | | | | | | 2,510,358 | | | | 8.34 | % | |
| | Industrials – 14.99% | | | | | | | | | | | | | |
| | APAC Customer Services, Inc. (a) | | | 105,900 | | | | 683,055 | | | | 2.27 | % | |
| | Baker Michael Corp. (a) | | | 13,300 | | | | 474,810 | | | | 1.58 | % | |
| | Cubic Corp. | | | 15,300 | | | | 531,063 | | | | 1.76 | % | |
| | Dollar Thrifty Automotive Group Co. (a) | | | 55,600 | | | | 1,029,156 | | | | 3.42 | % | |
| | Force Protection, Inc. (a) | | | 69,100 | | | | 304,040 | | | | 1.01 | % | |
| | Goodrich Corp. | | | 10,600 | | | | 576,110 | | | | 1.91 | % | |
| | Marten Transport Ltd. (a) | | | 25,300 | | | | 443,762 | | | | 1.48 | % | |
| | Tetra Tech, Inc. (a) | | | 18,300 | | | | 470,859 | | | | 1.56 | % | |
| | | | | | | | | 4,512,855 | | | | 14.99 | % | |
| | Information Technology – 4.44% | | | | | | | | | | | | | |
| | Black Box Corp. | | | 14,900 | | | | 394,999 | | | | 1.31 | % | |
| | Global Cash Access Holdings Inc (a) | | | 75,600 | | | | 478,548 | | | | 1.59 | % | |
| | NCI, Inc. (a) | | | 17,200 | | | | 462,852 | | | | 1.54 | % | |
| | | | | | | | | 1,336,399 | | | | 4.44 | % | |
| | Materials – 7.62% | | | | | | | | | | | | | |
| | Bway Holding Co. (a) | | | 33,500 | | | | 595,295 | | | | 1.98 | % | |
| | Rock-Tenn Co. | | | 14,500 | | | | 635,100 | | | | 2.11 | % | |
| | Schweitzer-Mauduit International, Inc. | | | 20,600 | | | | 1,063,990 | | | | 3.53 | % | |
| | | | | | | | | 2,294,385 | | | | 7.62 | % | |
The accompanying notes are an integral part of these financial statements.
SUMMARY OF INVESTMENTS — HENNESSY CORNERSTONE GROWTH FUND, SERIES II
| | COMMON STOCKS | | Number | | | | | | % of Net | | |
| | | | of Shares | | | Value | | | Assets | | |
| | Telecommunication Services – 1.60% | | | | | | | | | | |
| | USA Mobility, Inc. | | | 44,100 | | | $ | 480,690 | | | | 1.60 | % | |
| | | | | | | | | | | | | | | |
| | Total Common Stocks (Cost $26,393,200) | | | | | | | 28,891,326 | | | | 96.00 | % | |
| | | | | | | | | | | | | | | |
| | SHORT-TERM INVESTMENTS – 4.25% | | | | | | | | | | | | | |
| | Money Market Funds – 4.25% | | | | | | | | | | | | | |
| | Fidelity Government Portfolio, 0.0623% (c) | | $ | 1,280,481 | | | $ | 1,280,481 | | | | 4.25 | % | |
| | | | | | | | | | | | | | | |
| | Total Money Market Funds | | | | | | | | | | | | | |
| | (Cost $1,280,481) | | | | | | | 1,280,481 | | | | 4.25 | % | |
| | | | | | | | | | | | | | | |
| | Total Short-Term Investments | | | | | | | | | | | | | |
| | (Cost $1,280,481) | | | | | | | 1,280,481 | | | | 4.25 | % | |
| | | | | | | | | | | | | | | |
| | Total Investments – 100.25% | | | | | | | | | | | | | |
| | (Cost $27,673,681) | | | | | | | 30,171,807 | | | | 100.25 | % | |
| | | | | | | | | | | | | | | |
| | Liabilities in Excess of Other Assets – (0.25)% | | | | | | | (74,144 | ) | | | -0.25 | % | |
| | TOTAL NET ASSETS – 100.00% | | | | | | $ | 30,097,663 | | | | 100.00 | % | |
Percentages are stated as a percent of net assets.
(a)Non Income Producing
(b)Foreign Issued Security
(c)The rate listed is the Fund’s 7-day yield as of October 31, 2009.
The accompanying notes are an integral part of these financial statements.
HENNESSY FUNDS 1-800-966-4354
Summary of Fair Value Exposure at October 31, 2009
The Fund has adopted authoritative fair valuation accounting standards which establish an authoritative definition of fair value and set out a hierarchy for measuring fair value. These standards require additional disclosures about the various inputs and valuation techniques used to develop the measurements of fair value and a discussion in changes in valuation techniques and related inputs during the period. These inputs are summarized in the three broad levels listed below.
The Fund has performed an analysis of all existing investments to determine the significance and character of all inputs to their fair value determination.
| | Level 1 – | Quoted unadjusted prices for identical instruments in active markets to which the fund has access at the date of measurement |
| | Level 2 – | Quoted prices for similar instruments in active markets; quoted prices for identical or similar instruments in markets that are not active; and model-derived valuations in which all significant inputs and significant value drivers are observable in active markets. Level 2 inputs are those in markets for which there are few transactions, the prices are not current, little public information exists or instances where prices vary substantially over time or among brokered market makers. |
| | Level 3 – | Model derived valuations in which one or more significant inputs or significant value drivers are unobservable. Unobservable inputs are those inputs that reflect the fund’s own assumptions that market participants would use to price the asset or liability based on the best available information. |
The inputs or methodology used for valuing securities are not an indication of the risk associated with investing in those securities.
The following is a summary of the inputs used to value the Fund’s net assets as of October 31, 2009:
| | | | Level 1 | | | Level 2 | | | Level 3 | | | Total | |
| | Equity | | | | | | | | | | | | |
| | Consumer Discretionary | | $ | 9,271,598 | | | $ | — | | | $ | — | | | $ | 9,271,598 | |
| | Consumer Staples | | | 3,972,465 | | | | — | | | | — | | | | 3,972,465 | |
| | Energy | | | 1,819,910 | | | | — | | | | — | | | | 1,819,910 | |
| | Financials | | | 2,692,666 | | | | — | | | | — | | | | 2,692,666 | |
| | Health Care | | | 2,510,358 | | | | — | | | | — | | | | 2,510,358 | |
| | Industrials | | | 4,512,855 | | | | — | | | | — | | | | 4,512,855 | |
| | Information Technology | | | 1,336,399 | | | | — | | | | — | | | | 1,336,399 | |
| | Materials | | | 2,294,385 | | | | — | | | | — | | | | 2,294,385 | |
| | Telecommunication Services | | | 480,690 | | | | — | | | | — | | | | 480,690 | |
| | Total Equity | | $ | 28,891,326 | | | $ | — | | | $ | — | | | | 28,891,326 | |
| | Short-Term Investments | | $ | 1,280,481 | | | $ | — | | | $ | — | | | | 1,280,481 | |
| | Total Investments in Securities | | $ | 30,171,807 | | | $ | — | | | $ | — | | | $ | 30,171,807 | |
The accompanying notes are an integral part of these financial statements.
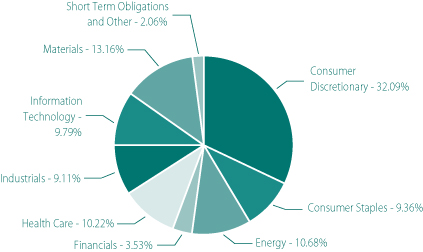
SUMMARY OF INVESTMENTS — HENNESSY FOCUS 30 FUND
HENNESSY FOCUS 30 FUND
(% of Net Assets)
| | TOP TEN EQUITY HOLDINGS | % of net assets |
| | Tupperware Brands Corp. | 3.89% |
| | Virgin Media, Inc. | 3.86% |
| | Linn Energy LLC | 3.77% |
| | World Fuel Services Corp. | 3.66% |
| | Mylan, Inc. | 3.65% |
| | Newmarket Corp. | 3.64% |
| | Americredit Corp. | 3.53% |
| | Computer Sciences Corp. | 3.41% |
| | Emergency Medical Services Corp. | 3.35% |
| | Ball Corp. | 3.32% |
HENNESSY FUNDS 1-800-966-4354
| | COMMON STOCKS – 97.94% | | Number | | | | | | % of Net | | |
| | | | of Shares | | | Value | | | Assets | | |
| | Consumer Discretionary – 32.09% | | | | | | | | | | |
| | Aeropostale, Inc. (a) | | | 122,000 | | | $ | 4,578,660 | | | | 2.94 | % | |
| | Carter’s, Inc. (a) | | | 202,200 | | | | 4,771,920 | | | | 3.06 | % | |
| | Darden Restaurants, Inc. | | | 147,700 | | | | 4,476,787 | | | | 2.87 | % | |
| | Dollar Tree, Inc. (a) | | | 103,400 | | | | 4,666,442 | | | | 3.00 | % | |
| | Gymboree Corp. (a) | | | 112,500 | | | | 4,789,125 | | | | 3.07 | % | |
| | O Reilly Automotive, Inc. (a) | | | 135,400 | | | | 5,047,712 | | | | 3.24 | % | |
| | Ross Stores, Inc. | | | 108,200 | | | | 4,761,882 | | | | 3.06 | % | |
| | Tractor Supply Co. (a) | | | 107,900 | | | | 4,823,130 | | | | 3.10 | % | |
| | Tupperware Brands Corp. | | | 134,600 | | | | 6,059,692 | | | | 3.89 | % | |
| | Virgin Media, Inc. | | | 430,800 | | | | 6,018,276 | | | | 3.86 | % | |
| | | | | | | | | 49,993,626 | | | | 32.09 | % | |
| | Consumer Staples – 9.36% | | | | | | | | | | | | | |
| | Coca Cola Enterprises, Inc. | | | 250,200 | | | | 4,771,314 | | | | 3.06 | % | |
| | Del Monte Foods Co. | | | 452,300 | | | | 4,884,840 | | | | 3.14 | % | |
| | Lancaster Colony Corp. | | | 101,300 | | | | 4,921,154 | | | | 3.16 | % | |
| | | | | | | | | 14,577,308 | | | | 9.36 | % | |
| | Energy – 10.68% | | | | | | | | | | | | | |
| | Linn Energy LLC | | | 239,700 | | | | 5,872,650 | | | | 3.77 | % | |
| | Plains All American Pipeline LP | | | 106,000 | | | | 5,069,980 | | | | 3.25 | % | |
| | World Fuel Services Corp. | | | 112,200 | | | | 5,705,370 | | | | 3.66 | % | |
| | | | | | | | | 16,648,000 | | | | 10.68 | % | |
| | Financials – 3.53% | | | | | | | | | | | | | |
| | Americredit Corp. (a) | | | 311,300 | | | | 5,494,445 | | | | 3.53 | % | |
| | | | | | | | | | | | | | | |
| | Health Care – 10.22% | | | | | | | | | | | | | |
| | Emergency Medical Services Corp. (a) | | | 108,600 | | | | 5,214,972 | | | | 3.35 | % | |
| | Mylan, Inc. (a) | | | 349,900 | | | | 5,682,376 | | | | 3.65 | % | |
| | Watson Pharmaceuticals, Inc. (a) | | | 146,000 | | | | 5,025,320 | | | | 3.22 | % | |
| | | | | | | | | 15,922,668 | | | | 10.22 | % | |
| | Industrials – 9.11% | | | | | | | | | | | | | |
| | Goodrich Corp. | | | 90,800 | | | | 4,934,980 | | | | 3.17 | % | |
| | KBR, Inc. | | | 233,100 | | | | 4,771,557 | | | | 3.06 | % | |
| | Tetra Tech, Inc. (a) | | | 174,300 | | | | 4,484,739 | | | | 2.88 | % | |
| | | | | | | | | 14,191,276 | | | | 9.11 | % | |
The accompanying notes are an integral part of these financial statements.
SUMMARY OF INVESTMENTS — HENNESSY FOCUS 30 FUND
| | COMMON STOCKS | | Number | | | | | | % of Net | | |
| | | | of Shares | | | Value | | | Assets | | |
| | Information Technology – 9.79% | | | | | | | | | | |
| | Broadridge Financial Solutions Inc. | | | 236,800 | | | $ | 4,927,808 | | | | 3.16 | % | |
| | Computer Sciences Corp. (a) | | | 104,700 | | | | 5,309,337 | | | | 3.41 | % | |
| | Tech Data Corp. (a) | | | 130,400 | | | | 5,011,272 | | | | 3.22 | % | |
| | | | | | | | | 15,248,417 | | | | 9.79 | % | |
| | Materials – 13.16% | | | | | | | | | | | | | |
| | Ball Corp. | | | 105,000 | | | | 5,179,650 | | | | 3.32 | % | |
| | Newmarket Corp. | | | 60,700 | | | | 5,675,450 | | | | 3.64 | % | |
| | Rock-Tenn Co. | | | 103,100 | | | | 4,515,780 | | | | 2.90 | % | |
| | Scotts Miracle Gro Co. | | | 126,600 | | | | 5,142,492 | | | | 3.30 | % | |
| | | | | | | | | 20,513,372 | | | | 13.16 | % | |
| | | | | | | | | | | | | | | |
| | Total Common Stocks (Cost $152,647,649) | | | | | | | 152,589,112 | | | | 97.94 | % | |
| | | | | | | | | | | | | | | |
| | WARRANTS – 0.00% | | | | | | | | | | | | | |
| | Lantronix Inc., Warrant ^ | | | | | | | | | | | | | |
| | Expiration: February, 2011, | | | | | | | | | | | | | |
| | Exercise Price: $0.850 | | | 158 | | | | 0 | | | | 0.00 | % | |
| | | | | | | | | | | | | | | |
| | Total Warrants (Cost $0) | | | | | | | 0 | | | | 0.00 | % | |
| | | | | | | | | | | | | | | |
| | SHORT-TERM INVESTMENTS – 2.28% | | | | | | | | | | | | | |
| | Money Market Funds – 2.28% | | | | | | | | | | | | | |
| | Fidelity Government Portfolio, 0.0623% (b) | | $ | 3,549,694 | | | | 3,549,694 | | | | 2.28 | % | |
| | | | | | | | | | | | | | | |
| | Total Money Market Funds | | | | | | | | | | | | | |
| | (Cost $3,549,694) | | | | | | | 3,549,694 | | | | 2.28 | % | |
| | | | | | | | | | | | | | | |
| | Total Short-Term Investments | | | | | | | | | | | | | |
| | (Cost $3,549,694) | | | | | | | 3,549,694 | | | | 2.28 | % | |
| | | | | | | | | | | | | | | |
| | Total Investments – 100.22% | | | | | | | | | | | | | |
| | (Cost $156,197,343) | | | | | | | 156,138,806 | | | | 100.22 | % | |
| | | | | | | | | | | | | | | |
| | Liabilities in Excess of Other Assets – (0.22)% | | | | | | | (341,332 | ) | | | -0.22 | % | |
| | TOTAL NET ASSETS – 100.00% | | | | | | $ | 155,797,474 | | | | 100.00 | % | |
Percentages are stated as a percent of net assets.
| (b) | The rate listed is the Fund’s 7-day yield as of October 31, 2009. |
The accompanying notes are an integral part of these financial statements.
HENNESSY FUNDS 1-800-966-4354
Summary of Fair Value Exposure at October 31, 2009
The Fund has adopted authoritative fair valuation accounting standards which establish an authoritative definition of fair value and set out a hierarchy for measuring fair value. These standards require additional disclosures about the various inputs and valuation techniques used to develop the measurements of fair value and a discussion in changes in valuation techniques and related inputs during the period. These inputs are summarized in the three broad levels listed below.
The Fund has performed an analysis of all existing investments to determine the significance and character of all inputs to their fair value determination.
| | Level 1 – | Quoted unadjusted prices for identical instruments in active markets to which the fund has access at the date of measurement |
| | Level 2 – | Quoted prices for similar instruments in active markets; quoted prices for identical or similar instruments in markets that are not active; and model-derived valuations in which all significant inputs and significant value drivers are observable in active markets. Level 2 inputs are those in markets for which there are few transactions, the prices are not current, little public information exists or instances where prices vary substantially over time or among brokered market makers. |
| | Level 3 – | Model derived valuations in which one or more significant inputs or significant value drivers are unobservable. Unobservable inputs are those inputs that reflect the fund’s own assumptions that market participants would use to price the asset or liability based on the best available information. |
The inputs or methodology used for valuing securities are not an indication of the risk associated with investing in those securities.
The following is a summary of the inputs used to value the Fund’s net assets as of October 31, 2009:
| | | | Level 1 | | | Level 2 | | | Level 3 | | | Total | |
| | Equity | | | | | | | | | | | | |
| | Consumer Discretionary | | $ | 49,993,626 | | | $ | — | | | $ | — | | | $ | 49,993,626 | |
| | Consumer Staples | | | 14,577,308 | | | | — | | | | — | | | | 14,577,308 | |
| | Energy | | | 16,648,000 | | | | — | | | | — | | | | 16,648,000 | |
| | Financials | | | 5,494,445 | | | | — | | | | — | | | | 5,494,445 | |
| | Health Care | | | 15,922,668 | | | | — | | | | — | | | | 15,922,668 | |
| | Industrials | | | 14,191,276 | | | | — | | | | — | | | | 14,191,276 | |
| | Information Technology | | | 15,248,417 | | | | — | | | | — | | | | 15,248,417 | |
| | Materials | | | 20,513,372 | | | | — | | | | — | | | | 20,513,372 | |
| | Total Equity | | $ | 152,589,112 | | | $ | — | | | $ | — | | | $ | 152,589,112 | |
| | Warrants | | $ | — | | | $ | — | | | $ | — | (1) | | $ | — | |
| | Short-Term Investments | | $ | 3,549,694 | | | $ | — | | | $ | — | | | $ | 3,549,694 | |
| | Total Investments in Securities | | $ | 156,138,806 | | | $ | — | | | $ | — | | | $ | 156,138,806 | |
| (1) | If the Lantronix, Inc. warrant would have had a value, it would have been a Level 3 fair value. The warrant has been fair valued at $0 during the entire reporting period. |
The accompanying notes are an integral part of these financial statements.
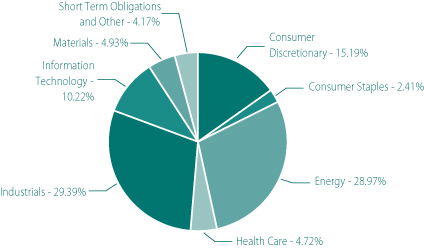
SUMMARY OF INVESTMENTS — HENNESSY CORNERSTONE LARGE GROWTH FUND
HENNESSY CORNERSTONE
LARGE GROWTH FUND
(% of Net Assets)
| | TOP TEN EQUITY HOLDINGS | % of net assets |
| | Coach, Inc. | 2.95% |
| | Western Digital Corp. | 2.61% |
| | Cummins, Inc. | 2.46% |
| | Avon Products, Inc. | 2.41% |
| | The Gap, Inc. | 2.39% |
| | Halliburton Co. | 2.33% |
| | Dish Network Corp. | 2.26% |
| | General Dynamics Corp. | 2.24% |
| | Precision Castparts Corp. | 2.23% |
| | Cameron International Corp. | 2.20% |
HENNESSY FUNDS 1-800-966-4354
| | COMMON STOCKS – 95.83% | | Number | | | | | | % of Net | | |
| | | | of Shares | | | Value | | | Assets | | |
| | Consumer Discretionary – 15.19% | | | | | | | | | | |
| | Best Buy Co, Inc. | | | 28,900 | | | $ | 1,103,402 | | | | 1.59 | % | |
| | Coach, Inc. | | | 62,100 | | | | 2,047,437 | | | | 2.95 | % | |
| | Dish Network Corp. (a) | | | 90,100 | | | | 1,567,740 | | | | 2.26 | % | |
| | The Gap, Inc. | | | 77,800 | | | | 1,660,252 | | | | 2.39 | % | |
| | The McGraw-Hill Companies, Inc. | | | 49,300 | | | | 1,418,854 | | | | 2.04 | % | |
| | Omnicom Group | | | 39,200 | | | | 1,343,776 | | | | 1.93 | % | |
| | TJX Cos., Inc. | | | 37,800 | | | | 1,411,830 | | | | 2.03 | % | |
| | | | | | | | | 10,553,291 | | | | 15.19 | % | |
| | Consumer Staples – 2.41% | | | | | | | | | | | | | |
| | Avon Products, Inc. | | | 52,200 | | | | 1,673,010 | | | | 2.41 | % | |
| | | | | | | | | | | | | | | |
| | Energy – 28.97% | | | | | | | | | | | | | |
| | Baker Hughes, Inc. | | | 30,100 | | | | 1,266,307 | | | | 1.82 | % | |
| | Cameron International Corp. (a) | | | 41,300 | | | | 1,526,861 | | | | 2.20 | % | |
| | ChevronTexaco Corp. | | | 14,400 | | | | 1,102,176 | | | | 1.59 | % | |
| | ConocoPhillips | | | 24,700 | | | | 1,239,446 | | | | 1.78 | % | |
| | Denbury Resources, Inc. (a) | | | 59,400 | | | | 867,240 | | | | 1.25 | % | |
| | Diamond Offshore Drilling | | | 14,100 | | | | 1,343,025 | | | | 1.93 | % | |
| | ENSCO International, Inc. | | | 33,200 | | | | 1,520,228 | | | | 2.19 | % | |
| | EOG Resources, Inc. | | | 15,100 | | | | 1,233,066 | | | | 1.78 | % | |
| | Exxon Mobil Corp. | | | 14,100 | | | | 1,010,547 | | | | 1.45 | % | |
| | Halliburton Co. | | | 55,400 | | | | 1,618,234 | | | | 2.33 | % | |
| | Hess Corp. | | | 15,100 | | | | 826,574 | | | | 1.19 | % | |
| | Marathon Oil Corp. | | | 38,400 | | | | 1,227,648 | | | | 1.77 | % | |
| | Murphy Oil Corp. | | | 19,500 | | | | 1,192,230 | | | | 1.72 | % | |
| | Noble Corporation Baar (b) | | | 37,000 | | | | 1,507,380 | | | | 2.17 | % | |
| | Occidental Petroleum Corp. | | | 16,400 | | | | 1,244,432 | | | | 1.79 | % | |
| | Schlumberger Ltd. (b) | | | 22,500 | | | | 1,399,500 | | | | 2.01 | % | |
| | | | | | | | | 20,124,894 | | | | 28.97 | % | |
| | Health Care – 4.72% | | | | | | | | | | | | | |
| | Eli Lilly & Co. | | | 28,700 | | | | 976,087 | | | | 1.41 | % | |
| | Forest Laboratories, Inc. (a) | | | 44,100 | | | | 1,220,247 | | | | 1.76 | % | |
| | Merck & Co., Inc. | | | 34,900 | | | | 1,079,457 | | | | 1.55 | % | |
| | | | | | | | | 3,275,791 | | | | 4.72 | % | |
The accompanying notes are an integral part of these financial statements.
SUMMARY OF INVESTMENTS — HENNESSY CORNERSTONE LARGE GROWTH FUND
| | COMMON STOCKS | | Number | | | | | | % of Net | | |
| | | | of Shares | | | Value | | | Assets | | |
| | Industrials – 29.39% | | | | | | | | | | |
| | 3M Co. | | | 20,300 | | | $ | 1,493,471 | | | | 2.15 | % | |
| | Boeing Co. | | | 28,700 | | | | 1,371,860 | | | | 1.98 | % | |
| | Cooper Industries Ltd. (b) | | | 39,300 | | | | 1,520,517 | | | | 2.19 | % | |
| | Cummins, Inc. | | | 39,700 | | | | 1,709,482 | | | | 2.46 | % | |
| | Emerson Electric Co. | | | 34,800 | | | | 1,313,700 | | | | 1.89 | % | |
| | Fluor Corp. | | | 25,500 | | | | 1,132,710 | | | | 1.63 | % | |
| | General Dynamics Corp. | | | 24,800 | | | | 1,554,960 | | | | 2.24 | % | |
| | Goodrich Corp. | | | 25,000 | | | | 1,358,750 | | | | 1.96 | % | |
| | Honeywell International, Inc. | | | 34,600 | | | | 1,241,794 | | | | 1.79 | % | |
| | ITT Industries, Inc. | | | 24,700 | | | | 1,252,290 | | | | 1.80 | % | |
| | Lockheed Martin Corp. | | | 13,800 | | | | 949,302 | | | | 1.37 | % | |
| | Pitney Bowes, Inc. | | | 42,700 | | | | 1,046,150 | | | | 1.51 | % | |
| | Precision Castparts Corp. | | | 16,200 | | | | 1,547,586 | | | | 2.23 | % | |
| | Rockwell Collins, Inc. | | | 29,700 | | | | 1,496,286 | | | | 2.15 | % | |
| | United Technologies Corp. | | | 23,000 | | | | 1,413,350 | | | | 2.04 | % | |
| | | | | | | | | 20,402,208 | | | | 29.39 | % | |
| | Information Technology – 10.22% | | | | | | | | | | | | | |
| | Dell, Inc. (a) | | | 94,400 | | | | 1,367,856 | | | | 1.97 | % | |
| | International Business Machines Corp. | | | 10,100 | | | | 1,218,161 | | | | 1.75 | % | |
| | Mastercard, Inc. | | | 6,000 | | | | 1,314,120 | | | | 1.89 | % | |
| | Texas Instruments, Inc. | | | 59,100 | | | | 1,385,895 | | | | 2.00 | % | |
| | Western Digital Corp. (a) | | | 53,900 | | | | 1,815,352 | | | | 2.61 | % | |
| | | | | | | | | 7,101,384 | | | | 10.22 | % | |
| | Materials – 4.93% | | | | | | | | | | | | | |
| | Consol Energy, Inc. | | | 32,400 | | | | 1,387,044 | | | | 1.99 | % | |
| | Mosaic Co. | | | 22,400 | | | | 1,046,752 | | | | 1.51 | % | |
| | Nucor Corp. | | | 24,900 | | | | 992,265 | | | | 1.43 | % | |
| | | | | | | | | 3,426,061 | | | | 4.93 | % | |
| | | | | | | | | | | | | | | |
| | Total Common Stocks (Cost $51,037,781) | | | | | | | 66,556,639 | | | | 95.83 | % | |
The accompanying notes are an integral part of these financial statements.
HENNESSY FUNDS 1-800-966-4354
| | SHORT-TERM INVESTMENTS – 4.21% | | Shares/Principal | | | | | | % of Net | | |
| | | | Amount | | | Value | | | Assets | | |
| | Money Market Funds – 4.18% | | | | | | | | | | |
| | Fidelity Government Portfolio, 0.080% (c) | | $ | 2,898,149 | | | $ | 2,898,149 | | | | 4.18 | % | |
| | | | | | | | | | | | | | | |
| | Total Investment Company | | | | | | | | | | | | | |
| | (Cost $2,898,149) | | | | | | | 2,898,149 | | | | 4.18 | % | |
| | | | | | | | | | | | | | | |
| | Variable Rate Demand Notes# – 0.03% | | | | | | | | | | | | | |
| | American Family Financial Services, 0.100% | | | 21,078 | | | | 21,078 | | | | 0.03 | % | |
| | | | | | | | | | | | | | | |
| | Total Variable Demand Notes | | | | | | | | | | | | | |
| | (Cost $21,078) | | | | | | | 21,078 | | | | 0.03 | % | |
| | | | | | | | | | | | | | | |
| | Total Short-Term Investments | | | | | | | | | | | | | |
| | (Cost $2,919,227) | | | | | | | 2,919,227 | | | | 4.21 | % | |
| | | | | | | | | | | | | | | |
| | Total Investments – 100.04% | | | | | | | | | | | | | |
| | (Cost $53,957,008) | | | | | | | 69,475,866 | | | | 100.04 | % | |
| | | | | | | | | | | | | | | |
| | Liabilities in Excess of Other Assets – (0.04)% | | | | | | | (25,753 | ) | | | (0.04 | )% | |
| | TOTAL NET ASSETS – 100.00% | | | | | | $ | 69,450,113 | | | | 100.00 | % | |
Percentages are stated as a percent of net assets.
| (b) | Foreign issued security |
| (c) | The rate listed is the Fund’s 7-day yield as of October 31, 2009. |
| # | Variable rate demand notes are considered short-term obligations and are payable on demand. Interest rates change periodically on specified dates. The rates listed are as of October 31, 2009. |
Summary of Fair Value Exposure at October 31, 2009
The Fund has adopted authoritative fair valuation accounting standards which establish an authoritative definition of fair value and set out a hierarchy for measuring fair value. These standards require additional disclosures about the various inputs and valuation techniques used to develop the measurements of fair value and a discussion in changes in valuation techniques and related inputs during the period. These inputs are summarized in the three broad levels listed below.
The accompanying notes are an integral part of these financial statements.
SUMMARY OF INVESTMENTS — HENNESSY CORNERSTONE LARGE GROWTH FUND
The Fund has performed an analysis of all existing investments to determine the significance and character of all inputs to their fair value determination.
| | Level 1 – | Quoted unadjusted prices for identical instruments in active markets to which the fund has access at the date of measurement |
| | Level 2 – | Quoted prices for similar instruments in active markets; quoted prices for identical or similar instruments in markets that are not active; and model-derived valuations in which all significant inputs and significant value drivers are observable in active markets. Level 2 inputs are those in markets for which there are few transactions, the prices are not current, little public information exists or instances where prices vary substantially over time or among brokered market makers. |
| | Level 3 – | Model derived valuations in which one or more significant inputs or significant value drivers are unobservable. Unobservable inputs are those inputs that reflect the fund’s own assumptions that market participants would use to price the asset or liability based on the best available information. |
The inputs or methodology used for valuing securities are not an indication of the risk associated with investing in those securities.
The following is a summary of the inputs used to value the Fund’s net assets as of October 31, 2009:
| | Common Stock | | Level 1 | | | Level 2 | | | Level 3 | | | Total | |
| | Consumer Discretionary | | $ | 10,553,291 | | | $ | — | | | $ | — | | | $ | 10,553,291 | |
| | Consumer Staples | | | 1,673,010 | | | | — | | | | — | | | | 1,673,010 | |
| | Energy | | | 20,124,894 | | | | — | | | | — | | | | 20,124,894 | |
| | Health Care | | | 3,275,791 | | | | — | | | | — | | | | 3,275,791 | |
| | Industrials | | | 20,402,208 | | | | — | | | | — | | | | 20,402,208 | |
| | Information Technology | | | 7,101,384 | | | | — | | | | — | | | | 7,101,384 | |
| | Materials | | | 3,426,061 | | | | — | | | | — | | | | 3,426,061 | |
| | Total Common Stock | | $ | 66,556,639 | | | $ | — | | | $ | — | | | $ | 66,556,639 | |
| | Short Term Investments | | $ | 2,898,149 | | | $ | 21,078 | | | $ | — | | | $ | 2,919,227 | |
| | Total Investments in Securities | | $ | 69,454,788 | | | $ | 21,078 | | | $ | — | | | $ | 69,475,866 | |
The accompanying notes are an integral part of these financial statements.
HENNESSY FUNDS 1-800-966-4354
HENNESSY CORNERSTONE VALUE FUND
(% of Net Assets)
| | TOP TEN EQUITY HOLDINGS | % of net assets |
| | Rio Tinto PLC | 3.73% |
| | Southern Copper Corp. | 3.49% |
| | Credit Suisse Group – ADR | 2.92% |
| | Vimpel Communications – ADR | 2.90% |
| | Morgan Stanley | 2.78% |
| | Macys, Inc. | 2.78% |
| | International Paper Co. | 2.75% |
| | CNOOC Ltd. – ADR | 2.63% |
| | Limited Brands, Inc. | 2.56% |
| | Starwood Hotels & Resorts Worldwide | 2.46% |
SUMMARY OF INVESTMENTS — HENNESSY CORNERSTONE VALUE FUND
| | COMMON STOCKS – 97.16% | | Number | | | | | | % of Net | | |
| | | | of Shares | | | Value | | | Assets | | |
| | Consumer Discretionary – 15.73% | | | | | | | | | | |
| | CBS Corp. | | | 270,500 | | | $ | 3,183,785 | | | | 2.17 | % | |
| | Daimler AG | | | 67,300 | | | | 3,245,879 | | | | 2.21 | % | |
| | Harley-Davidson, Inc. | | | 120,400 | | | | 3,000,368 | | | | 2.04 | % | |
| | Limited Brands, Inc. | | | 214,000 | | | | 3,766,400 | | | | 2.56 | % | |
| | Macys, Inc. | | | 232,200 | | | | 4,079,754 | | | | 2.78 | % | |
| | Newell Rubbermaid, Inc. | | | 153,400 | | | | 2,225,834 | | | | 1.51 | % | |
| | Starwood Hotels & Resorts Worldwide | | | 124,600 | | | | 3,620,876 | | | | 2.46 | % | |
| | | | | | | | | 23,122,896 | | | | 15.73 | % | |
| | Consumer Staples – 5.14% | | | | | | | | | | | | | |
| | Altria Group, Inc. | | | 133,300 | | | | 2,414,063 | | | | 1.64 | % | |
| | Reynolds American, Inc. | | | 48,100 | | | | 2,331,888 | | | | 1.59 | % | |
| | Supervalu, Inc. | | | 176,900 | | | | 2,807,403 | | | | 1.91 | % | |
| | | | | | | | | 7,553,354 | | | | 5.14 | % | |
| | Energy – 11.74% | | | | | | | | | | | | | |
| | BP PLC – ADR (b) | | | 45,900 | | | | 2,598,858 | | | | 1.77 | % | |
| | CNOOC Ltd. – ADR (b) | | | 25,900 | | | | 3,857,546 | | | | 2.63 | % | |
| | ENI SPA – ADR (b) | | | 48,400 | | | | 2,399,672 | | | | 1.63 | % | |
| | Enterprise Products Partners LP | | | 100,900 | | | | 2,829,236 | | | | 1.93 | % | |
| | Sasol Ltd. – ADR (b) | | | 81,100 | | | | 3,032,329 | | | | 2.06 | % | |
| | Total SA – ADR (b) | | | 42,200 | | | | 2,534,954 | | | | 1.72 | % | |
| | | | | | | | | 17,252,595 | | | | 11.74 | % | |
| | Financials – 17.97% | | | | | | | | | | | | | |
| | Allianz AG – ADR (b) | | | 229,000 | | | | 2,599,150 | | | | 1.77 | % | |
| | Allstate Corp. | | | 74,000 | | | | 2,188,180 | | | | 1.49 | % | |
| | Bank of America Corp. | | | 131,200 | | | | 1,912,896 | | | | 1.30 | % | |
| | BB&T Corp. | | | 68,500 | | | | 1,637,835 | | | | 1.12 | % | |
| | Credit Suisse Group – ADR (b) | | | 80,600 | | | | 4,295,980 | | | | 2.92 | % | |
| | Hartford Financial Services Group, Inc. | | | 137,000 | | | | 3,359,240 | | | | 2.29 | % | |
| | HSBC Holdings PLC – ADR (b) | | | 37,500 | | | | 2,077,125 | | | | 1.41 | % | |
| | Morgan Stanley | | | 127,200 | | | | 4,085,664 | | | | 2.78 | % | |
| | Sun Life Financial, Inc. (b) | | | 96,900 | | | | 2,651,184 | | | | 1.80 | % | |
| | US Bancorp (d) | | | 69,200 | | | | 1,606,824 | | | | 1.09 | % | |
| | | | | | | | | 26,414,078 | | | | 17.97 | % | |
The accompanying notes are an integral part of these financial statements.
HENNESSY FUNDS 1-800-966-4354
| | COMMON STOCKS | | Number | | | | | | % of Net | | |
| | | | of Shares | | | Value | | | Assets | | |
| | Health Care – 4.38% | | | | | | | | | | |
| | Bristol-Myers Squibb Co. | | | 94,200 | | | $ | 2,053,560 | | | | 1.39 | % | |
| | Merck & Co., Inc. | | | 75,500 | | | | 2,335,215 | | | | 1.59 | % | |
| | Pfizer, Inc. | | | 120,800 | | | | 2,057,224 | | | | 1.40 | % | |
| | | | | | | | | 6,445,999 | | | | 4.38 | % | |
| | Industrials – 10.17% | | | | | | | | | | | | | |
| | General Electric Co. | | | 112,000 | | | | 1,597,120 | | | | 1.09 | % | |
| | Koninklijke Philips – ADR (b) | | | 123,900 | | | | 3,108,651 | | | | 2.11 | % | |
| | Masco Corp. | | | 196,400 | | | | 2,307,700 | | | | 1.57 | % | |
| | Pitney Bowes, Inc. | | | 85,000 | | | | 2,082,500 | | | | 1.42 | % | |
| | RR Donnelley & Sons Co. | | | 166,500 | | | | 3,343,320 | | | | 2.27 | % | |
| | Textron, Inc. | | | 141,600 | | | | 2,517,648 | | | | 1.71 | % | |
| | | | | | | | | 14,956,939 | | | | 10.17 | % | |
| | Information Technology – 4.05% | | | | | | | | | | | | | |
| | AU Optronics Corp. – ADR (b) | | | 352,000 | | | | 3,108,160 | | | | 2.11 | % | |
| | Taiwan Semiconductor | | | | | | | | | | | | | |
| | Manufacturing Co., Ltd. – ADR (b) | | | 299,000 | | | | 2,852,460 | | | | 1.94 | % | |
| | | | | | | | | 5,960,620 | | | | 4.05 | % | |
| | Materials – 19.09% | | | | | | | | | | | | | |
| | Alcoa, Inc. | | | 245,300 | | | | 3,046,626 | | | | 2.07 | % | |
| | Arcelor Mittal – ADR (b) | | | 94,200 | | | | 3,204,684 | | | | 2.18 | % | |
| | Dow Chem Co. | | | 105,200 | | | | 2,470,096 | | | | 1.68 | % | |
| | EI Du Pont de Nemours & Co. | | | 82,900 | | | | 2,637,878 | | | | 1.79 | % | |
| | International Paper Co. | | | 180,800 | | | | 4,033,648 | | | | 2.75 | % | |
| | Rio Tinto PLC – ADR (b) | | | 30,800 | | | | 5,483,324 | | | | 3.73 | % | |
| | Southern Copper Corp. | | | 162,900 | | | | 5,131,350 | | | | 3.49 | % | |
| | Weyerhaeuser Co. | | | 56,500 | | | | 2,053,210 | | | | 1.40 | % | |
| | | | | | | | | 28,060,816 | | | | 19.09 | % | |
| | Telecommunication Services – 8.89% | | | | | | | | | | | | | |
| | AT&T, Inc. | | | 71,000 | | | | 1,822,570 | | | | 1.24 | % | |
| | Deutsche Telekom AG – ADR (b) | | | 136,400 | | | | 1,846,856 | | | | 1.26 | % | |
| | Mobile Telesystems – ADR (b) | | | 74,000 | | | | 3,352,200 | | | | 2.28 | % | |
| | Telefonica De Argentina (a)(b)^ | | | 100 | | | | — | | | | 0.00 | % | |
| | Vimpel Communications – ADR (a)(b) | | | 238,000 | | | | 4,267,340 | | | | 2.90 | % | |
The accompanying notes are an integral part of these financial statements.
SUMMARY OF INVESTMENTS — HENNESSY CORNERSTONE VALUE FUND
| | COMMON STOCKS | | Number | | | | | | % of Net | | |
| | | | of Shares | | | Value | | | Assets | | |
| | Telecommunication Services | | | | | | | | | | |
| | Verizon Communications, Inc. | | | 60,200 | | | $ | 1,781,318 | | | | 1.21 | % | |
| | | | | | | | | 13,070,284 | | | | 8.89 | % | |
| | | | | | | | | | | | | | | |
| | Total Common Stocks (Cost $130,848,714) | | | | | | | 142,837,581 | | | | 97.16 | % | |
| | | | | | | | | | | | | | | |
| | SHORT-TERM INVESTMENTS – 2.64% | | | | | | | | | | | | | |
| | Money Market Funds – 2.64% | | | | | | | | | | | | | |
| | Fidelity Government Portfolio, 0.0623% (c) | | $ | 3,873,950 | | | | 3,873,950 | | | | 2.64 | % | |
| | | | | | | | | | | | | | | |
| | Total Money Market Funds | | | | | | | | | | | | | |
| | (Cost $3,873,950) | | | | | | | 3,873,950 | | | | 2.64 | % | |
| | | | | | | | | | | | | | | |
| | Total Short-Term Investments | | | | | | | | | | | | | |
| | (Cost $3,873,950) | | | | | | | 3,873,950 | | | | 2.64 | % | |
| | | | | | | | | | | | | | | |
| | Total Investments – 99.80% | | | | | | | | | | | | | |
| | (Cost $134,722,664) | | | | | | | 146,711,531 | | | | 99.80 | % | |
| | | | | | | | | | | | | | | |
| | Other Assets in Excess of Liabilities – 0.20% | | | | | | | 300,236 | | | | 0.20 | % | |
| | TOTAL NET ASSETS – 100.00% | | | | | | $ | 147,011,767 | | | | 100.00 | % | |
Percentages are stated as a percent of net assets.
| (b) | Foreign Issued Security |
| (c) | The rate listed is the Fund’s 7-day yield as of October 31, 2009. |
| (d) | Investment in affiliated security. Quasar Distributors, LLC, which serves as the Fund’s distributor, is a subsidiary of U.S. Bancorp. Details of transactions with this affiliated company for the year ended October 31, 2009 were as follows: |
| | | Beginning | Purchase | Sales | Ending | Dividend | | Market |
| | Issuer | Cost | Cost | Cost | Cost | Income | Shares | Value |
| | U.S. Bancorp | $2,762,128 | $409,882 | $1,450,699 | $1,731,659 | $32,020 | 69,200 | $1,606,824 |
| ^ | Security is fair valued. |
The accompanying notes are an integral part of these financial statements.
HENNESSY FUNDS 1-800-966-4354
Summary of Fair Value Exposure at October 31, 2009
The Fund has adopted authoritative fair valuation accounting standards which establish an authoritative definition of fair value and set out a hierarchy for measuring fair value. These standards require additional disclosures about the various inputs and valuation techniques used to develop the measurements of fair value and a discussion in changes in valuation techniques and related inputs during the period. These inputs are summarized in the three broad levels listed below.
The Fund has performed an analysis of all existing investments to determine the significance and character of all inputs to their fair value determination.
| | Level 1 – | Quoted unadjusted prices for identical instruments in active markets to which the fund has access at the date of measurement |
| | Level 2 – | Quoted prices for similar instruments in active markets; quoted prices for identical or similar instruments in markets that are not active; and model-derived valuations in which all significant inputs and significant value drivers are observable in active markets. Level 2 inputs are those in markets for which there are few transactions, the prices are not current, little public information exists or instances where prices vary substantially over time or among brokered market makers. |
| | Level 3 – | Model derived valuations in which one or more significant inputs or significant value drivers are unobservable. Unobservable inputs are those inputs that reflect the fund’s own assumptions that market participants would use to price the asset or liability based on the best available information. |
The inputs or methodology used for valuing securities are not an indication of the risk associated with investing in those securities.
The following is a summary of the inputs used to value the Fund’s net assets as of October 31, 2009:
| | | | Level 1 | | | Level 2 | | | Level 3 | | | Total | |
| | Equity | | | | | | | | | | | | |
| | Consumer Discretionary | | $ | 23,122,896 | | | $ | — | | | $ | — | | | $ | 23,122,896 | |
| | Consumer Staples | | | 7,553,354 | | | | — | | | | — | | | | 7,553,354 | |
| | Energy | | | 17,252,595 | | | | — | | | | — | | | | 17,252,595 | |
| | Financials | | | 26,414,078 | | | | — | | | | — | | | | 26,414,078 | |
| | Health Care | | | 6,445,999 | | | | — | | | | — | | | | 6,445,999 | |
| | Industrials | | | 14,956,939 | | | | — | | | | — | | | | 14,956,939 | |
| | Information Technology | | | 5,960,620 | | | | — | | | | — | | | | 5,960,620 | |
| | Materials | | | 28,060,816 | | | | — | | | | — | | | | 28,060,816 | |
| | Telecommunication Services | | | 13,070,284 | | | | — | | | | — | | | | 13,070,284 | |
| | Total Equity | | $ | 142,837,581 | | | $ | — | | | $ | — | | | $ | 142,837,581 | |
| | Short-Term Investments | | $ | 3,873,950 | | | $ | — | | | $ | — | | | $ | 3,873,950 | |
| | Total Investments in Securities | | $ | 146,711,531 | | | $ | — | | | $ | — | | | $ | 146,711,531 | |
The accompanying notes are an integral part of these financial statements.
SUMMARY OF INVESTMENTS — HENNESSY TOTAL RETURN FUND
HENNESSY TOTAL RETURN FUND
(% of Net Assets)
| | TOP TEN EQUITY HOLDINGS | % of net assets |
| | EI Du Pont de Nemours & Co. | 7.30% |
| | Pfizer, Inc. | 6.84% |
| | AT&T, Inc. | 6.54% |
| | Verizon Communications, Inc. | 6.43% |
| | Kraft Foods, Inc. | 5.64% |
| | Merck & Co., Inc. | 5.63% |
| | Caterpillar, Inc. | 5.43% |
| | ChevronTexaco Corp. | 4.91% |
| | Boeing Co. | 4.82% |
| | American Express Co. | 4.08% |
HENNESSY FUNDS 1-800-966-4354
| | COMMON STOCKS – 72.74% | | Number | | | | | | % of Net | | |
| | | | of Shares | | | Value | | | Assets | | |
| | Consumer Discretionary – 6.57% | | | | | | | | | | |
| | Home Depot, Inc. | | | 77,600 | | | $ | 1,946,984 | | | | 3.72 | % | |
| | McDonald’s Corp. | | | 25,500 | | | | 1,494,555 | | | | 2.85 | % | |
| | | | | | | | | 3,441,539 | | | | 6.57 | % | |
| | Consumer Staples – 5.64% | | | | | | | | | | | | | |
| | Kraft Foods, Inc. – Class A | | | 107,400 | | | | 2,955,648 | | | | 5.64 | % | |
| | | | | | | | | | | | | | | |
| | Energy – 4.91% | | | | | | | | | | | | | |
| | ChevronTexaco Corp. | | | 33,600 | | | | 2,571,744 | | | | 4.91 | % | |
| | | | | | | | | | | | | | | |
| | Financials – 6.57% | | | | | | | | | | | | | |
| | American Express Co. | | | 61,300 | | | | 2,135,692 | | | | 4.08 | % | |
| | Bank of America Corp. | | | 21,200 | | | | 309,096 | | | | 0.59 | % | |
| | J.P. Morgan Chase & Co. | | | 23,800 | | | | 994,126 | | | | 1.90 | % | |
| | | | | | | | | 3,438,914 | | | | 6.57 | % | |
| | Health Care – 13.63% | | | | | | | | | | | | | |
| | Johnson & Johnson | | | 10,300 | | | | 608,215 | | | | 1.16 | % | |
| | Merck & Co., Inc. | | | 95,400 | | | | 2,950,722 | | | | 5.63 | % | |
| | Pfizer, Inc. | | | 210,200 | | | | 3,579,706 | | | | 6.84 | % | |
| | | | | | | | | 7,138,643 | | | | 13.63 | % | |
| | Industrials – 12.48% | | | | | | | | | | | | | |
| | 3M Co. | | | 2,400 | | | | 176,568 | | | | 0.34 | % | |
| | Boeing Co. | | | 52,800 | | | | 2,523,840 | | | | 4.82 | % | |
| | Caterpillar, Inc. | | | 51,700 | | | | 2,846,602 | | | | 5.43 | % | |
| | General Electric Co. | | | 69,600 | | | | 992,496 | | | | 1.89 | % | |
| | | | | | | | | 6,539,506 | | | | 12.48 | % | |
| | Materials – 9.97% | | | | | | | | | | | | | |
| | Alcoa, Inc. | | | 112,800 | | | | 1,400,976 | | | | 2.67 | % | |
| | EI Du Pont de Nemours & Co. | | | 120,100 | | | | 3,821,582 | | | | 7.30 | % | |
| | | | | | | | | 5,222,558 | | | | 9.97 | % | |
| | Telecommunication Services – 12.97% | | | | | | | | | | | | | |
| | AT&T, Inc. | | | 133,400 | | | | 3,424,378 | | | | 6.54 | % | |
| | Verizon Communications, Inc. | | | 113,900 | | | | 3,370,301 | | | | 6.43 | % | |
| | | | | | | | | 6,794,679 | | | | 12.97 | % | |
| | | | | | | | | | | | | | | |
| | Total Common Stocks (Cost $38,452,252) | | | | | | | 38,103,231 | | | | 72.74 | % | |
The accompanying notes are an integral part of these financial statements.
SUMMARY OF INVESTMENTS — HENNESSY TOTAL RETURN FUND
| | SHORT-TERM INVESTMENTS – 53.77% | | Shares/Principal | | | | | | % of Net | | |
| | | | Amount | | | Value | | | Assets | | |
| | Demand Notes# – 1.88% | | | | | | | | | | |
| | American Family Financial Services, 0.1001% | | $ | 982,794 | | | $ | 982,794 | | | | 1.88 | % | |
| | | | | | | | | | | | | | | |
| | Total Demand Notes | | | | | | | | | | | | | |
| | (Cost $982,794) | | | | | | | 982,794 | | | | 1.88 | % | |
| | | | | | | | | | | | | | | |
| | Money Market Funds – 1.50% | | | | | | | | | | | | | |
| | Fidelity Government Portfolio, 0.0623% (a) | | | 787,478 | | | | 787,478 | | | | 1.50 | % | |
| | | | | | | | | | | | | | | |
| | Total Money Market Funds | | | | | | | | | | | | | |
| | (Cost $787,478) | | | | | | | 787,478 | | | | 1.50 | % | |
| | | | | | | | | | | | | | | |
| | U.S. Treasury Bills* – 50.39% | | | | | | | | | | | | | |
| | 0.0000%, 12/24/2009 | | | 26,400,000 | | | | 26,393,469 | | | | 50.39 | % | |
| | | | | | | | | | | | | | | |
| | Total U.S. Treasury Bills (Cost $26,393,469) | | | | | | | 26,393,469 | | | | 50.39 | % | |
| | | | | | | | | | | | | | | |
| | Total Short-Term Investments | | | | | | | | | | | | | |
| | (Cost $28,163,741) | | | | | | | 28,163,741 | | | | 53.77 | % | |
| | | | | | | | | | | | | | | |
| | Total Investments – 126.51% | | | | | | | | | | | | | |
| | (Cost $66,615,993) | | | | | | | 66,266,972 | | | | 126.51 | % | |
| | | | | | | | | | | | | | | |
| | Liabilities in Excess of Other Assets – (26.51)% | | | | | | | (13,887,290 | ) | | | -26.51 | % | |
| | TOTAL NET ASSETS – 100.00% | | | | | | $ | 52,379,682 | | | | 100.00 | % | |
| (a) | The rate listed is the Fund’s 7-day yield as of October 31, 2009. |
| # | Variable rate demand notes are considered short-term obligations and are payable on demand. Interest rates change periodically on specified dates. The rates listed are as of October 31, 2009. |
| * | Collateral or partial collateral for securities sold subject to repurchase. |
The accompanying notes are an integral part of these financial statements.
HENNESSY FUNDS 1-800-966-4354
Summary of Fair Value Exposure at October 31, 2009
The Fund has adopted authoritative fair valuation accounting standards which establish an authoritative definition of fair value and set out a hierarchy for measuring fair value. These standards require additional disclosures about the various inputs and valuation techniques used to develop the measurements of fair value and a discussion in changes in valuation techniques and related inputs during the period. These inputs are summarized in the three broad levels listed below.
The Fund has performed an analysis of all existing investments to determine the significance and character of all inputs to their fair value determination.
| | Level 1 – | Quoted unadjusted prices for identical instruments in active markets to which the fund has access at the date of measurement |
| | Level 2 – | Quoted prices for similar instruments in active markets; quoted prices for identical or similar instruments in markets that are not active; and model-derived valuations in which all significant inputs and significant value drivers are observable in active markets. Level 2 inputs are those in markets for which there are few transactions, the prices are not current, little public information exists or instances where prices vary substantially over time or among brokered market makers. |
| | Level 3 – | Model derived valuations in which one or more significant inputs or significant value drivers are unobservable. Unobservable inputs are those inputs that reflect the fund’s own assumptions that market participants would use to price the asset or liability based on the best available information. |
The inputs or methodology used for valuing securities are not an indication of the risk associated with investing in those securities.
The following is a summary of the inputs used to value the Fund’s net assets as of October 31, 2009:
| | | | Level 1 | | | Level 2 | | | Level 3 | | | Total | |
| | Equity | | | | | | | | | | | | |
| | Consumer Discretionary | | $ | 3,441,539 | | | $ | — | | | $ | — | | | $ | 3,441,539 | |
| | Consumer Staples | | | 2,955,648 | | | | — | | | | — | | | | 2,955,648 | |
| | Energy | | | 2,571,744 | | | | — | | | | — | | | | 2,571,744 | |
| | Financials | | | 3,438,914 | | | | — | | | | — | | | | 3,438,914 | |
| | Health Care | | | 7,138,643 | | | | — | | | | — | | | | 7,138,643 | |
| | Industrials | | | 6,539,506 | | | | — | | | | — | | | | 6,539,506 | |
| | Materials | | | 5,222,558 | | | | — | | | | — | | | | 5,222,558 | |
| | Telecommunication Services | | | 6,794,679 | | | | — | | | | — | | | | 6,794,679 | |
| | Total Equity | | $ | 38,103,231 | | | $ | — | | | $ | — | | | $ | 38,103,231 | |
| | Short-Term Investments | | $ | 787,478 | | | $ | 27,376,263 | | | $ | — | | | $ | 28,163,741 | |
| | Total Investments in Securities | | $ | 38,890,709 | | | $ | 27,376,263 | | | $ | — | | | $ | 66,266,972 | |
The accompanying notes are an integral part of these financial statements.
SUMMARY OF INVESTMENTS — HENNESSY BALANCED FUND
HENNESSY BALANCED FUND
(% of Net Assets)
| | TOP TEN EQUITY HOLDINGS | % of net assets |
| | American Express Co. | 6.12% |
| | Alcoa, Inc. | 5.60% |
| | Caterpillar, Inc. | 5.39% |
| | J.P. Morgan Chase & Co. | 4.70% |
| | EI Du Pont de Nemours & Co. | 4.22% |
| | General Electric Co. | 3.97% |
| | Pfizer, Inc. | 3.42% |
| | Verizon Communications, Inc. | 3.24% |
| | AT&T, Inc. | 3.10% |
| | Merck & Co., Inc. | 2.41% |
HENNESSY FUNDS 1-800-966-4354
| | COMMON STOCKS – 50.19% | | Number | | | | | | % of Net | | |
| | | | of Shares | | | Value | | | Assets | | |
| | Consumer Discretionary – 1.65% | | | | | | | | | | |
| | Home Depot, Inc. | | | 3,600 | | | $ | 90,324 | | | | 0.78 | % | |
| | McDonald’s Corp. | | | 1,700 | | | | 99,637 | | | | 0.87 | % | |
| | | | | | | | | 189,961 | | | | 1.65 | % | |
| | Consumer Staples – 2.27% | | | | | | | | | | | | | |
| | Kraft Foods, Inc. – Class A | | | 9,450 | | | | 260,064 | | | | 2.27 | % | |
| | | | | | | | | | | | | | | |
| | Energy – 1.40% | | | | | | | | | | | | | |
| | ChevronTexaco Corp. | | | 2,100 | | | | 160,734 | | | | 1.40 | % | |
| | | | | | | | | | | | | | | |
| | Financials – 12.02% | | | | | | | | | | | | | |
| | American Express Co. | | | 20,140 | | | | 701,678 | | | | 6.12 | % | |
| | Bank of America Corp. | | | 5,990 | | | | 87,334 | | | | 0.76 | % | |
| | Citigroup, Inc. | | | 12,410 | | | | 50,757 | | | | 0.44 | % | |
| | J.P. Morgan Chase & Co. | | | 12,900 | | | | 538,833 | | | | 4.70 | % | |
| | | | | | | | | 1,378,602 | | | | 12.02 | % | |
| | Health Care – 6.29% | | | | | | | | | | | | | |
| | Johnson & Johnson | | | 900 | | | | 53,145 | | | | 0.46 | % | |
| | Merck & Co., Inc. | | | 8,920 | | | | 275,895 | | | | 2.41 | % | |
| | Pfizer, Inc. | | | 23,060 | | | | 392,712 | | | | 3.42 | % | |
| | | | | | | | | 721,752 | | | | 6.29 | % | |
| | Industrials – 10.40% | | | | | | | | | | | | | |
| | Boeing Co. | | | 2,500 | | | | 119,500 | | | | 1.04 | % | |
| | Caterpillar, Inc. | | | 11,220 | | | | 617,773 | | | | 5.39 | % | |
| | General Electric Co. | | | 31,940 | | | | 455,465 | | | | 3.97 | % | |
| | | | | | | | | 1,192,738 | | | | 10.40 | % | |
| | Materials – 9.82% | | | | | | | | | | | | | |
| | Alcoa, Inc. | | | 51,670 | | | | 641,742 | | | | 5.60 | % | |
| | EI Du Pont de Nemours & Co. | | | 15,220 | | | | 484,300 | | | | 4.22 | % | |
| | | | | | | | | 1,126,042 | | | | 9.82 | % | |
| | Telecommunication Services – 6.34% | | | | | | | | | | | | | |
| | AT&T, Inc. | | | 13,870 | | | | 356,043 | | | | 3.10 | % | |
| | Verizon Communications, Inc. | | | 12,550 | | | | 371,354 | | | | 3.24 | % | |
| | | | | | | | | 727,397 | | | | 6.34 | % | |
| | | | | | | | | | | | | | | |
| | Total Common Stocks (Cost $5,231,761) | | | | | | | 5,757,290 | | | | 50.19 | % | |
The accompanying notes are an integral part of these financial statements.
SUMMARY OF INVESTMENTS — HENNESSY BALANCED FUND
| | SHORT-TERM INVESTMENTS – 7.18% | | Shares/Principal | | | | | | % of Net | | |
| | | | Amount | | | Value | | | Assets | | |
| | U.S. Treasury Bills – 46.15% | | | | | | | | | | |
| | 3.125%, 11/30/2009 | | $ | 800,000 | | | $ | 802,063 | | | | 6.99 | % | |
| | 3.625%, 01/15/2010 | | | 400,000 | | | | 402,938 | | | | 3.51 | % | |
| | 3.500%, 02/15/2010 | | | 1,600,000 | | | | 1,615,875 | | | | 14.09 | % | |
| | 4.000%, 04/15/2010 | | | 200,000 | | | | 203,508 | | | | 1.77 | % | |
| | 3.625%, 06/15/2010 | | | 300,000 | | | | 306,375 | | | | 2.67 | % | |
| | 4.125%, 08/15/2010 | | | 1,000,000 | | | | 1,030,001 | | | | 8.98 | % | |
| | 4.250%, 10/15/2010 | | | 900,000 | | | | 933,259 | | | | 8.14 | % | |
| | | | | | | | | | | | | | | |
| | Total U.S. Treasury Bills (Cost $5,290,169) | | | | | | | 5,294,019 | | | | 46.15 | % | |
| | | | | | | | | | | | | | | |
| | Money Market Funds – 7.18% | | | | | | | | | | | | | |
| | Federated Government Obligation | | | | | | | | | | | | | |
| | Money Market, 0.0804% (a) | | | 328,002 | | | | 328,002 | | | | 2.86 | % | |
| | Fidelity Government Portfolio, 0.0623% (a) | | | 495,455 | | | | 495,455 | | | | 4.32 | % | |
| | | | | | | | | | | | | | | |
| | Total Money Market Funds (Cost $823,457) | | | | | | | 823,457 | | | | 7.18 | % | |
| | | | | | | | | | | | | | | |
| | Total Short-Term Investments | | | | | | | | | | | | | |
| | (Cost $6,113,626) | | | | | | | 6,117,476 | | | | 53.33 | % | |
| | | | | | | | | | | | | | | |
| | Total Investments – 103.52% | | | | | | | | | | | | | |
| | (Cost $11,345,387) | | | | | | | 11,874,766 | | | | 103.52 | % | |
| | | | | | | | | | | | | | | |
| | Liabilities in Excess of Other Assets – (3.52)% | | | | | | | (403,683 | ) | | | (3.52 | )% | |
| | TOTAL NET ASSETS – 100.00% | | | | | | $ | 11,471,083 | | | | 100.00 | % | |
| (a) | The rate listed is the Fund’s 7-day yield as of October 31, 2009. |
The accompanying notes are an integral part of these financial statements.
HENNESSY FUNDS 1-800-966-4354
Summary of Fair Value Exposure at October 31, 2009
The Fund has adopted authoritative fair valuation accounting standards which establish an authoritative definition of fair value and set out a hierarchy for measuring fair value. These standards require additional disclosures about the various inputs and valuation techniques used to develop the measurements of fair value and a discussion in changes in valuation techniques and related inputs during the period. These inputs are summarized in the three broad levels listed below.
The Fund has performed an analysis of all existing investments to determine the significance and character of all inputs to their fair value determination.
| | Level 1 – | Quoted unadjusted prices for identical instruments in active markets to which the fund has access at the date of measurement |
| | Level 2 – | Quoted prices for similar instruments in active markets; quoted prices for identical or similar instruments in markets that are not active; and model-derived valuations in which all significant inputs and significant value drivers are observable in active markets. Level 2 inputs are those in markets for which there are few transactions, the prices are not current, little public information exists or instances where prices vary substantially over time or among brokered market makers. |
| | Level 3 – | Model derived valuations in which one or more significant inputs or significant value drivers are unobservable. Unobservable inputs are those inputs that reflect the fund’s own assumptions that market participants would use to price the asset or liability based on the best available information. |
The inputs or methodology used for valuing securities are not an indication of the risk associated with investing in those securities.
The following is a summary of the inputs used to value the Fund’s net assets as of October 31, 2009:
| | | | Level 1 | | | Level 2 | | | Level 3 | | | Total | |
| | Equity | | | | | | | | | | | | |
| | Consumer Discretionary | | $ | 189,961 | | | $ | — | | | $ | — | | | $ | 189,961 | |
| | Consumer Staples | | | 260,064 | | | | — | | | | — | | | | 260,064 | |
| | Energy | | | 160,734 | | | | — | | | | — | | | | 160,734 | |
| | Financials | | | 1,378,602 | | | | — | | | | — | | | | 1,378,602 | |
| | Health Care | | | 721,752 | | | | — | | | | — | | | | 721,752 | |
| | Industrials | | | 1,192,738 | | | | — | | | | — | | | | 1,192,738 | |
| | Materials | | | 1,126,042 | | | | — | | | | — | | | | 1,126,042 | |
| | Telecommunication Services | | | 727,397 | | | | — | | | | — | | | | 727,397 | |
| | Total Equity | | $ | 5,757,290 | | | $ | — | | | $ | — | | | $ | 5,757,290 | |
| | Short-Term Investments | | $ | 823,457 | | | $ | 5,294,019 | | | $ | — | | | $ | 6,117,476 | |
| | Total Investments in Securities | | $ | 6,580,747 | | | $ | 5,294,019 | | | $ | — | | | $ | 11,874,766 | |
The accompanying notes are an integral part of these financial statements.
SUMMARY OF INVESTMENTS — HENNESSY BALANCED FUND
(This Page Intentionally Left Blank.)
HENNESSY FUNDS 1-800-966-4354
Financial Statements
Statements of Assets and Liabilities as of October 31, 2009 |
| | | HENNESSY | |
| | | CORNERSTONE | |
| | | GROWTH FUND | |
| ASSETS: | | | |
| Investments in unaffiliated securities, at value (cost $224,043,382, $27,673,681, | | | |
| $156,197,343, $53,957,008, $132,991,005, $66,615,993 and $11,345,387 respectively) | | $ | 228,309,485 | |
| Investments in affiliated securities, at value (cost $1,731,659) | | | — | |
| Cash | | | 172,409 | |
| Dividends and interest receivable | | | 106,995 | |
| Receivable for fund shares sold | | | 28,786 | |
| Receivable for securities sold | | | 5,746,000 | |
| Prepaid expenses and other assets | | | 31,488 | |
| Total Assets | | | 234,395,163 | |
| | | | | |
| LIABILITIES: | | | | |
| Payable for securities purchased | | | 15,332 | |
| Payable for fund shares redeemed | | | 261,510 | |
| Payable to Advisor | | | 153,630 | |
| Payable to Administrator | | | 208,923 | |
| Payable to Auditor | | | 19,748 | |
| Reverse repurchase agreement | | | — | |
| Accrued interest payable | | | 287 | |
| Accrued service fees | | | 20,290 | |
| Accrued sub transfer agent expenses | | | — | |
| Accrued expenses and other payables | | | 77,090 | |
| Total Liabilities | | | 756,810 | |
| | | | | |
| NET ASSETS | | $ | 233,638,353 | |
| | | | | |
| NET ASSETS CONSIST OF: | | | | |
| Capital stock | | $ | 521,844,718 | |
| Accumulated net investment income (loss) | | | — | |
| Accumulated net realized gain (loss) on investments | | | (292,472,468 | ) |
| Unrealized net appreciation (depreciation) on investments | | | 4,266,103 | |
| Total Net Assets | | $ | 233,638,353 | |
| | | | | |
| NET ASSETS | | | | |
| Original Class: | | | | |
| Shares authorized ($.0001 par value) | | | 25,000,000,000 | |
| Net assets applicable to outstanding Original Class shares | | | 228,959,784 | |
| Shares issued and outstanding | | | 25,974,994 | |
| Net asset value, offering price and redemption price per share | | $ | 8.81 | |
| | | | | |
| Institutional Class: | | | | |
| Shares authorized ($.0001 par value) | | | 25,000,000,000 | |
| Net assets applicable to outstanding Institutional Class shares | | | 4,678,569 | |
| Shares issued and outstanding | | | 527,954 | |
| Net asset value, offering price and redemption price per share | | $ | 8.86 | |
The accompanying notes are an integral part of these financial statements.
FINANCIAL STATEMENTS — STATEMENTS OF ASSETS AND LIABILITIES
| HENNESSY | | | | | | HENNESSY | | | | | | | | | | |
| CORNERSTONE | | | HENNESSY | | | CORNERSTONE | | | HENNESSY | | | HENNESSY | | | HENNESSY | |
| GROWTH FUND | | | FOCUS 30 | | | LARGE GROWTH | | | CORNERSTONE | | | TOTAL RETURN | | | BALANCED | |
| SERIES II | | | FUND | | | FUND | | | VALUE FUND | | | FUND | | | FUND | |
| | | | | | | | | | | | | | | | | |
| $ | 30,171,807 | | | $ | 156,138,806 | | | $ | 69,475,866 | | | $ | 145,104,707 | | | $ | 66,266,972 | | | $ | 11,874,766 | |
| | — | | | | — | | | | — | | | | 1,606,824 | | | | — | | | | — | |
| | — | | | | — | | | | 2,277 | | | | — | | | | — | | | | — | |
| | 41 | | | | 158,610 | | | | 72,009 | | | | 321,835 | | | | 152,767 | | | | 65,615 | |
| | 1,859 | | | | 55,934 | | | | 945 | | | | 689,782 | | | | 259 | | | | 25 | |
| | — | | | | — | | | | — | | | | — | | | | 3,506,069 | | | | 797,455 | |
| | 20,461 | | | | 25,930 | | | | 46,670 | | | | 22,838 | | | | 12,045 | | | | 9,337 | |
| | 30,194,168 | | | | 156,379,280 | | | | 69,597,767 | | | | 147,745,986 | | | | 69,938,112 | | | | 12,747,198 | |
| | | | | | | | | | | | | | | | | | | | | | | |
| | — | | | | — | | | | — | | | | — | | | | 3,009,279 | | | | 1,233,350 | |
| | 7,260 | | | | 282,431 | | | | 3,143 | | | | 499,297 | | | | 24,298 | | | | — | |
| | 20,282 | | | | 96,064 | | | | 47,706 | | | | 90,673 | | | | 27,293 | | | | 5,936 | |
| | 27,167 | | | | 141,012 | | | | 58,097 | | | | 98,977 | | | | 44,073 | | | | 9,467 | |
| | 16,578 | | | | 14,492 | | | | 17,055 | | | | 15,426 | | | | 14,514 | | | | 13,535 | |
| | — | | | | — | | | | — | | | | — | | | | 14,380,000 | | | | — | |
| | 9 | | | | 27 | | | | — | | | | — | | | | 13,450 | | | | — | |
| | 2,737 | | | | 11,540 | | | | 6,123 | | | | 12,101 | | | | 4,549 | | | | 989 | |
| | — | | | | — | | | | 1,699 | | | | — | | | | — | | | | — | |
| | 22,472 | | | | 36,240 | | | | 13,831 | | | | 17,745 | | | | 40,974 | | | | 12,838 | |
| | 96,505 | | | | 581,806 | | | | 147,654 | | | | 734,219 | | | | 17,558,430 | | | | 1,276,115 | |
| $ | 30,097,663 | | | $ | 155,797,474 | | | $ | 69,450,113 | | | $ | 147,011,767 | | | $ | 52,379,682 | | | $ | 11,471,083 | |
| | | | | | | | | | | | | | | | | | | | | | | |
| $ | 88,999,345 | | | $ | 244,970,714 | | | $ | 75,015,330 | | | $ | 217,876,584 | | | $ | 72,021,858 | | | $ | 14,454,901 | |
| | — | | | | — | | | | 358,421 | | | | 2,611,157 | | | | 86,870 | | | | 4,907 | |
| | (61,399,808 | ) | | | (89,114,703 | ) | | | (21,442,496 | ) | | | (85,464,841 | ) | | | (19,380,025 | ) | | | (3,518,104 | ) |
| | 2,498,126 | | | | (58,537 | ) | | | 15,518,858 | | | | 11,988,867 | | | | (349,021 | ) | | | 529,379 | |
| $ | 30,097,663 | | | $ | 155,797,474 | | | $ | 69,450,113 | | | $ | 147,011,767 | | | $ | 52,379,682 | | | $ | 11,471,083 | |
| | | | | | | | | | | | | | | | | | | | | | | |
| Unlimited | | | | 25,000,000,000 | | | Unlimited | | | | 25,000,000,000 | | | | 100,000,000 | | | | 100,000,000 | |
| | 29,813,921 | | | | 128,357,777 | | | | 69,412,389 | | | | 145,905,678 | | | | 52,379,682 | | | | 11,471,083 | |
| | 2,688,873 | | | | 14,708,178 | | | | 7,310,663 | | | | 13,729,442 | | | | 5,757,939 | | | | 1,210,257 | |
| $ | 11.09 | | | $ | 8.73 | | | $ | 9.49 | | | $ | 10.63 | | | $ | 9.10 | | | $ | 9.48 | |
| | | | | | | | | | | | | | | | | | | | | | | |
| Unlimited | | | | 25,000,000,000 | | | Unlimited | | | | 25,000,000,000 | | | | | | | | | |
| | 283,742 | | | | 27,439,697 | | | | 37,724 | | | | 1,106,089 | | | | | | | | | |
| | 25,315 | | | | 3,126,117 | | | | 3,966 | | | | 104,080 | | | | | | | | | |
| $ | 11.21 | | | $ | 8.78 | | | $ | 9.51 | | | $ | 10.63 | | | | | | | | | |
HENNESSY FUNDS 1-800-966-4354
Financial Statements
| | | HENNESSY | | | | |
| | | HENNESSY | | | CORNERSTONE | |
| | | CORNERSTONE | | | GROWTH FUND | |
| | | GROWTH FUND | | | SERIES II | |
| | | Year Ended | | | Year Ended | |
| | | October 31, 2009 | | | October 31, 2009 | |
| INVESTMENT INCOME: | | | | | | |
Dividend income from unaffiliated securities(1) | | $ | 2,378,649 | | | $ | 387,008 | |
| Dividend income from affiliated securities | | | — | | | | — | |
| Interest income | | | 4,399 | | | | 1,517 | |
| Total investment income | | | 2,383,048 | | | | 388,525 | |
| EXPENSES: | | | | | | | | |
| Investment advisory fees | | | 1,882,422 | | | | 225,699 | |
| Administration, fund accounting, custody and transfer agent fees | | | 654,138 | | | | 83,471 | |
| Distribution fees – Original Class (See Note 5) | | | — | | | | — | |
| Distribution fees – Predecessor Classes (See Note 5) | | | — | | | | — | |
| Service fees – Original Class (See Note 5) | | | 249,871 | | | | 30,355 | |
| Federal and state registration fees | | | 42,755 | | | | 41,020 | |
| Audit fees | | | 22,999 | | | | 19,976 | |
| Legal fees | | | 24,428 | | | | 19,977 | |
| Reports to shareholders | | | 90,259 | | | | 14,542 | |
| Directors’ fees and expenses | | | 11,877 | | | | 10,561 | |
| Sub-transfer agent expenses – Original Class (See Note 5) | | | 414,603 | | | | 55,465 | |
| Sub-transfer agent expenses – Institutional Class (See Note 5) | | | 867 | | | | 80 | |
| Sub-transfer agent expenses – Predecessor Classes (See Note 5) | | | — | | | | — | |
| Interest expense (See Note 3 and 6) | | | 846 | | | | 584 | |
| Other | | | 53,204 | | | | 18,337 | |
| Total expenses before reimbursement from advisor | | | 3,448,269 | | | | 520,067 | |
| Expense recoupment by advisor – Original Class | | | — | | | | — | |
| Expense reimbursement from advisor – Institutional Class | | | (6,062 | ) | | | (706 | ) |
| Expense waiver/reimbursement by: | | | | | | | | |
| Advisor (See Note 5) | | | — | | | | — | |
| Distributor (See Note 5) | | | — | | | | — | |
| Net expenses | | | 3,442,207 | | | | 519,361 | |
| NET INVESTMENT INCOME (LOSS) | | $ | (1,059,159 | ) | | $ | (130,836 | ) |
| REALIZED AND UNREALIZED GAINS (LOSSES): | | | | | | | | |
| Net realized gain (loss) on investments | | $ | (175,588,612 | ) | | $ | (25,002,829 | ) |
| Net realized gain (loss) on unaffiliated investments | | | — | | | | — | |
| Net realized gain (loss) on affiliated investments | | | — | | | | — | |
| Change in unrealized appreciation (depreciation) on investments | | | 171,339,271 | | | | 26,641,700 | |
| Net gain (loss) on investments | | | (4,249,341 | ) | | | 1,638,871 | |
| NET INCREASE (DECREASE) IN NET ASSETS | | | | | | | | |
| RESULTING FROM OPERATIONS | | $ | (5,308,500 | ) | | $ | 1,508,035 | |
(1) | Net of foreign taxes withheld of $81,778, $10,188, $0, $0, $173,859, $0 and $0, respectively. |
| * | For the one month ended October 31, 2009. Effective October 31, 2009, the Hennessy Cornerstone Large Growth Fund changed its fiscal year end to October 31st from September 30th. |
The accompanying notes are an integral part of these financial statements.
FINANCIAL STATEMENTS — STATEMENTS OF OPERATIONS
| HENNESSY | | | HENNESSY | | | HENNESSY | | | HENNESSY | | | HENNESSY | |
| FOCUS 30 | | | CORNERSTONE | | | CORNERSTONE | | | TOTAL RETURN | | | BALANCED | |
| FUND | | | LARGE GROWTH FUND | | | VALUE FUND | | | FUND | | | FUND | |
| Year Ended | | | One Month Ended | | | Year Ended | | | Year Ended | | | Year Ended | | | Year Ended | |
| October 31, 2009 | | | October 31, 2009* | | | September 30, 2009 | | | October 31, 2009 | | | October 31, 2009 | | | October 31, 2009 | |
| | | | | | | | | | | | | | | | | |
| $ | 1,939,777 | | | $ | 76,275 | | | $ | 1,073,917 | | | $ | 4,228,870 | | | $ | 1,737,135 | | | $ | 245,135 | |
| | — | | | | — | | | | — | | | | 32,020 | | | | — | | | | — | |
| | 5,124 | | | | 58 | | | | 5,210 | | | | 5,355 | | | | 73,980 | | | | 61,361 | |
| | 1,944,901 | | | | 76,333 | | | | 1,079,127 | | | | 4,266,265 | | | | 1,811,115 | | | | 306,496 | |
| | | | | | | | | | | | | | | | | | | | | | | |
| | 1,211,554 | | | | 45,336 | | | | 442,796 | | | | 707,415 | | | | 295,880 | | | | 63,393 | |
| | 423,766 | | | | 15,623 | | | | 223,204 | | | | 246,561 | | | | 131,401 | | | | 32,730 | |
| | — | | | | — | | | | — | | | | — | | | | 73,970 | | | | 15,849 | |
| | — | | | | — | | | | 5,770 | | | | — | | | | — | | | | — | |
| | 138,766 | | | | 6,123 | | | | 33,417 | | | | 94,724 | | | | 49,313 | | | | 10,566 | |
| | 45,581 | | | | 2,973 | | | | 42,367 | | | | 36,801 | | | | 20,196 | | | | 19,726 | |
| | 18,676 | | | | 1,962 | | | | 21,711 | | | | 19,217 | | | | 18,697 | | | | 17,502 | |
| | 12,477 | | | | 1,019 | | | | 17,856 | | | | 10,977 | | | | 10,012 | | | | 10,023 | |
| | 54,781 | | | | 1,062 | | | | 31,722 | | | | 17,998 | | | | 11,501 | | | | 2,500 | |
| | 10,812 | | | | 849 | | | | 5,829 | | | | 10,562 | | | | 8,390 | | | | 8,389 | |
| | 259,349 | | | | 1,225 | | | | 31,656 | | | | 53,513 | | | | — | | | | — | |
| | 12,879 | | | | — | | | | 2,000 | | | | 135 | | | | — | | | | — | |
| | — | | | | — | | | | 5,448 | | | | — | | | | — | | | | — | |
| | 1,004 | | | | — | | | | — | | | | 514 | | | | 140,695 | | | | — | |
| | 24,410 | | | | 1,092 | | | | 10,046 | | | | 13,330 | | | | 7,834 | | | | 2,226 | |
| | 2,214,055 | | | | 77,264 | | | | 873,822 | | | | 1,211,747 | | | | 767,889 | | | | 182,904 | |
| | — | | | | 2,375 | | | | — | | | | — | | | | — | | | | — | |
| | (43,673 | ) | | | (5 | ) | | | — | | | | (1,298 | ) | | | — | | | | — | |
| | | | | | | | | | | | | | | | | | | | | | | |
| | — | | | | — | | | | (148,261 | ) | | | — | | | | — | | | | — | |
| | — | | | | — | | | | (2,660 | ) | | | — | | | | — | | | | — | |
| | 2,170,382 | | | | 79,634 | | | | 722,901 | | | | 1,210,449 | | | | 767,889 | | | | 182,904 | |
| $ | (225,481 | ) | | $ | (3,301 | ) | | $ | 356,226 | | | $ | 3,055,816 | | | $ | 1,043,226 | | | $ | 123,592 | |
| | | | | | | | | | | | | | | | | | | | | | | |
| $ | (41,135,146 | ) | | $ | 810,847 | | | $ | (21,384,860 | ) | | $ | (56,666,478 | ) | | $ | (17,884,613 | ) | | $ | (2,906,301 | ) |
| | — | | | | — | | | | | | | | 10,348 | | | | — | | | | — | |
| | — | | | | — | | | | | | | | — | | | | — | | | | — | |
| | 51,687,206 | | | | (1,552,441 | ) | | | 14,850,433 | | | | 74,246,459 | | | | 16,495,364 | | | | 3,283,017 | |
| | 10,552,060 | | | | (741,594 | ) | | | (6,534,427 | ) | | | 17,590,329 | | | | (1,389,249 | ) | | | 376,716 | |
| | | | | | | | | | | | | | | | | | | | | | | |
| $ | 10,326,579 | | | $ | (744,895 | ) | | $ | (6,178,201 | ) | | $ | 20,646,145 | | | $ | (346,023 | ) | | $ | 500,308 | |
HENNESSY FUNDS 1-800-966-4354
Financial Statements
| Statements of Changes in Net Assets |
| | | Hennessy Cornerstone Growth Fund | |
| | | Year Ended | | | Year Ended | |
| | | October 31, 2009 | | | October 31, 2008 | |
| OPERATIONS: | | | | | | |
| Net investment income (loss) | | $ | (1,059,159 | ) | | $ | (1,718,215 | ) |
| Net realized gain (loss) on securities | | | (175,588,612 | ) | | | (116,321,526 | ) |
| Change in unrealized appreciation (depreciation) on securities | | | 171,339,271 | | | | (248,016,087 | ) |
| Net increase (decrease) in net assets resulting from operations | | | (5,308,500 | ) | | | (366,055,828 | ) |
| | | | | | | | | |
| DISTRIBUTIONS TO SHAREHOLDERS FROM: | | | | | | | | |
| Net investment income – Original Class | | | — | | | | — | |
| Net investment income – Institutional Class | | | — | | | | — | |
| Net realized gains – Original Class | | | — | | | | (110,914,265 | ) |
| Net realized gains – Institutional Class | | | — | | | | — | |
| Total distributions | | | — | | | | (110,914,265 | ) |
| | | | | | | | | |
| CAPITAL SHARE TRANSACTIONS: | | | | | | | | |
| Proceeds from shares subscribed – Original Class | | | 13,769,357 | | | | 39,355,042 | |
| Proceeds from shares subscribed – Institutional Class | | | 135,313 | | | | 14,450,082 | |
| Dividends reinvested – Original Class | | | — | | | | 107,702,229 | |
| Dividends reinvested – Institutional Class | | | — | | | | — | |
| Redemption fees retained – Original Class | | | — | | | | 23,170 | |
| Redemption fees retained – Institutional Class | | | — | | | | 205 | |
| Cost of shares redeemed – Original Class | | | (92,048,170 | ) | | | (350,084,701 | ) |
| Cost of shares redeemed – Institutional Class | | | (498,966 | ) | | | (7,312,081 | ) |
| Net increase (decrease) in net assets derived | | | | | | | | |
| from capital share transactions | | | (78,642,466 | ) | | | (195,866,054 | ) |
| | | | | | | | | |
| TOTAL INCREASE (DECREASE) IN NET ASSETS | | | (83,950,966 | ) | | | (672,836,147 | ) |
| | | | | | | | | |
| NET ASSETS: | | | | | | | | |
| Beginning of period | | | 317,589,319 | | | | 990,425,466 | |
| End of period | | $ | 233,638,353 | | | $ | 317,589,319 | |
| | | | | | | | | |
| Accumulated net investment income (loss), end of period | | $ | — | | | $ | — | |
| | | | | | | | | |
| CHANGES IN SHARES OUTSTANDING: | | | | | | | | |
| Shares sold – Original Class | | | 1,670,446 | | | | 42,121,972 | |
| Shares sold – Institutional Class | | | 16,333 | | | | 1,117,876 | |
| Shares issued to holders as reinvestment of dividends | | | | | | | | |
| Original Class | | | — | | | | 7,062,441 | |
| Institutional Class | | | — | | | | — | |
| Shares redeemed – Original Class | | | (11,189,297 | ) | | | (64,717,368 | ) |
| Shares redeemed – Institutional Class | | | (65,345 | ) | | | (540,910 | ) |
| Net increase (decrease) in shares outstanding | | | (9,567,863 | ) | | | (14,955,989 | ) |
The accompanying notes are an integral part of these financial statements.
FINANCIAL STATEMENTS — STATEMENTS OF CHANGES IN NET ASSETS
| Hennessy Cornerstone | | | | |
| Growth Fund, Series II | | | Hennessy Focus 30 Fund | |
| Year Ended | | | Year Ended | | | Year Ended | | | Year Ended | |
| October 31, 2009 | | | October 31, 2008 | | | October 31, 2009 | | | October 31, 2008 | |
| | | | | | | | | | | |
| $ | (130,836 | ) | | $ | (330,874 | ) | | $ | (225,481 | ) | | $ | (1,274,378 | ) |
| | (25,002,829 | ) | | | (35,487,492 | ) | | | (41,135,146 | ) | | | (47,714,145 | ) |
| | 26,641,700 | | | | (21,004,180 | ) | | | 51,687,206 | | | | (49,274,887 | ) |
| | 1,508,035 | | | | (56,822,546 | ) | | | 10,326,579 | | | | (98,263,410 | ) |
| | | | | | | | | | | | | | | |
| | — | | | | — | | | | — | | | | — | |
| | — | | | | — | | | | — | | | | — | |
| | — | | | | (27,055,016 | ) | | | — | | | | (33,250,015 | ) |
| | — | | | | — | | | | — | | | | — | |
| | — | | | | (27,055,016 | ) | | | — | | | | (33,250,015 | ) |
| | | | | | | | | | | | | | | |
| | 884,541 | | | | 3,777,707 | | | | 28,044,578 | | | | 169,225,771 | |
| | 229,027 | | | | 108,132 | | | | 3,182,769 | | | | 40,370,645 | |
| | — | | | | 26,856,690 | | | | — | | | | 32,845,640 | |
| | — | | | | — | | | | — | | | | — | |
| | — | | | | 6,554 | | | | — | | | | 118,011 | |
| | — | | | | — | | | | — | | | | 2,592 | |
| | (8,829,446 | ) | | | (49,122,781 | ) | | | (75,221,408 | ) | | | (146,107,945 | ) |
| | (21,810 | ) | | | | | | | (4,641,964 | ) | | | (4,205,478 | ) |
| | | | | | | | | | | | | | | |
| | (7,737,688 | ) | | | (18,373,698 | ) | | | (48,636,025 | ) | | | 92,249,236 | |
| | | | | | | | | | | | | | | |
| | (6,229,653 | ) | | | (102,251,260 | ) | | | (38,309,446 | ) | | | (39,264,189 | ) |
| | | | | | | | | | | | | | | |
| | 36,327,316 | | | | 138,578,576 | | | | 194,106,920 | | | | 233,371,109 | |
| $ | 30,097,663 | | | $ | 36,327,316 | | | $ | 155,797,474 | | | $ | 194,106,920 | |
| $ | — | | | $ | — | | | $ | — | | | $ | — | |
| | | | | | | | | | | | | | | |
| | 90,535 | | | | 3,389,025 | | | | 3,800,184 | | | | 26,879,882 | |
| | 21,589 | | | | 5,992 | | | | 412,433 | | | | 3,743,355 | |
| | | | | | | | | | | | | | | |
| | — | | | | 1,292,430 | | | | — | | | | 2,935,134 | |
| | — | | | | — | | | | — | | | | — | |
| | (904,443 | ) | | | (5,749,094 | ) | | | (9,945,713 | ) | | | (26,028,686 | ) |
| | (2,266 | ) | | | — | | | | (619,087 | ) | | | (410,584 | ) |
| | (794,585 | ) | | | (1,061,647 | ) | | | (6,352,183 | ) | | | 7,119,101 | |
HENNESSY FUNDS 1-800-966-4354
Financial Statements
| Statements of Changes in Net Assets |
| OPERATIONS: | |
| Net investment income (loss) | |
| Net realized gain (loss) on securities | |
| Change in unrealized appreciation (depreciation) on securities | |
| Net increase (decrease) in net assets resulting from operations | |
| DISTRIBUTIONS TO SHAREHOLDERS FROM: | |
| Net investment income – Original Class | |
| Net investment income – Institutional Class | |
| Net realized gains – Original Class | |
| Net realized gains – Institutional Class | |
| Total distributions | |
| CAPITAL SHARE TRANSACTIONS: | |
| Proceeds from shares issued in the reorganization | |
| Proceeds from shares subscribed – Original Class | |
| Proceeds from shares subscribed – Institutional Class | |
| Proceeds from shares subscribed – Class A | |
| Proceeds from shares subscribed – Class I | |
| Proceeds from shares subscribed – Class C | |
| Proceeds from shares subscribed – Class S | |
| Cost of shares redeemed – Original Class | |
| Cost of shares redeemed – Predecessor Class A | |
| Cost of shares redeemed – Predecessor Class I | |
| Cost of shares redeemed – Predecessor Class C | |
| Cost of shares redeemed – Predecessor Class R | |
| Cost of shares redeemed – Predecessor Class S | |
| Cost of shares redeemed in the reorganization – Class A | |
| Cost of shares redeemed in the reorganization – Class I | |
| Cost of shares redeemed in the reorganization – Class C | |
| Cost of shares redeemed in the reorganization – Class R | |
| Cost of shares redeemed in the reorganization – Class S | |
| Net increase (decrease) in net assets derived from capital share transactions | |
| TOTAL DECREASE IN NET ASSETS | |
| NET ASSETS: | |
| Beginning of period | |
| End of period | |
| Accumulated net investment income (loss), end of period | |
| * | For the one month ended October 31, 2009. Effective October 31, 2009, the Fund changed its fiscal year end to October 31st from September 30th. |
The accompanying notes are an integral part of these financial statements.
FINANCIAL STATEMENTS — STATEMENTS OF CHANGES IN NET ASSETS
| Hennessy Cornerstone | |
| Large Growth Fund | |
| | |
| One Month Ended | | | Year Ended | | | Year Ended | |
| October 31, 2009* | | | September 30, 2009 | | | September 30, 2008 | |
| | | | | | | | |
| $ | (3,301 | ) | | $ | 356,226 | | | $ | (22,418 | ) |
| | 810,847 | | | | (21,384,860 | ) | | | (866,288 | ) |
| | (1,552,441 | ) | | | 14,850,433 | | | | (21,199,636 | ) |
| | (744,895 | ) | | | (6,178,201 | ) | | | (22,088,342 | ) |
| | | | | | | | | | | |
| | — | | | | — | | | | — | |
| | — | | | | — | | | | — | |
| | — | | | | — | | | | — | |
| | — | | | | — | | | | — | |
| | — | | | | — | | | | — | |
| | | | | | | | | | | |
| | — | | | | 51,980,253 | | | | — | |
| | 92,349 | | | | 399,858 | | | | — | |
| | 914 | | | | 30,524 | | | | — | |
| | — | | | | 354,913 | | | | 637,476 | |
| | — | | | | 1,450 | | | | 43,830 | |
| | — | | | | — | | | | 114,000 | |
| | — | | | | 226,710 | | | | 1,012,835 | |
| | (549,997 | ) | | | (3,502,412 | ) | | | — | |
| | — | | | | (394,647 | ) | | | (1,104,104 | ) |
| | — | | | | (103,571 | ) | | | (316,089 | ) |
| | — | | | | (1,916 | ) | | | (4,572 | ) |
| | — | | | | (1,961 | ) | | | (514 | ) |
| | — | | | | (4,936,283 | ) | | | (12,226,101 | ) |
| | — | | | | (2,045,574 | ) | | | — | |
| | — | | | | (293,648 | ) | | | — | |
| | — | | | | (81,763 | ) | | | — | |
| | — | | | | (3,654 | ) | | | — | |
| | — | | | | (49,555,614 | ) | | | — | |
| | (456,734 | ) | | | (7,927,335 | ) | | | (11,843,239 | ) |
| | (1,201,629 | ) | | | (14,105,536 | ) | | | (33,931,581 | ) |
| | | | | | | | | | | |
| | 70,651,742 | | | | 84,757,278 | | | | 118,688,859 | |
| $ | 69,450,113 | | | $ | 70,651,742 | | | $ | 84,757,278 | |
| $ | 358,421 | | | $ | 358,421 | | | $ | — | |
HENNESSY FUNDS 1-800-966-4354
Financial Statements
| Statements of Changes in Net Assets |
| CHANGES IN SHARES OUTSTANDING: | |
| Shares issued in connection with reorganization | |
| Shares sold – Original Class | |
| Shares sold – Institutional Class | |
| Shares sold – Predecessor Class A | |
| Shares sold – Predecessor Class I | |
| Shares sold – Predecessor Class C | |
| Shares sold – Predecessor Class S | |
| Shares redeemed – Original Class | |
| Shares redeemed – Predecessor Class A | |
| Shares redeemed – Predecessor Class I | |
| Shares redeemed – Predecessor Class C | |
| Shares redeemed – Predecessor Class R | |
| Shares redeemed – Predecessor Class S | |
| Shares redeemed in the reorganization – Predecessor Class A | |
| Shares redeemed in the reorganization – Predecessor Class I | |
| Shares redeemed in the reorganization – Predecessor Class C | |
| Shares redeemed in the reorganization – Predecessor Class R | |
| Shares redeemed in the reorganization – Predecessor Class S | |
| | |
| Net decrease in shares outstanding | |
The accompanying notes are an integral part of these financial statements.
FINANCIAL STATEMENTS — STATEMENTS OF CHANGES IN NET ASSETS
| Hennessy Cornerstone | |
| Large Growth Fund | |
| | | | | | | | |
| One Month Ended | | | Year Ended | | | Year Ended | |
| October 31, 2009* | | | September 30, 2009 | | | September 30, 2008 | |
| | | | | | | | |
| | — | | | | 7,722,854 | | | | — | |
| | 9,537 | | | | 47,603 | | | | — | |
| | 93 | | | | 3,873 | | | | — | |
| | — | | | | 49,665 | | | | 55,203 | |
| | — | | | | 198 | | | | 4,066 | |
| | — | | | | — | | | | 10,374 | |
| | — | | | | 30,610 | | | | 87,136 | |
| | (55,752 | ) | | | (413,579 | ) | | | — | |
| | — | | | | (55,087 | ) | | | (98,867 | ) |
| | — | | | | (14,533 | ) | | | (28,065 | ) |
| | — | | | | (317 | ) | | | (418 | ) |
| | — | | | | (316 | ) | | | (46 | ) |
| | — | | | | (685,035 | ) | | | (1,041,694 | ) |
| | — | | | | (309,689 | ) | | | — | |
| | — | | | | (43,625 | ) | | | — | |
| | — | | | | (12,829 | ) | | | — | |
| | — | | | | (560 | ) | | | — | |
| | — | | | | (7,362,580 | ) | | | — | |
| | (46,122 | ) | | | (1,043,347 | ) | | | (1,012,311 | ) |
HENNESSY FUNDS 1-800-966-4354
Financial Statements
| Statements of Changes in Net Assets |
| | | | |
| | | Hennessy Cornerstone Value Fund | |
| | | | | | | |
| | | Year Ended | | | Year Ended | |
| | | October 31, 2009 | | | October 31, 2008 | |
| OPERATIONS: | | | | | | |
| Net investment income (loss) | | $ | 3,055,816 | | | $ | 5,994,086 | |
| Net realized gain (loss) on securities | | | (56,656,130 | ) | | | 5,901,494 | |
| Change in unrealized appreciation (depreciation) on securities | | | 74,246,459 | | | | (99,303,788 | ) |
| Net increase (decrease) in net assets resulting from operations | | | 20,646,145 | | | | (87,408,208 | ) |
| | | | | | | | | |
| DISTRIBUTIONS TO SHAREHOLDERS FROM: | | | | | | | | |
| Net investment income – Original Class | | | (5,597,237 | ) | | | (4,859,028 | ) |
| Net investment income – Institutional Class | | | (55,214 | ) | | | — | |
| Net realized gains – Original Class | | | — | | | | — | |
| Net realized gains – Institutional Class | | | — | | | | — | |
| Total distributions | | | (5,652,451 | ) | | | (4,859,028 | ) |
| | | | | | | | | |
| CAPITAL SHARE TRANSACTIONS: | | | | | | | | |
| Proceeds from shares subscribed – Original Class | | | 43,322,159 | | | | 2,874,361 | |
| Proceeds from shares subscribed – Institutional Class | | | 39,402 | | | | 1,312,785 | |
| Dividends reinvested – Original Class | | | 4,981,771 | | | | 4,316,071 | |
| Dividends reinvested – Institutional Class | | | 33,372 | | | | — | |
| Cost of shares redeemed – Original Class | | | (14,327,901 | ) | | | (22,760,874 | ) |
| Cost of shares redeemed – Institutional Class | | | (10,708 | ) | | | — | |
| Redemption fees retained – Original Class | | | — | | | | 664 | |
| Redemption fees retained – Institutional Class | | | — | | | | — | |
| Net increase (decrease) in net assets derived | | | | | | | | |
| from capital share transactions | | | 34,038,095 | | | | (14,256,993 | ) |
| | | | | | | | | |
| TOTAL INCREASE (DECREASE) IN NET ASSETS | | | 49,031,789 | | | | (106,524,229 | ) |
| | | | | | | | | |
| NET ASSETS: | | | | | | | | |
| Beginning of period | | | 97,979,978 | | | | 204,504,207 | |
| End of period | | $ | 147,011,767 | | | $ | 97,979,978 | |
| | | | | | | | | |
| Accumulated net investment income (loss), end of period | | $ | 2,611,157 | | | $ | 5,319,895 | |
The accompanying notes are an integral part of these financial statements.
FINANCIAL STATEMENTS — STATEMENTS OF CHANGES IN NET ASSETS
| | | | | |
| Hennessy Total Return Fund | | | Hennessy Balanced Fund | |
| | | | | | | | | | | |
| Year Ended | | | Year Ended | | | Year Ended | | | Year Ended | |
| October 31, 2009 | | | October 31, 2008 | | | October 31, 2009 | | | October 31, 2008 | |
| | | | | | | | | | | |
| $ | 1,043,226 | | | $ | 1,864,720 | | | $ | 123,592 | | | $ | 326,516 | |
| | (17,884,613 | ) | | | (447,136 | ) | | | (2,906,301 | ) | | | (35,369 | ) |
| | 16,495,364 | | | | (29,382,944 | ) | | | 3,283,017 | | | | (3,656,241 | ) |
| | (346,023 | ) | | | (27,965,360 | ) | | | 500,308 | | | | (3,365,094 | ) |
| | | | | | | | | | | | | | | |
| | (956,356 | ) | | | (2,023,302 | ) | | | (138,030 | ) | | | (345,420 | ) |
| | N/A | | | | N/A | | | | N/A | | | | N/A | |
| | — | | | | — | | | | — | | | | (785,865 | ) |
| | N/A | | | | N/A | | | | N/A | | | | N/A | |
| | (956,356 | ) | | | (2,023,302 | ) | | | (138,030 | ) | | | (1,131,285 | ) |
| | | | | | | | | | | | | | | |
| | 657,981 | | | | 1,911,184 | | | | 795,947 | | | | 656,445 | |
| | N/A | | | | N/A | | | | N/A | | | | N/A | |
| | 884,126 | | | | 1,889,484 | | | | 134,495 | | | | 1,104,807 | |
| | N/A | | | | N/A | | | | N/A | | | | N/A | |
| | (6,082,697 | ) | | | (11,899,129 | ) | | | (1,280,181 | ) | | | (2,627,822 | ) |
| | N/A | | | | N/A | | | | N/A | | | | N/A | |
| | — | | | | 855 | | | | — | | | | 610 | |
| | N/A | | | | N/A | | | | N/A | | | | N/A | |
| | | | | | | | | | | | | | | |
| | (4,540,590 | ) | | | (8,097,606 | ) | | | (349,739 | ) | | | (865,960 | ) |
| | | | | | | | | | | | | | | |
| | (5,842,969 | ) | | | (38,086,268 | ) | | | 12,539 | | | | (5,362,339 | ) |
| | | | | | | | | | | | | | | |
| | 58,222,651 | | | | 96,308,919 | | | | 11,458,544 | | | | 16,820,883 | |
| $ | 52,379,682 | | | $ | 58,222,651 | | | $ | 11,471,083 | | | $ | 11,458,544 | |
| | | | | | | | | | | | | | | |
| $ | 86,870 | | | $ | — | | | $ | 4,907 | | | $ | 17,790 | |
HENNESSY FUNDS 1-800-966-4354
Financial Statements
| Statements of Changes in Net Assets |
| | | | |
| | | Hennessy Cornerstone Value Fund | |
| | | | | | | |
| | | Year Ended | | | Year Ended | |
| | | October 31, 2009 | | | October 31, 2008 | |
| CHANGES IN SHARES OUTSTANDING: | | | | | | |
| Shares sold | | | | | | |
| Original Class | | | 4,111,585 | | | | 11,669,368 | |
| Institutional Class | | | 4,670 | | | | 96,448 | |
| Shares issued to holders as reinvestment of dividends | | | | | | | | |
| Original Class | | | 638,689 | | | | 288,122 | |
| Institutional Class | | | 4,290 | | | | — | |
| Shares redeemed | | | | | | | | |
| Original Class | | | (1,749,104 | ) | | | (13,218,237 | ) |
| Institutional Class | | | (1,328 | ) | | | — | |
| Net increase (decrease) in shares outstanding | | | 3,008,802 | | | | (1,164,299 | ) |
The accompanying notes are an integral part of these financial statements.
FINANCIAL STATEMENTS — STATEMENTS OF CHANGES IN NET ASSETS
| | | | | |
| Hennessy Total Return Fund | | | Hennessy Balanced Fund | |
| | | | | | | | | | | |
| Year Ended | | | Year Ended | | | Year Ended | | | Year Ended | |
| October 31, 2009 | | | October 31, 2008 | | | October 31, 2009 | | | October 31, 2008 | |
| | | | | | | | | | | |
| | 79,969 | | | | 161,806 | | | | 91,298 | | | | 61,447 | |
| | — | | | | — | | | | — | | | | — | |
| | | | | | | | | | | | | | | |
| | 110,321 | | | | 169,813 | | | | 16,328 | | | | 98,884 | |
| | — | | | | — | | | | — | | | | — | |
| | | | | | | | | | | | | | | |
| | (746,373 | ) | | | (1,034,535 | ) | | | (155,366 | ) | | | (247,266 | ) |
| | — | | | | — | | | | — | | | | — | |
| | (556,083 | ) | | | (702,916 | ) | | | (47,740 | ) | | | (86,935 | ) |
HENNESSY FUNDS 1-800-966-4354
Financial Highlights
| Hennessy Cornerstone Growth Fund |
| | | Year Ended | |
| | | October 31, 2009 | |
| | | | | | Institutional | |
| | | Original Class | | | Class(1) | |
| PER SHARE DATA: | | | | | | |
| Net asset value, beginning of period | | $ | 8.80 | | | $ | 8.82 | |
| | | | | | | | | |
| Income from investment operations: | | | | | | | | |
Net investment income (loss)(3) | | | (0.04 | ) | | | — | |
| Net realized and unrealized gains (losses) on securities | | | 0.05 | | | | 0.04 | |
| Total from investment operations | | | 0.01 | | | | 0.04 | |
| | | | | | | | | |
| Less Distributions: | | | | | | | | |
| Dividends from net investment income | | | — | | | | — | |
| Dividends from net realized gains | | | — | | | | — | |
| Total distributions | | | — | | | | — | |
Redemption fees retained(4) | | | — | | | | — | |
| Net asset value, end of period | | $ | 8.81 | | | $ | 8.86 | |
| | | | | | | | | |
| TOTAL RETURN | | | 0.11 | % | | | 0.45 | % |
| | | | | | | | | |
| SUPPLEMENTAL DATA AND RATIOS: | | | | | | | | |
| Net assets, end of period (millions) | | $ | 228.96 | | | $ | 4.68 | |
| Ratio of expenses to average net assets: | | | | | | | | |
| Before expense reimbursement | | | 1.36 | % | | | 1.11 | % |
After expense reimbursement(5) | | | 1.36 | % | | | 0.98 | % |
| Ratio of net investment income to average net assets | | | | | | | | |
| Before expense reimbursement | | | (0.42 | )% | | | (0.17 | )% |
After expense reimbursement(5) | | | (0.42 | )% | | | (0.04 | )% |
Portfolio turnover rate(6) | | | 108 | % | | | 108 | % |
(1) | Institutional Class shares commenced operations on March 3, 2008. |
(2) | All ratios for the period have been annualized, except portfolio turnover and total return. |
(3) | Net investment loss per share is calculated using ending balances prior to consideration for adjustments for permanent book and tax differences. |
(4) | Amount is less than $0.01. |
(5) | The Advisor has agreed to reimburse expenses in order to cap the Institutional Class share expenses. Please refer to Note 5 for more information. |
(6) | Portfolio turnover is calculated on the basis of the Fund as a whole. |
The accompanying notes are an integral part of these financial statements.
FINANCIAL HIGHLIGHTS — HENNESSY CORNERSTONE GROWTH FUND
| Year Ended October 31, | | | Year Ended October 31, | |
| 2008 | | | 2007 | | | 2006 | | | 2005 | |
| | | | Institutional | | | | | | | | | | |
| Original Class | | | Class(1)(2) | | | Original Class | |
| | | | | | | | | | | | | | |
| $ | 19.41 | | | $ | 13.29 | | | $ | 20.77 | | | $ | 19.49 | | | $ | 19.38 | |
| | | | | | | | | | | | | | | | | | | |
| | (0.05 | ) | | | 0.01 | | | | (0.07 | ) | | | (0.04 | ) | | | (0.14 | ) |
| | (8.32 | ) | | | (4.48 | ) | | | 1.82 | | | | 2.55 | | | | 4.13 | |
| | (8.37 | ) | | | (4.47 | ) | | | 1.75 | | | | 2.51 | | | | 3.99 | |
| | | | | | | | | | | | | | | | | | | |
| | — | | | | — | | | | — | | | | — | | | | — | |
| | (2.24 | ) | | | — | | | | (3.11 | ) | | | (1.23 | ) | | | (3.88 | ) |
| | (2.24 | ) | | | — | | | | (3.11 | ) | | | (1.23 | ) | | | (3.88 | ) |
| | — | | | | — | | | | — | | | | — | | | | — | |
| $ | 8.80 | | | $ | 8.82 | | | $ | 19.41 | | | $ | 20.77 | | | $ | 19.49 | |
| | | | | | | | | | | | | | | | | | | |
| | (48.00 | )% | | | (34.13 | )% | | | 9.65 | % | | | 13.59 | % | | | 23.17 | % |
| | | | | | | | | | | | | | | | | | | |
| $ | 312.50 | | | $ | 5.09 | | | $ | 990.43 | | | $ | 1,250.67 | | | $ | 1,071.78 | |
| | | | | | | | | | | | | | | | | | | |
| | 1.25 | % | | | 1.12 | % | | | 1.20 | % | | | 1.21 | % | | | 1.23 | % |
| | 1.25 | % | | | 0.98 | % | | | 1.20 | % | | | 1.21 | % | | | 1.23 | % |
| | | | | | | | | | | | | | | | | | | |
| | (0.29 | )% | | | 0.15 | % | | | (0.32 | )% | | | (0.20 | )% | | | (0.78 | )% |
| | (0.29 | )% | | | 0.29 | % | | | (0.32 | )% | | | (0.20 | )% | | | (0.78 | )% |
| | 103 | % | | | 103 | % | | | 97 | % | | | 90 | % | | | 89 | % |
HENNESSY FUNDS 1-800-966-4354
Financial Highlights
| Hennessy Cornerstone Growth Fund, Series II |
| | | Year Ended | |
| | | October 31, 2009 | |
| | | | | | Institutional | |
| | | Original Class | | | Class | |
| PER SHARE DATA: | | | | | | |
| Net asset value, beginning of period | | $ | 10.35 | | | $ | 10.39 | |
| | | | | | | | | |
| Income from investment operations: | | | | | | | | |
| Net investment income (loss) | | | (0.05 | ) | | | 0.02 | |
| Net realized and unrealized gains (losses) on securities | | | 0.79 | | | | 0.80 | |
| Total from investment operations | | | 0.74 | | | | 0.82 | |
| | | | | | | | | |
| Less Distributions: | | | | | | | | |
| Dividends from net investment income | | | — | | | | — | |
| Dividends from net realized gains | | | — | | | | — | |
| Total distributions | | | — | | | | — | |
Redemption fees retained(5) | | | — | | | | — | |
| Net asset value, end of period | | $ | 11.09 | | | $ | 11.21 | |
| | | | | | | | | |
| TOTAL RETURN | | | 7.15 | % | | | 7.89 | % |
| | | | | | | | | |
| SUPPLEMENTAL DATA AND RATIOS: | | | | | | | | |
| Net assets, end of period (millions) | | $ | 29.81 | | | $ | 0.28 | |
| Ratio of expenses to average net assets | | | | | | | | |
| Before expense reimbursement | | | 1.70 | % | | | 1.46 | % |
After expense reimbursement(7) | | | 1.70 | % | | | 0.98 | % |
| Ratio of net investment income to average net assets | | | | | | | | |
| Before expense reimbursement | | | (0.43 | )% | | | (0.19 | )% |
After expense reimbursement(7) | | | (0.43 | )% | | | 0.29 | % |
Portfolio turnover rate(8) | | | 94 | % | | | 94 | % |
(1) | Institutional Class shares commenced operations on March 3, 2008. |
(2) | For the four months ended October 31, 2006. Effective October 31, 2006 the Fund changed its fiscal year end to October 31st from June 30th. |
(3) | All ratios for the period have been annualized, except portfolio turnover and total return. |
(4) | Net investment loss per share is calculated using average shares outstanding. |
(5) | Amount is less than $0.01. |
(6) | The financial highlights set forth herein include the historical highlights of The Henlopen Fund. On July 1, 2005 Hennessy Advisors, Inc. became the investment advisor to the Fund and the Fund changed its name from “The Henlopen Fund” to Hennessy Cornerstone Growth Fund, Series II. |
(7) | The Advisor has agreed to reimburse expenses in order to cap the Institutional Class share expenses. Please refer to Note 5 for more information. |
(8) | Portfolio turnover is calculated on the basis of the Fund as a whole. |
The accompanying notes are an integral part of these financial statements.
FINANCIAL HIGHLIGHTS — HENNESSY CORNERSTONE GROWTH FUND, SERIES II
| Year Ended | | | Year Ended | | | Period Ended | | | | | | | |
| October 31, | | | October 31, | | | October 31, | | | Year Ended June 30, | |
| 2008 | | | 2007 | | | 2006(2)(3) | | | 2006 | | | 2005(6) | |
| | | | Institutional | | | | | | | | | | | | | |
| Original Class | | | Class(1)(3) | | | Original Class | |
| | | | | | | | | | | | | | | | | |
| $ | 30.32 | | | $ | 19.17 | | | $ | 30.75 | | | $ | 32.19 | | | $ | 31.29 | | | $ | 27.69 | |
| | | | | | | | | | | | | | | | | | | | | | | |
| | (0.09 | ) | | | 0.02 | | | | (0.25 | ) | | | (0.03 | ) | | | (0.07 | )(4) | | | (0.14 | )(4) |
| | (13.75 | ) | | | (8.80 | ) | | | 1.02 | | | | (1.41 | ) | | | 4.65 | | | | 3.75 | |
| | (13.84 | ) | | | (8.78 | ) | | | 0.77 | | | | (1.44 | ) | | | 4.58 | | | | 3.61 | |
| | | | | | | | | | | | | | | | | | | | | | | |
| | — | | | | — | | | | — | | | | — | | | | — | | | | (0.01 | ) |
| | (6.13 | ) | | | — | | | | (1.20 | ) | | | — | | | | (3.68 | ) | | | — | |
| | (6.13 | ) | | | — | | | | (1.20 | ) | | | — | | | | (3.68 | ) | | | (0.01 | ) |
| | — | | | | — | | | | — | | | | — | | | | — | | | | — | |
| $ | 10.35 | | | $ | 10.39 | | | $ | 30.32 | | | $ | 30.75 | | | $ | 32.19 | | | $ | 31.29 | |
| | | | | | | | | | | | | | | | | | | | | | | |
| | (55.79 | )% | | | (45.80 | )% | | | 2.60 | % | | | (4.47 | )% | | | 16.48 | % | | | 13.04 | % |
| | | | | | | | | | | | | | | | | | | | | | | |
| | | | | | | | | | | | | | | | | | | | | | | |
| $ | 36.27 | | | $ | 0.06 | | | $ | 138.58 | | | $ | 244.19 | | | $ | 279.3 | | | $ | 299.0 | |
| | | | | | | | | | | | | | | | | | | | | | | |
| | 1.37 | % | | | 1.22 | % | | | 1.27 | % | | | 1.25 | % | | | 1.25 | % | | | 1.33 | % |
| | 1.37 | % | | | 0.98 | % | | | 1.27 | % | | | 1.25 | % | | | 1.25 | % | | | 1.33 | % |
| | | | | | | | | | | | | | | | | | | | | | | |
| | (0.40 | )% | | | 0.17 | % | | | (0.59 | )% | | | (0.24 | )% | | | (0.22 | )% | | | (0.49 | )% |
| | (0.40 | )% | | | 0.41 | % | | | (0.59 | )% | | | (0.24 | )% | | | (0.22 | )% | | | (0.49 | )% |
| | 75 | % | | | 75 | % | | | 86 | % | | | 93 | % | | | 109 | % | | | 192 | % |
HENNESSY FUNDS 1-800-966-4354
Financial Highlights
| | | Year Ended | |
| | | October 31, 2009 | |
| | | | | | Institutional | |
| | | Original Class | | | Class | |
| PER SHARE DATA: | | | | | | |
| Net asset value, beginning of period | | $ | 8.02 | | | $ | 8.04 | |
| | | | | | | | | |
| Income from investment operations: | | | | | | | | |
| Net investment income (loss) | | | (0.02 | ) | | | 0.02 | |
| Net realized and unrealized gains (losses) on investments | | | 0.73 | | | | 0.72 | |
| Total from investment operations | | | 0.71 | | | | 0.74 | |
| | | | | | | | | |
| Less Distributions: | | | | | | | | |
| Dividends from net investment income | | | — | | | | — | |
| Dividends from net realized gains | | | — | | | | — | |
| Total distributions | | | — | | | | — | |
| Redemption fees retained | | | — | (3) | | | — | (3) |
| Net asset value, end of period | | $ | 8.73 | | | $ | 8.78 | |
| | | | | | | | | |
| TOTAL RETURN | | | 8.85 | % | | | 9.20 | % |
| | | | | | | | | |
| SUPPLEMENTAL DATA AND RATIOS: | | | | | | | | |
| Net assets, end of period (millions) | | $ | 128.36 | | | $ | 27.44 | |
| Ratio of net expenses to average net assets: | | | | | | | | |
| Before expense reimbursement | | | 1.39 | % | | | 1.15 | % |
After expense reimbursement(4) | | | 1.39 | % | | | 0.98 | % |
| Ratio of net investment loss to average net assets: | | | | | | | | |
| Before expense reimbursement | | | (0.20 | )% | | | 0.04 | % |
After expense reimbursement(4) | | | (0.20 | )% | | | 0.21 | % |
Portfolio turnover rate(5) | | | 90 | % | | | 90 | % |
(1) | Institutional Class shares commenced operations on March 3, 2008. |
(2) | All ratios for the period have been annualized, except portfolio turnover and total return. |
(3) | Amount is less than $0.01. |
(4) | The Advisor has agreed to reimburse expenses in order to cap the Institutional Class share expenses. Please refer to Note 5 for more information. |
(5) | Portfolio turnover is calculated on the basis of the Fund as a whole. |
The accompanying notes are an integral part of these financial statements.
FINANCIAL HIGHLIGHTS — HENNESSY FOCUS 30 FUND
| Year Ended October 31, | | | Year Ended October 31, | |
| 2008 | | | 2007 | | | 2006 | | | 2005 | |
| | | | Institutional | | | | | | | | | | |
| Original Class | | | Class(1)(2) | | | Original Class | |
| | | | | | | | | | | | | | |
| $ | 13.67 | | | $ | 11.15 | | | $ | 12.39 | | | $ | 12.21 | | | $ | 8.67 | |
| | | | | | | | | | | | | | | | | | | |
| | (0.06 | ) | | | (0.02 | ) | | | (0.09 | ) | | | (0.08 | ) | | | (0.04 | ) |
| | (3.57 | ) | | | (3.09 | ) | | | 1.47 | | | | 1.86 | | | | 3.58 | |
| | (3.63 | ) | | | (3.11 | ) | | | 1.38 | | | | 1.78 | | | | 3.54 | |
| | | | | | | | | | | | | | | | | | | |
| | — | | | | — | | | | — | | | | — | | | | — | |
| | (2.02 | ) | | | — | | | | (0.10 | ) | | | (1.61 | ) | | | — | |
| | (2.02 | ) | | | — | | | | (0.10 | ) | | | (1.61 | ) | | | — | |
| | — | (3) | | | — | (3) | | | — | (3) | | | 0.01 | | | | — | (3) |
| $ | 8.02 | | | $ | 8.04 | | | $ | 13.67 | | | $ | 12.39 | | | $ | 12.21 | |
| | | | | | | | | | | | | | | | | | | |
| | (30.81 | )% | | | (27.89 | )% | | | 11.30 | % | | | 16.18 | % | | | 40.83 | % |
| | | | | | | | | | | | | | | | | | | |
| | | | | | | | | | | | | | | | | | | |
| $ | 167.32 | | | $ | 26.78 | | | $ | 233.37 | | | $ | 240.63 | | | $ | 125.31 | |
| | | | | | | | | | | | | | | | | | | |
| | 1.27 | % | | | 1.13 | % | | | 1.23 | % | | | 1.21 | % | | | 1.35 | % |
| | 1.27 | % | | | 0.98 | % | | | 1.23 | % | | | 1.21 | % | | | 1.35 | % |
| | | | | | | | | | | | | | | | | | | |
| | (0.62 | )% | | | (0.28 | )% | | | (0.61 | )% | | | (0.65 | )% | | | (0.60 | )% |
| | (0.62 | )% | | | (0.13 | )% | | | (0.61 | )% | | | (0.65 | )% | | | (0.60 | )% |
| | 123 | % | | | 123 | % | | | 112 | % | | | 124 | % | | | 155 | % |
HENNESSY FUNDS 1-800-966-4354
Financial Highlights
| Hennessy Cornerstone Large Growth Fund |
| | | One Month Ended | |
| | | October 31, 2009 | |
| | | Original Class | | | Class I | |
| PER SHARE DATA: | | | | | | |
| Net asset value, beginning of period | | $ | 9.60 | | | $ | 9.61 | |
| | | | | | | | | |
| Income from investment operations: | | | | | | | | |
| Net investment income | | | — | | | | — | |
| Net realized and unrealized gains (losses) on securities | | | (0.11 | ) | | | (0.10 | ) |
| Total from investment operations | | | (0.11 | ) | | | (0.10 | ) |
| | | | | | | | | |
| Less Distributions: | | | | | | | | |
| Dividends from net investment income | | | — | | | | — | |
| Dividends from net realized gains | | | — | | | | — | |
| Total distributions | | | — | | | | — | |
Redemption fees retained(3) | | | — | | | | — | |
| Net asset value, end of period | | $ | 9.49 | | | $ | 9.51 | |
| | | | | | | | | |
| TOTAL RETURN | | | (1.15 | )%(5) | | | (1.04 | )%(5) |
| | | | | | | | | |
| SUPPLEMENTAL DATA AND RATIOS: | | | | | | | | |
| Net assets, end of period (millions) | | $ | 69.41 | | | $ | 0.04 | |
| Ratio of expenses to average net assets: | | | | | | | | |
| Before expense recoupment/reimbursement | | | 1.26 | %(6) | | | 1.14 | %(6) |
After expense recoupment/reimbursement(7) | | | 1.30 | %(6) | | | 0.98 | %(6) |
| Ratio of net investment income to average net assets | | | | | | | | |
| Before expense recoupment/reimbursement | | | (0.01 | )%(6) | | | 0.12 | %(6) |
After expense recoupment/reimbursement(7) | | | (0.05 | )%(6) | | | 0.28 | %(6) |
Portfolio turnover rate(8) | | | 0 | %(5) | | | 0 | %(5) |
(1) | The financial highlights set forth for periods prior to March 20, 2009 represent the historical financial highlights of the Tamarack Large Cap Growth Fund, Class S shares. The assets of the Tamarack Large Cap Growth Fund were acquired by the Hennessy Cornerstone Large Growth Fund on March 20, 2009. Prior to the reorganization, Tamarack Large Cap Growth Fund also offered Class A, I, C and R shares. At that time Voyageur Asset Management Inc. ceased to be investment advisor and Hennessy Advisors, Inc. became investment advisor. The return of the Tamarack Large Cap Growth Fund, Class S shares during the period October 1, 2008 through March 20, 2009 was (33.30)%. The return of the Hennessy Cornerstone Large Growth Fund, Original Class shares during the period March 20, 2009 through September 30, 2009 was 42.64%. |
(2) | Institutional Class shares commenced operations on March 20, 2009. |
(3) | Amount is less than $0.01 or ($0.01) per share. |
(4) | Per share net investment income (loss) has been calculated using the average daily shares method. |
(7) | The Advisor has agreed to reimburse expenses in order to cap the Original Class and Institutional Class share expenses. Please refer to Note 5 for more information. |
(8) | Portfolio turnover is calculated on the basis of the Fund as a whole. |
The accompanying notes are an integral part of these financial statements.
FINANCIAL HIGHLIGHTS — HENNESSY CORNERSTONE LARGE GROWTH FUND
| Year Ended | | | | | | | | | | | | | |
| September 30, | | | Year Ended September 30, | |
| 2009 | | | 2008 | | | 2007 | | | 2006 | | | 2005 | |
Original Class(1) | | | Class I(2) | | | Original Class(1) | |
| | | | | | | | | | | | | | | | | |
| $ | 10.09 | | | $ | 6.73 | | | $ | 12.61 | | | $ | 10.98 | | | $ | 10.75 | | | $ | 9.97 | |
| | | | | | | | | | | | | | | | | | | | | | | |
| | 0.05 | | | | 0.03 | | | | — | (3)(4) | | | — | (3) | | | — | (3) | | | 0.02 | |
| | (0.54 | ) | | | 2.85 | | | | (2.52 | ) | | | 1.63 | | | | 0.23 | | | | 0.78 | |
| | (0.49 | ) | | | 2.88 | | | | (2.52 | ) | | | 1.63 | | | | 0.23 | | | | 0.80 | |
| | | | | | | | | | | | | | | | | | | | | | | |
| | — | | | | — | | | | — | | | | — | | | | — | (3) | | | (0.02 | ) |
| | — | | | | — | | | | — | | | | — | | | | — | | | | — | |
| | — | | | | — | | | | — | | | | — | | | | — | | | | (0.02 | ) |
| | — | | | | — | | | | — | | | | — | | | | — | | | | — | |
| $ | 9.60 | | | $ | 9.61 | | | $ | 10.09 | | | $ | 12.61 | | | $ | 10.98 | | | $ | 10.75 | |
| | (4.86 | )% | | | 42.79 | %(5) | | | (19.98 | )% | | | 14.85 | % | | | 2.18 | % | | | 8.04 | % |
| | | | | | | | | | | | | | | | | | | | | | | |
| | | | | | | | | | | | | | | | | | | | | | | |
| $ | 70.61 | | | $ | 0.04 | | | $ | 80.91 | | | $ | 113.15 | | | $ | 125.25 | | | $ | 145.65 | |
| | | | | | | | | | | | | | | | | | | | | | | |
| | 1.40 | % | | | 16.51 | %(6) | | | 1.16 | % | | | 1.18 | % | | | 1.18 | % | | | 1.25 | % |
| | 1.17 | % | | | 0.98 | %(6) | | | 0.98 | % | | | 1.00 | % | | | 1.00 | % | | | 0.91 | % |
| | | | | | | | | | | | | | | | | | | | | | | |
| | 0.36 | % | | | (14.54 | )%(6) | | | (0.19 | )% | | | (0.19 | )% | | | (0.20 | )% | | | (0.10 | )% |
| | 0.59 | % | | | 0.99 | %(6) | | | (0.01 | )% | | | (0.01 | )% | | | (0.02 | )% | | | 0.24 | % |
| | 116 | % | | | 116 | % | | | 38 | % | | | 25 | % | | | 35 | % | | | 28 | % |
HENNESSY FUNDS 1-800-966-4354
Financial Highlights
| Hennessy Cornerstone Value Fund |
| | | Year Ended | |
| | | October 31, 2009 | |
| | | Original Class | | | Class I | |
| PER SHARE DATA: | | | | | | |
| Net asset value, beginning of period | | $ | 9.05 | | | $ | 9.06 | |
| | | | | | | | | |
| Income from investment operations: | | | | | | | | |
| Net investment income | | | 0.24 | | | | 0.30 | |
| Net realized and unrealized gains (losses) on investments | | | 1.87 | | | | 1.83 | |
| Total from investment operations | | | 2.11 | | | | 2.13 | |
| | | | | | | | | |
| Less Distributions: | | | | | | | | |
| Dividends from net investment income | | | (0.53 | ) | | | (0.56 | ) |
| Dividends from net realized gains | | | — | | | | — | |
| Total distributions | | | (0.53 | ) | | | (0.56 | ) |
Redemption fees retained(3) | | | — | | | | — | |
| Net asset value, end of period | | $ | 10.63 | | | $ | 10.63 | |
| | | | | | | | | |
| TOTAL RETURN | | | 25.51 | % | | | 25.87 | % |
| | | | | | | | | |
| SUPPLEMENTAL DATA AND RATIOS: | | | | | | | | |
| Net assets, end of period (millions) | | $ | 145.91 | | | $ | 1.11 | |
| Ratio of net expenses to average net assets | | | | | | | | |
| Before expense reimbursement | | | 1.27 | % | | | 1.13 | % |
| After expense reimbursement | | | 1.27 | % | | | 0.98 | %(4) |
| Ratio of net investment income to average net assets | | | | | | | | |
| Before expense reimbursement | | | 3.19 | % | | | 3.33 | % |
| After expense reimbursement | | | 3.19 | % | | | 3.48 | % |
Portfolio turnover rate(5) | | | 59 | % | | | 59 | % |
(1) | Institutional Class shares commenced operations on March 3, 2008. |
(2) | All ratios for the period have been annualized, except portfolio turnover and total return. |
(3) | Amount is less than $0.01. |
(4) | The Advisor has agreed to reimburse expenses in order to cap the Institutional Class share expenses. Please refer to Note 5 for more information. |
(5) | Portfolio turnover is calculated on the basis of the Fund as a whole. |
The accompanying notes are an integral part of these financial statements.
FINANCIAL HIGHLIGHTS — HENNESSY CORNERSTONE VALUE FUND
| Year Ended October 31, | | | Year Ended October 31, | |
| 2008 | | | 2007 | | | 2006 | | | 2005 | |
| Original Class | | | Class I(1)(2) | | | Original Class | |
| | | | | | | | | | | | | | |
| $ | 17.06 | | | $ | 13.79 | | | $ | 15.27 | | | $ | 12.95 | | | $ | 12.48 | |
| | | | | | | | | | | | | | | | | | | |
| | 0.55 | | | | 0.34 | | | | 0.46 | | | | 0.30 | | | | 0.30 | |
| | (8.15 | ) | | | (5.07 | ) | | | 1.68 | | | | 2.36 | | | | 0.41 | |
| | (7.60 | ) | | | (4.73 | ) | | | 2.14 | | | | 2.66 | | | | 0.71 | |
| | | | | | | | | | | | | | | | | | | |
| | (0.41 | ) | | | — | | | | (0.35 | ) | | | (0.34 | ) | | | (0.24 | ) |
| | — | | | | — | | | | — | | | | — | | | | — | |
| | (0.41 | ) | | | — | | | | (0.35 | ) | | | (0.34 | ) | | | (0.24 | ) |
| | — | | | | — | | | | — | | | | — | | | | — | |
| $ | 9.05 | | | $ | 9.06 | | | $ | 17.06 | | | $ | 15.27 | | | $ | 12.95 | |
| | | | | | | | | | | | | | | | | | | |
| | (45.50 | )% | | | (34.30 | )% | | | 14.26 | % | | | 21.00 | % | | | 5.69 | % |
| | | | | | | | | | | | | | | | | | | |
| $ | 97.10 | | | $ | 0.87 | | | $ | 204.50 | | | $ | 256.80 | | | $ | 183.76 | |
| | | | | | | | | | | | | | | | | | | |
| | 1.20 | % | | | 1.14 | % | | | 1.17 | % | | | 1.15 | % | | | 1.20 | % |
| | 1.20 | % | | | 0.98 | %(4) | | | 1.17 | % | | | 1.15 | % | | | 1.20 | % |
| | | | | | | | | | | | | | | | | | | |
| | 3.92 | % | | | 4.94 | % | | | 2.64 | % | | | 2.49 | % | | | 2.19 | % |
| | 3.92 | % | | | 5.10 | % | | | 2.64 | % | | | 2.49 | % | | | 2.19 | % |
| | 53 | % | | | 53 | % | | | 40 | % | | | 35 | % | | | 32 | % |
HENNESSY FUNDS 1-800-966-4354
Financial Highlights
| Hennessy Total Return Fund |
| | | Year Ended October 31, | |
| | | 2009 | | | 2008 | |
| | | Original Class | |
| PER SHARE DATA: | | | | | | |
| Net asset value, beginning of period | | $ | 9.22 | | | $ | 13.73 | |
| | | | | | | | | |
| Income from investment operations: | | | | | | | | |
| Net investment income | | | 0.18 | | | | 0.28 | |
| Net realized and unrealized gains (losses) on securities | | | (0.14 | ) | | | (4.49 | ) |
| Total from investment operations | | | 0.04 | | | | (4.21 | ) |
| | | | | | | | | |
| Less Distributions: | | | | | | | | |
| Dividends from net investment income | | | (0.16 | ) | | | (0.30 | ) |
| Dividends from realized capital gains | | | — | | | | — | |
| Return of capital | | | — | | | | — | |
| Total distributions | | | (0.16 | ) | | | (0.30 | ) |
Redemption fees retained(1) | | | — | | | | — | |
| Net asset value, end of period | | $ | 9.10 | | | $ | 9.22 | |
| | | | | | | | | |
| TOTAL RETURN | | | 0.69 | % | | | (30.97 | )% |
| | | | | | | | | |
| SUPPLEMENTAL DATA AND RATIOS: | | | | | | | | |
| Net assets, end of period (millions) | | $ | 52.38 | | | $ | 58.22 | |
| Gross ratio of expenses, including | | | | | | | | |
| interest expense, to average net assets | | | 1.56 | % | | | 2.36 | % |
| Ratio of interest expense to average net assets | | | 0.29 | % | | | 1.16 | % |
| Net ratio of expenses, excluding | | | | | | | | |
| interest expense, to average net assets | | | 1.27 | % | | | 1.20 | % |
| Ratio of net investment income (loss) to average net assets | | | 2.12 | % | | | 2.43 | % |
| Portfolio turnover rate | | | 41 | % | | | 16 | % |
(1) | Amount is less than $0.01. |
The accompanying notes are an integral part of these financial statements.
FINANCIAL HIGHLIGHTS — HENNESSY TOTAL RETURN FUND
| Year Ended October 31, | |
| 2007 | | | 2006 | | | 2005 | |
| Original Class | |
| | | | | | | | |
| $ | 12.61 | | | $ | 10.57 | | | $ | 10.40 | |
| | | | | | | | | | | |
| | | | | | | | | | | |
| | 0.33 | | | | 0.31 | | | | 0.23 | |
| | 1.13 | | | | 2.03 | | | | 0.17 | |
| | 1.46 | | | | 2.34 | | | | 0.40 | |
| | | | | | | | | | | |
| | | | | | | | | | | |
| | (0.34 | ) | | | (0.30 | ) | | | (0.23 | ) |
| | — | | | | — | | | | — | |
| | — | | | | — | | | | — | |
| | (0.34 | ) | | | (0.30 | ) | | | (0.23 | ) |
| | — | | | | — | | | | — | |
| $ | 13.73 | | | $ | 12.61 | | | $ | 10.57 | |
| | | | | | | | | | | |
| | 11.70 | % | | | 22.48 | % | | | 3.83 | % |
| | | | | | | | | | | |
| | | | | | | | | | | |
| $ | 96.31 | | | $ | 113.26 | | | $ | 86.75 | |
| | | | | | | | | | | |
| | 3.04 | % | | | 2.80 | % | | | 2.28 | % |
| | 1.88 | % | | | 1.64 | % | | | 1.05 | % |
| | | | | | | | | | | |
| | 1.16 | % | | | 1.16 | % | | | 1.23 | % |
| | 2.48 | % | | | 2.79 | % | | | 2.07 | % |
| | 12 | % | | | 24 | % | | | 26 | % |
HENNESSY FUNDS 1-800-966-4354
Financial Highlights
| | | Year Ended October 31, | |
| | | 2009 | | | 2008 | |
| | | Original Class | |
| PER SHARE DATA: | | | | | | |
| Net asset value, beginning of period | | $ | 9.11 | | | $ | 12.51 | |
| | | | | | | | | |
| Income from investment operations: | | | | | | | | |
| Net investment income | | | 0.10 | | | | 0.25 | |
| Net realized and unrealized gains (losses) on securities | | | 0.38 | | | | (2.80 | ) |
| Total from investment operations | | | 0.48 | | | | (2.55 | ) |
| | | | | | | | | |
| Less Distributions: | | | | | | | | |
| Dividends from net investment income | | | (0.11 | ) | | | (0.26 | ) |
| Dividends from realized capital gains | | | — | | | | (0.59 | ) |
| Return of capital | | | — | | | | — | |
| Total distributions | | | (0.11 | ) | | | (0.85 | ) |
Redemption fees retained(1) | | | — | | | | — | |
| Net asset value, end of period | | $ | 9.48 | | | $ | 9.11 | |
| | | | | | | | | |
| TOTAL RETURN | | | 5.46 | % | | | (21.55 | )% |
| | | | | | | | | |
| SUPPLEMENTAL DATA AND RATIOS: | | | | | | | | |
| Net assets, end of period (millions) | | $ | 11.47 | | | $ | 11.46 | |
| Ratio of net expenses to average net assets | | | 1.73 | % | | | 1.56 | % |
| Ratio of net investment income to average net assets | | | 1.17 | % | | | 2.31 | % |
| Portfolio turnover rate | | | 46 | % | | | 13 | % |
(1) | Amount is less than $0.01. |
The accompanying notes are an integral part of these financial statements.
FINANCIAL HIGHLIGHTS — HENNESSY BALANCED FUND
| Year Ended October 31, | |
| 2007 | | | 2006 | | | 2005 | |
| Original Class | |
| | | | | | | | |
| $ | 11.83 | | | $ | 10.56 | | | $ | 10.62 | |
| | | | | | | | | | | |
| | | | | | | | | | | |
| | 0.38 | | | | 0.30 | | | | 0.18 | |
| | 0.69 | | | | 1.25 | | | | (0.07 | ) |
| | 1.07 | | | | 1.55 | | | | 0.11 | |
| | | | | | | | | | | |
| | | | | | | | | | | |
| | (0.39 | ) | | | (0.28 | ) | | | (0.17 | ) |
| | — | | | | — | | | | — | |
| | — | | | | — | | | | — | |
| | (0.39 | ) | | | (0.28 | ) | | | (0.17 | ) |
| | — | | | | — | | | | — | |
| $ | 12.51 | | | $ | 11.83 | | | $ | 10.56 | |
| | | | | | | | | | | |
| | 9.16 | % | | | 14.92 | % | | | 1.13 | % |
| | | | | | | | | | | |
| | | | | | | | | | | |
| $ | 16.82 | | | $ | 26.14 | | | $ | 19.27 | |
| | 1.36 | % | | | 1.34 | % | | | 1.49 | % |
| | 2.86 | % | | | 2.75 | % | | | 1.58 | % |
| | 35 | % | | | 88 | % | | | 21 | % |
HENNESSY FUNDS 1-800-966-4354
Statement of Cash Flows
Hennessy Total Return Fund For the Year Ended October 31, 2009 |
| Cash Flows From Operating Activities: | | | |
| | | | |
| Net decrease in net assets from operations | | $ | (346,023 | ) |
| Adjustments to reconcile net decrease in net assets from | | | | |
| operations to net cash provided by operating activities: | | | | |
| Purchase of investment securities | | | (122,712,871 | ) |
| Proceeds on sale of securities | | | 135,322,749 | |
| Decrease in other receivables, net | | | 24,122 | |
| Decrease in other assets | | | 1,105 | |
| Decrease in accrued expenses and other payables | | | (65,632 | ) |
| Net accretion of discount on securities | | | (68,253 | ) |
| Net realized loss on investments | | | 17,884,613 | |
| Unrealized appreciation on securities | | | (16,495,364 | ) |
| Net cash provided by operating activities | | $ | 13,544,446 | |
| | | | | |
| Cash Flows From Financing Activities: | | | | |
| | | | | |
| Decrease in reverse repurchase agreements | | $ | (8,047,500 | ) |
| Proceeds on shares sold | | | 657,981 | |
| Payment on shares repurchased | | | (6,082,697 | ) |
| Cash dividends paid | | | (72,230 | ) |
| Net cash used by financing activities | | $ | (13,544,446 | ) |
| Net increase (decrease) in cash | | | — | |
| | | | | |
| Cash at beginning of period | | | — | |
| Cash at end of period | | $ | — | |
| | | | | |
| Cash paid for interest | | $ | 159,637 | |
The accompanying notes are an integral part of these financial statements.
Notes to the Financial Statements
October 31, 2009
1). ORGANIZATION
The Hennessy Mutual Funds, Inc. was organized as a Maryland corporation on May 20, 1996 and consists of three separate series: Hennessy Cornerstone Growth Fund (the “Growth Fund”), Hennessy Cornerstone Value Fund (the “Value Fund”) and the Hennessy Focus 30 Fund (the “Focus 30 Fund”), formerly SYM Select Growth Fund. These Funds are open-end, diversified management investment companies registered under the Investment Company Act of 1940, as amended. The Growth Fund and Value Fund commenced operations on November 1, 1996. On September 17, 2003, Hennessy Advisors, Inc. became the investment advisor to the SYM Select Growth Fund and the fund changed its name to the Hennessy Focus 30 Fund.
The Hennessy Funds, Inc. was organized as a Maryland corporation on January 11, 1996 and consists of two separate series: Hennessy Balanced Fund (the “Balanced Fund”) and Hennessy Total Return Fund (the “Total Return Fund”). The Balanced and Total Return Funds are open-end, non-diversified management investment companies registered under the Investment Company Act of 1940, as amended. The Balanced Fund and Total Return Fund commenced operations on March 8, 1996 and July 29, 1998, respectively.
The Hennessy Funds Trust (the “Trust”) was organized as a Delaware Statutory Trust on September 17, 1992 and consists of three series: Hennessy Cornerstone Growth Fund, Series II (the “Growth II Fund”), Hennessy Select Large Value Fund and Hennessy Large Growth Fund (the “Large Growth Fund”). The financial results of the Hennessy Select Large Value Fund are not contained in this report. Prior to July 1, 2005, both the Trust and the Growth II Fund were known as The Henlopen Fund. On July 1, 2005, Hennessy Advisors, Inc., became the investment advisor to the Growth II Fund and the Growth II Fund changed its name from “The Henlopen Fund” to “Hennessy Cornerstone Growth Fund, Series II”. The Large Growth Fund is the successor to the Tamarack Large Cap Growth Fund (the “Predecessor Tamarack Fund”) pursuant to a reorganization that took place on March 20, 2009 (See Note 8). As a result of the reorganization, holders of the Class A, Class C, Class I, Class R and Class S shares of the Tamarack Large Cap Growth Fund received Original Class shares of the Hennessy Cornerstone Large Growth Fund. On March 20, 2009, Hennessy Advisors, Inc., became the investment advisor to the Large Growth Fund and the Large Growth Fund changed its name from “Tamarack Large Cap Growth Fund” to “Hennessy Cornerstone Large Growth Fund”. The Growth II and Large Growth Funds are open-end, diversified investment management companies registered under the Investment Company Act of 1940, as amended.
The Growth Fund, Growth II Fund, Focus 30 Fund, Large Growth Fund, Value Fund, Total Return Fund and Balanced Fund collectively represent the Hennessy Cornerstone Series Funds (the “Funds”).
HENNESSY FUNDS 1-800-966-4354
The Growth, Growth II, Focus 30, Large Growth and Value Funds offer Original and Institutional Class shares. Each class of shares differs principally in its respective administration and transfer agent expenses and sales charges, if any. Each class has identical rights to earnings, assets and voting privileges, except for class-specific expenses and exclusive rights to vote on matters affecting only individual classes.
| 2). | SIGNIFICANT ACCOUNTING POLICIES |
The following is a summary of significant accounting policies consistently followed by the Funds in the preparation of the financial statements. These policies are in conformity with U.S. generally accepted accounting principles (“GAAP”).
| a). | Investment Valuation – Securities which are traded on a national or recognized stock exchange are valued at the last sale price on the securities exchange on which such securities are primarily traded. Exchange-traded securities for which there were no transactions that day and debt securities are valued at the most recent bid prices. Instruments with a remaining maturity of 60 days or less are valued on an amortized cost basis. When a price for an underlying security is not readily available or if a significant event has occurred that indicates the closing price of a security no longer represents the true value of that security, fair value pricing procedures have been adopted by the Board of Directors of the Funds. Fair value pricing determinations are made in good faith in accordance with these procedures. There are numerous criteria that will be given consideration in determining a fair value of a security. Some of these criteria are: trading volume of security and markets, value of other like securities and news events with direct bearing to security or market. Fair value pricing results in an estimated price that reasonably reflects the current market conditions in order to rate the portfolio holdings such that shareholder transactions receive a fair net asset value. |
| b). | Federal Income Taxes – Provision for federal income taxes or excise taxes has not been made since the Funds have elected to be taxed as “regulated investment companies” and intend to distribute substantially all taxable income to shareholders and otherwise comply with the provisions of the Internal Revenue Code applicable to regulated investment companies. Net investment income and realized gains and losses for federal income tax purposes may differ from that reported on the financial statements because of temporary book and tax basis differences. Temporary differences are primarily the result of the treatment of wash sales for tax reporting purposes. Distributions from net realized gains for book purposes may include short-term capital gains, which are included as ordinary income to shareholders for tax purposes. |
| | Due to inherent differences in the recognition of income, expenses, and realized gains/losses under U.S. generally accepted accounting principles and federal income tax purposes, permanent differences between book and tax basis reporting for the 2009 fiscal year have been identified and appropriately reclassified on the Statement of Assets and Liabilities. |
NOTES TO THE FINANCIAL STATEMENTS
| | | | Undistributed Net | | Accumulated Net | | Paid In |
| | | | Investment Income/(Loss) | | Realized Gain/(Loss) | | Capital |
| | Cornerstone Growth | | | 1,059,159 | | | | 369,963 | | | | (1,429,122 | ) |
| | Cornerstone Growth Series II | | | 130,836 | | | | (84 | ) | | | (130,752 | ) |
| | Focus 30 | | | 225,481 | | | | 8 | | | | (225,489 | ) |
| | Cornerstone Large Growth | | | 3,301 | | | | 2,915,217 | | | | (2,918,518 | ) |
| | Cornerstone Value | | | (112,103 | ) | | | 112,103 | | | | — | |
| | Total Return | | | — | | | | 34,658,579 | | | | (34,658,579 | ) |
| | Balanced | | | 1,555 | | | | 446,409 | | | | (447,964 | ) |
| | The permanent differences primarily relate to net operating losses and capital loss carryovers lost due to expiration |
| c). | Income and Expenses – Dividend income is recognized on the ex-dividend date or as soon as information is available to the Funds and interest income is recognized on an accrual basis. Income expenses (other than expenses attributable to a specific class), and realized and unrealized gains or losses on investments are allocated to each class of shares based on its respective net assets. |
| d). | Distributions to Shareholders – Dividends from net investment income for the Growth, Growth II, Focus 30, Large Growth and Value Funds, if any, are declared and paid out annually, usually in November or December of each year. Dividends from net investment income for the Total Return and Balanced Funds are declared and paid on a calendar quarter basis. Distributions of net realized capital gains, if any, are declared and paid annually, usually in November or December of each year, for all of the Funds. |
| e). | Security Transactions – Investment and shareholder transactions are recorded on the trade date. The Funds determine the gain or loss realized from the investment transactions by comparing the original cost of the security lot sold with the net sale proceeds. Discounts and premiums on securities purchased are accreted/amortized over the life of the respective security. |
| f). | Use of Estimates – The preparation of financial statements in conformity with GAAP requires management to make estimates and assumptions that affect the reported amounts of assets and liabilities and disclosure of contingent assets and liabilities at the date of the financial statements and the reported change in net assets during the reporting period. Actual results could differ from those estimates. |
| g). | Share Valuation – The net asset value (“NAV”) per share of each Fund is calculated by dividing the sum of the value of the securities held by each Fund, plus cash or other assets, minus all liabilities (including estimated accrued expenses) by the total number of shares outstanding for each Fund, rounded to the nearest cent. The Funds’ shares will not be priced on the days on which the NYSE is closed for trading. The offering and redemption price per share for each Fund is equal to each Fund’s net asset value per share. The Funds charged a 1.50% redemption fee on shares held less than 90 days through August 29, 2008. These fees were deducted from the redemption proceeds otherwise payable to the shareholder. The Funds retained the fee charged as paid-in capital and such fees became part of that Fund’s daily NAV calculation. |
HENNESSY FUNDS 1-800-966-4354
| h). | Repurchase Agreements – Each Fund may enter into repurchase agreements with member banks or security dealers of the Federal Reserve whom the investment advisor deems creditworthy. The repurchase price generally equals the price paid by the Fund plus interest negotiated on the basis of current short-term rates. |
| | Securities pledged as collateral for repurchase agreements are held by the custodian bank until the respective agreements mature. Provisions of the repurchase agreements ensure that the market value of the collateral, including accrued interest thereon, is sufficient, in the event of default of the counterparty. If the counterparty defaults and the value of the collateral declines or if the counterparty enters an insolvency proceeding, realization of the collateral by the Fund may be delayed or limited. |
| i). | Accounting for Uncertainty in Income Taxes – The Funds have adopted accounting policies regarding recognition and measurement of tax positions taken or expected to be taken on a tax return. The Funds have reviewed all open tax years and major jurisdictions and concluded that there is no impact on the Funds’ net assets and no tax liability resulting from unrecognized tax benefits relating to uncertain income tax positions taken or expected to be taken on a tax return. As of October 31, 2009, open Federal and state tax years for the Large Growth Fund include the tax years ended September 30, 2006 through 2009 and for the period ended October 31, 2009. As of October 31, 2009, open Federal and state tax years for the Growth, Growth II, Focus, Value, Total Return and Balanced Fund include the tax years ended October 31, 2006 through 2009. |
| j). | Events Subsequent to the Fiscal Period End – The Funds have adopted financial reporting rules regarding subsequent events which requires an entity to recognize in the financial statements the effects of all subsequent events that provide additional evidence about conditions that existed at the date of the balance sheet. In addition, an entity is required to disclose the date through which subsequent events have been evaluated. Management has evaluated the Funds’ related events and transactions that occurred subsequent to October 31, 2009, through December 29, 2009, the date of issuance of the Funds’ financial statements. There were no events or transactions that occurred during this period that materially impacted the amounts or disclosures in the Fund’s financial statements. |
| 3). | REVERSE REPURCHASE AGREEMENTS |
The Total Return Fund has entered into reverse repurchase agreements with UBS Financial Services, Inc., under which the Total Return Fund sells securities and agrees to repurchase them later at a mutually agreed upon price. For the year ended October 31, 2009, the average daily balance and average interest rate in effect for reverse repurchase agreements was $14,797,860 and 0.53%, respectively. In addition, an interest payment of $55,231 was paid due to the early termination of a reverse repurchase agreement. At October 31, 2009, the interest rate in effect for the outstanding reverse repurchase agreements, scheduled to mature on December 24, 2009 ($10,782,000), and December 24, 2009 ($3,598,000) was 0.32% and 0.32%, respectively. Outstanding reverse repurchase agreements at October 31, 2009 were equal to 27.45% of the Total Return Fund’s total net assets.
NOTES TO THE FINANCIAL STATEMENTS
| 4). | INVESTMENT TRANSACTIONS |
Purchases and sales of investment securities (excluding government and short-term investments) during the following fiscal periods were as follows:
| | | Growth | | | Growth II | | | Focus 30 | | | Large Growth | | | Value | | | Total Return | | | Balanced | |
| | | Fund | | | Fund | | | Fund | | | Fund | | | Fund | | | Fund | | | Fund | |
| | | Year | | | Year | | | Year | | | Period | | | Year | | | Year | | | Year | |
| | | Ended | | | Ended | | | Ended | | | Ended | | | Ended | | | Ended | | | Ended | |
| | | 10/31/09 | | | 10/31/09 | | | 10/31/09 | | | 10/31/09 | | | 10/31/09 | | | 10/31/09 | | | 10/31/09 | |
| Purchases | | $ | 273,736,263 | | | $ | 28,232,796 | | | $ | 145,322,855 | | | $ | — | | | $ | 86,164,443 | | | $ | 14,574,779 | | | $ | 2,528,018 | |
| Sales | | $ | 353,908,800 | | | $ | 36,595,712 | | | $ | 192,809,893 | | | $ | 2,930,408 | | | $ | 56,101,205 | | | $ | 16,398,646 | | | $ | 2,872,796 | |
Purchases and sales of investment securities (excluding government and short-term investments) for the Large Growth Fund during the year ended September 30, 2009 were $73,469,560 and $80,757,495, respectively. Purchases and sales of long-term U.S. Government Securities for the Total Return Fund were $28,997,582 and $29,000,000, respectively. Purchases and sales of long-term U.S. Government Securities for the Balanced Fund were $5,678,816 and $866,257, respectively. There were no purchases or sales of long-term U.S. Government Securities for the Growth, Growth II, Focus 30, Large Growth, or Value Funds.
| 5). | INVESTMENT MANAGEMENT FEE AND OTHER TRANSACTIONS WITH AFFILIATES |
Hennessy Advisors, Inc. (the “Advisor”) is the Advisor of the Funds. The Advisor provides the Funds with investment management services under a Management Agreement. The Advisor furnishes all investment advice, office space, facilities, and provides most of the personnel needed by the Funds. As compensation for its services, the Advisor is entitled to a monthly fee from each Fund. The fee is based upon the average daily net assets of the Funds at the annual rate of:
| Growth Fund | 0.74% |
| Growth II Fund | 0.74% |
| Focus 30 Fund | 0.74% |
| Large Growth Fund | 0.74% |
| Value Fund | 0.74% |
| Total Return Fund | 0.60% |
| Balanced Fund | 0.60% |
Prior to March 20, 2009, Voyageur Asset Management Inc. (“Voyageur”) acted as the investment advisor for the Predecessor Tamarack Fund. The Predecessor Tamarack Fund entered an agreement with Voyageur whereas they furnished related office facilities, equipment, research and personnel. The agreement required the Predecessor Tamarack Fund to pay Voyageur a monthly fee of 0.70% based upon average daily net assets.
The Advisor has agreed to waive its fees and absorb expenses to the extent that the total annual operating expenses (excluding all federal, state and local taxes, interest, brokerage commissions, acquired fund fees and expenses and other costs incurred in connection with the purchase and sale of securities and extraordinary items) do not exceed 0.98% of the Funds’ net assets for the Institutional Class shares in the Growth, Growth II, Focus 30, Large Growth and Value Funds or 1.30% of the Original Class shares of the Large Growth Fund.
HENNESSY FUNDS 1-800-966-4354
The expense limitation agreement for the Original Class shares of the Large Growth Fund is in place until March 31, 2010. The expense limitation agreement for the Institutional Class can only be terminated by the Board of Trustees. Voyageur Asset Management Inc. (“Voyaguer”) had contractually agreed to waive fees/or make payments in order to keep total operating expenses of the Predecessor Fund, Class S at 1.00%. This limitation was in place February 1, 2008 until January 31, 2009. For a period of three years after the year in which the Advisor waives or reimburses expenses, the Advisor may seek reimbursement from the Funds to the extent that total annual Fund operating expenses are less than the expense limitation in effect at the time of the reimbursement. The Advisor reimbursed Institutional Class expenses of $6,062, $706, $43,673, $5 and $1,298 for the Growth, Growth II, Focus 30, Large Growth and Value Funds, respectively for the year ended October 31, 2009.
The Advisor recouped $2,375 of previously reimbursed Original Class expenses for the Large Growth Fund for the period ended October 31, 2009.
As of October 31, 2009, cumulative expenses subject to potential recovery to the aforementioned conditions and year of expiration are as follows:
| | | | Oct. 31, 2011 | | | Oct. 31, 2012 | | | Total | |
| | Growth Fund – Institutional Class | | $ | 7,464 | | | $ | 6,062 | | | $ | 13,526 | |
| | Growth II Fund – Institutional Class | | $ | 137 | | | $ | 706 | | | $ | 843 | |
| | Focus 30 Fund – Institutional Class | | $ | 35,499 | | | $ | 43,673 | | | $ | 79,172 | |
| | Large Growth Fund – Original Class | | $ | 38,323 | | | $ | — | | | $ | 38,323 | |
| | Large Growth Fund – Institutional Class | | $ | 2,051 | | | $ | 5 | | | $ | 2,056 | |
| | Value Fund – Institutional Class | | $ | 1,056 | | | $ | 1,298 | | | $ | 2,354 | |
The Board of Directors has approved a Shareholder Servicing Plan for the Original Class shares of the Growth, Growth II, Focus 30, Large Growth, Value, Total Return and Balanced Funds which was instituted to compensate the Advisor for the non-investment management services it provides to the Funds. The Plan provides for a monthly fee paid to the Advisor at an annual rate of 0.10% of the average daily net assets of the Funds.
The Growth Fund, Growth II Fund, Focus 30 Fund, Large Growth and Value Fund have entered into agreements with various brokers, dealers and financial intermediaries in connection with the sale of shares of the Funds. The agreements provide for periodic payments by the Funds to the brokers, dealers and financial intermediaries for providing certain shareholder maintenance services (sub-transfer agent expenses). These shareholder services include: the pre-processing and quality control of new accounts, shareholder correspondence, answering customer inquiries regarding account status and facilitating shareholder telephone transactions. Fees paid by the Growth Fund, Growth II Fund, Focus 30 Fund, Large Growth and Value Fund to various brokers, dealers and financial intermediaries for the period ended October 31, 2009, were $415,470, $55,545, $272,228, $1,225 and $53,648, respectively. Fees paid by the Large Growth Fund and Predecessor Tamarack Fund to various brokers, dealers and financial intermediaries for the year ended September 30, 2009, were $31,656, $2,000, $203, $37, $8, $1 and $5,199 for Original Class, Institutional Class and Predecessor Classes A, I, C, R and S, respectively.
NOTES TO THE FINANCIAL STATEMENTS
The Total Return and Balanced Funds have adopted a plan pursuant to Rule 12b-1 which authorizes payments in connection with the distribution of the Total Return and Balanced Fund shares at an annual rate not to exceed 0.15% of each Fund’s average daily net assets. Amounts paid under the Plan may be spent on any activities or expenses primarily intended to result in the sale of shares, including but not limited to, advertising, compensation for sales and marketing activities or financial institutions and others such as dealers and distributors, shareholder account servicing, the printing and mailing of prospectuses to other than current shareowners and the printing and mailing of sales literature.
The Predecessor Tamarack Fund had adopted a Master Distribution 12b-1 Plan (the “Plan”) in which Tamarack Distributors Inc. (the “Distributor”) acted as the Predecessor Tamarack Fund’s distributor. The Distributor is an affiliate of Voyageur. The Plan permitted the Predecessor Tamarack Fund to make payments for or reimburse the Distributor monthly for distribution-related costs and expenses of marketing shares of each share class covered under the Plan; and/or for providing shareholder services. The following chart shows the most recent Plan fee rate for each class of the Predecessor Tamarack Fund.
| | | Class A | Class C | Class R |
| | 12b-1 Plan Fee | 0.25%* | 1.00% | 0.50% |
| * | The maximum Plan fee rate for Class A shares is 0.50%. The Distributor has contractually waived 0.25% of the total 0.50% Plan fee for Class A. |
Plan fees are based on average daily net assets of the applicable class. Up to 0.25% of each Plan fee may be designated as a Service Fee, as defined by the applicable rules of the Financial Industry Regulatory Authority. The Distributor, subject to applicable legal requirements, may waive a Plan fee voluntarily, in whole or in part. The distribution fees as of September 30, 2009 for the Predecessor Tamarack Fund were $5,320, $435 and $15 for Classes A, C and R, respectively. Neither the Original nor the Institutional Class shares of the Cornerstone Large Growth Fund have adopted a 12b-1 Plan.
For the period ended March 20, 2009, the Distributor received commissions of $436 from front-end sales charges of Class A shares of the Predecessor Tamarack Fund, all of which was paid to affiliated broker-dealers. The Distributor received no CDSC fees from Class A shares or Class C shares of the Predecessor Tamarack Fund during the period ended March 20, 2009. Class A and Class C shares were no longer offered for sale after March 20, 2009.
U.S. Bancorp Fund Services, LLC (the “Administrator”) acts as the Funds’ Administrator under an Administration Agreement. The Administrator prepares various federal and state regulatory filings, reports and returns for the Funds; prepares reports and materials to be supplied to the directors; monitors the activities of the Funds’ custodian, transfer agent and accountants; coordinates the preparation and payment of the Funds’ expenses and reviews the Funds’ expense accruals. Fees paid to U.S. Bancorp Fund Services, LLC for the year ended October 31, 2009, were $654,138, $83,471, $423,766, $15,623, $246,561, $131,401 and $32,730 for Growth, Growth II, Focus 30, Large Growth, Value, Total Return and Balanced Funds, respectively. Fees paid to U.S. Bancorp Fund Services, LLC for services provided to the Large Growth Fund for the period March 20, 2009 through September 30, 2009 were $85,033.
HENNESSY FUNDS �� 1-800-966-4354
Prior to March 23, 2009 Voyageur and PNC Global Investment Servicing (U.S.) Inc. (“PNC”) served as co-administrators of the Predecessor Tamarack Fund. Services provided under the administrative services contract included providing day-to-day administration of matters related to the Predecessor Tamarack Fund, maintenance of its records and the preparation of reports. Under the terms of the administrative services contract, Voyageur received a fee, payable monthly, at the annual rate of 0.075% of the Predecessor Tamarack Fund’s average daily net assets. PNC received a fee for its services payable by the Predecessor Tamarack Fund based on the Predecessor Tamarack Fund’s average net assets. Voyageur’s fee is included in “Administration fees” in the Statement of Operations for the year ended September 30, 2009. PNC’s fee is included with “Fund Accounting fees” in the Statement of Operations for the year ended September 30, 2009.
Quasar Distributors, LLC (the “Distributor”) acts as the Funds’ principal underwriter in a continuous public offering of the Funds’ shares. The Distributor is an affiliated company of U.S. Bank, N.A.
The Growth, Growth II, Focus 30, and Value Funds have $40,000,000, $1,500,000, $25,000,000 and $10,000,000 lines of credit, respectively, intended to provide short-term financing, if necessary, subject to certain restrictions, in connection with shareholder redemptions. The credit facility is with its custodian bank, U.S. Bank, N.A. During the year ended October 31, 2009, the Growth Fund had an outstanding average daily balance and a weighted average interest rate of $35,436 and 3.34%, respectively. The maximum amount outstanding for the Growth Fund during the period was $1,511,000. During the year ended October 31, 2009, the Growth II Fund had an outstanding average daily balance and a weighted average interest rate of $4,014 and 3.34%, respectively. The maximum amount outstanding for the Growth II Fund during the period was $303,000. During the year ended October 31, 2009, the Focus 30 Fund had an outstanding average daily balance and a weighted average interest rate of $15,299 and 3.34%, respectively. The maximum amount outstanding for the Focus 30 Fund during the period was $1,941,000. During the year ended October 31, 2009, the Value Fund had an outstanding average daily balance and a weighted average interest rate of $414 and 3.34%, respectively. The maximum amount outstanding for the Value Fund during the period was $108,000.
NOTES TO THE FINANCIAL STATEMENTS
| 7). | FEDERAL TAX INFORMATION |
As of October 31, 2009, the components of accumulated earnings (losses) for income tax purposes were as follows:
| | | Growth | | | Growth II | | | Focus 30 | |
| | | Fund | | | Fund | | | Fund | |
| Tax cost of Investments | | $ | 224,061,528 | | | $ | 27,673,681 | | | $ | 156,197,343 | |
| Unrealized Appreciation | | | 24,112,218 | | | | 4,292,546 | | | | 5,600,584 | |
| Unrealized Depreciation | | | (19,864,261 | ) | | | (1,794,420 | ) | | | (5,659,121 | ) |
| Net unrealized appreciation (depreciation) | | | 4,247,957 | | | | 2,498,126 | | | | (58,537 | ) |
| Undistributed OI | | $ | — | | | $ | — | | | $ | — | |
| Undistributed LTG | | $ | — | | | $ | — | | | $ | — | |
| Distributable earnings | | $ | — | | | $ | — | | | $ | — | |
| Other accumulated gain/(loss) | | $ | (292,454,322 | ) | | $ | (61,399,808 | ) | | $ | (89,114,703 | ) |
| Total accumulated gain/(loss) | | $ | (288,206,365 | ) | | $ | (58,901,682 | ) | | $ | (89,173,240 | ) |
| | | Large | | | | | | Total | | | | |
| | | Growth | | | Value | | | Return | | | Balanced | |
| | | Fund | | | Fund | | | Fund | | | Fund | |
| Tax cost of Investments | | $ | 53,957,008 | | | $ | 134,897,164 | | | $ | 67,023,216 | | | $ | 11,355,997 | |
| Unrealized Appreciation | | | 16,656,370 | | | | 27,487,624 | | | | 4,107,674 | | | | 1,367,882 | |
| Unrealized Depreciation | | | (1,137,512 | ) | | | (15,673,257 | ) | | | (4,863,918 | ) | | | (849,113 | ) |
| Net unrealized | | | | | | | | | | | | | | | | |
| appreciation (depreciation) | | | 15,518,858 | | | | 11,814,367 | | | | (756,244 | ) | | | 518,769 | |
| Undistributed OI | | $ | 358,421 | | | $ | 2,322,929 | | | $ | 86,870 | | | $ | 4,907 | |
| Undistributed LTG | | $ | — | | | $ | — | | | $ | — | | | $ | — | |
| Distributable earnings | | $ | 358,421 | | | $ | 2,322,929 | | | $ | 86,870 | | | $ | 4,907 | |
| Other accumulated gain/(loss) | | $ | (21,442,496 | ) | | $ | (85,002,113 | ) | | $ | (18,972,802 | ) | | $ | (3,507,494 | ) |
| Total accumulated gain/(loss) | | $ | (5,565,217 | ) | | $ | (70,864,817 | ) | | $ | (19,642,176 | ) | | $ | (2,983,818 | ) |
The difference between book-basis and tax-basis unrealized appreciation is attributable primarily to wash sales and partnership adjustments.
At October 31, 2009, the Growth Fund had tax basis capital losses of $292,454,322, to offset future capital gains, the use of a portion of which is limited by IRS regulations. Of such losses, $182,559 expire October 31, 2010, $115,170,412 expire October 31, 2016, and $177,101,351 expire October 31, 2017. Additionally, the Growth Fund had no post-October loss deferrals as of October 31, 2009.
At October 31, 2009, the Growth II Fund had tax basis capital losses of $61,399,808, to offset future capital gains, the use of a portion of which is limited by IRS regulations. Of such losses, $36,286,123 expire October 31, 2016 and $25,113,685 expire October 31, 2017. Additionally, the Growth II Fund had no post-October loss deferrals as of October 31, 2009.
At October 31, 2009, the Focus 30 Fund had tax basis capital losses of $89,114,703, to offset future capital gains, the use of a portion of which is limited by IRS regulations. Of such losses, $47,979,565 expire October 31, 2016
HENNESSY FUNDS 1-800-966-4354
At October 31, 2009, the Large Growth Fund had tax basis capital losses of $21,442,496, to offset future capital gains, the use of a portion of which is limited by IRS regulations. Of such losses, $612,261 expire October 31, 2015, $2,573,644 expire October 31, 2016 and $18,256,591 expire October 31, 2017. Additionally, the Large Growth Fund had no post-October loss deferrals as of October 31, 2009.
At October 31, 2009, the Value Fund had tax basis capital losses of $85,002,113, to offset future capital gains, the use of a portion of which is limited by IRS regulations. Of such losses, $27,482,264 expire October 31, 2010 and $712,595 expire October 31, 2011 and $56,807,254 expire on October 31, 2017. Additionally, the Value Fund had no post-October loss deferrals as of October 31, 2009.
At October 31, 2009, the Total Return Fund had tax basis capital losses of $18,972,802, which may be carried over to offset future capital gains. Of such $18,972,802 expire October 31, 2017. Additionally, the Total Return Fund had no post-October loss deferrals as of October 31, 2009.
At October 31, 2009, the Balanced Fund had tax basis capital losses of $3,507,494, to offset future capital gains, the use of a portion of which is limited by IRS regulations. Of such losses, $447,964 expire October 31, 2010, $119,027 expire October 31, 2016 and $2,940,503 expire October 31, 2017. Additionally, the Balanced Fund had no post-October loss deferrals as of October 31, 2009.
The tax character of distributions paid during 2009 and 2008 for the Funds were as follows:
| | | Year Ended | | | Year Ended | |
| Growth Fund | | October 31, 2009 | | | October 31, 2008 | |
| Ordinary income | | $ | — | | | $ | — | |
| Long-term capital gain | | | — | | | | 110,914,201 | |
| Return of capital | | | — | | | | 64 | |
| | | $ | — | | | $ | 110,914,265 | |
| | | | | | | |
| | | Year Ended | | | Year Ended | |
| Growth II Fund | | October 31, 2009 | | | October 31, 2008 | |
| Ordinary income | | $ | — | | | $ | 7,021,405 | |
| Long-term capital gain | | | — | | | | 19,858,903 | |
| Return of capital | | | — | | | | 174,708 | |
| | | $ | — | | | $ | 27,055,016 | |
| | | | | | | |
| | | Year Ended | | | Year Ended | |
| Focus 30 Fund | | October 31, 2009 | | | October 31, 2008 | |
| Ordinary income | | $ | — | | | $ | 1,697,121 | |
| Long-term capital gain | | | — | | | | 31,369,777 | |
| Return of capital | | | — | | | | 183,117 | |
| | | $ | — | | | $ | 33,250,015 | |
NOTES TO THE FINANCIAL STATEMENTS
| | | One Month Ended | | | Year Ended | | | Year Ended | |
| Large Growth Fund | | October 31, 2009 | | | September 30, 2009 | | | September 30, 2008 | |
| Ordinary income | | $ | — | | | $ | — | | | $ | — | |
| Long-term capital gain | | | — | | | | — | | | | — | |
| | | $ | — | | | $ | — | | | $ | — | |
| | | Years Ended | | | Year Ended | |
| Value Fund | | October 31, 2009 | | | October 31, 2008 | |
| Ordinary income | | $ | 5,652,451 | | | $ | 4,859,028 | |
| Long-term capital gain | | | — | | | | — | |
| | | $ | 5,652,451 | | | $ | 4,859,028 | |
| | | | | | | |
| | | Year Ended | | | Year Ended | |
| Total Return Fund | | October 31, 2009 | | | October 31, 2008 | |
| Ordinary income | | $ | 956,356 | | | $ | 2,008,865 | |
| Long-term capital gain | | | — | | | | — | |
| Return of capital | | | — | | | | 14,437 | |
| | | $ | 956,356 | | | $ | 2,023,302 | |
| | | | | | | |
| | | Year Ended | | | Year Ended | |
| Balanced Fund | | October 31, 2009 | | | October 31, 2008 | |
| Ordinary income | | $ | 138,030 | | | $ | 353,767 | |
| Long-term capital gain | | | — | | | | 777,518 | |
| | | $ | 138,030 | | | $ | 1,131,285 | |
On March 20, 2009 the shareholders of the Tamarack Large Cap Growth Fund approved the agreement and plan of reorganization providing for the transfer of assets of the Tamarack Large Cap Growth Fund to the Hennessy Cornerstone Large Growth Fund and the assumption of the liabilities of the Tamarack Large Cap Growth Fund by the Hennessy Cornerstone Large Growth Fund. The following table illustrates the specifics of the reorganization:
| | Shares issued to | | | |
| Acquired Fund | Shareholders of | Acquiring Fund | Combined | Tax Status |
| Net Assets | Acquired Fund | Net Assets | Net Assets | of Transfer |
$51,980,253(1) | 7,722,854 | — | $51,980,253 | Non-taxable |
(1) | Includes accumulated realized losses and unrealized depreciation in the amounts of ($13,369,709) and ($16,139,531) respectively. |
HENNESSY FUNDS 1-800-966-4354
The Shareholders and Board of Directors/Trustees of
The Hennessy Mutual Funds, Inc., The Hennessy Funds, Inc.,
and The Hennessy Funds Trust:
We have audited the accompanying statements of assets and liabilities of Hennessy Cornerstone Growth Fund, Hennessy Cornerstone Growth Fund, Series II, Hennessy Focus 30 Fund, Hennessy Cornerstone Large Growth Fund, Hennessy Cornerstone Value Fund, Hennessy Total Return Fund and Hennessy Balanced Fund, including the schedules of investments, as of October 31, 2009, and the related statements of operations for the year then ended (month ended October 31, 2009 and year ended September 30, 2009 for Hennessy Cornerstone Large Growth Fund), statements of changes in net assets for each of the periods presented in the two-year period then ended (month ended October 31, 2009 and year ended September 30, 2009 for Hennessy Cornerstone Large Growth Fund), and the financial highlights for each of the periods presented in the five-year period then ended (month ended October 31, 2009 and year ended September 30, 2009 for Hennessy Cornerstone Large Growth Fund; years ended October 31, 2008 and 2007, period ended October 31, 2006 and year ended June 30, 2006 for the Hennessy Cornerstone Large Growth Fund, Series II). These financial statements and financial highlights are the responsibility of management. Our responsibility is to express an opinion on these financial statements and financial highlights based on our audits. The statement of changes in net assets and financial highlights for the periods presented through September 30, 2008 of the Hennessy Cornerstone Large Growth Fund were audited by other auditors whose report dated November 26, 2008, expressed an unqualified opinion on that statement and those financial highlights. The financial highlights for the year ended June 30, 2005 of the Hennessy Cornerstone Growth Fund, Series II were audited by other auditors whose report dated July 28, 2005 expressed an unqualified opinion on those financial highlights.
We conducted our audits in accordance with the standards of the Public Company Accounting Oversight Board (United States). Those standards require that we plan and perform the audit to obtain reasonable assurance about whether the financial statements and financial highlights are free of material misstatement. An audit includes examining, on a test basis, evidence supporting the amounts and disclosures in the financial statements. Our procedures included confirmation of securities owned as of October 31, 2009 by correspondence with the custodian and brokers or by other appropriate auditing procedures. An audit also includes assessing the accounting principles used and significant estimates made by management, as well as evaluating the overall financial statement presentation. We believe that our audits provide a reasonable basis for our opinion.
In our opinion, the financial statements and financial highlights referred to above present fairly, in all material respects, the financial position of Hennessy
REPORT OF INDEPENDENT REGISTERED PUBLIC ACCOUNTING FIRM
Cornerstone Growth Fund, Hennessy Cornerstone Growth Fund, Series II, Hennessy Focus 30 Fund, Hennessy Cornerstone Large Growth Fund, Hennessy Cornerstone Value Fund, Hennessy Total Return Fund and Hennessy Balanced Fund as of October 31, 2009, and the results of their operations, the changes in their net assets and the financial highlights for each of the periods described in the first paragraph above, in conformity with U.S. generally accepted accounting principles.
Milwaukee, Wisconsin
December 29, 2009
HENNESSY FUNDS 1-800-966-4354
| | Position(s) | Term of Office |
| | Held with | and Length of |
| Name, Age and Address | the Companies | Time Served |
| | | |
| “Disinterested Persons” | | |
| | | |
| J. Dennis DeSousa | Director/Trustee | Indefinite, until |
| Age: 72 | | successor elected |
| Address: | | |
| c/o Hennessy Advisors, Inc. | | HMFI: Since January 1996 |
| 7250 Redwood Blvd. | | HFI: Since January 1996 |
| Suite 200 | | HFT: Since July 2005 |
| Novato, CA 94945 | | |
| | | |
| Robert T. Doyle | Director/Trustee | Indefinite, until |
| Age: 61 | | successor elected |
| Address: | | |
| c/o Hennessy Advisors, Inc. | | HMFI: Since January 1996 |
| 7250 Redwood Blvd. | | HFI: Since January 1996 |
| Suite 200 | | HFT: Since July 2005 |
| Novato, CA 94945 | | |
| | | |
| Gerald P. Richardson | Director/Trustee | Indefinite, until |
| Age: 62 | | successor elected |
| Address: | | |
| c/o Hennessy Advisors, Inc. | | HMFI: Since May 2004 |
| 7250 Redwood Blvd. | | HFI: Since May 2004 |
| Suite 200 | | HFT: Since July 2005 |
| Novato, CA 94945 | | |
| | | |
| “Interested Persons” (as defined in the 1940 Act) | | |
| | | |
Neil J. Hennessy(1) | Director/Trustee | Director/Trustee: |
| Age: 53 | and Chairman | Indefinite, until |
| Address: | of the Board | successor elected |
| c/o Hennessy Advisors, Inc. | | |
| 7250 Redwood Blvd. | | HMFI: Since January 2006 |
| Suite 200 | | HFI: Since January 2006 |
| Novato, CA 94945 | | HFT: Since July 2005 |
| | | |
| | | Officer (Chairman of the Board): |
| | | 1 year term |
| | | |
| | | HMFI: Since June 2008 |
| | | HFI: Since June 2008 |
| | | HFT: Since June 2008 |
DIRECTORS AND OFFICERS OF THE FUND
| | Number of Portfolios in the | |
| Principal Occupation(s) | Fund Complex Overseen | Other Directorships |
| During Past 5 Years | by Director/Trustee | Held by Director |
| | | |
| Currently a real estate investor. | 10 | None. |
| | | |
| | | |
| | | |
| | | |
| | | |
| | | |
| | | |
| Currently the Sheriff of Marin County, | 10 | None. |
| California (since 1996) and has been | | |
| employed in the Marin County Sheriff’s | | |
| Office in various capacities since 1969. | | |
| | | |
| | | |
| | | |
| | | |
| Formerly the Chief Executive Officer and | 10 | None. |
| owner of ORBIS Payment Services. | | |
| Mr. Richardson is now an independent | | |
| consultant in the securities industries. | | |
| | | |
| | | |
| | | |
| | | |
| | | |
| President, Chairman, CEO and Co-Portfolio | 10 | Director of Hennessy |
| Manager of Hennessy Advisors, Inc., the | | Advisors, Inc. |
| Hennessy Funds’ investment advisor, since | | |
| 1989; President of HMFI and HFI from 1996 | | |
| through June 2008, and President of HFT | | |
| from 2005 through June 2008. | | |
HENNESSY FUNDS 1-800-966-4354
| | Position(s) | Term of Office |
| | Held with | and Length of |
| Name, Age and Address | the Companies | Time Served |
| | | |
Kevin A. Rowell(1) | President | 1 year term |
| Age: 49 | | |
| Address: | | HMFI: Since June 2008 |
| c/o Hennessy Advisors, Inc. | | HFI: Since June 2008 |
| 7250 Redwood Blvd. | | HFT: Since June 2008 |
| Suite 200 | | |
| Novato, CA 94945 | | |
| | | |
Frank Ingarra, Jr.(1) | Co-Portfolio | 1 year term |
| Age: 38 | Manager and | |
| Address: | Vice President | HMFI: Since August 2002 |
| c/o Hennessy Advisors, Inc. | | HFI: Since August 2002 |
| 7250 Redwood Blvd. | | HFT: Since July 2005 |
| Suite 200 | | |
| Novato, CA 94945 | | |
| | | |
Harry F. Thomas(1) | Vice President, | 1 year term |
| Age: 62 | Chief Compliance | |
| Address: | Officer | HMFI: Since September 2004 |
| c/o Hennessy Advisors, Inc. | | HFI: Since September 2004 |
| 7250 Redwood Blvd. | | HFT: Since July 2005 |
| Suite 200 | | |
| Novato, CA 94945 | | |
| | | |
Teresa M. Nilsen(1) | Executive Vice | 1 year term |
| Age: 43 | President and | |
| Address: | Treasurer | HMFI: Since January 1996 |
| c/o Hennessy Advisors, Inc. | | HFI: Since January 1996 |
| 7250 Redwood Blvd. | | HFT: Since July 2005 |
| Suite 200 | | |
| Novato, CA 94945 | | |
| | | |
Daniel B. Steadman(1) | Executive Vice | 1 year term |
| Age: 53 | President and | |
| Address: | Secretary | HMFI: Since March 2000 |
| c/o Hennessy Advisors, Inc. | | HFI: Since March 2000 |
| 7250 Redwood Blvd. | | HFT: Since July 2005 |
| Suite 200 | | |
| Novato, CA 94945 | | |
DIRECTORS AND OFFICERS OF THE FUND
| | Number of Portfolios in the | |
| Principal Occupation(s) | Fund Complex Overseen | Other Directorships |
| During Past 5 Years | by Director/Trustee | Held by Director |
| | | |
| Mr. Rowell was President of Pioneer Funds | N/A | None. |
| Distributor from January 2006 to July 2007; | | |
| from April 2004 through November 2005, | | |
| Mr. Rowell was Executive Vice President at | | |
| Charles Schwab & Co., Inc.; and from | | |
| September 2002 through April 2004 was | | |
| President SAFECO Mutual Funds. | | |
| | | |
| Mr. Ingarra Co-Portfolio Manager for | N/A | None. |
| Hennessy Advisors, Inc., the Funds’ | | |
| investment advisor. Mr. Ingarra has been | | |
| with the Hennessy Funds and Hennessy | | |
| Advisors, Inc. since 2004. He is Vice | | |
| President of the Hennessy Funds. | | |
| | | |
| Vice President, Chief Compliance Officer | N/A | None. |
| for Hennessy Advisors, Inc., the Funds’ | | |
| investment advisor, since 2004; retired | | |
| business executive from 2001 through | | |
| 2004; and director of The Hennessy | | |
| Funds from 2000 to May 2004. | | |
| | | |
| Currently Executive Vice President, Chief | N/A | Director of Hennessy |
| Financial Officer and Secretary of Hennessy | | Advisors, Inc. |
| Advisors, Inc., the Funds’ investment advisor; | | |
| Ms. Nilsen has been the corporate secretary | | |
| and a financial officer of Hennessy Advisors, | | |
| Inc. since 1989; Ms. Nilsen has been an | | |
| officer of The Hennessy Funds since 1996, | | |
| currently she is Executive Vice President | | |
| and Treasurer. | | |
| | | |
| Executive Vice President of Hennessy | N/A | Director of Hennessy |
| Advisors, Inc., the Funds’ investment advisor, | | Advisors, Inc. |
| from 2000 to the present; Mr. Steadman has | | |
| been Executive Vice President and Secretary | | |
| of The Hennessy Funds since 2000. | | |
HENNESSY FUNDS 1-800-966-4354
| | Position(s) | Term of Office |
| | Held with | and Length of |
| Name, Age and Address | the Companies | Time Served |
| | | |
Tania A. Kelley(1) | Vice President | 1 year term |
| Age: 44 | of Marketing | |
| Address: | | HMFI: Since October 2003 |
| c/o Hennessy Advisors, Inc. | | HFI: Since October 2003 |
| 7250 Redwood Blvd. | | HFT: Since July 2005 |
| Suite 200 | | |
| Novato, CA 94945 | | |
| | | |
Ana Miner(1) | Vice President | 1 year term |
| Age: 51 | of Operations | |
| Address: | | HMFI: Since March 2000 |
| c/o Hennessy Advisors, Inc. | | HFI: Since March 2000 |
| 7250 Redwood Blvd. | | HFT: Since July 2005 |
| Suite 200 | | |
| Novato, CA 94945 | | |
| | | |
Brian Peery(1) | Vice President | 1 year term |
| Age: 40 | of Sales | |
| Address: | | HMFI: Since March 2003 |
| c/o Hennessy Advisors, Inc. | | HFI: Since March 2003 |
| 7250 Redwood Blvd. | | HFT: Since July 2005 |
| Suite 200 | | |
| Novato, CA 94945 | | |
(1) | All officers of the Hennessy Funds and employees of the Advisor are Interested Persons of the Hennessy Funds. |
Key:
HMFI = Hennessy Mutual Funds, Inc.
HFI = Hennessy Funds, Inc.
HFT = Hennessy Funds Trust
DIRECTORS AND OFFICERS OF THE FUND
| | Number of Portfolios in the | |
| Principal Occupation(s) | Fund Complex Overseen | Other Directorships |
| During Past 5 Years | by Director/Trustee | Held by Director |
| | | |
| Has been employed by Hennessy | N/A | None. |
| Advisors, Inc., the Funds’ investment | | |
| advisor, since October 2003; Director of | | |
| Sales and Marketing for Comcast from | | |
| 2000 through 2003. | | |
| | | |
| Has been employed by Hennessy | N/A | None. |
| Advisors, Inc., the Funds’ investment | | |
| advisor, since 1998. | | |
| | | |
| Has been employed by Hennessy | N/A | None. |
| Advisors, Inc., the Funds’ investment | | |
| advisor, since June 2002; Vice President of | | |
| Institutional Sales and Senior Analyst with | | |
| Brad Peery Inc. from June 2000 to June | | |
| 2002; from 1996 to 2002, Mr. Peery worked | | |
| for Haywood Securities where he was a | | |
| Vice President. | | |
HENNESSY FUNDS 1-800-966-4354
October 31, 2009
As a shareholder of the Funds, you incur two types of costs: (1) transaction costs, including sales charges (loads) on purchase payments, reinvested dividends, or other distributions; redemption fees; and exchange fees; and (2) ongoing costs, including management fees; service fees; and other Fund expenses. This Example is intended to help you understand your ongoing costs (in dollars) of investing in each of the Funds and to compare these costs with the ongoing costs of investing in other mutual funds. The Example is based on an investment of $1,000 invested at the beginning of the period and held for the entire period from May 1, 2009 through October 31, 2009.
Actual Expenses
The first set of lines of the table below provide information about actual account values and actual expenses. Although the Funds charge no sales loads or transaction fees, you will be assessed fees for outgoing wire transfers, returned checks and stop payment orders at prevailing rates charged by U.S. Bancorp Fund Services, LLC, the Funds’ transfer agent. If you request that a redemption be made by wire transfer, currently a $15.00 fee is charged by the Funds’ transfer agent. IRA accounts will be charged a $15.00 annual maintenance fee. The example below includes, but is not limited to, management fees, shareholder servicing fees, fund accounting, custody and transfer agent fees. However, the example below does not include portfolio trading commissions and related expenses, interest expense or dividends on short positions taken by the Fund and other extraordinary expenses as determined under generally accepted accounting principles. You may use the information within these lines, together with the amount you invested, to estimate the expenses that you paid over the six-month period. Simply divide your account value by $1,000 (for example, an $8,600 account value divided by $1,000 = 8.6), then multiply the result by the number in the first line under the heading entitled “Expenses Paid During Period” to estimate the expenses you paid on your account during this period.
Hypothetical Example for Comparison Purposes
The second set of lines within the table below provide information about hypothetical account values and hypothetical expenses based on the Funds’ actual expense ratios and an assumed rate of return of 5% per year before expenses, which is not the Funds’ actual return. The hypothetical account values and expenses may not be used to estimate the actual ending account balance or expenses you paid for the period. You may use this information to compare the ongoing costs of investing in the Funds and other funds. To do so, compare this 5% hypothetical example with the 5% hypothetical examples that appear in the shareholder reports of the other funds. Please note that the expenses shown in the table are meant to highlight your ongoing costs only and do not reflect any transactional costs, such as sales charges (loads), or exchange fees. Therefore, the second line of the table is useful in comparing ongoing costs only, and will not help you determine the relative total costs of owning different funds. In addition, if these transactional costs were included, your costs would have been higher.
| | Beginning | Ending | Expenses Paid |
| | Account Value | Account Value | During Period(1) |
| Original Class | 5/1/09 | 10/31/09 | 5/1/09 – 10/31/09 |
| | | | |
| Actual | | | |
| Growth Fund – Original Class | $1,000.00 | $1,098.50 | $7.19 |
| Growth II Fund – Original Class | $1,000.00 | $1,128.20 | $9.12 |
| Focus 30 Fund – Original Class | $1,000.00 | $1,157.80 | $7.56 |
| Large Growth Fund – Original Class | $1,000.00 | $1,222.90 | $7.34 |
| Value Fund – Original Class | $1,000.00 | $1,304.30 | $7.38 |
| Total Return Fund – Original Class | $1,000.00 | $1,166.60 | $8.52 |
| Balanced Fund – Original Class | $1,000.00 | $1,141.70 | $9.34 |
| | | | |
| Hypothetical (5% return | | | |
| before expenses) | | | |
| Growth Fund – Original Class | $1,000.00 | $1,018.35 | $6.92 |
| Growth II Fund – Original Class | $1,000.00 | $1,016.64 | $8.64 |
| Focus 30 Fund – Original Class | $1,000.00 | $1,018.20 | $7.07 |
| Large Growth Fund – Original Class | $1,000.00 | $1,018.60 | $6.67 |
| Value Fund – Original Class | $1,000.00 | $1,018.80 | $6.46 |
| Total Return Fund – Original Class | $1,000.00 | $1,017.34 | $7.93 |
| Balanced Fund – Original Class | $1,000.00 | $1,016.48 | $8.79 |
(1) | Expenses are equal to the Growth Funds’s expense ratio of 1.38%, the Growth II Fund’s expense ratio of 1.70%, the Focus 30 Fund’s expense ratio of 1.42%, the Large Growth Fund’s expense ratio of 1.30%, the Value Fund’s expense ratio of 1.26%, the Total Return Fund’s expense ratio of 1.37%, and the Balanced Fund’s expense ratio of 1.73%, multiplied by the average account value over the period, multiplied by 184/365 days (to reflect one-half year period.) |
| | Beginning | Ending | Expenses Paid |
| | Account Value | Account Value | During Period(2) |
| Institutional Class | 5/1/09 | 10/31/09 | 5/1/09 – 10/31/09 |
| | | | |
| Actual | | | |
| Growth Fund – Institutional Class | $1,000.00 | $1,015.67 | $4.98 |
| Growth II Fund – Institutional Class | $1,000.00 | $1,020.60 | $4.99 |
| Focus 30 Fund – Institutional Class | $1,000.00 | $1,024.89 | $5.00 |
| Large Growth Fund – Institutional Class | $1,000.00 | $1,035.12 | $5.03 |
| Value Fund – Institutional Class | $1,000.00 | $1,047.89 | $5.06 |
| | | | |
| Hypothetical (5% return | | | |
| before expenses) | | | |
| Growth Fund – Institutional Class | $1,000.00 | $1,003.16 | $4.95 |
| Growth II Fund – Institutional Class | $1,000.00 | $1,003.16 | $4.95 |
| Focus 30 Fund – Institutional Class | $1,000.00 | $1,003.16 | $4.95 |
| Large Growth Fund – Institutional Class | $1,000.00 | $1,003.16 | $4.95 |
| Value Fund – Institutional Class | $1,000.00 | $1,003.16 | $4.95 |
(2) | Expenses are equal to the Growth, Growth II, Focus 30, Large Growth, and Value Fund’s expense ratio of 0.98%, multiplied by the average account value over the period, multiplied by 184/365 days (to reflect one-half year period.) |
HENNESSY FUNDS 1-800-966-4354
A description of the policies and procedures that the Funds use to determine how to vote proxies relating to portfolio securities is available without charge: (1) by calling 1-800-966-4354; (2) on the Hennessy Funds website at www.hennessyfunds.com; or (3) on the U.S. Securities and Exchange Commission’s website at www.sec.gov. Hennessy Funds’ proxy voting record is available on the SEC’s website at www.sec.gov no later than August 31 for the prior 12 months ending June 30.
Quarterly Filings on Form N-Q
The Funds file their complete schedule of portfolio holdings with the SEC for the first and third quarters of each fiscal year on Form N-Q. The Funds’ Form N-Q will be available on the SEC’s website at www.sec.gov. The Funds’ Form N-Q may be reviewed and copied at the SEC’s Public Reference Room in Washington, DC and information on the operation of the Public Reference Room may be obtained by calling 1-800-SEC-0330. Information included in the Funds’ N-Q will also be available upon request by calling 1-800-966-4354.
Federal Tax Distribution Information (Unaudited)
The Value, Total Return and Balanced Fund designated 100%, 100% and 99.32%, respectively, of the dividend declared from net investment income during the year ended October 31, 2009, as qualified dividend income under the Jobs Growth and Tax Reconciliation Act of 2003.
For the year ended October 31, 2009, 84.20%, 100% and 99% of the ordinary income distributions paid by the Value, Total Return and Balanced Funds, respectively, qualify for the dividends received deduction available to corporate shareholders.
Privacy Policy
We collect the following non-public personal information about you:
| • | information we receive from you on or in applications or other forms, correspondence, or conversations, including, but not limited to, your name, address, phone number, social security number, assets, income and date of birth; |
| • | information about your transactions with us, our affiliates, or others, including, but not limited to, your account number and balance, payment history, parties to transactions, cost basis information and other financial information. |
We do not disclose any non-public personal information about our current or former shareholders to nonaffiliated third parties, except as permitted by law. For example, we are permitted by law to disclose all of the information we collect, as described above, to our Transfer Agent to process your transactions. Furthermore, we restrict access to your non-public personal information to those persons who require such information to provide products or services to you. We maintain physical, electronic and procedural safeguards that comply with federal standards to guard your non-public personal information.
In the event that you hold shares of the Fund through a financial intermediary, including, but not limited to, a broker-dealer, bank or trust company, the privacy policy of your financial intermediary would govern how your non-public personal information would be shared with nonaffiliated third parties.
HENNESSY FUNDS 1-800-966-4354
For information, questions
or assistance, please call
The Hennessy Funds
1-800-966-4354 or 1-415-899-1555
INVESTMENT ADVISOR
Hennessy Advisors, Inc.
7250 Redwood Blvd., Suite 200
Novato, California 94945
ADMINISTRATOR, TRANSFER
AGENT, DIVIDEND PAYING
AGENT & SHAREHOLDER
SERVICING AGENT
U.S. Bancorp Fund Services, LLC
P.O. Box 701
Milwaukee, Wisconsin 53201-0701
CUSTODIAN
U.S. Bank N.A.
Custody Operations
1555 North River Center Dr., Suite 302
Milwaukee, Wisconsin 53212
TRUSTEES
Neil J. Hennessy
Robert T. Doyle
J. Dennis DeSousa
Gerald P. Richardson
COUNSEL
Foley & Lardner LLP
777 East Wisconsin Avenue
Milwaukee, Wisconsin 53202-5306
INDEPENDENT REGISTERED
PUBLIC ACCOUNTING FIRM
KPMG LLP
303 East Wacker Drive
Chicago, Illinois 60601
DISTRIBUTOR
Quasar Distributors, LLC
615 East Michigan Street
Milwaukee, Wisconsin 53202
WWW.HENNESSYFUNDS.COM
This report has been prepared for shareholders and may be distributed
to others only if preceded or accompanied by a current prospectus.
HENNESSY FUNDS
ANNUAL REPORT
OCTOBER 31, 2009
Hennessy Select Large Value Fund
Hennessy Select SPARX Japan Fund
Hennessy Select SPARX Japan Smaller Companies Fund
| Letter to shareholders | 1 |
| Performance overview | |
| Hennessy Select Large Value Fund | 6 |
| Hennessy Select SPARX Japan Fund | 9 |
| Hennessy Select SPARX Japan Smaller Companies Fund | 12 |
| Summaries of investments | |
| Hennessy Select Large Value Fund | 15 |
| Hennessy Select SPARX Japan Fund | 21 |
| Hennessy Select SPARX Japan Smaller Companies Fund | 25 |
| Financial statements | |
| Statements of assets and liabilities | 30 |
| Statements of operations | 32 |
| Statements of changes in net assets | 34 |
| Financial highlights | |
| Hennessy Select Large Value Fund | 40 |
| Hennessy Select SPARX Japan Fund | 42 |
| Hennessy Select SPARX Japan Smaller Companies Fund | 44 |
| Notes to the financial statements | 46 |
| Report of Independent Registered Public Accounting Firm | 57 |
| Directors and Officers of the Funds | 58 |
| Expense example | 64 |
| Proxy voting policy | 66 |
December, 2009
Dear Hennessy Funds Shareholder:
The past year is one that I believe many investors will be glad to have behind them. At the beginning of the Fund’s fiscal year (November, 2008) the economy and financial markets were in chaos, and it felt as though they were on the brink of collapse following the AIG bailout, Lehman Brothers failure and the mega mergers between some of the country’s largest banks and investment houses. Many investors saw their portfolios and 401K’s cut nearly in half, while at the same time watched the values of their homes tumble; there was truly nowhere for investors to hide from the financial fallout. In my 30 years in the business, I have never witnessed the crisis of confidence we experienced in late February/March of this year. Even the most seasoned, disciplined and long-term investors I know simply had had enough and were pulling money out of the stock market.
Overview of the U.S. Market
Since their lows in March, the major indices have rallied back roughly 50-60%. There is certainly some ground to make up for the markets to return to their pre-recession levels, but I believe we are now in the midst of a recovery and that we should see steady, sustainable growth in the coming years. I actually believe the recovery began in November of 2008, with the first injection of government TARP (Trouble Asset Relief Program) spending. Like anything that is broken, a fix takes time to work, however, I believe that investors had seen such staggering losses that they were not willing to take a wait and see approach with this government stimulus. While the markets will no doubt have their ups and downs, I am confident that the lows of March should be behind us.
While the markets are in recovery, in my opinion, investor confidence is not. The magnitude of the most recent downturn has left investors feeling overwhelmed and distraught, and fear has kept many people on the sidelines, causing them to miss the recent rally. I believe there are several key factors that could push the stock market higher:
| • | During the past year companies have seen their stock prices crushed, and many have taken this as an opportunity to cut costs and position their balance sheets for the future. Companies have de-leveraged themselves, laid off employees, closed unprofitable |
HENNESSY FUNDS 1-800-966-4354
| | business lines and taken any available write-offs. As these companies emerge leaner, we expect to see their quarterly earnings steadily improving, as any additional revenue falls to their bottom lines. |
| • | The Federal Reserve appears to remain committed to very low interest rates. With 30-year U.S. Treasury yields hovering in the 4% range, investors may need to look to the market for more aggressive returns to try to stay ahead of inflation, and I believe this should drive increased investment in high-quality equities. |
| • | The price to sales ratio, one of the tools we use to determine a stock’s value, has returned to normalized historical levels. Over the past ten years the price to sales ratio of the Dow Jones Industrial Average has averaged $1.23. At the market low on March 9th the price to sales ratio of the Dow had dropped to just $0.60, meaning that investors were able to buy a dollar of revenue for just sixty cents. As of the end of September, 2009, this ratio had rebounded to $1.21 and is again within its historical norm. I believe this ratio will hold steady and that stock prices should rise proportionally with any increase in sales. |
| • | U.S. investors are holding an estimated $9 trillion on the sidelines. Once investor confidence starts to build, I believe this will encourage equity investing. Confidence should beget more widespread confidence and investing may beget further investing. |
| • | Banks are steadily regaining strength, with many already paying back their TARP loans. They have begun to lend again to credit-worthy consumers, who in turn have been able to purchase homes and other big ticket items. |
| • | I believe that companies with strong balance sheets will consider increasing or beginning to pay dividends as a way to increase the attractiveness of their stocks. Should shareholders receive dividend payments and see their investments rise in value, I believe that may spur confidence and increased consumer spending and investing. |
During the past decade, the tech bubble and the housing bubble created large financial gains. Many consumers were allowed, maybe even encouraged, to borrow more heavily than they should have and live beyond their means. In the past year, investors across the globe have learned a lesson about leverage and its downside, and I believe the markets have now made a move back to “normal”, where growth is
LETTER TO SHAREHOLDERS
based on fundamentals, and will be driven by increases in personal income and consumer spending, which should result in increases in corporate earnings. Using history as my guide, I believe the markets should return to a more normalized annual return. Since 1980, even with several major corrections along the way and including the most recent downturn, the Dow Jones Industrial Average has produced a 12% average annual return. While this may not be the 35% return investors were getting in the late 1990’s, I do believe a more normalized growth rate is sustainable for the foreseeable future.
Overview of the Japan Market
During the twelve-month period ending October 31, 2009, the performance of the Japanese equity market remained strong. The period got off to a challenging start as it did in the U.S., as the Japanese stock market dropped due to increasing uncertainty about the economic outlook for worldwide economies. Despite positive developments such as the G-7 ministers’ statement that they were committed to acting jointly to support world growth and strengthen the financial sector, and the passage of a stimulus package in the U.S., investors remained in doubt about the state of global financial institutions and economies. However, the markets bounced back in mid-March and continued their upward ascent due to optimism that the worst may be behind for the global financial industry and economies. Japan too provided enough evidence to support that the world’s second-largest economy may be pulling out of its economic slump. The nation’s Gross Domestic Product (GDP) grew +0.9% in the second quarter from the previous quarter, the first such expansion in five quarters. The Japanese stock market also got a boost on expectations that the opposition Democratic Party of Japan’s win at the August 30 general elections would bring in favorable policies, which could help stimulate domestic demand. Under such market conditions, the Tokyo Stock Price Index (TOPIX) gained +14.77% and the Nikkei 225 Stock Average soared +29.91% (in U.S. dollar terms) during the twelve-month period ending October 31, 2009.
In addition to favorable prospects for investing in the U.S. market, we also believe that there are opportunities in overseas markets, particularly in Japanese companies that have superior technological know how, a history of stable earnings and exposure to the neighboring developing nations. While many developed economies are still recovering, Asia is leading the global economy out of its worst recession since World War II. We believe that investing in certain strong individual Japanese companies, which are also linked to the region, is potentially profitable. Therefore, the Hennessy Select SPARX Japan Funds will continue to focus research efforts on Japanese-based
HENNESSY FUNDS 1-800-966-4354
companies that should benefit from growth in markets outside of Japan, which we expect to benefit from the rising living standards in developing nations.
I continue to believe that historical performance data has shown how patience, discipline and a long-term investing view can be rewarded. Many of the savviest investors, who realize that sometimes the best time to invest is when things look the worst, have already benefitted from the recent rally since the market lows in March.
We maintain our focus on long-term investing and on building value for all of our shareholders. At Hennessy Funds, we serve our shareholders directly, so that we can provide answers to shareholder questions and concerns. Please don’t hesitate to contact us at 800-966-4354 if we can answer any questions or can be of service.
Best regards,
Neil J. Hennessy
Portfolio Manager & Chief Investment Officer
Past performance does not guarantee future results.
Mutual fund investing involves risk. Principal loss is possible. Small and medium-capitalization companies tend to have limited liquidity and greater price volatility than large-capitalization companies. Growth stocks typically are more volatile then value stocks; however value stocks have a lower expected growth rate in earnings and sales. Investments in foreign securities involve greater volatility and political, economic and current risk and differences in accounting methods.
Price-to-sales ratio is a tool for calculating a stock’s valuation relative to other companies. It is calculated by dividing a stock’s current price by its revenue per share.
Opinions expressed are those of Neil Hennessy and are subject to change, are not guaranteed and should not be considered investment advice.
The Dow Jones Industrial Average is an unmanaged index of common stocks comprised of major industrial companies and assumes reinvestment of dividends. The Tokyo Stock Price Index (TOPIX) is a market capitalization-weighted index of all companies listed on the First Section of the Tokyo Stock Exchange. The Nikkei 225 is a stock market index for the Tokyo Stock Exchange (TSE). You cannot invest directly in an index.
LETTER TO SHAREHOLDERS
(This Page Intentionally Left Blank.)
HENNESSY FUNDS 1-800-966-4354
Hennessy Select Large Value Fund
Original Class Shares
AVERAGE ANNUAL TOTAL RETURN PERIODS ENDED OCTOBER 31, 2009
| | | One Month | | | | |
| | | Ended | One | Five | Ten | Since Inception |
| | | 10/31/09 | Year | Years | Years | (9/30/84) |
| | Hennessy Select Large Value | | | | | |
| | Fund – Original Class | -3.13% | 5.12% | -1.46% | 1.01% | 9.39% |
| | Russell 1000 Value Index | -3.06% | 4.78% | -0.05% | 1.70% | 10.65% |
| | S&P 500 Index | -1.86% | 9.80% | 0.33% | -0.95% | 10.24% |
Gross expense ratio: 1.37%. Net expense ratio: 1.30%. The expense ratio is contractually capped at 1.30% through March, 2010.
Performance data quoted represents past performance; past performance does not guarantee future results. The performance for periods prior to March 20, 2009 reflects the performance of the Tamarack Value Fund, the predecessor to the Hennessy Select Large Value Fund. The investment return and principal value of an investment will fluctuate so that an investor’s shares, when redeemed, may be worth more or less than their original cost. Current performance of the fund may be lower or higher than the performance quoted. Performance data current to the most recent month end may be obtained by visiting www.hennessyfunds.com. Investment performance reflects fee waivers in effect. In the absence of such waivers, total return would be reduced. The gross expense ratio presented is that from the most recent prospectus.
PERFORMANCE NARRATIVE FROM VOYAGEUR ASSET MANAGEMENT, SUB-ADVISOR
The Hennessy Select Large Value Fund has changed its fiscal year end from September 30 to October 31, effective with this report for the period ending October 31, 2009. Therefore, the following narrative describes performance for the one month period since the Fund’s last published annual report (for the twelve-month period ending September 30, 2009).
The Hennessy Select Large Value Fund returned -3.13% for the one-month period ending October 31, 2009, slightly underperforming its benchmark, the Russell 1000 Value Index, which returned -3.06%, and the S&P 500, which returned -1.86%. Relative to the market, the Fund had the most difficulty in Health Care and Consumer Staples. In Health Care, a poor performance from Amgen, down 11% for the one-month period, hurt results. In Consumer Discretionary, Starwood Hotels, which has been a strong performer during the year, pulled back in October, losing 12%. The Fund had its best success relative to the market in three sectors, Financials, Industrials, and Technology. In Financials, avoiding some of the worst commercial banks aided results. Within the Industrial sector, owning UTX, which was up 0.85% for the period, instead of Boeing, which was down 11.7%, helped performance. In Technology, Microsoft was up 6.5% in a down market, also aiding results. Markets have been extremely strong since March, and some consolidation of gains is not unexpected. We do not believe this represents a trend for the market, and we continue to own all of the securities mentioned above.
PERFORMANCE OVERVIEW — HENNESSY SELECT LARGE VALUE FUND
Hennessy Select Large Value Fund
Original Class Shares
CHANGE IN VALUE OF $10,000 INVESTMENT
This chart assumes an initial gross investment of $10,000 made on October 31, 1999. Returns shown include the reinvestment of all dividends. Returns shown do not reflect the deduction of taxes that a shareholder would pay on fund distributions or the redemption of fund shares.
HENNESSY FUNDS 1-800-966-4354
Hennessy Select Large Value Fund
Institutional Class Shares
TOTAL RETURN AS OF OCTOBER 31, 2009
| | | One Month | Since Inception |
| | | Ended 10/31/09 | (3/20/09) |
| | Hennessy Select Large Value | | |
| | Fund – Institutional Class | -3.12% | 32.77% |
| | Russell 1000 Value Index | -3.06% | 39.35% |
| | S&P 500 Index | -1.86% | 36.62% |
Gross expense ratio: 1.19%. Net expense ratio: 0.98%. The expense ratio is contractually capped at 0.98% indefinitely.
Performance data quoted represents past performance; past performance does not guarantee future results. The investment return and principal value of an investment will fluctuate so that an investor’s shares, when redeemed, may be worth more or less than their original cost. Current performance of the fund may be lower or higher than the performance quoted. Performance data current to the most recent month end may be obtained by visiting www.hennessyfunds.com. Investment performance reflects fee waivers in effect. In the absence of such waivers, total return would be reduced. The gross expense ratio presented is that from the most recent prospectus.
CHANGE IN VALUE OF $250,000 INVESTMENT
This chart assumes an initial gross investment of $250,000 (minimum investment) made on March 20, 2009 (inception date of share class). Returns shown include the reinvestment of all dividends. Returns shown do not reflect the deduction of taxes that a shareholder would pay on fund distributions or the redemption of fund shares.
The S&P 500 and Russell 1000 Value are unmanaged indices commonly used to measure the performance of U.S. stocks. The Russell 1000 Value measures large-cap, value-oriented stocks. One cannot invest directly in an index.
Medium-capitalization companies tend to have limited liquidity and greater price volatility than large-capitalization companies. Growth stocks typically are more volatile than value stocks; however, value stocks have a lower expected growth rate in earnings and sales.
The Fund’s composition and sector weightings are shown as a percentage of the Fund’s total net assets. Portfolio composition and sector weightings are subject to change at any time and should not be considered a recommendation to buy or sell a particular security. Please refer to the Summary of Investments within this Annual Report for additional portfolio information, including percentages of holdings.
Current and future portfolio holdings are subject to risk.
PERFORMANCE OVERVIEW — HENNESSY SELECT SPARX JAPAN FUND
Hennessy Select SPARX Japan Fund
Original Class Shares
AVERAGE ANNUAL TOTAL RETURN PERIODS ENDED OCTOBER 31, 2009
| | | One | Five | Since Inception |
| | | Year | Years | (10/31/03) |
| | Hennessy Select SPARX Japan Fund – Original Class | 17.36% | -1.17% | 3.82% |
| | MSCI Japan Index | 13.91% | 1.31% | 2.56% |
| | TOPIX | 14.77% | 0.72% | 2.06% |
Gross expense ratio: 1.74%. Net expense ratio: 1.27%. The expense ratio, excluding acquired fund fees, is contractually capped at 1.25% through February, 2010.
Performance data quoted represents past performance; past performance does not guarantee future results. The investment return and principal value of an investment will fluctuate so that an investor’s shares, when redeemed, may be worth more or less than their original cost. Current performance of the fund may be lower or higher than the performance quoted. Performance data current to the most recent month end may be obtained by visiting www.hennessyfunds.com. Investment performance reflects fee waivers in effect. In the absence of such waivers, total return would be reduced. The Fund may impose a redemption fee of 2% on shares held less than 60 days. If it had, total return would be reduced. The gross expense ratio presented is that from the most recent prospectus.
PERFORMANCE NARRATIVE FROM SPARX ASSET MANAGEMENT CO., SUB-ADVISOR
The Hennessy Select SPARX Japan Fund returned 17.36% for the twelve-month period ending October 31, 2009, outperforming both the MSCI Japan Index, which returned 13.91%, and the TOPIX Index, which returned 14.77%. The main contributors to the Fund’s performance in terms of the TOPIX’s 33 leading industry sectors included wholesalers, miscellaneous manufacturers and chemical makers, whereas the worst performers were banks, construction firms and glass and ceramics manufacturers. Among individual companies, positive contributions to the Fund’s performance during the year came from our investments in Mitsubishi Corporation, one of Japan’s major general trading companies, and the world’s leading supplier of shrink wrap labels for food and beverage products Fuji Seal International, Inc. During the period, the share price of Fuji Seal soared, and added more than 1.8% to the Fund’s performance, following the release of its fiscal first-quarter earnings for the year ending in March 2010, which reported a 35% increase in operating profit thanks to an improvement in production levels at its new European plant and a company-wide effort to cut costs amid a downturn in the economy. Shares of Mitsubishi Corporation also jumped, contributing approximately 2% to the performance of the Fund, thanks to the increasing demand for commodities, which is directly proportional to the firm’s earnings. The main detractors to the Fund’s performance for the period were shares of personal-care goods manufacturer Kao Corporation and Mizuho Financial Group, Inc., one of the nation’s leading banks. Kao plunged after announcing mid-September that it will suspend sales of its popular “Econa” brand cooking oil and related products. Mizuho posted declines as investors generally fled financial stocks. Additionally, Japan’s newly appointed minister for financial and postal services proposed plans to extend the repayment of bank loans to help smaller companies, which would pinch lenders’ earnings.
HENNESSY FUNDS 1-800-966-4354
Hennessy Select SPARX Japan Fund
Original Class Shares
CHANGE IN VALUE OF $10,000 INVESTMENT
This chart assumes an initial gross investment of $10,000 made on October 31, 2003. Returns shown include the reinvestment of all dividends. Returns shown do not reflect the deduction of taxes that a shareholder would pay on fund distributions or the redemption of fund shares.
PERFORMANCE OVERVIEW — HENNESSY SELECT SPARX JAPAN FUND
Hennessy Select SPARX Japan Fund
Institutional Class Shares
AVERAGE ANNUAL TOTAL RETURN PERIODS ENDED OCTOBER 31, 2009
| | | One | Five | Since Inception |
| | | Year | Years | (10/31/03) |
| | Hennessy Select SPARX | | | |
| | Japan Fund – Institutional Class | 17.37% | -1.09% | 3.93% |
| | MSCI Japan Index | 13.91% | 1.31% | 2.56% |
| | TOPIX | 14.77% | 0.72% | 2.06% |
Gross expense ratio: 1.74%. Net expense ratio: 1.27%. The expense ratio, excluding acquired fund fees, is contractually capped at 1.25% through February, 2010.
Performance data quoted represents past performance; past performance does not guarantee future results. The investment return and principal value of an investment will fluctuate so that an investor’s shares, when redeemed, may be worth more or less than their original cost. Current performance of the fund may be lower or higher than the performance quoted. Performance data current to the most recent month end may be obtained by visiting www.hennessyfunds.com. Investment performance reflects fee waivers in effect. In the absence of such waivers, total return would be reduced. The Fund may impose a redemption fee of 2% on shares held less than 60 days. If it had, total return would be reduced. The gross expense ratio presented is that from the most recent prospectus.
CHANGE IN VALUE OF $250,000 INVESTMENT
This chart assumes an initial gross investment of $250,000 (minimum investment) made on October 31, 2003. Returns shown include the reinvestment of all dividends. Returns shown do not reflect the deduction of taxes that a shareholder would pay on fund distributions or the redemption of fund shares.
The MSCI Japan Index is a market capitalization-weighted index of Japanese equities. The Tokyo Stock Price Index (TOPIX) is a market capitalization-weighted index of all companies listed on the First Section of the Tokyo Stock Exchange. The MSCI Japan and TOPIX indices are presented in U.S. Dollar terms and take into account reinvestment of dividends. One cannot invest directly in an index.
Small and medium-capitalization companies tend to have limited liquidity and greater price volatility than large-capitalization companies. Investments in foreign securities involve greater volatility and political, economic and currency risk and differences in accounting methods.
The Fund’s composition and sector weightings are shown as a percentage of the Fund’s total net assets. Portfolio composition and sector weightings are subject to change at any time and should not be considered a recommendation to buy or sell a particular security. Please refer to the Summary of Investments within this Annual Report for additional portfolio information, including percentages of holdings.
HENNESSY FUNDS 1-800-966-4354
AVERAGE ANNUAL TOTAL RETURN PERIODS ENDED OCTOBER 31, 2009
| | | One | Since Inception |
| | | Year | (8/31/07) |
| | Hennessy Select SPARX | | |
| | Japan Smaller Companies Fund | 41.78% | -0.89% |
| | MSCI Japan Small Cap Index | 24.79% | -9.01% |
| | TOPIX | 14.77% | -12.60% |
Gross expense ratio: 4.50%. Net expense ratio: 1.63%. The expense ratio, excluding acquired fund fees, is contractually capped at 1.60% through February, 2010.
Performance data quoted represents past performance; past performance does not guarantee future results. The investment return and principal value of an investment will fluctuate so that an investor’s shares, when redeemed, may be worth more or less than their original cost. Current performance of the fund may be lower or higher than the performance quoted. Performance data current to the most recent month end may be obtained by visiting www.hennessyfunds.com. Investment performance reflects fee waivers in effect. In the absence of such waivers, total return would be reduced. The Fund may impose a redemption fee of 2% on shares held less than 60 days. If it had, total return would be reduced. The gross expense ratio presented is that from the most recent prospectus.
PERFORMANCE NARRATIVE FROM SPARX ASSET MANAGEMENT CO., SUB-ADVISOR
The Hennessy Select SPARX Japan Smaller Companies Fund returned 41.78% for the twelve-month period ending October 31, 2009, significantly outperforming both the MSCI Japan Small Cap Index, which returned 24.79%, and the TOPIX Index, which returned 14.77%. During the period, we remained bearish on Japanese export-oriented companies, especially those that are heavily dependent on demand from Western economies amid a stronger Japanese Yen. However, we were relatively bullish on domestic-oriented sectors that are likely to benefit from the stimulus package recently announced by the Japanese government as well as companies that rely on long-term economic growth in emerging countries, and those stocks helped boost the Fund’s overall performance. Whereas retailers, information & communication-related firms and real estate companies contributed to the Fund’s strong performance, shares of miscellaneous manufacturers, land transportation companies and precision instrument makers hampered performance during the period. The top performing stocks in the portfolio were RISA Partners, Inc., a provider of real estate-related and financial due diligence services, and Dai-Ichi Seiko Co., Ltd., a maker of electronics components. The stock price of RISA Partners, which was battered heavily on credit related concerns, rebounded and contributed more than 4% to the Fund’s performance as investors’ sought out bargain hunting opportunities. Meanwhile, our investment in Dai-Ichi Seiko’s shares added approximately 3.7% to the Fund’s performance as the company raised its earnings projections for the fiscal year ending in March 2010. Moreover, a lineup of connectors for notebook computers with eco-friendly light emitting diode or LED back-lit displays are enjoying brisk demand since the company announced that these connectors have been approved as an official industry standard. An upgrade in the firm’s rating by a brokerage firm also helped push up its stock price higher. On the other hand, among the worst performing stock was Nittoku Engineering Co., Ltd., the world’s largest producer of automatic coil winding machines, whose share price slid after the company announced its plans to close one of its factories and offices owing to weaker demand.
PERFORMANCE OVERVIEW — HENNESSY SELECT SPARX JAPAN SMALLER COMPANIES FUND
Hennessy Select SPARX Japan Smaller Companies Fund
CHANGE IN VALUE OF $10,000 INVESTMENT
This chart assumes an initial gross investment of $10,000 made on August 31, 2007. Returns shown include the reinvestment of all dividends. Returns shown do not reflect the deduction of taxes that a shareholder would pay on fund distributions or the redemption of fund shares.
The MSCI Japan Small Cap Index represents the universe of small capitalization companies in the Japanese equity markets. The Tokyo Stock Price Index (TOPIX) is a market capitalization-weighted index of all companies listed on the First Section of the Tokyo Stock Exchange. The MSCI Japan Small Cap and TOPIX indices are presented in U.S. Dollar terms and take into account reinvestment of dividends. One cannot invest directly in an index.
Small and medium-capitalization companies tend to have limited liquidity and greater price volatility than large-capitalization companies. Investments in foreign securities involve greater volatility and political, economic and currency risk and differences in accounting methods.
The Fund’s composition and sector weightings are shown as a percentage of the Fund’s total net assets. Portfolio composition and sector weightings are subject to change at any time and should not be considered a recommendation to buy or sell a particular security. Please refer to the Summary of Investments within this Annual Report for additional portfolio information, including percentages of holdings.
HENNESSY FUNDS 1-800-966-4354
(This Page Intentionally Left Blank.)
SUMMARY OF INVESTMENTS — HENNESSY SELECT LARGE VALUE FUND
Summaries of Investments
The following summaries of investments are designed to help investors better understand the Funds’ principal holdings. The summary is as of October 31, 2009.
HENNESSY SELECT
LARGE VALUE FUND
(% of Net Assets)
| | TOP TEN EQUITY HOLDINGS | % of net assets |
| | ChevronTexaco Corp. | 4.61% |
| | Exxon Mobil Corp. | 4.35% |
| | J.P. Morgan Chase & Co. | 4.08% |
| | General Electric Co. | 3.12% |
| | Apache Corp. | 2.55% |
| | Verizon Communications, Inc. | 2.53% |
| | The Goldman Sachs Group, Inc. | 2.42% |
| | Baxter International, Inc. | 2.35% |
| | Wells Fargo & Co. | 2.29% |
| | U.S. Bancorp | 2.28% |
HENNESSY FUNDS 1-800-966-4354
| | COMMON STOCKS – 98.17% | | Number | | | | | | % of Net | | |
| | | | of Shares | | | Value | | | Assets | | |
| | Consumer Discretionary – 8.92% | | | | | | | | | | |
| | Discovery Communications, Inc. (a) | | | 32,240 | | | $ | 774,405 | | | | 0.58 | % | |
| | Ford Motor Co. (a) | | | 203,080 | | | | 1,840,290 | | | | 1.39 | % | |
| | The Gap Inc. | | | 61,595 | | | | 1,314,437 | | | | 0.99 | % | |
| | Home Depot, Inc. | | | 78,760 | | | | 1,976,088 | | | | 1.49 | % | |
| | Staples, Inc. | | | 60,785 | | | | 1,319,035 | | | | 0.99 | % | |
| | Starwood Hotels & Resorts Worldwide, Inc. | | | 64,900 | | | | 1,885,994 | | | | 1.42 | % | |
| | Viacom, Inc. (a) | | | 68,685 | | | | 1,895,019 | | | | 1.43 | % | |
| | Wendy’s/Arby’s Group, Inc. | | | 212,130 | | | | 837,914 | | | | 0.63 | % | |
| | | | | | | | | 11,843,182 | | | | 8.92 | % | |
| | Consumer Staples – 5.40% | | | | | | | | | | | | | |
| | ConAgra Foods, Inc. | | | 108,580 | | | | 2,280,180 | | | | 1.72 | % | |
| | CVS Corp. | | | 66,715 | | | | 2,355,039 | | | | 1.77 | % | |
| | Lorillard, Inc. | | | 15,290 | | | | 1,188,339 | | | | 0.90 | % | |
| | PepsiCo, Inc. | | | 22,220 | | | | 1,345,421 | | | | 1.01 | % | |
| | | | | | | | | 7,168,979 | | | | 5.40 | % | |
| | Energy – 18.93% | | | | | | | | | | | | | |
| | Anadarko Petroleum Corp. | | | 47,300 | | | | 2,881,989 | | | | 2.17 | % | |
| | Apache Corp. | | | 35,985 | | | | 3,386,908 | | | | 2.55 | % | |
| | ChevronTexaco Corp. | | | 79,895 | | | | 6,115,163 | | | | 4.61 | % | |
| | ConocoPhillips | | | 13,875 | | | | 696,248 | | | | 0.52 | % | |
| | EOG Resources, Inc. | | | 17,235 | | | | 1,407,410 | | | | 1.06 | % | |
| | Exxon Mobil Corp. | | | 80,680 | | | | 5,782,336 | | | | 4.35 | % | |
| | Noble Energy, Inc. | | | 14,060 | | | | 922,757 | | | | 0.70 | % | |
| | Occidental Petroleum Corp. | | | 23,780 | | | | 1,804,426 | | | | 1.36 | % | |
| | Schlumberger Ltd. (b) | | | 34,405 | | | | 2,139,991 | | | | 1.61 | % | |
| | | | | | | | | 25,137,228 | | | | 18.93 | % | |
| | Financials – 23.26% | | | | | | | | | | | | | |
| | Allstate Corp. | | | 21,990 | | | | 650,244 | | | | 0.49 | % | |
| | American Express Co. | | | 27,440 | | | | 956,010 | | | | 0.72 | % | |
| | Bank of America Corp. | | | 201,395 | | | | 2,936,339 | | | | 2.21 | % | |
| | BB&T Corp. | | | 51,040 | | | | 1,220,366 | | | | 0.92 | % | |
| | Capital One Financial Corp. | | | 4,255 | | | | 155,733 | | | | 0.12 | % | |
| | Citigroup, Inc. | | | 312,760 | | | | 1,279,189 | | | | 0.96 | % | |
The accompanying notes are an integral part of these financial statements.
SUMMARY OF INVESTMENTS — HENNESSY SELECT LARGE VALUE FUND
| | COMMON STOCKS | | Number | | | | | | % of Net | | |
| | | | of Shares | | | Value | | | Assets | | |
| | Financials (Continued) | | | | | | | | | | |
| | The Goldman Sachs Group, Inc. | | | 18,875 | | | $ | 3,211,959 | | | | 2.42 | % | |
| | J.P. Morgan Chase & Co. | | | 129,755 | | | | 5,419,866 | | | | 4.08 | % | |
| | Mack Cali Realty Corp. | | | 50,715 | | | | 1,569,629 | | | | 1.18 | % | |
| | Morgan Stanley | | | 38,185 | | | | 1,226,502 | | | | 0.92 | % | |
| | Prudential Financial, Inc. | | | 21,910 | | | | 990,989 | | | | 0.75 | % | |
| | Simon Property Group, Inc. | | | 25,580 | | | | 1,736,626 | | | | 1.31 | % | |
| | Travelers Companies, Inc. | | | 43,335 | | | | 2,157,650 | | | | 1.63 | % | |
| | U.S. Bancorp (d) | | | 130,590 | | | | 3,032,300 | | | | 2.28 | % | |
| | Wells Fargo & Co. | | | 110,635 | | | | 3,044,675 | | | | 2.29 | % | |
| | XL Capital Ltd. (b) | | | 78,945 | | | | 1,295,488 | | | | 0.98 | % | |
| | | | | | | | | 30,883,565 | | | | 23.26 | % | |
| | Health Care – 8.95% | | | | | | | | | | | | | |
| | Amgen, Inc. (a) | | | 33,980 | | | | 1,825,746 | | | | 1.37 | % | |
| | Baxter International, Inc. | | | 57,640 | | | | 3,116,018 | | | | 2.35 | % | |
| | Forest Laboratories, Inc. (a) | | | 71,805 | | | | 1,986,844 | | | | 1.50 | % | |
| | Pfizer, Inc. | | | 38,475 | | | | 655,229 | | | | 0.49 | % | |
| | Schering Plough Corp. | | | 73,865 | | | | 2,082,993 | | | | 1.57 | % | |
| | UnitedHealth Group, Inc. | | | 85,710 | | | | 2,224,175 | | | | 1.67 | % | |
| | | | | | | | | 11,891,005 | | | | 8.95 | % | |
| | Industrials – 10.35% | | | | | | | | | | | | | |
| | CSX Corp. | | | 46,400 | | | | 1,957,152 | | | | 1.47 | % | |
| | General Dynamics Corp. | | | 25,450 | | | | 1,595,715 | | | | 1.20 | % | |
| | General Electric Co. | | | 290,850 | | | | 4,147,521 | | | | 3.12 | % | |
| | Illinois Tool Works, Inc. | | | 31,195 | | | | 1,432,474 | | | | 1.08 | % | |
| | Ingersoll-Rand Plc (b) | | | 63,060 | | | | 1,992,065 | | | | 1.50 | % | |
| | Terex Corp. (a) | | | 29,305 | | | | 592,547 | | | | 0.45 | % | |
| | Tyco International Ltd. (b) | | | 13,940 | | | | 467,687 | | | | 0.35 | % | |
| | United Technologies Corp. | | | 25,370 | | | | 1,558,987 | | | | 1.18 | % | |
| | | | | | | | | 13,744,148 | | | | 10.35 | % | |
| | Information Technology – 6.53% | | | | | | | | | | | | | |
| | Applied Materials, Inc. | | | 99,885 | | | | 1,218,597 | | | | 0.92 | % | |
| | Hewlett-Packard Co. | | | 57,445 | | | | 2,726,340 | | | | 2.05 | % | |
| | Intel Corp. | | | 58,240 | | | | 1,112,966 | | | | 0.84 | % | |
The accompanying notes are an integral part of these financial statements.
HENNESSY FUNDS 1-800-966-4354
| | COMMON STOCKS | | Number | | | | | | % of Net | | |
| | | | of Shares | | | Value | | | Assets | | |
| | Information Technology (Continued) | | | | | | | | | | |
| | Microsoft Corp. | | | 106,195 | | | $ | 2,944,787 | | | | 2.22 | % | |
| | Yahoo!, Inc. (a) | | | 42,110 | | | | 669,549 | | | | 0.50 | % | |
| | | | | | | | | 8,672,239 | | | | 6.53 | % | |
| | Materials – 3.54% | | | | | | | | | | | | | |
| | The Dow Chemical Co. | | | 62,190 | | | | 1,460,221 | | | | 1.10 | % | |
| | FMC Corp. | | | 30,090 | | | | 1,537,599 | | | | 1.16 | % | |
| | Freeport-McMoRan Copper & Gold, Inc. (a) | | | 12,800 | | | | 939,008 | | | | 0.71 | % | |
| | Nucor Corp. | | | 19,050 | | | | 759,143 | | | | 0.57 | % | |
| | | | | | | | | 4,695,971 | | | | 3.54 | % | |
| | Telecommunication Services – 5.28% | | | | | | | | | | | | | |
| | AT&T, Inc. | | | 87,995 | | | | 2,258,832 | | | | 1.70 | % | |
| | Qwest Communications International Inc. | | | 389,165 | | | | 1,397,102 | | | | 1.05 | % | |
| | Verizon Communications, Inc. | | | 113,435 | | | | 3,356,542 | | | | 2.53 | % | |
| | | | | | | | | 7,012,476 | | | | 5.28 | % | |
| | Utilities – 7.01% | | | | | | | | | | | | | |
| | Dominion Resources, Inc. | | | 59,330 | | | | 2,022,560 | | | | 1.52 | % | |
| | Duke Energy Corp. | | | 115,690 | | | | 1,830,216 | | | | 1.38 | % | |
| | Edison International | | | 67,500 | | | | 2,147,850 | | | | 1.62 | % | |
| | MDU Resources Group, Inc. | | | 63,535 | | | | 1,318,351 | | | | 0.99 | % | |
| | Questar Corp. | | | 50,095 | | | | 1,995,785 | | | | 1.50 | % | |
| | | | | | | | | 9,314,762 | | | | 7.01 | % | |
| | | | | | | | | | | | | | | |
| | Total Common Stocks (Cost $113,975,836) | | | | | | | 130,363,555 | | | | 98.17 | % | |
The accompanying notes are an integral part of these financial statements.
SUMMARY OF INVESTMENTS — HENNESSY SELECT LARGE VALUE FUND
| | SHORT-TERM INVESTMENTS – 0.08% | | | | | | | | % of Net | | |
| | | | Shares | | | Value | | | Assets | | |
| | Money Market Funds – 0.08% | | | | | | | | | | |
| | Fidelity Government Portfolio, 0.080% (c) | | | 114,238 | | | $ | 114,238 | | | | 0.08 | % | |
| | | | | | | | | | | | | | | |
| | Total Investment Company | | | | | | | | | | | | | |
| | (Cost $114,238) | | | | | | | 114,238 | | | | 0.08 | % | |
| | | | | | | | | | | | | | | |
| | Total Short-Term Investments | | | | | | | | | | | | | |
| | (Cost $114,238) | | | | | | | 114,238 | | | | 0.08 | % | |
| | | | | | | | | | | | | | | |
| | Total Investments – 98.25% | | | | | | | | | | | | | |
| | (Cost $114,090,074) | | | | | | | 130,477,793 | | | | 98.25 | % | |
| | | | | | | | | | | | | | | |
| | Other Assets in Excess of Liabilities – 1.75% | | | | | | | 2,319,246 | | | | 1.75 | % | |
| | | | | | | | | | | | | | | |
| | TOTAL NET ASSETS – 100.00% | | | | | | $ | 132,797,039 | | | | 100.00 | % | |
Percentages are stated as a percent of net assets.
| (b) | Foreign issued security |
| (c) | The rate listed is the Fund’s 7-day yield as of October 31, 2009. |
| (d) | Investment in affiliated security. Quasar Distributors, LLC, which serves as the Fund’s distributor, is a subsidiary of U.S. Bancorp. Details of transactions with this affiliated company for the year ended October 31, 2009 were as follows: |
| | | Beginning | Purchase | Sales | Ending | Dividend | | Market |
| | Issuer | Cost | Cost | Cost | Cost | Income | Shares | Value |
| | U.S. Bancorp | $1,316,268 | $979,649 | $50,001 | $2,245,916 | $0 | 130,590 | $3,032,300 |
Summary of Fair Value Exposure at October 31, 2009
The Fund has adopted authoritative fair valuation accounting standards which establish an authoritative definition of fair value and set out a hierarchy for measuring fair value. These standards require additional disclosures about the various inputs and valuation techniques used to develop the measurements of fair value and a discussion in changes in valuation techniques and related inputs during the period. These inputs are summarized in the three broad levels listed below.
The Fund has performed an analysis of all existing investments to determine the significance and character of all inputs to their fair value determination.
| | Level 1 – | Quoted unadjusted prices for identical instruments in active markets to which the fund has access at the date of measurement |
| | Level 2 – | Quoted prices for similar instruments in active markets; quoted prices for identical or similar instruments in markets that are not active; and model-derived valuations in which all significant inputs and significant value drivers are observable in active markets. Level 2 inputs are those in markets for which there are few transactions, the prices are not current, little public information exists or instances where prices vary substantially over time or among brokered market makers. |
| | Level 3 – | Model derived valuations in which one or more significant inputs or significant value drivers are unobservable. Unobservable inputs are those inputs that reflect the fund’s own assumptions that market participants would use to price the asset or liability based on the best available information. |
The accompanying notes are an integral part of these financial statements.
HENNESSY FUNDS 1-800-966-4354
The inputs or methodology used for valuing securities are not an indication of the risk associated with investing in those securities.
The following is a summary of the inputs used to value the Fund’s net assets as of October 31, 2009:
| | Common Stock | | Level 1 | | | Level 2 | | | Level 3 | | | Total | |
| | Consumer Discretionary | | $ | 11,843,182 | | | $ | — | | | $ | — | | | $ | 11,843,182 | |
| | Consumer Staples | | | 7,168,979 | | | | — | | | | — | | | | 7,168,979 | |
| | Energy | | | 25,137,228 | | | | — | | | | — | | | | 25,137,228 | |
| | Financials | | | 30,883,565 | | | | — | | | | — | | | | 30,883,565 | |
| | Health Care | | | 11,891,005 | | | | — | | | | — | | | | 11,891,005 | |
| | Industrials | | | 13,744,148 | | | | — | | | | — | | | | 13,744,148 | |
| | Information Technology | | | 8,672,239 | | | | — | | | | — | | | | 8,672,239 | |
| | Materials | | | 4,695,971 | | | | — | | | | — | | | | 4,695,971 | |
| | Telecommunication Services | | | 7,012,476 | | | | — | | | | — | | | | 7,012,476 | |
| | Utilities | | | 9,314,762 | | | | — | | | | — | | | | 9,314,762 | |
| | Total Common Stock | | $ | 130,363,555 | | | $ | — | | | $ | — | | | $ | 130,363,555 | |
| | Short-Term Investments | | $ | 114,238 | | | $ | — | | | $ | — | | | $ | 114,238 | |
| | Total Investments in Securities | | $ | 130,477,793 | | | $ | — | | | $ | — | | | $ | 130,477,793 | |
The accompanying notes are an integral part of these financial statements.
SUMMARY OF INVESTMENTS — HENNESSY SELECT SPARX JAPAN FUND
HENNESSY SELECT SPARX
JAPAN FUND
(% of Net Assets)
| | TOP TEN EQUITY HOLDINGS | % of net assets |
| | Keyence Corp. | 6.93% |
| | Unicharm Corp. | 6.30% |
| | Mitsubishi Corp. | 6.26% |
| | Taiyo Nippon Sanso Corp. | 6.19% |
| | Asics Corp. | 5.93% |
| | Misumi Group, Inc. | 5.20% |
| | Kao Corp. | 4.93% |
| | Rohto Pharmaceutical Co., Inc. | 4.27% |
| | Ryohin Keikaku Co., Ltd. | 4.06% |
| | Marubeni Corp. | 3.90% |
HENNESSY FUNDS 1-800-966-4354
| | COMMON STOCKS – 96.75% | | Number | | | | | | % of Net | | |
| | | | of Shares | | | Value | | | Assets | | |
| | Consumer Discretionary – 20.27% | | | | | | | | | | |
| | Asics Corp. | | | 358,000 | | | $ | 3,191,171 | | | | 5.93 | % | |
| | Isuzu Motors, Ltd. | | | 586,000 | | | | 1,239,011 | | | | 2.30 | % | |
| | Mizuno Corp. | | | 129,000 | | | | 594,668 | | | | 1.10 | % | |
| | Ryohin Keikaku Co., Ltd. | | | 48,500 | | | | 2,182,979 | | | | 4.06 | % | |
| | Shimano, Inc. | | | 43,100 | | | | 1,648,095 | | | | 3.06 | % | |
| | Toyota Motor Corp. | | | 51,000 | | | | 2,013,325 | | | | 3.74 | % | |
| | Zenrin Co., Ltd. | | | 2,900 | | | | 42,463 | | | | 0.08 | % | |
| | | | | | | | | 10,911,712 | | | | 20.27 | % | |
| | Consumer Staples – 12.27% | | | | | | | | | | | | | |
| | Ariake Japan Co., Ltd. | | | 36,000 | | | | 561,436 | | | | 1.04 | % | |
| | Kao Corp. | | | 119,000 | | | | 2,650,587 | | | | 4.93 | % | |
| | Unicharm Corp. | | | 35,400 | | | | 3,392,535 | | | | 6.30 | % | |
| | | | | | | | | 6,604,558 | | | | 12.27 | % | |
| | Financials – 5.01% | | | | | | | | | | | | | |
| | Mizuho Financial Group, Inc. | | | 427,900 | | | | 844,004 | | | | 1.57 | % | |
| | NTT Urban Development Corp. | | | 269 | | | | 216,098 | | | | 0.40 | % | |
| | Sumitomo Mitsui Financial Group, Inc. | | | 30,800 | | | | 1,046,896 | | | | 1.94 | % | |
| | Sumitomo Real Estate Sales Co., Ltd. | | | 5,100 | | | | 178,844 | | | | 0.33 | % | |
| | Tokyu Livable, Inc. | | | 45,600 | | | | 412,547 | | | | 0.77 | % | |
| | | | | | | | | 2,698,389 | | | | 5.01 | % | |
| | Health Care – 7.14% | | | | | | | | | | | | | |
| | Mani, Inc. | | | 4,500 | | | | 313,066 | | | | 0.58 | % | |
| | Rohto Pharmaceutical Co., Ltd. | | | 180,000 | | | | 2,301,746 | | | | 4.27 | % | |
| | Terumo Corp. | | | 23,400 | | | | 1,231,653 | | | | 2.29 | % | |
| | | | | | | | | 3,846,465 | | | | 7.14 | % | |
| | Industrials – 28.02% | | | | | | | | | | | | | |
| | Daikin Industries Ltd. | | | 33,900 | | | | 1,149,066 | | | | 2.13 | % | |
| | Itochu Corp. | | | 227,000 | | | | 1,434,818 | | | | 2.67 | % | |
| | Kajima Corp. | | | 56,000 | | | | 131,111 | | | | 0.24 | % | |
| | Kawasaki Kisen Kaisha, Ltd. | | | 36,000 | | | | 131,174 | | | | 0.24 | % | |
| | Komatsu, Ltd. | | | 76,900 | | | | 1,499,161 | | | | 2.78 | % | |
| | Marubeni Corp. | | | 424,000 | | | | 2,097,773 | | | | 3.90 | % | |
| | Misumi Group, Inc. | | | 163,900 | | | | 2,797,153 | | | | 5.20 | % | |
The accompanying notes are an integral part of these financial statements.
SUMMARY OF INVESTMENTS — HENNESSY SELECT SPARX JAPAN FUND
| | COMMON STOCKS | | Number | | | | | | % of Net | | |
| | | | of Shares | | | Value | | | Assets | | |
| | Industrials (Continued) | | | | | | | | | | |
| | Mitsubishi Corp. | | | 159,000 | | | $ | 3,370,856 | | | | 6.26 | % | |
| | Nippon Sheet Glass, Ltd. | | | 32,000 | | | | 94,292 | | | | 0.18 | % | |
| | Obayashi Corp. | | | 70,000 | | | | 264,336 | | | | 0.49 | % | |
| | Shimizu Corp. | | | 62,000 | | | | 237,741 | | | | 0.44 | % | |
| | Sumitomo Corp. | | | 103,400 | | | | 1,003,777 | | | | 1.86 | % | |
| | Taisei Corp. | | | 157,000 | | | | 308,112 | | | | 0.57 | % | |
| | Tokyu Corp. | | | 130,000 | | | | 568,111 | | | | 1.06 | % | |
| | | | | | | | | 15,087,481 | | | | 28.02 | % | |
| | Information Technology – 8.00% | | | | | | | | | | | | | |
| | Keyence Corp. | | | 18,800 | | | | 3,732,262 | | | | 6.93 | % | |
| | Sumco Corp. | | | 4,300 | | | | 82,058 | | | | 0.15 | % | |
| | Toshiba Corp. | | | 86,000 | | | | 491,520 | | | | 0.92 | % | |
| | | | | | | | | 4,305,840 | | | | 8.00 | % | |
| | Materials – 16.04% | | | | | | | | | | | | | |
| | Fuji Seal International, Inc. | | | 90,800 | | | | 1,835,649 | | | | 3.41 | % | |
| | JFE Holdings, Inc. | | | 13,500 | | | | 439,760 | | | | 0.81 | % | |
| | Sumitomo Metal Industries, Ltd. | | | 468,000 | | | | 1,195,641 | | | | 2.22 | % | |
| | Sumitomo Metal Mining Co., Ltd. | | | 116,000 | | | | 1,834,497 | | | | 3.41 | % | |
| | Taiyo Nippon Sanso Corp. | | | 300,000 | | | | 3,331,678 | | | | 6.19 | % | |
| | | | | | | | | 8,637,225 | | | | 16.04 | % | |
| | | | | | | | | | | | | | | |
| | Total Common Stocks (Cost $58,087,870) | | | | | | | 52,091,670 | | | | 96.75 | % | |
| | | | | | | | | | | | | | | |
| | SHORT-TERM INVESTMENTS – 2.87% | | | | | | | | | | | | | |
| | | | | | | | | | | | | | | |
| | Money Market Funds – 2.87% | | | | | | | | | | | | | |
| | Federated Government Obligations, 0.080% (a) | | | 46,422 | | | | 46,422 | | | | 0.09 | % | |
| | Fidelity Government Portfolio, 0.077% (a) | | | 1,497,725 | | | | 1,497,725 | | | | 2.78 | % | |
| | | | | | | | | 1,544,147 | | | | 2.87 | % | |
| | Total Short-Term Investments | | | | | | | | | | | | | |
| | (Cost $1,544,147) | | | | | | | 1,544,147 | | | | 2.87 | % | |
| | | | | | | | | | | | | | | |
| | Total Investments – 99.62% | | | | | | | | | | | | | |
| | (Cost $59,632,017) | | | | | | | 53,635,817 | | | | 99.62 | % | |
| | | | | | | | | | | | | | | |
| | Other Assets in Excess of Liabilities – 0.38% | | | | | | | 207,226 | | | | 0.38 | % | |
| | | | | | | | | | | | | | | |
| | TOTAL NET ASSETS – 100.00% | | | | | | $ | 53,843,043 | | | | 100.00 | % | |
Percentages are stated as a percent of net assets.
| (a) | The rate listed is the Fund’s 7-day yield as of October 31, 2009. |
The accompanying notes are an integral part of these financial statements.
HENNESSY FUNDS 1-800-966-4354
Summary of Fair Value Exposure at October 31, 2009
The Fund has adopted authoritative fair valuation accounting standards which establish an authoritative definition of fair value and set out a hierarchy for measuring fair value. These standards require additional disclosures about the various inputs and valuation techniques used to develop the measurements of fair value and a discussion in changes in valuation techniques and related inputs during the period. These inputs are summarized in the three broad levels listed below.
The Fund has performed an analysis of all existing investments to determine the significance and character of all inputs to their fair value determination.
| | Level 1 – | Quoted unadjusted prices for identical instruments in active markets to which the fund has access at the date of measurement |
| | Level 2 – | Quoted prices for similar instruments in active markets; quoted prices for identical or similar instruments in markets that are not active; and model-derived valuations in which all significant inputs and significant value drivers are observable in active markets. Level 2 inputs are those in markets for which there are few transactions, the prices are not current, the prices are fair value adjusted due to post market close subsequent events (foreign markets), little public information exists or instances where prices vary substantially over time or among brokered market makers. |
| | Level 3 – | Model derived valuations in which one or more significant inputs or significant value drivers are unobservable. Unobservable inputs are those inputs that reflect the fund’s own assumptions that market participants would use to price the asset or liability based on the best available information. |
The inputs or methodology used for valuing securities are not an indication of the risk associated with investing in those securities.
The following is a summary of the inputs used to value the Fund’s net assets as of October 31, 2009:
| | Common Stock | | Level 1 | | | Level 2 | | | Level 3 | | | Total | |
| | Consumer Discretionary | | $ | — | | | $ | 10,911,712 | | | $ | — | | | $ | 10,911,712 | |
| | Consumer Staples | | | — | | | | 6,604,558 | | | | — | | | | 6,604,558 | |
| | Financials | | | — | | | | 2,698,389 | | | | — | | | | 2,698,389 | |
| | Health Care | | | — | | | | 3,846,465 | | | | — | | | | 3,846,465 | |
| | Industrials | | | — | | | | 15,087,481 | | | | — | | | | 15,087,481 | |
| | Information Technology | | | — | | | | 4,305,840 | | | | — | | | | 4,305,840 | |
| | Materials | | | — | | | | 8,637,225 | | | | — | | | | 8,637,225 | |
| | Total Common Stock | | $ | — | | | $ | 52,091,670 | | | $ | — | | | $ | 52,091,670 | |
| | Short-Term Investments | | $ | 1,544,147 | | | $ | — | | | $ | — | | | $ | 1,544,147 | |
| | Total Investments in Securities | | $ | 1,544,147 | | | $ | 52,091,670 | | | $ | — | | | $ | 53,635,817 | |
The accompanying notes are an integral part of these financial statements.
SUMMARY OF INVESTMENTS — HENNESSY SELECT SPARX JAPAN SMALLER COMPANIES FUND
HENNESSY SELECT SPARX
JAPAN SMALLER COMPANIES FUND
(% of Net Assets)
| | TOP TEN EQUITY HOLDINGS | % of net assets |
| | Saizeriya Co., Ltd. | 4.55% |
| | ASKUL Corp. | 3.76% |
| | Tamura Corp. | 3.29% |
| | T-Gaia Corp. | 3.08% |
| | Macromill, Inc. | 2.88% |
| | Village Vanguard Co., Ltd. | 2.86% |
| | Message Co., Ltd. | 2.70% |
| | So-net M3, Inc. | 2.52% |
| | SRA Holdings, Inc. | 2.39% |
| | K’s Holdings Corp. | 2.38% |
HENNESSY FUNDS 1-800-966-4354
| | COMMON STOCKS – 96.64% | | Number | | | | | | % of Net | | |
| | | | of Shares | | | Value | | | Assets | | |
| | Consumer Discretionary – 26.88% | | | | | | | | | | |
| | ASKUL Corp. | | | 31,000 | | | $ | 608,706 | | | | 3.76 | % | |
| | Doshisha Co., Ltd. | | | 20,000 | | | | 375,217 | | | | 2.32 | % | |
| | Doutor Nichires Holdings Co., Ltd. | | | 20,000 | | | | 289,459 | | | | 1.79 | % | |
| | Ishii Hyoki Co., Ltd. | | | 2,100 | | | | 26,973 | | | | 0.17 | % | |
| | K’s Holdings Corp. | | | 11,900 | | | | 385,650 | | | | 2.38 | % | |
| | Nippon Seiki Co., Ltd. | | | 35,000 | | | | 367,552 | | | | 2.27 | % | |
| | Otsuka Kagu, Ltd. | | | 18,600 | | | | 169,977 | | | | 1.05 | % | |
| | Press Kogyo Co., Ltd. | | | 124,000 | | | | 271,397 | | | | 1.67 | % | |
| | Saizeriya Co., Ltd. | | | 38,200 | | | | 737,007 | | | | 4.55 | % | |
| | T-Gaia Corp. | | | 261 | | | | 499,257 | | | | 3.08 | % | |
| | Village Vanguard Co., Ltd. | | | 110 | | | | 463,873 | | | | 2.86 | % | |
| | Wowow, Inc. | | | 81 | | | | 159,266 | | | | 0.98 | % | |
| | | | | | | | | 4,354,334 | | | | 26.88 | % | |
| | Consumer Staples – 3.70% | | | | | | | | | | | | | |
| | Hokuto Corp. | | | 15,000 | | | | 335,279 | | | | 2.07 | % | |
| | Sogo Medical Co., Ltd. | | | 10,000 | | | | 263,701 | | | | 1.63 | % | |
| | | | | | | | | 598,980 | | | | 3.70 | % | |
| | Financials – 5.15% | | | | | | | | | | | | | |
| | RISA Partners, Inc. | | | 459 | | | | 361,436 | | | | 2.23 | % | |
| | Suruga Bank, Ltd. | | | 20,000 | | | | 180,695 | | | | 1.12 | % | |
| | Tokyo Tomin Bank, Ltd. | | | 20,000 | | | | 291,576 | | | | 1.80 | % | |
| | | | | | | | | 833,707 | | | | 5.15 | % | |
| | Health Care – 8.67% | | | | | | | | | | | | | |
| | Hogy Medical Co., Ltd. | | | 6,100 | | | | 327,888 | | | | 2.02 | % | |
| | Message Co., Ltd. | | | 234 | | | | 437,505 | | | | 2.70 | % | |
| | Paramount Bed Co., Ltd. | | | 10,400 | | | | 231,671 | | | | 1.43 | % | |
| | So-net M3, Inc. | | | 119 | | | | 408,212 | | | | 2.52 | % | |
| | | | | | | | | 1,405,276 | | | | 8.67 | % | |
| | Industrials – 19.35% | | | | | | | | | | | | | |
| | Aica Kogyo Co., Ltd. | | | 20,000 | | | | 191,336 | | | | 1.18 | % | |
| | Asunaro Aoki Construction., Ltd. | | | 33,500 | | | | 209,534 | | | | 1.29 | % | |
| | Benefit One, Inc. | | | 398 | | | | 316,888 | | | | 1.96 | % | |
| | Ichinen Holdings Co., Ltd. | | | 64,700 | | | | 251,544 | | | | 1.55 | % | |
The accompanying notes are an integral part of these financial statements.
SUMMARY OF INVESTMENTS — HENNESSY SELECT SPARX JAPAN SMALLER COMPANIES FUND
| | COMMON STOCKS | | Number | | | | | | % of Net | | |
| | | | of Shares | | | Value | | | Assets | | |
| | Industrials (Continued) | | | | | | | | | | |
| | Kito Corp. | | | 248 | | | $ | 242,045 | | | | 1.49 | % | |
| | NPC Inc. | | | 9,400 | | | | 240,188 | | | | 1.48 | % | |
| | Prestige International, Inc. | | | 193 | | | | 333,625 | | | | 2.06 | % | |
| | SBS Holdings, Inc. | | | 350 | | | | 242,608 | | | | 1.50 | % | |
| | Skymark Airlines, Inc. (a) | | | 45,300 | | | | 101,550 | | | | 0.63 | % | |
| | Teraoka Seisakusho Co., Ltd. | | | 27,600 | | | | 128,167 | | | | 0.79 | % | |
| | Tocalo Co., Ltd. | | | 15,300 | | | | 123,416 | | | | 0.76 | % | |
| | Tokyo Keiki, Inc. | | | 103,000 | | | | 124,552 | | | | 0.77 | % | |
| | Toshin Group Co., Ltd. | | | 9,200 | | | | 164,707 | | | | 1.02 | % | |
| | Uchida Yoko Co., Ltd. | | | 48,000 | | | | 144,209 | | | | 0.89 | % | |
| | Yushin Precision Equipment Co., Ltd. | | | 20,000 | | | | 321,343 | | | | 1.98 | % | |
| | | | | | | | | 3,135,712 | | | | 19.35 | % | |
| | Information Technology – 24.12% | | | | | | | | | | | | | |
| | Dai-Ichi Seiko Co., Ltd. | | | 3,500 | | | | 171,145 | | | | 1.06 | % | |
| | Digital Garage, Inc. | | | 130 | | | | 251,082 | | | | 1.55 | % | |
| | Elematec Corp. | | | 700 | | | | 7,122 | | | | 0.04 | % | |
| | Fuetrek Co., Ltd. | | | 110 | | | | 160,393 | | | | 0.99 | % | |
| | GMO Payment Gateway, Inc. | | | 118 | | | | 154,454 | | | | 0.95 | % | |
| | Gourmet Navigator, Inc. | | | 139 | | | | 338,040 | | | | 2.09 | % | |
| | Kakaku.com., Inc. | | | 65 | | | | 237,685 | | | | 1.47 | % | |
| | Macnica, Inc. | | | 16,300 | | | | 258,747 | | | | 1.60 | % | |
| | Macromill, Inc. | | | 300 | | | | 465,872 | | | | 2.88 | % | |
| | Otsuka Corp. | | | 6,200 | | | | 326,960 | | | | 2.02 | % | |
| | SMS Co., Ltd. | | | 80 | | | | 179,080 | | | | 1.10 | % | |
| | SRA Holdings, Inc. | | | 44,000 | | | | 386,596 | | | | 2.39 | % | |
| | Tamura Corp. | | | 165,000 | | | | 533,408 | | | | 3.29 | % | |
| | Works Applications Co., Ltd. | | | 461 | | | | 273,007 | | | | 1.68 | % | |
| | Yokowo Co., Ltd. | | | 27,800 | | | | 163,279 | | | | 1.01 | % | |
| | | | | | | | | 3,906,870 | | | | 24.12 | % | |
| | Materials – 7.32% | | | | | | | | | | | | | |
| | Adeka Corp. | | | 36,000 | | | | 329,947 | | | | 2.04 | % | |
| | Fujikura Kasei Co., Ltd. | | | 61,700 | | | | 318,764 | | | | 1.97 | % | |
| | JSP Corp. | | | 19,400 | | | | 185,479 | | | | 1.14 | % | |
The accompanying notes are an integral part of these financial statements.
HENNESSY FUNDS 1-800-966-4354
| | COMMON STOCKS | | Number | | | | | | % of Net | | |
| | | | of Shares | | | Value | | | Assets | | |
| | Materials (Continued) | | | | | | | | | | |
| | T.Hasegawa Co., Ltd. | | | 12,300 | | | $ | 189,589 | | | | 1.17 | % | |
| | Ube Material Industries, Ltd. | | | 62,000 | | | | 162,796 | | | | 1.00 | % | |
| | | | | | | | | 1,186,575 | | | | 7.32 | % | |
| | Utilities – 1.45% | | | | | | | | | | | | | |
| | Japan Wind Development Co., Ltd. | | | 60 | | | | 234,967 | | | | 1.45 | % | |
| | | | | | | | | | | | | | | |
| | Total Common Stocks (Cost $12,790,111) | | | | | | | 15,656,421 | | | | 96.64 | % | |
| | | | | | | | | | | | | | | |
| | SHORT-TERM INVESTMENTS – 1.43% | | | | | | | | | | | | | |
| | | | | | | | | | | | | | | |
| | Money Market Funds – 1.43% | | | | | | | | | | | | | |
| | Fidelity Government Portfolio, 0.077% (b) | | | 231,027 | | | | 231,027 | | | | 1.43 | % | |
| | | | | | | | | | | | | | | |
| | Total Short-Term Investments | | | | | | | | | | | | | |
| | (Cost $231,027) | | | | | | | 231,027 | | | | 1.43 | % | |
| | | | | | | | | | | | | | | |
| | Total Investments – 98.07% | | | | | | | | | | | | | |
| | (Cost $13,021,138) | | | | | | | 15,887,448 | | | | 98.07 | % | |
| | Other Assets in Excess of Liabilities – 1.93% | | | | | | | 313,232 | | | | 1.93 | % | |
| | | | | | | | | | | | | | | |
| | TOTAL NET ASSETS – 100.00% | | | | | | $ | 16,200,680 | | | | 100.00 | % | |
Percentages are stated as a percent of net assets.
| (a) | Non-income producing security. |
| (b) | The rate listed is the Fund’s 7-day yield as of October 31, 2009. |
The accompanying notes are an integral part of these financial statements.
SUMMARY OF INVESTMENTS — HENNESSY SELECT SPARX JAPAN SMALLER COMPANIES FUND
Summary of Fair Value Exposure at October 31, 2009
The Fund has adopted authoritative fair valuation accounting standards which establish an authoritative definition of fair value and set out a hierarchy for measuring fair value. These standards require additional disclosures about the various inputs and valuation techniques used to develop the measurements of fair value and a discussion in changes in valuation techniques and related inputs during the period. These inputs are summarized in the three broad levels listed below.
The Fund has performed an analysis of all existing investments to determine the significance and character of all inputs to their fair value determination.
| | Level 1 – | Quoted unadjusted prices for identical instruments in active markets to which the fund has access at the date of measurement |
| | Level 2 – | Quoted prices for similar instruments in active markets; quoted prices for identical or similar instruments in markets that are not active; and model-derived valuations in which all significant inputs and significant value drivers are observable in active markets. Level 2 inputs are those in markets for which there are few transactions, the prices are not current, the prices are fair value adjusted due to post market close subsequent events (foreign markets), little public information exists or instances where prices vary substantially over time or among brokered market makers. |
| | Level 3 – | Model derived valuations in which one or more significant inputs or significant value drivers are unobservable. Unobservable inputs are those inputs that reflect the fund’s own assumptions that market participants would use to price the asset or liability based on the best available information. |
The inputs or methodology used for valuing securities are not an indication of the risk associated with investing in those securities.
The following is a summary of the inputs used to value the Fund’s net assets as of October 31, 2009:
| | Common Stock | | Level 1 | | | Level 2 | | | Level 3 | | | Total | |
| | Consumer Discretionary | | $ | — | | | $ | 4,354,334 | | | $ | — | | | $ | 4,354,334 | |
| | Consumer Staples | | | | | | | 598,980 | | | | — | | | | 598,980 | |
| | Financials | | | | | | | 833,707 | | | | — | | | | 833,707 | |
| | Health Care | | | | | | | 1,405,276 | | | | — | | | | 1,405,276 | |
| | Industrials | | | | | | | 3,135,712 | | | | — | | | | 3,135,712 | |
| | Information Technology | | | | | | | 3,906,870 | | | | — | | | | 3,906,870 | |
| | Materials | | | | | | | 1,186,575 | | | | — | | | | 1,186,575 | |
| | Utilities | | | | | | | 234,967 | | | | — | | | | 234,967 | |
| | Total Common Stock | | $ | — | | | $ | 15,656,421 | | | $ | — | | | $ | 15,656,421 | |
| | Short-Term Investments | | $ | 231,027 | | | $ | — | | | $ | — | | | $ | 231,027 | |
| | Total Investments in Securities | | $ | 231,027 | | | $ | 15,656,421 | | | $ | — | | | $ | 15,887,448 | |
The accompanying notes are an integral part of these financial statements.
HENNESSY FUNDS 1-800-966-4354
Financial Statements
Statements of Assets and Liabilities as of October 31, 2009 |
| | |
| ASSETS: | |
| Investments in unaffiliated securities, at value | |
| (cost $111,844,158, $59,632,017 and $13,021,138, respectively) | |
| Investments in affiliated securities, at value | |
| (cost $2,245,916, $0 and $0, respectively) | |
| Cash | |
| Dividends and interest receivable | |
| Receivable for fund shares sold | |
| Receivable for securities sold | |
| Prepaid expenses and other assets | |
| Total Assets | |
| | |
| LIABILITIES: | |
| Payable for securities purchased | |
| Payable for fund shares redeemed | |
| Payable to Advisor | |
| Payable to Administrator | |
| Payable to Auditor | |
| Accrued service fees | |
| Accrued sub transfer agent fees | |
| Accrued expenses and other payables | |
| Total Liabilities | |
| | |
| NET ASSETS | |
| | |
| NET ASSETS CONSIST OF: | |
| Capital stock | |
| Accumulated net investment income | |
| Accumulated net realized loss on investments | |
| Unrealized net appreciation (depreciation) on investments and foreign currency related transactions | |
| Total Net Assets | |
| | |
| NET ASSETS | |
| Original Class: | |
| Shares authorized (no par value, $0.001 and $0.001 par value, respectively) | |
| Net assets applicable to outstanding Original Class shares | |
| Shares issued and outstanding | |
| Net asset value, offering price and redemption price per share | |
| | |
| Institutional Class: | |
| Shares authorized (no par value and $0.001 par value, respectively) | |
| Net assets applicable to outstanding Institutional Class shares | |
| Shares issued and outstanding | |
| Net asset value, offering price and redemption price per share | |
The accompanying notes are an integral part of these financial statements.
FINANCIAL STATEMENTS – STATEMENTS OF ASSETS AND LIABILITIES
| | | | | | | HENNESSY | |
| HENNESSY | | | HENNESSY | | | SELECT SPARX | |
| SELECT LARGE | | | SELECT SPARX | | | JAPAN SMALLER | |
| VALUE FUND | | | JAPAN FUND | | | COMPANIES FUND | |
| | | | | | | | |
| | | | | | | | |
| $ | 127,445,493 | | | $ | 53,635,817 | | | $ | 15,887,448 | |
| | | | | | | | | | | |
| | 3,032,300 | | | | — | | | | — | |
| | 2,513 | | | | — | | | | — | |
| | 207,307 | | | | 302,838 | | | | 68,603 | |
| | 2,128 | | | | 12,951 | | | | 2,591 | |
| | 3,320,316 | | | | — | | | | 325,631 | |
| | 43,187 | | | | 1,057 | | | | 9,332 | |
| | 134,053,244 | | | | 53,952,663 | | | | 16,293,605 | |
| | | | | | | | | | | |
| | 971,196 | | | | — | | | | 42,703 | |
| | 15,862 | | | | 731 | | | | — | |
| | 92,627 | | | | 54,378 | | | | 21,458 | |
| | 113,311 | | | | 12,001 | | | | 3,557 | |
| | 17,895 | | | | 19,771 | | | | 17,752 | |
| | 11,795 | | | | — | | | | — | |
| | 9,392 | | | | — | | | | — | |
| | 24,127 | | | | 22,739 | | | | 7,455 | |
| | 1,256,205 | | | | 109,620 | | | | 92,925 | |
| | | | | | | | | | | |
| $ | 132,797,039 | | | $ | 53,843,043 | | | $ | 16,200,680 | |
| | | | | | | | | | | |
| $ | 178,263,869 | | | $ | 87,788,492 | | | $ | 16,911,770 | |
| | 1,390,728 | | | | 53,363 | | | | 237,889 | |
| | (63,245,277 | ) | | | (28,007,540 | ) | | | (3,818,529 | ) |
| | 16,387,719 | | | | (5,991,272 | ) | | | 2,869,550 | |
| $ | 132,797,039 | | | $ | 53,843,043 | | | $ | 16,200,680 | |
| | | | | | | | | | | |
| | | | | | | | | | | |
| Unlimited | | | Unlimited | | | Unlimited | |
| | 132,768,154 | | | | 28,288,448 | | | | 16,200,680 | |
| | 7,031,215 | | | | 2,484,892 | | | | 1,663,727 | |
| $ | 18.88 | | | $ | 11.38 | | | $ | 9.74 | |
| | | | | | | | | | | |
| Unlimited | | | Unlimited | | | | N/A | |
| | 28,885 | | | | 25,554,595 | | | | | |
| | 1,527 | | | | 2,232,841 | | | | | |
| $ | 18.92 | | | $ | 11.44 | | | | | |
HENNESSY FUNDS 1-800-966-4354
Financial Statements
| INVESTMENT INCOME: | |
Dividend income from unaffiliated securities(1) | |
| Dividend income from affiliated securities | |
| Interest income | |
| Total investment income | |
| | |
| EXPENSES: | |
| Investment advisory fees | |
| Administration, fund accounting, custody and transfer agent fees | |
| Distribution fees – Predecessor Fund (See Note 4) | |
| Service fees – Original Class (See Note 4) | |
| Federal and state registration fees | |
| Audit fees | |
| Legal fees | |
| Reports to shareholders | |
| Directors’ fees and expenses | |
| Sub-transfer agent expenses – Original Class (See Note 4) | |
| Sub-transfer agent expenses – Institutional Class (See Note 4) | |
| Sub-transfer agent expenses – Predecessor Fund (See Note 4) | |
| Other | |
| Total expenses before reimbursement from advisor | |
| Expense reimbursement from Advisor: | |
| Original Class | |
| Institutional Class | |
| Net expenses | |
| NET INVESTMENT INCOME | |
| | |
| REALIZED AND UNREALIZED GAINS (LOSSES): | |
| Net realized gain (loss) on: | |
| Investments from unaffiliated securities | |
| Investments from affiliated securities | |
| Foreign currency transactions | |
| Change in unrealized appreciation (depreciation) on: | |
| Investments | |
| Foreign currency translation | |
| NET REALIZED GAIN (LOSS) AND UNREALIZED GAIN (LOSS) ON INVESTMENTS | |
| NET INCREASE (DECREASE) IN NET ASSETS RESULTING FROM OPERATIONS | |
(1) | Net of foreign taxes withheld of $0, $55,267 and $28,122, respectively. |
| * | For the one month ended October 31, 2009. Effective October 31, 2009, the Hennessy Select Large Value Fund changed its fiscal year end to October 31st from September 30th. |
| ** | Expense waiver/reimbursement by Predecessor Tamarack Service Providers was $317,462 (See Note 4). |
The accompanying notes are an integral part of these financial statements.
FINANCIAL STATEMENTS – STATEMENTS OF OPERATIONS
| | | | | | | | | | HENNESSY | |
| HENNESSY | | | HENNESSY | | | SELECT SPARX | |
| SELECT LARGE | | | SELECT SPARX | | | JAPAN SMALLER | |
| VALUE FUND | | | JAPAN FUND | | | COMPANIES FUND | |
| One Month Ended | | | Year Ended | | | Year Ended | | | Year Ended | |
| October 31, 2009* | | | September 30, 2009 | | | October 31, 2009 | | | October 31, 2009 | |
| | | | | | | | | | | |
| $ | 193,756 | | | $ | 3,563,526 | | | $ | 734,261 | | | $ | 373,617 | |
| | — | | | | 44,662 | | | | — | | | | — | |
| | 77 | | | | 9,396 | | | | 6,465 | | | | 1,892 | |
| | 193,833 | | | | 3,617,584 | | | | 740,726 | | | | 375,509 | |
| | | | | | | | | | | | | | | |
| | 100,274 | | | | 1,059,043 | | | | 523,555 | | | | 200,394 | |
| | 30,082 | | | | 375,095 | | | | 182,516 | | | | 190,167 | |
| | — | | | | 668 | | | | — | | | | — | |
| | 11,794 | | | | 65,975 | | | | — | | | | — | |
| | 2,973 | | | | 44,034 | | | | 26,028 | | | | 31,958 | |
| | 1,962 | | | | 22,566 | | | | 48,481 | | | | 27,175 | |
| | 1,019 | | | | 36,032 | | | | 33,106 | | | | 14,228 | |
| | 1,062 | | | | 57,719 | | | | 18,628 | | | | 7,331 | |
| | 849 | | | | 6,723 | | | | 29,331 | | | | 12,070 | |
| | 8,846 | | | | 88,011 | | | | — | | | | — | |
| | — | | | | 2,210 | | | | — | | | | — | |
| | — | | | | 17,148 | | | | — | | | | — | |
| | 2,138 | | | | 12,165 | | | | 56,774 | | | | 36,170 | |
| | 160,999 | | | | 1,787,389 | | | | 918,419 | | | | 519,493 | |
| | | | | | | | | | | | | | | |
| | (7,641 | ) | | | (317,462 | )** | | | (117,054 | ) | | | (252,301 | ) |
| | (6 | ) | | | — | | | | (151,534 | ) | | | — | |
| | 153,352 | | | | 1,469,927 | | | | 649,831 | | | | 267,192 | |
| $ | 40,481 | | | $ | 2,147,657 | | | $ | 90,895 | | | $ | 108,317 | |
| | | | | | | | | | | | | | | |
| $ | 2,132,557 | | | $ | (37,480,133 | ) | | $ | (12,607,879 | ) | | $ | (3,641,062 | ) |
| | (11,365 | ) | | | (553,489 | ) | | | — | | | | — | |
| | — | | | | — | | | | 133,540 | | | | 71,792 | |
| | | | | | | | | | | | | | | |
| | (6,438,340 | ) | | | 17,930,480 | | | | 21,230,126 | | | | 8,343,294 | |
| | — | | | | — | | | | (35,043 | ) | | | (971 | ) |
| | (4,317,148 | ) | | | (20,103,142 | ) | | | 8,720,744 | | | | 4,773,053 | |
| $ | (4,276,667 | ) | | $ | (17,955,485 | ) | | $ | 8,811,639 | | | $ | 4,881,370 | |
HENNESSY FUNDS 1-800-966-4354
Financial Statements
| Statements of Changes in Net Assets |
| | |
| OPERATIONS: | |
| Net investment income | |
| Net realized gain (loss) on securities | |
| Change in unrealized appreciation (depreciation) on securities | |
| Net decrease in net assets resulting from operations | |
| DISTRIBUTIONS TO SHAREHOLDERS FROM: | |
| Net investment income – Class A | |
| Net investment income – Class C | |
| Net investment income – Class R | |
| Net investment income – Class S | |
| Net realized gains – Class A | |
| Net realized gains – Class C | |
| Net realized gains – Class R | |
| Net realized gains – Class S | |
| Total distributions | |
| CAPITAL SHARE TRANSACTIONS: | |
| Proceeds from shares issued in the reorganization – Original Class (See Note 7) | |
| Proceeds from shares subscribed – Original Class | |
| Proceeds from shares subscribed – Institutional Class | |
| Proceeds from shares subscribed – Predecessor Class A | |
| Proceeds from shares subscribed – Predecessor Class C | |
| Proceeds from shares subscribed – Predecessor Class R | |
| Proceeds from shares subscribed – Predecessor Class S | |
| Dividends reinvested – Predecessor Class A | |
| Dividends reinvested – Predecessor Class C | |
| Dividends reinvested – Predecessor Class R | |
| Dividends reinvested – Predecessor Class S | |
| Cost of shares redeemed – Original Class | |
| Cost of shares redeemed – Predecessor Class A | |
| Cost of shares redeemed – Predecessor Class C | |
| Cost of shares redeemed – Predecessor Class R | |
| Cost of shares redeemed – Predecessor Class S | |
| Cost of shares redeemed in the reorganization – Predecessor Class A (See Note 7) | |
| Cost of shares redeemed in the reorganization – Predecessor Class C (See Note 7) | |
| Cost of shares redeemed in the reorganization – Predecessor Class S (See Note 7) | |
| Net increase (decrease) in net assets derived from capital share transactions | |
| TOTAL DECREASE IN NET ASSETS | |
| NET ASSETS: | |
| Beginning of period | |
| End of period | |
| Accumulated net investment income, end of period | |
| * | For the one month ended October 31, 2009. Effective October 31, 2009, the Fund changed its fiscal year end to October 31st from September 30th. |
The accompanying notes are an integral part of these financial statements.
FINANCIAL STATEMENTS – STATEMENTS OF CHANGES IN NET ASSETS
| Hennessy Select | |
| Large Value Fund | |
| | | | | | | | |
| One Month Ended | | | Year Ended | | | Year Ended | |
| October 31, 2009* | | | September 30, 2009 | | | September 30, 2008 | |
| | | | | | | | |
| $ | 40,481 | | | $ | 2,147,657 | | | $ | 3,227,881 | |
| | 2,121,192 | | | | (38,033,622 | ) | | | (23,643,916 | ) |
| | (6,438,340 | ) | | | 17,930,480 | | | | (34,396,957 | ) |
| | (4,276,667 | ) | | | (17,955,485 | ) | | | (54,812,992 | ) |
| | | | | | | | | | | |
| | — | | | | (2,447 | ) | | | (7,765 | ) |
| | — | | | | (250 | ) | | | (142 | ) |
| | — | | | | (47 | ) | | | (61 | ) |
| | — | | | | (3,119,888 | ) | | | (4,736,449 | ) |
| | — | | | | — | | | | (157,564 | ) |
| | — | | | | — | | | | (6,277 | ) |
| | — | | | | — | | | | (1,434 | ) |
| | — | | | | — | | | | (81,783,401 | ) |
| | — | | | | (3,122,632 | ) | | | (86,693,093 | ) |
| | | | | | | | | | | |
| | — | | | | 106,344,111 | | | | — | |
| | 148,751 | | | | 913,870 | | | | — | |
| | 3,402 | | | | 22,275 | | | | — | |
| | — | | | | 4,294 | | | | 371,029 | |
| | — | | | | 300 | | | | 11,100 | |
| | — | | | | — | | | | — | |
| | — | | | | 1,105,178 | | | | 3,663,742 | |
| | — | | | | 2,160 | | | | 108,540 | |
| | — | | | | 250 | | | | 6,411 | |
| | — | | | | 47 | | | | 1,487 | |
| | — | | | | 2,990,948 | | | | 82,713,848 | |
| | (1,443,405 | ) | | | (7,303,823 | ) | | | — | |
| | — | | | | (206,038 | ) | | | (205,995 | ) |
| | — | | | | (2,369 | ) | | | (263 | ) |
| | — | | | | (2,172 | ) | | | (13 | ) |
| | | | | | (12,805,550 | ) | | | (40,339,761 | ) |
| | | | | | (130,787 | ) | | | — | |
| | | | | | (14,058 | ) | | | — | |
| | | | | | (106,199,266 | ) | | | — | |
| | (1,291,252 | ) | | | (15,280,630 | ) | | | 46,330,125 | |
| | (5,567,919 | ) | | | (36,358,747 | ) | | | (95,175,960 | ) |
| | | | | | | | | | | |
| | 138,364,958 | | | | 174,723,705 | | | | 269,899,665 | |
| $ | 132,797,039 | | | $ | 138,364,958 | | | $ | 174,723,705 | |
| $ | 1,390,728 | | | $ | 1,350,367 | | | $ | 2,270,488 | |
HENNESSY FUNDS 1-800-966-4354
Financial Statements
| Statements of Changes in Net Assets |
| | |
| CHANGES IN SHARES OUTSTANDING: | |
| Shares issued in connection with reorganization | |
| Shares sold | |
| Original Class | |
| Institutional Class | |
| Predecessor Class A | |
| Predecessor Class C | |
| Predecessor Class R | |
| Predecessor Class S | |
| Shares issued to holders as reinvestment of dividends | |
| Predecessor Class A | |
| Predecessor Class C | |
| Predecessor Class R | |
| Predecessor Class S | |
| Shares redeemed | |
| Original Class | |
| Predecessor Class A | |
| Predecessor Class C | |
| Predecessor Class R | |
| Predecessor Class S | |
| Shares redeemed in the reorganization – Predecessor Class A | |
| Shares redeemed in the reorganization – Predecessor Class C | |
| Shares redeemed in the reorganization – Predecessor Class S | |
| Net increase (decrease) in shares outstanding | |
| * | For the one month ended October 31, 2009. Effective October 31, 2009, the Fund changed its fiscal year end to October 31st from September 30th. |
The accompanying notes are an integral part of these financial statements.
FINANCIAL STATEMENTS – STATEMENTS OF CHANGES IN NET ASSETS
| Hennessy Select | |
| Large Value Fund | |
| | | | | | | | |
| One Month Ended | | | Year Ended | | | Year Ended | |
| October 31, 2009* | | | September 30, 2009 | | | September 30, 2008 | |
| | | | | | | | |
| | — | | | | 7,462,745 | | | | — | |
| | | | | | | | | | | |
| | 7,564 | | | | 56,201 | | | | — | |
| | 172 | | | | 1,355 | | | | — | |
| | — | | | | 272 | | | | 14,127 | |
| | — | | | | 20 | | | | 436 | |
| | — | | | | — | | | | — | |
| | — | | | | 68,408 | | | | 133,042 | |
| | | | | | | | | | | |
| | — | | | | 134 | | | | 4,035 | |
| | — | | | | 16 | | | | 241 | |
| | — | | | | 3 | | | | 56 | |
| | — | | | | 187,051 | | | | 3,074,865 | |
| | | | | | | | | | | |
| | (72,961 | ) | | | (422,334 | ) | | | — | |
| | — | | | | (12,588 | ) | | | (8,629 | ) |
| | — | | | | (176 | ) | | | (7 | ) |
| | — | | | | (164 | ) | | | (1 | ) |
| | — | | | | (796,220 | ) | | | (1,460,879 | ) |
| | — | | | | (9,127 | ) | | | — | |
| | — | | | | (1,000 | ) | | | — | |
| | — | | | | (7,452,580 | ) | | | — | |
| | (65,225 | ) | | | (917,984 | ) | | | 1,757,286 | |
HENNESSY FUNDS 1-800-966-4354
Financial Statements
| Statements of Changes in Net Assets |
| OPERATIONS: | |
| Net investment income | |
| Net realized loss on securities | |
| Change in unrealized appreciation (depreciation) on securities | |
| Net increase (decrease) in net assets resulting from operations | |
| | |
| DISTRIBUTIONS TO SHAREHOLDERS FROM: | |
| Net investment income – Original Class | |
| Net investment income – Institutional Class | |
| Total distributions | |
| | |
| CAPITAL SHARE TRANSACTIONS: | |
| Proceeds from shares subscribed – Original Class | |
| Proceeds from shares subscribed – Institutional Class | |
| Dividends reinvested – Original Class | |
| Dividends reinvested – Institutional Class | |
| Cost of shares redeemed – Original Class | |
| Cost of shares redeemed – Institutional Class | |
| Redemption fees retained – Original Class | |
| Redemption fees retained – Institutional Class | |
| Net increase (decrease) in net assets derived from capital share transactions | |
| TOTAL INCREASE (DECREASE) IN NET ASSETS | |
| | |
| NET ASSETS: | |
| Beginning of year | |
| End of year | |
| | |
| Accumulated net investment income (loss), end of period | |
| | |
| CHANGES IN SHARES OUTSTANDING: | |
| Shares sold | |
| Original Class | |
| Institutional Class | |
| Shares issued to holders as reinvestment of dividends | |
| Original Class | |
| Institutional Class | |
| Shares redeemed | |
| Original Class | |
| Institutional Class | |
| Net increase (decrease) in shares outstanding | |
The accompanying notes are an integral part of these financial statements.
FINANCIAL STATEMENTS – STATEMENTS OF CHANGES IN NET ASSETS
| Hennessy Select SPARX | | | Hennessy Select SPARX | |
| Japan Fund | | | Japan Smaller Companies Fund | |
| Year Ended | | | Year Ended | | | Year Ended | | | Year Ended | |
| October 31, 2009 | | | October 31, 2008 | | | October 31, 2009 | | | October 31, 2008 | |
| | | | | | | | | | | |
| $ | 90,895 | | | $ | 276,999 | | | $ | 108,317 | | | $ | 23,013 | |
| | (12,474,339 | ) | | | (7,673,038 | ) | | | (3,569,270 | ) | | | (131,173 | ) |
| | 21,195,083 | | | | (30,286,211 | ) | | | 8,342,323 | | | | (5,980,662 | ) |
| | 8,811,639 | | | | (37,682,250 | ) | | | 4,881,370 | | | | (6,088,822 | ) |
| | | | | | | | | | | | | | | |
| | (65,133 | ) | | | — | | | | — | | | | (37,128 | ) |
| | (110,045 | ) | | | — | | | | — | | | | — | |
| | (175,178 | ) | | | — | | | | — | | | | (37,128 | ) |
| | | | | | | | | | | | | | | |
| | 14,425,238 | | | | 23,045,592 | | | | 10,635,183 | | | | 14,721,358 | |
| | 2,861,706 | | | | 17,346,932 | | | | — | | | | — | |
| | 63,659 | | | | — | | | | — | | | | 37,128 | |
| | 103,942 | | | | — | | | | — | | | | — | |
| | (5,945,945 | ) | | | (16,256,500 | ) | | | (11,060,855 | ) | | | (2,495,073 | ) |
| | (19,199,363 | ) | | | (36,054,652 | ) | | | — | | | | — | |
| | 2,875 | | | | 13,040 | | | | 3,412 | | | | 20,819 | |
| | 4,035 | | | | — | | | | — | | | | — | |
| | (7,683,853 | ) | | | (11,905,588 | ) | | | (422,260 | ) | | | 12,284,232 | |
| | 952,608 | | | | (49,587,838 | ) | | | 4,459,110 | | | | 6,158,282 | |
| | | | | | | | | | | | | | | |
| | 52,890,435 | | | | 102,478,273 | | | | 11,741,570 | | | | 5,583,288 | |
| $ | 53,843,043 | | | $ | 52,890,435 | | | $ | 16,200,680 | | | $ | 11,741,570 | |
| | | | | | | | | | | | | | | |
| $ | 53,363 | | | $ | 126,926 | | | $ | 237,889 | | | $ | (733 | ) |
| | | | | | | | | | | | | | | |
| | 1,434,814 | | | | 1,736,620 | | | | 1,477,631 | | | | 1,497,950 | |
| | 275,108 | | | | 1,233,199 | | | | — | | | | — | |
| | | | | | | | | | | | | | | |
| | 6,211 | | | | — | | | | — | | | | 3,654 | |
| | 10,082 | | | | — | | | | — | | | | — | |
| | | | | | | | | | | | | | | |
| | (585,989 | ) | | | (1,309,871 | ) | | | (1,523,006 | ) | | | (300,890 | ) |
| | (1,837,630 | ) | | | (2,525,969 | ) | | | — | | | | — | |
| | (697,404 | ) | | | (866,021 | ) | | | (45,375 | ) | | | 1,200,714 | |
HENNESSY FUNDS 1-800-966-4354
Financial Highlights
| Hennessy Select Large Value Fund |
| | | One Month Ended | |
| | | October 31, 2009(1) | |
| | | Original | | | Institutional | |
| | | Class | | | Class | |
| PER SHARE DATA: | | | | | | |
| Net asset value, beginning of period | | $ | 19.49 | | | $ | 19.53 | |
| | | | | | | | | |
| Income from investment operations: | | | | | | | | |
| Net investment income | | | 0.01 | | | | 0.00 | (5) |
| Net realized and unrealized gains (losses) on securities | | | (0.62 | ) | | | (0.61 | ) |
| Total from investment operations | | | (0.61 | ) | | | (0.61 | ) |
| | | | | | | | | |
| Less distributions: | | | | | | | | |
| Dividends from net investment income | | | — | | | | — | |
| Dividends from net realized gains | | | — | | | | — | |
| Total distributions | | | — | | | | — | |
Redemption fees retained(5) | | | — | | | | — | |
| Net asset value, end of period | | $ | 18.88 | | | $ | 18.92 | |
| | | | | | | | | |
| TOTAL RETURN | | | (3.13 | )%(6) | | | (3.12 | )%(6) |
| | | | | | | | | |
| SUPPLEMENTAL DATA AND RATIOS: | | | | | | | | |
| Net assets, end of period (millions) | | $ | 132.77 | | | $ | 28.89 | |
| Ratio of expenses to average net assets: | | | | | | | | |
| Before expense reimbursement | | | 1.37 | %(7) | | | 1.20 | %(7) |
After expense reimbursement(8) | | | 1.30 | %(7) | | | 0.98 | %(7) |
| Ratio of net investment income to average net assets | | | | | | | | |
| Before expense reimbursement | | | 0.28 | %(7) | | | 0.44 | %(7) |
After expense reimbursement(8) | | | 0.35 | %(7) | | | 0.66 | %(7) |
Portfolio turnover rate(9) | | | 10 | %(6) | | | 10 | %(6) |
(1) | For the one month ended October 31, 2009. Effective October 31, 2009, the Fund changed its fiscal year end to October 31st from September 30th. |
(2) | The financial highlights set forth for periods prior to March 20, 2009 represent the historical financial highlights of the Tamarack Value Fund, Class S shares. The assets of the Tamarack Value Fund were acquired by the Hennessy Select Large Value Fund on March 20, 2009. Prior to the reorganization, Tamarack Value Fund also offered Class A, C and R shares. At that time Voyageur Asset Management Inc. ceased to be investment advisor and Hennessy Advisors, Inc. became investment advisor. The return of the Tamarack Value Fund, Class S shares during the period October 1, 2008 through March 20, 2009 was (33.09)%. The return of the Hennessy Select Large Value Fund, Original Class shares during the period March 20, 2009 through September 30, 2009 was 36.84%. |
(3) | Institutional Class shares commenced operations on March 20, 2009. |
(4) | Per share net investment income (loss) has been calculated using the average daily shares method. |
(5) | Amount is less than $0.01 per share. |
(8) | The Advisor has agreed to reimburse expenses in order to cap the Original Class and Institutional Class share expenses. Please refer to Note 4 for more information. |
(9) | Portfolio turnover is calculated on the basis of the Fund as a whole. |
The accompanying notes are an integral part of these financial statements.
FINANCIAL HIGHLIGHTS — HENNESSY SELECT LARGE VALUE FUND
| Year Ended September 30, | | | Year Ended September 30, | |
| 2009 | | | 2008 | | | 2007 | | | 2006 | | | 2005 | |
| Original | | | Institutional | | | | | | | | | | | | | |
Class(2) | | | Class(3) | | | Original Class | |
| | | | | | | | | | | | | | | | | |
| $ | 21.80 | | | $ | 14.25 | | | $ | 43.12 | | | $ | 41.74 | | | $ | 45.78 | | | $ | 45.05 | |
| | | | | | | | | | | | | | | | | | | | | | | |
| | 0.31 | | | | 0.08 | | | | 0.42 | (4) | | | 0.58 | (4) | | | 0.55 | (4) | | | 0.74 | |
| | (2.21 | ) | | | 5.20 | | | | (7.43 | ) | | | 5.04 | | | | 3.07 | | | | 4.35 | |
| | (1.90 | ) | | | 5.28 | | | | (7.01 | ) | | | 5.62 | | | | 3.62 | | | | 5.09 | |
| | | | | | | | | | | | | | | | | | | | | | | |
| | (0.41 | ) | | | — | | | | (0.78 | ) | | | (0.63 | ) | | | (0.61 | ) | | | (0.46 | ) |
| | — | | | | — | | | | (13.53 | ) | | | (3.61 | ) | | | (7.05 | ) | | | (3.90 | ) |
| | (0.41 | ) | | | — | | | | (14.31 | ) | | | (4.24 | ) | | | (7.66 | ) | | | (4.36 | ) |
| | — | | | | — | | | | — | | | | — | | | | — | | | | — | |
| $ | 19.49 | | | $ | 19.53 | | | $ | 21.80 | | | $ | 43.12 | | | $ | 41.74 | | | $ | 45.78 | |
| | (8.43 | )% | | | 37.05 | %(5) | | | (22.42 | )% | | | 14.19 | % | | | 9.10 | % | | | 11.42 | % |
| | | | | | | | | | | | | | | | | | | | | | | |
| $ | 138.34 | | | $ | 0.03 | | | $ | 174.23 | | | $ | 269.37 | | | $ | 291.66 | | | $ | 366.95 | |
| | | | | | | | | | | | | | | | | | | | | | | |
| | 1.42 | % | | | 26.18 | %(6) | | | 1.22 | % | | | 1.26 | % | | | 1.22 | % | | | 1.25 | % |
| | 1.17 | % | | | 0.98 | %(6) | | | 1.02 | % | | | 1.03 | % | | | 1.05 | % | | | 1.01 | % |
| | | | | | | | | | | | | | | | | | | | | | | |
| | 1.46 | % | | | (24.06 | )%(6) | | | 1.32 | % | | | 1.13 | % | | | 1.16 | % | | | 1.28 | % |
| | 1.71 | % | | | 1.14 | %(6) | | | 1.52 | % | | | 1.36 | % | | | 1.33 | % | | | 1.52 | % |
| | 142 | % | | | 142 | % | | | 162 | % | | | 136 | % | | | 38 | % | | | 35 | % |
HENNESSY FUNDS 1-800-966-4354
Financial Highlights
| Hennessy Select SPARX Japan Fund |
| | | Year Ended | |
| | | October 31, 2009(1) | |
| | | Original | | | Institutional | |
| | | Class | | | Class | |
| PER SHARE DATA: | | | | | | |
| Net asset value, beginning of year | | $ | 9.73 | | | $ | 9.78 | |
| | | | | | | | | |
| Income from investment operations: | | | | | | | | |
| Net investment income (loss) | | | 0.02 | | | | 0.03 | |
| Net realized and unrealized gains (losses) on securities | | | 1.66 | | | | 1.66 | |
| Total from investment operations | | | 1.68 | | | | 1.69 | |
| | | | | | | | | |
| Less distributions: | | | | | | | | |
| Dividends from net investment income | | | (0.03 | ) | | | (0.03 | ) |
| Dividends from net realized gains | | | — | | | | — | |
| Total distributions | | | (0.03 | ) | | | (0.03 | ) |
| Redemption fees retained | | | — | (2) | | | — | (2) |
| Net asset value, end of year | | $ | 11.38 | | | $ | 11.44 | |
| | | | | | | | | |
| TOTAL RETURN | | | 17.36 | % | | | 17.37 | % |
| | | | | | | | | |
| SUPPLEMENTAL DATA AND RATIOS: | | | | | | | | |
| Net assets, end of period (millions) | | $ | 28.29 | | | $ | 25.55 | |
| Ratio of expenses to average net assets: | | | | | | | | |
| Before expense reimbursement | | | 1.75 | % | | | 1.75 | % |
After expense reimbursement(5) | | | 1.24 | % | | | 1.24 | % |
| Ratio of net investment income to average net assets | | | | | | | | |
| Before expense reimbursement | | | (0.34 | )% | | | (0.34 | )% |
After expense reimbursement(5) | | | 0.17 | % | | | 0.17 | % |
Portfolio turnover rate(4) | | | 17 | % | | | 17 | % |
(1) | The financial highlights set forth for periods prior to September 17, 2009 represent the historical financial highlights of the SPARX Japan Fund. On September 17, 2009 Hennessy Advisors, Inc., became the investment advisor to the Fund and the Fund changed its name to Hennessy Select SPARX Japan Fund. In addition, the Investor Class shares were redesignated Original Class shares. |
(2) | Amount is less than $0.01. |
(3) | Calculated based on average shares outstanding. |
(4) | Portfolio turnover is calculated on the basis of the Fund as a whole. |
(5) | The Advisor has agreed to reimburse expenses in order to cap the Original Class and Institutional Class share expenses. Please refer to Note 4 for more information. |
The accompanying notes are an integral part of these financial statements.
FINANCIAL HIGHLIGHTS — HENNESSY SELECT SPARX JAPAN FUND
| Year Ended October 31, | |
| 2008 | | | 2007 | | | 2006 | | | 2005 | |
| Original | | | Institutional | | | Original | | | Institutional | | | Original | | | Institutional | | | Original | | | Institutional | |
Class(1) | | | Class(1) | | | Class(1) | | | Class(1) | | | Class(1) | | | Class(1) | | | Class(1) | | | Class(1) | |
| | | | | | | | | | | | | | | | | | | | | | | | | | | | | | | |
| $ | 16.24 | | | $ | 16.33 | | | $ | 17.20 | | | $ | 17.27 | | | $ | 17.41 | | | $ | 17.44 | | | $ | 13.28 | | | $ | 13.31 | |
| | | | | | | | | | | | | | | | | | | | | | | | | | | | | | | |
| | 0.05 | | | | 0.05 | | | | (0.03 | ) | | | — | (2) | | | (0.10 | )(3) | | | (0.06 | )(3) | | | (0.06 | )(3) | | | (0.02 | )(3) |
| | (6.56 | ) | | | (6.60 | ) | | | (0.93 | ) | | | (0.94 | ) | | | 0.60 | | | | 0.61 | | | | 4.90 | | | | 4.87 | |
| | (6.51 | ) | | | (6.55 | ) | | | (0.96 | ) | | | (0.94 | ) | | | 0.50 | | | | 0.55 | | | | 4.84 | | | | 4.85 | |
| | | | | | | | | | | | | | | | | | | | | | | | | | | | | | | |
| | — | | | | — | | | | — | | | | — | | | | (0.55 | ) | | | (0.56 | ) | | | — | (2) | | | — | |
| | — | | | | — | | | | — | | | | — | | | | (0.17 | ) | | | (0.17 | ) | | | (0.71 | ) | | | (0.72 | ) |
| | — | | | | — | | | | — | | | | — | | | | (0.72 | ) | | | (0.73 | ) | | | (0.71 | ) | | | (0.72 | ) |
| | — | (2) | | | — | (2) | | | — | | | | — | | | | 0.01 | | | | 0.01 | | | | — | | | | — | (2) |
| $ | 9.73 | | | $ | 9.78 | | | $ | 16.24 | | | $ | 16.33 | | | $ | 17.20 | | | $ | 17.27 | | | $ | 17.41 | | | $ | 17.44 | |
| | | | | | | | | | | | | | | | | | | | | | | | | | | | | | | |
| | (40.09 | )% | | | (40.11 | )% | | | (5.58 | )% | | | (5.44 | )% | | | 2.64 | % | | | 2.90 | % | | | 38.36 | % | | | 38.41 | % |
| | | | | | | | | | | | | | | | | | | | | | | | | | | | | | | |
| $ | 15.86 | | | $ | 37.03 | | | $ | 19.54 | | | $ | 82.94 | | | $ | 26.23 | | | $ | 105.15 | | | $ | 23.49 | | | $ | 53.17 | |
| | | | | | | | | | | | | | | | | | | | | | | | | | | | | | | |
| | 1.72 | % | | | 1.72 | % | | | 1.87 | % | | | 1.67 | % | | | 2.22 | % | | | 1.66 | % | | | 4.24 | % | | | 3.63 | % |
| | 1.25 | % | | | 1.25 | % | | | 1.45 | % | | | 1.25 | % | | | 1.50 | % | | | 1.25 | % | | | 1.50 | % | | | 1.25 | % |
| | | | | | | | | | | | | | | | | | | | | | | | | | | | | | | |
| | (0.10 | )% | | | (0.10 | )% | | | (0.62 | )% | | | (0.42 | )% | | | (1.27 | )% | | | (0.71 | )% | | | (3.14 | )% | | | (2.53 | )% |
| | 0.37 | % | | | 0.37 | % | | | (0.20 | )% | | | 0.00 | % | | | (0.55 | )% | | | (0.30 | )% | | | (0.40 | )% | | | (0.15 | )% |
| | 35 | % | | | 35 | % | | | 111 | % | | | 111 | % | | | 89 | % | | | 89 | % | | | 73 | % | | | 73 | % |
HENNESSY FUNDS 1-800-966-4354
Financial Highlights
| Hennessy Select SPARX Japan Smaller Companies Fund |
| PER SHARE DATA: | |
| Net asset value, beginning of period | |
| | |
| Income from investment operations: | |
| Net investment income (loss) | |
| Net realized and unrealized gains (losses) on securities | |
| Total from investment operations | |
| | |
| Less distributions: | |
| Dividends from net investment income | |
| Dividends from net realized gains | |
| Total distributions | |
| Redemption fees retained | |
| Net asset value, end of period | |
| | |
| TOTAL RETURN | |
| | |
| SUPPLEMENTAL DATA AND RATIOS: | |
| Net assets, end of period (millions) | |
| Ratio of expenses to average net assets: | |
| Before expense reimbursement | |
After expense reimbursement(7) | |
| Ratio of net investment income to average net assets | |
| Before expense reimbursement | |
After expense reimbursement(7) | |
| Portfolio turnover rate | |
(1) | The financial highlights set forth for periods prior to September 17, 2009 represent the historical financial highlights of the SPARX Japan Smaller Companies Fund. On September 17, 2009 Hennessy Advisors, Inc., became the investment advisor to the Fund and the Fund changed its name to Hennessy Select SPARX Japan Smaller Companies Fund. In addition, the Investor Class shares were redesignated Original Class shares. |
(2) | The Fund commenced operations on August 31, 2007. |
(3) | Calculated based on average shares outstanding. |
(4) | Amount is less than $0.01. |
(7) | The Advisor has agreed to reimburse expenses in order to cap the Original Class share expenses. Please refer to Note 4 for more information. |
The accompanying notes are an integral part of these financial statements.
FINANCIAL HIGHLIGHTS — HENNESSY SELECT SPARX JAPAN SMALLER COMPANIES FUND
| Year Ended | | | Year Ended | | | Period Ended | |
| October 31, | | | October 31, | | | October 31, | |
2009(1) | | | 2008(1) | | | 2007(1)(2) | |
| Original Class | |
| | | | | | | | |
| $ | 6.87 | | | $ | 10.98 | | | $ | 10.00 | |
| | | | | | | | | | | |
| | 0.07 | | | | 0.02 | (3) | | | — | (4) |
| | 2.80 | | | | (4.08 | ) | | | 0.98 | |
| | 2.87 | | | | (4.06 | ) | | | 0.98 | |
| | | | | | | | | | | |
| | — | | | | (0.07 | ) | | | — | |
| | — | | | | — | | | | — | |
| | — | | | | (0.07 | ) | | | — | |
| | — | (4) | | | 0.02 | | | | — | |
| $ | 9.74 | | | $ | 6.87 | | | $ | 10.98 | |
| | | | | | | | | | | |
| | 41.78 | % | | | (37.00 | )% | | | 9.80 | %(5) |
| | | | | | | | | | | |
| $ | 16.20 | | | $ | 11.74 | | | $ | 5.58 | |
| | | | | | | | | | | |
| | 3.10 | % | | | 4.47 | % | | | 9.73 | %(6) |
| | 1.60 | % | | | 1.60 | % | | | 1.60 | %(6) |
| | | | | | | | | | | |
| | (0.86 | )% | | | (2.60 | )% | | | (8.15 | )%(6) |
| | 0.64 | % | | | 0.26 | % | | | (0.02 | )%(6) |
| | 138 | % | | | 55 | % | | | 13 | %(5) |
HENNESSY FUNDS 1-800-966-4354
October 31, 2009
The Hennessy Select Large Value Fund (the “Large Value Fund”, formerly known as the Tamarack Value Fund) is organized as a separate investment portfolio or series of Hennessy Funds Trust, a Delaware statutory trust that was organized on September 17, 1992. Prior to July 1, 2005, the Hennessy Funds Trust was known as “The Henlopen Fund”. The Select Large Value Fund is the successor to the Tamarack Value Fund (the “Predecessor Tamarack Fund”) pursuant to a reorganization that took place on March 20, 2009 (See Note 7). As a result of the reorganization, holders of the Class A, Class C, Class R and Class S shares of the Tamarack Value Fund received Original Class shares of the Hennessy Select Large Value Fund. On March 20, 2009, Hennessy Advisors, Inc., became the investment advisor to the Select Large Value Fund and the Select Large Value Fund changed its name from “Tamarack Value Fund” to “Hennessy Select Large Value Fund”. The Hennessy Funds Trust is an open-end, management investment company registered under the Investment Company Act of 1940, as amended. The Large Value Fund is a diversified portfolio. The Large Value Fund commenced operations on September 30, 1984.
The Hennessy Select SPARX Japan Fund (the “Japan Fund”, formerly known as the SPARX Japan Fund) and the Hennessy Select SPARX Japan Smaller Companies Fund (the “Japan Smaller Companies Fund”, formerly known as the SPARX Japan Smaller Companies Fund or together with the SPARX Japan Fund, the “Predecessor SPARX Funds”) are organized as separate investment portfolios or series of Hennessy SPARX Funds Trust, a Massachusetts business trust that was organized on July 24, 1995. From July 25, 2007 through September 17, 2009 the Hennessy SPARX Funds Trust name was “SPARX Asia Funds”. Prior to July 25, 2007, the Hennessy SPARX Funds Trust was known as “SPARX Funds Trust”. On September 17, 2009, Hennessy Advisors, Inc., became the investment advisor to the SPARX Japan Fund and SPARX Japan Smaller Companies Fund. The Hennessy SPARX Funds Trust is an open-end, management investment company registered under the Investment Company Act of 1940, as amended. The Japan Fund and Smaller Companies Fund are each diversified portfolios. Although these funds will each be considered a “diversified” mutual fund, the fund may employ a relatively focused investment strategy and may hold securities of fewer issuers than other diversified funds. The Japan Fund commenced operations on October 31, 2003 and the Smaller Companies Fund commenced operations on August 31, 2007.
The Large Value Fund and Japan Fund offer Original and Institutional Class shares. Each class of shares differs principally in its respective administration and transfer agent expenses and sales charges, if any. Each class has identical rights to earnings, assets and voting privileges, except for class-specific expenses and exclusive rights to vote on matters affecting only individual classes.
NOTES TO THE FINANCIAL STATEMENTS
| 2). | SIGNIFICANT ACCOUNTING POLICIES |
The following is a summary of significant accounting policies consistently followed by the Funds in the preparation of the financial statements. These policies are in conformity with U.S. generally accepted accounting principles (“GAAP”).
| a). | Investment Valuation – Securities which are traded on a national or recognized stock exchange are valued at the last sale price on the securities exchange on which such securities are primarily traded. Exchange-traded securities for which there were no transactions that day and debt securities are valued at the most recent bid prices. Instruments with a remaining maturity of 60 days or less are valued on an amortized cost basis. When a price for an underlying security is not readily available or if a significant event has occurred that indicates the closing price of a security no longer represents the true value of that security, fair value pricing procedures have been adopted by the Board of Trustees of the Funds. Fair value pricing determinations are made in good faith in accordance with these procedures. There are numerous criteria that will be given consideration in determining a fair value of a security. Some of these criteria are: trading volume of security and markets, value of other like securities and news events with direct bearing to security or market. Fair value pricing results in an estimated price that reasonably reflects the current market conditions in order to rate the portfolio holdings such that shareholder transactions receive a fair net asset value. |
| | Fair valuing of foreign securities may be determined with the assistance of a pricing service using correlations between the movement of prices of such securities and indices of domestic securities and other appropriate indicators, such as closing market prices of relevant American Depositary Receipts or futures contracts. The effect of using fair value pricing is that the Funds’ NAV will reflect the affected portfolio securities’ value as determined in the judgment of the Board of Trustees or its designee instead of being determined by the market. Using a fair value pricing methodology to price securities may result in a value that is different from a security’s most recent closing price and from the prices used by other investment companies to calculate their net asset values and are considered level 2 prices. Because the Funds invest in foreign securities, the value of the Funds’ portfolio securities may change on days when you will not be able to purchase or redeem your shares. |
| | Foreign securities are recorded in the financial statements after translation to U.S. dollars based on the applicable exchange rate at the end of the period. The Funds do not isolate that portion of the results of operations resulting from changes in the currency exchange rate from the fluctuations resulting from changes in the market prices of investments. |
| b). | Federal Income Taxes – Provision for federal income taxes or excise taxes has not been made since the Funds have elected to be taxed as a “regulated investment company” and intend to distribute substantially all taxable income to shareholders and otherwise comply with the provisions of the Internal Revenue Code applicable to regulated investment companies. Net investment income and realized gains and losses for federal income tax purposes may differ from that reported on the financial statements because of |
HENNESSY FUNDS 1-800-966-4354
| | temporary book and tax basis differences. Temporary differences are primarily the result of the treatment of wash sales for tax reporting purposes. Distributions from net realized gains for book purposes may include short-term capital gains, which are included as ordinary income to shareholders for tax purposes. |
| | Due to inherent differences in the recognition of income, expenses, and realized gains/losses under U.S. generally accepted accounting principles and federal income tax purposes, permanent differences between book and tax basis reporting for the 2009 fiscal year have been identified and appropriately reclassified on the Statement of Assets and Liabilities. |
| | | | Undistributed Net | | | Accumulated Net | | | Paid In | |
| | | | Investment Income/(Loss) | | | Realized Gain/(Loss) | | | Capital | |
| | Large Value Fund | | | (120 | ) | | | 120 | | | | — | |
| | Japan Fund | | | 10,720 | | | | (10,720 | ) | | | — | |
| | Japan Smaller Companies Fund | | | 130,305 | | | | (130,265 | ) | | | (40 | ) |
| | The permanent differences primarily relate to foreign currency gain (loss) reclasses and adjustments related to passive foreign investment companies. |
| c). | Income and Expenses – Dividend income is recognized on the ex-dividend date or as soon as information is available to the Funds and interest income is recognized on an accrual basis. Income expenses (other than expenses attributable to a specific class), and realized and unrealized gains or losses on investments are allocated to each class of shares based on its respective net assets. |
| d). | Distributions to Shareholders – Dividends from net investment income and distributions of net realized capital gains for the Funds, if any, are declared and paid out annually, usually in November or December of each year. |
| e). | Security Transactions – Investment and shareholder transactions are recorded on the trade date. The Fund determines the gain or loss realized from the investment transactions by comparing the original cost of the security lot sold with the net sale proceeds. Discounts and premiums on securities purchased are accreted/amortized over the life of the respective security. |
| f). | Use of Estimates – The preparation of financial statements in conformity with GAAP requires management to make estimates and assumptions that affect the reported amounts of assets and liabilities and disclosure of contingent assets and liabilities at the date of the financial statements and the reported change in net assets during the reporting period. Actual results could differ from those estimates. |
| g). | Share Valuation – The net asset value (“NAV”) per share of each Fund is calculated by dividing the sum of the value of the securities held, plus cash or other assets, minus all liabilities (including estimated accrued expenses) by the total number of shares outstanding, rounded to the nearest cent. The Funds’ shares will not be priced on the days on which the NYSE is closed for trading. The offering and redemption price per share for the Fund is equal to the Fund’s net asset value per share. The Japan Fund and Smaller Companies Fund may charge a 2.00% redemption fee for selling shares you have owned for 60 days or less. The redemption fee is retained by the fund and treated as additional paid-in-capital and allocated to each class of shares (if applicable) on relative net assets. |
NOTES TO THE FINANCIAL STATEMENTS
| h). | Foreign Currency – Values of investments denominated in foreign currencies are converted into U.S. dollars using the spot market rate of exchange at the time of valuation. Purchases and sales of investments and income are translated into U.S. dollars using the spot market rate of exchange prevailing on the respective dates of such transactions. The effect of changes in foreign exchange rates on realized and unrealized security gains and losses is reflected as a component of such gains or losses. Foreign investments present additional risks due to currency fluctuations, economic and political factors, lower liquidity, government regulations, differences in accounting standards and other factors. |
| i). | Forward Contracts – The Funds may enter into forward currency contracts to reduce their exposure to changes in foreign currency exchange rates on their foreign holdings and to lock in the U.S. dollar cost of firm purchase and sale commitments for securities denominated in foreign currencies. A forward currency contract is a commitment to purchase or sell a foreign currency at a future date at a negotiated forward rate. The gain or loss arising from the difference between the U.S. dollar cost of the original contract and the value of the foreign currency in U.S. dollars upon closing of such contract is included in net realized gain or loss from foreign currency transactions. |
| | The Funds may invest in, or enter into, derivatives, such as options, futures contracts, options on futures contracts and swaps, for a variety of reasons, including to hedge certain risks, to provide a substitute for purchasing or selling particular securities or to increase potential income gain. Derivatives may provide a cheaper, quicker or more specifically focused way for a Fund to invest than “traditional” securities would. The main purpose of utilizing these derivative instruments is for hedging purposes. |
| j). | Repurchase Agreements – The Funds may enter into repurchase agreements with member banks or security dealers of the Federal Reserve whom the investment advisor deems creditworthy. The repurchase price generally equals the price paid by the Fund plus interest negotiated on the basis of current short-term rates. |
| | Securities pledged as collateral for repurchase agreements are held by the custodian bank until the respective agreements mature. Provisions of the repurchase agreements ensure that the market value of the collateral, including accrued interest thereon, is sufficient, in the event of default of the counterparty. If the counterparty defaults and the value of the collateral declines or if the counterparty enters an insolvency proceeding, realization of the collateral by the Fund may be delayed or limited. |
| k). | Accounting for Uncertainty in Income Taxes – The Funds have adopted accounting policies regarding recognition and measurement of tax positions taken or expected to be taken on a tax return. The Funds have reviewed all open tax years and major jurisdictions and concluded that there is no impact on the Funds’ net assets and no tax liability resulting from unrecognized tax benefits relating to uncertain income tax positions taken or expected to be taken on a tax return. As of October 31, 2009, open Federal and state tax years for the Large Value Fund include the tax years ended September 30, 2006 through 2009 and the tax period ended October 31, 2009. As of October 31, 2009, open Federal and state tax years for the Japan Fund and |
HENNESSY FUNDS 1-800-966-4354
| | Japan Smaller Companies Fund include the tax years ended October 31, 2006 through 2009. |
| l). | Events Subsequent to the Fiscal Period End – The Funds have adopted financial reporting rules regarding subsequent events which requires an entity to recognize in the financial statements the effects of all subsequent events that provide additional evidence about conditions that existed at the date of the balance sheet. In addition, an entity is required to disclose the date through which subsequent events have been evaluated. Management has evaluated the Funds’ related events and transactions that occurred subsequent to October 31, 2009, through December 29, 2009, the date of issuance of the Funds’ financial statements. There were no events or transactions that occurred during this period that materially impacted the amounts or disclosures in the Funds’ financial statements. |
| 3). | INVESTMENT TRANSACTIONS |
Purchases and sales of investment securities (excluding government and short-term investments) during the one month ended October 31, 2009 for the Large Value Fund were $13,621,663 and $17,252,129, respectively.
Purchases and sales of investment securities (excluding government and short-term investments) during the year ended October 31, 2009 were as follows:
| | Purchases | Sales |
| Japan Fund | $ 8,942,049 | $17,244,673 |
| Japan Smaller Companies Fund | $22,773,999 | $22,916,199 |
Purchases and sales of investment securities (excluding government and short-term investments) for the Select Large Value Fund during the year ended September 30, 2009 were $170,697,264 and $182,979,545, respectively. There were no purchases or sales of long term U.S. Government securities in the Funds during the period/year ended October 31, 2009.
| 4). | INVESTMENT MANAGEMENT FEE AND OTHER TRANSACTIONS WITH AFFILIATES |
Hennessy Advisors, Inc. (the “Advisor”) is the Advisor of the Funds. The Advisor provides the Funds with investment management services under an Investment Advisory Agreement. The Advisor furnishes all investment advice, office space, facilities, and provides most of the personnel needed by the Funds. As compensation for its services, the Advisor is entitled to a monthly fee from each Fund. The fee is based upon the average daily net assets of the Funds at the annual rate of:
| Large Value Fund | 0.85% |
| Japan Fund | 1.00% |
| Japan Smaller Companies Fund | 1.20% |
Prior to March 20, 2009, Voyageur Asset Management Inc. (“Voyageur”) acted as the investment advisor for the Predecessor Tamarack Fund. The Predecessor Tamarack Fund entered an agreement with Voyageur whereas they furnished related office facilities, equipment, research and personnel. The agreement required the Predecessor Tamarack Fund to pay Voyageur a monthly fee of 0.85% based upon average daily net assets.
NOTES TO THE FINANCIAL STATEMENTS
The Advisor has delegated the day to day management of the Large Value Fund to a Sub-Advisor, Voyageur Asset Management, Inc. (“Voyageur”). The Advisor has delegated the day to day management of the Japan and Japan Smaller Companies Funds to a Sub-Advisor, SPARX Asset Management Co. Ltd. (“SPARX”). The Advisor pays the Sub-Advisor fees for each of the Funds from its own assets and these fees are not an additional expense of the Funds.
Prior to September 17, 2009, SPARX Investment & Research, USA, Inc. (“SPARX USA”) acted as the investment advisor for the Predecessor SPARX Japan Fund and SPARX Smaller Companies Fund. The Predecessor SPARX Funds entered into an agreement with SPARX USA whereas they furnished related office facilities, equipment, research and personnel. The agreement required the SPARX Japan Fund and SPARX Smaller Companies Fund to pay SPARX USA a monthly fee of 1.00% and 1.20%, respectively, based upon average daily net assets.
The Advisor has agreed to absorb expenses to the extent that the total annual operating expenses (excluding all federal, state and local taxes, interest, brokerage commissions, acquired fund fees and expenses and other costs incurred in connection with the purchase and sale of securities and extraordinary items) do not exceed 1.30% and 0.98% of the Large Value Fund’s net assets for the Original Class and Institutional Class shares, respectively. The expense limitation agreement for the Original Class shares of the Large Value Fund is in place through March 31, 2010. The expense limitation agreement for the Institutional Class shares of the Large Value Fund can only be terminated by the Board of Trustees. Voyageur Asset Management Inc. (“Voyageur”) had contractually agreed to waive fees/or make payments in order to keep total operating expenses of the Predecessor Fund, Class S at 1.03%. This limitation was in place February 1, 2008 until January 31, 2009. Additionally, the Advisor has agreed to waive its fees and absorb expenses to the extent that the total annual operating expenses (excluding all federal, state and local taxes, interest, brokerage commissions, acquired fund fees and expenses and other costs incurred in connection with the purchase and sale of securities and extraordinary items) do not exceed 1.25% of the Japan Fund’s net assets for both the Original Class and Institutional Class and 1.60% of the net assets of the Japan Smaller Companies Fund, Original Class shares. The expense limitation agreement for the Japan Fund and the Japan Smaller Companies Fund is in place through February, 2010. For a period of three years after the year in which the Advisor waives or reimburses expenses, the Advisor may seek reimbursement from the Fund to the extent that total annual fund operating expenses are less than the expense limitation in effect at the time of the waiver or reimbursement. The Advisor reimbursed expenses of $7,647 for the Large Value Fund, for the fiscal period ended October 31, 2009. As of October 31, 2009, cumulative expenses subject to potential recovery to the aforementioned conditions and year of expiration are as follows:
| | | Oct. 31, 2011 | | | Oct. 31, 2012 | | | Total | |
| Large Value – Original Class | | $ | 91,061 | | | $ | 7,641 | | | $ | 98,702 | |
| Large Value – Institutional Class | | $ | 2,239 | | | $ | 6 | | | $ | 2,245 | |
HENNESSY FUNDS 1-800-966-4354
The Board of Trustees has approved a Shareholder Servicing Plan for the Original Class shares of the Large Value Fund which was instituted to compensate the Advisor for the non-investment management services it provides to the Fund. The Plan provides for a monthly fee paid to the Advisor at an annual rate of 0.10% of the average daily net assets of the Large Value Fund. The Japan and Japan Smaller Companies Funds have not adopted a shareholder servicing plan.
The Large Value Fund has entered into agreements with various brokers, dealers and financial intermediaries in connection with the sale of shares of the Large Value Fund. The agreements provide for periodic payments by the Large Value Fund to the brokers, dealers and financial intermediaries for providing certain shareholder maintenance services (sub-transfer agent expenses). These shareholder services include: the pre-processing and quality control of new accounts, shareholder correspondence, answering customer inquiries regarding account status and facilitating shareholder telephone transactions. Fees paid by the Large Value Fund to various brokers, dealers and financial intermediaries for the fiscal period ended October 31, 2009, were $8,846. Fees paid by the Large Value Fund to various brokers, dealers and financial intermediaries for the year ended September 30, 2009 were $88,011, $2,210, $34, $2 and $17,112 for Original Class, Institutional Class and Predecessor Classes A, C and S, respectively.
The Predecessor Tamarack Fund had adopted a Master Distribution 12b-1 Plan (the “Plan”) in which Tamarack Distributors Inc. (the “Distributor”) acted as the Predecessor Tamarack Fund’s distributor. The Distributor is an affiliate of Voyageur. The Plan permitted the Predecessor Tamarack Fund to make payments for or reimburse the Distributor monthly for distribution-related costs and expenses of marketing shares of each share class covered under the Plan; and/or for providing shareholder services. The following chart shows the most recent Plan fee rate for each class of the Predecessor Tamarack Fund.
| | | Class A | Class I | Class C | Class R | Class S |
| | 12b-1 Plan Fee | 0.25%* | 0.00% | 1.00% | 0.50% | 0.00% |
| * | The maximum Plan fee rate for Class A shares is 0.50%. The Distributor contractually waived 0.25% of the total 0.50% Plan fee for Class A. |
Plan fees are based on average daily net assets of the applicable class. Up to 0.25% of each Plan fee may be designated as a Service Fee, as defined by the applicable rules of the Financial Industry Regulatory Authority. The Distributor, subject to applicable legal requirements, may waive a Plan fee voluntarily, in whole or in part. The distribution fees for the Predecessor Tamarack Fund were $576, $86 and $6 for Classes A, C and R, respectively. Neither the Original nor the Institutional Class shares of the Select Large Value Fund have adopted a 12b-1 Plan.
For the period ended March 20, 2009, the Distributor received commissions of $27 from front-end sales charges of Class A shares of the Predecessor Tamarack Fund, all of which was paid to affiliated broker-dealers. The Distributor also received $3 from CDSC fees from Class C shares of the Predecessor Tamarack Fund. The Distributor received no CDSC fees from Class A shares of the Predecessor Tamarack Fund during the period ended March 20, 2009 after which Class A and Class C shares were no longer offered for sale after March 20, 2009.
NOTES TO THE FINANCIAL STATEMENTS
U.S. Bancorp Fund Services, LLC (the “Administrator”) acts as the Large Value Fund’s Administrator under an Administration Agreement. Prior to September 18, 2009 PNC Global Investment Servicing (U.S.) Inc. (“PNC”) served as administrator of the Predecessor SPARX Funds. Effective March 20, 2009 the Large Value Fund entered into an Administration Agreement with U.S. Bancorp Fund Services, LLC. Effective September 18, 2009 the Japan and Japan Smaller Companies Funds entered into an Administration Agreement with U.S. Bancorp Fund Services, LLC. The Administrator prepares various federal and state regulatory filings, reports and returns for the Fund; prepares reports and materials to be supplied to the directors; monitors the activities of the Funds’ custodian, transfer agent and accountants; coordinates the preparation and payment of the Funds’ expenses and reviews the Funds’ expense accruals. Fees paid to U.S. Bancorp Fund Services, LLC for the fiscal period ended October 31, 2009, were $30,082, $11,773 and $3,484, for the Large Value, Japan and Japan Smaller Companies Funds, respectively. Fees paid to U.S. Bancorp Fund Services, LLC for services provided to the Select Large Value Fund for the period March 20, 2009 through September 30, 2009 were $167,841.
Prior to March 20, 2009 Voyageur and PNC Global Investment Servicing (U.S.) Inc. (“PNC”) served as co-administrators of the Predecessor Tamarack Fund. Services provided under the administrative services contract included providing day-to-day administration of matters related to the Predecessor Tamarack Fund, maintenance of its records and the preparation of reports. Under the terms of the administrative services contract, Voyageur received a fee, payable monthly, at the annual rate of 0.075% of the Predecessor Tamarack Fund’s average daily net assets. PNC received a fee for its services payable by the Predecessor Tamarack Fund based on the Predecessor Tamarack Fund’s average net assets. Voyageur’s fee is included in “Administration fees” in the Statement of Operations for the year ended September 30, 2009. PNC’s fee is included with “Fund Accounting fees” in the Statement of Operations for the year ended September 30, 2009.
Prior to September 18, 2009, services provided under the PNC administrative services contract included providing day-to-day administration of matters related to the Predecessor SPARX Funds, maintenance of their records and the preparation of reports. Under the terms of the administrative services contract, PNC received a fee, payable monthly, at the annual rate of 0.07% of the first $100 million of the Predecessor SPARX Funds’ average daily net assets, decreasing as assets reach certain levels and subject to a minimum fee plus out-of-pocket expenses.
Quasar Distributors, LLC (“Quasar”) acts as the Funds’ principal underwriter in a continuous public offering of the Funds’ shares. Quasar is an affiliated company of U.S. Bank, N.A.
The Japan and Japan Smaller Companies Funds each had a $5,000,000 line of credit, intended to provide short-term financing, if necessary, subject to certain restrictions, in connection with shareholder redemptions. The credit facility was with its former custodian bank, PNC Bank, N.A. and was terminated on September 18, 2009. During the year ended October 31, 2009, the Japan Fund and Japan Smaller Companies Fund did not have any borrowings under the facility.
HENNESSY FUNDS 1-800-966-4354
| 6). | FEDERAL TAX INFORMATION |
The following balances for the Funds are as of October 31, 2009, the Funds’ most recent fiscal year end:
| | | | | | | | | Japan | |
| | | Large | | | | | | Smaller | |
| | | Value | | | Japan | | | Companies | |
| | | Fund | | | Fund | | | Fund | |
| Cost of Investments for tax purposes | | $ | 114,795,217 | | | $ | 59,643,948 | | | $ | 13,458,638 | |
| Gross tax unrealized appreciation | | | 22,806,298 | | | | 5,599,157 | | | | 3,444,166 | |
| Gross tax unrealized depreciation | | | (7,123,722 | ) | | | (11,602,360 | ) | | | (1,012,116 | ) |
| Net tax unrealized appreciation | | | | | | | | | | | | |
| (depreciation) on investments | | | 15,682,576 | | | | (6,003,203 | ) | | | 2,432,050 | |
| Undistributed ordinary income | | $ | 1,390,728 | | | $ | 53,363 | | | $ | 675,389 | |
| Undistributed long-term capital gains | | $ | — | | | $ | — | | | $ | — | |
| Total distributable earnings | | $ | 1,390,728 | | | $ | 53,363 | | | $ | 675,389 | |
| Other accumulated gains (losses) | | $ | (62,540,134 | ) | | $ | (27,995,609 | ) | | $ | (3,818,529 | ) |
| Total accumulated earnings (losses) | | $ | (45,466,830 | ) | | $ | (33,945,449 | ) | | $ | (711,090 | ) |
At October 31, 2009, the Large Value Fund had tax basis capital losses of $62,540,134, to offset future capital gains, the use of a portion of which is limited by IRS regulations. Of such losses, $31,599,923 expire October 31, 2016 and $30,940,211 expire on October 31, 2017. Additionally, the Large Value Fund had no post-October loss deferrals as of October 31, 2009.
At October 31, 2009, the Japan Fund had tax basis capital losses of $27,995,609, to offset future capital gains, the use of a portion of which is limited by IRS regulations. Of such losses, $967,738 expire October 31, 2014, $5,345,663 expire October 31, 2015, $6,231,544 expire October 31, 2016 and $15,450,664 expire October 31, 2017. Additionally, the Japan Fund had no post-October loss deferrals as of October 31, 2009.
At October 31, 2009, the Japan Smaller Companies Fund had tax basis capital losses of $3,818,529, to offset future capital gains, the use of a portion of which is limited by IRS regulations. Of such losses, $6,584 expire October 31, 2015, $69,006 expire October 31, 2016 and $3,742,939 expire October 31, 2017. Additionally, the Smaller Companies Fund had no post-October loss deferrals as of October 31, 2009.
The tax character of distributions paid during 2009 and 2008 for the Funds were as follows:
| | | One Month Ended | | | Year Ended | | | Year Ended | |
| Large Value Fund | | October 31, 2009* | | | September 30, 2009 | | | September 30, 2008 | |
| Ordinary income | | | — | | | $ | 3,122,632 | | | $ | 11,195,735 | |
| Long-term capital gain | | | — | | | | — | | | | 75,497,358 | |
| | | | — | | | $ | 3,122,632 | | | $ | 86,693,093 | |
| * | The Large Value Fund changed its fiscal year end to October 31 from September 30. |
NOTES TO THE FINANCIAL STATEMENTS
| | | Year Ended | | | Year Ended | |
| Japan Fund | | October 31, 2009 | | | October 31, 2008 | |
| Ordinary income | | $ | 175,178 | | | $ | — | |
| Long-term capital gain | | | — | | | | — | |
| | | $ | 175,178 | | | $ | — | |
| | | | | | | |
| | | Year Ended | | | Year Ended | |
| Japan Smaller Companies Fund | | October 31, 2009 | | | October 31, 2008 | |
| Ordinary income | | $ | — | | | $ | 37,128 | |
| Long-term capital gain | | | — | | | | — | |
| | | $ | — | | | $ | 37,128 | |
On March 20, 2009 the shareholders of the Tamarack Value Fund approved the agreement and plan of reorganization providing for the transfer of assets of the Tamarack Value Fund to the Hennessy Select Value Fund and the assumption of the liabilities of the Tamarack Value Fund by the Hennessy Select Value Fund. The following table illustrates the specifics of the reorganization:
| Acquired | Shares issued to | Acquiring | | |
| Fund | Shareholders of | Fund | Combined | Tax Status |
| Net Assets | Acquired Fund | Net Assets | Net Assets | of Transfer |
$106,344,111(1) | 7,462,745 | — | $106,344,111 | Non-taxable |
(1) | Includes accumulated realized losses and unrealized depreciation in the amounts of ($22,268,596) and ($20,869,681) respectively. |
HENNESSY FUNDS 1-800-966-4354
(This Page Intentionally Left Blank.)
Report of Independent Registered Public Accounting Firm
The Shareholders and Board of Trustees of
The Hennessy Funds Trust and The Hennessy SPARX Funds Trust:
We have audited the accompanying statements of assets and liabilities of Hennessy Select Large Value Fund, Hennessy Select SPARX Japan Fund (formerly known as the SPARX Japan Fund) and Hennessy Select SPARX Japan Smaller Companies Fund (formerly known as the SPARX Japan Smaller Companies Fund), including the schedules of investments, as of October 31, 2009, and the related statements of operations for the year then ended (month ended October 31, 2009 and year ended September 30, 2009 for Hennessy Select Large Value Fund), and the statements of changes in net assets and the financial highlights for the year then ended (month ended October 31, 2009 and year ended September 30, 2009 for Hennessy Select Large Value Fund). These financial statements and financial highlights are the responsibility of management. Our responsibility is to express an opinion on these financial statements and financial highlights based on our audits. The statement of changes in net assets and financial highlights for the periods presented through September 30, 2008 of the Hennessy Select Large Value Fund were audited by other auditors whose report dated November 26, 2008 expressed an unqualified opinion on that statement and those financial highlights. The statement of changes in net assets and financial highlights for the periods presented through October 30, 2008 of the Hennessy Select SPARX Japan Fund and Hennessy Select SPARX Japan Smaller Companies Fund were audited by other auditors whose report dated December 10, 2008 expressed an unqualified opinion on that statement and those financial highlights.
We conducted our audits in accordance with the standards of the Public Company Accounting Oversight Board (United States). Those standards require that we plan and perform the audit to obtain reasonable assurance about whether the financial statements and financial highlights are free of material misstatement. An audit includes examining, on a test basis, evidence supporting the amounts and disclosures in the financial statements. Our procedures included confirmation of securities owned as of October 31, 2009 by correspondence with the custodian and brokers or by other appropriate auditing procedures. An audit also includes assessing the accounting principles used and significant estimates made by management, as well as evaluating the overall financial statement presentation. We believe that our audits provide a reasonable basis for our opinion.
In our opinion, the financial statements and financial highlights referred to above present fairly, in all material respects, the financial position of Hennessy Select Large Value Fund, Hennessy Select SPARX Japan Fund and Hennessy Select SPARX Japan Smaller Companies Fund as of October 31, 2009, and the results of their operations, the changes in their net assets and the financial highlights for each of the periods described in the first paragraph above, in conformity with U.S. generally accepted accounting principles.
Milwaukee, Wisconsin
December 29, 2009
HENNESSY FUNDS 1-800-966-4354
Directors and Officers of the Fund
| | Position(s) | Term of Office |
| | Held with | and Length of |
| Name, Age and Address | the Companies | Time Served |
| | | |
| “Disinterested Persons” | | |
| | | |
| J. Dennis DeSousa | Director/Trustee | Indefinite, until |
| Age: 72 | | successor elected |
| Address: | | |
| c/o Hennessy Advisors, Inc. | | HFT: Served since July 2005 |
| 7250 Redwood Blvd. | | HSFT: Served since September 2009 |
| Suite 200 | | |
| Novato, CA 94945 | | |
| | | |
| Robert T. Doyle | Director/Trustee | Indefinite, until |
| Age: 61 | | successor elected |
| Address: | | |
| c/o Hennessy Advisors, Inc. | | HFT: Served since July 2005 |
| 7250 Redwood Blvd. | | HSFT: Served since September 2009 |
| Suite 200 | | |
| Novato, CA 94945 | | |
| | | |
| Gerald P. Richardson | Director/Trustee | Indefinite, until |
| Age: 62 | | successor elected |
| Address: | | |
| c/o Hennessy Advisors, Inc. | | HFT: Served since July 2005 |
| 7250 Redwood Blvd. | | HSFT: Served since September 2009 |
| Suite 200 | | |
| Novato, CA 94945 | | |
| | | |
| “Interested Persons” (as defined in the 1940 Act) | | |
| | | |
Neil J. Hennessy(1) | Director/Trustee | Director/Trustee: |
| Age: 53 | and Chairman | Indefinite, until |
| Address: | of the Board | successor elected |
| c/o Hennessy Advisors, Inc. | | |
| 7250 Redwood Blvd. | | HFT: Served since July 2005 |
| Suite 200 | | HSFT: Served since September 2009 |
| Novato, CA 94945 | | |
| | | |
| | | Officer (Chairman of the Board): |
| | | 1 year term |
| | | |
| | | HFT: Served since June 2008 |
| | | HSFT: Served since September 2009 |
Key:
HFT = Hennessy Funds Trust
HSFT = Hennessy SPARX Funds Trust
DIRECTORS AND OFFICERS OF THE FUND
| | Number of Portfolios in the | |
| Principal Occupation(s) | Fund Complex Overseen | Other Directorships |
| During Past 5 Years | by Director/Trustee | Held by Director |
| | | |
| Currently a real estate investor. | 10 | None. |
| | | |
| | | |
| Currently the Sheriff of Marin County, | 10 | None. |
| California (since 1996) and has been | | |
| employed in the Marin County Sheriff’s | | |
| Office in various capacities since 1969. | | |
| | | |
| | | |
| Formerly the Chief Executive Officer and | 10 | None. |
| owner of ORBIS Payment Services. | | |
| Mr. Richardson is now an independent | | |
| consultant in the securities industries. | | |
| | | |
| | | |
| President, Chairman, CEO and Co-Portfolio | 10 | Director of Hennessy |
| Manager of Hennessy Advisors, Inc., the | | Advisors, Inc. |
| Hennessy Funds’ investment advisor, since | | |
| 1989; President of HMFI and HFI from 1996 | | |
| through June 2008, and President of HFT | | |
| from 2005 through June 2008. | | |
HENNESSY FUNDS 1-800-966-4354
| | Position(s) | Term of Office |
| | Held with | and Length of |
| Name, Age and Address | the Companies | Time Served |
| | | |
Kevin A. Rowell(1) | President | 1 year term |
| Age: 49 | | |
| Address: | | HFT: Since June 2008 |
| c/o Hennessy Advisors, Inc. | | HSFT: Since September 2009 |
| 7250 Redwood Blvd. | | |
| Suite 200 | | |
| Novato, CA 94945 | | |
| | | |
Frank Ingarra, Jr.(1) | Co-Portfolio | 1 year term |
| Age: 38 | Manager and | |
| Address: | Vice President | HFT: Since July 2005 |
| c/o Hennessy Advisors, Inc. | | HSFT: Since September 2009 |
| 7250 Redwood Blvd. | | |
| Suite 200 | | |
| Novato, CA 94945 | | |
| | | |
Harry F. Thomas(1) | Vice President, | 1 year term |
| Age: 62 | Chief Compliance | |
| Address: | Officer | HFT: Since July 2005 |
| c/o Hennessy Advisors, Inc. | | HSFT: Since September 2009 |
| 7250 Redwood Blvd. | | |
| Suite 200 | | |
| Novato, CA 94945 | | |
| | | |
Teresa M. Nilsen(1) | Executive Vice | 1 year term |
| Age: 43 | President and | |
| Address: | Treasurer | HFT: Since July 2005 |
| c/o Hennessy Advisors, Inc. | | HSFT: Since September 2009 |
| 7250 Redwood Blvd. | | |
| Suite 200 | | |
| Novato, CA 94945 | | |
| | | |
Daniel B. Steadman(1) | Executive Vice | 1 year term |
| Age: 53 | President and | |
| Address: | Secretary | HFT: Since July 2005 |
| c/o Hennessy Advisors, Inc. | | HSFT: Since September 2009 |
| 7250 Redwood Blvd. | | |
| Suite 200 | | |
| Novato, CA 94945 | | |
DIRECTORS AND OFFICERS OF THE FUND
| | Number of Portfolios in the | |
| Principal Occupation(s) | Fund Complex Overseen | Other Directorships |
| During Past 5 Years | by Director/Trustee | Held by Director |
| | | |
| Mr. Rowell was President of Pioneer Funds | N/A | None. |
| Distributor from January 2006 to July 2007; | | |
| from April 2004 through November 2005, | | |
| Mr. Rowell was Executive Vice President at | | |
| Charles Schwab & Co., Inc.; and from | | |
| September 2002 through April 2004 was | | |
| President SAFECO Mutual Funds. | | |
| | | |
| Mr. Ingarra Co-Portfolio Manager for | N/A | None. |
| Hennessy Advisors, Inc., the Funds’ | | |
| investment advisor. Mr. Ingarra has been | | |
| with the Hennessy Funds and Hennessy | | |
| Advisors, Inc. since 2004. He is Vice | | |
| President of the Hennessy Funds. | | |
| | | |
| Vice President, Chief Compliance Officer | N/A | None. |
| for Hennessy Advisors, Inc., the Funds’ | | |
| investment advisor, since 2004; retired | | |
| business executive from 2001 through | | |
| 2004; and director of The Hennessy | | |
| Funds from 2000 to May 2004. | | |
| | | |
| Currently Executive Vice President, Chief | N/A | Director of Hennessy |
| Financial Officer and Secretary of Hennessy | | Advisors, Inc. |
| Advisors, Inc., the Funds’ investment advisor; | | |
| Ms. Nilsen has been the corporate secretary | | |
| and a financial officer of Hennessy Advisors, | | |
| Inc. since 1989; Ms. Nilsen has been an | | |
| officer of The Hennessy Funds since 1996, | | |
| currently she is Executive Vice President | | |
| and Treasurer. | | |
| | | |
| Executive Vice President of Hennessy | N/A | Director of Hennessy |
| Advisors, Inc., the Funds’ investment advisor, | | Advisors, Inc. |
| from 2000 to the present; Mr. Steadman has | | |
| been Executive Vice President and Secretary | | |
| of The Hennessy Funds since 2000. | | |
HENNESSY FUNDS 1-800-966-4354
| | Position(s) | Term of Office |
| | Held with | and Length of |
| Name, Age and Address | the Companies | Time Served |
| | | |
Tania A. Kelley(1) | Vice President | 1 year term |
| Age: 44 | of Marketing | |
| Address: | | HFT: Since July 2005 |
| c/o Hennessy Advisors, Inc. | | HSFT: Since September 2009 |
| 7250 Redwood Blvd. | | |
| Suite 200 | | |
| Novato, CA 94945 | | |
| | | |
Ana Miner(1) | Vice President | 1 year term |
| Age: 51 | of Operations | |
| Address: | | HFT: Since July 2005 |
| c/o Hennessy Advisors, Inc. | | HSFT: Since September 2009 |
| 7250 Redwood Blvd. | | |
| Suite 200 | | |
| Novato, CA 94945 | | |
| | | |
Brian Peery(1) | Vice President | 1 year term |
| Age: 40 | of Sales | |
| Address: | | HFT: Since July 2005 |
| c/o Hennessy Advisors, Inc. | | HSFT: Since September 2009 |
| 7250 Redwood Blvd. | | |
| Suite 200 | | |
| Novato, CA 94945 | | |
(1) | All officers of the Hennessy Funds and employees of the Advisor are Interested Persons of the Hennessy Funds. |
DIRECTORS AND OFFICERS OF THE FUND
| | Number of Portfolios in the | |
| Principal Occupation(s) | Fund Complex Overseen | Other Directorships |
| During Past 5 Years | by Director/Trustee | Held by Director |
| | | |
| Has been employed by Hennessy | N/A | None. |
| Advisors, Inc., the Funds’ investment | | |
| advisor, since October 2003; Director of | | |
| Sales and Marketing for Comcast from | | |
| 2000 through 2003. | | |
| | | |
| | | |
| Has been employed by Hennessy | N/A | None. |
| Advisors, Inc., the Funds’ investment | | |
| advisor, since 1998. | | |
| | | |
| | | |
| Has been employed by Hennessy | N/A | None. |
| Advisors, Inc., the Funds’ investment | | |
| advisor, since June 2002; Vice President of | | |
| Institutional Sales and Senior Analyst with | | |
| Brad Peery Inc. from June 2000 to June | | |
| 2002; from 1996 to 2002, Mr. Peery worked | | |
| for Haywood Securities where he was a | | |
| Vice President. | | |
HENNESSY FUNDS 1-800-966-4354
October 31, 2009
As a shareholder of the Funds, you incur two types of costs: (1) transaction costs, including sales charges (loads) on purchase payments, reinvested dividends, or other distributions; redemption fees; and exchange fees; and (2) ongoing costs, including management fees; service fees; and other Fund expenses. This Example is intended to help you understand your ongoing costs (in dollars) of investing in each of the Funds and to compare these costs with the ongoing costs of investing in other mutual funds. The Example is based on an investment of $1,000 invested at the beginning of the period and held for the entire period from May 1, 2009 through October 31, 2009.
Actual Expenses
The first set of lines of the table below provide information about actual account values and actual expenses. Although the Funds charge no sales loads or transaction fees, you will be assessed fees for outgoing wire transfers, returned checks and stop payment orders at prevailing rates charged by U.S. Bancorp Fund Services, LLC, the Funds’ transfer agent. If you request that a redemption be made by wire transfer, currently a $15.00 fee is charged by the Funds’ transfer agent. IRA accounts will be charged a $15.00 annual maintenance fee. The example below includes, but is not limited to, management fees, shareholder servicing fees, fund accounting, custody and transfer agent fees. However, the example below does not include portfolio trading commissions and related expenses, interest expense or dividends on short positions taken by the Fund and other extraordinary expenses as determined under generally accepted accounting principles. You may use the information within these lines, together with the amount you invested, to estimate the expenses that you paid over the six-month period. Simply divide your account value by $1,000 (for example, an $8,600 account value divided by $1,000 = 8.6), then multiply the result by the number in the first line under the heading entitled “Expenses Paid During Period” to estimate the expenses you paid on your account during this period.
Hypothetical Example for Comparison Purposes
The second set of lines within the table below provide information about hypothetical account values and hypothetical expenses based on the Funds’ actual expense ratios and an assumed rate of return of 5% per year before expenses, which is not the Funds’ actual return. The hypothetical account values and expenses may not be used to estimate the actual ending account balance or expenses you paid for the period. You may use this information to compare the ongoing costs of investing in the Funds and other funds. To do so, compare this 5% hypothetical example with the 5% hypothetical examples that appear in the shareholder reports of the other funds. Please note that the expenses shown in the table are meant to highlight your ongoing costs only and do not reflect any transactional costs, such as sales charges (loads), or exchange fees. Therefore, the second line of the table is useful in comparing ongoing costs only, and will not help you determine the relative total costs of owning different funds. In addition, if these transactional costs were included, your costs would have been higher.
EXPENSE EXAMPLE
| | Beginning | Ending | Expenses Paid |
| | Account Value | Account Value | During Period(1) |
| Original Class | 5/1/09 | 10/31/09 | 5/1/09 – 10/31/09 |
| | | | |
| Actual | | | |
| Select Large Value | | | |
| Fund – Original Class | $1,000.00 | $1,171.20 | $7.11 |
| Select SPARX Japan | | | |
| Fund – Original Class | $1,000.00 | $1,206.80 | $6.95 |
| Select SPARX Japan Smaller | | | |
| Companies Fund – Original Class | $1,000.00 | $1,393.40 | $9.65 |
| | | | |
| Hypothetical (5% return | | | |
| before expenses) | | | |
| Select Large Value | | | |
| Fund – Original Class | $1,000.00 | $1,018.65 | $6.61 |
| Select SPARX Japan | | | |
| Fund – Original Class | $1,000.00 | $1,018.90 | $6.36 |
| Select SPARX Japan Smaller | | | |
| Companies Fund – Original Class | $1,000.00 | $1,017.14 | $8.13 |
(1) | Expenses are equal to the Select Large Value Funds’s expense ratio of 1.30%, the Select SPARX Japan Fund’s expense ratio of 1.25%, and the Select SPARX Japan Smaller Companies Fund’s expense ratio of 1.60%, multiplied by the average account value over the period, multiplied by 184/365 days (to reflect one-half year period.) |
| | Beginning | Ending | Expenses Paid |
| | Account Value | Account Value | During Period(2) |
| Institutional Class | 5/1/09 | 10/31/09 | 5/1/09 – 10/31/09 |
| | | | |
| Actual | | | |
| Select Large Value Fund – | | | |
| Institutional Class | $1,000.00 | $1,026.94 | $5.01 |
| Select SPARX Japan Fund – | | | |
| Institutional Class | $1,000.00 | $1,206.80 | $6.95 |
| | | | |
| Hypothetical (5% return | | | |
| before expenses) | | | |
| Select Large Value Fund – | | | |
| Institutional Class | $1,000.00 | $1,003.16 | $4.95 |
| Select SPARX Japan Fund – | | | |
| Institutional Class | $1,000.00 | $1,018.90 | $6.36 |
(2) | Expenses are equal to the Select Large Value Fund’s expense ratio of 0.98%, and the Select SPARX Japan Fund’s expense ratio of 1.25%, multiplied by the average account value over the period, multiplied by 184/365 days (to reflect one-half year period.) |
HENNESSY FUNDS 1-800-966-4354
A description of the policies and procedures that the Funds use to determine how to vote proxies relating to portfolio securities is available without charge: (1) by calling 1-800-966-4354; (2) on the Hennessy Funds website at www.hennessyfunds.com; or (3) on the U.S. Securities and Exchange Commission’s website at www.sec.gov. Hennessy Funds’ proxy voting record is available on the SEC’s website at www.sec.gov no later than August 31 for the prior 12 months ending June 30.
Quarterly Filings on Form N-Q
The Funds file their complete schedule of portfolio holdings with the SEC for the first and third quarters of each fiscal year on Form N-Q. The Funds’ Form N-Q will be available on the SEC’s website at www.sec.gov. The Funds’ Form N-Q may be reviewed and copied at the SEC’s Public Reference Room in Washington, DC and information on the operation of the Public Reference Room may be obtained by calling 1-800-SEC-0330. Information included in the Funds’ N-Q will also be available upon request by calling 1-800-966-4354.
Matters Submitted to a Shareholder Vote
A special meeting of shareholders of the SPARX Japan Fund and the SPARX Japan Smaller Companies Fund was held on September 17, 2009 and the following matters were approved by such Fund’s voting shares:
| 1). | Approve a new investment advisory agreement between SPARX Asia Funds and Hennessy Advisors, Inc.: |
| | | Japan Fund | | | Japan Smaller Companies Fund | |
| For | | | 3,568,799 | | | | 924,859 | |
| Against | | | 4,477 | | | | 3,166 | |
| Abstain | | | 469 | | | | 9,224 | |
| Broker non-vote | | | 1,206,649 | | | | 725,990 | |
| 2). | Approve a new sub-advisory agreement between Hennessy Advisors, Inc., and SPARX Asset Management Co., Ltd.: |
| | | Japan Fund | | | Japan Smaller Companies Fund | |
| For | | | 3,568,799 | | | | 919,936 | |
| Against | | | 4,477 | | | | 6,939 | |
| Abstain | | | 469 | | | | 10,372 | |
| Broker non-vote | | | 1,206,649 | | | | 725,992 | |
Japan Fund
| | | J. Dennis | | | Robert T. | | | Gerald P. | | | Neil J. | |
| | | DeSousa | | | Doyle | | | Richardson | | | Hennessy | |
| For | | | 1,608,479 | | | | 1,608,479 | | | | 1,608,479 | | | | 1,608,479 | |
| Against | | | — | | | | — | | | | — | | | | — | |
| Abstain | | | 54,760 | | | | 54,760 | | | | 54,760 | | | | 54,760 | |
| Broker non-vote | | | — | | | | — | | | | — | | | | — | |
Japan Smaller Companies Fund
| | | J. Dennis | | | Robert T. | | | Gerald P. | | | Neil J. | |
| | | DeSousa | | | Doyle | | | Richardson | | | Hennessy | |
| For | | | 1,608,479 | | | | 1,608,479 | | | | 1,608,479 | | | | 1,608,479 | |
| Against | | | — | | | | — | | | | — | | | | — | |
| Abstain | | | 54,760 | | | | 54,760 | | | | 54,760 | | | | 54,760 | |
| Broker non-vote | | | — | | | | — | | | | — | | | | — | |
Federal Tax Distribution Information (Unaudited)
The Large Value, Japan and Japan Smaller Companies Funds designate 0%, 0% and 0%, respectively, of the dividends declared from net investment income during the year ended October 31, 2009*, as qualified dividend income under the Jobs Growth and Tax Reconciliation Act of 2003.
For the year ended October 31, 2009*, 0%, 0% and 0%, of the ordinary income distributions paid by the Large Value, Japan and Smaller Companies Funds qualify for the dividend received deduction available to corporate shareholders.
| * | Effective October 31, 2009, the Large Value Fund changed its fiscal year end to October 31st from September 30th. The percentages listed for the Large Value Fund are for the one month period ended October 31, 2009. |
HENNESSY FUNDS 1-800-966-4354
The Board of Trustees of Hennessy SPARX Funds Trust appointed KPMG LLP to replace Ernst & Young LLP (“E&Y”) as the independent auditor for the Hennessy Select SPARX Japan Fund and the Hennessy Select SPARX Japan Smaller Companies Fund commencing with the fiscal year ended October 31, 2009. During the two most recent fiscal years, E&Y’s audit reports contained no adverse opinion or disclaimer of opinion; nor were their reports qualified as to uncertainty, audit scope, or accounting principles. Further, there were no disagreements with E&Y on any matter of accounting principles or practices, financial statement disclosure or auditing scope or procedure, which disagreements, if not resolved to the satisfaction of E&Y, would have caused it to make reference to the subject matter of the disagreements in connection with its reports on the funds’ financial statements for such years; and there were no “reportable events” of the kind described in Item 304(a)(1)(v) of Regulation S-K under the Securities Exchange Act of 1934, as amended.
During the fiscal years ended prior to October 31, 2009, neither Hennessy Advisors, Inc., the Hennessy Select SPARX Japan Fund, the Hennessy Select SPARX Japan Smaller Companies Fund nor anyone on their behalf have consulted KPMG LLP or any other independent registered public accounting firms on items which (i) concerned the application of accounting principles to a specified transaction, either completed or proposed, or the type of audit opinion that might be rendered on the funds’ financial statements or (ii) concerned the subject of a disagreement (as defined in paragraph (a)(1)(iv) of Item 304 of Regulation S-K and related instructions) or reportable events (as described in paragraph (a)(1)(v) of said Item 304).
Privacy Policy
We collect the following non-public personal information about you:
| • | information we receive from you on or in applications or other forms, correspondence, or conversations, including, but not limited to, your name, address, phone number, social security number, assets, income and date of birth; |
| • | information about your transactions with us, our affiliates, or others, including, but not limited to, your account number and balance, payment history, parties to transactions, cost basis information and other financial information. |
We do not disclose any non-public personal information about our current or former shareholders to nonaffiliated third parties, except as permitted by law. For example, we are permitted by law to disclose all of the information we collect, as described above, to our Transfer Agent to process your transactions. Furthermore, we restrict access to your non-public personal information to those persons who require such information to provide products or services to you. We maintain physical, electronic and procedural safeguards that comply with federal standards to guard your non-public personal information.
In the event that you hold shares of the Fund through a financial intermediary, including, but not limited to, a broker-dealer, bank or trust company, the privacy policy of your financial intermediary would govern how your non-public personal information would be shared with nonaffiliated third parties.
HENNESSY FUNDS 1-800-966-4354
For information, questions
or assistance, please call
The Hennessy Funds
1-800-966-4354 or 1-415-899-1555
INVESTMENT ADVISOR
Hennessy Advisors, Inc.
7250 Redwood Blvd., Suite 200
Novato, California 94945
ADMINISTRATOR, TRANSFER
AGENT, DIVIDEND PAYING
AGENT & SHAREHOLDER
SERVICING AGENT
U.S. Bancorp Fund Services, LLC
P.O. Box 701
Milwaukee, Wisconsin 53201-0701
CUSTODIAN
U.S. Bank N.A.
Custody Operations
1555 North River Center Dr., Suite 302
Milwaukee, Wisconsin 53212
TRUSTEES
Neil J. Hennessy
Robert T. Doyle
J. Dennis DeSousa
Gerald P. Richardson
COUNSEL
Foley & Lardner LLP
777 East Wisconsin Avenue
Milwaukee, Wisconsin 53202-5306
INDEPENDENT REGISTERED
PUBLIC ACCOUNTING FIRM
KPMG LLP
777 East Wisconsin Avenue, 15th Floor
Milwaukee, Wisconsin 53202
DISTRIBUTOR
Quasar Distributors, LLC
615 East Michigan Street
Milwaukee, Wisconsin 53202
WWW.HENNESSYFUNDS.COM
This report has been prepared for shareholders and may be distributed
to others only if preceded or accompanied by a current prospectus.
Item 2. Code of Ethics.
A copy of the registrant’s Code of Ethics is filed herewith.
The registrant has adopted a code of ethics that applies to the registrant’s principal executive officer and principal financial officer. The registrant has not made any amendments to its code of ethics during the period covered by this report. The registrant has not granted any waivers from any provisions of the code of ethics during the period covered by this report.
Item 3. Audit Committee Financial Expert.
The registrant’s board of directors has determined that it does not have an audit committee financial expert serving on its audit committee. At this time, the registrant believes that the experience provided by each member of the audit committee together offers the registrant adequate oversight for the registrant’s level of financial complexity.
Item 4. Principal Accountant Fees and Services.
The registrant has engaged its principal accountant to perform audit services, audit-related services, tax services and other services during the past two fiscal years. “Audit services” refer to performing an audit of the registrant's annual financial statements or services that are normally provided by the accountant in connection with statutory and regulatory filings or engagements for those fiscal years. “Audit-related services” refer to the assurance and related services by the principal accountant that are reasonably related to the performance of the audit. “Tax services” refer to professional services rendered by the principal accountant for tax compliance, tax advice, and tax planning. The following table details the aggregate fees billed or expected to be billed for each of the last two fiscal years for audit fees, audit-related fees, tax fees and other fees by the principal accountant.
| | FYE 10/31/2009 | FYE 10/31/2008 |
| Audit Fees | $31,250 | $16,500 |
| Audit-Related Fees | - | - |
| Tax Fees | 6,250 | 3,250 |
| All Other Fees | - | - |
The audit committee has adopted pre-approval policies and procedures that require the audit committee to pre-approve all audit and non-audit services of the registrant, including services provided to any entity affiliated with the registrant.
The percentage of fees billed by KPMG, LLP applicable to non-audit services pursuant to waiver of pre-approval requirement were as follows:
| | FYE 10/31/2009 | FYE 10/31/2008 |
| Audit-Related Fees | 0% | 0% |
| Tax Fees | 0% | 0% |
| All Other Fees | 0% | 0% |
All of the principal accountant’s hours spent on auditing the registrant’s financial statements were attributed to work performed by full-time permanent employees of the principal accountant. (If more than 50 percent of the accountant’s hours were spent to audit the registrant's financial statements for the most recent fiscal year, state how many hours were attributed to work performed by persons other than the principal accountant's full-time, permanent employees.)
The following table indicates the non-audit fees billed or expected to be billed by the registrant’s accountant for services to the registrant and to the registrant’s investment adviser (and any other controlling entity, etc.—not sub-adviser) for the last two years. The audit committee of the board of trustees/directors has considered whether the provision of non-audit services that were rendered to the registrant's investment adviser is compatible with maintaining the principal accountant's independence and has concluded that the provision of such non-audit services by the accountant has not compromised the accountant’s independence.
| Non-Audit Related Fees | FYE 10/31/2009 | FYE 10/31/2008 |
| Registrant | $- | $- |
| Registrant’s Investment Adviser | - | - |
Item 5. Audit Committee of Listed Registrants.
Not applicable to registrants who are not listed issuers (as defined in Rule 10A-3 under the Securities Exchange Act of 1934).
Item 6. Investments.
Schedule of Investments is included as part of the report to shareholders filed under Item 1 of this Form.
Item 7. Disclosure of Proxy Voting Policies and Procedures for Closed-End Management Investment Companies.
Not applicable to open-end investment companies.
Item 8. Portfolio Managers of Closed-End Management Investment Companies.
Not applicable to open-end investment companies.
Item 9. Purchases of Equity Securities by Closed-End Management Investment Company and Affiliated Purchasers.
Not applicable to open-end investment companies.
Item 10. Submission of Matters to a Vote of Security Holders.
Not Applicable.
Item 11. Controls and Procedures.
| (a) | The Registrant’s Chief Executive Officer and Treasurer have reviewed the Registrant's disclosure controls and procedures (as defined in Rule 30a-3(c) under the Investment Company Act of 1940 (the “Act”)) as of a date within 90 days of the filing of this report, as required by Rule 30a-3(b) under the Act and Rules 13a-15(b) or 15d-15(b) under the Securities Exchange Act of 1934. Based on their review, such officers have concluded that the disclosure controls and procedures are effective in ensuring that information required to be disclosed in this report is appropriately recorded, processed, summarized and reported and made known to them by others within the Registrant and by the Registrant’s service provider. |
| (b) | There were no changes in the Registrant's internal control over financial reporting (as defined in Rule 30a-3(d) under the Act) that occurred during the second fiscal quarter of the period covered by this report that has materially affected, or is reasonably likely to materially affect, the Registrant's internal control over financial reporting. |
Item 12. Exhibits.
| (a) | (1) Any code of ethics or amendment thereto, that is the subject of the disclosure required by Item 2, to the extent that the registrant intends to satisfy Item 2 requirements through filing an exhibit. Filed herewith |
(2) A separate certification for each principal executive and principal financial officer pursuant to Section 302 of the Sarbanes-Oxley Act of 2002. Filed herewith.
(3) Any written solicitation to purchase securities under Rule 23c-1 under the Act sent or given during the period covered by the report by or on behalf of the registrant to 10 or more persons. Not applicable to open-end investment companies.
| (b) | Certifications pursuant to Section 906 of the Sarbanes-Oxley Act of 2002. Furnished herewith. |
SIGNATURES
Pursuant to the requirements of the Securities Exchange Act of 1934 and the Investment Company Act of 1940, the registrant has duly caused this report to be signed on its behalf by the undersigned, thereunto duly authorized.
(Registrant) Hennessy Funds Trust.
By (Signature and Title)* /s/Neil J. Hennessy
Neil J. Hennessy, Principal Executive Officer
Date January 5, 2010
Pursuant to the requirements of the Securities Exchange Act of 1934 and the Investment Company Act of 1940, this report has been signed below by the following persons on behalf of the registrant and in the capacities and on the dates indicated.
By (Signature and Title) /s/Neil J. Hennessy
Neil J. Hennessy, Principal Executive Officer
By (Signature and Title) /s/Teresa M. Nilsen
Teresa M. Nilsen, Treasurer