UNITED STATES
SECURITIES AND EXCHANGE COMMISSION
Washington, D.C. 20549
FORM N-CSR
CERTIFIED SHAREHOLDER REPORT OF REGISTERED
MANAGEMENT INVESTMENT COMPANIES
Investment Company Act file number (811-07168)
Hennessy Funds Trust
(Exact name of registrant as specified in charter)
7250 Redwood Blvd., Suite 200
Novato, CA 94945
(Address of principal executive offices) (Zip code)
Neil J. Hennessy
Hennessy Advisors, Inc.
7250 Redwood Blvd., Suite 200
Novato, CA 94945
(Name and address of agent for service)
800-966-4354
Registrant's telephone number, including area code
Date of fiscal year end: September 30, 2009
Date of reporting period: September 30, 2009
Item 1. Reports to Stockholders.
HENNESSY FUNDS
ANNUAL REPORT
SEPTEMBER 30, 2009
Hennessy Select Large Value Fund
Contents
| Letter to shareholders | | 1 |
| Performance overview | | 5 |
| Summary of investments | | 7 |
| Financial statements | | |
| Statement of assets and liabilities | | 14 |
| Statement of operations | | 15 |
| Statement of changes in net assets | | 16 |
| Financial highlights | | 18 |
| Notes to the financial statements | | 20 |
| Report of Independent Registered Public Accounting Firm | | 26 |
| Trustees and Officers of the Fund | | 28 |
| Expense example | | 34 |
| Additional Information | | 36 |
WWW.HENNESSYFUNDS.COM
LETTER TO SHAREHOLDERS
November, 2009
Dear Hennessy Select Large Value Fund Shareholder:
The past year is one that I believe many investors will be glad to have behind them. At the beginning of the Fund’s fiscal year (October, 2008) the economy and financial markets were in chaos, and it felt as though they were on the brink of collapse following the AIG bailout, Lehman Brothers failure and the mega mergers between some of the country’s largest banks and investment houses. Many investors saw their portfolios and 401K’s cut nearly in half, while at the same time watched the values of their homes tumble; there was truly nowhere for investors to hide from the financial fallout. In my 30 years in the business, I have never witnessed the crisis of confidence we experienced in late February/March of this year. Even the most seasoned, disciplined and long-term investors I know simply had had enough and were pulling money out of the stock market. In just the short period from October 1st to March 9th, the major indices, such as the S&P 500 and Dow Jones Industrial Average, lost approximately 40% of their value.
Since their lows in March, the major indices have rallied back roughly 50-60%. There is certainly some ground to make up for the markets to return to their pre-recession levels, but I believe we are now in the midst of a recovery and that we should see steady, sustainable growth in the coming years. I actually believe the recovery began in November of 2008, with the first injection of government TARP (Trouble Asset Relief Program) spending. Like anything that is broken, a fix takes time to work, however, I believe that investors had seen such staggering losses that they were not willing to take a wait and see approach with this government stimulus. While the markets will no doubt have their ups and downs, I am confident that the lows of March should be behind us.
While the markets are in recovery, in my opinion, investor confidence is not. The magnitude of the most recent downturn has left investors feeling overwhelmed and distraught, and fear has kept many people on the sidelines, causing them to miss the recent rally. I believe there are several key factors that could push the stock market higher:
| | • | During the past year companies have seen their stock prices crushed, and many have taken this as an opportunity to cut costs and position their balance sheets for the future. Companies have de-leveraged themselves, laid off employees, closed unprofitable |
HENNESSY FUNDS 1-800-966-4354
| | business lines and taken any available write-offs. As these companies emerge leaner, we expect to see their quarterly earnings steadily improving, as any additional revenue falls to their bottom lines. |
| | • | The Federal Reserve appears to remain committed to very low interest rates. With 30-year U.S. Treasury yields hovering in the 4% range, investors may need to look to the market for more aggressive returns to try to stay ahead of inflation, and I believe this should drive increased investment in high-quality equities. |
| | • | The price to sales ratio, one of the tools we use to determine a stock’s value, has returned to normalized historical levels. Over the past ten years the price to sales ratio of the Dow Jones Industrial Average has averaged $1.23. At the market low on March 9th the price to sales ratio of the Dow had dropped to just $0.60, meaning that investors were able to buy a dollar of revenue for just sixty cents. As of the end of September, 2009, this ratio had rebounded to $1.21 and is again within its historical norm. I believe this ratio will hold steady and that stock prices should rise proportionally with any increase in sales. |
| | • | U.S. investors are holding an estimated $9 trillion on the sidelines. Once investor confidence starts to build, I believe this will encourage equity investing. Confidence should beget more widespread confidence and investing may beget further investing. |
| | • | Banks are steadily regaining strength, with many already paying back their TARP loans. They have begun to lend again to credit-worthy consumers, who in turn have been able to purchase homes and other big ticket items. |
During the past decade, the tech bubble and the housing bubble created large financial gains. Many consumers were allowed, maybe even encouraged, to borrow more heavily than they should have and live beyond their means. In the past year, investors across the globe have learned a lesson about leverage and its downside, and I believe the markets have now made a move back to “normal”, where growth is based on fundamentals, and will be driven by increases in personal income and consumer spending, which should result in increases in corporate earnings. Using history as my guide, I believe the markets should return to a more normalized annual return. Since 1980, even with several major corrections along the way and including the most recent downturn, the Dow Jones Industrial Average has produced a 12% average annual return. While this may not be the 35% return investors were getting in the late 1990’s, I do believe a more normalized growth rate is sustainable for the foreseeable future.
LETTER TO SHAREHOLDERS
I continue to believe that historical performance data has shown how patience, discipline and a long-term investing view can be rewarded. Many of the savviest investors, who realize that sometimes the best time to invest is when things look the worst, have already benefitted from the recent rally since the market lows in March.
We maintain our focus on long-term investing and on building value for all of our shareholders. At Hennessy Funds, we serve our shareholders directly, so that we can provide answers to shareholder questions and concerns. Please don’t hesitate to contact us at 800-966-4354 if we can answer any questions or can be of service.
Best regards,
Neil J. Hennessy
Portfolio Manager & Chief Investment Officer
Past performance does not guarantee future results.
Mutual fund investing involves risk. Principal loss is possible. Medium-capitalization companies tend to have limited liquidity and greater price volatility than large-capitalization companies. Growth stocks typically are more volatile than value stocks; however value stocks have a lower expected growth rate in earnings and sales.
Price-to-sales ratio is a tool for calculating a stock’s valuation relative to other companies. It is calculated by dividing a stock’s current price by its revenue per share.
Opinions expressed are those of Neil Hennessy and are subject to change, are not guaranteed and should not be considered investment advice.
The Dow Jones Industrial Average is an unmanaged index of common stocks comprised of major industrial companies and assumes reinvestment of dividends. You cannot invest directly in an index.
HENNESSY FUNDS 1-800-966-4354
Performance Overview
Original Class Shares
AVERAGE ANNUAL TOTAL RETURN PERIODS ENDED SEPTEMBER 30, 2009
| | | One | | Five | | Ten | | Since Inception |
| | | Year | | Years | | Years | | (9/30/84) |
| Hennessy Select Large | | | | | | | | | | | | |
| Value Fund – Original Class | | | (8.43 | )% | | | (0.28 | )% | | | 1.73 | % | | | 9.57 | % |
| Russell 1000 Value Index | | | (10.62 | )% | | | 0.90 | % | | | 2.59 | % | | | 10.83 | % |
| S&P 500 Index | | | (6.91 | )% | | | 1.02 | % | | | (0.15 | )% | | | 10.36 | % |
Gross expense ratio: 1.37%
Performance data quoted represents past performance; past performance does not guarantee future results. The performance for periods prior to March 20, 2009 reflects the performance of the Tamarack Value Fund, the predecessor to the Hennessy Select Large Value Fund. The investment return and principal value of an investment will fluctuate so that an investor’s shares, when redeemed, may be worth more or less than their original cost. Current performance of the fund may be lower or higher than the performance quoted. Performance data current to the most recent month end may be obtained by visiting www.hennessyfunds.com. Investment performance reflects fee waivers in effect. In the absence of such waivers, total return would be reduced.
PERFORMANCE NARRATIVE FROM VOYAGEUR
ASSET MANAGEMENT, SUB-ADVISOR TO THE FUND
For the twelve-month period ending September 30, 2009, The Hennessy Select Large Value Fund (formerly known as the Tamarack Value Fund) returned -8.43%. While the Fund suffered a loss, it outperformed its benchmark index, the Russell 1000 Value Index, which lost 10.62% over the same time period. The S&P 500 lost 6.91% for the period. Because the Hennessy Select Large Value portfolio is managed to be sector neutral to the benchmark, all of the Fund’s excess performance was attributable to stock selection.
With the recent financial crisis, it is not surprising that the Financial sector was the hardest hit. Over the last twelve months the Financial stocks held in the portfolio lost approximately 23%. The Industrial Sector followed close behind, with our stocks down roughly 20%, as they too were affected by the availability of credit. The sectors displaying positive returns during fiscal 2009 were the Technology and Telecommunications sectors. During this time period our Technology stocks returned approximately 9%, while our Telecommunications stocks were able to eke out a gain of about 1%.
Relative to the market overall, the Hennessy Select Large Value Fund had the most difficulty this last year in the Consumer Staples sector, followed by the Technology sector. Within Consumer Staples, our holding of Tyson Foods inhibited overall portfolio performance. While we anticipated that a significant competitor for Tyson (Pilgrim’s Pride) would file bankruptcy, an unforeseen implementation of foreign quotas on chicken deliveries caused Tyson’s stock to underperform, and the stock has since been eliminated. In the Technology sector, a loss for Motorola overcame otherwise good results.
The portfolio’s best relative returns over the year were in the Energy sector, followed closely by the Financial and Materials sectors. Our strategy to concentrate on energy producers outside of the integrated oil companies yielded positive results, especially our holdings in Anadarko Petroleum, Noble Energy and Peabody Energy. Our results in the Financial sector were significantly improved by our holding in Prudential Insurance, while down over the last twelve months, more than doubled while it was held in the portfolio. Our timely holdings of CF Industries, prior to its takeover, and FMC assisted in producing good relative results in the Materials sector.
PERFORMANCE OVERVIEW
Performance Overview
Original Class Shares
During the last six month, specifically since the market lows on March 9th, we have seen that returns were more driven by sector selection, rather than stock selection. The best performing sectors were Financials, Industrials, Consumer Discretionary, Materials and Technology, which returned between 52% and 70%. The Energy, Health Care, Consumer Staples, Utilities and Telecom Services sectors were up only between approximately 10% and 24% for the period. While this has not been the best environment for our portfolio strategy, which emphasizes security selection over sector rotation, we are gratified to have outperformed the benchmark over the last year. We believe that in the coming months and years stock selection will return to be a more prominent factor in the calculus of excess returns, an environment in which we believe the portfolio should be well positioned to benefit from.
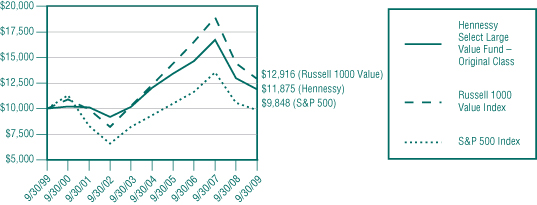
CHANGE IN VALUE OF $10,000 INVESTMENT
This chart assumes an initial gross investment of $10,000 made on September 30, 1999. Returns shown include the reinvestment of all dividends. Returns shown do not reflect the deduction of taxes that a shareholder would pay on fund distributions or the redemption of fund shares.
The S&P 500 and Russell 1000 Value are unmanaged indices commonly used to measure the performance of U.S. stocks. The Russell 1000 Value measures large-cap, value-oriented stocks. One cannot invest directly in an index.
Past performance is not a guarantee of future results. Medium-capitalization companies tend to have limited liquidity and greater price volatility than large-capitalization companies. Growth stocks typically are more volatile than value stocks; however, value stocks have a lower expected growth rate in earnings and sales.
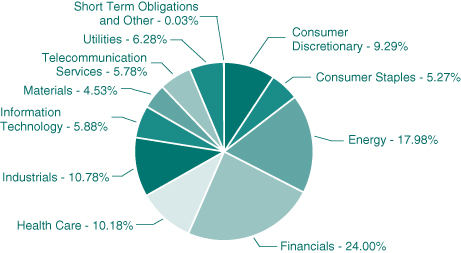
The Fund’s composition and sector weightings are shown as a percentage of the Fund’s total net assets. Portfolio composition and sector weightings are subject to change at any time and should not be considered a recommendation to buy or sell a particular security. Please refer to the Summary of Investments within this Annual Report for additional portfolio information, including percentages of holdings.
HENNESSY FUNDS 1-800-966-4354
Performance Overview
Institutional Class Shares
TOTAL RETURN AS OF SEPTEMBER 30, 2009
| | | Since Inception |
| | | (3/20/09) |
| Hennessy Select Large Value Fund – Institutional Class | | 37.05% |
| Russell 1000 Value Fund | | 43.75% |
| S&P 500 Index | | 39.20% |
Gross expense ratio: 1.19%
Performance data quoted represents past performance; past performance does not guarantee future results. The investment return and principal value of an investment will fluctuate so that an investor’s shares, when redeemed, may be worth more or less than their original cost. Current performance of the fund may be lower or higher than the performance quoted. Performance data current to the most recent month end may be obtained by visiting www.hennessyfunds.com. Investment performance reflects fee waivers in effect. In the absence of such waivers, total return would be reduced.
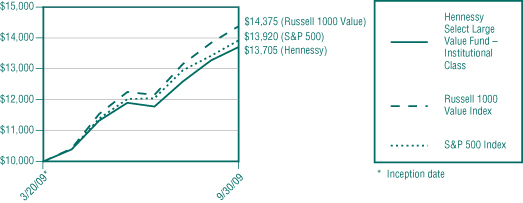
CHANGE IN VALUE OF $10,000 INVESTMENT
This chart assumes an initial gross investment of $10,000 made on March 20, 2009 (inception date of share class). Returns shown include the reinvestment of all dividends. Returns shown do not reflect the deduction of taxes that a shareholder would pay on fund distributions or the redemption of fund shares.
The S&P 500 and Russell 1000 Value are unmanaged indices commonly used to measure the performance of U.S. stocks. The Russell 1000 Value measures large-cap, value-oriented stocks. One cannot invest directly in an index.
Past performance is not a guarantee of future results. Medium-capitalization companies tend to have limited liquidity and greater price volatility than large-capitalization companies. Growth stocks typically are more volatile than value stocks; however, value stocks have a lower expected growth rate in earnings and sales.
PERFORMANCE OVERVIEW AND SUMMARY OF INVESTMENTS
Summary of Investments
The following summary of investments is designed to help investors better understand the Fund’s principal holdings. The summary is as of September 30, 2009.
HENNESSY SELECT
LARGE VALUE FUND
(% of Net Assets)
| | TOP TEN EQUITY HOLDINGS | % of net assets | |
| | J.P. Morgan Chase & Co. | 4.18% | |
| | ChevronTexaco Corp. | 4.13% | |
| | Exxon Mobil Corp. | 4.06% | |
| | General Electric Co. | 3.51% | |
| | Verizon Communications, Inc. | 2.83% | |
| | Bank of America Corp. | 2.50% | |
| | Apache Corp. | 2.43% | |
| | Baxter International, Inc. | 2.41% | |
| | Anadarko Petroleum Corp. | 2.40% | |
| | Schering Plough Corp. | 1.53% | |
HENNESSY FUNDS 1-800-966-4354
COMMON STOCKS – 99.97% | | Number | | | | | | % of Net | |
| | | of Shares | | | Value | | | Assets | |
| Consumer Discretionary – 9.29% | | | | | | | | | |
| Discovery Communications, Inc. (a) | | | 32,760 | | | $ | 852,743 | | | | 0.62 | % |
| Ford Motor Co. (a) | | | 196,685 | | | | 1,418,099 | | | | 1.03 | % |
| Home Depot, Inc. | | | 80,025 | | | | 2,131,866 | | | | 1.54 | % |
| Staples, Inc. | | | 61,760 | | | | 1,434,067 | | | | 1.04 | % |
| Starwood Hotels & Resorts Worldwide, Inc. | | | 65,945 | | | | 2,178,163 | | | | 1.57 | % |
| The Gap, Inc. | | | 86,820 | | | | 1,857,948 | | | | 1.34 | % |
| Viacom, Inc. (a) | | | 69,790 | | | | 1,956,912 | | | | 1.41 | % |
| Wendy’s/Arby’s Group, Inc. | | | 215,530 | | | | 1,019,457 | | | | 0.74 | % |
| | | | | | | | 12,849,255 | | | | 9.29 | % |
| | | | | | | | | | | | | |
| Consumer Staples – 5.27% | | | | | | | | | | | | |
| ConAgra Foods, Inc. | | | 110,320 | | | | 2,391,737 | | | | 1.73 | % |
| CVS Corp. | | | 67,785 | | | | 2,422,636 | | | | 1.75 | % |
| Lorillard, Inc. | | | 15,540 | | | | 1,154,622 | | | | 0.83 | % |
| PepsiCo, Inc. | | | 22,580 | | | | 1,324,543 | | | | 0.96 | % |
| | | | | | | | 7,293,538 | | | | 5.27 | % |
| | | | | | | | | | | | | |
| Energy – 17.98% | | | | | | | | | | | | |
| Anadarko Petroleum Corp. | | | 52,840 | | | | 3,314,653 | | | | 2.40 | % |
| Apache Corp. | | | 36,570 | | | | 3,358,223 | | | | 2.43 | % |
| ChevronTexaco Corp. | | | 81,175 | | | | 5,717,155 | | | | 4.13 | % |
| EOG Resources, Inc. | | | 17,515 | | | | 1,462,678 | | | | 1.06 | % |
| Exxon Mobil Corp. | | | 81,975 | | | | 5,624,305 | | | | 4.06 | % |
| Noble Energy, Inc. | | | 24,875 | | | | 1,640,755 | | | | 1.19 | % |
| Occidental Petroleum Corp. | | | 31,330 | | | | 2,456,272 | | | | 1.77 | % |
| Schlumberger Ltd. (b) | | | 21,715 | | | | 1,294,214 | | | | 0.94 | % |
| | | | | | | | 24,868,255 | | | | 17.98 | % |
| | | | | | | | | | | | | |
| Financials – 24.00% | | | | | | | | | | | | |
| American Express Co. | | | 30,630 | | | | 1,038,357 | | | | 0.75 | % |
| Bank of America Corp. | | | 204,620 | | | | 3,462,170 | | | | 2.50 | % |
| BB&T Corp. | | | 51,860 | | | | 1,412,666 | | | | 1.02 | % |
| Citigroup, Inc. | | | 273,790 | | | | 1,325,144 | | | | 0.96 | % |
| The Goldman Sachs Group, Inc. | | | 16,675 | | | | 3,074,036 | | | | 2.22 | % |
| J.P. Morgan Chase & Co. | | | 131,835 | | | | 5,777,010 | | | | 4.18 | % |
| Mack-Cali Realty Corp. | | | 47,745 | | | | 1,543,596 | | | | 1.12 | % |
The accompanying notes are an integral part of these financial statements.
SUMMARY OF INVESTMENTS
| COMMON STOCKS | | Number | | | | | | % of Net | |
| | | of Shares | | | Value | | | Assets | |
| Financials (Continued) | | | | | | | | | |
| Marshall & Ilsley Corp. | | | 79,860 | | | $ | 644,470 | | | | 0.47 | % |
| Morgan Stanley | | | 52,585 | | | | 1,623,825 | | | | 1.17 | % |
| Prudential Financial, Inc. | | | 27,920 | | | | 1,393,487 | | | | 1.01 | % |
| Simon Property Group, Inc. | | | 25,990 | | | | 1,804,486 | | | | 1.30 | % |
| State Street Corp. | | | 22,800 | | | | 1,199,280 | | | | 0.87 | % |
| Travelers Companies, Inc. | | | 46,995 | | | | 2,313,564 | | | | 1.67 | % |
| US Bancorp (c) | | | 92,675 | | | | 2,025,876 | | | | 1.46 | % |
| Wells Fargo & Co. | | | 112,410 | | | | 3,167,714 | | | | 2.29 | % |
| XL Capital Ltd. (b) | | | 80,210 | | | | 1,400,467 | | | | 1.01 | % |
| | | | | | | | 33,206,148 | | | | 24.00 | % |
| | | | | | | | | | | | | |
| Health Care – 10.18% | | | | | | | | | | | | |
| Amgen, Inc. | | | 34,525 | | | | 2,079,441 | | | | 1.50 | % |
| Baxter International, Inc. | | | 58,565 | | | | 3,338,791 | | | | 2.41 | % |
| DaVita, Inc. (a) | | | 36,885 | | | | 2,089,166 | | | | 1.51 | % |
| Forest Laboratories, Inc. (a) | | | 72,955 | | | | 2,147,795 | | | | 1.55 | % |
| Pfizer, Inc. | | | 39,095 | | | | 647,022 | | | | 0.47 | % |
| Schering Plough Corp. | | | 75,055 | | | | 2,120,304 | | | | 1.53 | % |
| Wellpoint, Inc. (a) | | | 35,185 | | | | 1,666,362 | | | | 1.21 | % |
| | | | | | | | 14,088,881 | | | | 10.18 | % |
| | | | | | | | | | | | | |
| Industrials – 10.78% | | | | | | | | | | | | |
| CSX Corp. | | | 43,660 | | | | 1,827,608 | | | | 1.32 | % |
| General Dynamics Corp. | | | 25,860 | | | | 1,670,556 | | | | 1.21 | % |
| General Electric Co. | | | 295,505 | | | | 4,852,192 | | | | 3.51 | % |
| Illinois Tool Works, Inc. | | | 29,145 | | | | 1,244,783 | | | | 0.90 | % |
| Ingersoll-Rand Plc (b) | | | 44,870 | | | | 1,376,163 | | | | 0.99 | % |
| Terex Corp. (a) | | | 26,670 | | | | 552,868 | | | | 0.40 | % |
| Tyco International Ltd. (b) | | | 52,965 | | | | 1,826,233 | | | | 1.32 | % |
| United Technologies Corp. | | | 25,780 | | | | 1,570,775 | | | | 1.13 | % |
| | | | | | | | 14,921,178 | | | | 10.78 | % |
| | | | | | | | | | | | | |
| Information Technology – 5.88% | | | | | | | | | | | | |
| Applied Materials, Inc. | | | 101,485 | | | | 1,359,899 | | | | 0.98 | % |
| Hewlett-Packard Co. | | | 58,370 | | | | 2,755,648 | | | | 1.99 | % |
| Microsoft Corp. | | | 92,560 | | | | 2,396,378 | | | | 1.73 | % |
The accompanying notes are an integral part of these financial statements.
HENNESSY FUNDS 1-800-966-4354
| COMMON STOCKS | | Number | | | | | | % of Net | |
| | | of Shares | | | Value | | | Assets | |
| Information Technology (Continued) | | | | | | | | | |
| Xerox Corp. | | | 121,715 | | | $ | 942,074 | | | | 0.68 | % |
| Yahoo!, Inc. (a) | | | 38,480 | | | | 685,329 | | | | 0.50 | % |
| | | | | | | | 8,139,328 | | | | 5.88 | % |
| | | | | | | | | | | | | |
| Materials – 4.53% | | | | | | | | | | | | |
| The Dow Chemical Co. | | | 63,190 | | | | 1,647,363 | | | | 1.19 | % |
| FMC Corp. | | | 30,575 | | | | 1,719,844 | | | | 1.24 | % |
| Freeport-McMoRan Copper & Gold, Inc. | | | 13,010 | | | | 892,616 | | | | 0.65 | % |
| International Paper Co. | | | 49,280 | | | | 1,095,494 | | | | 0.79 | % |
| Nucor Corp. | | | 19,360 | | | | 910,114 | | | | 0.66 | % |
| | | | | | | | 6,265,431 | | | | 4.53 | % |
| | | | | | | | | | | | | |
| Telecommunication Services – 5.78% | | | | | | | | | | | | |
| AT&T, Inc. | | | 89,405 | | | | 2,414,829 | | | | 1.75 | % |
| Qwest Communications International, Inc. | | | 232,035 | | | | 884,054 | | | | 0.64 | % |
| Sprint Nextel Corp. (a) | | | 197,080 | | | | 778,466 | | | | 0.56 | % |
| Verizon Communications, Inc. | | | 129,515 | | | | 3,920,419 | | | | 2.83 | % |
| | | | | | | | 7,997,768 | | | | 5.78 | % |
| | | | | | | | | | | | | |
| Utilities – 6.28% | | | | | | | | | | | | |
| Duke Energy Corp. | | | 117,545 | | | | 1,850,158 | | | | 1.34 | % |
| Edison International | | | 68,585 | | | | 2,303,084 | | | | 1.66 | % |
| FPL Group, Inc. | | | 40,250 | | | | 2,223,008 | | | | 1.61 | % |
| MDU Resources Group, Inc. | | | 64,555 | | | | 1,345,972 | | | | 0.97 | % |
| Questar Corp. | | | 25,640 | | | | 963,038 | | | | 0.70 | % |
| | | | | | | | 8,685,260 | | | | 6.28 | % |
| | | | | | | | | | | | | |
Total Common Stocks (Cost $115,488,983) | | | | | | | 138,315,042 | | | | 99.97 | % |
The accompanying notes are an integral part of these financial statements.
SUMMARY OF INVESTMENTS
| SHORT-TERM INVESTMENTS – 0.71% | | Shares/ | | | | | | % of Net | |
| | | Principal Amount | | | Value | | | Assets | |
| Investment Company – 0.71% | | | | | | | | | |
Fidelity Government Portfolio 0.100% (d) | | | 982,290 | | | $ | 982,290 | | | | 0.71 | % |
| | | | | | | | | | | | | |
Total Investment Company (Cost $982,290) | | | | | | | 982,290 | | | | 0.71 | % |
| | | | | | | | | | | | | |
| Variable Rate Demand Notes# – 0.00% | | | | | | | | | | | | |
American Family Financial Services 0.100% | | $ | 3,850 | | | | 3,850 | | | | 0.00 | % |
| | | | | | | | | | | | | |
Total Variable Demand Notes (Cost $3,850) | | | | | | | 3,850 | | | | 0.00 | % |
| | | | | | | | | | | | | |
| Total Short-Term Investments | | | | | | | | | | | | |
| (Cost $986,140) | | | | | | | 986,140 | | | | 0.71 | % |
| | | | | | | | | | | | | |
Total Investments – 100.68% | | | | | | | | | | | | |
| (Cost $116,475,123) | | | | | | | 139,301,182 | | | | 100.68 | % |
| | | | | | | | | | | | | |
| Liabilities in Excess of Other Assets – (0.68)% | | | | | | | (936,224 | ) | | | (0.68 | )% |
TOTAL NET ASSETS – 100.00% | | | | | | $ | 138,364,958 | | | | 100.00 | % |
Percentages are stated as a percent of net assets.
| | (b) | Foreign issued security |
| | (c) | Investment in affiliated security. Quasar Distributors, LLC, which serves as the Fund’s distributor, is a subsidiary of U.S. Bancorp. Details of transactions with this affiliated company for the year ended September 30, 2009 were as follows: |
| | Beginning | Purchase | Sales | Ending | Dividend | | Market |
| Issuer | Cost | Cost | Cost | Cost | Income | Shares | Value |
| U.S. Bancorp | $2,077,698 | $991,928 | $1,753,358 | $1,316,268 | $44,662 | 92,675 | $2,025,876 |
| | (d) | The rate listed is the Fund’s 7-day yield as of September 30, 2009. |
| | # | Variable rate demand notes are considered short-term obligations and are payable on demand. Interest rates change periodically on specified dates. The rates listed are as of September 30, 2009. |
Summary of Fair Value Exposure at September 30, 2009
The Fund has adopted authoritative fair valuation accounting standards which establish an authoritative definition of fair value and set out a hierarchy for measuring fair value. These standards require additional disclosures about the various inputs and valuation techniques used to develop the measurements of fair value and a discussion in changes in valuation techniques and related inputs during the period. These inputs are summarized in the three broad levels listed below.
The Fund has performed an analysis of all existing investments to determine the significance and character of all inputs to their fair value determination.
The accompanying notes are an integral part of these financial statements.
HENNESSY FUNDS 1-800-966-4354
| Level 1 – | Quoted unadjusted prices for identical instruments in active markets to which the Fund has access at the date of measurement. |
| Level 2 – | Quoted prices for similar instruments in active markets; quoted prices for identical or similar instruments in markets that are not active; and model-derived valuations in which all significant inputs and significant value drivers are observable in active markets. Level 2 inputs are those in markets for which there are few transactions, the prices are not current, little public information exists or instances where prices vary substantially over time or among brokered market makers. |
| Level 3 – | Model derived valuations in which one or more significant inputs or significant value drivers are unobservable. Unobservable inputs are those inputs that reflect the Fund’s own assumptions that market participants would use to price the asset or liability based on the best available information. |
The inputs or methodology used for valuing securities are not an indication of the risk associated with investing in those securities.
The following is a summary of the inputs used to value the Fund’s net assets as of September 30, 2009:
| Common Stock | | Level 1 | | | Level 2 | | | Level 3 | | | Total | |
| Consumer Discretionary | | $ | 12,849,255 | | | $ | — | | | $ | — | | | $ | 12,849,255 | |
| Consumer Staples | | | 7,293,538 | | | | — | | | | — | | | | 7,293,538 | |
| Energy | | | 24,868,255 | | | | — | | | | — | | | | 24,868,255 | |
| Financials | | | 33,206,148 | | | | — | | | | — | | | | 33,206,148 | |
| Health Care | | | 14,088,881 | | | | — | | | | — | | | | 14,088,881 | |
| Industrials | | | 14,921,178 | | | | — | | | | — | | | | 14,921,178 | |
| Information Technology | | | 8,139,328 | | | | — | | | | — | | | | 8,139,328 | |
| Materials | | | 6,265,431 | | | | — | | | | — | | | | 6,265,431 | |
| Telecommunication Services | | | 7,997,768 | | | | — | | | | — | | | | 7,997,768 | |
| Utilities | | | 8,685,260 | | | | — | | | | — | | | | 8,685,260 | |
| Total Common Stock | | $ | 138,315,042 | | | $ | — | | | $ | — | | | $ | 138,315,042 | |
| Short-Term Investments | | $ | 982,290 | | | $ | 3,850 | | | $ | — | | | $ | 986,140 | |
| Total Investments in Securities | | $ | 139,297,332 | | | $ | 3,850 | | | $ | — | | | $ | 139,301,182 | |
The accompanying notes are an integral part of these financial statements.
SUMMARY OF INVESTMENTS
(This Page Intentionally Left Blank.)
HENNESSY FUNDS 1-800-966-4354
Financial Statements
Statement of Assets and Liabilities as of September 30, 2009 |
| ASSETS: | | | |
| Investments in unaffiliated securities, at value (cost $115,158,855) | | $ | 137,275,306 | |
| Investments in affiliated securities, at value (cost $1,316,268) | | | 2,025,876 | |
| Cash | | | 7,355 | |
| Dividends and interest receivable | | | 143,628 | |
| Receivable for fund shares sold | | | 1,908 | |
| Receivable for securities sold | | | 2,202,688 | |
| Prepaid expenses and other assets | | | 38,585 | |
| Total Assets | | | 141,695,346 | |
| | | | | |
| LIABILITIES: | | | | |
| Payable for securities purchased | | | 3,079,663 | |
| Payable for fund shares redeemed | | | 32,788 | |
| Payable to Advisor | | | 74,735 | |
| Accrued administration fees | | | 83,229 | |
| Accrued audit fees | | | 15,933 | |
| Accrued legal fees | | | 1,988 | |
| Accrued service fees | | | 11,296 | |
| Accrued sub transfer agent fees | | | 11,431 | |
| Accrued printing and mailing expense | | | 17,049 | |
| Accrued expenses and other payables | | | 2,276 | |
| Total Liabilities | | | 3,330,388 | |
| | | | | |
| NET ASSETS | | $ | 138,364,958 | |
| | | | | |
| NET ASSETS CONSIST OF: | | | | |
| Capital stock | | $ | 179,555,121 | |
| Undistributed net investment income | | | 1,350,367 | |
| Accumulated net realized loss on investments | | | (65,366,589 | ) |
| Unrealized net appreciation on investments | | | 22,826,059 | |
| Total Net Assets | | $ | 138,364,958 | |
| | | | | |
| NET ASSETS | | | | |
| Original Class: | | | | |
| Shares authorized (no par value) | | Unlimited | |
| Net assets applicable to outstanding Original Class shares | | | 138,338,493 | |
| Shares issued and outstanding | | | 7,096,612 | |
| Net asset value, offering price and redemption price per share | | $ | 19.49 | |
| | | | | |
| Institutional Class: | | | | |
| Shares authorized (no par value) | | Unlimited | |
| Net assets applicable to outstanding Institutional Class shares | | | 26,465 | |
| Shares issued and outstanding | | | 1,355 | |
| Net asset value, offering price and redemption price per share | | $ | 19.53 | |
The accompanying notes are an integral part of these financial statements.
FINANCIAL STATEMENTS – STATEMENT OF ASSETS AND LIABILITIES AND STATEMENT OF OPERATIONS
Financial Statements
Statement of Operations Year ended September 30, 2009 |
| INVESTMENT INCOME: | | | |
| Dividend income from unaffiliated securities | | $ | 3,563,526 | |
| Dividend income from affiliated securities | | | 44,662 | |
| Interest income | | | 9,396 | |
| Total investment income | | | 3,617,584 | |
| | | | | |
| EXPENSES: | | | | |
| Investment advisory fees (See Note 4) | | | 1,059,043 | |
| Administration fees (See Note 4) | | | 249,821 | |
| Transfer agent fees | | | 103,324 | |
| Sub-transfer agent expenses (See Note 4) – Original Class | | | 88,011 | |
| Sub-transfer agent expenses (See Note 4) – Institutional Class | | | 2,210 | |
| Sub-transfer agent expenses (See Note 4) – Predecessor Class A | | | 34 | |
| Sub-transfer agent expenses (See Note 4) – Predecessor Class C | | | 2 | |
| Sub-transfer agent expenses (See Note 4) – Predecessor Class S | | | 17,112 | |
| Service fees (See Note 4) – Original Class | | | 65,975 | |
| Distribution fees (See Note 4) – Predecessor Class A | | | 576 | |
| Distribution fees (See Note 4) – Predecessor Class C | | | 86 | |
| Distribution fees (See Note 4) – Predecessor Class R | | | 6 | |
| Printing and mailing expense | | | 57,719 | |
| Federal and state registration fees | | | 44,034 | |
| Legal fees | | | 36,032 | |
| Audit fees | | | 22,566 | |
| Fund accounting fees | | | 15,421 | |
| Directors’ fees and expenses | | | 6,723 | |
| Custody fees | | | 6,529 | |
| Other | | | 12,165 | |
| Total expenses before waiver/reimbursement | | | 1,787,389 | |
| Expense waiver/reimbursement by: | | | | |
| Advisor (See Note 4) | | | (317,174 | ) |
| Distributor (See Note 4) | | | (288 | ) |
| Net expenses | | | 1,469,927 | |
| NET INVESTMENT INCOME | | $ | 2,147,657 | |
| | | | | |
| REALIZED AND UNREALIZED GAINS (LOSSES): | | | | |
| Net realized loss on: | | | | |
| Unaffiliated investments | | $ | (37,480,133 | ) |
| Affiliated investments | | | (553,489 | ) |
| Change in unrealized appreciation on investments | | | 17,930,480 | |
| Net loss on investments | | | (20,103,142 | ) |
| | | | | |
| NET DECREASE IN NET ASSETS RESULTING FROM OPERATIONS | | $ | (17,955,485 | ) |
The accompanying notes are an integral part of these financial statements.
HENNESSY FUNDS 1-800-966-4354
Financial Statements
| Statement of Changes in Net Assets |
| | | Year Ended | | | Year Ended | |
| | | September 30, | | | September 30, | |
| | | 2009 | | | 2008 | |
| OPERATIONS: | | | | | | |
| Net investment income | | $ | 2,147,657 | | | $ | 3,227,881 | |
| Net realized loss on securities | | | (38,033,622 | ) | | | (23,643,916 | ) |
| Change in unrealized appreciation on securities | | | 17,930,480 | | | | (34,396,957 | ) |
| Net decrease in net assets resulting from operations | | | (17,955,485 | ) | | | (54,812,992 | ) |
| | | | | | | | | |
| DISTRIBUTIONS TO SHAREHOLDERS FROM: | | | | | | | | |
| Net investment income – Class A | | | (2,447 | ) | | | (7,765 | ) |
| Net investment income – Class C | | | (250 | ) | | | (142 | ) |
| Net investment income – Class R | | | (47 | ) | | | (61 | ) |
| Net investment income – Class S | | | (3,119,888 | ) | | | (4,736,449 | ) |
| Net realized gains – Class A | | | — | | | | (157,564 | ) |
| Net realized gains – Class C | | | — | | | | (6,277 | ) |
| Net realized gains – Class R | | | — | | | | (1,434 | ) |
| Net realized gains – Class S | | | — | | | | (81,783,401 | ) |
| Total distributions | | | (3,122,632 | ) | | | (86,693,093 | ) |
| | | | | | | | | |
| CAPITAL SHARE TRANSACTIONS: | | | | | | | | |
| Proceeds from shares issued in the | | | | | | | | |
| reorganization – Original Class (See Note 6) | | | 106,344,111 | | | | | |
| Proceeds from shares subscribed – Original Class | | | 913,870 | | | | — | |
| Proceeds from shares subscribed – Institutional Class | | | 22,275 | | | | — | |
| Proceeds from shares subscribed – Predecessor Class A | | | 4,294 | | | | 371,029 | |
| Proceeds from shares subscribed – Predecessor Class C | | | 300 | | | | 11,100 | |
| Proceeds from shares subscribed – Predecessor Class R | | | — | | | | — | |
| Proceeds from shares subscribed – Predecessor Class S | | | 1,105,178 | | | | 3,663,742 | |
| Dividends reinvested – Predecessor Class A | | | 2,160 | | | | 108,540 | |
| Dividends reinvested – Predecessor Class C | | | 250 | | | | 6,411 | |
| Dividends reinvested – Predecessor Class R | | | 47 | | | | 1,487 | |
| Dividends reinvested – Predecessor Class S | | | 2,990,948 | | | | 82,713,848 | |
| Cost of shares redeemed – Original Class | | | (7,303,823 | ) | | | — | |
| Cost of shares redeemed – Predecessor Class A | | | (206,038 | ) | | | (205,995 | ) |
| Cost of shares redeemed – Predecessor Class C | | | (2,369 | ) | | | (263 | ) |
| Cost of shares redeemed – Predecessor Class R | | | (2,172 | ) | | | (13 | ) |
| Cost of shares redeemed – Predecessor Class S | | | (12,805,550 | ) | | | (40,339,761 | ) |
| Cost of shares redeemed in the reorganization – Predecessor Class A | | | (130,787 | ) | | | — | |
| Cost of shares redeemed in the reorganization – Predecessor Class C | | | (14,058 | ) | | | — | |
| Cost of shares redeemed in the reorganization – Predecessor Class S | | | (106,199,266 | ) | | | — | |
| Net increase (decrease) in net assets | | | | | | | | |
| derived from capital share transactions | | | (15,280,630 | ) | | | 46,330,125 | |
| TOTAL DECREASE IN NET ASSETS | | | (36,358,747 | ) | | | (95,175,960 | ) |
| | | | | | | | | |
| NET ASSETS: | | | | | | | | |
| Beginning of year | | | 174,723,705 | | | | 269,899,665 | |
| End of year | | $ | 138,364,958 | | | $ | 174,723,705 | |
| Accumulated net investment income, end of year | | $ | 1,350,367 | | | $ | 2,270,488 | |
The accompanying notes are an integral part of these financial statements.
FINANCIAL STATEMENTS – STATEMENT OF CHANGES IN NET ASSETS
Financial Statements
| Statement of Changes in Net Assets (Continued) |
| | | Year Ended | | | Year Ended | |
| | | September 30, | | | September 30, | |
| | | 2009 | | | 2008 | |
| CHANGES IN SHARES OUTSTANDING: | | | | | | |
| Shares issued in connection with reorganization | | | 7,462,745 | | | | — | |
| Shares sold | | | | | | | | |
| Original Class | | | 56,201 | | | | — | |
| Institutional Class | | | 1,355 | | | | — | |
| Predecessor Class A | | | 272 | | | | 14,127 | |
| Predecessor Class C | | | 20 | | | | 436 | |
| Predecessor Class R | | | — | | | | — | |
| Predecessor Class S | | | 68,408 | | | | 133,042 | |
| Shares issued to holders as reinvestment of dividends | | | | | | | | |
| Predecessor Class A | | | 134 | | | | 4,035 | |
| Predecessor Class C | | | 16 | | | | 241 | |
| Predecessor Class R | | | 3 | | | | 56 | |
| Predecessor Class S | | | 187,051 | | | | 3,074,865 | |
| Shares redeemed | | | | | | | | |
| Original Class | | | (422,334 | ) | | | — | |
| Predecessor Class A | | | (12,588 | ) | | | (8,629 | ) |
| Predecessor Class C | | | (176 | ) | | | (7 | ) |
| Predecessor Class R | | | (164 | ) | | | (1 | ) |
| Predecessor Class S | | | (796,220 | ) | | | (1,460,879 | ) |
| Shares redeemed in the reorganization – Predecessor Class A | | | (9,127 | ) | | | — | |
| Shares redeemed in the reorganization – Predecessor Class C | | | (1,000 | ) | | | — | |
| Shares redeemed in the reorganization – Predecessor Class S | | | (7,452,580 | ) | | | — | |
| Net increase (decrease) in shares outstanding | | | (917,984 | ) | | | 1,757,286 | |
The accompanying notes are an integral part of these financial statements.
HENNESSY FUNDS 1-800-966-4354
Financial Highlights
| Hennessy Select Large Value Fund |
| | | Year Ended | | | Period Ended | |
| | | September 30, | | | September 30, | |
| | | 2009 | | | 2009 | |
| | | Original | | | Institutional | |
| | | Class(1) | | | Class(2) | |
| PER SHARE DATA: | | | | | | |
| Net asset value, beginning of period | | $ | 21.80 | | | $ | 14.25 | |
| | | | | | | | | |
| Income from investment operations: | | | | | | | | |
| Net investment income | | | 0.31 | | | | 0.08 | |
| Net realized and unrealized gains (losses) on securities | | | (2.21 | ) | | | 5.20 | |
| Total from investment operations | | | (1.90 | ) | | | 5.28 | |
| | | | | | | | | |
| Less Distributions: | | | | | | | | |
| Dividends from net investment income | | | (0.41 | ) | | | — | |
| Dividends from net realized gains | | | — | | | | — | |
| Total distributions | | | (0.41 | ) | | | — | |
Redemption fees retained(4) | | | — | | | | — | |
| Net asset value, end of period | | $ | 19.49 | | | $ | 19.53 | |
| | | | | | | | | |
| TOTAL RETURN | | | (8.43)% | | | | 37.05% | (5) |
| | | | | | | | | |
| SUPPLEMENTAL DATA AND RATIOS: | | | | | | | | |
| Net assets, end of period (millions) | | $ | 138.34 | | | $ | 0.03 | |
| Ratio of expenses to average net assets: | | | | | | | | |
| Before expense reimbursement | | | 1.42% | | | | 26.18% | (6) |
| After expense reimbursement | | | 1.17% | | | | 0.98% | (6) |
| Ratio of net investment income to average net assets | | | | | | | | |
| Before expense reimbursement | | | 1.46% | | | | (24.06)% | (6) |
| After expense reimbursement | | | 1.71% | | | | 1.14% | (6) |
| Portfolio turnover rate | | | 142% | | | | 142% | |
| (1) | The financial highlights set forth for periods prior to March 20, 2009 represent the historical financial highlights of the Tamarack Value Fund, Class S shares. The assets of the Tamarack Value Fund were acquired by the Hennessy Select Value Fund on March 20, 2009. Prior to the reorganization, Tamarack Value Fund also offered Class A, C and R shares. At that time Voyageur Asset Management Inc. ceased to be investment advisor and Hennessy Advisors, Inc. became investment advisor. The return of the Tamarack Value Fund, Class S shares during the period October 1, 2008 through March 20, 2009 was (33.09)%. The return of the Hennessy Select Large Value Fund, Original Class shares during the period March 20, 2009 through September 30, 2009 was 36.84%. |
| (2) | Institutional Class shares commenced operations on March 20, 2009. |
| (3) | Per share net investment income (loss) has been calculated using the average daily shares method. |
| (4) | Amount is less than $0.01 per share. |
The accompanying notes are an integral part of these financial statements.
FINANCIAL HIGHLIGHTS
| Year Ended September 30, | |
| | | 2008 | | | 2007 | | | 2006 | | | 2005 | |
| Original Class(1) | |
| | | | | | | | | | | | | |
| | | $ | 43.12 | | | $ | 41.74 | | | $ | 45.78 | | | $ | 45.05 | |
| | | | | | | | | | | | | | | | | |
| | | | | | | | | | | | | | | | | |
| | | | 0.42 | (3) | | | 0.58 | (3) | | | 0.55 | (3) | | | 0.74 | |
| | | | (7.43 | ) | | | 5.04 | | | | 3.07 | | | | 4.35 | |
| | | | (7.01 | ) | | | 5.62 | | | | 3.62 | | | | 5.09 | |
| | | | | | | | | | | | | | | | | |
| | | | | | | | | | | | | | | | | |
| | | | (0.78 | ) | | | (0.63 | ) | | | (0.61 | ) | | | (0.46 | ) |
| | | | (13.53 | ) | | | (3.61 | ) | | | (7.05 | ) | | | (3.90 | ) |
| | | | (14.31 | ) | | | (4.24 | ) | | | (7.66 | ) | | | (4.36 | ) |
| | | | — | | | | — | | | | — | | | | — | |
| | | $ | 21.80 | | | $ | 43.12 | | | $ | 41.74 | | | $ | 45.78 | |
| | | | | | | | | | | | | | | | | |
| | | | (22.42)% | | | | 14.19% | | | | 9.10% | | | | 11.42% | |
| | | | | | | | | | | | | | | | | |
| | | | | | | | | | | | | | | | | |
| | | $ | 174.23 | | | $ | 269.37 | | | $ | 291.66 | | | $ | 366.95 | |
| | | | | | | | | | | | | | | | | |
| | | | 1.22% | | | | 1.26% | | | | 1.22% | | | | 1.25% | |
| | | | 1.02% | | | | 1.03% | | | | 1.05% | | | | 1.01% | |
| | | | | | | | | | | | | | | | | |
| | | | 1.32% | | | | 1.13% | | | | 1.16% | | | | 1.28% | |
| | | | 1.52% | | | | 1.36% | | | | 1.33% | | | | 1.52% | |
| | | | 162% | | | | 136% | | | | 38% | | | | 35% | |
HENNESSY FUNDS 1-800-966-4354
Notes to the Financial Statements
September 30, 2009
The Hennessy Select Large Value Fund (the “Fund”, formerly known as the Tamarack Value Fund) is organized as a separate investment portfolio or series of Hennessy Funds Trust (the “Trust”), a Delaware statutory trust that was organized on September 17, 1992. Prior to July 1, 2005, the Trust was known as “The Henlopen Fund”. The Trust is an open-end, management investment company registered under the Investment Company Act of 1940, as amended. The Fund is a diversified portfolio.
The Fund is the successor to the Tamarack Value Fund (the “Predecessor Fund”) pursuant to a reorganization that took place on March 20, 2009 (See Note 6). As a result of the reorganization, holders of the Class A, Class C, Class R and Class S shares of the Tamarack Value Fund received Original Class shares of the Hennessy Select Large Value Fund.
The Fund offers Original and Institutional Class shares. Each class of shares differs principally in its respective administration and transfer agent expenses and sales charges, if any. Each class has identical rights to earnings, assets and voting privileges, except for class-specific expenses and exclusive rights to vote on matters affecting only individual classes.
| 2). | SIGNIFICANT ACCOUNTING POLICIES |
The following is a summary of significant accounting policies consistently followed by the Fund in the preparation of the financial statements. These policies are in conformity with U.S. generally accepted accounting principles (“GAAP”).
| | a). | Investment Valuation – Securities which are traded on a national or recognized stock exchange are valued at the last sale price on the securities exchange on which such securities are primarily traded. Exchange-traded securities for which there were no transactions that day and debt securities are valued at the most recent bid prices. Instruments with a remaining maturity of 60 days or less are valued on an amortized cost basis. When a price for an underlying security is not readily available or if a significant event has occurred that indicates the closing price of a security no longer represents the true value of that security, fair value pricing procedures have been adopted by the Board of Trustees of the Fund. Fair value pricing determinations are made in good faith in accordance with these procedures. There are numerous criteria that will be given consideration in determining a fair value of a security. Some of these criteria are: trading volume of security and markets, value of other like securities and news events with direct bearing to security or market. Fair value pricing results in an estimated price that reasonably reflects the current market conditions in order to rate the portfolio holdings such that shareholder transactions receive a fair net asset value. |
NOTES TO THE FINANCIAL STATEMENTS
| | b). | Federal Income Taxes – Provision for federal income taxes or excise taxes has not been made since the Fund has elected to be taxed as a “regulated investment company” and intends to distribute substantially all taxable income to shareholders and otherwise comply with the provisions of the Internal Revenue Code applicable to regulated investment companies. Net investment income and realized gains and losses for federal income tax purposes may differ from that reported on the financial statements because of temporary book and tax basis differences. Temporary differences are primarily the result of the treatment of wash sales for tax reporting purposes. Distributions from net realized gains for book purposes may include short-term capital gains, which are included as ordinary income to shareholders for tax purposes. |
| | | Due to inherent differences in the recognition of income, expenses, and realized gains/losses under U.S. generally accepted accounting principles and federal income tax purposes, permanent differences between book and tax basis reporting for the 2009 fiscal year have been identified and appropriately reclassified on the Statement of Assets and Liabilities. |
| Undistributed Net | Accumulated Net | Paid In |
| Investment Income/(Loss) | Realized Gain/(Loss) | Capital |
| 54,854 | (27,827) | (27,027) |
| | The permanent differences primarily relate to Foreign Currency reclasses and REITs. |
| | c). | Income and Expenses – Dividend income is recognized on the ex-dividend date or as soon as information is available to the Fund and interest income is recognized on an accrual basis. Income, expenses (other than expenses attributable to a specific class), and realized and unrealized gains or losses on investments are allocated to each class of shares based on its respective net assets. |
| | d). | Distributions to Shareholders – Dividends from net investment income and distributions of net realized capital gains for the Fund, if any, are declared and paid out annually, usually in November or December of each year. |
| | e). | Security Transactions – Investment and shareholder transactions are recorded on the trade date. The Fund determines the gain or loss realized from the investment transactions by comparing the original cost of the security lot sold with the net sale proceeds. Discounts and premiums on securities purchased are accreted/amortized over the life of the respective security. |
| | f). | Use of Estimates – The preparation of financial statements in conformity with GAAP requires management to make estimates and assumptions that affect the reported amounts of assets and liabilities and disclosure of contingent assets and liabilities at the date of the financial statements and the reported change in net assets during the reporting period. Actual results could differ from those estimates. |
| | g). | Share Valuation – The net asset value (“NAV”) per share of the Fund is calculated by dividing the sum of the value of the securities held, plus cash or other assets, minus all liabilities (including estimated accrued expenses) by the total number of shares outstanding, rounded to the nearest cent. The Fund’s shares will not be priced on the days on which the NYSE is closed for |
HENNESSY FUNDS 1-800-966-4354
| | | trading. The offering and redemption price per share for the Fund is equal to the Fund’s net asset value per share. |
| | h). | Repurchase Agreements – The Fund may enter into repurchase agreements with member banks or security dealers of the Federal Reserve whom the investment advisor deems creditworthy. The repurchase price generally equals the price paid by the Fund plus interest negotiated on the basis of current short-term rates. |
| | | Securities pledged as collateral for repurchase agreements are held by the custodian bank until the respective agreements mature. Provisions of the repurchase agreements ensure that the market value of the collateral, including accrued interest thereon, is sufficient, in the event of default of the counterparty. If the counterparty defaults and the value of the collateral declines or if the counterparty enters an insolvency proceeding, realization of the collateral by the Fund may be delayed or limited. |
| | i). | Accounting for Uncertainty in Income Taxes – The Fund has adopted accounting policies regarding recognition and measurement of tax positions taken or expected to be taken on a tax return. The Fund has reviewed all open tax years and major jurisdictions and concluded that there is no impact on the Fund’s net assets and no tax liability resulting from unrecognized tax benefits relating to uncertain income tax positions taken or expected to be taken on a tax return. As of September 30, 2009, open Federal and State tax years include the tax year ended September 30, 2006 through 2009. |
| | j). | Events Subsequent to the Fiscal Period End – The Fund has adopted financial reporting rules regarding subsequent events which requires an entity to recognize in the financial statements the effects of all subsequent events that provide additional evidence about conditions that existed at the date of the balance sheet. In addition, an entity is required to disclose the date through which subsequent events have been evaluated. Management has evaluated the Fund’s related events and transactions that occurred subsequent to September 30, 2009, through November 27, 2009, the date of issuance of the Fund’s financial statements. There were no events or transactions that occurred during this period that materially impacted the amounts or disclosures in the Fund’s financial statements |
| 3). | INVESTMENT TRANSACTIONS |
Purchases and sales of investment securities (excluding government and short-term investments) during the year ended September 30, 2009 were $170,697,264 and $182,979,545, respectively. There were no purchases or sales of long term U.S Government securities during the year ended September 30, 2009.
| 4). | INVESTMENT MANAGEMENT FEE AND OTHER TRANSACTIONS WITH AFFILIATES |
Hennessy Advisors, Inc. (the “Advisor”) is the Advisor of the Fund. The Advisor provides the Fund with investment management services under an Investment Advisory Agreement. The Advisor furnishes all investment advice, office space, facilities, and provides most of the personnel needed by the Fund. As compensation for its services, the Advisor is entitled to a monthly fee from the Fund. The fee is based upon the average daily net assets of the Fund at the annual rate of 0.85%. The Advisor has delegated the day to day management of
NOTES TO THE FINANCIAL STATEMENTS
the Fund to a Sub-Advisor, Voyageur Asset Management, Inc. (the “Sub-Advisor”). The Advisor pays Sub-Advisory fees from its own assets and these fees are not an additional expense of the Fund.
Prior to March 20, 2009, Voyageur Asset Management, Inc. (“Voyageur”) acted as the investment advisor for the Predecessor Fund. The Predecessor Fund entered an agreement with Voyageur whereby they furnished related office facilities, equipment, research and personnel. The agreement required the Predecessor Fund to pay Voyageur a monthly fee of 0.85% based upon average daily net assets.
Hennessy Advisors, Inc. has agreed to waive its fees and absorb expenses to the extent that the total annual operating expenses (excluding all federal, state and local taxes, interest, brokerage commissions, acquired fund fees and expenses and other costs incurred in connection with the purchase and sale of securities and extraordinary items) do not exceed 1.30% and 0.98% of the Fund’s net assets for the Original Class and Institutional Class shares, respectively. The expense limitation agreement for the Original Class shares is in place until March 31, 2010. The expense limitation agreement for the Institutional Class shares can only be terminated by the Board of Trustees. Voyageur had contractually agreed to waive fees/or make payments in order to keep total operating expenses of the Predecessor Fund, Class S at 1.03%. This limitation was in place from February 1, 2008 until January 31, 2009. For a period of three years after the year in which the Advisor waives or reimburses expenses, the Advisor may seek reimbursement from the Fund to the extent that total annual Fund operating expenses are less than the expense limitation in effect at the time of the waiver or reimbursement. The Advisor waived or reimbursed expenses of $93,300 for the Fund for the period March 20, 2009 through September 30, 2009. Cumulative expenses subject to potential recovery to the aforementioned conditions and year of expiration are as follows:
| | | 2012 | |
| Original Class | | $ | 91,061 | |
| Institutional Class | | $ | 2,239 | |
The Board of Trustees has approved a Shareholder Servicing Plan for the Original Class shares (but not the Institutional Class shares) of the Fund which was instituted to compensate the Advisor for the non-investment management services it provides to the Funds. The Plan provides for a monthly fee paid to the Advisor at an annual rate of 0.10% of the average daily net assets of the Fund. There was no Shareholder Servicing Plan for the shares of the Predecessor Fund.
The Fund and Predecessor Fund entered into agreements with various brokers, dealers and financial intermediaries in connection with the sale of shares of the Fund. The agreements provide for periodic payments by the Fund to the brokers, dealers and financial intermediaries for providing certain shareholder maintenance services (sub-transfer agent expenses). These shareholder services include: the pre-processing and quality control of new accounts, shareholder correspondence, answering customer inquiries regarding account status and facilitating shareholder telephone transactions. Fees paid by
HENNESSY FUNDS 1-800-966-4354
the Fund and Predecessor Fund to various brokers, dealers and financial intermediaries for the year ended September 30, 2009, were $107,369.
The Fund has not adopted a 12b-1 Plan. The Predecessor Fund had adopted a Master Distribution 12b-1 Plan (the “Plan”) in which Tamarack Distributors Inc. (the “Distributor”) acted as the Fund’s distributor. The Distributor is an affiliate of Voyageur. The Plan permitted the Predecessor Fund to make payments for or reimburse the Distributor monthly for distribution-related costs and expenses of marketing shares of each share class covered under the Plan; and/or for providing shareholder services. The following chart shows the most recent Plan fee rate for each class of the Predecessor Fund.
| | Class A | Class I | Class C | Class R | Class S |
| 12b-1 Plan Fee | 0.25%* | 0.00% | 1.00% | 0.50% | 0.00% |
| | * | The maximum Plan fee rate for Class A shares is 0.50%. The Distributor contractually waived 0.25% of the total 0.50% Plan fee for Class A. |
Plan fees are based on average daily net assets of the applicable class. Up to 0.25% of each Plan fee may have been designated as a Service Fee, as defined by the applicable rules of the Financial Industry Regulatory Authority. The Distributor, subject to applicable legal requirements, may have waived a Plan fee voluntarily, in whole or in part.
For the period ended March 20, 2009, the Distributor received commissions of $27 from front-end sales charges of Class A shares of the Predecessor Fund, all of which was paid to affiliated broker-dealers. The Distributor also received $3 from CDSC fees from Class C shares of the Predecessor Fund. The Distributor received no CDSC fees from Class A shares of the Predecessor Fund during the period ended March 20, 2009 after which Class A and Class C shares were no longer offered for sale.
Effective March 20, 2009 U.S. Bancorp Fund Services, LLC (the “Administrator”) acts as the Fund’s Administrator under an Administration Agreement. The Administrator prepares various federal and state regulatory filings, reports and returns for the Fund; prepares reports and materials to be supplied to the directors; monitors the activities of the Fund’s custodian, transfer agent and accountants; coordinates the preparation and payment of the Fund’s expenses and reviews the Fund’s expense accruals. The administration fees are calculated daily and paid monthly, equal to each fund’s pro rata share of the aggregate average daily net assets of all open-end mutual funds in the Hennessy family of funds. Fees paid to U.S. Bancorp Fund Services, LLC for the period March 20, 2009 through September 30, 2009, were $167,841.
Prior to March 20, 2009 Voyageur and PNC Global Investment Servicing (U.S.) Inc. (“PNC”) served as co-administrators of the Predecessor Fund. Services provided under the administrative services contract included providing day-to-day administration of matters related to the Predecessor Fund, maintenance of its records and the preparation of reports. Under the terms of the administrative services contract, Voyageur received a fee, payable monthly, at the annual rate of 0.075% of the Predecessor Fund’s average daily net assets. PNC received a fee for its services payable by the Predecessor Fund based on the Predecessor Fund’s average net assets. Voyageur’s fee is included in
NOTES TO THE FINANCIAL STATEMENTS
“Administration fees” in the Statement of Operations. PNC’s fee is included with “Fund Accounting fees” in the Statement of Operations.
Quasar Distributors, LLC (“Quasar”) acts as the Fund’s principal underwriter in a continuous public offering of the Fund’s shares. Quasar is an affiliated company of U.S. Bank, N.A.
| 5). | FEDERAL TAX INFORMATION |
The following balances for the Fund are as of September 30, 2009, the Fund’s most recent fiscal year end:
| Cost of Investments for tax purposes | | $ | 117,217,479 | |
| Gross tax unrealized appreciation | | | 28,204,686 | |
| Gross tax unrealized depreciation | | | (6,120,983 | ) |
| Net tax unrealized appreciation (depreciation) on investments | | $ | 22,083,703 | |
| Undistributed ordinary income | | | 1,350,567 | |
| Undistributed long-term capital gains | | $ | — | |
| Total Distributable earnings | | $ | 1,350,567 | |
| Other accumulated gains (losses) | | | (64,624,433 | ) |
| Total accumulated earnings (losses) | | $ | (41,190,163 | ) |
At September 30, 2009, the Fund had tax basis capital losses of $31,599,923, to offset future capital gains, the use of a portion of which is limited by IRS regulations. Such losses expire September 30, 2017. Additionally, the Fund had $33,024,510 of post-October loss deferrals as of September 30, 2009.
The tax character of distributions paid during 2009 and 2008 for the Fund was as follows:
| | | Year Ended | | | Year Ended | |
| | | September 30, 2009 | | | September 30, 2008 | |
| Distributions paid from: | | | | | | |
| Ordinary income | | $ | 3,122,632 | | | $ | 11,195,735 | |
| Long-term capital gain | | | — | | | | 75,497,358 | |
| | | $ | 3,122,632 | | | $ | 86,693,093 | |
On March 20, 2009 the shareholders of the Tamarack Value Fund approved the agreement and plan of reorganization providing for the transfer of assets of the Tamarack Value Fund to the Hennessy Select Value Fund and the assumption of the liabilities of the Tamarack Value Fund by the Hennessy Select Value Fund. The following table illustrates the specifics of the reorganization:
| Acquired | Shares issued to | Acquiring | | |
| Fund | Shareholders of | Fund | Combined | Tax Status |
| Net Assets | Acquired Fund | Net Assets | Net Assets | of Transfer |
$106,344,111(1) | 7,462,745 | — | $106,344,111 | Non-taxable |
| | (1) | Includes accumulated realized losses and unrealized depreciation in the amounts of ($22,268,596) and ($20,869,681) respectively. |
HENNESSY FUNDS 1-800-966-4354
Report of Independent Registered Public Accounting Firm
The Shareholders and Board of Trustees of
The Hennessy Funds Trust:
We have audited the accompanying statement of assets and liabilities of Hennessy Select Large Value Fund, formerly known as the Tamarack Value Fund, (a series of The Hennessy Funds Trust), including the schedule of investments, as of September 30, 2009, and the related statements of operations, changes in net assets and the financial highlights for the year then ended. These financial statements and financial highlights are the responsibility of management. Our responsibility is to express an opinion on these financial statements and financial highlights based on our audit. The statement of changes in net assets and financial highlights for the periods presented through September 30, 2008, were audited by other auditors whose report dated November 26, 2008, expressed an unqualified opinion on that statement and those financial highlights.
We conducted our audit in accordance with the standards of the Public Company Accounting Oversight Board (United States). Those standards require that we plan and perform the audit to obtain reasonable assurance about whether the financial statements and financial highlights are free of material misstatement. An audit includes examining, on a test basis, evidence supporting the amounts and disclosures in the financial statements. Our procedures included confirmation of securities owned as of September 30, 2009, by correspondence with the custodian and brokers or by other appropriate auditing procedures. An audit also includes assessing the accounting principles used and significant estimates made by management, as well as evaluating the overall financial statement presentation. We believe that our audit provides a reasonable basis for our opinion.
In our opinion, the financial statements and financial highlights referred to above present fairly, in all material respects, the financial position of Hennessy Select Large Value Fund as of September 30, 2009, and the results of its operations, the changes in its net assets and the financial highlights for the year then ended, in conformity with U.S. generally accepted accounting principles.
Milwaukee, Wisconsin
November 27, 2009
REPORT OF INDEPENDENT REGISTERED PUBLIC ACCOUNTING FIRM
(This Page Intentionally Left Blank.)
HENNESSY FUNDS 1-800-966-4354
Directors and Officers of the Fund
| | Position(s) | Term of Office |
| | Held with | and Length of |
| Name, Age and Address | the Companies | Time Served |
| “Disinterested Persons” | | |
| J. Dennis DeSousa | Director/Trustee | Indefinite, until |
| Age: 72 | | successor elected |
| Address: | | |
| c/o Hennessy Advisors, Inc. | | Served since July 2005 |
| 7250 Redwood Blvd. | | |
| Suite 200 | | |
| Novato, CA 94945 | | |
| | | |
| Robert T. Doyle | Director/Trustee | Indefinite, until |
| Age: 61 | | successor elected |
| Address: | | |
| c/o Hennessy Advisors, Inc. | | Served since July 2005 |
| 7250 Redwood Blvd. | | |
| Suite 200 | | |
| Novato, CA 94945 | | |
| | | |
| Gerald P. Richardson | Director/Trustee | Indefinite, until |
| Age: 62 | | successor elected |
| Address: | | |
| c/o Hennessy Advisors, Inc. | | Served since July 2005 |
| 7250 Redwood Blvd. | | |
| Suite 200 | | |
| Novato, CA 94945 | | |
| | | |
| “Interested Persons” (as defined in the 1940 Act) |
Neil J. Hennessy(1) | Director/Trustee | Director/Trustee: |
| Age: 53 | and Chairman | Indefinite, until |
| Address: | of the Board | successor elected |
| c/o Hennessy Advisors, Inc. | | |
| 7250 Redwood Blvd. | | Served since July 2005 |
| Suite 200 | | |
| Novato, CA 94945 | | |
| | | |
| | | |
| | | Officer (Chairman of the Board): |
| | | 1 year term |
| | | |
| | | Served since June 2008 |
DIRECTORS AND OFFICERS OF THE FUND
| | Number of Portfolios in the | |
| Principal Occupation(s) | Fund Complex Overseen | Other Directorships |
| During Past 5 Years | by Director/Trustee | Held by Director |
| | | |
| Currently a real estate investor. | 10 | None. |
| | | |
| | | |
| | | |
| | | |
| | | |
| | | |
| | | |
| Currently the Sheriff of Marin County, | 10 | None. |
| California (since 1996) and has been | | |
| employed in the Marin County Sheriff’s | | |
| Office in various capacities since 1969. | | |
| | | |
| | | |
| | | |
| | | |
| Formerly the Chief Executive Officer and | 10 | None. |
| owner of ORBIS Payment Services. | | |
| Mr. Richardson is now an independent | | |
| consultant in the securities industries. | | |
| | | |
| | | |
| | | |
| | | |
| | | |
| President, Chairman, CEO and Co-Portfolio | 10 | Director of Hennessy |
| Manager of Hennessy Advisors, Inc., the | | Advisors, Inc. |
| Hennessy Funds’ investment advisor, since | | |
| 1989; President of HMFI and HFI from 1996 | | |
| through June 2008, and President of HFT | | |
| from 2005 through June 2008. | | |
HENNESSY FUNDS 1-800-966-4354
| | Position(s) | Term of Office |
| | Held with | and Length of |
| Name, Age and Address | the Companies | Time Served |
Kevin A. Rowell(1) | President | 1 year term |
| Age: 49 | | |
| Address: | | Since June 2008 |
| c/o Hennessy Advisors, Inc. | | |
| 7250 Redwood Blvd. | | |
| Suite 200 | | |
| Novato, CA 94945 | | |
| | | |
Frank Ingarra, Jr.(1) | Co-Portfolio | 1 year term |
| Age: 38 | Manager and | |
| Address: | Vice President | Since July 2005 |
| c/o Hennessy Advisors, Inc. | | |
| 7250 Redwood Blvd. | | |
| Suite 200 | | |
| Novato, CA 94945 | | |
| | | |
Harry F. Thomas(1) | Vice President, | 1 year term |
| Age: 62 | Chief Compliance | |
| Address: | Officer | Since July 2005 |
| c/o Hennessy Advisors, Inc. | | |
| 7250 Redwood Blvd. | | |
| Suite 200 | | |
| Novato, CA 94945 | | |
| | | |
Teresa M. Nilsen(1) | Executive Vice | 1 year term |
| Age: 43 | President and | |
| Address: | Treasurer | Since July 2005 |
| c/o Hennessy Advisors, Inc. | | |
| 7250 Redwood Blvd. | | |
| Suite 200 | | |
| Novato, CA 94945 | | |
| | | |
| | | |
| | | |
Daniel B. Steadman(1) | Executive Vice | 1 year term |
| Age: 53 | President and | |
| Address: | Secretary | Since July 2005 |
| c/o Hennessy Advisors, Inc. | | |
| 7250 Redwood Blvd. | | |
| Suite 200 | | |
| Novato, CA 94945 | | |
DIRECTORS AND OFFICERS OF THE FUND
| | Number of Portfolios in the | |
| Principal Occupation(s) | Fund Complex Overseen | Other Directorships |
| During Past 5 Years | by Director/Trustee | Held by Director |
| Mr. Rowell was President of Pioneer Funds | N/A | None. |
| Distributor from January 2006 to July 2007; | | |
| from April 2004 through November 2005, | | |
| Mr. Rowell was Executive Vice President at | | |
| Charles Schwab & Co., Inc.; and from | | |
| September 2002 through April 2004 was | | |
| President SAFECO Mutual Funds. | | |
| | | |
| Mr. Ingarra Co-Portfolio Manager for | N/A | None. |
| Hennessy Advisors, Inc., the Funds’ | | |
| investment advisor. Mr. Ingarra has been | | |
| with the Hennessy Funds and Hennessy | | |
| Advisors, Inc. since 2004. He is Vice | | |
| President of the Hennessy Funds. | | |
| | | |
| | | |
| Vice President, Chief Compliance Officer | N/A | None. |
| for Hennessy Advisors, Inc., the Funds’ | | |
| investment advisor, since 2004; retired | | |
| business executive from 2001 through | | |
| 2004; and director of The Hennessy | | |
| Funds from 2000 to May 2004. | | |
| | | |
| | | |
| Currently Executive Vice President, Chief | N/A | Director of Hennessy |
| Financial Officer and Secretary of Hennessy | | Advisors, Inc. |
| Advisors, Inc., the Funds’ investment advisor; | | |
| Ms. Nilsen has been the corporate secretary | | |
| and a financial officer of Hennessy Advisors, | | |
| Inc. since 1989; Ms. Nilsen has been an | | |
| officer of The Hennessy Funds since 1996, | | |
| currently she is Executive Vice President | | |
| and Treasurer. | | |
| | | |
| Executive Vice President of Hennessy | N/A | Director of Hennessy |
| Advisors, Inc., the Funds’ investment advisor, | | Advisors, Inc. |
| from 2000 to the present; Mr. Steadman has | | |
| been Executive Vice President and Secretary | | |
| of The Hennessy Funds since 2000. | | |
HENNESSY FUNDS 1-800-966-4354
| | Position(s) | Term of Office |
| | Held with | and Length of |
| Name, Age and Address | the Companies | Time Served |
Tania A. Kelley(1) | Vice President | 1 year term |
| Age: 44 | of Marketing | |
| Address: | | Since July 2005 |
| c/o Hennessy Advisors, Inc. | | |
| 7250 Redwood Blvd. | | |
| Suite 200 | | |
| Novato, CA 94945 | | |
| | | |
Ana Miner(1) | Vice President | 1 year term |
| Age: 51 | of Operations | |
| Address: | | Since July 2005 |
| c/o Hennessy Advisors, Inc. | | |
| 7250 Redwood Blvd. | | |
| Suite 200 | | |
| Novato, CA 94945 | | |
| | | |
Brian Peery(1) | Vice President | 1 year term |
| Age: 40 | of Sales | |
| Address: | | Since July 2005 |
| c/o Hennessy Advisors, Inc. | | |
| 7250 Redwood Blvd. | | |
| Suite 200 | | |
| Novato, CA 94945 | | |
__________
| (1) | All officers of the Hennessy Funds and employees of the Advisor are Interested Persons of the Hennessy Funds. |
DIRECTORS AND OFFICERS OF THE FUND
| | Number of Portfolios in the | |
| Principal Occupation(s) | Fund Complex Overseen | Other Directorships |
| During Past 5 Years | by Director/Trustee | Held by Director |
| Has been employed by Hennessy | N/A | None. |
| Advisors, Inc., the Funds’ investment | | |
| advisor, since October 2003; Director of | | |
| Sales and Marketing for Comcast from | | |
| 2000 through 2003. | | |
| | | |
| | | |
| | | |
| Has been employed by Hennessy | N/A | None. |
| Advisors, Inc., the Funds’ investment | | |
| advisor, since 1998. | | |
| | | |
| | | |
| | | |
| | | |
| | | |
| Has been employed by Hennessy | N/A | None. |
| Advisors, Inc., the Funds’ investment | | |
| advisor, since June 2002; Vice President of | | |
| Institutional Sales and Senior Analyst with | | |
| Brad Peery Inc. from June 2000 to June | | |
| 2002; from 1996 to 2002, Mr. Peery worked | | |
| for Haywood Securities where he was a | | |
| Vice President. | | |
HENNESSY FUNDS 1-800-966-4354
Expense Example
September 30, 2009
As a shareholder of the Fund, you incur two types of costs: (1) transaction costs, including sales charges (loads) on purchase payments, reinvested dividends, or other distributions; redemption fees; and exchange fees; and (2) ongoing costs, including management fees; service fees; and other Fund expenses. This Example is intended to help you understand your ongoing costs (in dollars) of investing in the Fund and to compare these costs with the ongoing costs of investing in other mutual funds. The Example is based on an investment of $1,000 invested at the beginning of the period and held for the entire period from April 1, 2009 through September 30, 2009.
Actual Expenses
The first set of lines of the table below provide information about actual account values and actual expenses. Although the Fund charge no sales loads or transaction fees, you will be assessed fees for outgoing wire transfers, returned checks and stop payment orders at prevailing rates charged by U.S. Bancorp Fund Services, LLC, the Fund’s transfer agent. If you request that a redemption be made by wire transfer, currently a $15.00 fee is charged by the Fund’s transfer agent. IRA accounts will be charged a $15.00 annual maintenance fee. The example below includes, but is not limited to, management fees, shareholder servicing fees, fund accounting, custody and transfer agent fees. However, the example below does not include portfolio trading commissions and related expenses, interest expense or dividends on short positions taken by the Fund and other extraordinary expenses as determined under generally accepted accounting principles. You may use the information within these lines, together with the amount you invested, to estimate the expenses that you paid over the six-month period. Simply divide your account value by $1,000 (for example, an $8,600 account value divided by $1,000 = 8.6), then multiply the result by the number in the first line under the heading entitled “Expenses Paid During Period” to estimate the expenses you paid on your account during this period.
Hypothetical Example for Comparison Purposes
The second set of lines within the table below provide information about hypothetical account values and hypothetical expenses based on the Fund’s actual expense ratios and an assumed rate of return of 5% per year before expenses, which is not the Fund’s actual return. The hypothetical account values and expenses may not be used to estimate the actual ending account balance or expenses you paid for the period. You may use this information to compare the ongoing costs of investing in the Fund and other funds. To do so, compare this 5% hypothetical example with the 5% hypothetical examples that appear in the shareholder reports of the other funds. Please note that the expenses shown in the table are meant to highlight your ongoing costs only and do not reflect any transactional costs, such as sales charges (loads), or exchange fees. Therefore, the second line of the table is useful in comparing ongoing costs only, and will not help you determine the relative total costs of owning different funds. In addition, if these transactional costs were included, your costs would have been higher.
EXPENSE EXAMPLE
| | Beginning | Ending | Expenses Paid |
| | Account Value | Account Value | During Period(1) |
| Original Class | 4/1/09 | 9/30/09 | 4/1/09 – 9/30/09 |
| | | | |
| Actual | $1,000.00 | $1,317.60 | $7.55 |
| Hypothetical (5% return | | | |
| before expenses) | $1,000.00 | $1,018.55 | $6.58 |
| (1) | Expenses are equal to the Select Large Value Fund’s expense ratio of 1.30%, multiplied by the average account value over the period, multiplied by 183/365 days (to reflect the one-half year period). |
| | Beginning | Ending | Expenses Paid |
| | Account Value | Account Value | During Period(2) |
| Institutional Class | 4/1/09 | 9/30/09 | 4/1/09 – 9/30/09 |
| | | | |
| Actual | $1,000.00 | $1,319.60 | $5.70 |
| Hypothetical (5% return | | | |
| before expenses) | $1,000.00 | $1,020.16 | $4.96 |
| (2) | Expenses are equal to the Select Large Value Fund’s expense ratio of 0.98%, multiplied by the average account value over the period, multiplied by 183/365 days (to reflect the one-half year period). |
HENNESSY FUNDS 1-800-966-4354
How to Obtain a Copy of the Fund’s Proxy Voting Policy and Proxy Voting Records
A description of the policies and procedures that the Funds use to determine how to vote proxies relating to portfolio securities is available without charge: (1) by calling 1-800-966-4354; (2) on the Hennessy Funds website at www.hennessyfunds.com; or (3) on the U.S. Securities and Exchange Commission’s website at www.sec.gov. Hennessy Funds’ proxy voting record is available on the SEC’s website at www.sec.gov no later than August 31 for the prior 12 months ending June 30.
Quarterly Filings on Form N-Q
The Fund files its complete schedule of portfolio holdings with the SEC for the first and third quarters of each fiscal year on Form N-Q. The Fund’s Form N-Q will be available on the SEC’s website at www.sec.gov. The Fund’s Form N-Q may be reviewed and copied at the SEC’s Public Reference Room in Washington, DC and information on the operation of the Public Reference Room may be obtained by calling 1-800-SEC-0330. Information included in the Fund’s N-Q will also be available upon request by calling 1-800-966-4354.
Matters Submitted to a Shareholder Vote (Unaudited)
A special meeting of shareholders of the Tamarack Value Fund was held on March 20, 2009 and the following matters were approved by such Fund’s voting shares:
| 1). | Approve an Agreement and Plan of Reorganization pursuant to which all of the assets of the Tamarack Value Fund will be transferred to a newly formed series of Hennessy Funds Trust named the Hennessy Select Large Value Fund, in exchange for Original Class shares of the Hennessy Select Large Value Fund, which will be distributed pro rata by the Tamarack Value Fund to its Class A, Class C, Class R and Class S shareholders, and the Hennessy Select Large Value Fund’s assumption of the Tamarack Value Fund’s stated liabilities: |
| | For | Against | Abstain | Broker non-vote |
| | 3,310,941 | 410,811 | 266,743 | — |
ADDITIONAL INFORMATION
| 2). | Adjourn the special meeting to permit further solicitation of proxies in the event there are not sufficient votes at the time of the special meeting to approve the Agreement and Plan of Reorganization: |
| | For | Against | Abstain | Broker non-vote |
| | 3,273,443 | 404,912 | 310,139 | 1 |
Federal Tax Distribution Information (Unaudited)
The Fund has designated 97.23% of the dividends declared from net investment income during the year ended September 30, 2009, as qualified dividend income under the Jobs Growth and Tax Reconciliation Act of 2003.
For the year ended September 30, 2009, 81.40% of the ordinary distributions paid by the Fund qualify for the dividend received deduction available to corporate shareholders.
HENNESSY FUNDS 1-800-966-4354
For information, questions
or assistance, please call
The Hennessy Funds
1-800-966-4354 or 1-415-899-1555
| INVESTMENT ADVISOR | TRUSTEES |
| Hennessy Advisors, Inc. | Neil J. Hennessy |
| 7250 Redwood Blvd., Suite 200 | Robert T. Doyle |
| Novato, California 94945 | J. Dennis DeSousa |
| | Gerald P. Richardson |
| ADMINISTRATOR, TRANSFER | |
| AGENT, DIVIDEND PAYING | COUNSEL |
| AGENT & SHAREHOLDER | Foley & Lardner LLP |
| SERVICING AGENT | 777 East Wisconsin Avenue |
| U.S. Bancorp Fund Services, LLC | Milwaukee, Wisconsin 53202-5306 |
| P.O. Box 701 | |
| Milwaukee, Wisconsin 53201-0701 | INDEPENDENT REGISTERED |
| | PUBLIC ACCOUNTING FIRM |
| CUSTODIAN | KPMG LLP |
| U.S. Bank N.A. | 777 East Wisconsin Avenue, 15th Floor |
| Custody Operations | Milwaukee, Wisconsin 53202 |
| 1555 North River Center Dr., Suite 302 | |
| Milwaukee, Wisconsin 53212 | DISTRIBUTOR |
| | Quasar Distributors, LLC |
| | 615 East Michigan Street |
| | Milwaukee, Wisconsin 53202 |
WWW.HENNESSYFUNDS.COM
This report has been prepared for shareholders and may be distributed to others only if preceded or accompanied by a current prospectus.
Item 2. Code of Ethics.
A copy of the registrant’s Code of Ethics is filed herewith.
The registrant has adopted a code of ethics that applies to the registrant’s principal executive officer and principal financial officer. The registrant has not made any amendments to its code of ethics during the period covered by this report. The registrant has not granted any waivers from any provisions of the code of ethics during the period covered by this report.
Item 3. Audit Committee Financial Expert.
The registrant’s board of directors has determined that it does not have an audit committee financial expert serving on its audit committee. At this time, the registrant believes that the experience provided by each member of the audit committee together offers the registrant adequate oversight for the registrant’s level of financial complexity.
Item 4. Principal Accountant Fees and Services.
The registrant has engaged its principal accountant to perform audit services, audit-related services, tax services and other services during the past two fiscal years. “Audit services” refer to performing an audit of the registrant's annual financial statements or services that are normally provided by the accountant in connection with statutory and regulatory filings or engagements for those fiscal years. “Audit-related services” refer to the assurance and related services by the principal accountant that are reasonably related to the performance of the audit. “Tax services” refer to professional services rendered by the principal accountant for tax compliance, tax advice, and tax planning. The following table details the aggregate fees billed or expected to be billed for each of the last two fiscal years for audit fees, audit-related fees, tax fees and other fees by the principal accountant.
| | FYE 9/30/2009 | FYE 9/30/2008 |
| Audit Fees | $29,000 | $6,557 |
| Audit-Related Fees | - | - |
| Tax Fees | 3,250 | 6,600 |
| All Other Fees | - | - |
The audit committee has adopted pre-approval policies and procedures that require the audit committee to pre-approve all audit and non-audit services of the registrant, including services provided to any entity affiliated with the registrant.
The percentage of fees billed by KPMG, LLP applicable to non-audit services pursuant to waiver of pre-approval requirement were as follows:
| | FYE 9/30/2009 | FYE 9/30/2008 |
| Audit-Related Fees | 0% | 0% |
| Tax Fees | 0% | 0% |
| All Other Fees | 0% | 0% |
All of the principal accountant’s hours spent on auditing the registrant’s financial statements were attributed to work performed by full-time permanent employees of the principal accountant. (If more than 50 percent of the accountant’s hours were spent to audit the registrant's financial statements for the most recent fiscal year, state how many hours were attributed to work performed by persons other than the principal accountant's full-time, permanent employees.)
The following table indicates the non-audit fees billed or expected to be billed by the registrant’s accountant for services to the registrant and to the registrant’s investment adviser (and any other controlling entity, etc.—not sub-adviser) for the last two years. The audit committee of the board of trustees/directors has considered whether the provision of non-audit services that were rendered to the registrant's investment adviser is compatible with maintaining the principal accountant's independence and has concluded that the provision of such non-audit services by the accountant has not compromised the accountant’s independence.
| Non-Audit Related Fees | FYE 9/30/2009 | FYE 9/30/2008 |
| Registrant | $- | $- |
| Registrant’s Investment Adviser | - | - |
Item 5. Audit Committee of Listed Registrants.
Not applicable to registrants who are not listed issuers (as defined in Rule 10A-3 under the Securities Exchange Act of 1934).
Item 6. Investments.
Schedule of Investments is included as part of the report to shareholders filed under Item 1 of this Form.
Item 7. Disclosure of Proxy Voting Policies and Procedures for Closed-End Management Investment Companies.
Not applicable to open-end investment companies.
Item 8. Portfolio Managers of Closed-End Management Investment Companies.
Not applicable to open-end investment companies.
Item 9. Purchases of Equity Securities by Closed-End Management Investment Company and Affiliated Purchasers.
Not applicable to open-end investment companies.
Item 10. Submission of Matters to a Vote of Security Holders.
Not Applicable.
Item 11. Controls and Procedures.
| (a) | The Registrant’s Chief Executive Officer and Treasurer have reviewed the Registrant's disclosure controls and procedures (as defined in Rule 30a-3(c) under the Investment Company Act of 1940 (the “Act”)) as of a date within 90 days of the filing of this report, as required by Rule 30a-3(b) under the Act and Rules 13a-15(b) or 15d-15(b) under the Securities Exchange Act of 1934. Based on their review, such officers have concluded that the disclosure controls and procedures are effective in ensuring that information required to be disclosed in this report is appropriately recorded, processed, summarized and reported and made known to them by others within the Registrant and by the Registrant’s service provider. |
| (b) | There were no changes in the Registrant's internal control over financial reporting (as defined in Rule 30a-3(d) under the Act) that occurred during the second fiscal quarter of the period covered by this report that has materially affected, or is reasonably likely to materially affect, the Registrant's internal control over financial reporting. |
Item 12. Exhibits.
| (a) | (1) Any code of ethics or amendment thereto, that is the subject of the disclosure required by Item 2, to the extent that the registrant intends to satisfy Item 2 requirements through filing an exhibit. Filed herewith. |
(2) A separate certification for each principal executive and principal financial officer pursuant to Section 302 of the Sarbanes-Oxley Act of 2002. Filed herewith.
(3) Any written solicitation to purchase securities under Rule 23c-1 under the Act sent or given during the period covered by the report by or on behalf of the registrant to 10 or more persons. Not applicable to open-end investment companies.
| (b) | Certifications pursuant to Section 906 of the Sarbanes-Oxley Act of 2002. Furnished herewith. |
SIGNATURES
Pursuant to the requirements of the Securities Exchange Act of 1934 and the Investment Company Act of 1940, the registrant has duly caused this report to be signed on its behalf by the undersigned, thereunto duly authorized.
(Registrant) Hennessy Funds Trust.
By (Signature and Title) /s/Neil J. Hennessy
Neil J. Hennessy, Principal Executive Officer
Date December 8, 2009
Pursuant to the requirements of the Securities Exchange Act of 1934 and the Investment Company Act of 1940, this report has been signed below by the following persons on behalf of the registrant and in the capacities and on the dates indicated.
By (Signature and Title) /s/Neil J. Hennessy
Neil J. Hennessy, Principal Executive Officer
Date December 8, 2009
By (Signature and Title) /s/Teresa M. Nilsen
Teresa M. Nilsen, Treasurer
Date December 8, 2009